Prairie View, TX Map & Demographics
Prairie View Map
Prairie View Overview
$9,925
PER CAPITA INCOME
$44,533
AVG FAMILY INCOME
$19,238
AVG HOUSEHOLD INCOME
0.60
INEQUALITY / GINI INDEX
8,039
TOTAL POPULATION
3,646
MALE POPULATION
4,393
FEMALE POPULATION
83.00
MALES / 100 FEMALES
120.49
FEMALES / 100 MALES
20.6
MEDIAN AGE
3.3
AVG FAMILY SIZE
2.5
AVG HOUSEHOLD SIZE
3,537
LABOR FORCE [ PEOPLE ]
47.0%
PERCENT IN LABOR FORCE
20.0%
UNEMPLOYMENT RATE
Prairie View Zip Codes
Income in Prairie View
Income Overview in Prairie View
Per Capita Income in Prairie View is $9,925, while median incomes of families and households are $44,533 and $19,238 respectively.
| Characteristic | Number | Measure |
| Per Capita Income | 8,039 | $9,925 |
| Median Family Income | 650 | $44,533 |
| Mean Family Income | 650 | $61,973 |
| Median Household Income | 1,556 | $19,238 |
| Mean Household Income | 1,556 | $32,204 |
| Income Deficit | 650 | $0 |
| Wage / Income Gap (%) | 8,039 | 0.00% |
| Wage / Income Gap ($) | 8,039 | 100.00¢ per $1 |
| Gini / Inequality Index | 8,039 | 0.60 |
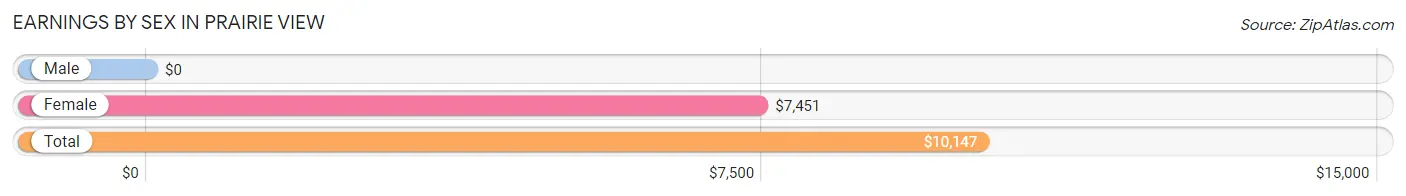
Earnings by Sex in Prairie View
| Sex | Number | Average Earnings |
| Male | 1,837 (43.0%) | $0 |
| Female | 2,439 (57.0%) | $7,451 |
| Total | 4,276 (100.0%) | $10,147 |
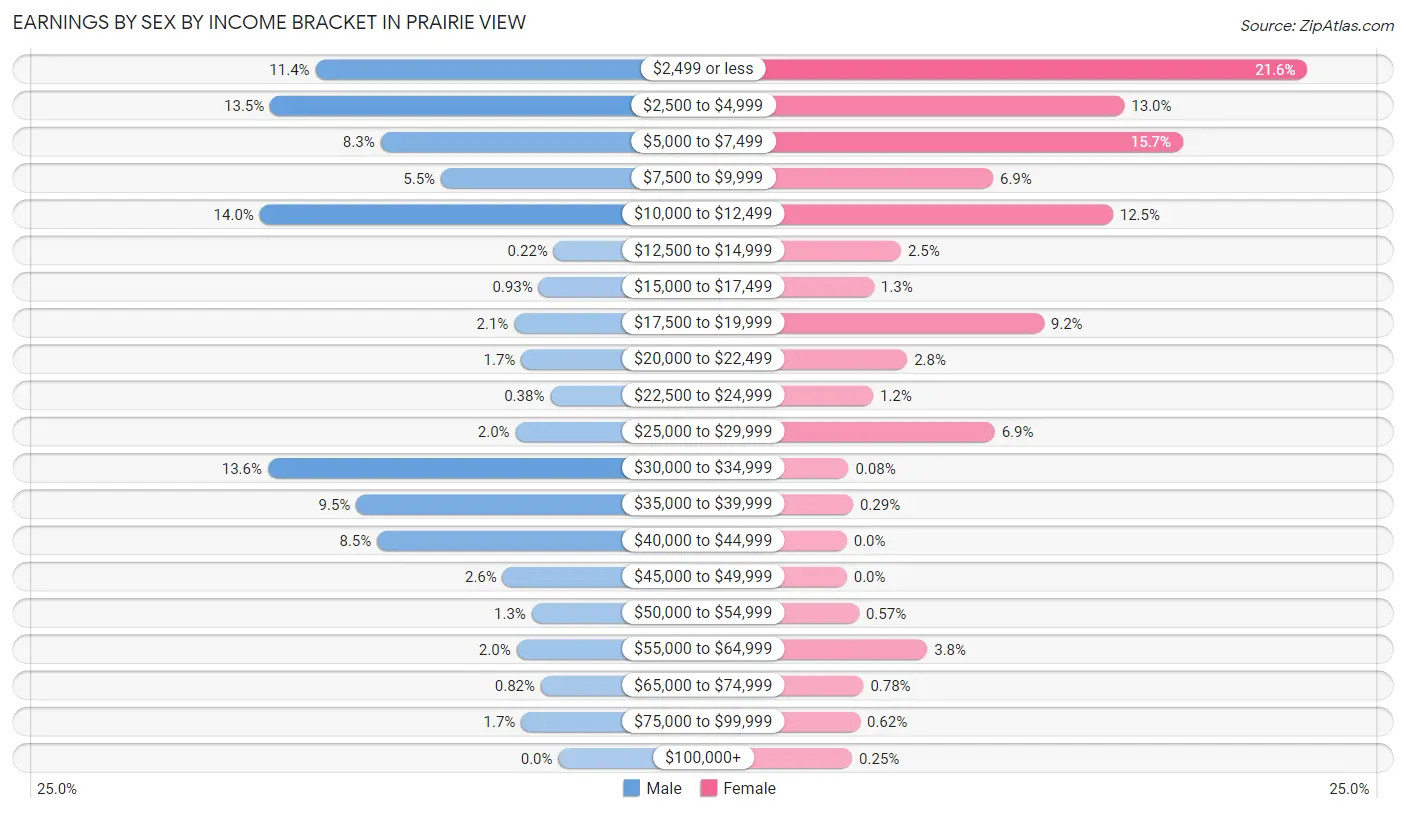
Earnings by Sex by Income Bracket in Prairie View
The most common earnings brackets in Prairie View are $10,000 to $12,499 for men (257 | 14.0%) and $2,499 or less for women (526 | 21.6%).
| Income | Male | Female |
| $2,499 or less | 209 (11.4%) | 526 (21.6%) |
| $2,500 to $4,999 | 248 (13.5%) | 317 (13.0%) |
| $5,000 to $7,499 | 153 (8.3%) | 384 (15.7%) |
| $7,500 to $9,999 | 101 (5.5%) | 167 (6.9%) |
| $10,000 to $12,499 | 257 (14.0%) | 304 (12.5%) |
| $12,500 to $14,999 | 4 (0.2%) | 62 (2.5%) |
| $15,000 to $17,499 | 17 (0.9%) | 31 (1.3%) |
| $17,500 to $19,999 | 38 (2.1%) | 225 (9.2%) |
| $20,000 to $22,499 | 32 (1.7%) | 69 (2.8%) |
| $22,500 to $24,999 | 7 (0.4%) | 30 (1.2%) |
| $25,000 to $29,999 | 37 (2.0%) | 169 (6.9%) |
| $30,000 to $34,999 | 250 (13.6%) | 2 (0.1%) |
| $35,000 to $39,999 | 174 (9.5%) | 7 (0.3%) |
| $40,000 to $44,999 | 156 (8.5%) | 0 (0.0%) |
| $45,000 to $49,999 | 48 (2.6%) | 0 (0.0%) |
| $50,000 to $54,999 | 23 (1.3%) | 14 (0.6%) |
| $55,000 to $64,999 | 36 (2.0%) | 92 (3.8%) |
| $65,000 to $74,999 | 15 (0.8%) | 19 (0.8%) |
| $75,000 to $99,999 | 32 (1.7%) | 15 (0.6%) |
| $100,000+ | 0 (0.0%) | 6 (0.3%) |
| Total | 1,837 (100.0%) | 2,439 (100.0%) |
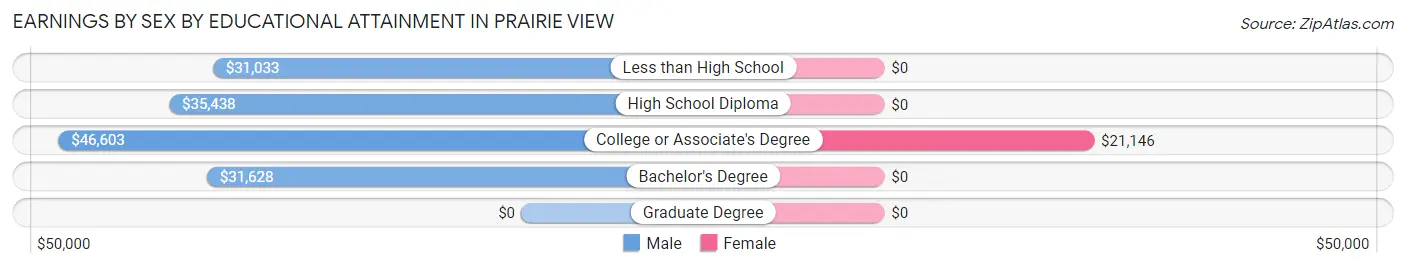
Earnings by Sex by Educational Attainment in Prairie View
Average earnings in Prairie View are $32,391 for men and $21,486 for women, a difference of 33.7%. Men with an educational attainment of college or associate's degree enjoy the highest average annual earnings of $46,603, while those with less than high school education earn the least with $31,033. Women with an educational attainment of college or associate's degree earn the most with the average annual earnings of $21,146, while those with college or associate's degree education have the smallest earnings of $21,146.
| Educational Attainment | Male Income | Female Income |
| Less than High School | $31,033 | $0 |
| High School Diploma | $35,438 | $0 |
| College or Associate's Degree | $46,603 | $21,146 |
| Bachelor's Degree | $31,628 | $0 |
| Graduate Degree | - | - |
| Total | $32,391 | $21,486 |
Family Income in Prairie View
Family Income Brackets in Prairie View
According to the Prairie View family income data, there are 212 families falling into the $35,000 to $49,999 income range, which is the most common income bracket and makes up 32.6% of all families.
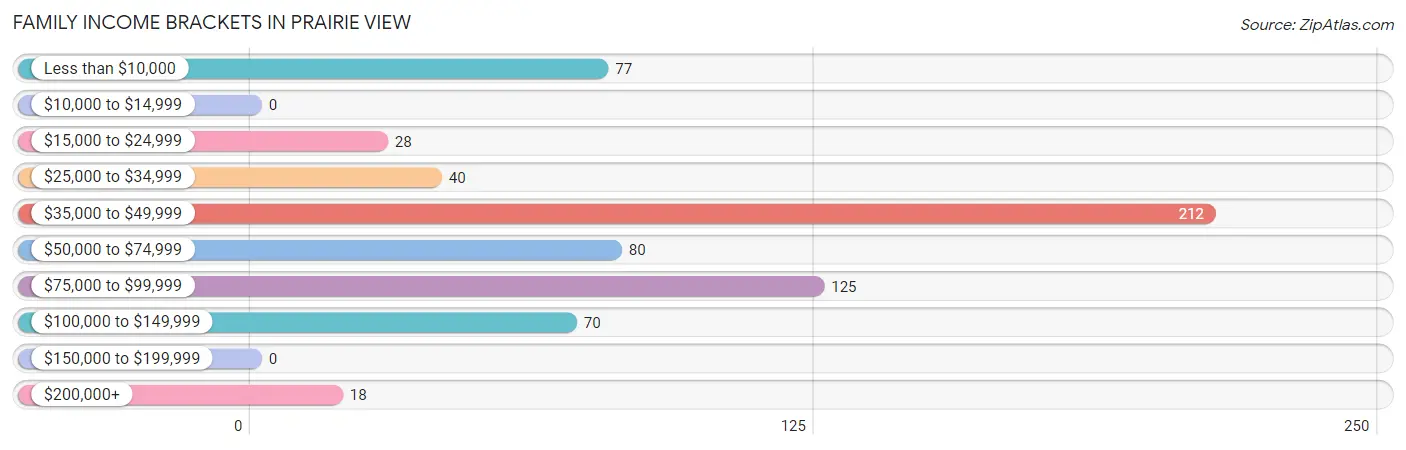
| Income Bracket | # Families | % Families |
| Less than $10,000 | 77 | 11.8% |
| $10,000 to $14,999 | 0 | 0.0% |
| $15,000 to $24,999 | 28 | 4.3% |
| $25,000 to $34,999 | 40 | 6.2% |
| $35,000 to $49,999 | 212 | 32.6% |
| $50,000 to $74,999 | 80 | 12.3% |
| $75,000 to $99,999 | 125 | 19.2% |
| $100,000 to $149,999 | 70 | 10.8% |
| $150,000 to $199,999 | 0 | 0.0% |
| $200,000+ | 18 | 2.8% |
Family Income by Famaliy Size in Prairie View
3-person families (162 | 24.9%) account for the highest median family income in Prairie View with $67,976 per family, while 3-person families (162 | 24.9%) have the highest median income of $22,659 per family member.
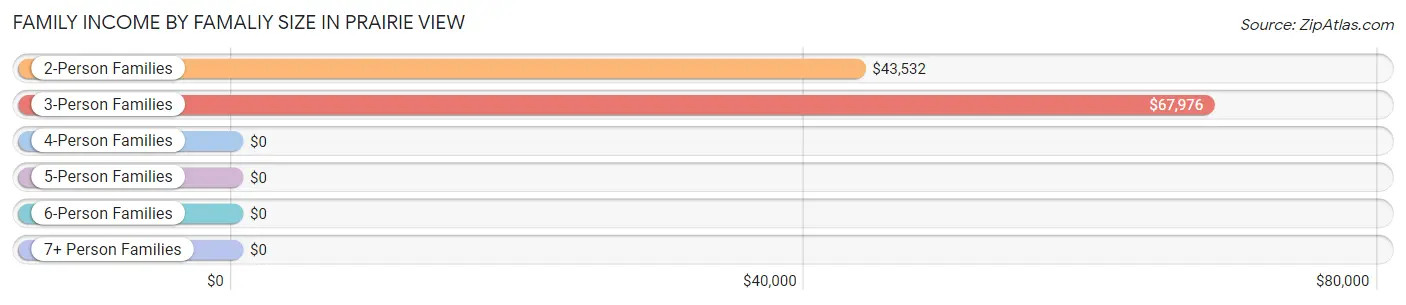
| Income Bracket | # Families | Median Income |
| 2-Person Families | 325 (50.0%) | $43,532 |
| 3-Person Families | 162 (24.9%) | $67,976 |
| 4-Person Families | 91 (14.0%) | $0 |
| 5-Person Families | 61 (9.4%) | $0 |
| 6-Person Families | 1 (0.2%) | $0 |
| 7+ Person Families | 10 (1.5%) | $0 |
| Total | 650 (100.0%) | $44,533 |
Family Income by Number of Earners in Prairie View
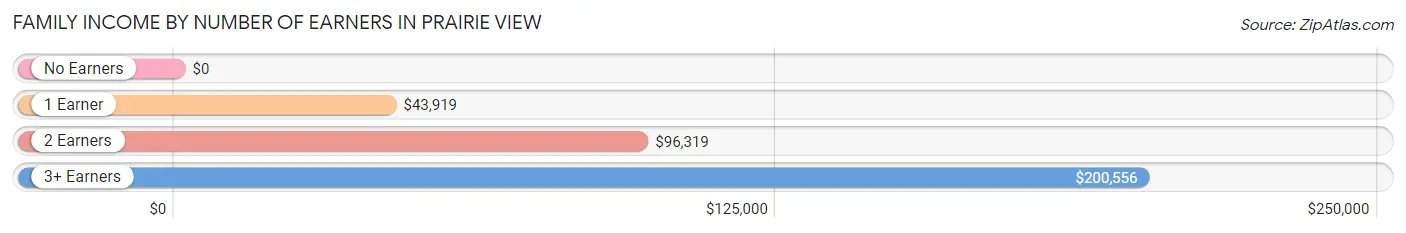
| Number of Earners | # Families | Median Income |
| No Earners | 100 (15.4%) | $0 |
| 1 Earner | 356 (54.8%) | $43,919 |
| 2 Earners | 166 (25.5%) | $96,319 |
| 3+ Earners | 28 (4.3%) | $200,556 |
| Total | 650 (100.0%) | $44,533 |
Household Income in Prairie View
Household Income Brackets in Prairie View
With 610 households falling in the category, the less than $10,000 income range is the most frequent in Prairie View, accounting for 39.2% of all households.
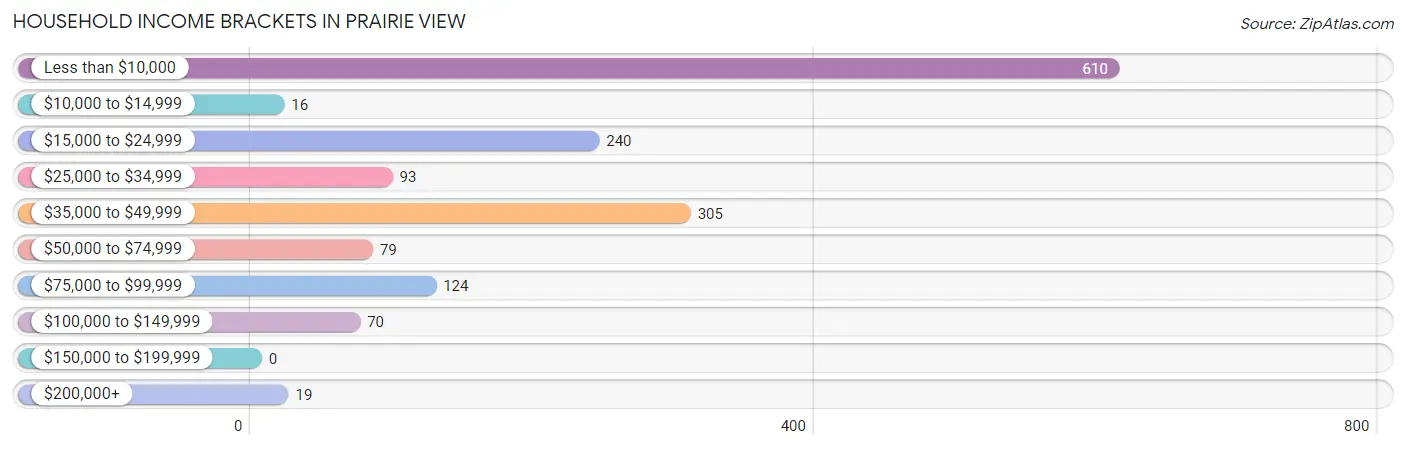
| Income Bracket | # Households | % Households |
| Less than $10,000 | 610 | 39.2% |
| $10,000 to $14,999 | 16 | 1.0% |
| $15,000 to $24,999 | 240 | 15.4% |
| $25,000 to $34,999 | 93 | 6.0% |
| $35,000 to $49,999 | 305 | 19.6% |
| $50,000 to $74,999 | 79 | 5.1% |
| $75,000 to $99,999 | 124 | 8.0% |
| $100,000 to $149,999 | 70 | 4.5% |
| $150,000 to $199,999 | 0 | 0.0% |
| $200,000+ | 19 | 1.2% |
Household Income by Householder Age in Prairie View
The median household income in Prairie View is $19,238, with the highest median household income of $69,565 found in the 65+ years age bracket for the primary householder. A total of 184 households (11.8%) fall into this category. Meanwhile, the 15 to 24 years age bracket for the primary householder has the lowest median household income of $0, with 927 households (59.6%) in this group.
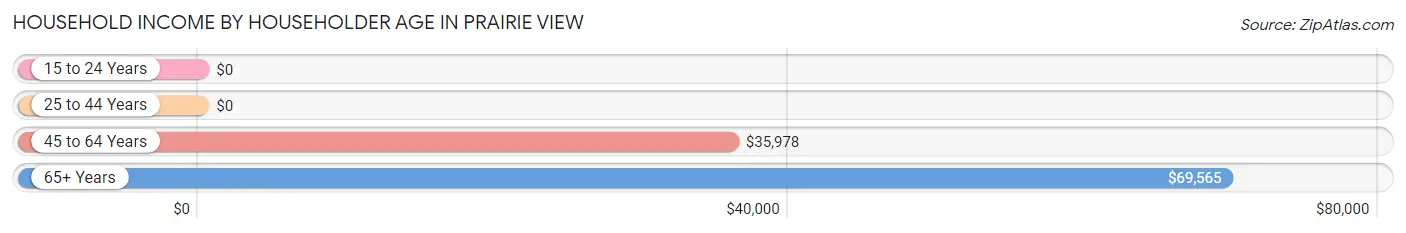
| Income Bracket | # Households | Median Income |
| 15 to 24 Years | 927 (59.6%) | $0 |
| 25 to 44 Years | 207 (13.3%) | $0 |
| 45 to 64 Years | 238 (15.3%) | $35,978 |
| 65+ Years | 184 (11.8%) | $69,565 |
| Total | 1,556 (100.0%) | $19,238 |
Poverty in Prairie View
Income Below Poverty by Sex and Age in Prairie View
With 41.6% poverty level for males and 49.4% for females among the residents of Prairie View, under 5 year old males and 6 to 11 year old females are the most vulnerable to poverty, with 25 males (100.0%) and 42 females (100.0%) in their respective age groups living below the poverty level.
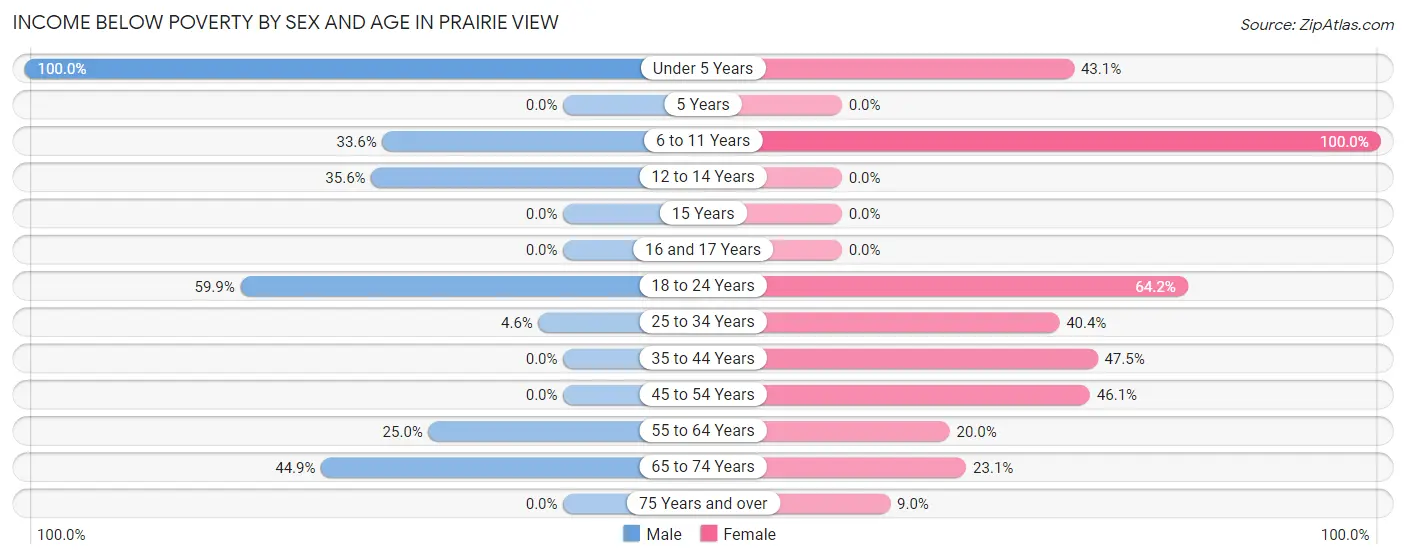
| Age Bracket | Male | Female |
| Under 5 Years | 25 (100.0%) | 25 (43.1%) |
| 5 Years | 0 (0.0%) | 0 (0.0%) |
| 6 to 11 Years | 49 (33.6%) | 42 (100.0%) |
| 12 to 14 Years | 62 (35.6%) | 0 (0.0%) |
| 15 Years | 0 (0.0%) | 0 (0.0%) |
| 16 and 17 Years | 0 (0.0%) | 0 (0.0%) |
| 18 to 24 Years | 767 (59.9%) | 502 (64.2%) |
| 25 to 34 Years | 7 (4.6%) | 46 (40.4%) |
| 35 to 44 Years | 0 (0.0%) | 28 (47.5%) |
| 45 to 54 Years | 0 (0.0%) | 35 (46.1%) |
| 55 to 64 Years | 24 (25.0%) | 33 (20.0%) |
| 65 to 74 Years | 31 (44.9%) | 15 (23.1%) |
| 75 Years and over | 0 (0.0%) | 6 (9.0%) |
| Total | 965 (41.6%) | 732 (49.4%) |
Income Above Poverty by Sex and Age in Prairie View
According to the poverty statistics in Prairie View, males aged 5 years and females aged 15 years are the age groups that are most secure financially, with 100.0% of males and 100.0% of females in these age groups living above the poverty line.
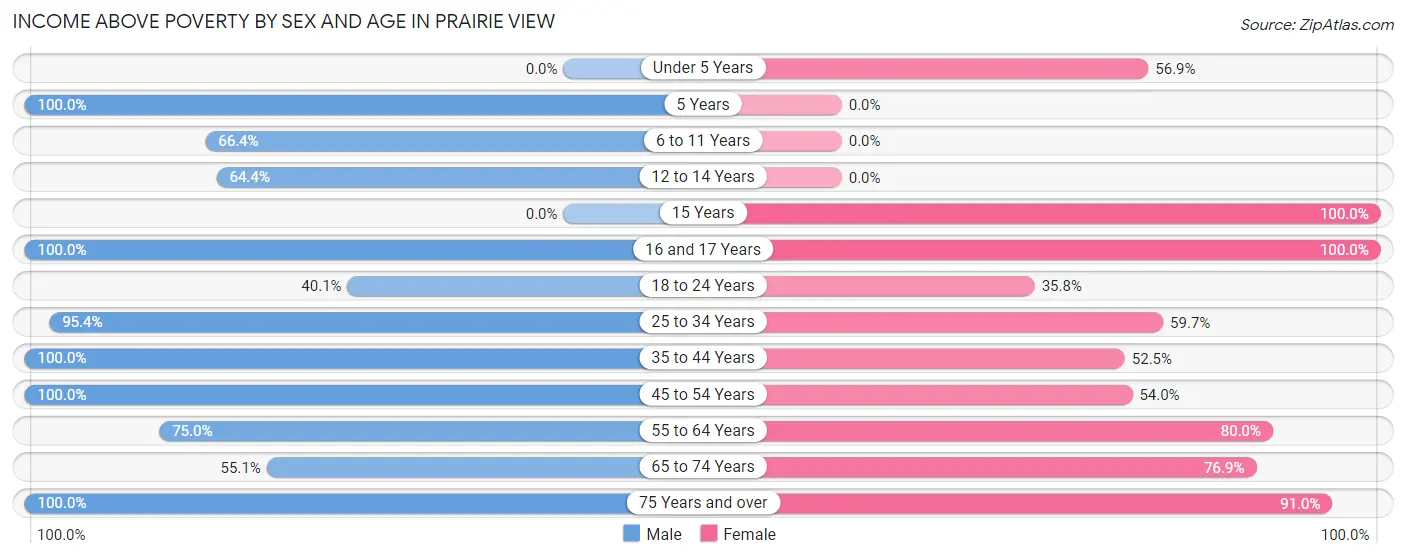
| Age Bracket | Male | Female |
| Under 5 Years | 0 (0.0%) | 33 (56.9%) |
| 5 Years | 2 (100.0%) | 0 (0.0%) |
| 6 to 11 Years | 97 (66.4%) | 0 (0.0%) |
| 12 to 14 Years | 112 (64.4%) | 0 (0.0%) |
| 15 Years | 0 (0.0%) | 18 (100.0%) |
| 16 and 17 Years | 23 (100.0%) | 36 (100.0%) |
| 18 to 24 Years | 513 (40.1%) | 280 (35.8%) |
| 25 to 34 Years | 146 (95.4%) | 68 (59.7%) |
| 35 to 44 Years | 209 (100.0%) | 31 (52.5%) |
| 45 to 54 Years | 110 (100.0%) | 41 (53.9%) |
| 55 to 64 Years | 72 (75.0%) | 132 (80.0%) |
| 65 to 74 Years | 38 (55.1%) | 50 (76.9%) |
| 75 Years and over | 31 (100.0%) | 61 (91.0%) |
| Total | 1,353 (58.4%) | 750 (50.6%) |
Income Below Poverty Among Married-Couple Families in Prairie View
The poverty statistics for married-couple families in Prairie View show that 11.2% or 31 of the total 276 families live below the poverty line. Families with no children have the highest poverty rate of 22.3%, comprising of 31 families. On the other hand, families with 1 or 2 children have the lowest poverty rate of 0.0%, which includes 0 families.
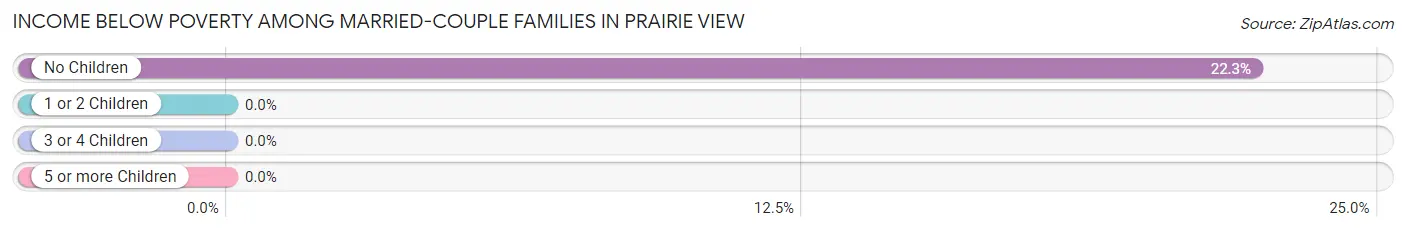
| Children | Above Poverty | Below Poverty |
| No Children | 108 (77.7%) | 31 (22.3%) |
| 1 or 2 Children | 137 (100.0%) | 0 (0.0%) |
| 3 or 4 Children | 0 (0.0%) | 0 (0.0%) |
| 5 or more Children | 0 (0.0%) | 0 (0.0%) |
| Total | 245 (88.8%) | 31 (11.2%) |
Income Below Poverty Among Single-Parent Households in Prairie View
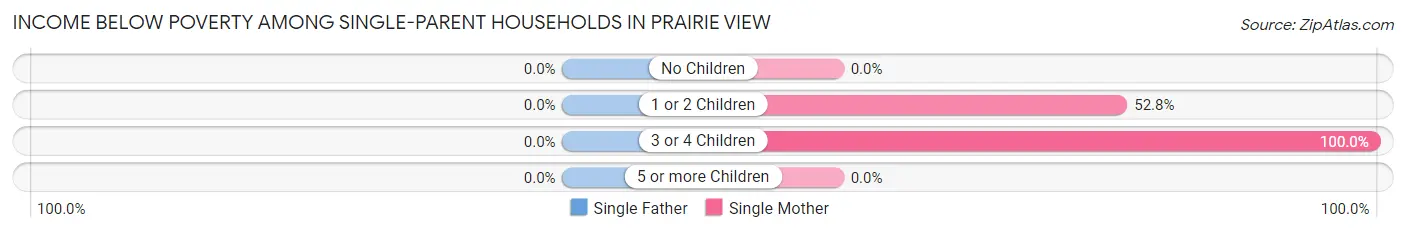
| Children | Single Father | Single Mother |
| No Children | 0 (0.0%) | 0 (0.0%) |
| 1 or 2 Children | 0 (0.0%) | 28 (52.8%) |
| 3 or 4 Children | 0 (0.0%) | 46 (100.0%) |
| 5 or more Children | 0 (0.0%) | 0 (0.0%) |
| Total | 0 (0.0%) | 74 (42.3%) |
Income Below Poverty Among Married-Couple vs Single-Parent Households in Prairie View
The poverty data for Prairie View shows that 31 of the married-couple family households (11.2%) and 74 of the single-parent households (19.8%) are living below the poverty level. Within the married-couple family households, those with no children have the highest poverty rate, with 31 households (22.3%) falling below the poverty line. Among the single-parent households, those with 3 or 4 children have the highest poverty rate, with 46 household (100.0%) living below poverty.
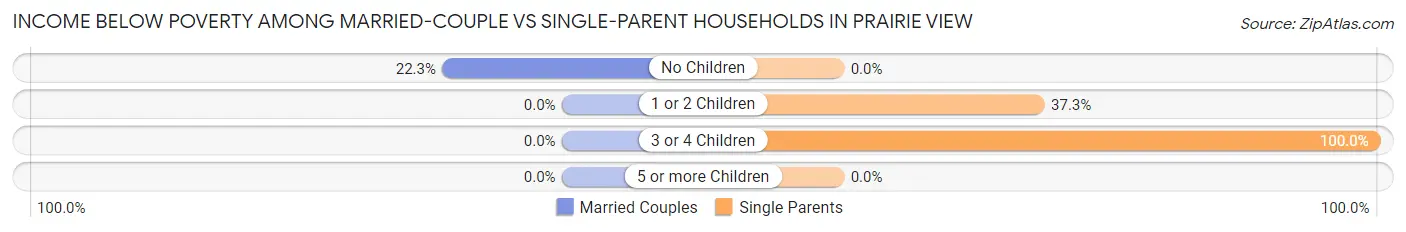
| Children | Married-Couple Families | Single-Parent Households |
| No Children | 31 (22.3%) | 0 (0.0%) |
| 1 or 2 Children | 0 (0.0%) | 28 (37.3%) |
| 3 or 4 Children | 0 (0.0%) | 46 (100.0%) |
| 5 or more Children | 0 (0.0%) | 0 (0.0%) |
| Total | 31 (11.2%) | 74 (19.8%) |
Race in Prairie View
The most populous races in Prairie View are Black / African American (7,259 | 90.3%), Hispanic or Latino (417 | 5.2%), and Two or more Races (404 | 5.0%).
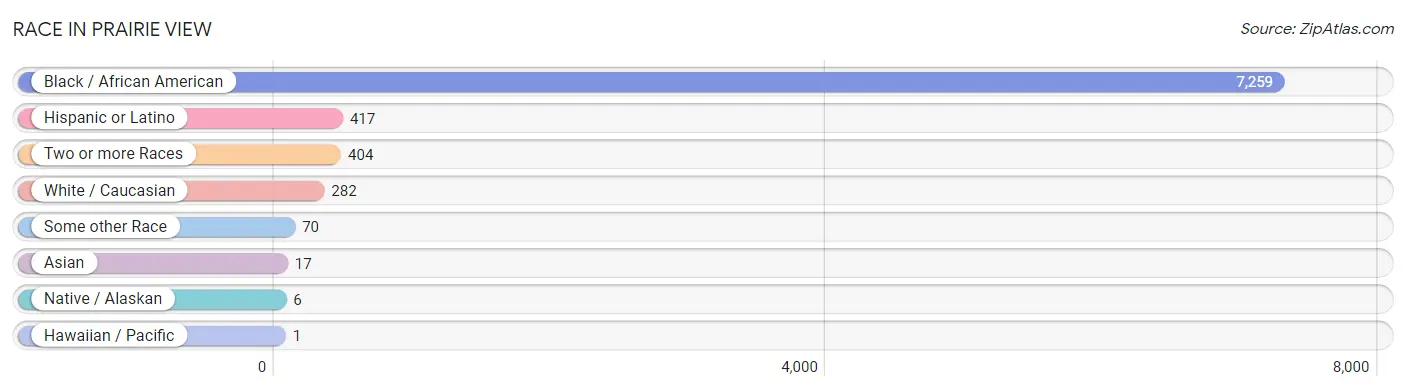
| Race | # Population | % Population |
| Asian | 17 | 0.2% |
| Black / African American | 7,259 | 90.3% |
| Hawaiian / Pacific | 1 | 0.0% |
| Hispanic or Latino | 417 | 5.2% |
| Native / Alaskan | 6 | 0.1% |
| White / Caucasian | 282 | 3.5% |
| Two or more Races | 404 | 5.0% |
| Some other Race | 70 | 0.9% |
| Total | 8,039 | 100.0% |
Ancestry in Prairie View
The most populous ancestries reported in Prairie View are Subsaharan African (456 | 5.7%), African (403 | 5.0%), Mexican (302 | 3.8%), American (128 | 1.6%), and English (48 | 0.6%), together accounting for 16.6% of all Prairie View residents.
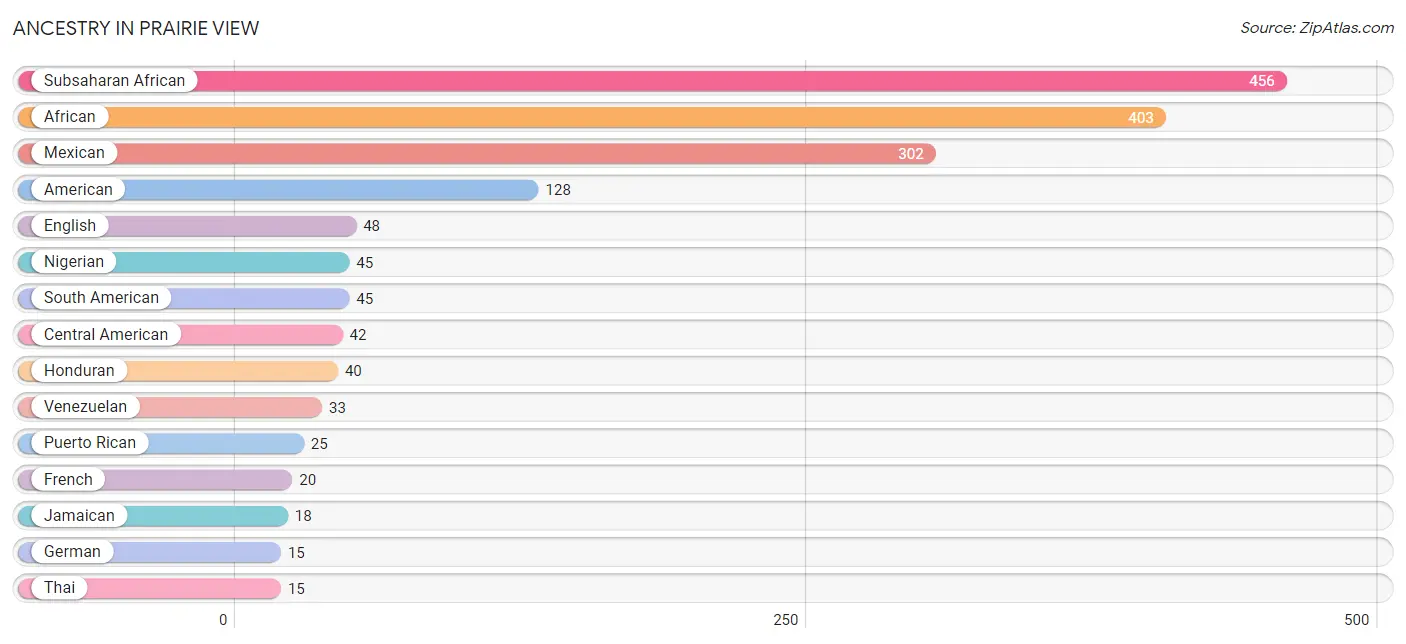
| Ancestry | # Population | % Population |
| African | 403 | 5.0% |
| American | 128 | 1.6% |
| Bahamian | 2 | 0.0% |
| Belizean | 8 | 0.1% |
| Burmese | 1 | 0.0% |
| Central American | 42 | 0.5% |
| Colombian | 12 | 0.2% |
| English | 48 | 0.6% |
| Ethiopian | 4 | 0.1% |
| French | 20 | 0.3% |
| French Canadian | 4 | 0.1% |
| German | 15 | 0.2% |
| Honduran | 40 | 0.5% |
| Irish | 14 | 0.2% |
| Italian | 8 | 0.1% |
| Jamaican | 18 | 0.2% |
| Mexican | 302 | 3.8% |
| Native Hawaiian | 1 | 0.0% |
| Nigerian | 45 | 0.6% |
| Puerto Rican | 25 | 0.3% |
| Salvadoran | 2 | 0.0% |
| Somali | 4 | 0.1% |
| South American | 45 | 0.6% |
| Subsaharan African | 456 | 5.7% |
| Thai | 15 | 0.2% |
| Venezuelan | 33 | 0.4% | View All 26 Rows |
Immigrants in Prairie View
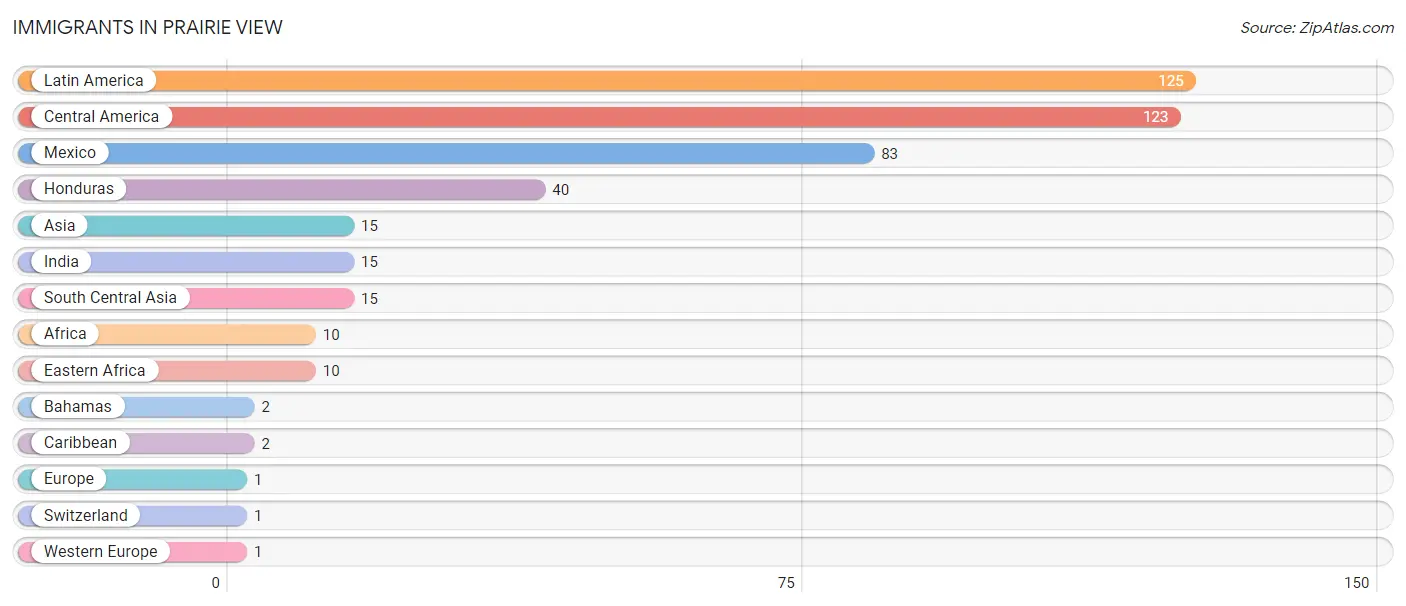
The most numerous immigrant groups reported in Prairie View came from Latin America (125 | 1.5%), Central America (123 | 1.5%), Mexico (83 | 1.0%), Honduras (40 | 0.5%), and Asia (15 | 0.2%), together accounting for 4.8% of all Prairie View residents.
| Immigration Origin | # Population | % Population |
| Africa | 10 | 0.1% |
| Asia | 15 | 0.2% |
| Bahamas | 2 | 0.0% |
| Caribbean | 2 | 0.0% |
| Central America | 123 | 1.5% |
| Eastern Africa | 10 | 0.1% |
| Europe | 1 | 0.0% |
| Honduras | 40 | 0.5% |
| India | 15 | 0.2% |
| Latin America | 125 | 1.5% |
| Mexico | 83 | 1.0% |
| South Central Asia | 15 | 0.2% |
| Switzerland | 1 | 0.0% |
| Western Europe | 1 | 0.0% | View All 14 Rows |
Sex and Age in Prairie View
Sex and Age in Prairie View
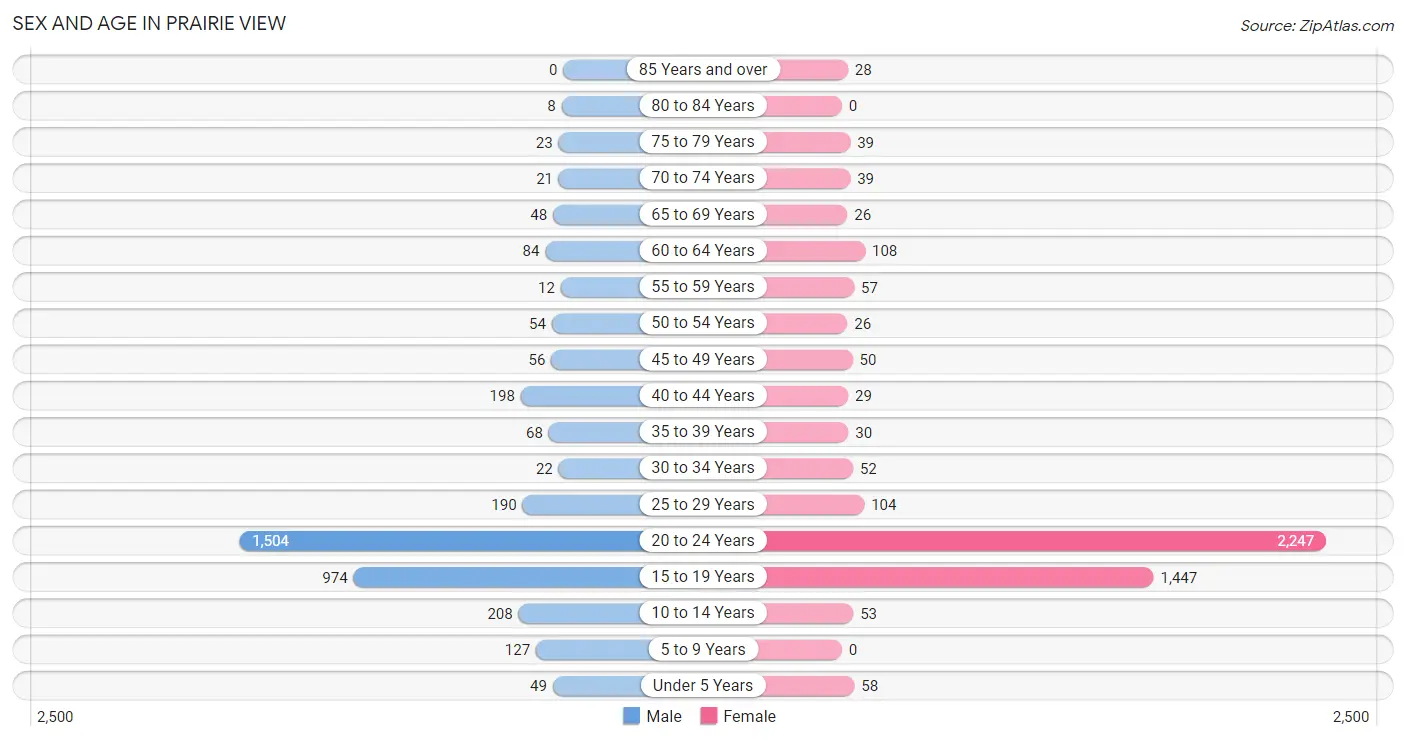
The most populous age groups in Prairie View are 20 to 24 Years (1,504 | 41.2%) for men and 20 to 24 Years (2,247 | 51.1%) for women.
| Age Bracket | Male | Female |
| Under 5 Years | 49 (1.3%) | 58 (1.3%) |
| 5 to 9 Years | 127 (3.5%) | 0 (0.0%) |
| 10 to 14 Years | 208 (5.7%) | 53 (1.2%) |
| 15 to 19 Years | 974 (26.7%) | 1,447 (32.9%) |
| 20 to 24 Years | 1,504 (41.2%) | 2,247 (51.1%) |
| 25 to 29 Years | 190 (5.2%) | 104 (2.4%) |
| 30 to 34 Years | 22 (0.6%) | 52 (1.2%) |
| 35 to 39 Years | 68 (1.9%) | 30 (0.7%) |
| 40 to 44 Years | 198 (5.4%) | 29 (0.7%) |
| 45 to 49 Years | 56 (1.5%) | 50 (1.1%) |
| 50 to 54 Years | 54 (1.5%) | 26 (0.6%) |
| 55 to 59 Years | 12 (0.3%) | 57 (1.3%) |
| 60 to 64 Years | 84 (2.3%) | 108 (2.5%) |
| 65 to 69 Years | 48 (1.3%) | 26 (0.6%) |
| 70 to 74 Years | 21 (0.6%) | 39 (0.9%) |
| 75 to 79 Years | 23 (0.6%) | 39 (0.9%) |
| 80 to 84 Years | 8 (0.2%) | 0 (0.0%) |
| 85 Years and over | 0 (0.0%) | 28 (0.6%) |
| Total | 3,646 (100.0%) | 4,393 (100.0%) |
Families and Households in Prairie View
Median Family Size in Prairie View
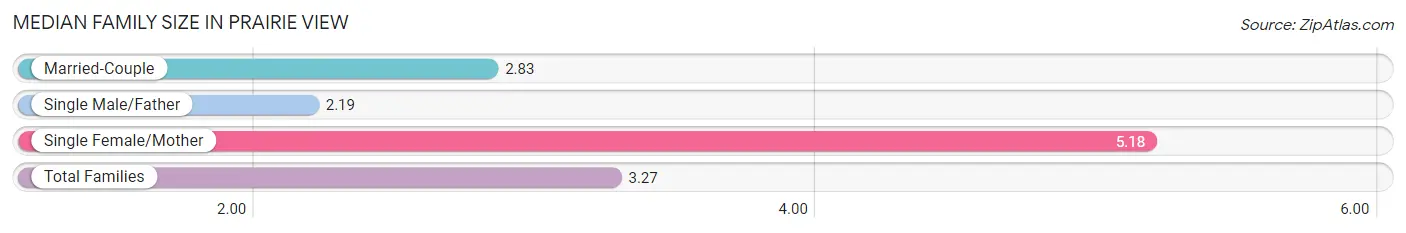
The median family size in Prairie View is 3.27 persons per family, with single female/mother families (175 | 26.9%) accounting for the largest median family size of 5.18 persons per family. On the other hand, single male/father families (199 | 30.6%) represent the smallest median family size with 2.19 persons per family.
| Family Type | # Families | Family Size |
| Married-Couple | 276 (42.5%) | 2.83 |
| Single Male/Father | 199 (30.6%) | 2.19 |
| Single Female/Mother | 175 (26.9%) | 5.18 |
| Total Families | 650 (100.0%) | 3.27 |
Median Household Size in Prairie View
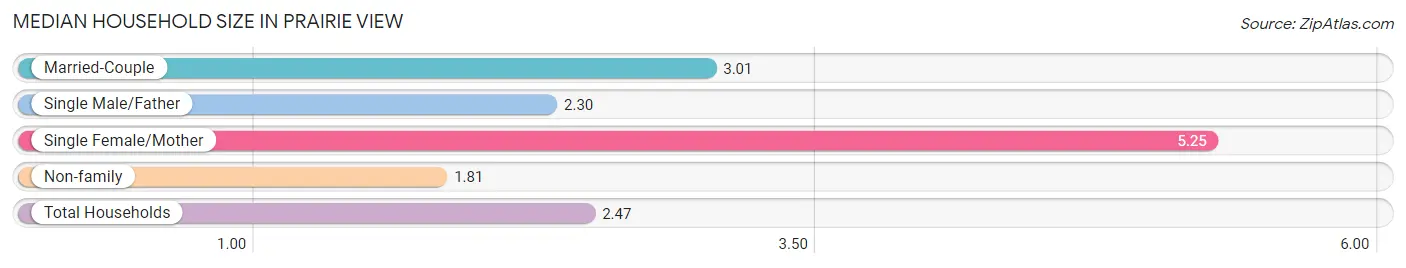
The median household size in Prairie View is 2.47 persons per household, with single female/mother households (175 | 11.3%) accounting for the largest median household size of 5.25 persons per household. non-family households (906 | 58.2%) represent the smallest median household size with 1.81 persons per household.
| Household Type | # Households | Household Size |
| Married-Couple | 276 (17.7%) | 3.01 |
| Single Male/Father | 199 (12.8%) | 2.30 |
| Single Female/Mother | 175 (11.3%) | 5.25 |
| Non-family | 906 (58.2%) | 1.81 |
| Total Households | 1,556 (100.0%) | 2.47 |
Household Size by Marriage Status in Prairie View
Out of a total of 1,556 households in Prairie View, 650 (41.8%) are family households, while 906 (58.2%) are nonfamily households. The most numerous type of family households are 2-person households, comprising 325, and the most common type of nonfamily households are 1-person households, comprising 535.
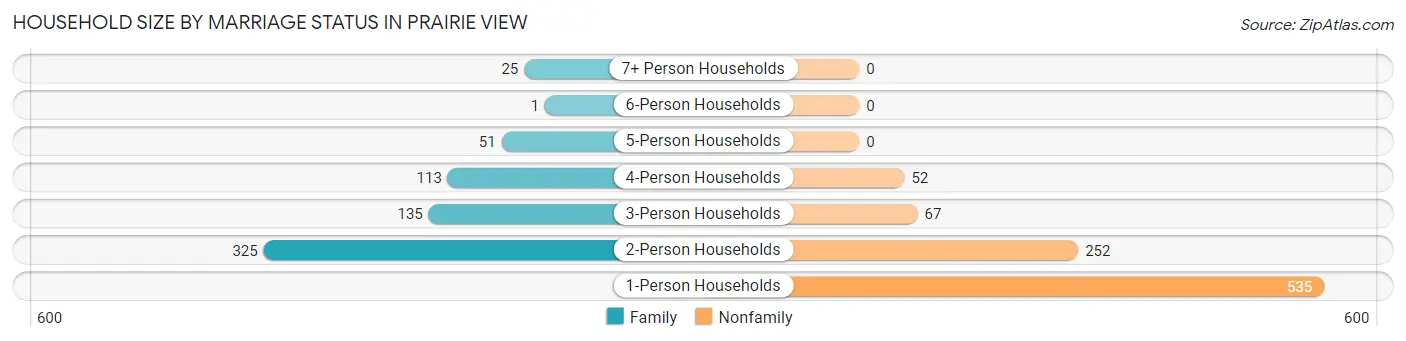
| Household Size | Family Households | Nonfamily Households |
| 1-Person Households | - | 535 (34.4%) |
| 2-Person Households | 325 (20.9%) | 252 (16.2%) |
| 3-Person Households | 135 (8.7%) | 67 (4.3%) |
| 4-Person Households | 113 (7.3%) | 52 (3.3%) |
| 5-Person Households | 51 (3.3%) | 0 (0.0%) |
| 6-Person Households | 1 (0.1%) | 0 (0.0%) |
| 7+ Person Households | 25 (1.6%) | 0 (0.0%) |
| Total | 650 (41.8%) | 906 (58.2%) |
Female Fertility in Prairie View
Fertility by Age in Prairie View
Average fertility rate in Prairie View is 13.0 births per 1,000 women. Women in the age bracket of 20 to 34 years have the highest fertility rate with 21.0 births per 1,000 women. Women in the age bracket of 20 to 34 years acount for 100.0% of all women with births.
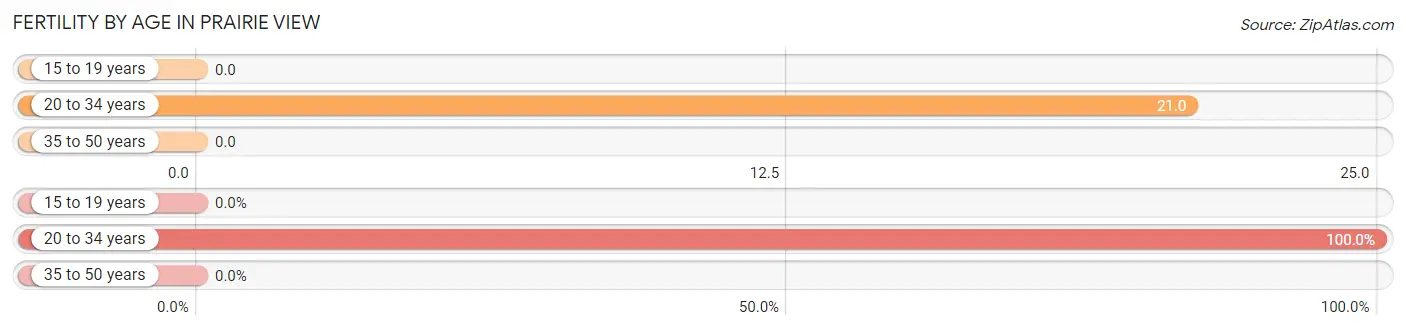
| Age Bracket | Women with Births | Births / 1,000 Women |
| 15 to 19 years | 0 (0.0%) | 0.0 |
| 20 to 34 years | 50 (100.0%) | 21.0 |
| 35 to 50 years | 0 (0.0%) | 0.0 |
| Total | 50 (100.0%) | 13.0 |
Fertility by Age by Marriage Status in Prairie View
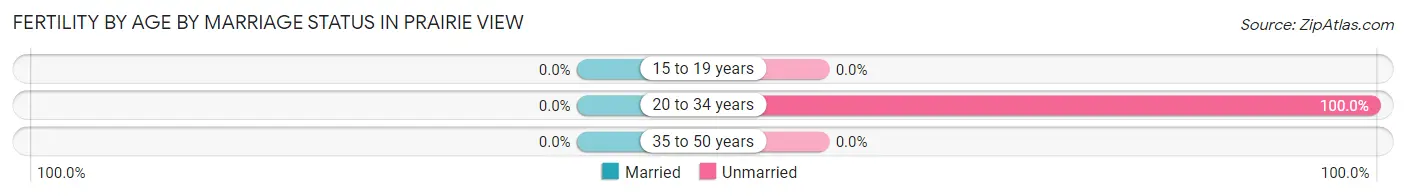
| Age Bracket | Married | Unmarried |
| 15 to 19 years | 0 (0.0%) | 0 (0.0%) |
| 20 to 34 years | 0 (0.0%) | 50 (100.0%) |
| 35 to 50 years | 0 (0.0%) | 0 (0.0%) |
| Total | 0 (0.0%) | 50 (100.0%) |
Fertility by Education in Prairie View
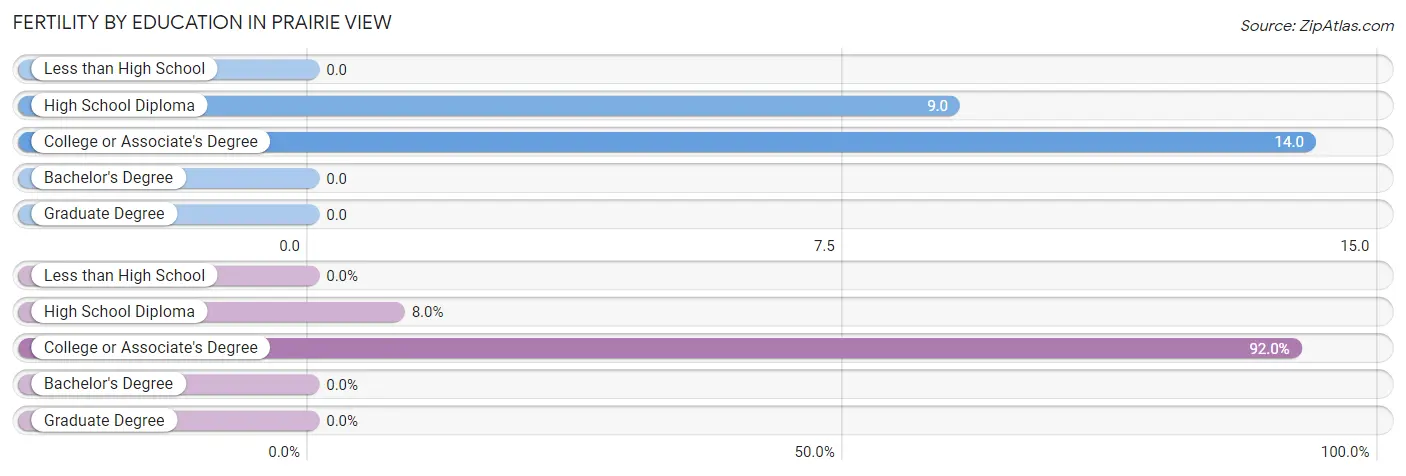
| Educational Attainment | Women with Births | Births / 1,000 Women |
| Less than High School | 0 (0.0%) | 0.0 |
| High School Diploma | 4 (8.0%) | 9.0 |
| College or Associate's Degree | 46 (92.0%) | 14.0 |
| Bachelor's Degree | 0 (0.0%) | 0.0 |
| Graduate Degree | 0 (0.0%) | 0.0 |
| Total | 50 (100.0%) | 13.0 |
Fertility by Education by Marriage Status in Prairie View
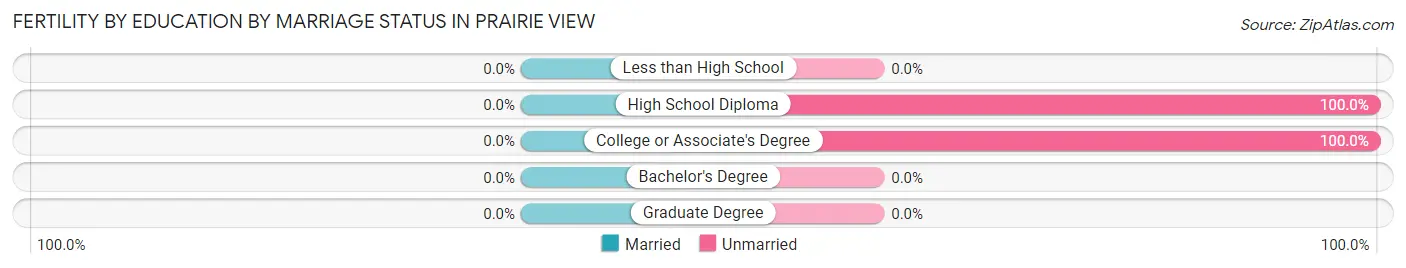
| Educational Attainment | Married | Unmarried |
| Less than High School | 0 (0.0%) | 0 (0.0%) |
| High School Diploma | 0 (0.0%) | 4 (100.0%) |
| College or Associate's Degree | 0 (0.0%) | 46 (100.0%) |
| Bachelor's Degree | 0 (0.0%) | 0 (0.0%) |
| Graduate Degree | 0 (0.0%) | 0 (0.0%) |
| Total | 0 (0.0%) | 50 (100.0%) |
Employment Characteristics in Prairie View
Employment by Class of Employer in Prairie View
Among the 2,487 employed individuals in Prairie View, private company employees (1,473 | 59.2%), state government employees (305 | 12.3%), and federal government employees (293 | 11.8%) make up the most common classes of employment.
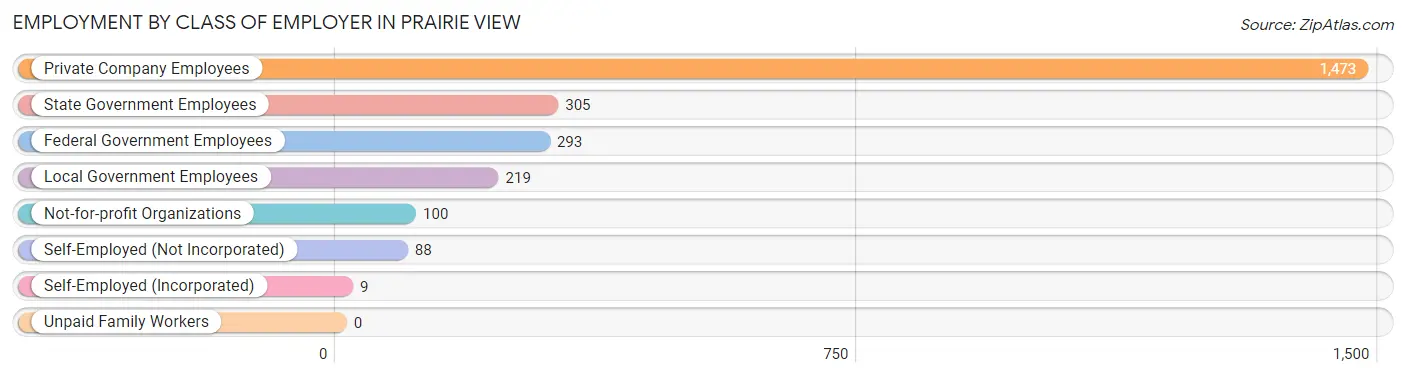
| Employer Class | # Employees | % Employees |
| Private Company Employees | 1,473 | 59.2% |
| Self-Employed (Incorporated) | 9 | 0.4% |
| Self-Employed (Not Incorporated) | 88 | 3.5% |
| Not-for-profit Organizations | 100 | 4.0% |
| Local Government Employees | 219 | 8.8% |
| State Government Employees | 305 | 12.3% |
| Federal Government Employees | 293 | 11.8% |
| Unpaid Family Workers | 0 | 0.0% |
| Total | 2,487 | 100.0% |
Employment Status by Age in Prairie View
According to the labor force statistics for Prairie View, out of the total population over 16 years of age (7,526), 47.0% or 3,537 individuals are in the labor force, with 20.0% or 707 of them unemployed. The age group with the highest labor force participation rate is 35 to 44 years, with 100.0% or 325 individuals in the labor force. Within the labor force, the 20 to 24 years age range has the highest percentage of unemployed individuals, with 30.1% or 545 of them being unemployed.
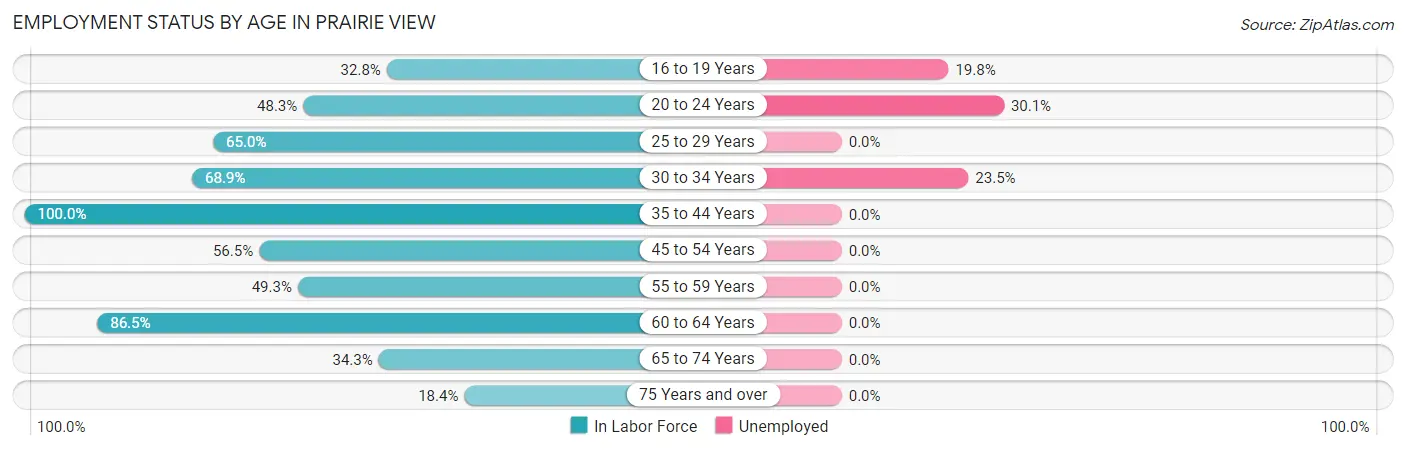
| Age Bracket | In Labor Force | Unemployed |
| 16 to 19 Years | 788 (32.8%) | 156 (19.8%) |
| 20 to 24 Years | 1,812 (48.3%) | 545 (30.1%) |
| 25 to 29 Years | 191 (65.0%) | 0 (0.0%) |
| 30 to 34 Years | 51 (68.9%) | 12 (23.5%) |
| 35 to 44 Years | 325 (100.0%) | 0 (0.0%) |
| 45 to 54 Years | 105 (56.5%) | 0 (0.0%) |
| 55 to 59 Years | 34 (49.3%) | 0 (0.0%) |
| 60 to 64 Years | 166 (86.5%) | 0 (0.0%) |
| 65 to 74 Years | 46 (34.3%) | 0 (0.0%) |
| 75 Years and over | 18 (18.4%) | 0 (0.0%) |
| Total | 3,537 (47.0%) | 707 (20.0%) |
Employment Status by Educational Attainment in Prairie View
According to labor force statistics for Prairie View, 76.5% of individuals (872) out of the total population between 25 and 64 years of age (1,140) are in the labor force, with 1.4% or 12 of them being unemployed. The group with the highest labor force participation rate are those with the educational attainment of bachelor's degree or higher, with 100.0% or 358 individuals in the labor force. Within the labor force, individuals with less than high school education have the highest percentage of unemployment, with 16.2% or 12 of them being unemployed.
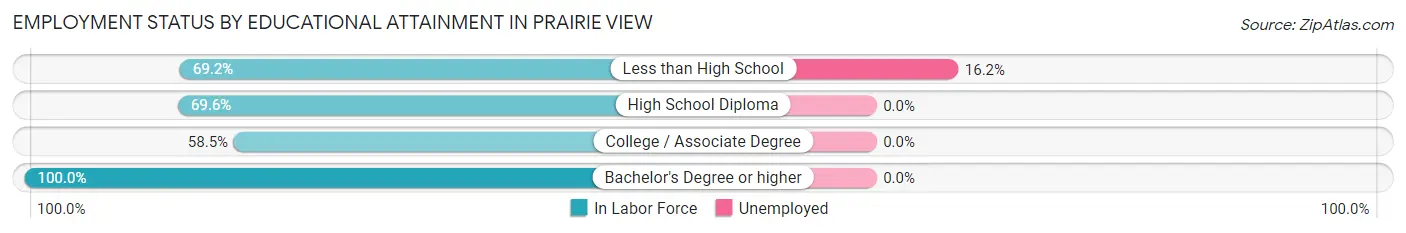
| Educational Attainment | In Labor Force | Unemployed |
| Less than High School | 74 (69.2%) | 17 (16.2%) |
| High School Diploma | 282 (69.6%) | 0 (0.0%) |
| College / Associate Degree | 158 (58.5%) | 0 (0.0%) |
| Bachelor's Degree or higher | 358 (100.0%) | 0 (0.0%) |
| Total | 872 (76.5%) | 16 (1.4%) |
Employment Occupations by Sex in Prairie View
Management, Business, Science and Arts Occupations
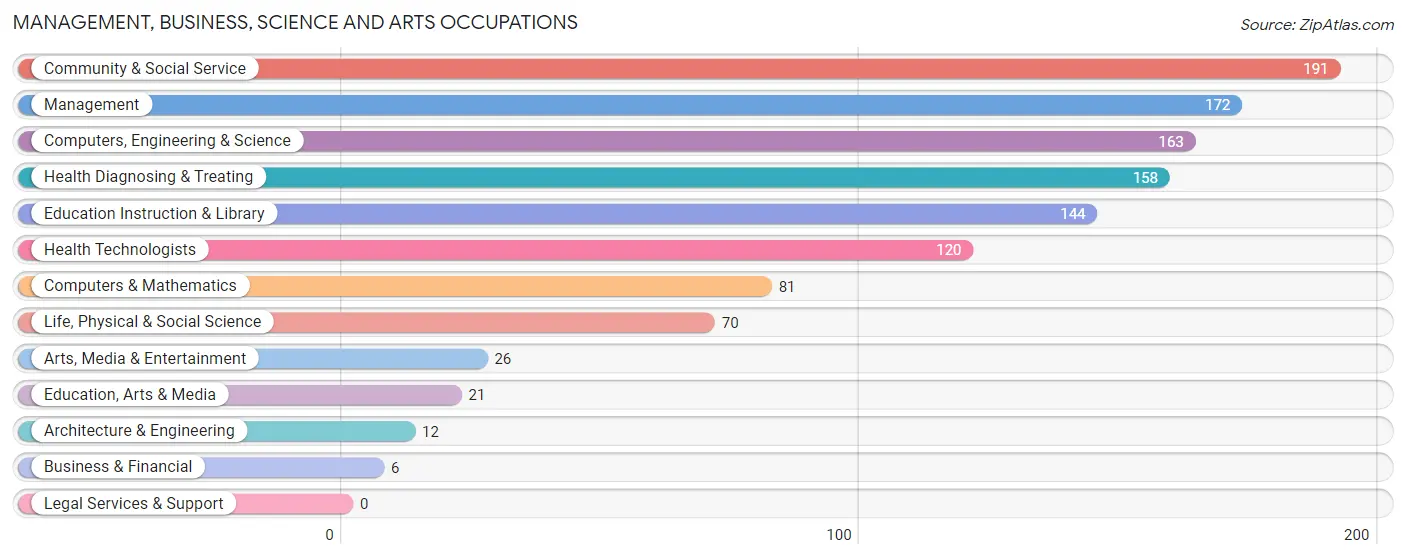
The most common Management, Business, Science and Arts occupations in Prairie View are Community & Social Service (191 | 6.8%), Management (172 | 6.1%), Computers, Engineering & Science (163 | 5.8%), Health Diagnosing & Treating (158 | 5.7%), and Education Instruction & Library (144 | 5.1%).
Management, Business, Science and Arts Occupations by Sex
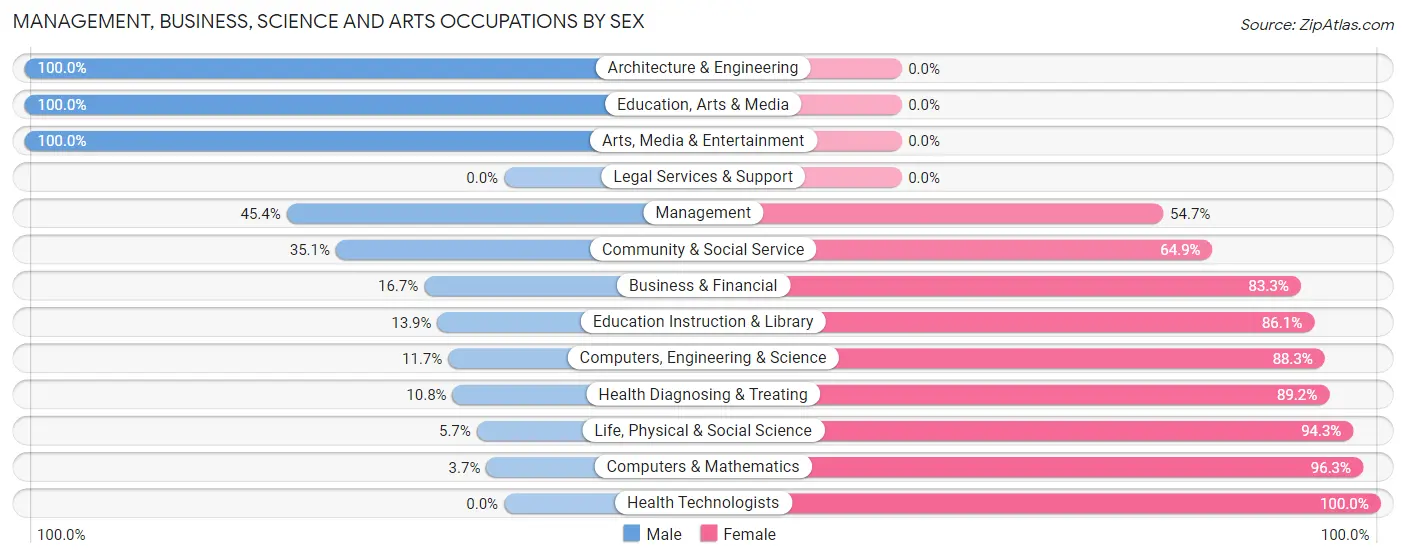
Within the Management, Business, Science and Arts occupations in Prairie View, the most male-oriented occupations are Architecture & Engineering (100.0%), Education, Arts & Media (100.0%), and Arts, Media & Entertainment (100.0%), while the most female-oriented occupations are Health Technologists (100.0%), Computers & Mathematics (96.3%), and Life, Physical & Social Science (94.3%).
| Occupation | Male | Female |
| Management | 78 (45.4%) | 94 (54.6%) |
| Business & Financial | 1 (16.7%) | 5 (83.3%) |
| Computers, Engineering & Science | 19 (11.7%) | 144 (88.3%) |
| Computers & Mathematics | 3 (3.7%) | 78 (96.3%) |
| Architecture & Engineering | 12 (100.0%) | 0 (0.0%) |
| Life, Physical & Social Science | 4 (5.7%) | 66 (94.3%) |
| Community & Social Service | 67 (35.1%) | 124 (64.9%) |
| Education, Arts & Media | 21 (100.0%) | 0 (0.0%) |
| Legal Services & Support | 0 (0.0%) | 0 (0.0%) |
| Education Instruction & Library | 20 (13.9%) | 124 (86.1%) |
| Arts, Media & Entertainment | 26 (100.0%) | 0 (0.0%) |
| Health Diagnosing & Treating | 17 (10.8%) | 141 (89.2%) |
| Health Technologists | 0 (0.0%) | 120 (100.0%) |
| Total (Category) | 182 (26.4%) | 508 (73.6%) |
| Total (Overall) | 1,272 (45.5%) | 1,523 (54.5%) |
Services Occupations
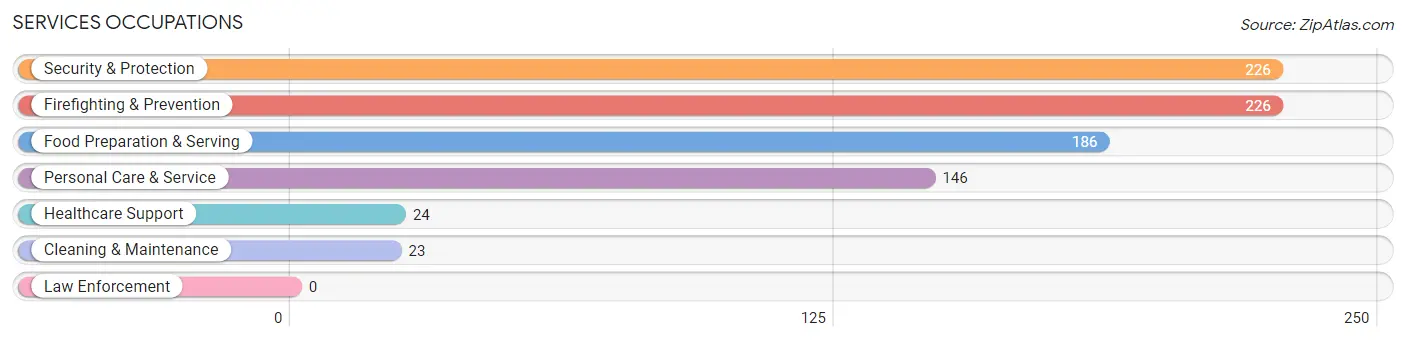
The most common Services occupations in Prairie View are Security & Protection (226 | 8.1%), Firefighting & Prevention (226 | 8.1%), Food Preparation & Serving (186 | 6.7%), Personal Care & Service (146 | 5.2%), and Healthcare Support (24 | 0.9%).
Services Occupations by Sex
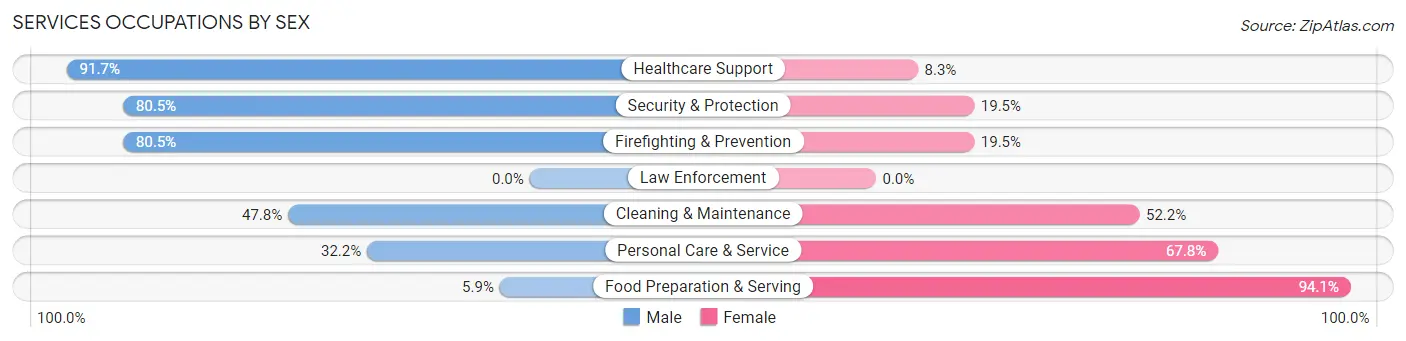
Within the Services occupations in Prairie View, the most male-oriented occupations are Healthcare Support (91.7%), Security & Protection (80.5%), and Firefighting & Prevention (80.5%), while the most female-oriented occupations are Food Preparation & Serving (94.1%), Personal Care & Service (67.8%), and Cleaning & Maintenance (52.2%).
| Occupation | Male | Female |
| Healthcare Support | 22 (91.7%) | 2 (8.3%) |
| Security & Protection | 182 (80.5%) | 44 (19.5%) |
| Firefighting & Prevention | 182 (80.5%) | 44 (19.5%) |
| Law Enforcement | 0 (0.0%) | 0 (0.0%) |
| Food Preparation & Serving | 11 (5.9%) | 175 (94.1%) |
| Cleaning & Maintenance | 11 (47.8%) | 12 (52.2%) |
| Personal Care & Service | 47 (32.2%) | 99 (67.8%) |
| Total (Category) | 273 (45.1%) | 332 (54.9%) |
| Total (Overall) | 1,272 (45.5%) | 1,523 (54.5%) |
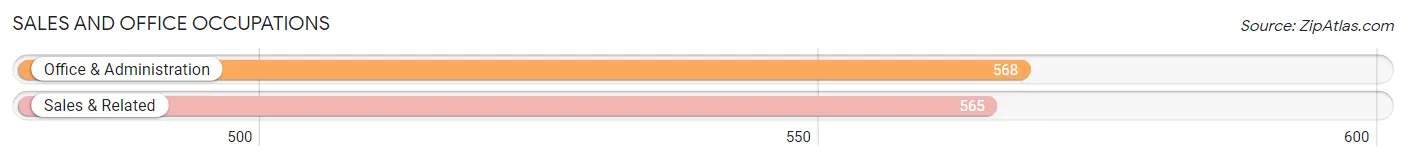
Sales and Office Occupations
The most common Sales and Office occupations in Prairie View are Office & Administration (568 | 20.3%), and Sales & Related (565 | 20.2%).
Sales and Office Occupations by Sex
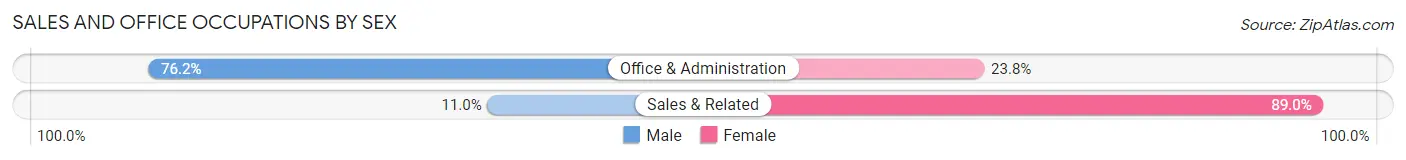
| Occupation | Male | Female |
| Sales & Related | 62 (11.0%) | 503 (89.0%) |
| Office & Administration | 433 (76.2%) | 135 (23.8%) |
| Total (Category) | 495 (43.7%) | 638 (56.3%) |
| Total (Overall) | 1,272 (45.5%) | 1,523 (54.5%) |
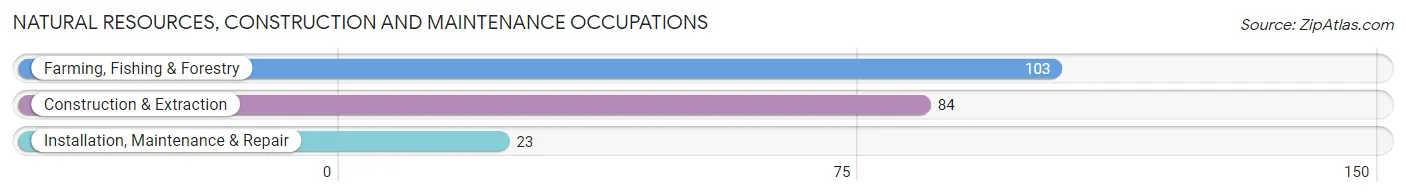
Natural Resources, Construction and Maintenance Occupations
The most common Natural Resources, Construction and Maintenance occupations in Prairie View are Farming, Fishing & Forestry (103 | 3.7%), Construction & Extraction (84 | 3.0%), and Installation, Maintenance & Repair (23 | 0.8%).
Natural Resources, Construction and Maintenance Occupations by Sex
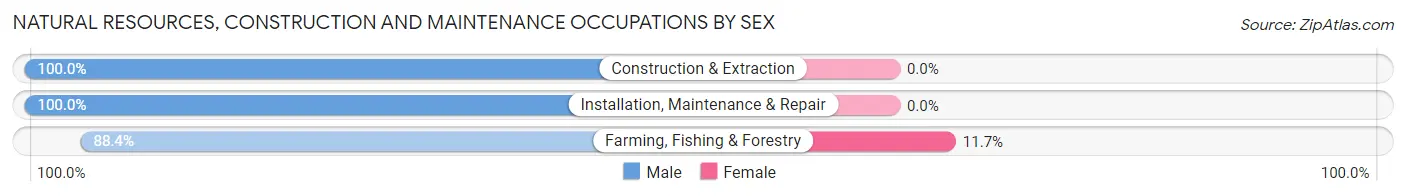
| Occupation | Male | Female |
| Farming, Fishing & Forestry | 91 (88.3%) | 12 (11.7%) |
| Construction & Extraction | 84 (100.0%) | 0 (0.0%) |
| Installation, Maintenance & Repair | 23 (100.0%) | 0 (0.0%) |
| Total (Category) | 198 (94.3%) | 12 (5.7%) |
| Total (Overall) | 1,272 (45.5%) | 1,523 (54.5%) |
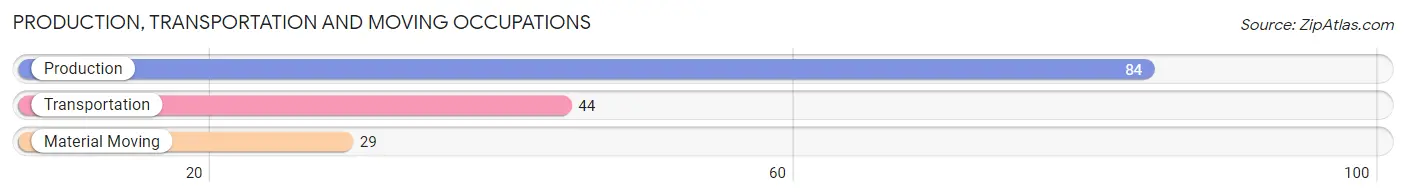
Production, Transportation and Moving Occupations
The most common Production, Transportation and Moving occupations in Prairie View are Production (84 | 3.0%), Transportation (44 | 1.6%), and Material Moving (29 | 1.0%).
Production, Transportation and Moving Occupations by Sex
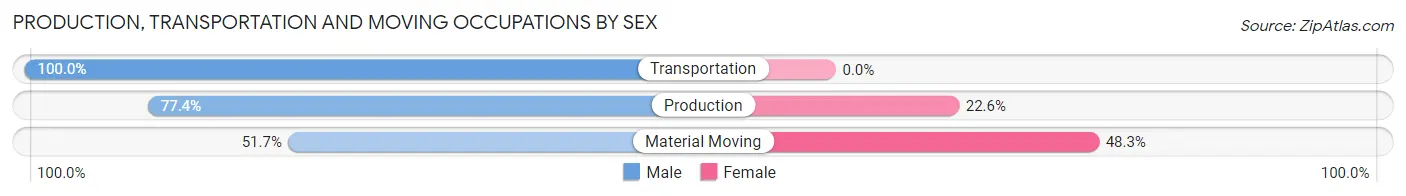
| Occupation | Male | Female |
| Production | 65 (77.4%) | 19 (22.6%) |
| Transportation | 44 (100.0%) | 0 (0.0%) |
| Material Moving | 15 (51.7%) | 14 (48.3%) |
| Total (Category) | 124 (79.0%) | 33 (21.0%) |
| Total (Overall) | 1,272 (45.5%) | 1,523 (54.5%) |
Employment Industries by Sex in Prairie View
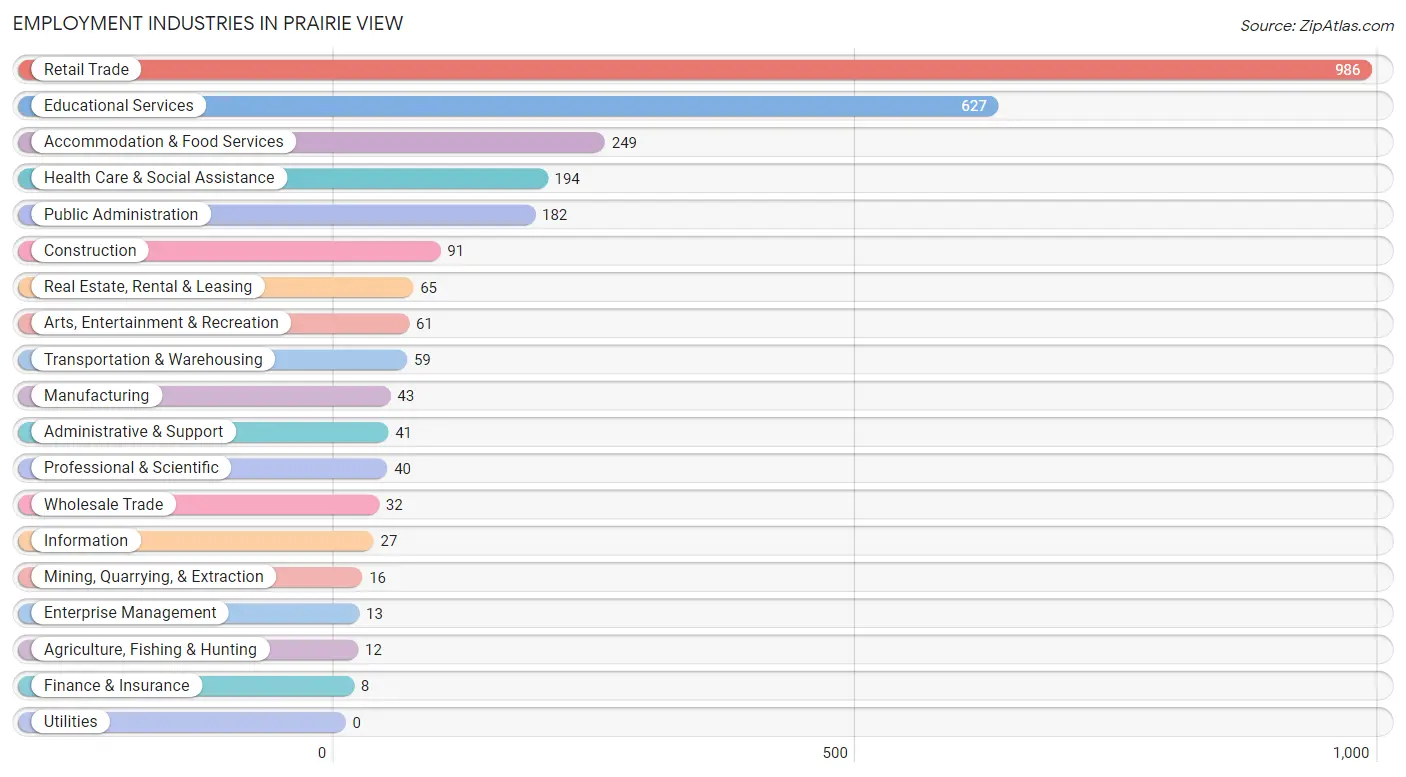
Employment Industries in Prairie View
The major employment industries in Prairie View include Retail Trade (986 | 35.3%), Educational Services (627 | 22.4%), Accommodation & Food Services (249 | 8.9%), Health Care & Social Assistance (194 | 6.9%), and Public Administration (182 | 6.5%).
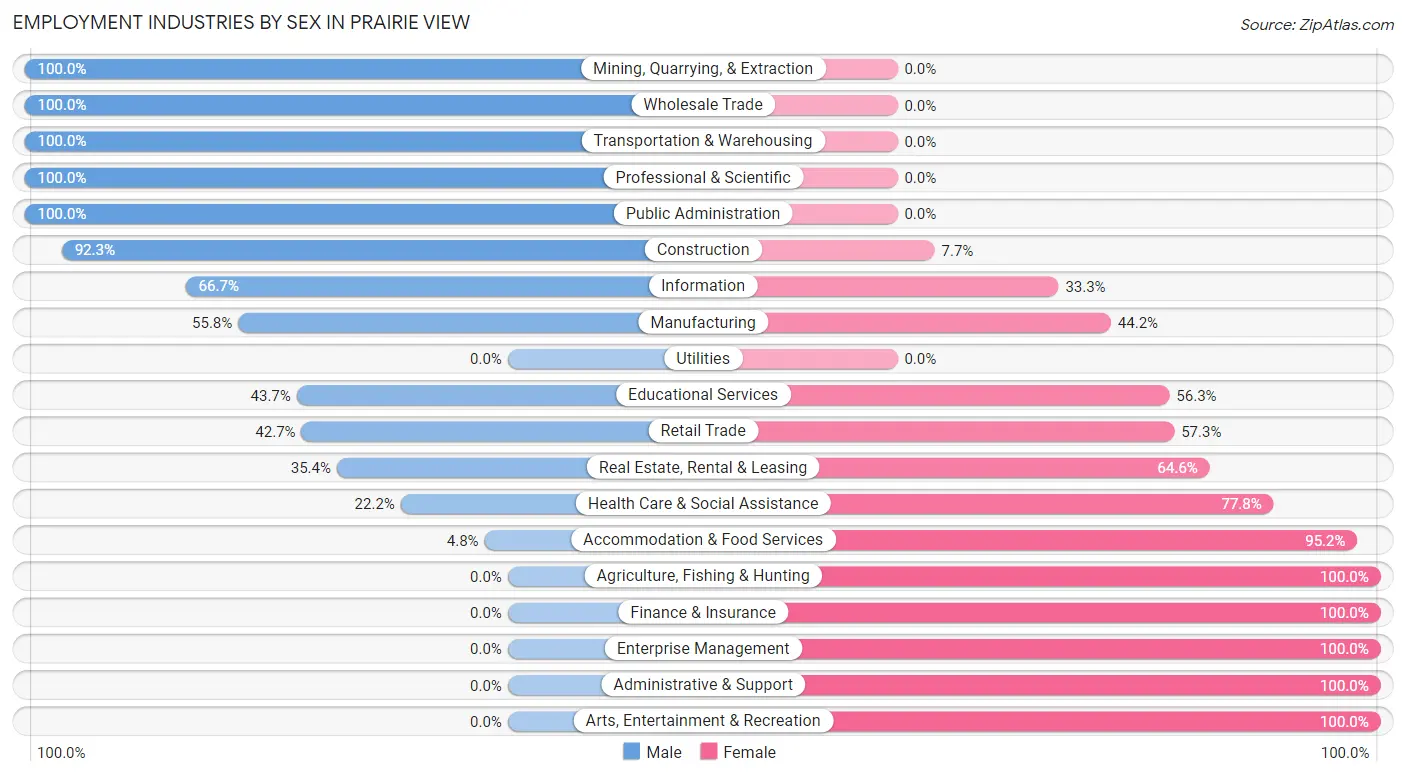
Employment Industries by Sex in Prairie View
The Prairie View industries that see more men than women are Mining, Quarrying, & Extraction (100.0%), Wholesale Trade (100.0%), and Transportation & Warehousing (100.0%), whereas the industries that tend to have a higher number of women are Agriculture, Fishing & Hunting (100.0%), Finance & Insurance (100.0%), and Enterprise Management (100.0%).
| Industry | Male | Female |
| Agriculture, Fishing & Hunting | 0 (0.0%) | 12 (100.0%) |
| Mining, Quarrying, & Extraction | 16 (100.0%) | 0 (0.0%) |
| Construction | 84 (92.3%) | 7 (7.7%) |
| Manufacturing | 24 (55.8%) | 19 (44.2%) |
| Wholesale Trade | 32 (100.0%) | 0 (0.0%) |
| Retail Trade | 421 (42.7%) | 565 (57.3%) |
| Transportation & Warehousing | 59 (100.0%) | 0 (0.0%) |
| Utilities | 0 (0.0%) | 0 (0.0%) |
| Information | 18 (66.7%) | 9 (33.3%) |
| Finance & Insurance | 0 (0.0%) | 8 (100.0%) |
| Real Estate, Rental & Leasing | 23 (35.4%) | 42 (64.6%) |
| Professional & Scientific | 40 (100.0%) | 0 (0.0%) |
| Enterprise Management | 0 (0.0%) | 13 (100.0%) |
| Administrative & Support | 0 (0.0%) | 41 (100.0%) |
| Educational Services | 274 (43.7%) | 353 (56.3%) |
| Health Care & Social Assistance | 43 (22.2%) | 151 (77.8%) |
| Arts, Entertainment & Recreation | 0 (0.0%) | 61 (100.0%) |
| Accommodation & Food Services | 12 (4.8%) | 237 (95.2%) |
| Public Administration | 182 (100.0%) | 0 (0.0%) |
| Total | 1,272 (45.5%) | 1,523 (54.5%) |
Education in Prairie View
School Enrollment in Prairie View
The most common levels of schooling among the 6,369 students in Prairie View are college / undergraduate (5,929 | 93.1%), middle school (183 | 2.9%), and elementary school (130 | 2.0%).
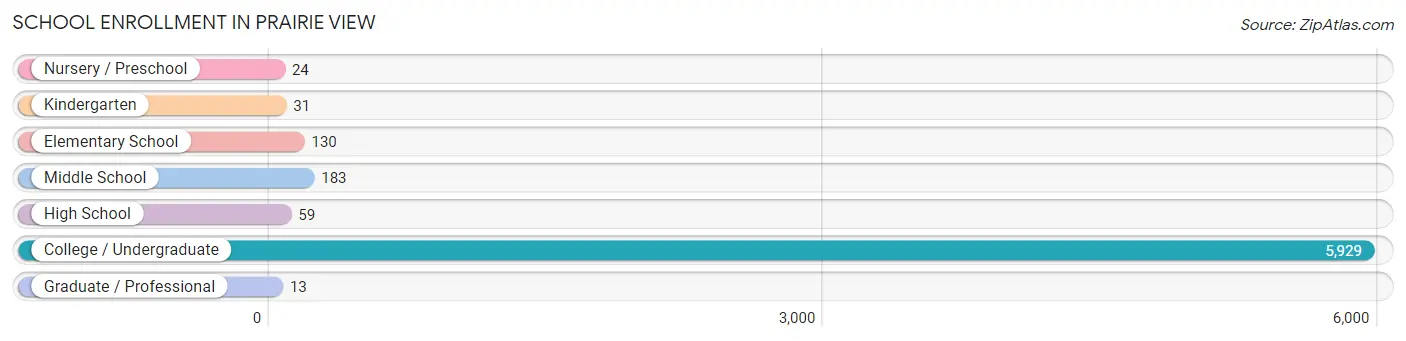
| School Level | # Students | % Students |
| Nursery / Preschool | 24 | 0.4% |
| Kindergarten | 31 | 0.5% |
| Elementary School | 130 | 2.0% |
| Middle School | 183 | 2.9% |
| High School | 59 | 0.9% |
| College / Undergraduate | 5,929 | 93.1% |
| Graduate / Professional | 13 | 0.2% |
| Total | 6,369 | 100.0% |
School Enrollment by Age by Funding Source in Prairie View
Out of a total of 6,369 students who are enrolled in schools in Prairie View, 45 (0.7%) attend a private institution, while the remaining 6,324 (99.3%) are enrolled in public schools. The age group of 18 to 19 year olds has the highest likelihood of being enrolled in private schools, with 23 (1.0% in the age bracket) enrolled. Conversely, the age group of 3 to 4 year olds has the lowest likelihood of being enrolled in a private school, with 24 (100.0% in the age bracket) attending a public institution.
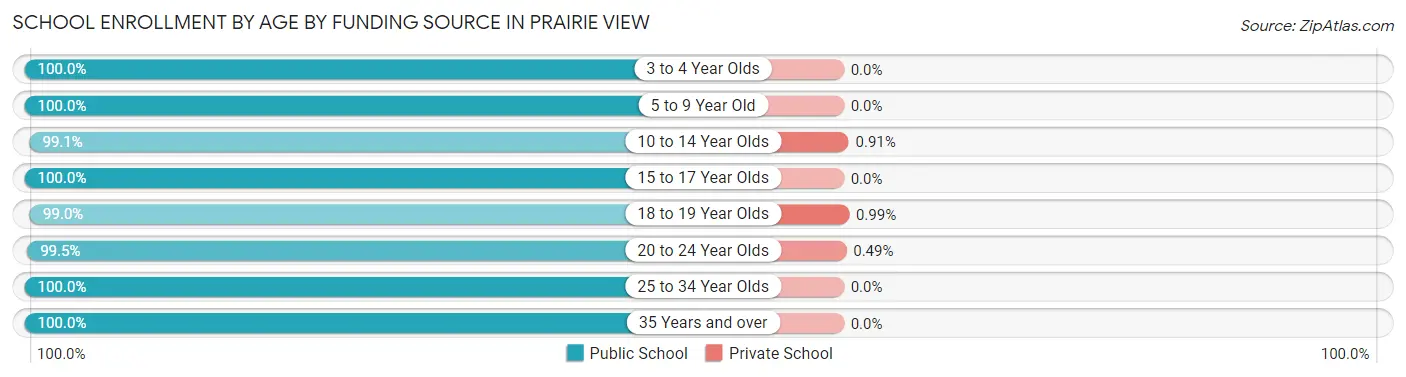
| Age Bracket | Public School | Private School |
| 3 to 4 Year Olds | 24 (100.0%) | 0 (0.0%) |
| 5 to 9 Year Old | 127 (100.0%) | 0 (0.0%) |
| 10 to 14 Year Olds | 217 (99.1%) | 2 (0.9%) |
| 15 to 17 Year Olds | 59 (100.0%) | 0 (0.0%) |
| 18 to 19 Year Olds | 2,303 (99.0%) | 23 (1.0%) |
| 20 to 24 Year Olds | 3,465 (99.5%) | 17 (0.5%) |
| 25 to 34 Year Olds | 124 (100.0%) | 0 (0.0%) |
| 35 Years and over | 8 (100.0%) | 0 (0.0%) |
| Total | 6,324 (99.3%) | 45 (0.7%) |
Educational Attainment by Field of Study in Prairie View
Social sciences (182 | 41.2%), business (87 | 19.7%), bio, nature & agricultural (55 | 12.4%), education (47 | 10.6%), and physical & health sciences (32 | 7.2%) are the most common fields of study among 442 individuals in Prairie View who have obtained a bachelor's degree or higher.
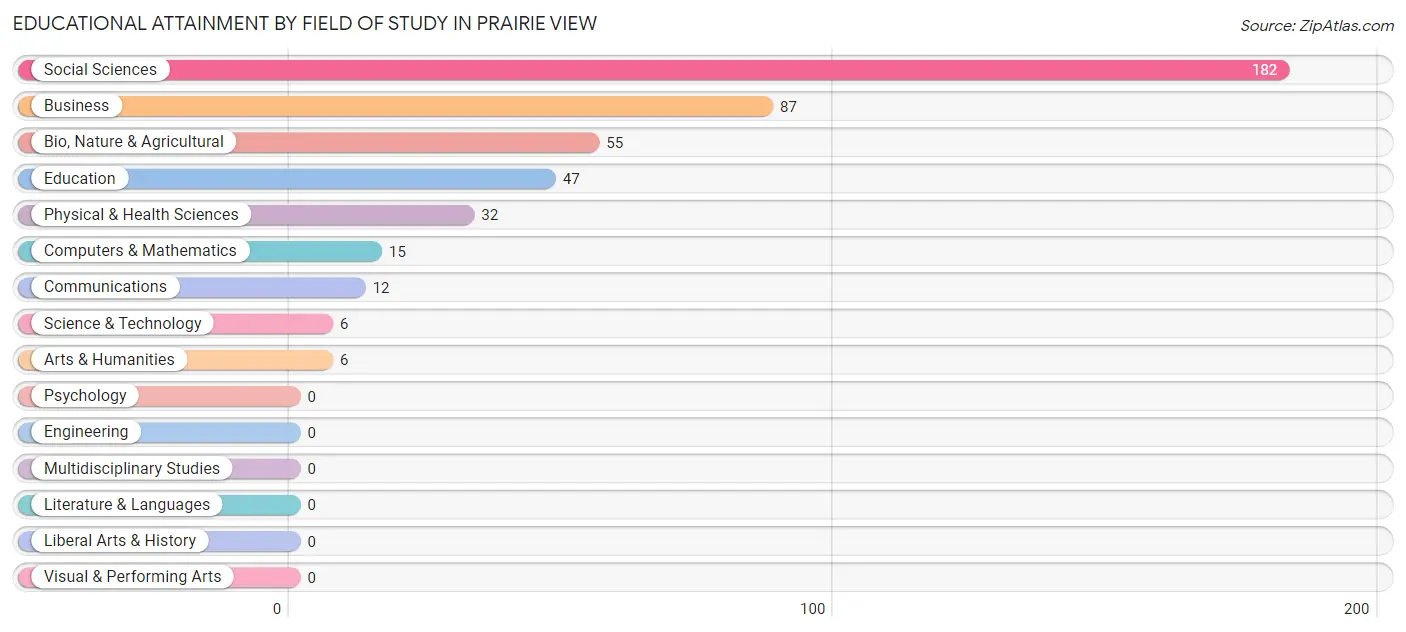
| Field of Study | # Graduates | % Graduates |
| Computers & Mathematics | 15 | 3.4% |
| Bio, Nature & Agricultural | 55 | 12.4% |
| Physical & Health Sciences | 32 | 7.2% |
| Psychology | 0 | 0.0% |
| Social Sciences | 182 | 41.2% |
| Engineering | 0 | 0.0% |
| Multidisciplinary Studies | 0 | 0.0% |
| Science & Technology | 6 | 1.4% |
| Business | 87 | 19.7% |
| Education | 47 | 10.6% |
| Literature & Languages | 0 | 0.0% |
| Liberal Arts & History | 0 | 0.0% |
| Visual & Performing Arts | 0 | 0.0% |
| Communications | 12 | 2.7% |
| Arts & Humanities | 6 | 1.4% |
| Total | 442 | 100.0% |
Transportation & Commute in Prairie View
Vehicle Availability by Sex in Prairie View
The most prevalent vehicle ownership categories in Prairie View are males with 3 vehicles (332, accounting for 52.0%) and females with 3 vehicles (67, making up 65.2%).
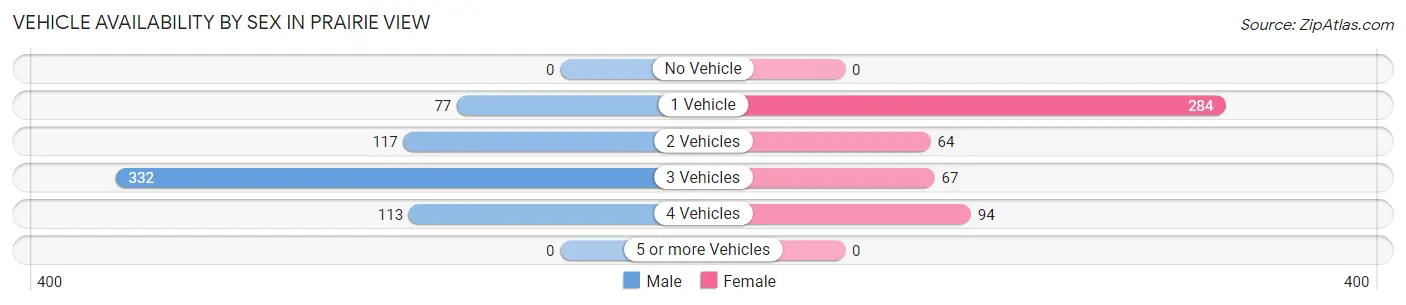
| Vehicles Available | Male | Female |
| No Vehicle | 0 (0.0%) | 0 (0.0%) |
| 1 Vehicle | 77 (12.0%) | 284 (55.8%) |
| 2 Vehicles | 117 (18.3%) | 64 (12.6%) |
| 3 Vehicles | 332 (52.0%) | 67 (13.2%) |
| 4 Vehicles | 113 (17.7%) | 94 (18.5%) |
| 5 or more Vehicles | 0 (0.0%) | 0 (0.0%) |
| Total | 639 (100.0%) | 509 (100.0%) |
Commute Time in Prairie View
The most frequently occuring commute durations in Prairie View are 10 to 14 minutes (523 commuters, 22.5%), 5 to 9 minutes (359 commuters, 15.5%), and 20 to 24 minutes (319 commuters, 13.8%).
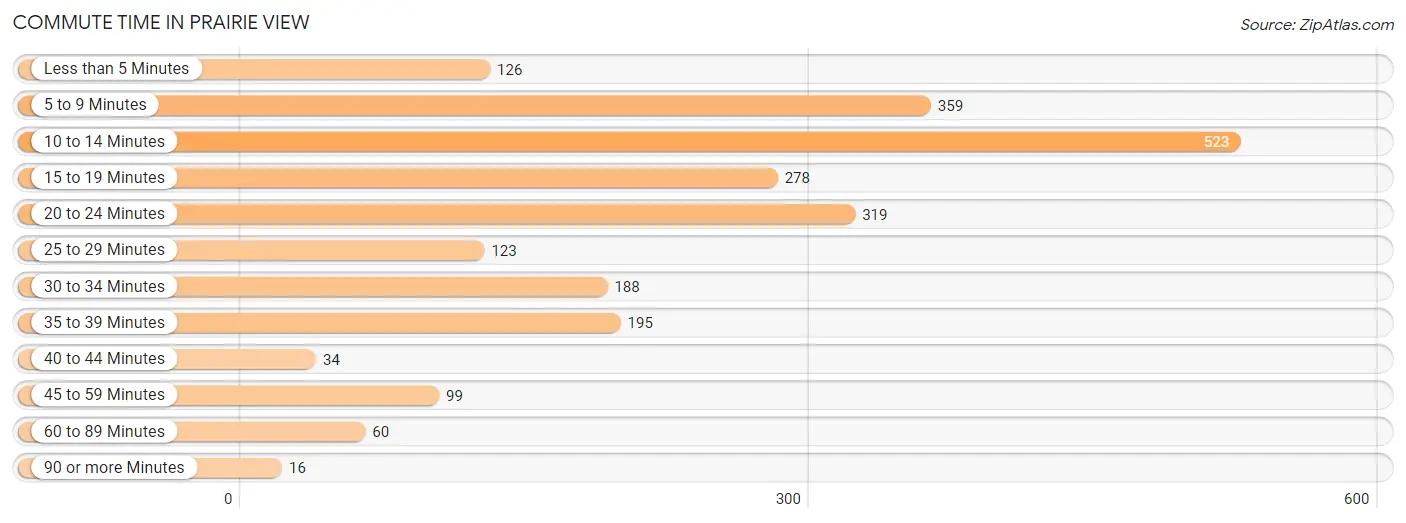
| Commute Time | # Commuters | % Commuters |
| Less than 5 Minutes | 126 | 5.4% |
| 5 to 9 Minutes | 359 | 15.5% |
| 10 to 14 Minutes | 523 | 22.5% |
| 15 to 19 Minutes | 278 | 12.0% |
| 20 to 24 Minutes | 319 | 13.8% |
| 25 to 29 Minutes | 123 | 5.3% |
| 30 to 34 Minutes | 188 | 8.1% |
| 35 to 39 Minutes | 195 | 8.4% |
| 40 to 44 Minutes | 34 | 1.5% |
| 45 to 59 Minutes | 99 | 4.3% |
| 60 to 89 Minutes | 60 | 2.6% |
| 90 or more Minutes | 16 | 0.7% |
Commute Time by Sex in Prairie View
The most common commute times in Prairie View are 10 to 14 minutes (257 commuters, 27.5%) for males and 10 to 14 minutes (266 commuters, 19.2%) for females.
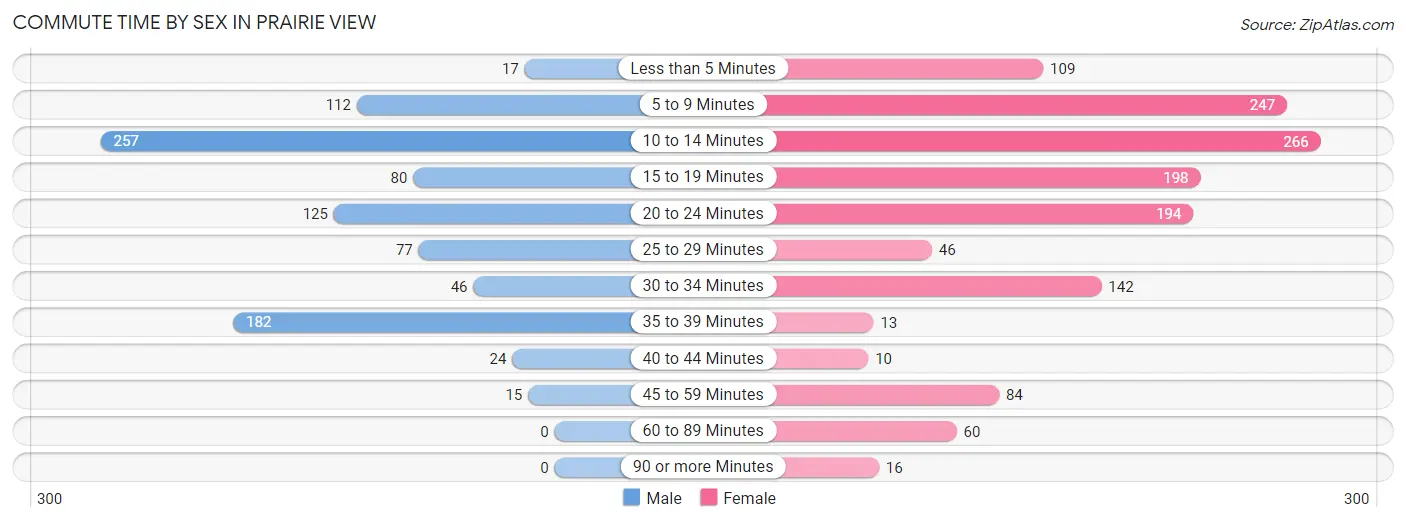
| Commute Time | Male | Female |
| Less than 5 Minutes | 17 (1.8%) | 109 (7.9%) |
| 5 to 9 Minutes | 112 (12.0%) | 247 (17.8%) |
| 10 to 14 Minutes | 257 (27.5%) | 266 (19.2%) |
| 15 to 19 Minutes | 80 (8.6%) | 198 (14.3%) |
| 20 to 24 Minutes | 125 (13.4%) | 194 (14.0%) |
| 25 to 29 Minutes | 77 (8.2%) | 46 (3.3%) |
| 30 to 34 Minutes | 46 (4.9%) | 142 (10.2%) |
| 35 to 39 Minutes | 182 (19.5%) | 13 (0.9%) |
| 40 to 44 Minutes | 24 (2.6%) | 10 (0.7%) |
| 45 to 59 Minutes | 15 (1.6%) | 84 (6.1%) |
| 60 to 89 Minutes | 0 (0.0%) | 60 (4.3%) |
| 90 or more Minutes | 0 (0.0%) | 16 (1.2%) |
Time of Departure to Work by Sex in Prairie View
The most frequent times of departure to work in Prairie View are 5:00 AM to 5:29 AM (182, 19.5%) for males and 12:00 PM to 3:59 PM (281, 20.3%) for females.
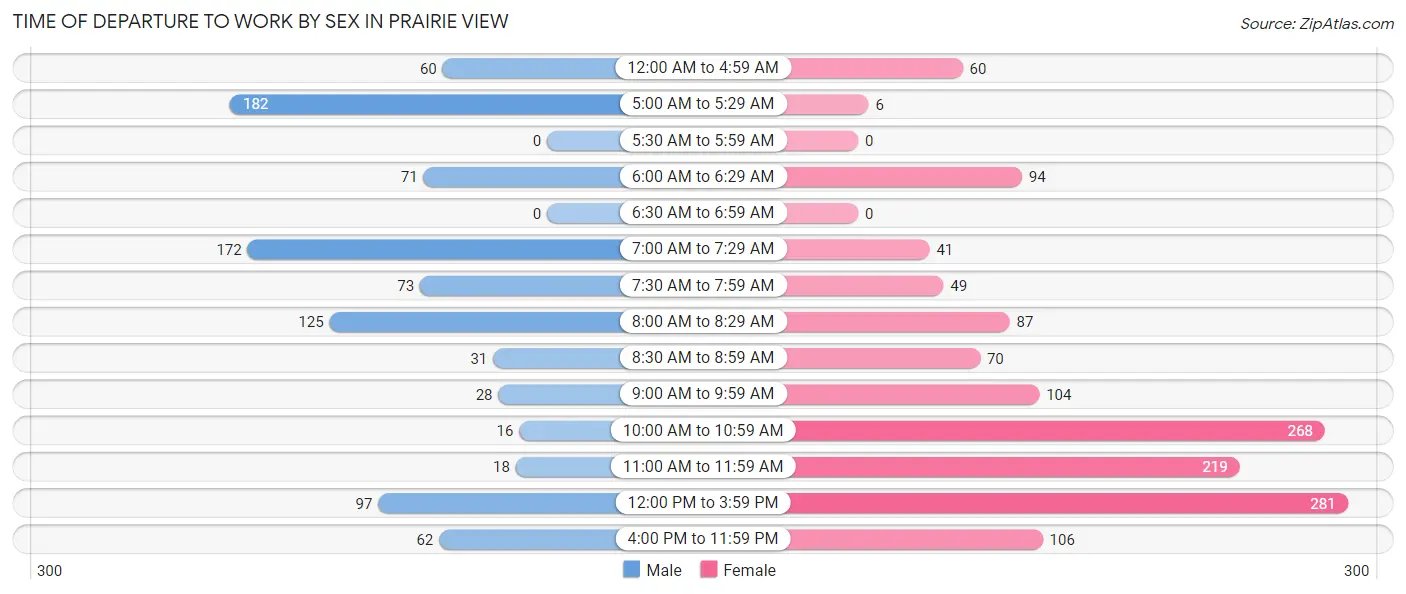
| Time of Departure | Male | Female |
| 12:00 AM to 4:59 AM | 60 (6.4%) | 60 (4.3%) |
| 5:00 AM to 5:29 AM | 182 (19.5%) | 6 (0.4%) |
| 5:30 AM to 5:59 AM | 0 (0.0%) | 0 (0.0%) |
| 6:00 AM to 6:29 AM | 71 (7.6%) | 94 (6.8%) |
| 6:30 AM to 6:59 AM | 0 (0.0%) | 0 (0.0%) |
| 7:00 AM to 7:29 AM | 172 (18.4%) | 41 (3.0%) |
| 7:30 AM to 7:59 AM | 73 (7.8%) | 49 (3.5%) |
| 8:00 AM to 8:29 AM | 125 (13.4%) | 87 (6.3%) |
| 8:30 AM to 8:59 AM | 31 (3.3%) | 70 (5.1%) |
| 9:00 AM to 9:59 AM | 28 (3.0%) | 104 (7.5%) |
| 10:00 AM to 10:59 AM | 16 (1.7%) | 268 (19.4%) |
| 11:00 AM to 11:59 AM | 18 (1.9%) | 219 (15.8%) |
| 12:00 PM to 3:59 PM | 97 (10.4%) | 281 (20.3%) |
| 4:00 PM to 11:59 PM | 62 (6.6%) | 106 (7.6%) |
| Total | 935 (100.0%) | 1,385 (100.0%) |
Housing Occupancy in Prairie View
Occupancy by Ownership in Prairie View
Of the total 1,556 dwellings in Prairie View, owner-occupied units account for 279 (17.9%), while renter-occupied units make up 1,277 (82.1%).
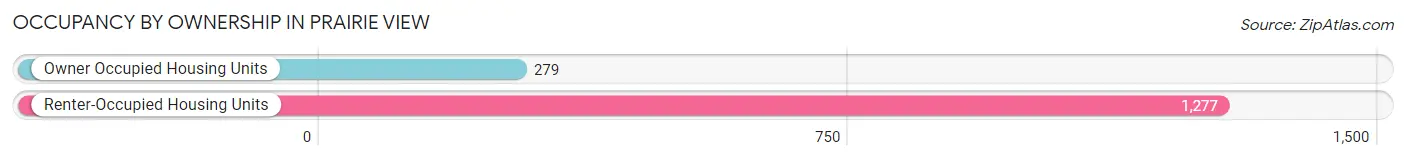
| Occupancy | # Housing Units | % Housing Units |
| Owner Occupied Housing Units | 279 | 17.9% |
| Renter-Occupied Housing Units | 1,277 | 82.1% |
| Total Occupied Housing Units | 1,556 | 100.0% |
Occupancy by Household Size in Prairie View
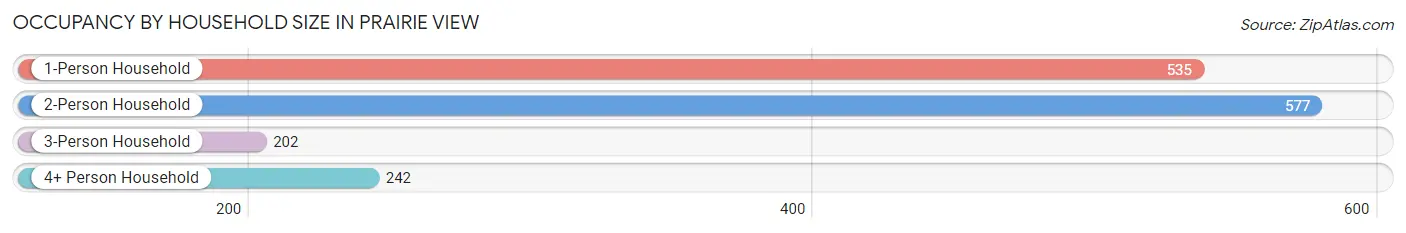
| Household Size | # Housing Units | % Housing Units |
| 1-Person Household | 535 | 34.4% |
| 2-Person Household | 577 | 37.1% |
| 3-Person Household | 202 | 13.0% |
| 4+ Person Household | 242 | 15.5% |
| Total Housing Units | 1,556 | 100.0% |
Occupancy by Ownership by Household Size in Prairie View
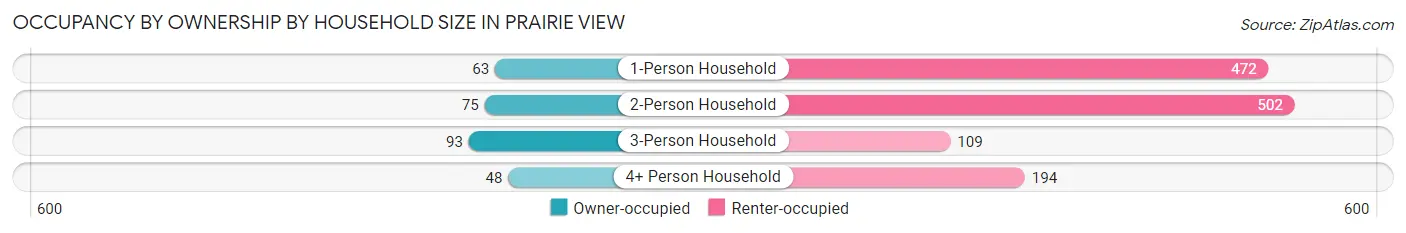
| Household Size | Owner-occupied | Renter-occupied |
| 1-Person Household | 63 (11.8%) | 472 (88.2%) |
| 2-Person Household | 75 (13.0%) | 502 (87.0%) |
| 3-Person Household | 93 (46.0%) | 109 (54.0%) |
| 4+ Person Household | 48 (19.8%) | 194 (80.2%) |
| Total Housing Units | 279 (17.9%) | 1,277 (82.1%) |
Occupancy by Educational Attainment in Prairie View
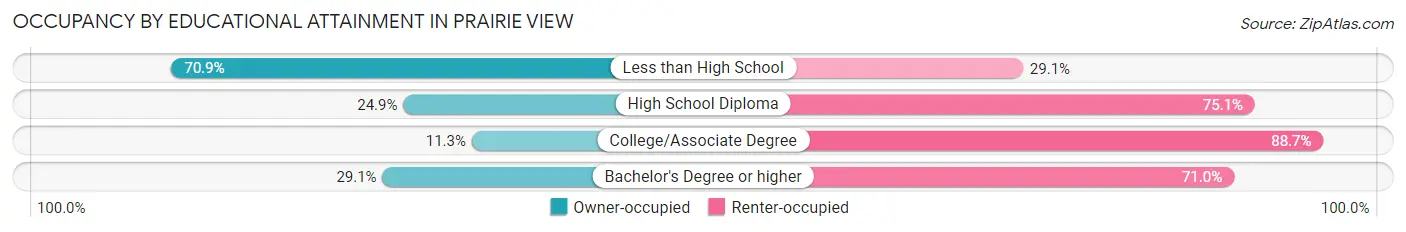
| Household Size | Owner-occupied | Renter-occupied |
| Less than High School | 39 (70.9%) | 16 (29.1%) |
| High School Diploma | 80 (24.9%) | 241 (75.1%) |
| College/Associate Degree | 117 (11.3%) | 915 (88.7%) |
| Bachelor's Degree or higher | 43 (29.0%) | 105 (71.0%) |
Occupancy by Age of Householder in Prairie View
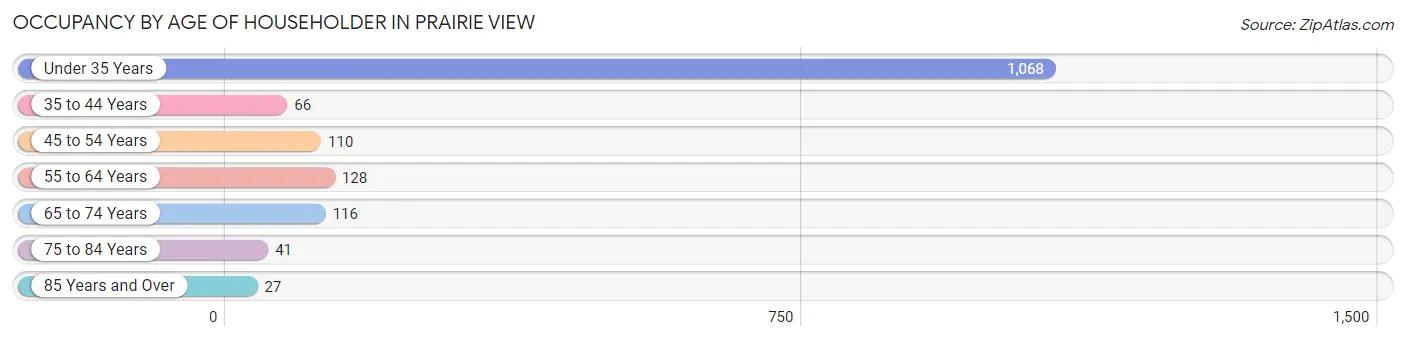
| Age Bracket | # Households | % Households |
| Under 35 Years | 1,068 | 68.6% |
| 35 to 44 Years | 66 | 4.2% |
| 45 to 54 Years | 110 | 7.1% |
| 55 to 64 Years | 128 | 8.2% |
| 65 to 74 Years | 116 | 7.5% |
| 75 to 84 Years | 41 | 2.6% |
| 85 Years and Over | 27 | 1.7% |
| Total | 1,556 | 100.0% |
Housing Finances in Prairie View
Median Income by Occupancy in Prairie View
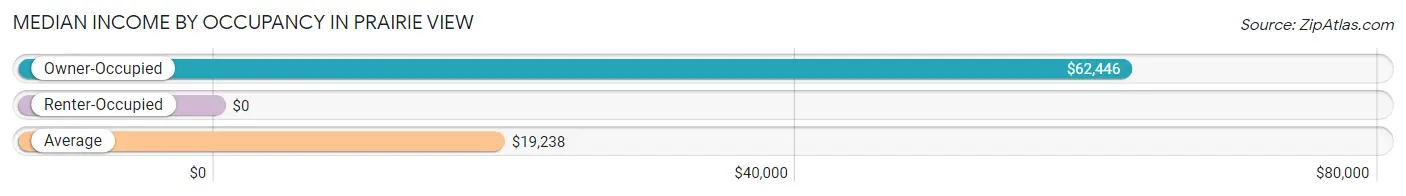
| Occupancy Type | # Households | Median Income |
| Owner-Occupied | 279 (17.9%) | $62,446 |
| Renter-Occupied | 1,277 (82.1%) | $0 |
| Average | 1,556 (100.0%) | $19,238 |
Occupancy by Householder Income Bracket in Prairie View
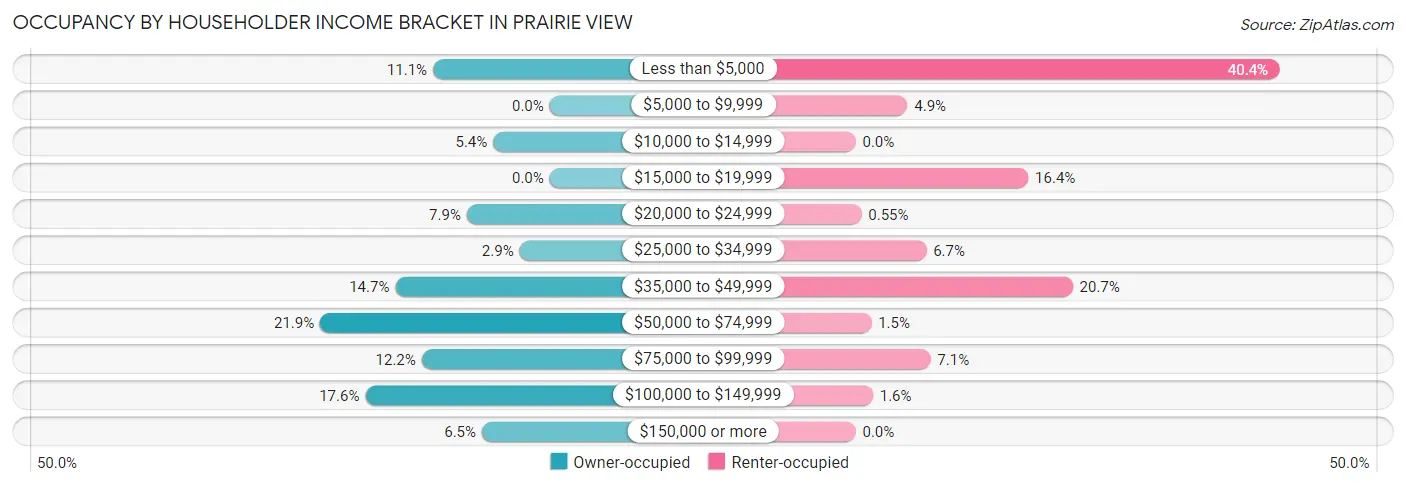
| Income Bracket | Owner-occupied | Renter-occupied |
| Less than $5,000 | 31 (11.1%) | 516 (40.4%) |
| $5,000 to $9,999 | 0 (0.0%) | 63 (4.9%) |
| $10,000 to $14,999 | 15 (5.4%) | 0 (0.0%) |
| $15,000 to $19,999 | 0 (0.0%) | 210 (16.4%) |
| $20,000 to $24,999 | 22 (7.9%) | 7 (0.5%) |
| $25,000 to $34,999 | 8 (2.9%) | 86 (6.7%) |
| $35,000 to $49,999 | 41 (14.7%) | 264 (20.7%) |
| $50,000 to $74,999 | 61 (21.9%) | 19 (1.5%) |
| $75,000 to $99,999 | 34 (12.2%) | 91 (7.1%) |
| $100,000 to $149,999 | 49 (17.6%) | 21 (1.6%) |
| $150,000 or more | 18 (6.5%) | 0 (0.0%) |
| Total | 279 (100.0%) | 1,277 (100.0%) |
Monthly Housing Cost Tiers in Prairie View
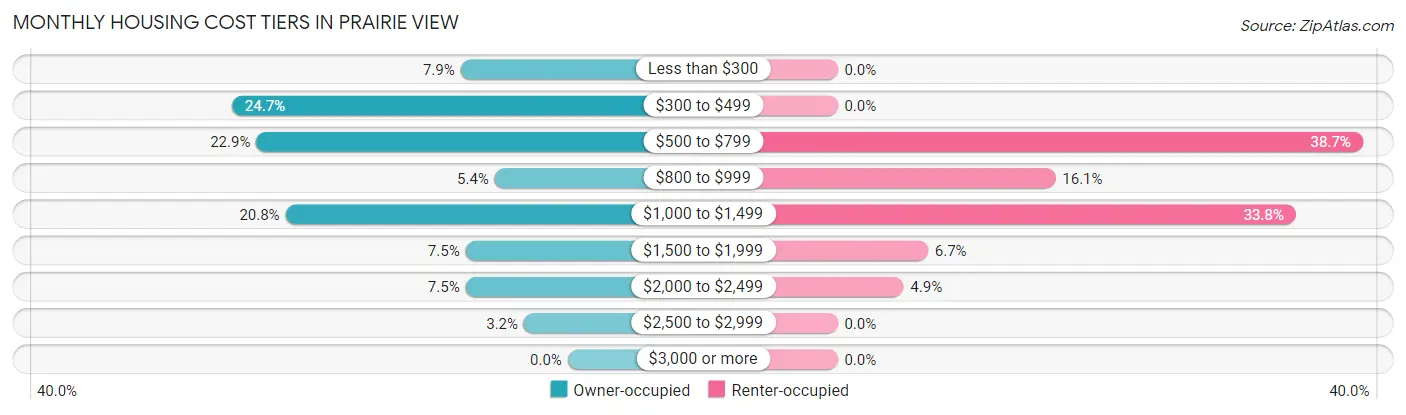
| Monthly Cost | Owner-occupied | Renter-occupied |
| Less than $300 | 22 (7.9%) | 0 (0.0%) |
| $300 to $499 | 69 (24.7%) | 0 (0.0%) |
| $500 to $799 | 64 (22.9%) | 494 (38.7%) |
| $800 to $999 | 15 (5.4%) | 205 (16.1%) |
| $1,000 to $1,499 | 58 (20.8%) | 431 (33.8%) |
| $1,500 to $1,999 | 21 (7.5%) | 85 (6.7%) |
| $2,000 to $2,499 | 21 (7.5%) | 62 (4.9%) |
| $2,500 to $2,999 | 9 (3.2%) | 0 (0.0%) |
| $3,000 or more | 0 (0.0%) | 0 (0.0%) |
| Total | 279 (100.0%) | 1,277 (100.0%) |
Physical Housing Characteristics in Prairie View
Housing Structures in Prairie View
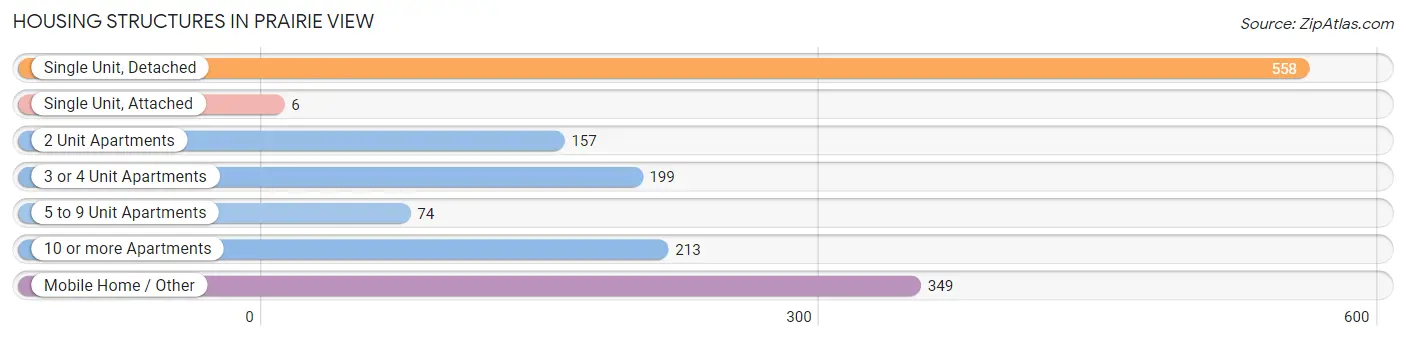
| Structure Type | # Housing Units | % Housing Units |
| Single Unit, Detached | 558 | 35.9% |
| Single Unit, Attached | 6 | 0.4% |
| 2 Unit Apartments | 157 | 10.1% |
| 3 or 4 Unit Apartments | 199 | 12.8% |
| 5 to 9 Unit Apartments | 74 | 4.8% |
| 10 or more Apartments | 213 | 13.7% |
| Mobile Home / Other | 349 | 22.4% |
| Total | 1,556 | 100.0% |
Housing Structures by Occupancy in Prairie View
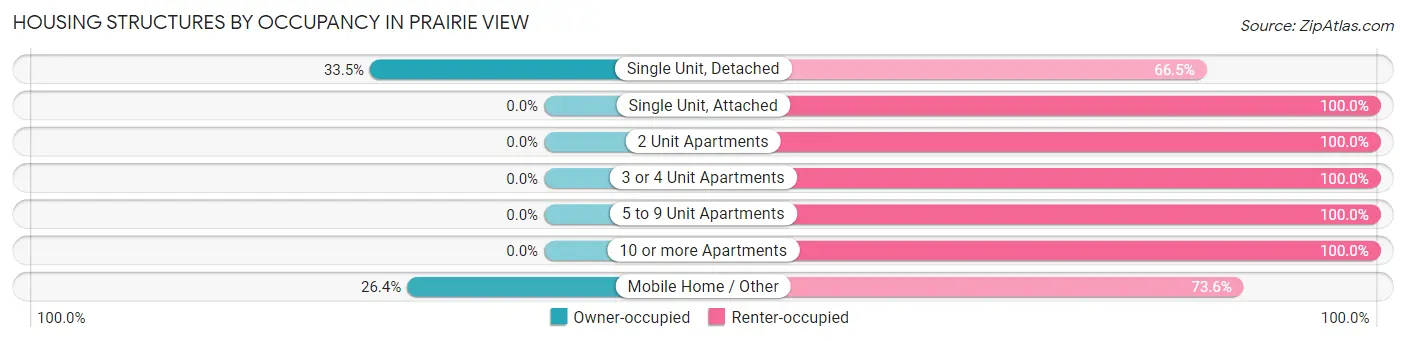
| Structure Type | Owner-occupied | Renter-occupied |
| Single Unit, Detached | 187 (33.5%) | 371 (66.5%) |
| Single Unit, Attached | 0 (0.0%) | 6 (100.0%) |
| 2 Unit Apartments | 0 (0.0%) | 157 (100.0%) |
| 3 or 4 Unit Apartments | 0 (0.0%) | 199 (100.0%) |
| 5 to 9 Unit Apartments | 0 (0.0%) | 74 (100.0%) |
| 10 or more Apartments | 0 (0.0%) | 213 (100.0%) |
| Mobile Home / Other | 92 (26.4%) | 257 (73.6%) |
| Total | 279 (17.9%) | 1,277 (82.1%) |
Housing Structures by Number of Rooms in Prairie View
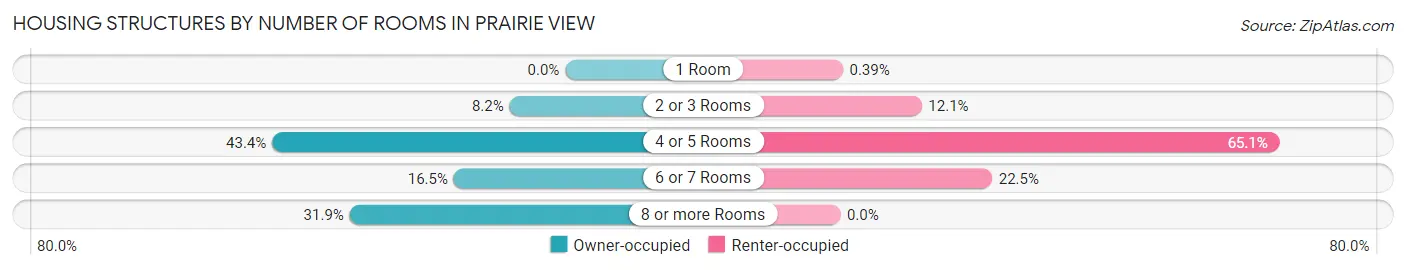
| Number of Rooms | Owner-occupied | Renter-occupied |
| 1 Room | 0 (0.0%) | 5 (0.4%) |
| 2 or 3 Rooms | 23 (8.2%) | 154 (12.1%) |
| 4 or 5 Rooms | 121 (43.4%) | 831 (65.1%) |
| 6 or 7 Rooms | 46 (16.5%) | 287 (22.5%) |
| 8 or more Rooms | 89 (31.9%) | 0 (0.0%) |
| Total | 279 (100.0%) | 1,277 (100.0%) |
Housing Structure by Heating Type in Prairie View
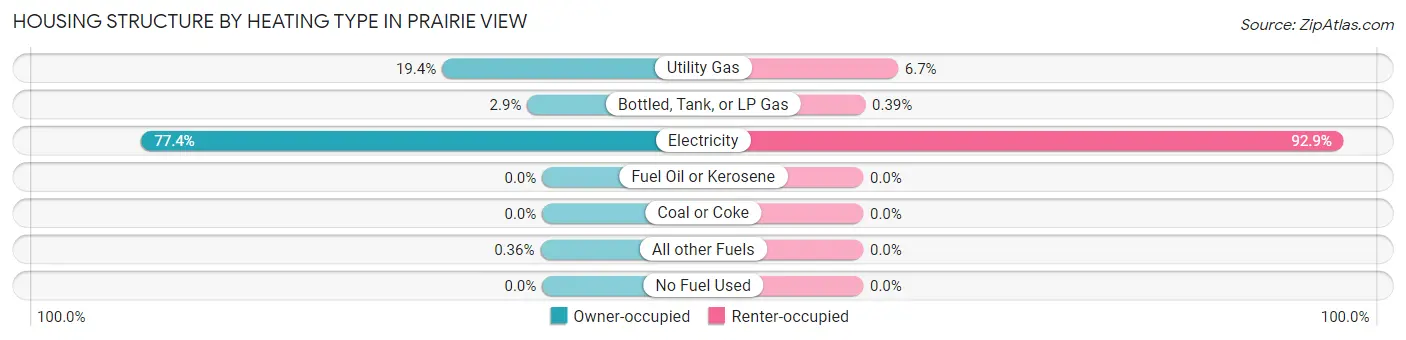
| Heating Type | Owner-occupied | Renter-occupied |
| Utility Gas | 54 (19.4%) | 86 (6.7%) |
| Bottled, Tank, or LP Gas | 8 (2.9%) | 5 (0.4%) |
| Electricity | 216 (77.4%) | 1,186 (92.9%) |
| Fuel Oil or Kerosene | 0 (0.0%) | 0 (0.0%) |
| Coal or Coke | 0 (0.0%) | 0 (0.0%) |
| All other Fuels | 1 (0.4%) | 0 (0.0%) |
| No Fuel Used | 0 (0.0%) | 0 (0.0%) |
| Total | 279 (100.0%) | 1,277 (100.0%) |
Household Vehicle Usage in Prairie View
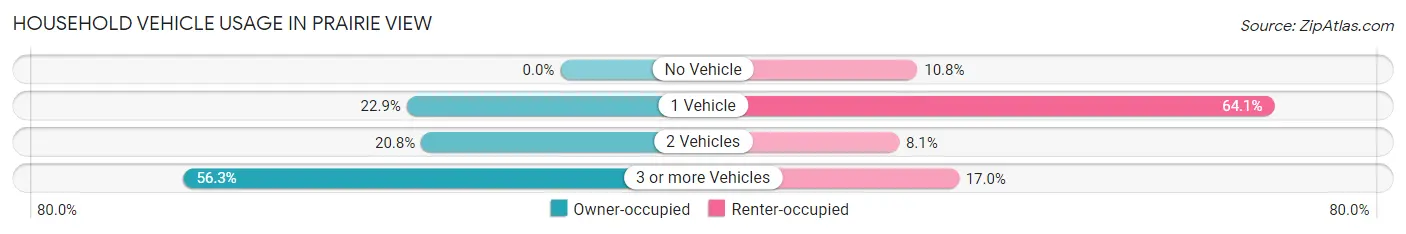
| Vehicles per Household | Owner-occupied | Renter-occupied |
| No Vehicle | 0 (0.0%) | 138 (10.8%) |
| 1 Vehicle | 64 (22.9%) | 819 (64.1%) |
| 2 Vehicles | 58 (20.8%) | 103 (8.1%) |
| 3 or more Vehicles | 157 (56.3%) | 217 (17.0%) |
| Total | 279 (100.0%) | 1,277 (100.0%) |
Real Estate & Mortgages in Prairie View
Real Estate and Mortgage Overview in Prairie View
| Characteristic | Without Mortgage | With Mortgage |
| Housing Units | 197 | 82 |
| Median Property Value | $156,800 | $238,500 |
| Median Household Income | $61,793 | $0 |
| Monthly Housing Costs | $518 | $0 |
| Real Estate Taxes | - | - |
Property Value by Mortgage Status in Prairie View
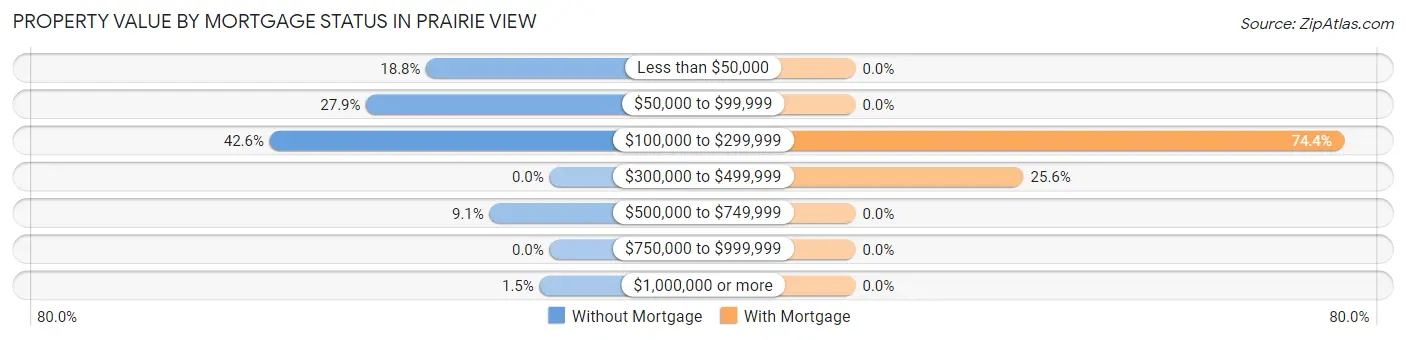
| Property Value | Without Mortgage | With Mortgage |
| Less than $50,000 | 37 (18.8%) | 0 (0.0%) |
| $50,000 to $99,999 | 55 (27.9%) | 0 (0.0%) |
| $100,000 to $299,999 | 84 (42.6%) | 61 (74.4%) |
| $300,000 to $499,999 | 0 (0.0%) | 21 (25.6%) |
| $500,000 to $749,999 | 18 (9.1%) | 0 (0.0%) |
| $750,000 to $999,999 | 0 (0.0%) | 0 (0.0%) |
| $1,000,000 or more | 3 (1.5%) | 0 (0.0%) |
| Total | 197 (100.0%) | 82 (100.0%) |
Household Income by Mortgage Status in Prairie View
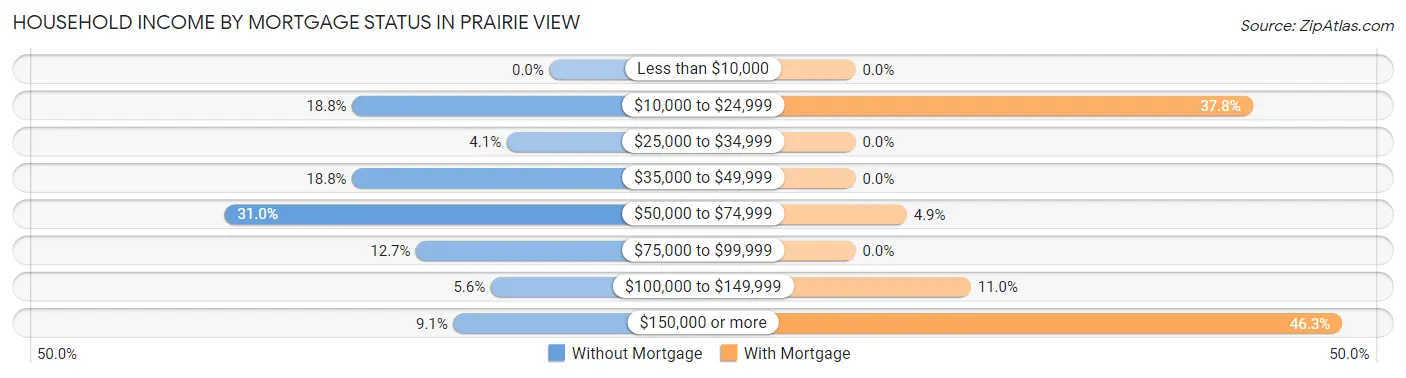
| Household Income | Without Mortgage | With Mortgage |
| Less than $10,000 | 0 (0.0%) | 0 (0.0%) |
| $10,000 to $24,999 | 37 (18.8%) | 31 (37.8%) |
| $25,000 to $34,999 | 8 (4.1%) | 0 (0.0%) |
| $35,000 to $49,999 | 37 (18.8%) | 0 (0.0%) |
| $50,000 to $74,999 | 61 (31.0%) | 4 (4.9%) |
| $75,000 to $99,999 | 25 (12.7%) | 0 (0.0%) |
| $100,000 to $149,999 | 11 (5.6%) | 9 (11.0%) |
| $150,000 or more | 18 (9.1%) | 38 (46.3%) |
| Total | 197 (100.0%) | 82 (100.0%) |
Property Value to Household Income Ratio in Prairie View
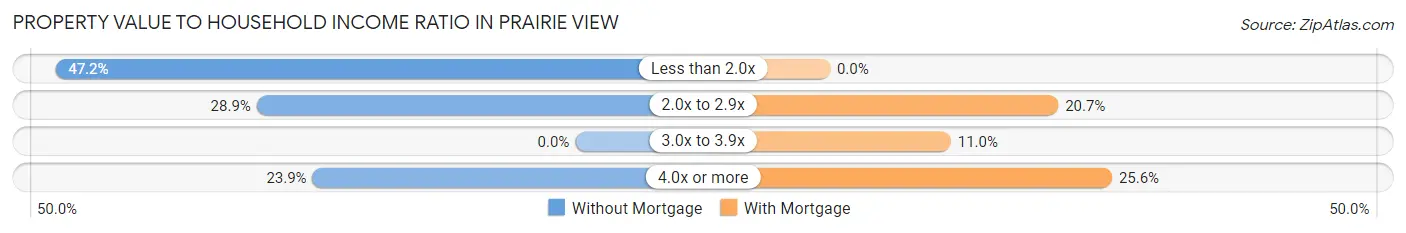
| Value-to-Income Ratio | Without Mortgage | With Mortgage |
| Less than 2.0x | 93 (47.2%) | 0 (0.0%) |
| 2.0x to 2.9x | 57 (28.9%) | 17 (20.7%) |
| 3.0x to 3.9x | 0 (0.0%) | 9 (11.0%) |
| 4.0x or more | 47 (23.9%) | 21 (25.6%) |
| Total | 197 (100.0%) | 82 (100.0%) |
Real Estate Taxes by Mortgage Status in Prairie View
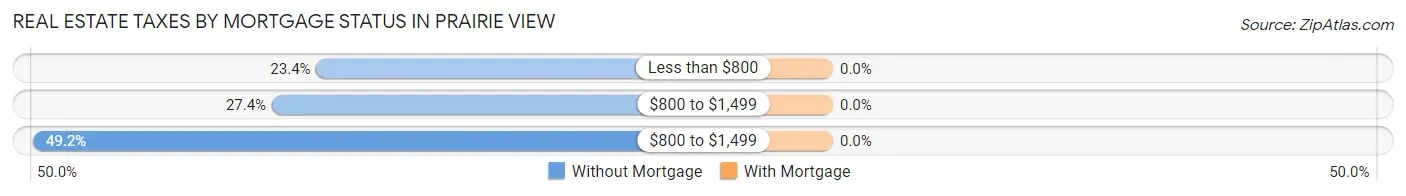
| Property Taxes | Without Mortgage | With Mortgage |
| Less than $800 | 46 (23.4%) | 0 (0.0%) |
| $800 to $1,499 | 54 (27.4%) | 0 (0.0%) |
| $800 to $1,499 | 97 (49.2%) | 0 (0.0%) |
| Total | 197 (100.0%) | 82 (100.0%) |
Health & Disability in Prairie View
Health Insurance Coverage by Age in Prairie View
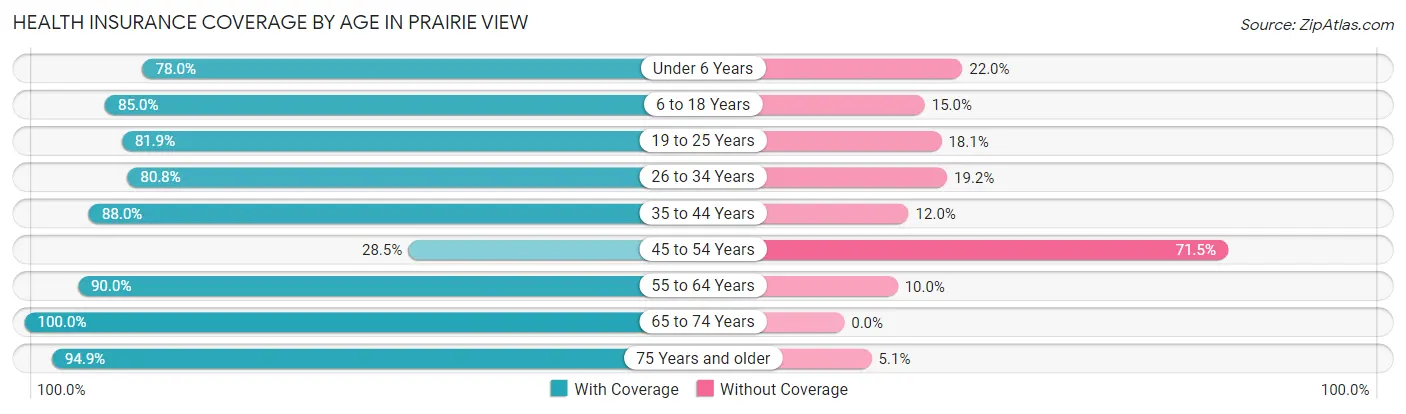
| Age Bracket | With Coverage | Without Coverage |
| Under 6 Years | 85 (78.0%) | 24 (22.0%) |
| 6 to 18 Years | 1,092 (85.0%) | 193 (15.0%) |
| 19 to 25 Years | 4,428 (81.9%) | 980 (18.1%) |
| 26 to 34 Years | 156 (80.8%) | 37 (19.2%) |
| 35 to 44 Years | 286 (88.0%) | 39 (12.0%) |
| 45 to 54 Years | 53 (28.5%) | 133 (71.5%) |
| 55 to 64 Years | 235 (90.0%) | 26 (10.0%) |
| 65 to 74 Years | 134 (100.0%) | 0 (0.0%) |
| 75 Years and older | 93 (94.9%) | 5 (5.1%) |
| Total | 6,562 (82.0%) | 1,437 (18.0%) |
Health Insurance Coverage by Citizenship Status in Prairie View
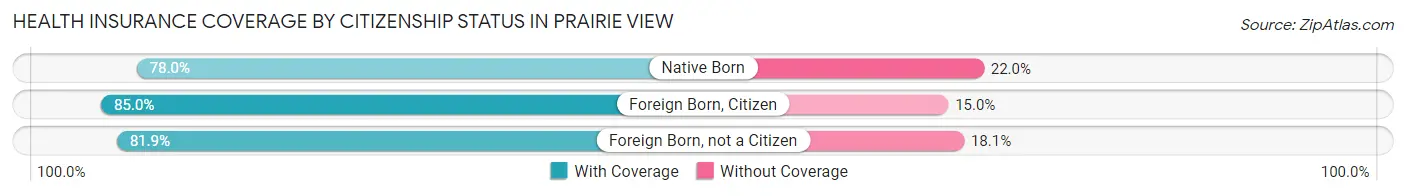
| Citizenship Status | With Coverage | Without Coverage |
| Native Born | 85 (78.0%) | 24 (22.0%) |
| Foreign Born, Citizen | 1,092 (85.0%) | 193 (15.0%) |
| Foreign Born, not a Citizen | 4,428 (81.9%) | 980 (18.1%) |
Health Insurance Coverage by Household Income in Prairie View
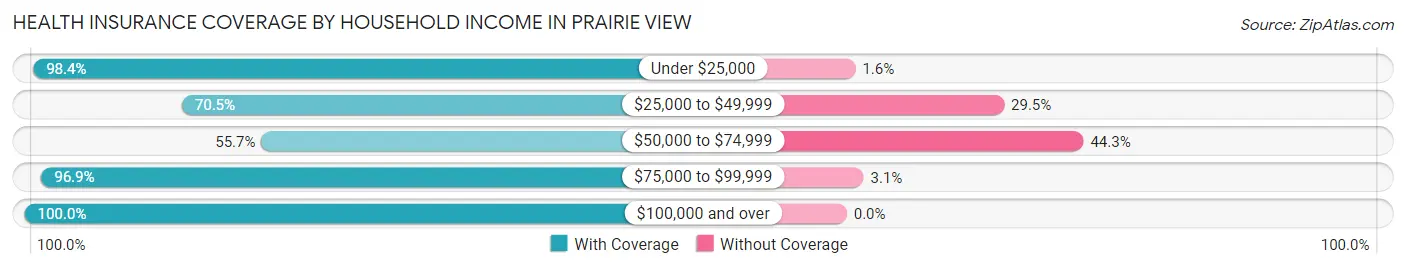
| Household Income | With Coverage | Without Coverage |
| Under $25,000 | 1,698 (98.4%) | 28 (1.6%) |
| $25,000 to $49,999 | 699 (70.5%) | 292 (29.5%) |
| $50,000 to $74,999 | 172 (55.7%) | 137 (44.3%) |
| $75,000 to $99,999 | 525 (96.9%) | 17 (3.1%) |
| $100,000 and over | 279 (100.0%) | 0 (0.0%) |
Public vs Private Health Insurance Coverage by Age in Prairie View
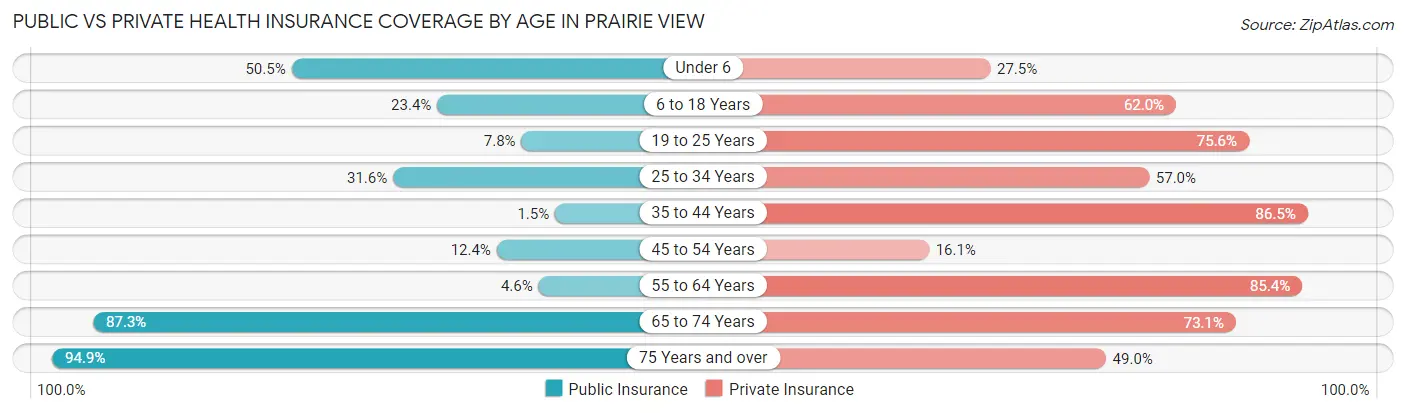
| Age Bracket | Public Insurance | Private Insurance |
| Under 6 | 55 (50.5%) | 30 (27.5%) |
| 6 to 18 Years | 301 (23.4%) | 797 (62.0%) |
| 19 to 25 Years | 421 (7.8%) | 4,086 (75.5%) |
| 25 to 34 Years | 61 (31.6%) | 110 (57.0%) |
| 35 to 44 Years | 5 (1.5%) | 281 (86.5%) |
| 45 to 54 Years | 23 (12.4%) | 30 (16.1%) |
| 55 to 64 Years | 12 (4.6%) | 223 (85.4%) |
| 65 to 74 Years | 117 (87.3%) | 98 (73.1%) |
| 75 Years and over | 93 (94.9%) | 48 (49.0%) |
| Total | 1,088 (13.6%) | 5,703 (71.3%) |
Disability Status by Sex by Age in Prairie View
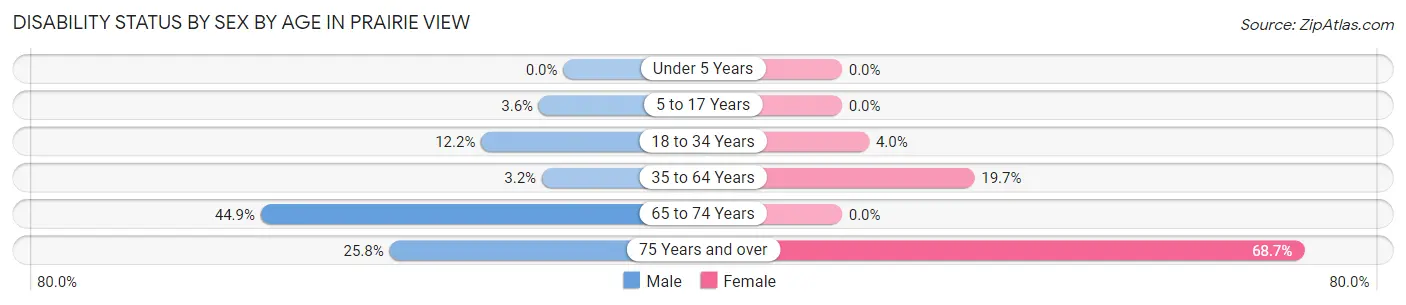
| Age Bracket | Male | Female |
| Under 5 Years | 0 (0.0%) | 0 (0.0%) |
| 5 to 17 Years | 13 (3.6%) | 0 (0.0%) |
| 18 to 34 Years | 325 (12.2%) | 151 (4.0%) |
| 35 to 64 Years | 15 (3.2%) | 59 (19.7%) |
| 65 to 74 Years | 31 (44.9%) | 0 (0.0%) |
| 75 Years and over | 8 (25.8%) | 46 (68.7%) |
Disability Class by Sex by Age in Prairie View
Disability Class: Hearing Difficulty
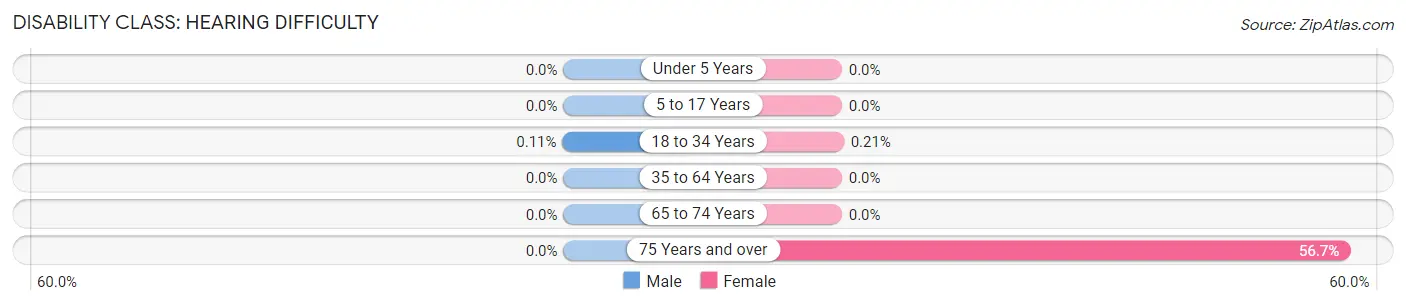
| Age Bracket | Male | Female |
| Under 5 Years | 0 (0.0%) | 0 (0.0%) |
| 5 to 17 Years | 0 (0.0%) | 0 (0.0%) |
| 18 to 34 Years | 3 (0.1%) | 8 (0.2%) |
| 35 to 64 Years | 0 (0.0%) | 0 (0.0%) |
| 65 to 74 Years | 0 (0.0%) | 0 (0.0%) |
| 75 Years and over | 0 (0.0%) | 38 (56.7%) |
Disability Class: Vision Difficulty
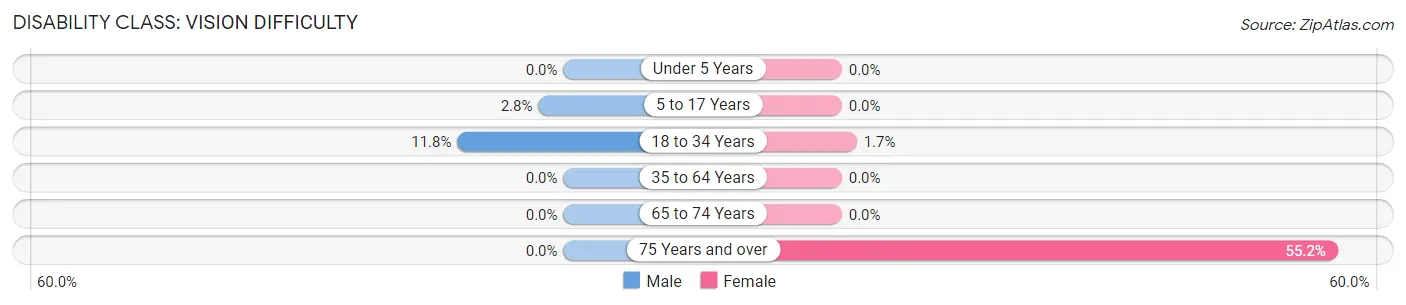
| Age Bracket | Male | Female |
| Under 5 Years | 0 (0.0%) | 0 (0.0%) |
| 5 to 17 Years | 10 (2.8%) | 0 (0.0%) |
| 18 to 34 Years | 315 (11.8%) | 62 (1.7%) |
| 35 to 64 Years | 0 (0.0%) | 0 (0.0%) |
| 65 to 74 Years | 0 (0.0%) | 0 (0.0%) |
| 75 Years and over | 0 (0.0%) | 37 (55.2%) |
Disability Class: Cognitive Difficulty
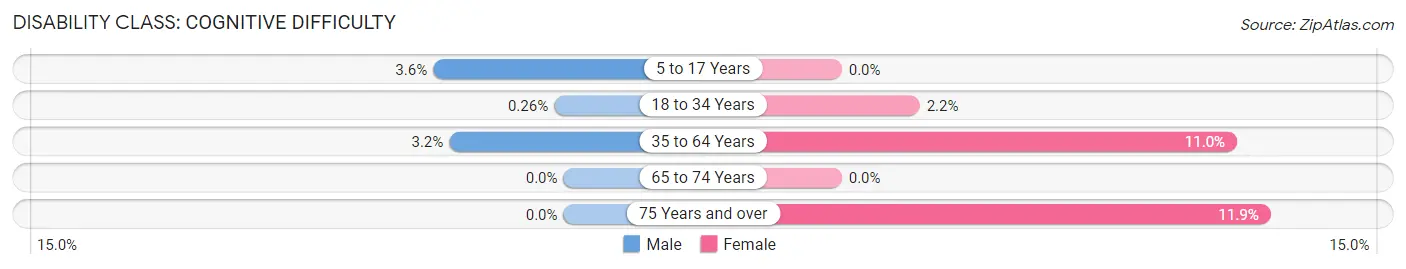
| Age Bracket | Male | Female |
| 5 to 17 Years | 13 (3.6%) | 0 (0.0%) |
| 18 to 34 Years | 7 (0.3%) | 81 (2.2%) |
| 35 to 64 Years | 15 (3.2%) | 33 (11.0%) |
| 65 to 74 Years | 0 (0.0%) | 0 (0.0%) |
| 75 Years and over | 0 (0.0%) | 8 (11.9%) |
Disability Class: Ambulatory Difficulty
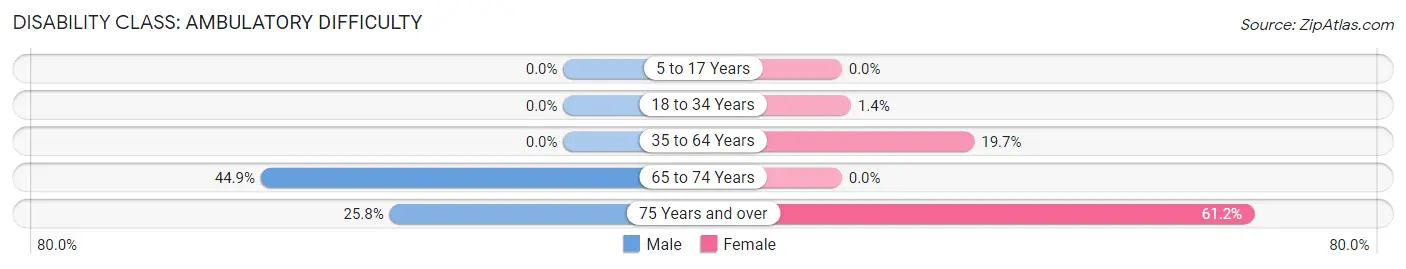
| Age Bracket | Male | Female |
| 5 to 17 Years | 0 (0.0%) | 0 (0.0%) |
| 18 to 34 Years | 0 (0.0%) | 51 (1.4%) |
| 35 to 64 Years | 0 (0.0%) | 59 (19.7%) |
| 65 to 74 Years | 31 (44.9%) | 0 (0.0%) |
| 75 Years and over | 8 (25.8%) | 41 (61.2%) |
Disability Class: Self-Care Difficulty
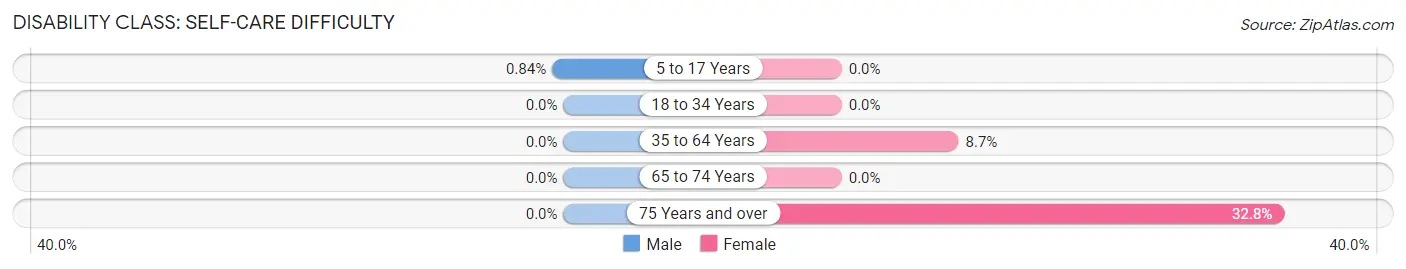
| Age Bracket | Male | Female |
| 5 to 17 Years | 3 (0.8%) | 0 (0.0%) |
| 18 to 34 Years | 0 (0.0%) | 0 (0.0%) |
| 35 to 64 Years | 0 (0.0%) | 26 (8.7%) |
| 65 to 74 Years | 0 (0.0%) | 0 (0.0%) |
| 75 Years and over | 0 (0.0%) | 22 (32.8%) |
Technology Access in Prairie View
Computing Device Access in Prairie View
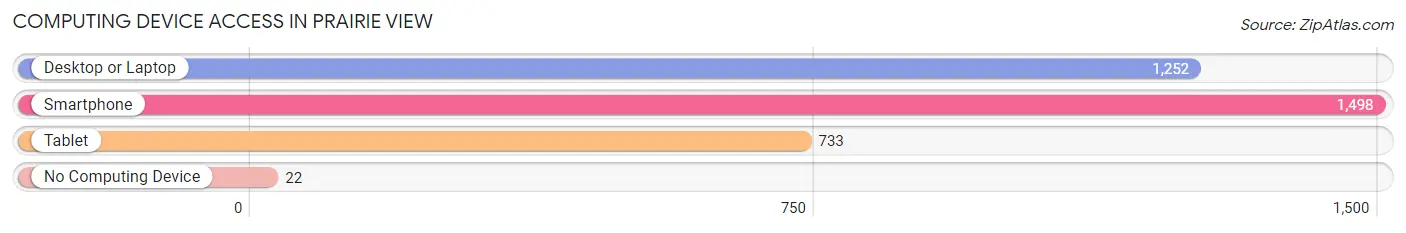
| Device Type | # Households | % Households |
| Desktop or Laptop | 1,252 | 80.5% |
| Smartphone | 1,498 | 96.3% |
| Tablet | 733 | 47.1% |
| No Computing Device | 22 | 1.4% |
| Total | 1,556 | 100.0% |
Internet Access in Prairie View
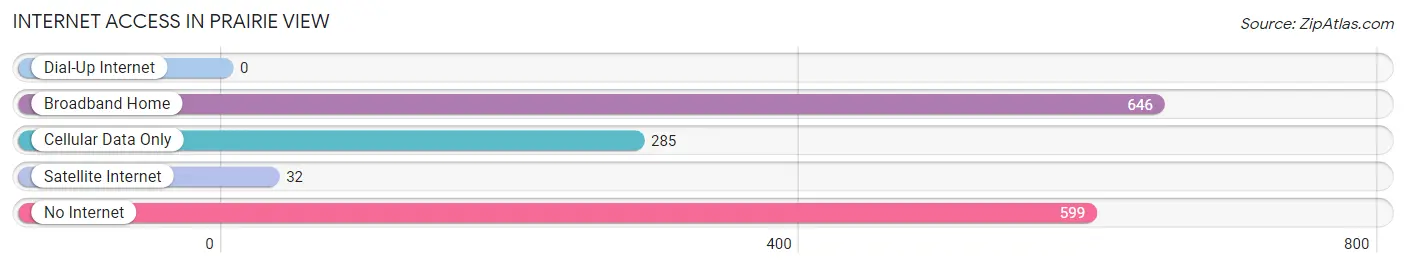
| Internet Type | # Households | % Households |
| Dial-Up Internet | 0 | 0.0% |
| Broadband Home | 646 | 41.5% |
| Cellular Data Only | 285 | 18.3% |
| Satellite Internet | 32 | 2.1% |
| No Internet | 599 | 38.5% |
| Total | 1,556 | 100.0% |
Prairie View Summary
Prairie View, Texas is a small city located in Waller County, Texas, United States. It is situated about 50 miles northwest of Houston and is part of the Houston–The Woodlands–Sugar Land metropolitan area. The city is home to Prairie View A&M University, a historically black college and university (HBCU).
History
Prairie View was founded in 1873 by the Houston and Texas Central Railway. The city was named after the prairie grass that grew in the area. The city was originally a stop on the railroad, but it soon became a center for education and commerce.
In 1876, the Texas Legislature established Prairie View Normal School, which later became Prairie View A&M University. The school was established to provide educational opportunities for African Americans in the state. The school has since grown to become one of the largest HBCUs in the United States.
Geography
Prairie View is located in Waller County, Texas, about 50 miles northwest of Houston. The city has a total area of 4.2 square miles, all of which is land. The city is situated on the northern edge of the Houston–The Woodlands–Sugar Land metropolitan area.
The city is located in the Gulf Coastal Plains region of Texas. The terrain is mostly flat, with some rolling hills. The climate is humid subtropical, with hot summers and mild winters.
Economy
Prairie View’s economy is largely driven by the presence of Prairie View A&M University. The university is the largest employer in the city, providing jobs for faculty, staff, and students. The university also provides a large number of services to the community, including healthcare, education, and research.
In addition to the university, the city is home to a number of small businesses, including restaurants, retail stores, and professional services. The city also has a small manufacturing sector, which produces a variety of products, including furniture, clothing, and electronics.
Demographics
As of the 2010 census, the population of Prairie View was 5,576. The racial makeup of the city was 57.3% African American, 37.2% White, 0.7% Native American, 0.4% Asian, 0.1% Pacific Islander, and 4.3% from other races. The median household income was $30,938, and the median family income was $37,813.
Prairie View is a diverse city, with a variety of cultures and backgrounds represented. The city is home to a large number of students from Prairie View A&M University, as well as a number of families and individuals who have lived in the city for generations.
Conclusion
Prairie View, Texas is a small city located in Waller County, Texas, United States. It is situated about 50 miles northwest of Houston and is part of the Houston–The Woodlands–Sugar Land metropolitan area. The city is home to Prairie View A&M University, a historically black college and university (HBCU). The city has a total area of 4.2 square miles, all of which is land. The city’s economy is largely driven by the presence of Prairie View A&M University. As of the 2010 census, the population of Prairie View was 5,576. The racial makeup of the city was 57.3% African American, 37.2% White, 0.7% Native American, 0.4% Asian, 0.1% Pacific Islander, and 4.3% from other races. Prairie View is a diverse city, with a variety of cultures and backgrounds represented.
Common Questions
What is Per Capita Income in Prairie View?
Per Capita income in Prairie View is $9,925.
What is the Median Family Income in Prairie View?
Median Family Income in Prairie View is $44,533.
What is the Median Household income in Prairie View?
Median Household Income in Prairie View is $19,238.
What is Inequality or Gini Index in Prairie View?
Inequality or Gini Index in Prairie View is 0.60.
What is the Total Population of Prairie View?
Total Population of Prairie View is 8,039.
What is the Total Male Population of Prairie View?
Total Male Population of Prairie View is 3,646.
What is the Total Female Population of Prairie View?
Total Female Population of Prairie View is 4,393.
What is the Ratio of Males per 100 Females in Prairie View?
There are 83.00 Males per 100 Females in Prairie View.
What is the Ratio of Females per 100 Males in Prairie View?
There are 120.49 Females per 100 Males in Prairie View.
What is the Median Population Age in Prairie View?
Median Population Age in Prairie View is 20.6 Years.
What is the Average Family Size in Prairie View
Average Family Size in Prairie View is 3.3 People.
What is the Average Household Size in Prairie View
Average Household Size in Prairie View is 2.5 People.
How Large is the Labor Force in Prairie View?
There are 3,537 People in the Labor Forcein in Prairie View.
What is the Percentage of People in the Labor Force in Prairie View?
47.0% of People are in the Labor Force in Prairie View.
What is the Unemployment Rate in Prairie View?
Unemployment Rate in Prairie View is 20.0%.