Spruce Pine, NC Map & Demographics
Spruce Pine Map
Spruce Pine Overview
$27,056
PER CAPITA INCOME
$71,806
AVG FAMILY INCOME
$44,596
AVG HOUSEHOLD INCOME
15.3%
WAGE / INCOME GAP [ % ]
84.7¢/ $1
WAGE / INCOME GAP [ $ ]
0.56
INEQUALITY / GINI INDEX
2,637
TOTAL POPULATION
1,207
MALE POPULATION
1,430
FEMALE POPULATION
84.41
MALES / 100 FEMALES
118.48
FEMALES / 100 MALES
42.9
MEDIAN AGE
3.1
AVG FAMILY SIZE
2.2
AVG HOUSEHOLD SIZE
1,119
LABOR FORCE [ PEOPLE ]
51.3%
PERCENT IN LABOR FORCE
1.8%
UNEMPLOYMENT RATE
Spruce Pine Zip Codes
Spruce Pine Area Codes
Income in Spruce Pine
Income Overview in Spruce Pine
Per Capita Income in Spruce Pine is $27,056, while median incomes of families and households are $71,806 and $44,596 respectively.
| Characteristic | Number | Measure |
| Per Capita Income | 2,637 | $27,056 |
| Median Family Income | 637 | $71,806 |
| Mean Family Income | 637 | $100,250 |
| Median Household Income | 1,141 | $44,596 |
| Mean Household Income | 1,141 | $71,505 |
| Income Deficit | 637 | $0 |
| Wage / Income Gap (%) | 2,637 | 15.34% |
| Wage / Income Gap ($) | 2,637 | 84.66¢ per $1 |
| Gini / Inequality Index | 2,637 | 0.56 |
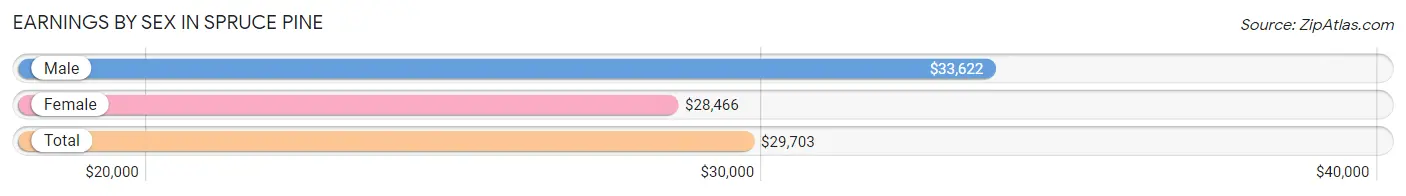
Earnings by Sex in Spruce Pine
Average Earnings in Spruce Pine are $29,703, $33,622 for men and $28,466 for women, a difference of 15.3%.
| Sex | Number | Average Earnings |
| Male | 607 (48.3%) | $33,622 |
| Female | 650 (51.7%) | $28,466 |
| Total | 1,257 (100.0%) | $29,703 |
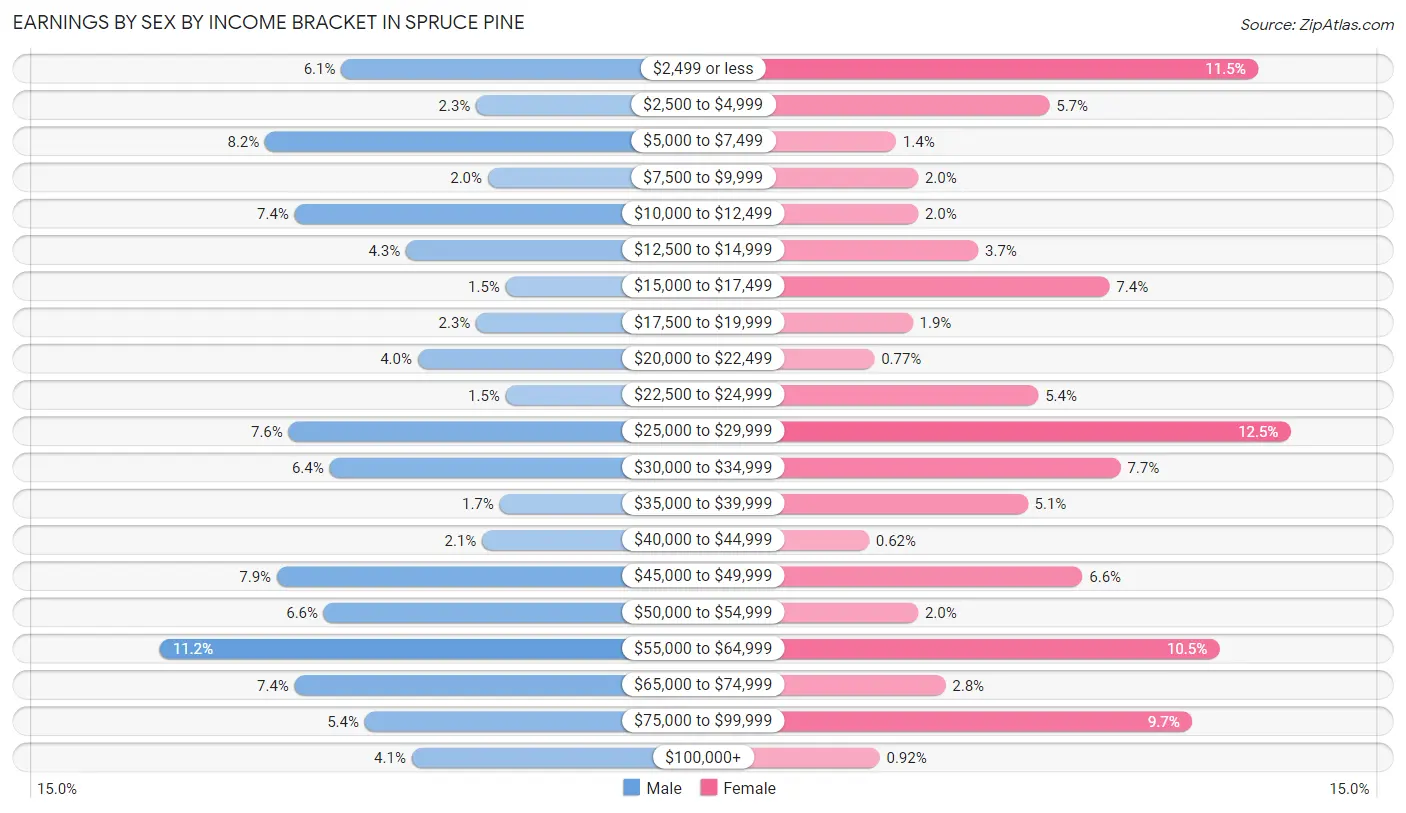
Earnings by Sex by Income Bracket in Spruce Pine
The most common earnings brackets in Spruce Pine are $55,000 to $64,999 for men (68 | 11.2%) and $25,000 to $29,999 for women (81 | 12.5%).
| Income | Male | Female |
| $2,499 or less | 37 (6.1%) | 75 (11.5%) |
| $2,500 to $4,999 | 14 (2.3%) | 37 (5.7%) |
| $5,000 to $7,499 | 50 (8.2%) | 9 (1.4%) |
| $7,500 to $9,999 | 12 (2.0%) | 13 (2.0%) |
| $10,000 to $12,499 | 45 (7.4%) | 13 (2.0%) |
| $12,500 to $14,999 | 26 (4.3%) | 24 (3.7%) |
| $15,000 to $17,499 | 9 (1.5%) | 48 (7.4%) |
| $17,500 to $19,999 | 14 (2.3%) | 12 (1.8%) |
| $20,000 to $22,499 | 24 (4.0%) | 5 (0.8%) |
| $22,500 to $24,999 | 9 (1.5%) | 35 (5.4%) |
| $25,000 to $29,999 | 46 (7.6%) | 81 (12.5%) |
| $30,000 to $34,999 | 39 (6.4%) | 50 (7.7%) |
| $35,000 to $39,999 | 10 (1.7%) | 33 (5.1%) |
| $40,000 to $44,999 | 13 (2.1%) | 4 (0.6%) |
| $45,000 to $49,999 | 48 (7.9%) | 43 (6.6%) |
| $50,000 to $54,999 | 40 (6.6%) | 13 (2.0%) |
| $55,000 to $64,999 | 68 (11.2%) | 68 (10.5%) |
| $65,000 to $74,999 | 45 (7.4%) | 18 (2.8%) |
| $75,000 to $99,999 | 33 (5.4%) | 63 (9.7%) |
| $100,000+ | 25 (4.1%) | 6 (0.9%) |
| Total | 607 (100.0%) | 650 (100.0%) |
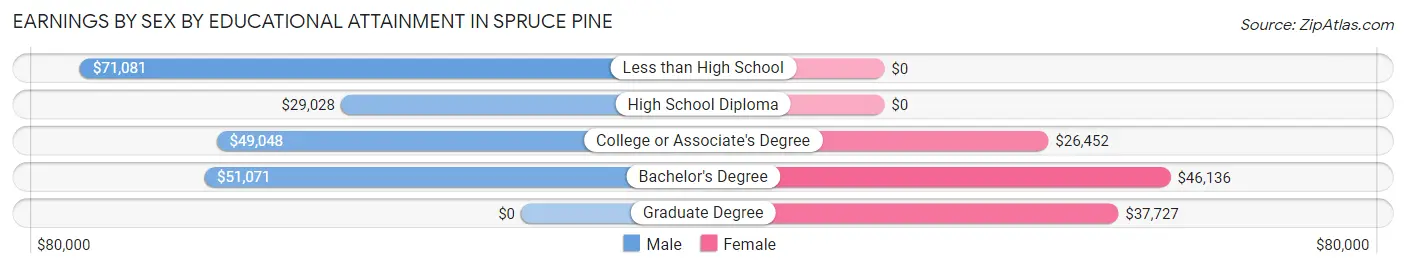
Earnings by Sex by Educational Attainment in Spruce Pine
Average earnings in Spruce Pine are $47,065 for men and $29,517 for women, a difference of 37.3%. Men with an educational attainment of less than high school enjoy the highest average annual earnings of $71,081, while those with high school diploma education earn the least with $29,028. Women with an educational attainment of bachelor's degree earn the most with the average annual earnings of $46,136, while those with college or associate's degree education have the smallest earnings of $26,452.
| Educational Attainment | Male Income | Female Income |
| Less than High School | $71,081 | $0 |
| High School Diploma | $29,028 | $0 |
| College or Associate's Degree | $49,048 | $26,452 |
| Bachelor's Degree | $51,071 | $46,136 |
| Graduate Degree | - | - |
| Total | $47,065 | $29,517 |
Family Income in Spruce Pine
Family Income Brackets in Spruce Pine
According to the Spruce Pine family income data, there are 147 families falling into the $75,000 to $99,999 income range, which is the most common income bracket and makes up 23.1% of all families. Conversely, the $10,000 to $14,999 income bracket is the least frequent group with only 6 families (0.9%) belonging to this category.
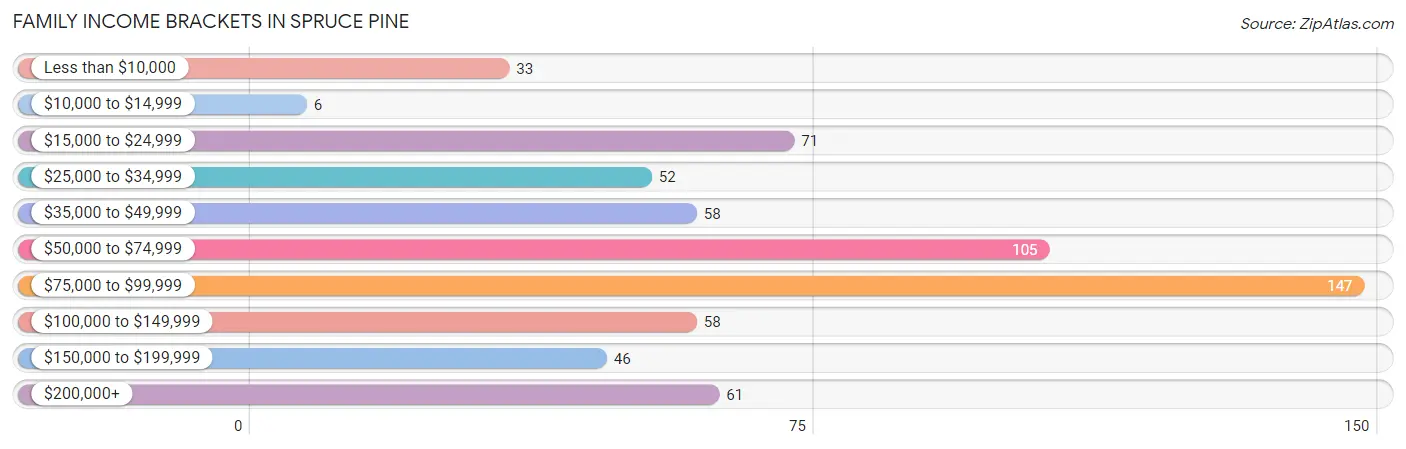
| Income Bracket | # Families | % Families |
| Less than $10,000 | 33 | 5.2% |
| $10,000 to $14,999 | 6 | 0.9% |
| $15,000 to $24,999 | 71 | 11.1% |
| $25,000 to $34,999 | 52 | 8.2% |
| $35,000 to $49,999 | 58 | 9.1% |
| $50,000 to $74,999 | 105 | 16.5% |
| $75,000 to $99,999 | 147 | 23.1% |
| $100,000 to $149,999 | 58 | 9.1% |
| $150,000 to $199,999 | 46 | 7.2% |
| $200,000+ | 61 | 9.6% |
Family Income by Famaliy Size in Spruce Pine
6-person families (23 | 3.6%) account for the highest median family income in Spruce Pine with $97,031 per family, while 2-person families (317 | 49.8%) have the highest median income of $33,396 per family member.
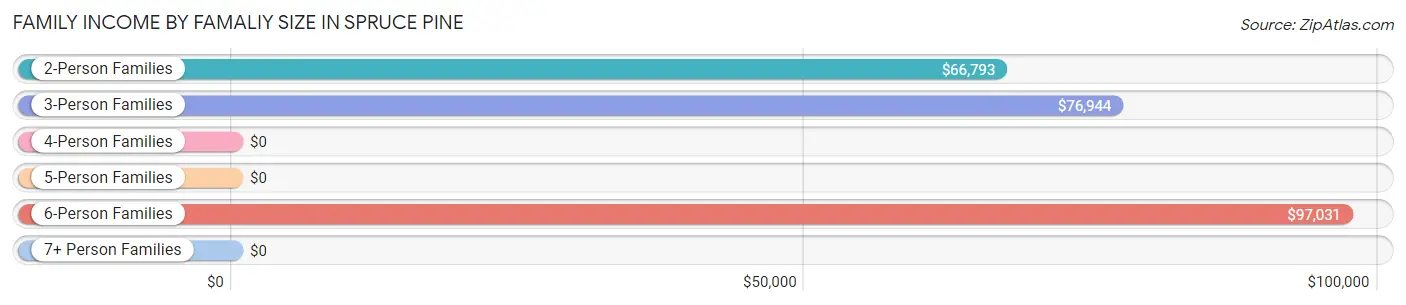
| Income Bracket | # Families | Median Income |
| 2-Person Families | 317 (49.8%) | $66,793 |
| 3-Person Families | 134 (21.0%) | $76,944 |
| 4-Person Families | 122 (19.2%) | $0 |
| 5-Person Families | 33 (5.2%) | $0 |
| 6-Person Families | 23 (3.6%) | $97,031 |
| 7+ Person Families | 8 (1.3%) | $0 |
| Total | 637 (100.0%) | $71,806 |
Family Income by Number of Earners in Spruce Pine
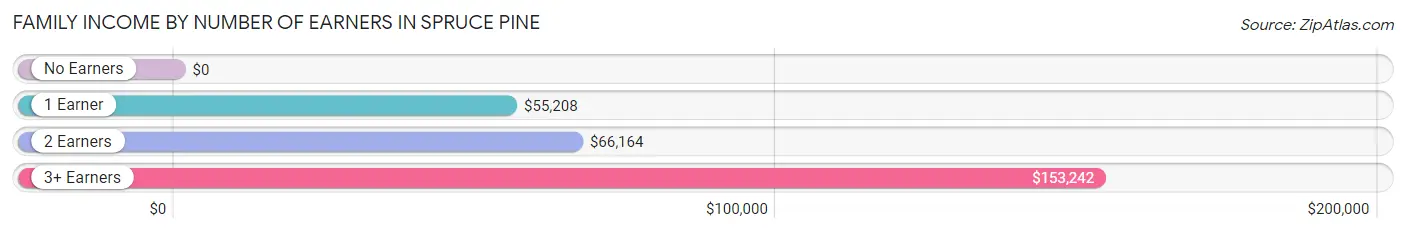
| Number of Earners | # Families | Median Income |
| No Earners | 160 (25.1%) | $0 |
| 1 Earner | 181 (28.4%) | $55,208 |
| 2 Earners | 223 (35.0%) | $66,164 |
| 3+ Earners | 73 (11.5%) | $153,242 |
| Total | 637 (100.0%) | $71,806 |
Household Income in Spruce Pine
Household Income Brackets in Spruce Pine
With 179 households falling in the category, the $75,000 to $99,999 income range is the most frequent in Spruce Pine, accounting for 15.7% of all households. In contrast, only 60 households (5.3%) fall into the $200,000+ income bracket, making it the least populous group.
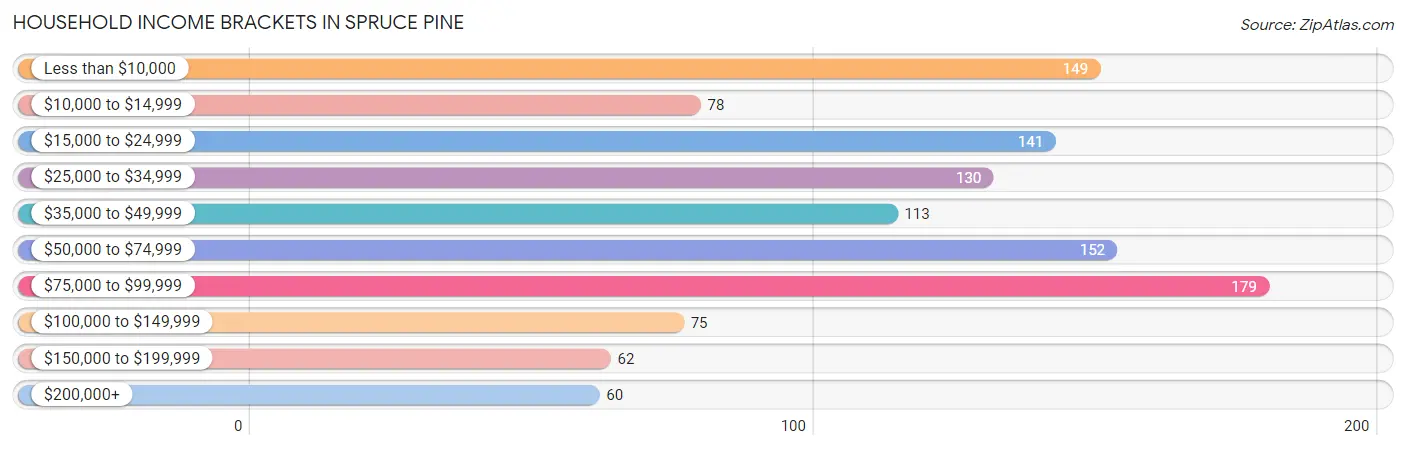
| Income Bracket | # Households | % Households |
| Less than $10,000 | 149 | 13.1% |
| $10,000 to $14,999 | 78 | 6.8% |
| $15,000 to $24,999 | 141 | 12.4% |
| $25,000 to $34,999 | 130 | 11.4% |
| $35,000 to $49,999 | 113 | 9.9% |
| $50,000 to $74,999 | 152 | 13.3% |
| $75,000 to $99,999 | 179 | 15.7% |
| $100,000 to $149,999 | 75 | 6.6% |
| $150,000 to $199,999 | 62 | 5.4% |
| $200,000+ | 60 | 5.3% |
Household Income by Householder Age in Spruce Pine
The median household income in Spruce Pine is $44,596, with the highest median household income of $56,667 found in the 25 to 44 years age bracket for the primary householder. A total of 290 households (25.4%) fall into this category. Meanwhile, the 15 to 24 years age bracket for the primary householder has the lowest median household income of $0, with 37 households (3.2%) in this group.
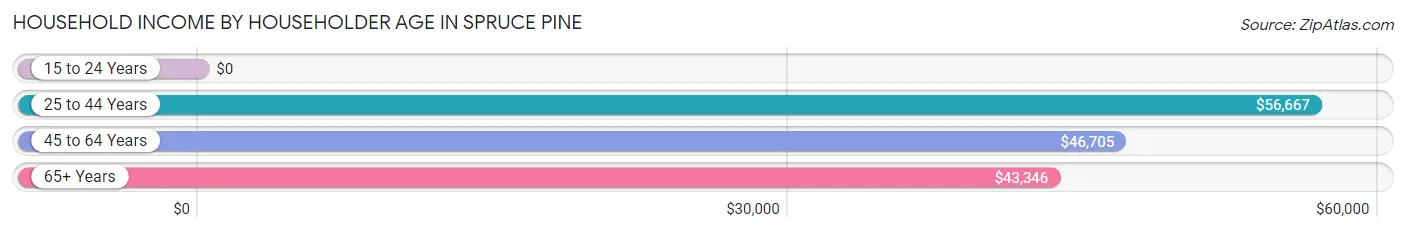
| Income Bracket | # Households | Median Income |
| 15 to 24 Years | 37 (3.2%) | $0 |
| 25 to 44 Years | 290 (25.4%) | $56,667 |
| 45 to 64 Years | 425 (37.2%) | $46,705 |
| 65+ Years | 389 (34.1%) | $43,346 |
| Total | 1,141 (100.0%) | $44,596 |
Poverty in Spruce Pine
Income Below Poverty by Sex and Age in Spruce Pine
With 22.7% poverty level for males and 20.5% for females among the residents of Spruce Pine, 5 year old males and 6 to 11 year old females are the most vulnerable to poverty, with 16 males (55.2%) and 47 females (50.5%) in their respective age groups living below the poverty level.
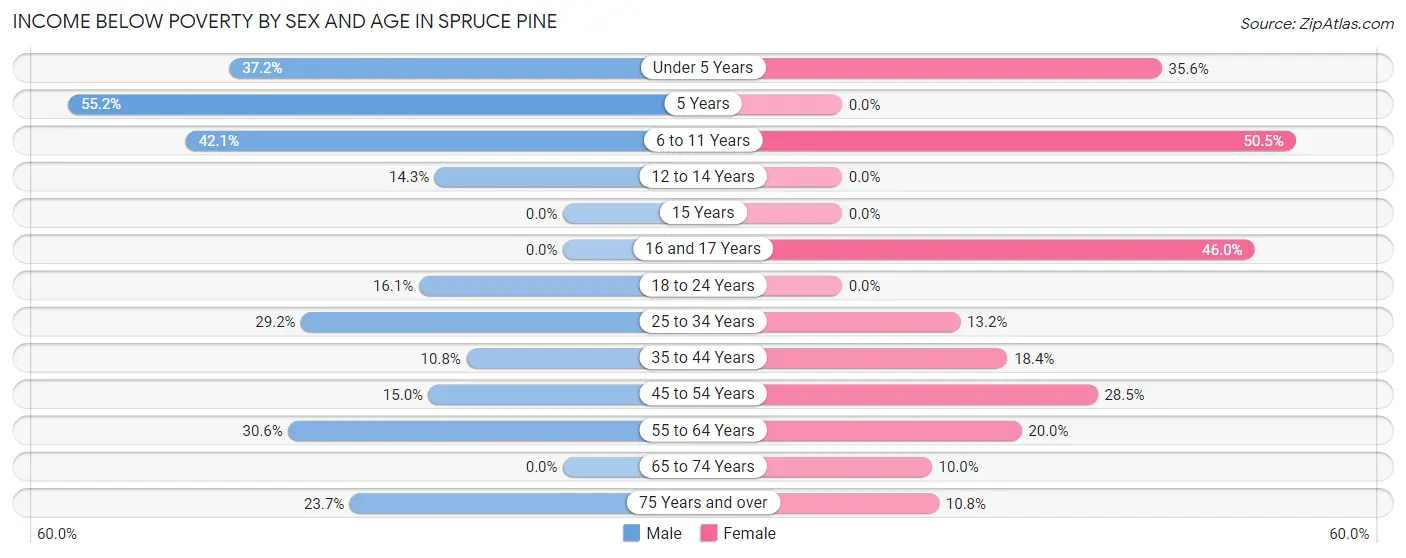
| Age Bracket | Male | Female |
| Under 5 Years | 32 (37.2%) | 26 (35.6%) |
| 5 Years | 16 (55.2%) | 0 (0.0%) |
| 6 to 11 Years | 37 (42.0%) | 47 (50.5%) |
| 12 to 14 Years | 2 (14.3%) | 0 (0.0%) |
| 15 Years | 0 (0.0%) | 0 (0.0%) |
| 16 and 17 Years | 0 (0.0%) | 17 (46.0%) |
| 18 to 24 Years | 23 (16.1%) | 0 (0.0%) |
| 25 to 34 Years | 56 (29.2%) | 29 (13.2%) |
| 35 to 44 Years | 7 (10.8%) | 28 (18.4%) |
| 45 to 54 Years | 22 (15.0%) | 78 (28.5%) |
| 55 to 64 Years | 41 (30.6%) | 31 (20.0%) |
| 65 to 74 Years | 0 (0.0%) | 12 (10.0%) |
| 75 Years and over | 33 (23.7%) | 12 (10.8%) |
| Total | 269 (22.7%) | 280 (20.5%) |
Income Above Poverty by Sex and Age in Spruce Pine
According to the poverty statistics in Spruce Pine, males aged 15 years and females aged 12 to 14 years are the age groups that are most secure financially, with 100.0% of males and 100.0% of females in these age groups living above the poverty line.
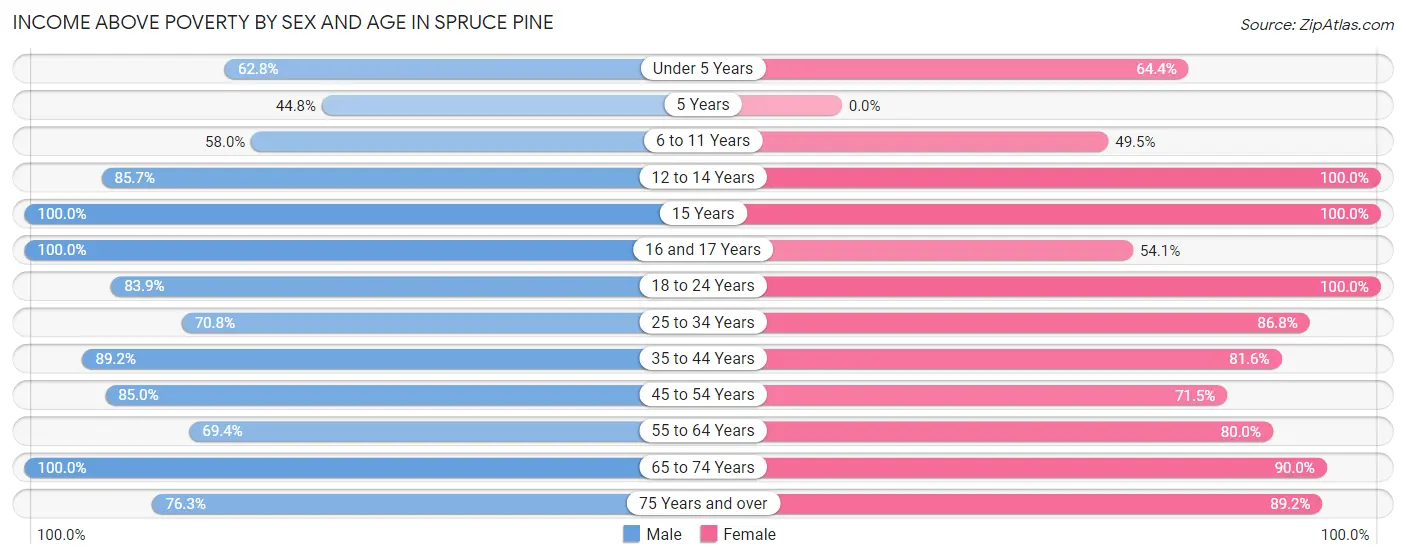
| Age Bracket | Male | Female |
| Under 5 Years | 54 (62.8%) | 47 (64.4%) |
| 5 Years | 13 (44.8%) | 0 (0.0%) |
| 6 to 11 Years | 51 (58.0%) | 46 (49.5%) |
| 12 to 14 Years | 12 (85.7%) | 31 (100.0%) |
| 15 Years | 3 (100.0%) | 34 (100.0%) |
| 16 and 17 Years | 25 (100.0%) | 20 (54.0%) |
| 18 to 24 Years | 120 (83.9%) | 65 (100.0%) |
| 25 to 34 Years | 136 (70.8%) | 191 (86.8%) |
| 35 to 44 Years | 58 (89.2%) | 124 (81.6%) |
| 45 to 54 Years | 125 (85.0%) | 196 (71.5%) |
| 55 to 64 Years | 93 (69.4%) | 124 (80.0%) |
| 65 to 74 Years | 120 (100.0%) | 108 (90.0%) |
| 75 Years and over | 106 (76.3%) | 99 (89.2%) |
| Total | 916 (77.3%) | 1,085 (79.5%) |
Income Below Poverty Among Married-Couple Families in Spruce Pine
The poverty statistics for married-couple families in Spruce Pine show that 12.1% or 59 of the total 488 families live below the poverty line. Families with 3 or 4 children have the highest poverty rate of 60.5%, comprising of 23 families. On the other hand, families with 5 or more children have the lowest poverty rate of 0.0%, which includes 0 families.
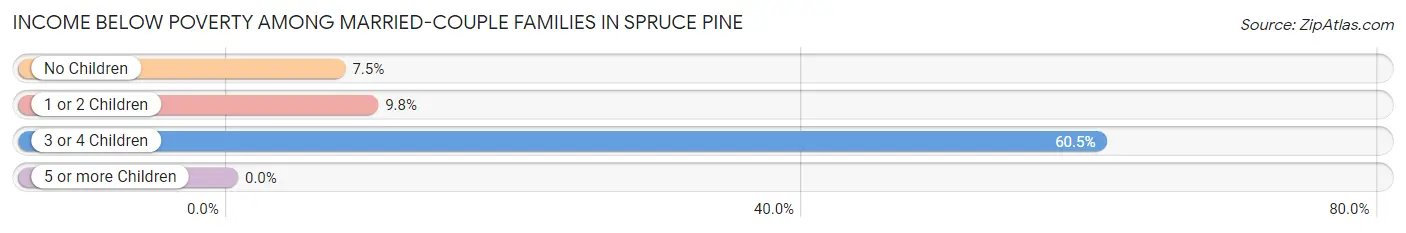
| Children | Above Poverty | Below Poverty |
| No Children | 297 (92.5%) | 24 (7.5%) |
| 1 or 2 Children | 111 (90.2%) | 12 (9.8%) |
| 3 or 4 Children | 15 (39.5%) | 23 (60.5%) |
| 5 or more Children | 6 (100.0%) | 0 (0.0%) |
| Total | 429 (87.9%) | 59 (12.1%) |
Income Below Poverty Among Single-Parent Households in Spruce Pine
According to the poverty data in Spruce Pine, 100.0% or 9 single-father households and 24.3% or 34 single-mother households are living below the poverty line. Among single-father households, those with 3 or 4 children have the highest poverty rate, with 9 households (100.0%) experiencing poverty. Likewise, among single-mother households, those with 3 or 4 children have the highest poverty rate, with 23 households (79.3%) falling below the poverty line.
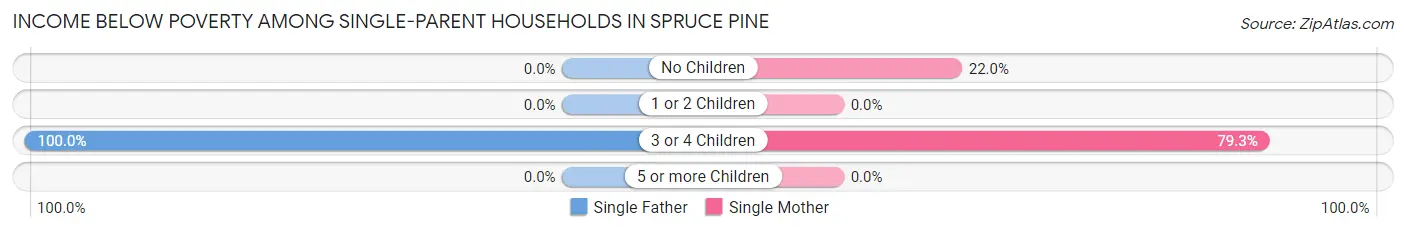
| Children | Single Father | Single Mother |
| No Children | 0 (0.0%) | 11 (22.0%) |
| 1 or 2 Children | 0 (0.0%) | 0 (0.0%) |
| 3 or 4 Children | 9 (100.0%) | 23 (79.3%) |
| 5 or more Children | 0 (0.0%) | 0 (0.0%) |
| Total | 9 (100.0%) | 34 (24.3%) |
Income Below Poverty Among Married-Couple vs Single-Parent Households in Spruce Pine
The poverty data for Spruce Pine shows that 59 of the married-couple family households (12.1%) and 43 of the single-parent households (28.9%) are living below the poverty level. Within the married-couple family households, those with 3 or 4 children have the highest poverty rate, with 23 households (60.5%) falling below the poverty line. Among the single-parent households, those with 3 or 4 children have the highest poverty rate, with 32 household (84.2%) living below poverty.
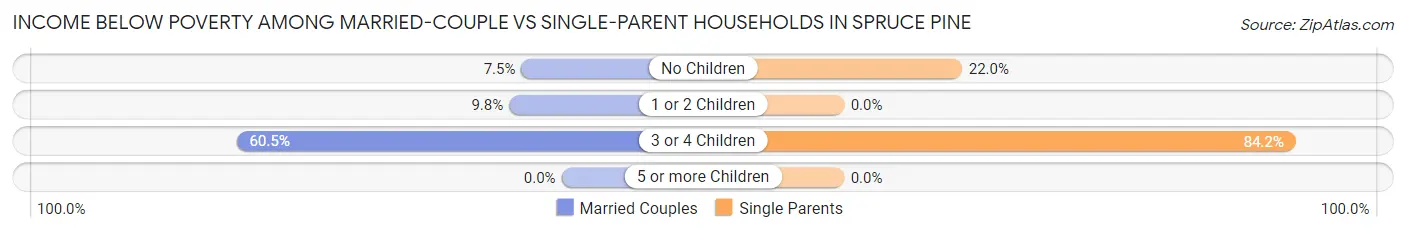
| Children | Married-Couple Families | Single-Parent Households |
| No Children | 24 (7.5%) | 11 (22.0%) |
| 1 or 2 Children | 12 (9.8%) | 0 (0.0%) |
| 3 or 4 Children | 23 (60.5%) | 32 (84.2%) |
| 5 or more Children | 0 (0.0%) | 0 (0.0%) |
| Total | 59 (12.1%) | 43 (28.9%) |
Race in Spruce Pine
The most populous races in Spruce Pine are White / Caucasian (2,304 | 87.4%), Hispanic or Latino (357 | 13.5%), and Some other Race (177 | 6.7%).
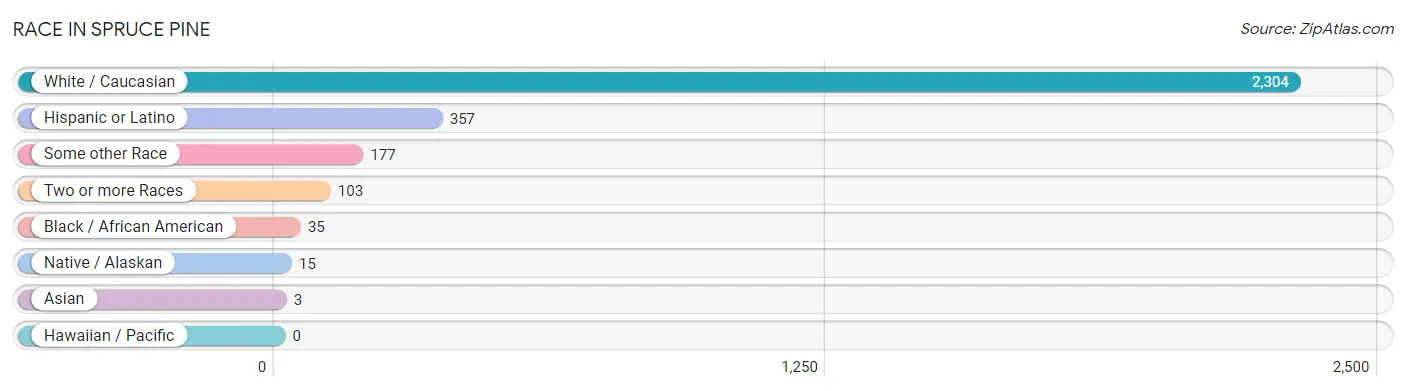
| Race | # Population | % Population |
| Asian | 3 | 0.1% |
| Black / African American | 35 | 1.3% |
| Hawaiian / Pacific | 0 | 0.0% |
| Hispanic or Latino | 357 | 13.5% |
| Native / Alaskan | 15 | 0.6% |
| White / Caucasian | 2,304 | 87.4% |
| Two or more Races | 103 | 3.9% |
| Some other Race | 177 | 6.7% |
| Total | 2,637 | 100.0% |
Ancestry in Spruce Pine
The most populous ancestries reported in Spruce Pine are English (469 | 17.8%), German (400 | 15.2%), Irish (375 | 14.2%), Mexican (326 | 12.4%), and Scotch-Irish (253 | 9.6%), together accounting for 69.1% of all Spruce Pine residents.
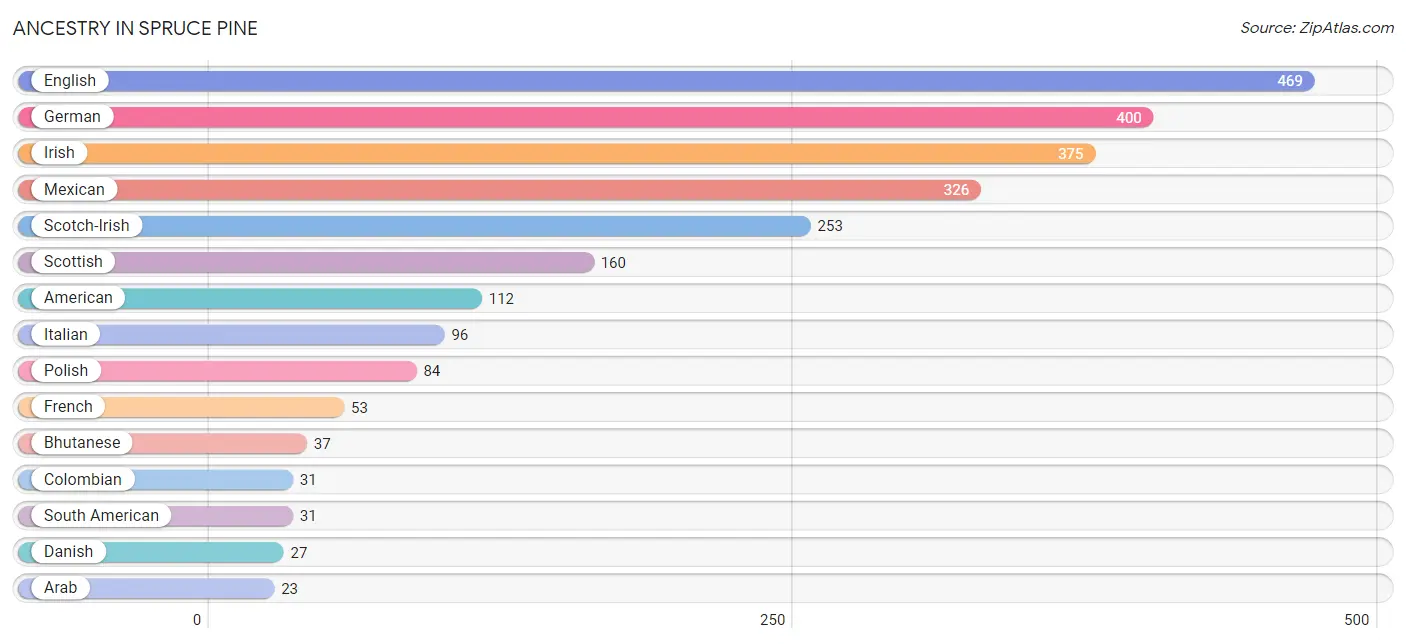
| Ancestry | # Population | % Population |
| American | 112 | 4.3% |
| Arab | 23 | 0.9% |
| Bhutanese | 37 | 1.4% |
| British | 7 | 0.3% |
| Canadian | 3 | 0.1% |
| Cherokee | 18 | 0.7% |
| Colombian | 31 | 1.2% |
| Danish | 27 | 1.0% |
| English | 469 | 17.8% |
| European | 10 | 0.4% |
| French | 53 | 2.0% |
| French Canadian | 7 | 0.3% |
| German | 400 | 15.2% |
| Hungarian | 19 | 0.7% |
| Irish | 375 | 14.2% |
| Italian | 96 | 3.6% |
| Korean | 10 | 0.4% |
| Lumbee | 9 | 0.3% |
| Mexican | 326 | 12.4% |
| Moroccan | 23 | 0.9% |
| Polish | 84 | 3.2% |
| Russian | 3 | 0.1% |
| Scotch-Irish | 253 | 9.6% |
| Scottish | 160 | 6.1% |
| South American | 31 | 1.2% |
| Welsh | 8 | 0.3% | View All 26 Rows |
Immigrants in Spruce Pine
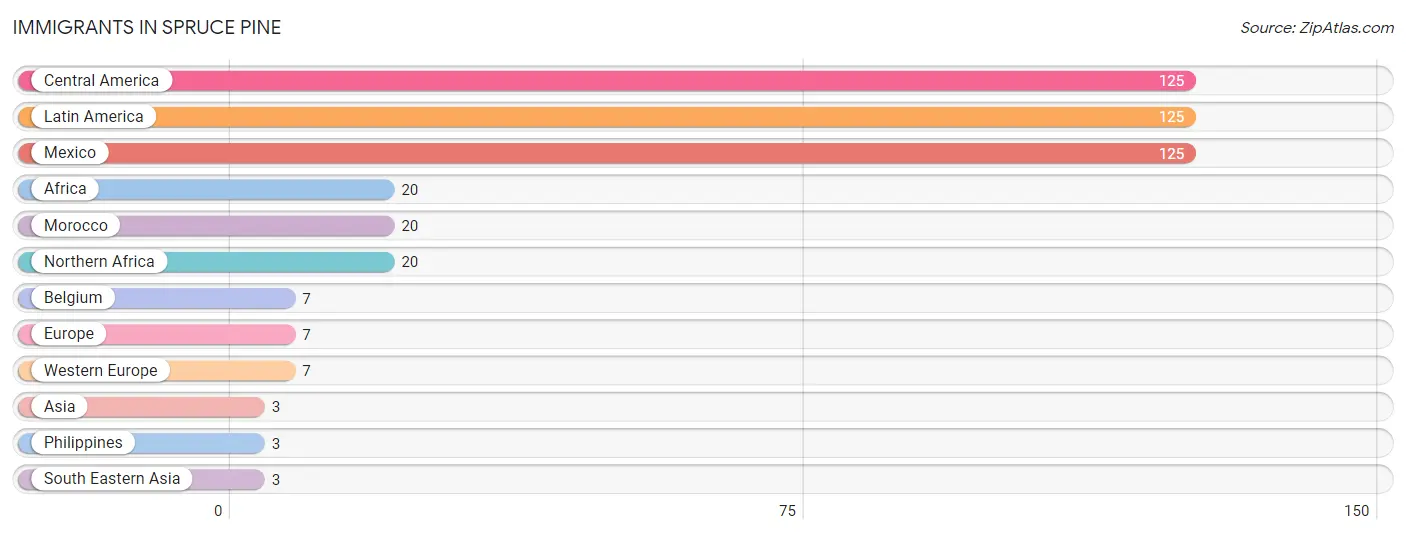
The most numerous immigrant groups reported in Spruce Pine came from Central America (125 | 4.7%), Latin America (125 | 4.7%), Mexico (125 | 4.7%), Africa (20 | 0.8%), and Morocco (20 | 0.8%), together accounting for 15.7% of all Spruce Pine residents.
| Immigration Origin | # Population | % Population |
| Africa | 20 | 0.8% |
| Asia | 3 | 0.1% |
| Belgium | 7 | 0.3% |
| Central America | 125 | 4.7% |
| Europe | 7 | 0.3% |
| Latin America | 125 | 4.7% |
| Mexico | 125 | 4.7% |
| Morocco | 20 | 0.8% |
| Northern Africa | 20 | 0.8% |
| Philippines | 3 | 0.1% |
| South Eastern Asia | 3 | 0.1% |
| Western Europe | 7 | 0.3% | View All 12 Rows |
Sex and Age in Spruce Pine
Sex and Age in Spruce Pine
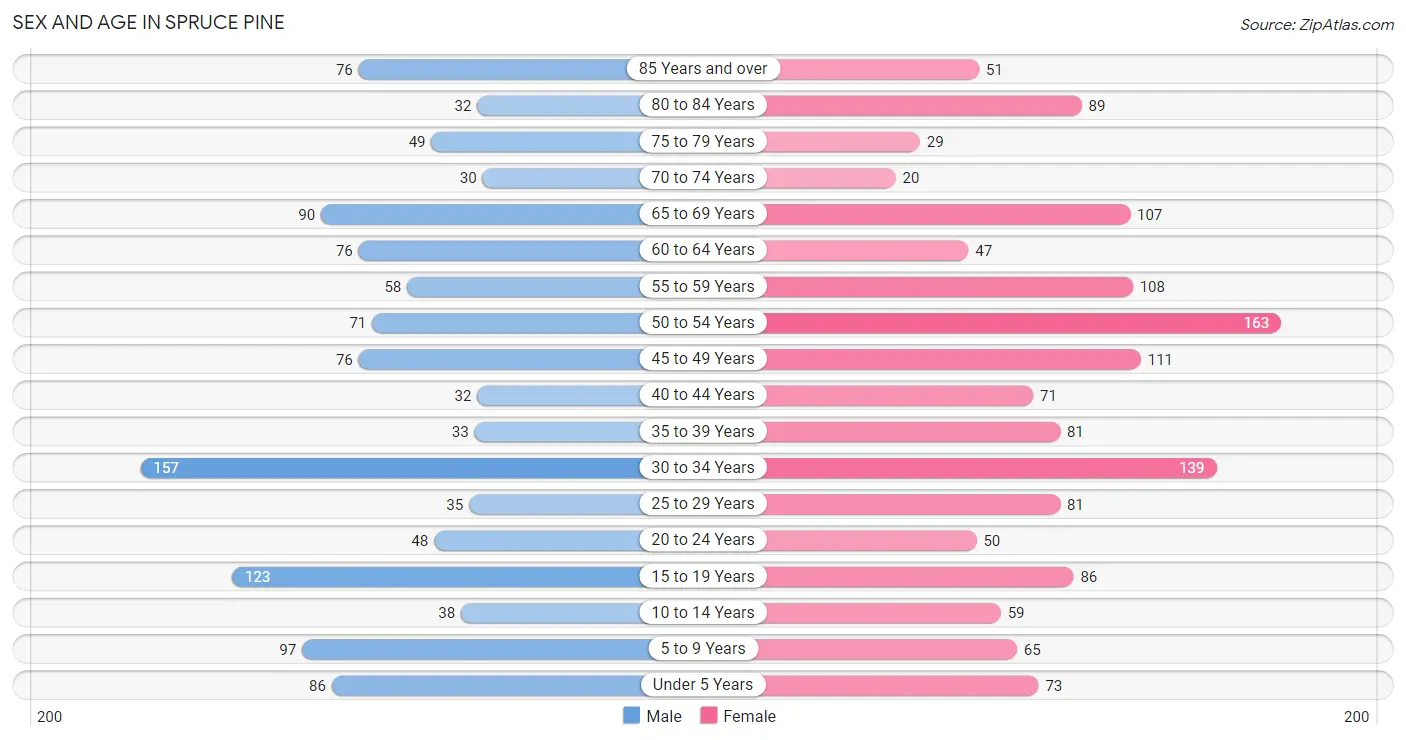
The most populous age groups in Spruce Pine are 30 to 34 Years (157 | 13.0%) for men and 50 to 54 Years (163 | 11.4%) for women.
| Age Bracket | Male | Female |
| Under 5 Years | 86 (7.1%) | 73 (5.1%) |
| 5 to 9 Years | 97 (8.0%) | 65 (4.5%) |
| 10 to 14 Years | 38 (3.2%) | 59 (4.1%) |
| 15 to 19 Years | 123 (10.2%) | 86 (6.0%) |
| 20 to 24 Years | 48 (4.0%) | 50 (3.5%) |
| 25 to 29 Years | 35 (2.9%) | 81 (5.7%) |
| 30 to 34 Years | 157 (13.0%) | 139 (9.7%) |
| 35 to 39 Years | 33 (2.7%) | 81 (5.7%) |
| 40 to 44 Years | 32 (2.6%) | 71 (5.0%) |
| 45 to 49 Years | 76 (6.3%) | 111 (7.8%) |
| 50 to 54 Years | 71 (5.9%) | 163 (11.4%) |
| 55 to 59 Years | 58 (4.8%) | 108 (7.5%) |
| 60 to 64 Years | 76 (6.3%) | 47 (3.3%) |
| 65 to 69 Years | 90 (7.5%) | 107 (7.5%) |
| 70 to 74 Years | 30 (2.5%) | 20 (1.4%) |
| 75 to 79 Years | 49 (4.1%) | 29 (2.0%) |
| 80 to 84 Years | 32 (2.6%) | 89 (6.2%) |
| 85 Years and over | 76 (6.3%) | 51 (3.6%) |
| Total | 1,207 (100.0%) | 1,430 (100.0%) |
Families and Households in Spruce Pine
Median Family Size in Spruce Pine
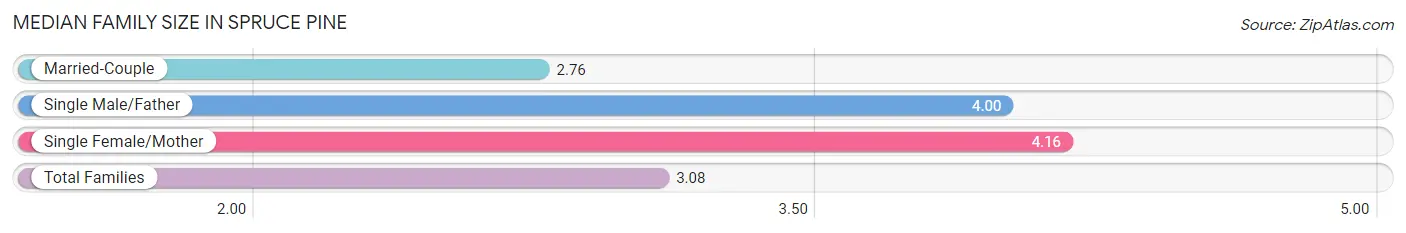
The median family size in Spruce Pine is 3.08 persons per family, with single female/mother families (140 | 22.0%) accounting for the largest median family size of 4.16 persons per family. On the other hand, married-couple families (488 | 76.6%) represent the smallest median family size with 2.76 persons per family.
| Family Type | # Families | Family Size |
| Married-Couple | 488 (76.6%) | 2.76 |
| Single Male/Father | 9 (1.4%) | 4.00 |
| Single Female/Mother | 140 (22.0%) | 4.16 |
| Total Families | 637 (100.0%) | 3.08 |
Median Household Size in Spruce Pine
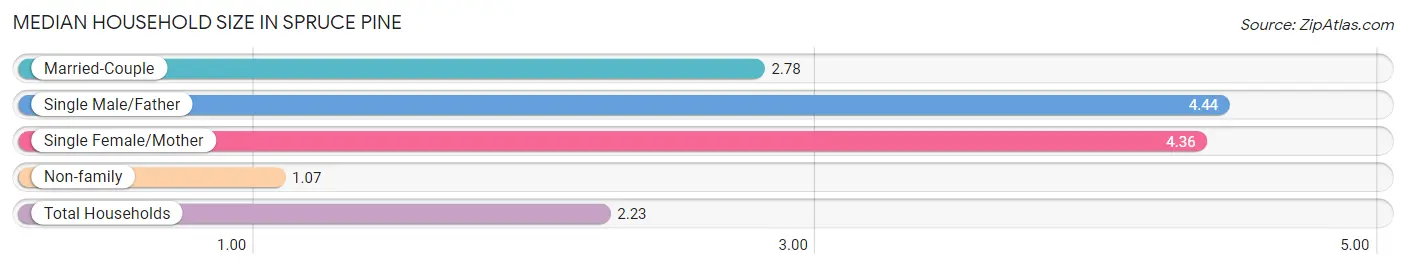
The median household size in Spruce Pine is 2.23 persons per household, with single male/father households (9 | 0.8%) accounting for the largest median household size of 4.44 persons per household. non-family households (504 | 44.2%) represent the smallest median household size with 1.07 persons per household.
| Household Type | # Households | Household Size |
| Married-Couple | 488 (42.8%) | 2.78 |
| Single Male/Father | 9 (0.8%) | 4.44 |
| Single Female/Mother | 140 (12.3%) | 4.36 |
| Non-family | 504 (44.2%) | 1.07 |
| Total Households | 1,141 (100.0%) | 2.23 |
Household Size by Marriage Status in Spruce Pine
Out of a total of 1,141 households in Spruce Pine, 637 (55.8%) are family households, while 504 (44.2%) are nonfamily households. The most numerous type of family households are 2-person households, comprising 311, and the most common type of nonfamily households are 1-person households, comprising 479.
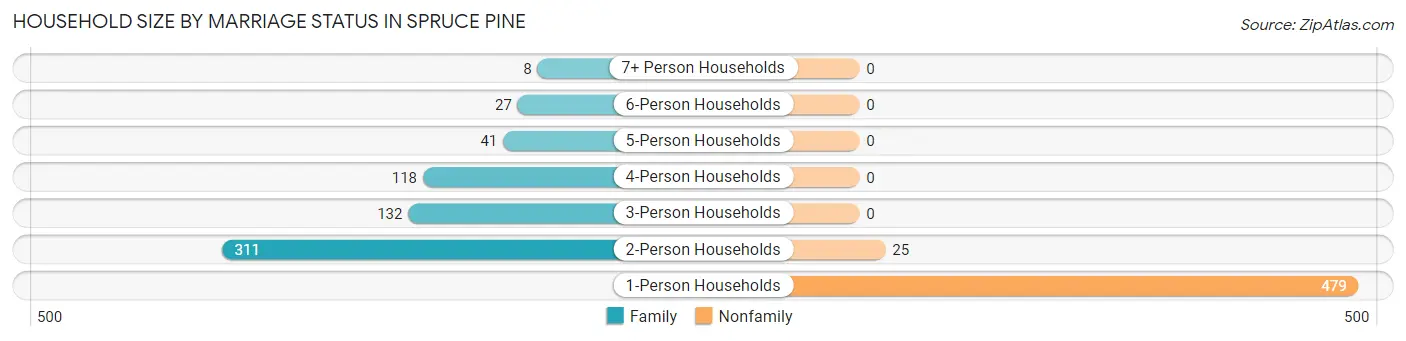
| Household Size | Family Households | Nonfamily Households |
| 1-Person Households | - | 479 (42.0%) |
| 2-Person Households | 311 (27.3%) | 25 (2.2%) |
| 3-Person Households | 132 (11.6%) | 0 (0.0%) |
| 4-Person Households | 118 (10.3%) | 0 (0.0%) |
| 5-Person Households | 41 (3.6%) | 0 (0.0%) |
| 6-Person Households | 27 (2.4%) | 0 (0.0%) |
| 7+ Person Households | 8 (0.7%) | 0 (0.0%) |
| Total | 637 (55.8%) | 504 (44.2%) |
Female Fertility in Spruce Pine
Fertility by Age in Spruce Pine
Average fertility rate in Spruce Pine is 36.0 births per 1,000 women. Women in the age bracket of 20 to 34 years have the highest fertility rate with 81.0 births per 1,000 women. Women in the age bracket of 20 to 34 years acount for 100.0% of all women with births.
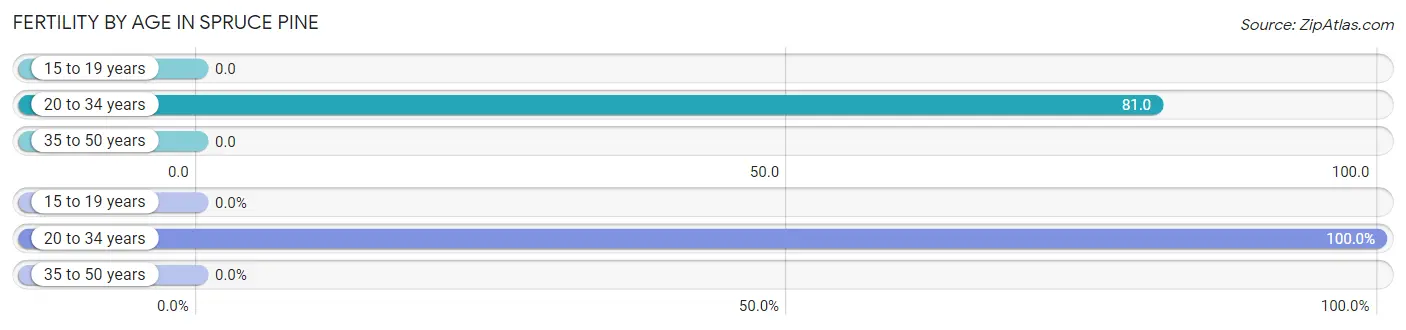
| Age Bracket | Women with Births | Births / 1,000 Women |
| 15 to 19 years | 0 (0.0%) | 0.0 |
| 20 to 34 years | 22 (100.0%) | 81.0 |
| 35 to 50 years | 0 (0.0%) | 0.0 |
| Total | 22 (100.0%) | 36.0 |
Fertility by Age by Marriage Status in Spruce Pine
81.8% of women with births (22) in Spruce Pine are married. The highest percentage of unmarried women with births falls into 20 to 34 years age bracket with 18.2% of them unmarried at the time of birth, while the lowest percentage of unmarried women with births belong to 20 to 34 years age bracket with 18.2% of them unmarried.
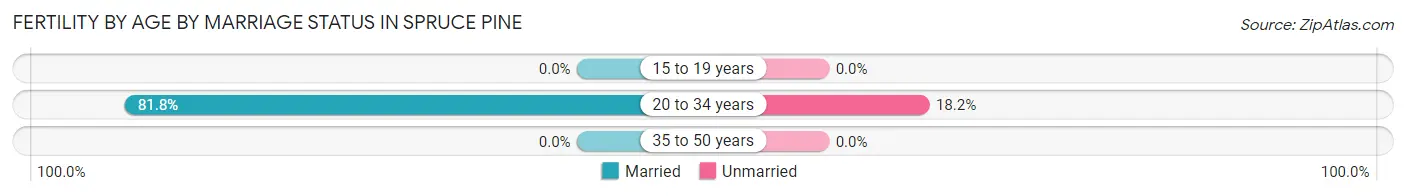
| Age Bracket | Married | Unmarried |
| 15 to 19 years | 0 (0.0%) | 0 (0.0%) |
| 20 to 34 years | 18 (81.8%) | 4 (18.2%) |
| 35 to 50 years | 0 (0.0%) | 0 (0.0%) |
| Total | 18 (81.8%) | 4 (18.2%) |
Fertility by Education in Spruce Pine
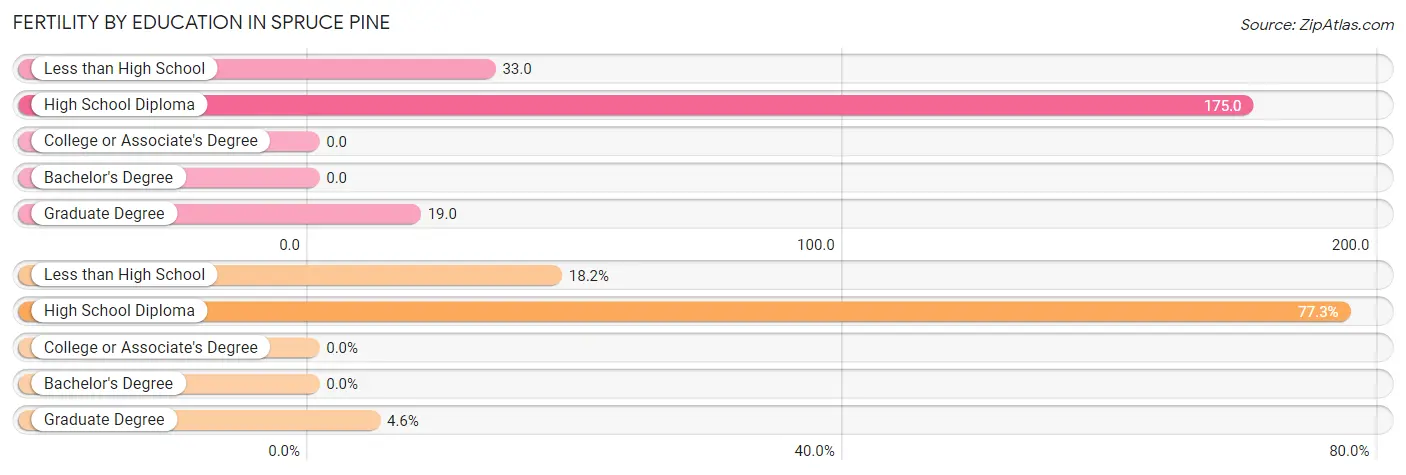
| Educational Attainment | Women with Births | Births / 1,000 Women |
| Less than High School | 4 (18.2%) | 33.0 |
| High School Diploma | 17 (77.3%) | 175.0 |
| College or Associate's Degree | 0 (0.0%) | 0.0 |
| Bachelor's Degree | 0 (0.0%) | 0.0 |
| Graduate Degree | 1 (4.5%) | 19.0 |
| Total | 22 (100.0%) | 36.0 |
Fertility by Education by Marriage Status in Spruce Pine
18.2% of women with births in Spruce Pine are unmarried. Women with the educational attainment of high school diploma are most likely to be married with 100.0% of them married at childbirth, while women with the educational attainment of less than high school are least likely to be married with 100.0% of them unmarried at childbirth.
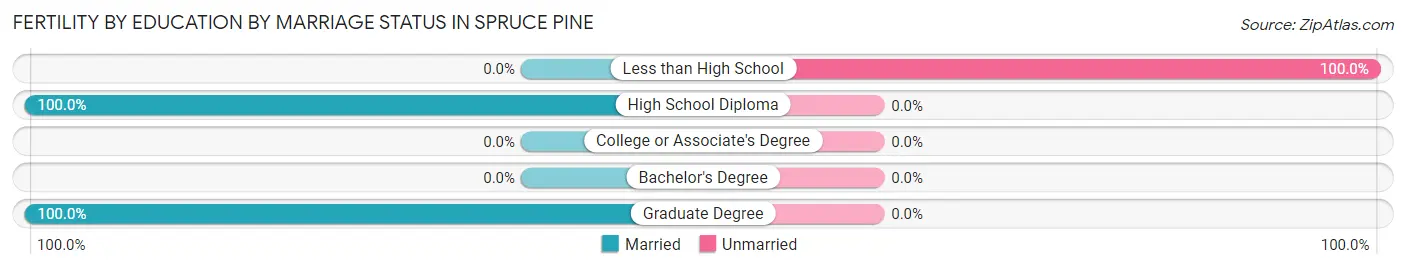
| Educational Attainment | Married | Unmarried |
| Less than High School | 0 (0.0%) | 4 (100.0%) |
| High School Diploma | 17 (100.0%) | 0 (0.0%) |
| College or Associate's Degree | 0 (0.0%) | 0 (0.0%) |
| Bachelor's Degree | 0 (0.0%) | 0 (0.0%) |
| Graduate Degree | 1 (100.0%) | 0 (0.0%) |
| Total | 18 (81.8%) | 4 (18.2%) |
Employment Characteristics in Spruce Pine
Employment by Class of Employer in Spruce Pine
Among the 1,099 employed individuals in Spruce Pine, private company employees (722 | 65.7%), state government employees (106 | 9.7%), and not-for-profit organizations (94 | 8.6%) make up the most common classes of employment.
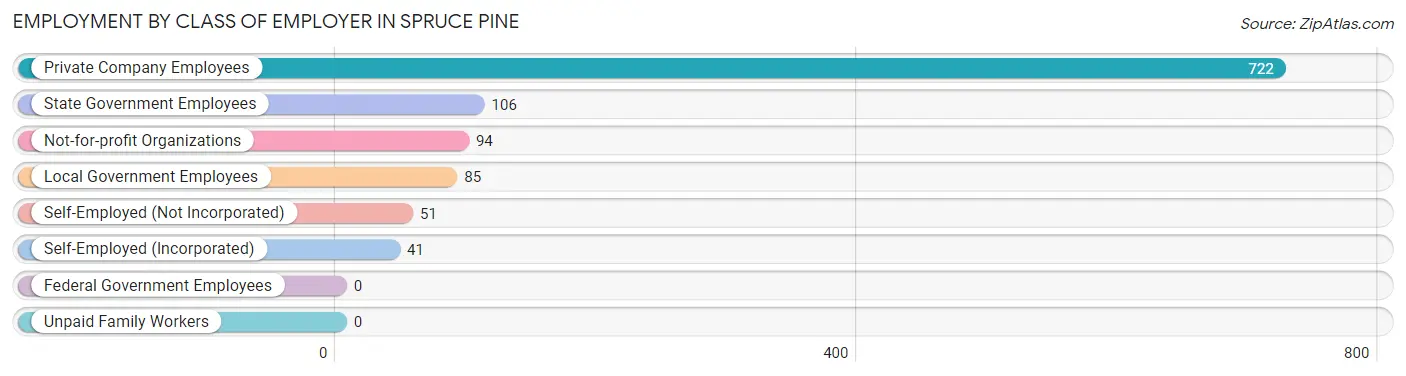
| Employer Class | # Employees | % Employees |
| Private Company Employees | 722 | 65.7% |
| Self-Employed (Incorporated) | 41 | 3.7% |
| Self-Employed (Not Incorporated) | 51 | 4.6% |
| Not-for-profit Organizations | 94 | 8.6% |
| Local Government Employees | 85 | 7.7% |
| State Government Employees | 106 | 9.7% |
| Federal Government Employees | 0 | 0.0% |
| Unpaid Family Workers | 0 | 0.0% |
| Total | 1,099 | 100.0% |
Employment Status by Age in Spruce Pine
According to the labor force statistics for Spruce Pine, out of the total population over 16 years of age (2,182), 51.3% or 1,119 individuals are in the labor force, with 1.8% or 20 of them unemployed. The age group with the highest labor force participation rate is 35 to 44 years, with 76.5% or 166 individuals in the labor force. Within the labor force, the 60 to 64 years age range has the highest percentage of unemployed individuals, with 9.4% or 3 of them being unemployed.
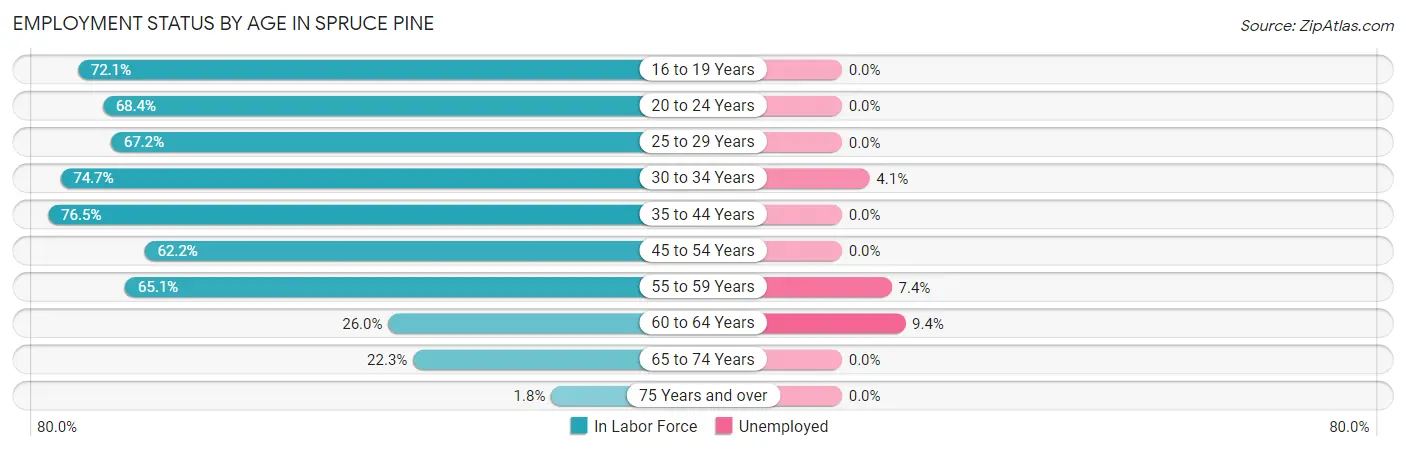
| Age Bracket | In Labor Force | Unemployed |
| 16 to 19 Years | 124 (72.1%) | 0 (0.0%) |
| 20 to 24 Years | 67 (68.4%) | 0 (0.0%) |
| 25 to 29 Years | 78 (67.2%) | 0 (0.0%) |
| 30 to 34 Years | 221 (74.7%) | 9 (4.1%) |
| 35 to 44 Years | 166 (76.5%) | 0 (0.0%) |
| 45 to 54 Years | 262 (62.2%) | 0 (0.0%) |
| 55 to 59 Years | 108 (65.1%) | 8 (7.4%) |
| 60 to 64 Years | 32 (26.0%) | 3 (9.4%) |
| 65 to 74 Years | 55 (22.3%) | 0 (0.0%) |
| 75 Years and over | 6 (1.8%) | 0 (0.0%) |
| Total | 1,119 (51.3%) | 20 (1.8%) |
Employment Status by Educational Attainment in Spruce Pine
According to labor force statistics for Spruce Pine, 64.7% of individuals (866) out of the total population between 25 and 64 years of age (1,339) are in the labor force, with 2.3% or 20 of them being unemployed. The group with the highest labor force participation rate are those with the educational attainment of bachelor's degree or higher, with 87.5% or 266 individuals in the labor force. Within the labor force, individuals with high school diploma education have the highest percentage of unemployment, with 9.4% or 12 of them being unemployed.
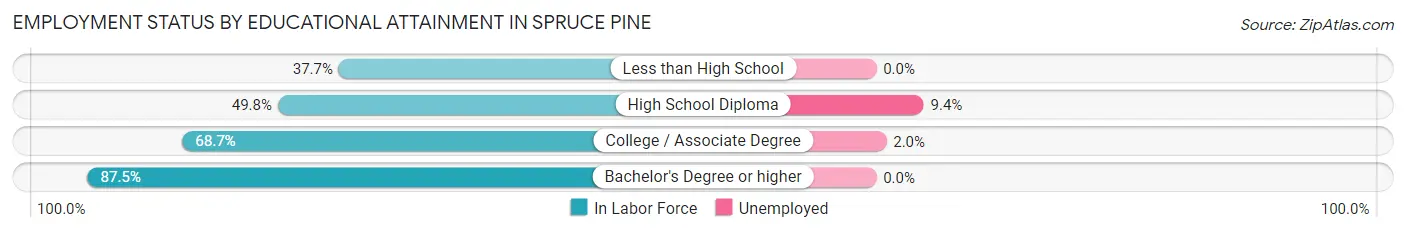
| Educational Attainment | In Labor Force | Unemployed |
| Less than High School | 75 (37.7%) | 0 (0.0%) |
| High School Diploma | 127 (49.8%) | 24 (9.4%) |
| College / Associate Degree | 399 (68.7%) | 12 (2.0%) |
| Bachelor's Degree or higher | 266 (87.5%) | 0 (0.0%) |
| Total | 866 (64.7%) | 31 (2.3%) |
Employment Occupations by Sex in Spruce Pine
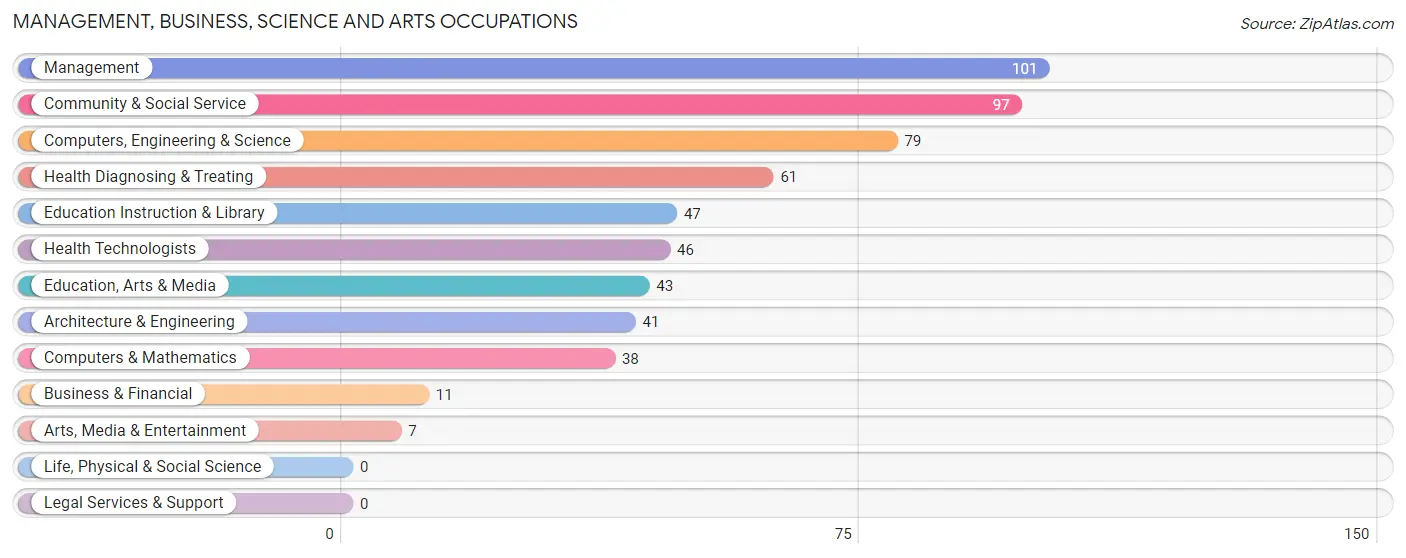
Management, Business, Science and Arts Occupations
The most common Management, Business, Science and Arts occupations in Spruce Pine are Management (101 | 9.2%), Community & Social Service (97 | 8.8%), Computers, Engineering & Science (79 | 7.2%), Health Diagnosing & Treating (61 | 5.6%), and Education Instruction & Library (47 | 4.3%).
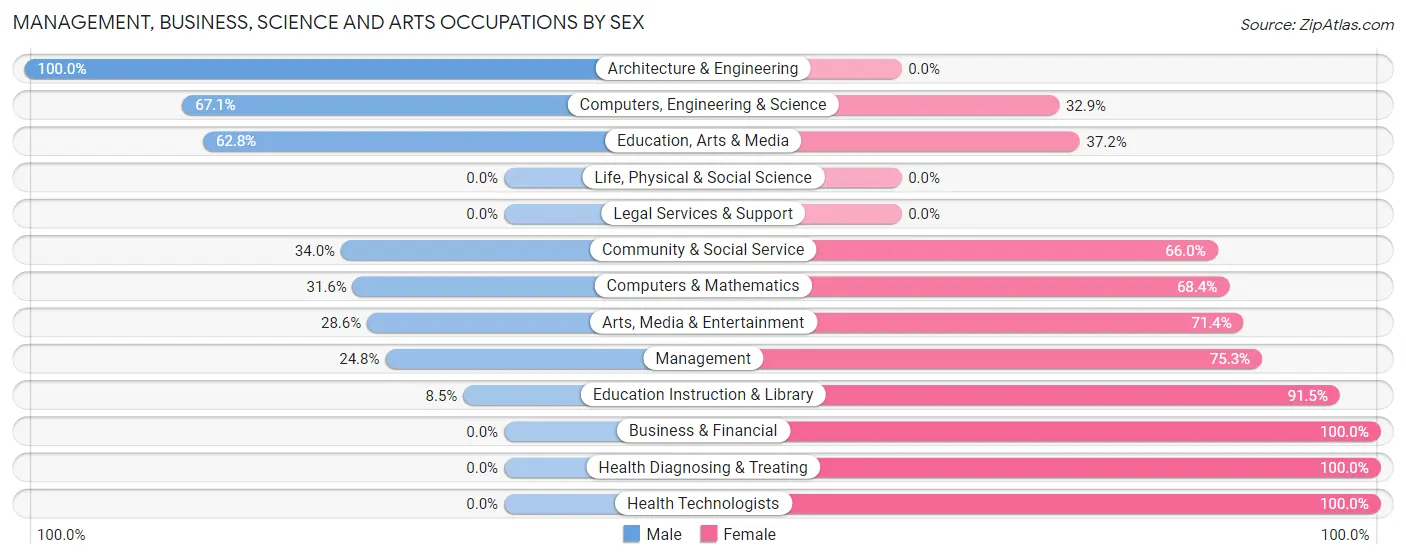
Management, Business, Science and Arts Occupations by Sex
Within the Management, Business, Science and Arts occupations in Spruce Pine, the most male-oriented occupations are Architecture & Engineering (100.0%), Computers, Engineering & Science (67.1%), and Education, Arts & Media (62.8%), while the most female-oriented occupations are Business & Financial (100.0%), Health Diagnosing & Treating (100.0%), and Health Technologists (100.0%).
| Occupation | Male | Female |
| Management | 25 (24.7%) | 76 (75.2%) |
| Business & Financial | 0 (0.0%) | 11 (100.0%) |
| Computers, Engineering & Science | 53 (67.1%) | 26 (32.9%) |
| Computers & Mathematics | 12 (31.6%) | 26 (68.4%) |
| Architecture & Engineering | 41 (100.0%) | 0 (0.0%) |
| Life, Physical & Social Science | 0 (0.0%) | 0 (0.0%) |
| Community & Social Service | 33 (34.0%) | 64 (66.0%) |
| Education, Arts & Media | 27 (62.8%) | 16 (37.2%) |
| Legal Services & Support | 0 (0.0%) | 0 (0.0%) |
| Education Instruction & Library | 4 (8.5%) | 43 (91.5%) |
| Arts, Media & Entertainment | 2 (28.6%) | 5 (71.4%) |
| Health Diagnosing & Treating | 0 (0.0%) | 61 (100.0%) |
| Health Technologists | 0 (0.0%) | 46 (100.0%) |
| Total (Category) | 111 (31.8%) | 238 (68.2%) |
| Total (Overall) | 524 (47.7%) | 575 (52.3%) |
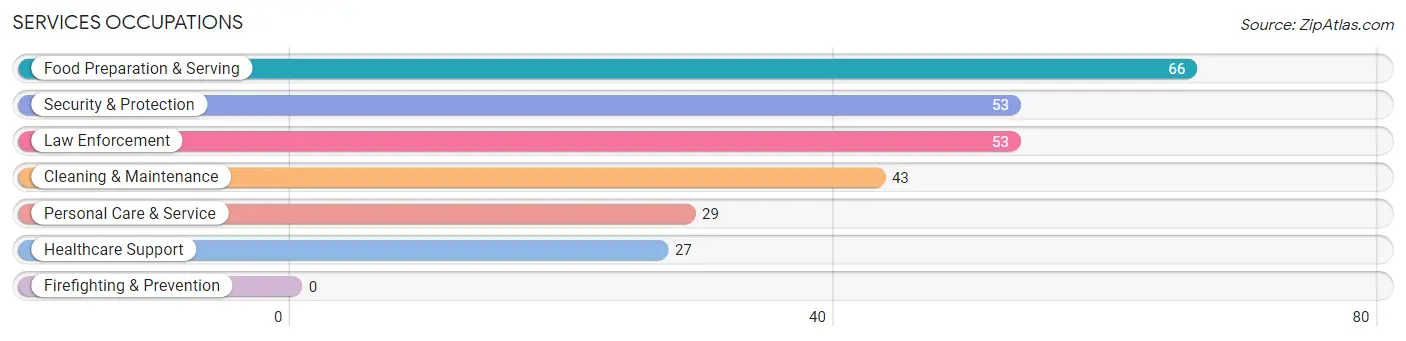
Services Occupations
The most common Services occupations in Spruce Pine are Food Preparation & Serving (66 | 6.0%), Security & Protection (53 | 4.8%), Law Enforcement (53 | 4.8%), Cleaning & Maintenance (43 | 3.9%), and Personal Care & Service (29 | 2.6%).
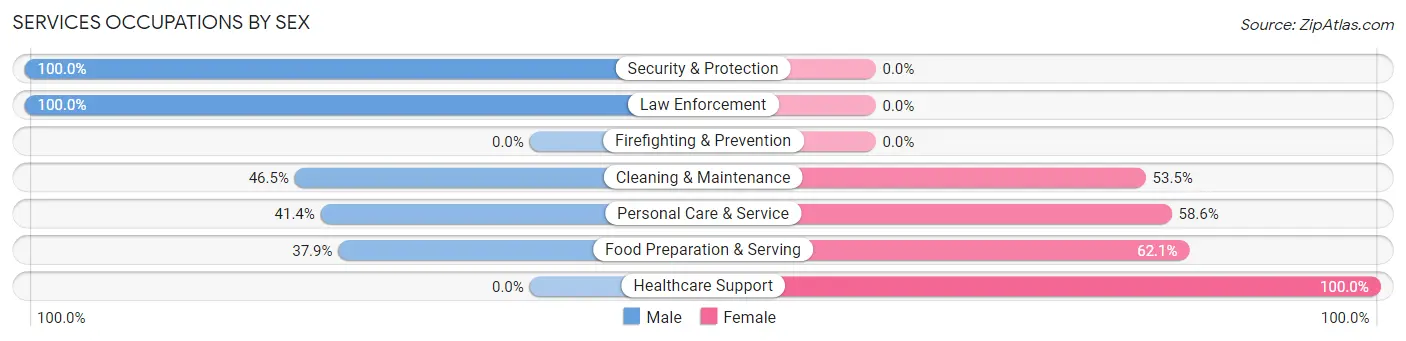
Services Occupations by Sex
Within the Services occupations in Spruce Pine, the most male-oriented occupations are Security & Protection (100.0%), Law Enforcement (100.0%), and Cleaning & Maintenance (46.5%), while the most female-oriented occupations are Healthcare Support (100.0%), Food Preparation & Serving (62.1%), and Personal Care & Service (58.6%).
| Occupation | Male | Female |
| Healthcare Support | 0 (0.0%) | 27 (100.0%) |
| Security & Protection | 53 (100.0%) | 0 (0.0%) |
| Firefighting & Prevention | 0 (0.0%) | 0 (0.0%) |
| Law Enforcement | 53 (100.0%) | 0 (0.0%) |
| Food Preparation & Serving | 25 (37.9%) | 41 (62.1%) |
| Cleaning & Maintenance | 20 (46.5%) | 23 (53.5%) |
| Personal Care & Service | 12 (41.4%) | 17 (58.6%) |
| Total (Category) | 110 (50.5%) | 108 (49.5%) |
| Total (Overall) | 524 (47.7%) | 575 (52.3%) |
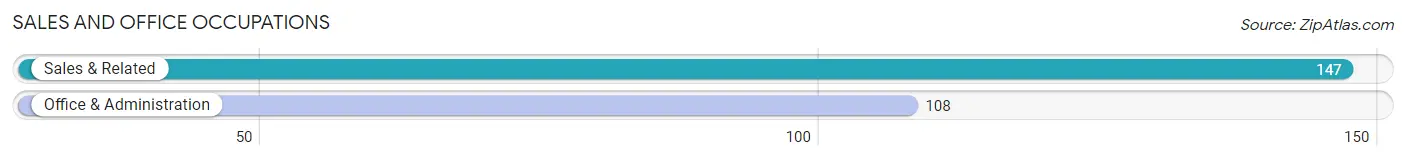
Sales and Office Occupations
The most common Sales and Office occupations in Spruce Pine are Sales & Related (147 | 13.4%), and Office & Administration (108 | 9.8%).
Sales and Office Occupations by Sex
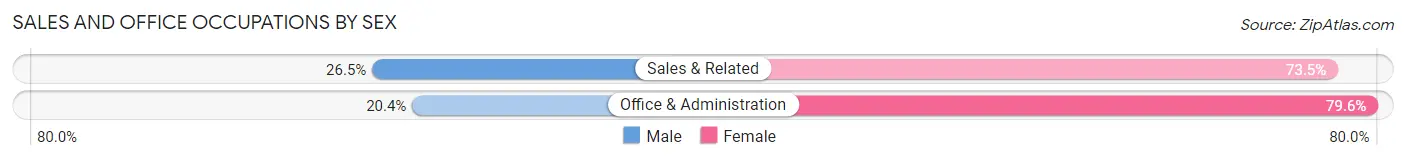
| Occupation | Male | Female |
| Sales & Related | 39 (26.5%) | 108 (73.5%) |
| Office & Administration | 22 (20.4%) | 86 (79.6%) |
| Total (Category) | 61 (23.9%) | 194 (76.1%) |
| Total (Overall) | 524 (47.7%) | 575 (52.3%) |
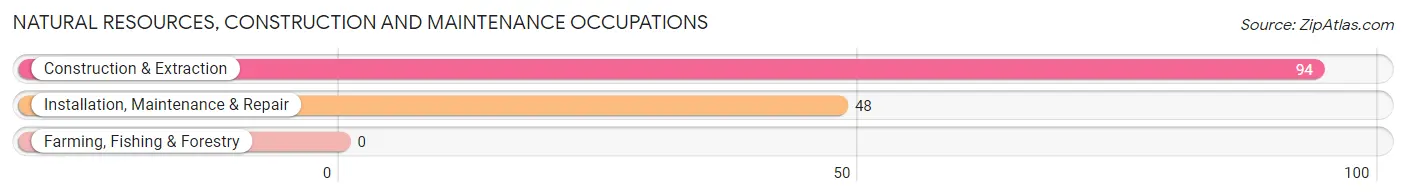
Natural Resources, Construction and Maintenance Occupations
The most common Natural Resources, Construction and Maintenance occupations in Spruce Pine are Construction & Extraction (94 | 8.6%), and Installation, Maintenance & Repair (48 | 4.4%).
Natural Resources, Construction and Maintenance Occupations by Sex
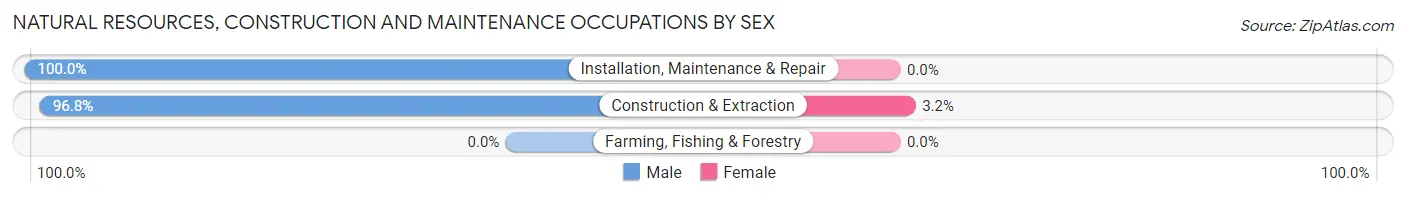
| Occupation | Male | Female |
| Farming, Fishing & Forestry | 0 (0.0%) | 0 (0.0%) |
| Construction & Extraction | 91 (96.8%) | 3 (3.2%) |
| Installation, Maintenance & Repair | 48 (100.0%) | 0 (0.0%) |
| Total (Category) | 139 (97.9%) | 3 (2.1%) |
| Total (Overall) | 524 (47.7%) | 575 (52.3%) |
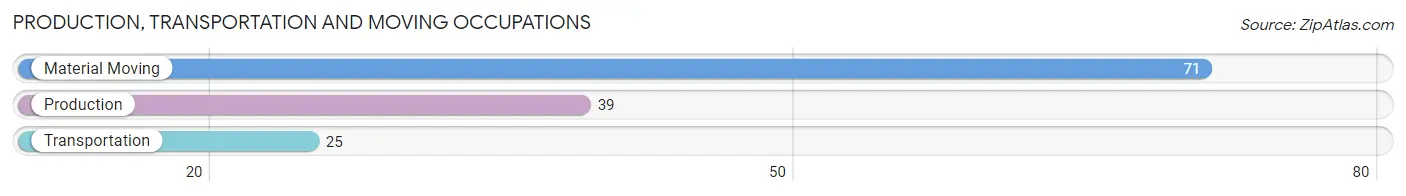
Production, Transportation and Moving Occupations
The most common Production, Transportation and Moving occupations in Spruce Pine are Material Moving (71 | 6.5%), Production (39 | 3.5%), and Transportation (25 | 2.3%).
Production, Transportation and Moving Occupations by Sex
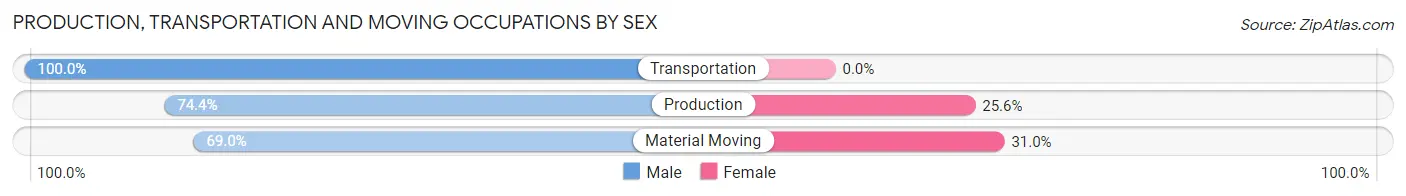
| Occupation | Male | Female |
| Production | 29 (74.4%) | 10 (25.6%) |
| Transportation | 25 (100.0%) | 0 (0.0%) |
| Material Moving | 49 (69.0%) | 22 (31.0%) |
| Total (Category) | 103 (76.3%) | 32 (23.7%) |
| Total (Overall) | 524 (47.7%) | 575 (52.3%) |
Employment Industries by Sex in Spruce Pine
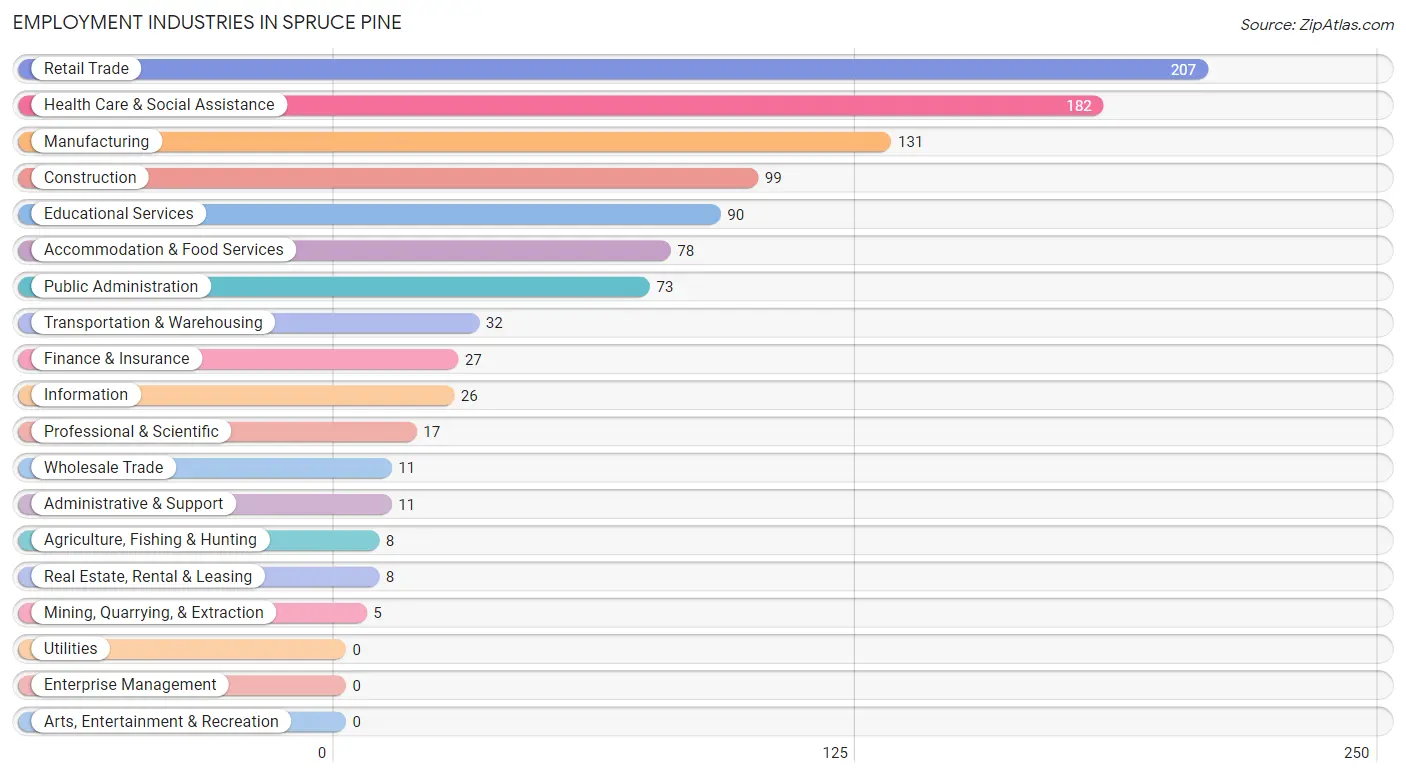
Employment Industries in Spruce Pine
The major employment industries in Spruce Pine include Retail Trade (207 | 18.8%), Health Care & Social Assistance (182 | 16.6%), Manufacturing (131 | 11.9%), Construction (99 | 9.0%), and Educational Services (90 | 8.2%).
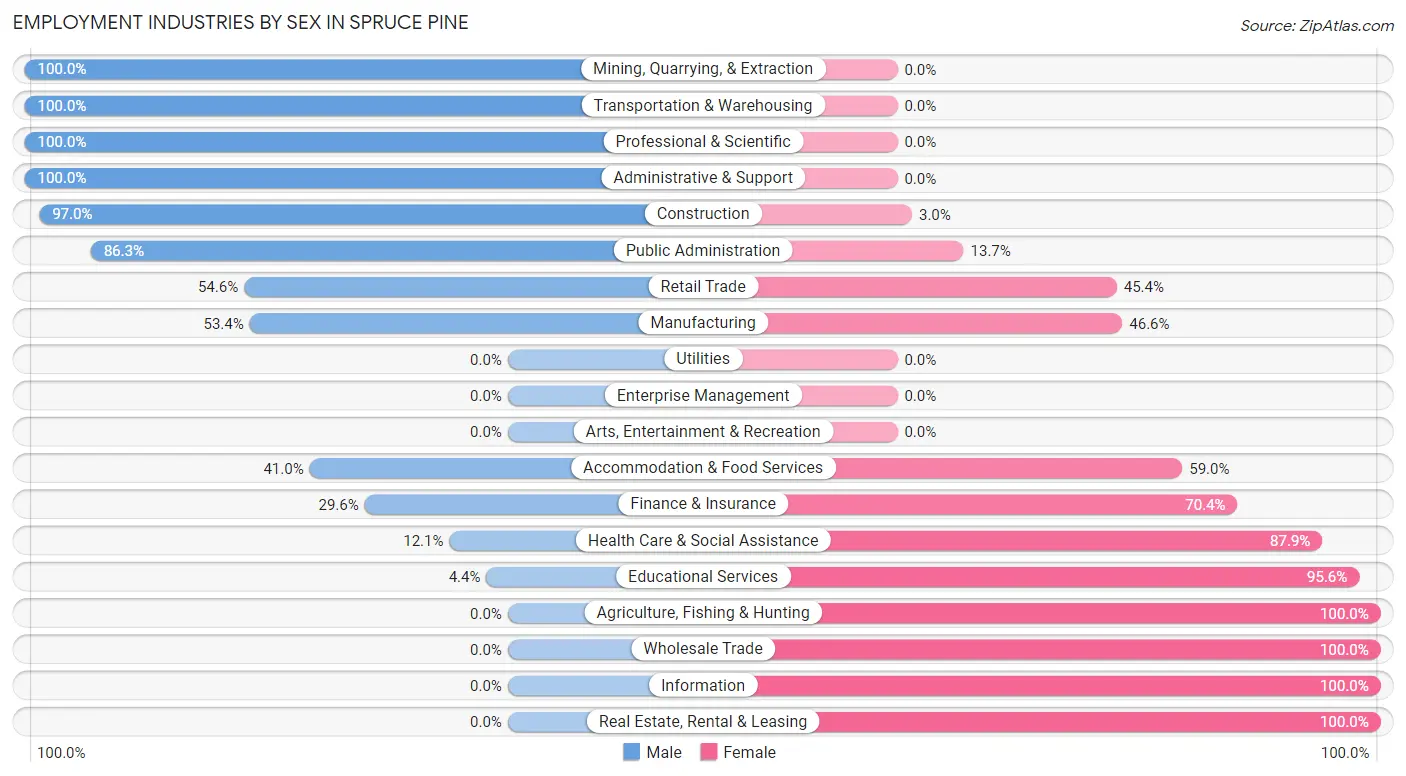
Employment Industries by Sex in Spruce Pine
The Spruce Pine industries that see more men than women are Mining, Quarrying, & Extraction (100.0%), Transportation & Warehousing (100.0%), and Professional & Scientific (100.0%), whereas the industries that tend to have a higher number of women are Agriculture, Fishing & Hunting (100.0%), Wholesale Trade (100.0%), and Information (100.0%).
| Industry | Male | Female |
| Agriculture, Fishing & Hunting | 0 (0.0%) | 8 (100.0%) |
| Mining, Quarrying, & Extraction | 5 (100.0%) | 0 (0.0%) |
| Construction | 96 (97.0%) | 3 (3.0%) |
| Manufacturing | 70 (53.4%) | 61 (46.6%) |
| Wholesale Trade | 0 (0.0%) | 11 (100.0%) |
| Retail Trade | 113 (54.6%) | 94 (45.4%) |
| Transportation & Warehousing | 32 (100.0%) | 0 (0.0%) |
| Utilities | 0 (0.0%) | 0 (0.0%) |
| Information | 0 (0.0%) | 26 (100.0%) |
| Finance & Insurance | 8 (29.6%) | 19 (70.4%) |
| Real Estate, Rental & Leasing | 0 (0.0%) | 8 (100.0%) |
| Professional & Scientific | 17 (100.0%) | 0 (0.0%) |
| Enterprise Management | 0 (0.0%) | 0 (0.0%) |
| Administrative & Support | 11 (100.0%) | 0 (0.0%) |
| Educational Services | 4 (4.4%) | 86 (95.6%) |
| Health Care & Social Assistance | 22 (12.1%) | 160 (87.9%) |
| Arts, Entertainment & Recreation | 0 (0.0%) | 0 (0.0%) |
| Accommodation & Food Services | 32 (41.0%) | 46 (59.0%) |
| Public Administration | 63 (86.3%) | 10 (13.7%) |
| Total | 524 (47.7%) | 575 (52.3%) |
Education in Spruce Pine
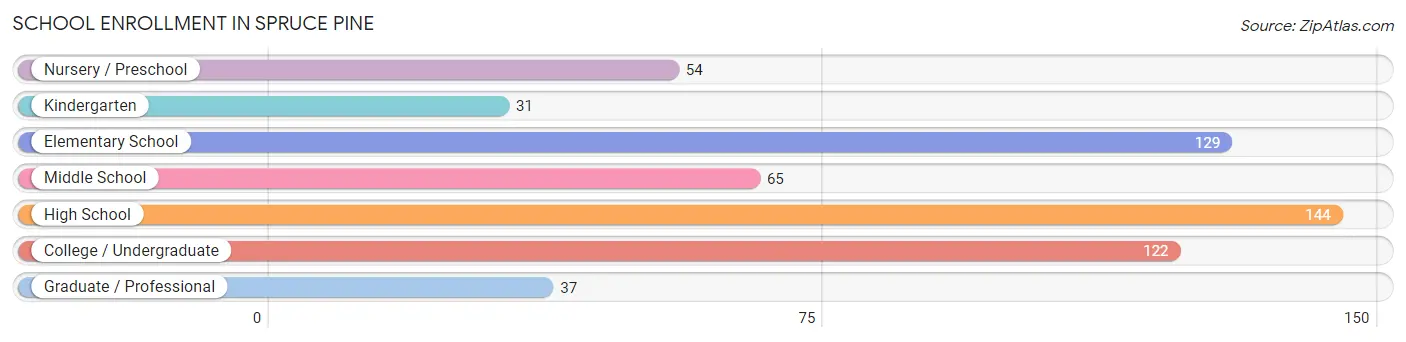
School Enrollment in Spruce Pine
The most common levels of schooling among the 582 students in Spruce Pine are high school (144 | 24.7%), elementary school (129 | 22.2%), and college / undergraduate (122 | 21.0%).
| School Level | # Students | % Students |
| Nursery / Preschool | 54 | 9.3% |
| Kindergarten | 31 | 5.3% |
| Elementary School | 129 | 22.2% |
| Middle School | 65 | 11.2% |
| High School | 144 | 24.7% |
| College / Undergraduate | 122 | 21.0% |
| Graduate / Professional | 37 | 6.4% |
| Total | 582 | 100.0% |
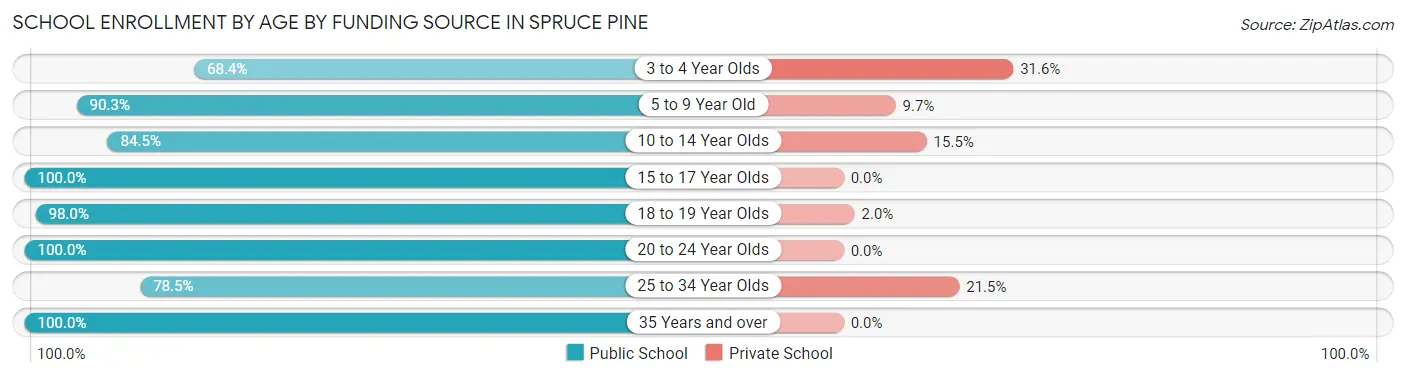
School Enrollment by Age by Funding Source in Spruce Pine
Out of a total of 582 students who are enrolled in schools in Spruce Pine, 57 (9.8%) attend a private institution, while the remaining 525 (90.2%) are enrolled in public schools. The age group of 3 to 4 year olds has the highest likelihood of being enrolled in private schools, with 12 (31.6% in the age bracket) enrolled. Conversely, the age group of 15 to 17 year olds has the lowest likelihood of being enrolled in a private school, with 99 (100.0% in the age bracket) attending a public institution.
| Age Bracket | Public School | Private School |
| 3 to 4 Year Olds | 26 (68.4%) | 12 (31.6%) |
| 5 to 9 Year Old | 140 (90.3%) | 15 (9.7%) |
| 10 to 14 Year Olds | 82 (84.5%) | 15 (15.5%) |
| 15 to 17 Year Olds | 99 (100.0%) | 0 (0.0%) |
| 18 to 19 Year Olds | 48 (98.0%) | 1 (2.0%) |
| 20 to 24 Year Olds | 36 (100.0%) | 0 (0.0%) |
| 25 to 34 Year Olds | 51 (78.5%) | 14 (21.5%) |
| 35 Years and over | 43 (100.0%) | 0 (0.0%) |
| Total | 525 (90.2%) | 57 (9.8%) |
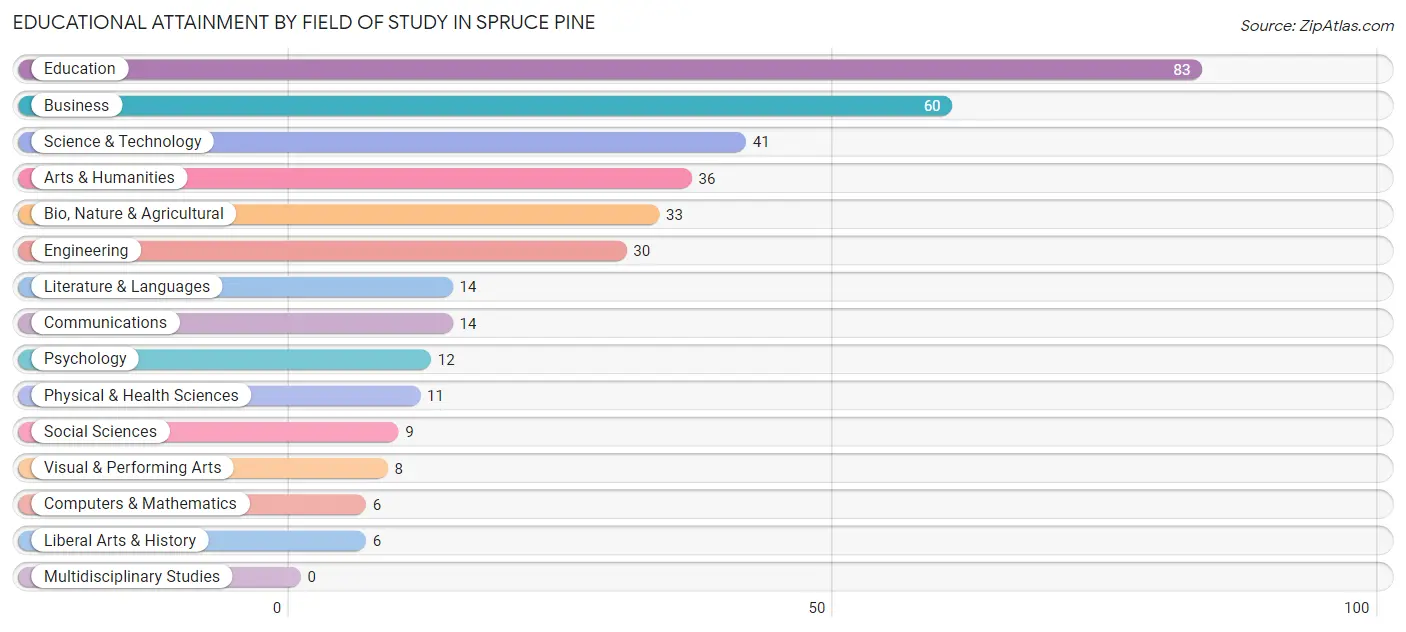
Educational Attainment by Field of Study in Spruce Pine
Education (83 | 22.9%), business (60 | 16.5%), science & technology (41 | 11.3%), arts & humanities (36 | 9.9%), and bio, nature & agricultural (33 | 9.1%) are the most common fields of study among 363 individuals in Spruce Pine who have obtained a bachelor's degree or higher.
| Field of Study | # Graduates | % Graduates |
| Computers & Mathematics | 6 | 1.7% |
| Bio, Nature & Agricultural | 33 | 9.1% |
| Physical & Health Sciences | 11 | 3.0% |
| Psychology | 12 | 3.3% |
| Social Sciences | 9 | 2.5% |
| Engineering | 30 | 8.3% |
| Multidisciplinary Studies | 0 | 0.0% |
| Science & Technology | 41 | 11.3% |
| Business | 60 | 16.5% |
| Education | 83 | 22.9% |
| Literature & Languages | 14 | 3.9% |
| Liberal Arts & History | 6 | 1.7% |
| Visual & Performing Arts | 8 | 2.2% |
| Communications | 14 | 3.9% |
| Arts & Humanities | 36 | 9.9% |
| Total | 363 | 100.0% |
Transportation & Commute in Spruce Pine
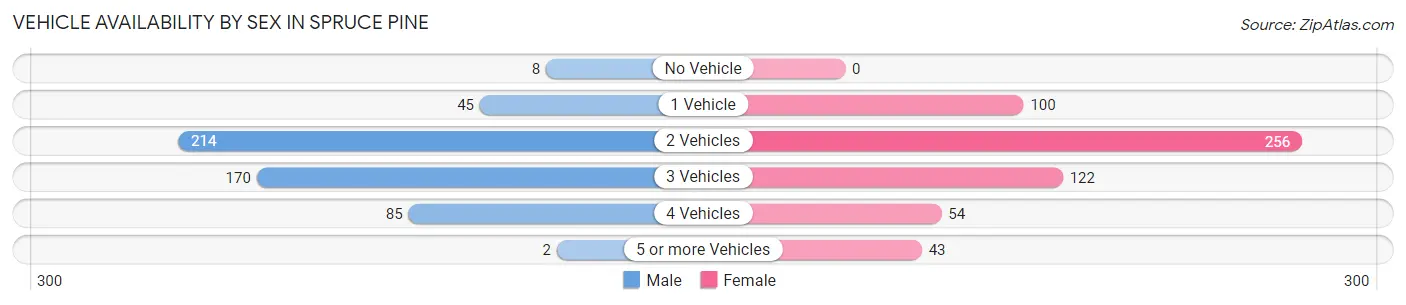
Vehicle Availability by Sex in Spruce Pine
The most prevalent vehicle ownership categories in Spruce Pine are males with 2 vehicles (214, accounting for 40.8%) and females with 2 vehicles (256, making up 37.2%).
| Vehicles Available | Male | Female |
| No Vehicle | 8 (1.5%) | 0 (0.0%) |
| 1 Vehicle | 45 (8.6%) | 100 (17.4%) |
| 2 Vehicles | 214 (40.8%) | 256 (44.5%) |
| 3 Vehicles | 170 (32.4%) | 122 (21.2%) |
| 4 Vehicles | 85 (16.2%) | 54 (9.4%) |
| 5 or more Vehicles | 2 (0.4%) | 43 (7.5%) |
| Total | 524 (100.0%) | 575 (100.0%) |
Commute Time in Spruce Pine
The most frequently occuring commute durations in Spruce Pine are 5 to 9 minutes (266 commuters, 25.6%), less than 5 minutes (198 commuters, 19.1%), and 15 to 19 minutes (151 commuters, 14.5%).
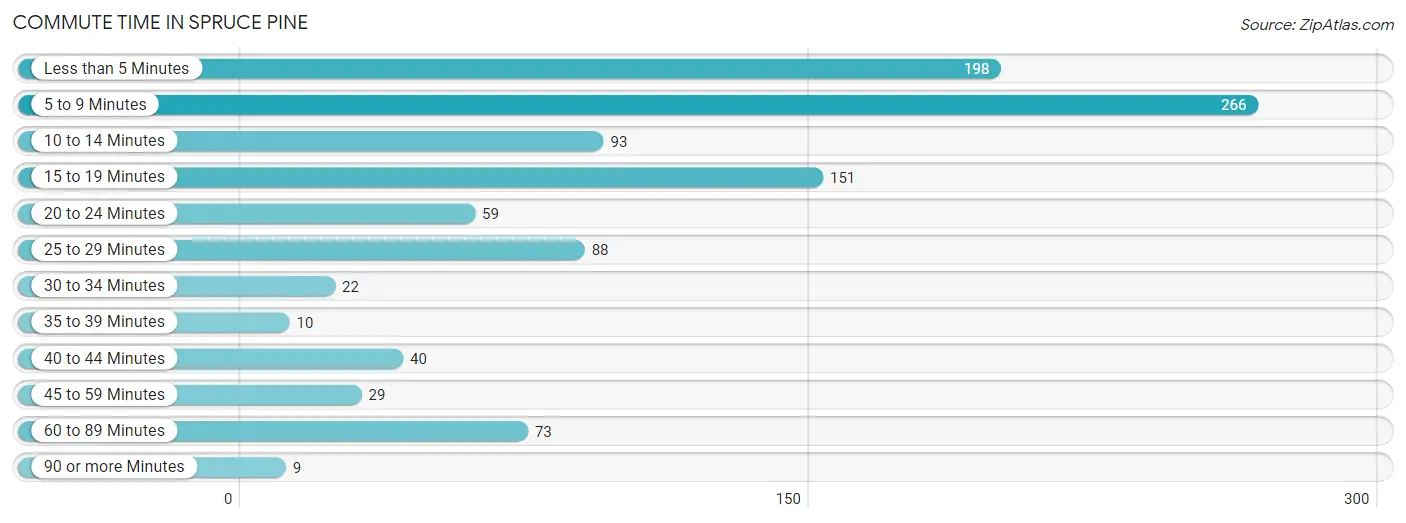
| Commute Time | # Commuters | % Commuters |
| Less than 5 Minutes | 198 | 19.1% |
| 5 to 9 Minutes | 266 | 25.6% |
| 10 to 14 Minutes | 93 | 9.0% |
| 15 to 19 Minutes | 151 | 14.5% |
| 20 to 24 Minutes | 59 | 5.7% |
| 25 to 29 Minutes | 88 | 8.5% |
| 30 to 34 Minutes | 22 | 2.1% |
| 35 to 39 Minutes | 10 | 1.0% |
| 40 to 44 Minutes | 40 | 3.8% |
| 45 to 59 Minutes | 29 | 2.8% |
| 60 to 89 Minutes | 73 | 7.0% |
| 90 or more Minutes | 9 | 0.9% |
Commute Time by Sex in Spruce Pine
The most common commute times in Spruce Pine are 5 to 9 minutes (156 commuters, 30.7%) for males and 5 to 9 minutes (110 commuters, 20.7%) for females.
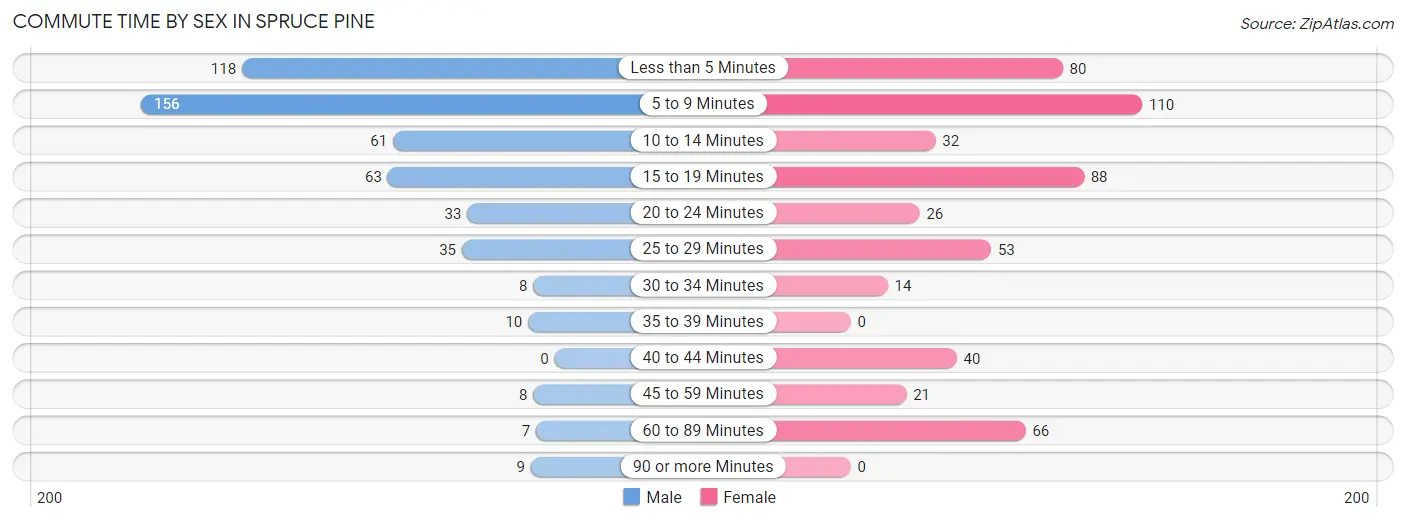
| Commute Time | Male | Female |
| Less than 5 Minutes | 118 (23.2%) | 80 (15.1%) |
| 5 to 9 Minutes | 156 (30.7%) | 110 (20.7%) |
| 10 to 14 Minutes | 61 (12.0%) | 32 (6.0%) |
| 15 to 19 Minutes | 63 (12.4%) | 88 (16.6%) |
| 20 to 24 Minutes | 33 (6.5%) | 26 (4.9%) |
| 25 to 29 Minutes | 35 (6.9%) | 53 (10.0%) |
| 30 to 34 Minutes | 8 (1.6%) | 14 (2.6%) |
| 35 to 39 Minutes | 10 (2.0%) | 0 (0.0%) |
| 40 to 44 Minutes | 0 (0.0%) | 40 (7.5%) |
| 45 to 59 Minutes | 8 (1.6%) | 21 (4.0%) |
| 60 to 89 Minutes | 7 (1.4%) | 66 (12.4%) |
| 90 or more Minutes | 9 (1.8%) | 0 (0.0%) |
Time of Departure to Work by Sex in Spruce Pine
The most frequent times of departure to work in Spruce Pine are 6:30 AM to 6:59 AM (72, 14.2%) for males and 7:00 AM to 7:29 AM (117, 22.1%) for females.
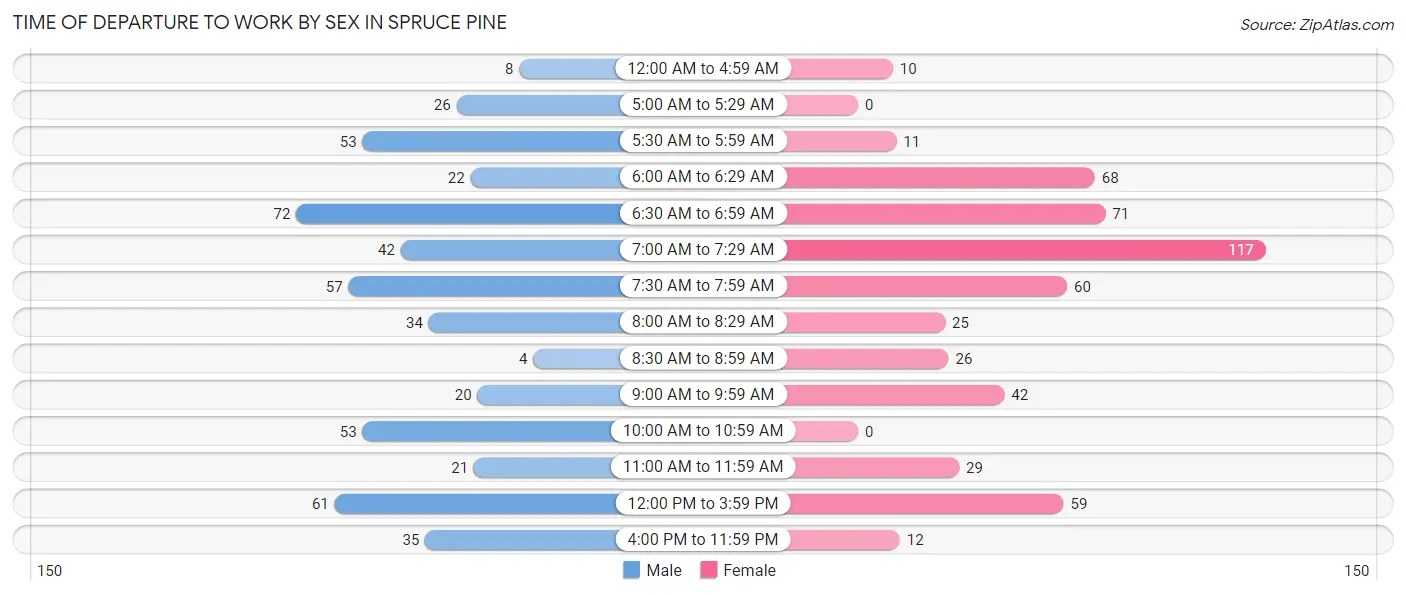
| Time of Departure | Male | Female |
| 12:00 AM to 4:59 AM | 8 (1.6%) | 10 (1.9%) |
| 5:00 AM to 5:29 AM | 26 (5.1%) | 0 (0.0%) |
| 5:30 AM to 5:59 AM | 53 (10.4%) | 11 (2.1%) |
| 6:00 AM to 6:29 AM | 22 (4.3%) | 68 (12.8%) |
| 6:30 AM to 6:59 AM | 72 (14.2%) | 71 (13.4%) |
| 7:00 AM to 7:29 AM | 42 (8.3%) | 117 (22.1%) |
| 7:30 AM to 7:59 AM | 57 (11.2%) | 60 (11.3%) |
| 8:00 AM to 8:29 AM | 34 (6.7%) | 25 (4.7%) |
| 8:30 AM to 8:59 AM | 4 (0.8%) | 26 (4.9%) |
| 9:00 AM to 9:59 AM | 20 (3.9%) | 42 (7.9%) |
| 10:00 AM to 10:59 AM | 53 (10.4%) | 0 (0.0%) |
| 11:00 AM to 11:59 AM | 21 (4.1%) | 29 (5.5%) |
| 12:00 PM to 3:59 PM | 61 (12.0%) | 59 (11.1%) |
| 4:00 PM to 11:59 PM | 35 (6.9%) | 12 (2.3%) |
| Total | 508 (100.0%) | 530 (100.0%) |
Housing Occupancy in Spruce Pine
Occupancy by Ownership in Spruce Pine
Of the total 1,141 dwellings in Spruce Pine, owner-occupied units account for 774 (67.8%), while renter-occupied units make up 367 (32.2%).
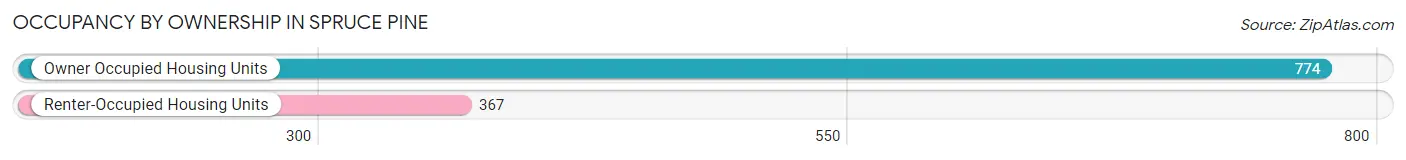
| Occupancy | # Housing Units | % Housing Units |
| Owner Occupied Housing Units | 774 | 67.8% |
| Renter-Occupied Housing Units | 367 | 32.2% |
| Total Occupied Housing Units | 1,141 | 100.0% |
Occupancy by Household Size in Spruce Pine
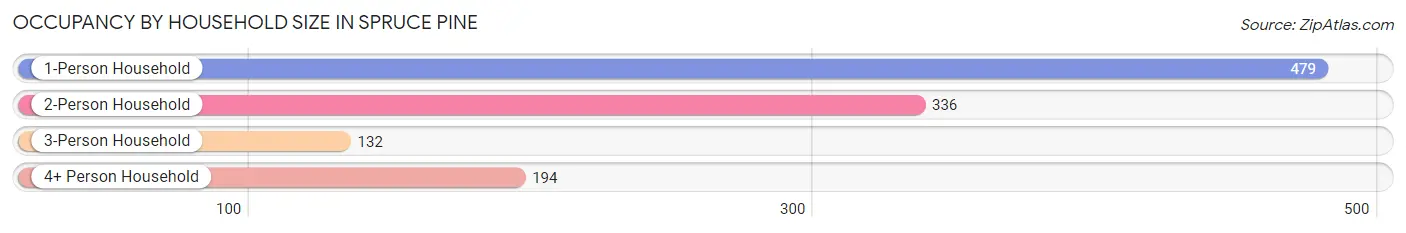
| Household Size | # Housing Units | % Housing Units |
| 1-Person Household | 479 | 42.0% |
| 2-Person Household | 336 | 29.4% |
| 3-Person Household | 132 | 11.6% |
| 4+ Person Household | 194 | 17.0% |
| Total Housing Units | 1,141 | 100.0% |
Occupancy by Ownership by Household Size in Spruce Pine
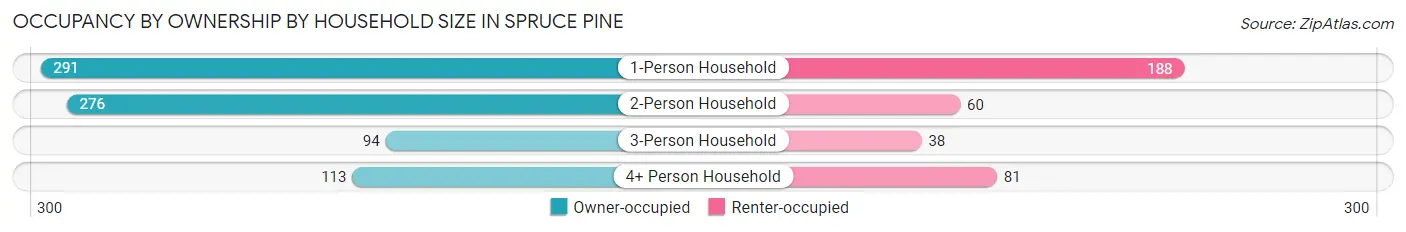
| Household Size | Owner-occupied | Renter-occupied |
| 1-Person Household | 291 (60.8%) | 188 (39.3%) |
| 2-Person Household | 276 (82.1%) | 60 (17.9%) |
| 3-Person Household | 94 (71.2%) | 38 (28.8%) |
| 4+ Person Household | 113 (58.3%) | 81 (41.7%) |
| Total Housing Units | 774 (67.8%) | 367 (32.2%) |
Occupancy by Educational Attainment in Spruce Pine
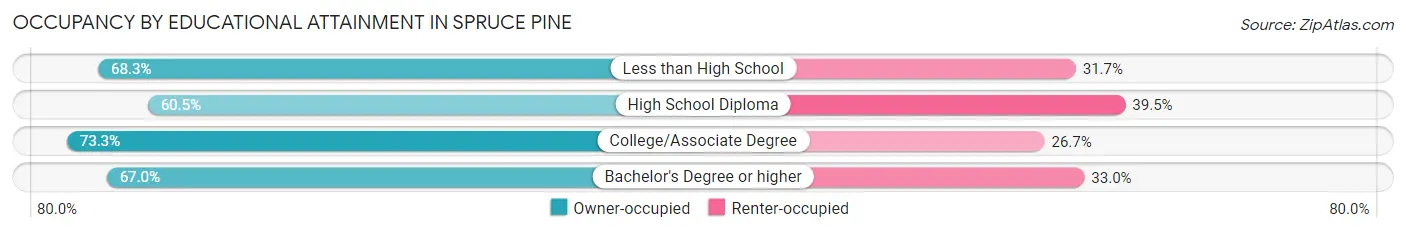
| Household Size | Owner-occupied | Renter-occupied |
| Less than High School | 136 (68.3%) | 63 (31.7%) |
| High School Diploma | 182 (60.5%) | 119 (39.5%) |
| College/Associate Degree | 310 (73.3%) | 113 (26.7%) |
| Bachelor's Degree or higher | 146 (67.0%) | 72 (33.0%) |
Occupancy by Age of Householder in Spruce Pine
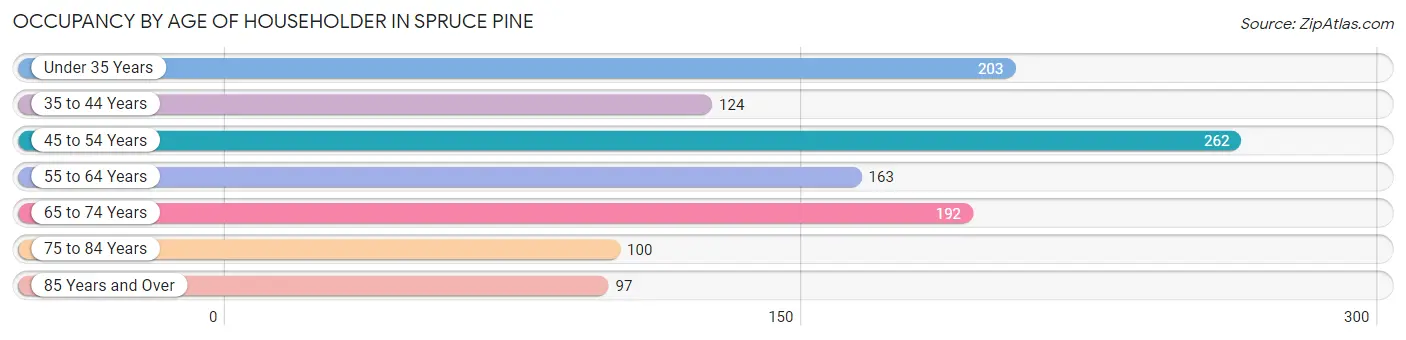
| Age Bracket | # Households | % Households |
| Under 35 Years | 203 | 17.8% |
| 35 to 44 Years | 124 | 10.9% |
| 45 to 54 Years | 262 | 23.0% |
| 55 to 64 Years | 163 | 14.3% |
| 65 to 74 Years | 192 | 16.8% |
| 75 to 84 Years | 100 | 8.8% |
| 85 Years and Over | 97 | 8.5% |
| Total | 1,141 | 100.0% |
Housing Finances in Spruce Pine
Median Income by Occupancy in Spruce Pine
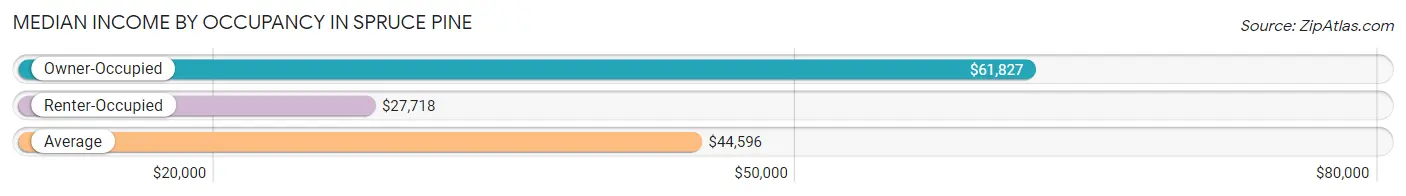
| Occupancy Type | # Households | Median Income |
| Owner-Occupied | 774 (67.8%) | $61,827 |
| Renter-Occupied | 367 (32.2%) | $27,718 |
| Average | 1,141 (100.0%) | $44,596 |
Occupancy by Householder Income Bracket in Spruce Pine
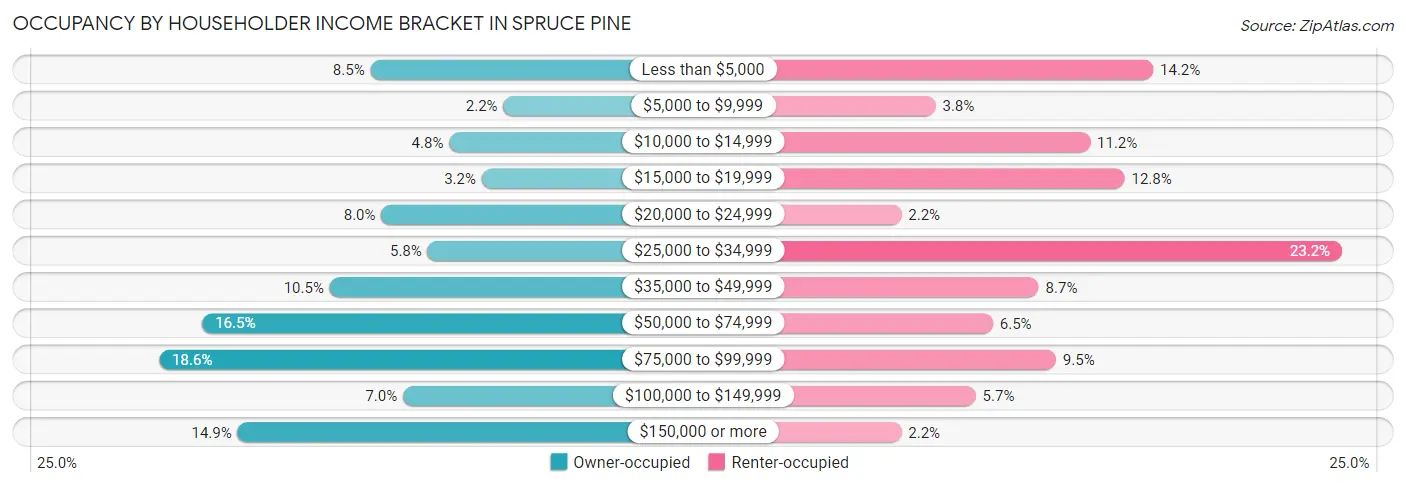
| Income Bracket | Owner-occupied | Renter-occupied |
| Less than $5,000 | 66 (8.5%) | 52 (14.2%) |
| $5,000 to $9,999 | 17 (2.2%) | 14 (3.8%) |
| $10,000 to $14,999 | 37 (4.8%) | 41 (11.2%) |
| $15,000 to $19,999 | 25 (3.2%) | 47 (12.8%) |
| $20,000 to $24,999 | 62 (8.0%) | 8 (2.2%) |
| $25,000 to $34,999 | 45 (5.8%) | 85 (23.2%) |
| $35,000 to $49,999 | 81 (10.5%) | 32 (8.7%) |
| $50,000 to $74,999 | 128 (16.5%) | 24 (6.5%) |
| $75,000 to $99,999 | 144 (18.6%) | 35 (9.5%) |
| $100,000 to $149,999 | 54 (7.0%) | 21 (5.7%) |
| $150,000 or more | 115 (14.9%) | 8 (2.2%) |
| Total | 774 (100.0%) | 367 (100.0%) |
Monthly Housing Cost Tiers in Spruce Pine
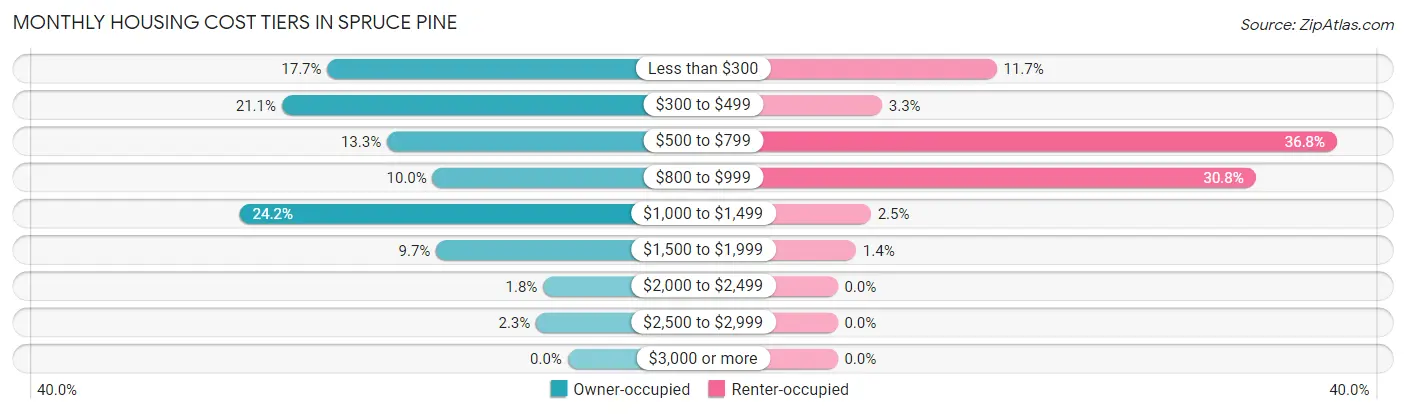
| Monthly Cost | Owner-occupied | Renter-occupied |
| Less than $300 | 137 (17.7%) | 43 (11.7%) |
| $300 to $499 | 163 (21.1%) | 12 (3.3%) |
| $500 to $799 | 103 (13.3%) | 135 (36.8%) |
| $800 to $999 | 77 (10.0%) | 113 (30.8%) |
| $1,000 to $1,499 | 187 (24.2%) | 9 (2.5%) |
| $1,500 to $1,999 | 75 (9.7%) | 5 (1.4%) |
| $2,000 to $2,499 | 14 (1.8%) | 0 (0.0%) |
| $2,500 to $2,999 | 18 (2.3%) | 0 (0.0%) |
| $3,000 or more | 0 (0.0%) | 0 (0.0%) |
| Total | 774 (100.0%) | 367 (100.0%) |
Physical Housing Characteristics in Spruce Pine
Housing Structures in Spruce Pine
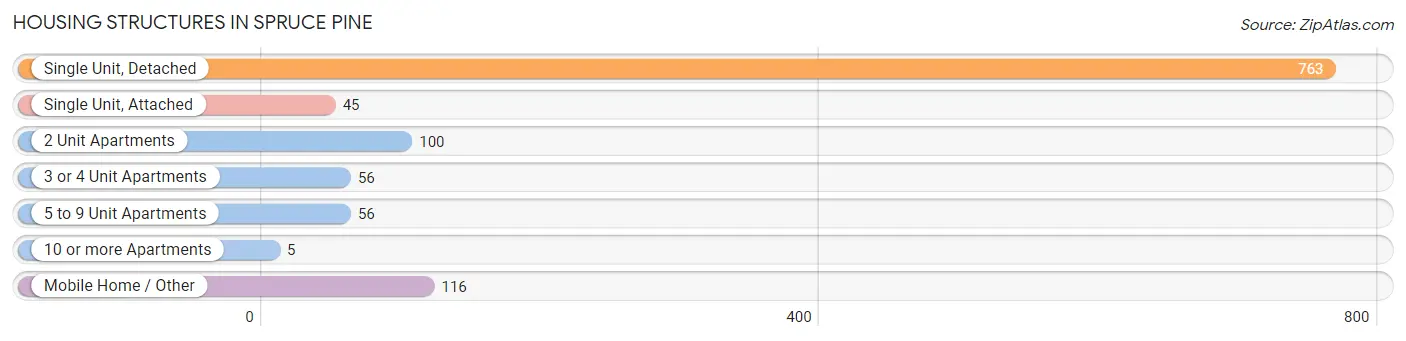
| Structure Type | # Housing Units | % Housing Units |
| Single Unit, Detached | 763 | 66.9% |
| Single Unit, Attached | 45 | 3.9% |
| 2 Unit Apartments | 100 | 8.8% |
| 3 or 4 Unit Apartments | 56 | 4.9% |
| 5 to 9 Unit Apartments | 56 | 4.9% |
| 10 or more Apartments | 5 | 0.4% |
| Mobile Home / Other | 116 | 10.2% |
| Total | 1,141 | 100.0% |
Housing Structures by Occupancy in Spruce Pine
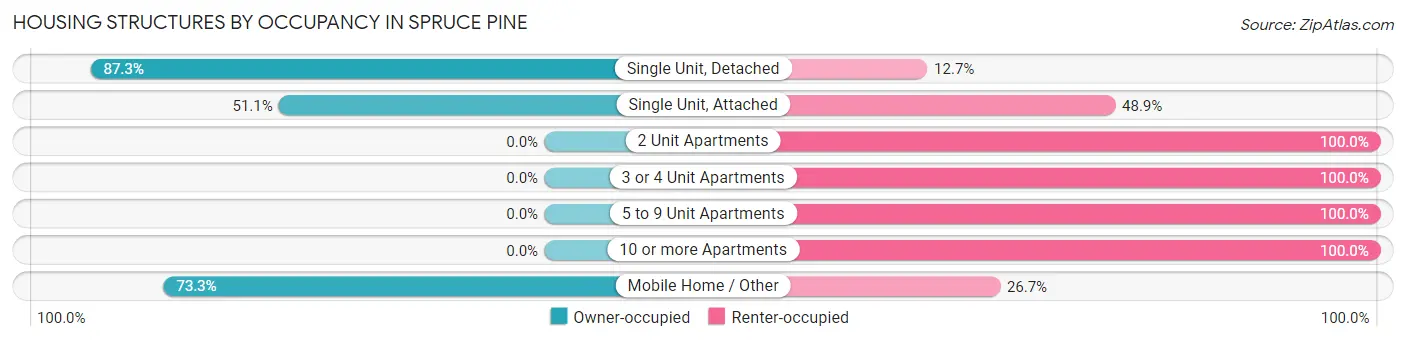
| Structure Type | Owner-occupied | Renter-occupied |
| Single Unit, Detached | 666 (87.3%) | 97 (12.7%) |
| Single Unit, Attached | 23 (51.1%) | 22 (48.9%) |
| 2 Unit Apartments | 0 (0.0%) | 100 (100.0%) |
| 3 or 4 Unit Apartments | 0 (0.0%) | 56 (100.0%) |
| 5 to 9 Unit Apartments | 0 (0.0%) | 56 (100.0%) |
| 10 or more Apartments | 0 (0.0%) | 5 (100.0%) |
| Mobile Home / Other | 85 (73.3%) | 31 (26.7%) |
| Total | 774 (67.8%) | 367 (32.2%) |
Housing Structures by Number of Rooms in Spruce Pine
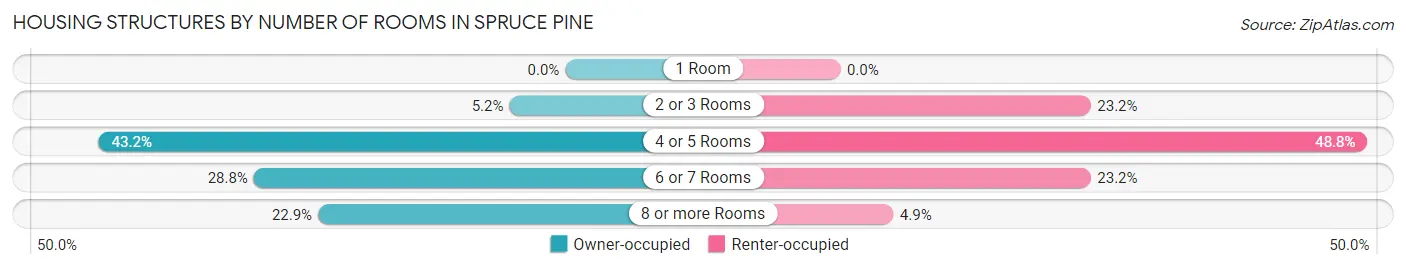
| Number of Rooms | Owner-occupied | Renter-occupied |
| 1 Room | 0 (0.0%) | 0 (0.0%) |
| 2 or 3 Rooms | 40 (5.2%) | 85 (23.2%) |
| 4 or 5 Rooms | 334 (43.1%) | 179 (48.8%) |
| 6 or 7 Rooms | 223 (28.8%) | 85 (23.2%) |
| 8 or more Rooms | 177 (22.9%) | 18 (4.9%) |
| Total | 774 (100.0%) | 367 (100.0%) |
Housing Structure by Heating Type in Spruce Pine
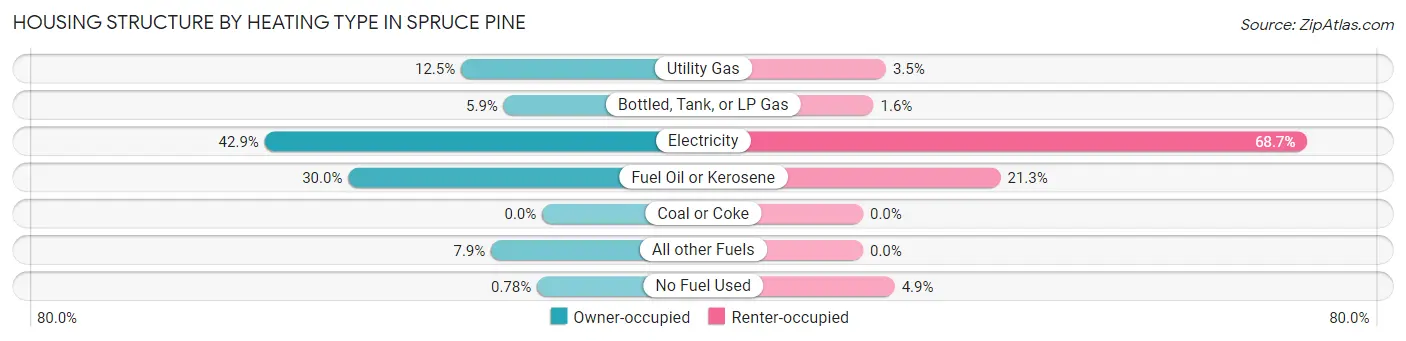
| Heating Type | Owner-occupied | Renter-occupied |
| Utility Gas | 97 (12.5%) | 13 (3.5%) |
| Bottled, Tank, or LP Gas | 46 (5.9%) | 6 (1.6%) |
| Electricity | 332 (42.9%) | 252 (68.7%) |
| Fuel Oil or Kerosene | 232 (30.0%) | 78 (21.2%) |
| Coal or Coke | 0 (0.0%) | 0 (0.0%) |
| All other Fuels | 61 (7.9%) | 0 (0.0%) |
| No Fuel Used | 6 (0.8%) | 18 (4.9%) |
| Total | 774 (100.0%) | 367 (100.0%) |
Household Vehicle Usage in Spruce Pine
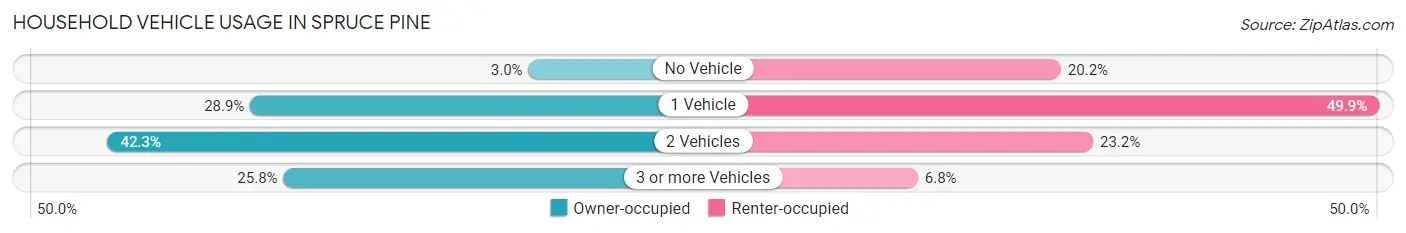
| Vehicles per Household | Owner-occupied | Renter-occupied |
| No Vehicle | 23 (3.0%) | 74 (20.2%) |
| 1 Vehicle | 224 (28.9%) | 183 (49.9%) |
| 2 Vehicles | 327 (42.2%) | 85 (23.2%) |
| 3 or more Vehicles | 200 (25.8%) | 25 (6.8%) |
| Total | 774 (100.0%) | 367 (100.0%) |
Real Estate & Mortgages in Spruce Pine
Real Estate and Mortgage Overview in Spruce Pine
| Characteristic | Without Mortgage | With Mortgage |
| Housing Units | 366 | 408 |
| Median Property Value | $120,800 | $212,200 |
| Median Household Income | $26,406 | $109 |
| Monthly Housing Costs | $343 | $0 |
| Real Estate Taxes | $904 | $21 |
Property Value by Mortgage Status in Spruce Pine
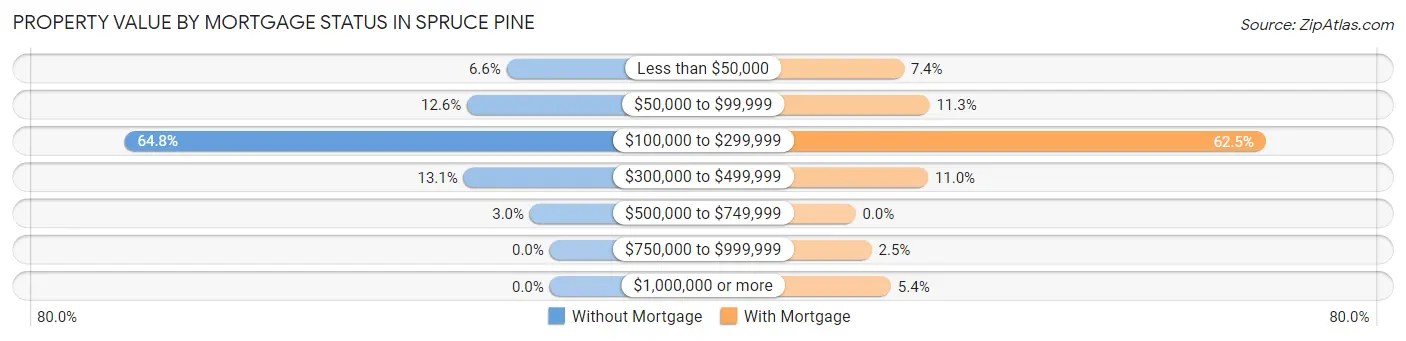
| Property Value | Without Mortgage | With Mortgage |
| Less than $50,000 | 24 (6.6%) | 30 (7.3%) |
| $50,000 to $99,999 | 46 (12.6%) | 46 (11.3%) |
| $100,000 to $299,999 | 237 (64.7%) | 255 (62.5%) |
| $300,000 to $499,999 | 48 (13.1%) | 45 (11.0%) |
| $500,000 to $749,999 | 11 (3.0%) | 0 (0.0%) |
| $750,000 to $999,999 | 0 (0.0%) | 10 (2.5%) |
| $1,000,000 or more | 0 (0.0%) | 22 (5.4%) |
| Total | 366 (100.0%) | 408 (100.0%) |
Household Income by Mortgage Status in Spruce Pine
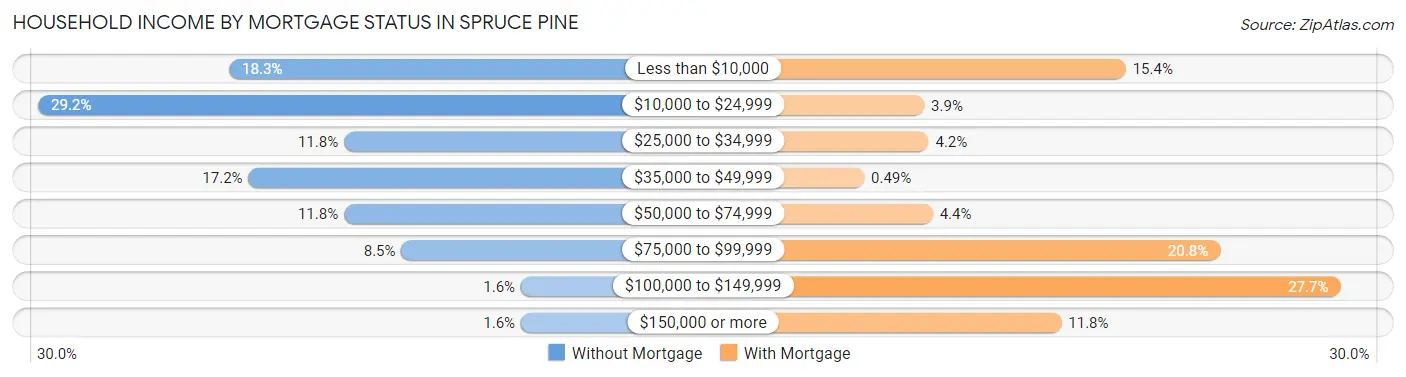
| Household Income | Without Mortgage | With Mortgage |
| Less than $10,000 | 67 (18.3%) | 63 (15.4%) |
| $10,000 to $24,999 | 107 (29.2%) | 16 (3.9%) |
| $25,000 to $34,999 | 43 (11.7%) | 17 (4.2%) |
| $35,000 to $49,999 | 63 (17.2%) | 2 (0.5%) |
| $50,000 to $74,999 | 43 (11.7%) | 18 (4.4%) |
| $75,000 to $99,999 | 31 (8.5%) | 85 (20.8%) |
| $100,000 to $149,999 | 6 (1.6%) | 113 (27.7%) |
| $150,000 or more | 6 (1.6%) | 48 (11.8%) |
| Total | 366 (100.0%) | 408 (100.0%) |
Property Value to Household Income Ratio in Spruce Pine
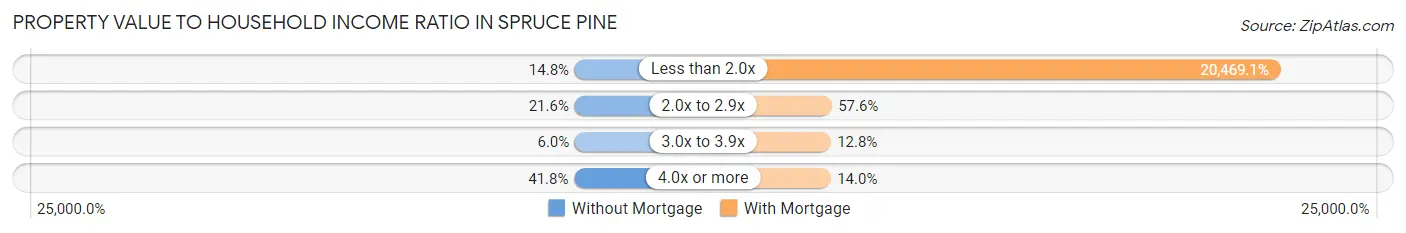
| Value-to-Income Ratio | Without Mortgage | With Mortgage |
| Less than 2.0x | 54 (14.7%) | 83,514 (20,469.1%) |
| 2.0x to 2.9x | 79 (21.6%) | 235 (57.6%) |
| 3.0x to 3.9x | 22 (6.0%) | 52 (12.8%) |
| 4.0x or more | 153 (41.8%) | 57 (14.0%) |
| Total | 366 (100.0%) | 408 (100.0%) |
Real Estate Taxes by Mortgage Status in Spruce Pine
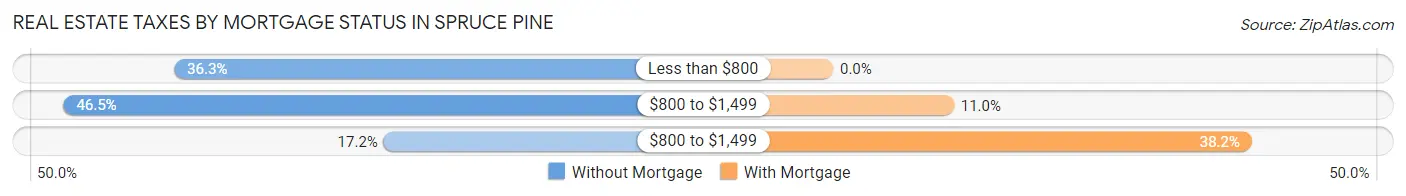
| Property Taxes | Without Mortgage | With Mortgage |
| Less than $800 | 133 (36.3%) | 0 (0.0%) |
| $800 to $1,499 | 170 (46.5%) | 45 (11.0%) |
| $800 to $1,499 | 63 (17.2%) | 156 (38.2%) |
| Total | 366 (100.0%) | 408 (100.0%) |
Health & Disability in Spruce Pine
Health Insurance Coverage by Age in Spruce Pine
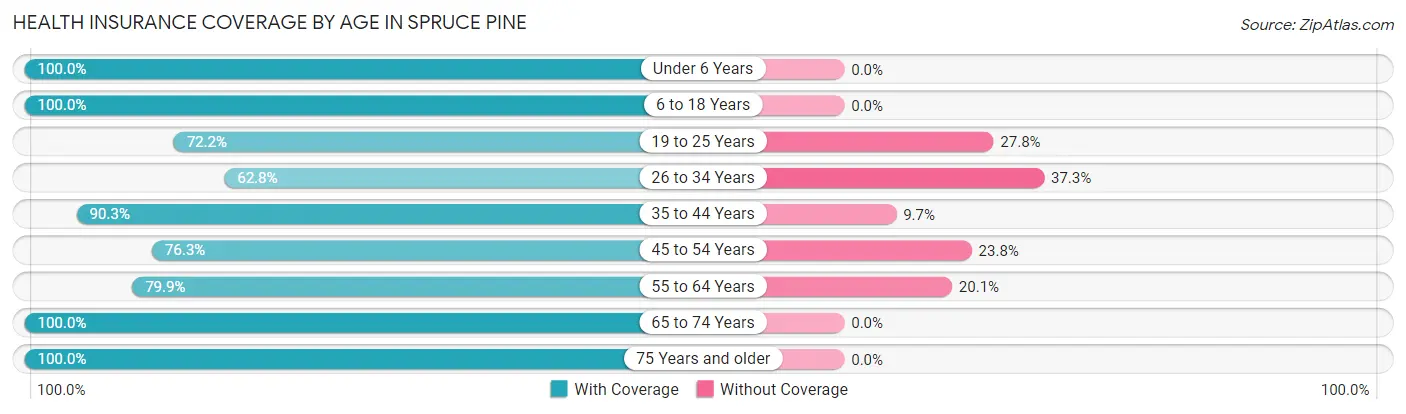
| Age Bracket | With Coverage | Without Coverage |
| Under 6 Years | 188 (100.0%) | 0 (0.0%) |
| 6 to 18 Years | 372 (100.0%) | 0 (0.0%) |
| 19 to 25 Years | 122 (72.2%) | 47 (27.8%) |
| 26 to 34 Years | 256 (62.7%) | 152 (37.2%) |
| 35 to 44 Years | 196 (90.3%) | 21 (9.7%) |
| 45 to 54 Years | 321 (76.2%) | 100 (23.7%) |
| 55 to 64 Years | 231 (79.9%) | 58 (20.1%) |
| 65 to 74 Years | 240 (100.0%) | 0 (0.0%) |
| 75 Years and older | 250 (100.0%) | 0 (0.0%) |
| Total | 2,176 (85.2%) | 378 (14.8%) |
Health Insurance Coverage by Citizenship Status in Spruce Pine
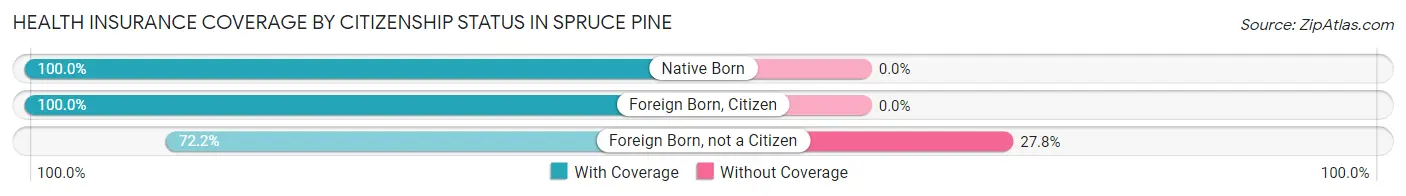
| Citizenship Status | With Coverage | Without Coverage |
| Native Born | 188 (100.0%) | 0 (0.0%) |
| Foreign Born, Citizen | 372 (100.0%) | 0 (0.0%) |
| Foreign Born, not a Citizen | 122 (72.2%) | 47 (27.8%) |
Health Insurance Coverage by Household Income in Spruce Pine
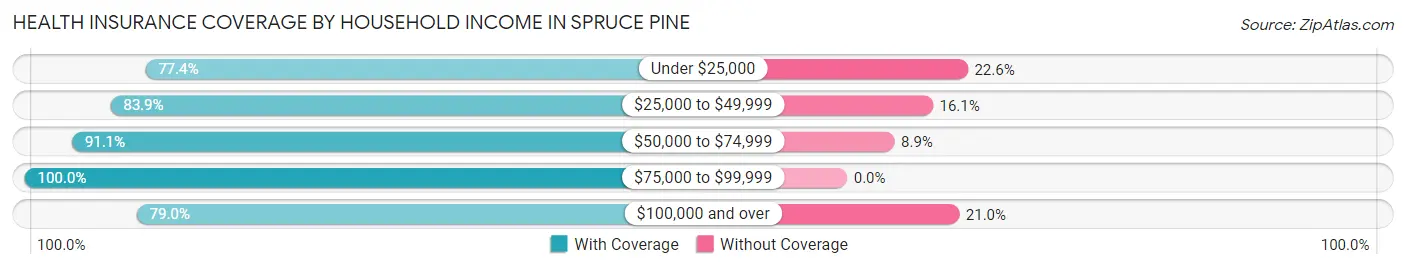
| Household Income | With Coverage | Without Coverage |
| Under $25,000 | 445 (77.4%) | 130 (22.6%) |
| $25,000 to $49,999 | 460 (83.9%) | 88 (16.1%) |
| $50,000 to $74,999 | 329 (91.1%) | 32 (8.9%) |
| $75,000 to $99,999 | 476 (100.0%) | 0 (0.0%) |
| $100,000 and over | 463 (79.0%) | 123 (21.0%) |
Public vs Private Health Insurance Coverage by Age in Spruce Pine
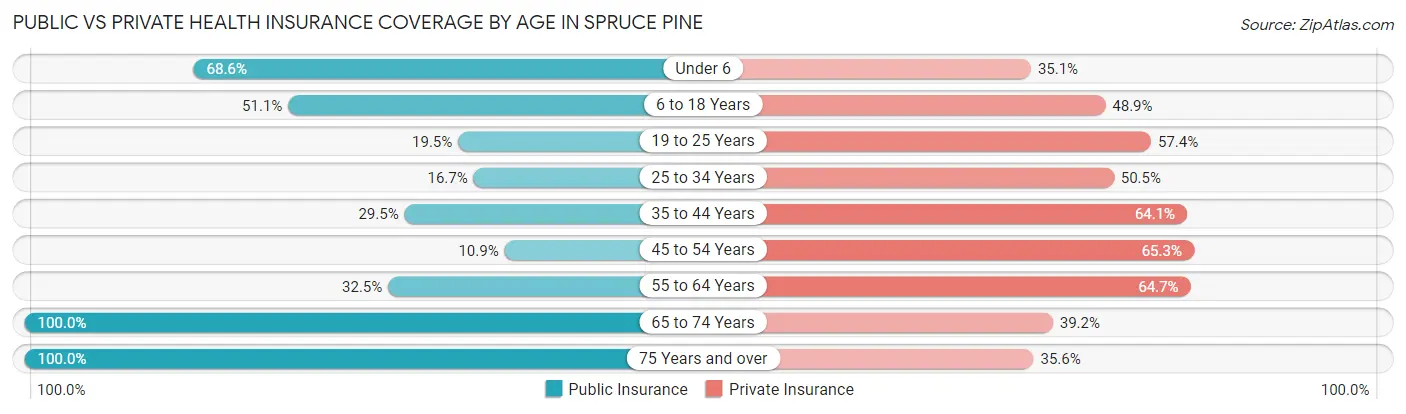
| Age Bracket | Public Insurance | Private Insurance |
| Under 6 | 129 (68.6%) | 66 (35.1%) |
| 6 to 18 Years | 190 (51.1%) | 182 (48.9%) |
| 19 to 25 Years | 33 (19.5%) | 97 (57.4%) |
| 25 to 34 Years | 68 (16.7%) | 206 (50.5%) |
| 35 to 44 Years | 64 (29.5%) | 139 (64.1%) |
| 45 to 54 Years | 46 (10.9%) | 275 (65.3%) |
| 55 to 64 Years | 94 (32.5%) | 187 (64.7%) |
| 65 to 74 Years | 240 (100.0%) | 94 (39.2%) |
| 75 Years and over | 250 (100.0%) | 89 (35.6%) |
| Total | 1,114 (43.6%) | 1,335 (52.3%) |
Disability Status by Sex by Age in Spruce Pine
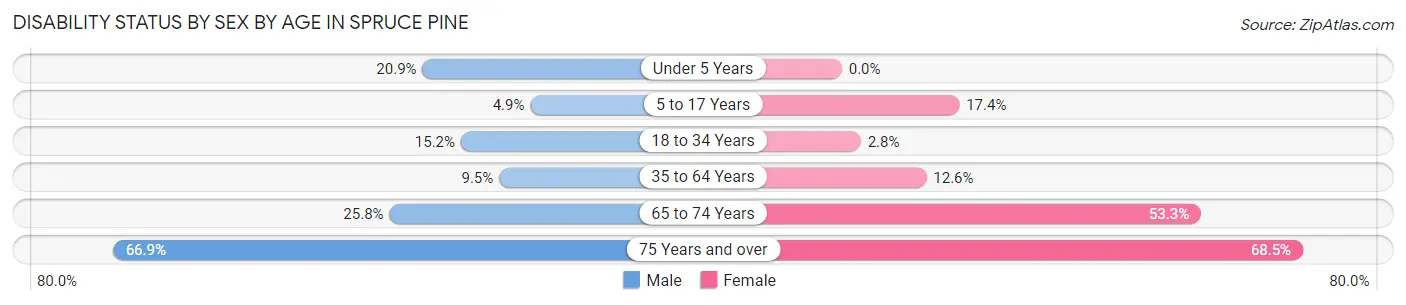
| Age Bracket | Male | Female |
| Under 5 Years | 18 (20.9%) | 0 (0.0%) |
| 5 to 17 Years | 8 (4.9%) | 34 (17.4%) |
| 18 to 34 Years | 51 (15.2%) | 8 (2.8%) |
| 35 to 64 Years | 33 (9.5%) | 73 (12.6%) |
| 65 to 74 Years | 31 (25.8%) | 64 (53.3%) |
| 75 Years and over | 93 (66.9%) | 76 (68.5%) |
Disability Class by Sex by Age in Spruce Pine
Disability Class: Hearing Difficulty
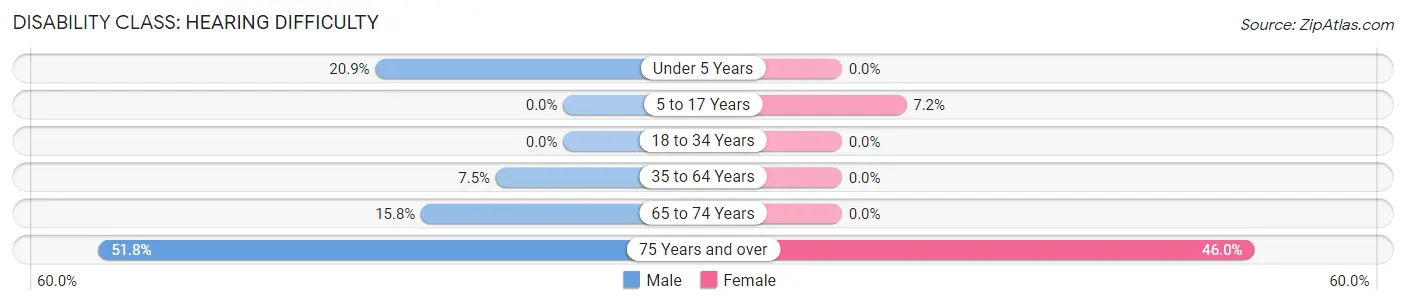
| Age Bracket | Male | Female |
| Under 5 Years | 18 (20.9%) | 0 (0.0%) |
| 5 to 17 Years | 0 (0.0%) | 14 (7.2%) |
| 18 to 34 Years | 0 (0.0%) | 0 (0.0%) |
| 35 to 64 Years | 26 (7.5%) | 0 (0.0%) |
| 65 to 74 Years | 19 (15.8%) | 0 (0.0%) |
| 75 Years and over | 72 (51.8%) | 51 (46.0%) |
Disability Class: Vision Difficulty
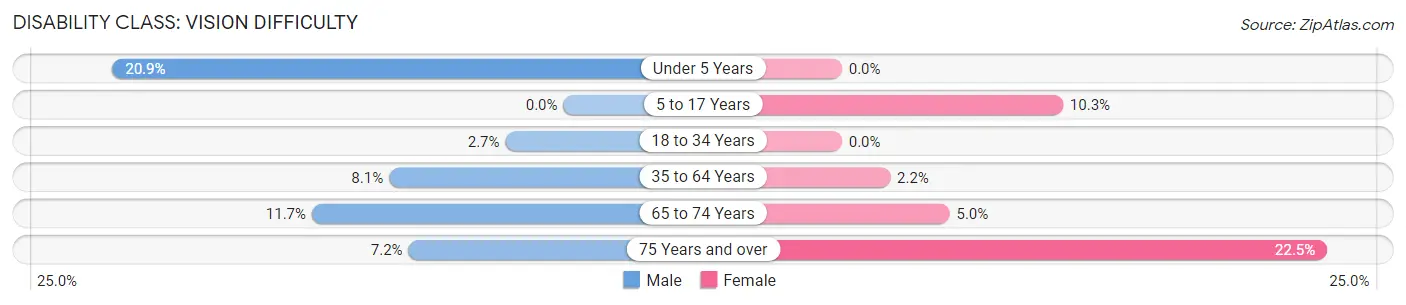
| Age Bracket | Male | Female |
| Under 5 Years | 18 (20.9%) | 0 (0.0%) |
| 5 to 17 Years | 0 (0.0%) | 20 (10.3%) |
| 18 to 34 Years | 9 (2.7%) | 0 (0.0%) |
| 35 to 64 Years | 28 (8.1%) | 13 (2.2%) |
| 65 to 74 Years | 14 (11.7%) | 6 (5.0%) |
| 75 Years and over | 10 (7.2%) | 25 (22.5%) |
Disability Class: Cognitive Difficulty
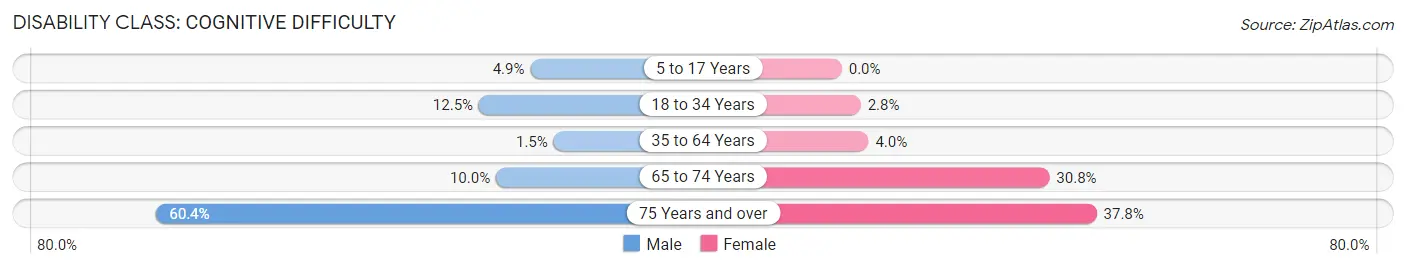
| Age Bracket | Male | Female |
| 5 to 17 Years | 8 (4.9%) | 0 (0.0%) |
| 18 to 34 Years | 42 (12.5%) | 8 (2.8%) |
| 35 to 64 Years | 5 (1.5%) | 23 (4.0%) |
| 65 to 74 Years | 12 (10.0%) | 37 (30.8%) |
| 75 Years and over | 84 (60.4%) | 42 (37.8%) |
Disability Class: Ambulatory Difficulty
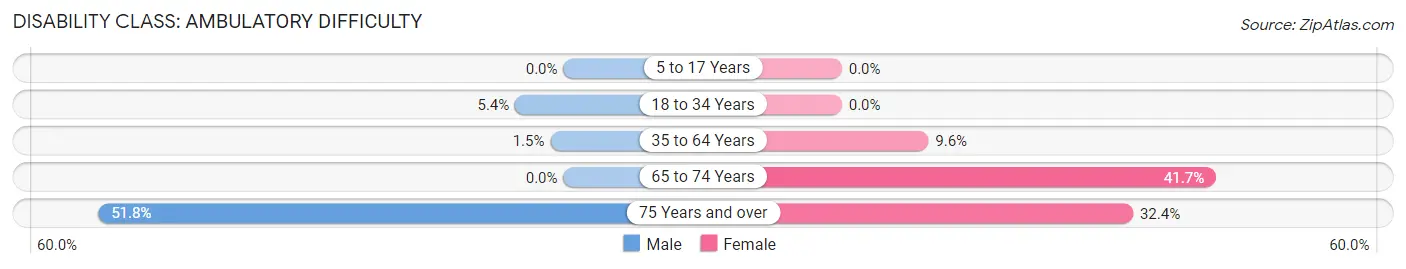
| Age Bracket | Male | Female |
| 5 to 17 Years | 0 (0.0%) | 0 (0.0%) |
| 18 to 34 Years | 18 (5.4%) | 0 (0.0%) |
| 35 to 64 Years | 5 (1.5%) | 56 (9.6%) |
| 65 to 74 Years | 0 (0.0%) | 50 (41.7%) |
| 75 Years and over | 72 (51.8%) | 36 (32.4%) |
Disability Class: Self-Care Difficulty
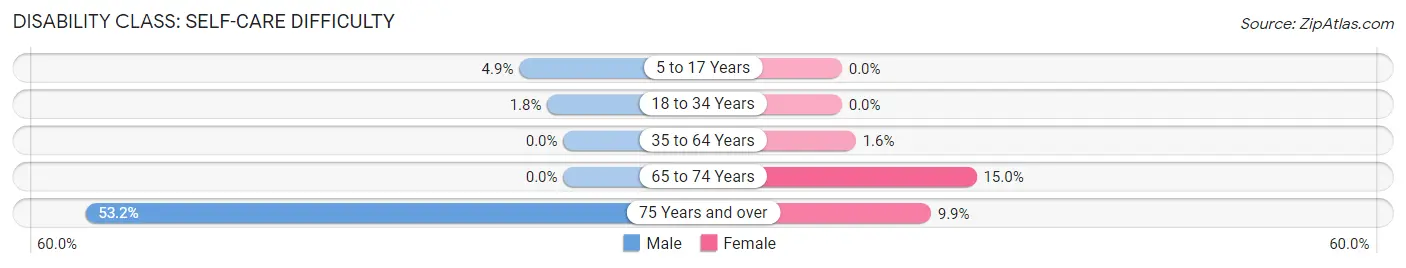
| Age Bracket | Male | Female |
| 5 to 17 Years | 8 (4.9%) | 0 (0.0%) |
| 18 to 34 Years | 6 (1.8%) | 0 (0.0%) |
| 35 to 64 Years | 0 (0.0%) | 9 (1.5%) |
| 65 to 74 Years | 0 (0.0%) | 18 (15.0%) |
| 75 Years and over | 74 (53.2%) | 11 (9.9%) |
Technology Access in Spruce Pine
Computing Device Access in Spruce Pine
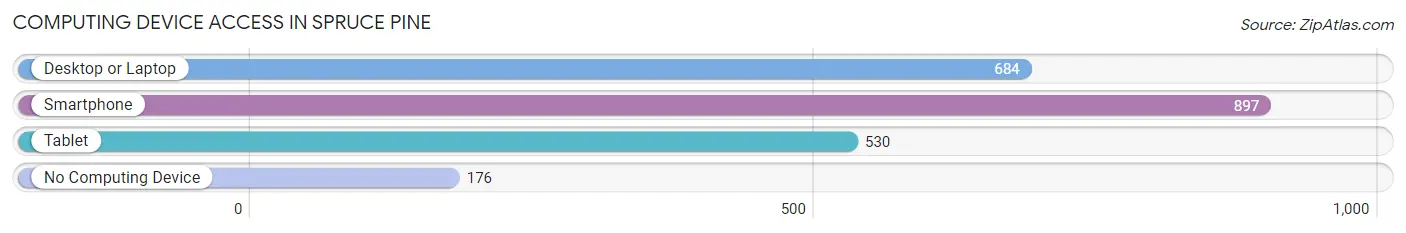
| Device Type | # Households | % Households |
| Desktop or Laptop | 684 | 60.0% |
| Smartphone | 897 | 78.6% |
| Tablet | 530 | 46.5% |
| No Computing Device | 176 | 15.4% |
| Total | 1,141 | 100.0% |
Internet Access in Spruce Pine
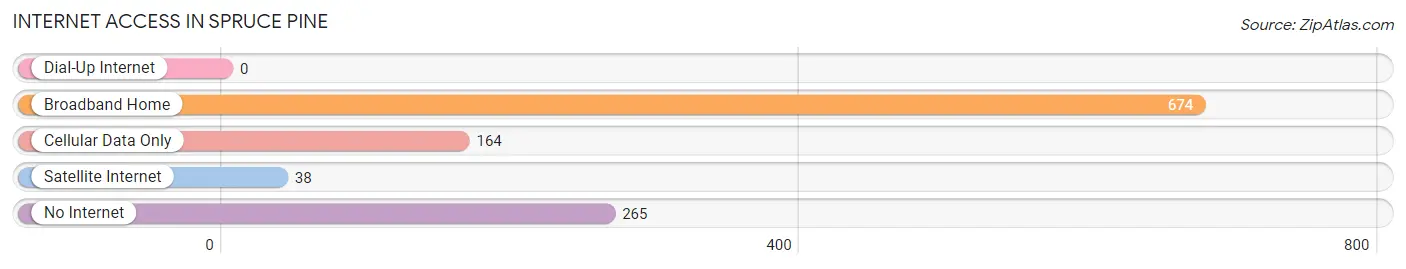
| Internet Type | # Households | % Households |
| Dial-Up Internet | 0 | 0.0% |
| Broadband Home | 674 | 59.1% |
| Cellular Data Only | 164 | 14.4% |
| Satellite Internet | 38 | 3.3% |
| No Internet | 265 | 23.2% |
| Total | 1,141 | 100.0% |
Spruce Pine Summary
Spruce Pine, North Carolina is a small town located in the Blue Ridge Mountains of western North Carolina. It is situated in Mitchell County, which is part of the Appalachian region of the United States. The town has a population of approximately 2,000 people and is the county seat of Mitchell County.
History
The area that is now Spruce Pine was first settled in the late 1700s by a group of settlers from the nearby town of Burnsville. The town was originally known as “Little Switzerland” due to its mountainous terrain. The town was officially incorporated in 1891 and was named after the abundance of spruce and pine trees in the area.
In the early 1900s, the town began to grow and develop as a center for the mining industry. The town was home to several large mining companies, including the Spruce Pine Mining Company, which was founded in 1906. The company was responsible for the development of the town’s infrastructure, including the construction of a railroad line and a power plant.
The town continued to grow and develop throughout the 20th century. In the 1950s, the town was home to several large manufacturing companies, including the Spruce Pine Manufacturing Company, which produced furniture and other wood products. The town also became a popular tourist destination, with many visitors coming to enjoy the scenic beauty of the Blue Ridge Mountains.
Geography
Spruce Pine is located in the Blue Ridge Mountains of western North Carolina. The town is situated in Mitchell County, which is part of the Appalachian region of the United States. The town is located at an elevation of 2,400 feet and is surrounded by the Pisgah National Forest. The town is located approximately 30 miles northeast of Asheville and is accessible via US Highway 19.
The town is situated in a valley surrounded by the Blue Ridge Mountains. The town is located at the confluence of the North Toe River and the South Toe River. The town is also home to several small lakes, including Lake Mitchell and Lake Rhodhiss.
Economy
The economy of Spruce Pine is largely based on the mining industry. The town is home to several large mining companies, including the Spruce Pine Mining Company, which was founded in 1906. The company is responsible for the development of the town’s infrastructure, including the construction of a railroad line and a power plant.
The town is also home to several manufacturing companies, including the Spruce Pine Manufacturing Company, which produces furniture and other wood products. The town is also home to several small businesses, including restaurants, shops, and other services.
Demographics
As of the 2010 census, the population of Spruce Pine was 2,078. The racial makeup of the town was 95.3% White, 0.7% African American, 0.3% Native American, 0.2% Asian, 0.1% Pacific Islander, and 3.4% from other races. The median household income in the town was $30,938.
Conclusion
Spruce Pine, North Carolina is a small town located in the Blue Ridge Mountains of western North Carolina. The town has a population of approximately 2,000 people and is the county seat of Mitchell County. The town is home to several large mining companies, as well as several manufacturing companies and small businesses. The town is also a popular tourist destination, with many visitors coming to enjoy the scenic beauty of the Blue Ridge Mountains.
Common Questions
What is Per Capita Income in Spruce Pine?
Per Capita income in Spruce Pine is $27,056.
What is the Median Family Income in Spruce Pine?
Median Family Income in Spruce Pine is $71,806.
What is the Median Household income in Spruce Pine?
Median Household Income in Spruce Pine is $44,596.
What is Income or Wage Gap in Spruce Pine?
Income or Wage Gap in Spruce Pine is 15.3%.
Women in Spruce Pine earn 84.7 cents for every dollar earned by a man.
What is Inequality or Gini Index in Spruce Pine?
Inequality or Gini Index in Spruce Pine is 0.56.
What is the Total Population of Spruce Pine?
Total Population of Spruce Pine is 2,637.
What is the Total Male Population of Spruce Pine?
Total Male Population of Spruce Pine is 1,207.
What is the Total Female Population of Spruce Pine?
Total Female Population of Spruce Pine is 1,430.
What is the Ratio of Males per 100 Females in Spruce Pine?
There are 84.41 Males per 100 Females in Spruce Pine.
What is the Ratio of Females per 100 Males in Spruce Pine?
There are 118.48 Females per 100 Males in Spruce Pine.
What is the Median Population Age in Spruce Pine?
Median Population Age in Spruce Pine is 42.9 Years.
What is the Average Family Size in Spruce Pine
Average Family Size in Spruce Pine is 3.1 People.
What is the Average Household Size in Spruce Pine
Average Household Size in Spruce Pine is 2.2 People.
How Large is the Labor Force in Spruce Pine?
There are 1,119 People in the Labor Forcein in Spruce Pine.
What is the Percentage of People in the Labor Force in Spruce Pine?
51.3% of People are in the Labor Force in Spruce Pine.
What is the Unemployment Rate in Spruce Pine?
Unemployment Rate in Spruce Pine is 1.8%.