Wilmore, KY Map & Demographics
Wilmore Map
Wilmore Overview
$26,244
PER CAPITA INCOME
$73,750
AVG FAMILY INCOME
$59,848
AVG HOUSEHOLD INCOME
2.5%
WAGE / INCOME GAP [ % ]
97.5¢/ $1
WAGE / INCOME GAP [ $ ]
0.38
INEQUALITY / GINI INDEX
6,017
TOTAL POPULATION
2,803
MALE POPULATION
3,214
FEMALE POPULATION
87.21
MALES / 100 FEMALES
114.66
FEMALES / 100 MALES
29.1
MEDIAN AGE
2.9
AVG FAMILY SIZE
2.6
AVG HOUSEHOLD SIZE
3,292
LABOR FORCE [ PEOPLE ]
66.6%
PERCENT IN LABOR FORCE
2.1%
UNEMPLOYMENT RATE
Wilmore Zip Codes
Wilmore Area Codes
Income in Wilmore
Income Overview in Wilmore
Per Capita Income in Wilmore is $26,244, while median incomes of families and households are $73,750 and $59,848 respectively.
| Characteristic | Number | Measure |
| Per Capita Income | 6,017 | $26,244 |
| Median Family Income | 1,169 | $73,750 |
| Mean Family Income | 1,169 | $83,359 |
| Median Household Income | 1,835 | $59,848 |
| Mean Household Income | 1,835 | $75,425 |
| Income Deficit | 1,169 | $0 |
| Wage / Income Gap (%) | 6,017 | 2.53% |
| Wage / Income Gap ($) | 6,017 | 97.47¢ per $1 |
| Gini / Inequality Index | 6,017 | 0.38 |
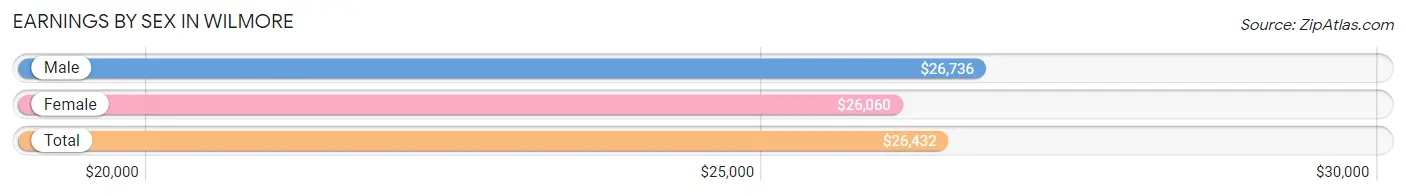
Earnings by Sex in Wilmore
Average Earnings in Wilmore are $26,432, $26,736 for men and $26,060 for women, a difference of 2.5%.
| Sex | Number | Average Earnings |
| Male | 1,611 (45.9%) | $26,736 |
| Female | 1,903 (54.1%) | $26,060 |
| Total | 3,514 (100.0%) | $26,432 |
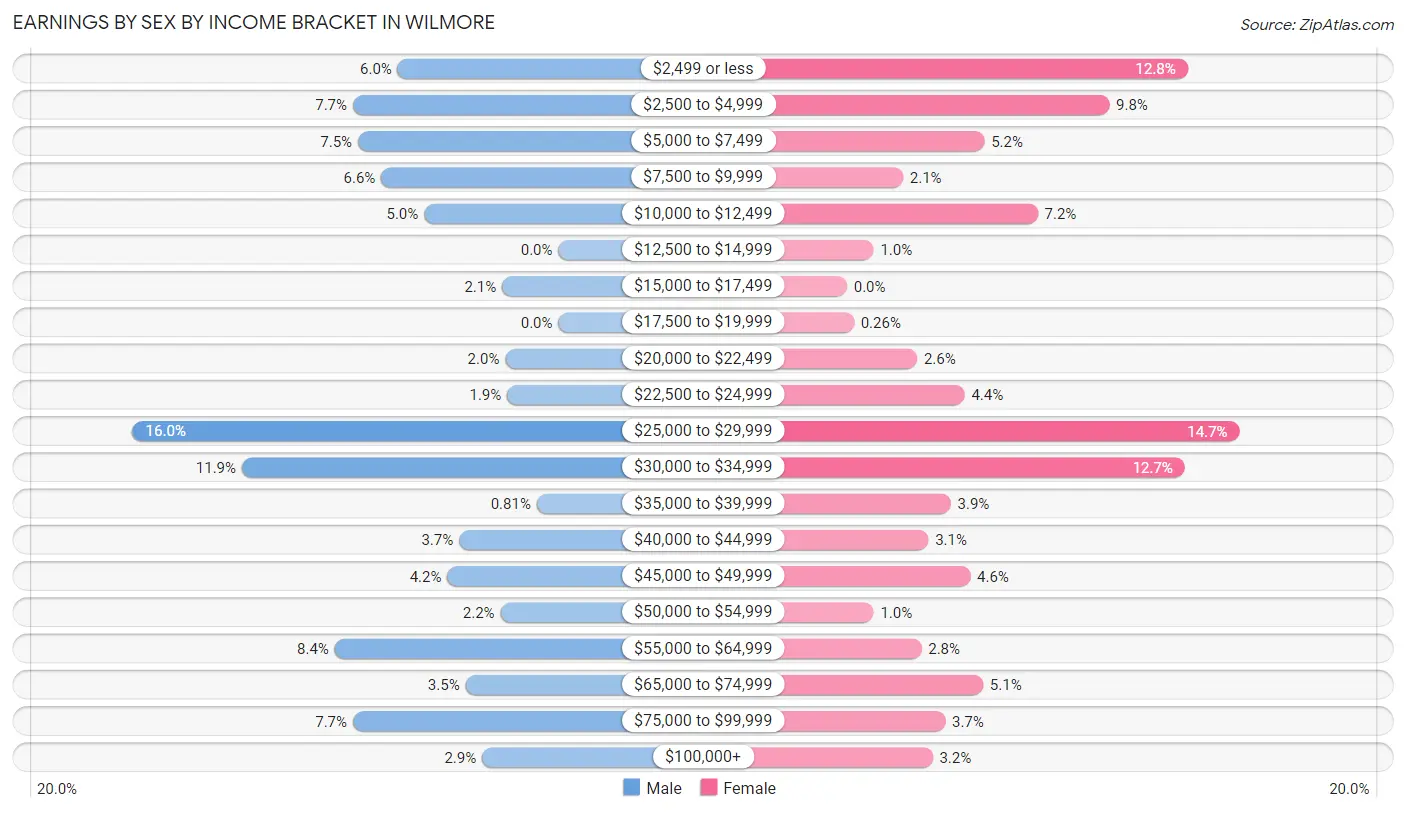
Earnings by Sex by Income Bracket in Wilmore
The most common earnings brackets in Wilmore are $25,000 to $29,999 for men (257 | 16.0%) and $25,000 to $29,999 for women (280 | 14.7%).
| Income | Male | Female |
| $2,499 or less | 97 (6.0%) | 243 (12.8%) |
| $2,500 to $4,999 | 124 (7.7%) | 187 (9.8%) |
| $5,000 to $7,499 | 121 (7.5%) | 98 (5.1%) |
| $7,500 to $9,999 | 107 (6.6%) | 40 (2.1%) |
| $10,000 to $12,499 | 81 (5.0%) | 136 (7.1%) |
| $12,500 to $14,999 | 0 (0.0%) | 19 (1.0%) |
| $15,000 to $17,499 | 34 (2.1%) | 0 (0.0%) |
| $17,500 to $19,999 | 0 (0.0%) | 5 (0.3%) |
| $20,000 to $22,499 | 32 (2.0%) | 50 (2.6%) |
| $22,500 to $24,999 | 31 (1.9%) | 84 (4.4%) |
| $25,000 to $29,999 | 257 (16.0%) | 280 (14.7%) |
| $30,000 to $34,999 | 191 (11.9%) | 241 (12.7%) |
| $35,000 to $39,999 | 13 (0.8%) | 74 (3.9%) |
| $40,000 to $44,999 | 60 (3.7%) | 58 (3.0%) |
| $45,000 to $49,999 | 67 (4.2%) | 88 (4.6%) |
| $50,000 to $54,999 | 35 (2.2%) | 19 (1.0%) |
| $55,000 to $64,999 | 135 (8.4%) | 53 (2.8%) |
| $65,000 to $74,999 | 56 (3.5%) | 97 (5.1%) |
| $75,000 to $99,999 | 124 (7.7%) | 70 (3.7%) |
| $100,000+ | 46 (2.9%) | 61 (3.2%) |
| Total | 1,611 (100.0%) | 1,903 (100.0%) |
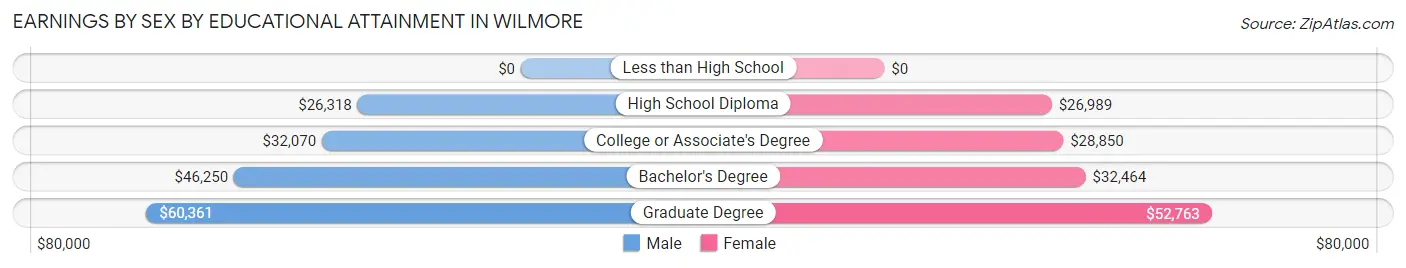
Earnings by Sex by Educational Attainment in Wilmore
Average earnings in Wilmore are $31,800 for men and $30,762 for women, a difference of 3.3%. Men with an educational attainment of graduate degree enjoy the highest average annual earnings of $60,361, while those with high school diploma education earn the least with $26,318. Women with an educational attainment of graduate degree earn the most with the average annual earnings of $52,763, while those with high school diploma education have the smallest earnings of $26,989.
| Educational Attainment | Male Income | Female Income |
| Less than High School | - | - |
| High School Diploma | $26,318 | $26,989 |
| College or Associate's Degree | $32,070 | $28,850 |
| Bachelor's Degree | $46,250 | $32,464 |
| Graduate Degree | $60,361 | $52,763 |
| Total | $31,800 | $30,762 |
Family Income in Wilmore
Family Income Brackets in Wilmore
According to the Wilmore family income data, there are 302 families falling into the $100,000 to $149,999 income range, which is the most common income bracket and makes up 25.8% of all families. Conversely, the $15,000 to $24,999 income bracket is the least frequent group with only 32 families (2.7%) belonging to this category.
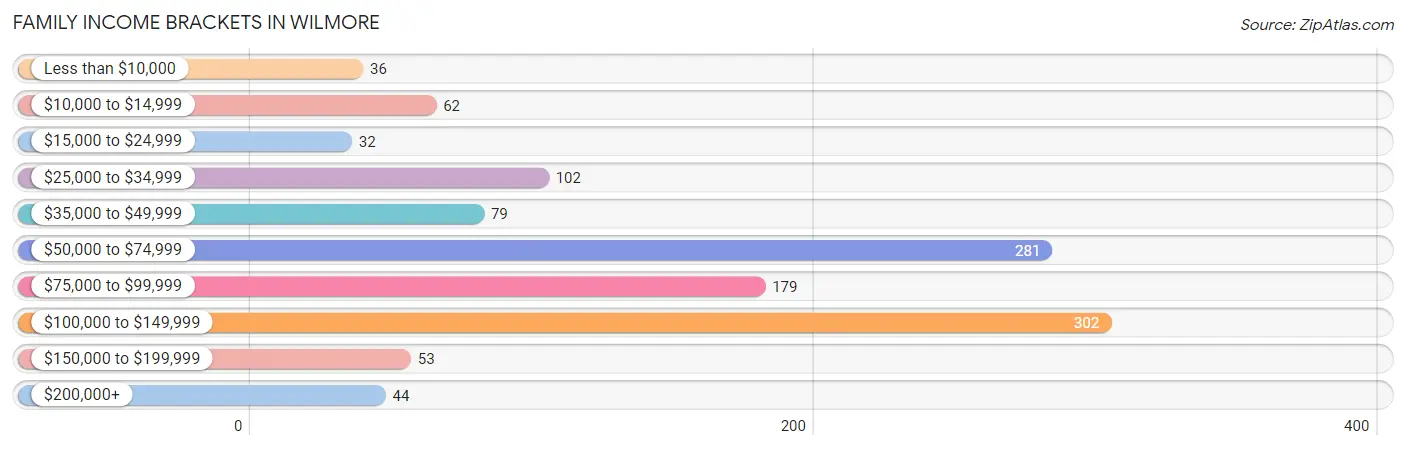
| Income Bracket | # Families | % Families |
| Less than $10,000 | 36 | 3.1% |
| $10,000 to $14,999 | 62 | 5.3% |
| $15,000 to $24,999 | 32 | 2.7% |
| $25,000 to $34,999 | 102 | 8.7% |
| $35,000 to $49,999 | 79 | 6.8% |
| $50,000 to $74,999 | 281 | 24.0% |
| $75,000 to $99,999 | 179 | 15.3% |
| $100,000 to $149,999 | 302 | 25.8% |
| $150,000 to $199,999 | 53 | 4.5% |
| $200,000+ | 44 | 3.8% |
Family Income by Famaliy Size in Wilmore
5-person families (87 | 7.4%) account for the highest median family income in Wilmore with $113,403 per family, while 2-person families (701 | 60.0%) have the highest median income of $35,912 per family member.
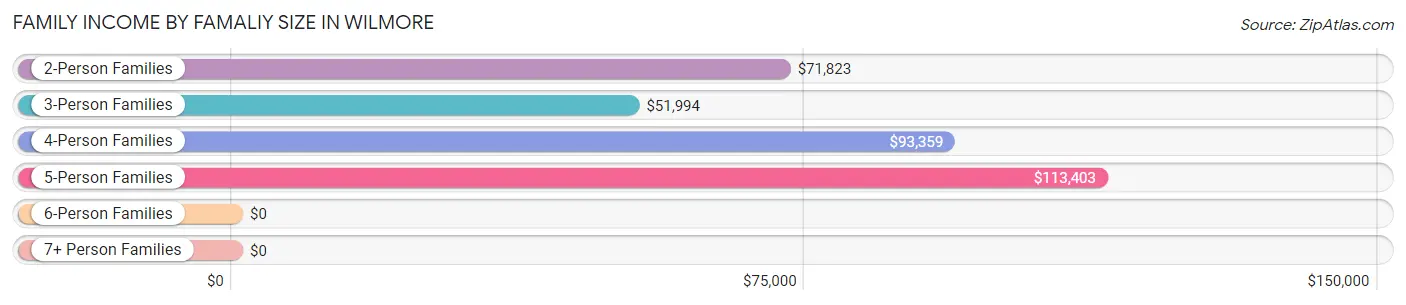
| Income Bracket | # Families | Median Income |
| 2-Person Families | 701 (60.0%) | $71,823 |
| 3-Person Families | 242 (20.7%) | $51,994 |
| 4-Person Families | 107 (9.1%) | $93,359 |
| 5-Person Families | 87 (7.4%) | $113,403 |
| 6-Person Families | 26 (2.2%) | $0 |
| 7+ Person Families | 6 (0.5%) | $0 |
| Total | 1,169 (100.0%) | $73,750 |
Family Income by Number of Earners in Wilmore
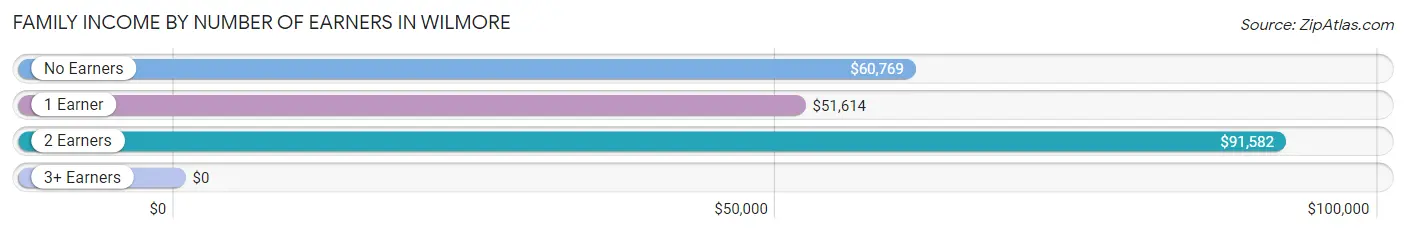
| Number of Earners | # Families | Median Income |
| No Earners | 214 (18.3%) | $60,769 |
| 1 Earner | 400 (34.2%) | $51,614 |
| 2 Earners | 533 (45.6%) | $91,582 |
| 3+ Earners | 22 (1.9%) | $0 |
| Total | 1,169 (100.0%) | $73,750 |
Household Income in Wilmore
Household Income Brackets in Wilmore
With 358 households falling in the category, the $100,000 to $149,999 income range is the most frequent in Wilmore, accounting for 19.5% of all households. In contrast, only 44 households (2.4%) fall into the $200,000+ income bracket, making it the least populous group.
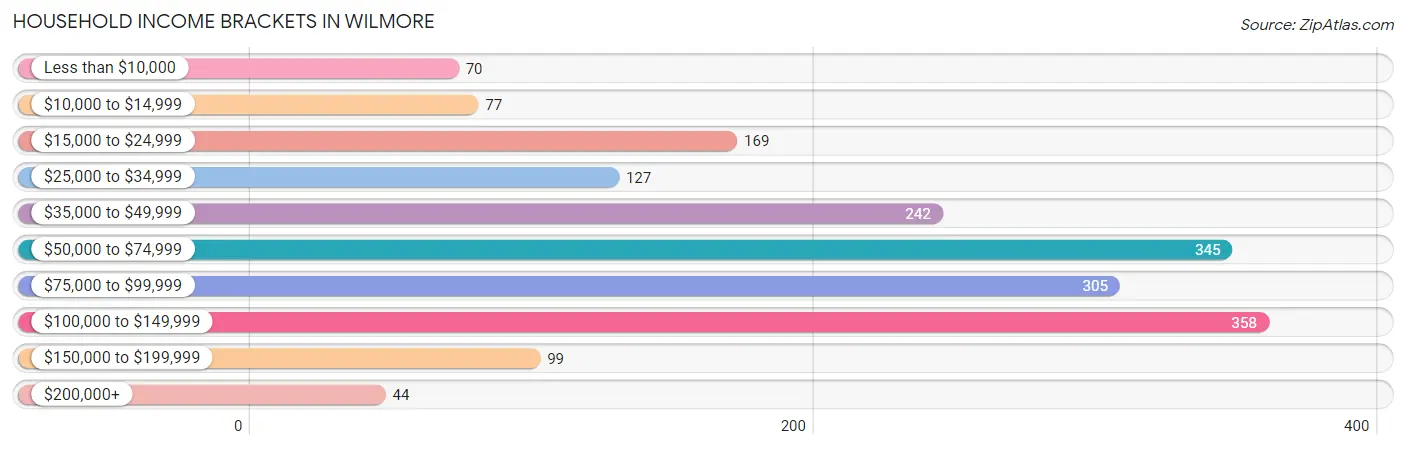
| Income Bracket | # Households | % Households |
| Less than $10,000 | 70 | 3.8% |
| $10,000 to $14,999 | 77 | 4.2% |
| $15,000 to $24,999 | 169 | 9.2% |
| $25,000 to $34,999 | 127 | 6.9% |
| $35,000 to $49,999 | 242 | 13.2% |
| $50,000 to $74,999 | 345 | 18.8% |
| $75,000 to $99,999 | 305 | 16.6% |
| $100,000 to $149,999 | 358 | 19.5% |
| $150,000 to $199,999 | 99 | 5.4% |
| $200,000+ | 44 | 2.4% |
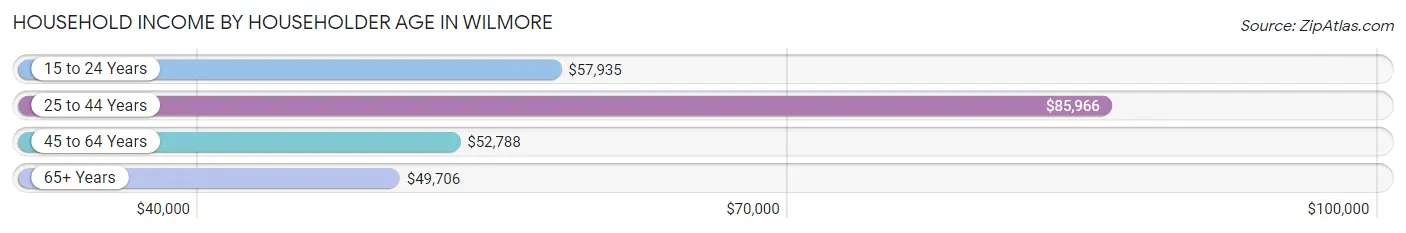
Household Income by Householder Age in Wilmore
The median household income in Wilmore is $59,848, with the highest median household income of $85,966 found in the 25 to 44 years age bracket for the primary householder. A total of 790 households (43.0%) fall into this category. Meanwhile, the 65+ years age bracket for the primary householder has the lowest median household income of $49,706, with 558 households (30.4%) in this group.
| Income Bracket | # Households | Median Income |
| 15 to 24 Years | 78 (4.3%) | $57,935 |
| 25 to 44 Years | 790 (43.0%) | $85,966 |
| 45 to 64 Years | 409 (22.3%) | $52,788 |
| 65+ Years | 558 (30.4%) | $49,706 |
| Total | 1,835 (100.0%) | $59,848 |
Poverty in Wilmore
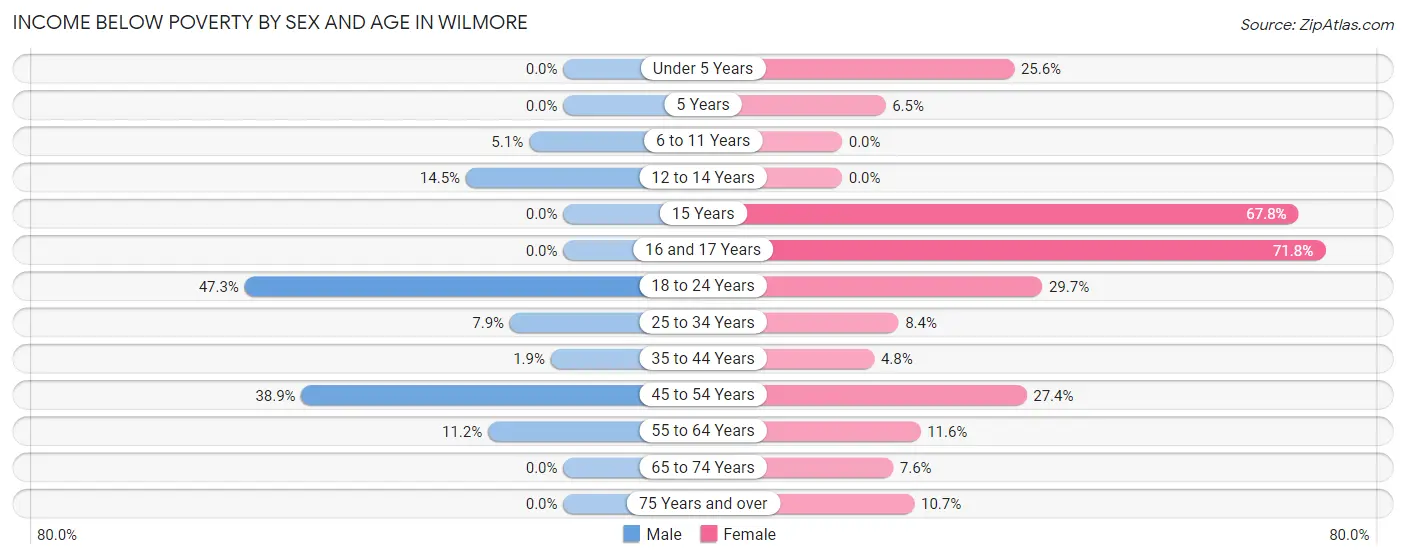
Income Below Poverty by Sex and Age in Wilmore
With 9.0% poverty level for males and 15.0% for females among the residents of Wilmore, 18 to 24 year old males and 16 and 17 year old females are the most vulnerable to poverty, with 53 males (47.3%) and 61 females (71.8%) in their respective age groups living below the poverty level.
| Age Bracket | Male | Female |
| Under 5 Years | 0 (0.0%) | 34 (25.6%) |
| 5 Years | 0 (0.0%) | 4 (6.5%) |
| 6 to 11 Years | 5 (5.1%) | 0 (0.0%) |
| 12 to 14 Years | 11 (14.5%) | 0 (0.0%) |
| 15 Years | 0 (0.0%) | 40 (67.8%) |
| 16 and 17 Years | 0 (0.0%) | 61 (71.8%) |
| 18 to 24 Years | 53 (47.3%) | 66 (29.7%) |
| 25 to 34 Years | 55 (7.9%) | 59 (8.4%) |
| 35 to 44 Years | 4 (1.9%) | 10 (4.8%) |
| 45 to 54 Years | 49 (38.9%) | 57 (27.4%) |
| 55 to 64 Years | 18 (11.2%) | 27 (11.6%) |
| 65 to 74 Years | 0 (0.0%) | 16 (7.6%) |
| 75 Years and over | 0 (0.0%) | 25 (10.7%) |
| Total | 195 (9.0%) | 399 (15.0%) |
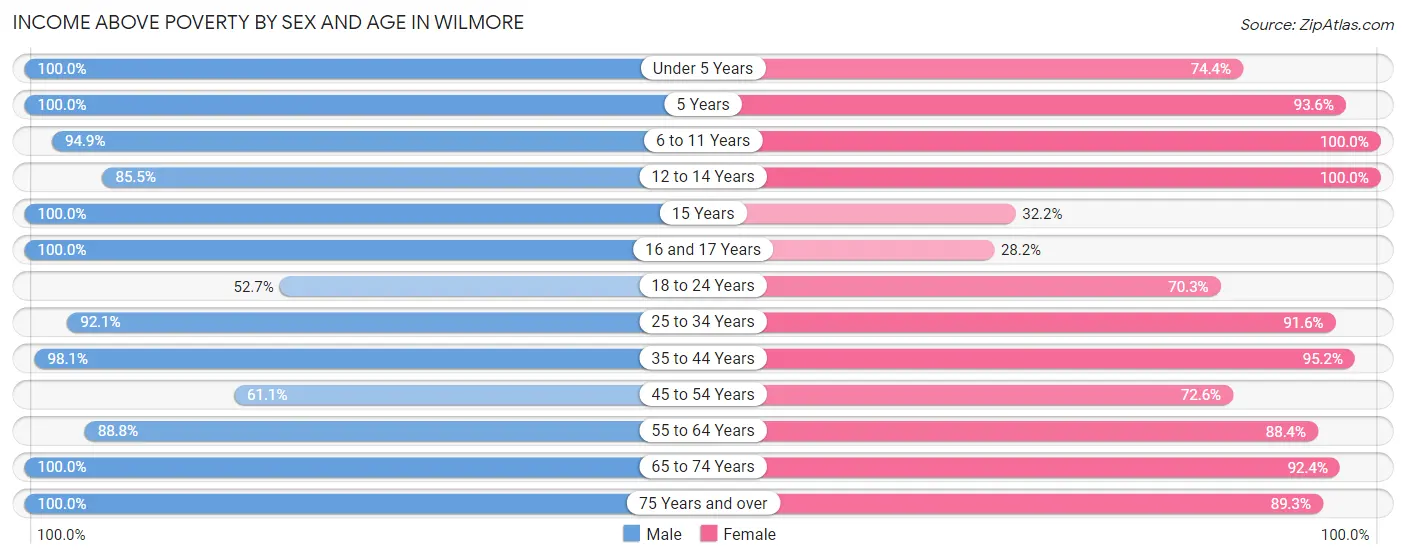
Income Above Poverty by Sex and Age in Wilmore
According to the poverty statistics in Wilmore, males aged under 5 years and females aged 6 to 11 years are the age groups that are most secure financially, with 100.0% of males and 100.0% of females in these age groups living above the poverty line.
| Age Bracket | Male | Female |
| Under 5 Years | 166 (100.0%) | 99 (74.4%) |
| 5 Years | 27 (100.0%) | 58 (93.5%) |
| 6 to 11 Years | 93 (94.9%) | 256 (100.0%) |
| 12 to 14 Years | 65 (85.5%) | 43 (100.0%) |
| 15 Years | 154 (100.0%) | 19 (32.2%) |
| 16 and 17 Years | 27 (100.0%) | 24 (28.2%) |
| 18 to 24 Years | 59 (52.7%) | 156 (70.3%) |
| 25 to 34 Years | 639 (92.1%) | 645 (91.6%) |
| 35 to 44 Years | 211 (98.1%) | 199 (95.2%) |
| 45 to 54 Years | 77 (61.1%) | 151 (72.6%) |
| 55 to 64 Years | 143 (88.8%) | 205 (88.4%) |
| 65 to 74 Years | 186 (100.0%) | 195 (92.4%) |
| 75 Years and over | 120 (100.0%) | 208 (89.3%) |
| Total | 1,967 (91.0%) | 2,258 (85.0%) |
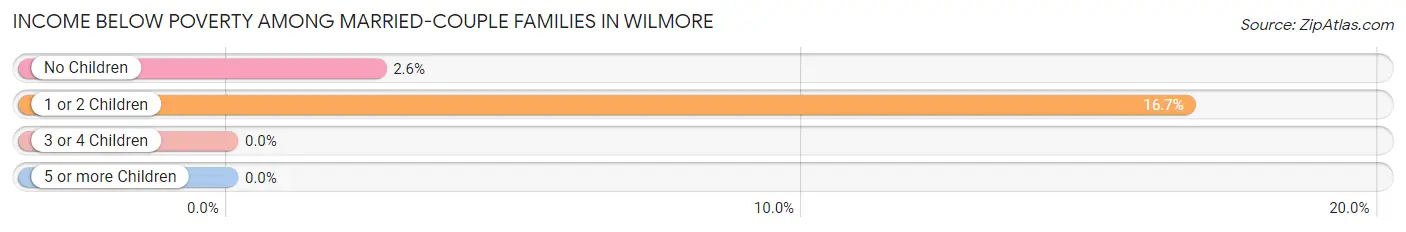
Income Below Poverty Among Married-Couple Families in Wilmore
The poverty statistics for married-couple families in Wilmore show that 5.8% or 50 of the total 867 families live below the poverty line. Families with 1 or 2 children have the highest poverty rate of 16.7%, comprising of 36 families. On the other hand, families with 3 or 4 children have the lowest poverty rate of 0.0%, which includes 0 families.
| Children | Above Poverty | Below Poverty |
| No Children | 529 (97.4%) | 14 (2.6%) |
| 1 or 2 Children | 180 (83.3%) | 36 (16.7%) |
| 3 or 4 Children | 102 (100.0%) | 0 (0.0%) |
| 5 or more Children | 6 (100.0%) | 0 (0.0%) |
| Total | 817 (94.2%) | 50 (5.8%) |
Income Below Poverty Among Single-Parent Households in Wilmore
According to the poverty data in Wilmore, 26.7% or 36 single-father households and 16.2% or 27 single-mother households are living below the poverty line. Among single-father households, those with 1 or 2 children have the highest poverty rate, with 36 households (36.7%) experiencing poverty. Likewise, among single-mother households, those with no children have the highest poverty rate, with 15 households (100.0%) falling below the poverty line.
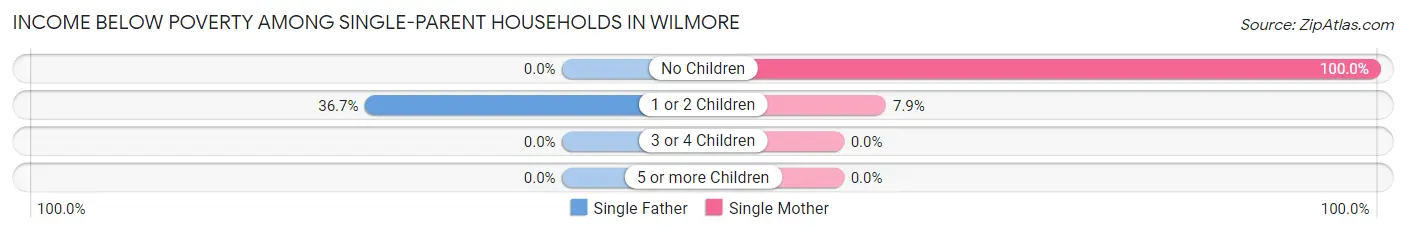
| Children | Single Father | Single Mother |
| No Children | 0 (0.0%) | 15 (100.0%) |
| 1 or 2 Children | 36 (36.7%) | 12 (7.9%) |
| 3 or 4 Children | 0 (0.0%) | 0 (0.0%) |
| 5 or more Children | 0 (0.0%) | 0 (0.0%) |
| Total | 36 (26.7%) | 27 (16.2%) |
Income Below Poverty Among Married-Couple vs Single-Parent Households in Wilmore
The poverty data for Wilmore shows that 50 of the married-couple family households (5.8%) and 63 of the single-parent households (20.9%) are living below the poverty level. Within the married-couple family households, those with 1 or 2 children have the highest poverty rate, with 36 households (16.7%) falling below the poverty line. Among the single-parent households, those with no children have the highest poverty rate, with 15 household (28.8%) living below poverty.
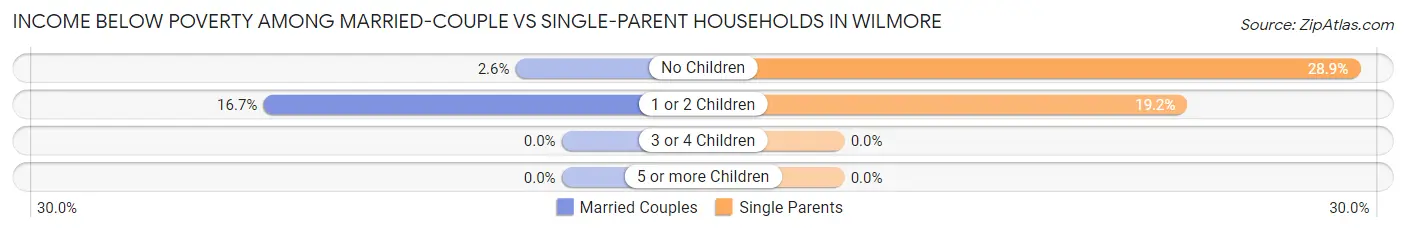
| Children | Married-Couple Families | Single-Parent Households |
| No Children | 14 (2.6%) | 15 (28.8%) |
| 1 or 2 Children | 36 (16.7%) | 48 (19.2%) |
| 3 or 4 Children | 0 (0.0%) | 0 (0.0%) |
| 5 or more Children | 0 (0.0%) | 0 (0.0%) |
| Total | 50 (5.8%) | 63 (20.9%) |
Race in Wilmore
The most populous races in Wilmore are White / Caucasian (5,428 | 90.2%), Black / African American (270 | 4.5%), and Two or more Races (176 | 2.9%).
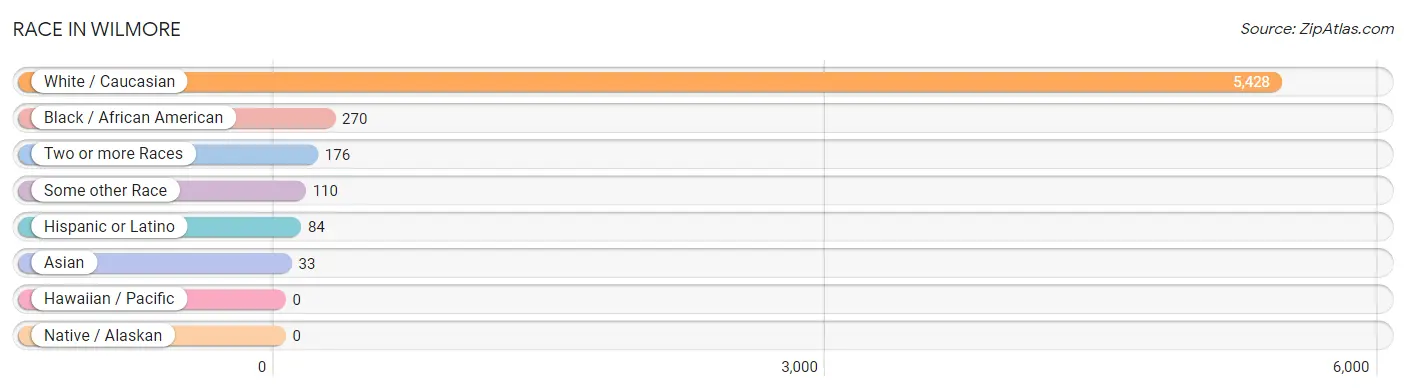
| Race | # Population | % Population |
| Asian | 33 | 0.5% |
| Black / African American | 270 | 4.5% |
| Hawaiian / Pacific | 0 | 0.0% |
| Hispanic or Latino | 84 | 1.4% |
| Native / Alaskan | 0 | 0.0% |
| White / Caucasian | 5,428 | 90.2% |
| Two or more Races | 176 | 2.9% |
| Some other Race | 110 | 1.8% |
| Total | 6,017 | 100.0% |
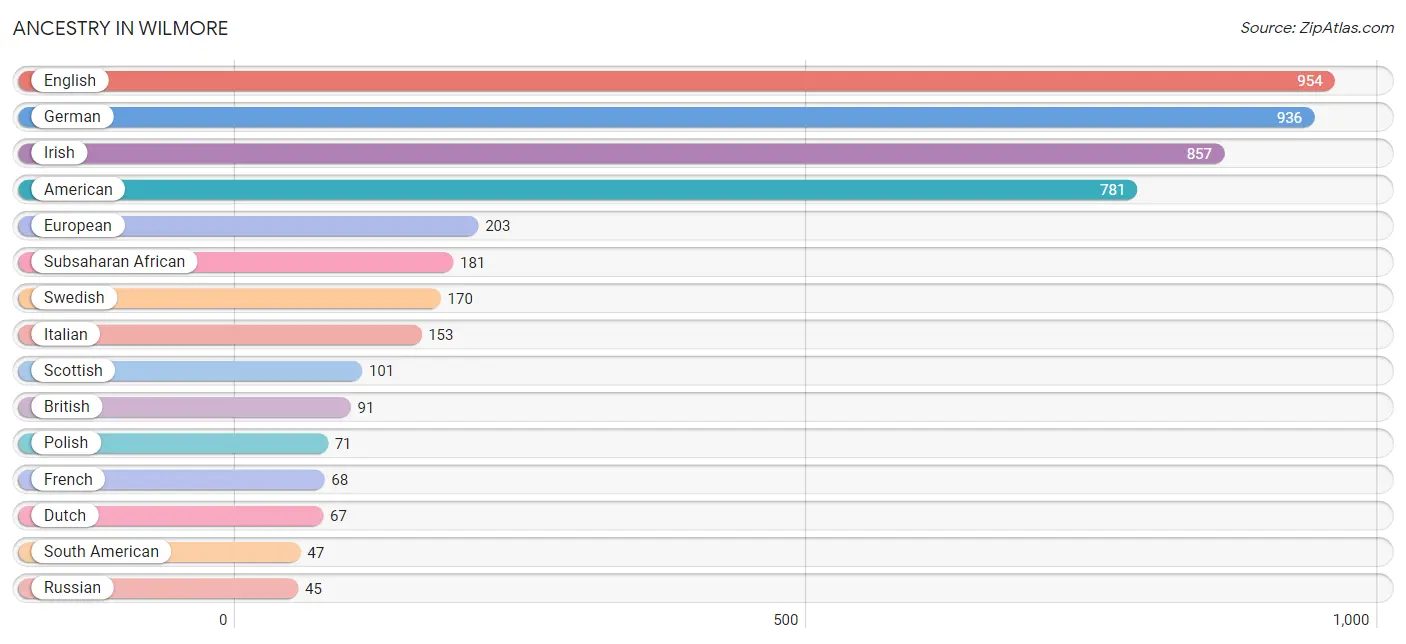
Ancestry in Wilmore
The most populous ancestries reported in Wilmore are English (954 | 15.9%), German (936 | 15.6%), Irish (857 | 14.2%), American (781 | 13.0%), and European (203 | 3.4%), together accounting for 62.0% of all Wilmore residents.
| Ancestry | # Population | % Population |
| African | 8 | 0.1% |
| American | 781 | 13.0% |
| Armenian | 6 | 0.1% |
| Belgian | 15 | 0.3% |
| Blackfeet | 6 | 0.1% |
| British | 91 | 1.5% |
| Canadian | 3 | 0.1% |
| Cherokee | 16 | 0.3% |
| Colombian | 38 | 0.6% |
| Danish | 29 | 0.5% |
| Dutch | 67 | 1.1% |
| Ecuadorian | 9 | 0.2% |
| English | 954 | 15.9% |
| European | 203 | 3.4% |
| Filipino | 7 | 0.1% |
| Finnish | 22 | 0.4% |
| French | 68 | 1.1% |
| French American Indian | 4 | 0.1% |
| French Canadian | 20 | 0.3% |
| German | 936 | 15.6% |
| Haitian | 1 | 0.0% |
| Indian (Asian) | 26 | 0.4% |
| Irish | 857 | 14.2% |
| Italian | 153 | 2.5% |
| Latvian | 10 | 0.2% |
| Macedonian | 9 | 0.2% |
| Mexican | 15 | 0.3% |
| Norwegian | 3 | 0.1% |
| Polish | 71 | 1.2% |
| Portuguese | 13 | 0.2% |
| Romanian | 38 | 0.6% |
| Russian | 45 | 0.7% |
| Scotch-Irish | 32 | 0.5% |
| Scottish | 101 | 1.7% |
| South American | 47 | 0.8% |
| Sri Lankan | 22 | 0.4% |
| Subsaharan African | 181 | 3.0% |
| Swedish | 170 | 2.8% |
| Swiss | 45 | 0.7% |
| Thai | 6 | 0.1% |
| Ukrainian | 12 | 0.2% |
| Welsh | 20 | 0.3% | View All 42 Rows |
Immigrants in Wilmore
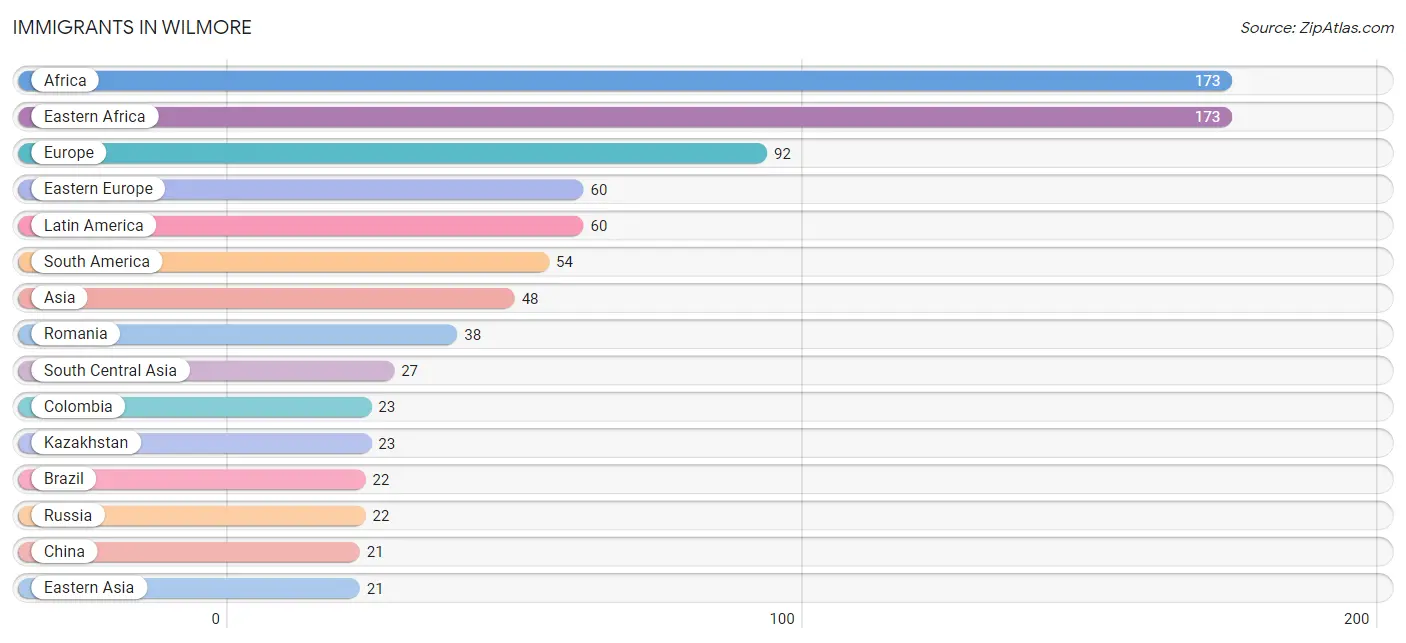
The most numerous immigrant groups reported in Wilmore came from Africa (173 | 2.9%), Eastern Africa (173 | 2.9%), Europe (92 | 1.5%), Eastern Europe (60 | 1.0%), and Latin America (60 | 1.0%), together accounting for 9.3% of all Wilmore residents.
| Immigration Origin | # Population | % Population |
| Africa | 173 | 2.9% |
| Asia | 48 | 0.8% |
| Brazil | 22 | 0.4% |
| Canada | 7 | 0.1% |
| Caribbean | 6 | 0.1% |
| China | 21 | 0.4% |
| Colombia | 23 | 0.4% |
| Eastern Africa | 173 | 2.9% |
| Eastern Asia | 21 | 0.4% |
| Eastern Europe | 60 | 1.0% |
| Ecuador | 9 | 0.2% |
| England | 16 | 0.3% |
| Europe | 92 | 1.5% |
| Haiti | 6 | 0.1% |
| Iran | 4 | 0.1% |
| Kazakhstan | 23 | 0.4% |
| Latin America | 60 | 1.0% |
| Northern Europe | 16 | 0.3% |
| Portugal | 13 | 0.2% |
| Romania | 38 | 0.6% |
| Russia | 22 | 0.4% |
| South America | 54 | 0.9% |
| South Central Asia | 27 | 0.4% |
| Southern Europe | 16 | 0.3% |
| Spain | 3 | 0.1% | View All 25 Rows |
Sex and Age in Wilmore
Sex and Age in Wilmore
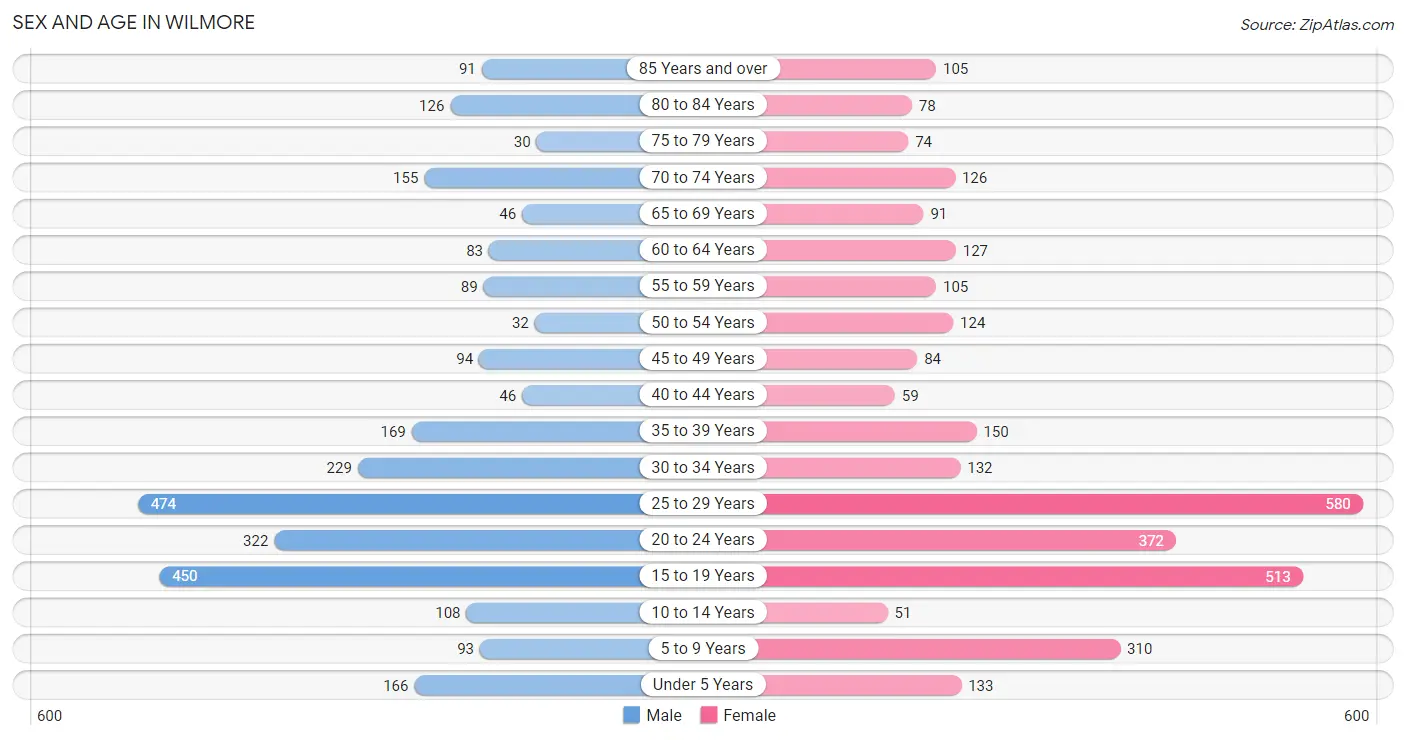
The most populous age groups in Wilmore are 25 to 29 Years (474 | 16.9%) for men and 25 to 29 Years (580 | 18.0%) for women.
| Age Bracket | Male | Female |
| Under 5 Years | 166 (5.9%) | 133 (4.1%) |
| 5 to 9 Years | 93 (3.3%) | 310 (9.7%) |
| 10 to 14 Years | 108 (3.8%) | 51 (1.6%) |
| 15 to 19 Years | 450 (16.1%) | 513 (16.0%) |
| 20 to 24 Years | 322 (11.5%) | 372 (11.6%) |
| 25 to 29 Years | 474 (16.9%) | 580 (18.0%) |
| 30 to 34 Years | 229 (8.2%) | 132 (4.1%) |
| 35 to 39 Years | 169 (6.0%) | 150 (4.7%) |
| 40 to 44 Years | 46 (1.6%) | 59 (1.8%) |
| 45 to 49 Years | 94 (3.4%) | 84 (2.6%) |
| 50 to 54 Years | 32 (1.1%) | 124 (3.9%) |
| 55 to 59 Years | 89 (3.2%) | 105 (3.3%) |
| 60 to 64 Years | 83 (3.0%) | 127 (4.0%) |
| 65 to 69 Years | 46 (1.6%) | 91 (2.8%) |
| 70 to 74 Years | 155 (5.5%) | 126 (3.9%) |
| 75 to 79 Years | 30 (1.1%) | 74 (2.3%) |
| 80 to 84 Years | 126 (4.5%) | 78 (2.4%) |
| 85 Years and over | 91 (3.3%) | 105 (3.3%) |
| Total | 2,803 (100.0%) | 3,214 (100.0%) |
Families and Households in Wilmore
Median Family Size in Wilmore
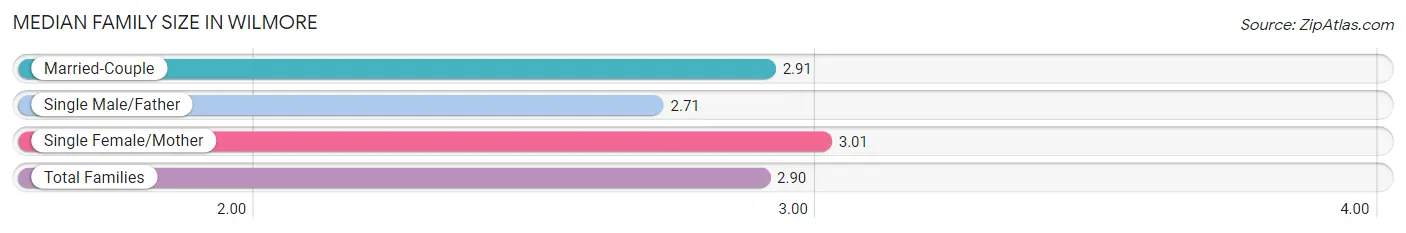
The median family size in Wilmore is 2.90 persons per family, with single female/mother families (167 | 14.3%) accounting for the largest median family size of 3.01 persons per family. On the other hand, single male/father families (135 | 11.6%) represent the smallest median family size with 2.71 persons per family.
| Family Type | # Families | Family Size |
| Married-Couple | 867 (74.2%) | 2.91 |
| Single Male/Father | 135 (11.6%) | 2.71 |
| Single Female/Mother | 167 (14.3%) | 3.01 |
| Total Families | 1,169 (100.0%) | 2.90 |
Median Household Size in Wilmore
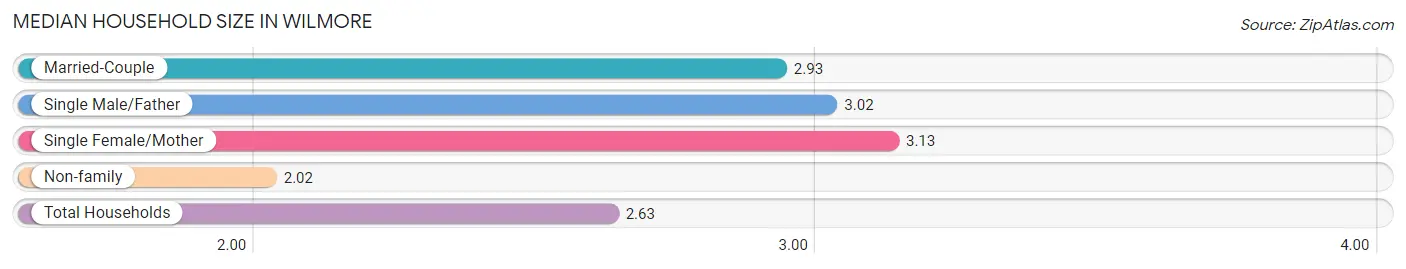
The median household size in Wilmore is 2.63 persons per household, with single female/mother households (167 | 9.1%) accounting for the largest median household size of 3.13 persons per household. non-family households (666 | 36.3%) represent the smallest median household size with 2.02 persons per household.
| Household Type | # Households | Household Size |
| Married-Couple | 867 (47.2%) | 2.93 |
| Single Male/Father | 135 (7.4%) | 3.02 |
| Single Female/Mother | 167 (9.1%) | 3.13 |
| Non-family | 666 (36.3%) | 2.02 |
| Total Households | 1,835 (100.0%) | 2.63 |
Household Size by Marriage Status in Wilmore
Out of a total of 1,835 households in Wilmore, 1,169 (63.7%) are family households, while 666 (36.3%) are nonfamily households. The most numerous type of family households are 2-person households, comprising 626, and the most common type of nonfamily households are 1-person households, comprising 450.
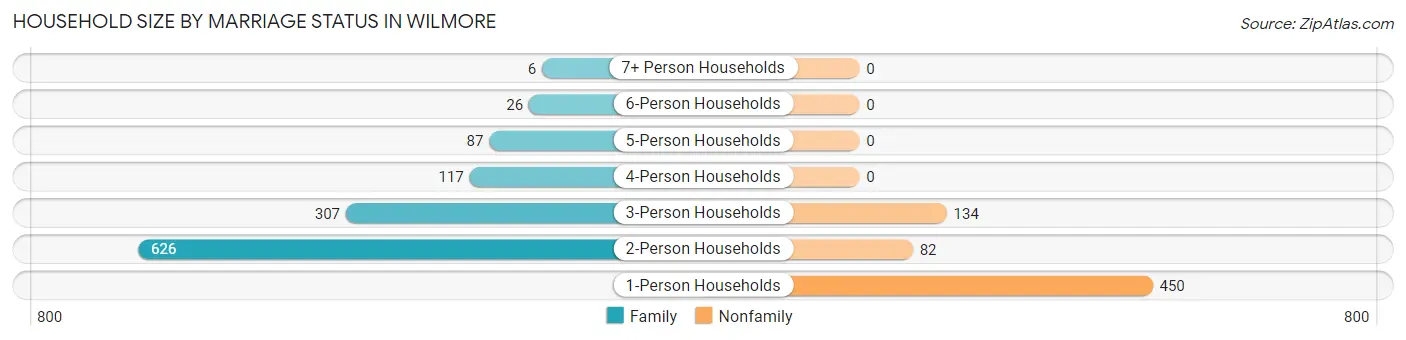
| Household Size | Family Households | Nonfamily Households |
| 1-Person Households | - | 450 (24.5%) |
| 2-Person Households | 626 (34.1%) | 82 (4.5%) |
| 3-Person Households | 307 (16.7%) | 134 (7.3%) |
| 4-Person Households | 117 (6.4%) | 0 (0.0%) |
| 5-Person Households | 87 (4.7%) | 0 (0.0%) |
| 6-Person Households | 26 (1.4%) | 0 (0.0%) |
| 7+ Person Households | 6 (0.3%) | 0 (0.0%) |
| Total | 1,169 (63.7%) | 666 (36.3%) |
Female Fertility in Wilmore
Fertility by Age in Wilmore
Average fertility rate in Wilmore is 14.0 births per 1,000 women. Women in the age bracket of 20 to 34 years have the highest fertility rate with 25.0 births per 1,000 women. Women in the age bracket of 20 to 34 years acount for 100.0% of all women with births.
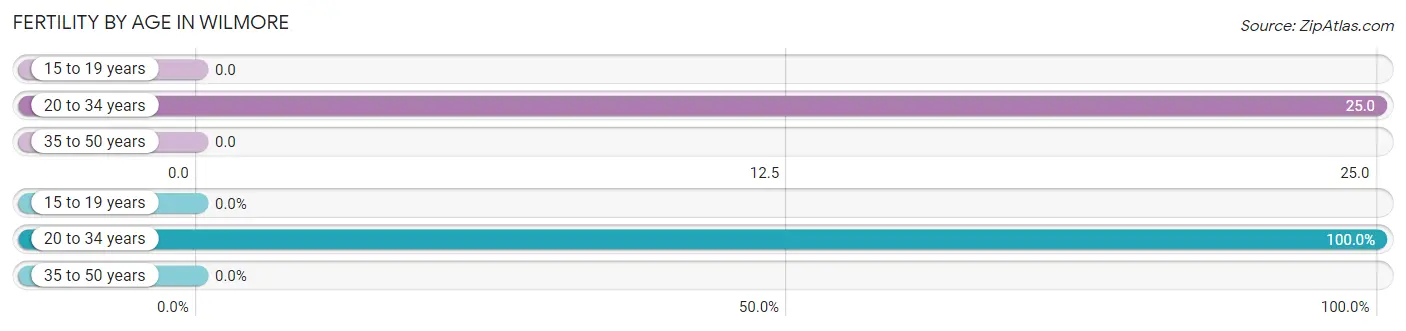
| Age Bracket | Women with Births | Births / 1,000 Women |
| 15 to 19 years | 0 (0.0%) | 0.0 |
| 20 to 34 years | 27 (100.0%) | 25.0 |
| 35 to 50 years | 0 (0.0%) | 0.0 |
| Total | 27 (100.0%) | 14.0 |
Fertility by Age by Marriage Status in Wilmore
66.7% of women with births (27) in Wilmore are married. The highest percentage of unmarried women with births falls into 20 to 34 years age bracket with 33.3% of them unmarried at the time of birth, while the lowest percentage of unmarried women with births belong to 20 to 34 years age bracket with 33.3% of them unmarried.
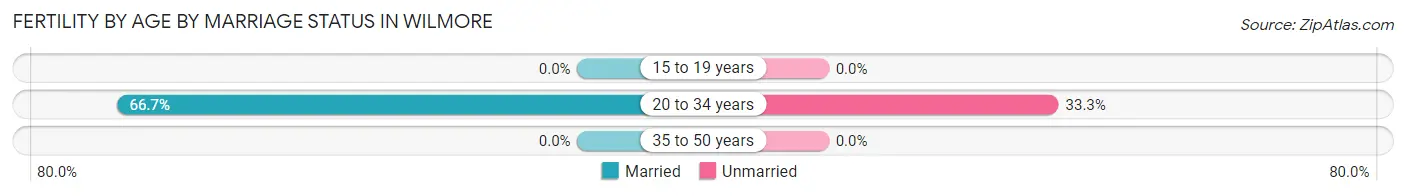
| Age Bracket | Married | Unmarried |
| 15 to 19 years | 0 (0.0%) | 0 (0.0%) |
| 20 to 34 years | 18 (66.7%) | 9 (33.3%) |
| 35 to 50 years | 0 (0.0%) | 0 (0.0%) |
| Total | 18 (66.7%) | 9 (33.3%) |
Fertility by Education in Wilmore
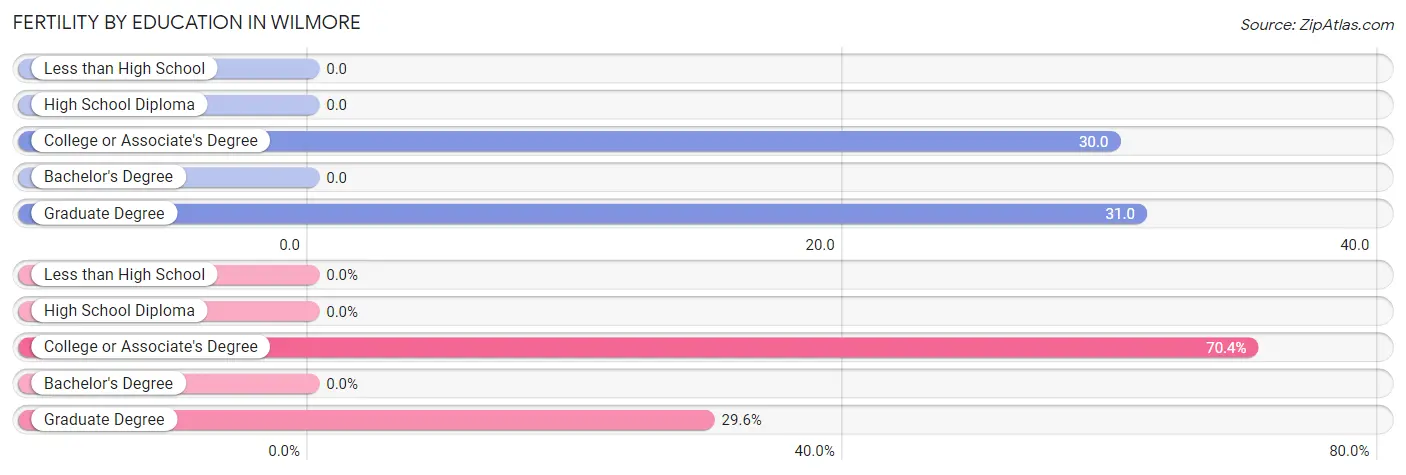
| Educational Attainment | Women with Births | Births / 1,000 Women |
| Less than High School | 0 (0.0%) | 0.0 |
| High School Diploma | 0 (0.0%) | 0.0 |
| College or Associate's Degree | 19 (70.4%) | 30.0 |
| Bachelor's Degree | 0 (0.0%) | 0.0 |
| Graduate Degree | 8 (29.6%) | 31.0 |
| Total | 27 (100.0%) | 14.0 |
Fertility by Education by Marriage Status in Wilmore
33.3% of women with births in Wilmore are unmarried. Women with the educational attainment of graduate degree are most likely to be married with 100.0% of them married at childbirth, while women with the educational attainment of college or associate's degree are least likely to be married with 47.4% of them unmarried at childbirth.
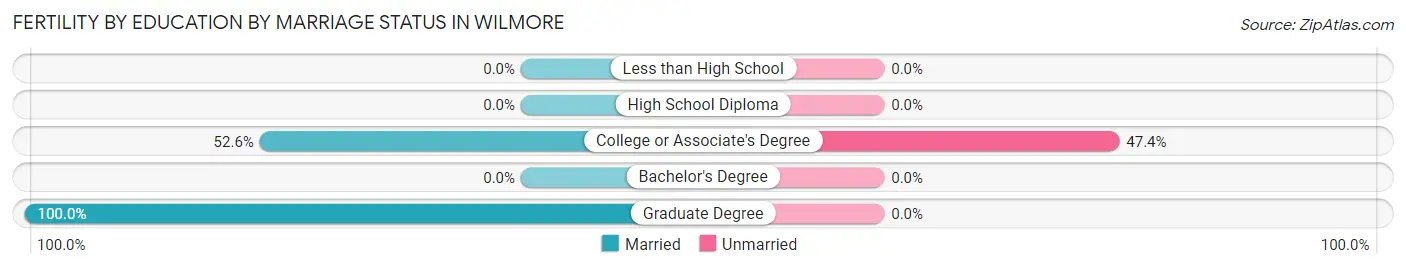
| Educational Attainment | Married | Unmarried |
| Less than High School | 0 (0.0%) | 0 (0.0%) |
| High School Diploma | 0 (0.0%) | 0 (0.0%) |
| College or Associate's Degree | 10 (52.6%) | 9 (47.4%) |
| Bachelor's Degree | 0 (0.0%) | 0 (0.0%) |
| Graduate Degree | 8 (100.0%) | 0 (0.0%) |
| Total | 18 (66.7%) | 9 (33.3%) |
Employment Characteristics in Wilmore
Employment by Class of Employer in Wilmore
Among the 3,157 employed individuals in Wilmore, private company employees (1,875 | 59.4%), not-for-profit organizations (817 | 25.9%), and state government employees (220 | 7.0%) make up the most common classes of employment.
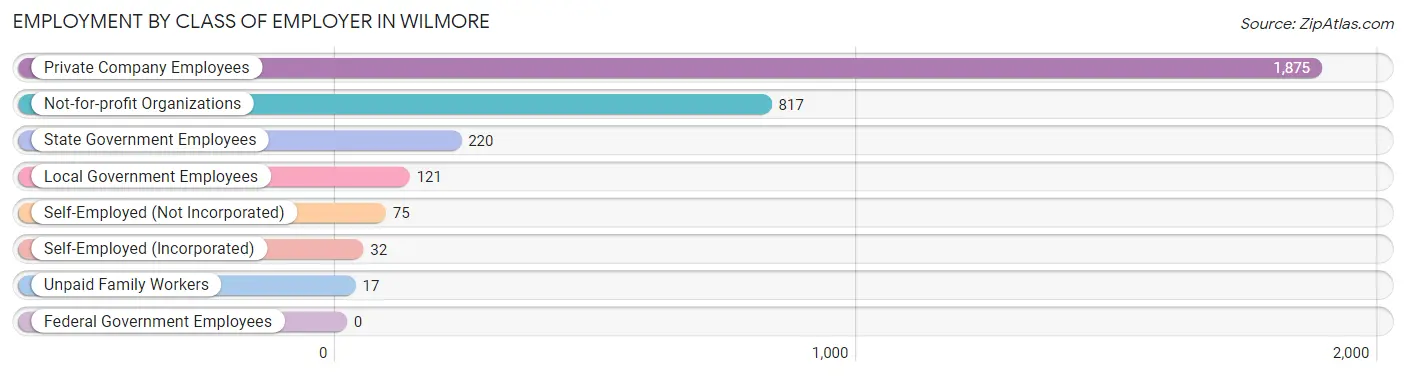
| Employer Class | # Employees | % Employees |
| Private Company Employees | 1,875 | 59.4% |
| Self-Employed (Incorporated) | 32 | 1.0% |
| Self-Employed (Not Incorporated) | 75 | 2.4% |
| Not-for-profit Organizations | 817 | 25.9% |
| Local Government Employees | 121 | 3.8% |
| State Government Employees | 220 | 7.0% |
| Federal Government Employees | 0 | 0.0% |
| Unpaid Family Workers | 17 | 0.5% |
| Total | 3,157 | 100.0% |
Employment Status by Age in Wilmore
According to the labor force statistics for Wilmore, out of the total population over 16 years of age (4,943), 66.6% or 3,292 individuals are in the labor force, with 2.1% or 69 of them unemployed. The age group with the highest labor force participation rate is 25 to 29 years, with 98.2% or 1,035 individuals in the labor force. Within the labor force, the 16 to 19 years age range has the highest percentage of unemployed individuals, with 6.5% or 23 of them being unemployed.
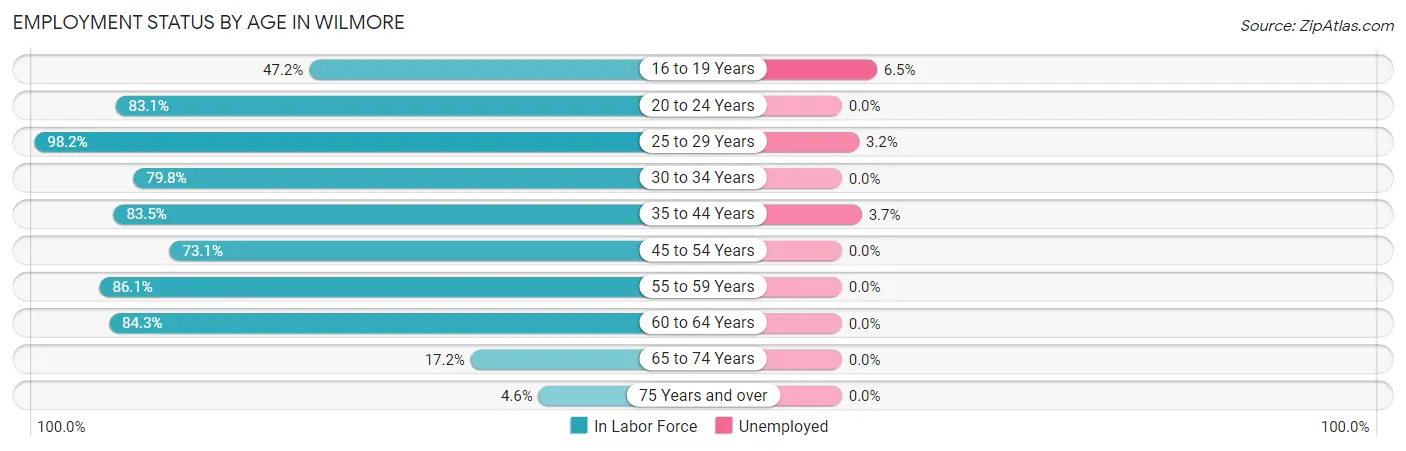
| Age Bracket | In Labor Force | Unemployed |
| 16 to 19 Years | 354 (47.2%) | 23 (6.5%) |
| 20 to 24 Years | 577 (83.1%) | 0 (0.0%) |
| 25 to 29 Years | 1,035 (98.2%) | 33 (3.2%) |
| 30 to 34 Years | 288 (79.8%) | 0 (0.0%) |
| 35 to 44 Years | 354 (83.5%) | 13 (3.7%) |
| 45 to 54 Years | 244 (73.1%) | 0 (0.0%) |
| 55 to 59 Years | 167 (86.1%) | 0 (0.0%) |
| 60 to 64 Years | 177 (84.3%) | 0 (0.0%) |
| 65 to 74 Years | 72 (17.2%) | 0 (0.0%) |
| 75 Years and over | 23 (4.6%) | 0 (0.0%) |
| Total | 3,292 (66.6%) | 69 (2.1%) |
Employment Status by Educational Attainment in Wilmore
According to labor force statistics for Wilmore, 87.9% of individuals (2,265) out of the total population between 25 and 64 years of age (2,577) are in the labor force, with 2.0% or 45 of them being unemployed. The group with the highest labor force participation rate are those with the educational attainment of high school diploma, with 96.2% or 652 individuals in the labor force. Within the labor force, individuals with college / associate degree education have the highest percentage of unemployment, with 10.1% or 40 of them being unemployed.
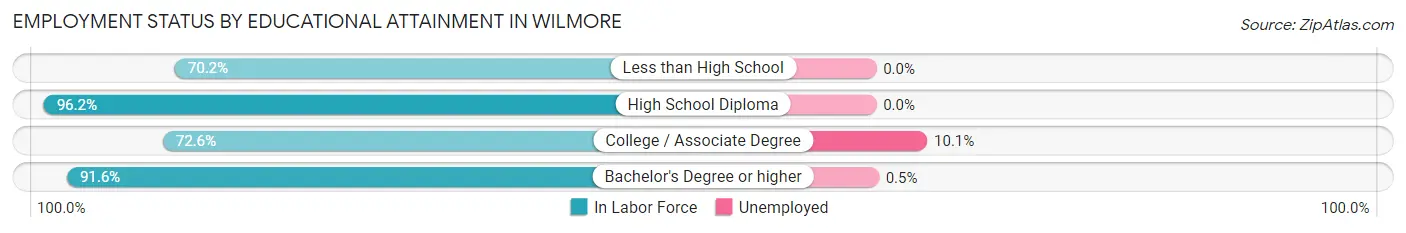
| Educational Attainment | In Labor Force | Unemployed |
| Less than High School | 73 (70.2%) | 0 (0.0%) |
| High School Diploma | 652 (96.2%) | 0 (0.0%) |
| College / Associate Degree | 398 (72.6%) | 55 (10.1%) |
| Bachelor's Degree or higher | 1,142 (91.6%) | 6 (0.5%) |
| Total | 2,265 (87.9%) | 52 (2.0%) |
Employment Occupations by Sex in Wilmore
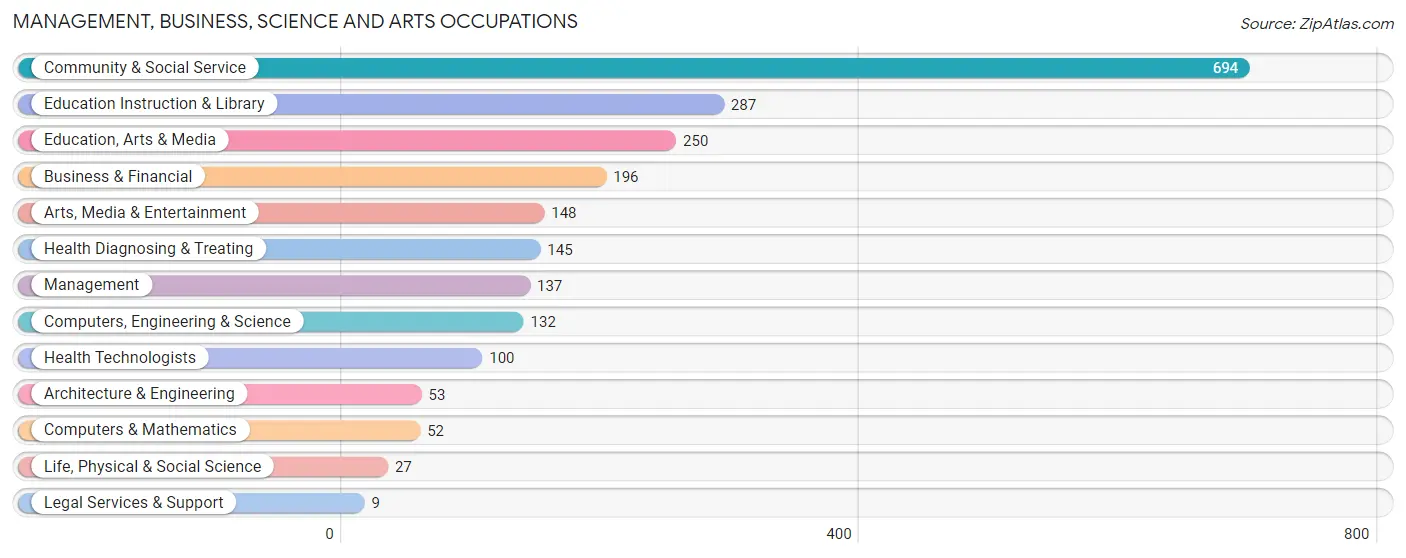
Management, Business, Science and Arts Occupations
The most common Management, Business, Science and Arts occupations in Wilmore are Community & Social Service (694 | 21.5%), Education Instruction & Library (287 | 8.9%), Education, Arts & Media (250 | 7.8%), Business & Financial (196 | 6.1%), and Arts, Media & Entertainment (148 | 4.6%).
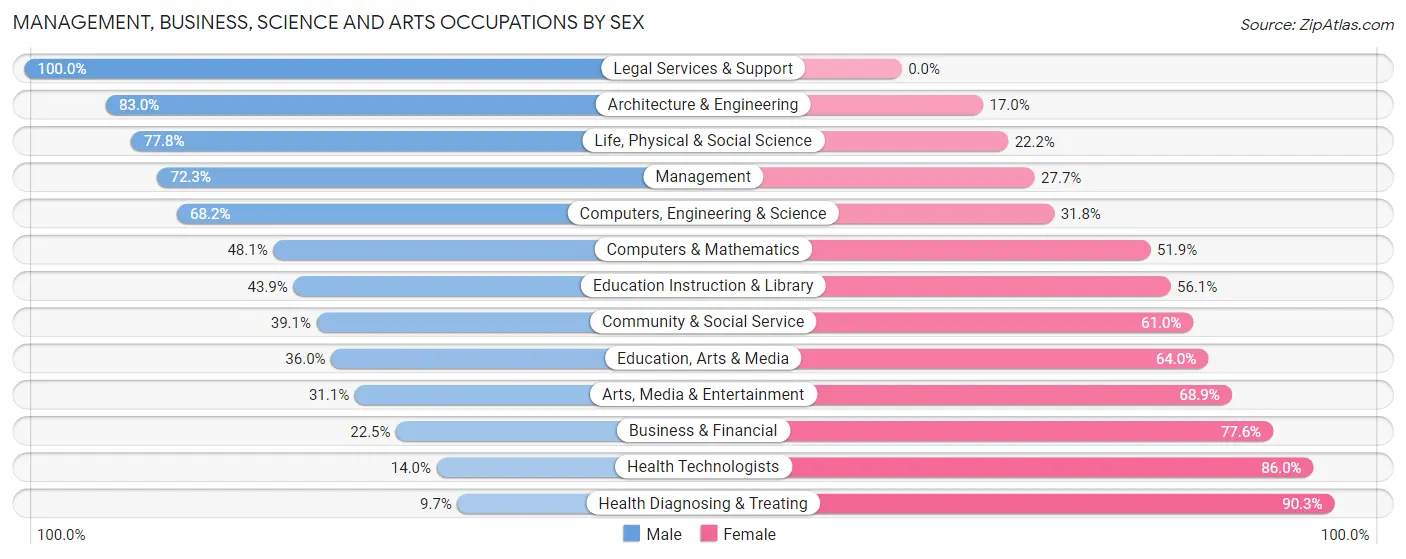
Management, Business, Science and Arts Occupations by Sex
Within the Management, Business, Science and Arts occupations in Wilmore, the most male-oriented occupations are Legal Services & Support (100.0%), Architecture & Engineering (83.0%), and Life, Physical & Social Science (77.8%), while the most female-oriented occupations are Health Diagnosing & Treating (90.3%), Health Technologists (86.0%), and Business & Financial (77.5%).
| Occupation | Male | Female |
| Management | 99 (72.3%) | 38 (27.7%) |
| Business & Financial | 44 (22.5%) | 152 (77.5%) |
| Computers, Engineering & Science | 90 (68.2%) | 42 (31.8%) |
| Computers & Mathematics | 25 (48.1%) | 27 (51.9%) |
| Architecture & Engineering | 44 (83.0%) | 9 (17.0%) |
| Life, Physical & Social Science | 21 (77.8%) | 6 (22.2%) |
| Community & Social Service | 271 (39.1%) | 423 (61.0%) |
| Education, Arts & Media | 90 (36.0%) | 160 (64.0%) |
| Legal Services & Support | 9 (100.0%) | 0 (0.0%) |
| Education Instruction & Library | 126 (43.9%) | 161 (56.1%) |
| Arts, Media & Entertainment | 46 (31.1%) | 102 (68.9%) |
| Health Diagnosing & Treating | 14 (9.7%) | 131 (90.3%) |
| Health Technologists | 14 (14.0%) | 86 (86.0%) |
| Total (Category) | 518 (39.7%) | 786 (60.3%) |
| Total (Overall) | 1,487 (46.2%) | 1,735 (53.8%) |
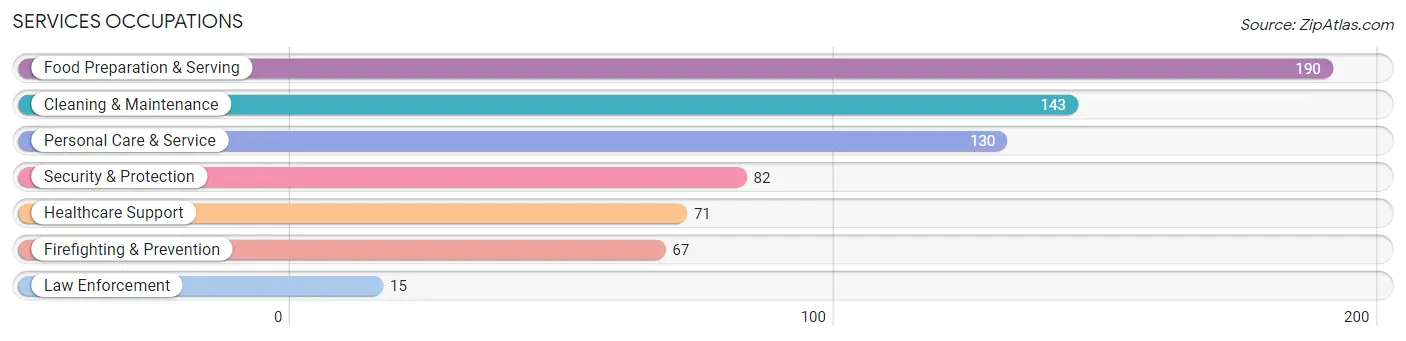
Services Occupations
The most common Services occupations in Wilmore are Food Preparation & Serving (190 | 5.9%), Cleaning & Maintenance (143 | 4.4%), Personal Care & Service (130 | 4.0%), Security & Protection (82 | 2.5%), and Healthcare Support (71 | 2.2%).
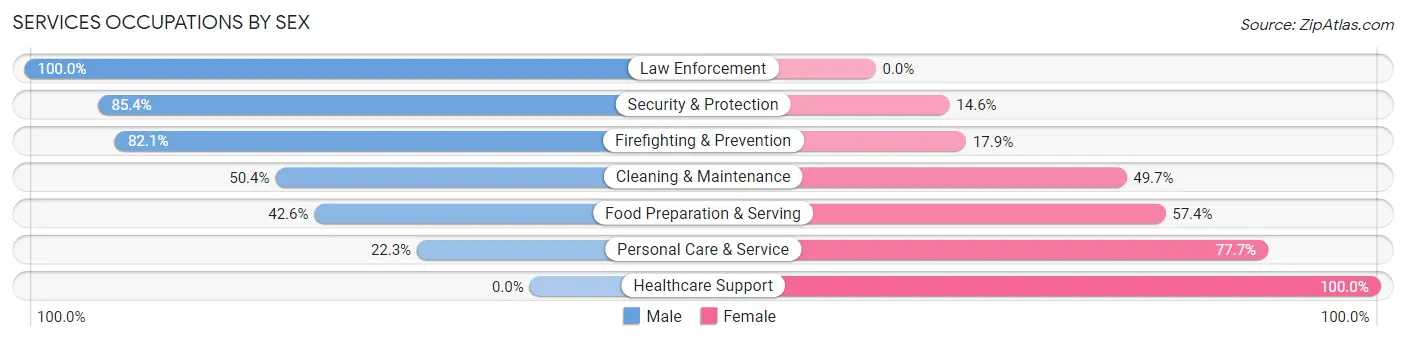
Services Occupations by Sex
Within the Services occupations in Wilmore, the most male-oriented occupations are Law Enforcement (100.0%), Security & Protection (85.4%), and Firefighting & Prevention (82.1%), while the most female-oriented occupations are Healthcare Support (100.0%), Personal Care & Service (77.7%), and Food Preparation & Serving (57.4%).
| Occupation | Male | Female |
| Healthcare Support | 0 (0.0%) | 71 (100.0%) |
| Security & Protection | 70 (85.4%) | 12 (14.6%) |
| Firefighting & Prevention | 55 (82.1%) | 12 (17.9%) |
| Law Enforcement | 15 (100.0%) | 0 (0.0%) |
| Food Preparation & Serving | 81 (42.6%) | 109 (57.4%) |
| Cleaning & Maintenance | 72 (50.3%) | 71 (49.6%) |
| Personal Care & Service | 29 (22.3%) | 101 (77.7%) |
| Total (Category) | 252 (40.9%) | 364 (59.1%) |
| Total (Overall) | 1,487 (46.2%) | 1,735 (53.8%) |
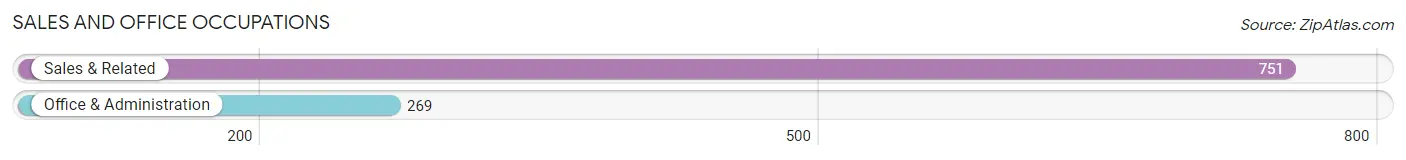
Sales and Office Occupations
The most common Sales and Office occupations in Wilmore are Sales & Related (751 | 23.3%), and Office & Administration (269 | 8.4%).
Sales and Office Occupations by Sex
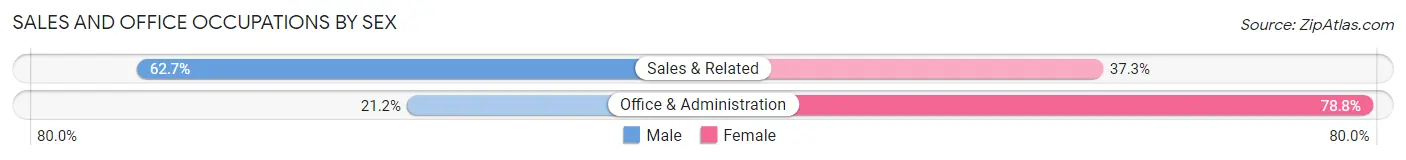
| Occupation | Male | Female |
| Sales & Related | 471 (62.7%) | 280 (37.3%) |
| Office & Administration | 57 (21.2%) | 212 (78.8%) |
| Total (Category) | 528 (51.8%) | 492 (48.2%) |
| Total (Overall) | 1,487 (46.2%) | 1,735 (53.8%) |
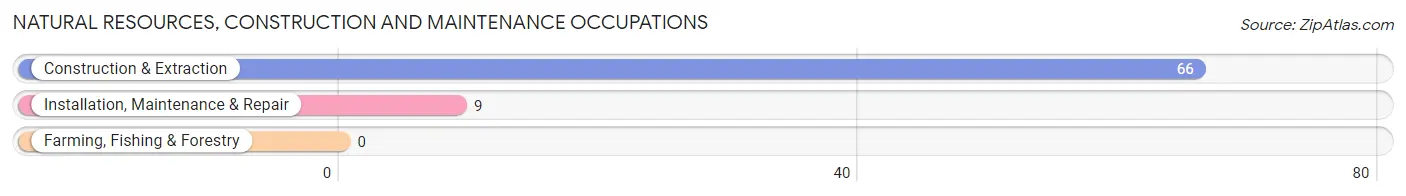
Natural Resources, Construction and Maintenance Occupations
The most common Natural Resources, Construction and Maintenance occupations in Wilmore are Construction & Extraction (66 | 2.1%), and Installation, Maintenance & Repair (9 | 0.3%).
Natural Resources, Construction and Maintenance Occupations by Sex
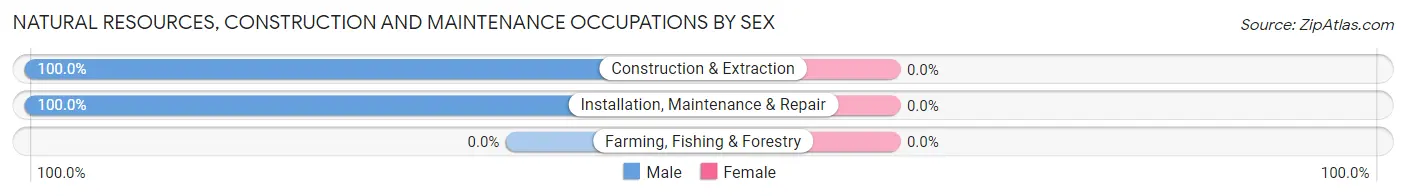
| Occupation | Male | Female |
| Farming, Fishing & Forestry | 0 (0.0%) | 0 (0.0%) |
| Construction & Extraction | 66 (100.0%) | 0 (0.0%) |
| Installation, Maintenance & Repair | 9 (100.0%) | 0 (0.0%) |
| Total (Category) | 75 (100.0%) | 0 (0.0%) |
| Total (Overall) | 1,487 (46.2%) | 1,735 (53.8%) |
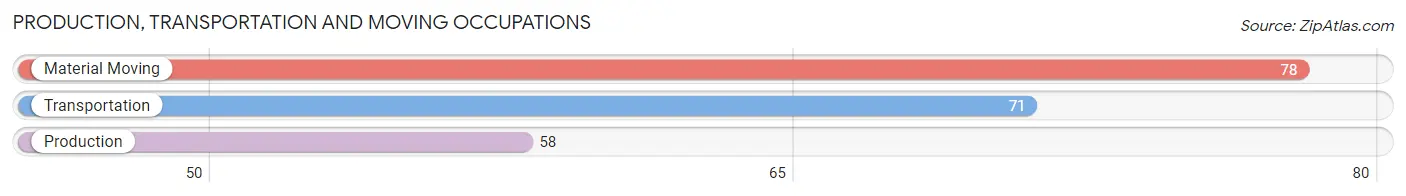
Production, Transportation and Moving Occupations
The most common Production, Transportation and Moving occupations in Wilmore are Material Moving (78 | 2.4%), Transportation (71 | 2.2%), and Production (58 | 1.8%).
Production, Transportation and Moving Occupations by Sex
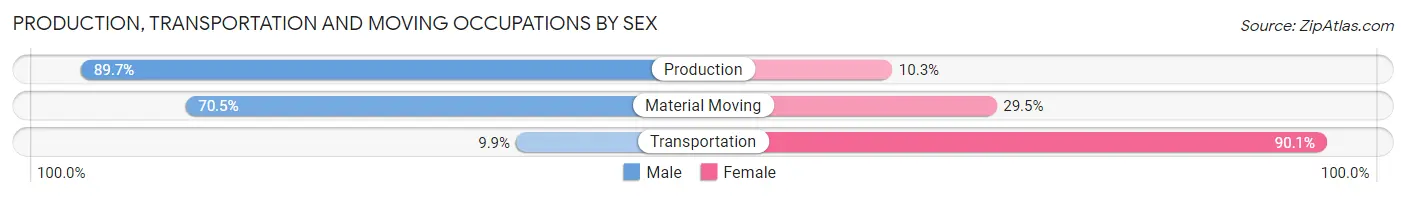
| Occupation | Male | Female |
| Production | 52 (89.7%) | 6 (10.3%) |
| Transportation | 7 (9.9%) | 64 (90.1%) |
| Material Moving | 55 (70.5%) | 23 (29.5%) |
| Total (Category) | 114 (55.1%) | 93 (44.9%) |
| Total (Overall) | 1,487 (46.2%) | 1,735 (53.8%) |
Employment Industries by Sex in Wilmore
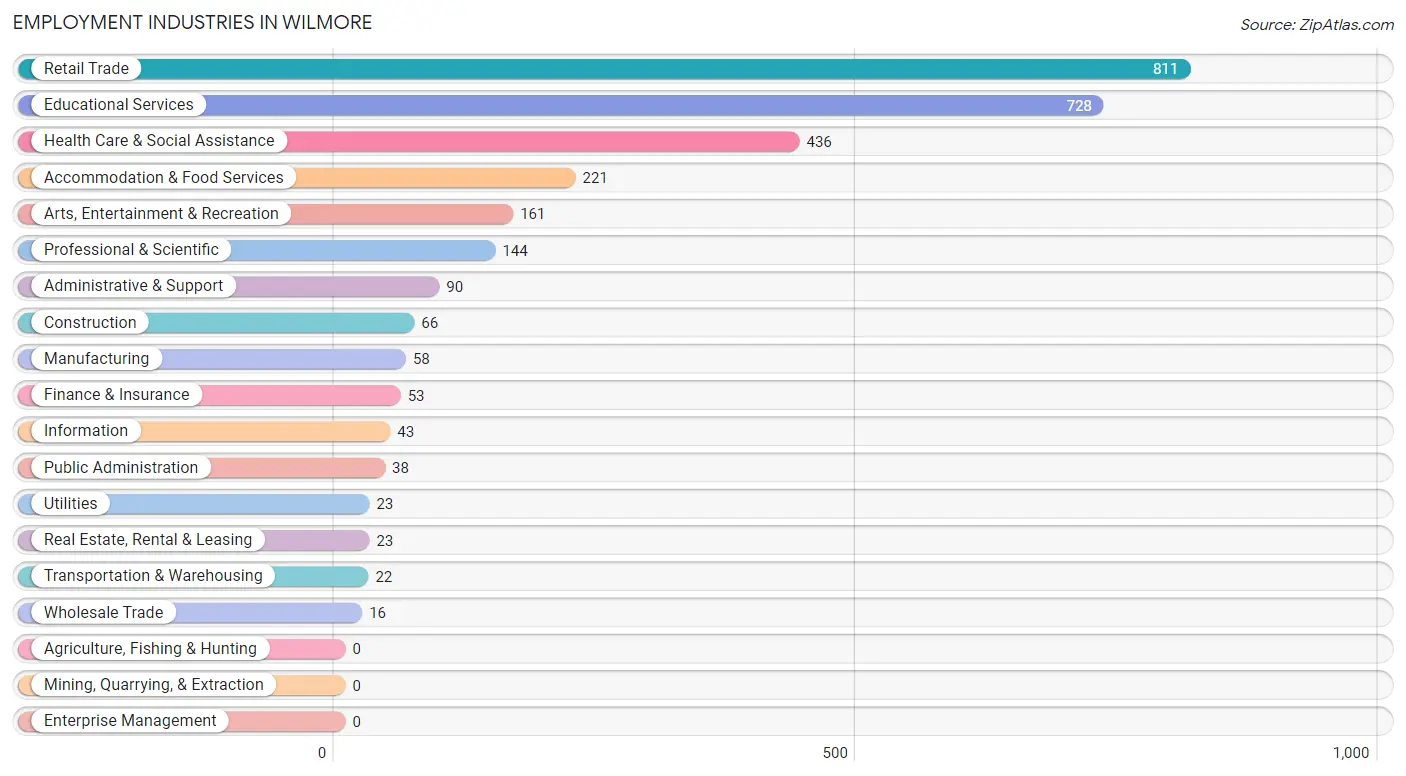
Employment Industries in Wilmore
The major employment industries in Wilmore include Retail Trade (811 | 25.2%), Educational Services (728 | 22.6%), Health Care & Social Assistance (436 | 13.5%), Accommodation & Food Services (221 | 6.9%), and Arts, Entertainment & Recreation (161 | 5.0%).
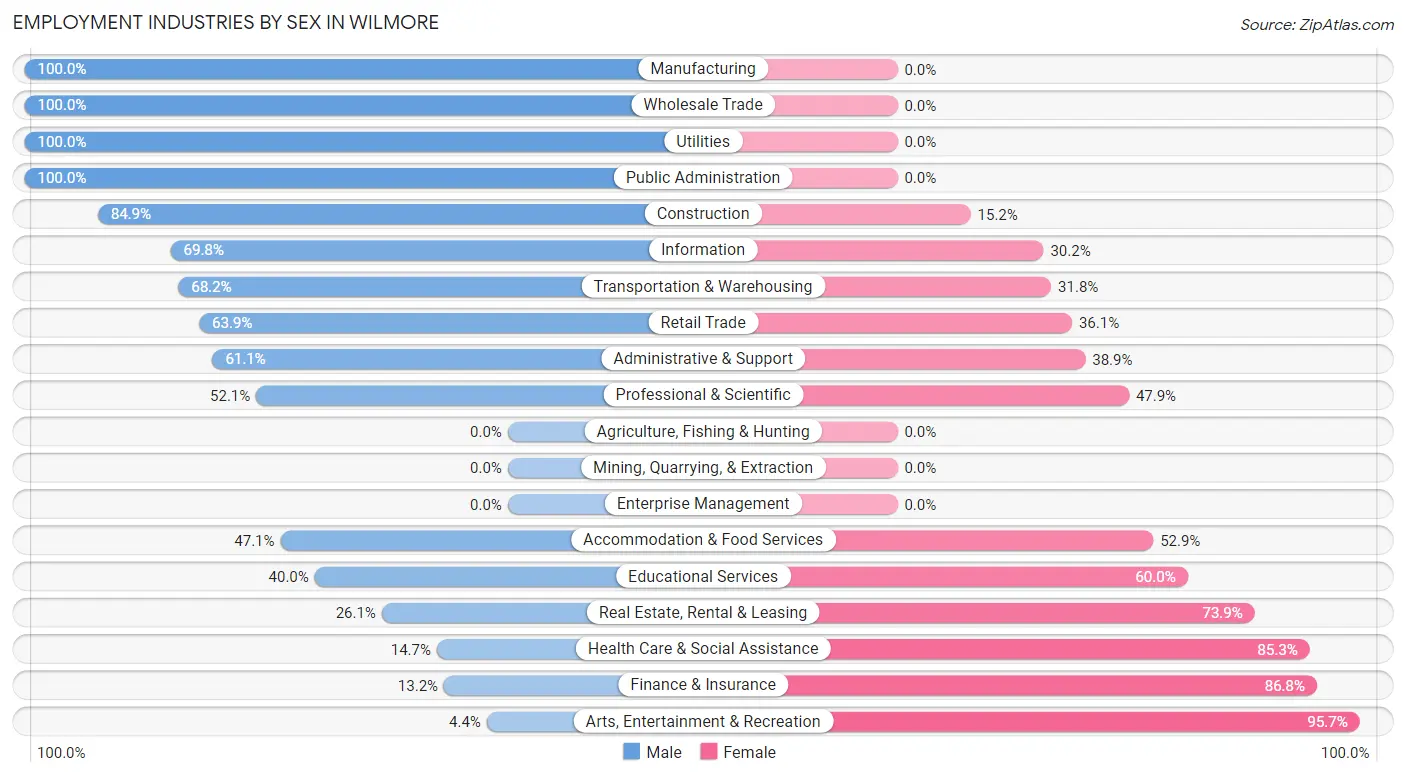
Employment Industries by Sex in Wilmore
The Wilmore industries that see more men than women are Manufacturing (100.0%), Wholesale Trade (100.0%), and Utilities (100.0%), whereas the industries that tend to have a higher number of women are Arts, Entertainment & Recreation (95.7%), Finance & Insurance (86.8%), and Health Care & Social Assistance (85.3%).
| Industry | Male | Female |
| Agriculture, Fishing & Hunting | 0 (0.0%) | 0 (0.0%) |
| Mining, Quarrying, & Extraction | 0 (0.0%) | 0 (0.0%) |
| Construction | 56 (84.9%) | 10 (15.1%) |
| Manufacturing | 58 (100.0%) | 0 (0.0%) |
| Wholesale Trade | 16 (100.0%) | 0 (0.0%) |
| Retail Trade | 518 (63.9%) | 293 (36.1%) |
| Transportation & Warehousing | 15 (68.2%) | 7 (31.8%) |
| Utilities | 23 (100.0%) | 0 (0.0%) |
| Information | 30 (69.8%) | 13 (30.2%) |
| Finance & Insurance | 7 (13.2%) | 46 (86.8%) |
| Real Estate, Rental & Leasing | 6 (26.1%) | 17 (73.9%) |
| Professional & Scientific | 75 (52.1%) | 69 (47.9%) |
| Enterprise Management | 0 (0.0%) | 0 (0.0%) |
| Administrative & Support | 55 (61.1%) | 35 (38.9%) |
| Educational Services | 291 (40.0%) | 437 (60.0%) |
| Health Care & Social Assistance | 64 (14.7%) | 372 (85.3%) |
| Arts, Entertainment & Recreation | 7 (4.3%) | 154 (95.7%) |
| Accommodation & Food Services | 104 (47.1%) | 117 (52.9%) |
| Public Administration | 38 (100.0%) | 0 (0.0%) |
| Total | 1,487 (46.2%) | 1,735 (53.8%) |
Education in Wilmore
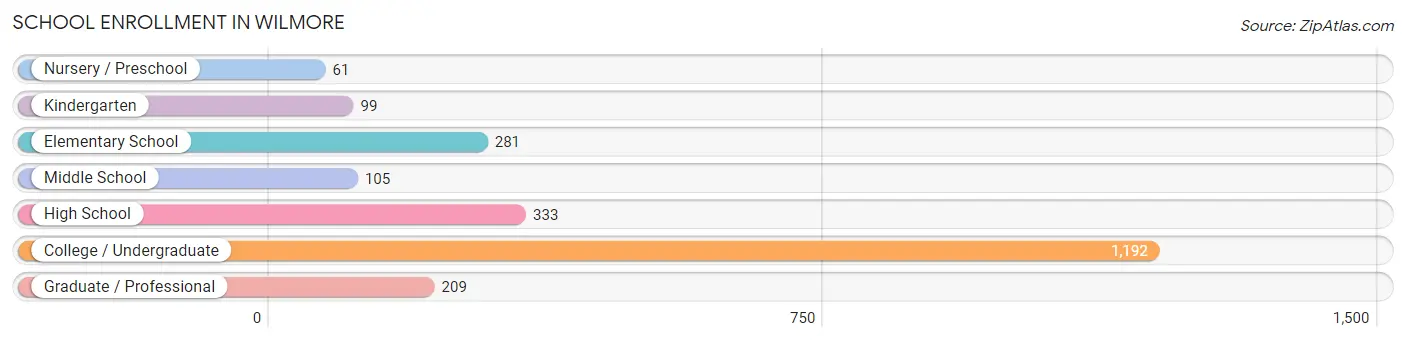
School Enrollment in Wilmore
The most common levels of schooling among the 2,280 students in Wilmore are college / undergraduate (1,192 | 52.3%), high school (333 | 14.6%), and elementary school (281 | 12.3%).
| School Level | # Students | % Students |
| Nursery / Preschool | 61 | 2.7% |
| Kindergarten | 99 | 4.3% |
| Elementary School | 281 | 12.3% |
| Middle School | 105 | 4.6% |
| High School | 333 | 14.6% |
| College / Undergraduate | 1,192 | 52.3% |
| Graduate / Professional | 209 | 9.2% |
| Total | 2,280 | 100.0% |
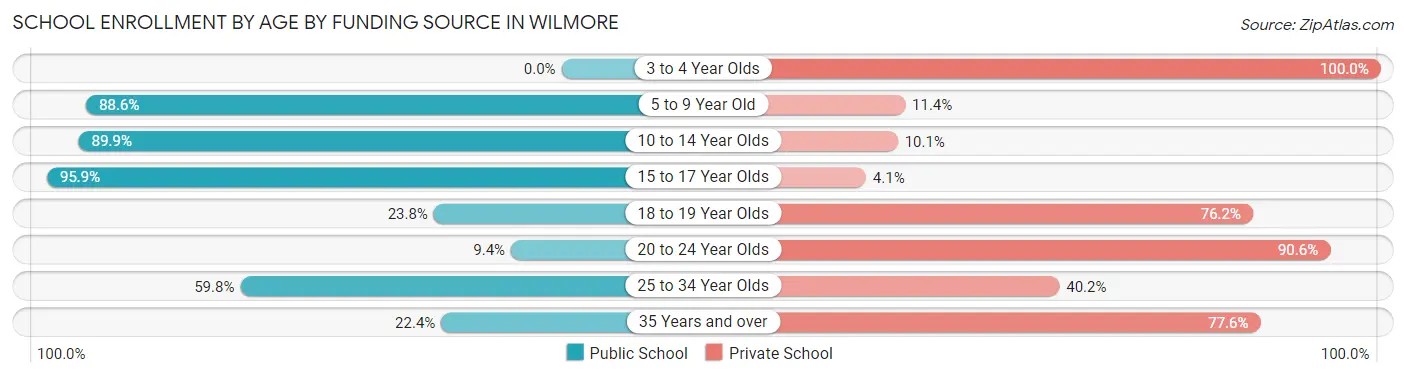
School Enrollment by Age by Funding Source in Wilmore
Out of a total of 2,280 students who are enrolled in schools in Wilmore, 1,172 (51.4%) attend a private institution, while the remaining 1,108 (48.6%) are enrolled in public schools. The age group of 3 to 4 year olds has the highest likelihood of being enrolled in private schools, with 38 (100.0% in the age bracket) enrolled. Conversely, the age group of 15 to 17 year olds has the lowest likelihood of being enrolled in a private school, with 278 (95.9% in the age bracket) attending a public institution.
| Age Bracket | Public School | Private School |
| 3 to 4 Year Olds | 0 (0.0%) | 38 (100.0%) |
| 5 to 9 Year Old | 333 (88.6%) | 43 (11.4%) |
| 10 to 14 Year Olds | 143 (89.9%) | 16 (10.1%) |
| 15 to 17 Year Olds | 278 (95.9%) | 12 (4.1%) |
| 18 to 19 Year Olds | 149 (23.8%) | 477 (76.2%) |
| 20 to 24 Year Olds | 42 (9.4%) | 404 (90.6%) |
| 25 to 34 Year Olds | 137 (59.8%) | 92 (40.2%) |
| 35 Years and over | 26 (22.4%) | 90 (77.6%) |
| Total | 1,108 (48.6%) | 1,172 (51.4%) |
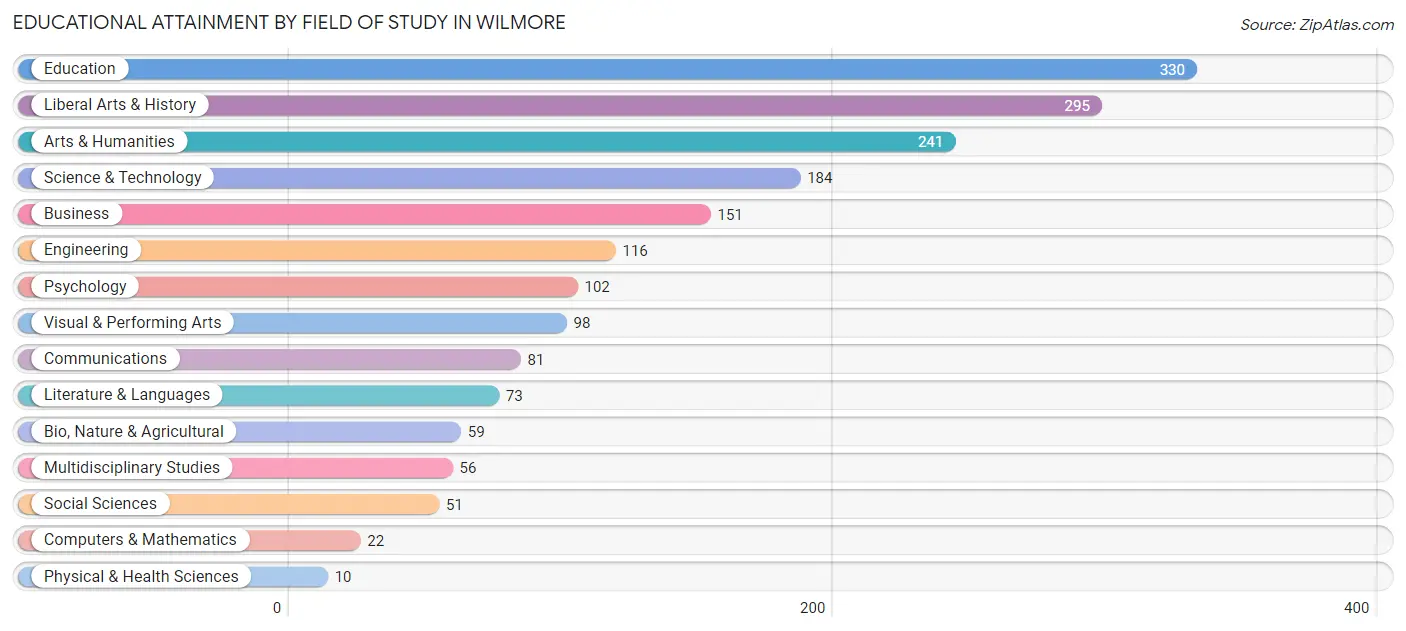
Educational Attainment by Field of Study in Wilmore
Education (330 | 17.7%), liberal arts & history (295 | 15.8%), arts & humanities (241 | 12.9%), science & technology (184 | 9.8%), and business (151 | 8.1%) are the most common fields of study among 1,869 individuals in Wilmore who have obtained a bachelor's degree or higher.
| Field of Study | # Graduates | % Graduates |
| Computers & Mathematics | 22 | 1.2% |
| Bio, Nature & Agricultural | 59 | 3.2% |
| Physical & Health Sciences | 10 | 0.5% |
| Psychology | 102 | 5.5% |
| Social Sciences | 51 | 2.7% |
| Engineering | 116 | 6.2% |
| Multidisciplinary Studies | 56 | 3.0% |
| Science & Technology | 184 | 9.8% |
| Business | 151 | 8.1% |
| Education | 330 | 17.7% |
| Literature & Languages | 73 | 3.9% |
| Liberal Arts & History | 295 | 15.8% |
| Visual & Performing Arts | 98 | 5.2% |
| Communications | 81 | 4.3% |
| Arts & Humanities | 241 | 12.9% |
| Total | 1,869 | 100.0% |
Transportation & Commute in Wilmore
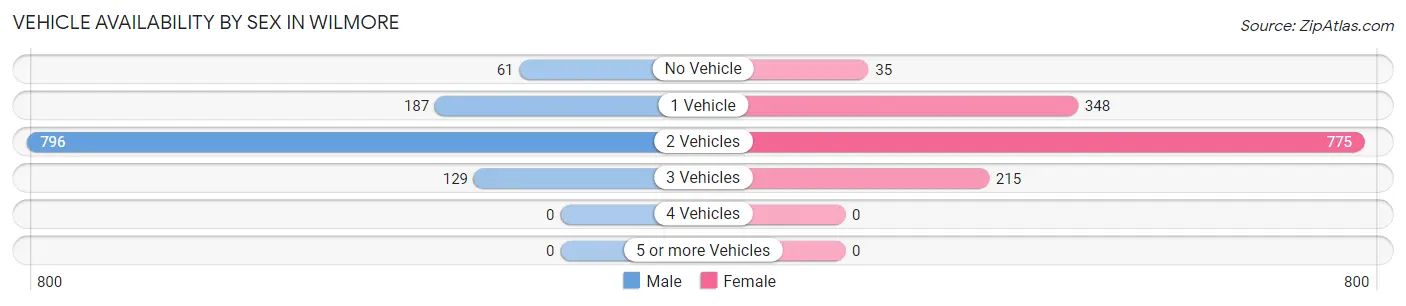
Vehicle Availability by Sex in Wilmore
The most prevalent vehicle ownership categories in Wilmore are males with 2 vehicles (796, accounting for 67.9%) and females with 2 vehicles (775, making up 58.0%).
| Vehicles Available | Male | Female |
| No Vehicle | 61 (5.2%) | 35 (2.5%) |
| 1 Vehicle | 187 (15.9%) | 348 (25.4%) |
| 2 Vehicles | 796 (67.9%) | 775 (56.5%) |
| 3 Vehicles | 129 (11.0%) | 215 (15.7%) |
| 4 Vehicles | 0 (0.0%) | 0 (0.0%) |
| 5 or more Vehicles | 0 (0.0%) | 0 (0.0%) |
| Total | 1,173 (100.0%) | 1,373 (100.0%) |
Commute Time in Wilmore
The most frequently occuring commute durations in Wilmore are 15 to 19 minutes (697 commuters, 25.3%), 5 to 9 minutes (432 commuters, 15.7%), and 30 to 34 minutes (361 commuters, 13.1%).
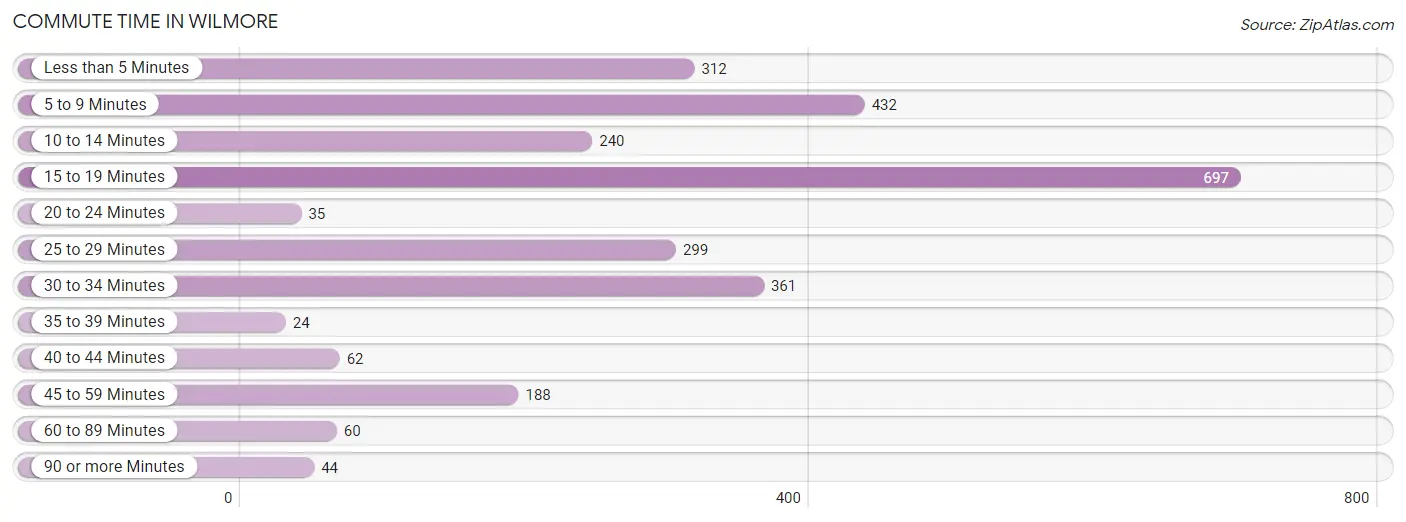
| Commute Time | # Commuters | % Commuters |
| Less than 5 Minutes | 312 | 11.3% |
| 5 to 9 Minutes | 432 | 15.7% |
| 10 to 14 Minutes | 240 | 8.7% |
| 15 to 19 Minutes | 697 | 25.3% |
| 20 to 24 Minutes | 35 | 1.3% |
| 25 to 29 Minutes | 299 | 10.9% |
| 30 to 34 Minutes | 361 | 13.1% |
| 35 to 39 Minutes | 24 | 0.9% |
| 40 to 44 Minutes | 62 | 2.2% |
| 45 to 59 Minutes | 188 | 6.8% |
| 60 to 89 Minutes | 60 | 2.2% |
| 90 or more Minutes | 44 | 1.6% |
Commute Time by Sex in Wilmore
The most common commute times in Wilmore are 15 to 19 minutes (438 commuters, 34.2%) for males and 15 to 19 minutes (259 commuters, 17.6%) for females.
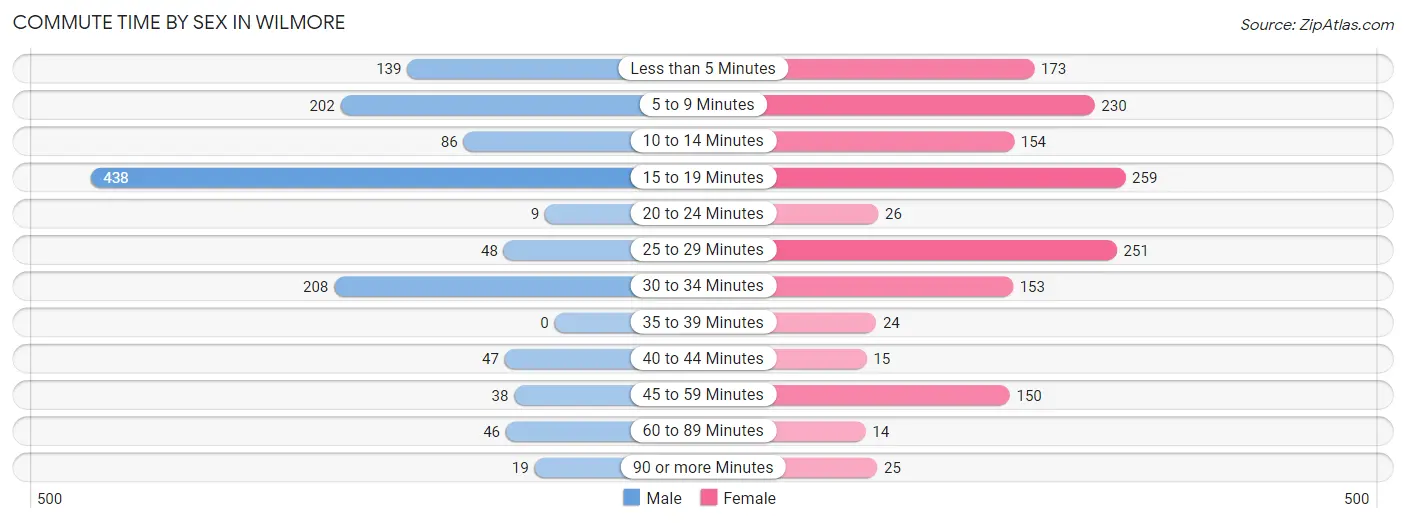
| Commute Time | Male | Female |
| Less than 5 Minutes | 139 (10.9%) | 173 (11.7%) |
| 5 to 9 Minutes | 202 (15.8%) | 230 (15.6%) |
| 10 to 14 Minutes | 86 (6.7%) | 154 (10.4%) |
| 15 to 19 Minutes | 438 (34.2%) | 259 (17.6%) |
| 20 to 24 Minutes | 9 (0.7%) | 26 (1.8%) |
| 25 to 29 Minutes | 48 (3.7%) | 251 (17.0%) |
| 30 to 34 Minutes | 208 (16.3%) | 153 (10.4%) |
| 35 to 39 Minutes | 0 (0.0%) | 24 (1.6%) |
| 40 to 44 Minutes | 47 (3.7%) | 15 (1.0%) |
| 45 to 59 Minutes | 38 (3.0%) | 150 (10.2%) |
| 60 to 89 Minutes | 46 (3.6%) | 14 (0.9%) |
| 90 or more Minutes | 19 (1.5%) | 25 (1.7%) |
Time of Departure to Work by Sex in Wilmore
The most frequent times of departure to work in Wilmore are 10:00 AM to 10:59 AM (279, 21.8%) for males and 7:00 AM to 7:29 AM (411, 27.9%) for females.
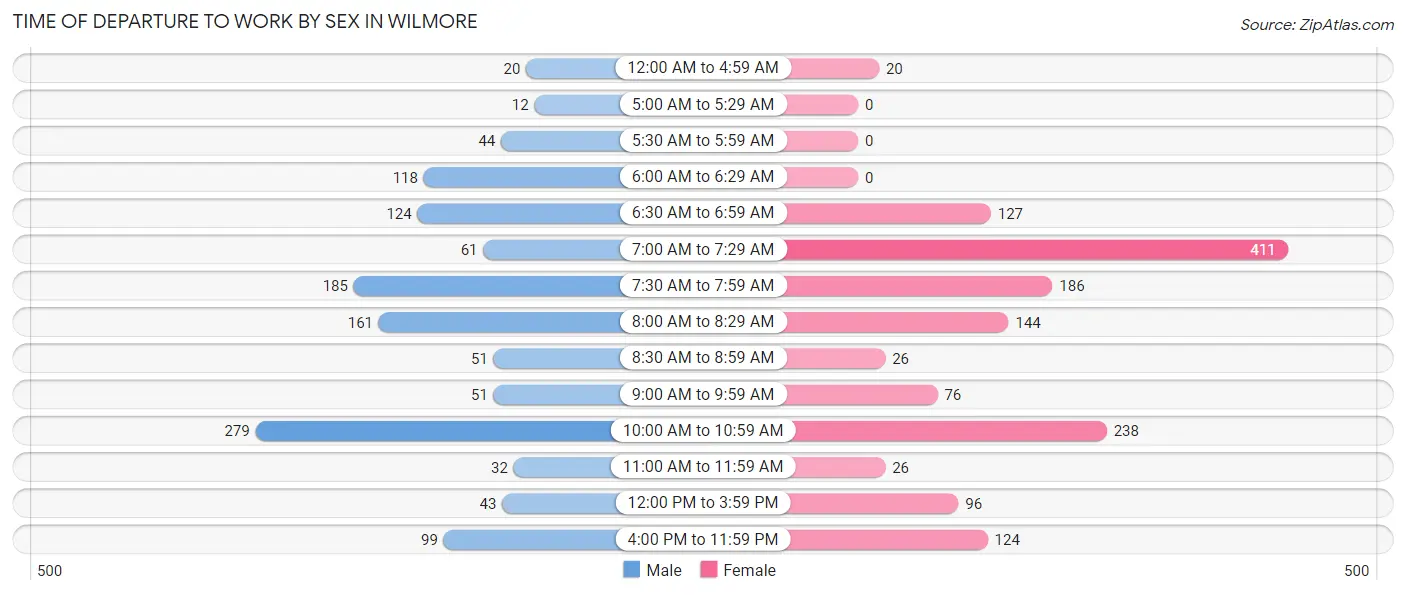
| Time of Departure | Male | Female |
| 12:00 AM to 4:59 AM | 20 (1.6%) | 20 (1.4%) |
| 5:00 AM to 5:29 AM | 12 (0.9%) | 0 (0.0%) |
| 5:30 AM to 5:59 AM | 44 (3.4%) | 0 (0.0%) |
| 6:00 AM to 6:29 AM | 118 (9.2%) | 0 (0.0%) |
| 6:30 AM to 6:59 AM | 124 (9.7%) | 127 (8.6%) |
| 7:00 AM to 7:29 AM | 61 (4.8%) | 411 (27.9%) |
| 7:30 AM to 7:59 AM | 185 (14.4%) | 186 (12.6%) |
| 8:00 AM to 8:29 AM | 161 (12.6%) | 144 (9.8%) |
| 8:30 AM to 8:59 AM | 51 (4.0%) | 26 (1.8%) |
| 9:00 AM to 9:59 AM | 51 (4.0%) | 76 (5.2%) |
| 10:00 AM to 10:59 AM | 279 (21.8%) | 238 (16.2%) |
| 11:00 AM to 11:59 AM | 32 (2.5%) | 26 (1.8%) |
| 12:00 PM to 3:59 PM | 43 (3.4%) | 96 (6.5%) |
| 4:00 PM to 11:59 PM | 99 (7.7%) | 124 (8.4%) |
| Total | 1,280 (100.0%) | 1,474 (100.0%) |
Housing Occupancy in Wilmore
Occupancy by Ownership in Wilmore
Of the total 1,835 dwellings in Wilmore, owner-occupied units account for 916 (49.9%), while renter-occupied units make up 919 (50.1%).
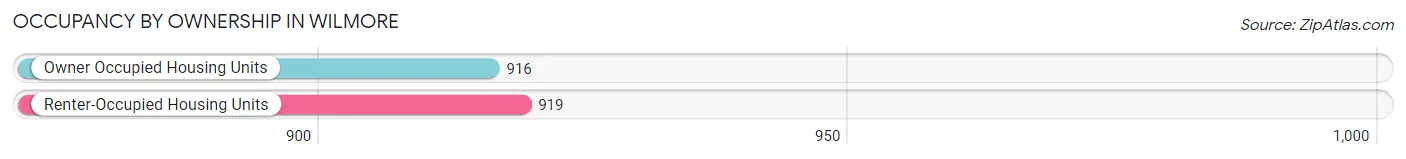
| Occupancy | # Housing Units | % Housing Units |
| Owner Occupied Housing Units | 916 | 49.9% |
| Renter-Occupied Housing Units | 919 | 50.1% |
| Total Occupied Housing Units | 1,835 | 100.0% |
Occupancy by Household Size in Wilmore
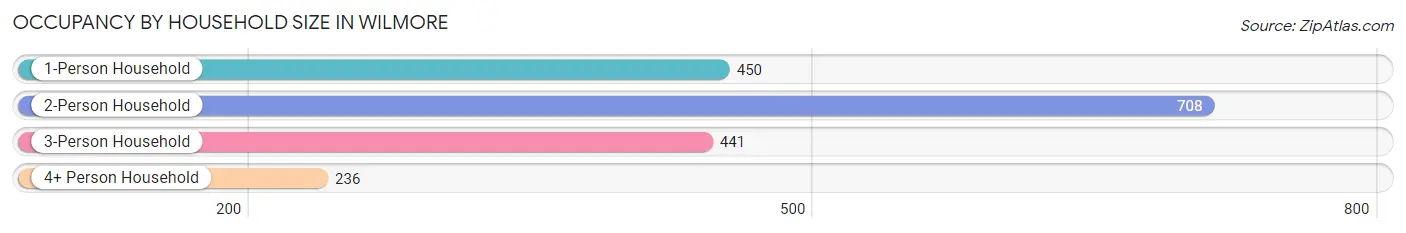
| Household Size | # Housing Units | % Housing Units |
| 1-Person Household | 450 | 24.5% |
| 2-Person Household | 708 | 38.6% |
| 3-Person Household | 441 | 24.0% |
| 4+ Person Household | 236 | 12.9% |
| Total Housing Units | 1,835 | 100.0% |
Occupancy by Ownership by Household Size in Wilmore
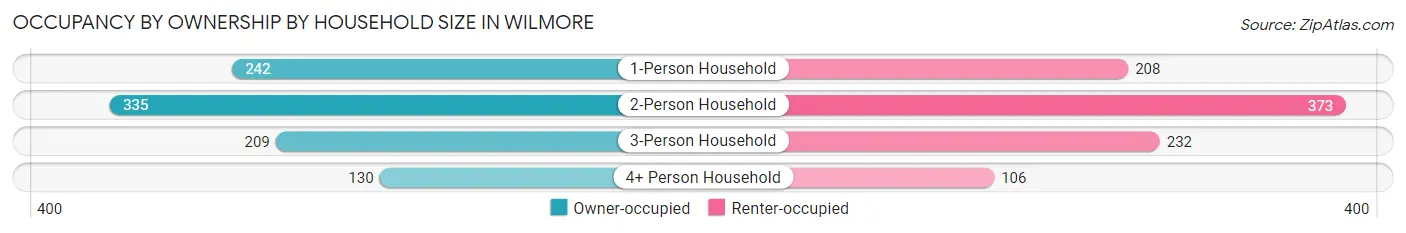
| Household Size | Owner-occupied | Renter-occupied |
| 1-Person Household | 242 (53.8%) | 208 (46.2%) |
| 2-Person Household | 335 (47.3%) | 373 (52.7%) |
| 3-Person Household | 209 (47.4%) | 232 (52.6%) |
| 4+ Person Household | 130 (55.1%) | 106 (44.9%) |
| Total Housing Units | 916 (49.9%) | 919 (50.1%) |
Occupancy by Educational Attainment in Wilmore
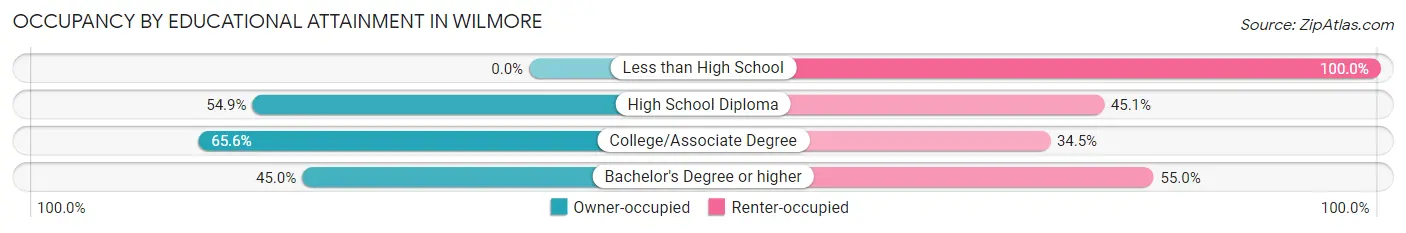
| Household Size | Owner-occupied | Renter-occupied |
| Less than High School | 0 (0.0%) | 55 (100.0%) |
| High School Diploma | 96 (54.9%) | 79 (45.1%) |
| College/Associate Degree | 312 (65.5%) | 164 (34.4%) |
| Bachelor's Degree or higher | 508 (45.0%) | 621 (55.0%) |
Occupancy by Age of Householder in Wilmore
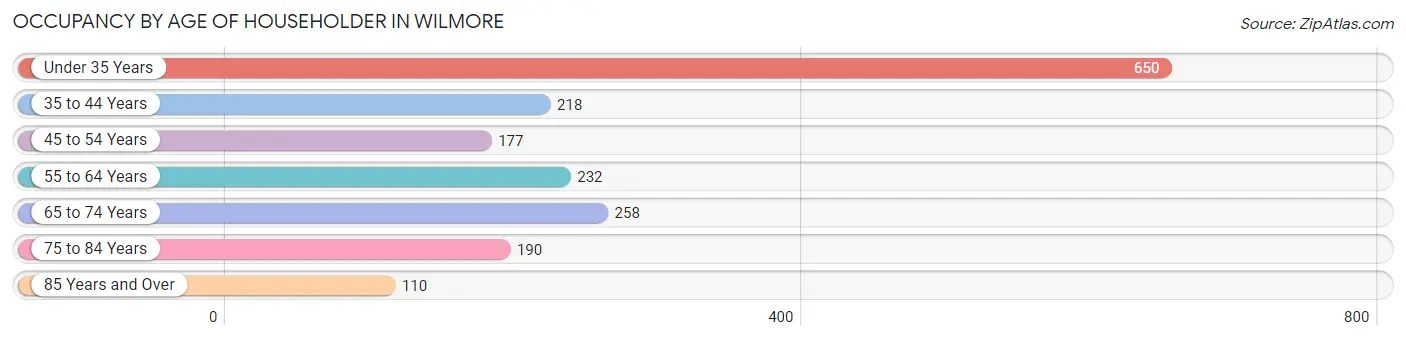
| Age Bracket | # Households | % Households |
| Under 35 Years | 650 | 35.4% |
| 35 to 44 Years | 218 | 11.9% |
| 45 to 54 Years | 177 | 9.7% |
| 55 to 64 Years | 232 | 12.6% |
| 65 to 74 Years | 258 | 14.1% |
| 75 to 84 Years | 190 | 10.3% |
| 85 Years and Over | 110 | 6.0% |
| Total | 1,835 | 100.0% |
Housing Finances in Wilmore
Median Income by Occupancy in Wilmore
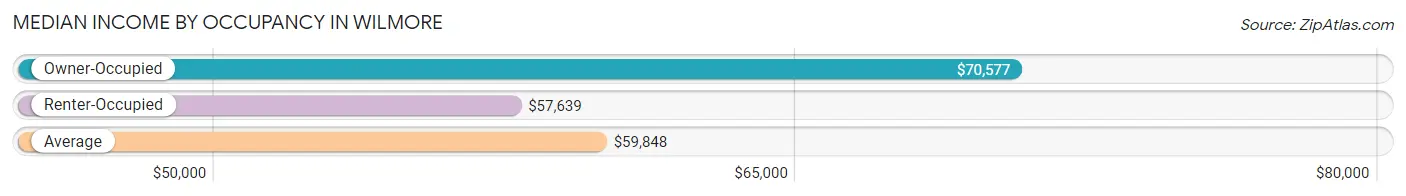
| Occupancy Type | # Households | Median Income |
| Owner-Occupied | 916 (49.9%) | $70,577 |
| Renter-Occupied | 919 (50.1%) | $57,639 |
| Average | 1,835 (100.0%) | $59,848 |
Occupancy by Householder Income Bracket in Wilmore
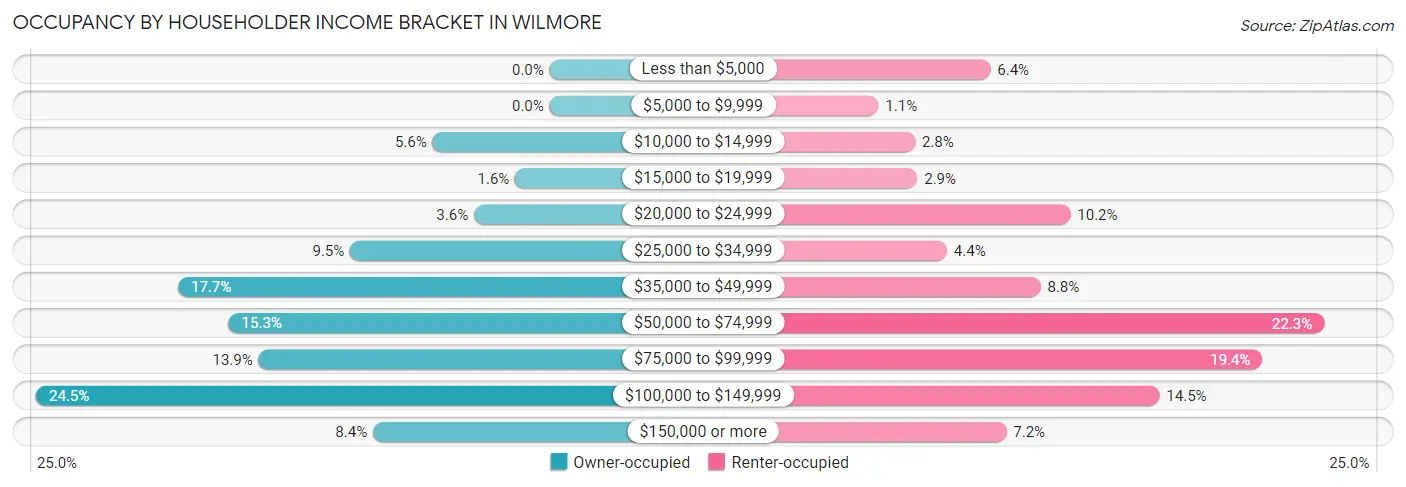
| Income Bracket | Owner-occupied | Renter-occupied |
| Less than $5,000 | 0 (0.0%) | 59 (6.4%) |
| $5,000 to $9,999 | 0 (0.0%) | 10 (1.1%) |
| $10,000 to $14,999 | 51 (5.6%) | 26 (2.8%) |
| $15,000 to $19,999 | 15 (1.6%) | 27 (2.9%) |
| $20,000 to $24,999 | 33 (3.6%) | 94 (10.2%) |
| $25,000 to $34,999 | 87 (9.5%) | 40 (4.3%) |
| $35,000 to $49,999 | 162 (17.7%) | 81 (8.8%) |
| $50,000 to $74,999 | 140 (15.3%) | 205 (22.3%) |
| $75,000 to $99,999 | 127 (13.9%) | 178 (19.4%) |
| $100,000 to $149,999 | 224 (24.4%) | 133 (14.5%) |
| $150,000 or more | 77 (8.4%) | 66 (7.2%) |
| Total | 916 (100.0%) | 919 (100.0%) |
Monthly Housing Cost Tiers in Wilmore
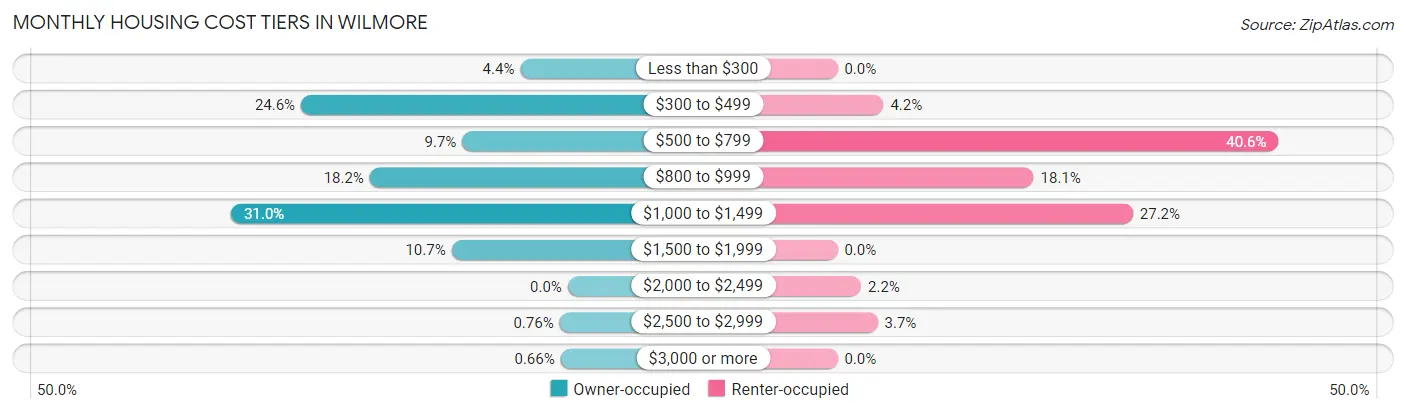
| Monthly Cost | Owner-occupied | Renter-occupied |
| Less than $300 | 40 (4.4%) | 0 (0.0%) |
| $300 to $499 | 225 (24.6%) | 39 (4.2%) |
| $500 to $799 | 89 (9.7%) | 373 (40.6%) |
| $800 to $999 | 167 (18.2%) | 166 (18.1%) |
| $1,000 to $1,499 | 284 (31.0%) | 250 (27.2%) |
| $1,500 to $1,999 | 98 (10.7%) | 0 (0.0%) |
| $2,000 to $2,499 | 0 (0.0%) | 20 (2.2%) |
| $2,500 to $2,999 | 7 (0.8%) | 34 (3.7%) |
| $3,000 or more | 6 (0.7%) | 0 (0.0%) |
| Total | 916 (100.0%) | 919 (100.0%) |
Physical Housing Characteristics in Wilmore
Housing Structures in Wilmore
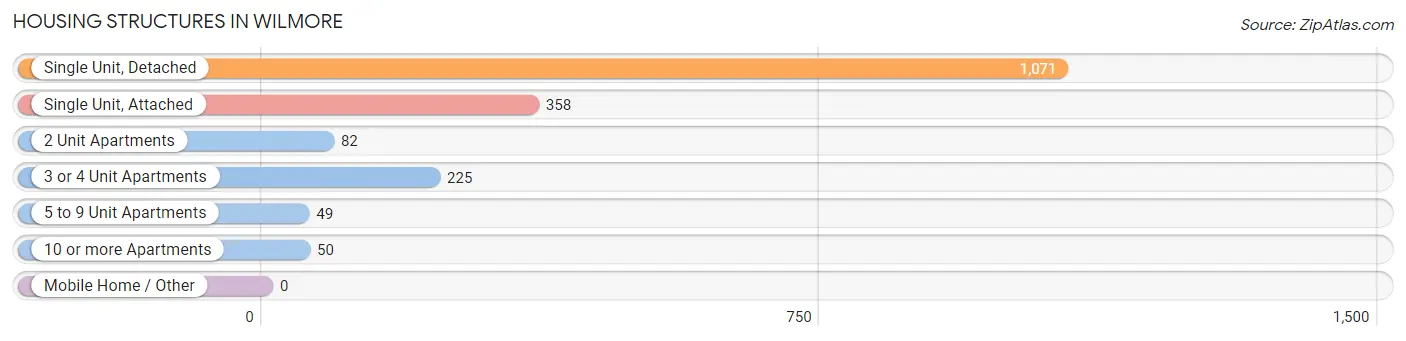
| Structure Type | # Housing Units | % Housing Units |
| Single Unit, Detached | 1,071 | 58.4% |
| Single Unit, Attached | 358 | 19.5% |
| 2 Unit Apartments | 82 | 4.5% |
| 3 or 4 Unit Apartments | 225 | 12.3% |
| 5 to 9 Unit Apartments | 49 | 2.7% |
| 10 or more Apartments | 50 | 2.7% |
| Mobile Home / Other | 0 | 0.0% |
| Total | 1,835 | 100.0% |
Housing Structures by Occupancy in Wilmore
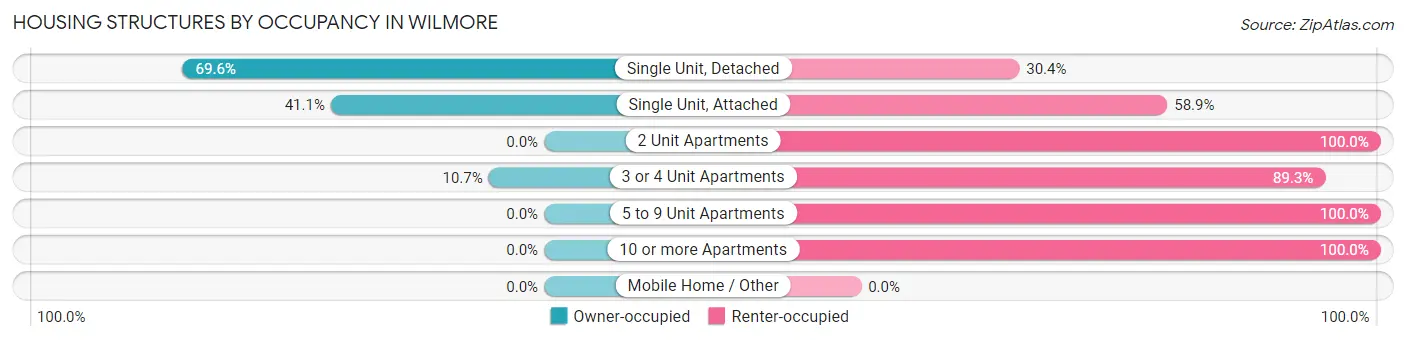
| Structure Type | Owner-occupied | Renter-occupied |
| Single Unit, Detached | 745 (69.6%) | 326 (30.4%) |
| Single Unit, Attached | 147 (41.1%) | 211 (58.9%) |
| 2 Unit Apartments | 0 (0.0%) | 82 (100.0%) |
| 3 or 4 Unit Apartments | 24 (10.7%) | 201 (89.3%) |
| 5 to 9 Unit Apartments | 0 (0.0%) | 49 (100.0%) |
| 10 or more Apartments | 0 (0.0%) | 50 (100.0%) |
| Mobile Home / Other | 0 (0.0%) | 0 (0.0%) |
| Total | 916 (49.9%) | 919 (50.1%) |
Housing Structures by Number of Rooms in Wilmore
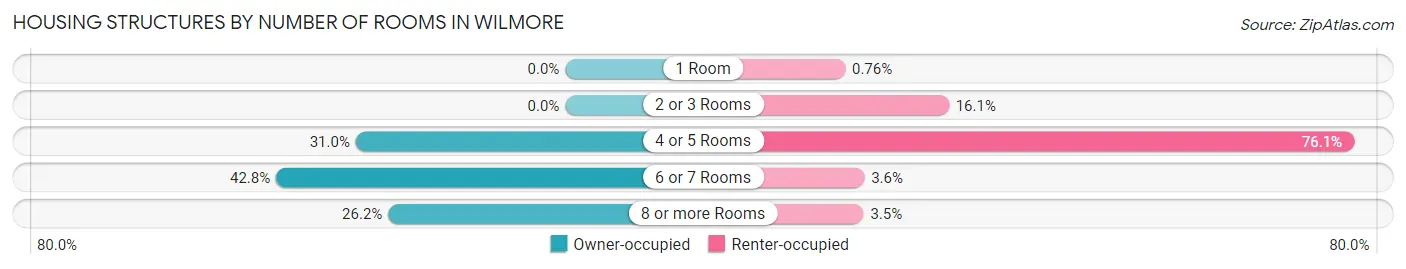
| Number of Rooms | Owner-occupied | Renter-occupied |
| 1 Room | 0 (0.0%) | 7 (0.8%) |
| 2 or 3 Rooms | 0 (0.0%) | 148 (16.1%) |
| 4 or 5 Rooms | 284 (31.0%) | 699 (76.1%) |
| 6 or 7 Rooms | 392 (42.8%) | 33 (3.6%) |
| 8 or more Rooms | 240 (26.2%) | 32 (3.5%) |
| Total | 916 (100.0%) | 919 (100.0%) |
Housing Structure by Heating Type in Wilmore
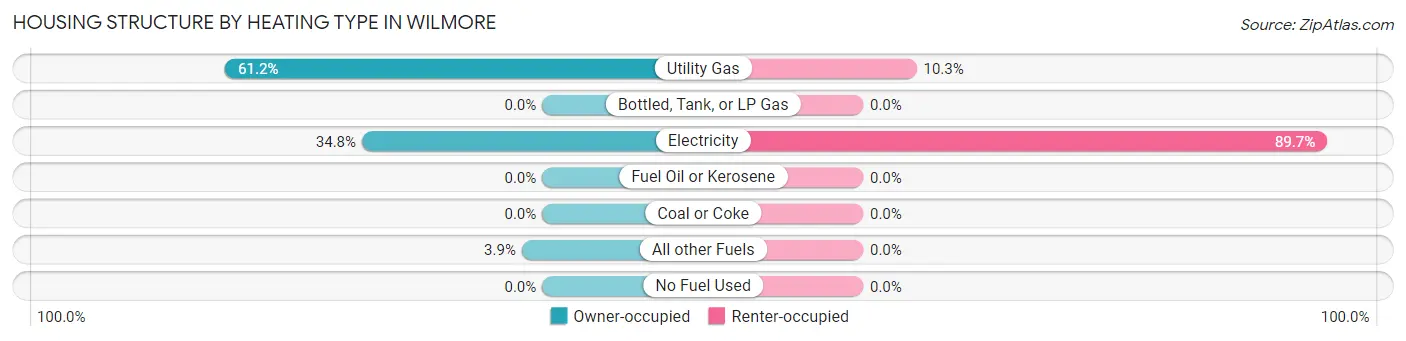
| Heating Type | Owner-occupied | Renter-occupied |
| Utility Gas | 561 (61.2%) | 95 (10.3%) |
| Bottled, Tank, or LP Gas | 0 (0.0%) | 0 (0.0%) |
| Electricity | 319 (34.8%) | 824 (89.7%) |
| Fuel Oil or Kerosene | 0 (0.0%) | 0 (0.0%) |
| Coal or Coke | 0 (0.0%) | 0 (0.0%) |
| All other Fuels | 36 (3.9%) | 0 (0.0%) |
| No Fuel Used | 0 (0.0%) | 0 (0.0%) |
| Total | 916 (100.0%) | 919 (100.0%) |
Household Vehicle Usage in Wilmore
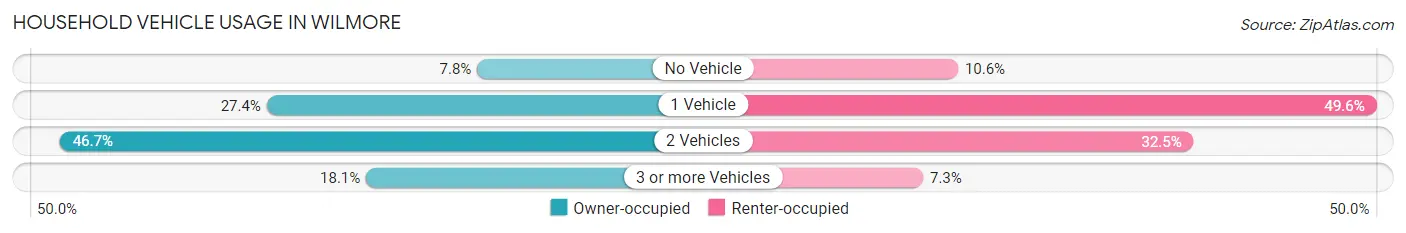
| Vehicles per Household | Owner-occupied | Renter-occupied |
| No Vehicle | 71 (7.7%) | 97 (10.5%) |
| 1 Vehicle | 251 (27.4%) | 456 (49.6%) |
| 2 Vehicles | 428 (46.7%) | 299 (32.5%) |
| 3 or more Vehicles | 166 (18.1%) | 67 (7.3%) |
| Total | 916 (100.0%) | 919 (100.0%) |
Real Estate & Mortgages in Wilmore
Real Estate and Mortgage Overview in Wilmore
| Characteristic | Without Mortgage | With Mortgage |
| Housing Units | 372 | 544 |
| Median Property Value | $211,400 | $193,000 |
| Median Household Income | $45,459 | $30 |
| Monthly Housing Costs | $371 | $6 |
| Real Estate Taxes | $1,976 | $10 |
Property Value by Mortgage Status in Wilmore
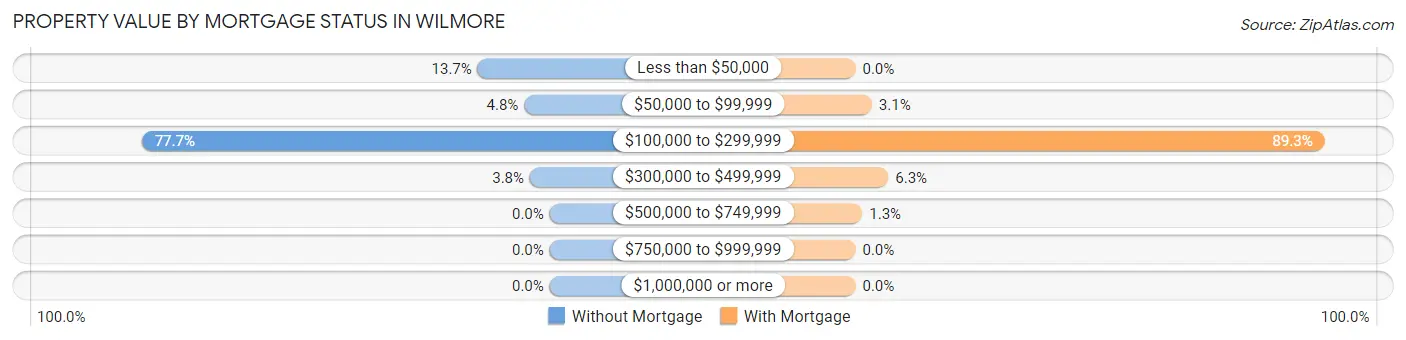
| Property Value | Without Mortgage | With Mortgage |
| Less than $50,000 | 51 (13.7%) | 0 (0.0%) |
| $50,000 to $99,999 | 18 (4.8%) | 17 (3.1%) |
| $100,000 to $299,999 | 289 (77.7%) | 486 (89.3%) |
| $300,000 to $499,999 | 14 (3.8%) | 34 (6.2%) |
| $500,000 to $749,999 | 0 (0.0%) | 7 (1.3%) |
| $750,000 to $999,999 | 0 (0.0%) | 0 (0.0%) |
| $1,000,000 or more | 0 (0.0%) | 0 (0.0%) |
| Total | 372 (100.0%) | 544 (100.0%) |
Household Income by Mortgage Status in Wilmore
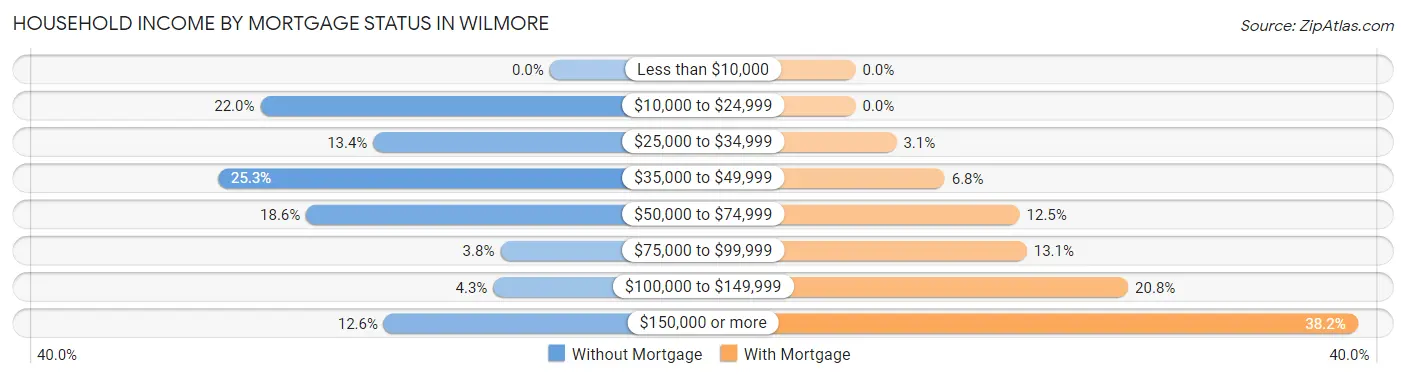
| Household Income | Without Mortgage | With Mortgage |
| Less than $10,000 | 0 (0.0%) | 0 (0.0%) |
| $10,000 to $24,999 | 82 (22.0%) | 0 (0.0%) |
| $25,000 to $34,999 | 50 (13.4%) | 17 (3.1%) |
| $35,000 to $49,999 | 94 (25.3%) | 37 (6.8%) |
| $50,000 to $74,999 | 69 (18.5%) | 68 (12.5%) |
| $75,000 to $99,999 | 14 (3.8%) | 71 (13.1%) |
| $100,000 to $149,999 | 16 (4.3%) | 113 (20.8%) |
| $150,000 or more | 47 (12.6%) | 208 (38.2%) |
| Total | 372 (100.0%) | 544 (100.0%) |
Property Value to Household Income Ratio in Wilmore
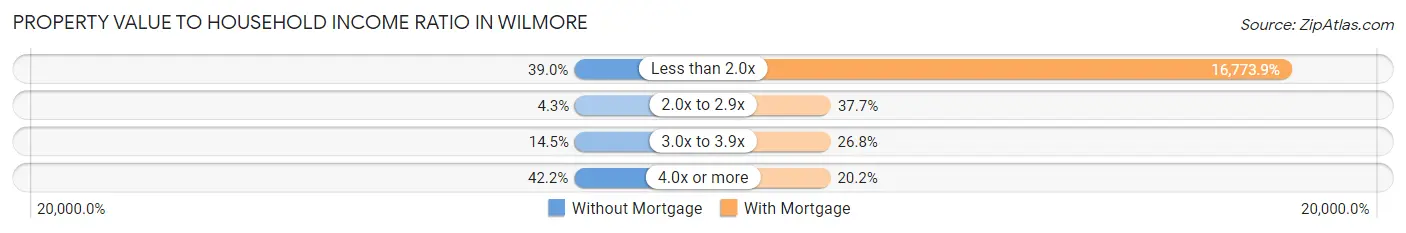
| Value-to-Income Ratio | Without Mortgage | With Mortgage |
| Less than 2.0x | 145 (39.0%) | 91,250 (16,773.9%) |
| 2.0x to 2.9x | 16 (4.3%) | 205 (37.7%) |
| 3.0x to 3.9x | 54 (14.5%) | 146 (26.8%) |
| 4.0x or more | 157 (42.2%) | 110 (20.2%) |
| Total | 372 (100.0%) | 544 (100.0%) |
Real Estate Taxes by Mortgage Status in Wilmore
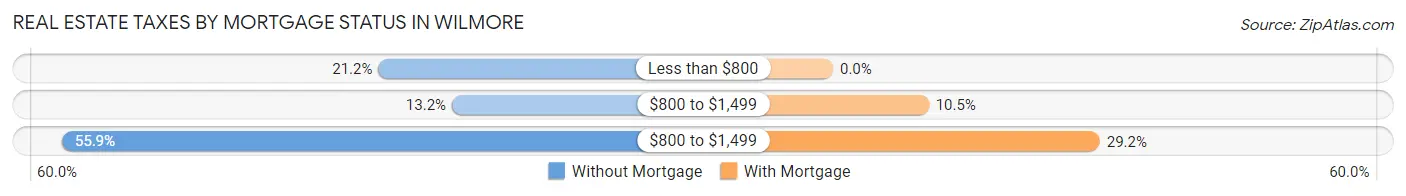
| Property Taxes | Without Mortgage | With Mortgage |
| Less than $800 | 79 (21.2%) | 0 (0.0%) |
| $800 to $1,499 | 49 (13.2%) | 57 (10.5%) |
| $800 to $1,499 | 208 (55.9%) | 159 (29.2%) |
| Total | 372 (100.0%) | 544 (100.0%) |
Health & Disability in Wilmore
Health Insurance Coverage by Age in Wilmore
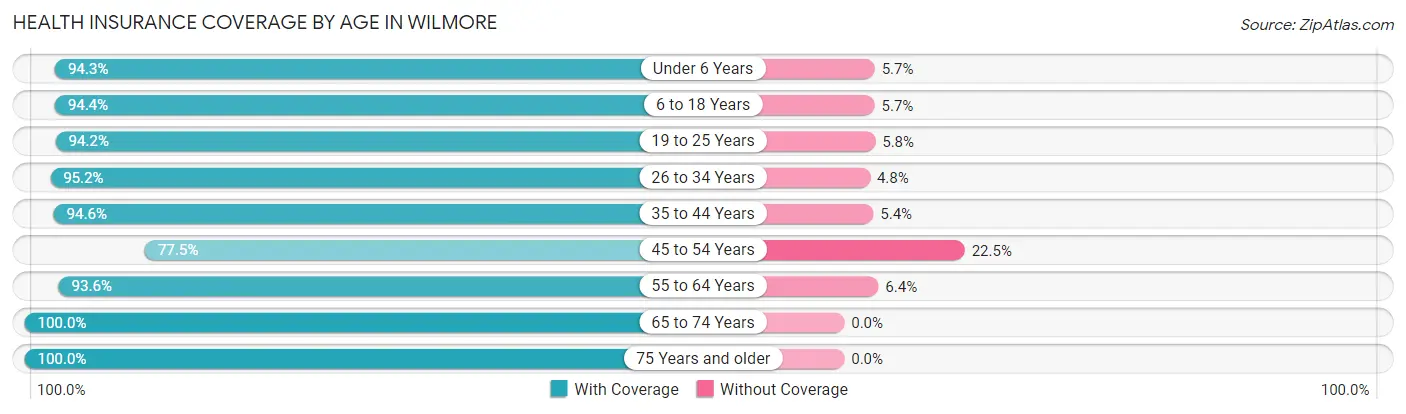
| Age Bracket | With Coverage | Without Coverage |
| Under 6 Years | 366 (94.3%) | 22 (5.7%) |
| 6 to 18 Years | 969 (94.4%) | 58 (5.7%) |
| 19 to 25 Years | 1,092 (94.2%) | 67 (5.8%) |
| 26 to 34 Years | 1,294 (95.2%) | 65 (4.8%) |
| 35 to 44 Years | 401 (94.6%) | 23 (5.4%) |
| 45 to 54 Years | 259 (77.5%) | 75 (22.5%) |
| 55 to 64 Years | 368 (93.6%) | 25 (6.4%) |
| 65 to 74 Years | 397 (100.0%) | 0 (0.0%) |
| 75 Years and older | 353 (100.0%) | 0 (0.0%) |
| Total | 5,499 (94.3%) | 335 (5.7%) |
Health Insurance Coverage by Citizenship Status in Wilmore
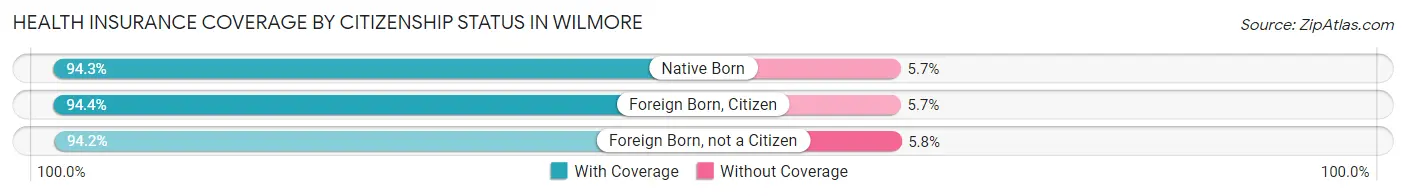
| Citizenship Status | With Coverage | Without Coverage |
| Native Born | 366 (94.3%) | 22 (5.7%) |
| Foreign Born, Citizen | 969 (94.4%) | 58 (5.7%) |
| Foreign Born, not a Citizen | 1,092 (94.2%) | 67 (5.8%) |
Health Insurance Coverage by Household Income in Wilmore
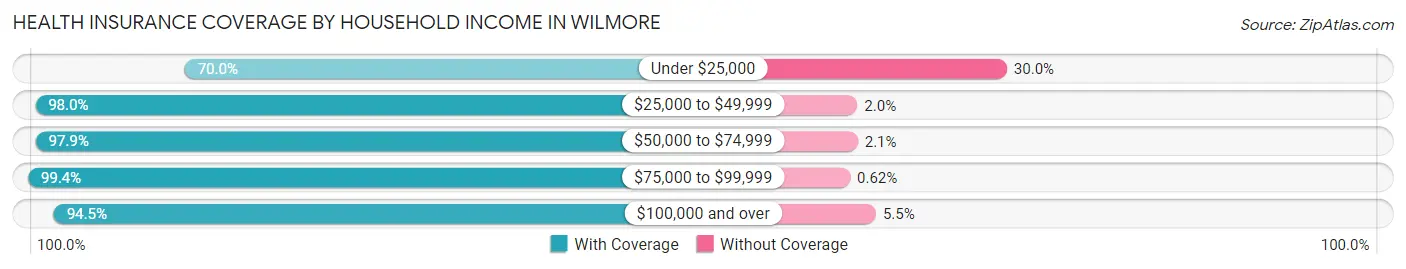
| Household Income | With Coverage | Without Coverage |
| Under $25,000 | 434 (70.0%) | 186 (30.0%) |
| $25,000 to $49,999 | 838 (98.0%) | 17 (2.0%) |
| $50,000 to $74,999 | 809 (97.9%) | 17 (2.1%) |
| $75,000 to $99,999 | 1,121 (99.4%) | 7 (0.6%) |
| $100,000 and over | 1,314 (94.5%) | 76 (5.5%) |
Public vs Private Health Insurance Coverage by Age in Wilmore
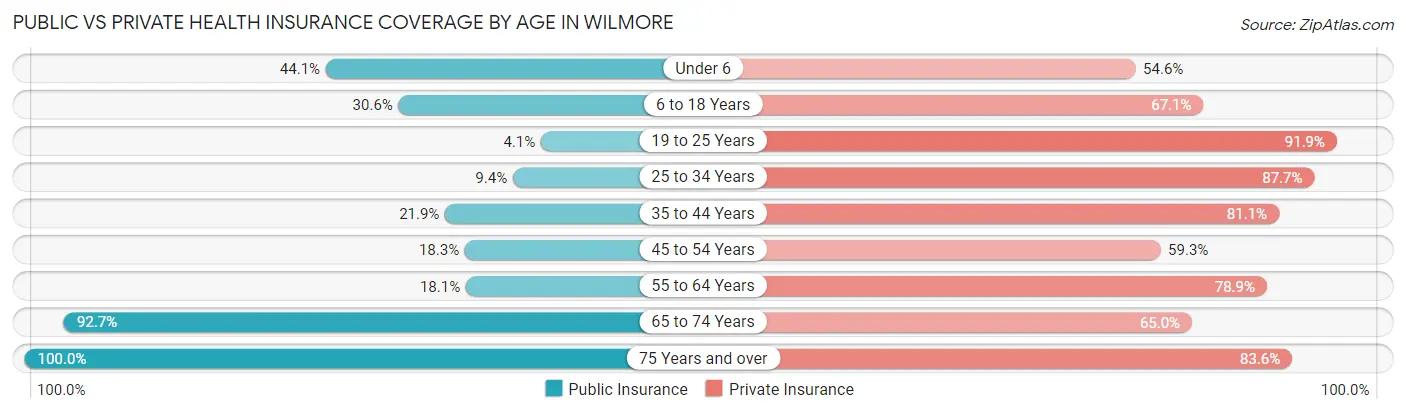
| Age Bracket | Public Insurance | Private Insurance |
| Under 6 | 171 (44.1%) | 212 (54.6%) |
| 6 to 18 Years | 314 (30.6%) | 689 (67.1%) |
| 19 to 25 Years | 48 (4.1%) | 1,065 (91.9%) |
| 25 to 34 Years | 127 (9.3%) | 1,192 (87.7%) |
| 35 to 44 Years | 93 (21.9%) | 344 (81.1%) |
| 45 to 54 Years | 61 (18.3%) | 198 (59.3%) |
| 55 to 64 Years | 71 (18.1%) | 310 (78.9%) |
| 65 to 74 Years | 368 (92.7%) | 258 (65.0%) |
| 75 Years and over | 353 (100.0%) | 295 (83.6%) |
| Total | 1,606 (27.5%) | 4,563 (78.2%) |
Disability Status by Sex by Age in Wilmore
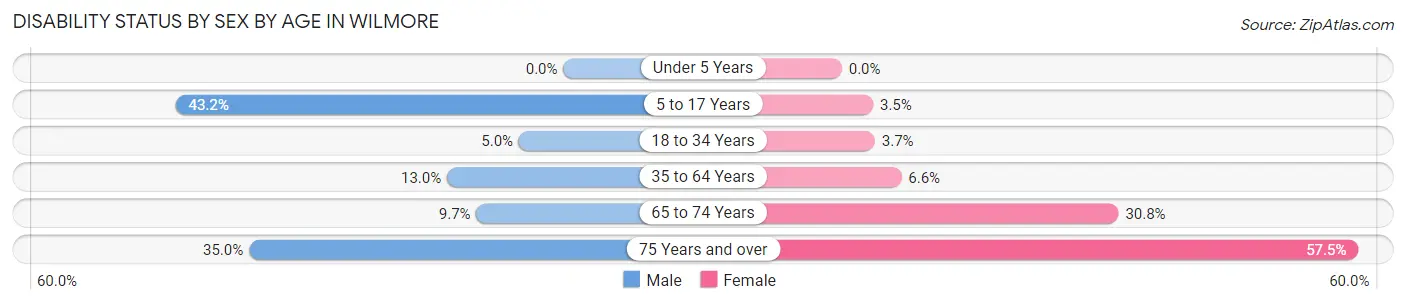
| Age Bracket | Male | Female |
| Under 5 Years | 0 (0.0%) | 0 (0.0%) |
| 5 to 17 Years | 165 (43.2%) | 18 (3.5%) |
| 18 to 34 Years | 64 (5.0%) | 53 (3.7%) |
| 35 to 64 Years | 65 (13.0%) | 43 (6.6%) |
| 65 to 74 Years | 18 (9.7%) | 65 (30.8%) |
| 75 Years and over | 42 (35.0%) | 134 (57.5%) |
Disability Class by Sex by Age in Wilmore
Disability Class: Hearing Difficulty
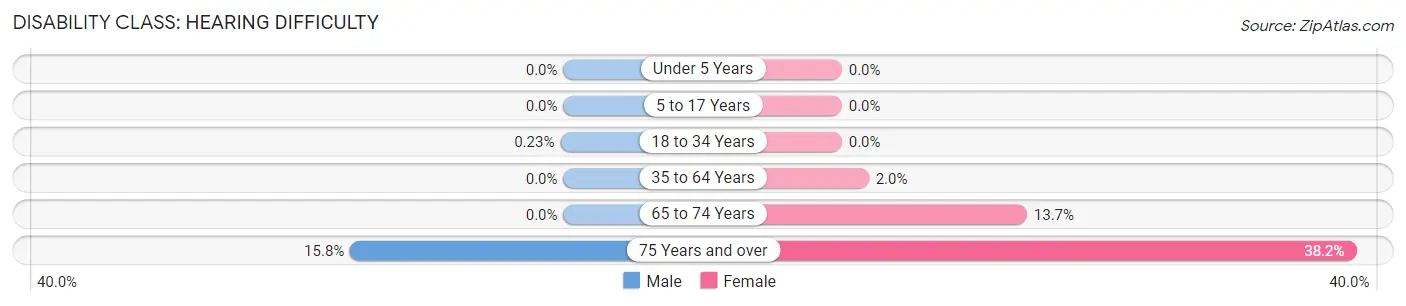
| Age Bracket | Male | Female |
| Under 5 Years | 0 (0.0%) | 0 (0.0%) |
| 5 to 17 Years | 0 (0.0%) | 0 (0.0%) |
| 18 to 34 Years | 3 (0.2%) | 0 (0.0%) |
| 35 to 64 Years | 0 (0.0%) | 13 (2.0%) |
| 65 to 74 Years | 0 (0.0%) | 29 (13.7%) |
| 75 Years and over | 19 (15.8%) | 89 (38.2%) |
Disability Class: Vision Difficulty
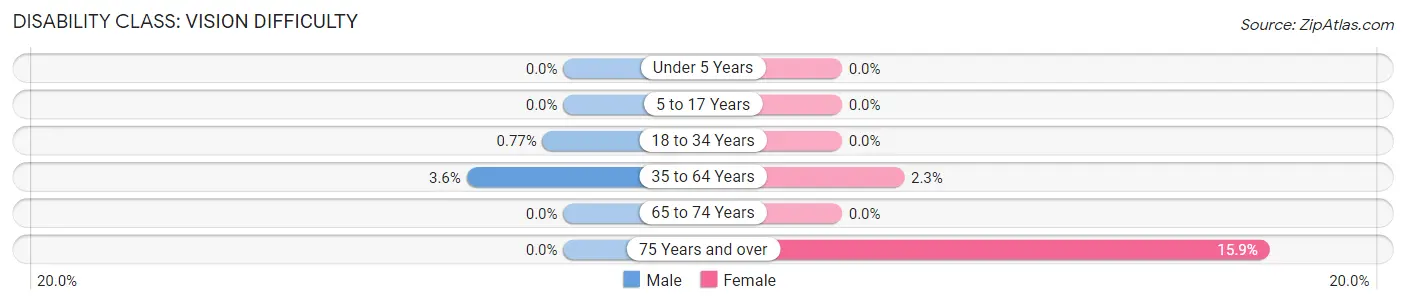
| Age Bracket | Male | Female |
| Under 5 Years | 0 (0.0%) | 0 (0.0%) |
| 5 to 17 Years | 0 (0.0%) | 0 (0.0%) |
| 18 to 34 Years | 10 (0.8%) | 0 (0.0%) |
| 35 to 64 Years | 18 (3.6%) | 15 (2.3%) |
| 65 to 74 Years | 0 (0.0%) | 0 (0.0%) |
| 75 Years and over | 0 (0.0%) | 37 (15.9%) |
Disability Class: Cognitive Difficulty
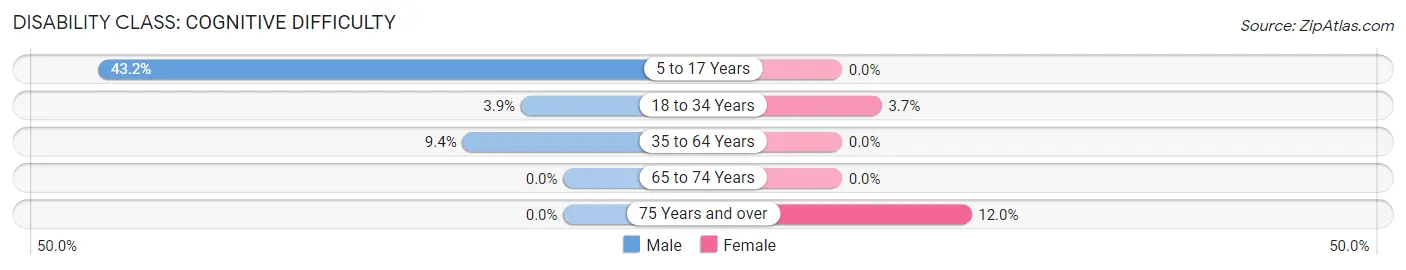
| Age Bracket | Male | Female |
| 5 to 17 Years | 165 (43.2%) | 0 (0.0%) |
| 18 to 34 Years | 51 (3.9%) | 53 (3.7%) |
| 35 to 64 Years | 47 (9.4%) | 0 (0.0%) |
| 65 to 74 Years | 0 (0.0%) | 0 (0.0%) |
| 75 Years and over | 0 (0.0%) | 28 (12.0%) |
Disability Class: Ambulatory Difficulty
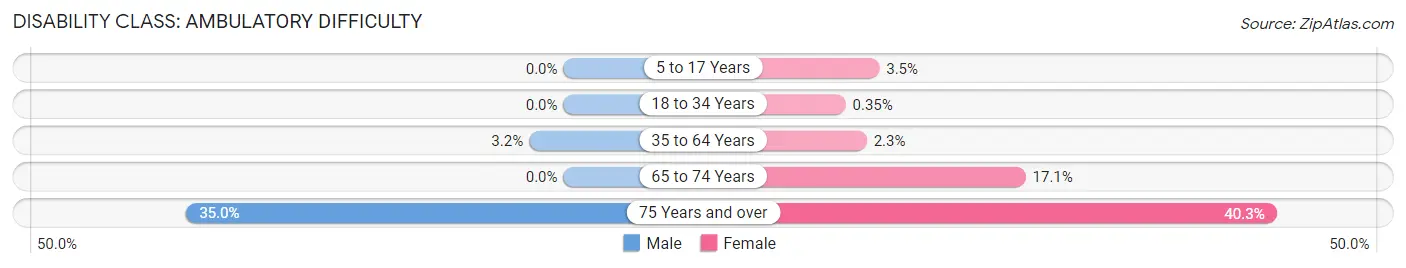
| Age Bracket | Male | Female |
| 5 to 17 Years | 0 (0.0%) | 18 (3.5%) |
| 18 to 34 Years | 0 (0.0%) | 5 (0.4%) |
| 35 to 64 Years | 16 (3.2%) | 15 (2.3%) |
| 65 to 74 Years | 0 (0.0%) | 36 (17.1%) |
| 75 Years and over | 42 (35.0%) | 94 (40.3%) |
Disability Class: Self-Care Difficulty
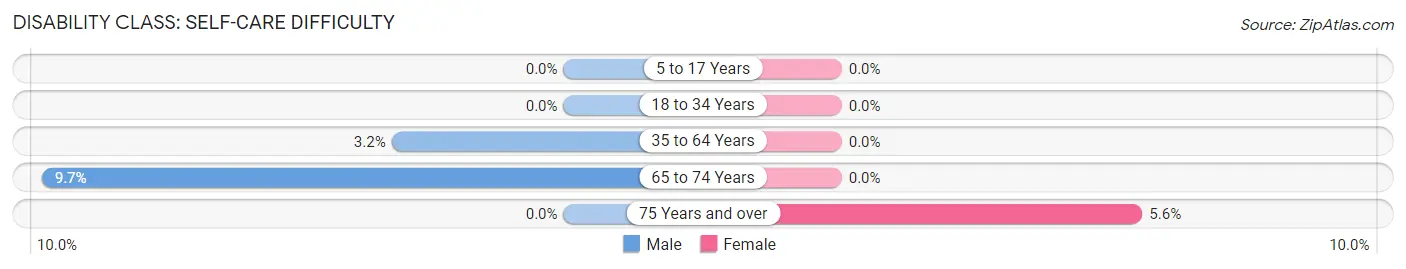
| Age Bracket | Male | Female |
| 5 to 17 Years | 0 (0.0%) | 0 (0.0%) |
| 18 to 34 Years | 0 (0.0%) | 0 (0.0%) |
| 35 to 64 Years | 16 (3.2%) | 0 (0.0%) |
| 65 to 74 Years | 18 (9.7%) | 0 (0.0%) |
| 75 Years and over | 0 (0.0%) | 13 (5.6%) |
Technology Access in Wilmore
Computing Device Access in Wilmore
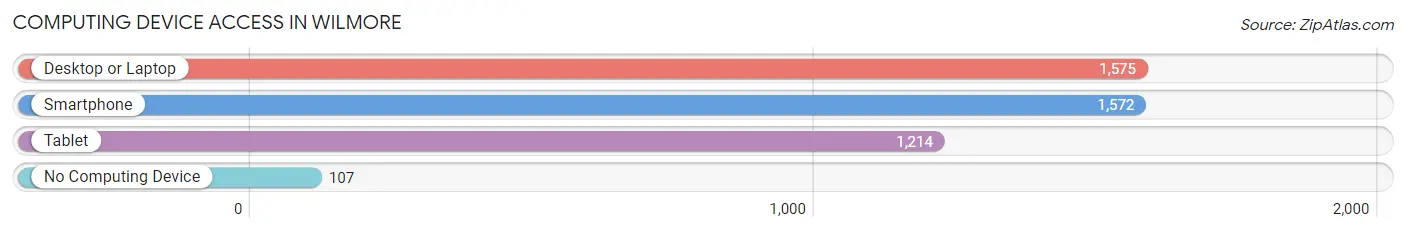
| Device Type | # Households | % Households |
| Desktop or Laptop | 1,575 | 85.8% |
| Smartphone | 1,572 | 85.7% |
| Tablet | 1,214 | 66.2% |
| No Computing Device | 107 | 5.8% |
| Total | 1,835 | 100.0% |
Internet Access in Wilmore
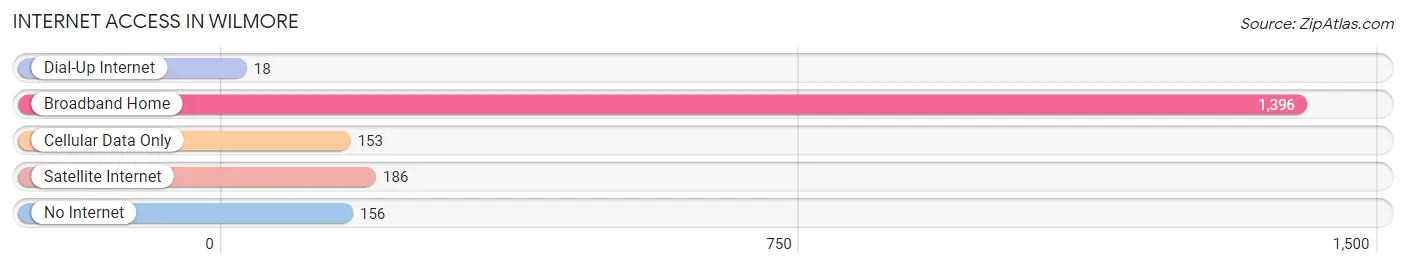
| Internet Type | # Households | % Households |
| Dial-Up Internet | 18 | 1.0% |
| Broadband Home | 1,396 | 76.1% |
| Cellular Data Only | 153 | 8.3% |
| Satellite Internet | 186 | 10.1% |
| No Internet | 156 | 8.5% |
| Total | 1,835 | 100.0% |
Wilmore Summary
Wilmore, Kentucky is a small city located in Jessamine County, Kentucky. It is situated in the heart of the Bluegrass Region, and is home to a population of approximately 3,000 people. The city is located just south of Lexington, and is part of the Lexington-Fayette Metropolitan Statistical Area.
History
Wilmore was founded in 1867 by the Reverend William Wilmore, a Methodist minister. He purchased the land from the estate of Colonel William Whitley, who had been killed in the Revolutionary War. Wilmore named the town after himself, and it was incorporated in 1872.
The city was originally a farming community, but it soon developed into a small industrial center. The first industry to locate in Wilmore was a woolen mill, which was established in 1875. This was followed by a furniture factory, a canning factory, and a brickyard.
The city was also home to a number of educational institutions. The first school in Wilmore was established in 1876, and it was followed by Asbury College in 1890. Asbury College is now known as Asbury University, and it is one of the largest private universities in the state.
Geography
Wilmore is located in the Bluegrass Region of Kentucky, and it is situated in the heart of the state. The city is located just south of Lexington, and it is part of the Lexington-Fayette Metropolitan Statistical Area.
The city is situated on the banks of the Kentucky River, and it is surrounded by rolling hills and farmland. The climate in Wilmore is mild, with hot summers and cold winters.
Economy
The economy of Wilmore is largely based on agriculture and education. The city is home to a number of farms, and it is also home to Asbury University. The university is one of the largest employers in the city, and it provides jobs for many of the city’s residents.
In addition to agriculture and education, Wilmore is also home to a number of small businesses. These businesses include restaurants, retail stores, and professional services.
Demographics
As of the 2010 census, the population of Wilmore was 3,068. The racial makeup of the city was 95.3% White, 1.7% African American, 0.3% Native American, 0.7% Asian, 0.1% Pacific Islander, and 1.9% from other races. Hispanic or Latino of any race were 2.2% of the population.
The median household income in Wilmore was $41,944, and the median family income was $50,917. The per capita income was $20,945. About 8.3% of the population was below the poverty line.
Wilmore is a small city with a rich history and a diverse economy. It is home to a number of farms, businesses, and educational institutions, and it is a great place to live and work.
Common Questions
What is Per Capita Income in Wilmore?
Per Capita income in Wilmore is $26,244.
What is the Median Family Income in Wilmore?
Median Family Income in Wilmore is $73,750.
What is the Median Household income in Wilmore?
Median Household Income in Wilmore is $59,848.
What is Income or Wage Gap in Wilmore?
Income or Wage Gap in Wilmore is 2.5%.
Women in Wilmore earn 97.5 cents for every dollar earned by a man.
What is Inequality or Gini Index in Wilmore?
Inequality or Gini Index in Wilmore is 0.38.
What is the Total Population of Wilmore?
Total Population of Wilmore is 6,017.
What is the Total Male Population of Wilmore?
Total Male Population of Wilmore is 2,803.
What is the Total Female Population of Wilmore?
Total Female Population of Wilmore is 3,214.
What is the Ratio of Males per 100 Females in Wilmore?
There are 87.21 Males per 100 Females in Wilmore.
What is the Ratio of Females per 100 Males in Wilmore?
There are 114.66 Females per 100 Males in Wilmore.
What is the Median Population Age in Wilmore?
Median Population Age in Wilmore is 29.1 Years.
What is the Average Family Size in Wilmore
Average Family Size in Wilmore is 2.9 People.
What is the Average Household Size in Wilmore
Average Household Size in Wilmore is 2.6 People.
How Large is the Labor Force in Wilmore?
There are 3,292 People in the Labor Forcein in Wilmore.
What is the Percentage of People in the Labor Force in Wilmore?
66.6% of People are in the Labor Force in Wilmore.
What is the Unemployment Rate in Wilmore?
Unemployment Rate in Wilmore is 2.1%.