Spring Valley, IL Map & Demographics
Spring Valley Map
Spring Valley Overview
$32,544
PER CAPITA INCOME
$71,083
AVG FAMILY INCOME
$60,861
AVG HOUSEHOLD INCOME
54.9%
WAGE / INCOME GAP [ % ]
45.1¢/ $1
WAGE / INCOME GAP [ $ ]
0.42
INEQUALITY / GINI INDEX
5,518
TOTAL POPULATION
2,825
MALE POPULATION
2,693
FEMALE POPULATION
104.90
MALES / 100 FEMALES
95.33
FEMALES / 100 MALES
43.4
MEDIAN AGE
2.9
AVG FAMILY SIZE
2.3
AVG HOUSEHOLD SIZE
2,667
LABOR FORCE [ PEOPLE ]
58.3%
PERCENT IN LABOR FORCE
7.6%
UNEMPLOYMENT RATE
Spring Valley Zip Codes
Income in Spring Valley
Income Overview in Spring Valley
Per Capita Income in Spring Valley is $32,544, while median incomes of families and households are $71,083 and $60,861 respectively.
| Characteristic | Number | Measure |
| Per Capita Income | 5,518 | $32,544 |
| Median Family Income | 1,463 | $71,083 |
| Mean Family Income | 1,463 | $90,103 |
| Median Household Income | 2,304 | $60,861 |
| Mean Household Income | 2,304 | $75,451 |
| Income Deficit | 1,463 | $0 |
| Wage / Income Gap (%) | 5,518 | 54.87% |
| Wage / Income Gap ($) | 5,518 | 45.13¢ per $1 |
| Gini / Inequality Index | 5,518 | 0.42 |
Earnings by Sex in Spring Valley
Average Earnings in Spring Valley are $30,111, $52,162 for men and $23,542 for women, a difference of 54.9%.
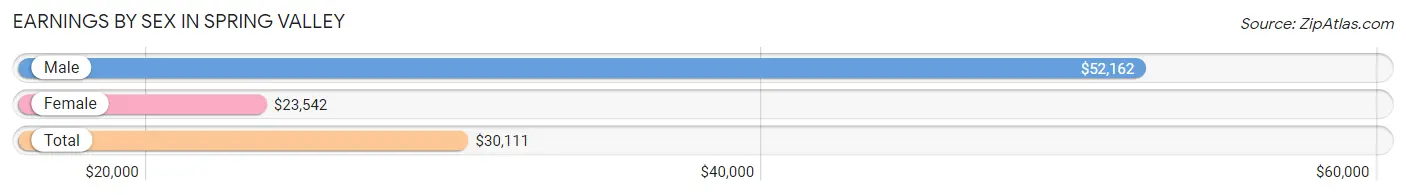
| Sex | Number | Average Earnings |
| Male | 1,406 (50.8%) | $52,162 |
| Female | 1,361 (49.2%) | $23,542 |
| Total | 2,767 (100.0%) | $30,111 |
Earnings by Sex by Income Bracket in Spring Valley
The most common earnings brackets in Spring Valley are $55,000 to $64,999 for men (227 | 16.2%) and $25,000 to $29,999 for women (159 | 11.7%).
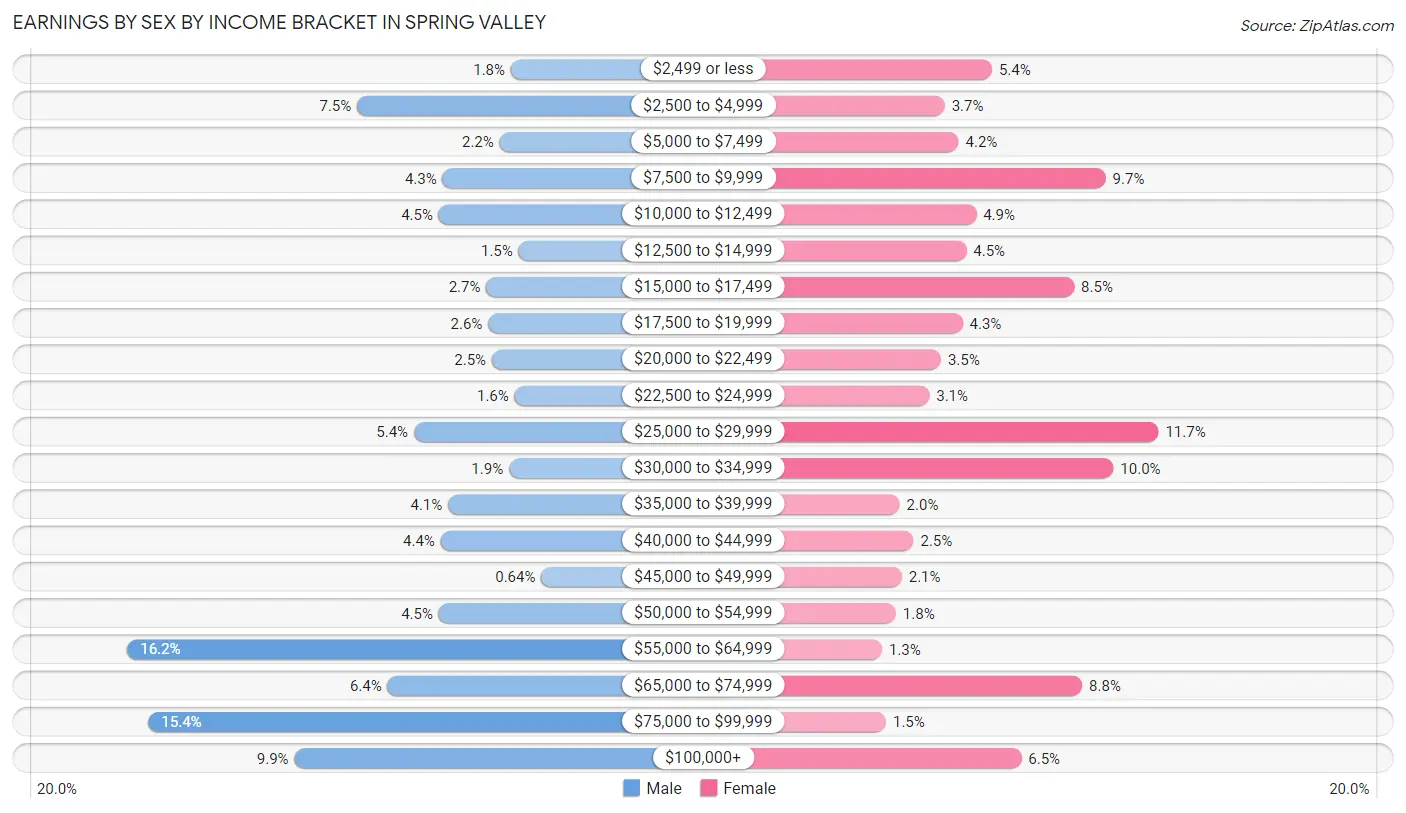
| Income | Male | Female |
| $2,499 or less | 25 (1.8%) | 74 (5.4%) |
| $2,500 to $4,999 | 106 (7.5%) | 50 (3.7%) |
| $5,000 to $7,499 | 31 (2.2%) | 57 (4.2%) |
| $7,500 to $9,999 | 61 (4.3%) | 132 (9.7%) |
| $10,000 to $12,499 | 63 (4.5%) | 66 (4.9%) |
| $12,500 to $14,999 | 21 (1.5%) | 61 (4.5%) |
| $15,000 to $17,499 | 38 (2.7%) | 116 (8.5%) |
| $17,500 to $19,999 | 37 (2.6%) | 59 (4.3%) |
| $20,000 to $22,499 | 35 (2.5%) | 48 (3.5%) |
| $22,500 to $24,999 | 23 (1.6%) | 42 (3.1%) |
| $25,000 to $29,999 | 76 (5.4%) | 159 (11.7%) |
| $30,000 to $34,999 | 26 (1.8%) | 136 (10.0%) |
| $35,000 to $39,999 | 58 (4.1%) | 27 (2.0%) |
| $40,000 to $44,999 | 62 (4.4%) | 34 (2.5%) |
| $45,000 to $49,999 | 9 (0.6%) | 28 (2.1%) |
| $50,000 to $54,999 | 63 (4.5%) | 25 (1.8%) |
| $55,000 to $64,999 | 227 (16.2%) | 18 (1.3%) |
| $65,000 to $74,999 | 90 (6.4%) | 120 (8.8%) |
| $75,000 to $99,999 | 216 (15.4%) | 20 (1.5%) |
| $100,000+ | 139 (9.9%) | 89 (6.5%) |
| Total | 1,406 (100.0%) | 1,361 (100.0%) |
Earnings by Sex by Educational Attainment in Spring Valley
Average earnings in Spring Valley are $61,038 for men and $26,759 for women, a difference of 56.2%. Men with an educational attainment of bachelor's degree enjoy the highest average annual earnings of $70,268, while those with high school diploma education earn the least with $50,739. Women with an educational attainment of bachelor's degree earn the most with the average annual earnings of $38,750, while those with less than high school education have the smallest earnings of $11,122.
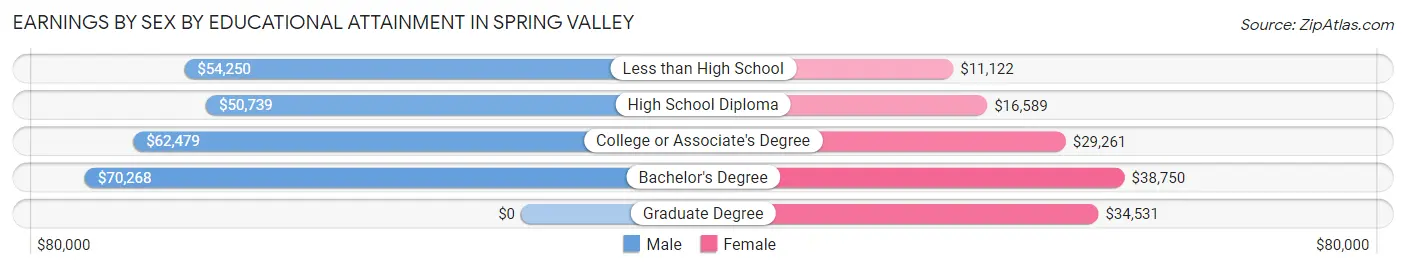
| Educational Attainment | Male Income | Female Income |
| Less than High School | $54,250 | $11,122 |
| High School Diploma | $50,739 | $16,589 |
| College or Associate's Degree | $62,479 | $29,261 |
| Bachelor's Degree | $70,268 | $38,750 |
| Graduate Degree | - | - |
| Total | $61,038 | $26,759 |
Family Income in Spring Valley
Family Income Brackets in Spring Valley
According to the Spring Valley family income data, there are 338 families falling into the $50,000 to $74,999 income range, which is the most common income bracket and makes up 23.1% of all families. Conversely, the $10,000 to $14,999 income bracket is the least frequent group with only 7 families (0.5%) belonging to this category.
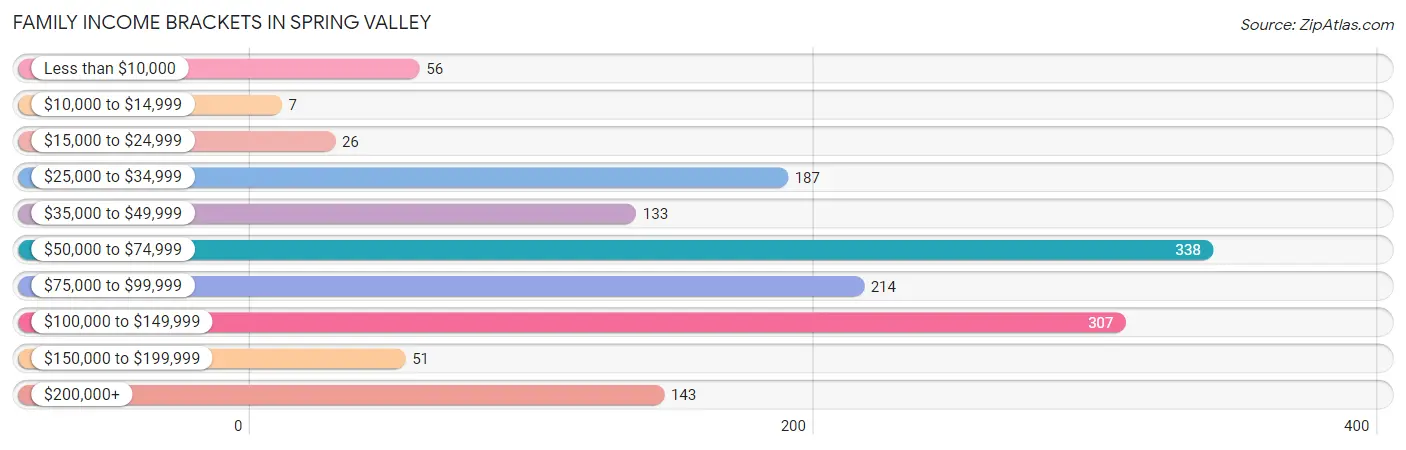
| Income Bracket | # Families | % Families |
| Less than $10,000 | 56 | 3.8% |
| $10,000 to $14,999 | 7 | 0.5% |
| $15,000 to $24,999 | 26 | 1.8% |
| $25,000 to $34,999 | 187 | 12.8% |
| $35,000 to $49,999 | 133 | 9.1% |
| $50,000 to $74,999 | 338 | 23.1% |
| $75,000 to $99,999 | 214 | 14.6% |
| $100,000 to $149,999 | 307 | 21.0% |
| $150,000 to $199,999 | 51 | 3.5% |
| $200,000+ | 143 | 9.8% |
Family Income by Famaliy Size in Spring Valley
4-person families (240 | 16.4%) account for the highest median family income in Spring Valley with $107,891 per family, while 2-person families (844 | 57.7%) have the highest median income of $33,990 per family member.
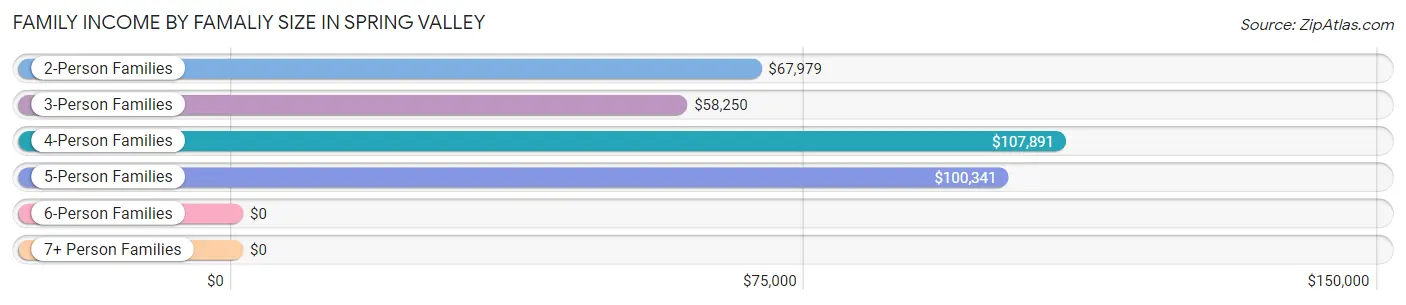
| Income Bracket | # Families | Median Income |
| 2-Person Families | 844 (57.7%) | $67,979 |
| 3-Person Families | 230 (15.7%) | $58,250 |
| 4-Person Families | 240 (16.4%) | $107,891 |
| 5-Person Families | 133 (9.1%) | $100,341 |
| 6-Person Families | 0 (0.0%) | $0 |
| 7+ Person Families | 16 (1.1%) | $0 |
| Total | 1,463 (100.0%) | $71,083 |
Family Income by Number of Earners in Spring Valley
The median family income in Spring Valley is $71,083, with families comprising 3+ earners (151) having the highest median family income of $132,831, while families with 1 earner (478) have the lowest median family income of $56,053, accounting for 10.3% and 32.7% of families, respectively.
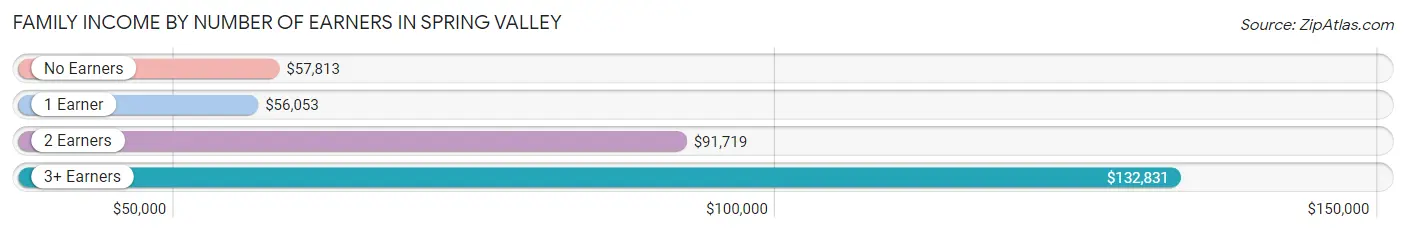
| Number of Earners | # Families | Median Income |
| No Earners | 298 (20.4%) | $57,813 |
| 1 Earner | 478 (32.7%) | $56,053 |
| 2 Earners | 536 (36.6%) | $91,719 |
| 3+ Earners | 151 (10.3%) | $132,831 |
| Total | 1,463 (100.0%) | $71,083 |
Household Income in Spring Valley
Household Income Brackets in Spring Valley
With 523 households falling in the category, the $50,000 to $74,999 income range is the most frequent in Spring Valley, accounting for 22.7% of all households. In contrast, only 83 households (3.6%) fall into the $150,000 to $199,999 income bracket, making it the least populous group.
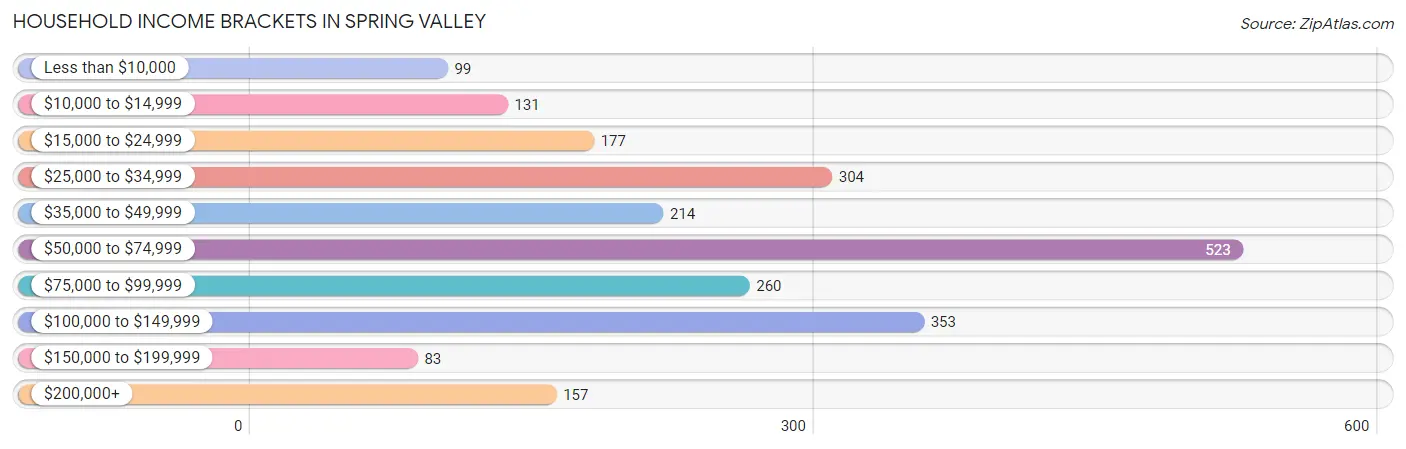
| Income Bracket | # Households | % Households |
| Less than $10,000 | 99 | 4.3% |
| $10,000 to $14,999 | 131 | 5.7% |
| $15,000 to $24,999 | 177 | 7.7% |
| $25,000 to $34,999 | 304 | 13.2% |
| $35,000 to $49,999 | 214 | 9.3% |
| $50,000 to $74,999 | 523 | 22.7% |
| $75,000 to $99,999 | 260 | 11.3% |
| $100,000 to $149,999 | 353 | 15.3% |
| $150,000 to $199,999 | 83 | 3.6% |
| $200,000+ | 157 | 6.8% |
Household Income by Householder Age in Spring Valley
The median household income in Spring Valley is $60,861, with the highest median household income of $71,477 found in the 25 to 44 years age bracket for the primary householder. A total of 655 households (28.4%) fall into this category. Meanwhile, the 65+ years age bracket for the primary householder has the lowest median household income of $46,964, with 852 households (37.0%) in this group.
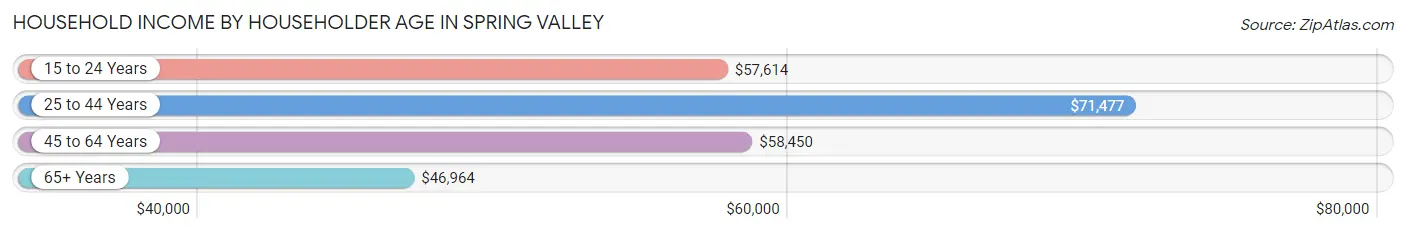
| Income Bracket | # Households | Median Income |
| 15 to 24 Years | 42 (1.8%) | $57,614 |
| 25 to 44 Years | 655 (28.4%) | $71,477 |
| 45 to 64 Years | 755 (32.8%) | $58,450 |
| 65+ Years | 852 (37.0%) | $46,964 |
| Total | 2,304 (100.0%) | $60,861 |
Poverty in Spring Valley
Income Below Poverty by Sex and Age in Spring Valley
With 9.8% poverty level for males and 10.3% for females among the residents of Spring Valley, 5 year old males and 16 and 17 year old females are the most vulnerable to poverty, with 9 males (18.8%) and 44 females (60.3%) in their respective age groups living below the poverty level.
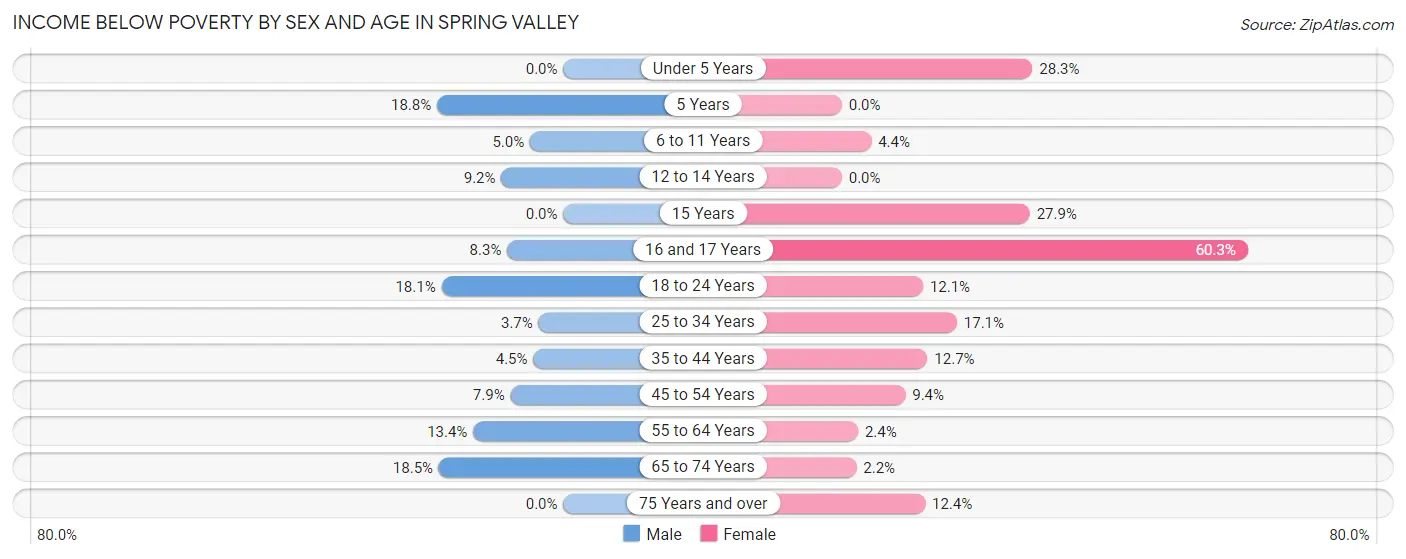
| Age Bracket | Male | Female |
| Under 5 Years | 0 (0.0%) | 15 (28.3%) |
| 5 Years | 9 (18.8%) | 0 (0.0%) |
| 6 to 11 Years | 11 (5.0%) | 9 (4.4%) |
| 12 to 14 Years | 8 (9.2%) | 0 (0.0%) |
| 15 Years | 0 (0.0%) | 12 (27.9%) |
| 16 and 17 Years | 10 (8.3%) | 44 (60.3%) |
| 18 to 24 Years | 59 (18.1%) | 27 (12.0%) |
| 25 to 34 Years | 8 (3.7%) | 47 (17.1%) |
| 35 to 44 Years | 15 (4.4%) | 46 (12.7%) |
| 45 to 54 Years | 19 (7.9%) | 20 (9.4%) |
| 55 to 64 Years | 64 (13.4%) | 10 (2.4%) |
| 65 to 74 Years | 68 (18.5%) | 9 (2.2%) |
| 75 Years and over | 0 (0.0%) | 33 (12.4%) |
| Total | 271 (9.8%) | 272 (10.3%) |
Income Above Poverty by Sex and Age in Spring Valley
According to the poverty statistics in Spring Valley, males aged under 5 years and females aged 5 years are the age groups that are most secure financially, with 100.0% of males and 100.0% of females in these age groups living above the poverty line.
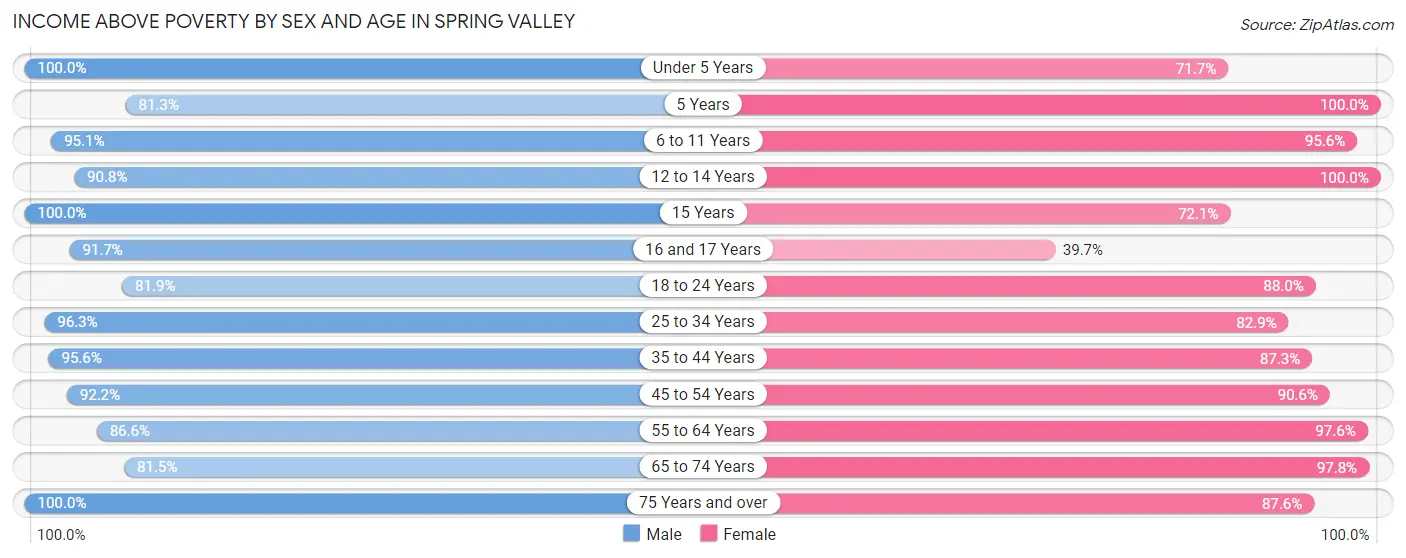
| Age Bracket | Male | Female |
| Under 5 Years | 158 (100.0%) | 38 (71.7%) |
| 5 Years | 39 (81.2%) | 20 (100.0%) |
| 6 to 11 Years | 211 (95.1%) | 197 (95.6%) |
| 12 to 14 Years | 79 (90.8%) | 70 (100.0%) |
| 15 Years | 32 (100.0%) | 31 (72.1%) |
| 16 and 17 Years | 110 (91.7%) | 29 (39.7%) |
| 18 to 24 Years | 267 (81.9%) | 197 (87.9%) |
| 25 to 34 Years | 210 (96.3%) | 228 (82.9%) |
| 35 to 44 Years | 322 (95.6%) | 316 (87.3%) |
| 45 to 54 Years | 223 (92.1%) | 192 (90.6%) |
| 55 to 64 Years | 414 (86.6%) | 407 (97.6%) |
| 65 to 74 Years | 300 (81.5%) | 408 (97.8%) |
| 75 Years and over | 128 (100.0%) | 234 (87.6%) |
| Total | 2,493 (90.2%) | 2,367 (89.7%) |
Income Below Poverty Among Married-Couple Families in Spring Valley
The poverty statistics for married-couple families in Spring Valley show that 2.1% or 21 of the total 1,020 families live below the poverty line. Families with 1 or 2 children have the highest poverty rate of 9.7%, comprising of 21 families. On the other hand, families with no children have the lowest poverty rate of 0.0%, which includes 0 families.
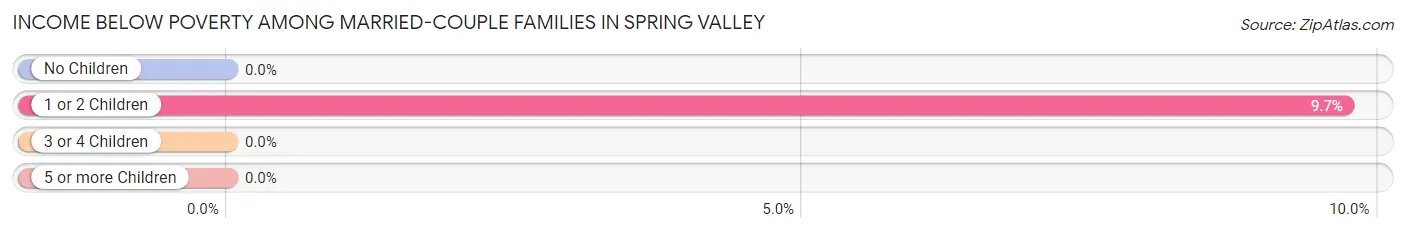
| Children | Above Poverty | Below Poverty |
| No Children | 714 (100.0%) | 0 (0.0%) |
| 1 or 2 Children | 195 (90.3%) | 21 (9.7%) |
| 3 or 4 Children | 74 (100.0%) | 0 (0.0%) |
| 5 or more Children | 16 (100.0%) | 0 (0.0%) |
| Total | 999 (97.9%) | 21 (2.1%) |
Income Below Poverty Among Single-Parent Households in Spring Valley
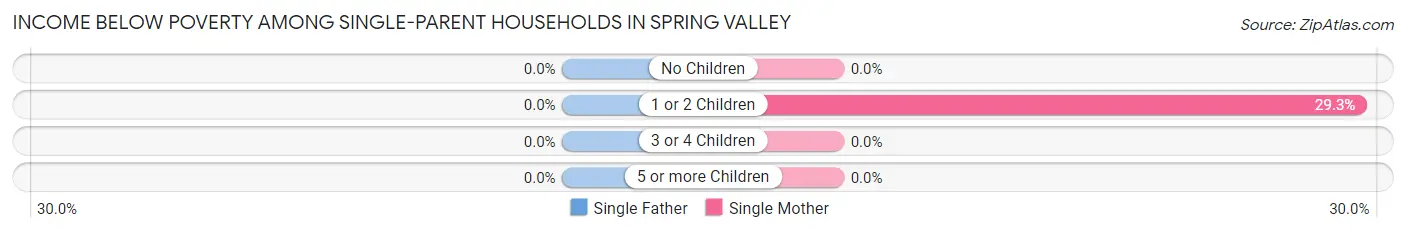
| Children | Single Father | Single Mother |
| No Children | 0 (0.0%) | 0 (0.0%) |
| 1 or 2 Children | 0 (0.0%) | 62 (29.2%) |
| 3 or 4 Children | 0 (0.0%) | 0 (0.0%) |
| 5 or more Children | 0 (0.0%) | 0 (0.0%) |
| Total | 0 (0.0%) | 62 (21.7%) |
Income Below Poverty Among Married-Couple vs Single-Parent Households in Spring Valley
The poverty data for Spring Valley shows that 21 of the married-couple family households (2.1%) and 62 of the single-parent households (14.0%) are living below the poverty level. Within the married-couple family households, those with 1 or 2 children have the highest poverty rate, with 21 households (9.7%) falling below the poverty line. Among the single-parent households, those with 1 or 2 children have the highest poverty rate, with 62 household (20.0%) living below poverty.
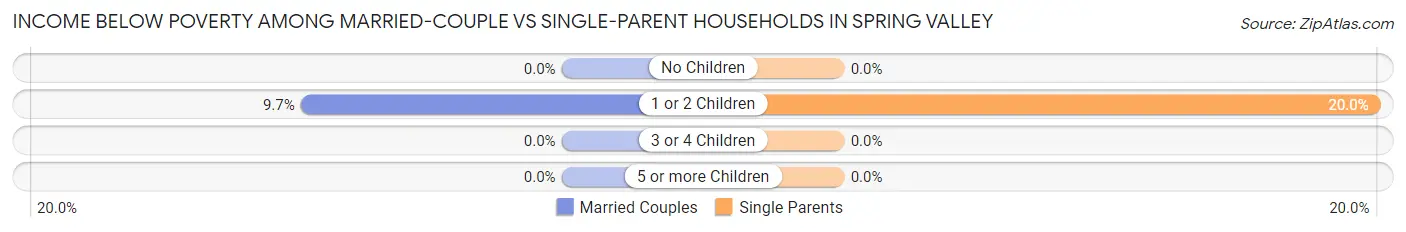
| Children | Married-Couple Families | Single-Parent Households |
| No Children | 0 (0.0%) | 0 (0.0%) |
| 1 or 2 Children | 21 (9.7%) | 62 (20.0%) |
| 3 or 4 Children | 0 (0.0%) | 0 (0.0%) |
| 5 or more Children | 0 (0.0%) | 0 (0.0%) |
| Total | 21 (2.1%) | 62 (14.0%) |
Race in Spring Valley
The most populous races in Spring Valley are White / Caucasian (4,679 | 84.8%), Hispanic or Latino (1,242 | 22.5%), and Some other Race (540 | 9.8%).
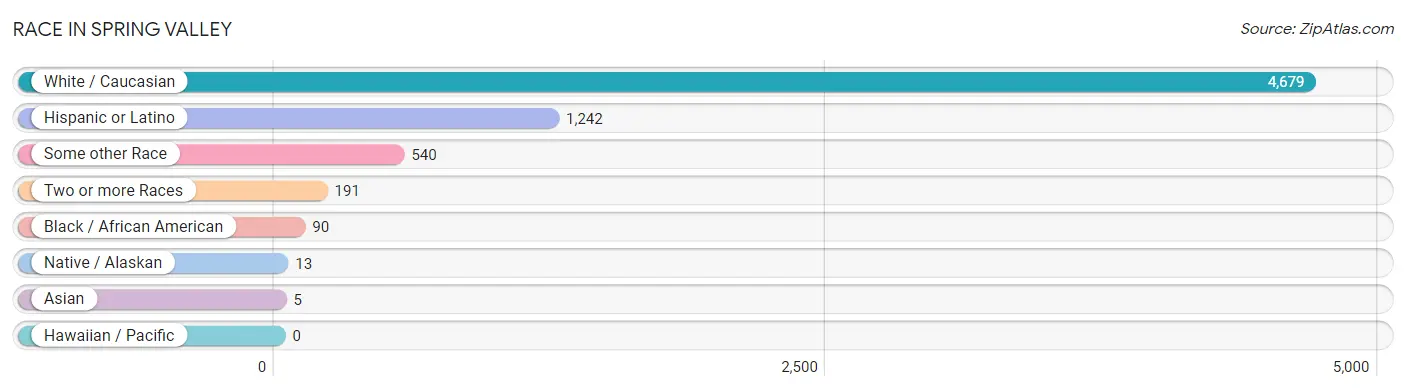
| Race | # Population | % Population |
| Asian | 5 | 0.1% |
| Black / African American | 90 | 1.6% |
| Hawaiian / Pacific | 0 | 0.0% |
| Hispanic or Latino | 1,242 | 22.5% |
| Native / Alaskan | 13 | 0.2% |
| White / Caucasian | 4,679 | 84.8% |
| Two or more Races | 191 | 3.5% |
| Some other Race | 540 | 9.8% |
| Total | 5,518 | 100.0% |
Ancestry in Spring Valley
The most populous ancestries reported in Spring Valley are Mexican (1,188 | 21.5%), Italian (1,078 | 19.5%), German (876 | 15.9%), Irish (713 | 12.9%), and Polish (564 | 10.2%), together accounting for 80.1% of all Spring Valley residents.
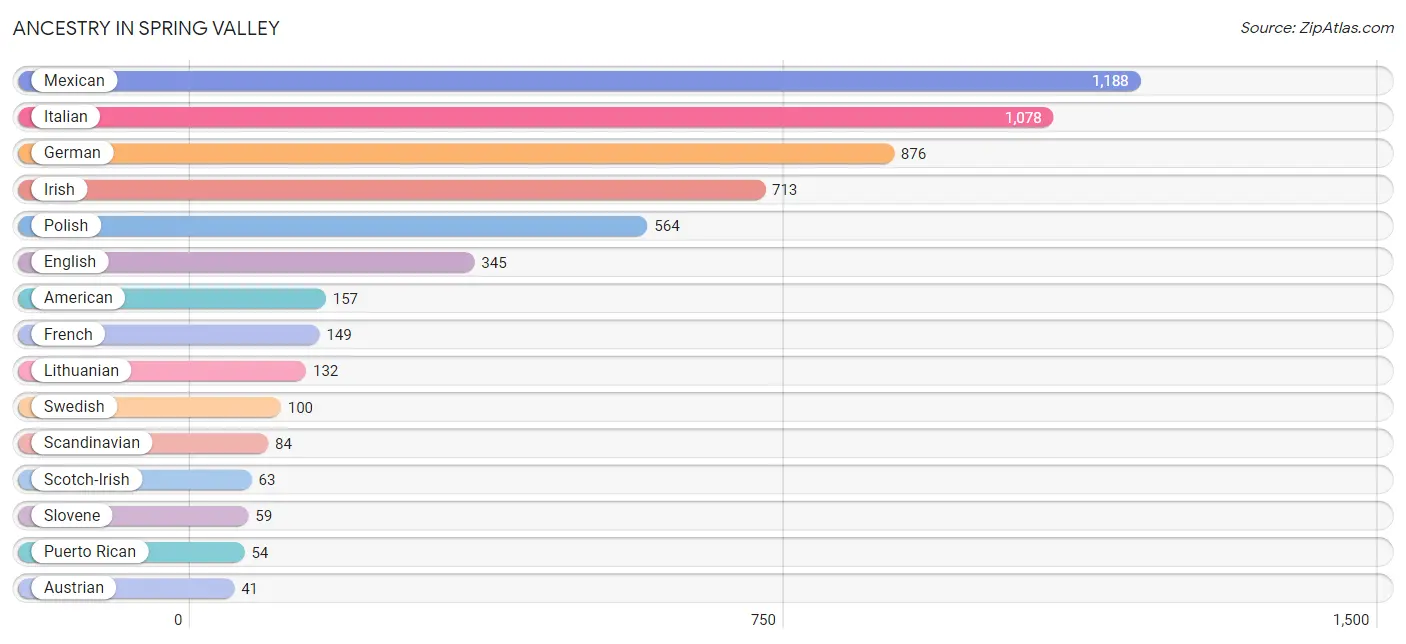
| Ancestry | # Population | % Population |
| American | 157 | 2.9% |
| Austrian | 41 | 0.7% |
| Belgian | 30 | 0.5% |
| Canadian | 7 | 0.1% |
| Chippewa | 8 | 0.1% |
| Czech | 7 | 0.1% |
| Czechoslovakian | 7 | 0.1% |
| Danish | 41 | 0.7% |
| Dutch | 37 | 0.7% |
| English | 345 | 6.2% |
| European | 8 | 0.1% |
| French | 149 | 2.7% |
| German | 876 | 15.9% |
| Irish | 713 | 12.9% |
| Iroquois | 4 | 0.1% |
| Italian | 1,078 | 19.5% |
| Lithuanian | 132 | 2.4% |
| Menominee | 5 | 0.1% |
| Mexican | 1,188 | 21.5% |
| Mexican American Indian | 8 | 0.1% |
| Norwegian | 22 | 0.4% |
| Polish | 564 | 10.2% |
| Puerto Rican | 54 | 1.0% |
| Russian | 13 | 0.2% |
| Scandinavian | 84 | 1.5% |
| Scotch-Irish | 63 | 1.1% |
| Scottish | 40 | 0.7% |
| Slovak | 10 | 0.2% |
| Slovene | 59 | 1.1% |
| Swedish | 100 | 1.8% |
| Thai | 5 | 0.1% |
| Welsh | 20 | 0.4% | View All 32 Rows |
Immigrants in Spring Valley
The most numerous immigrant groups reported in Spring Valley came from Central America (254 | 4.6%), Latin America (254 | 4.6%), Mexico (227 | 4.1%), Guatemala (27 | 0.5%), and Eastern Europe (13 | 0.2%), together accounting for 14.0% of all Spring Valley residents.
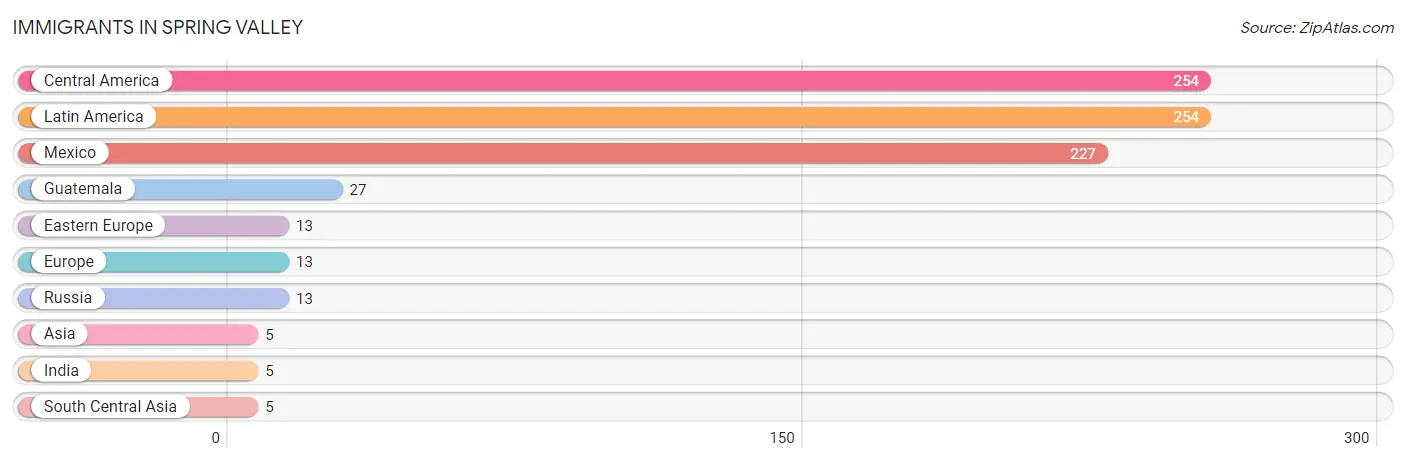
| Immigration Origin | # Population | % Population |
| Asia | 5 | 0.1% |
| Central America | 254 | 4.6% |
| Eastern Europe | 13 | 0.2% |
| Europe | 13 | 0.2% |
| Guatemala | 27 | 0.5% |
| India | 5 | 0.1% |
| Latin America | 254 | 4.6% |
| Mexico | 227 | 4.1% |
| Russia | 13 | 0.2% |
| South Central Asia | 5 | 0.1% | View All 10 Rows |
Sex and Age in Spring Valley
Sex and Age in Spring Valley
The most populous age groups in Spring Valley are 20 to 24 Years (264 | 9.3%) for men and 70 to 74 Years (260 | 9.7%) for women.
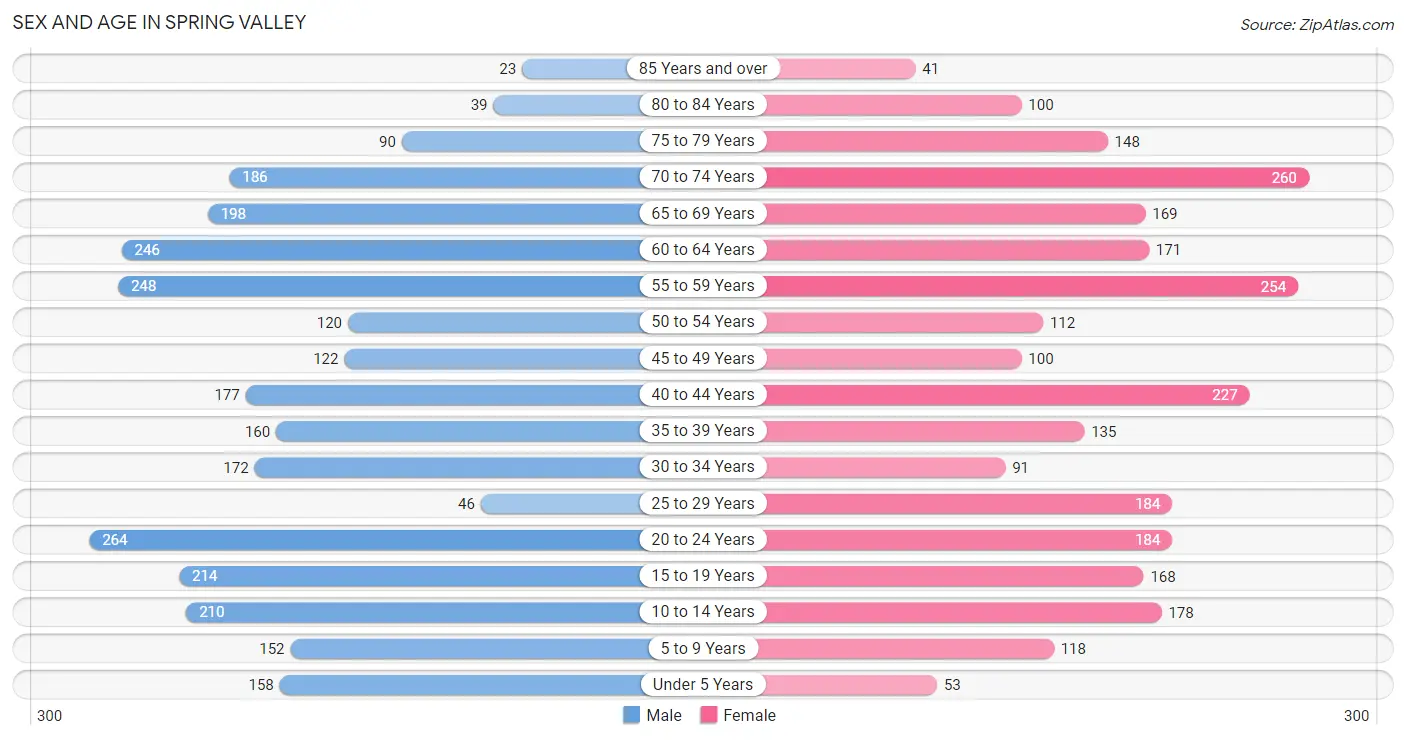
| Age Bracket | Male | Female |
| Under 5 Years | 158 (5.6%) | 53 (2.0%) |
| 5 to 9 Years | 152 (5.4%) | 118 (4.4%) |
| 10 to 14 Years | 210 (7.4%) | 178 (6.6%) |
| 15 to 19 Years | 214 (7.6%) | 168 (6.2%) |
| 20 to 24 Years | 264 (9.3%) | 184 (6.8%) |
| 25 to 29 Years | 46 (1.6%) | 184 (6.8%) |
| 30 to 34 Years | 172 (6.1%) | 91 (3.4%) |
| 35 to 39 Years | 160 (5.7%) | 135 (5.0%) |
| 40 to 44 Years | 177 (6.3%) | 227 (8.4%) |
| 45 to 49 Years | 122 (4.3%) | 100 (3.7%) |
| 50 to 54 Years | 120 (4.3%) | 112 (4.2%) |
| 55 to 59 Years | 248 (8.8%) | 254 (9.4%) |
| 60 to 64 Years | 246 (8.7%) | 171 (6.4%) |
| 65 to 69 Years | 198 (7.0%) | 169 (6.3%) |
| 70 to 74 Years | 186 (6.6%) | 260 (9.7%) |
| 75 to 79 Years | 90 (3.2%) | 148 (5.5%) |
| 80 to 84 Years | 39 (1.4%) | 100 (3.7%) |
| 85 Years and over | 23 (0.8%) | 41 (1.5%) |
| Total | 2,825 (100.0%) | 2,693 (100.0%) |
Families and Households in Spring Valley
Median Family Size in Spring Valley
The median family size in Spring Valley is 2.86 persons per family, with married-couple families (1,020 | 69.7%) accounting for the largest median family size of 2.87 persons per family. On the other hand, single male/father families (157 | 10.7%) represent the smallest median family size with 2.75 persons per family.
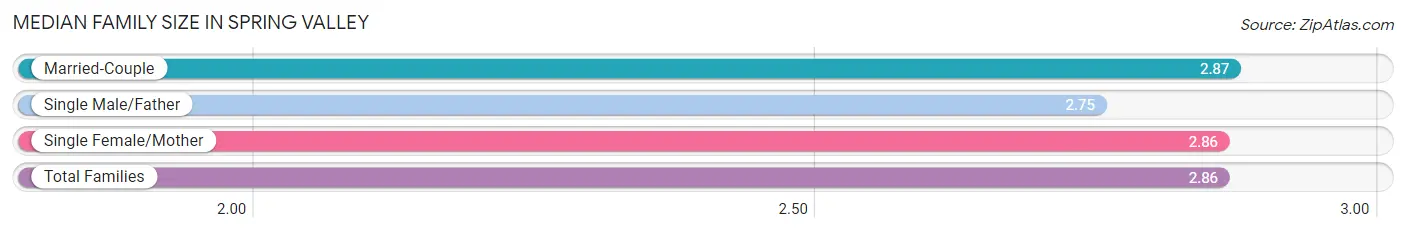
| Family Type | # Families | Family Size |
| Married-Couple | 1,020 (69.7%) | 2.87 |
| Single Male/Father | 157 (10.7%) | 2.75 |
| Single Female/Mother | 286 (19.6%) | 2.86 |
| Total Families | 1,463 (100.0%) | 2.86 |
Median Household Size in Spring Valley
The median household size in Spring Valley is 2.33 persons per household, with single male/father households (157 | 6.8%) accounting for the largest median household size of 3.37 persons per household. non-family households (841 | 36.5%) represent the smallest median household size with 1.17 persons per household.
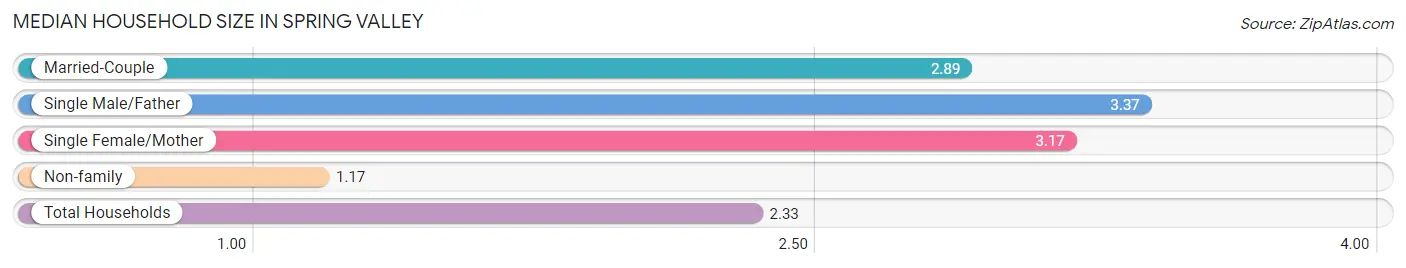
| Household Type | # Households | Household Size |
| Married-Couple | 1,020 (44.3%) | 2.89 |
| Single Male/Father | 157 (6.8%) | 3.37 |
| Single Female/Mother | 286 (12.4%) | 3.17 |
| Non-family | 841 (36.5%) | 1.17 |
| Total Households | 2,304 (100.0%) | 2.33 |
Household Size by Marriage Status in Spring Valley
Out of a total of 2,304 households in Spring Valley, 1,463 (63.5%) are family households, while 841 (36.5%) are nonfamily households. The most numerous type of family households are 2-person households, comprising 822, and the most common type of nonfamily households are 1-person households, comprising 700.
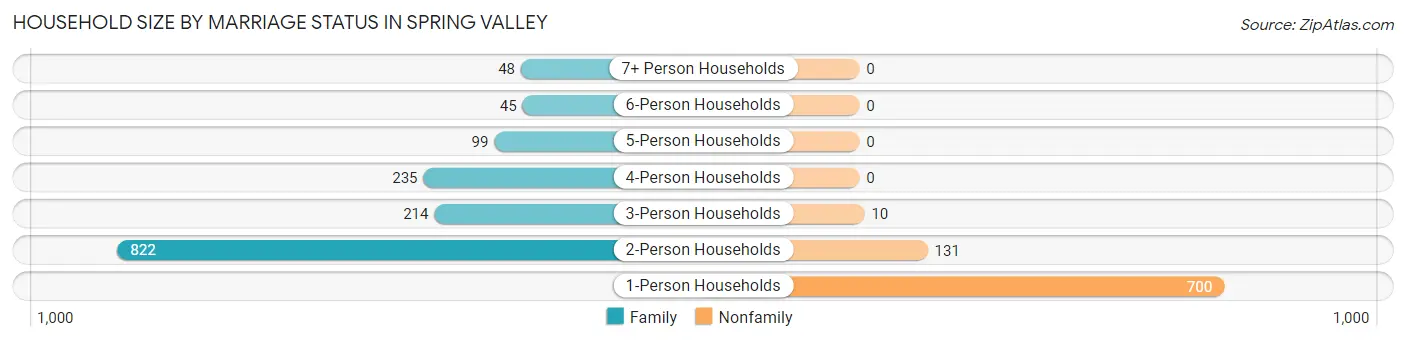
| Household Size | Family Households | Nonfamily Households |
| 1-Person Households | - | 700 (30.4%) |
| 2-Person Households | 822 (35.7%) | 131 (5.7%) |
| 3-Person Households | 214 (9.3%) | 10 (0.4%) |
| 4-Person Households | 235 (10.2%) | 0 (0.0%) |
| 5-Person Households | 99 (4.3%) | 0 (0.0%) |
| 6-Person Households | 45 (1.9%) | 0 (0.0%) |
| 7+ Person Households | 48 (2.1%) | 0 (0.0%) |
| Total | 1,463 (63.5%) | 841 (36.5%) |
Female Fertility in Spring Valley
Fertility by Age in Spring Valley
Average fertility rate in Spring Valley is 28.0 births per 1,000 women. Women in the age bracket of 20 to 34 years have the highest fertility rate with 57.0 births per 1,000 women. Women in the age bracket of 20 to 34 years acount for 86.7% of all women with births.
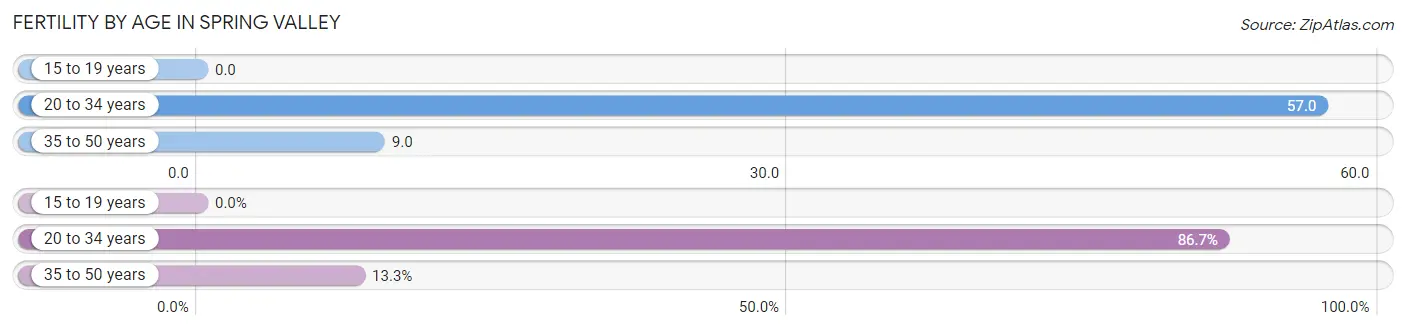
| Age Bracket | Women with Births | Births / 1,000 Women |
| 15 to 19 years | 0 (0.0%) | 0.0 |
| 20 to 34 years | 26 (86.7%) | 57.0 |
| 35 to 50 years | 4 (13.3%) | 9.0 |
| Total | 30 (100.0%) | 28.0 |
Fertility by Age by Marriage Status in Spring Valley
83.3% of women with births (30) in Spring Valley are married. The highest percentage of unmarried women with births falls into 20 to 34 years age bracket with 19.2% of them unmarried at the time of birth, while the lowest percentage of unmarried women with births belong to 35 to 50 years age bracket with 0.0% of them unmarried.
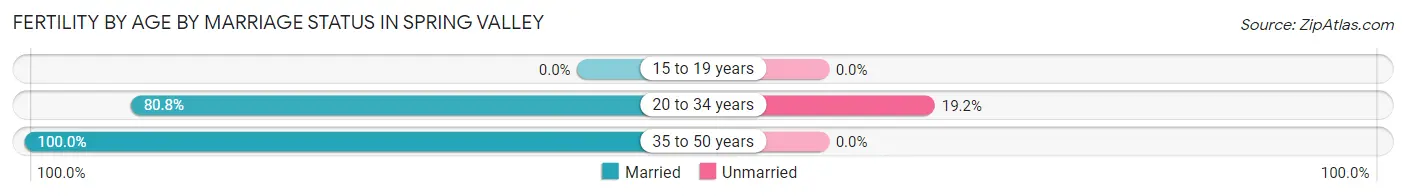
| Age Bracket | Married | Unmarried |
| 15 to 19 years | 0 (0.0%) | 0 (0.0%) |
| 20 to 34 years | 21 (80.8%) | 5 (19.2%) |
| 35 to 50 years | 4 (100.0%) | 0 (0.0%) |
| Total | 25 (83.3%) | 5 (16.7%) |
Fertility by Education in Spring Valley
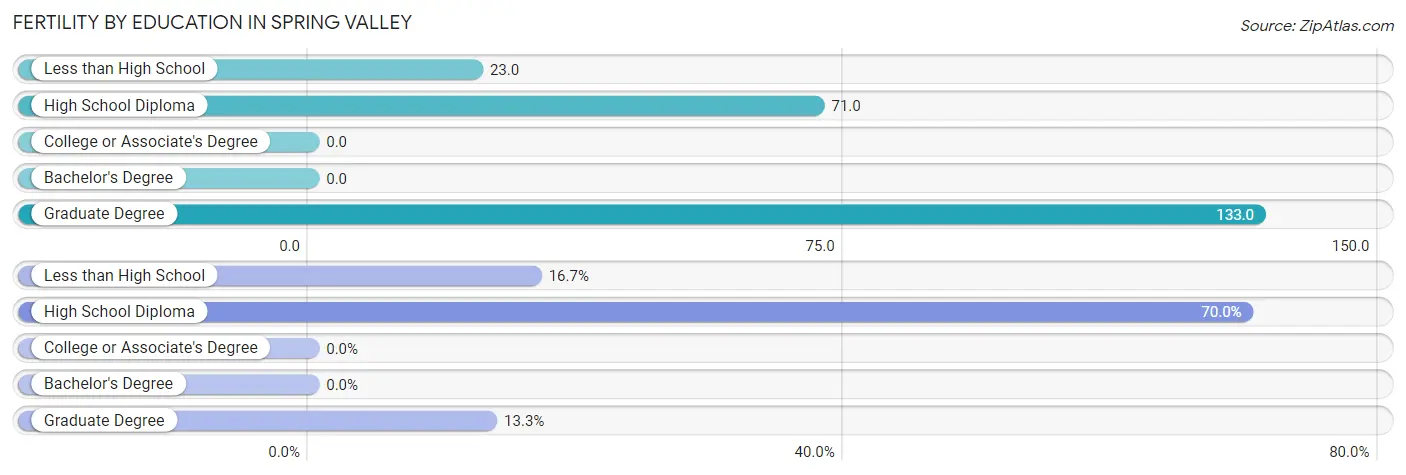
| Educational Attainment | Women with Births | Births / 1,000 Women |
| Less than High School | 5 (16.7%) | 23.0 |
| High School Diploma | 21 (70.0%) | 71.0 |
| College or Associate's Degree | 0 (0.0%) | 0.0 |
| Bachelor's Degree | 0 (0.0%) | 0.0 |
| Graduate Degree | 4 (13.3%) | 133.0 |
| Total | 30 (100.0%) | 28.0 |
Fertility by Education by Marriage Status in Spring Valley
16.7% of women with births in Spring Valley are unmarried. Women with the educational attainment of high school diploma are most likely to be married with 100.0% of them married at childbirth, while women with the educational attainment of less than high school are least likely to be married with 100.0% of them unmarried at childbirth.
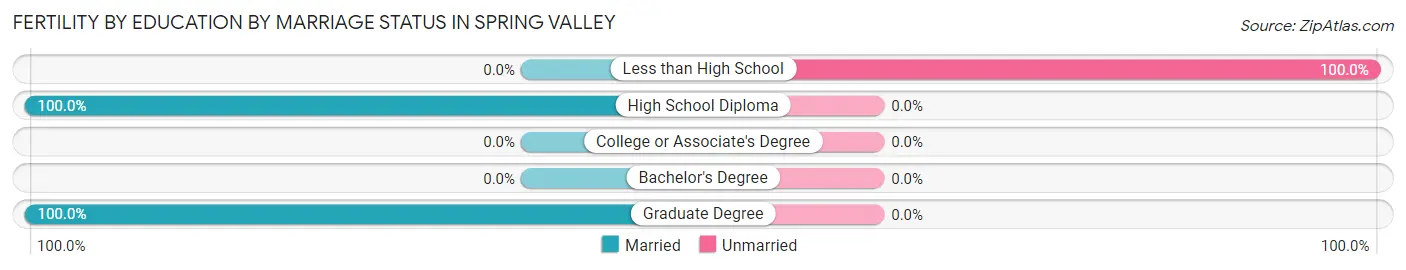
| Educational Attainment | Married | Unmarried |
| Less than High School | 0 (0.0%) | 5 (100.0%) |
| High School Diploma | 21 (100.0%) | 0 (0.0%) |
| College or Associate's Degree | 0 (0.0%) | 0 (0.0%) |
| Bachelor's Degree | 0 (0.0%) | 0 (0.0%) |
| Graduate Degree | 4 (100.0%) | 0 (0.0%) |
| Total | 25 (83.3%) | 5 (16.7%) |
Employment Characteristics in Spring Valley
Employment by Class of Employer in Spring Valley
Among the 2,449 employed individuals in Spring Valley, private company employees (1,852 | 75.6%), local government employees (295 | 12.0%), and not-for-profit organizations (182 | 7.4%) make up the most common classes of employment.
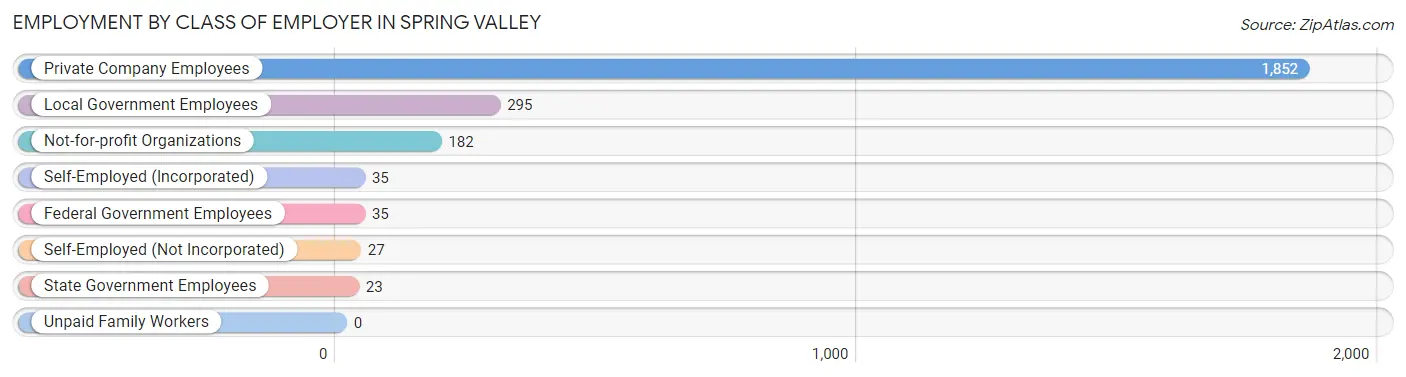
| Employer Class | # Employees | % Employees |
| Private Company Employees | 1,852 | 75.6% |
| Self-Employed (Incorporated) | 35 | 1.4% |
| Self-Employed (Not Incorporated) | 27 | 1.1% |
| Not-for-profit Organizations | 182 | 7.4% |
| Local Government Employees | 295 | 12.0% |
| State Government Employees | 23 | 0.9% |
| Federal Government Employees | 35 | 1.4% |
| Unpaid Family Workers | 0 | 0.0% |
| Total | 2,449 | 100.0% |
Employment Status by Age in Spring Valley
According to the labor force statistics for Spring Valley, out of the total population over 16 years of age (4,574), 58.3% or 2,667 individuals are in the labor force, with 7.6% or 203 of them unemployed. The age group with the highest labor force participation rate is 25 to 29 years, with 98.7% or 227 individuals in the labor force. Within the labor force, the 30 to 34 years age range has the highest percentage of unemployed individuals, with 18.1% or 43 of them being unemployed.
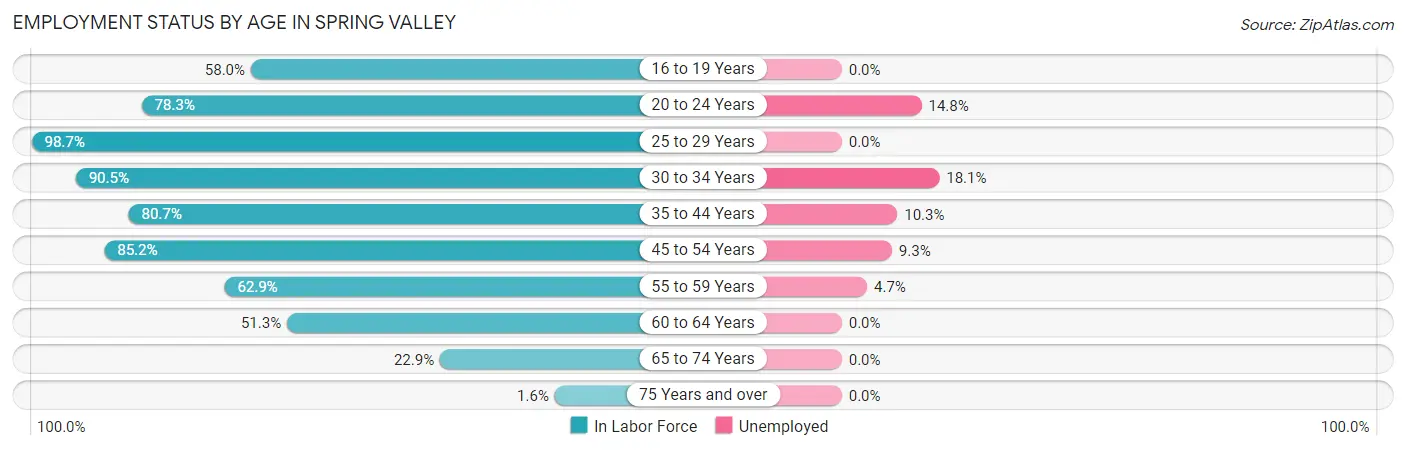
| Age Bracket | In Labor Force | Unemployed |
| 16 to 19 Years | 178 (58.0%) | 0 (0.0%) |
| 20 to 24 Years | 351 (78.3%) | 52 (14.8%) |
| 25 to 29 Years | 227 (98.7%) | 0 (0.0%) |
| 30 to 34 Years | 238 (90.5%) | 43 (18.1%) |
| 35 to 44 Years | 564 (80.7%) | 58 (10.3%) |
| 45 to 54 Years | 387 (85.2%) | 36 (9.3%) |
| 55 to 59 Years | 316 (62.9%) | 15 (4.7%) |
| 60 to 64 Years | 214 (51.3%) | 0 (0.0%) |
| 65 to 74 Years | 186 (22.9%) | 0 (0.0%) |
| 75 Years and over | 7 (1.6%) | 0 (0.0%) |
| Total | 2,667 (58.3%) | 203 (7.6%) |
Employment Status by Educational Attainment in Spring Valley
According to labor force statistics for Spring Valley, 75.9% of individuals (1,947) out of the total population between 25 and 64 years of age (2,565) are in the labor force, with 7.8% or 152 of them being unemployed. The group with the highest labor force participation rate are those with the educational attainment of bachelor's degree or higher, with 91.3% or 438 individuals in the labor force. Within the labor force, individuals with less than high school education have the highest percentage of unemployment, with 34.5% or 69 of them being unemployed.
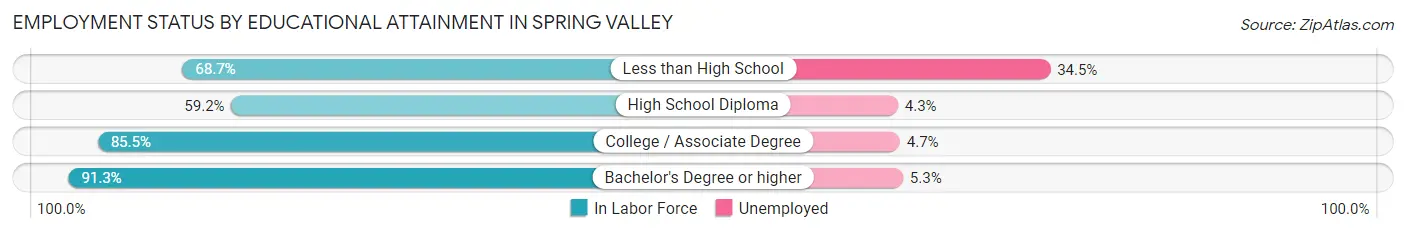
| Educational Attainment | In Labor Force | Unemployed |
| Less than High School | 200 (68.7%) | 100 (34.5%) |
| High School Diploma | 507 (59.2%) | 37 (4.3%) |
| College / Associate Degree | 801 (85.5%) | 44 (4.7%) |
| Bachelor's Degree or higher | 438 (91.3%) | 25 (5.3%) |
| Total | 1,947 (75.9%) | 200 (7.8%) |
Employment Occupations by Sex in Spring Valley
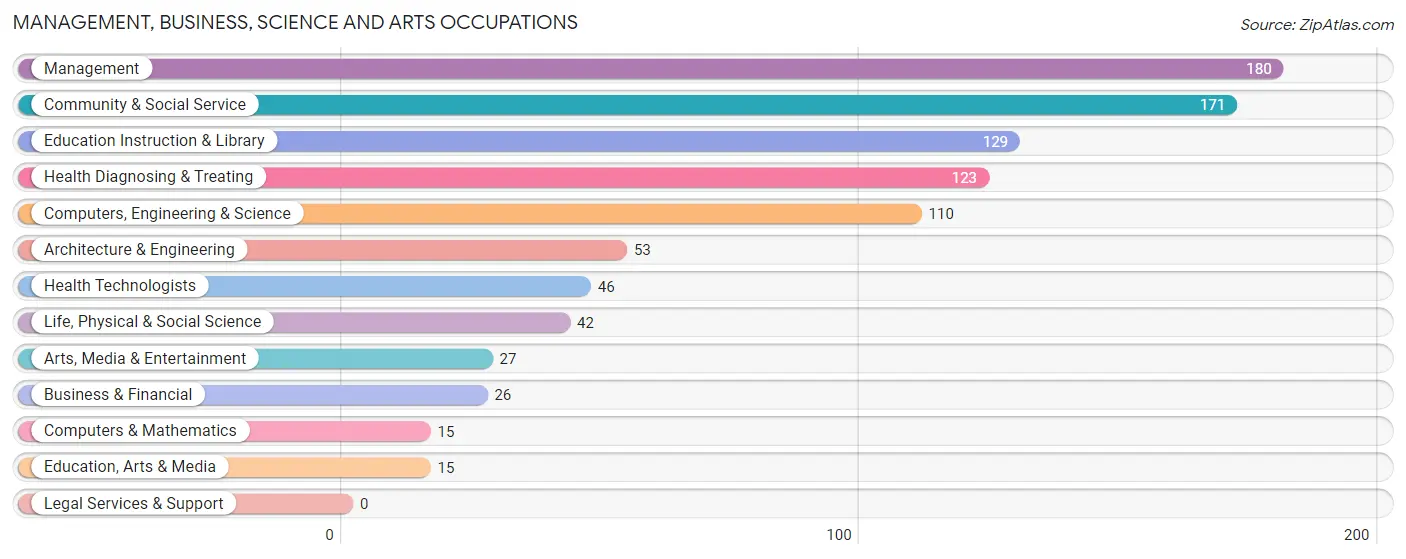
Management, Business, Science and Arts Occupations
The most common Management, Business, Science and Arts occupations in Spring Valley are Management (180 | 7.3%), Community & Social Service (171 | 6.9%), Education Instruction & Library (129 | 5.2%), Health Diagnosing & Treating (123 | 5.0%), and Computers, Engineering & Science (110 | 4.5%).
Management, Business, Science and Arts Occupations by Sex
Within the Management, Business, Science and Arts occupations in Spring Valley, the most male-oriented occupations are Computers & Mathematics (100.0%), Architecture & Engineering (100.0%), and Computers, Engineering & Science (90.9%), while the most female-oriented occupations are Arts, Media & Entertainment (100.0%), Education Instruction & Library (96.1%), and Community & Social Service (94.2%).
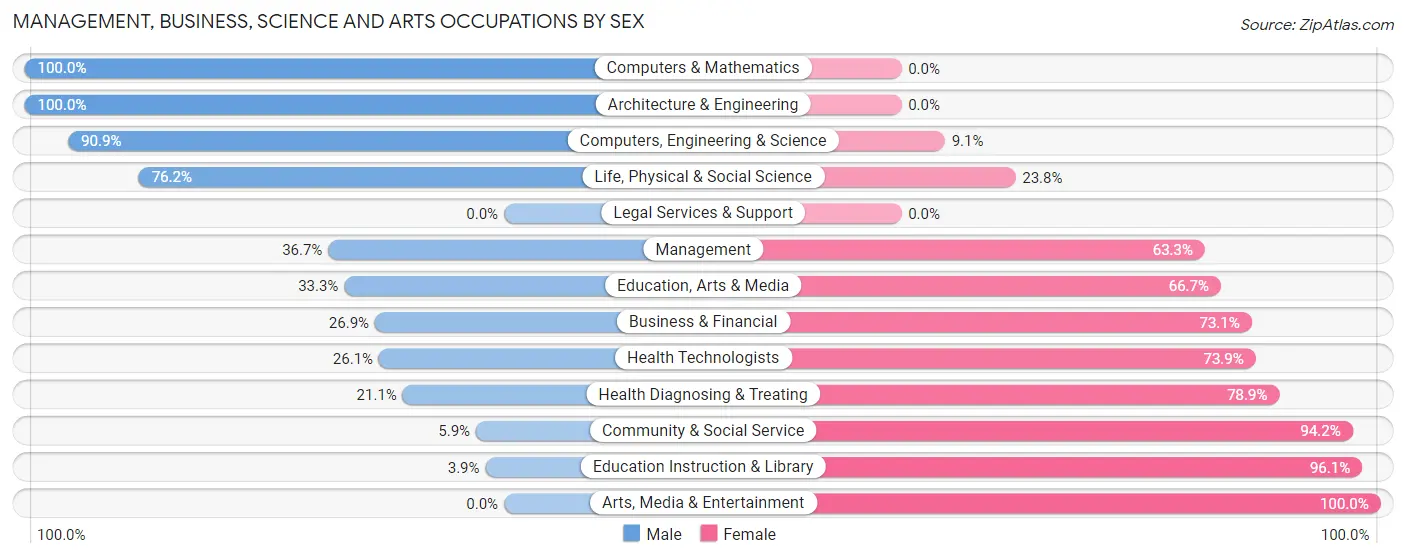
| Occupation | Male | Female |
| Management | 66 (36.7%) | 114 (63.3%) |
| Business & Financial | 7 (26.9%) | 19 (73.1%) |
| Computers, Engineering & Science | 100 (90.9%) | 10 (9.1%) |
| Computers & Mathematics | 15 (100.0%) | 0 (0.0%) |
| Architecture & Engineering | 53 (100.0%) | 0 (0.0%) |
| Life, Physical & Social Science | 32 (76.2%) | 10 (23.8%) |
| Community & Social Service | 10 (5.9%) | 161 (94.2%) |
| Education, Arts & Media | 5 (33.3%) | 10 (66.7%) |
| Legal Services & Support | 0 (0.0%) | 0 (0.0%) |
| Education Instruction & Library | 5 (3.9%) | 124 (96.1%) |
| Arts, Media & Entertainment | 0 (0.0%) | 27 (100.0%) |
| Health Diagnosing & Treating | 26 (21.1%) | 97 (78.9%) |
| Health Technologists | 12 (26.1%) | 34 (73.9%) |
| Total (Category) | 209 (34.3%) | 401 (65.7%) |
| Total (Overall) | 1,293 (52.5%) | 1,171 (47.5%) |
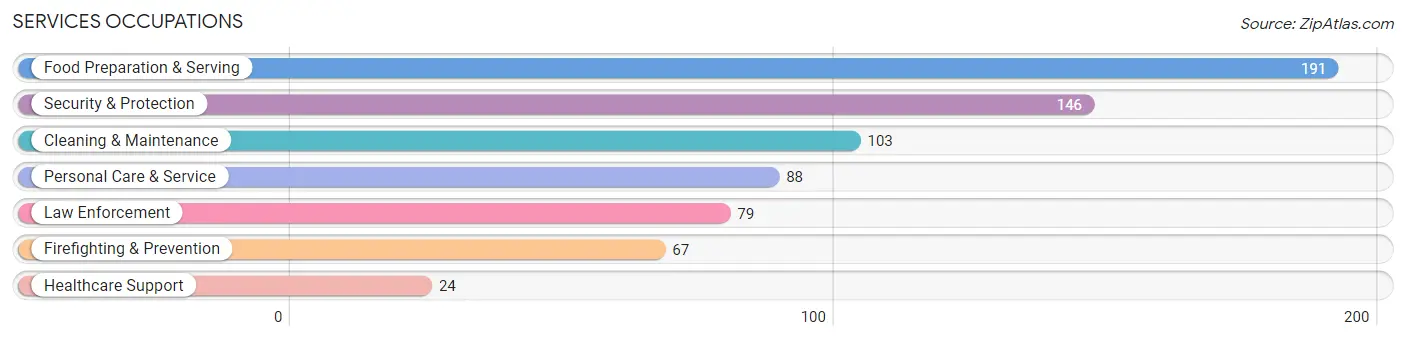
Services Occupations
The most common Services occupations in Spring Valley are Food Preparation & Serving (191 | 7.7%), Security & Protection (146 | 5.9%), Cleaning & Maintenance (103 | 4.2%), Personal Care & Service (88 | 3.6%), and Law Enforcement (79 | 3.2%).
Services Occupations by Sex
Within the Services occupations in Spring Valley, the most male-oriented occupations are Law Enforcement (78.5%), Security & Protection (65.1%), and Firefighting & Prevention (49.2%), while the most female-oriented occupations are Personal Care & Service (87.5%), Cleaning & Maintenance (84.5%), and Healthcare Support (62.5%).
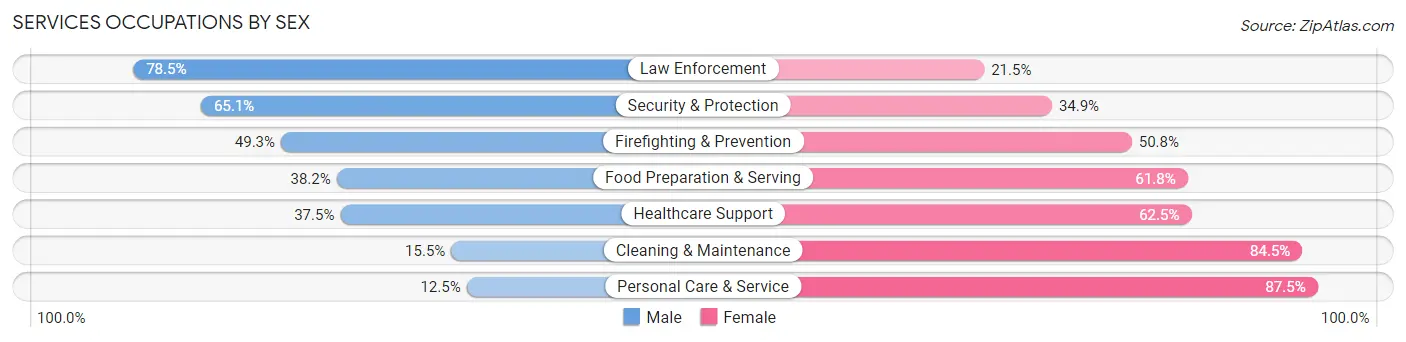
| Occupation | Male | Female |
| Healthcare Support | 9 (37.5%) | 15 (62.5%) |
| Security & Protection | 95 (65.1%) | 51 (34.9%) |
| Firefighting & Prevention | 33 (49.2%) | 34 (50.7%) |
| Law Enforcement | 62 (78.5%) | 17 (21.5%) |
| Food Preparation & Serving | 73 (38.2%) | 118 (61.8%) |
| Cleaning & Maintenance | 16 (15.5%) | 87 (84.5%) |
| Personal Care & Service | 11 (12.5%) | 77 (87.5%) |
| Total (Category) | 204 (37.0%) | 348 (63.0%) |
| Total (Overall) | 1,293 (52.5%) | 1,171 (47.5%) |
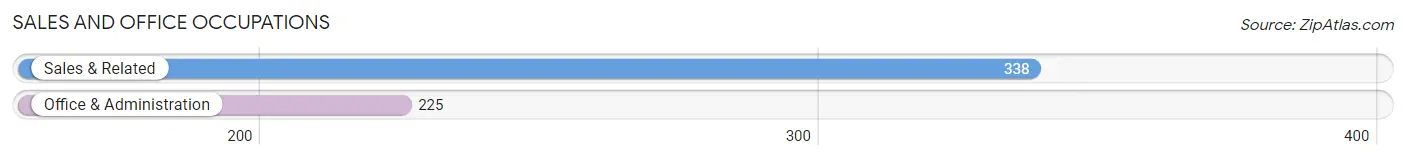
Sales and Office Occupations
The most common Sales and Office occupations in Spring Valley are Sales & Related (338 | 13.7%), and Office & Administration (225 | 9.1%).
Sales and Office Occupations by Sex
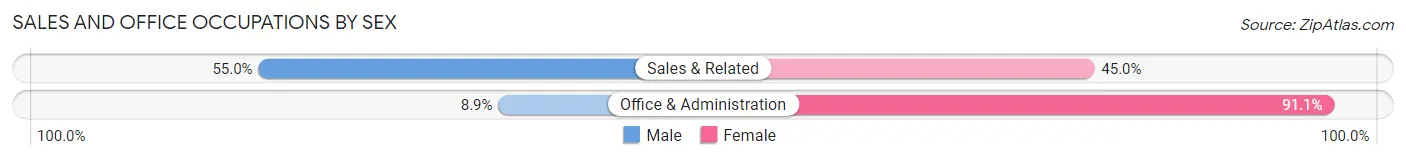
| Occupation | Male | Female |
| Sales & Related | 186 (55.0%) | 152 (45.0%) |
| Office & Administration | 20 (8.9%) | 205 (91.1%) |
| Total (Category) | 206 (36.6%) | 357 (63.4%) |
| Total (Overall) | 1,293 (52.5%) | 1,171 (47.5%) |
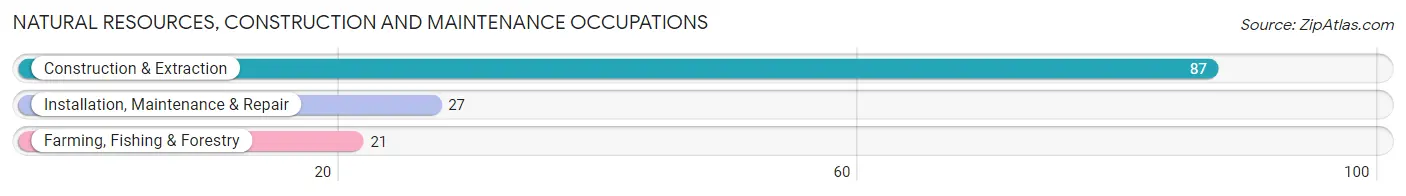
Natural Resources, Construction and Maintenance Occupations
The most common Natural Resources, Construction and Maintenance occupations in Spring Valley are Construction & Extraction (87 | 3.5%), Installation, Maintenance & Repair (27 | 1.1%), and Farming, Fishing & Forestry (21 | 0.9%).
Natural Resources, Construction and Maintenance Occupations by Sex
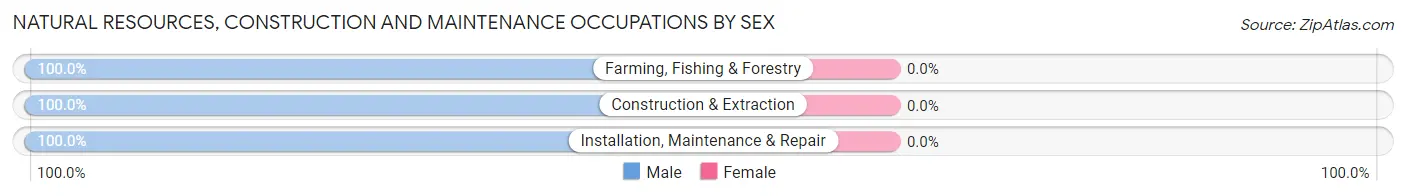
| Occupation | Male | Female |
| Farming, Fishing & Forestry | 21 (100.0%) | 0 (0.0%) |
| Construction & Extraction | 87 (100.0%) | 0 (0.0%) |
| Installation, Maintenance & Repair | 27 (100.0%) | 0 (0.0%) |
| Total (Category) | 135 (100.0%) | 0 (0.0%) |
| Total (Overall) | 1,293 (52.5%) | 1,171 (47.5%) |
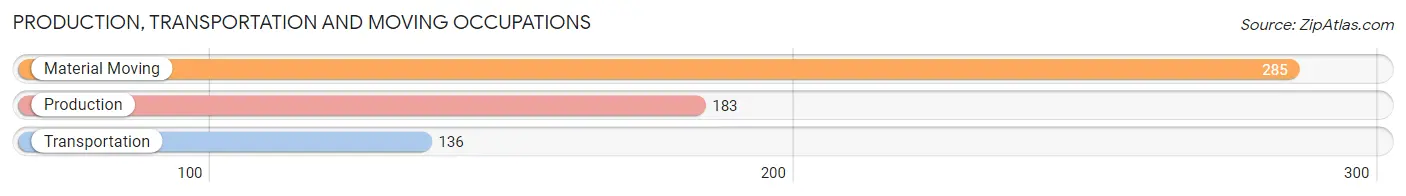
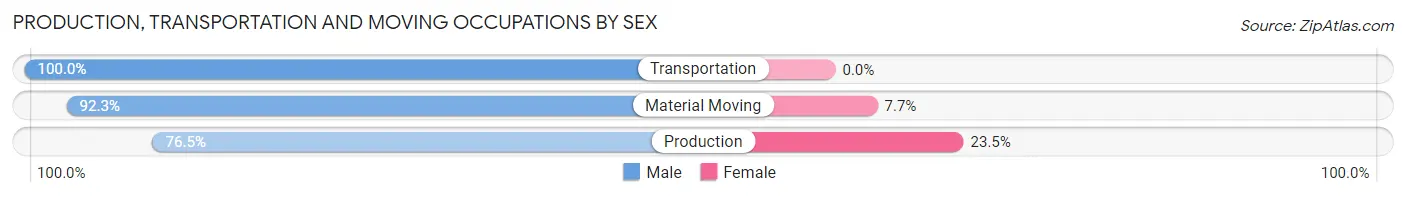
Production, Transportation and Moving Occupations
The most common Production, Transportation and Moving occupations in Spring Valley are Material Moving (285 | 11.6%), Production (183 | 7.4%), and Transportation (136 | 5.5%).
Production, Transportation and Moving Occupations by Sex
| Occupation | Male | Female |
| Production | 140 (76.5%) | 43 (23.5%) |
| Transportation | 136 (100.0%) | 0 (0.0%) |
| Material Moving | 263 (92.3%) | 22 (7.7%) |
| Total (Category) | 539 (89.2%) | 65 (10.8%) |
| Total (Overall) | 1,293 (52.5%) | 1,171 (47.5%) |
Employment Industries by Sex in Spring Valley
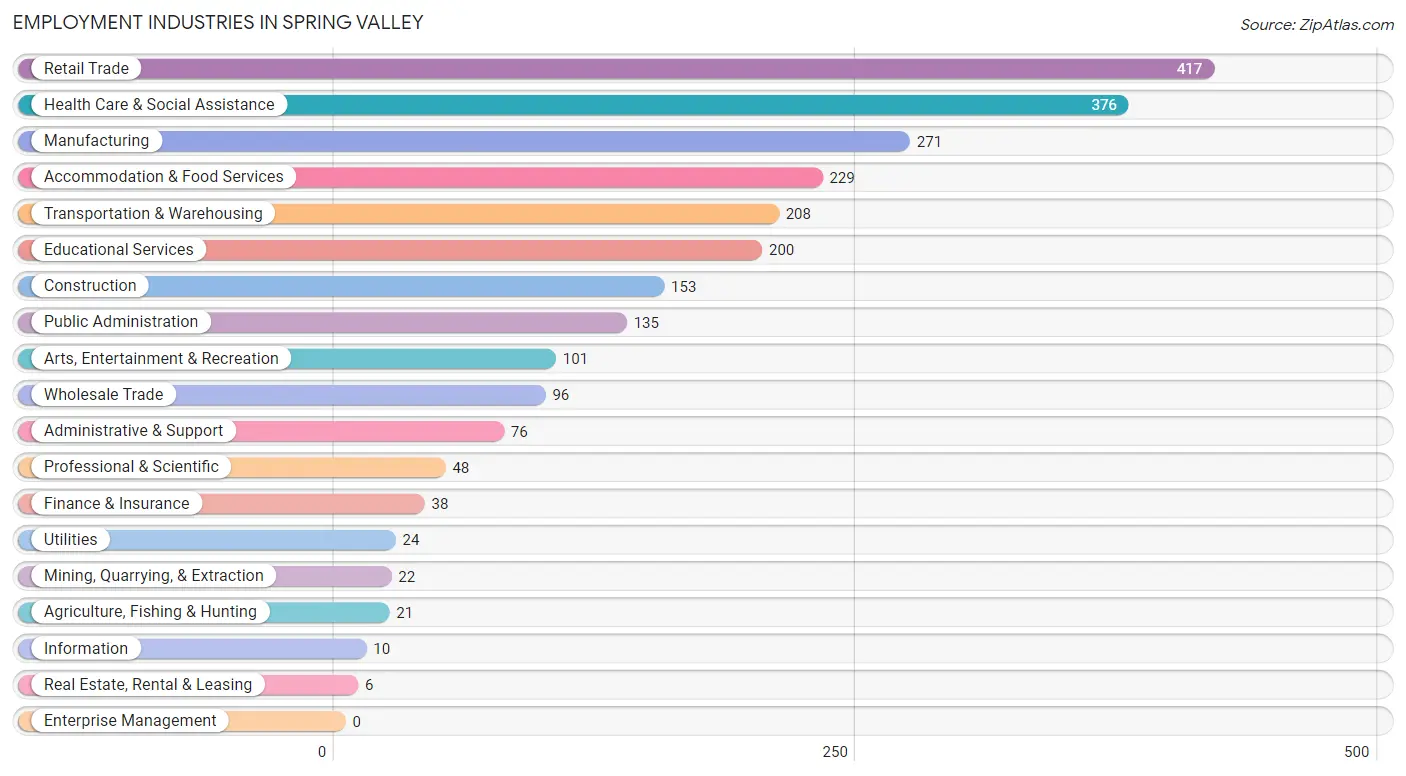
Employment Industries in Spring Valley
The major employment industries in Spring Valley include Retail Trade (417 | 16.9%), Health Care & Social Assistance (376 | 15.3%), Manufacturing (271 | 11.0%), Accommodation & Food Services (229 | 9.3%), and Transportation & Warehousing (208 | 8.4%).
Employment Industries by Sex in Spring Valley
The Spring Valley industries that see more men than women are Agriculture, Fishing & Hunting (100.0%), Mining, Quarrying, & Extraction (100.0%), and Utilities (100.0%), whereas the industries that tend to have a higher number of women are Information (100.0%), Arts, Entertainment & Recreation (100.0%), and Educational Services (90.0%).
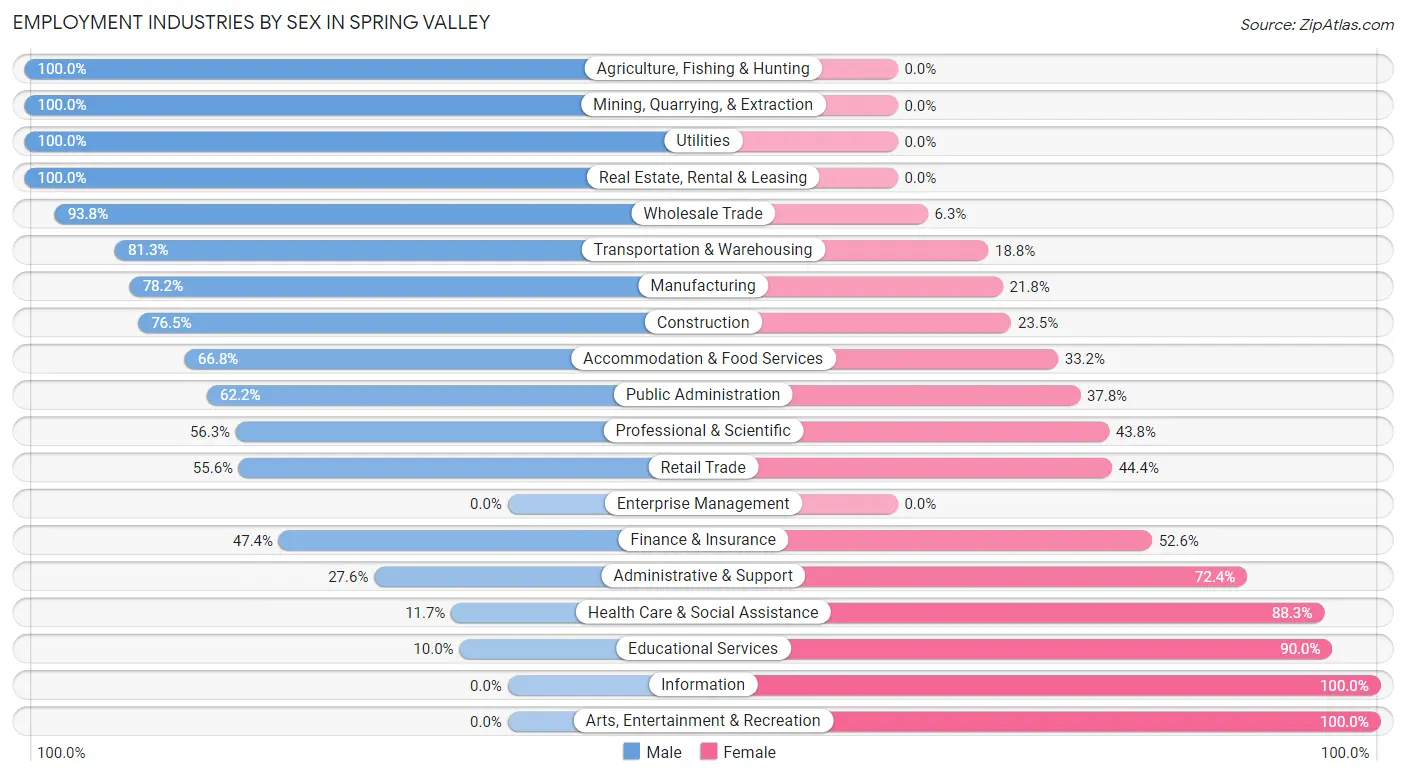
| Industry | Male | Female |
| Agriculture, Fishing & Hunting | 21 (100.0%) | 0 (0.0%) |
| Mining, Quarrying, & Extraction | 22 (100.0%) | 0 (0.0%) |
| Construction | 117 (76.5%) | 36 (23.5%) |
| Manufacturing | 212 (78.2%) | 59 (21.8%) |
| Wholesale Trade | 90 (93.8%) | 6 (6.2%) |
| Retail Trade | 232 (55.6%) | 185 (44.4%) |
| Transportation & Warehousing | 169 (81.2%) | 39 (18.8%) |
| Utilities | 24 (100.0%) | 0 (0.0%) |
| Information | 0 (0.0%) | 10 (100.0%) |
| Finance & Insurance | 18 (47.4%) | 20 (52.6%) |
| Real Estate, Rental & Leasing | 6 (100.0%) | 0 (0.0%) |
| Professional & Scientific | 27 (56.2%) | 21 (43.8%) |
| Enterprise Management | 0 (0.0%) | 0 (0.0%) |
| Administrative & Support | 21 (27.6%) | 55 (72.4%) |
| Educational Services | 20 (10.0%) | 180 (90.0%) |
| Health Care & Social Assistance | 44 (11.7%) | 332 (88.3%) |
| Arts, Entertainment & Recreation | 0 (0.0%) | 101 (100.0%) |
| Accommodation & Food Services | 153 (66.8%) | 76 (33.2%) |
| Public Administration | 84 (62.2%) | 51 (37.8%) |
| Total | 1,293 (52.5%) | 1,171 (47.5%) |
Education in Spring Valley
School Enrollment in Spring Valley
The most common levels of schooling among the 1,242 students in Spring Valley are high school (362 | 29.1%), middle school (299 | 24.1%), and elementary school (283 | 22.8%).
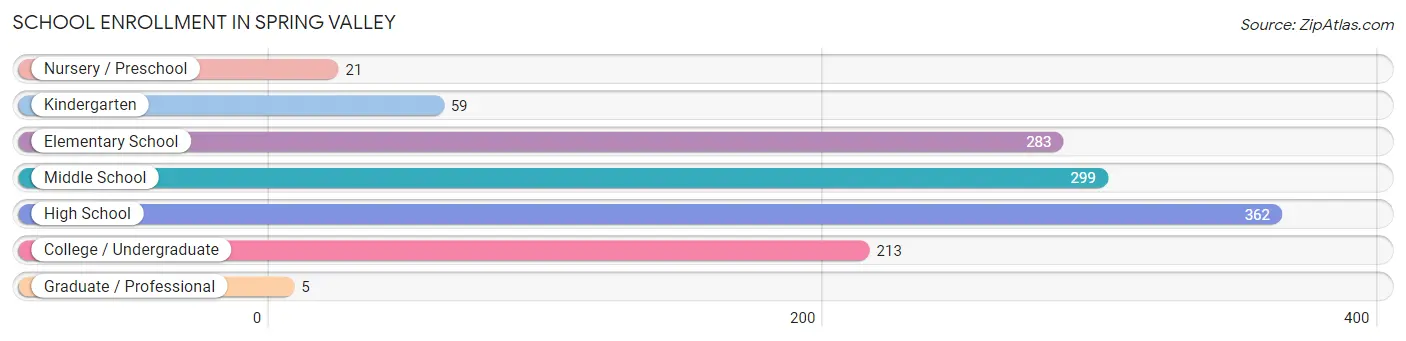
| School Level | # Students | % Students |
| Nursery / Preschool | 21 | 1.7% |
| Kindergarten | 59 | 4.8% |
| Elementary School | 283 | 22.8% |
| Middle School | 299 | 24.1% |
| High School | 362 | 29.1% |
| College / Undergraduate | 213 | 17.2% |
| Graduate / Professional | 5 | 0.4% |
| Total | 1,242 | 100.0% |
School Enrollment by Age by Funding Source in Spring Valley
Out of a total of 1,242 students who are enrolled in schools in Spring Valley, 193 (15.5%) attend a private institution, while the remaining 1,049 (84.5%) are enrolled in public schools. The age group of 10 to 14 year olds has the highest likelihood of being enrolled in private schools, with 102 (26.3% in the age bracket) enrolled. Conversely, the age group of 3 to 4 year olds has the lowest likelihood of being enrolled in a private school, with 12 (100.0% in the age bracket) attending a public institution.
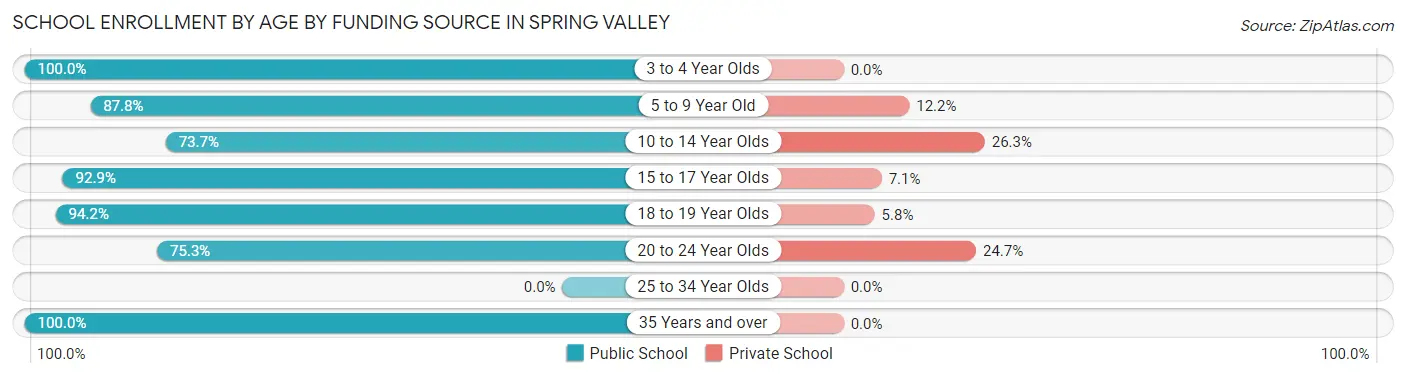
| Age Bracket | Public School | Private School |
| 3 to 4 Year Olds | 12 (100.0%) | 0 (0.0%) |
| 5 to 9 Year Old | 237 (87.8%) | 33 (12.2%) |
| 10 to 14 Year Olds | 286 (73.7%) | 102 (26.3%) |
| 15 to 17 Year Olds | 249 (92.9%) | 19 (7.1%) |
| 18 to 19 Year Olds | 49 (94.2%) | 3 (5.8%) |
| 20 to 24 Year Olds | 110 (75.3%) | 36 (24.7%) |
| 25 to 34 Year Olds | 0 (0.0%) | 0 (0.0%) |
| 35 Years and over | 106 (100.0%) | 0 (0.0%) |
| Total | 1,049 (84.5%) | 193 (15.5%) |
Educational Attainment by Field of Study in Spring Valley
Business (159 | 22.8%), education (157 | 22.5%), science & technology (97 | 13.9%), engineering (51 | 7.3%), and social sciences (44 | 6.3%) are the most common fields of study among 698 individuals in Spring Valley who have obtained a bachelor's degree or higher.
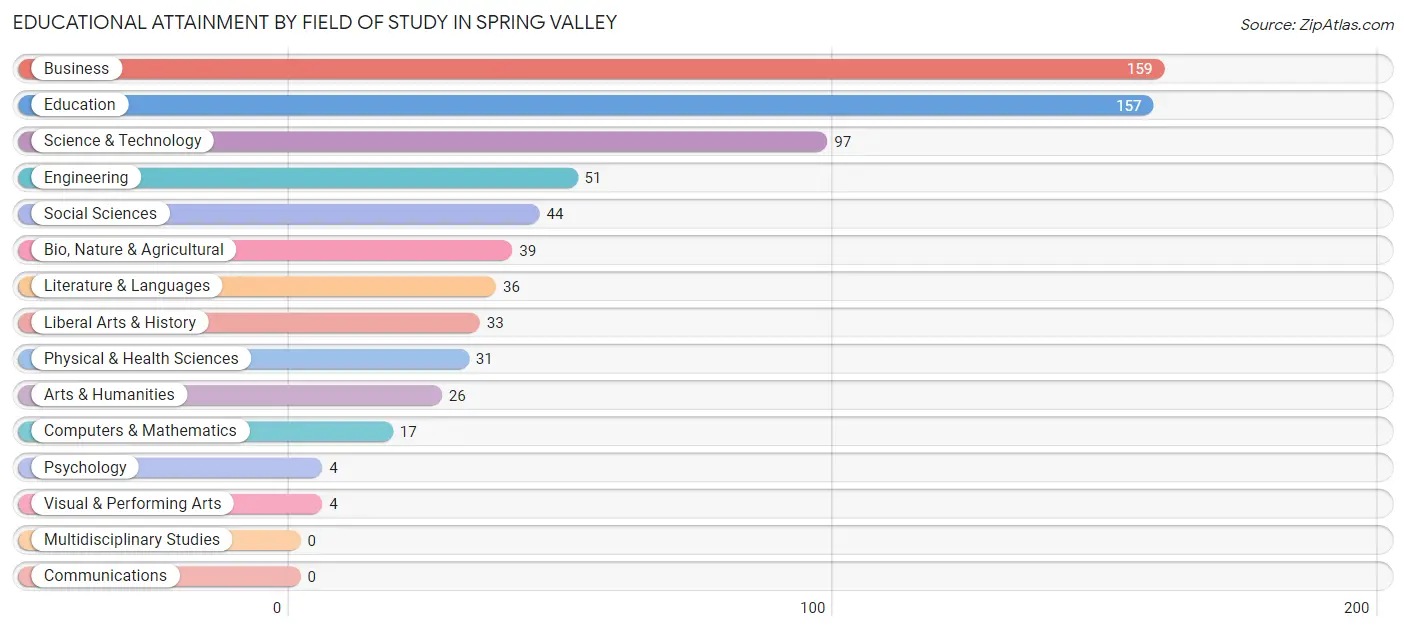
| Field of Study | # Graduates | % Graduates |
| Computers & Mathematics | 17 | 2.4% |
| Bio, Nature & Agricultural | 39 | 5.6% |
| Physical & Health Sciences | 31 | 4.4% |
| Psychology | 4 | 0.6% |
| Social Sciences | 44 | 6.3% |
| Engineering | 51 | 7.3% |
| Multidisciplinary Studies | 0 | 0.0% |
| Science & Technology | 97 | 13.9% |
| Business | 159 | 22.8% |
| Education | 157 | 22.5% |
| Literature & Languages | 36 | 5.2% |
| Liberal Arts & History | 33 | 4.7% |
| Visual & Performing Arts | 4 | 0.6% |
| Communications | 0 | 0.0% |
| Arts & Humanities | 26 | 3.7% |
| Total | 698 | 100.0% |
Transportation & Commute in Spring Valley
Vehicle Availability by Sex in Spring Valley
The most prevalent vehicle ownership categories in Spring Valley are males with 2 vehicles (714, accounting for 55.7%) and females with 2 vehicles (554, making up 62.4%).
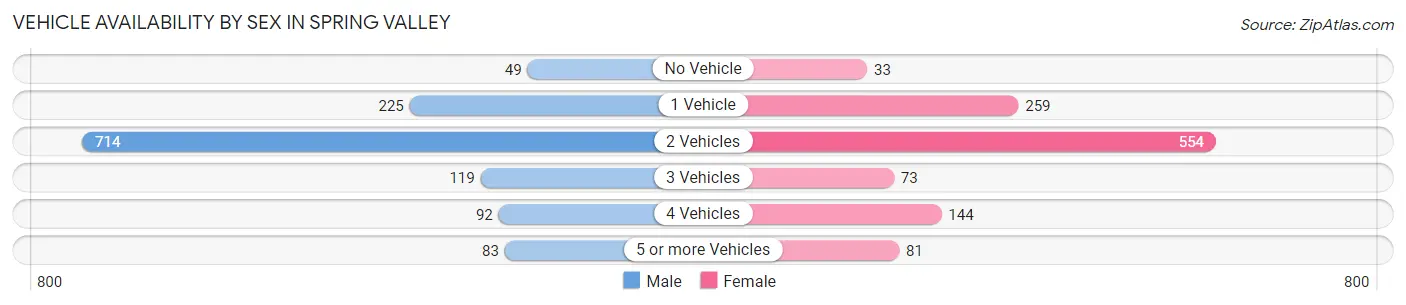
| Vehicles Available | Male | Female |
| No Vehicle | 49 (3.8%) | 33 (2.9%) |
| 1 Vehicle | 225 (17.5%) | 259 (22.6%) |
| 2 Vehicles | 714 (55.7%) | 554 (48.4%) |
| 3 Vehicles | 119 (9.3%) | 73 (6.4%) |
| 4 Vehicles | 92 (7.2%) | 144 (12.6%) |
| 5 or more Vehicles | 83 (6.5%) | 81 (7.1%) |
| Total | 1,282 (100.0%) | 1,144 (100.0%) |
Commute Time in Spring Valley
The most frequently occuring commute durations in Spring Valley are 15 to 19 minutes (748 commuters, 31.2%), 10 to 14 minutes (329 commuters, 13.7%), and 5 to 9 minutes (317 commuters, 13.2%).
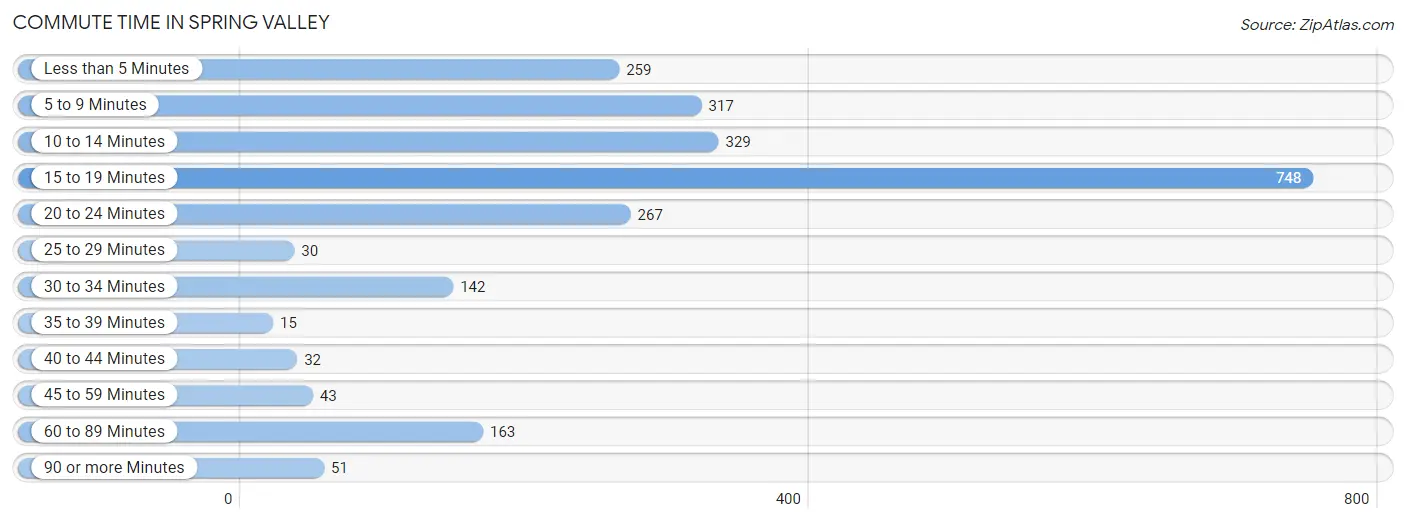
| Commute Time | # Commuters | % Commuters |
| Less than 5 Minutes | 259 | 10.8% |
| 5 to 9 Minutes | 317 | 13.2% |
| 10 to 14 Minutes | 329 | 13.7% |
| 15 to 19 Minutes | 748 | 31.2% |
| 20 to 24 Minutes | 267 | 11.1% |
| 25 to 29 Minutes | 30 | 1.3% |
| 30 to 34 Minutes | 142 | 5.9% |
| 35 to 39 Minutes | 15 | 0.6% |
| 40 to 44 Minutes | 32 | 1.3% |
| 45 to 59 Minutes | 43 | 1.8% |
| 60 to 89 Minutes | 163 | 6.8% |
| 90 or more Minutes | 51 | 2.1% |
Commute Time by Sex in Spring Valley
The most common commute times in Spring Valley are 15 to 19 minutes (331 commuters, 25.7%) for males and 15 to 19 minutes (417 commuters, 37.6%) for females.
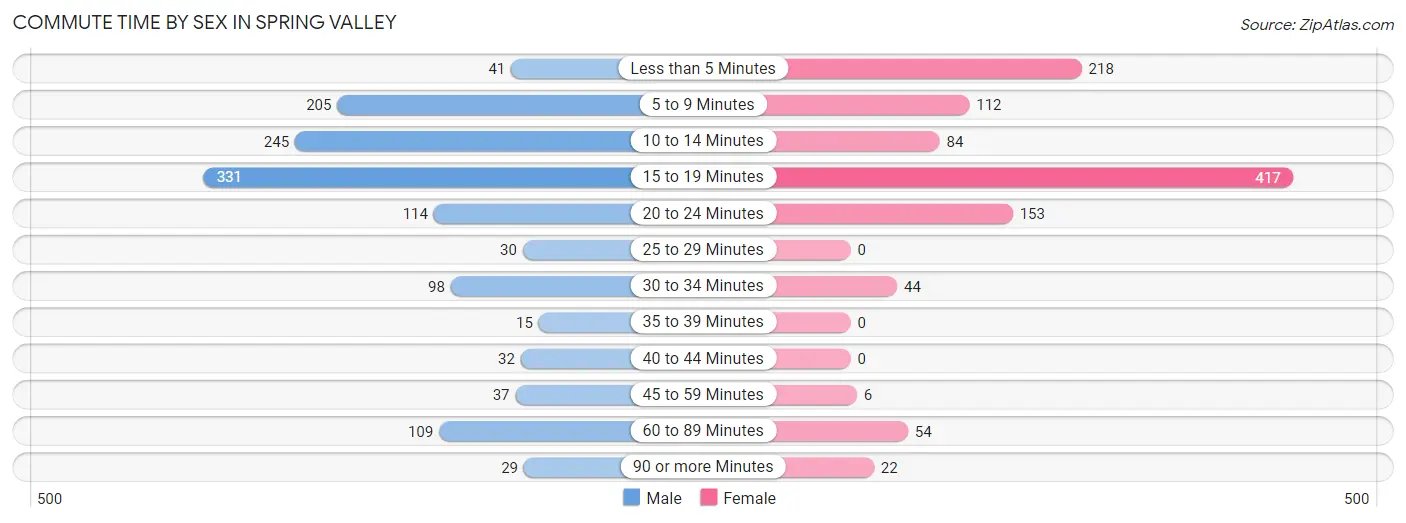
| Commute Time | Male | Female |
| Less than 5 Minutes | 41 (3.2%) | 218 (19.6%) |
| 5 to 9 Minutes | 205 (15.9%) | 112 (10.1%) |
| 10 to 14 Minutes | 245 (19.1%) | 84 (7.6%) |
| 15 to 19 Minutes | 331 (25.7%) | 417 (37.6%) |
| 20 to 24 Minutes | 114 (8.9%) | 153 (13.8%) |
| 25 to 29 Minutes | 30 (2.3%) | 0 (0.0%) |
| 30 to 34 Minutes | 98 (7.6%) | 44 (4.0%) |
| 35 to 39 Minutes | 15 (1.2%) | 0 (0.0%) |
| 40 to 44 Minutes | 32 (2.5%) | 0 (0.0%) |
| 45 to 59 Minutes | 37 (2.9%) | 6 (0.5%) |
| 60 to 89 Minutes | 109 (8.5%) | 54 (4.9%) |
| 90 or more Minutes | 29 (2.3%) | 22 (2.0%) |
Time of Departure to Work by Sex in Spring Valley
The most frequent times of departure to work in Spring Valley are 7:00 AM to 7:29 AM (206, 16.0%) for males and 7:00 AM to 7:29 AM (282, 25.4%) for females.
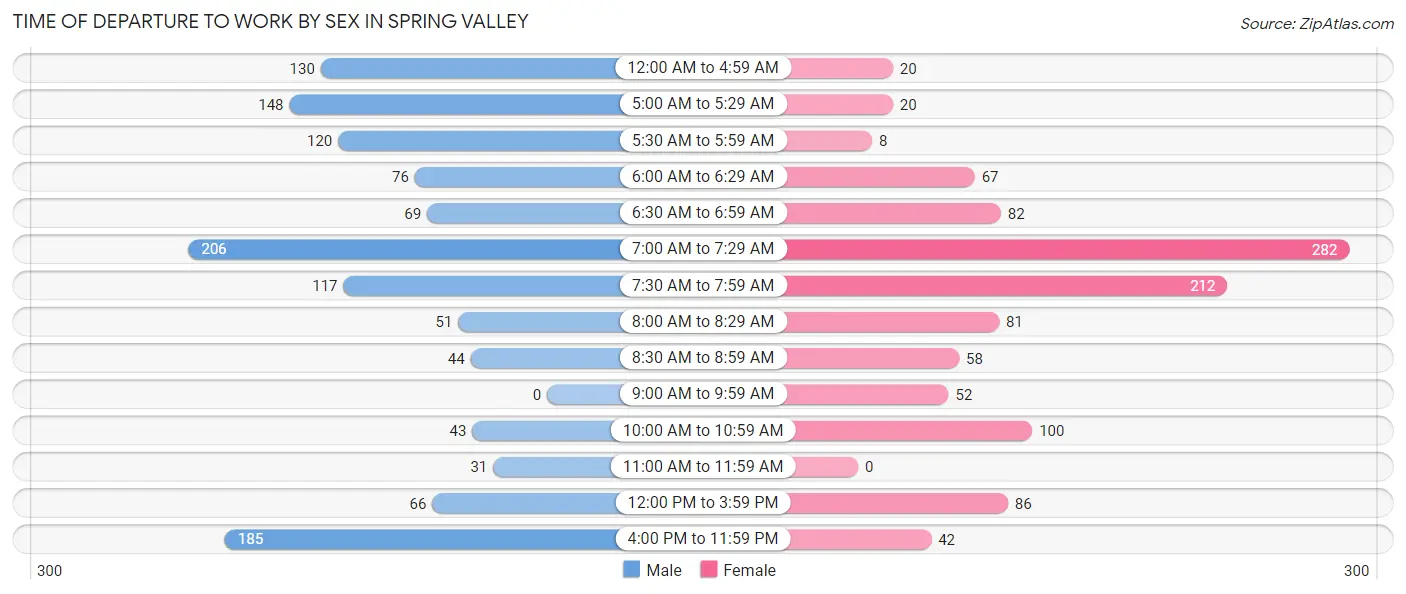
| Time of Departure | Male | Female |
| 12:00 AM to 4:59 AM | 130 (10.1%) | 20 (1.8%) |
| 5:00 AM to 5:29 AM | 148 (11.5%) | 20 (1.8%) |
| 5:30 AM to 5:59 AM | 120 (9.3%) | 8 (0.7%) |
| 6:00 AM to 6:29 AM | 76 (5.9%) | 67 (6.0%) |
| 6:30 AM to 6:59 AM | 69 (5.4%) | 82 (7.4%) |
| 7:00 AM to 7:29 AM | 206 (16.0%) | 282 (25.4%) |
| 7:30 AM to 7:59 AM | 117 (9.1%) | 212 (19.1%) |
| 8:00 AM to 8:29 AM | 51 (4.0%) | 81 (7.3%) |
| 8:30 AM to 8:59 AM | 44 (3.4%) | 58 (5.2%) |
| 9:00 AM to 9:59 AM | 0 (0.0%) | 52 (4.7%) |
| 10:00 AM to 10:59 AM | 43 (3.3%) | 100 (9.0%) |
| 11:00 AM to 11:59 AM | 31 (2.4%) | 0 (0.0%) |
| 12:00 PM to 3:59 PM | 66 (5.1%) | 86 (7.7%) |
| 4:00 PM to 11:59 PM | 185 (14.4%) | 42 (3.8%) |
| Total | 1,286 (100.0%) | 1,110 (100.0%) |
Housing Occupancy in Spring Valley
Occupancy by Ownership in Spring Valley
Of the total 2,304 dwellings in Spring Valley, owner-occupied units account for 1,484 (64.4%), while renter-occupied units make up 820 (35.6%).
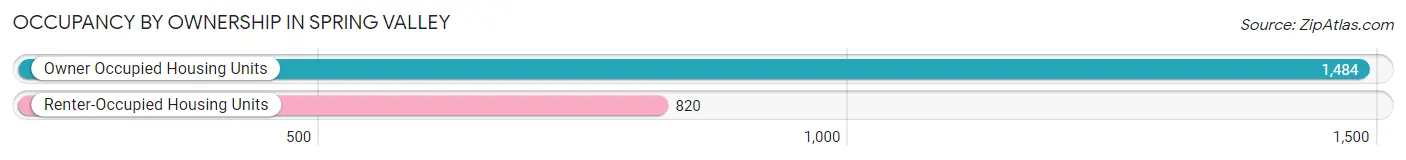
| Occupancy | # Housing Units | % Housing Units |
| Owner Occupied Housing Units | 1,484 | 64.4% |
| Renter-Occupied Housing Units | 820 | 35.6% |
| Total Occupied Housing Units | 2,304 | 100.0% |
Occupancy by Household Size in Spring Valley
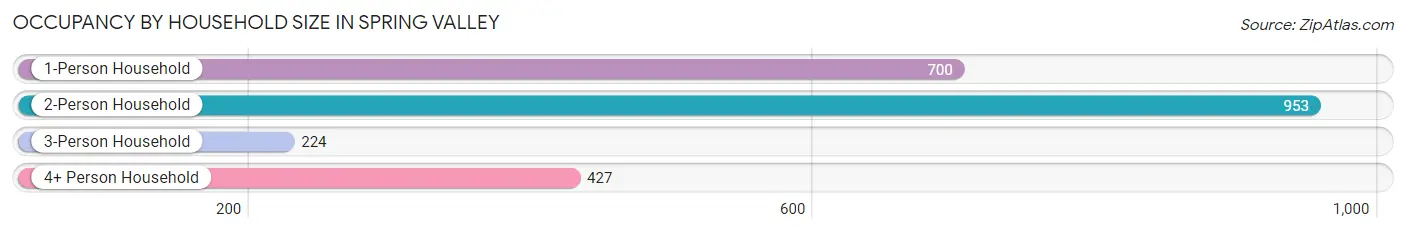
| Household Size | # Housing Units | % Housing Units |
| 1-Person Household | 700 | 30.4% |
| 2-Person Household | 953 | 41.4% |
| 3-Person Household | 224 | 9.7% |
| 4+ Person Household | 427 | 18.5% |
| Total Housing Units | 2,304 | 100.0% |
Occupancy by Ownership by Household Size in Spring Valley
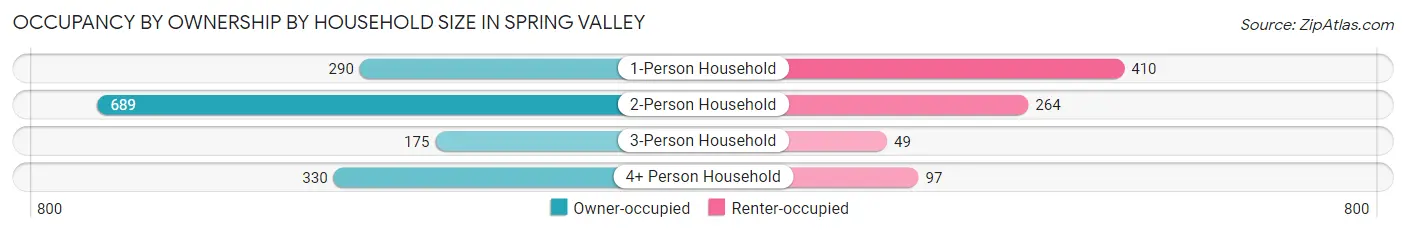
| Household Size | Owner-occupied | Renter-occupied |
| 1-Person Household | 290 (41.4%) | 410 (58.6%) |
| 2-Person Household | 689 (72.3%) | 264 (27.7%) |
| 3-Person Household | 175 (78.1%) | 49 (21.9%) |
| 4+ Person Household | 330 (77.3%) | 97 (22.7%) |
| Total Housing Units | 1,484 (64.4%) | 820 (35.6%) |
Occupancy by Educational Attainment in Spring Valley
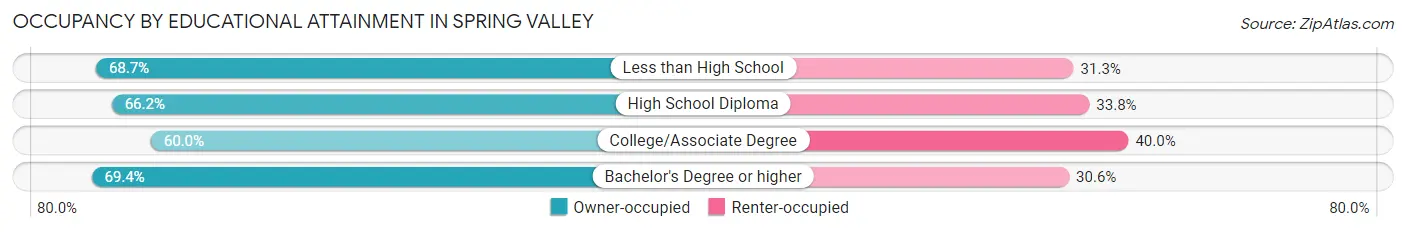
| Household Size | Owner-occupied | Renter-occupied |
| Less than High School | 193 (68.7%) | 88 (31.3%) |
| High School Diploma | 497 (66.2%) | 254 (33.8%) |
| College/Associate Degree | 565 (60.0%) | 377 (40.0%) |
| Bachelor's Degree or higher | 229 (69.4%) | 101 (30.6%) |
Occupancy by Age of Householder in Spring Valley
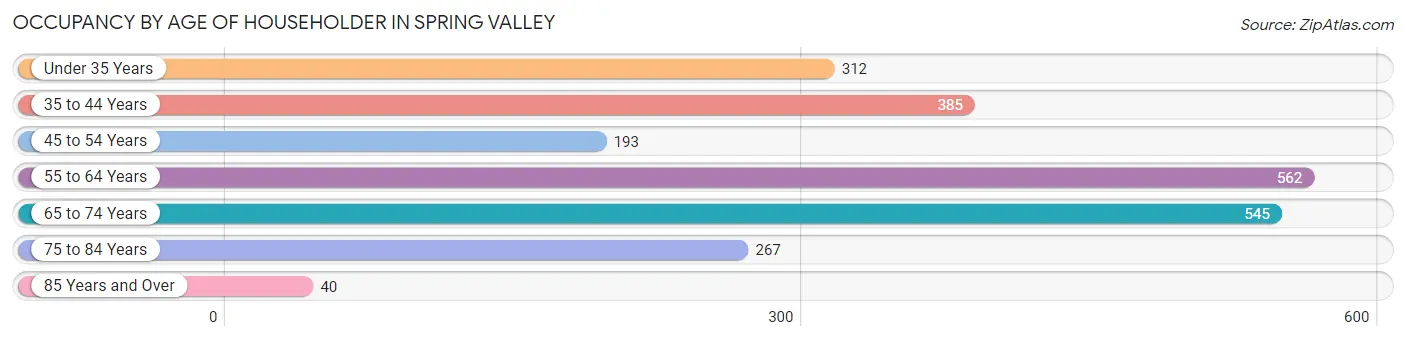
| Age Bracket | # Households | % Households |
| Under 35 Years | 312 | 13.5% |
| 35 to 44 Years | 385 | 16.7% |
| 45 to 54 Years | 193 | 8.4% |
| 55 to 64 Years | 562 | 24.4% |
| 65 to 74 Years | 545 | 23.6% |
| 75 to 84 Years | 267 | 11.6% |
| 85 Years and Over | 40 | 1.7% |
| Total | 2,304 | 100.0% |
Housing Finances in Spring Valley
Median Income by Occupancy in Spring Valley
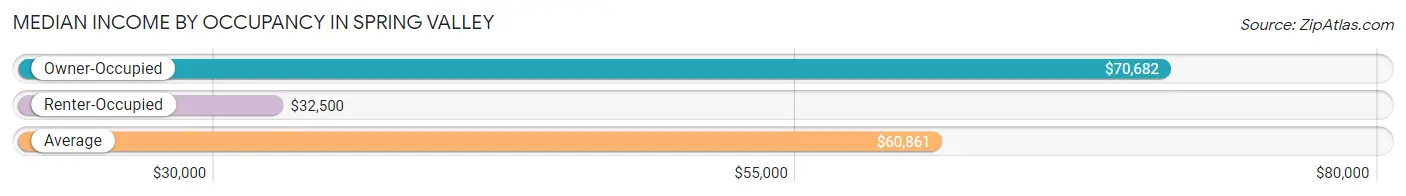
| Occupancy Type | # Households | Median Income |
| Owner-Occupied | 1,484 (64.4%) | $70,682 |
| Renter-Occupied | 820 (35.6%) | $32,500 |
| Average | 2,304 (100.0%) | $60,861 |
Occupancy by Householder Income Bracket in Spring Valley
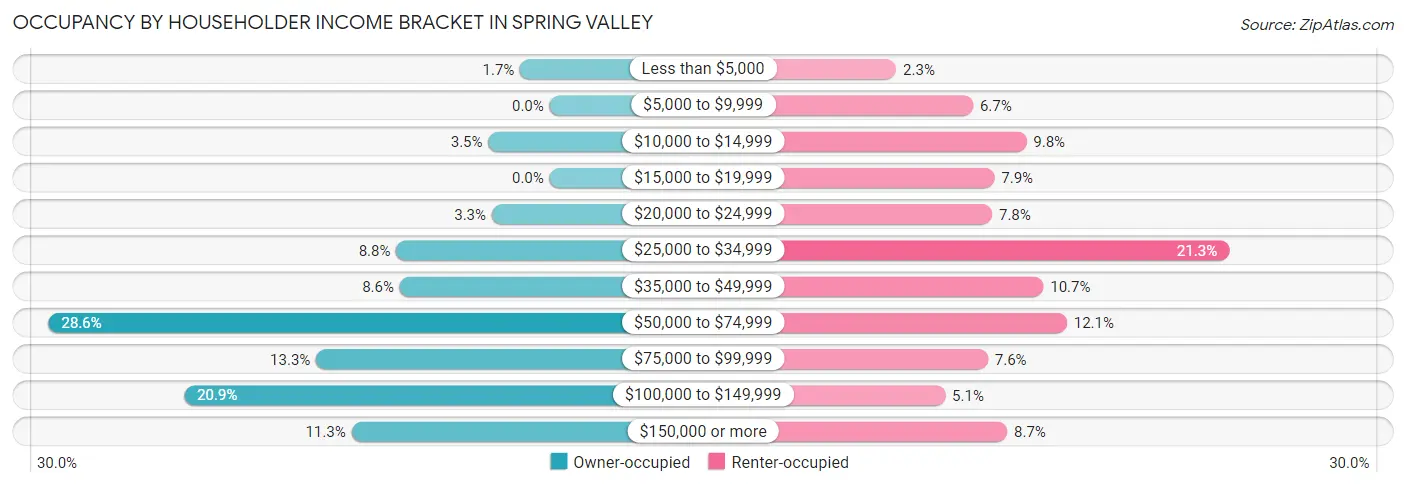
| Income Bracket | Owner-occupied | Renter-occupied |
| Less than $5,000 | 25 (1.7%) | 19 (2.3%) |
| $5,000 to $9,999 | 0 (0.0%) | 55 (6.7%) |
| $10,000 to $14,999 | 52 (3.5%) | 80 (9.8%) |
| $15,000 to $19,999 | 0 (0.0%) | 65 (7.9%) |
| $20,000 to $24,999 | 49 (3.3%) | 64 (7.8%) |
| $25,000 to $34,999 | 130 (8.8%) | 175 (21.3%) |
| $35,000 to $49,999 | 127 (8.6%) | 88 (10.7%) |
| $50,000 to $74,999 | 425 (28.6%) | 99 (12.1%) |
| $75,000 to $99,999 | 198 (13.3%) | 62 (7.6%) |
| $100,000 to $149,999 | 310 (20.9%) | 42 (5.1%) |
| $150,000 or more | 168 (11.3%) | 71 (8.7%) |
| Total | 1,484 (100.0%) | 820 (100.0%) |
Monthly Housing Cost Tiers in Spring Valley
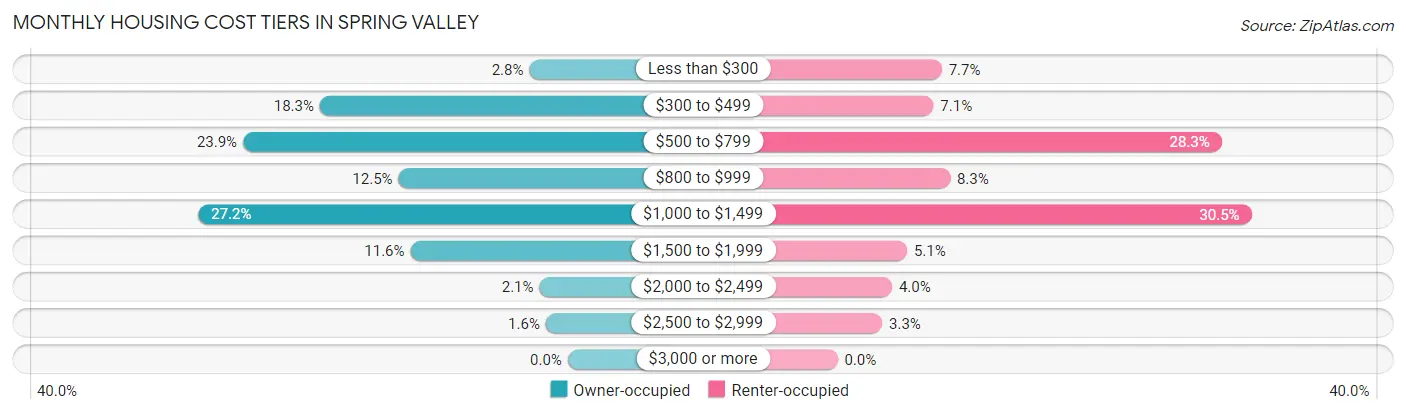
| Monthly Cost | Owner-occupied | Renter-occupied |
| Less than $300 | 42 (2.8%) | 63 (7.7%) |
| $300 to $499 | 271 (18.3%) | 58 (7.1%) |
| $500 to $799 | 355 (23.9%) | 232 (28.3%) |
| $800 to $999 | 185 (12.5%) | 68 (8.3%) |
| $1,000 to $1,499 | 404 (27.2%) | 250 (30.5%) |
| $1,500 to $1,999 | 172 (11.6%) | 42 (5.1%) |
| $2,000 to $2,499 | 31 (2.1%) | 33 (4.0%) |
| $2,500 to $2,999 | 24 (1.6%) | 27 (3.3%) |
| $3,000 or more | 0 (0.0%) | 0 (0.0%) |
| Total | 1,484 (100.0%) | 820 (100.0%) |
Physical Housing Characteristics in Spring Valley
Housing Structures in Spring Valley
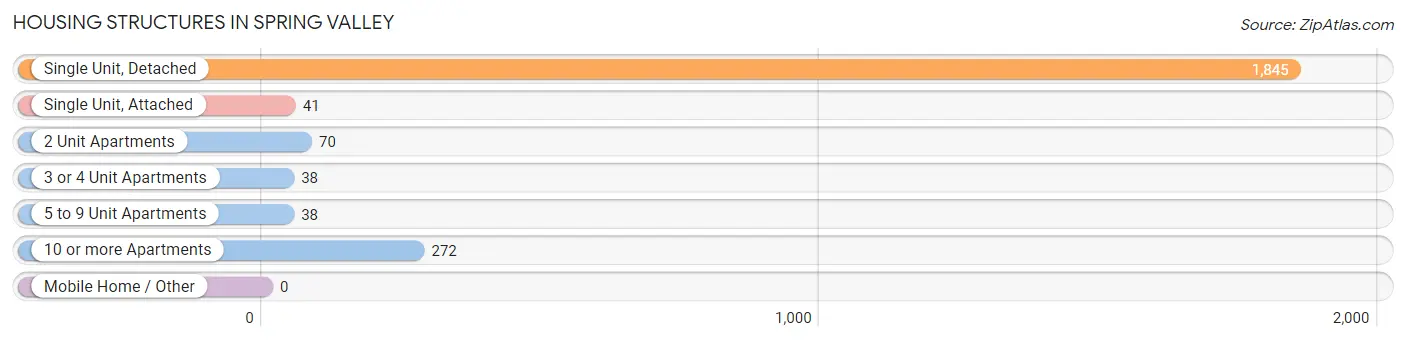
| Structure Type | # Housing Units | % Housing Units |
| Single Unit, Detached | 1,845 | 80.1% |
| Single Unit, Attached | 41 | 1.8% |
| 2 Unit Apartments | 70 | 3.0% |
| 3 or 4 Unit Apartments | 38 | 1.7% |
| 5 to 9 Unit Apartments | 38 | 1.7% |
| 10 or more Apartments | 272 | 11.8% |
| Mobile Home / Other | 0 | 0.0% |
| Total | 2,304 | 100.0% |
Housing Structures by Occupancy in Spring Valley
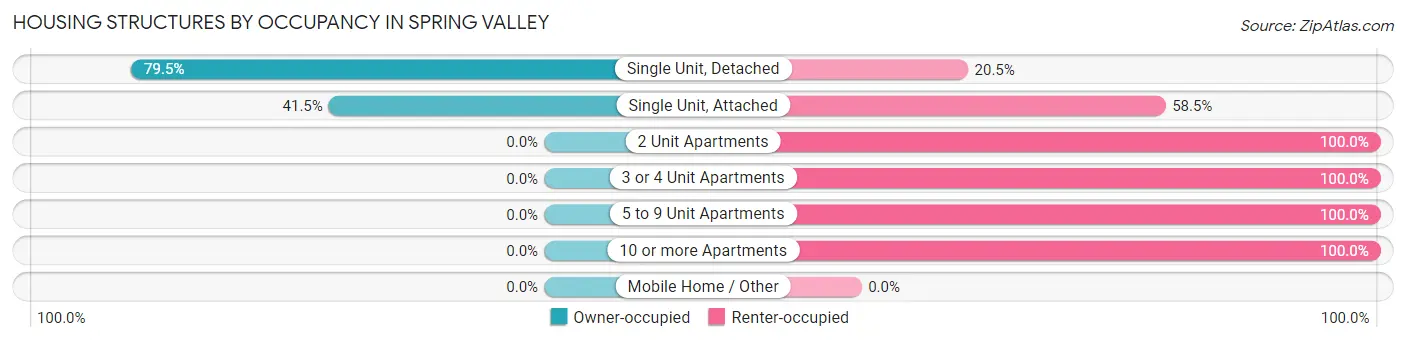
| Structure Type | Owner-occupied | Renter-occupied |
| Single Unit, Detached | 1,467 (79.5%) | 378 (20.5%) |
| Single Unit, Attached | 17 (41.5%) | 24 (58.5%) |
| 2 Unit Apartments | 0 (0.0%) | 70 (100.0%) |
| 3 or 4 Unit Apartments | 0 (0.0%) | 38 (100.0%) |
| 5 to 9 Unit Apartments | 0 (0.0%) | 38 (100.0%) |
| 10 or more Apartments | 0 (0.0%) | 272 (100.0%) |
| Mobile Home / Other | 0 (0.0%) | 0 (0.0%) |
| Total | 1,484 (64.4%) | 820 (35.6%) |
Housing Structures by Number of Rooms in Spring Valley
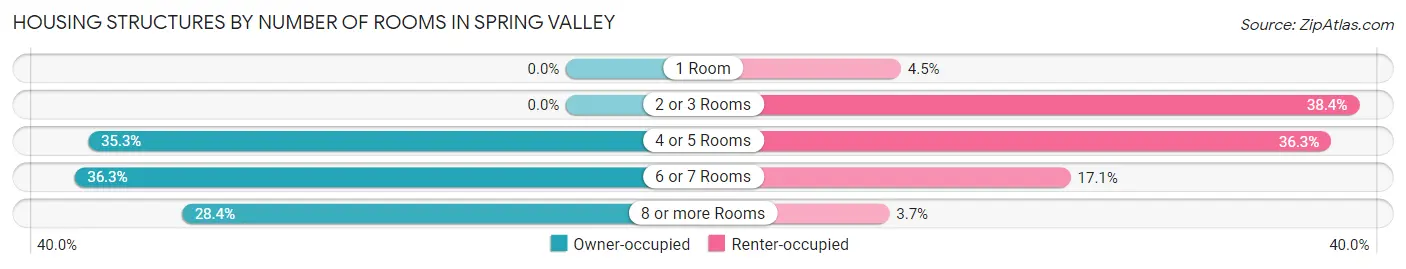
| Number of Rooms | Owner-occupied | Renter-occupied |
| 1 Room | 0 (0.0%) | 37 (4.5%) |
| 2 or 3 Rooms | 0 (0.0%) | 315 (38.4%) |
| 4 or 5 Rooms | 524 (35.3%) | 298 (36.3%) |
| 6 or 7 Rooms | 539 (36.3%) | 140 (17.1%) |
| 8 or more Rooms | 421 (28.4%) | 30 (3.7%) |
| Total | 1,484 (100.0%) | 820 (100.0%) |
Housing Structure by Heating Type in Spring Valley
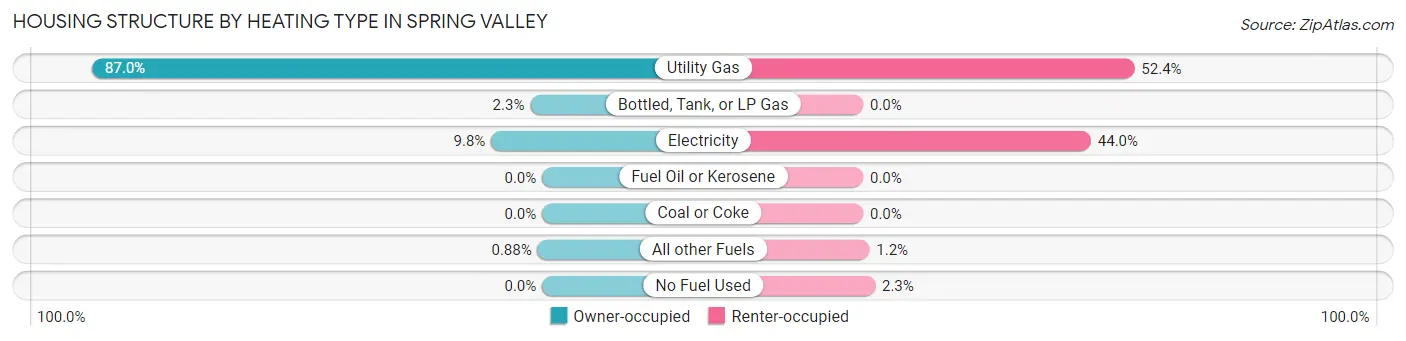
| Heating Type | Owner-occupied | Renter-occupied |
| Utility Gas | 1,291 (87.0%) | 430 (52.4%) |
| Bottled, Tank, or LP Gas | 34 (2.3%) | 0 (0.0%) |
| Electricity | 146 (9.8%) | 361 (44.0%) |
| Fuel Oil or Kerosene | 0 (0.0%) | 0 (0.0%) |
| Coal or Coke | 0 (0.0%) | 0 (0.0%) |
| All other Fuels | 13 (0.9%) | 10 (1.2%) |
| No Fuel Used | 0 (0.0%) | 19 (2.3%) |
| Total | 1,484 (100.0%) | 820 (100.0%) |
Household Vehicle Usage in Spring Valley
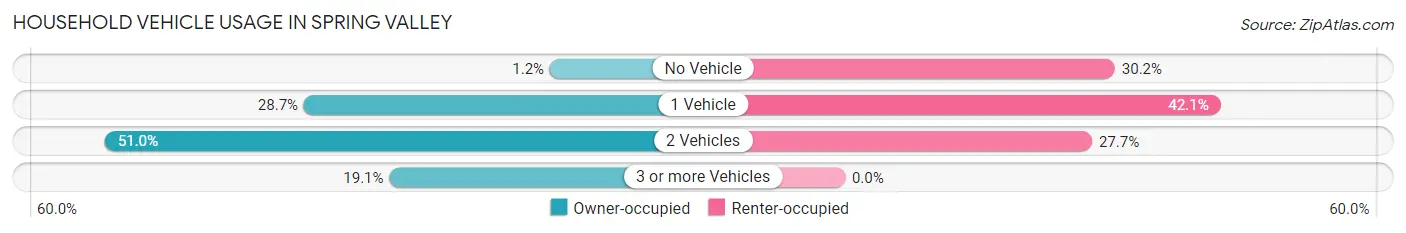
| Vehicles per Household | Owner-occupied | Renter-occupied |
| No Vehicle | 17 (1.1%) | 248 (30.2%) |
| 1 Vehicle | 426 (28.7%) | 345 (42.1%) |
| 2 Vehicles | 757 (51.0%) | 227 (27.7%) |
| 3 or more Vehicles | 284 (19.1%) | 0 (0.0%) |
| Total | 1,484 (100.0%) | 820 (100.0%) |
Real Estate & Mortgages in Spring Valley
Real Estate and Mortgage Overview in Spring Valley
| Characteristic | Without Mortgage | With Mortgage |
| Housing Units | 750 | 734 |
| Median Property Value | $128,800 | $114,100 |
| Median Household Income | $63,281 | $115 |
| Monthly Housing Costs | $569 | $0 |
| Real Estate Taxes | $2,893 | $0 |
Property Value by Mortgage Status in Spring Valley
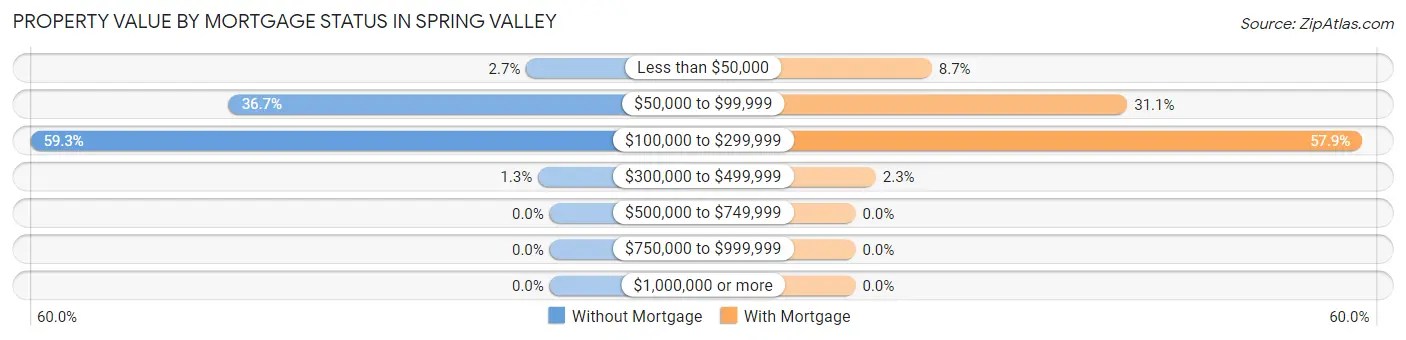
| Property Value | Without Mortgage | With Mortgage |
| Less than $50,000 | 20 (2.7%) | 64 (8.7%) |
| $50,000 to $99,999 | 275 (36.7%) | 228 (31.1%) |
| $100,000 to $299,999 | 445 (59.3%) | 425 (57.9%) |
| $300,000 to $499,999 | 10 (1.3%) | 17 (2.3%) |
| $500,000 to $749,999 | 0 (0.0%) | 0 (0.0%) |
| $750,000 to $999,999 | 0 (0.0%) | 0 (0.0%) |
| $1,000,000 or more | 0 (0.0%) | 0 (0.0%) |
| Total | 750 (100.0%) | 734 (100.0%) |
Household Income by Mortgage Status in Spring Valley
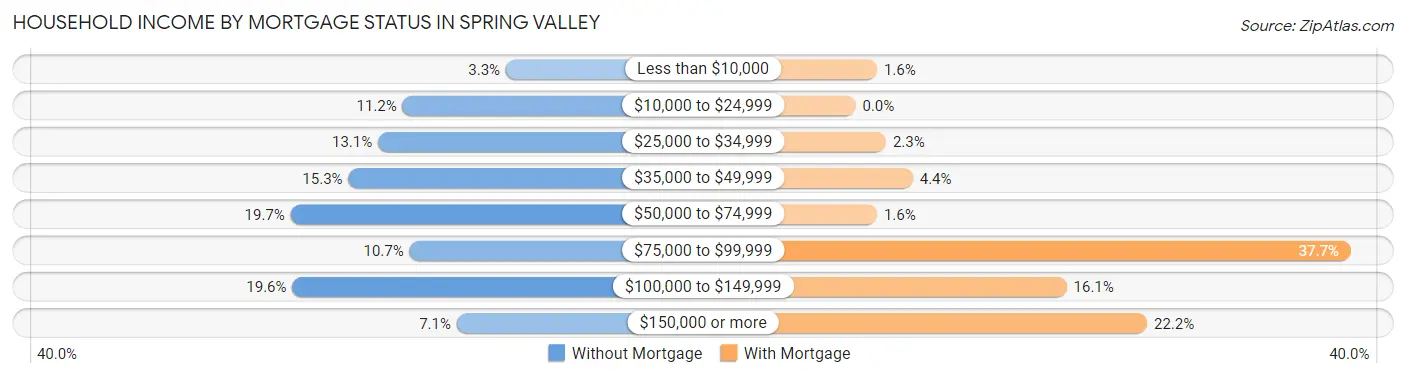
| Household Income | Without Mortgage | With Mortgage |
| Less than $10,000 | 25 (3.3%) | 12 (1.6%) |
| $10,000 to $24,999 | 84 (11.2%) | 0 (0.0%) |
| $25,000 to $34,999 | 98 (13.1%) | 17 (2.3%) |
| $35,000 to $49,999 | 115 (15.3%) | 32 (4.4%) |
| $50,000 to $74,999 | 148 (19.7%) | 12 (1.6%) |
| $75,000 to $99,999 | 80 (10.7%) | 277 (37.7%) |
| $100,000 to $149,999 | 147 (19.6%) | 118 (16.1%) |
| $150,000 or more | 53 (7.1%) | 163 (22.2%) |
| Total | 750 (100.0%) | 734 (100.0%) |
Property Value to Household Income Ratio in Spring Valley
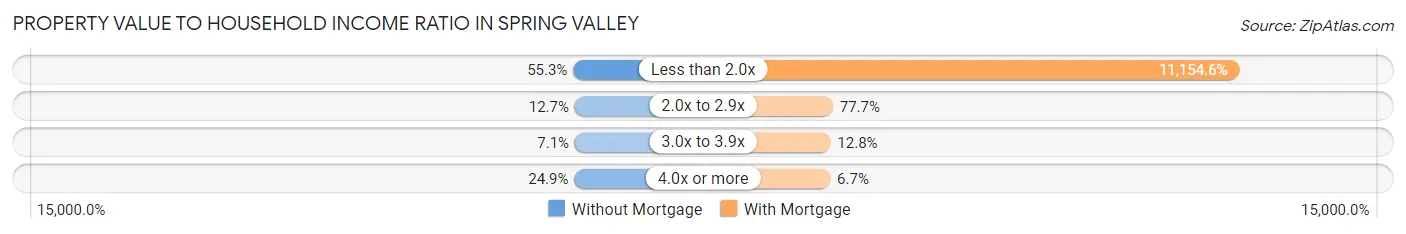
| Value-to-Income Ratio | Without Mortgage | With Mortgage |
| Less than 2.0x | 415 (55.3%) | 81,875 (11,154.6%) |
| 2.0x to 2.9x | 95 (12.7%) | 570 (77.7%) |
| 3.0x to 3.9x | 53 (7.1%) | 94 (12.8%) |
| 4.0x or more | 187 (24.9%) | 49 (6.7%) |
| Total | 750 (100.0%) | 734 (100.0%) |
Real Estate Taxes by Mortgage Status in Spring Valley
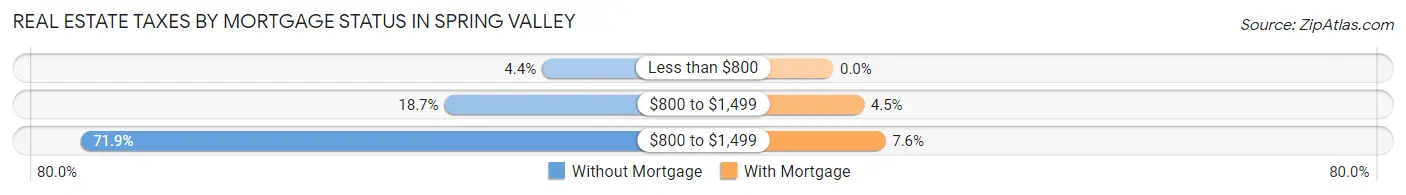
| Property Taxes | Without Mortgage | With Mortgage |
| Less than $800 | 33 (4.4%) | 0 (0.0%) |
| $800 to $1,499 | 140 (18.7%) | 33 (4.5%) |
| $800 to $1,499 | 539 (71.9%) | 56 (7.6%) |
| Total | 750 (100.0%) | 734 (100.0%) |
Health & Disability in Spring Valley
Health Insurance Coverage by Age in Spring Valley
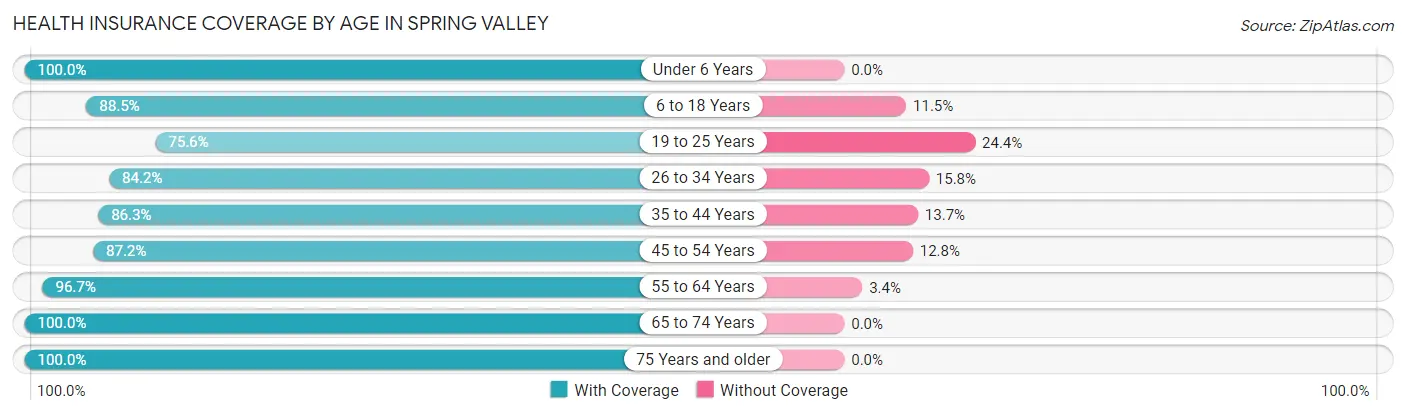
| Age Bracket | With Coverage | Without Coverage |
| Under 6 Years | 279 (100.0%) | 0 (0.0%) |
| 6 to 18 Years | 798 (88.5%) | 104 (11.5%) |
| 19 to 25 Years | 400 (75.6%) | 129 (24.4%) |
| 26 to 34 Years | 406 (84.2%) | 76 (15.8%) |
| 35 to 44 Years | 603 (86.3%) | 96 (13.7%) |
| 45 to 54 Years | 396 (87.2%) | 58 (12.8%) |
| 55 to 64 Years | 865 (96.7%) | 30 (3.4%) |
| 65 to 74 Years | 785 (100.0%) | 0 (0.0%) |
| 75 Years and older | 395 (100.0%) | 0 (0.0%) |
| Total | 4,927 (90.9%) | 493 (9.1%) |
Health Insurance Coverage by Citizenship Status in Spring Valley
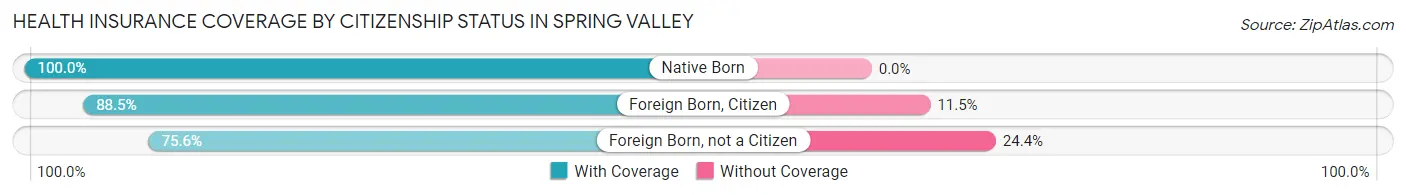
| Citizenship Status | With Coverage | Without Coverage |
| Native Born | 279 (100.0%) | 0 (0.0%) |
| Foreign Born, Citizen | 798 (88.5%) | 104 (11.5%) |
| Foreign Born, not a Citizen | 400 (75.6%) | 129 (24.4%) |
Health Insurance Coverage by Household Income in Spring Valley
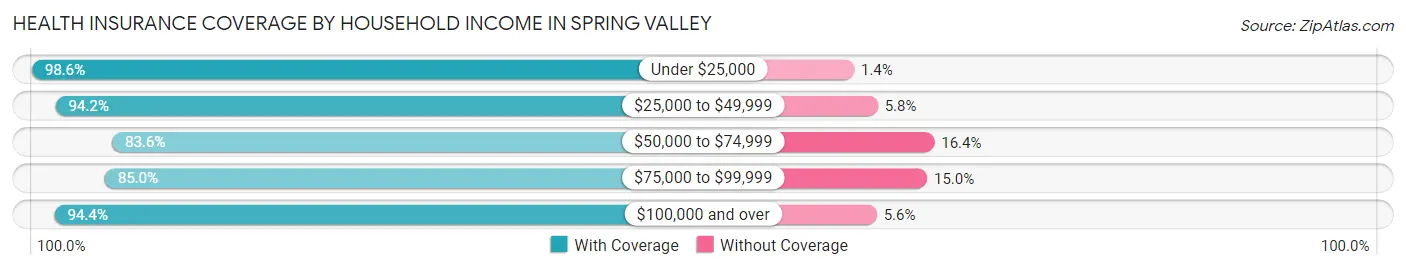
| Household Income | With Coverage | Without Coverage |
| Under $25,000 | 508 (98.6%) | 7 (1.4%) |
| $25,000 to $49,999 | 960 (94.2%) | 59 (5.8%) |
| $50,000 to $74,999 | 1,015 (83.6%) | 199 (16.4%) |
| $75,000 to $99,999 | 729 (85.0%) | 129 (15.0%) |
| $100,000 and over | 1,665 (94.4%) | 99 (5.6%) |
Public vs Private Health Insurance Coverage by Age in Spring Valley
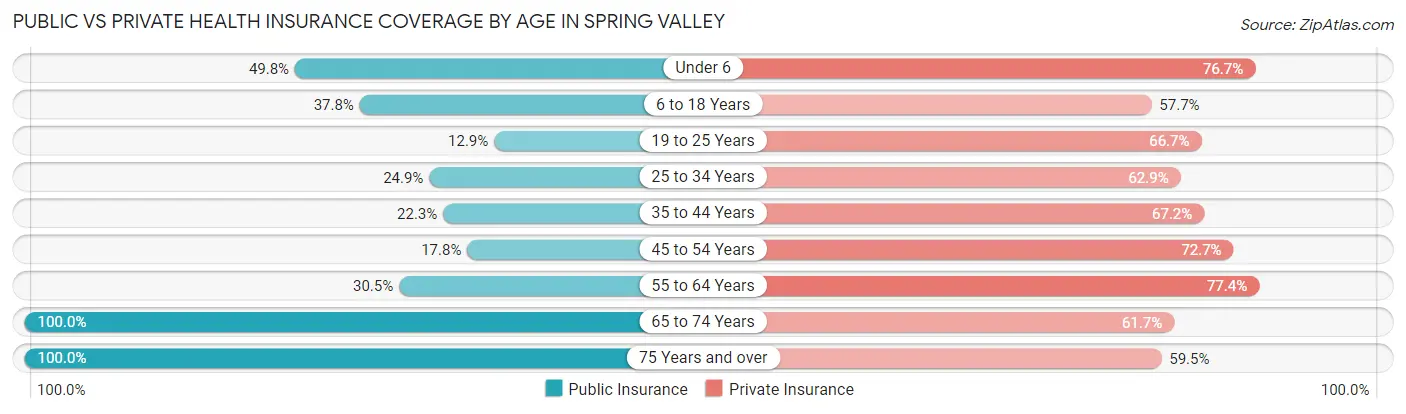
| Age Bracket | Public Insurance | Private Insurance |
| Under 6 | 139 (49.8%) | 214 (76.7%) |
| 6 to 18 Years | 341 (37.8%) | 520 (57.7%) |
| 19 to 25 Years | 68 (12.9%) | 353 (66.7%) |
| 25 to 34 Years | 120 (24.9%) | 303 (62.9%) |
| 35 to 44 Years | 156 (22.3%) | 470 (67.2%) |
| 45 to 54 Years | 81 (17.8%) | 330 (72.7%) |
| 55 to 64 Years | 273 (30.5%) | 693 (77.4%) |
| 65 to 74 Years | 785 (100.0%) | 484 (61.7%) |
| 75 Years and over | 395 (100.0%) | 235 (59.5%) |
| Total | 2,358 (43.5%) | 3,602 (66.5%) |
Disability Status by Sex by Age in Spring Valley
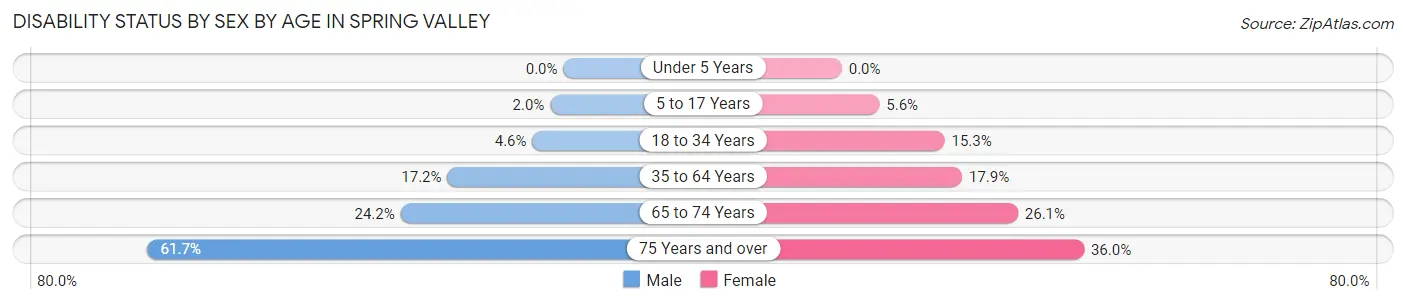
| Age Bracket | Male | Female |
| Under 5 Years | 0 (0.0%) | 0 (0.0%) |
| 5 to 17 Years | 10 (1.9%) | 23 (5.6%) |
| 18 to 34 Years | 25 (4.6%) | 78 (15.3%) |
| 35 to 64 Years | 182 (17.2%) | 177 (17.9%) |
| 65 to 74 Years | 89 (24.2%) | 109 (26.1%) |
| 75 Years and over | 79 (61.7%) | 96 (36.0%) |
Disability Class by Sex by Age in Spring Valley
Disability Class: Hearing Difficulty
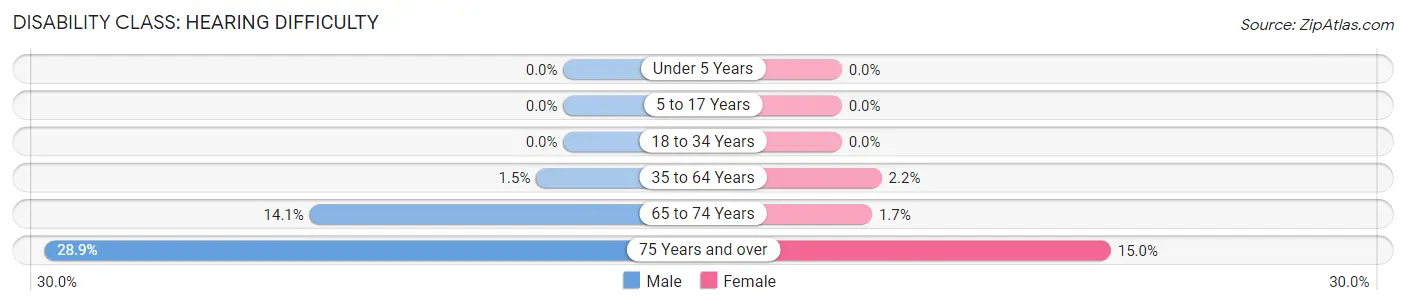
| Age Bracket | Male | Female |
| Under 5 Years | 0 (0.0%) | 0 (0.0%) |
| 5 to 17 Years | 0 (0.0%) | 0 (0.0%) |
| 18 to 34 Years | 0 (0.0%) | 0 (0.0%) |
| 35 to 64 Years | 16 (1.5%) | 22 (2.2%) |
| 65 to 74 Years | 52 (14.1%) | 7 (1.7%) |
| 75 Years and over | 37 (28.9%) | 40 (15.0%) |
Disability Class: Vision Difficulty
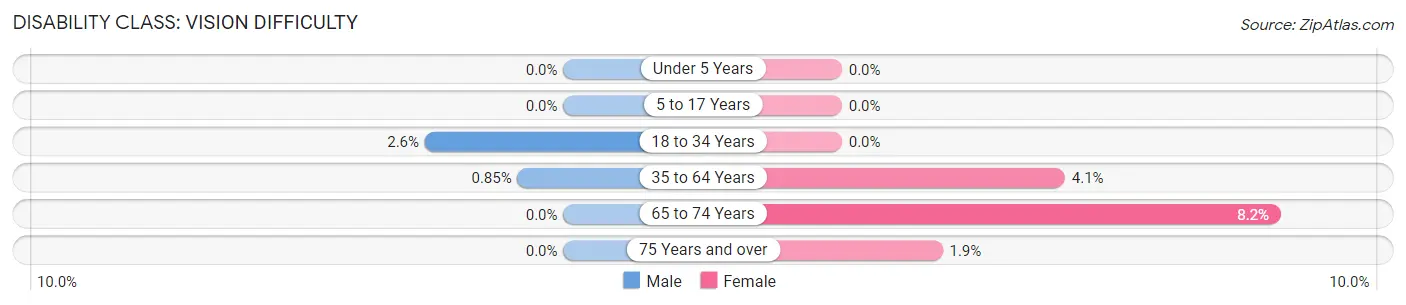
| Age Bracket | Male | Female |
| Under 5 Years | 0 (0.0%) | 0 (0.0%) |
| 5 to 17 Years | 0 (0.0%) | 0 (0.0%) |
| 18 to 34 Years | 14 (2.6%) | 0 (0.0%) |
| 35 to 64 Years | 9 (0.9%) | 41 (4.1%) |
| 65 to 74 Years | 0 (0.0%) | 34 (8.2%) |
| 75 Years and over | 0 (0.0%) | 5 (1.9%) |
Disability Class: Cognitive Difficulty
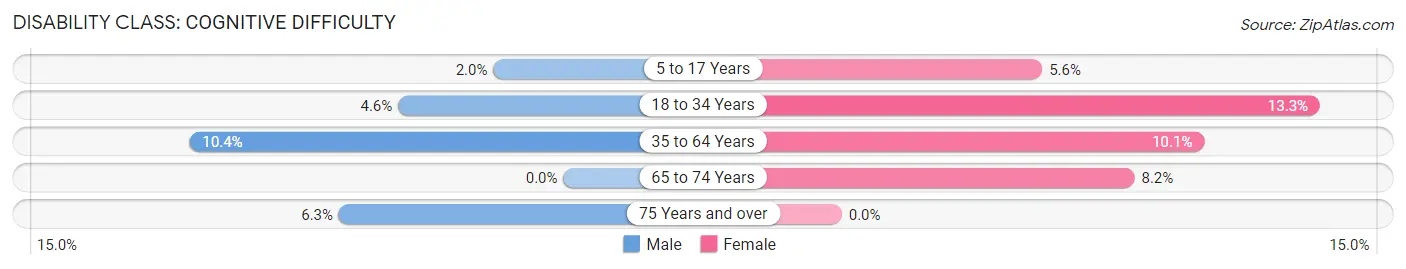
| Age Bracket | Male | Female |
| 5 to 17 Years | 10 (1.9%) | 23 (5.6%) |
| 18 to 34 Years | 25 (4.6%) | 68 (13.3%) |
| 35 to 64 Years | 110 (10.4%) | 100 (10.1%) |
| 65 to 74 Years | 0 (0.0%) | 34 (8.2%) |
| 75 Years and over | 8 (6.2%) | 0 (0.0%) |
Disability Class: Ambulatory Difficulty
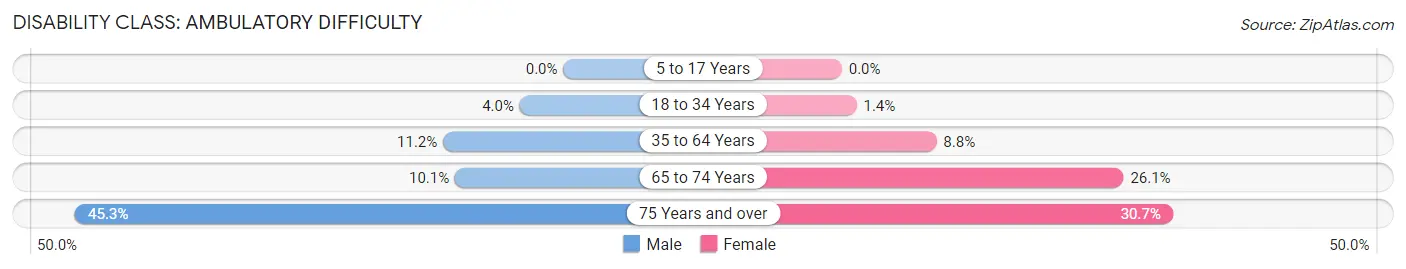
| Age Bracket | Male | Female |
| 5 to 17 Years | 0 (0.0%) | 0 (0.0%) |
| 18 to 34 Years | 22 (4.0%) | 7 (1.4%) |
| 35 to 64 Years | 118 (11.2%) | 87 (8.8%) |
| 65 to 74 Years | 37 (10.1%) | 109 (26.1%) |
| 75 Years and over | 58 (45.3%) | 82 (30.7%) |
Disability Class: Self-Care Difficulty
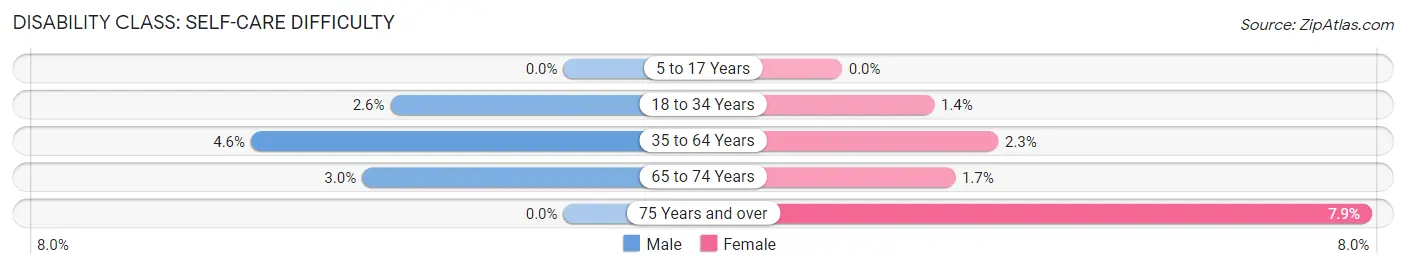
| Age Bracket | Male | Female |
| 5 to 17 Years | 0 (0.0%) | 0 (0.0%) |
| 18 to 34 Years | 14 (2.6%) | 7 (1.4%) |
| 35 to 64 Years | 49 (4.6%) | 23 (2.3%) |
| 65 to 74 Years | 11 (3.0%) | 7 (1.7%) |
| 75 Years and over | 0 (0.0%) | 21 (7.9%) |
Technology Access in Spring Valley
Computing Device Access in Spring Valley
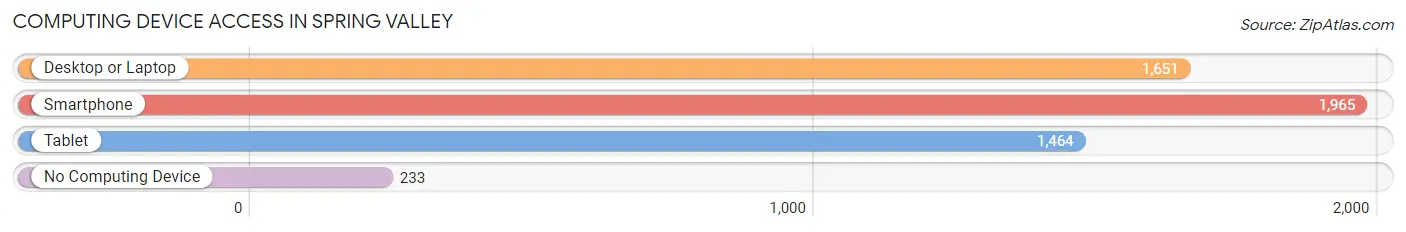
| Device Type | # Households | % Households |
| Desktop or Laptop | 1,651 | 71.7% |
| Smartphone | 1,965 | 85.3% |
| Tablet | 1,464 | 63.5% |
| No Computing Device | 233 | 10.1% |
| Total | 2,304 | 100.0% |
Internet Access in Spring Valley
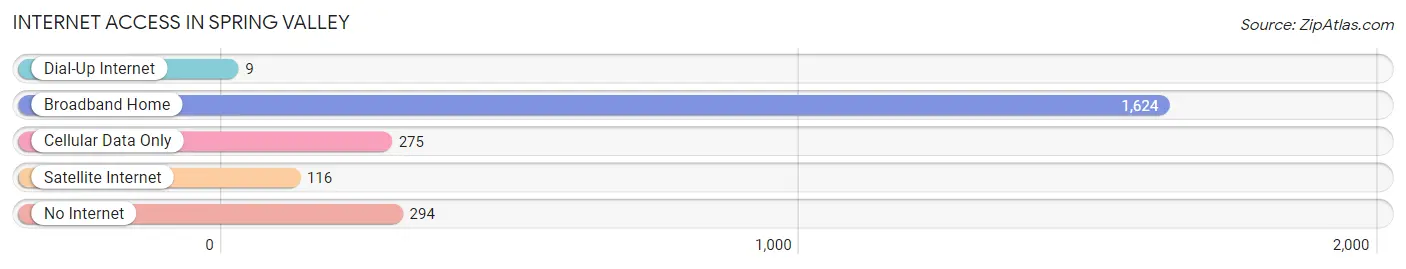
| Internet Type | # Households | % Households |
| Dial-Up Internet | 9 | 0.4% |
| Broadband Home | 1,624 | 70.5% |
| Cellular Data Only | 275 | 11.9% |
| Satellite Internet | 116 | 5.0% |
| No Internet | 294 | 12.8% |
| Total | 2,304 | 100.0% |
Spring Valley Summary
History
The history of Spring Valley, Illinois dates back to the early 1800s when the area was first settled by European immigrants. The first settlers were mostly of German and Irish descent, and the area was known as “German Valley”. The first post office was established in 1837, and the town was officially incorporated in 1845.
The town was named after the nearby Spring Valley Creek, which was a popular spot for settlers to gather and hunt. The creek was also used to power the first grist mill in the area, which was built in 1845.
The town grew steadily throughout the 19th century, and by the turn of the century, it had become a bustling agricultural center. The town was home to several large farms, and the local economy was largely based on the production of corn, wheat, and other grains.
In the early 20th century, the town began to diversify its economy. Several factories were built in the area, including a canning factory, a brickyard, and a furniture factory. The town also became a popular tourist destination, as it was located near several popular lakes and rivers.
The town continued to grow throughout the 20th century, and by the year 2000, it had a population of over 5,000 people.
Geography
Spring Valley is located in LaSalle County, Illinois, in the north-central part of the state. It is situated along the Illinois River, about 40 miles southwest of Chicago. The town is surrounded by rolling hills and farmland, and is located near several popular lakes and rivers.
The town covers an area of 4.2 square miles, and has an elevation of 690 feet. The climate is humid continental, with hot summers and cold winters.
Economy
The economy of Spring Valley is largely based on agriculture and manufacturing. The town is home to several large farms, and the local economy is largely based on the production of corn, wheat, and other grains.
The town is also home to several factories, including a canning factory, a brickyard, and a furniture factory. The town is also home to several small businesses, including restaurants, shops, and other services.
Demographics
As of the 2010 census, the population of Spring Valley was 5,717. The racial makeup of the town was 97.2% White, 0.7% African American, 0.3% Native American, 0.3% Asian, 0.2% from other races, and 1.5% from two or more races. Hispanic or Latino of any race were 1.3% of the population.
The median household income in Spring Valley was $45,938, and the median family income was $54,917. The per capita income was $20,945. About 8.2% of families and 10.2% of the population were below the poverty line, including 14.2% of those under age 18 and 6.2% of those age 65 or over.
Common Questions
What is Per Capita Income in Spring Valley?
Per Capita income in Spring Valley is $32,544.
What is the Median Family Income in Spring Valley?
Median Family Income in Spring Valley is $71,083.
What is the Median Household income in Spring Valley?
Median Household Income in Spring Valley is $60,861.
What is Income or Wage Gap in Spring Valley?
Income or Wage Gap in Spring Valley is 54.9%.
Women in Spring Valley earn 45.1 cents for every dollar earned by a man.
What is Inequality or Gini Index in Spring Valley?
Inequality or Gini Index in Spring Valley is 0.42.
What is the Total Population of Spring Valley?
Total Population of Spring Valley is 5,518.
What is the Total Male Population of Spring Valley?
Total Male Population of Spring Valley is 2,825.
What is the Total Female Population of Spring Valley?
Total Female Population of Spring Valley is 2,693.
What is the Ratio of Males per 100 Females in Spring Valley?
There are 104.90 Males per 100 Females in Spring Valley.
What is the Ratio of Females per 100 Males in Spring Valley?
There are 95.33 Females per 100 Males in Spring Valley.
What is the Median Population Age in Spring Valley?
Median Population Age in Spring Valley is 43.4 Years.
What is the Average Family Size in Spring Valley
Average Family Size in Spring Valley is 2.9 People.
What is the Average Household Size in Spring Valley
Average Household Size in Spring Valley is 2.3 People.
How Large is the Labor Force in Spring Valley?
There are 2,667 People in the Labor Forcein in Spring Valley.
What is the Percentage of People in the Labor Force in Spring Valley?
58.3% of People are in the Labor Force in Spring Valley.
What is the Unemployment Rate in Spring Valley?
Unemployment Rate in Spring Valley is 7.6%.