Pleasant Grove, AL Map & Demographics
Pleasant Grove Map
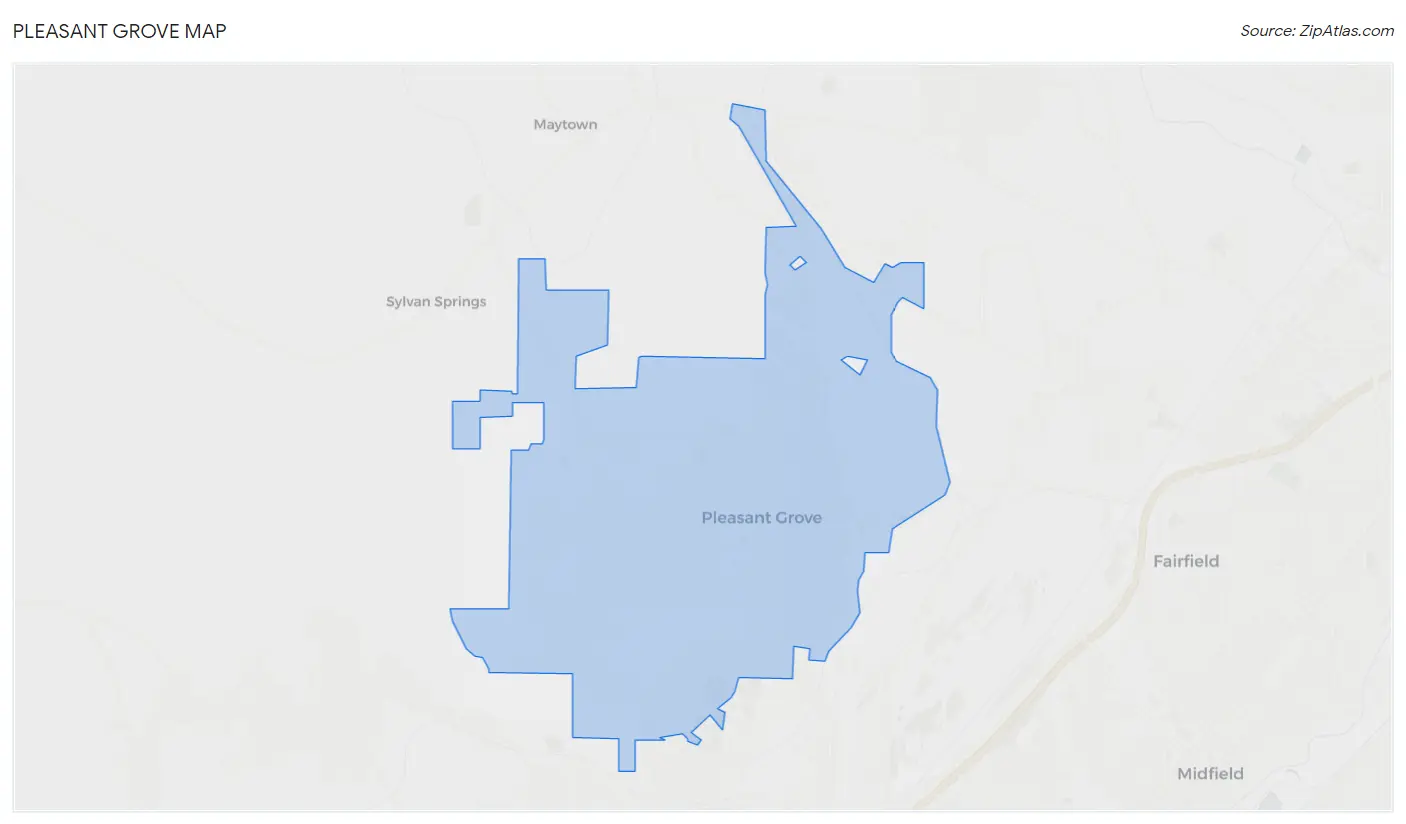
Pleasant Grove Overview
$33,206
PER CAPITA INCOME
$76,297
AVG FAMILY INCOME
$72,917
AVG HOUSEHOLD INCOME
2.6%
WAGE / INCOME GAP [ % ]
97.4¢/ $1
WAGE / INCOME GAP [ $ ]
0.36
INEQUALITY / GINI INDEX
9,549
TOTAL POPULATION
4,532
MALE POPULATION
5,017
FEMALE POPULATION
90.33
MALES / 100 FEMALES
110.70
FEMALES / 100 MALES
43.8
MEDIAN AGE
3.0
AVG FAMILY SIZE
2.6
AVG HOUSEHOLD SIZE
5,087
LABOR FORCE [ PEOPLE ]
61.5%
PERCENT IN LABOR FORCE
4.6%
UNEMPLOYMENT RATE
Pleasant Grove Zip Codes
Pleasant Grove Area Codes
Income in Pleasant Grove
Income Overview in Pleasant Grove
Per Capita Income in Pleasant Grove is $33,206, while median incomes of families and households are $76,297 and $72,917 respectively.
| Characteristic | Number | Measure |
| Per Capita Income | 9,549 | $33,206 |
| Median Family Income | 2,740 | $76,297 |
| Mean Family Income | 2,740 | $90,580 |
| Median Household Income | 3,553 | $72,917 |
| Mean Household Income | 3,553 | $85,937 |
| Income Deficit | 2,740 | $0 |
| Wage / Income Gap (%) | 9,549 | 2.57% |
| Wage / Income Gap ($) | 9,549 | 97.43¢ per $1 |
| Gini / Inequality Index | 9,549 | 0.36 |
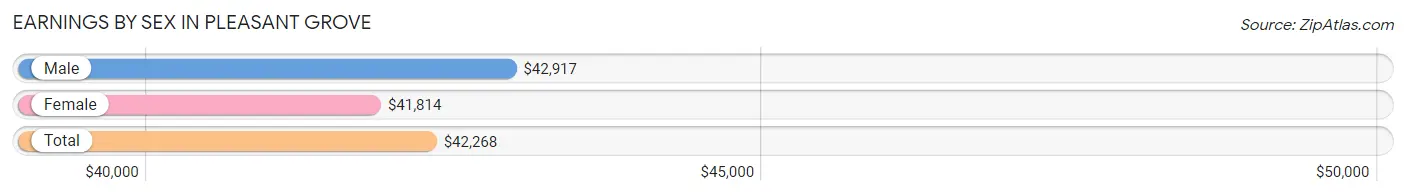
Earnings by Sex in Pleasant Grove
Average Earnings in Pleasant Grove are $42,268, $42,917 for men and $41,814 for women, a difference of 2.6%.
| Sex | Number | Average Earnings |
| Male | 2,394 (46.9%) | $42,917 |
| Female | 2,716 (53.1%) | $41,814 |
| Total | 5,110 (100.0%) | $42,268 |
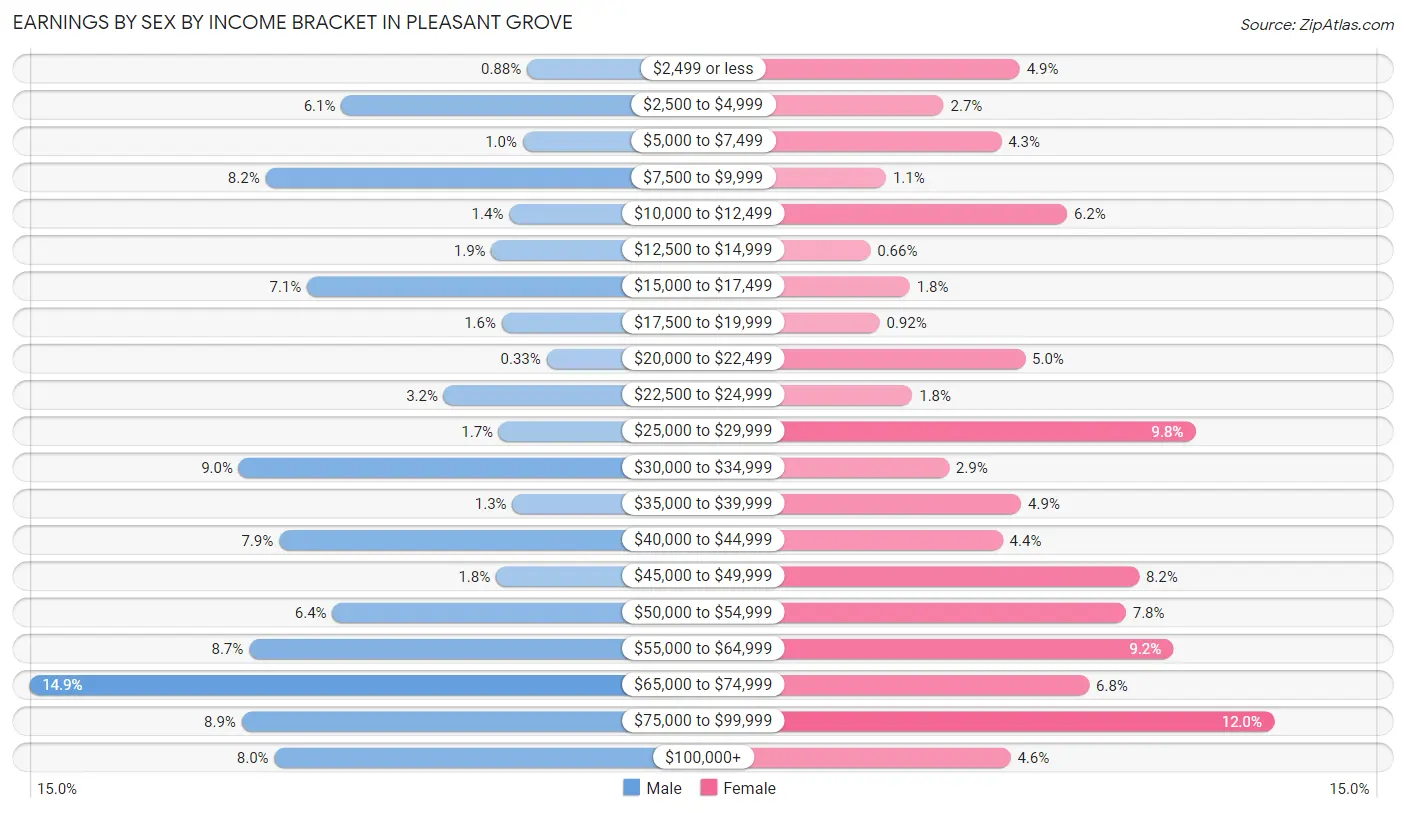
Earnings by Sex by Income Bracket in Pleasant Grove
The most common earnings brackets in Pleasant Grove are $65,000 to $74,999 for men (356 | 14.9%) and $75,000 to $99,999 for women (326 | 12.0%).
| Income | Male | Female |
| $2,499 or less | 21 (0.9%) | 132 (4.9%) |
| $2,500 to $4,999 | 146 (6.1%) | 74 (2.7%) |
| $5,000 to $7,499 | 24 (1.0%) | 118 (4.3%) |
| $7,500 to $9,999 | 197 (8.2%) | 30 (1.1%) |
| $10,000 to $12,499 | 33 (1.4%) | 168 (6.2%) |
| $12,500 to $14,999 | 45 (1.9%) | 18 (0.7%) |
| $15,000 to $17,499 | 169 (7.1%) | 48 (1.8%) |
| $17,500 to $19,999 | 38 (1.6%) | 25 (0.9%) |
| $20,000 to $22,499 | 8 (0.3%) | 136 (5.0%) |
| $22,500 to $24,999 | 77 (3.2%) | 50 (1.8%) |
| $25,000 to $29,999 | 40 (1.7%) | 266 (9.8%) |
| $30,000 to $34,999 | 215 (9.0%) | 78 (2.9%) |
| $35,000 to $39,999 | 31 (1.3%) | 133 (4.9%) |
| $40,000 to $44,999 | 188 (7.9%) | 119 (4.4%) |
| $45,000 to $49,999 | 42 (1.8%) | 223 (8.2%) |
| $50,000 to $54,999 | 152 (6.4%) | 213 (7.8%) |
| $55,000 to $64,999 | 208 (8.7%) | 249 (9.2%) |
| $65,000 to $74,999 | 356 (14.9%) | 185 (6.8%) |
| $75,000 to $99,999 | 213 (8.9%) | 326 (12.0%) |
| $100,000+ | 191 (8.0%) | 125 (4.6%) |
| Total | 2,394 (100.0%) | 2,716 (100.0%) |
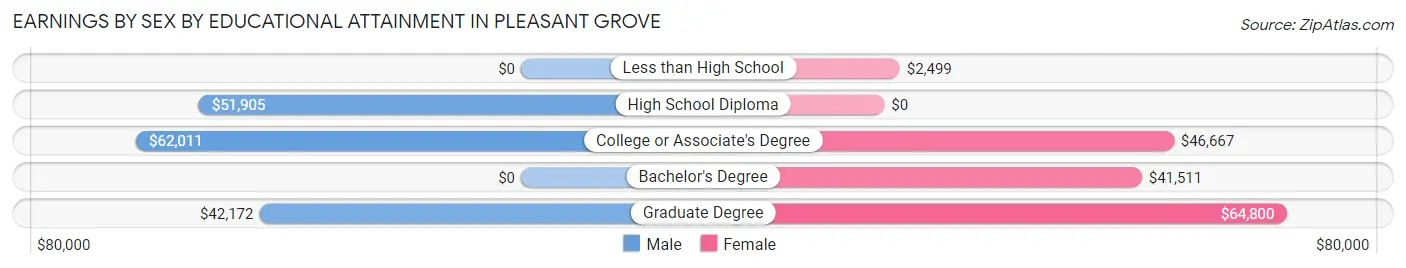
Earnings by Sex by Educational Attainment in Pleasant Grove
Average earnings in Pleasant Grove are $55,000 for men and $48,065 for women, a difference of 12.6%. Men with an educational attainment of college or associate's degree enjoy the highest average annual earnings of $62,011, while those with graduate degree education earn the least with $42,172. Women with an educational attainment of graduate degree earn the most with the average annual earnings of $64,800, while those with less than high school education have the smallest earnings of $2,499.
| Educational Attainment | Male Income | Female Income |
| Less than High School | - | - |
| High School Diploma | $51,905 | $0 |
| College or Associate's Degree | $62,011 | $46,667 |
| Bachelor's Degree | - | - |
| Graduate Degree | $42,172 | $64,800 |
| Total | $55,000 | $48,065 |
Family Income in Pleasant Grove
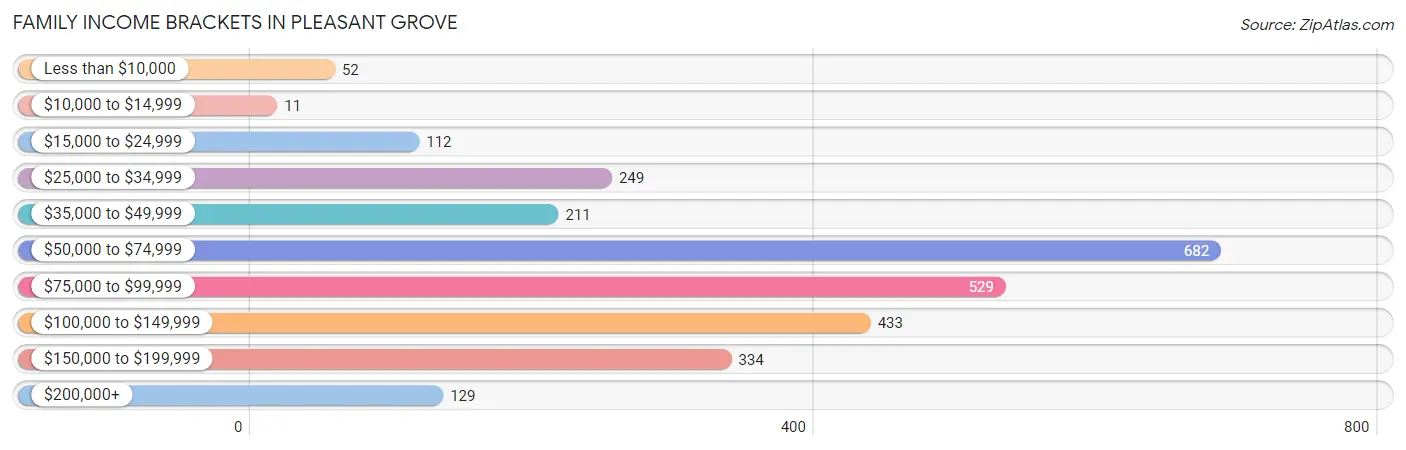
Family Income Brackets in Pleasant Grove
According to the Pleasant Grove family income data, there are 682 families falling into the $50,000 to $74,999 income range, which is the most common income bracket and makes up 24.9% of all families. Conversely, the $10,000 to $14,999 income bracket is the least frequent group with only 11 families (0.4%) belonging to this category.
| Income Bracket | # Families | % Families |
| Less than $10,000 | 52 | 1.9% |
| $10,000 to $14,999 | 11 | 0.4% |
| $15,000 to $24,999 | 112 | 4.1% |
| $25,000 to $34,999 | 249 | 9.1% |
| $35,000 to $49,999 | 211 | 7.7% |
| $50,000 to $74,999 | 682 | 24.9% |
| $75,000 to $99,999 | 529 | 19.3% |
| $100,000 to $149,999 | 433 | 15.8% |
| $150,000 to $199,999 | 334 | 12.2% |
| $200,000+ | 129 | 4.7% |
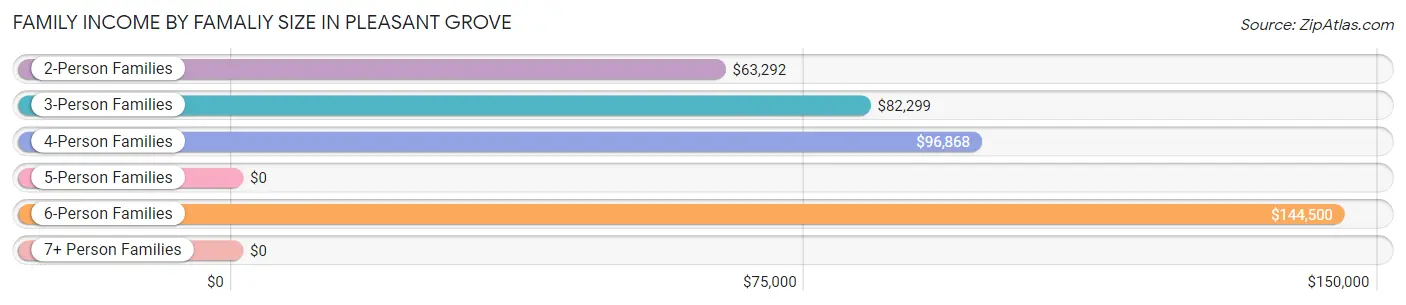
Family Income by Famaliy Size in Pleasant Grove
6-person families (60 | 2.2%) account for the highest median family income in Pleasant Grove with $144,500 per family, while 2-person families (1,355 | 49.4%) have the highest median income of $31,646 per family member.
| Income Bracket | # Families | Median Income |
| 2-Person Families | 1,355 (49.4%) | $63,292 |
| 3-Person Families | 735 (26.8%) | $82,299 |
| 4-Person Families | 524 (19.1%) | $96,868 |
| 5-Person Families | 54 (2.0%) | $0 |
| 6-Person Families | 60 (2.2%) | $144,500 |
| 7+ Person Families | 12 (0.4%) | $0 |
| Total | 2,740 (100.0%) | $76,297 |
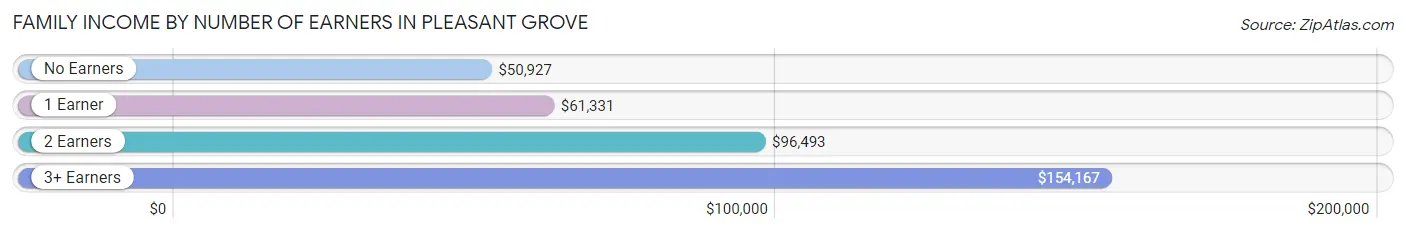
Family Income by Number of Earners in Pleasant Grove
The median family income in Pleasant Grove is $76,297, with families comprising 3+ earners (286) having the highest median family income of $154,167, while families with no earners (283) have the lowest median family income of $50,927, accounting for 10.4% and 10.3% of families, respectively.
| Number of Earners | # Families | Median Income |
| No Earners | 283 (10.3%) | $50,927 |
| 1 Earner | 1,088 (39.7%) | $61,331 |
| 2 Earners | 1,083 (39.5%) | $96,493 |
| 3+ Earners | 286 (10.4%) | $154,167 |
| Total | 2,740 (100.0%) | $76,297 |
Household Income in Pleasant Grove
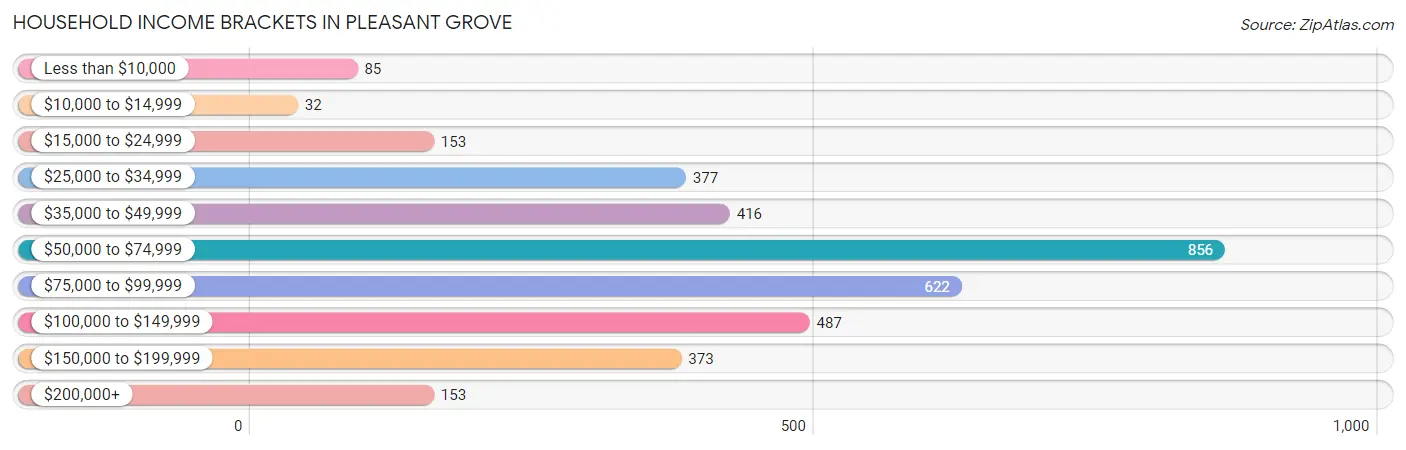
Household Income Brackets in Pleasant Grove
With 856 households falling in the category, the $50,000 to $74,999 income range is the most frequent in Pleasant Grove, accounting for 24.1% of all households. In contrast, only 32 households (0.9%) fall into the $10,000 to $14,999 income bracket, making it the least populous group.
| Income Bracket | # Households | % Households |
| Less than $10,000 | 85 | 2.4% |
| $10,000 to $14,999 | 32 | 0.9% |
| $15,000 to $24,999 | 153 | 4.3% |
| $25,000 to $34,999 | 377 | 10.6% |
| $35,000 to $49,999 | 416 | 11.7% |
| $50,000 to $74,999 | 856 | 24.1% |
| $75,000 to $99,999 | 622 | 17.5% |
| $100,000 to $149,999 | 487 | 13.7% |
| $150,000 to $199,999 | 373 | 10.5% |
| $200,000+ | 153 | 4.3% |
Household Income by Householder Age in Pleasant Grove
The median household income in Pleasant Grove is $72,917, with the highest median household income of $95,904 found in the 15 to 24 years age bracket for the primary householder. A total of 235 households (6.6%) fall into this category. Meanwhile, the 65+ years age bracket for the primary householder has the lowest median household income of $46,728, with 955 households (26.9%) in this group.
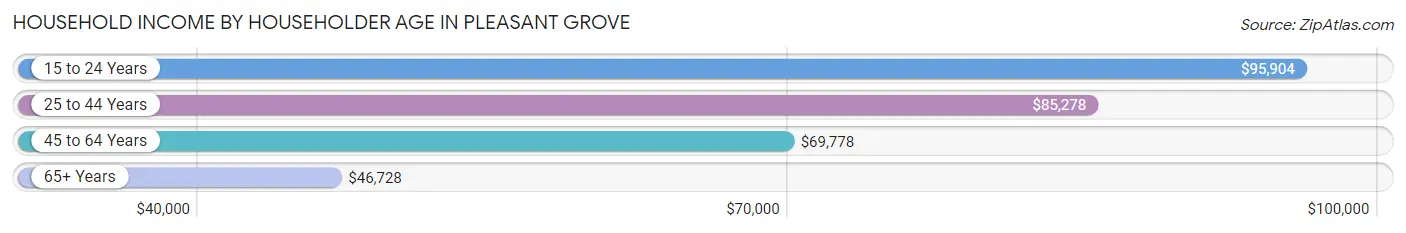
| Income Bracket | # Households | Median Income |
| 15 to 24 Years | 235 (6.6%) | $95,904 |
| 25 to 44 Years | 816 (23.0%) | $85,278 |
| 45 to 64 Years | 1,547 (43.5%) | $69,778 |
| 65+ Years | 955 (26.9%) | $46,728 |
| Total | 3,553 (100.0%) | $72,917 |
Poverty in Pleasant Grove
Income Below Poverty by Sex and Age in Pleasant Grove
With 14.0% poverty level for males and 7.2% for females among the residents of Pleasant Grove, 16 and 17 year old males and 12 to 14 year old females are the most vulnerable to poverty, with 87 males (70.7%) and 16 females (20.3%) in their respective age groups living below the poverty level.
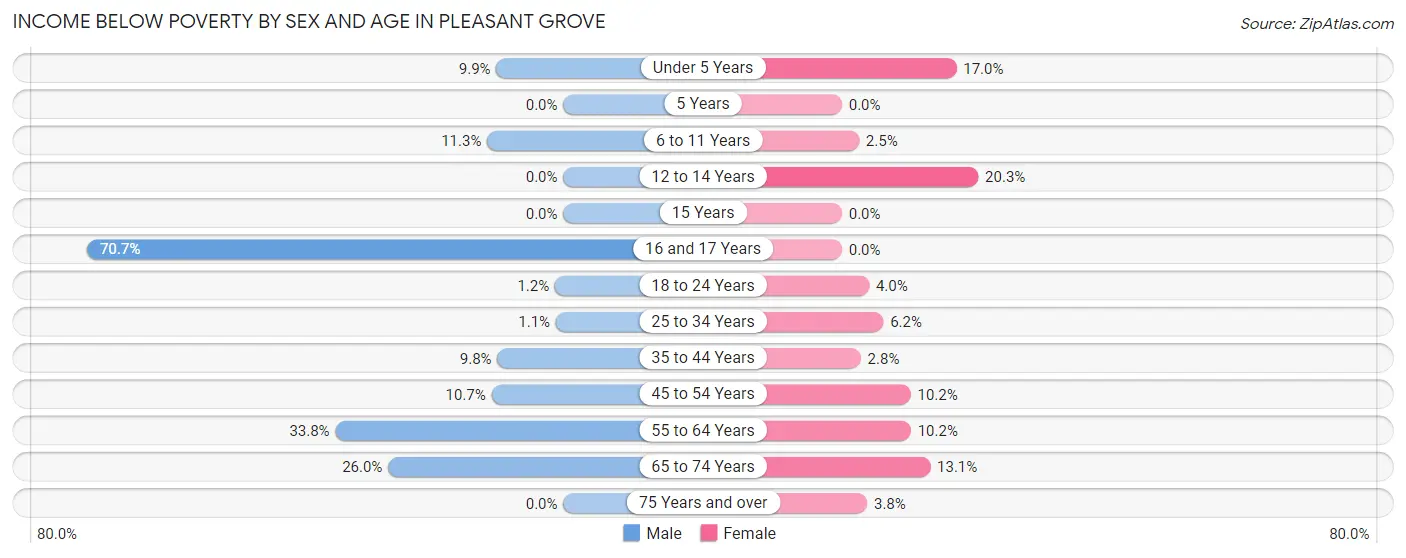
| Age Bracket | Male | Female |
| Under 5 Years | 16 (9.9%) | 17 (17.0%) |
| 5 Years | 0 (0.0%) | 0 (0.0%) |
| 6 to 11 Years | 53 (11.3%) | 7 (2.5%) |
| 12 to 14 Years | 0 (0.0%) | 16 (20.3%) |
| 15 Years | 0 (0.0%) | 0 (0.0%) |
| 16 and 17 Years | 87 (70.7%) | 0 (0.0%) |
| 18 to 24 Years | 7 (1.2%) | 22 (4.0%) |
| 25 to 34 Years | 6 (1.1%) | 27 (6.1%) |
| 35 to 44 Years | 33 (9.8%) | 20 (2.8%) |
| 45 to 54 Years | 69 (10.7%) | 69 (10.2%) |
| 55 to 64 Years | 245 (33.8%) | 78 (10.2%) |
| 65 to 74 Years | 103 (26.0%) | 86 (13.1%) |
| 75 Years and over | 0 (0.0%) | 12 (3.7%) |
| Total | 619 (14.0%) | 354 (7.2%) |
Income Above Poverty by Sex and Age in Pleasant Grove
According to the poverty statistics in Pleasant Grove, males aged 5 years and females aged 15 years are the age groups that are most secure financially, with 100.0% of males and 100.0% of females in these age groups living above the poverty line.
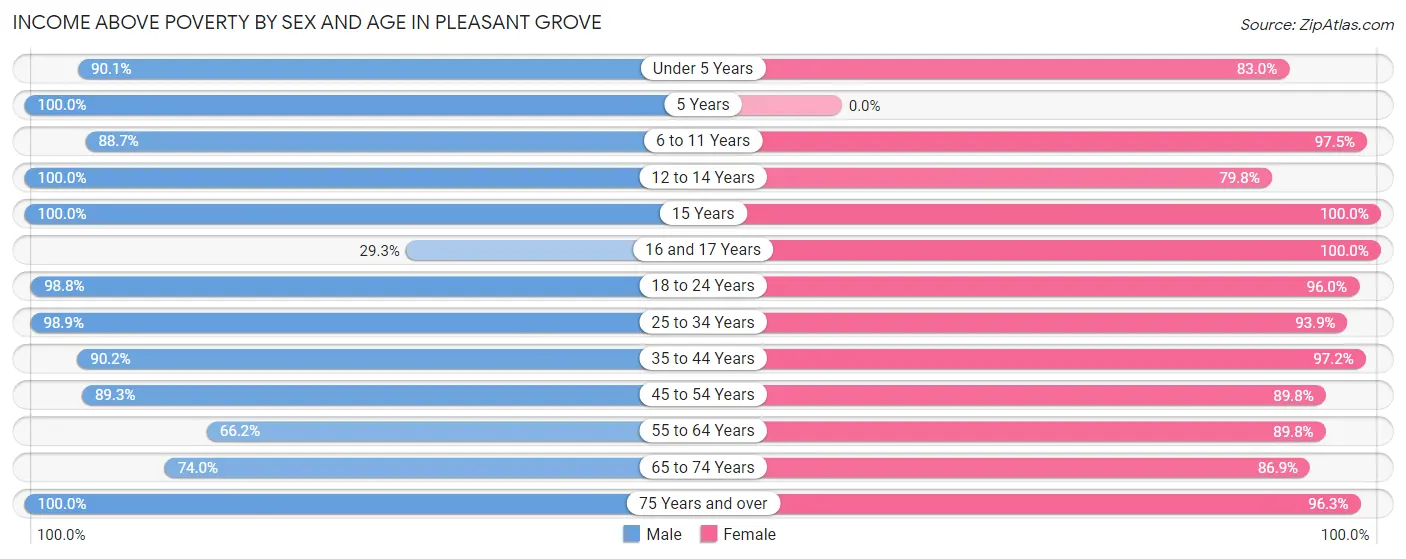
| Age Bracket | Male | Female |
| Under 5 Years | 145 (90.1%) | 83 (83.0%) |
| 5 Years | 13 (100.0%) | 0 (0.0%) |
| 6 to 11 Years | 416 (88.7%) | 269 (97.5%) |
| 12 to 14 Years | 117 (100.0%) | 63 (79.7%) |
| 15 Years | 46 (100.0%) | 16 (100.0%) |
| 16 and 17 Years | 36 (29.3%) | 320 (100.0%) |
| 18 to 24 Years | 561 (98.8%) | 523 (96.0%) |
| 25 to 34 Years | 538 (98.9%) | 412 (93.9%) |
| 35 to 44 Years | 304 (90.2%) | 694 (97.2%) |
| 45 to 54 Years | 578 (89.3%) | 607 (89.8%) |
| 55 to 64 Years | 479 (66.2%) | 684 (89.8%) |
| 65 to 74 Years | 293 (74.0%) | 570 (86.9%) |
| 75 Years and over | 274 (100.0%) | 308 (96.3%) |
| Total | 3,800 (86.0%) | 4,549 (92.8%) |
Income Below Poverty Among Married-Couple Families in Pleasant Grove
The poverty statistics for married-couple families in Pleasant Grove show that 8.6% or 150 of the total 1,753 families live below the poverty line. Families with 1 or 2 children have the highest poverty rate of 13.0%, comprising of 72 families. On the other hand, families with 3 or 4 children have the lowest poverty rate of 0.0%, which includes 0 families.
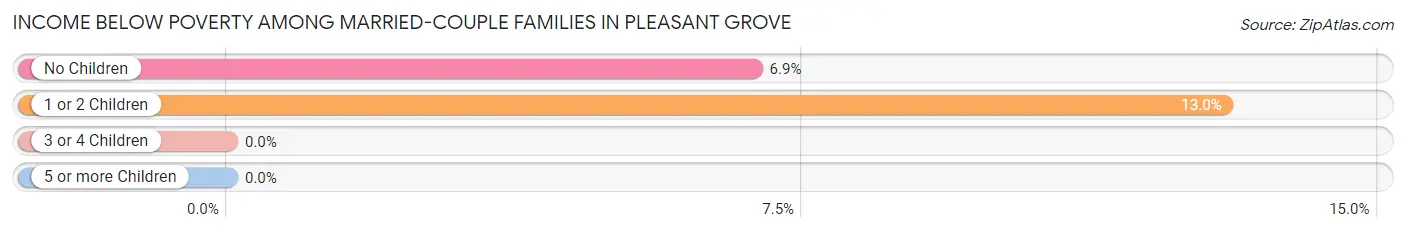
| Children | Above Poverty | Below Poverty |
| No Children | 1,061 (93.1%) | 78 (6.9%) |
| 1 or 2 Children | 482 (87.0%) | 72 (13.0%) |
| 3 or 4 Children | 48 (100.0%) | 0 (0.0%) |
| 5 or more Children | 12 (100.0%) | 0 (0.0%) |
| Total | 1,603 (91.4%) | 150 (8.6%) |
Income Below Poverty Among Single-Parent Households in Pleasant Grove
According to the poverty data in Pleasant Grove, 3.2% or 10 single-father households and 10.2% or 69 single-mother households are living below the poverty line. Among single-father households, those with no children have the highest poverty rate, with 10 households (29.4%) experiencing poverty. Likewise, among single-mother households, those with 3 or 4 children have the highest poverty rate, with 6 households (100.0%) falling below the poverty line.
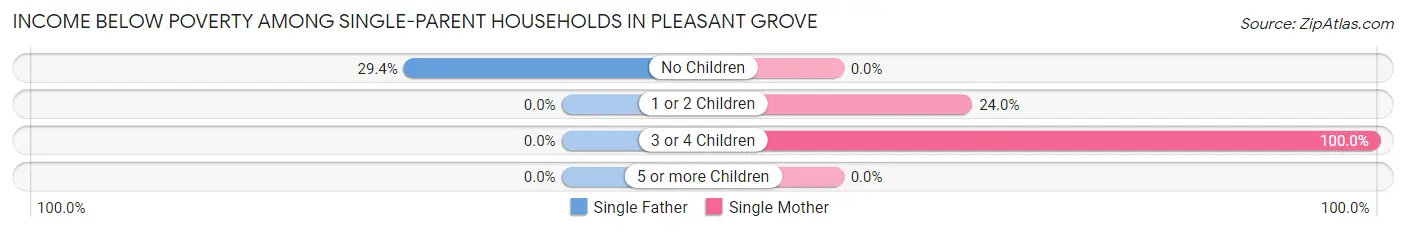
| Children | Single Father | Single Mother |
| No Children | 10 (29.4%) | 0 (0.0%) |
| 1 or 2 Children | 0 (0.0%) | 63 (23.9%) |
| 3 or 4 Children | 0 (0.0%) | 6 (100.0%) |
| 5 or more Children | 0 (0.0%) | 0 (0.0%) |
| Total | 10 (3.2%) | 69 (10.2%) |
Income Below Poverty Among Married-Couple vs Single-Parent Households in Pleasant Grove
The poverty data for Pleasant Grove shows that 150 of the married-couple family households (8.6%) and 79 of the single-parent households (8.0%) are living below the poverty level. Within the married-couple family households, those with 1 or 2 children have the highest poverty rate, with 72 households (13.0%) falling below the poverty line. Among the single-parent households, those with 3 or 4 children have the highest poverty rate, with 6 household (100.0%) living below poverty.
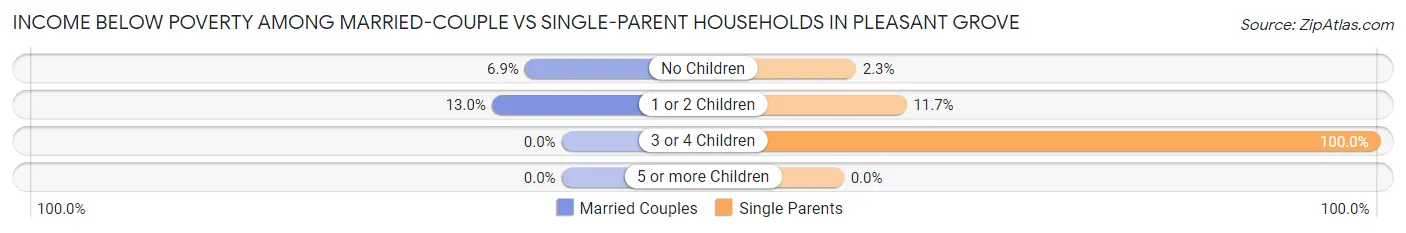
| Children | Married-Couple Families | Single-Parent Households |
| No Children | 78 (6.9%) | 10 (2.3%) |
| 1 or 2 Children | 72 (13.0%) | 63 (11.7%) |
| 3 or 4 Children | 0 (0.0%) | 6 (100.0%) |
| 5 or more Children | 0 (0.0%) | 0 (0.0%) |
| Total | 150 (8.6%) | 79 (8.0%) |
Race in Pleasant Grove
The most populous races in Pleasant Grove are Black / African American (6,255 | 65.5%), White / Caucasian (2,951 | 30.9%), and Two or more Races (236 | 2.5%).
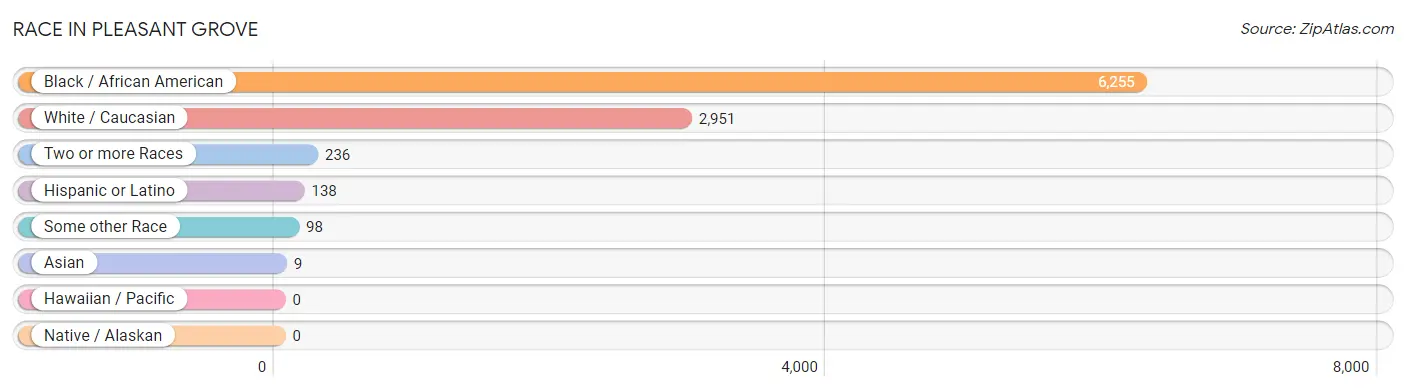
| Race | # Population | % Population |
| Asian | 9 | 0.1% |
| Black / African American | 6,255 | 65.5% |
| Hawaiian / Pacific | 0 | 0.0% |
| Hispanic or Latino | 138 | 1.5% |
| Native / Alaskan | 0 | 0.0% |
| White / Caucasian | 2,951 | 30.9% |
| Two or more Races | 236 | 2.5% |
| Some other Race | 98 | 1.0% |
| Total | 9,549 | 100.0% |
Ancestry in Pleasant Grove
The most populous ancestries reported in Pleasant Grove are American (1,068 | 11.2%), English (455 | 4.8%), Irish (313 | 3.3%), German (234 | 2.5%), and Scottish (132 | 1.4%), together accounting for 23.0% of all Pleasant Grove residents.
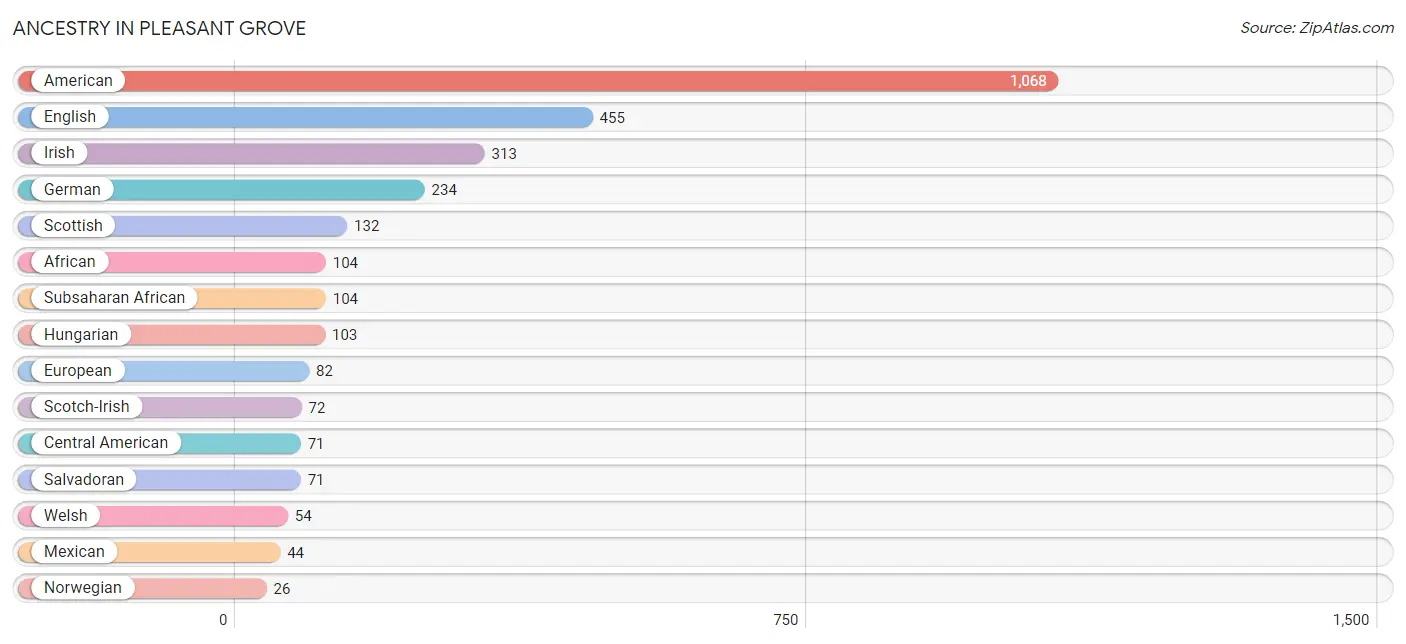
| Ancestry | # Population | % Population |
| African | 104 | 1.1% |
| American | 1,068 | 11.2% |
| Arab | 6 | 0.1% |
| Blackfeet | 3 | 0.0% |
| Central American | 71 | 0.7% |
| Cherokee | 12 | 0.1% |
| Eastern European | 18 | 0.2% |
| English | 455 | 4.8% |
| European | 82 | 0.9% |
| German | 234 | 2.5% |
| Hungarian | 103 | 1.1% |
| Irish | 313 | 3.3% |
| Italian | 16 | 0.2% |
| Korean | 18 | 0.2% |
| Lebanese | 6 | 0.1% |
| Mexican | 44 | 0.5% |
| Northern European | 11 | 0.1% |
| Norwegian | 26 | 0.3% |
| Polish | 12 | 0.1% |
| Salvadoran | 71 | 0.7% |
| Scotch-Irish | 72 | 0.7% |
| Scottish | 132 | 1.4% |
| Subsaharan African | 104 | 1.1% |
| Welsh | 54 | 0.6% | View All 24 Rows |
Immigrants in Pleasant Grove
The most numerous immigrant groups reported in Pleasant Grove came from Central America (53 | 0.6%), Latin America (53 | 0.6%), El Salvador (47 | 0.5%), Canada (24 | 0.3%), and Asia (9 | 0.1%), together accounting for 1.9% of all Pleasant Grove residents.
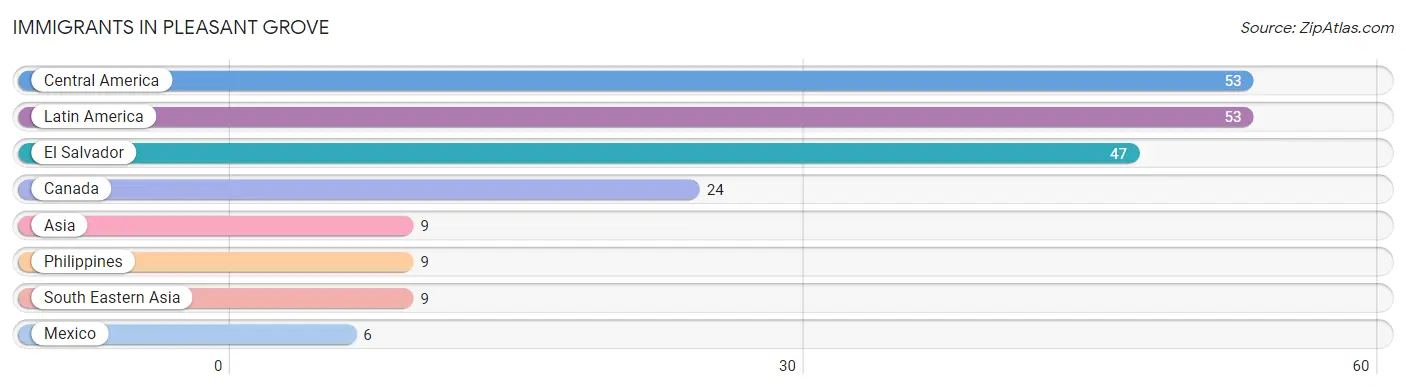
| Immigration Origin | # Population | % Population |
| Asia | 9 | 0.1% |
| Canada | 24 | 0.3% |
| Central America | 53 | 0.6% |
| El Salvador | 47 | 0.5% |
| Latin America | 53 | 0.6% |
| Mexico | 6 | 0.1% |
| Philippines | 9 | 0.1% |
| South Eastern Asia | 9 | 0.1% | View All 8 Rows |
Sex and Age in Pleasant Grove
Sex and Age in Pleasant Grove
The most populous age groups in Pleasant Grove are 20 to 24 Years (484 | 10.7%) for men and 15 to 19 Years (510 | 10.2%) for women.
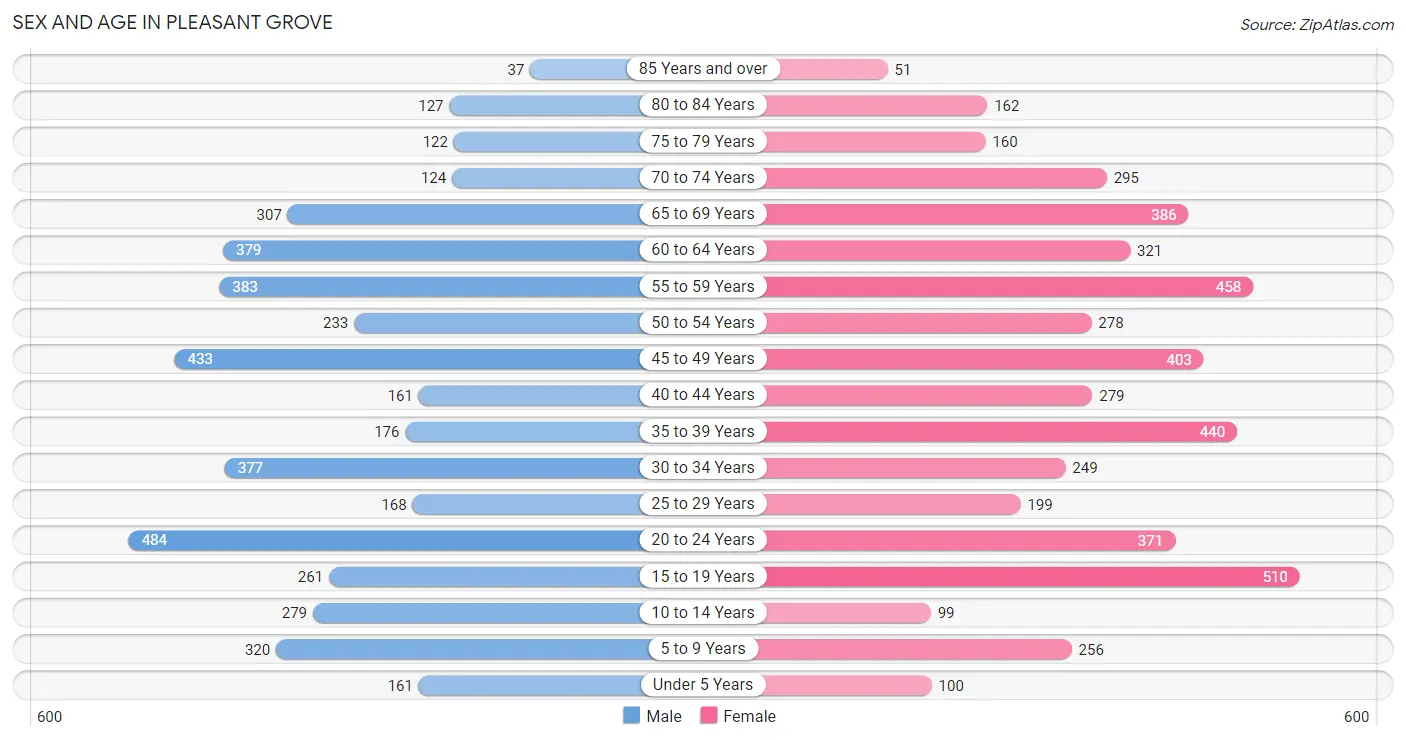
| Age Bracket | Male | Female |
| Under 5 Years | 161 (3.5%) | 100 (2.0%) |
| 5 to 9 Years | 320 (7.1%) | 256 (5.1%) |
| 10 to 14 Years | 279 (6.2%) | 99 (2.0%) |
| 15 to 19 Years | 261 (5.8%) | 510 (10.2%) |
| 20 to 24 Years | 484 (10.7%) | 371 (7.4%) |
| 25 to 29 Years | 168 (3.7%) | 199 (4.0%) |
| 30 to 34 Years | 377 (8.3%) | 249 (5.0%) |
| 35 to 39 Years | 176 (3.9%) | 440 (8.8%) |
| 40 to 44 Years | 161 (3.5%) | 279 (5.6%) |
| 45 to 49 Years | 433 (9.6%) | 403 (8.0%) |
| 50 to 54 Years | 233 (5.1%) | 278 (5.5%) |
| 55 to 59 Years | 383 (8.5%) | 458 (9.1%) |
| 60 to 64 Years | 379 (8.4%) | 321 (6.4%) |
| 65 to 69 Years | 307 (6.8%) | 386 (7.7%) |
| 70 to 74 Years | 124 (2.7%) | 295 (5.9%) |
| 75 to 79 Years | 122 (2.7%) | 160 (3.2%) |
| 80 to 84 Years | 127 (2.8%) | 162 (3.2%) |
| 85 Years and over | 37 (0.8%) | 51 (1.0%) |
| Total | 4,532 (100.0%) | 5,017 (100.0%) |
Families and Households in Pleasant Grove
Median Family Size in Pleasant Grove
The median family size in Pleasant Grove is 2.98 persons per family, with single male/father families (310 | 11.3%) accounting for the largest median family size of 3.31 persons per family. On the other hand, single female/mother families (677 | 24.7%) represent the smallest median family size with 2.64 persons per family.
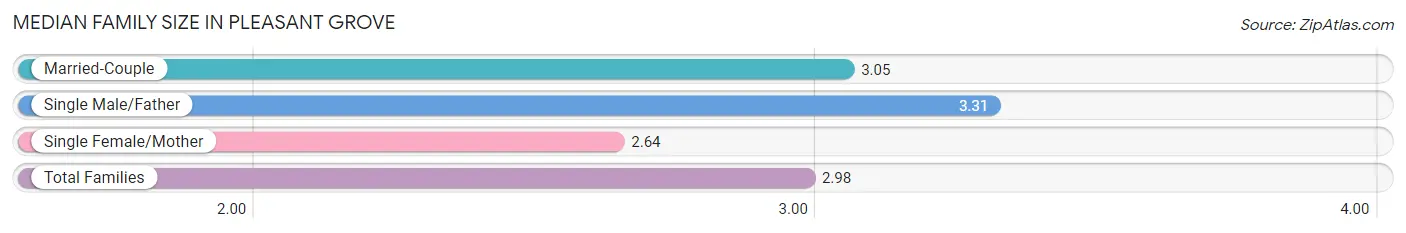
| Family Type | # Families | Family Size |
| Married-Couple | 1,753 (64.0%) | 3.05 |
| Single Male/Father | 310 (11.3%) | 3.31 |
| Single Female/Mother | 677 (24.7%) | 2.64 |
| Total Families | 2,740 (100.0%) | 2.98 |
Median Household Size in Pleasant Grove
The median household size in Pleasant Grove is 2.62 persons per household, with single male/father households (310 | 8.7%) accounting for the largest median household size of 3.35 persons per household. non-family households (813 | 22.9%) represent the smallest median household size with 1.27 persons per household.
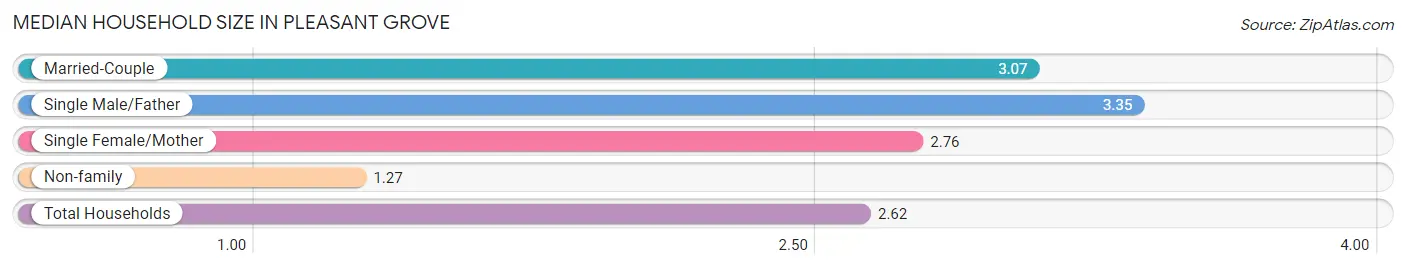
| Household Type | # Households | Household Size |
| Married-Couple | 1,753 (49.3%) | 3.07 |
| Single Male/Father | 310 (8.7%) | 3.35 |
| Single Female/Mother | 677 (19.1%) | 2.76 |
| Non-family | 813 (22.9%) | 1.27 |
| Total Households | 3,553 (100.0%) | 2.62 |
Household Size by Marriage Status in Pleasant Grove
Out of a total of 3,553 households in Pleasant Grove, 2,740 (77.1%) are family households, while 813 (22.9%) are nonfamily households. The most numerous type of family households are 2-person households, comprising 1,306, and the most common type of nonfamily households are 1-person households, comprising 613.
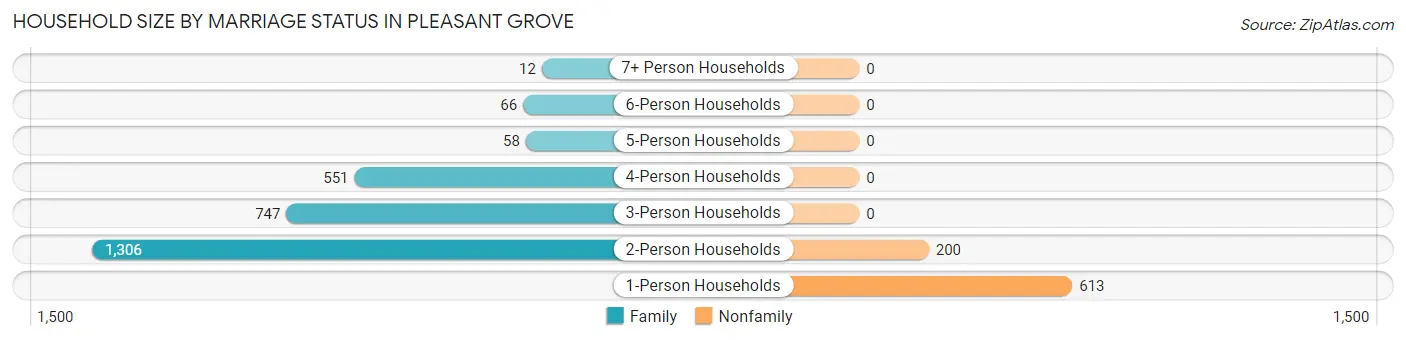
| Household Size | Family Households | Nonfamily Households |
| 1-Person Households | - | 613 (17.2%) |
| 2-Person Households | 1,306 (36.8%) | 200 (5.6%) |
| 3-Person Households | 747 (21.0%) | 0 (0.0%) |
| 4-Person Households | 551 (15.5%) | 0 (0.0%) |
| 5-Person Households | 58 (1.6%) | 0 (0.0%) |
| 6-Person Households | 66 (1.9%) | 0 (0.0%) |
| 7+ Person Households | 12 (0.3%) | 0 (0.0%) |
| Total | 2,740 (77.1%) | 813 (22.9%) |
Female Fertility in Pleasant Grove
Fertility by Age in Pleasant Grove
Average fertility rate in Pleasant Grove is 3.0 births per 1,000 women. Women in the age bracket of 35 to 50 years have the highest fertility rate with 6.0 births per 1,000 women. Women in the age bracket of 35 to 50 years acount for 87.5% of all women with births.
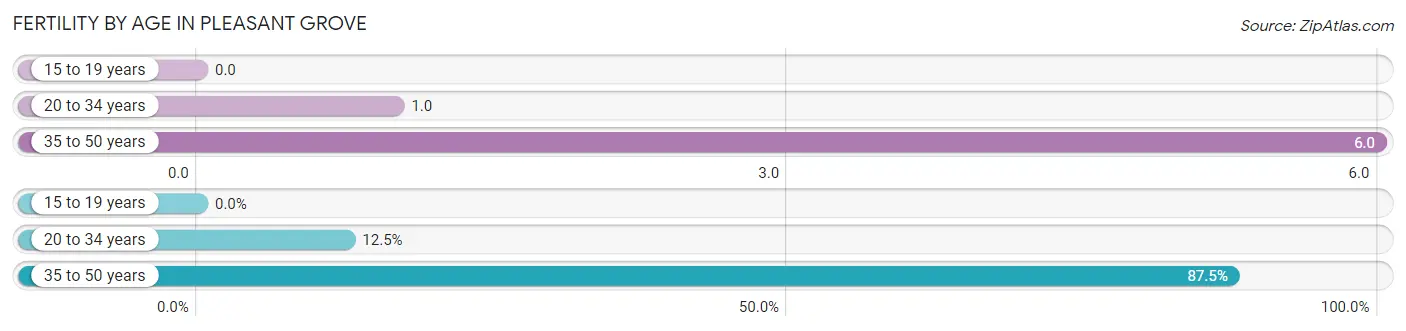
| Age Bracket | Women with Births | Births / 1,000 Women |
| 15 to 19 years | 0 (0.0%) | 0.0 |
| 20 to 34 years | 1 (12.5%) | 1.0 |
| 35 to 50 years | 7 (87.5%) | 6.0 |
| Total | 8 (100.0%) | 3.0 |
Fertility by Age by Marriage Status in Pleasant Grove
12.5% of women with births (8) in Pleasant Grove are married. The highest percentage of unmarried women with births falls into 35 to 50 years age bracket with 100.0% of them unmarried at the time of birth, while the lowest percentage of unmarried women with births belong to 20 to 34 years age bracket with 0.0% of them unmarried.
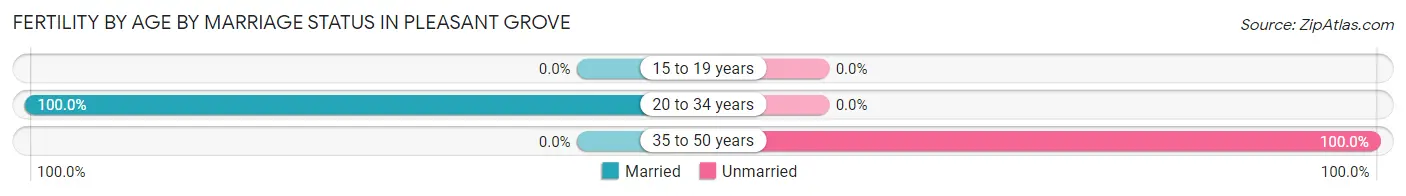
| Age Bracket | Married | Unmarried |
| 15 to 19 years | 0 (0.0%) | 0 (0.0%) |
| 20 to 34 years | 1 (100.0%) | 0 (0.0%) |
| 35 to 50 years | 0 (0.0%) | 7 (100.0%) |
| Total | 1 (12.5%) | 7 (87.5%) |
Fertility by Education in Pleasant Grove
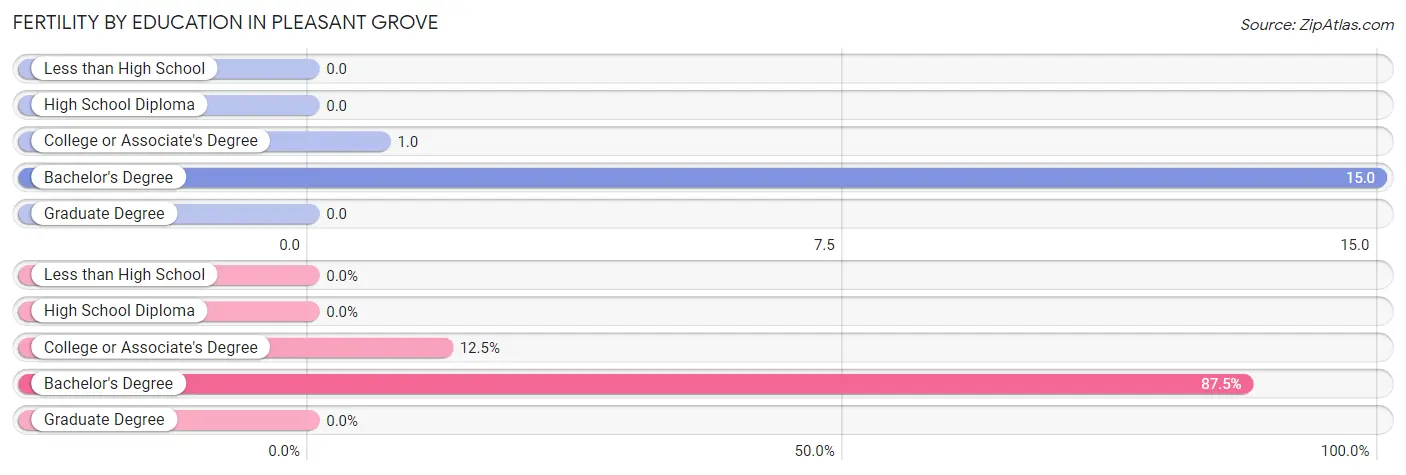
| Educational Attainment | Women with Births | Births / 1,000 Women |
| Less than High School | 0 (0.0%) | 0.0 |
| High School Diploma | 0 (0.0%) | 0.0 |
| College or Associate's Degree | 1 (12.5%) | 1.0 |
| Bachelor's Degree | 7 (87.5%) | 15.0 |
| Graduate Degree | 0 (0.0%) | 0.0 |
| Total | 8 (100.0%) | 3.0 |
Fertility by Education by Marriage Status in Pleasant Grove
87.5% of women with births in Pleasant Grove are unmarried. Women with the educational attainment of college or associate's degree are most likely to be married with 100.0% of them married at childbirth, while women with the educational attainment of bachelor's degree are least likely to be married with 100.0% of them unmarried at childbirth.
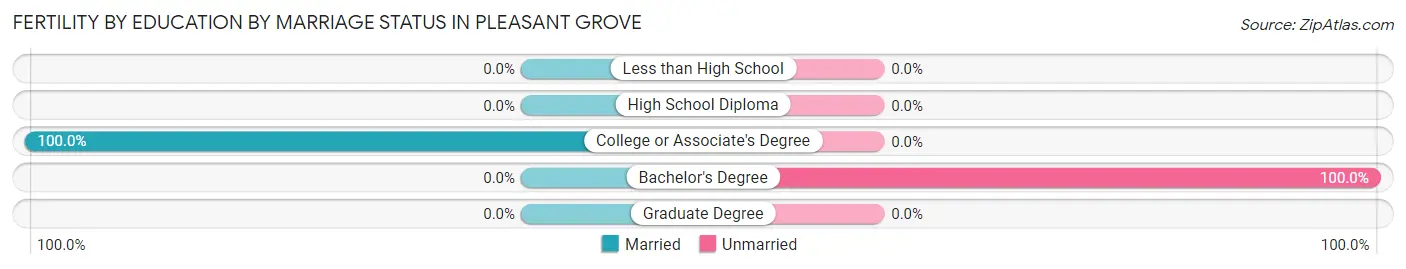
| Educational Attainment | Married | Unmarried |
| Less than High School | 0 (0.0%) | 0 (0.0%) |
| High School Diploma | 0 (0.0%) | 0 (0.0%) |
| College or Associate's Degree | 1 (100.0%) | 0 (0.0%) |
| Bachelor's Degree | 0 (0.0%) | 7 (100.0%) |
| Graduate Degree | 0 (0.0%) | 0 (0.0%) |
| Total | 1 (12.5%) | 7 (87.5%) |
Employment Characteristics in Pleasant Grove
Employment by Class of Employer in Pleasant Grove
Among the 4,798 employed individuals in Pleasant Grove, private company employees (3,053 | 63.6%), local government employees (736 | 15.3%), and federal government employees (402 | 8.4%) make up the most common classes of employment.
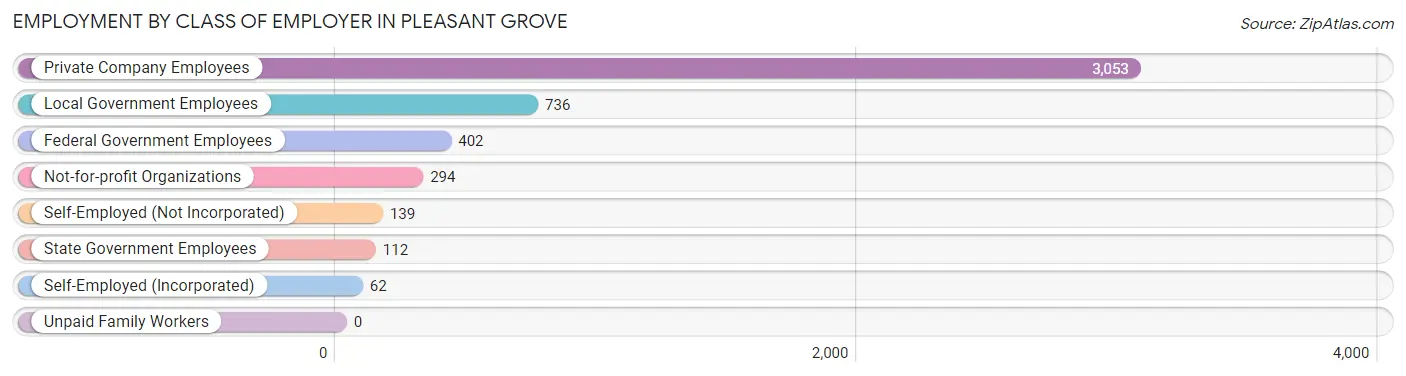
| Employer Class | # Employees | % Employees |
| Private Company Employees | 3,053 | 63.6% |
| Self-Employed (Incorporated) | 62 | 1.3% |
| Self-Employed (Not Incorporated) | 139 | 2.9% |
| Not-for-profit Organizations | 294 | 6.1% |
| Local Government Employees | 736 | 15.3% |
| State Government Employees | 112 | 2.3% |
| Federal Government Employees | 402 | 8.4% |
| Unpaid Family Workers | 0 | 0.0% |
| Total | 4,798 | 100.0% |
Employment Status by Age in Pleasant Grove
According to the labor force statistics for Pleasant Grove, out of the total population over 16 years of age (8,272), 61.5% or 5,087 individuals are in the labor force, with 4.6% or 234 of them unemployed. The age group with the highest labor force participation rate is 30 to 34 years, with 97.8% or 612 individuals in the labor force. Within the labor force, the 16 to 19 years age range has the highest percentage of unemployed individuals, with 46.9% or 121 of them being unemployed.
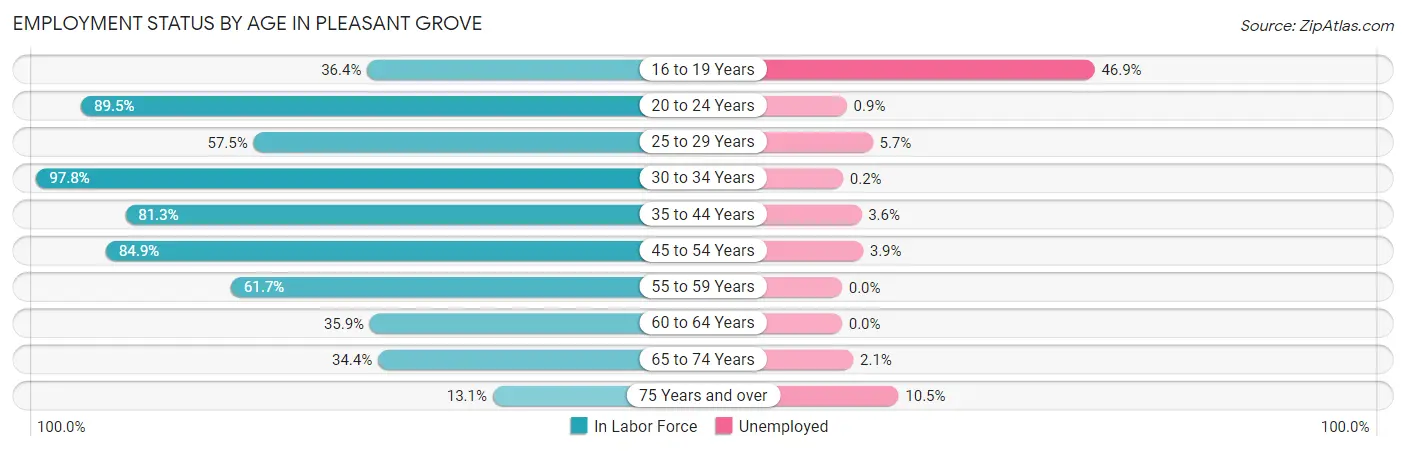
| Age Bracket | In Labor Force | Unemployed |
| 16 to 19 Years | 258 (36.4%) | 121 (46.9%) |
| 20 to 24 Years | 765 (89.5%) | 7 (0.9%) |
| 25 to 29 Years | 211 (57.5%) | 12 (5.7%) |
| 30 to 34 Years | 612 (97.8%) | 1 (0.2%) |
| 35 to 44 Years | 859 (81.3%) | 31 (3.6%) |
| 45 to 54 Years | 1,144 (84.9%) | 45 (3.9%) |
| 55 to 59 Years | 519 (61.7%) | 0 (0.0%) |
| 60 to 64 Years | 251 (35.9%) | 0 (0.0%) |
| 65 to 74 Years | 383 (34.4%) | 8 (2.1%) |
| 75 Years and over | 86 (13.1%) | 9 (10.5%) |
| Total | 5,087 (61.5%) | 234 (4.6%) |
Employment Status by Educational Attainment in Pleasant Grove
According to labor force statistics for Pleasant Grove, 72.8% of individuals (3,594) out of the total population between 25 and 64 years of age (4,937) are in the labor force, with 2.5% or 90 of them being unemployed. The group with the highest labor force participation rate are those with the educational attainment of college / associate degree, with 78.3% or 1,759 individuals in the labor force. Within the labor force, individuals with less than high school education have the highest percentage of unemployment, with 26.5% or 31 of them being unemployed.
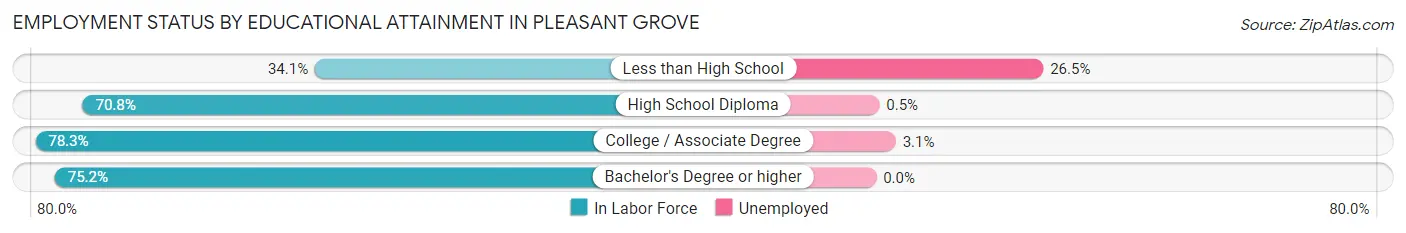
| Educational Attainment | In Labor Force | Unemployed |
| Less than High School | 117 (34.1%) | 91 (26.5%) |
| High School Diploma | 760 (70.8%) | 5 (0.5%) |
| College / Associate Degree | 1,759 (78.3%) | 70 (3.1%) |
| Bachelor's Degree or higher | 959 (75.2%) | 0 (0.0%) |
| Total | 3,594 (72.8%) | 123 (2.5%) |
Employment Occupations by Sex in Pleasant Grove
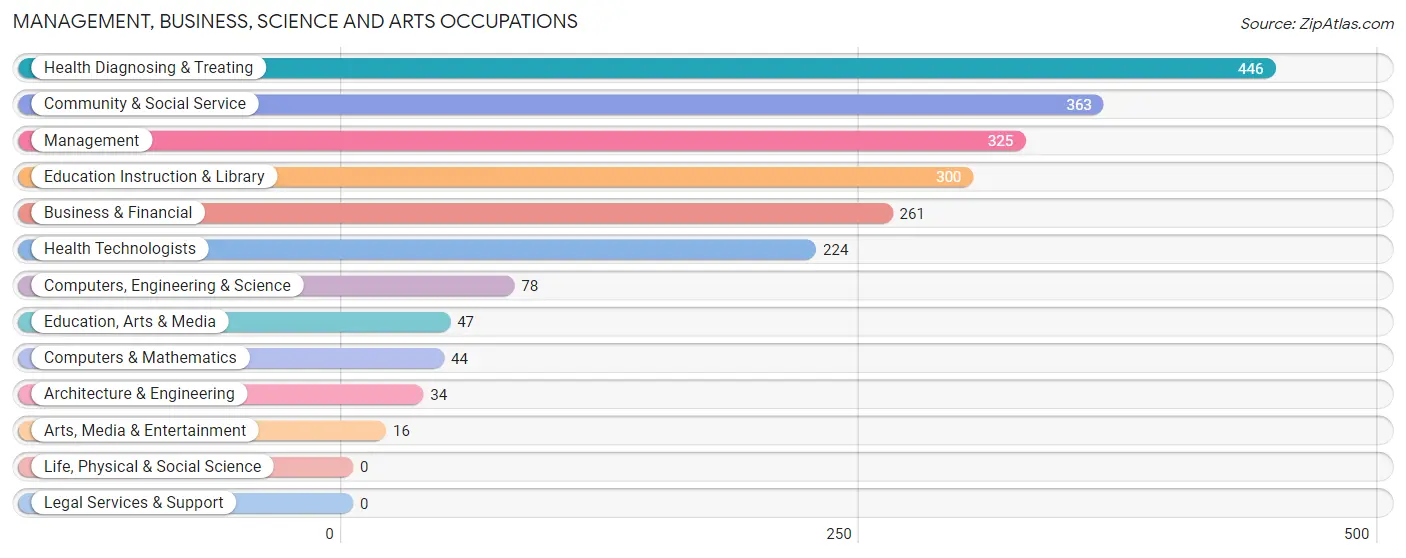
Management, Business, Science and Arts Occupations
The most common Management, Business, Science and Arts occupations in Pleasant Grove are Health Diagnosing & Treating (446 | 9.2%), Community & Social Service (363 | 7.5%), Management (325 | 6.7%), Education Instruction & Library (300 | 6.2%), and Business & Financial (261 | 5.4%).
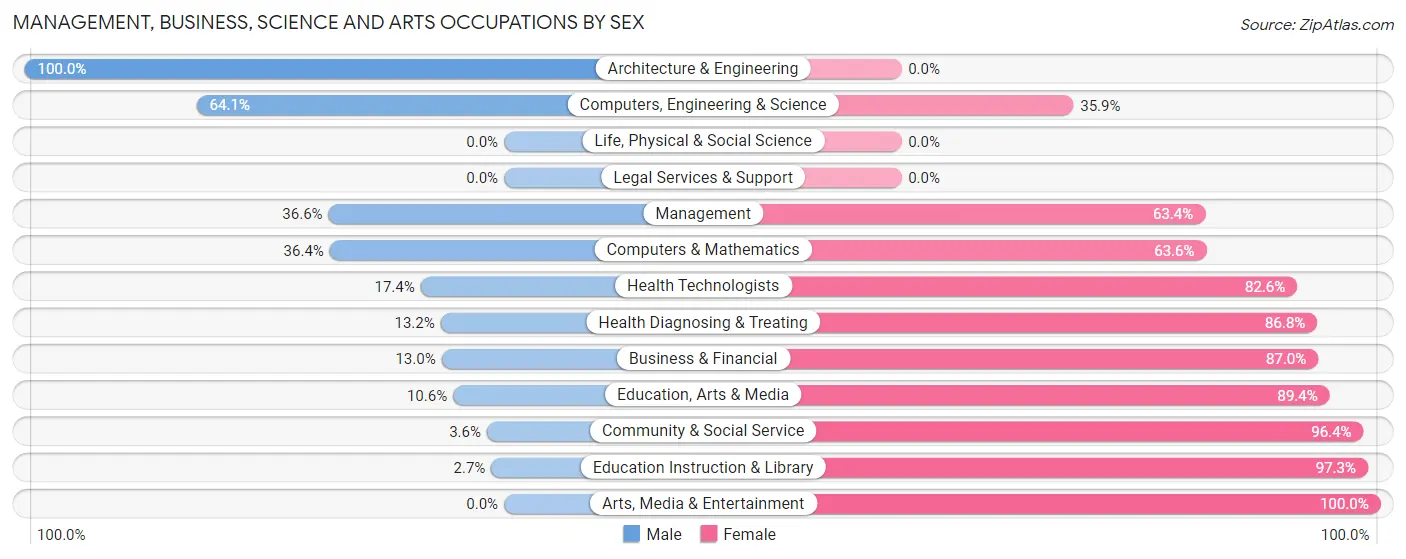
Management, Business, Science and Arts Occupations by Sex
Within the Management, Business, Science and Arts occupations in Pleasant Grove, the most male-oriented occupations are Architecture & Engineering (100.0%), Computers, Engineering & Science (64.1%), and Management (36.6%), while the most female-oriented occupations are Arts, Media & Entertainment (100.0%), Education Instruction & Library (97.3%), and Community & Social Service (96.4%).
| Occupation | Male | Female |
| Management | 119 (36.6%) | 206 (63.4%) |
| Business & Financial | 34 (13.0%) | 227 (87.0%) |
| Computers, Engineering & Science | 50 (64.1%) | 28 (35.9%) |
| Computers & Mathematics | 16 (36.4%) | 28 (63.6%) |
| Architecture & Engineering | 34 (100.0%) | 0 (0.0%) |
| Life, Physical & Social Science | 0 (0.0%) | 0 (0.0%) |
| Community & Social Service | 13 (3.6%) | 350 (96.4%) |
| Education, Arts & Media | 5 (10.6%) | 42 (89.4%) |
| Legal Services & Support | 0 (0.0%) | 0 (0.0%) |
| Education Instruction & Library | 8 (2.7%) | 292 (97.3%) |
| Arts, Media & Entertainment | 0 (0.0%) | 16 (100.0%) |
| Health Diagnosing & Treating | 59 (13.2%) | 387 (86.8%) |
| Health Technologists | 39 (17.4%) | 185 (82.6%) |
| Total (Category) | 275 (18.7%) | 1,198 (81.3%) |
| Total (Overall) | 2,304 (47.5%) | 2,542 (52.5%) |
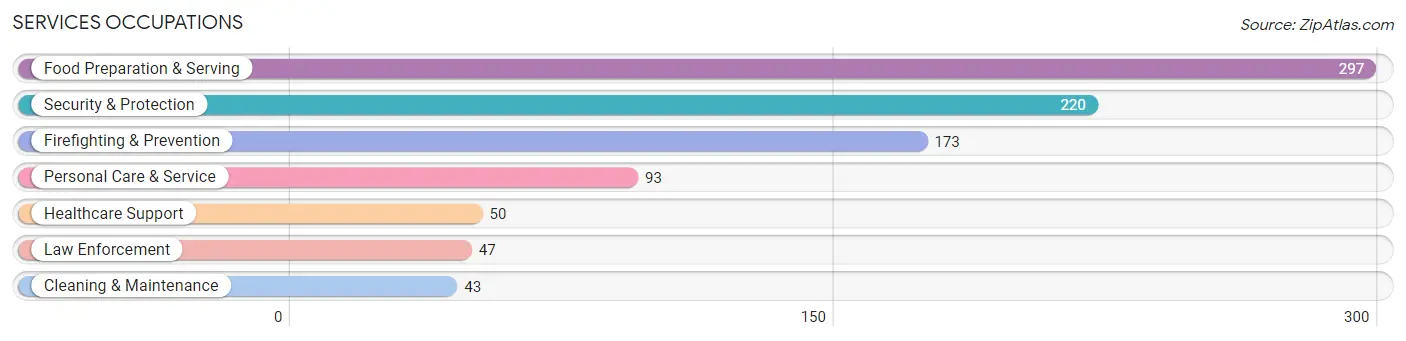
Services Occupations
The most common Services occupations in Pleasant Grove are Food Preparation & Serving (297 | 6.1%), Security & Protection (220 | 4.5%), Firefighting & Prevention (173 | 3.6%), Personal Care & Service (93 | 1.9%), and Healthcare Support (50 | 1.0%).
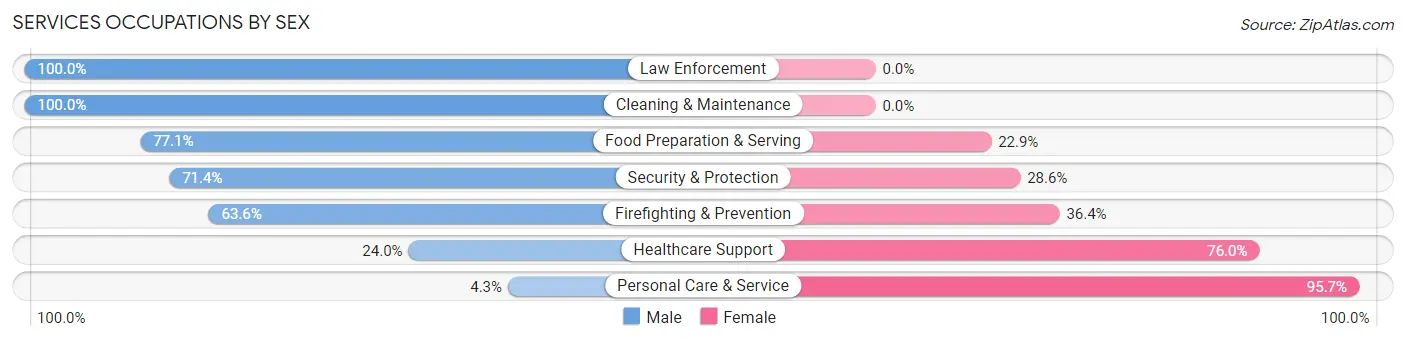
Services Occupations by Sex
Within the Services occupations in Pleasant Grove, the most male-oriented occupations are Law Enforcement (100.0%), Cleaning & Maintenance (100.0%), and Food Preparation & Serving (77.1%), while the most female-oriented occupations are Personal Care & Service (95.7%), Healthcare Support (76.0%), and Firefighting & Prevention (36.4%).
| Occupation | Male | Female |
| Healthcare Support | 12 (24.0%) | 38 (76.0%) |
| Security & Protection | 157 (71.4%) | 63 (28.6%) |
| Firefighting & Prevention | 110 (63.6%) | 63 (36.4%) |
| Law Enforcement | 47 (100.0%) | 0 (0.0%) |
| Food Preparation & Serving | 229 (77.1%) | 68 (22.9%) |
| Cleaning & Maintenance | 43 (100.0%) | 0 (0.0%) |
| Personal Care & Service | 4 (4.3%) | 89 (95.7%) |
| Total (Category) | 445 (63.3%) | 258 (36.7%) |
| Total (Overall) | 2,304 (47.5%) | 2,542 (52.5%) |
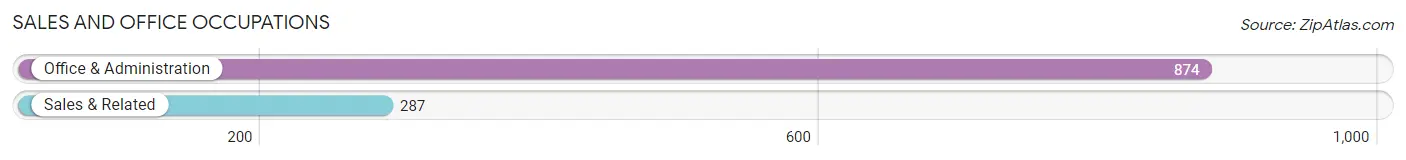
Sales and Office Occupations
The most common Sales and Office occupations in Pleasant Grove are Office & Administration (874 | 18.0%), and Sales & Related (287 | 5.9%).
Sales and Office Occupations by Sex
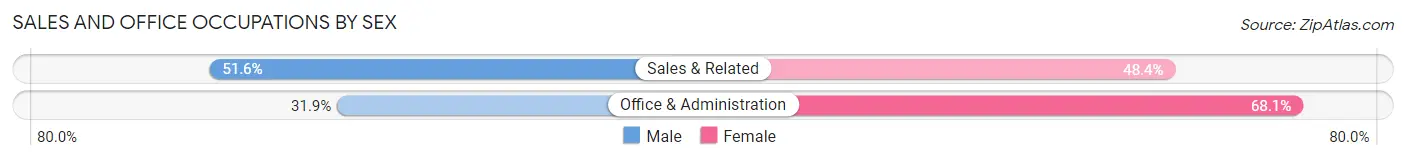
| Occupation | Male | Female |
| Sales & Related | 148 (51.6%) | 139 (48.4%) |
| Office & Administration | 279 (31.9%) | 595 (68.1%) |
| Total (Category) | 427 (36.8%) | 734 (63.2%) |
| Total (Overall) | 2,304 (47.5%) | 2,542 (52.5%) |
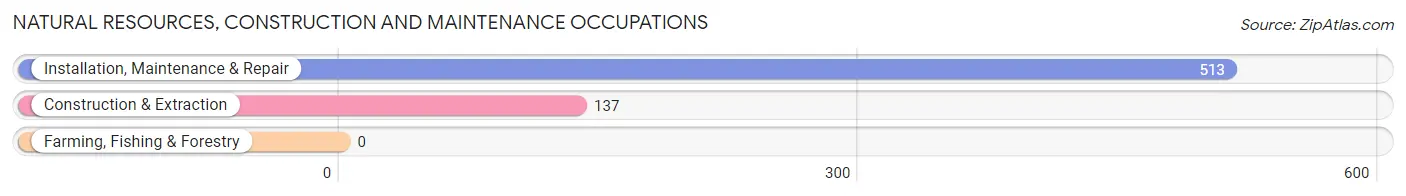
Natural Resources, Construction and Maintenance Occupations
The most common Natural Resources, Construction and Maintenance occupations in Pleasant Grove are Installation, Maintenance & Repair (513 | 10.6%), and Construction & Extraction (137 | 2.8%).
Natural Resources, Construction and Maintenance Occupations by Sex
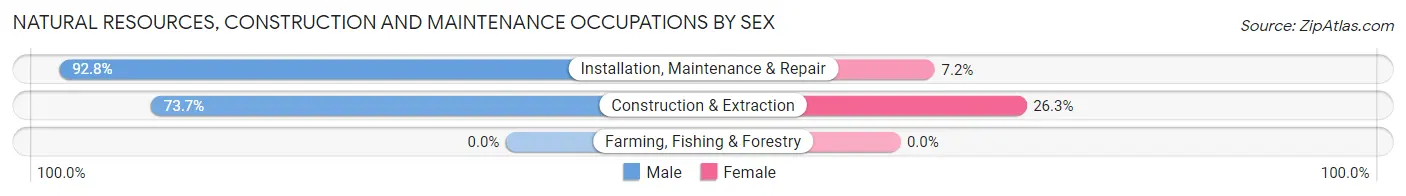
| Occupation | Male | Female |
| Farming, Fishing & Forestry | 0 (0.0%) | 0 (0.0%) |
| Construction & Extraction | 101 (73.7%) | 36 (26.3%) |
| Installation, Maintenance & Repair | 476 (92.8%) | 37 (7.2%) |
| Total (Category) | 577 (88.8%) | 73 (11.2%) |
| Total (Overall) | 2,304 (47.5%) | 2,542 (52.5%) |
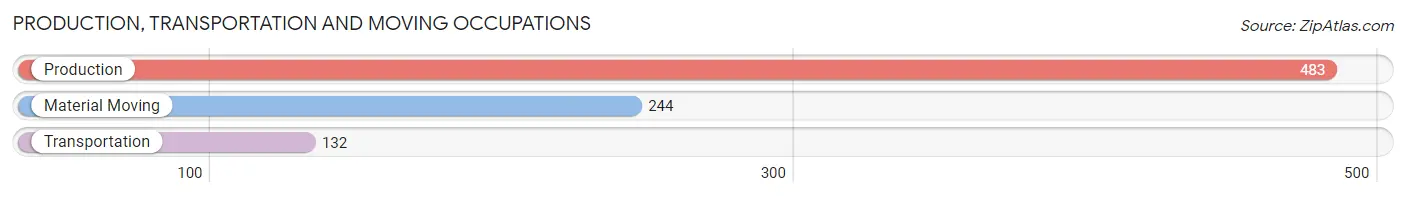
Production, Transportation and Moving Occupations
The most common Production, Transportation and Moving occupations in Pleasant Grove are Production (483 | 10.0%), Material Moving (244 | 5.0%), and Transportation (132 | 2.7%).
Production, Transportation and Moving Occupations by Sex
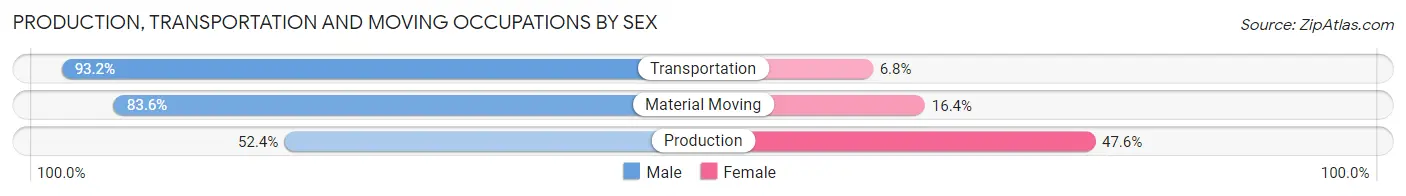
| Occupation | Male | Female |
| Production | 253 (52.4%) | 230 (47.6%) |
| Transportation | 123 (93.2%) | 9 (6.8%) |
| Material Moving | 204 (83.6%) | 40 (16.4%) |
| Total (Category) | 580 (67.5%) | 279 (32.5%) |
| Total (Overall) | 2,304 (47.5%) | 2,542 (52.5%) |
Employment Industries by Sex in Pleasant Grove
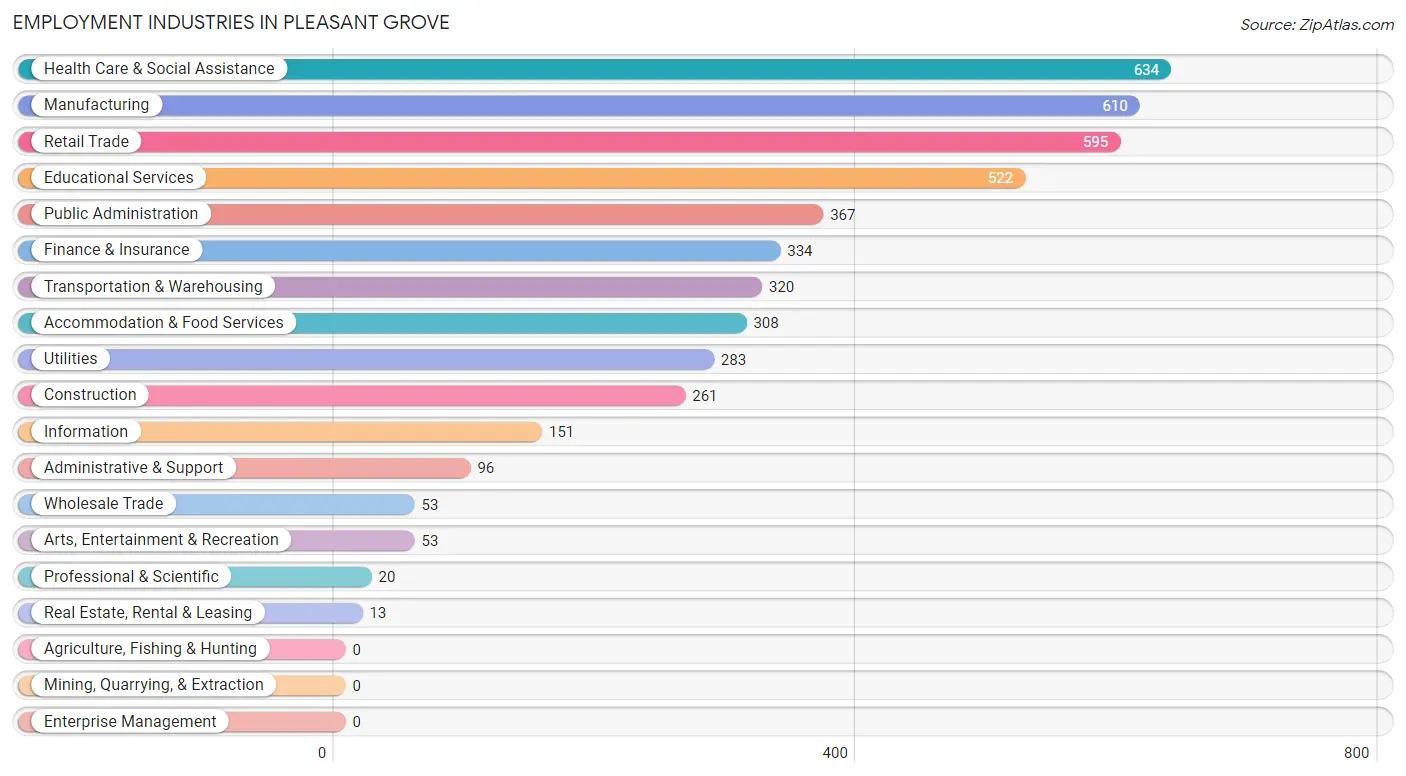
Employment Industries in Pleasant Grove
The major employment industries in Pleasant Grove include Health Care & Social Assistance (634 | 13.1%), Manufacturing (610 | 12.6%), Retail Trade (595 | 12.3%), Educational Services (522 | 10.8%), and Public Administration (367 | 7.6%).
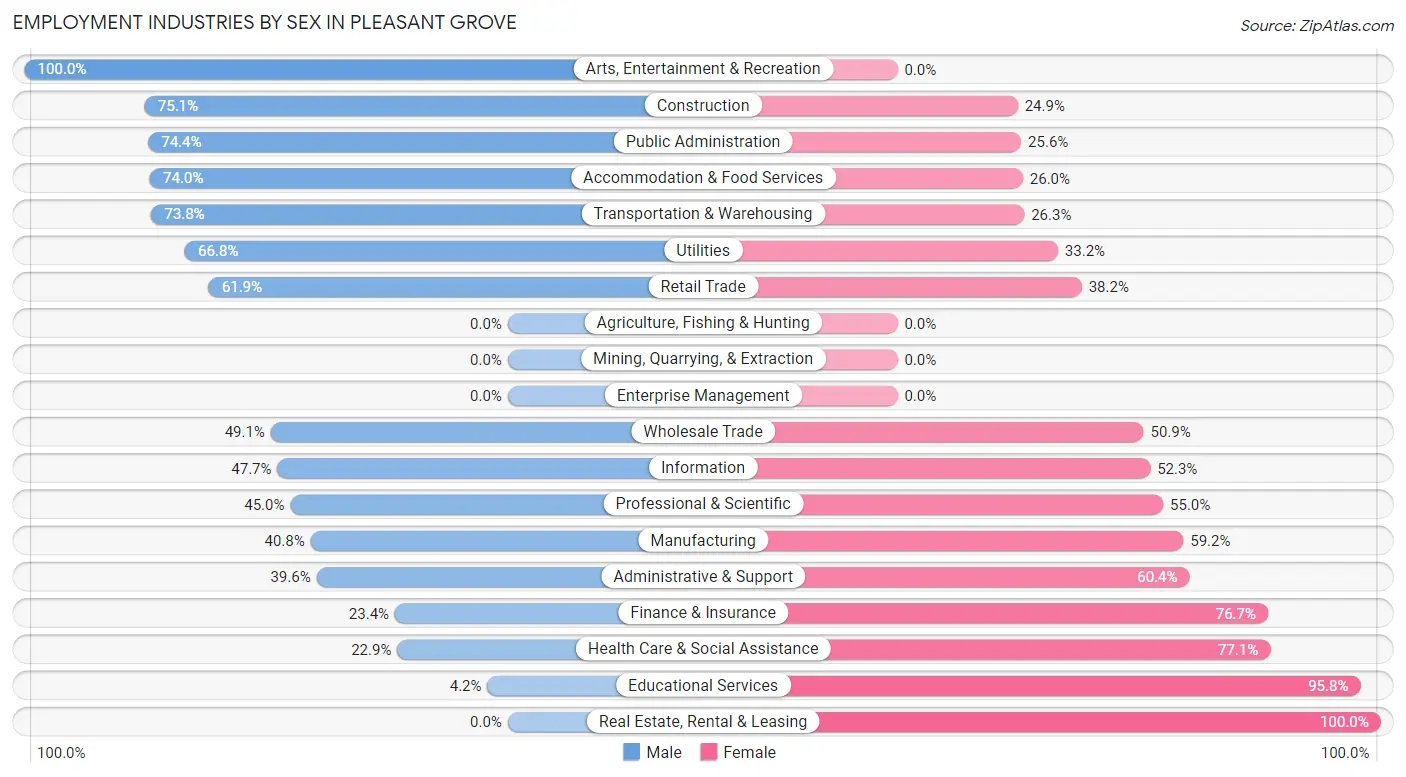
Employment Industries by Sex in Pleasant Grove
The Pleasant Grove industries that see more men than women are Arts, Entertainment & Recreation (100.0%), Construction (75.1%), and Public Administration (74.4%), whereas the industries that tend to have a higher number of women are Real Estate, Rental & Leasing (100.0%), Educational Services (95.8%), and Health Care & Social Assistance (77.1%).
| Industry | Male | Female |
| Agriculture, Fishing & Hunting | 0 (0.0%) | 0 (0.0%) |
| Mining, Quarrying, & Extraction | 0 (0.0%) | 0 (0.0%) |
| Construction | 196 (75.1%) | 65 (24.9%) |
| Manufacturing | 249 (40.8%) | 361 (59.2%) |
| Wholesale Trade | 26 (49.1%) | 27 (50.9%) |
| Retail Trade | 368 (61.9%) | 227 (38.2%) |
| Transportation & Warehousing | 236 (73.8%) | 84 (26.3%) |
| Utilities | 189 (66.8%) | 94 (33.2%) |
| Information | 72 (47.7%) | 79 (52.3%) |
| Finance & Insurance | 78 (23.4%) | 256 (76.6%) |
| Real Estate, Rental & Leasing | 0 (0.0%) | 13 (100.0%) |
| Professional & Scientific | 9 (45.0%) | 11 (55.0%) |
| Enterprise Management | 0 (0.0%) | 0 (0.0%) |
| Administrative & Support | 38 (39.6%) | 58 (60.4%) |
| Educational Services | 22 (4.2%) | 500 (95.8%) |
| Health Care & Social Assistance | 145 (22.9%) | 489 (77.1%) |
| Arts, Entertainment & Recreation | 53 (100.0%) | 0 (0.0%) |
| Accommodation & Food Services | 228 (74.0%) | 80 (26.0%) |
| Public Administration | 273 (74.4%) | 94 (25.6%) |
| Total | 2,304 (47.5%) | 2,542 (52.5%) |
Education in Pleasant Grove
School Enrollment in Pleasant Grove
The most common levels of schooling among the 2,373 students in Pleasant Grove are high school (791 | 33.3%), elementary school (595 | 25.1%), and college / undergraduate (523 | 22.0%).
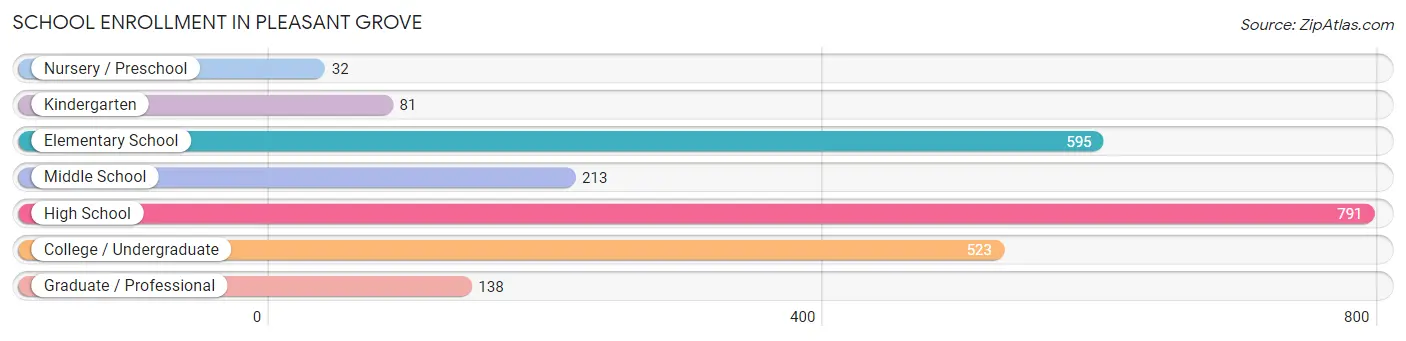
| School Level | # Students | % Students |
| Nursery / Preschool | 32 | 1.3% |
| Kindergarten | 81 | 3.4% |
| Elementary School | 595 | 25.1% |
| Middle School | 213 | 9.0% |
| High School | 791 | 33.3% |
| College / Undergraduate | 523 | 22.0% |
| Graduate / Professional | 138 | 5.8% |
| Total | 2,373 | 100.0% |
School Enrollment by Age by Funding Source in Pleasant Grove
Out of a total of 2,373 students who are enrolled in schools in Pleasant Grove, 131 (5.5%) attend a private institution, while the remaining 2,242 (94.5%) are enrolled in public schools. The age group of 25 to 34 year olds has the highest likelihood of being enrolled in private schools, with 29 (76.3% in the age bracket) enrolled. Conversely, the age group of 15 to 17 year olds has the lowest likelihood of being enrolled in a private school, with 491 (100.0% in the age bracket) attending a public institution.
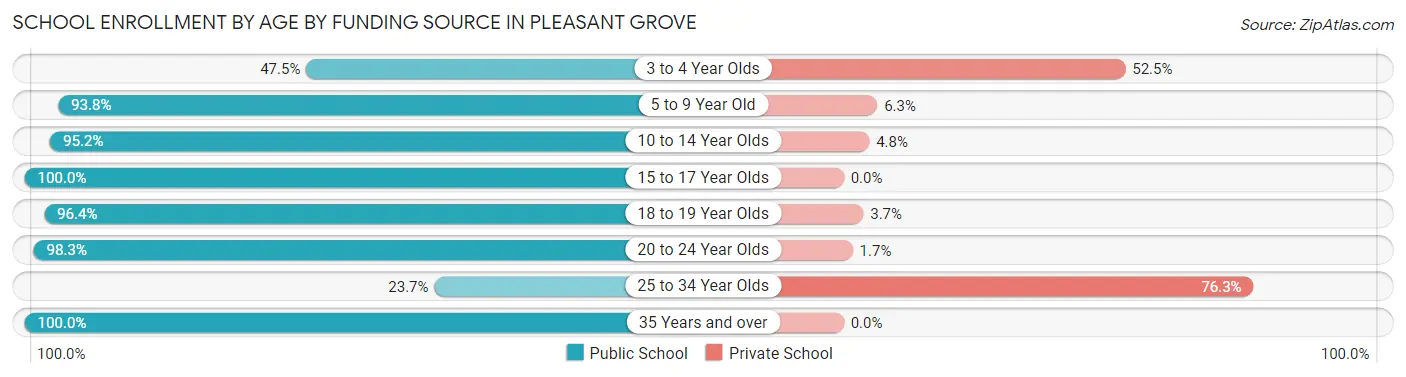
| Age Bracket | Public School | Private School |
| 3 to 4 Year Olds | 29 (47.5%) | 32 (52.5%) |
| 5 to 9 Year Old | 540 (93.8%) | 36 (6.2%) |
| 10 to 14 Year Olds | 360 (95.2%) | 18 (4.8%) |
| 15 to 17 Year Olds | 491 (100.0%) | 0 (0.0%) |
| 18 to 19 Year Olds | 211 (96.4%) | 8 (3.6%) |
| 20 to 24 Year Olds | 411 (98.3%) | 7 (1.7%) |
| 25 to 34 Year Olds | 9 (23.7%) | 29 (76.3%) |
| 35 Years and over | 192 (100.0%) | 0 (0.0%) |
| Total | 2,242 (94.5%) | 131 (5.5%) |
Educational Attainment by Field of Study in Pleasant Grove
Business (333 | 20.4%), arts & humanities (250 | 15.3%), science & technology (222 | 13.6%), education (214 | 13.1%), and psychology (96 | 5.9%) are the most common fields of study among 1,632 individuals in Pleasant Grove who have obtained a bachelor's degree or higher.
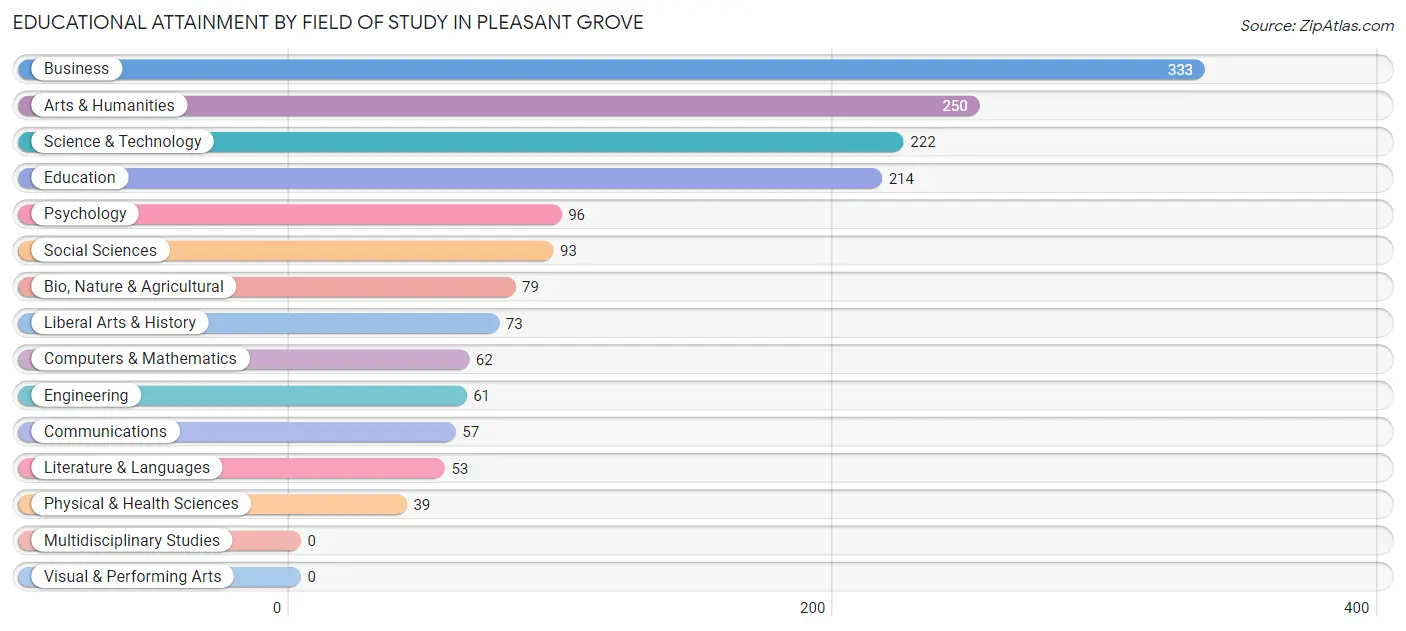
| Field of Study | # Graduates | % Graduates |
| Computers & Mathematics | 62 | 3.8% |
| Bio, Nature & Agricultural | 79 | 4.8% |
| Physical & Health Sciences | 39 | 2.4% |
| Psychology | 96 | 5.9% |
| Social Sciences | 93 | 5.7% |
| Engineering | 61 | 3.7% |
| Multidisciplinary Studies | 0 | 0.0% |
| Science & Technology | 222 | 13.6% |
| Business | 333 | 20.4% |
| Education | 214 | 13.1% |
| Literature & Languages | 53 | 3.3% |
| Liberal Arts & History | 73 | 4.5% |
| Visual & Performing Arts | 0 | 0.0% |
| Communications | 57 | 3.5% |
| Arts & Humanities | 250 | 15.3% |
| Total | 1,632 | 100.0% |
Transportation & Commute in Pleasant Grove
Vehicle Availability by Sex in Pleasant Grove
The most prevalent vehicle ownership categories in Pleasant Grove are males with 2 vehicles (947, accounting for 41.1%) and females with 2 vehicles (889, making up 38.0%).
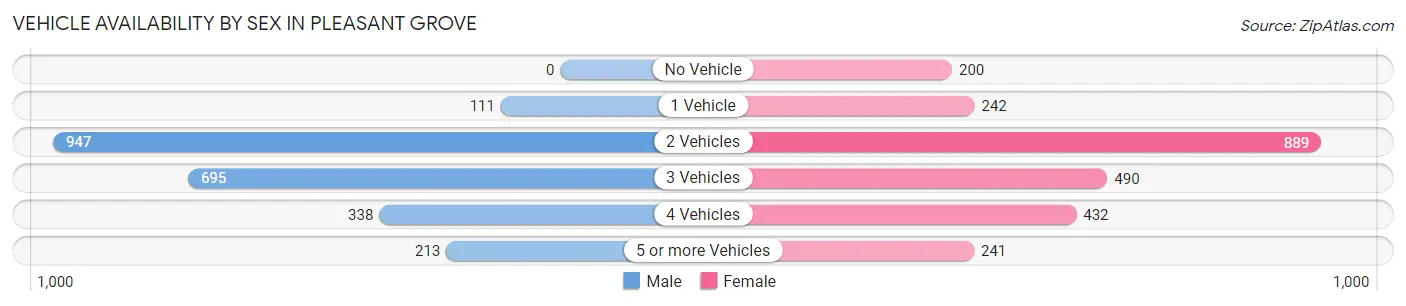
| Vehicles Available | Male | Female |
| No Vehicle | 0 (0.0%) | 200 (8.0%) |
| 1 Vehicle | 111 (4.8%) | 242 (9.7%) |
| 2 Vehicles | 947 (41.1%) | 889 (35.6%) |
| 3 Vehicles | 695 (30.2%) | 490 (19.7%) |
| 4 Vehicles | 338 (14.7%) | 432 (17.3%) |
| 5 or more Vehicles | 213 (9.2%) | 241 (9.7%) |
| Total | 2,304 (100.0%) | 2,494 (100.0%) |
Commute Time in Pleasant Grove
The most frequently occuring commute durations in Pleasant Grove are 20 to 24 minutes (1,067 commuters, 23.1%), 15 to 19 minutes (691 commuters, 14.9%), and 30 to 34 minutes (664 commuters, 14.4%).
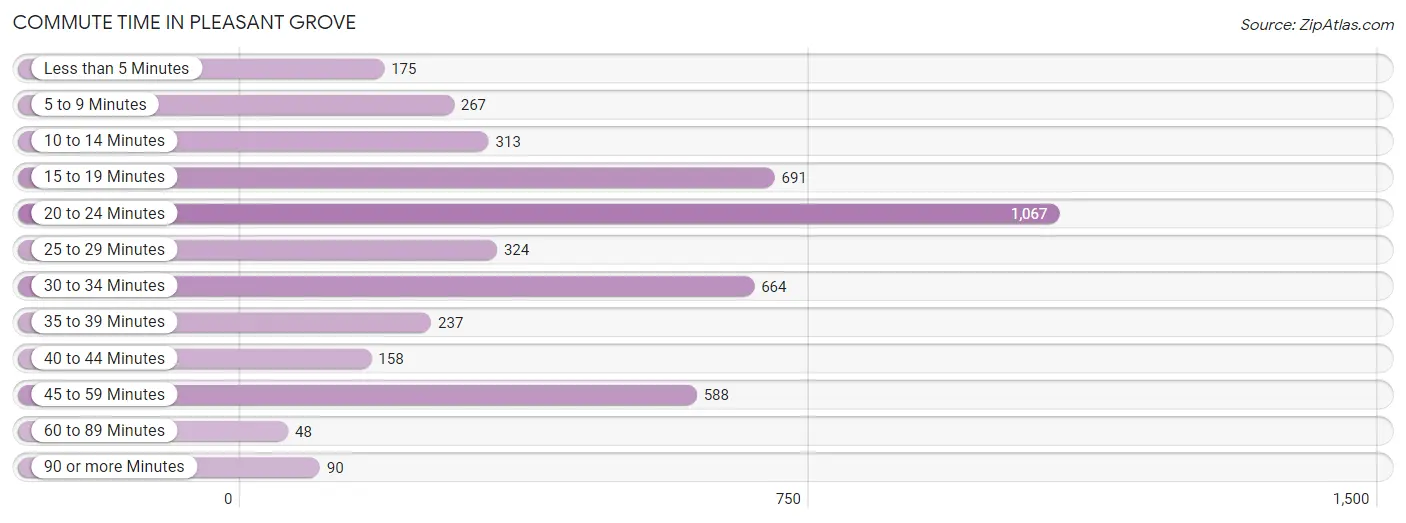
| Commute Time | # Commuters | % Commuters |
| Less than 5 Minutes | 175 | 3.8% |
| 5 to 9 Minutes | 267 | 5.8% |
| 10 to 14 Minutes | 313 | 6.8% |
| 15 to 19 Minutes | 691 | 14.9% |
| 20 to 24 Minutes | 1,067 | 23.1% |
| 25 to 29 Minutes | 324 | 7.0% |
| 30 to 34 Minutes | 664 | 14.4% |
| 35 to 39 Minutes | 237 | 5.1% |
| 40 to 44 Minutes | 158 | 3.4% |
| 45 to 59 Minutes | 588 | 12.7% |
| 60 to 89 Minutes | 48 | 1.0% |
| 90 or more Minutes | 90 | 1.9% |
Commute Time by Sex in Pleasant Grove
The most common commute times in Pleasant Grove are 20 to 24 minutes (452 commuters, 19.8%) for males and 20 to 24 minutes (615 commuters, 26.3%) for females.
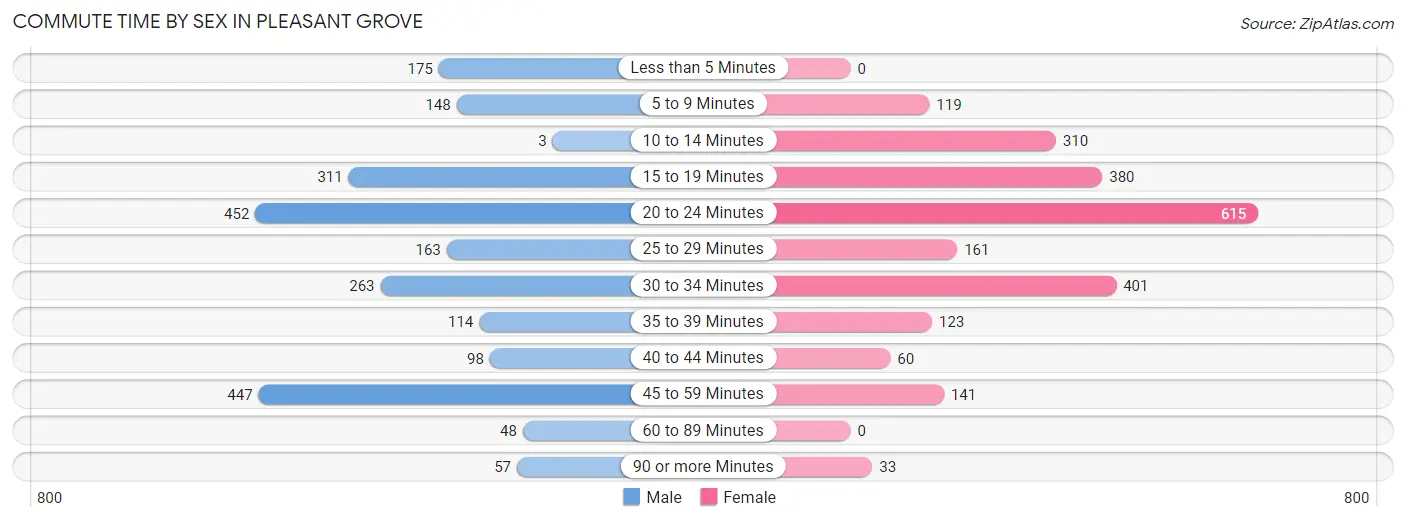
| Commute Time | Male | Female |
| Less than 5 Minutes | 175 (7.7%) | 0 (0.0%) |
| 5 to 9 Minutes | 148 (6.5%) | 119 (5.1%) |
| 10 to 14 Minutes | 3 (0.1%) | 310 (13.2%) |
| 15 to 19 Minutes | 311 (13.7%) | 380 (16.2%) |
| 20 to 24 Minutes | 452 (19.8%) | 615 (26.3%) |
| 25 to 29 Minutes | 163 (7.1%) | 161 (6.9%) |
| 30 to 34 Minutes | 263 (11.5%) | 401 (17.1%) |
| 35 to 39 Minutes | 114 (5.0%) | 123 (5.2%) |
| 40 to 44 Minutes | 98 (4.3%) | 60 (2.6%) |
| 45 to 59 Minutes | 447 (19.6%) | 141 (6.0%) |
| 60 to 89 Minutes | 48 (2.1%) | 0 (0.0%) |
| 90 or more Minutes | 57 (2.5%) | 33 (1.4%) |
Time of Departure to Work by Sex in Pleasant Grove
The most frequent times of departure to work in Pleasant Grove are 7:30 AM to 7:59 AM (337, 14.8%) for males and 7:00 AM to 7:29 AM (389, 16.6%) for females.
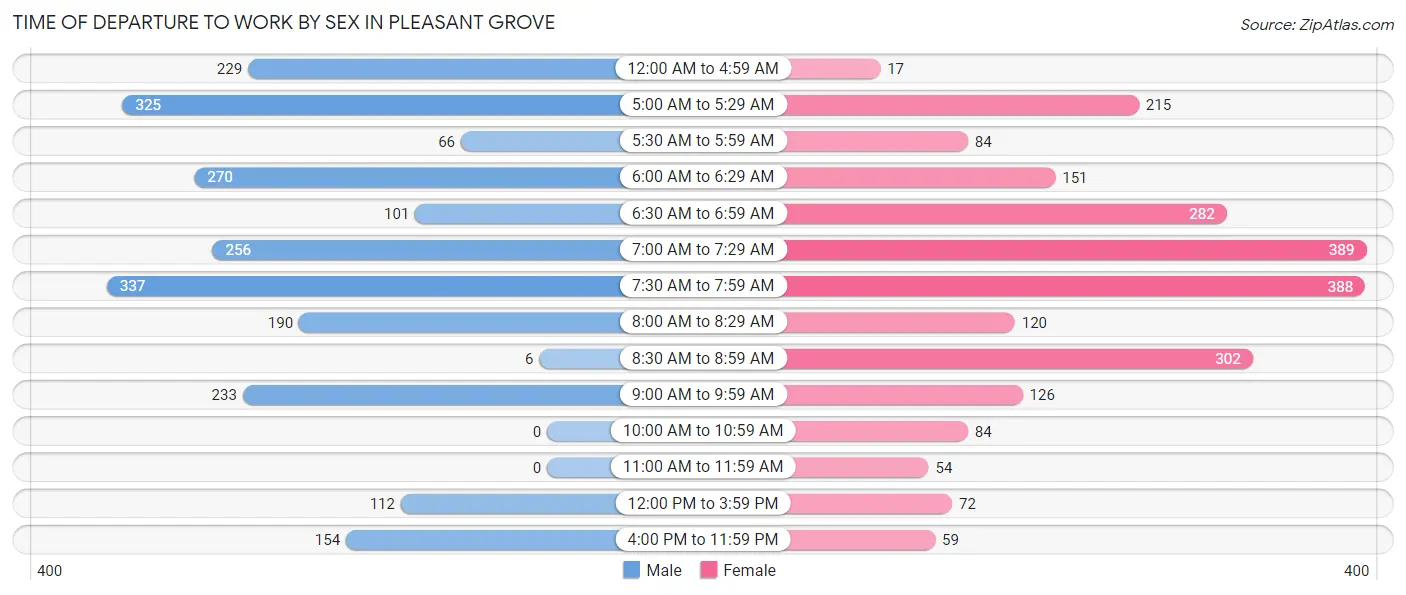
| Time of Departure | Male | Female |
| 12:00 AM to 4:59 AM | 229 (10.1%) | 17 (0.7%) |
| 5:00 AM to 5:29 AM | 325 (14.3%) | 215 (9.2%) |
| 5:30 AM to 5:59 AM | 66 (2.9%) | 84 (3.6%) |
| 6:00 AM to 6:29 AM | 270 (11.8%) | 151 (6.4%) |
| 6:30 AM to 6:59 AM | 101 (4.4%) | 282 (12.0%) |
| 7:00 AM to 7:29 AM | 256 (11.2%) | 389 (16.6%) |
| 7:30 AM to 7:59 AM | 337 (14.8%) | 388 (16.6%) |
| 8:00 AM to 8:29 AM | 190 (8.3%) | 120 (5.1%) |
| 8:30 AM to 8:59 AM | 6 (0.3%) | 302 (12.9%) |
| 9:00 AM to 9:59 AM | 233 (10.2%) | 126 (5.4%) |
| 10:00 AM to 10:59 AM | 0 (0.0%) | 84 (3.6%) |
| 11:00 AM to 11:59 AM | 0 (0.0%) | 54 (2.3%) |
| 12:00 PM to 3:59 PM | 112 (4.9%) | 72 (3.1%) |
| 4:00 PM to 11:59 PM | 154 (6.8%) | 59 (2.5%) |
| Total | 2,279 (100.0%) | 2,343 (100.0%) |
Housing Occupancy in Pleasant Grove
Occupancy by Ownership in Pleasant Grove
Of the total 3,553 dwellings in Pleasant Grove, owner-occupied units account for 2,744 (77.2%), while renter-occupied units make up 809 (22.8%).
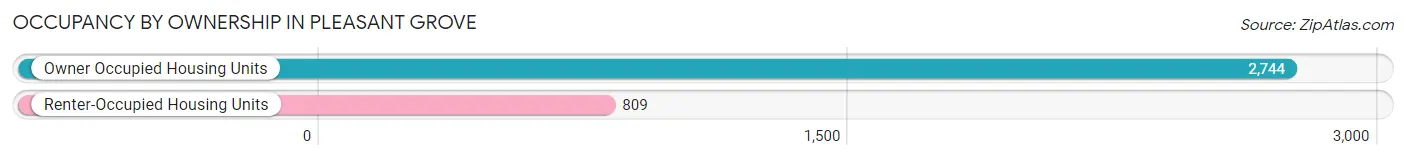
| Occupancy | # Housing Units | % Housing Units |
| Owner Occupied Housing Units | 2,744 | 77.2% |
| Renter-Occupied Housing Units | 809 | 22.8% |
| Total Occupied Housing Units | 3,553 | 100.0% |
Occupancy by Household Size in Pleasant Grove
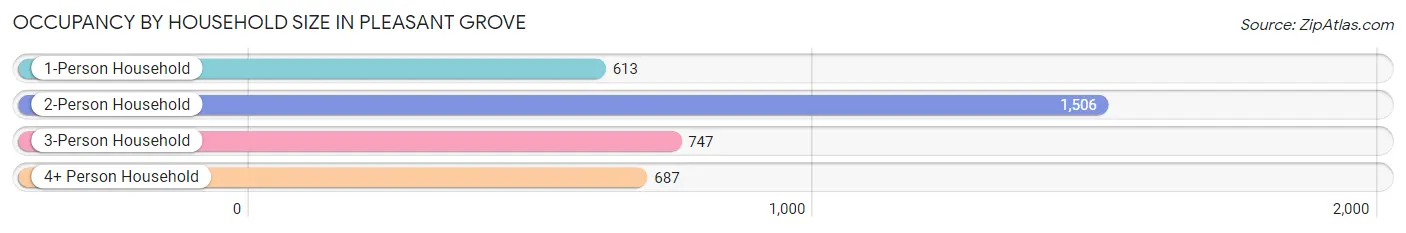
| Household Size | # Housing Units | % Housing Units |
| 1-Person Household | 613 | 17.2% |
| 2-Person Household | 1,506 | 42.4% |
| 3-Person Household | 747 | 21.0% |
| 4+ Person Household | 687 | 19.3% |
| Total Housing Units | 3,553 | 100.0% |
Occupancy by Ownership by Household Size in Pleasant Grove
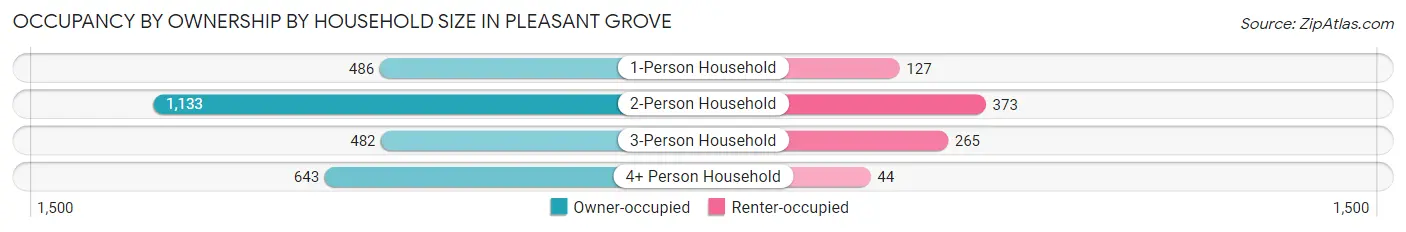
| Household Size | Owner-occupied | Renter-occupied |
| 1-Person Household | 486 (79.3%) | 127 (20.7%) |
| 2-Person Household | 1,133 (75.2%) | 373 (24.8%) |
| 3-Person Household | 482 (64.5%) | 265 (35.5%) |
| 4+ Person Household | 643 (93.6%) | 44 (6.4%) |
| Total Housing Units | 2,744 (77.2%) | 809 (22.8%) |
Occupancy by Educational Attainment in Pleasant Grove
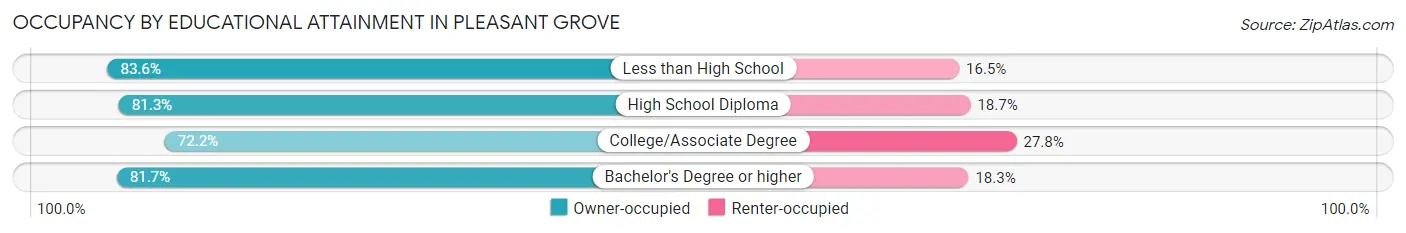
| Household Size | Owner-occupied | Renter-occupied |
| Less than High School | 127 (83.6%) | 25 (16.5%) |
| High School Diploma | 687 (81.3%) | 158 (18.7%) |
| College/Associate Degree | 1,198 (72.2%) | 462 (27.8%) |
| Bachelor's Degree or higher | 732 (81.7%) | 164 (18.3%) |
Occupancy by Age of Householder in Pleasant Grove
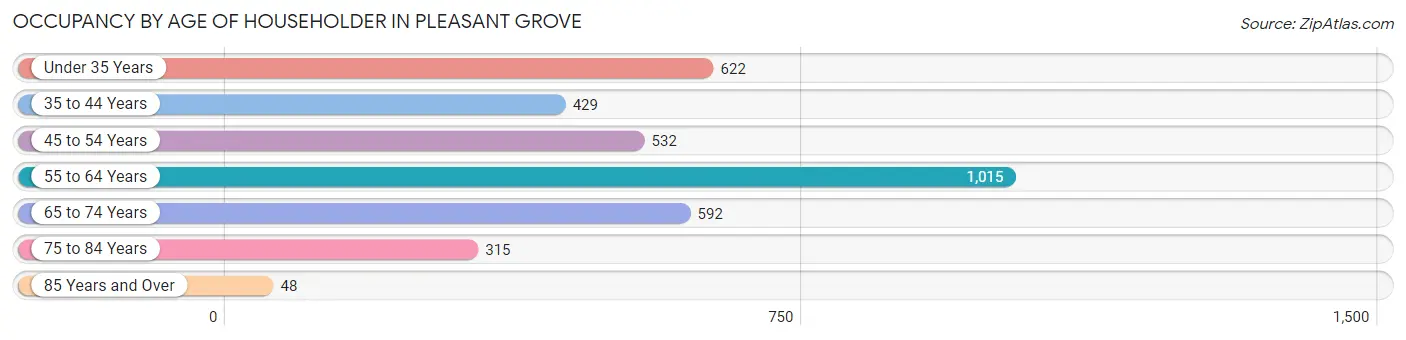
| Age Bracket | # Households | % Households |
| Under 35 Years | 622 | 17.5% |
| 35 to 44 Years | 429 | 12.1% |
| 45 to 54 Years | 532 | 15.0% |
| 55 to 64 Years | 1,015 | 28.6% |
| 65 to 74 Years | 592 | 16.7% |
| 75 to 84 Years | 315 | 8.9% |
| 85 Years and Over | 48 | 1.3% |
| Total | 3,553 | 100.0% |
Housing Finances in Pleasant Grove
Median Income by Occupancy in Pleasant Grove
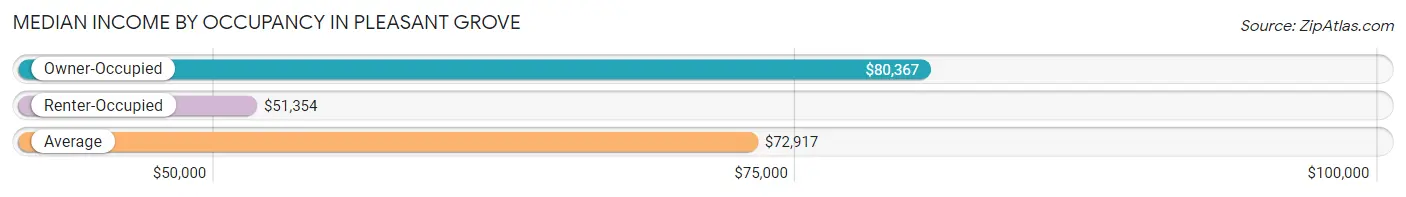
| Occupancy Type | # Households | Median Income |
| Owner-Occupied | 2,744 (77.2%) | $80,367 |
| Renter-Occupied | 809 (22.8%) | $51,354 |
| Average | 3,553 (100.0%) | $72,917 |
Occupancy by Householder Income Bracket in Pleasant Grove
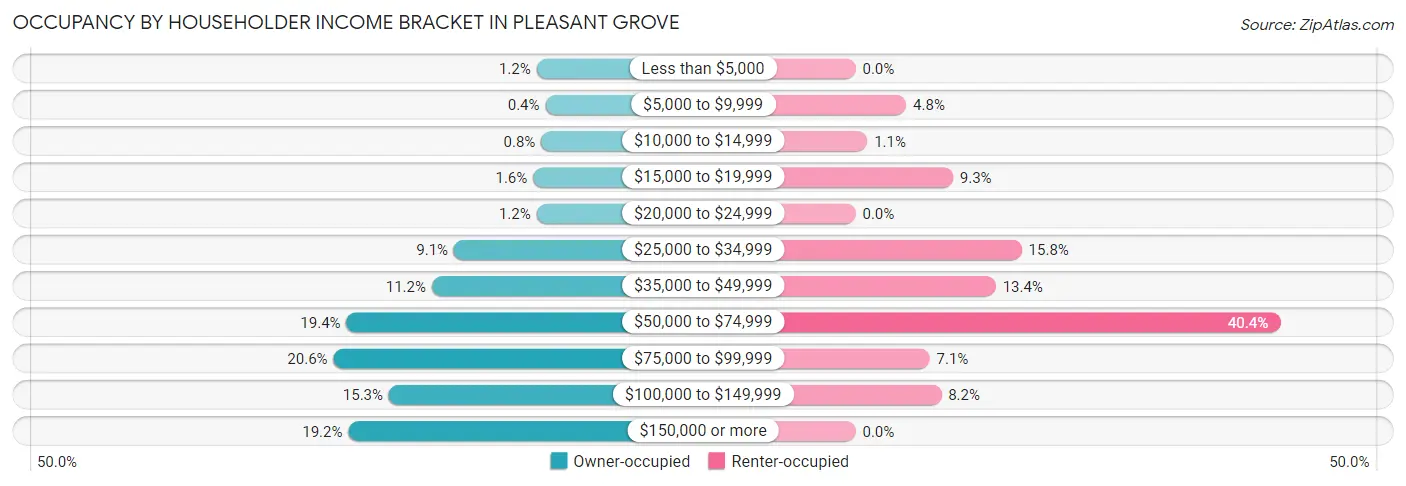
| Income Bracket | Owner-occupied | Renter-occupied |
| Less than $5,000 | 34 (1.2%) | 0 (0.0%) |
| $5,000 to $9,999 | 11 (0.4%) | 39 (4.8%) |
| $10,000 to $14,999 | 22 (0.8%) | 9 (1.1%) |
| $15,000 to $19,999 | 43 (1.6%) | 75 (9.3%) |
| $20,000 to $24,999 | 34 (1.2%) | 0 (0.0%) |
| $25,000 to $34,999 | 250 (9.1%) | 128 (15.8%) |
| $35,000 to $49,999 | 308 (11.2%) | 108 (13.4%) |
| $50,000 to $74,999 | 531 (19.4%) | 327 (40.4%) |
| $75,000 to $99,999 | 565 (20.6%) | 57 (7.0%) |
| $100,000 to $149,999 | 420 (15.3%) | 66 (8.2%) |
| $150,000 or more | 526 (19.2%) | 0 (0.0%) |
| Total | 2,744 (100.0%) | 809 (100.0%) |
Monthly Housing Cost Tiers in Pleasant Grove
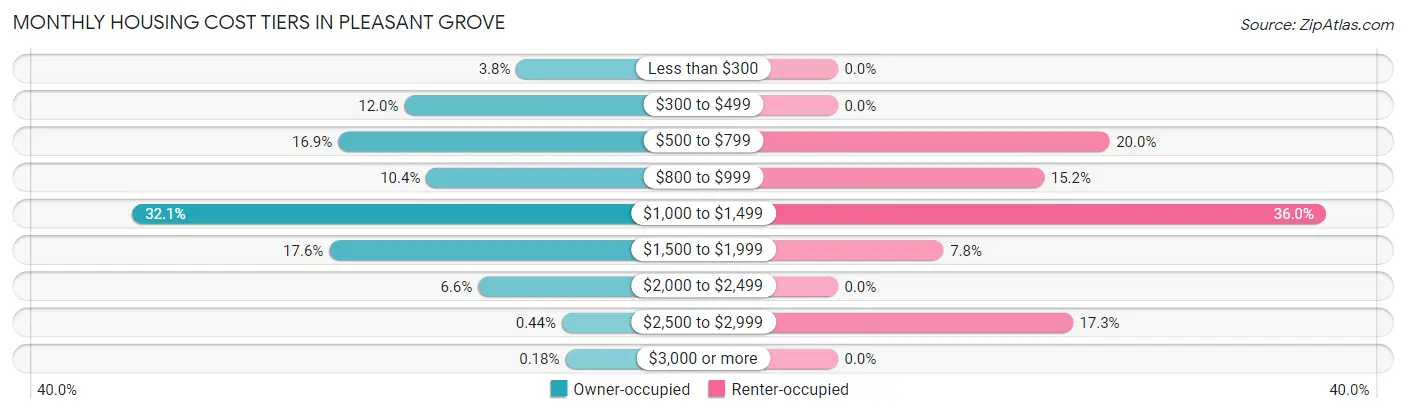
| Monthly Cost | Owner-occupied | Renter-occupied |
| Less than $300 | 104 (3.8%) | 0 (0.0%) |
| $300 to $499 | 330 (12.0%) | 0 (0.0%) |
| $500 to $799 | 464 (16.9%) | 162 (20.0%) |
| $800 to $999 | 286 (10.4%) | 123 (15.2%) |
| $1,000 to $1,499 | 880 (32.1%) | 291 (36.0%) |
| $1,500 to $1,999 | 482 (17.6%) | 63 (7.8%) |
| $2,000 to $2,499 | 181 (6.6%) | 0 (0.0%) |
| $2,500 to $2,999 | 12 (0.4%) | 140 (17.3%) |
| $3,000 or more | 5 (0.2%) | 0 (0.0%) |
| Total | 2,744 (100.0%) | 809 (100.0%) |
Physical Housing Characteristics in Pleasant Grove
Housing Structures in Pleasant Grove
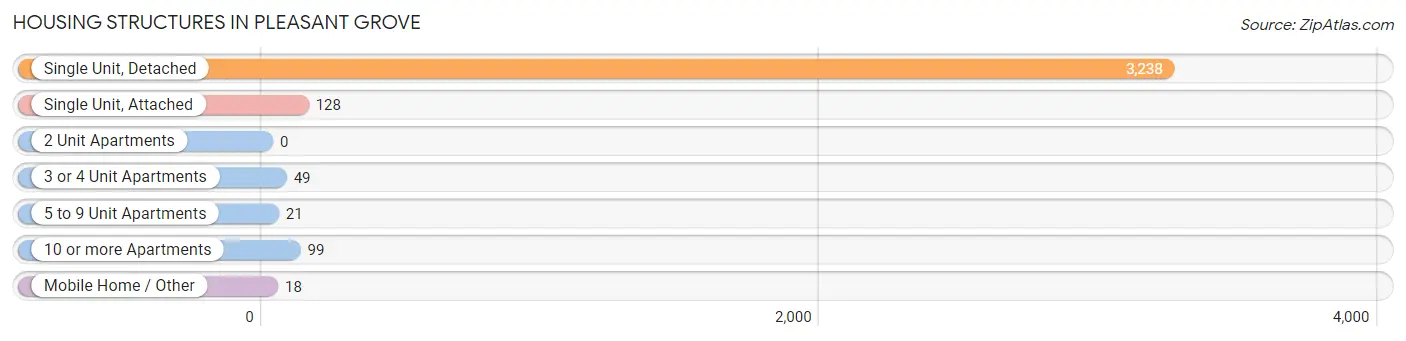
| Structure Type | # Housing Units | % Housing Units |
| Single Unit, Detached | 3,238 | 91.1% |
| Single Unit, Attached | 128 | 3.6% |
| 2 Unit Apartments | 0 | 0.0% |
| 3 or 4 Unit Apartments | 49 | 1.4% |
| 5 to 9 Unit Apartments | 21 | 0.6% |
| 10 or more Apartments | 99 | 2.8% |
| Mobile Home / Other | 18 | 0.5% |
| Total | 3,553 | 100.0% |
Housing Structures by Occupancy in Pleasant Grove
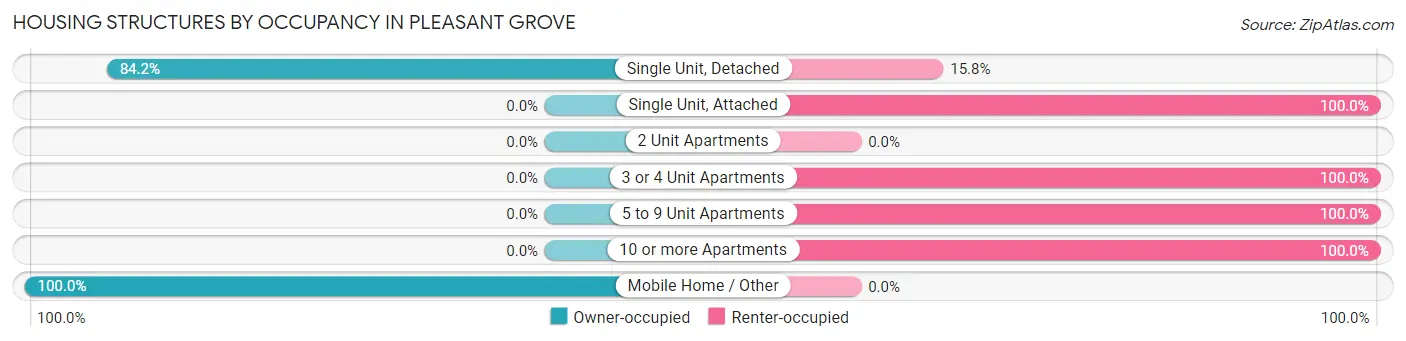
| Structure Type | Owner-occupied | Renter-occupied |
| Single Unit, Detached | 2,726 (84.2%) | 512 (15.8%) |
| Single Unit, Attached | 0 (0.0%) | 128 (100.0%) |
| 2 Unit Apartments | 0 (0.0%) | 0 (0.0%) |
| 3 or 4 Unit Apartments | 0 (0.0%) | 49 (100.0%) |
| 5 to 9 Unit Apartments | 0 (0.0%) | 21 (100.0%) |
| 10 or more Apartments | 0 (0.0%) | 99 (100.0%) |
| Mobile Home / Other | 18 (100.0%) | 0 (0.0%) |
| Total | 2,744 (77.2%) | 809 (22.8%) |
Housing Structures by Number of Rooms in Pleasant Grove
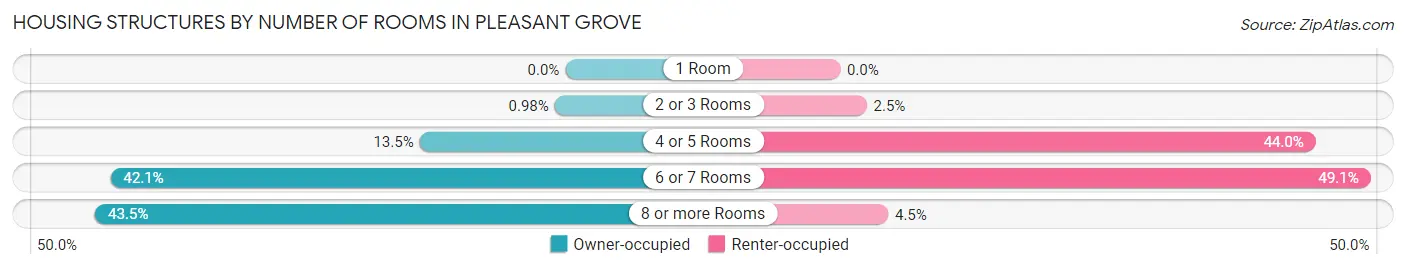
| Number of Rooms | Owner-occupied | Renter-occupied |
| 1 Room | 0 (0.0%) | 0 (0.0%) |
| 2 or 3 Rooms | 27 (1.0%) | 20 (2.5%) |
| 4 or 5 Rooms | 370 (13.5%) | 356 (44.0%) |
| 6 or 7 Rooms | 1,154 (42.1%) | 397 (49.1%) |
| 8 or more Rooms | 1,193 (43.5%) | 36 (4.4%) |
| Total | 2,744 (100.0%) | 809 (100.0%) |
Housing Structure by Heating Type in Pleasant Grove
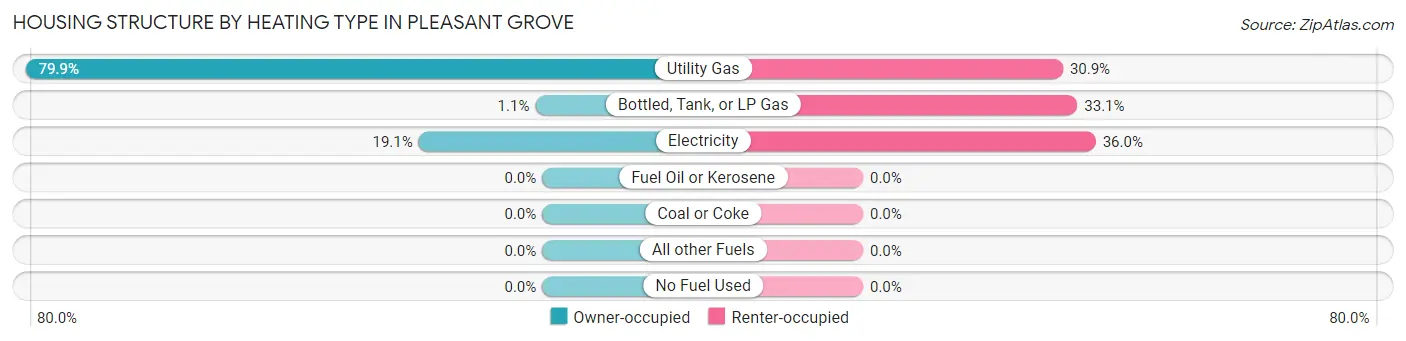
| Heating Type | Owner-occupied | Renter-occupied |
| Utility Gas | 2,191 (79.8%) | 250 (30.9%) |
| Bottled, Tank, or LP Gas | 29 (1.1%) | 268 (33.1%) |
| Electricity | 524 (19.1%) | 291 (36.0%) |
| Fuel Oil or Kerosene | 0 (0.0%) | 0 (0.0%) |
| Coal or Coke | 0 (0.0%) | 0 (0.0%) |
| All other Fuels | 0 (0.0%) | 0 (0.0%) |
| No Fuel Used | 0 (0.0%) | 0 (0.0%) |
| Total | 2,744 (100.0%) | 809 (100.0%) |
Household Vehicle Usage in Pleasant Grove
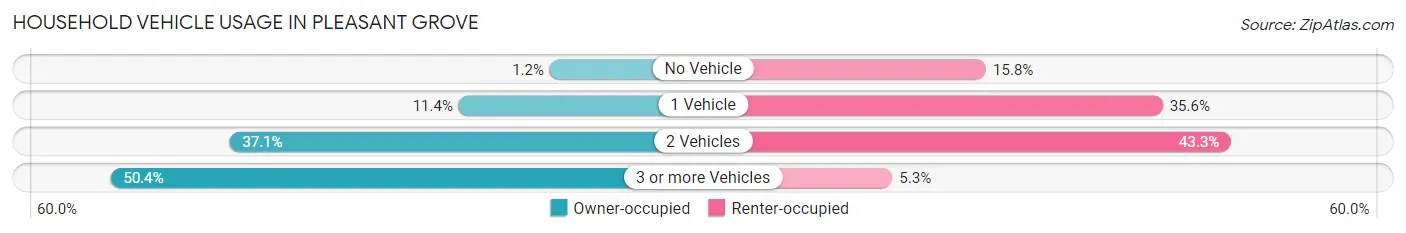
| Vehicles per Household | Owner-occupied | Renter-occupied |
| No Vehicle | 32 (1.2%) | 128 (15.8%) |
| 1 Vehicle | 312 (11.4%) | 288 (35.6%) |
| 2 Vehicles | 1,017 (37.1%) | 350 (43.3%) |
| 3 or more Vehicles | 1,383 (50.4%) | 43 (5.3%) |
| Total | 2,744 (100.0%) | 809 (100.0%) |
Real Estate & Mortgages in Pleasant Grove
Real Estate and Mortgage Overview in Pleasant Grove
| Characteristic | Without Mortgage | With Mortgage |
| Housing Units | 891 | 1,853 |
| Median Property Value | $145,900 | $182,700 |
| Median Household Income | $84,632 | $414 |
| Monthly Housing Costs | $504 | $5 |
| Real Estate Taxes | $1,253 | $227 |
Property Value by Mortgage Status in Pleasant Grove
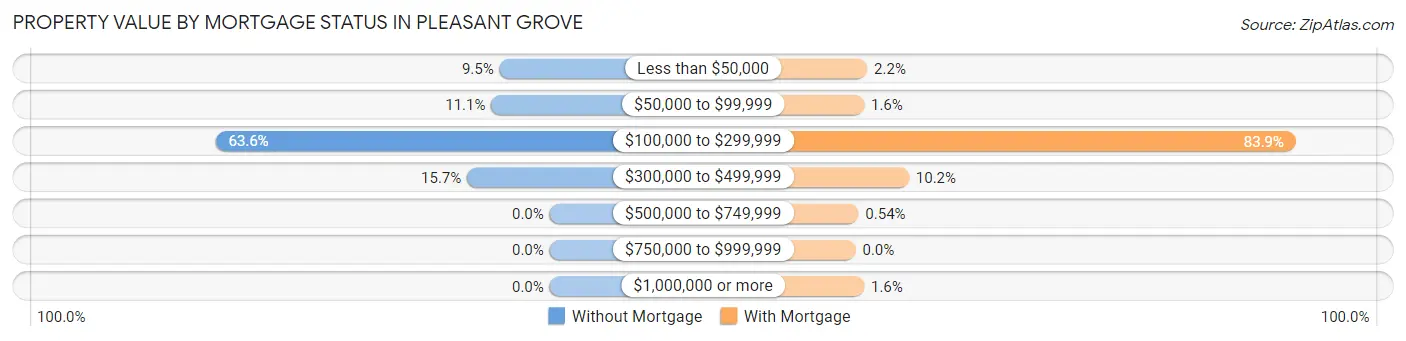
| Property Value | Without Mortgage | With Mortgage |
| Less than $50,000 | 85 (9.5%) | 41 (2.2%) |
| $50,000 to $99,999 | 99 (11.1%) | 30 (1.6%) |
| $100,000 to $299,999 | 567 (63.6%) | 1,554 (83.9%) |
| $300,000 to $499,999 | 140 (15.7%) | 188 (10.2%) |
| $500,000 to $749,999 | 0 (0.0%) | 10 (0.5%) |
| $750,000 to $999,999 | 0 (0.0%) | 0 (0.0%) |
| $1,000,000 or more | 0 (0.0%) | 30 (1.6%) |
| Total | 891 (100.0%) | 1,853 (100.0%) |
Household Income by Mortgage Status in Pleasant Grove
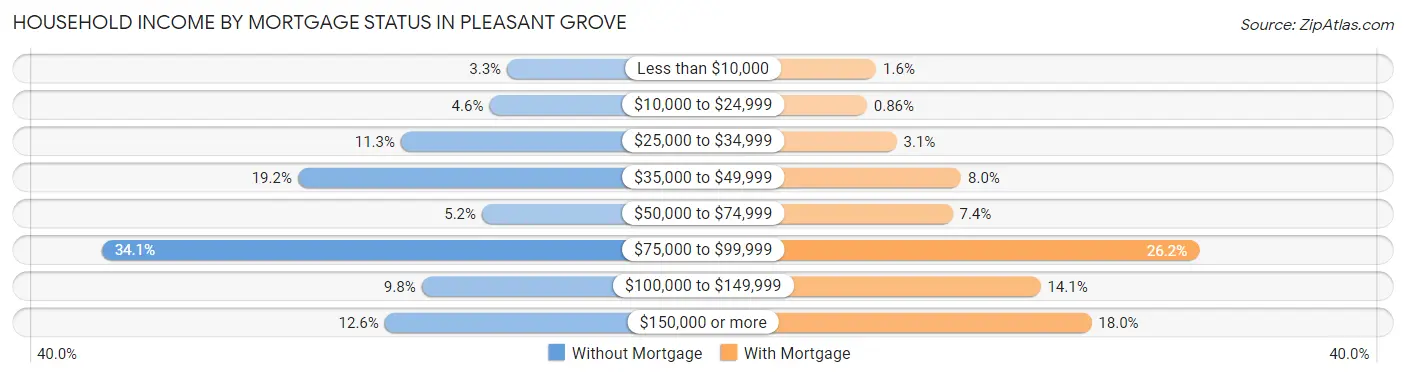
| Household Income | Without Mortgage | With Mortgage |
| Less than $10,000 | 29 (3.3%) | 29 (1.6%) |
| $10,000 to $24,999 | 41 (4.6%) | 16 (0.9%) |
| $25,000 to $34,999 | 101 (11.3%) | 58 (3.1%) |
| $35,000 to $49,999 | 171 (19.2%) | 149 (8.0%) |
| $50,000 to $74,999 | 46 (5.2%) | 137 (7.4%) |
| $75,000 to $99,999 | 304 (34.1%) | 485 (26.2%) |
| $100,000 to $149,999 | 87 (9.8%) | 261 (14.1%) |
| $150,000 or more | 112 (12.6%) | 333 (18.0%) |
| Total | 891 (100.0%) | 1,853 (100.0%) |
Property Value to Household Income Ratio in Pleasant Grove
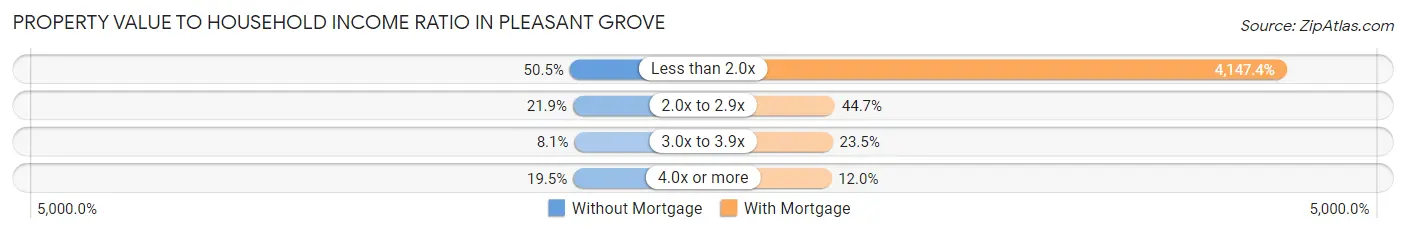
| Value-to-Income Ratio | Without Mortgage | With Mortgage |
| Less than 2.0x | 450 (50.5%) | 76,852 (4,147.4%) |
| 2.0x to 2.9x | 195 (21.9%) | 829 (44.7%) |
| 3.0x to 3.9x | 72 (8.1%) | 435 (23.5%) |
| 4.0x or more | 174 (19.5%) | 223 (12.0%) |
| Total | 891 (100.0%) | 1,853 (100.0%) |
Real Estate Taxes by Mortgage Status in Pleasant Grove
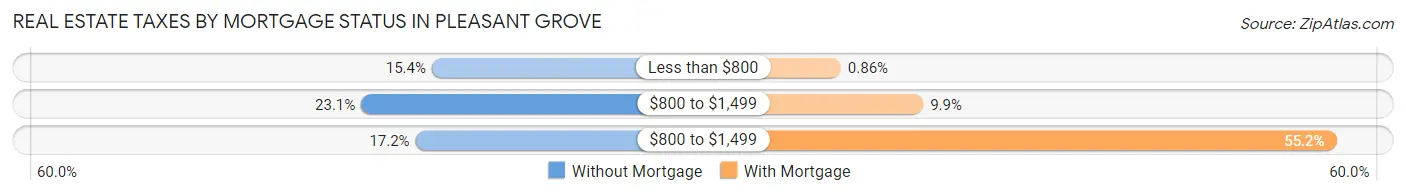
| Property Taxes | Without Mortgage | With Mortgage |
| Less than $800 | 137 (15.4%) | 16 (0.9%) |
| $800 to $1,499 | 206 (23.1%) | 183 (9.9%) |
| $800 to $1,499 | 153 (17.2%) | 1,022 (55.1%) |
| Total | 891 (100.0%) | 1,853 (100.0%) |
Health & Disability in Pleasant Grove
Health Insurance Coverage by Age in Pleasant Grove
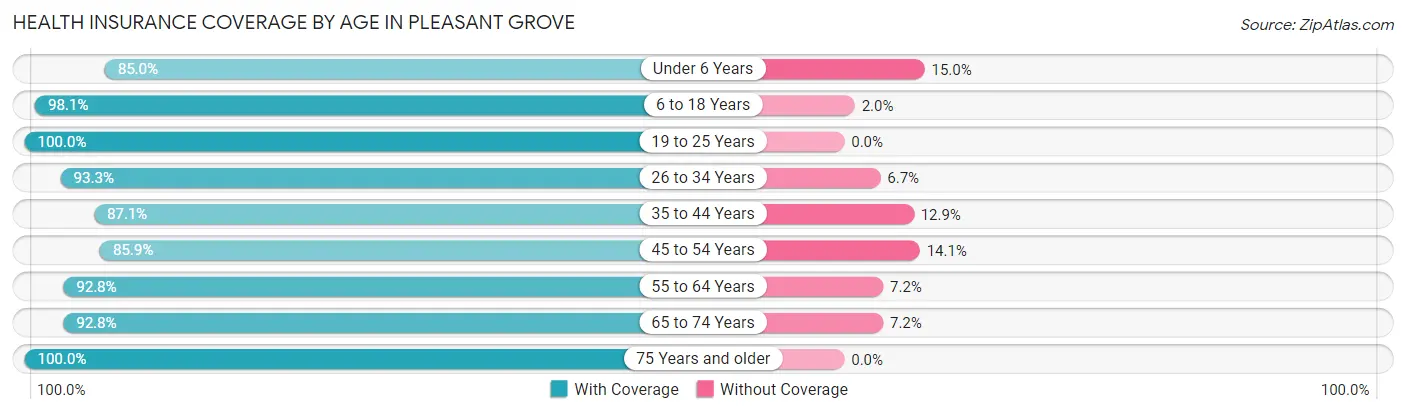
| Age Bracket | With Coverage | Without Coverage |
| Under 6 Years | 233 (85.0%) | 41 (15.0%) |
| 6 to 18 Years | 1,612 (98.1%) | 32 (1.9%) |
| 19 to 25 Years | 947 (100.0%) | 0 (0.0%) |
| 26 to 34 Years | 887 (93.3%) | 64 (6.7%) |
| 35 to 44 Years | 915 (87.1%) | 136 (12.9%) |
| 45 to 54 Years | 1,137 (85.9%) | 186 (14.1%) |
| 55 to 64 Years | 1,372 (92.8%) | 107 (7.2%) |
| 65 to 74 Years | 976 (92.8%) | 76 (7.2%) |
| 75 Years and older | 594 (100.0%) | 0 (0.0%) |
| Total | 8,673 (93.1%) | 642 (6.9%) |
Health Insurance Coverage by Citizenship Status in Pleasant Grove
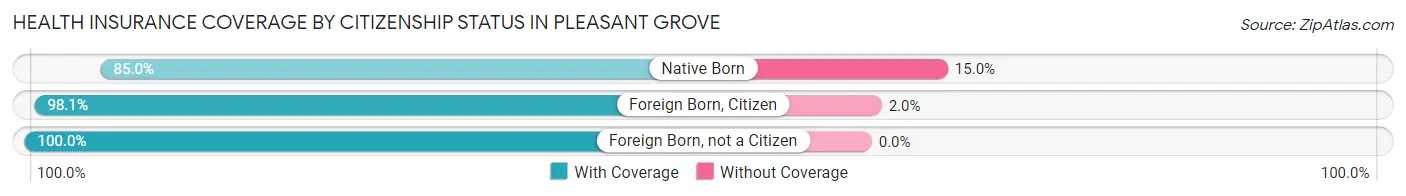
| Citizenship Status | With Coverage | Without Coverage |
| Native Born | 233 (85.0%) | 41 (15.0%) |
| Foreign Born, Citizen | 1,612 (98.1%) | 32 (1.9%) |
| Foreign Born, not a Citizen | 947 (100.0%) | 0 (0.0%) |
Health Insurance Coverage by Household Income in Pleasant Grove
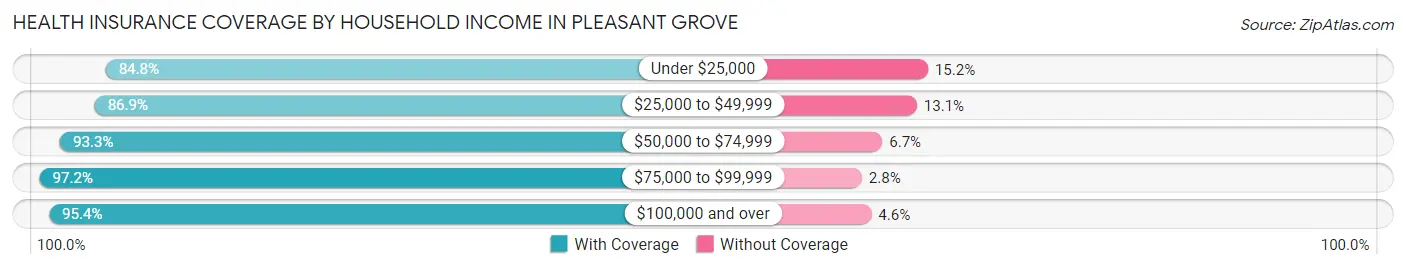
| Household Income | With Coverage | Without Coverage |
| Under $25,000 | 474 (84.8%) | 85 (15.2%) |
| $25,000 to $49,999 | 1,474 (86.9%) | 223 (13.1%) |
| $50,000 to $74,999 | 1,807 (93.3%) | 129 (6.7%) |
| $75,000 to $99,999 | 1,714 (97.2%) | 50 (2.8%) |
| $100,000 and over | 3,204 (95.4%) | 155 (4.6%) |
Public vs Private Health Insurance Coverage by Age in Pleasant Grove
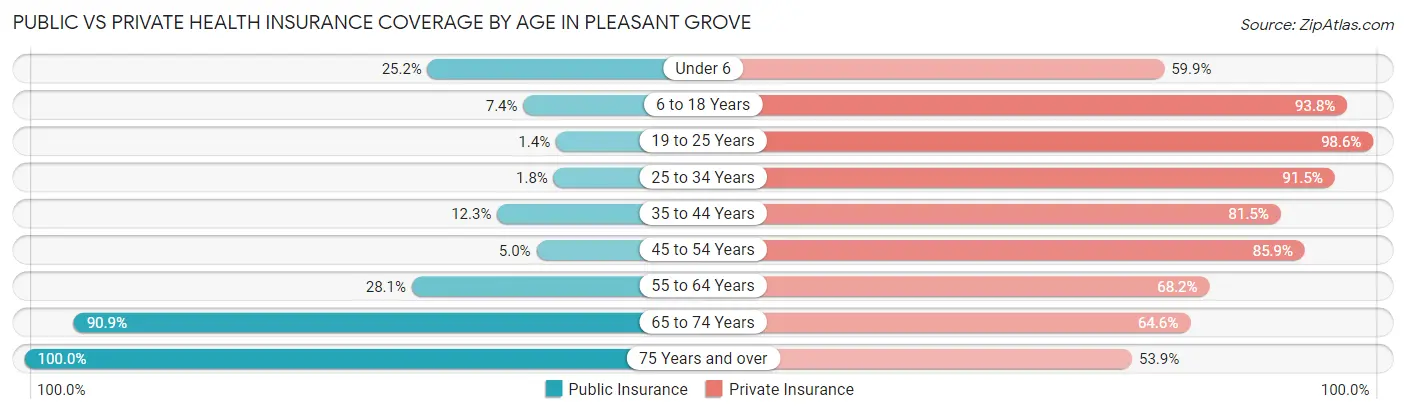
| Age Bracket | Public Insurance | Private Insurance |
| Under 6 | 69 (25.2%) | 164 (59.9%) |
| 6 to 18 Years | 122 (7.4%) | 1,542 (93.8%) |
| 19 to 25 Years | 13 (1.4%) | 934 (98.6%) |
| 25 to 34 Years | 17 (1.8%) | 870 (91.5%) |
| 35 to 44 Years | 129 (12.3%) | 856 (81.5%) |
| 45 to 54 Years | 66 (5.0%) | 1,137 (85.9%) |
| 55 to 64 Years | 416 (28.1%) | 1,009 (68.2%) |
| 65 to 74 Years | 956 (90.9%) | 680 (64.6%) |
| 75 Years and over | 594 (100.0%) | 320 (53.9%) |
| Total | 2,382 (25.6%) | 7,512 (80.6%) |
Disability Status by Sex by Age in Pleasant Grove
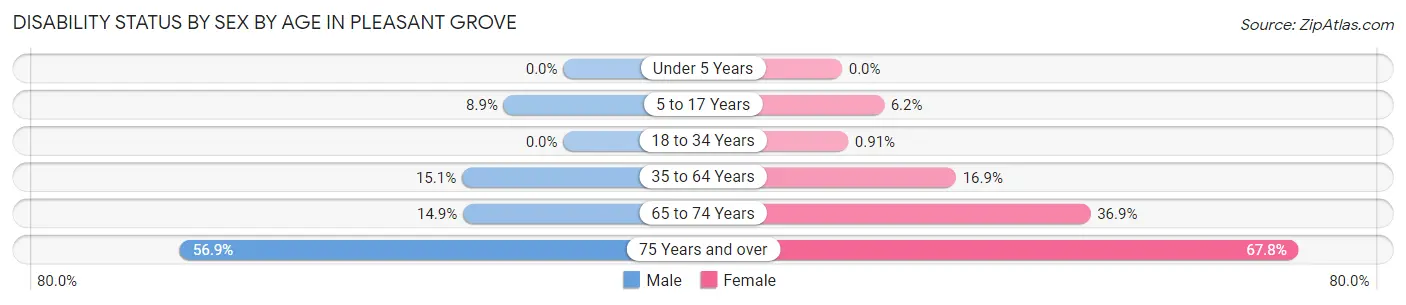
| Age Bracket | Male | Female |
| Under 5 Years | 0 (0.0%) | 0 (0.0%) |
| 5 to 17 Years | 68 (8.8%) | 43 (6.2%) |
| 18 to 34 Years | 0 (0.0%) | 9 (0.9%) |
| 35 to 64 Years | 257 (15.0%) | 363 (16.9%) |
| 65 to 74 Years | 59 (14.9%) | 242 (36.9%) |
| 75 Years and over | 156 (56.9%) | 217 (67.8%) |
Disability Class by Sex by Age in Pleasant Grove
Disability Class: Hearing Difficulty
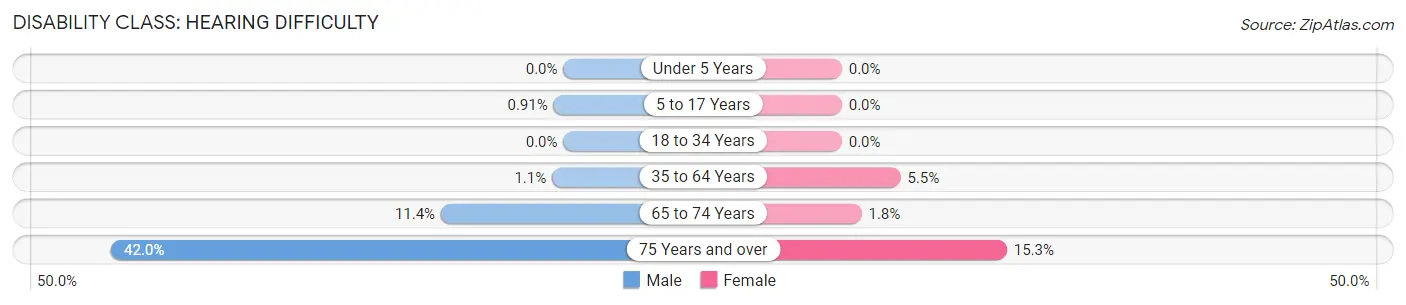
| Age Bracket | Male | Female |
| Under 5 Years | 0 (0.0%) | 0 (0.0%) |
| 5 to 17 Years | 7 (0.9%) | 0 (0.0%) |
| 18 to 34 Years | 0 (0.0%) | 0 (0.0%) |
| 35 to 64 Years | 18 (1.1%) | 117 (5.4%) |
| 65 to 74 Years | 45 (11.4%) | 12 (1.8%) |
| 75 Years and over | 115 (42.0%) | 49 (15.3%) |
Disability Class: Vision Difficulty
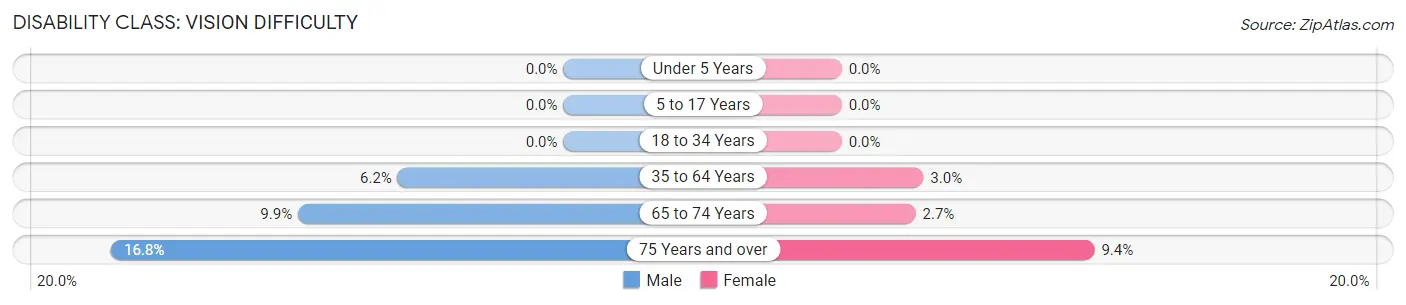
| Age Bracket | Male | Female |
| Under 5 Years | 0 (0.0%) | 0 (0.0%) |
| 5 to 17 Years | 0 (0.0%) | 0 (0.0%) |
| 18 to 34 Years | 0 (0.0%) | 0 (0.0%) |
| 35 to 64 Years | 105 (6.1%) | 65 (3.0%) |
| 65 to 74 Years | 39 (9.9%) | 18 (2.7%) |
| 75 Years and over | 46 (16.8%) | 30 (9.4%) |
Disability Class: Cognitive Difficulty
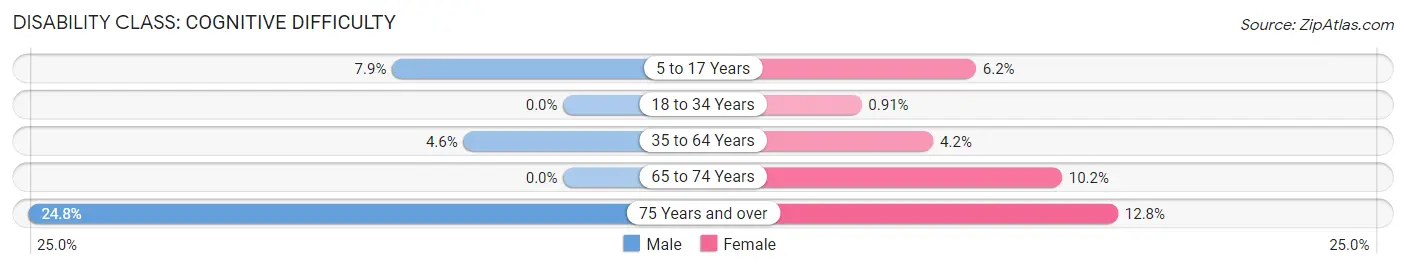
| Age Bracket | Male | Female |
| 5 to 17 Years | 61 (7.9%) | 43 (6.2%) |
| 18 to 34 Years | 0 (0.0%) | 9 (0.9%) |
| 35 to 64 Years | 79 (4.6%) | 91 (4.2%) |
| 65 to 74 Years | 0 (0.0%) | 67 (10.2%) |
| 75 Years and over | 68 (24.8%) | 41 (12.8%) |
Disability Class: Ambulatory Difficulty
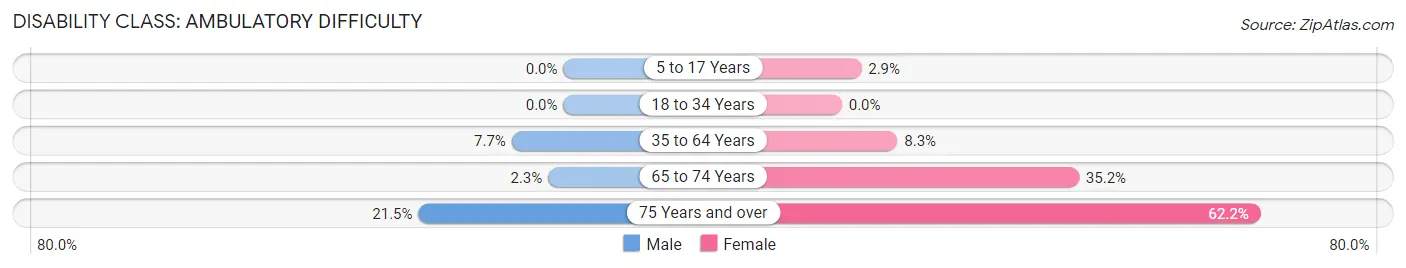
| Age Bracket | Male | Female |
| 5 to 17 Years | 0 (0.0%) | 20 (2.9%) |
| 18 to 34 Years | 0 (0.0%) | 0 (0.0%) |
| 35 to 64 Years | 131 (7.7%) | 177 (8.3%) |
| 65 to 74 Years | 9 (2.3%) | 231 (35.2%) |
| 75 Years and over | 59 (21.5%) | 199 (62.2%) |
Disability Class: Self-Care Difficulty
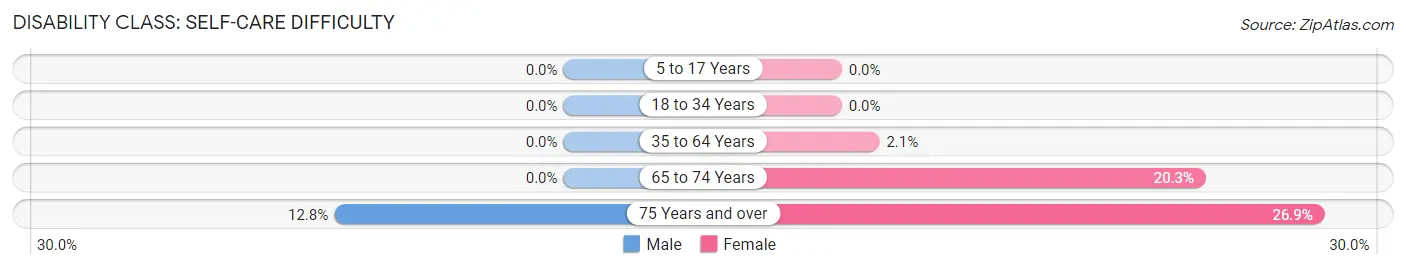
| Age Bracket | Male | Female |
| 5 to 17 Years | 0 (0.0%) | 0 (0.0%) |
| 18 to 34 Years | 0 (0.0%) | 0 (0.0%) |
| 35 to 64 Years | 0 (0.0%) | 45 (2.1%) |
| 65 to 74 Years | 0 (0.0%) | 133 (20.3%) |
| 75 Years and over | 35 (12.8%) | 86 (26.9%) |
Technology Access in Pleasant Grove
Computing Device Access in Pleasant Grove
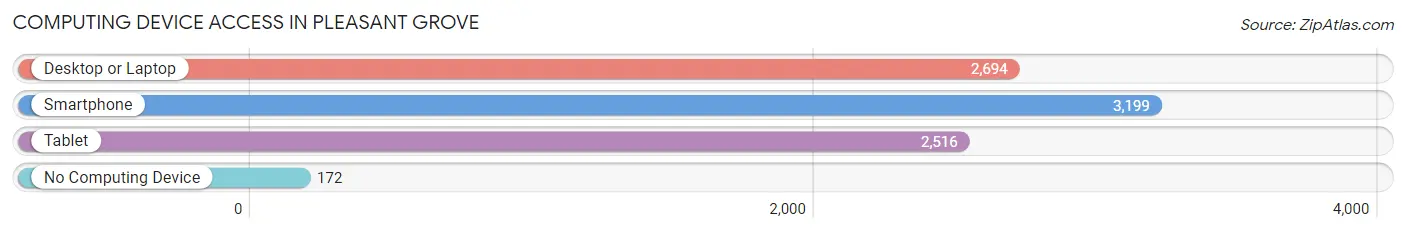
| Device Type | # Households | % Households |
| Desktop or Laptop | 2,694 | 75.8% |
| Smartphone | 3,199 | 90.0% |
| Tablet | 2,516 | 70.8% |
| No Computing Device | 172 | 4.8% |
| Total | 3,553 | 100.0% |
Internet Access in Pleasant Grove
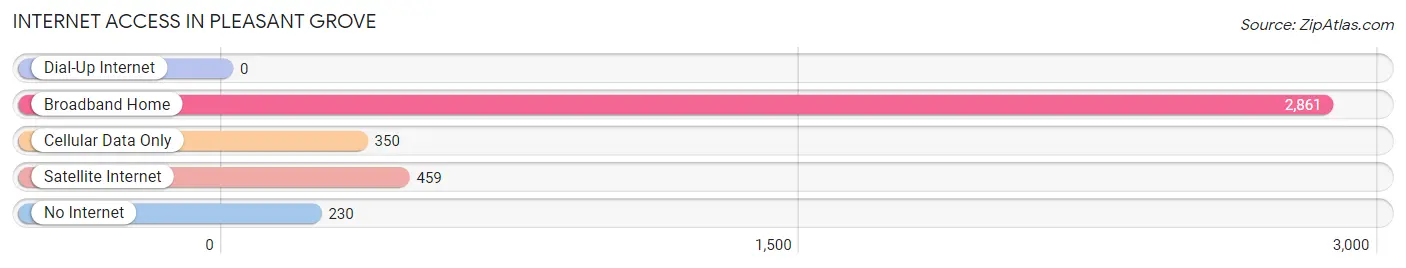
| Internet Type | # Households | % Households |
| Dial-Up Internet | 0 | 0.0% |
| Broadband Home | 2,861 | 80.5% |
| Cellular Data Only | 350 | 9.9% |
| Satellite Internet | 459 | 12.9% |
| No Internet | 230 | 6.5% |
| Total | 3,553 | 100.0% |
Pleasant Grove Summary
Pleasant Grove, Alabama is a small city located in the northern part of Jefferson County, Alabama. It is part of the Birmingham-Hoover Metropolitan Statistical Area. The city has a population of 10,110 as of the 2010 census.
History
Pleasant Grove was founded in 1887 by a group of settlers from Georgia. The city was named after the pleasant grove of trees that the settlers found when they arrived. The city was incorporated in 1901.
In the early 1900s, Pleasant Grove was a small farming community. The city was home to several cotton gins and a sawmill. The city also had a post office, a general store, and a few churches.
In the 1950s, the city began to grow as the Birmingham metropolitan area expanded. The city was annexed by the city of Birmingham in 1952.
Geography
Pleasant Grove is located in northern Jefferson County, Alabama. It is situated at the intersection of Interstate 65 and U.S. Highway 31. The city is located about 15 miles north of downtown Birmingham.
The city has a total area of 4.2 square miles, all of which is land. The city is located in the foothills of the Appalachian Mountains. The terrain is mostly hilly and wooded.
Economy
The economy of Pleasant Grove is largely based on manufacturing and retail. The city is home to several manufacturing plants, including a steel mill and a paper mill. The city also has several retail stores, including a Walmart Supercenter.
The city is also home to several medical facilities including a hospital and several clinics
Demographics
As of the 2010 census, the population of Pleasant Grove was 10,110. The racial makeup of the city was 79.3% White, 16.2% African American, 0.4% Native American, 0.7% Asian, 0.1% Pacific Islander, 1.3% from other races, and 2.0% from two or more races. Hispanic or Latino of any race were 3.2% of the population.
The median income for a household in the city was $37,917, and the median income for a family was $45,938. The per capita income for the city was $18,945. About 16.2% of families and 19.2% of the population were below the poverty line, including 28.2% of those under age 18 and 11.2% of those age 65 or over.
Common Questions
What is Per Capita Income in Pleasant Grove?
Per Capita income in Pleasant Grove is $33,206.
What is the Median Family Income in Pleasant Grove?
Median Family Income in Pleasant Grove is $76,297.
What is the Median Household income in Pleasant Grove?
Median Household Income in Pleasant Grove is $72,917.
What is Income or Wage Gap in Pleasant Grove?
Income or Wage Gap in Pleasant Grove is 2.6%.
Women in Pleasant Grove earn 97.4 cents for every dollar earned by a man.
What is Inequality or Gini Index in Pleasant Grove?
Inequality or Gini Index in Pleasant Grove is 0.36.
What is the Total Population of Pleasant Grove?
Total Population of Pleasant Grove is 9,549.
What is the Total Male Population of Pleasant Grove?
Total Male Population of Pleasant Grove is 4,532.
What is the Total Female Population of Pleasant Grove?
Total Female Population of Pleasant Grove is 5,017.
What is the Ratio of Males per 100 Females in Pleasant Grove?
There are 90.33 Males per 100 Females in Pleasant Grove.
What is the Ratio of Females per 100 Males in Pleasant Grove?
There are 110.70 Females per 100 Males in Pleasant Grove.
What is the Median Population Age in Pleasant Grove?
Median Population Age in Pleasant Grove is 43.8 Years.
What is the Average Family Size in Pleasant Grove
Average Family Size in Pleasant Grove is 3.0 People.
What is the Average Household Size in Pleasant Grove
Average Household Size in Pleasant Grove is 2.6 People.
How Large is the Labor Force in Pleasant Grove?
There are 5,087 People in the Labor Forcein in Pleasant Grove.
What is the Percentage of People in the Labor Force in Pleasant Grove?
61.5% of People are in the Labor Force in Pleasant Grove.
What is the Unemployment Rate in Pleasant Grove?
Unemployment Rate in Pleasant Grove is 4.6%.