Athens, OH Map & Demographics
Athens Map
Athens Overview
$22,737
PER CAPITA INCOME
$104,432
AVG FAMILY INCOME
$34,493
AVG HOUSEHOLD INCOME
40.2%
WAGE / INCOME GAP [ % ]
59.8¢/ $1
WAGE / INCOME GAP [ $ ]
$18,466
FAMILY INCOME DEFICIT
0.60
INEQUALITY / GINI INDEX
22,698
TOTAL POPULATION
11,214
MALE POPULATION
11,484
FEMALE POPULATION
97.65
MALES / 100 FEMALES
102.41
FEMALES / 100 MALES
21.9
MEDIAN AGE
3.0
AVG FAMILY SIZE
2.4
AVG HOUSEHOLD SIZE
12,262
LABOR FORCE [ PEOPLE ]
57.7%
PERCENT IN LABOR FORCE
7.5%
UNEMPLOYMENT RATE
Athens Zip Codes
Athens Area Codes
Income in Athens
Income Overview in Athens
Per Capita Income in Athens is $22,737, while median incomes of families and households are $104,432 and $34,493 respectively.
| Characteristic | Number | Measure |
| Per Capita Income | 22,698 | $22,737 |
| Median Family Income | 1,965 | $104,432 |
| Mean Family Income | 1,965 | $130,544 |
| Median Household Income | 6,595 | $34,493 |
| Mean Household Income | 6,595 | $67,975 |
| Income Deficit | 1,965 | $18,466 |
| Wage / Income Gap (%) | 22,698 | 40.17% |
| Wage / Income Gap ($) | 22,698 | 59.83¢ per $1 |
| Gini / Inequality Index | 22,698 | 0.60 |
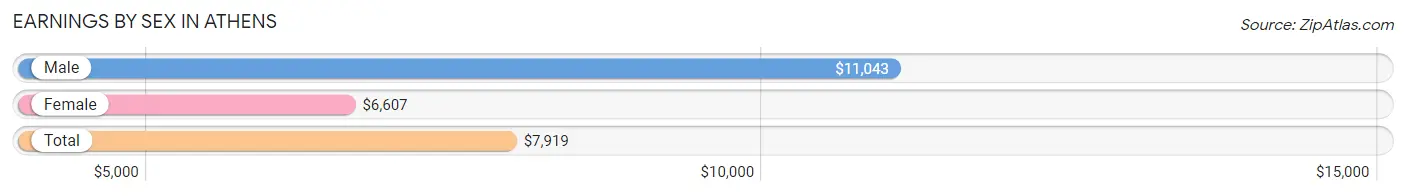
Earnings by Sex in Athens
Average Earnings in Athens are $7,919, $11,043 for men and $6,607 for women, a difference of 40.2%.
| Sex | Number | Average Earnings |
| Male | 8,120 (49.0%) | $11,043 |
| Female | 8,465 (51.0%) | $6,607 |
| Total | 16,585 (100.0%) | $7,919 |
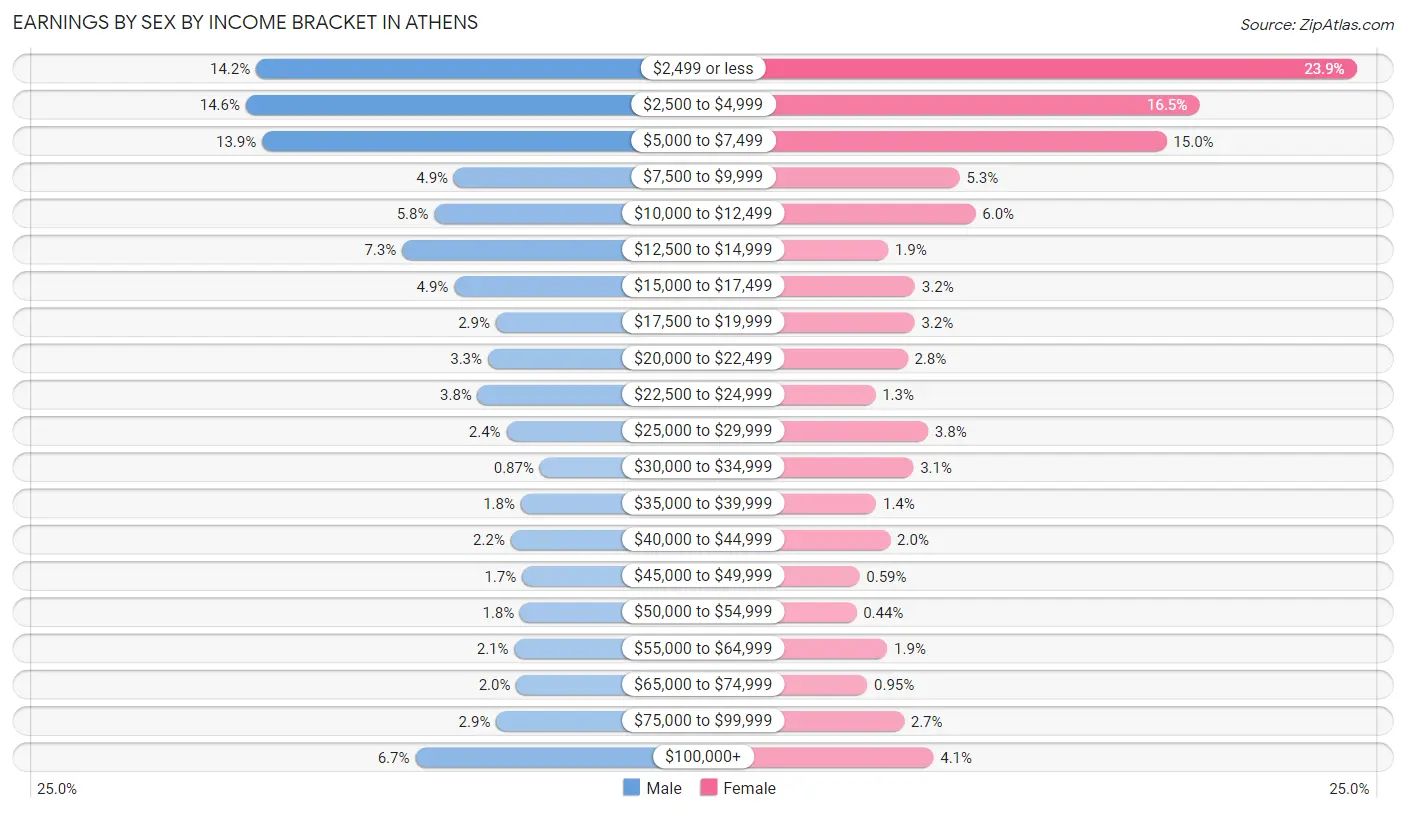
Earnings by Sex by Income Bracket in Athens
The most common earnings brackets in Athens are $2,500 to $4,999 for men (1,189 | 14.6%) and $2,499 or less for women (2,021 | 23.9%).
| Income | Male | Female |
| $2,499 or less | 1,150 (14.2%) | 2,021 (23.9%) |
| $2,500 to $4,999 | 1,189 (14.6%) | 1,397 (16.5%) |
| $5,000 to $7,499 | 1,127 (13.9%) | 1,267 (15.0%) |
| $7,500 to $9,999 | 397 (4.9%) | 447 (5.3%) |
| $10,000 to $12,499 | 472 (5.8%) | 510 (6.0%) |
| $12,500 to $14,999 | 594 (7.3%) | 163 (1.9%) |
| $15,000 to $17,499 | 396 (4.9%) | 270 (3.2%) |
| $17,500 to $19,999 | 238 (2.9%) | 268 (3.2%) |
| $20,000 to $22,499 | 268 (3.3%) | 240 (2.8%) |
| $22,500 to $24,999 | 307 (3.8%) | 113 (1.3%) |
| $25,000 to $29,999 | 197 (2.4%) | 322 (3.8%) |
| $30,000 to $34,999 | 71 (0.9%) | 263 (3.1%) |
| $35,000 to $39,999 | 143 (1.8%) | 116 (1.4%) |
| $40,000 to $44,999 | 181 (2.2%) | 172 (2.0%) |
| $45,000 to $49,999 | 138 (1.7%) | 50 (0.6%) |
| $50,000 to $54,999 | 145 (1.8%) | 37 (0.4%) |
| $55,000 to $64,999 | 167 (2.1%) | 160 (1.9%) |
| $65,000 to $74,999 | 160 (2.0%) | 80 (0.9%) |
| $75,000 to $99,999 | 236 (2.9%) | 226 (2.7%) |
| $100,000+ | 544 (6.7%) | 343 (4.1%) |
| Total | 8,120 (100.0%) | 8,465 (100.0%) |
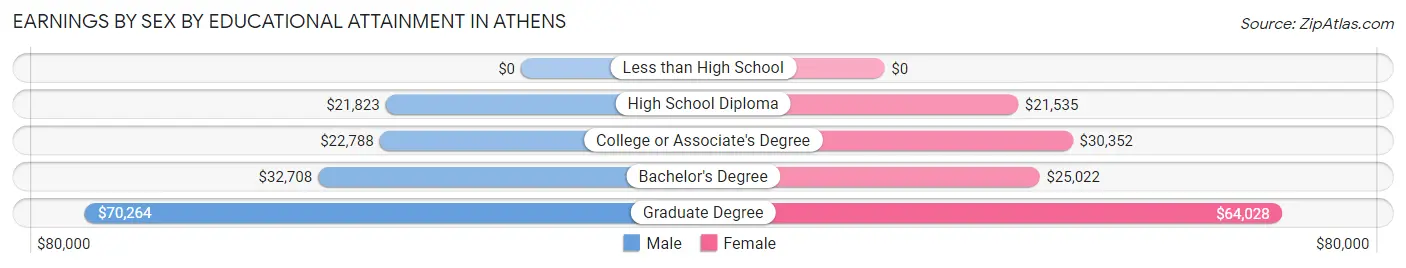
Earnings by Sex by Educational Attainment in Athens
Average earnings in Athens are $40,393 for men and $29,754 for women, a difference of 26.3%. Men with an educational attainment of graduate degree enjoy the highest average annual earnings of $70,264, while those with high school diploma education earn the least with $21,823. Women with an educational attainment of graduate degree earn the most with the average annual earnings of $64,028, while those with high school diploma education have the smallest earnings of $21,535.
| Educational Attainment | Male Income | Female Income |
| Less than High School | - | - |
| High School Diploma | $21,823 | $21,535 |
| College or Associate's Degree | $22,788 | $30,352 |
| Bachelor's Degree | $32,708 | $25,022 |
| Graduate Degree | $70,264 | $64,028 |
| Total | $40,393 | $29,754 |
Family Income in Athens
Family Income Brackets in Athens
According to the Athens family income data, there are 446 families falling into the $100,000 to $149,999 income range, which is the most common income bracket and makes up 22.7% of all families. Conversely, the $25,000 to $34,999 income bracket is the least frequent group with only 20 families (1.0%) belonging to this category.
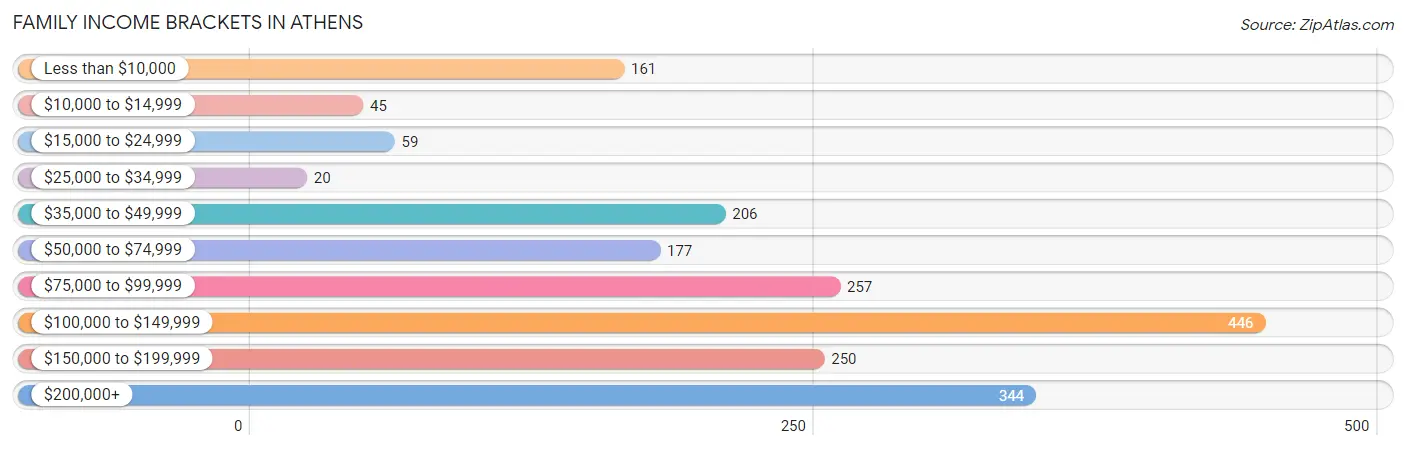
| Income Bracket | # Families | % Families |
| Less than $10,000 | 161 | 8.2% |
| $10,000 to $14,999 | 45 | 2.3% |
| $15,000 to $24,999 | 59 | 3.0% |
| $25,000 to $34,999 | 20 | 1.0% |
| $35,000 to $49,999 | 206 | 10.5% |
| $50,000 to $74,999 | 177 | 9.0% |
| $75,000 to $99,999 | 257 | 13.1% |
| $100,000 to $149,999 | 446 | 22.7% |
| $150,000 to $199,999 | 250 | 12.7% |
| $200,000+ | 344 | 17.5% |
Family Income by Famaliy Size in Athens
4-person families (299 | 15.2%) account for the highest median family income in Athens with $118,831 per family, while 2-person families (954 | 48.5%) have the highest median income of $46,389 per family member.
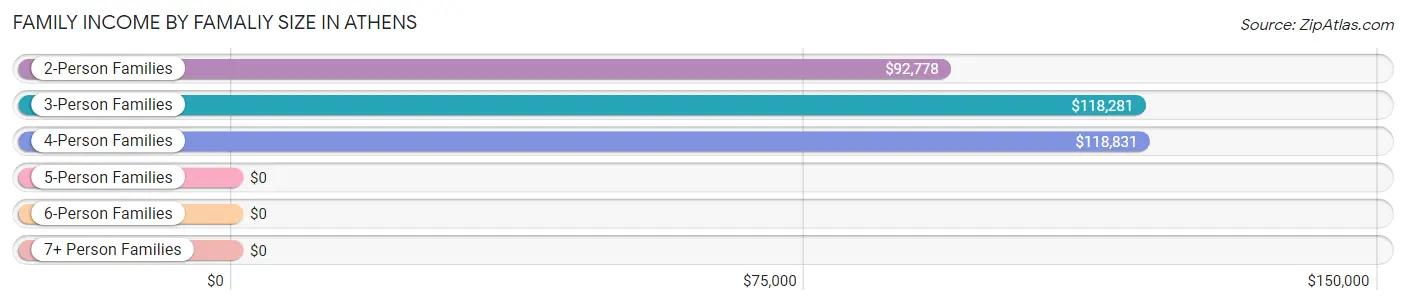
| Income Bracket | # Families | Median Income |
| 2-Person Families | 954 (48.5%) | $92,778 |
| 3-Person Families | 584 (29.7%) | $118,281 |
| 4-Person Families | 299 (15.2%) | $118,831 |
| 5-Person Families | 128 (6.5%) | $0 |
| 6-Person Families | 0 (0.0%) | $0 |
| 7+ Person Families | 0 (0.0%) | $0 |
| Total | 1,965 (100.0%) | $104,432 |
Family Income by Number of Earners in Athens
The median family income in Athens is $104,432, with families comprising 3+ earners (155) having the highest median family income of $175,417, while families with no earners (311) have the lowest median family income of $41,573, accounting for 7.9% and 15.8% of families, respectively.
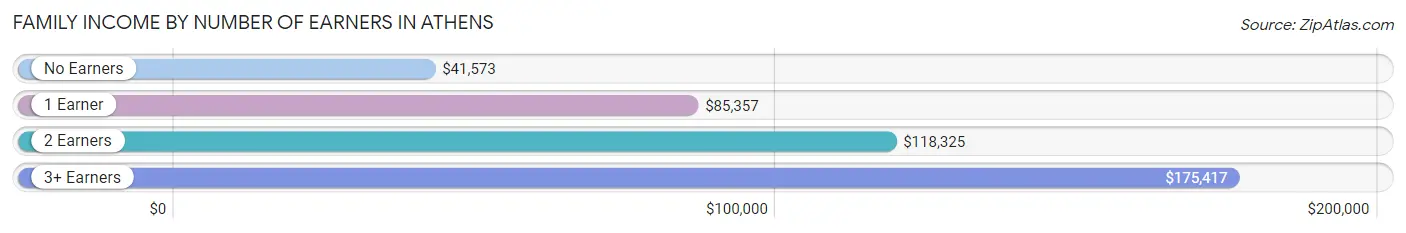
| Number of Earners | # Families | Median Income |
| No Earners | 311 (15.8%) | $41,573 |
| 1 Earner | 564 (28.7%) | $85,357 |
| 2 Earners | 935 (47.6%) | $118,325 |
| 3+ Earners | 155 (7.9%) | $175,417 |
| Total | 1,965 (100.0%) | $104,432 |
Household Income in Athens
Household Income Brackets in Athens
With 1,134 households falling in the category, the less than $10,000 income range is the most frequent in Athens, accounting for 17.2% of all households. In contrast, only 323 households (4.9%) fall into the $150,000 to $199,999 income bracket, making it the least populous group.
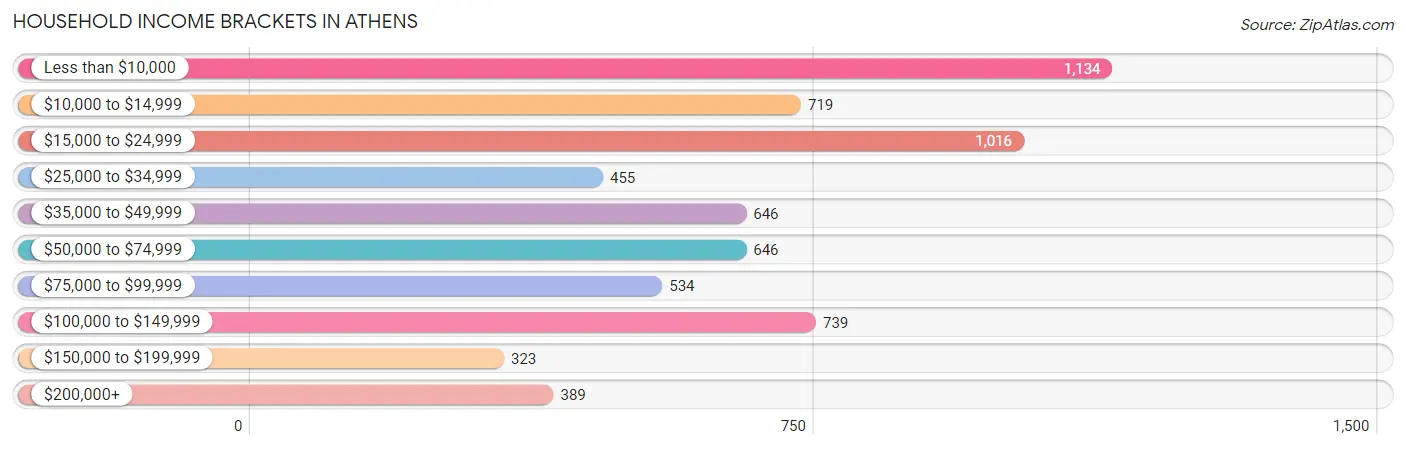
| Income Bracket | # Households | % Households |
| Less than $10,000 | 1,134 | 17.2% |
| $10,000 to $14,999 | 719 | 10.9% |
| $15,000 to $24,999 | 1,016 | 15.4% |
| $25,000 to $34,999 | 455 | 6.9% |
| $35,000 to $49,999 | 646 | 9.8% |
| $50,000 to $74,999 | 646 | 9.8% |
| $75,000 to $99,999 | 534 | 8.1% |
| $100,000 to $149,999 | 739 | 11.2% |
| $150,000 to $199,999 | 323 | 4.9% |
| $200,000+ | 389 | 5.9% |
Household Income by Householder Age in Athens
The median household income in Athens is $34,493, with the highest median household income of $86,429 found in the 45 to 64 years age bracket for the primary householder. A total of 1,594 households (24.2%) fall into this category. Meanwhile, the 15 to 24 years age bracket for the primary householder has the lowest median household income of $17,426, with 2,159 households (32.7%) in this group.
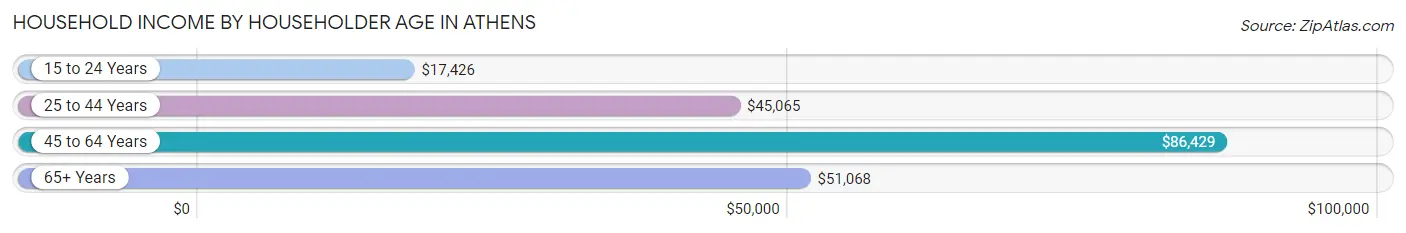
| Income Bracket | # Households | Median Income |
| 15 to 24 Years | 2,159 (32.7%) | $17,426 |
| 25 to 44 Years | 2,015 (30.5%) | $45,065 |
| 45 to 64 Years | 1,594 (24.2%) | $86,429 |
| 65+ Years | 827 (12.5%) | $51,068 |
| Total | 6,595 (100.0%) | $34,493 |
Poverty in Athens
Income Below Poverty by Sex and Age in Athens
With 43.2% poverty level for males and 42.8% for females among the residents of Athens, 18 to 24 year old males and 5 year old females are the most vulnerable to poverty, with 2,476 males (69.7%) and 39 females (81.2%) in their respective age groups living below the poverty level.
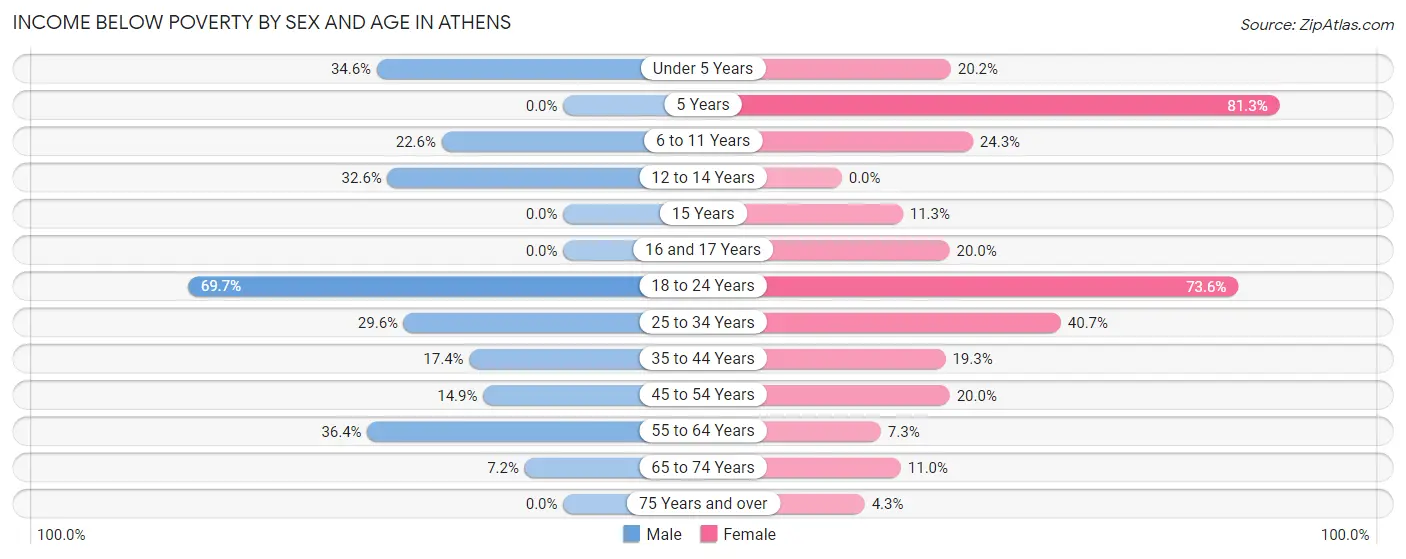
| Age Bracket | Male | Female |
| Under 5 Years | 82 (34.6%) | 50 (20.2%) |
| 5 Years | 0 (0.0%) | 39 (81.2%) |
| 6 to 11 Years | 81 (22.6%) | 55 (24.3%) |
| 12 to 14 Years | 30 (32.6%) | 0 (0.0%) |
| 15 Years | 0 (0.0%) | 6 (11.3%) |
| 16 and 17 Years | 0 (0.0%) | 16 (20.0%) |
| 18 to 24 Years | 2,476 (69.7%) | 2,138 (73.6%) |
| 25 to 34 Years | 417 (29.6%) | 555 (40.7%) |
| 35 to 44 Years | 132 (17.4%) | 123 (19.3%) |
| 45 to 54 Years | 74 (14.9%) | 120 (20.0%) |
| 55 to 64 Years | 296 (36.4%) | 34 (7.3%) |
| 65 to 74 Years | 25 (7.2%) | 39 (11.0%) |
| 75 Years and over | 0 (0.0%) | 13 (4.3%) |
| Total | 3,613 (43.2%) | 3,188 (42.8%) |
Income Above Poverty by Sex and Age in Athens
According to the poverty statistics in Athens, males aged 5 years and females aged 12 to 14 years are the age groups that are most secure financially, with 100.0% of males and 100.0% of females in these age groups living above the poverty line.
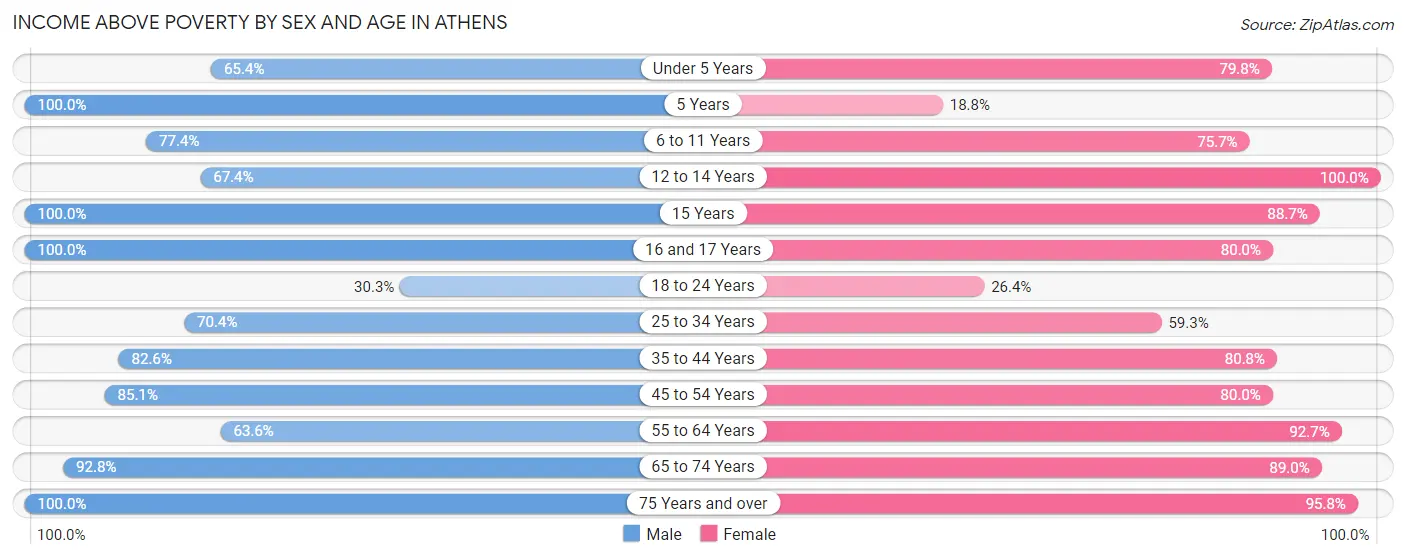
| Age Bracket | Male | Female |
| Under 5 Years | 155 (65.4%) | 197 (79.8%) |
| 5 Years | 7 (100.0%) | 9 (18.8%) |
| 6 to 11 Years | 278 (77.4%) | 171 (75.7%) |
| 12 to 14 Years | 62 (67.4%) | 150 (100.0%) |
| 15 Years | 24 (100.0%) | 47 (88.7%) |
| 16 and 17 Years | 98 (100.0%) | 64 (80.0%) |
| 18 to 24 Years | 1,076 (30.3%) | 768 (26.4%) |
| 25 to 34 Years | 992 (70.4%) | 810 (59.3%) |
| 35 to 44 Years | 625 (82.6%) | 516 (80.7%) |
| 45 to 54 Years | 424 (85.1%) | 479 (80.0%) |
| 55 to 64 Years | 518 (63.6%) | 434 (92.7%) |
| 65 to 74 Years | 324 (92.8%) | 317 (89.0%) |
| 75 Years and over | 166 (100.0%) | 293 (95.8%) |
| Total | 4,749 (56.8%) | 4,255 (57.2%) |
Income Below Poverty Among Married-Couple Families in Athens
The poverty statistics for married-couple families in Athens show that 7.5% or 113 of the total 1,512 families live below the poverty line. Families with 3 or 4 children have the highest poverty rate of 52.0%, comprising of 39 families. On the other hand, families with no children have the lowest poverty rate of 4.5%, which includes 40 families.
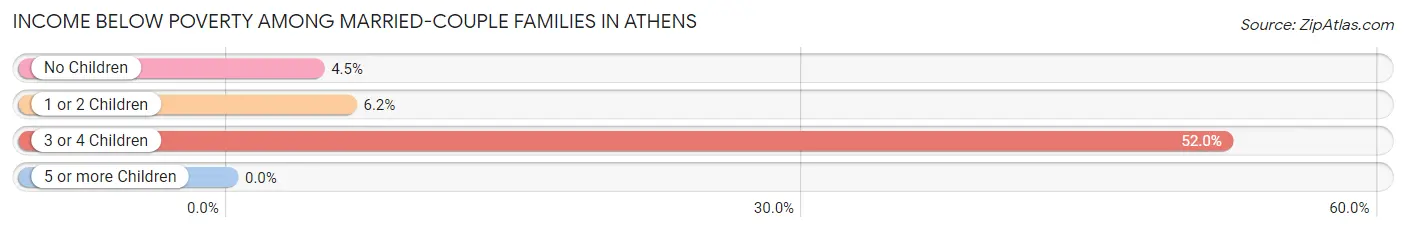
| Children | Above Poverty | Below Poverty |
| No Children | 848 (95.5%) | 40 (4.5%) |
| 1 or 2 Children | 515 (93.8%) | 34 (6.2%) |
| 3 or 4 Children | 36 (48.0%) | 39 (52.0%) |
| 5 or more Children | 0 (0.0%) | 0 (0.0%) |
| Total | 1,399 (92.5%) | 113 (7.5%) |
Income Below Poverty Among Single-Parent Households in Athens
According to the poverty data in Athens, 39.9% or 73 single-father households and 22.6% or 61 single-mother households are living below the poverty line. Among single-father households, those with no children have the highest poverty rate, with 44 households (47.8%) experiencing poverty. Likewise, among single-mother households, those with 3 or 4 children have the highest poverty rate, with 19 households (70.4%) falling below the poverty line.
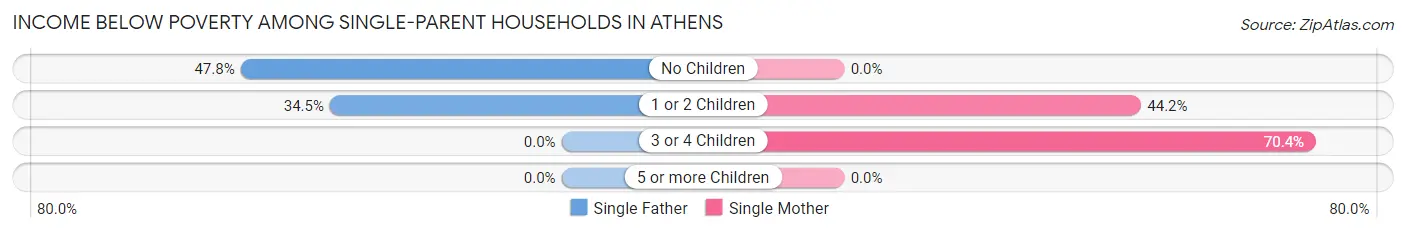
| Children | Single Father | Single Mother |
| No Children | 44 (47.8%) | 0 (0.0%) |
| 1 or 2 Children | 29 (34.5%) | 42 (44.2%) |
| 3 or 4 Children | 0 (0.0%) | 19 (70.4%) |
| 5 or more Children | 0 (0.0%) | 0 (0.0%) |
| Total | 73 (39.9%) | 61 (22.6%) |
Income Below Poverty Among Married-Couple vs Single-Parent Households in Athens
The poverty data for Athens shows that 113 of the married-couple family households (7.5%) and 134 of the single-parent households (29.6%) are living below the poverty level. Within the married-couple family households, those with 3 or 4 children have the highest poverty rate, with 39 households (52.0%) falling below the poverty line. Among the single-parent households, those with 3 or 4 children have the highest poverty rate, with 19 household (55.9%) living below poverty.
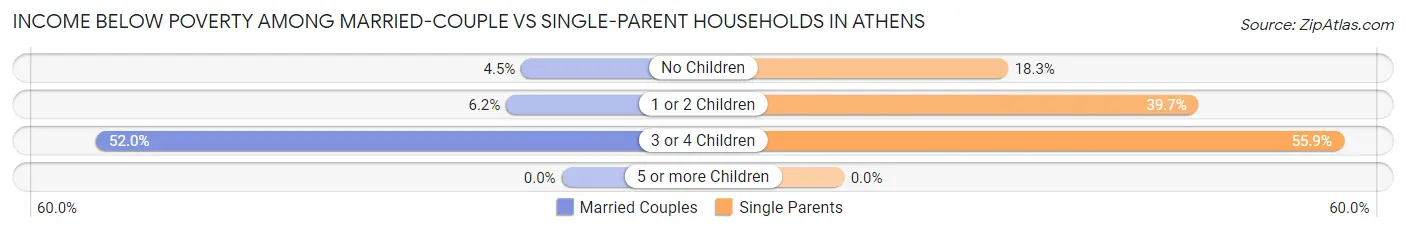
| Children | Married-Couple Families | Single-Parent Households |
| No Children | 40 (4.5%) | 44 (18.3%) |
| 1 or 2 Children | 34 (6.2%) | 71 (39.7%) |
| 3 or 4 Children | 39 (52.0%) | 19 (55.9%) |
| 5 or more Children | 0 (0.0%) | 0 (0.0%) |
| Total | 113 (7.5%) | 134 (29.6%) |
Race in Athens
The most populous races in Athens are White / Caucasian (19,172 | 84.5%), Asian (1,369 | 6.0%), and Black / African American (1,051 | 4.6%).
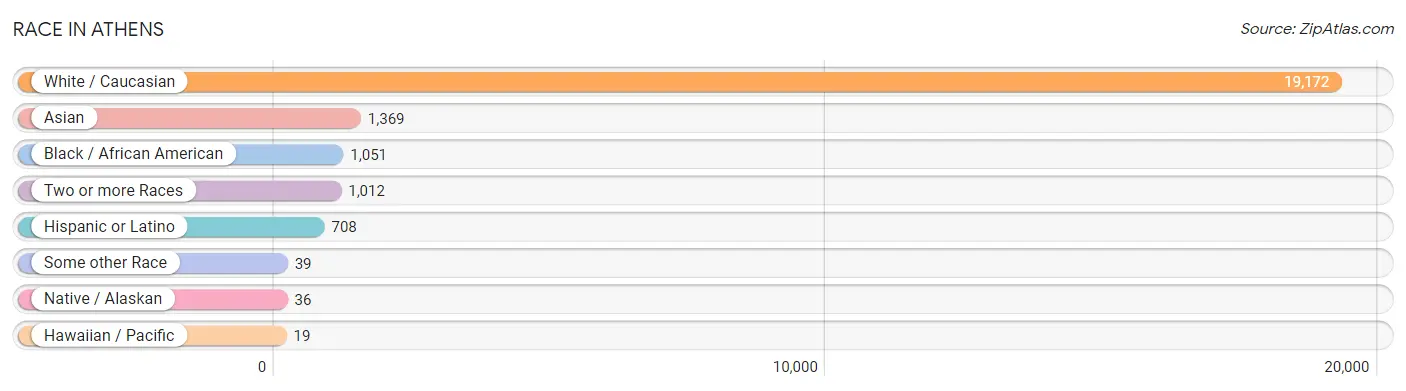
| Race | # Population | % Population |
| Asian | 1,369 | 6.0% |
| Black / African American | 1,051 | 4.6% |
| Hawaiian / Pacific | 19 | 0.1% |
| Hispanic or Latino | 708 | 3.1% |
| Native / Alaskan | 36 | 0.2% |
| White / Caucasian | 19,172 | 84.5% |
| Two or more Races | 1,012 | 4.5% |
| Some other Race | 39 | 0.2% |
| Total | 22,698 | 100.0% |
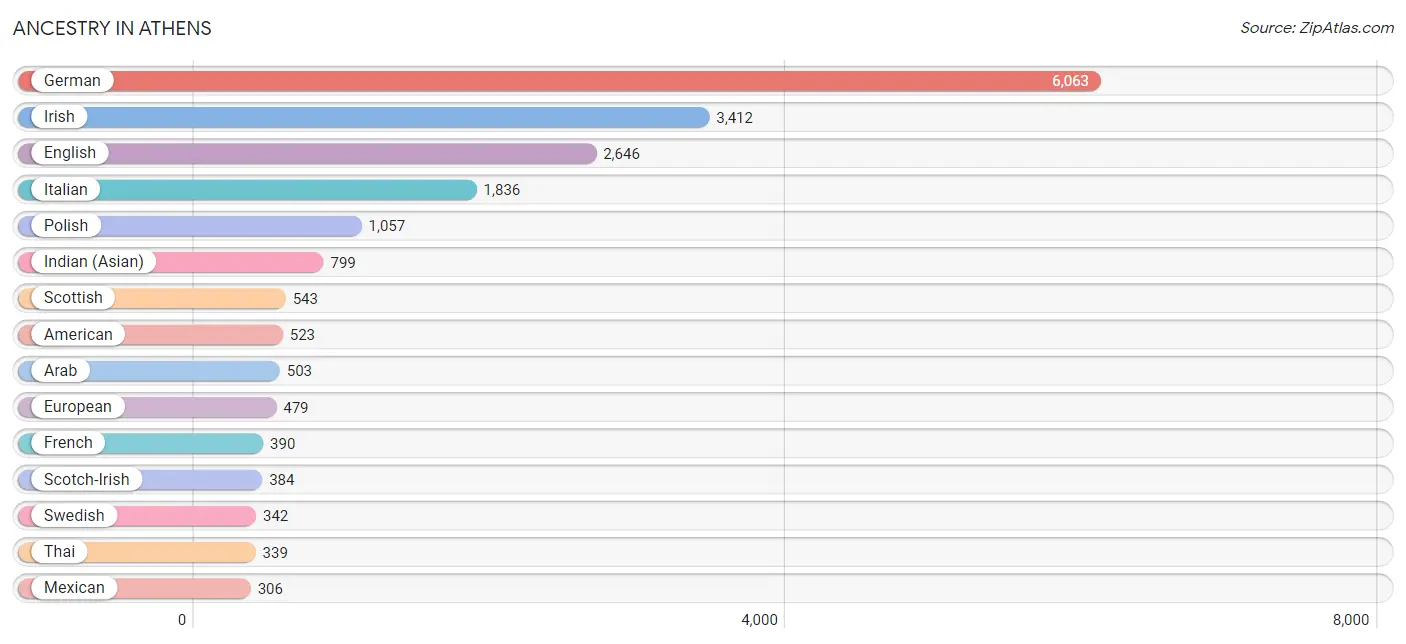
Ancestry in Athens
The most populous ancestries reported in Athens are German (6,063 | 26.7%), Irish (3,412 | 15.0%), English (2,646 | 11.7%), Italian (1,836 | 8.1%), and Polish (1,057 | 4.7%), together accounting for 66.1% of all Athens residents.
| Ancestry | # Population | % Population |
| African | 109 | 0.5% |
| American | 523 | 2.3% |
| Arab | 503 | 2.2% |
| Austrian | 11 | 0.1% |
| Belgian | 45 | 0.2% |
| Bhutanese | 72 | 0.3% |
| Blackfeet | 12 | 0.1% |
| British | 137 | 0.6% |
| Bulgarian | 11 | 0.1% |
| Burmese | 155 | 0.7% |
| Canadian | 21 | 0.1% |
| Carpatho Rusyn | 11 | 0.1% |
| Central American | 88 | 0.4% |
| Central American Indian | 5 | 0.0% |
| Cherokee | 33 | 0.2% |
| Chippewa | 33 | 0.2% |
| Choctaw | 23 | 0.1% |
| Colombian | 7 | 0.0% |
| Croatian | 38 | 0.2% |
| Cuban | 56 | 0.3% |
| Czech | 120 | 0.5% |
| Czechoslovakian | 22 | 0.1% |
| Danish | 31 | 0.1% |
| Delaware | 7 | 0.0% |
| Dutch | 250 | 1.1% |
| Eastern European | 82 | 0.4% |
| Egyptian | 7 | 0.0% |
| English | 2,646 | 11.7% |
| European | 479 | 2.1% |
| Filipino | 22 | 0.1% |
| Finnish | 26 | 0.1% |
| French | 390 | 1.7% |
| French Canadian | 42 | 0.2% |
| German | 6,063 | 26.7% |
| Ghanaian | 100 | 0.4% |
| Greek | 55 | 0.2% |
| Guatemalan | 5 | 0.0% |
| Honduran | 12 | 0.1% |
| Hungarian | 215 | 0.9% |
| Indian (Asian) | 799 | 3.5% |
| Iranian | 14 | 0.1% |
| Iraqi | 2 | 0.0% |
| Irish | 3,412 | 15.0% |
| Israeli | 4 | 0.0% |
| Italian | 1,836 | 8.1% |
| Japanese | 6 | 0.0% |
| Jordanian | 89 | 0.4% |
| Kenyan | 11 | 0.1% |
| Korean | 127 | 0.6% |
| Laotian | 1 | 0.0% |
| Latvian | 17 | 0.1% |
| Lebanese | 114 | 0.5% |
| Lithuanian | 22 | 0.1% |
| Macedonian | 24 | 0.1% |
| Mexican | 306 | 1.3% |
| New Zealander | 14 | 0.1% |
| Nigerian | 11 | 0.1% |
| Northern European | 46 | 0.2% |
| Norwegian | 206 | 0.9% |
| Okinawan | 1 | 0.0% |
| Pakistani | 130 | 0.6% |
| Pennsylvania German | 23 | 0.1% |
| Peruvian | 65 | 0.3% |
| Polish | 1,057 | 4.7% |
| Portuguese | 13 | 0.1% |
| Puerto Rican | 120 | 0.5% |
| Romanian | 57 | 0.3% |
| Russian | 297 | 1.3% |
| Salvadoran | 71 | 0.3% |
| Samoan | 9 | 0.0% |
| Scandinavian | 53 | 0.2% |
| Scotch-Irish | 384 | 1.7% |
| Scottish | 543 | 2.4% |
| Serbian | 38 | 0.2% |
| Slovak | 148 | 0.6% |
| Slovene | 85 | 0.4% |
| South African | 3 | 0.0% |
| South American | 79 | 0.4% |
| Spaniard | 31 | 0.1% |
| Sri Lankan | 131 | 0.6% |
| Subsaharan African | 234 | 1.0% |
| Swedish | 342 | 1.5% |
| Swiss | 92 | 0.4% |
| Syrian | 7 | 0.0% |
| Thai | 339 | 1.5% |
| Turkish | 19 | 0.1% |
| Ukrainian | 131 | 0.6% |
| Venezuelan | 7 | 0.0% |
| Welsh | 220 | 1.0% |
| West Indian | 5 | 0.0% | View All 90 Rows |
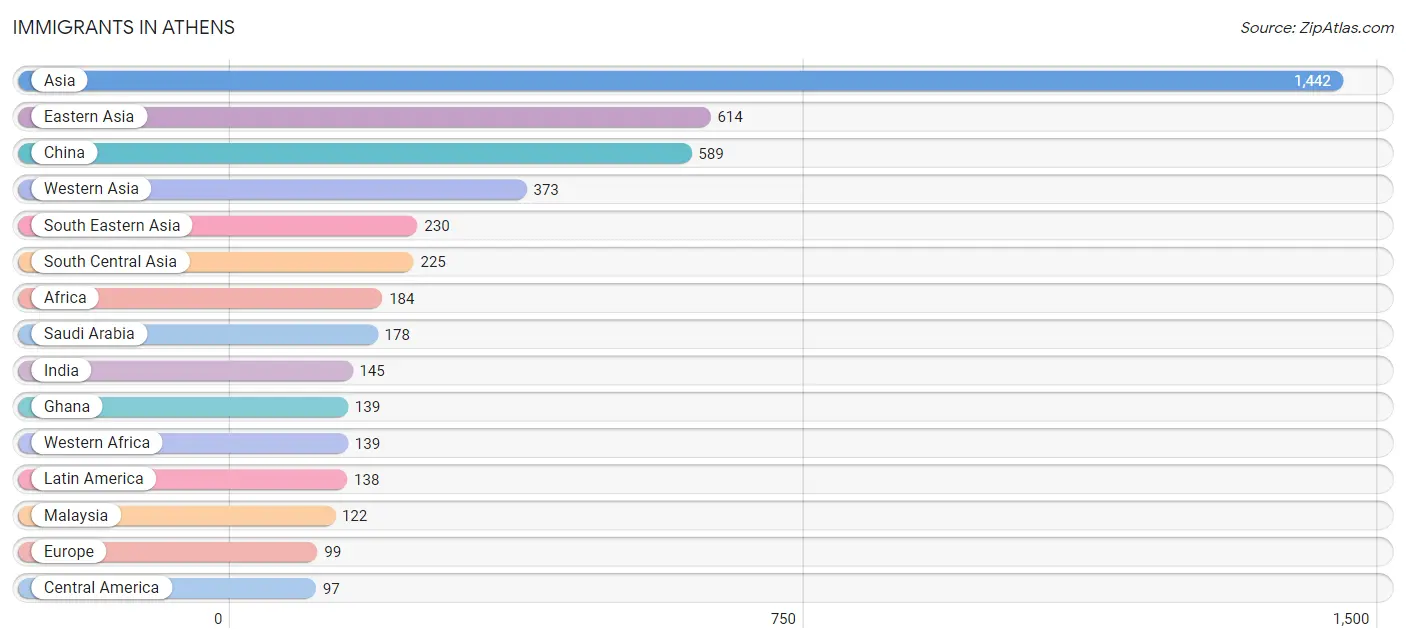
Immigrants in Athens
The most numerous immigrant groups reported in Athens came from Asia (1,442 | 6.4%), Eastern Asia (614 | 2.7%), China (589 | 2.6%), Western Asia (373 | 1.6%), and South Eastern Asia (230 | 1.0%), together accounting for 14.3% of all Athens residents.
| Immigration Origin | # Population | % Population |
| Africa | 184 | 0.8% |
| Asia | 1,442 | 6.4% |
| Bulgaria | 11 | 0.1% |
| Canada | 37 | 0.2% |
| Central America | 97 | 0.4% |
| China | 589 | 2.6% |
| Colombia | 7 | 0.0% |
| Croatia | 12 | 0.1% |
| Eastern Africa | 18 | 0.1% |
| Eastern Asia | 614 | 2.7% |
| Eastern Europe | 60 | 0.3% |
| El Salvador | 10 | 0.0% |
| Europe | 99 | 0.4% |
| Germany | 6 | 0.0% |
| Ghana | 139 | 0.6% |
| Guatemala | 5 | 0.0% |
| Guyana | 34 | 0.2% |
| Hong Kong | 36 | 0.2% |
| India | 145 | 0.6% |
| Iran | 9 | 0.0% |
| Ireland | 6 | 0.0% |
| Japan | 25 | 0.1% |
| Jordan | 89 | 0.4% |
| Kenya | 11 | 0.1% |
| Latin America | 138 | 0.6% |
| Lebanon | 57 | 0.3% |
| Malaysia | 122 | 0.5% |
| Mexico | 78 | 0.3% |
| Nepal | 68 | 0.3% |
| Northern Africa | 21 | 0.1% |
| Northern Europe | 21 | 0.1% |
| Oceania | 10 | 0.0% |
| Pakistan | 3 | 0.0% |
| Panama | 4 | 0.0% |
| Philippines | 45 | 0.2% |
| Poland | 7 | 0.0% |
| Saudi Arabia | 178 | 0.8% |
| South America | 41 | 0.2% |
| South Central Asia | 225 | 1.0% |
| South Eastern Asia | 230 | 1.0% |
| Switzerland | 12 | 0.1% |
| Taiwan | 10 | 0.0% |
| Turkey | 20 | 0.1% |
| Vietnam | 63 | 0.3% |
| Western Africa | 139 | 0.6% |
| Western Asia | 373 | 1.6% |
| Western Europe | 18 | 0.1% | View All 47 Rows |
Sex and Age in Athens
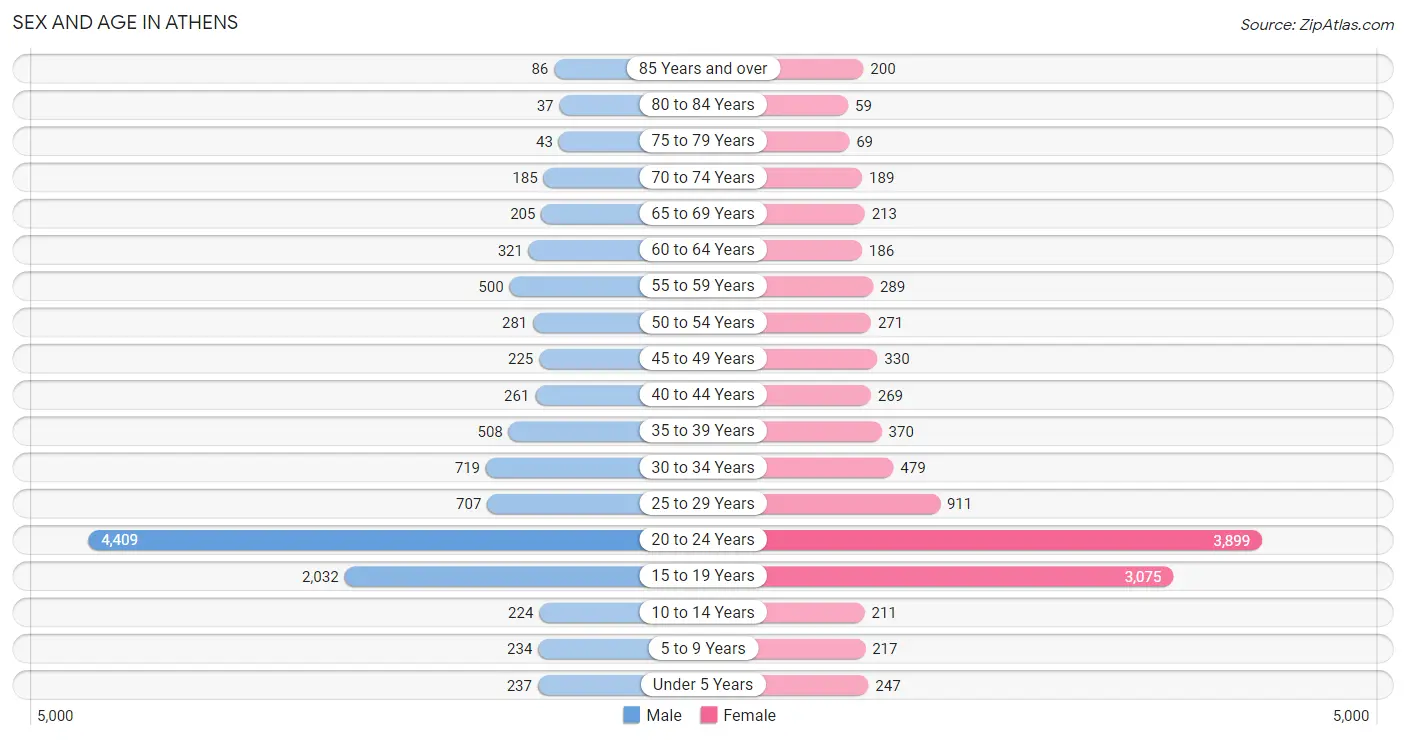
Sex and Age in Athens
The most populous age groups in Athens are 20 to 24 Years (4,409 | 39.3%) for men and 20 to 24 Years (3,899 | 34.0%) for women.
| Age Bracket | Male | Female |
| Under 5 Years | 237 (2.1%) | 247 (2.1%) |
| 5 to 9 Years | 234 (2.1%) | 217 (1.9%) |
| 10 to 14 Years | 224 (2.0%) | 211 (1.8%) |
| 15 to 19 Years | 2,032 (18.1%) | 3,075 (26.8%) |
| 20 to 24 Years | 4,409 (39.3%) | 3,899 (34.0%) |
| 25 to 29 Years | 707 (6.3%) | 911 (7.9%) |
| 30 to 34 Years | 719 (6.4%) | 479 (4.2%) |
| 35 to 39 Years | 508 (4.5%) | 370 (3.2%) |
| 40 to 44 Years | 261 (2.3%) | 269 (2.3%) |
| 45 to 49 Years | 225 (2.0%) | 330 (2.9%) |
| 50 to 54 Years | 281 (2.5%) | 271 (2.4%) |
| 55 to 59 Years | 500 (4.5%) | 289 (2.5%) |
| 60 to 64 Years | 321 (2.9%) | 186 (1.6%) |
| 65 to 69 Years | 205 (1.8%) | 213 (1.8%) |
| 70 to 74 Years | 185 (1.7%) | 189 (1.7%) |
| 75 to 79 Years | 43 (0.4%) | 69 (0.6%) |
| 80 to 84 Years | 37 (0.3%) | 59 (0.5%) |
| 85 Years and over | 86 (0.8%) | 200 (1.7%) |
| Total | 11,214 (100.0%) | 11,484 (100.0%) |
Families and Households in Athens
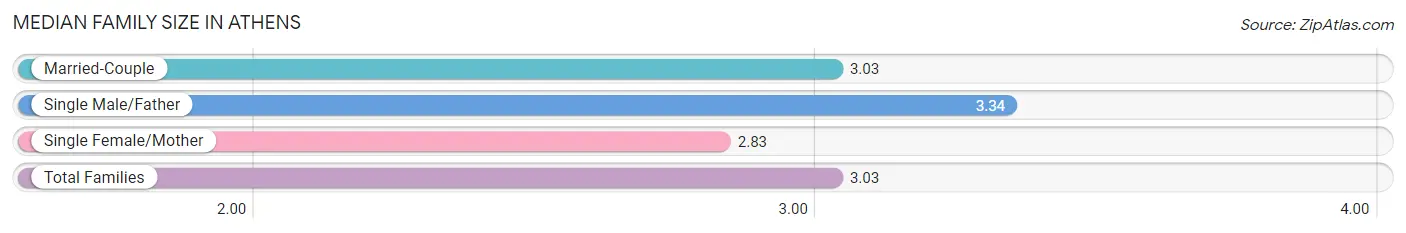
Median Family Size in Athens
The median family size in Athens is 3.03 persons per family, with single male/father families (183 | 9.3%) accounting for the largest median family size of 3.34 persons per family. On the other hand, single female/mother families (270 | 13.7%) represent the smallest median family size with 2.83 persons per family.
| Family Type | # Families | Family Size |
| Married-Couple | 1,512 (76.9%) | 3.03 |
| Single Male/Father | 183 (9.3%) | 3.34 |
| Single Female/Mother | 270 (13.7%) | 2.83 |
| Total Families | 1,965 (100.0%) | 3.03 |
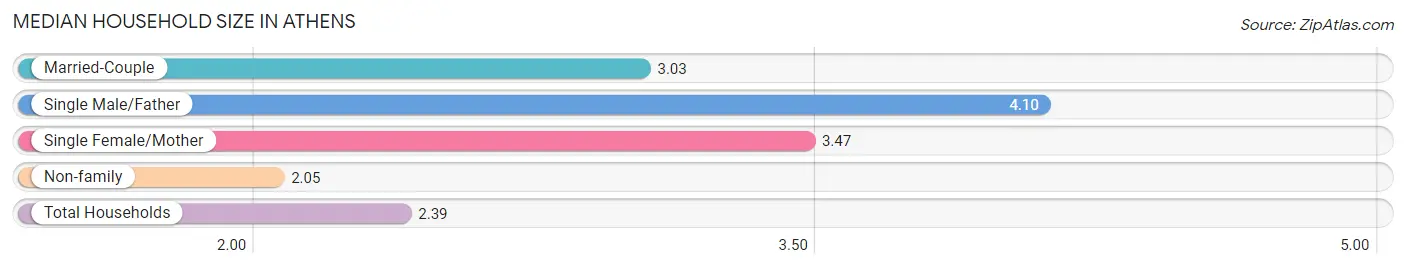
Median Household Size in Athens
The median household size in Athens is 2.39 persons per household, with single male/father households (183 | 2.8%) accounting for the largest median household size of 4.1 persons per household. non-family households (4,630 | 70.2%) represent the smallest median household size with 2.05 persons per household.
| Household Type | # Households | Household Size |
| Married-Couple | 1,512 (22.9%) | 3.03 |
| Single Male/Father | 183 (2.8%) | 4.10 |
| Single Female/Mother | 270 (4.1%) | 3.47 |
| Non-family | 4,630 (70.2%) | 2.05 |
| Total Households | 6,595 (100.0%) | 2.39 |
Household Size by Marriage Status in Athens
Out of a total of 6,595 households in Athens, 1,965 (29.8%) are family households, while 4,630 (70.2%) are nonfamily households. The most numerous type of family households are 2-person households, comprising 846, and the most common type of nonfamily households are 1-person households, comprising 2,662.
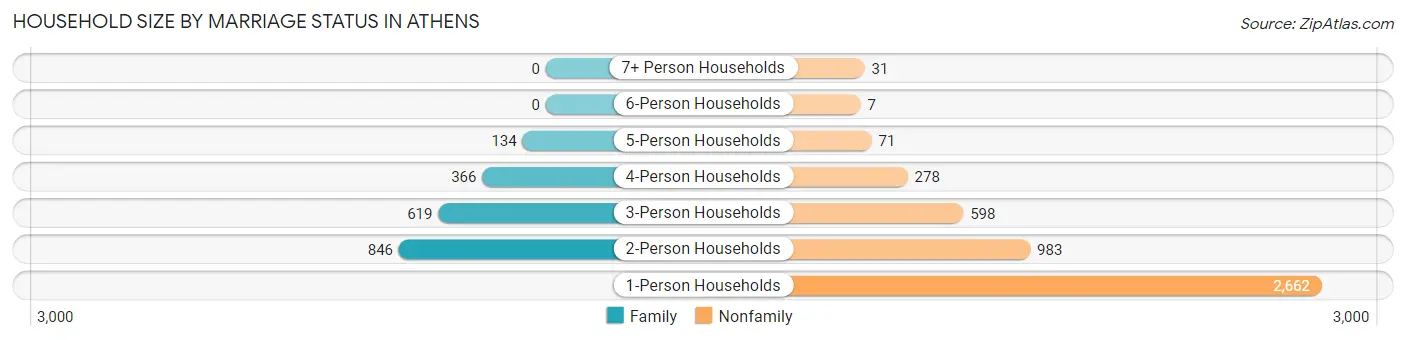
| Household Size | Family Households | Nonfamily Households |
| 1-Person Households | - | 2,662 (40.4%) |
| 2-Person Households | 846 (12.8%) | 983 (14.9%) |
| 3-Person Households | 619 (9.4%) | 598 (9.1%) |
| 4-Person Households | 366 (5.6%) | 278 (4.2%) |
| 5-Person Households | 134 (2.0%) | 71 (1.1%) |
| 6-Person Households | 0 (0.0%) | 7 (0.1%) |
| 7+ Person Households | 0 (0.0%) | 31 (0.5%) |
| Total | 1,965 (29.8%) | 4,630 (70.2%) |
Female Fertility in Athens
Fertility by Age in Athens
Average fertility rate in Athens is 5.0 births per 1,000 women. Women in the age bracket of 20 to 34 years have the highest fertility rate with 8.0 births per 1,000 women. Women in the age bracket of 20 to 34 years acount for 100.0% of all women with births.
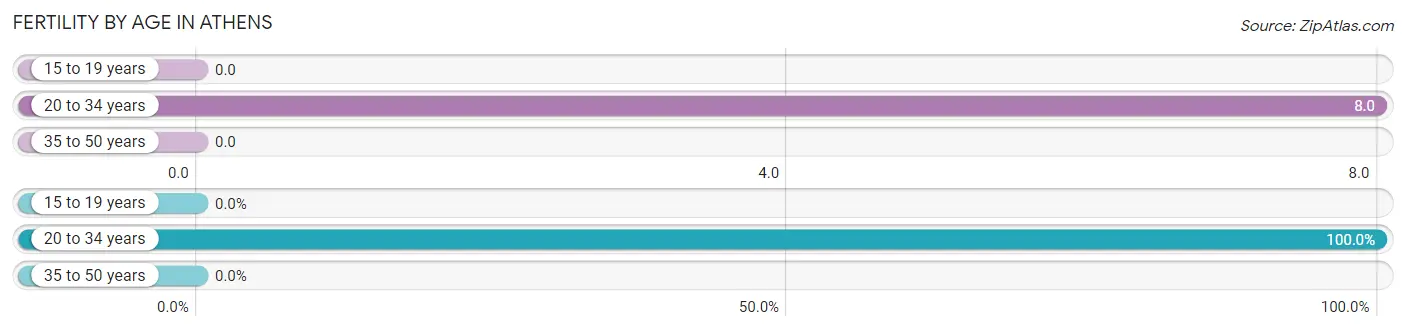
| Age Bracket | Women with Births | Births / 1,000 Women |
| 15 to 19 years | 0 (0.0%) | 0.0 |
| 20 to 34 years | 44 (100.0%) | 8.0 |
| 35 to 50 years | 0 (0.0%) | 0.0 |
| Total | 44 (100.0%) | 5.0 |
Fertility by Age by Marriage Status in Athens
70.5% of women with births (44) in Athens are married. The highest percentage of unmarried women with births falls into 20 to 34 years age bracket with 29.5% of them unmarried at the time of birth, while the lowest percentage of unmarried women with births belong to 20 to 34 years age bracket with 29.5% of them unmarried.
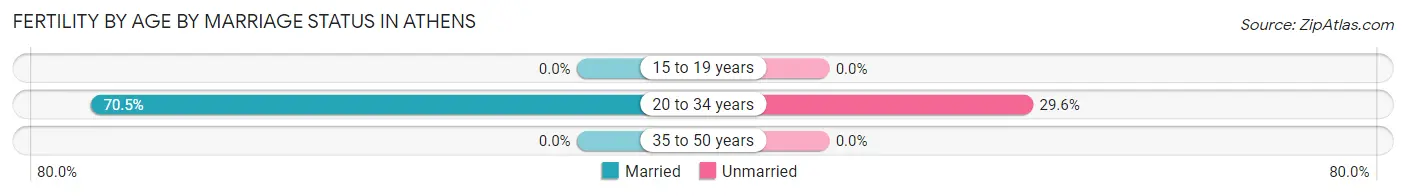
| Age Bracket | Married | Unmarried |
| 15 to 19 years | 0 (0.0%) | 0 (0.0%) |
| 20 to 34 years | 31 (70.5%) | 13 (29.5%) |
| 35 to 50 years | 0 (0.0%) | 0 (0.0%) |
| Total | 31 (70.5%) | 13 (29.5%) |
Fertility by Education in Athens
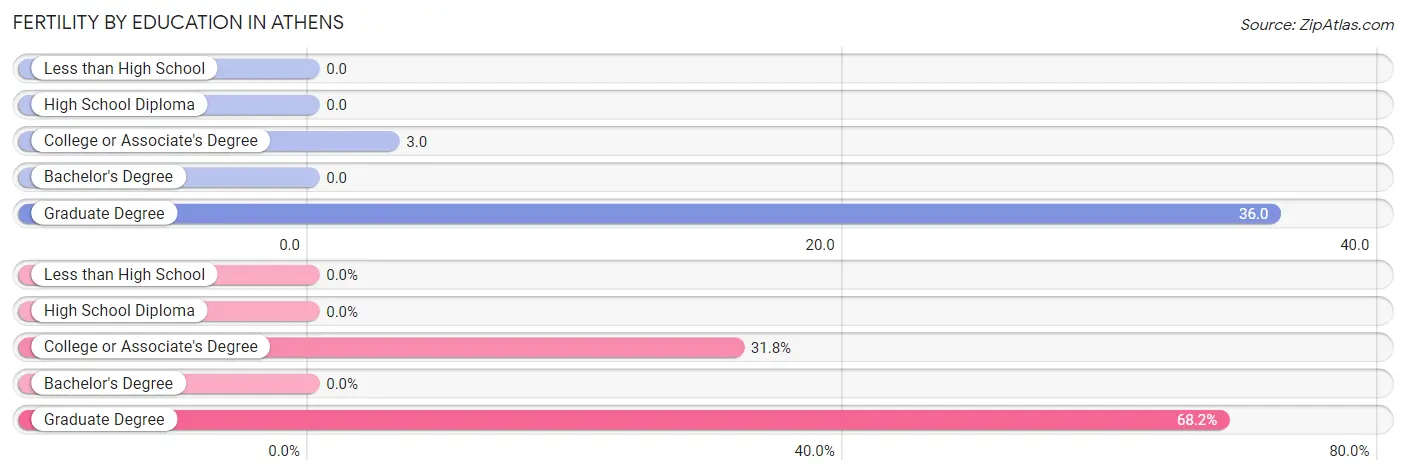
| Educational Attainment | Women with Births | Births / 1,000 Women |
| Less than High School | 0 (0.0%) | 0.0 |
| High School Diploma | 0 (0.0%) | 0.0 |
| College or Associate's Degree | 14 (31.8%) | 3.0 |
| Bachelor's Degree | 0 (0.0%) | 0.0 |
| Graduate Degree | 30 (68.2%) | 36.0 |
| Total | 44 (100.0%) | 5.0 |
Fertility by Education by Marriage Status in Athens
29.5% of women with births in Athens are unmarried. Women with the educational attainment of graduate degree are most likely to be married with 100.0% of them married at childbirth, while women with the educational attainment of college or associate's degree are least likely to be married with 92.9% of them unmarried at childbirth.
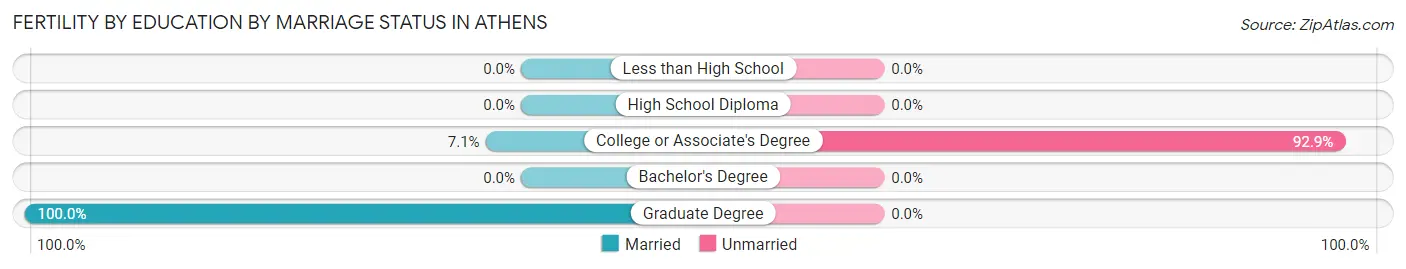
| Educational Attainment | Married | Unmarried |
| Less than High School | 0 (0.0%) | 0 (0.0%) |
| High School Diploma | 0 (0.0%) | 0 (0.0%) |
| College or Associate's Degree | 1 (7.1%) | 13 (92.9%) |
| Bachelor's Degree | 0 (0.0%) | 0 (0.0%) |
| Graduate Degree | 30 (100.0%) | 0 (0.0%) |
| Total | 31 (70.5%) | 13 (29.5%) |
Employment Characteristics in Athens
Employment by Class of Employer in Athens
Among the 10,857 employed individuals in Athens, private company employees (6,501 | 59.9%), state government employees (2,191 | 20.2%), and not-for-profit organizations (972 | 8.9%) make up the most common classes of employment.
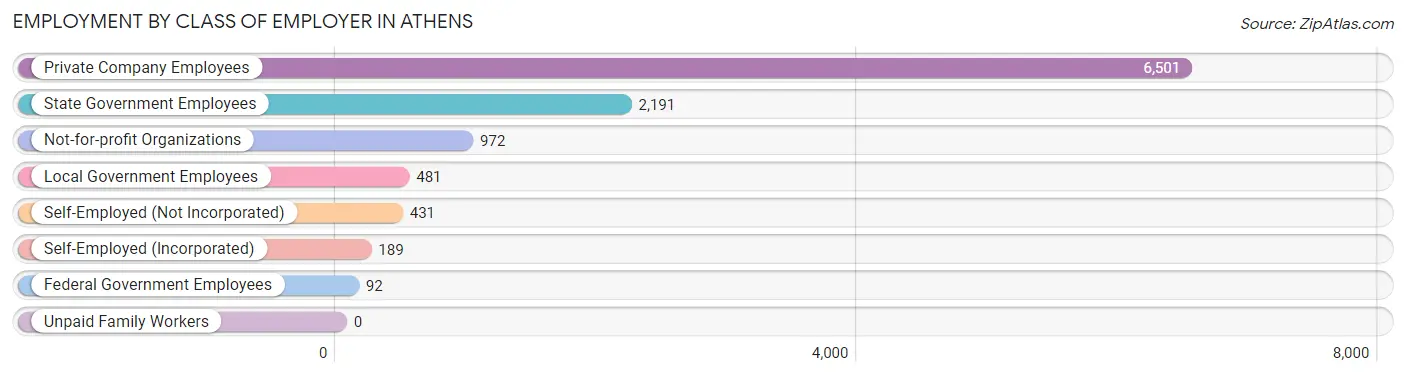
| Employer Class | # Employees | % Employees |
| Private Company Employees | 6,501 | 59.9% |
| Self-Employed (Incorporated) | 189 | 1.7% |
| Self-Employed (Not Incorporated) | 431 | 4.0% |
| Not-for-profit Organizations | 972 | 8.9% |
| Local Government Employees | 481 | 4.4% |
| State Government Employees | 2,191 | 20.2% |
| Federal Government Employees | 92 | 0.9% |
| Unpaid Family Workers | 0 | 0.0% |
| Total | 10,857 | 100.0% |
Employment Status by Age in Athens
According to the labor force statistics for Athens, out of the total population over 16 years of age (21,251), 57.7% or 12,262 individuals are in the labor force, with 7.5% or 920 of them unemployed. The age group with the highest labor force participation rate is 30 to 34 years, with 82.6% or 990 individuals in the labor force. Within the labor force, the 16 to 19 years age range has the highest percentage of unemployed individuals, with 19.9% or 418 of them being unemployed.
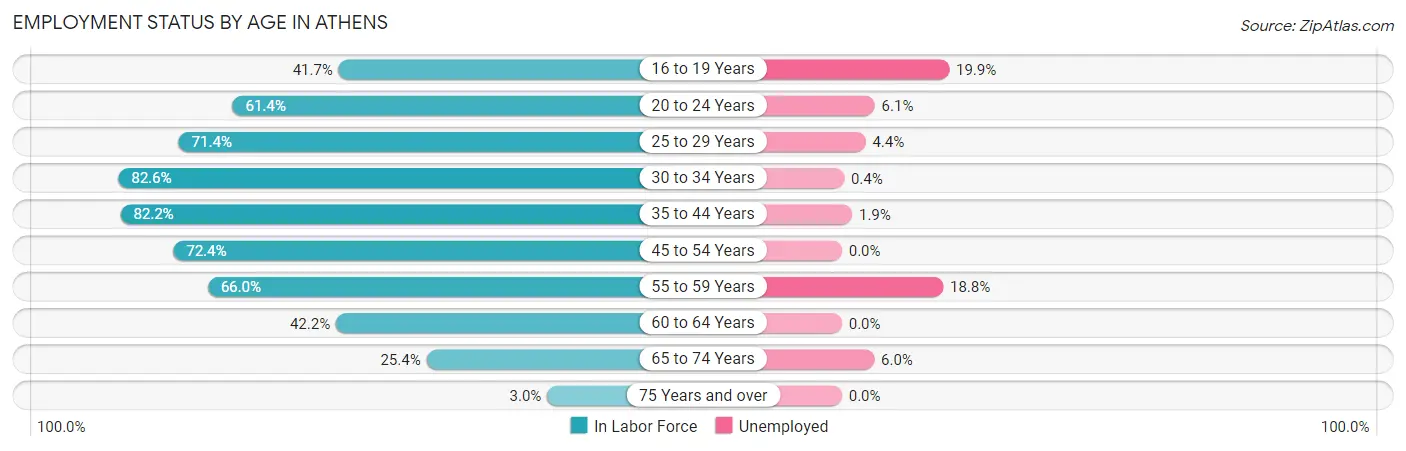
| Age Bracket | In Labor Force | Unemployed |
| 16 to 19 Years | 2,098 (41.7%) | 418 (19.9%) |
| 20 to 24 Years | 5,101 (61.4%) | 311 (6.1%) |
| 25 to 29 Years | 1,155 (71.4%) | 51 (4.4%) |
| 30 to 34 Years | 990 (82.6%) | 4 (0.4%) |
| 35 to 44 Years | 1,157 (82.2%) | 22 (1.9%) |
| 45 to 54 Years | 801 (72.4%) | 0 (0.0%) |
| 55 to 59 Years | 521 (66.0%) | 98 (18.8%) |
| 60 to 64 Years | 214 (42.2%) | 0 (0.0%) |
| 65 to 74 Years | 201 (25.4%) | 12 (6.0%) |
| 75 Years and over | 15 (3.0%) | 0 (0.0%) |
| Total | 12,262 (57.7%) | 920 (7.5%) |
Employment Status by Educational Attainment in Athens
According to labor force statistics for Athens, 73.0% of individuals (4,838) out of the total population between 25 and 64 years of age (6,627) are in the labor force, with 3.6% or 174 of them being unemployed. The group with the highest labor force participation rate are those with the educational attainment of bachelor's degree or higher, with 80.1% or 3,564 individuals in the labor force. Within the labor force, individuals with less than high school education have the highest percentage of unemployment, with 16.2% or 19 of them being unemployed.
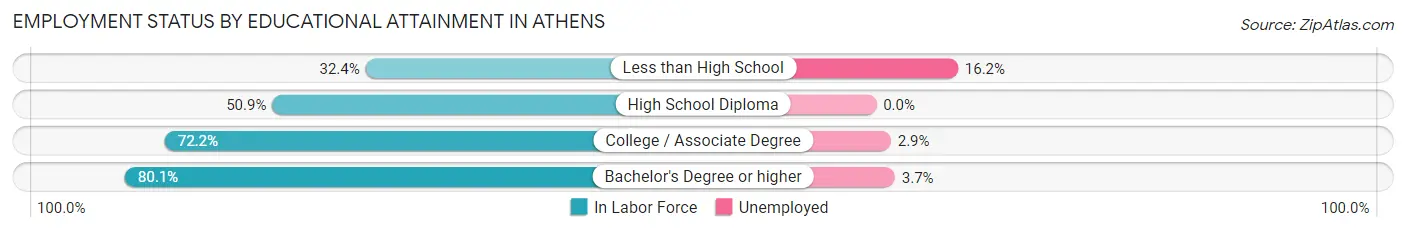
| Educational Attainment | In Labor Force | Unemployed |
| Less than High School | 117 (32.4%) | 58 (16.2%) |
| High School Diploma | 368 (50.9%) | 0 (0.0%) |
| College / Associate Degree | 789 (72.2%) | 32 (2.9%) |
| Bachelor's Degree or higher | 3,564 (80.1%) | 165 (3.7%) |
| Total | 4,838 (73.0%) | 239 (3.6%) |
Employment Occupations by Sex in Athens
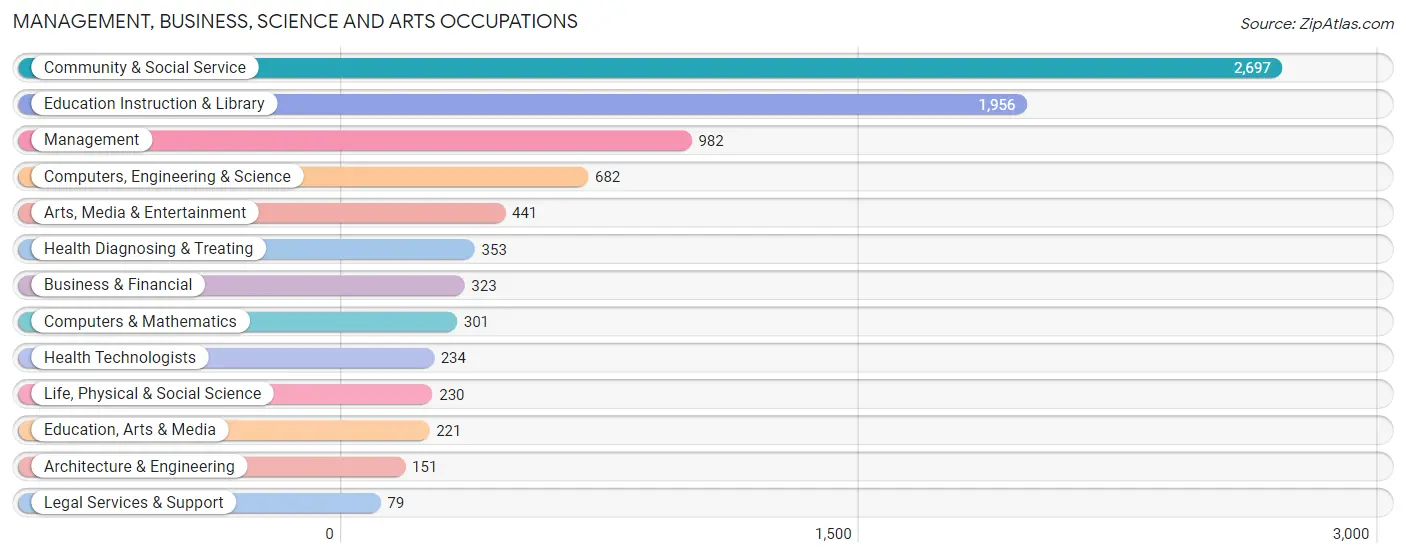
Management, Business, Science and Arts Occupations
The most common Management, Business, Science and Arts occupations in Athens are Community & Social Service (2,697 | 23.8%), Education Instruction & Library (1,956 | 17.3%), Management (982 | 8.7%), Computers, Engineering & Science (682 | 6.0%), and Arts, Media & Entertainment (441 | 3.9%).
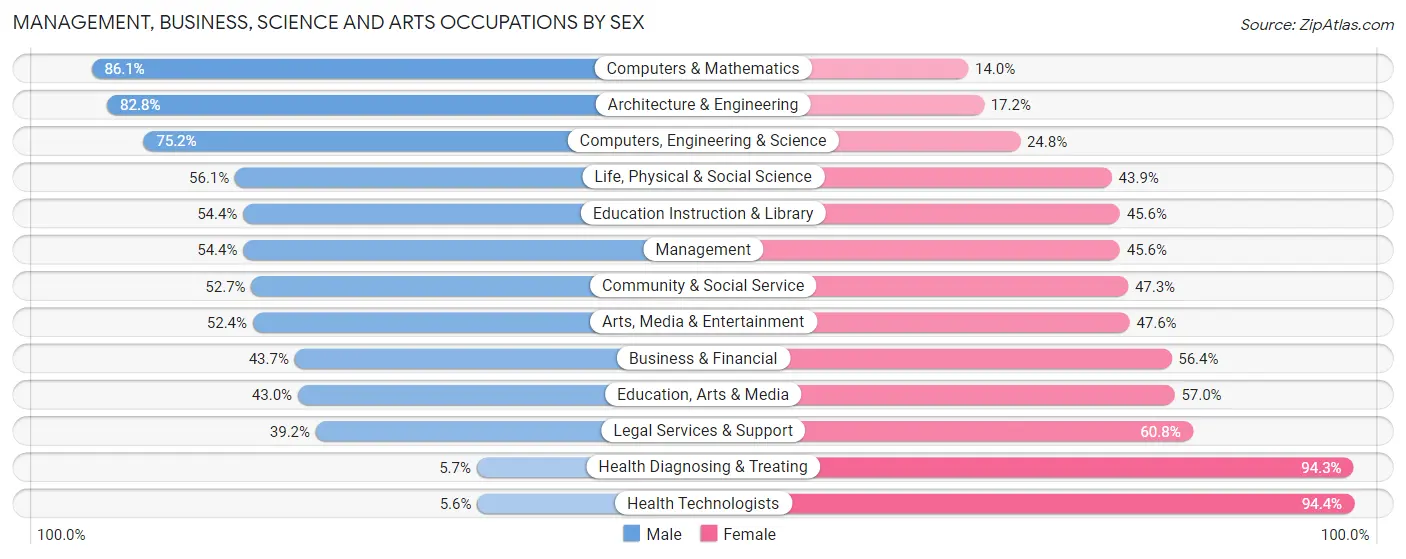
Management, Business, Science and Arts Occupations by Sex
Within the Management, Business, Science and Arts occupations in Athens, the most male-oriented occupations are Computers & Mathematics (86.1%), Architecture & Engineering (82.8%), and Computers, Engineering & Science (75.2%), while the most female-oriented occupations are Health Technologists (94.4%), Health Diagnosing & Treating (94.3%), and Legal Services & Support (60.8%).
| Occupation | Male | Female |
| Management | 534 (54.4%) | 448 (45.6%) |
| Business & Financial | 141 (43.6%) | 182 (56.4%) |
| Computers, Engineering & Science | 513 (75.2%) | 169 (24.8%) |
| Computers & Mathematics | 259 (86.1%) | 42 (14.0%) |
| Architecture & Engineering | 125 (82.8%) | 26 (17.2%) |
| Life, Physical & Social Science | 129 (56.1%) | 101 (43.9%) |
| Community & Social Service | 1,421 (52.7%) | 1,276 (47.3%) |
| Education, Arts & Media | 95 (43.0%) | 126 (57.0%) |
| Legal Services & Support | 31 (39.2%) | 48 (60.8%) |
| Education Instruction & Library | 1,064 (54.4%) | 892 (45.6%) |
| Arts, Media & Entertainment | 231 (52.4%) | 210 (47.6%) |
| Health Diagnosing & Treating | 20 (5.7%) | 333 (94.3%) |
| Health Technologists | 13 (5.6%) | 221 (94.4%) |
| Total (Category) | 2,629 (52.2%) | 2,408 (47.8%) |
| Total (Overall) | 5,670 (50.1%) | 5,639 (49.9%) |
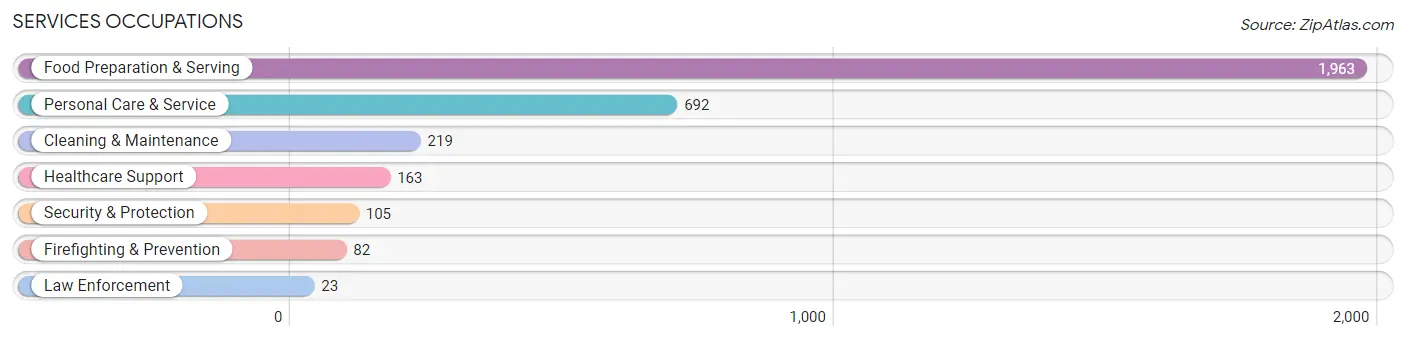
Services Occupations
The most common Services occupations in Athens are Food Preparation & Serving (1,963 | 17.4%), Personal Care & Service (692 | 6.1%), Cleaning & Maintenance (219 | 1.9%), Healthcare Support (163 | 1.4%), and Security & Protection (105 | 0.9%).
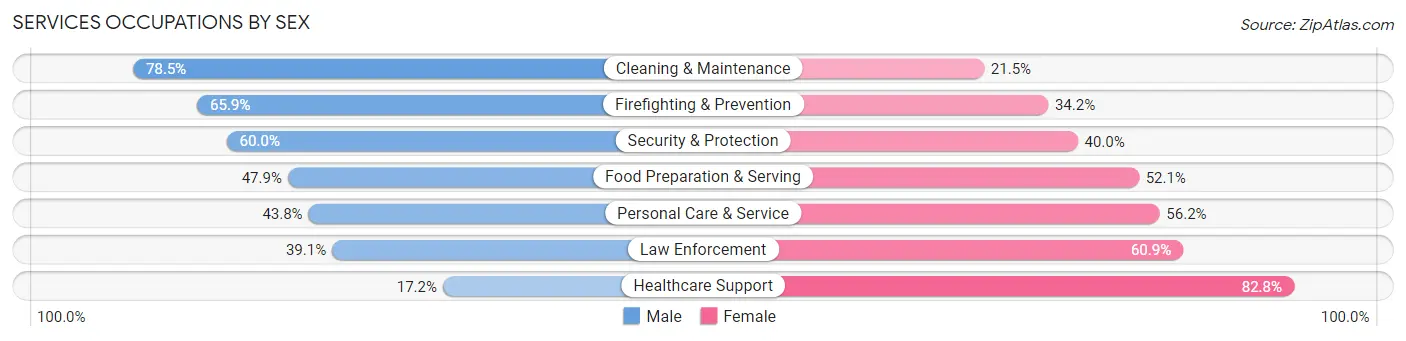
Services Occupations by Sex
Within the Services occupations in Athens, the most male-oriented occupations are Cleaning & Maintenance (78.5%), Firefighting & Prevention (65.8%), and Security & Protection (60.0%), while the most female-oriented occupations are Healthcare Support (82.8%), Law Enforcement (60.9%), and Personal Care & Service (56.2%).
| Occupation | Male | Female |
| Healthcare Support | 28 (17.2%) | 135 (82.8%) |
| Security & Protection | 63 (60.0%) | 42 (40.0%) |
| Firefighting & Prevention | 54 (65.8%) | 28 (34.2%) |
| Law Enforcement | 9 (39.1%) | 14 (60.9%) |
| Food Preparation & Serving | 940 (47.9%) | 1,023 (52.1%) |
| Cleaning & Maintenance | 172 (78.5%) | 47 (21.5%) |
| Personal Care & Service | 303 (43.8%) | 389 (56.2%) |
| Total (Category) | 1,506 (47.9%) | 1,636 (52.1%) |
| Total (Overall) | 5,670 (50.1%) | 5,639 (49.9%) |
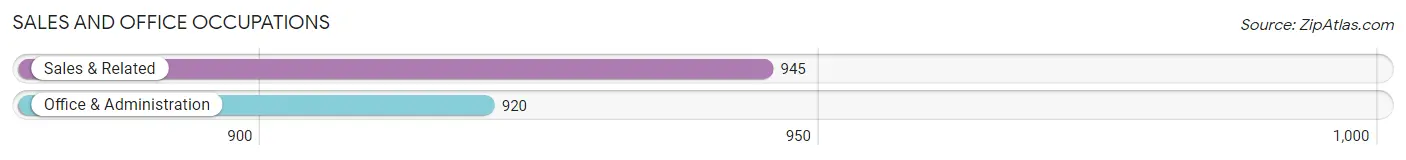
Sales and Office Occupations
The most common Sales and Office occupations in Athens are Sales & Related (945 | 8.4%), and Office & Administration (920 | 8.1%).
Sales and Office Occupations by Sex
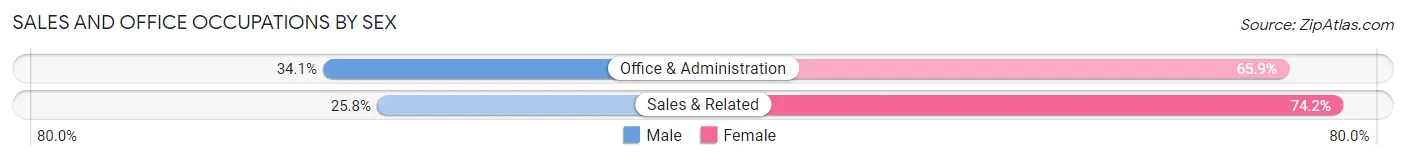
| Occupation | Male | Female |
| Sales & Related | 244 (25.8%) | 701 (74.2%) |
| Office & Administration | 314 (34.1%) | 606 (65.9%) |
| Total (Category) | 558 (29.9%) | 1,307 (70.1%) |
| Total (Overall) | 5,670 (50.1%) | 5,639 (49.9%) |
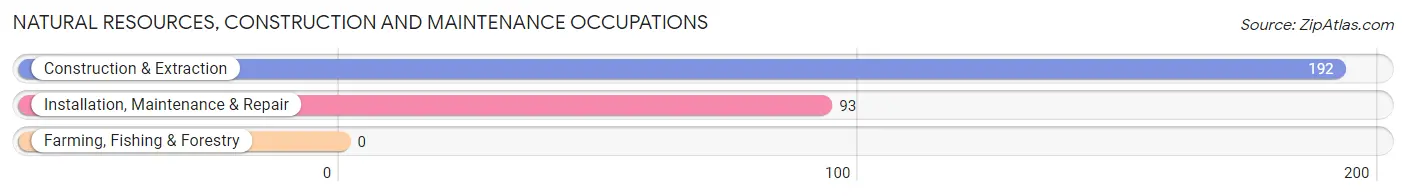
Natural Resources, Construction and Maintenance Occupations
The most common Natural Resources, Construction and Maintenance occupations in Athens are Construction & Extraction (192 | 1.7%), and Installation, Maintenance & Repair (93 | 0.8%).
Natural Resources, Construction and Maintenance Occupations by Sex
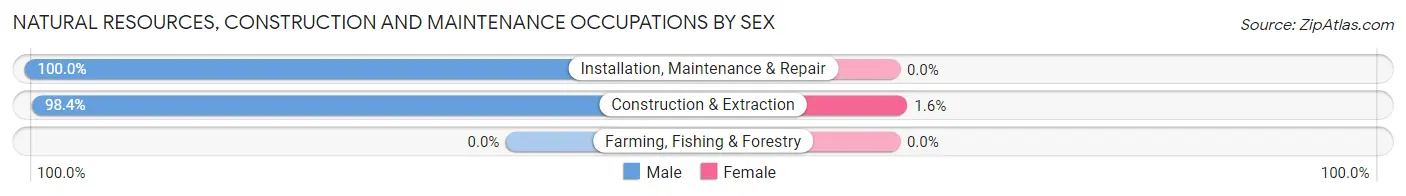
| Occupation | Male | Female |
| Farming, Fishing & Forestry | 0 (0.0%) | 0 (0.0%) |
| Construction & Extraction | 189 (98.4%) | 3 (1.6%) |
| Installation, Maintenance & Repair | 93 (100.0%) | 0 (0.0%) |
| Total (Category) | 282 (99.0%) | 3 (1.1%) |
| Total (Overall) | 5,670 (50.1%) | 5,639 (49.9%) |
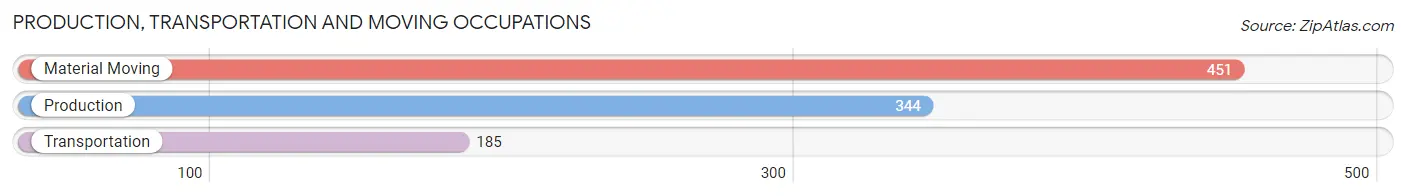
Production, Transportation and Moving Occupations
The most common Production, Transportation and Moving occupations in Athens are Material Moving (451 | 4.0%), Production (344 | 3.0%), and Transportation (185 | 1.6%).
Production, Transportation and Moving Occupations by Sex
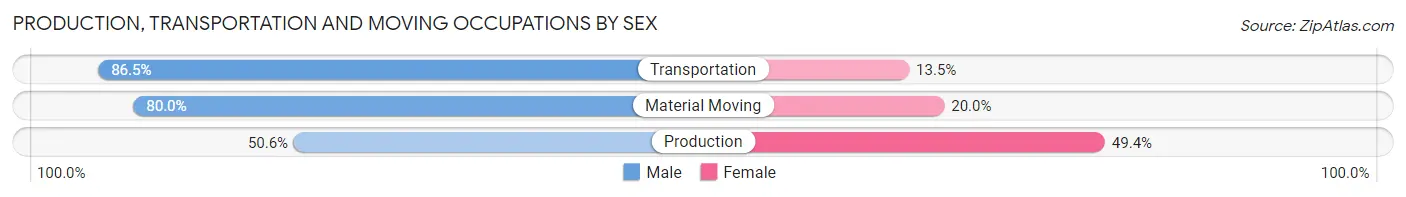
| Occupation | Male | Female |
| Production | 174 (50.6%) | 170 (49.4%) |
| Transportation | 160 (86.5%) | 25 (13.5%) |
| Material Moving | 361 (80.0%) | 90 (20.0%) |
| Total (Category) | 695 (70.9%) | 285 (29.1%) |
| Total (Overall) | 5,670 (50.1%) | 5,639 (49.9%) |
Employment Industries by Sex in Athens
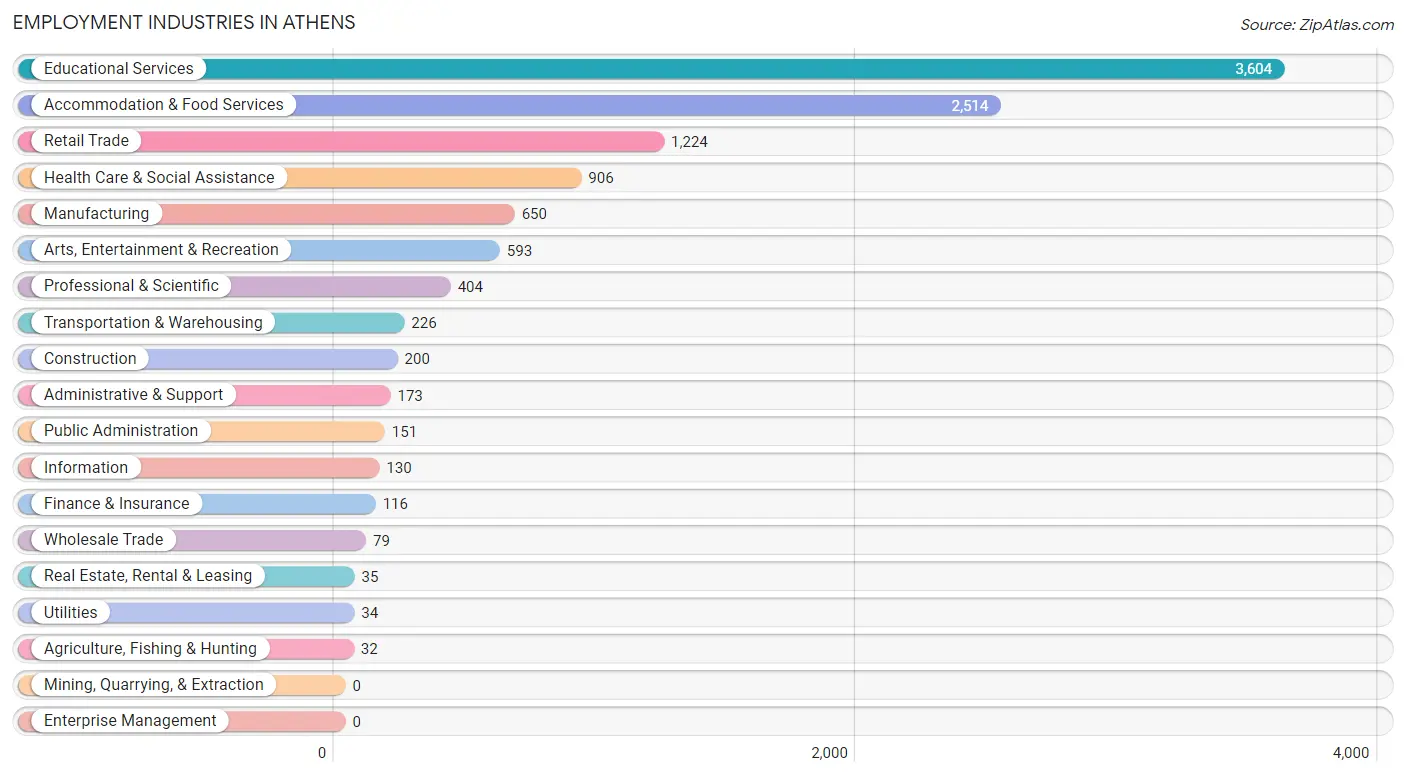
Employment Industries in Athens
The major employment industries in Athens include Educational Services (3,604 | 31.9%), Accommodation & Food Services (2,514 | 22.2%), Retail Trade (1,224 | 10.8%), Health Care & Social Assistance (906 | 8.0%), and Manufacturing (650 | 5.8%).
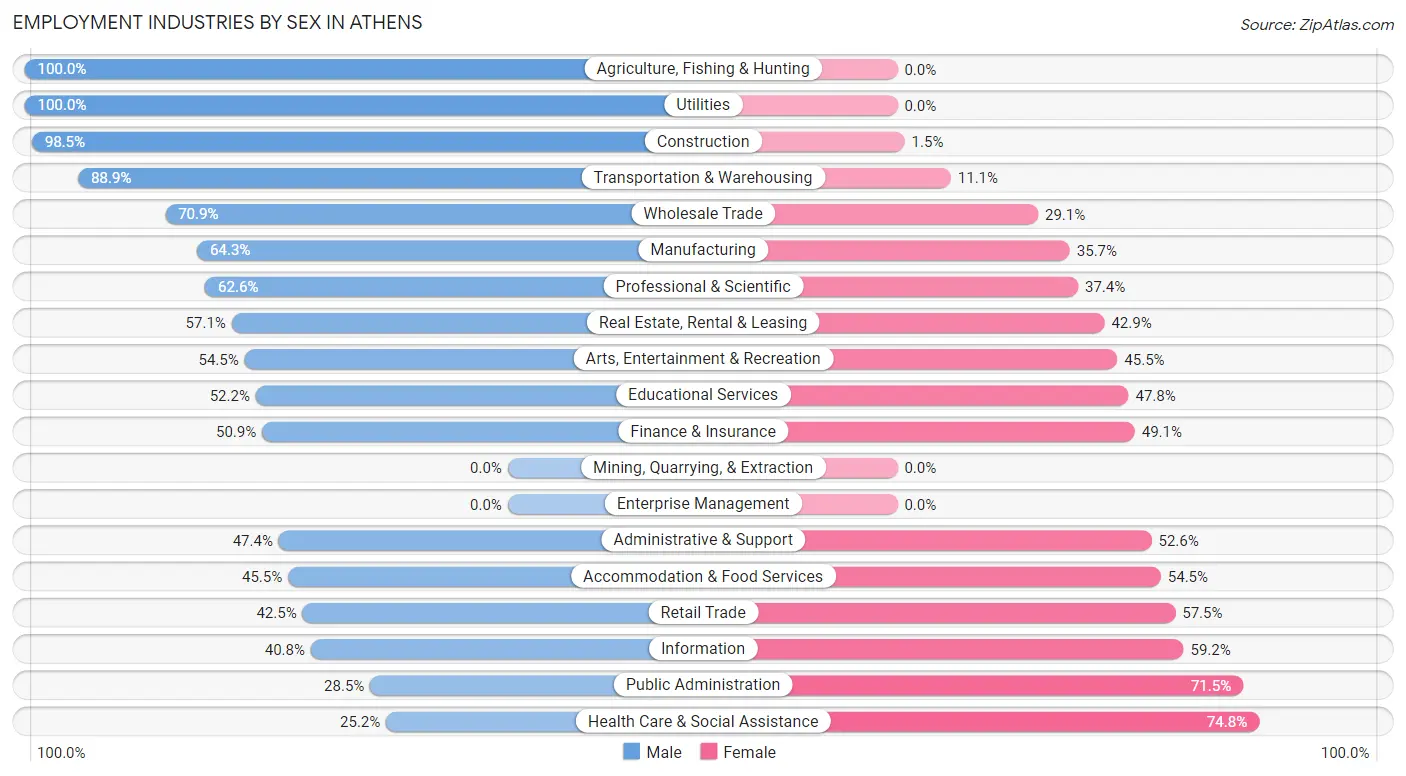
Employment Industries by Sex in Athens
The Athens industries that see more men than women are Agriculture, Fishing & Hunting (100.0%), Utilities (100.0%), and Construction (98.5%), whereas the industries that tend to have a higher number of women are Health Care & Social Assistance (74.8%), Public Administration (71.5%), and Information (59.2%).
| Industry | Male | Female |
| Agriculture, Fishing & Hunting | 32 (100.0%) | 0 (0.0%) |
| Mining, Quarrying, & Extraction | 0 (0.0%) | 0 (0.0%) |
| Construction | 197 (98.5%) | 3 (1.5%) |
| Manufacturing | 418 (64.3%) | 232 (35.7%) |
| Wholesale Trade | 56 (70.9%) | 23 (29.1%) |
| Retail Trade | 520 (42.5%) | 704 (57.5%) |
| Transportation & Warehousing | 201 (88.9%) | 25 (11.1%) |
| Utilities | 34 (100.0%) | 0 (0.0%) |
| Information | 53 (40.8%) | 77 (59.2%) |
| Finance & Insurance | 59 (50.9%) | 57 (49.1%) |
| Real Estate, Rental & Leasing | 20 (57.1%) | 15 (42.9%) |
| Professional & Scientific | 253 (62.6%) | 151 (37.4%) |
| Enterprise Management | 0 (0.0%) | 0 (0.0%) |
| Administrative & Support | 82 (47.4%) | 91 (52.6%) |
| Educational Services | 1,880 (52.2%) | 1,724 (47.8%) |
| Health Care & Social Assistance | 228 (25.2%) | 678 (74.8%) |
| Arts, Entertainment & Recreation | 323 (54.5%) | 270 (45.5%) |
| Accommodation & Food Services | 1,143 (45.5%) | 1,371 (54.5%) |
| Public Administration | 43 (28.5%) | 108 (71.5%) |
| Total | 5,670 (50.1%) | 5,639 (49.9%) |
Education in Athens
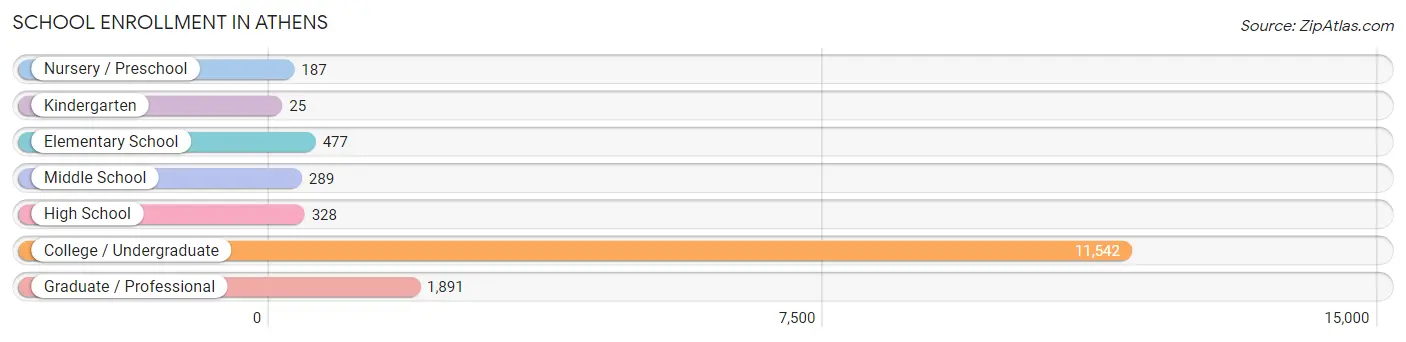
School Enrollment in Athens
The most common levels of schooling among the 14,739 students in Athens are college / undergraduate (11,542 | 78.3%), graduate / professional (1,891 | 12.8%), and elementary school (477 | 3.2%).
| School Level | # Students | % Students |
| Nursery / Preschool | 187 | 1.3% |
| Kindergarten | 25 | 0.2% |
| Elementary School | 477 | 3.2% |
| Middle School | 289 | 2.0% |
| High School | 328 | 2.2% |
| College / Undergraduate | 11,542 | 78.3% |
| Graduate / Professional | 1,891 | 12.8% |
| Total | 14,739 | 100.0% |
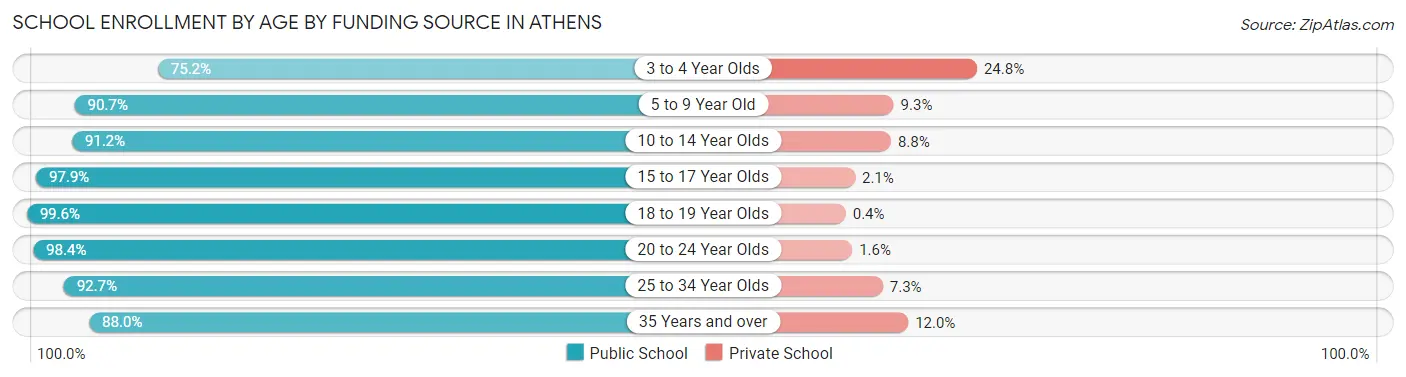
School Enrollment by Age by Funding Source in Athens
Out of a total of 14,739 students who are enrolled in schools in Athens, 383 (2.6%) attend a private institution, while the remaining 14,356 (97.4%) are enrolled in public schools. The age group of 3 to 4 year olds has the highest likelihood of being enrolled in private schools, with 36 (24.8% in the age bracket) enrolled. Conversely, the age group of 18 to 19 year olds has the lowest likelihood of being enrolled in a private school, with 4,727 (99.6% in the age bracket) attending a public institution.
| Age Bracket | Public School | Private School |
| 3 to 4 Year Olds | 109 (75.2%) | 36 (24.8%) |
| 5 to 9 Year Old | 409 (90.7%) | 42 (9.3%) |
| 10 to 14 Year Olds | 383 (91.2%) | 37 (8.8%) |
| 15 to 17 Year Olds | 277 (97.9%) | 6 (2.1%) |
| 18 to 19 Year Olds | 4,727 (99.6%) | 19 (0.4%) |
| 20 to 24 Year Olds | 7,077 (98.4%) | 114 (1.6%) |
| 25 to 34 Year Olds | 1,054 (92.7%) | 83 (7.3%) |
| 35 Years and over | 322 (88.0%) | 44 (12.0%) |
| Total | 14,356 (97.4%) | 383 (2.6%) |
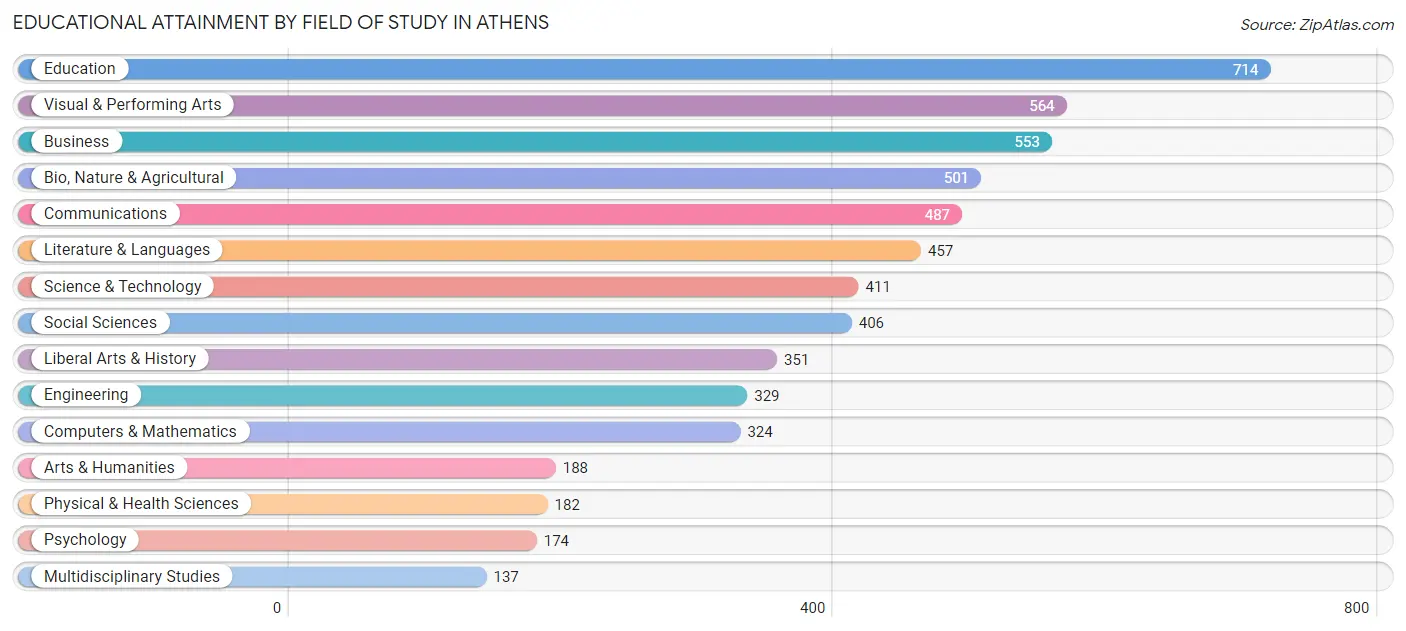
Educational Attainment by Field of Study in Athens
Education (714 | 12.4%), visual & performing arts (564 | 9.8%), business (553 | 9.6%), bio, nature & agricultural (501 | 8.7%), and communications (487 | 8.4%) are the most common fields of study among 5,778 individuals in Athens who have obtained a bachelor's degree or higher.
| Field of Study | # Graduates | % Graduates |
| Computers & Mathematics | 324 | 5.6% |
| Bio, Nature & Agricultural | 501 | 8.7% |
| Physical & Health Sciences | 182 | 3.2% |
| Psychology | 174 | 3.0% |
| Social Sciences | 406 | 7.0% |
| Engineering | 329 | 5.7% |
| Multidisciplinary Studies | 137 | 2.4% |
| Science & Technology | 411 | 7.1% |
| Business | 553 | 9.6% |
| Education | 714 | 12.4% |
| Literature & Languages | 457 | 7.9% |
| Liberal Arts & History | 351 | 6.1% |
| Visual & Performing Arts | 564 | 9.8% |
| Communications | 487 | 8.4% |
| Arts & Humanities | 188 | 3.3% |
| Total | 5,778 | 100.0% |
Transportation & Commute in Athens
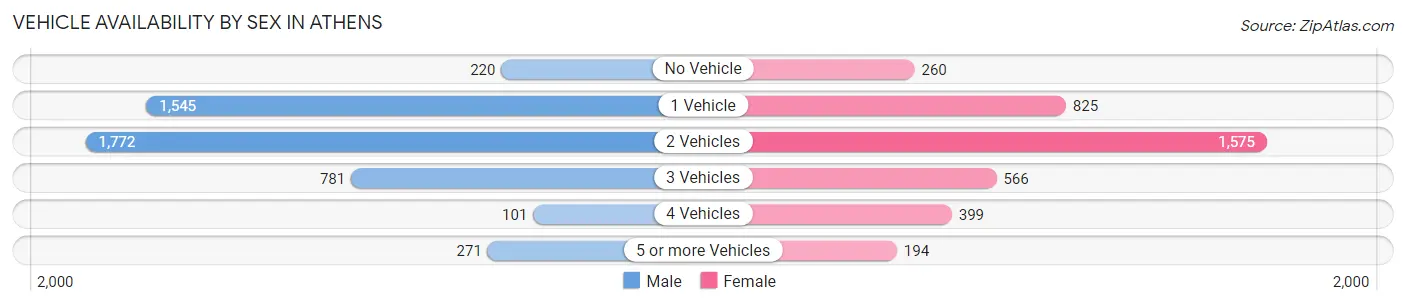
Vehicle Availability by Sex in Athens
The most prevalent vehicle ownership categories in Athens are males with 2 vehicles (1,772, accounting for 37.8%) and females with 2 vehicles (1,575, making up 46.4%).
| Vehicles Available | Male | Female |
| No Vehicle | 220 (4.7%) | 260 (6.8%) |
| 1 Vehicle | 1,545 (32.9%) | 825 (21.6%) |
| 2 Vehicles | 1,772 (37.8%) | 1,575 (41.2%) |
| 3 Vehicles | 781 (16.7%) | 566 (14.8%) |
| 4 Vehicles | 101 (2.1%) | 399 (10.4%) |
| 5 or more Vehicles | 271 (5.8%) | 194 (5.1%) |
| Total | 4,690 (100.0%) | 3,819 (100.0%) |
Commute Time in Athens
The most frequently occuring commute durations in Athens are 5 to 9 minutes (3,077 commuters, 33.1%), 10 to 14 minutes (2,458 commuters, 26.4%), and 15 to 19 minutes (1,033 commuters, 11.1%).
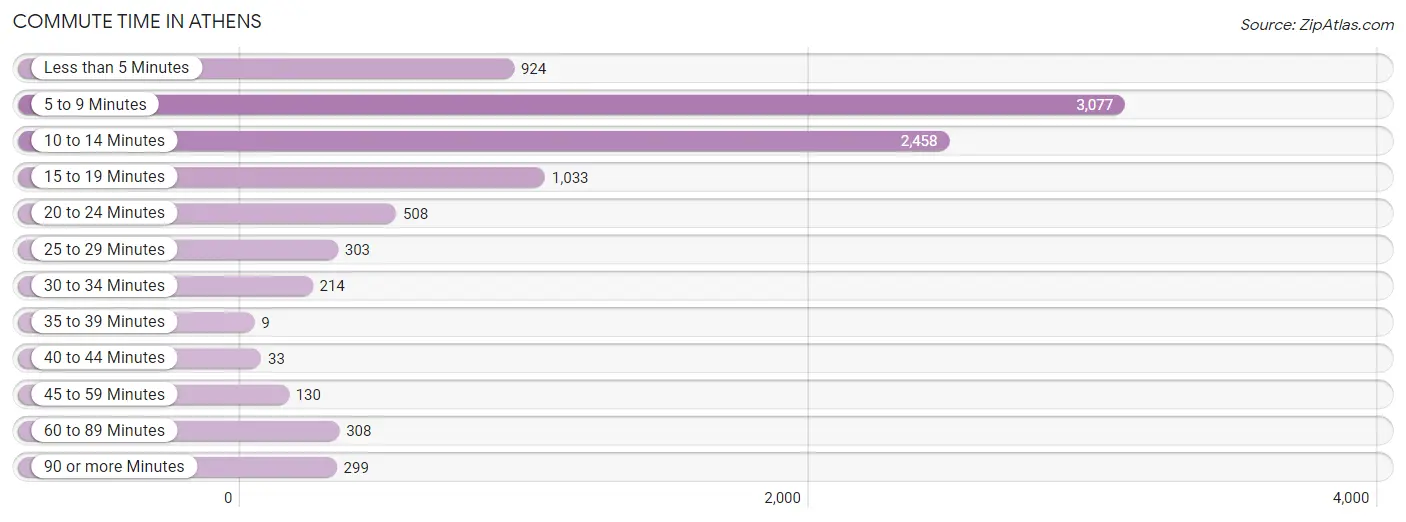
| Commute Time | # Commuters | % Commuters |
| Less than 5 Minutes | 924 | 9.9% |
| 5 to 9 Minutes | 3,077 | 33.1% |
| 10 to 14 Minutes | 2,458 | 26.4% |
| 15 to 19 Minutes | 1,033 | 11.1% |
| 20 to 24 Minutes | 508 | 5.5% |
| 25 to 29 Minutes | 303 | 3.3% |
| 30 to 34 Minutes | 214 | 2.3% |
| 35 to 39 Minutes | 9 | 0.1% |
| 40 to 44 Minutes | 33 | 0.4% |
| 45 to 59 Minutes | 130 | 1.4% |
| 60 to 89 Minutes | 308 | 3.3% |
| 90 or more Minutes | 299 | 3.2% |
Commute Time by Sex in Athens
The most common commute times in Athens are 5 to 9 minutes (1,354 commuters, 29.4%) for males and 5 to 9 minutes (1,723 commuters, 36.7%) for females.
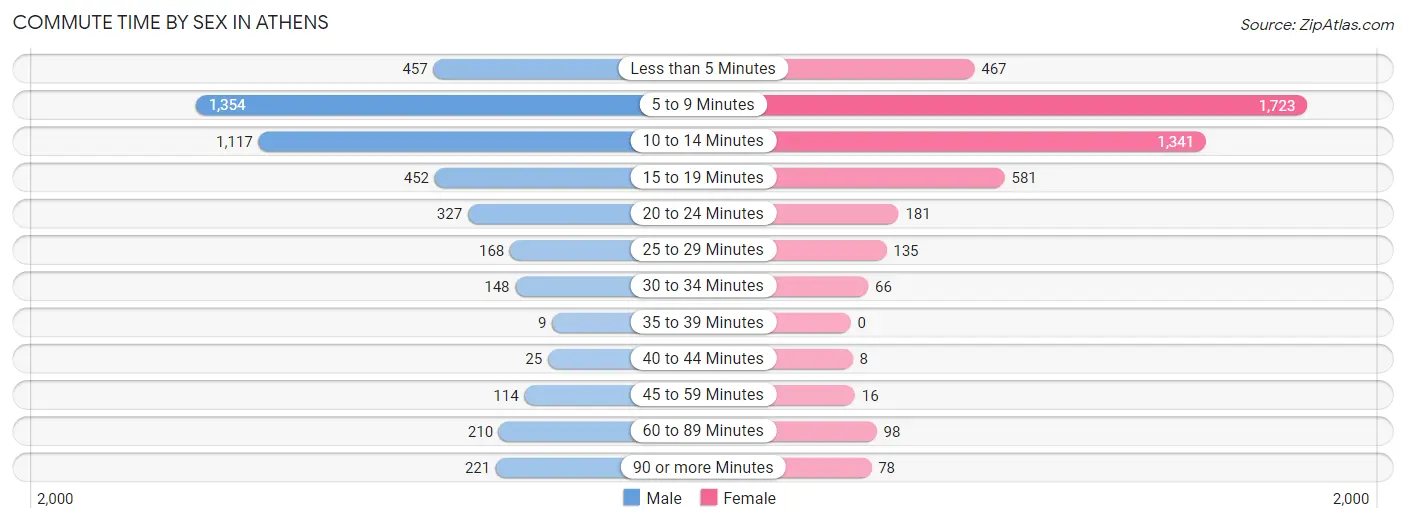
| Commute Time | Male | Female |
| Less than 5 Minutes | 457 (9.9%) | 467 (10.0%) |
| 5 to 9 Minutes | 1,354 (29.4%) | 1,723 (36.7%) |
| 10 to 14 Minutes | 1,117 (24.3%) | 1,341 (28.6%) |
| 15 to 19 Minutes | 452 (9.8%) | 581 (12.4%) |
| 20 to 24 Minutes | 327 (7.1%) | 181 (3.9%) |
| 25 to 29 Minutes | 168 (3.6%) | 135 (2.9%) |
| 30 to 34 Minutes | 148 (3.2%) | 66 (1.4%) |
| 35 to 39 Minutes | 9 (0.2%) | 0 (0.0%) |
| 40 to 44 Minutes | 25 (0.5%) | 8 (0.2%) |
| 45 to 59 Minutes | 114 (2.5%) | 16 (0.3%) |
| 60 to 89 Minutes | 210 (4.6%) | 98 (2.1%) |
| 90 or more Minutes | 221 (4.8%) | 78 (1.7%) |
Time of Departure to Work by Sex in Athens
The most frequent times of departure to work in Athens are 4:00 PM to 11:59 PM (833, 18.1%) for males and 12:00 PM to 3:59 PM (965, 20.6%) for females.
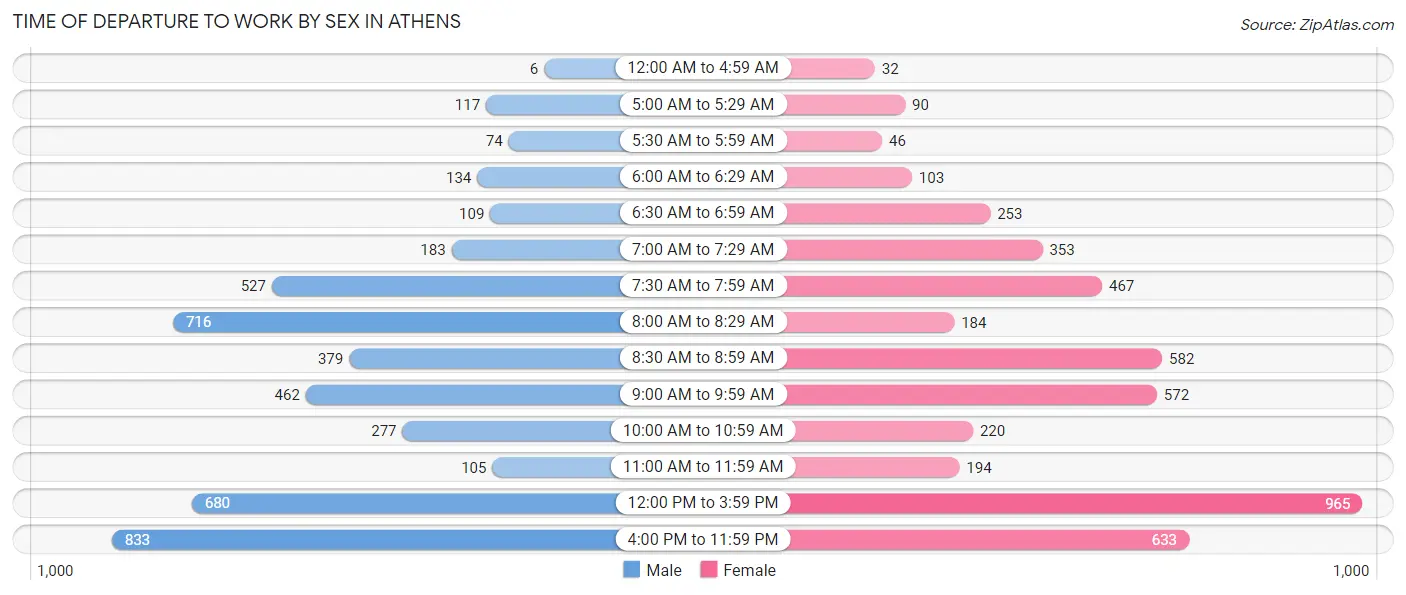
| Time of Departure | Male | Female |
| 12:00 AM to 4:59 AM | 6 (0.1%) | 32 (0.7%) |
| 5:00 AM to 5:29 AM | 117 (2.5%) | 90 (1.9%) |
| 5:30 AM to 5:59 AM | 74 (1.6%) | 46 (1.0%) |
| 6:00 AM to 6:29 AM | 134 (2.9%) | 103 (2.2%) |
| 6:30 AM to 6:59 AM | 109 (2.4%) | 253 (5.4%) |
| 7:00 AM to 7:29 AM | 183 (4.0%) | 353 (7.5%) |
| 7:30 AM to 7:59 AM | 527 (11.5%) | 467 (10.0%) |
| 8:00 AM to 8:29 AM | 716 (15.6%) | 184 (3.9%) |
| 8:30 AM to 8:59 AM | 379 (8.2%) | 582 (12.4%) |
| 9:00 AM to 9:59 AM | 462 (10.0%) | 572 (12.2%) |
| 10:00 AM to 10:59 AM | 277 (6.0%) | 220 (4.7%) |
| 11:00 AM to 11:59 AM | 105 (2.3%) | 194 (4.1%) |
| 12:00 PM to 3:59 PM | 680 (14.8%) | 965 (20.6%) |
| 4:00 PM to 11:59 PM | 833 (18.1%) | 633 (13.5%) |
| Total | 4,602 (100.0%) | 4,694 (100.0%) |
Housing Occupancy in Athens
Occupancy by Ownership in Athens
Of the total 6,595 dwellings in Athens, owner-occupied units account for 2,125 (32.2%), while renter-occupied units make up 4,470 (67.8%).
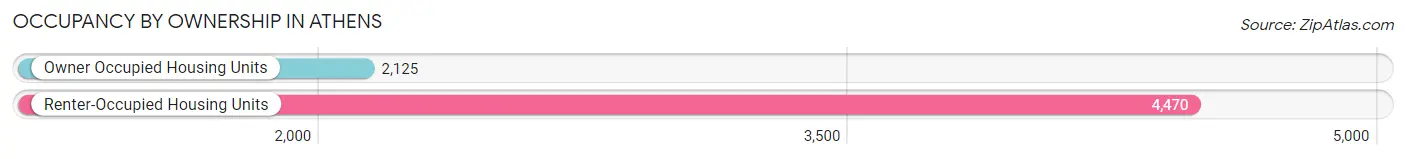
| Occupancy | # Housing Units | % Housing Units |
| Owner Occupied Housing Units | 2,125 | 32.2% |
| Renter-Occupied Housing Units | 4,470 | 67.8% |
| Total Occupied Housing Units | 6,595 | 100.0% |
Occupancy by Household Size in Athens
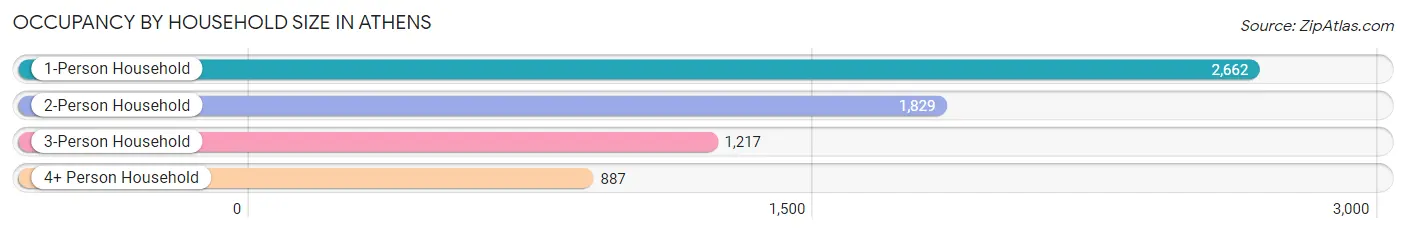
| Household Size | # Housing Units | % Housing Units |
| 1-Person Household | 2,662 | 40.4% |
| 2-Person Household | 1,829 | 27.7% |
| 3-Person Household | 1,217 | 18.4% |
| 4+ Person Household | 887 | 13.5% |
| Total Housing Units | 6,595 | 100.0% |
Occupancy by Ownership by Household Size in Athens
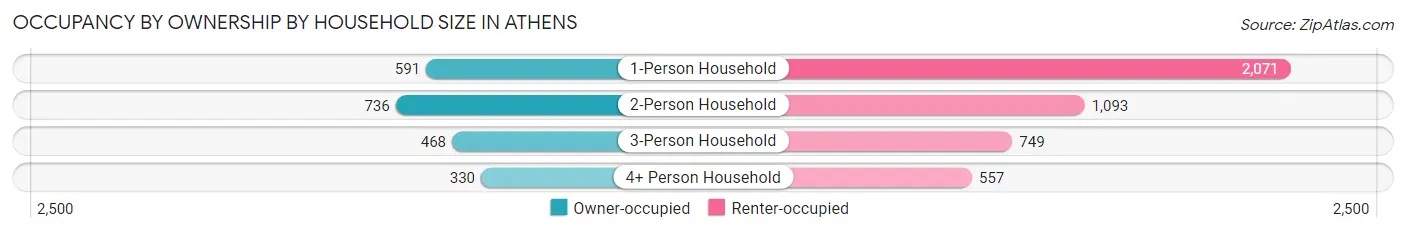
| Household Size | Owner-occupied | Renter-occupied |
| 1-Person Household | 591 (22.2%) | 2,071 (77.8%) |
| 2-Person Household | 736 (40.2%) | 1,093 (59.8%) |
| 3-Person Household | 468 (38.5%) | 749 (61.5%) |
| 4+ Person Household | 330 (37.2%) | 557 (62.8%) |
| Total Housing Units | 2,125 (32.2%) | 4,470 (67.8%) |
Occupancy by Educational Attainment in Athens
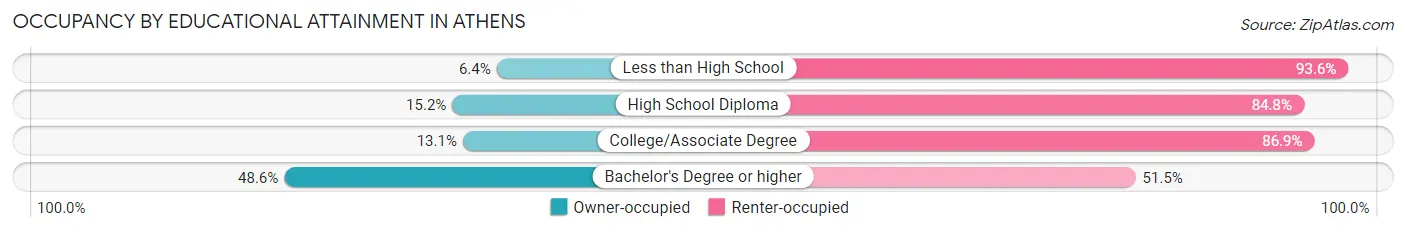
| Household Size | Owner-occupied | Renter-occupied |
| Less than High School | 22 (6.4%) | 320 (93.6%) |
| High School Diploma | 118 (15.2%) | 657 (84.8%) |
| College/Associate Degree | 250 (13.1%) | 1,654 (86.9%) |
| Bachelor's Degree or higher | 1,735 (48.5%) | 1,839 (51.4%) |
Occupancy by Age of Householder in Athens
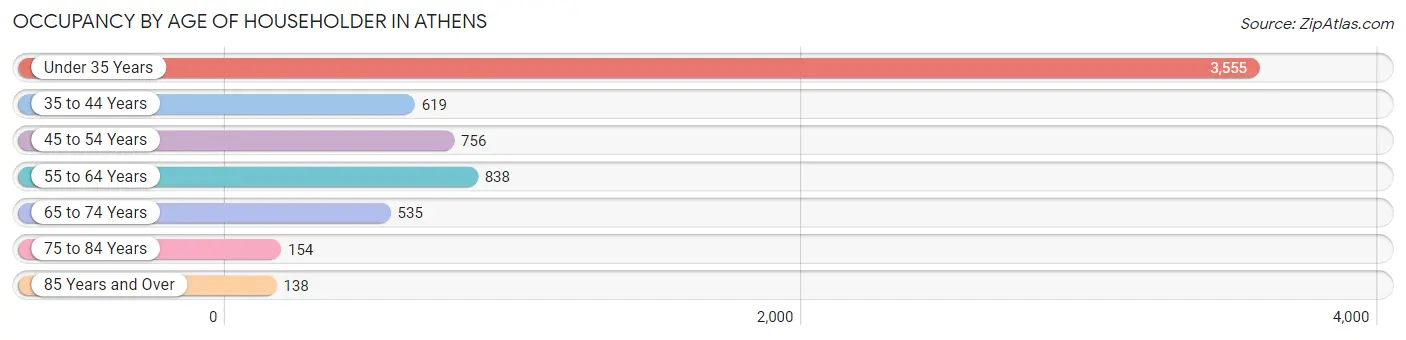
| Age Bracket | # Households | % Households |
| Under 35 Years | 3,555 | 53.9% |
| 35 to 44 Years | 619 | 9.4% |
| 45 to 54 Years | 756 | 11.5% |
| 55 to 64 Years | 838 | 12.7% |
| 65 to 74 Years | 535 | 8.1% |
| 75 to 84 Years | 154 | 2.3% |
| 85 Years and Over | 138 | 2.1% |
| Total | 6,595 | 100.0% |
Housing Finances in Athens
Median Income by Occupancy in Athens
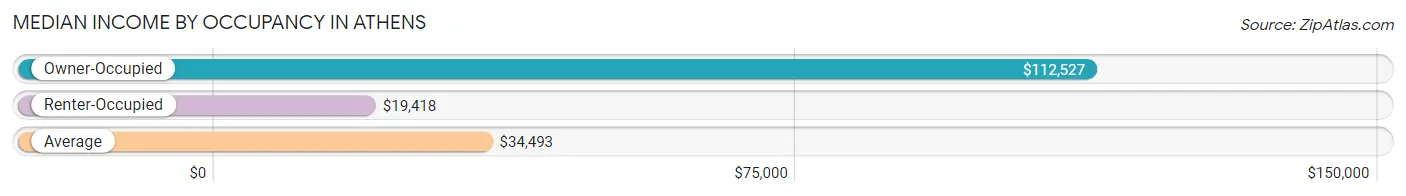
| Occupancy Type | # Households | Median Income |
| Owner-Occupied | 2,125 (32.2%) | $112,527 |
| Renter-Occupied | 4,470 (67.8%) | $19,418 |
| Average | 6,595 (100.0%) | $34,493 |
Occupancy by Householder Income Bracket in Athens
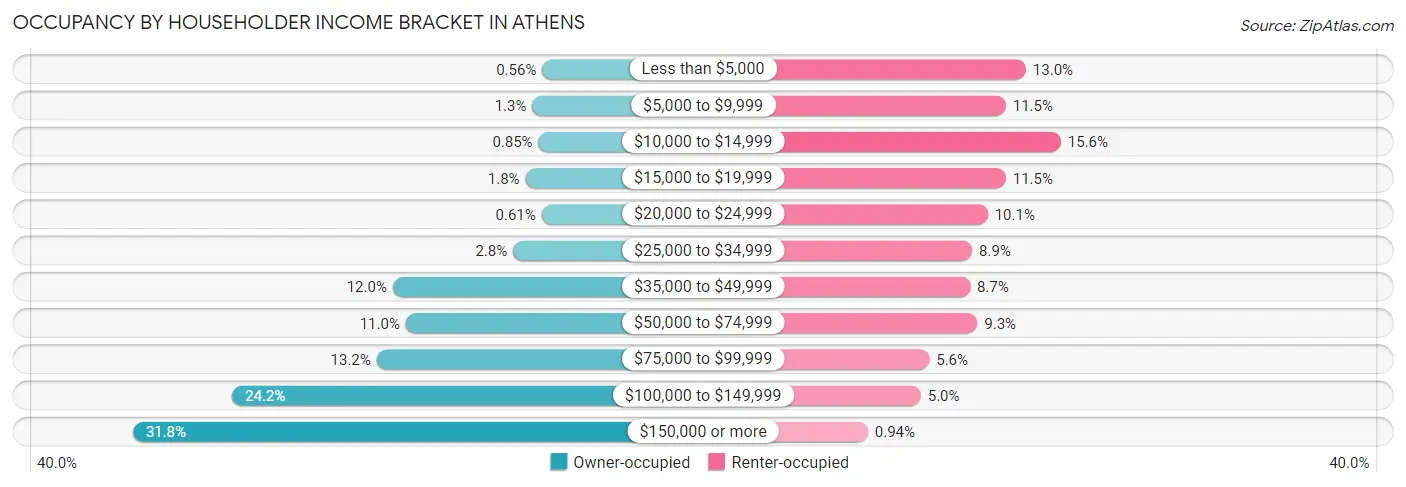
| Income Bracket | Owner-occupied | Renter-occupied |
| Less than $5,000 | 12 (0.6%) | 580 (13.0%) |
| $5,000 to $9,999 | 28 (1.3%) | 512 (11.5%) |
| $10,000 to $14,999 | 18 (0.9%) | 699 (15.6%) |
| $15,000 to $19,999 | 39 (1.8%) | 512 (11.5%) |
| $20,000 to $24,999 | 13 (0.6%) | 450 (10.1%) |
| $25,000 to $34,999 | 59 (2.8%) | 397 (8.9%) |
| $35,000 to $49,999 | 254 (11.9%) | 390 (8.7%) |
| $50,000 to $74,999 | 233 (11.0%) | 415 (9.3%) |
| $75,000 to $99,999 | 280 (13.2%) | 251 (5.6%) |
| $100,000 to $149,999 | 514 (24.2%) | 222 (5.0%) |
| $150,000 or more | 675 (31.8%) | 42 (0.9%) |
| Total | 2,125 (100.0%) | 4,470 (100.0%) |
Monthly Housing Cost Tiers in Athens
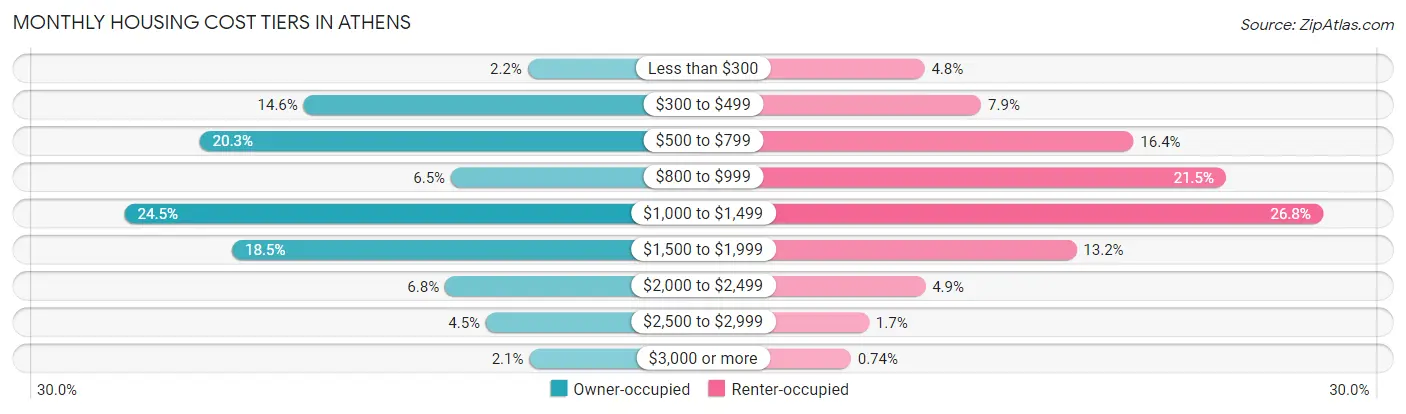
| Monthly Cost | Owner-occupied | Renter-occupied |
| Less than $300 | 47 (2.2%) | 215 (4.8%) |
| $300 to $499 | 310 (14.6%) | 355 (7.9%) |
| $500 to $799 | 432 (20.3%) | 731 (16.4%) |
| $800 to $999 | 137 (6.5%) | 959 (21.4%) |
| $1,000 to $1,499 | 520 (24.5%) | 1,198 (26.8%) |
| $1,500 to $1,999 | 394 (18.5%) | 590 (13.2%) |
| $2,000 to $2,499 | 144 (6.8%) | 217 (4.9%) |
| $2,500 to $2,999 | 96 (4.5%) | 78 (1.7%) |
| $3,000 or more | 45 (2.1%) | 33 (0.7%) |
| Total | 2,125 (100.0%) | 4,470 (100.0%) |
Physical Housing Characteristics in Athens
Housing Structures in Athens
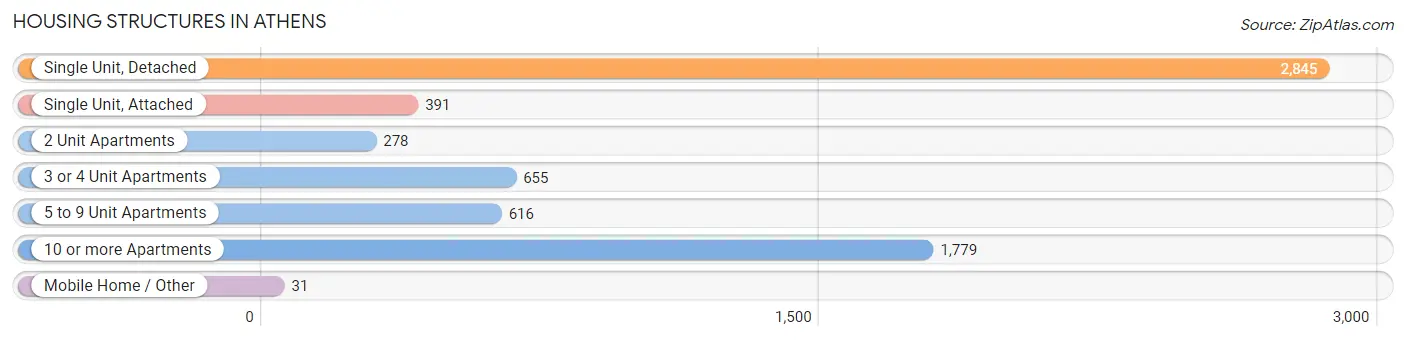
| Structure Type | # Housing Units | % Housing Units |
| Single Unit, Detached | 2,845 | 43.1% |
| Single Unit, Attached | 391 | 5.9% |
| 2 Unit Apartments | 278 | 4.2% |
| 3 or 4 Unit Apartments | 655 | 9.9% |
| 5 to 9 Unit Apartments | 616 | 9.3% |
| 10 or more Apartments | 1,779 | 27.0% |
| Mobile Home / Other | 31 | 0.5% |
| Total | 6,595 | 100.0% |
Housing Structures by Occupancy in Athens
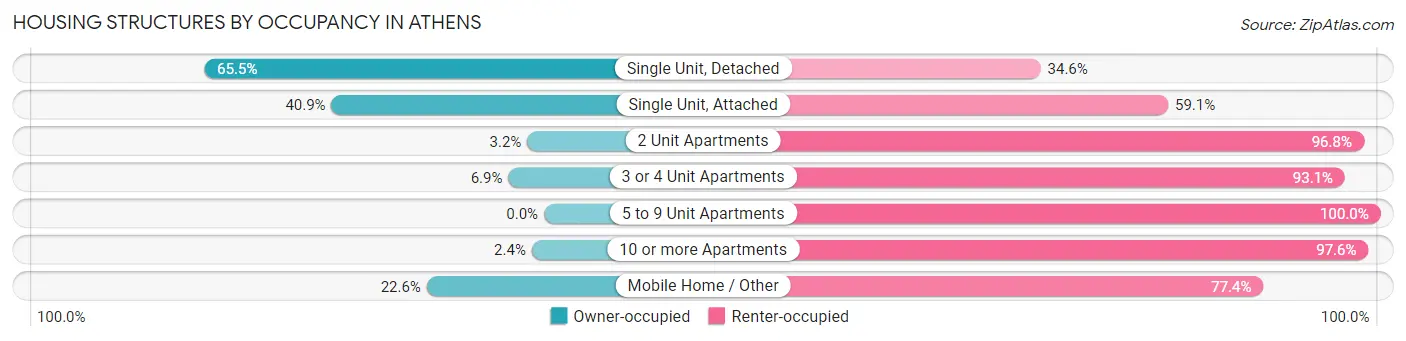
| Structure Type | Owner-occupied | Renter-occupied |
| Single Unit, Detached | 1,862 (65.4%) | 983 (34.5%) |
| Single Unit, Attached | 160 (40.9%) | 231 (59.1%) |
| 2 Unit Apartments | 9 (3.2%) | 269 (96.8%) |
| 3 or 4 Unit Apartments | 45 (6.9%) | 610 (93.1%) |
| 5 to 9 Unit Apartments | 0 (0.0%) | 616 (100.0%) |
| 10 or more Apartments | 42 (2.4%) | 1,737 (97.6%) |
| Mobile Home / Other | 7 (22.6%) | 24 (77.4%) |
| Total | 2,125 (32.2%) | 4,470 (67.8%) |
Housing Structures by Number of Rooms in Athens
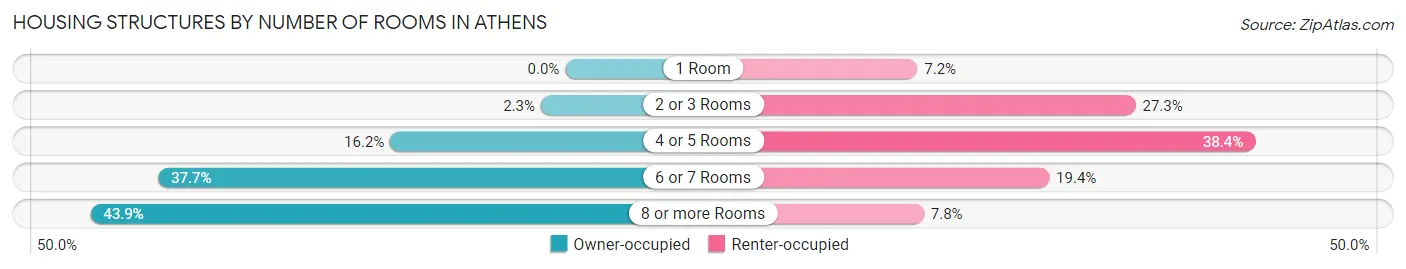
| Number of Rooms | Owner-occupied | Renter-occupied |
| 1 Room | 0 (0.0%) | 320 (7.2%) |
| 2 or 3 Rooms | 48 (2.3%) | 1,222 (27.3%) |
| 4 or 5 Rooms | 344 (16.2%) | 1,716 (38.4%) |
| 6 or 7 Rooms | 800 (37.7%) | 865 (19.4%) |
| 8 or more Rooms | 933 (43.9%) | 347 (7.8%) |
| Total | 2,125 (100.0%) | 4,470 (100.0%) |
Housing Structure by Heating Type in Athens
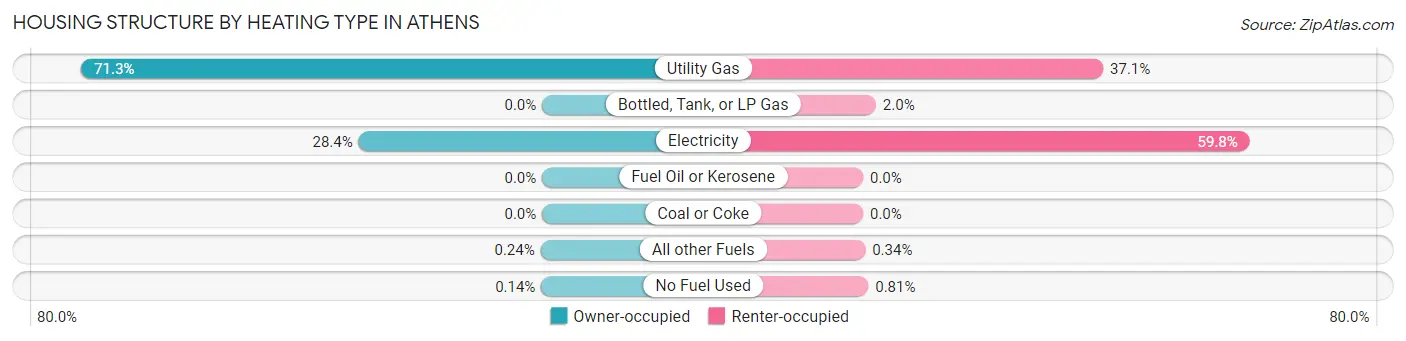
| Heating Type | Owner-occupied | Renter-occupied |
| Utility Gas | 1,514 (71.3%) | 1,659 (37.1%) |
| Bottled, Tank, or LP Gas | 0 (0.0%) | 89 (2.0%) |
| Electricity | 603 (28.4%) | 2,671 (59.8%) |
| Fuel Oil or Kerosene | 0 (0.0%) | 0 (0.0%) |
| Coal or Coke | 0 (0.0%) | 0 (0.0%) |
| All other Fuels | 5 (0.2%) | 15 (0.3%) |
| No Fuel Used | 3 (0.1%) | 36 (0.8%) |
| Total | 2,125 (100.0%) | 4,470 (100.0%) |
Household Vehicle Usage in Athens
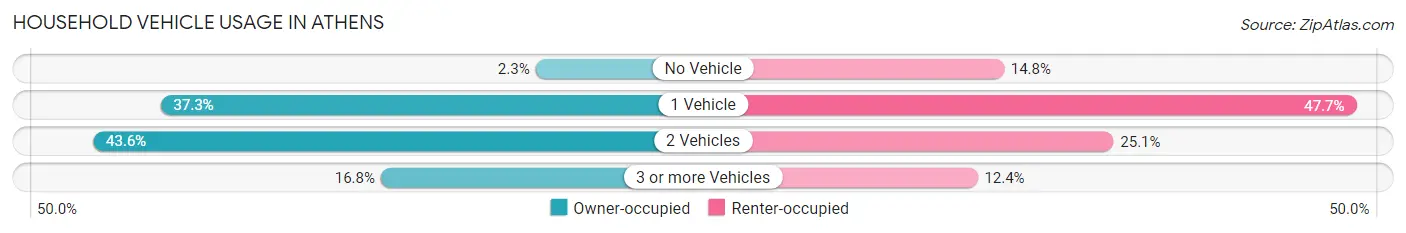
| Vehicles per Household | Owner-occupied | Renter-occupied |
| No Vehicle | 49 (2.3%) | 663 (14.8%) |
| 1 Vehicle | 793 (37.3%) | 2,134 (47.7%) |
| 2 Vehicles | 927 (43.6%) | 1,120 (25.1%) |
| 3 or more Vehicles | 356 (16.8%) | 553 (12.4%) |
| Total | 2,125 (100.0%) | 4,470 (100.0%) |
Real Estate & Mortgages in Athens
Real Estate and Mortgage Overview in Athens
| Characteristic | Without Mortgage | With Mortgage |
| Housing Units | 897 | 1,228 |
| Median Property Value | $230,100 | $234,400 |
| Median Household Income | $101,131 | $410 |
| Monthly Housing Costs | $576 | $45 |
| Real Estate Taxes | $3,279 | $8 |
Property Value by Mortgage Status in Athens
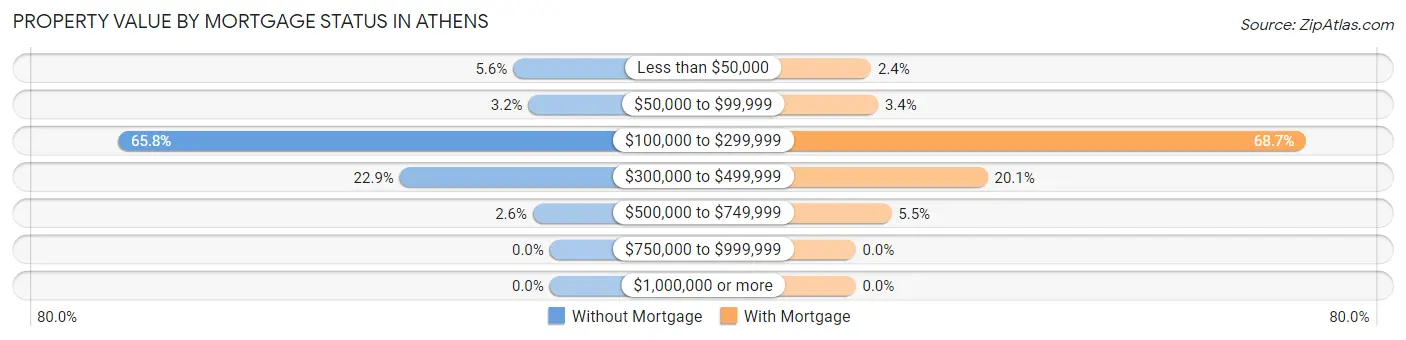
| Property Value | Without Mortgage | With Mortgage |
| Less than $50,000 | 50 (5.6%) | 29 (2.4%) |
| $50,000 to $99,999 | 29 (3.2%) | 42 (3.4%) |
| $100,000 to $299,999 | 590 (65.8%) | 843 (68.6%) |
| $300,000 to $499,999 | 205 (22.9%) | 247 (20.1%) |
| $500,000 to $749,999 | 23 (2.6%) | 67 (5.5%) |
| $750,000 to $999,999 | 0 (0.0%) | 0 (0.0%) |
| $1,000,000 or more | 0 (0.0%) | 0 (0.0%) |
| Total | 897 (100.0%) | 1,228 (100.0%) |
Household Income by Mortgage Status in Athens
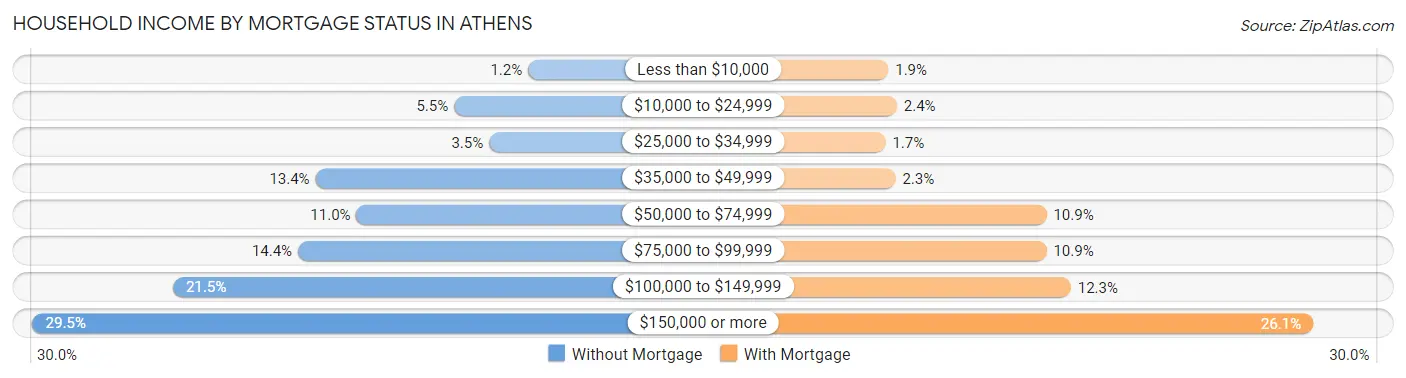
| Household Income | Without Mortgage | With Mortgage |
| Less than $10,000 | 11 (1.2%) | 23 (1.9%) |
| $10,000 to $24,999 | 49 (5.5%) | 29 (2.4%) |
| $25,000 to $34,999 | 31 (3.5%) | 21 (1.7%) |
| $35,000 to $49,999 | 120 (13.4%) | 28 (2.3%) |
| $50,000 to $74,999 | 99 (11.0%) | 134 (10.9%) |
| $75,000 to $99,999 | 129 (14.4%) | 134 (10.9%) |
| $100,000 to $149,999 | 193 (21.5%) | 151 (12.3%) |
| $150,000 or more | 265 (29.5%) | 321 (26.1%) |
| Total | 897 (100.0%) | 1,228 (100.0%) |
Property Value to Household Income Ratio in Athens
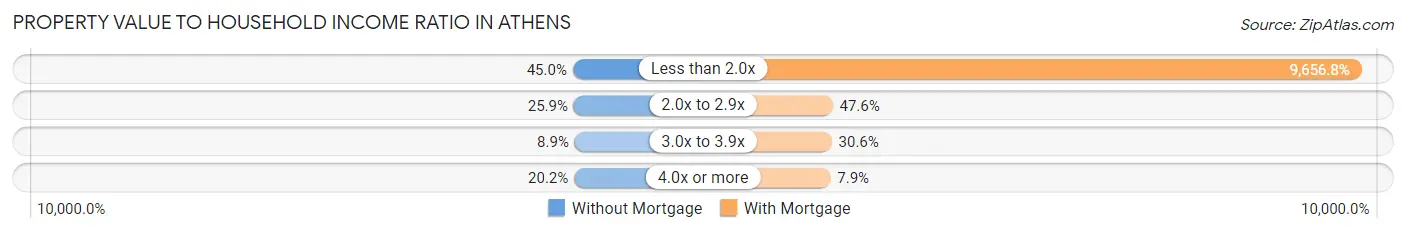
| Value-to-Income Ratio | Without Mortgage | With Mortgage |
| Less than 2.0x | 404 (45.0%) | 118,585 (9,656.8%) |
| 2.0x to 2.9x | 232 (25.9%) | 585 (47.6%) |
| 3.0x to 3.9x | 80 (8.9%) | 376 (30.6%) |
| 4.0x or more | 181 (20.2%) | 97 (7.9%) |
| Total | 897 (100.0%) | 1,228 (100.0%) |
Real Estate Taxes by Mortgage Status in Athens
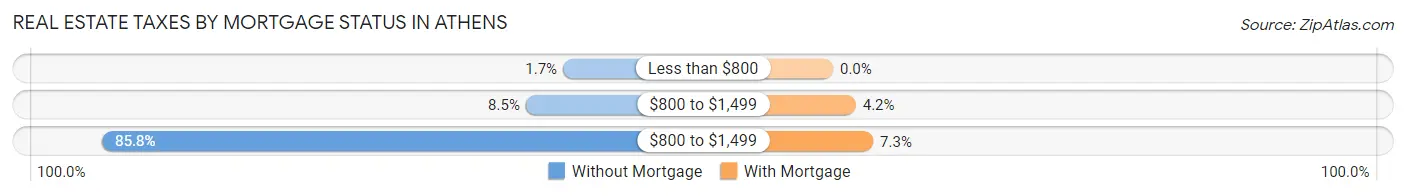
| Property Taxes | Without Mortgage | With Mortgage |
| Less than $800 | 15 (1.7%) | 0 (0.0%) |
| $800 to $1,499 | 76 (8.5%) | 51 (4.2%) |
| $800 to $1,499 | 770 (85.8%) | 90 (7.3%) |
| Total | 897 (100.0%) | 1,228 (100.0%) |
Health & Disability in Athens
Health Insurance Coverage by Age in Athens
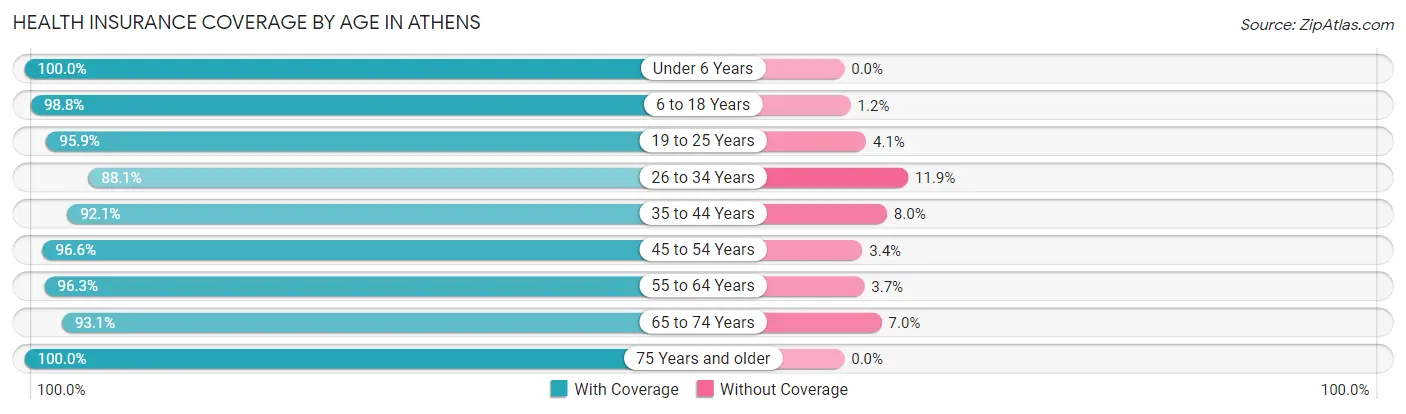
| Age Bracket | With Coverage | Without Coverage |
| Under 6 Years | 539 (100.0%) | 0 (0.0%) |
| 6 to 18 Years | 2,913 (98.8%) | 35 (1.2%) |
| 19 to 25 Years | 11,253 (95.9%) | 478 (4.1%) |
| 26 to 34 Years | 2,051 (88.1%) | 277 (11.9%) |
| 35 to 44 Years | 1,285 (92.0%) | 111 (8.0%) |
| 45 to 54 Years | 1,060 (96.6%) | 37 (3.4%) |
| 55 to 64 Years | 1,234 (96.3%) | 48 (3.7%) |
| 65 to 74 Years | 656 (93.0%) | 49 (7.0%) |
| 75 Years and older | 472 (100.0%) | 0 (0.0%) |
| Total | 21,463 (95.4%) | 1,035 (4.6%) |
Health Insurance Coverage by Citizenship Status in Athens
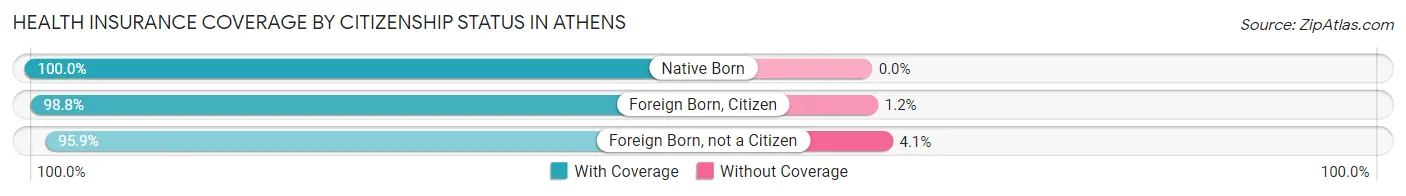
| Citizenship Status | With Coverage | Without Coverage |
| Native Born | 539 (100.0%) | 0 (0.0%) |
| Foreign Born, Citizen | 2,913 (98.8%) | 35 (1.2%) |
| Foreign Born, not a Citizen | 11,253 (95.9%) | 478 (4.1%) |
Health Insurance Coverage by Household Income in Athens
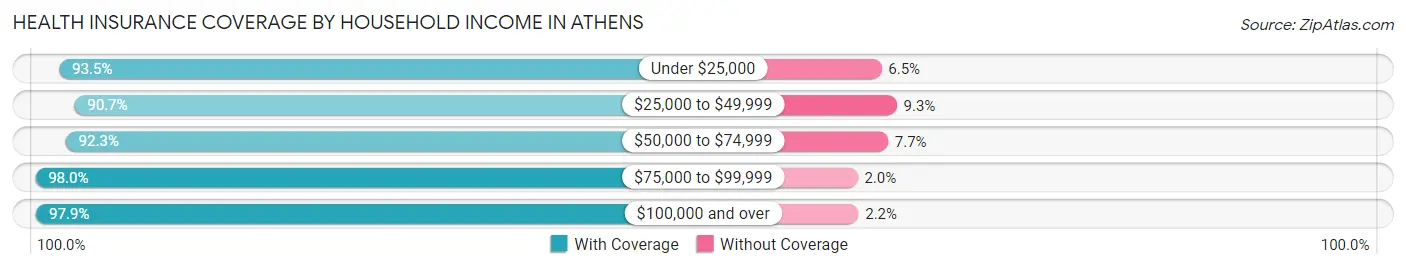
| Household Income | With Coverage | Without Coverage |
| Under $25,000 | 4,985 (93.5%) | 345 (6.5%) |
| $25,000 to $49,999 | 2,800 (90.7%) | 288 (9.3%) |
| $50,000 to $74,999 | 1,536 (92.3%) | 128 (7.7%) |
| $75,000 to $99,999 | 1,370 (98.0%) | 28 (2.0%) |
| $100,000 and over | 4,145 (97.9%) | 91 (2.1%) |
Public vs Private Health Insurance Coverage by Age in Athens
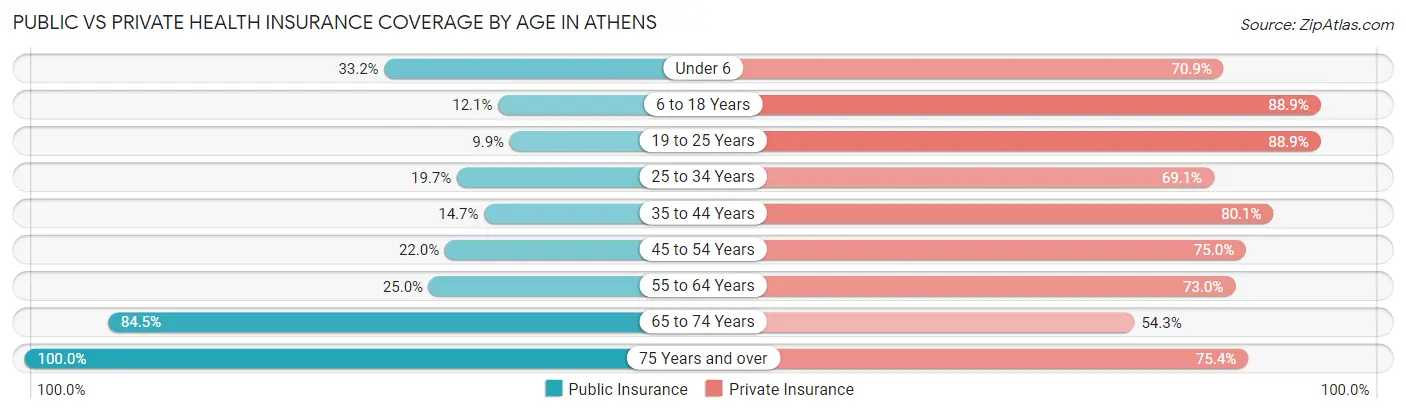
| Age Bracket | Public Insurance | Private Insurance |
| Under 6 | 179 (33.2%) | 382 (70.9%) |
| 6 to 18 Years | 356 (12.1%) | 2,620 (88.9%) |
| 19 to 25 Years | 1,163 (9.9%) | 10,423 (88.8%) |
| 25 to 34 Years | 459 (19.7%) | 1,608 (69.1%) |
| 35 to 44 Years | 205 (14.7%) | 1,118 (80.1%) |
| 45 to 54 Years | 241 (22.0%) | 823 (75.0%) |
| 55 to 64 Years | 320 (25.0%) | 936 (73.0%) |
| 65 to 74 Years | 596 (84.5%) | 383 (54.3%) |
| 75 Years and over | 472 (100.0%) | 356 (75.4%) |
| Total | 3,991 (17.7%) | 18,649 (82.9%) |
Disability Status by Sex by Age in Athens
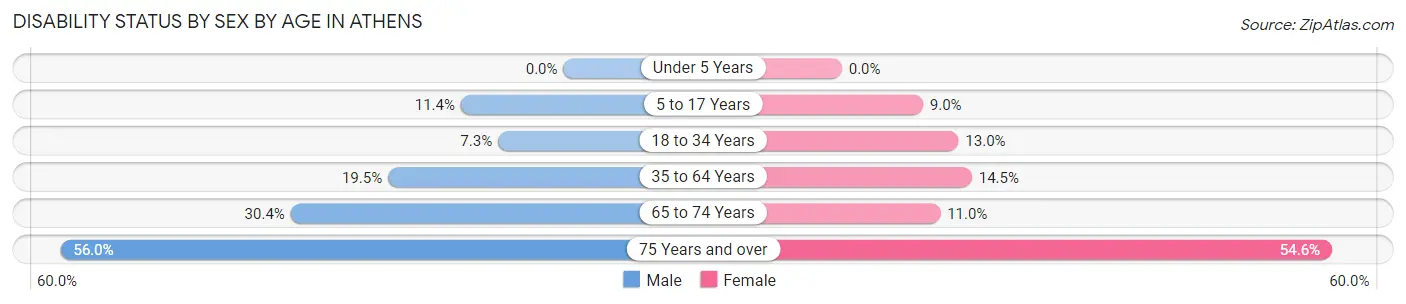
| Age Bracket | Male | Female |
| Under 5 Years | 0 (0.0%) | 0 (0.0%) |
| 5 to 17 Years | 69 (11.4%) | 52 (9.0%) |
| 18 to 34 Years | 559 (7.3%) | 1,066 (13.0%) |
| 35 to 64 Years | 404 (19.5%) | 247 (14.5%) |
| 65 to 74 Years | 106 (30.4%) | 39 (11.0%) |
| 75 Years and over | 93 (56.0%) | 167 (54.6%) |
Disability Class by Sex by Age in Athens
Disability Class: Hearing Difficulty
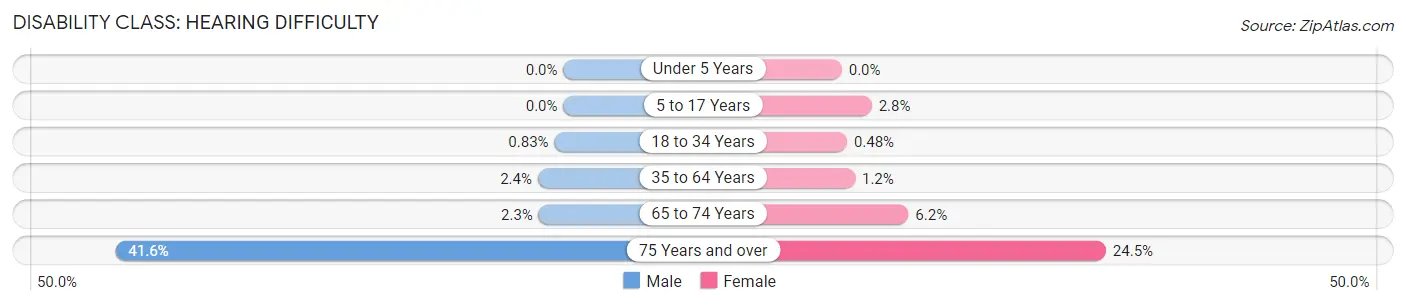
| Age Bracket | Male | Female |
| Under 5 Years | 0 (0.0%) | 0 (0.0%) |
| 5 to 17 Years | 0 (0.0%) | 16 (2.8%) |
| 18 to 34 Years | 64 (0.8%) | 39 (0.5%) |
| 35 to 64 Years | 49 (2.4%) | 21 (1.2%) |
| 65 to 74 Years | 8 (2.3%) | 22 (6.2%) |
| 75 Years and over | 69 (41.6%) | 75 (24.5%) |
Disability Class: Vision Difficulty
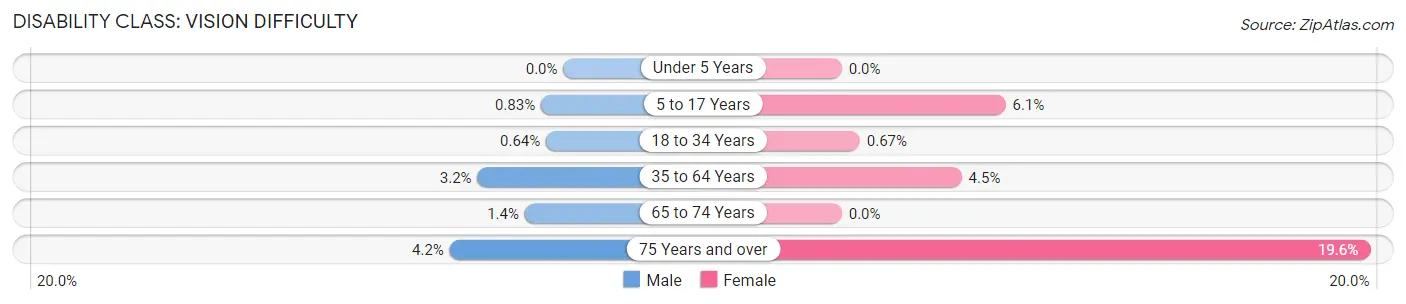
| Age Bracket | Male | Female |
| Under 5 Years | 0 (0.0%) | 0 (0.0%) |
| 5 to 17 Years | 5 (0.8%) | 35 (6.1%) |
| 18 to 34 Years | 49 (0.6%) | 55 (0.7%) |
| 35 to 64 Years | 66 (3.2%) | 76 (4.4%) |
| 65 to 74 Years | 5 (1.4%) | 0 (0.0%) |
| 75 Years and over | 7 (4.2%) | 60 (19.6%) |
Disability Class: Cognitive Difficulty
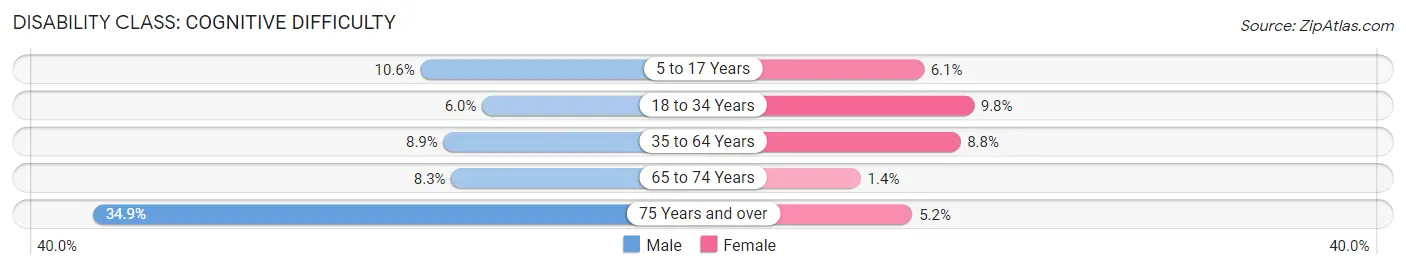
| Age Bracket | Male | Female |
| 5 to 17 Years | 64 (10.6%) | 35 (6.1%) |
| 18 to 34 Years | 462 (6.0%) | 804 (9.8%) |
| 35 to 64 Years | 184 (8.9%) | 150 (8.8%) |
| 65 to 74 Years | 29 (8.3%) | 5 (1.4%) |
| 75 Years and over | 58 (34.9%) | 16 (5.2%) |
Disability Class: Ambulatory Difficulty
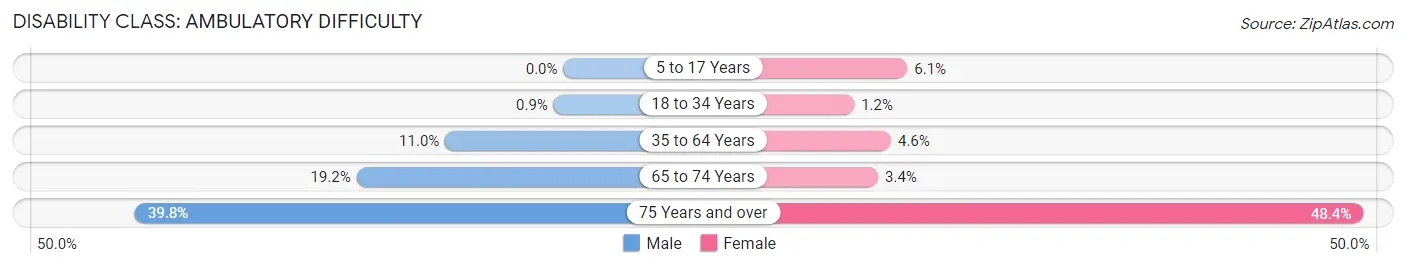
| Age Bracket | Male | Female |
| 5 to 17 Years | 0 (0.0%) | 35 (6.1%) |
| 18 to 34 Years | 69 (0.9%) | 94 (1.1%) |
| 35 to 64 Years | 227 (11.0%) | 78 (4.6%) |
| 65 to 74 Years | 67 (19.2%) | 12 (3.4%) |
| 75 Years and over | 66 (39.8%) | 148 (48.4%) |
Disability Class: Self-Care Difficulty
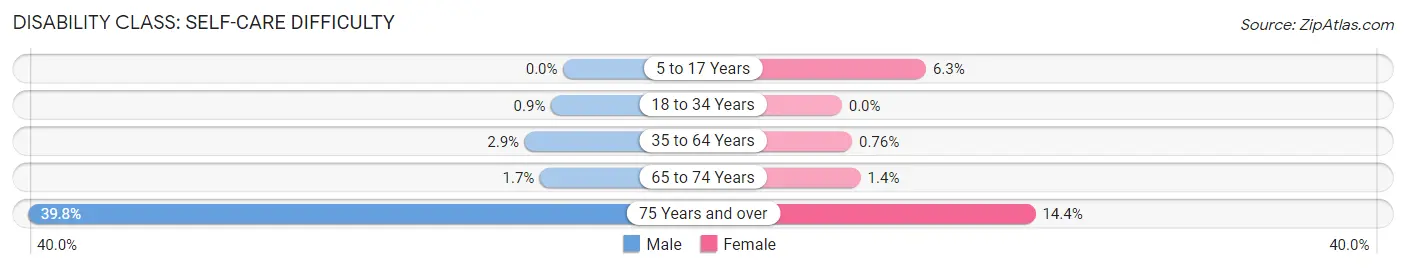
| Age Bracket | Male | Female |
| 5 to 17 Years | 0 (0.0%) | 36 (6.2%) |
| 18 to 34 Years | 69 (0.9%) | 0 (0.0%) |
| 35 to 64 Years | 59 (2.9%) | 13 (0.8%) |
| 65 to 74 Years | 6 (1.7%) | 5 (1.4%) |
| 75 Years and over | 66 (39.8%) | 44 (14.4%) |
Technology Access in Athens
Computing Device Access in Athens
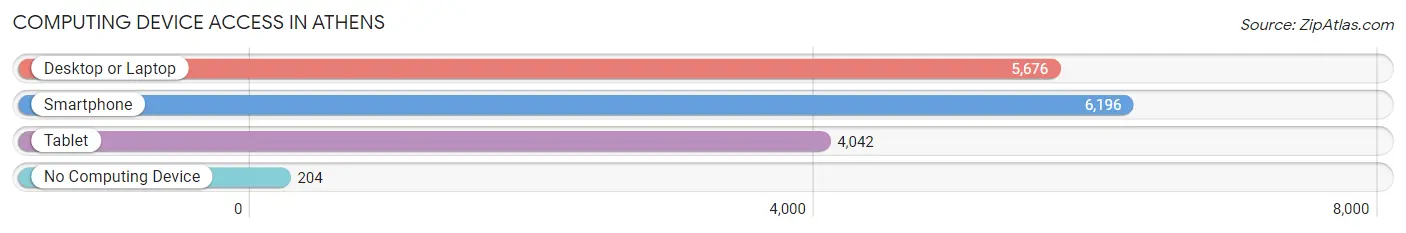
| Device Type | # Households | % Households |
| Desktop or Laptop | 5,676 | 86.1% |
| Smartphone | 6,196 | 94.0% |
| Tablet | 4,042 | 61.3% |
| No Computing Device | 204 | 3.1% |
| Total | 6,595 | 100.0% |
Internet Access in Athens
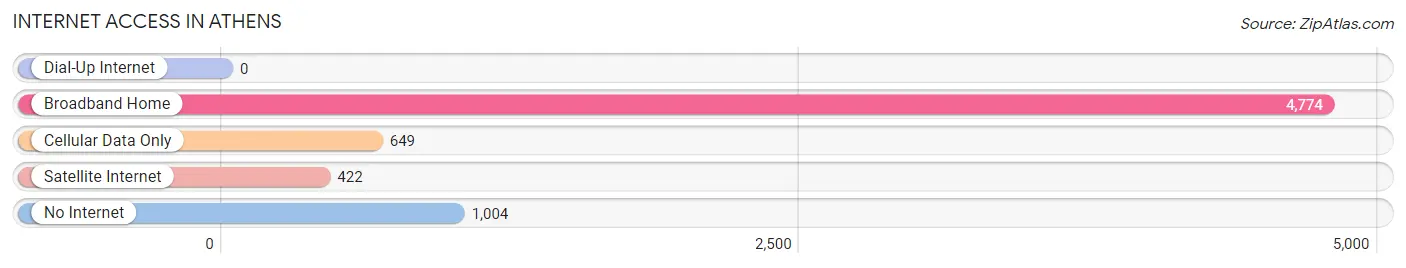
| Internet Type | # Households | % Households |
| Dial-Up Internet | 0 | 0.0% |
| Broadband Home | 4,774 | 72.4% |
| Cellular Data Only | 649 | 9.8% |
| Satellite Internet | 422 | 6.4% |
| No Internet | 1,004 | 15.2% |
| Total | 6,595 | 100.0% |
Athens Summary
Athens, Ohio is a city located in the southeastern part of the state of Ohio. It is the county seat of Athens County and is located along the Hocking River. The city is home to Ohio University, which is the oldest university in the state. Athens is also home to several other colleges and universities, including Hocking College and the Ohio University Heritage College of Osteopathic Medicine. The city has a population of approximately 25,000 people and is part of the larger Athens-Clarke County Metropolitan Statistical Area.
History
Athens was founded in 1797 by General Robert Lucas, who was the first governor of the Northwest Territory. The city was named after the ancient Greek city of Athens. The city was originally a trading post and was the first permanent settlement in the Northwest Territory. In 1802, the Ohio University was founded and the city quickly became a center of education and culture.
In the 19th century, Athens was a major center of the Underground Railroad, which helped slaves escape to freedom. The city was also a major center of the abolitionist movement. During the Civil War, Athens was a major center of Union support.
Geography
Athens is located in southeastern Ohio, along the Hocking River. The city is located in the Appalachian Plateau region of the state and is surrounded by rolling hills and forests. The city is located approximately 60 miles southeast of Columbus and is part of the larger Athens-Clarke County Metropolitan Statistical Area.
Economy
Athens is a major center of education and culture in the state of Ohio. The city is home to Ohio University, which is the oldest university in the state. The university is a major employer in the city and provides jobs for many of the city’s residents. The city is also home to several other colleges and universities, including Hocking College and the Ohio University Heritage College of Osteopathic Medicine.
The city is also home to several major industries, including manufacturing, healthcare, and technology. The city is home to several major employers, including Ohio University, O’Bleness Memorial Hospital, and the Ohio Valley Medical Center. The city is also home to several major retail stores, including Walmart, Target, and Kroger.
Demographics
As of the 2010 census, the population of Athens was 25,000. The city has a population that is predominantly white (90.2%), with a small African American population (3.2%) and a small Hispanic population (2.2%). The median household income in the city is $30,000 and the median home value is $125,000. The city has a poverty rate of 22.3%.
Athens is a diverse city with a variety of cultures and backgrounds. The city is home to a large student population, as well as a large number of immigrants from around the world. The city is also home to a large number of artists, musicians, and writers.
Athens is a vibrant city with a rich history and culture. The city is home to a variety of educational and cultural institutions, as well as a diverse population. The city is a major center of education and culture in the state of Ohio and is home to several major employers. The city is also home to a variety of retail stores and restaurants.
Common Questions
What is Per Capita Income in Athens?
Per Capita income in Athens is $22,737.
What is the Median Family Income in Athens?
Median Family Income in Athens is $104,432.
What is the Median Household income in Athens?
Median Household Income in Athens is $34,493.
What is Income or Wage Gap in Athens?
Income or Wage Gap in Athens is 40.2%.
Women in Athens earn 59.8 cents for every dollar earned by a man.
What is Family Income Deficit in Athens?
Family Income Deficit in Athens is $18,466.
Families that are below poverty line in Athens earn $18,466 less on average than the poverty threshold level.
What is Inequality or Gini Index in Athens?
Inequality or Gini Index in Athens is 0.60.
What is the Total Population of Athens?
Total Population of Athens is 22,698.
What is the Total Male Population of Athens?
Total Male Population of Athens is 11,214.
What is the Total Female Population of Athens?
Total Female Population of Athens is 11,484.
What is the Ratio of Males per 100 Females in Athens?
There are 97.65 Males per 100 Females in Athens.
What is the Ratio of Females per 100 Males in Athens?
There are 102.41 Females per 100 Males in Athens.
What is the Median Population Age in Athens?
Median Population Age in Athens is 21.9 Years.
What is the Average Family Size in Athens
Average Family Size in Athens is 3.0 People.
What is the Average Household Size in Athens
Average Household Size in Athens is 2.4 People.
How Large is the Labor Force in Athens?
There are 12,262 People in the Labor Forcein in Athens.
What is the Percentage of People in the Labor Force in Athens?
57.7% of People are in the Labor Force in Athens.
What is the Unemployment Rate in Athens?
Unemployment Rate in Athens is 7.5%.