Coffeyville, KS Map & Demographics
Coffeyville Map
Coffeyville Overview
$24,060
PER CAPITA INCOME
$53,657
AVG FAMILY INCOME
$41,220
AVG HOUSEHOLD INCOME
30.5%
WAGE / INCOME GAP [ % ]
69.5¢/ $1
WAGE / INCOME GAP [ $ ]
$12,667
FAMILY INCOME DEFICIT
0.45
INEQUALITY / GINI INDEX
8,842
TOTAL POPULATION
4,392
MALE POPULATION
4,450
FEMALE POPULATION
98.70
MALES / 100 FEMALES
101.32
FEMALES / 100 MALES
41.0
MEDIAN AGE
3.4
AVG FAMILY SIZE
2.3
AVG HOUSEHOLD SIZE
3,670
LABOR FORCE [ PEOPLE ]
51.0%
PERCENT IN LABOR FORCE
7.0%
UNEMPLOYMENT RATE
Coffeyville Zip Codes
Coffeyville Area Codes
Income in Coffeyville
Income Overview in Coffeyville
Per Capita Income in Coffeyville is $24,060, while median incomes of families and households are $53,657 and $41,220 respectively.
| Characteristic | Number | Measure |
| Per Capita Income | 8,842 | $24,060 |
| Median Family Income | 1,773 | $53,657 |
| Mean Family Income | 1,773 | $65,951 |
| Median Household Income | 3,575 | $41,220 |
| Mean Household Income | 3,575 | $53,085 |
| Income Deficit | 1,773 | $12,667 |
| Wage / Income Gap (%) | 8,842 | 30.52% |
| Wage / Income Gap ($) | 8,842 | 69.48¢ per $1 |
| Gini / Inequality Index | 8,842 | 0.45 |
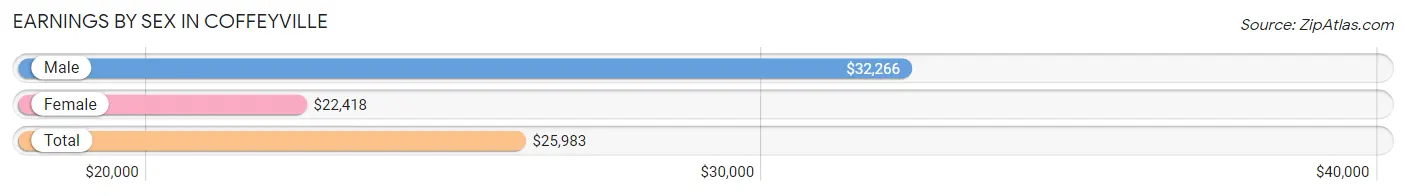
Earnings by Sex in Coffeyville
Average Earnings in Coffeyville are $25,983, $32,266 for men and $22,418 for women, a difference of 30.5%.
| Sex | Number | Average Earnings |
| Male | 1,992 (50.7%) | $32,266 |
| Female | 1,936 (49.3%) | $22,418 |
| Total | 3,928 (100.0%) | $25,983 |
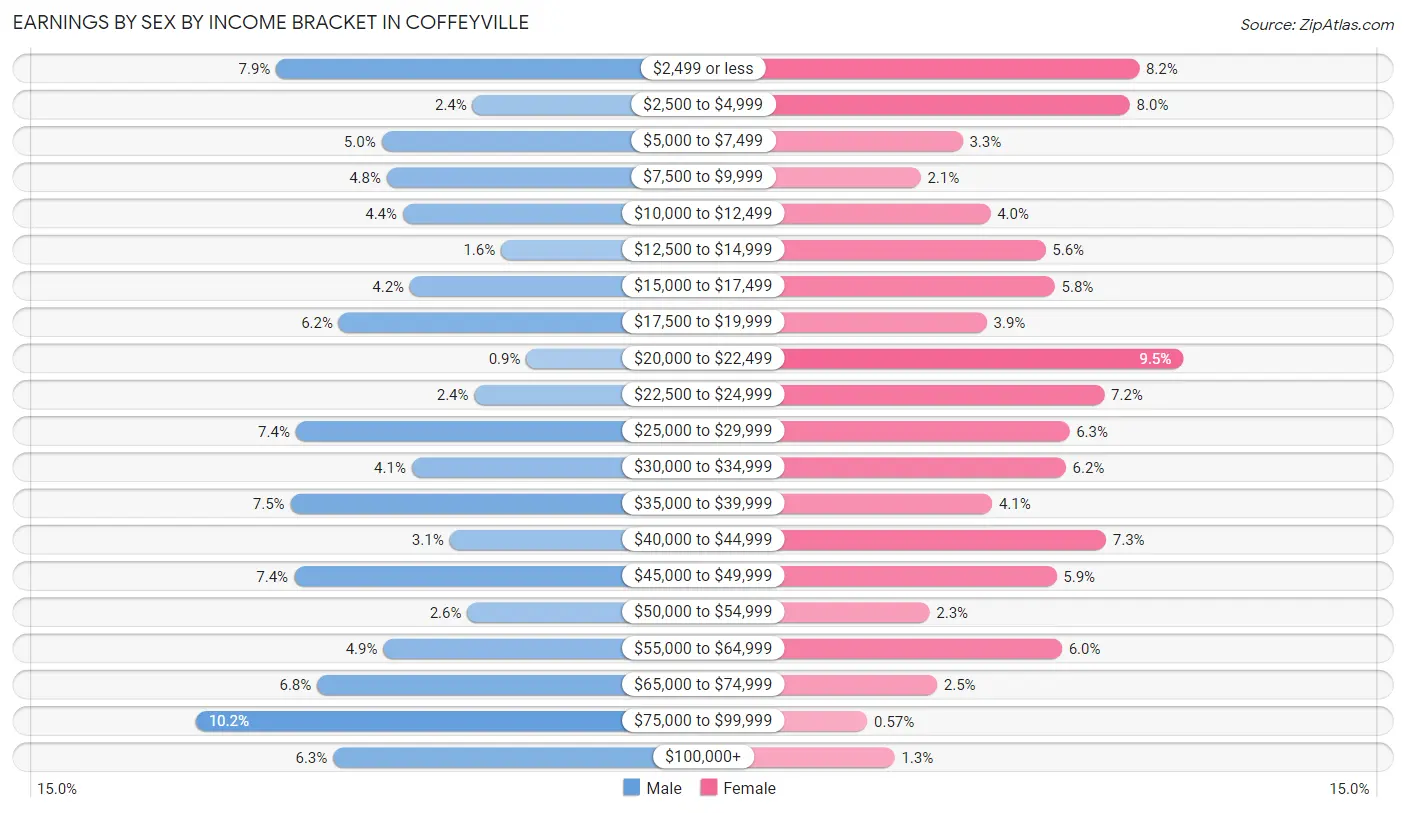
Earnings by Sex by Income Bracket in Coffeyville
The most common earnings brackets in Coffeyville are $75,000 to $99,999 for men (203 | 10.2%) and $20,000 to $22,499 for women (183 | 9.5%).
| Income | Male | Female |
| $2,499 or less | 158 (7.9%) | 159 (8.2%) |
| $2,500 to $4,999 | 48 (2.4%) | 154 (8.0%) |
| $5,000 to $7,499 | 99 (5.0%) | 63 (3.3%) |
| $7,500 to $9,999 | 96 (4.8%) | 40 (2.1%) |
| $10,000 to $12,499 | 87 (4.4%) | 78 (4.0%) |
| $12,500 to $14,999 | 32 (1.6%) | 108 (5.6%) |
| $15,000 to $17,499 | 83 (4.2%) | 113 (5.8%) |
| $17,500 to $19,999 | 123 (6.2%) | 76 (3.9%) |
| $20,000 to $22,499 | 18 (0.9%) | 183 (9.5%) |
| $22,500 to $24,999 | 47 (2.4%) | 140 (7.2%) |
| $25,000 to $29,999 | 147 (7.4%) | 121 (6.2%) |
| $30,000 to $34,999 | 82 (4.1%) | 119 (6.1%) |
| $35,000 to $39,999 | 150 (7.5%) | 79 (4.1%) |
| $40,000 to $44,999 | 61 (3.1%) | 141 (7.3%) |
| $45,000 to $49,999 | 148 (7.4%) | 114 (5.9%) |
| $50,000 to $54,999 | 51 (2.6%) | 45 (2.3%) |
| $55,000 to $64,999 | 98 (4.9%) | 117 (6.0%) |
| $65,000 to $74,999 | 135 (6.8%) | 49 (2.5%) |
| $75,000 to $99,999 | 203 (10.2%) | 11 (0.6%) |
| $100,000+ | 126 (6.3%) | 26 (1.3%) |
| Total | 1,992 (100.0%) | 1,936 (100.0%) |
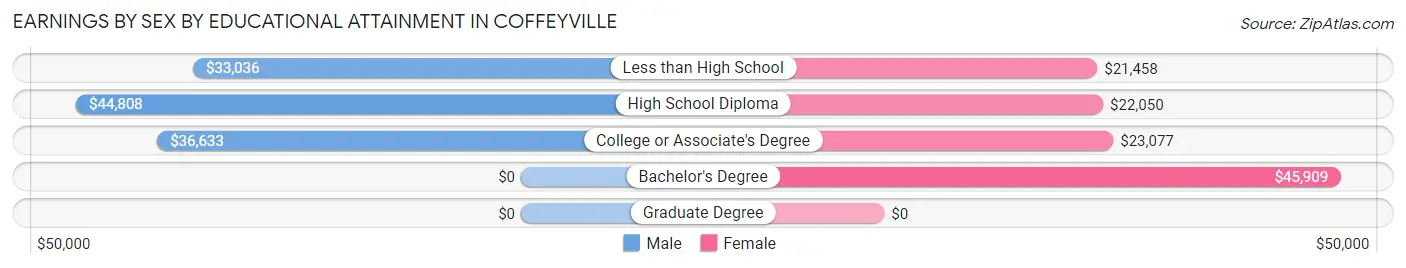
Earnings by Sex by Educational Attainment in Coffeyville
Average earnings in Coffeyville are $38,915 for men and $24,070 for women, a difference of 38.2%. Men with an educational attainment of high school diploma enjoy the highest average annual earnings of $44,808, while those with less than high school education earn the least with $33,036. Women with an educational attainment of bachelor's degree earn the most with the average annual earnings of $45,909, while those with less than high school education have the smallest earnings of $21,458.
| Educational Attainment | Male Income | Female Income |
| Less than High School | $33,036 | $21,458 |
| High School Diploma | $44,808 | $22,050 |
| College or Associate's Degree | $36,633 | $23,077 |
| Bachelor's Degree | - | - |
| Graduate Degree | - | - |
| Total | $38,915 | $24,070 |
Family Income in Coffeyville
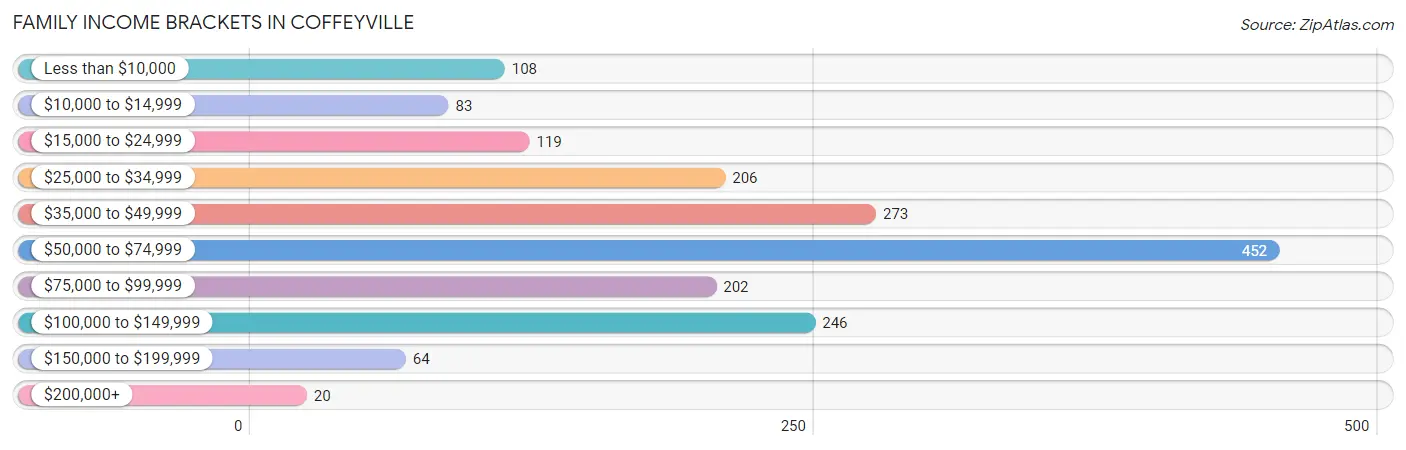
Family Income Brackets in Coffeyville
According to the Coffeyville family income data, there are 452 families falling into the $50,000 to $74,999 income range, which is the most common income bracket and makes up 25.5% of all families. Conversely, the $200,000+ income bracket is the least frequent group with only 20 families (1.1%) belonging to this category.
| Income Bracket | # Families | % Families |
| Less than $10,000 | 108 | 6.1% |
| $10,000 to $14,999 | 83 | 4.7% |
| $15,000 to $24,999 | 119 | 6.7% |
| $25,000 to $34,999 | 206 | 11.6% |
| $35,000 to $49,999 | 273 | 15.4% |
| $50,000 to $74,999 | 452 | 25.5% |
| $75,000 to $99,999 | 202 | 11.4% |
| $100,000 to $149,999 | 246 | 13.9% |
| $150,000 to $199,999 | 64 | 3.6% |
| $200,000+ | 20 | 1.1% |
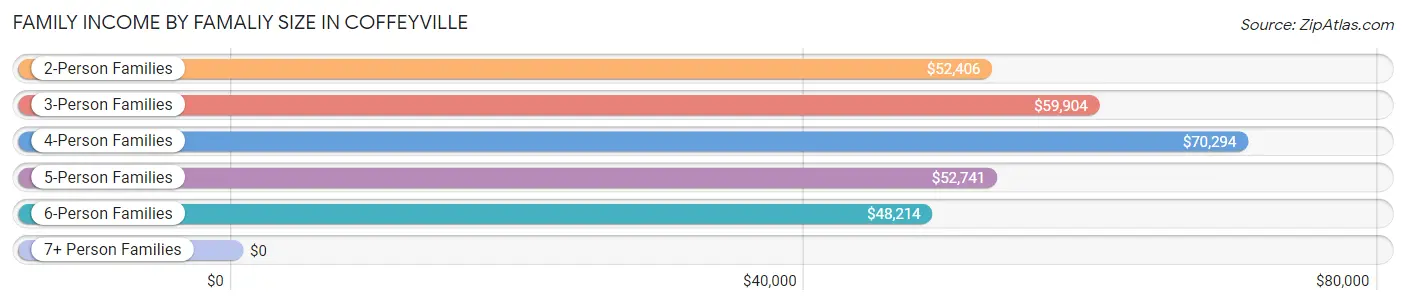
Family Income by Famaliy Size in Coffeyville
4-person families (286 | 16.1%) account for the highest median family income in Coffeyville with $70,294 per family, while 2-person families (939 | 53.0%) have the highest median income of $26,203 per family member.
| Income Bracket | # Families | Median Income |
| 2-Person Families | 939 (53.0%) | $52,406 |
| 3-Person Families | 179 (10.1%) | $59,904 |
| 4-Person Families | 286 (16.1%) | $70,294 |
| 5-Person Families | 265 (14.9%) | $52,741 |
| 6-Person Families | 96 (5.4%) | $48,214 |
| 7+ Person Families | 8 (0.4%) | $0 |
| Total | 1,773 (100.0%) | $53,657 |
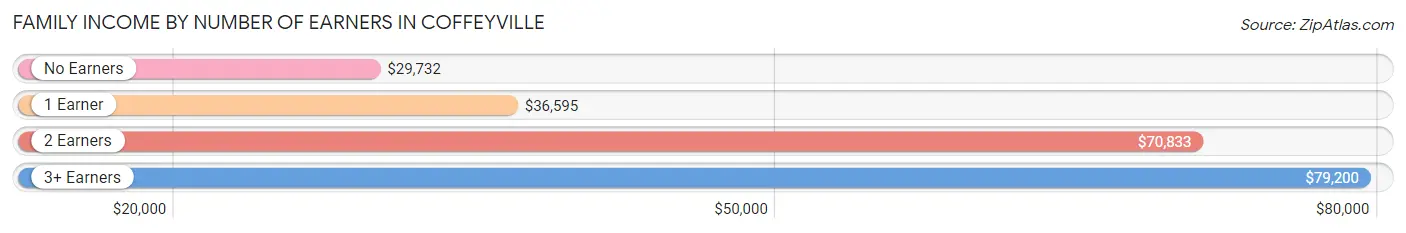
Family Income by Number of Earners in Coffeyville
The median family income in Coffeyville is $53,657, with families comprising 3+ earners (108) having the highest median family income of $79,200, while families with no earners (295) have the lowest median family income of $29,732, accounting for 6.1% and 16.6% of families, respectively.
| Number of Earners | # Families | Median Income |
| No Earners | 295 (16.6%) | $29,732 |
| 1 Earner | 690 (38.9%) | $36,595 |
| 2 Earners | 680 (38.4%) | $70,833 |
| 3+ Earners | 108 (6.1%) | $79,200 |
| Total | 1,773 (100.0%) | $53,657 |
Household Income in Coffeyville
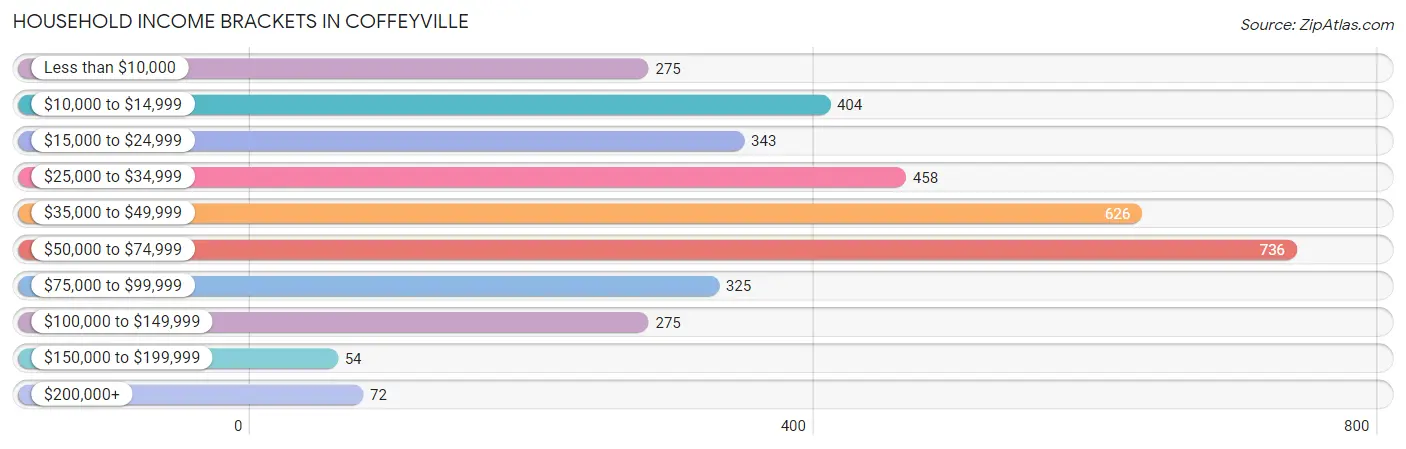
Household Income Brackets in Coffeyville
With 736 households falling in the category, the $50,000 to $74,999 income range is the most frequent in Coffeyville, accounting for 20.6% of all households. In contrast, only 54 households (1.5%) fall into the $150,000 to $199,999 income bracket, making it the least populous group.
| Income Bracket | # Households | % Households |
| Less than $10,000 | 275 | 7.7% |
| $10,000 to $14,999 | 404 | 11.3% |
| $15,000 to $24,999 | 343 | 9.6% |
| $25,000 to $34,999 | 458 | 12.8% |
| $35,000 to $49,999 | 626 | 17.5% |
| $50,000 to $74,999 | 736 | 20.6% |
| $75,000 to $99,999 | 325 | 9.1% |
| $100,000 to $149,999 | 275 | 7.7% |
| $150,000 to $199,999 | 54 | 1.5% |
| $200,000+ | 72 | 2.0% |
Household Income by Householder Age in Coffeyville
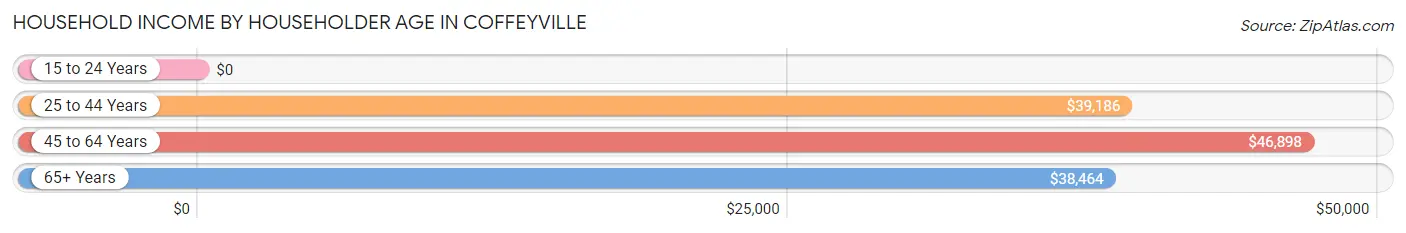
The median household income in Coffeyville is $41,220, with the highest median household income of $46,898 found in the 45 to 64 years age bracket for the primary householder. A total of 1,456 households (40.7%) fall into this category. Meanwhile, the 15 to 24 years age bracket for the primary householder has the lowest median household income of $0, with 51 households (1.4%) in this group.
| Income Bracket | # Households | Median Income |
| 15 to 24 Years | 51 (1.4%) | $0 |
| 25 to 44 Years | 892 (24.9%) | $39,186 |
| 45 to 64 Years | 1,456 (40.7%) | $46,898 |
| 65+ Years | 1,176 (32.9%) | $38,464 |
| Total | 3,575 (100.0%) | $41,220 |
Poverty in Coffeyville
Income Below Poverty by Sex and Age in Coffeyville
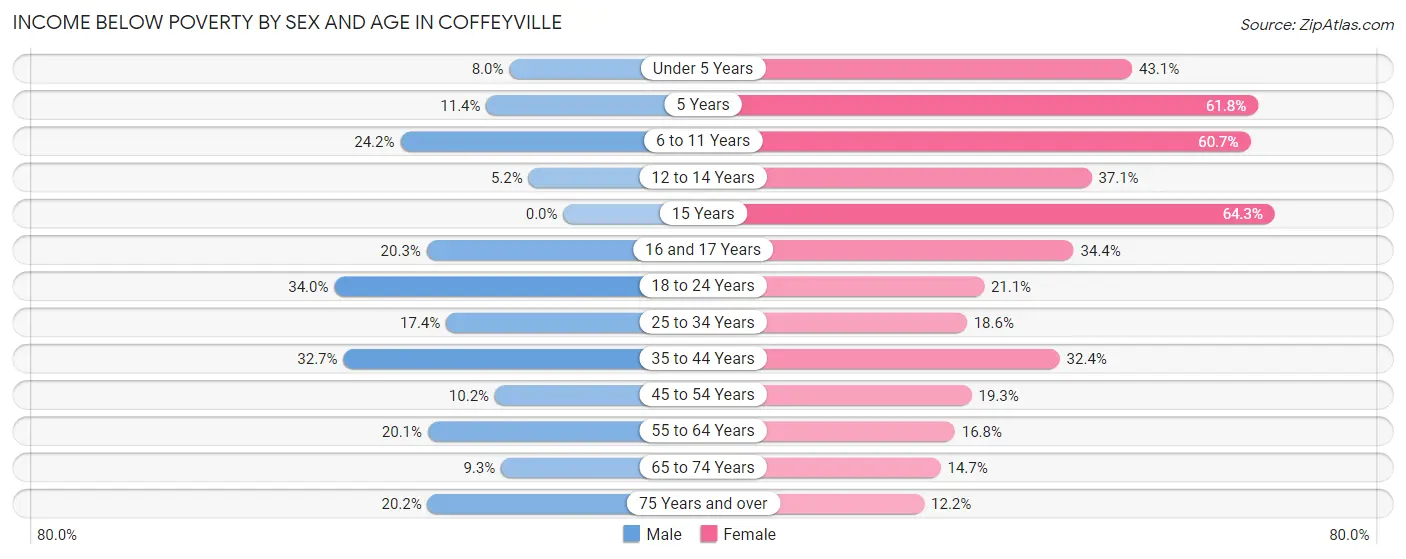
With 18.2% poverty level for males and 26.9% for females among the residents of Coffeyville, 18 to 24 year old males and 15 year old females are the most vulnerable to poverty, with 101 males (34.0%) and 54 females (64.3%) in their respective age groups living below the poverty level.
| Age Bracket | Male | Female |
| Under 5 Years | 22 (8.0%) | 103 (43.1%) |
| 5 Years | 4 (11.4%) | 55 (61.8%) |
| 6 to 11 Years | 61 (24.2%) | 219 (60.7%) |
| 12 to 14 Years | 9 (5.2%) | 43 (37.1%) |
| 15 Years | 0 (0.0%) | 54 (64.3%) |
| 16 and 17 Years | 27 (20.3%) | 53 (34.4%) |
| 18 to 24 Years | 101 (34.0%) | 38 (21.1%) |
| 25 to 34 Years | 98 (17.4%) | 105 (18.5%) |
| 35 to 44 Years | 131 (32.7%) | 143 (32.4%) |
| 45 to 54 Years | 57 (10.2%) | 79 (19.3%) |
| 55 to 64 Years | 135 (20.1%) | 125 (16.8%) |
| 65 to 74 Years | 38 (9.2%) | 56 (14.7%) |
| 75 Years and over | 71 (20.2%) | 50 (12.2%) |
| Total | 754 (18.2%) | 1,123 (26.9%) |
Income Above Poverty by Sex and Age in Coffeyville
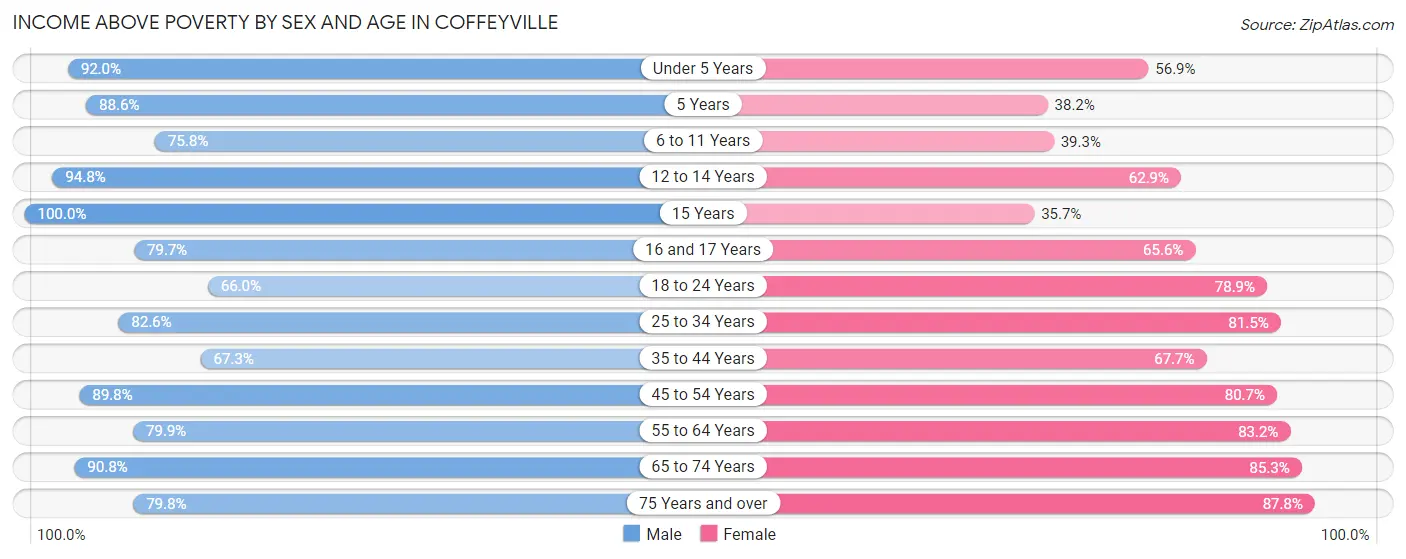
According to the poverty statistics in Coffeyville, males aged 15 years and females aged 75 years and over are the age groups that are most secure financially, with 100.0% of males and 87.8% of females in these age groups living above the poverty line.
| Age Bracket | Male | Female |
| Under 5 Years | 252 (92.0%) | 136 (56.9%) |
| 5 Years | 31 (88.6%) | 34 (38.2%) |
| 6 to 11 Years | 191 (75.8%) | 142 (39.3%) |
| 12 to 14 Years | 165 (94.8%) | 73 (62.9%) |
| 15 Years | 16 (100.0%) | 30 (35.7%) |
| 16 and 17 Years | 106 (79.7%) | 101 (65.6%) |
| 18 to 24 Years | 196 (66.0%) | 142 (78.9%) |
| 25 to 34 Years | 465 (82.6%) | 461 (81.5%) |
| 35 to 44 Years | 270 (67.3%) | 299 (67.6%) |
| 45 to 54 Years | 504 (89.8%) | 331 (80.7%) |
| 55 to 64 Years | 536 (79.9%) | 620 (83.2%) |
| 65 to 74 Years | 373 (90.7%) | 326 (85.3%) |
| 75 Years and over | 281 (79.8%) | 359 (87.8%) |
| Total | 3,386 (81.8%) | 3,054 (73.1%) |
Income Below Poverty Among Married-Couple Families in Coffeyville
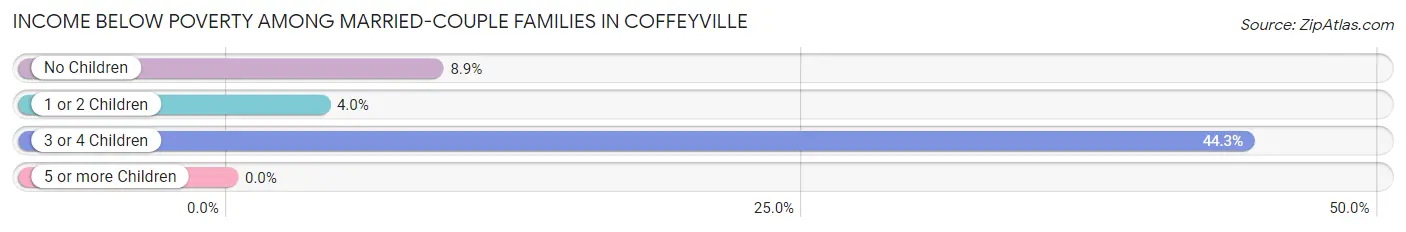
The poverty statistics for married-couple families in Coffeyville show that 13.1% or 155 of the total 1,185 families live below the poverty line. Families with 3 or 4 children have the highest poverty rate of 44.3%, comprising of 77 families. On the other hand, families with 1 or 2 children have the lowest poverty rate of 4.0%, which includes 10 families.
| Children | Above Poverty | Below Poverty |
| No Children | 693 (91.1%) | 68 (8.9%) |
| 1 or 2 Children | 240 (96.0%) | 10 (4.0%) |
| 3 or 4 Children | 97 (55.7%) | 77 (44.3%) |
| 5 or more Children | 0 (0.0%) | 0 (0.0%) |
| Total | 1,030 (86.9%) | 155 (13.1%) |
Income Below Poverty Among Single-Parent Households in Coffeyville
According to the poverty data in Coffeyville, 14.4% or 21 single-father households and 26.0% or 115 single-mother households are living below the poverty line. Among single-father households, those with 3 or 4 children have the highest poverty rate, with 5 households (71.4%) experiencing poverty. Likewise, among single-mother households, those with 5 or more children have the highest poverty rate, with 8 households (100.0%) falling below the poverty line.
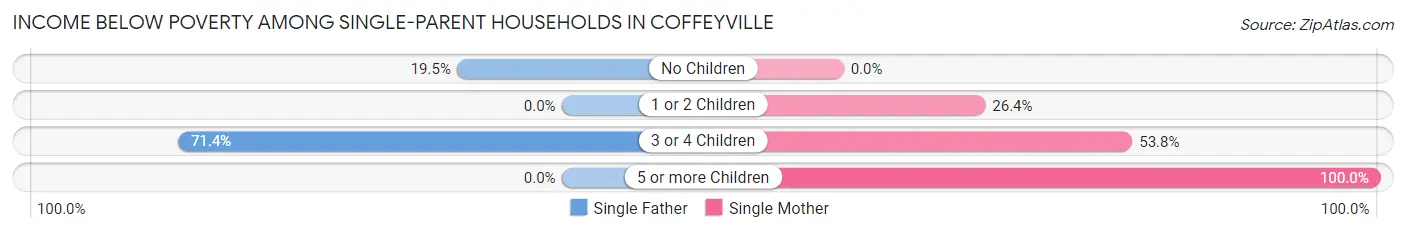
| Children | Single Father | Single Mother |
| No Children | 16 (19.5%) | 0 (0.0%) |
| 1 or 2 Children | 0 (0.0%) | 57 (26.4%) |
| 3 or 4 Children | 5 (71.4%) | 50 (53.8%) |
| 5 or more Children | 0 (0.0%) | 8 (100.0%) |
| Total | 21 (14.4%) | 115 (26.0%) |
Income Below Poverty Among Married-Couple vs Single-Parent Households in Coffeyville
The poverty data for Coffeyville shows that 155 of the married-couple family households (13.1%) and 136 of the single-parent households (23.1%) are living below the poverty level. Within the married-couple family households, those with 3 or 4 children have the highest poverty rate, with 77 households (44.3%) falling below the poverty line. Among the single-parent households, those with 5 or more children have the highest poverty rate, with 8 household (100.0%) living below poverty.
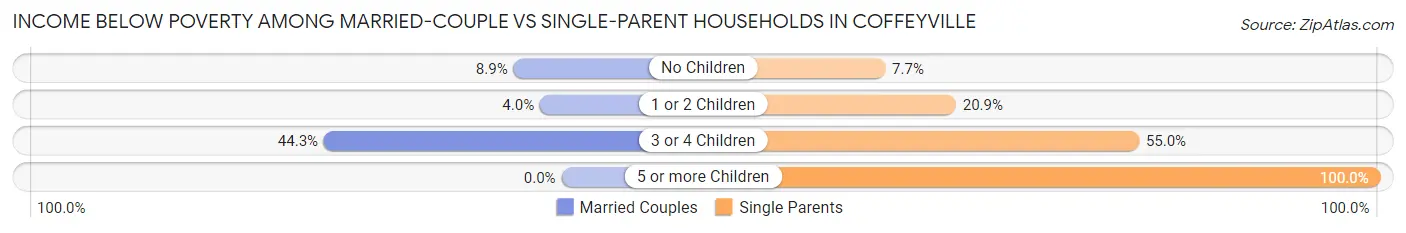
| Children | Married-Couple Families | Single-Parent Households |
| No Children | 68 (8.9%) | 16 (7.7%) |
| 1 or 2 Children | 10 (4.0%) | 57 (20.9%) |
| 3 or 4 Children | 77 (44.3%) | 55 (55.0%) |
| 5 or more Children | 0 (0.0%) | 8 (100.0%) |
| Total | 155 (13.1%) | 136 (23.1%) |
Race in Coffeyville
The most populous races in Coffeyville are White / Caucasian (5,959 | 67.4%), Hispanic or Latino (1,488 | 16.8%), and Two or more Races (1,233 | 13.9%).
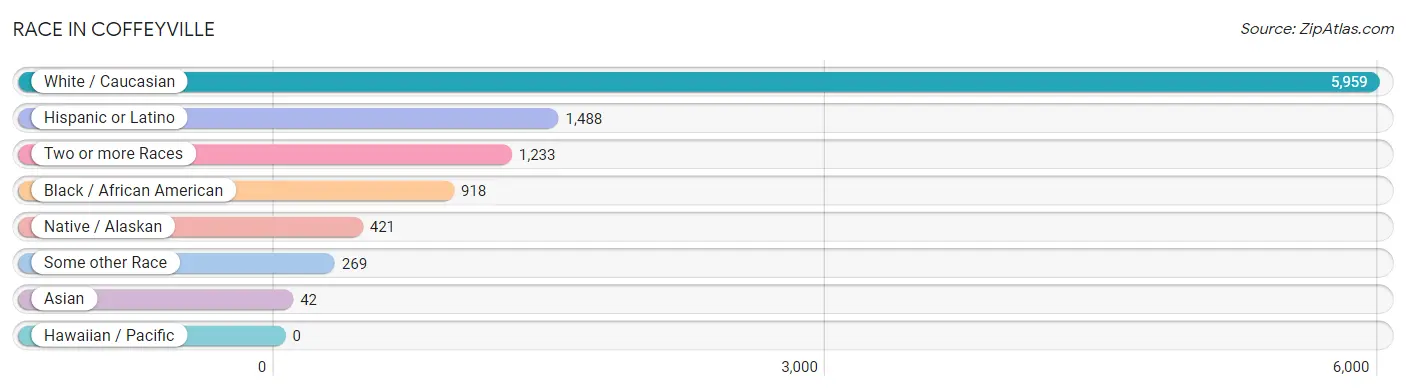
| Race | # Population | % Population |
| Asian | 42 | 0.5% |
| Black / African American | 918 | 10.4% |
| Hawaiian / Pacific | 0 | 0.0% |
| Hispanic or Latino | 1,488 | 16.8% |
| Native / Alaskan | 421 | 4.8% |
| White / Caucasian | 5,959 | 67.4% |
| Two or more Races | 1,233 | 13.9% |
| Some other Race | 269 | 3.0% |
| Total | 8,842 | 100.0% |
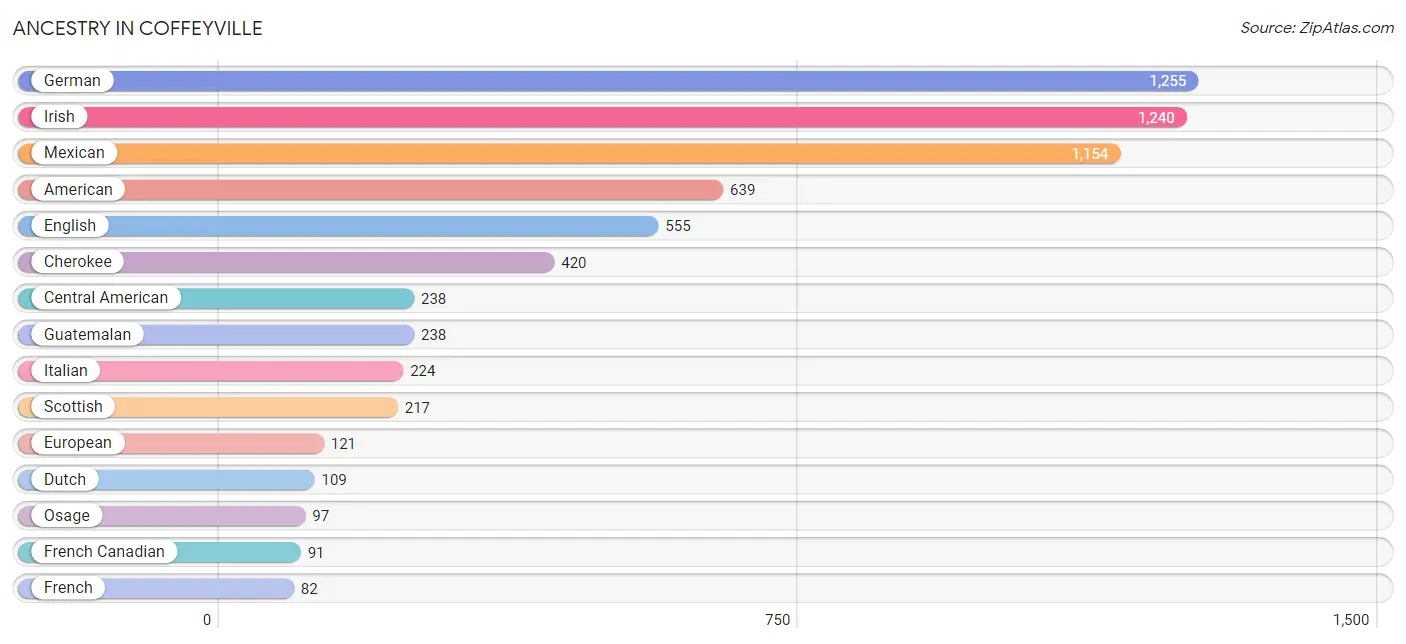
Ancestry in Coffeyville
The most populous ancestries reported in Coffeyville are German (1,255 | 14.2%), Irish (1,240 | 14.0%), Mexican (1,154 | 13.1%), American (639 | 7.2%), and English (555 | 6.3%), together accounting for 54.8% of all Coffeyville residents.
| Ancestry | # Population | % Population |
| African | 68 | 0.8% |
| American | 639 | 7.2% |
| Apache | 8 | 0.1% |
| Australian | 15 | 0.2% |
| Austrian | 13 | 0.2% |
| Bhutanese | 31 | 0.4% |
| Blackfeet | 6 | 0.1% |
| British | 8 | 0.1% |
| Celtic | 5 | 0.1% |
| Central American | 238 | 2.7% |
| Central American Indian | 71 | 0.8% |
| Cherokee | 420 | 4.8% |
| Chickasaw | 39 | 0.4% |
| Choctaw | 31 | 0.4% |
| Creek | 26 | 0.3% |
| Czech | 7 | 0.1% |
| Danish | 16 | 0.2% |
| Dutch | 109 | 1.2% |
| Eastern European | 33 | 0.4% |
| English | 555 | 6.3% |
| European | 121 | 1.4% |
| Finnish | 14 | 0.2% |
| French | 82 | 0.9% |
| French Canadian | 91 | 1.0% |
| German | 1,255 | 14.2% |
| Guatemalan | 238 | 2.7% |
| Irish | 1,240 | 14.0% |
| Italian | 224 | 2.5% |
| Jamaican | 15 | 0.2% |
| Korean | 7 | 0.1% |
| Mexican | 1,154 | 13.1% |
| Norwegian | 11 | 0.1% |
| Osage | 97 | 1.1% |
| Pennsylvania German | 4 | 0.1% |
| Polish | 61 | 0.7% |
| Portuguese | 7 | 0.1% |
| Puerto Rican | 59 | 0.7% |
| Scandinavian | 19 | 0.2% |
| Scotch-Irish | 72 | 0.8% |
| Scottish | 217 | 2.5% |
| Sri Lankan | 32 | 0.4% |
| Subsaharan African | 68 | 0.8% |
| Swedish | 43 | 0.5% |
| Welsh | 26 | 0.3% | View All 44 Rows |
Immigrants in Coffeyville
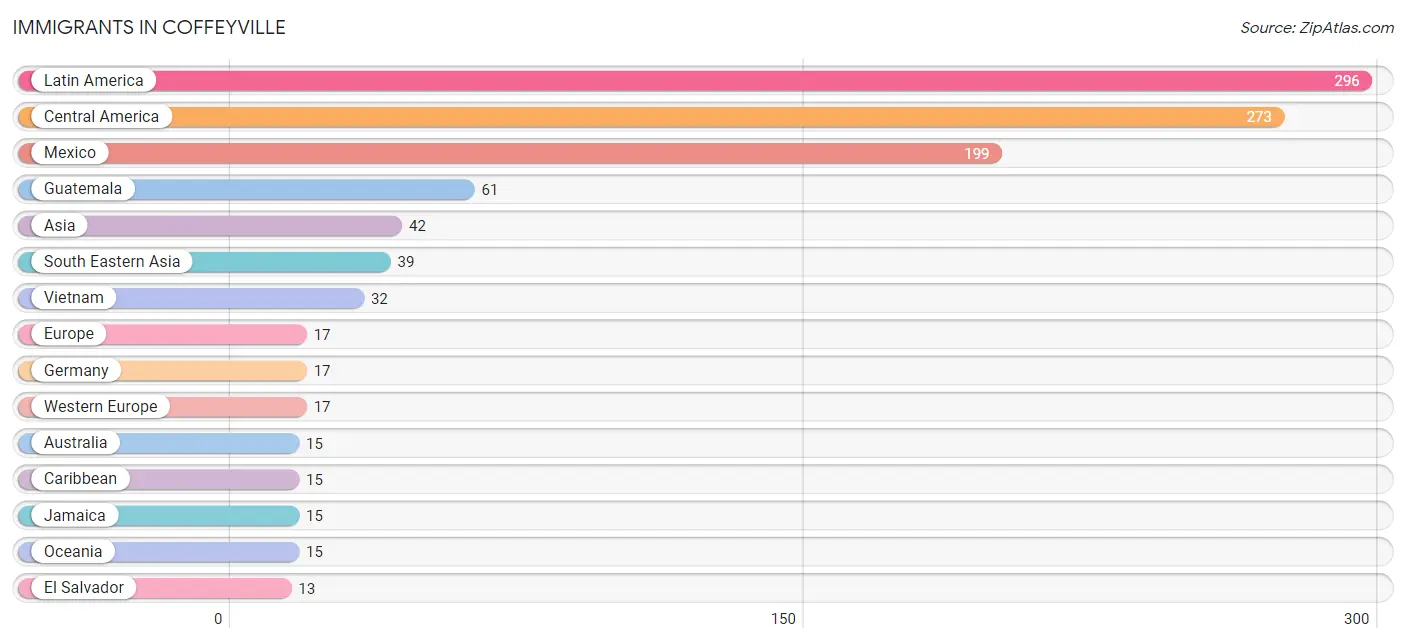
The most numerous immigrant groups reported in Coffeyville came from Latin America (296 | 3.4%), Central America (273 | 3.1%), Mexico (199 | 2.2%), Guatemala (61 | 0.7%), and Asia (42 | 0.5%), together accounting for 9.9% of all Coffeyville residents.
| Immigration Origin | # Population | % Population |
| Asia | 42 | 0.5% |
| Australia | 15 | 0.2% |
| Caribbean | 15 | 0.2% |
| Central America | 273 | 3.1% |
| Eastern Asia | 3 | 0.0% |
| El Salvador | 13 | 0.2% |
| Europe | 17 | 0.2% |
| Germany | 17 | 0.2% |
| Guatemala | 61 | 0.7% |
| Jamaica | 15 | 0.2% |
| Japan | 3 | 0.0% |
| Latin America | 296 | 3.4% |
| Mexico | 199 | 2.2% |
| Oceania | 15 | 0.2% |
| Philippines | 7 | 0.1% |
| South America | 8 | 0.1% |
| South Eastern Asia | 39 | 0.4% |
| Venezuela | 8 | 0.1% |
| Vietnam | 32 | 0.4% |
| Western Europe | 17 | 0.2% | View All 20 Rows |
Sex and Age in Coffeyville
Sex and Age in Coffeyville
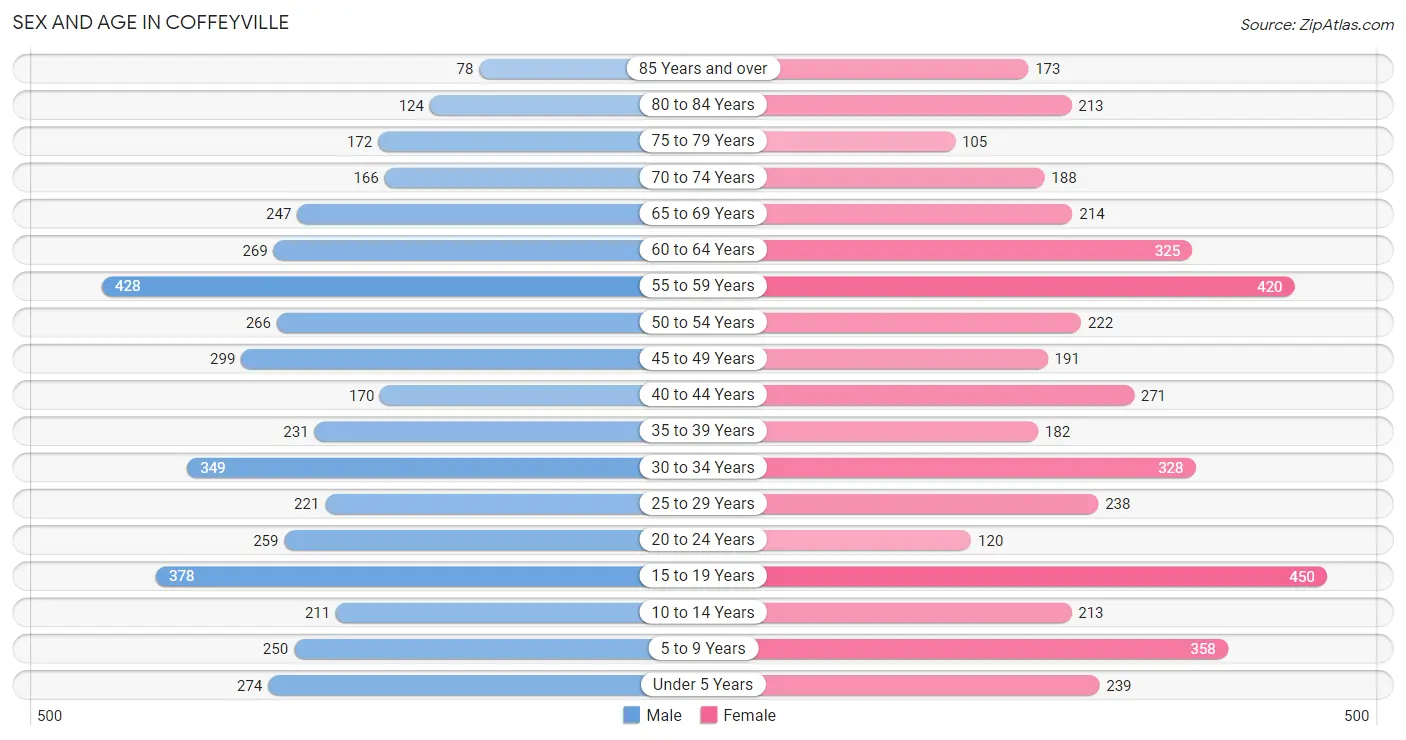
The most populous age groups in Coffeyville are 55 to 59 Years (428 | 9.7%) for men and 15 to 19 Years (450 | 10.1%) for women.
| Age Bracket | Male | Female |
| Under 5 Years | 274 (6.2%) | 239 (5.4%) |
| 5 to 9 Years | 250 (5.7%) | 358 (8.0%) |
| 10 to 14 Years | 211 (4.8%) | 213 (4.8%) |
| 15 to 19 Years | 378 (8.6%) | 450 (10.1%) |
| 20 to 24 Years | 259 (5.9%) | 120 (2.7%) |
| 25 to 29 Years | 221 (5.0%) | 238 (5.3%) |
| 30 to 34 Years | 349 (8.0%) | 328 (7.4%) |
| 35 to 39 Years | 231 (5.3%) | 182 (4.1%) |
| 40 to 44 Years | 170 (3.9%) | 271 (6.1%) |
| 45 to 49 Years | 299 (6.8%) | 191 (4.3%) |
| 50 to 54 Years | 266 (6.1%) | 222 (5.0%) |
| 55 to 59 Years | 428 (9.7%) | 420 (9.4%) |
| 60 to 64 Years | 269 (6.1%) | 325 (7.3%) |
| 65 to 69 Years | 247 (5.6%) | 214 (4.8%) |
| 70 to 74 Years | 166 (3.8%) | 188 (4.2%) |
| 75 to 79 Years | 172 (3.9%) | 105 (2.4%) |
| 80 to 84 Years | 124 (2.8%) | 213 (4.8%) |
| 85 Years and over | 78 (1.8%) | 173 (3.9%) |
| Total | 4,392 (100.0%) | 4,450 (100.0%) |
Families and Households in Coffeyville
Median Family Size in Coffeyville
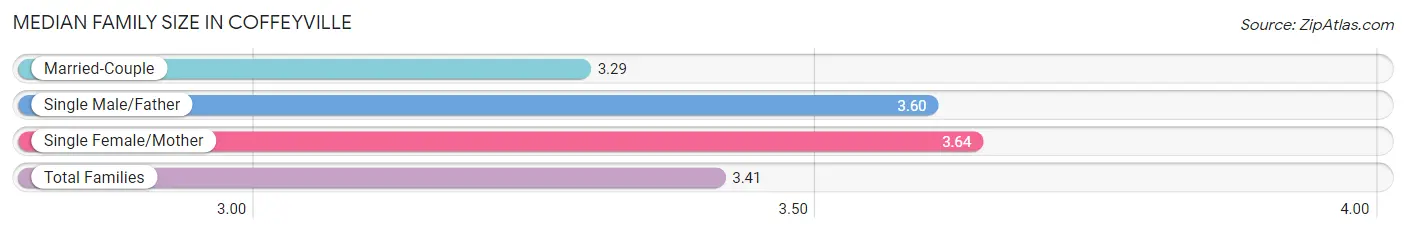
The median family size in Coffeyville is 3.41 persons per family, with single female/mother families (442 | 24.9%) accounting for the largest median family size of 3.64 persons per family. On the other hand, married-couple families (1,185 | 66.8%) represent the smallest median family size with 3.29 persons per family.
| Family Type | # Families | Family Size |
| Married-Couple | 1,185 (66.8%) | 3.29 |
| Single Male/Father | 146 (8.2%) | 3.60 |
| Single Female/Mother | 442 (24.9%) | 3.64 |
| Total Families | 1,773 (100.0%) | 3.41 |
Median Household Size in Coffeyville
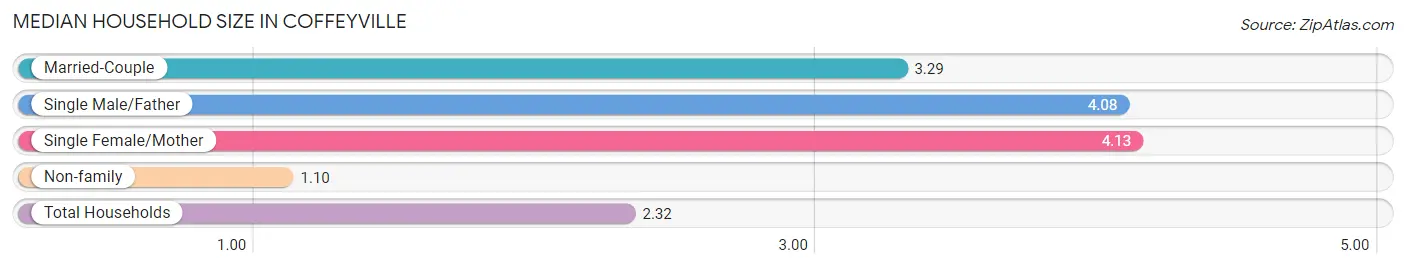
The median household size in Coffeyville is 2.32 persons per household, with single female/mother households (442 | 12.4%) accounting for the largest median household size of 4.13 persons per household. non-family households (1,802 | 50.4%) represent the smallest median household size with 1.10 persons per household.
| Household Type | # Households | Household Size |
| Married-Couple | 1,185 (33.2%) | 3.29 |
| Single Male/Father | 146 (4.1%) | 4.08 |
| Single Female/Mother | 442 (12.4%) | 4.13 |
| Non-family | 1,802 (50.4%) | 1.10 |
| Total Households | 3,575 (100.0%) | 2.32 |
Household Size by Marriage Status in Coffeyville
Out of a total of 3,575 households in Coffeyville, 1,773 (49.6%) are family households, while 1,802 (50.4%) are nonfamily households. The most numerous type of family households are 2-person households, comprising 868, and the most common type of nonfamily households are 1-person households, comprising 1,656.
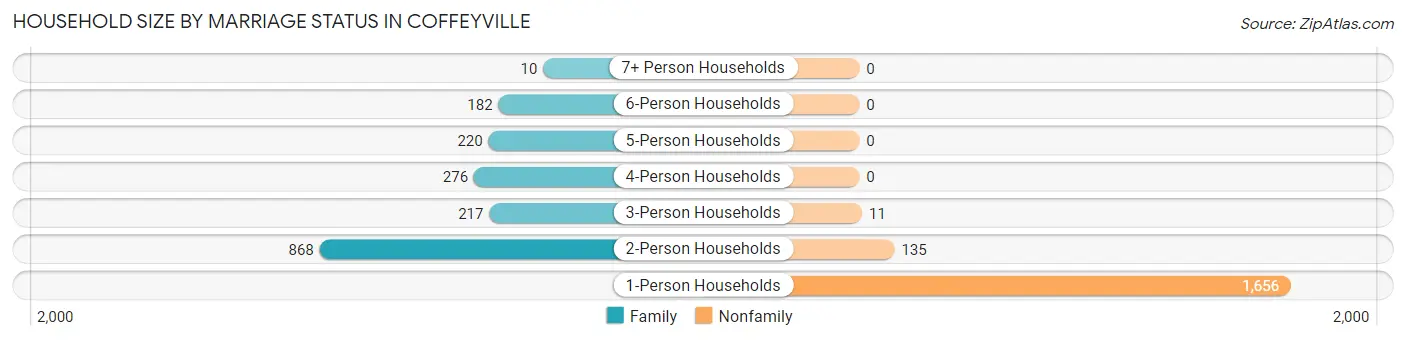
| Household Size | Family Households | Nonfamily Households |
| 1-Person Households | - | 1,656 (46.3%) |
| 2-Person Households | 868 (24.3%) | 135 (3.8%) |
| 3-Person Households | 217 (6.1%) | 11 (0.3%) |
| 4-Person Households | 276 (7.7%) | 0 (0.0%) |
| 5-Person Households | 220 (6.1%) | 0 (0.0%) |
| 6-Person Households | 182 (5.1%) | 0 (0.0%) |
| 7+ Person Households | 10 (0.3%) | 0 (0.0%) |
| Total | 1,773 (49.6%) | 1,802 (50.4%) |
Female Fertility in Coffeyville
Fertility by Age in Coffeyville
Average fertility rate in Coffeyville is 10.0 births per 1,000 women. Women in the age bracket of 20 to 34 years have the highest fertility rate with 20.0 births per 1,000 women. Women in the age bracket of 20 to 34 years acount for 77.8% of all women with births.
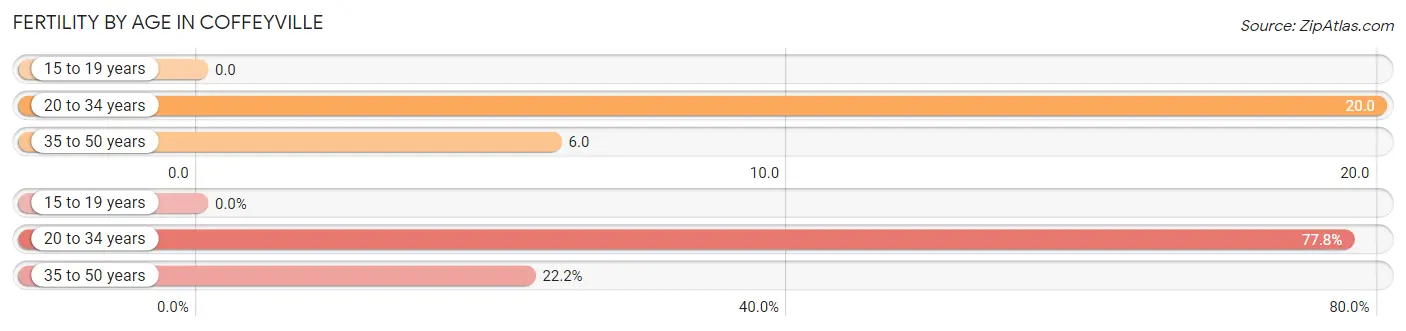
| Age Bracket | Women with Births | Births / 1,000 Women |
| 15 to 19 years | 0 (0.0%) | 0.0 |
| 20 to 34 years | 14 (77.8%) | 20.0 |
| 35 to 50 years | 4 (22.2%) | 6.0 |
| Total | 18 (100.0%) | 10.0 |
Fertility by Age by Marriage Status in Coffeyville
72.2% of women with births (18) in Coffeyville are married. The highest percentage of unmarried women with births falls into 20 to 34 years age bracket with 35.7% of them unmarried at the time of birth, while the lowest percentage of unmarried women with births belong to 35 to 50 years age bracket with 0.0% of them unmarried.
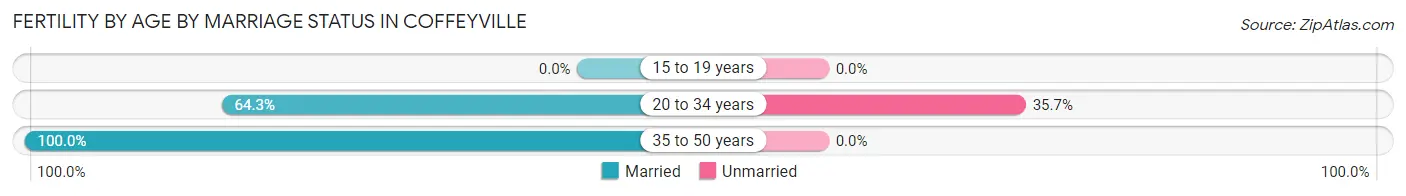
| Age Bracket | Married | Unmarried |
| 15 to 19 years | 0 (0.0%) | 0 (0.0%) |
| 20 to 34 years | 9 (64.3%) | 5 (35.7%) |
| 35 to 50 years | 4 (100.0%) | 0 (0.0%) |
| Total | 13 (72.2%) | 5 (27.8%) |
Fertility by Education in Coffeyville
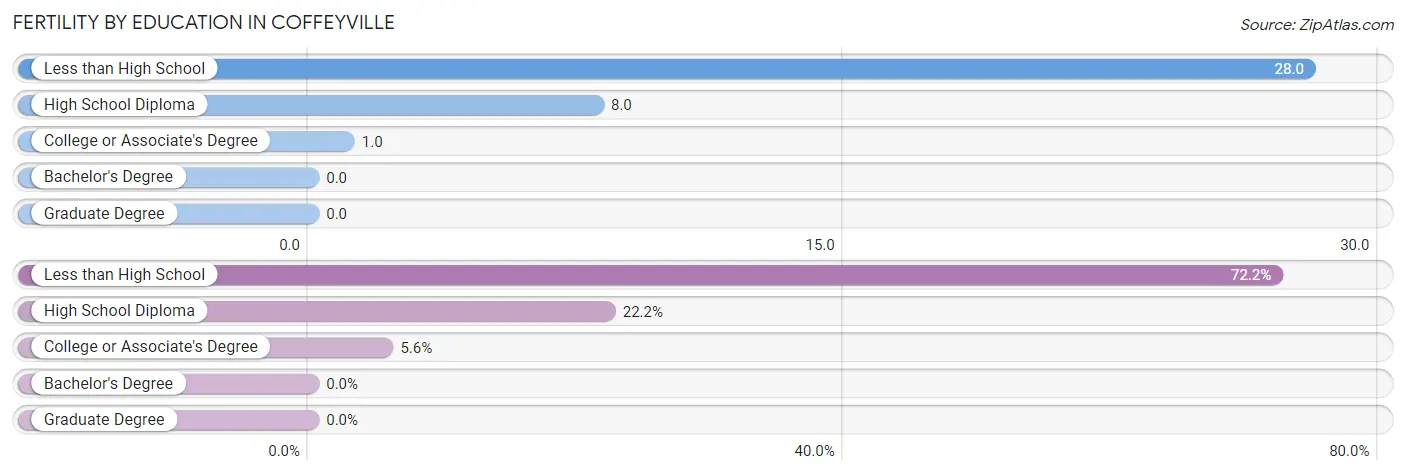
| Educational Attainment | Women with Births | Births / 1,000 Women |
| Less than High School | 13 (72.2%) | 28.0 |
| High School Diploma | 4 (22.2%) | 8.0 |
| College or Associate's Degree | 1 (5.6%) | 1.0 |
| Bachelor's Degree | 0 (0.0%) | 0.0 |
| Graduate Degree | 0 (0.0%) | 0.0 |
| Total | 18 (100.0%) | 10.0 |
Fertility by Education by Marriage Status in Coffeyville
27.8% of women with births in Coffeyville are unmarried. Women with the educational attainment of high school diploma are most likely to be married with 100.0% of them married at childbirth, while women with the educational attainment of less than high school are least likely to be married with 38.5% of them unmarried at childbirth.
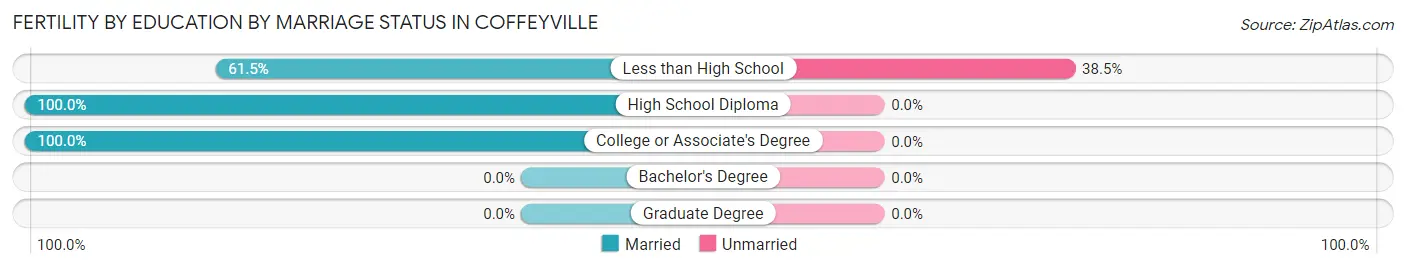
| Educational Attainment | Married | Unmarried |
| Less than High School | 8 (61.5%) | 5 (38.5%) |
| High School Diploma | 4 (100.0%) | 0 (0.0%) |
| College or Associate's Degree | 1 (100.0%) | 0 (0.0%) |
| Bachelor's Degree | 0 (0.0%) | 0 (0.0%) |
| Graduate Degree | 0 (0.0%) | 0 (0.0%) |
| Total | 13 (72.2%) | 5 (27.8%) |
Employment Characteristics in Coffeyville
Employment by Class of Employer in Coffeyville
Among the 3,394 employed individuals in Coffeyville, private company employees (2,419 | 71.3%), not-for-profit organizations (338 | 10.0%), and local government employees (222 | 6.5%) make up the most common classes of employment.
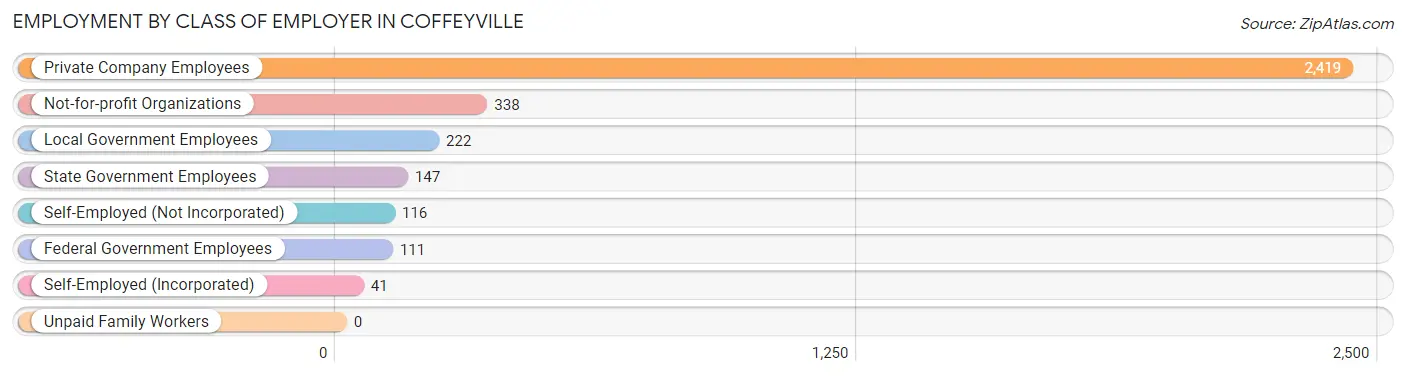
| Employer Class | # Employees | % Employees |
| Private Company Employees | 2,419 | 71.3% |
| Self-Employed (Incorporated) | 41 | 1.2% |
| Self-Employed (Not Incorporated) | 116 | 3.4% |
| Not-for-profit Organizations | 338 | 10.0% |
| Local Government Employees | 222 | 6.5% |
| State Government Employees | 147 | 4.3% |
| Federal Government Employees | 111 | 3.3% |
| Unpaid Family Workers | 0 | 0.0% |
| Total | 3,394 | 100.0% |
Employment Status by Age in Coffeyville
According to the labor force statistics for Coffeyville, out of the total population over 16 years of age (7,197), 51.0% or 3,670 individuals are in the labor force, with 7.0% or 257 of them unemployed. The age group with the highest labor force participation rate is 25 to 29 years, with 78.6% or 361 individuals in the labor force. Within the labor force, the 20 to 24 years age range has the highest percentage of unemployed individuals, with 25.8% or 65 of them being unemployed.
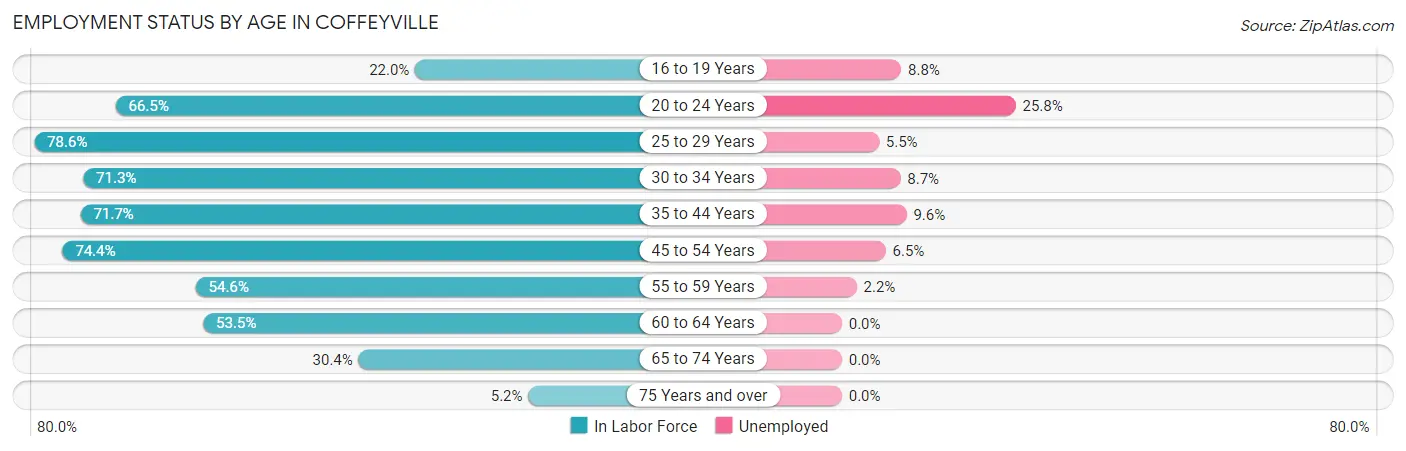
| Age Bracket | In Labor Force | Unemployed |
| 16 to 19 Years | 160 (22.0%) | 14 (8.8%) |
| 20 to 24 Years | 252 (66.5%) | 65 (25.8%) |
| 25 to 29 Years | 361 (78.6%) | 20 (5.5%) |
| 30 to 34 Years | 483 (71.3%) | 42 (8.7%) |
| 35 to 44 Years | 612 (71.7%) | 59 (9.6%) |
| 45 to 54 Years | 728 (74.4%) | 47 (6.5%) |
| 55 to 59 Years | 463 (54.6%) | 10 (2.2%) |
| 60 to 64 Years | 318 (53.5%) | 0 (0.0%) |
| 65 to 74 Years | 248 (30.4%) | 0 (0.0%) |
| 75 Years and over | 45 (5.2%) | 0 (0.0%) |
| Total | 3,670 (51.0%) | 257 (7.0%) |
Employment Status by Educational Attainment in Coffeyville
According to labor force statistics for Coffeyville, 67.2% of individuals (2,964) out of the total population between 25 and 64 years of age (4,410) are in the labor force, with 6.0% or 178 of them being unemployed. The group with the highest labor force participation rate are those with the educational attainment of college / associate degree, with 79.2% or 1,235 individuals in the labor force. Within the labor force, individuals with less than high school education have the highest percentage of unemployment, with 12.6% or 48 of them being unemployed.
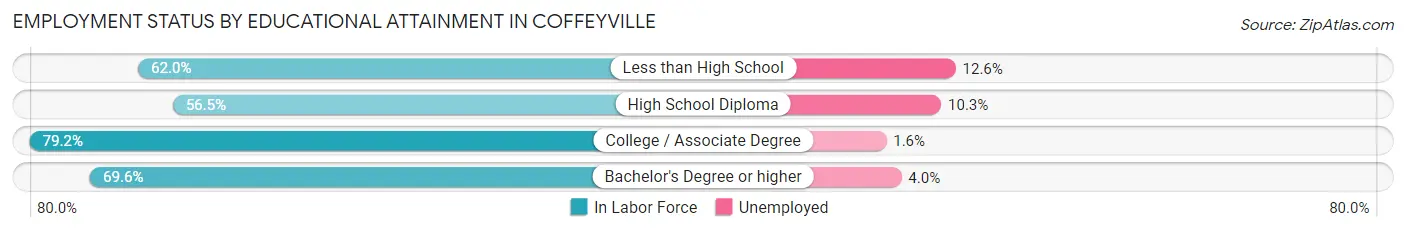
| Educational Attainment | In Labor Force | Unemployed |
| Less than High School | 380 (62.0%) | 77 (12.6%) |
| High School Diploma | 888 (56.5%) | 162 (10.3%) |
| College / Associate Degree | 1,235 (79.2%) | 25 (1.6%) |
| Bachelor's Degree or higher | 464 (69.6%) | 27 (4.0%) |
| Total | 2,964 (67.2%) | 265 (6.0%) |
Employment Occupations by Sex in Coffeyville
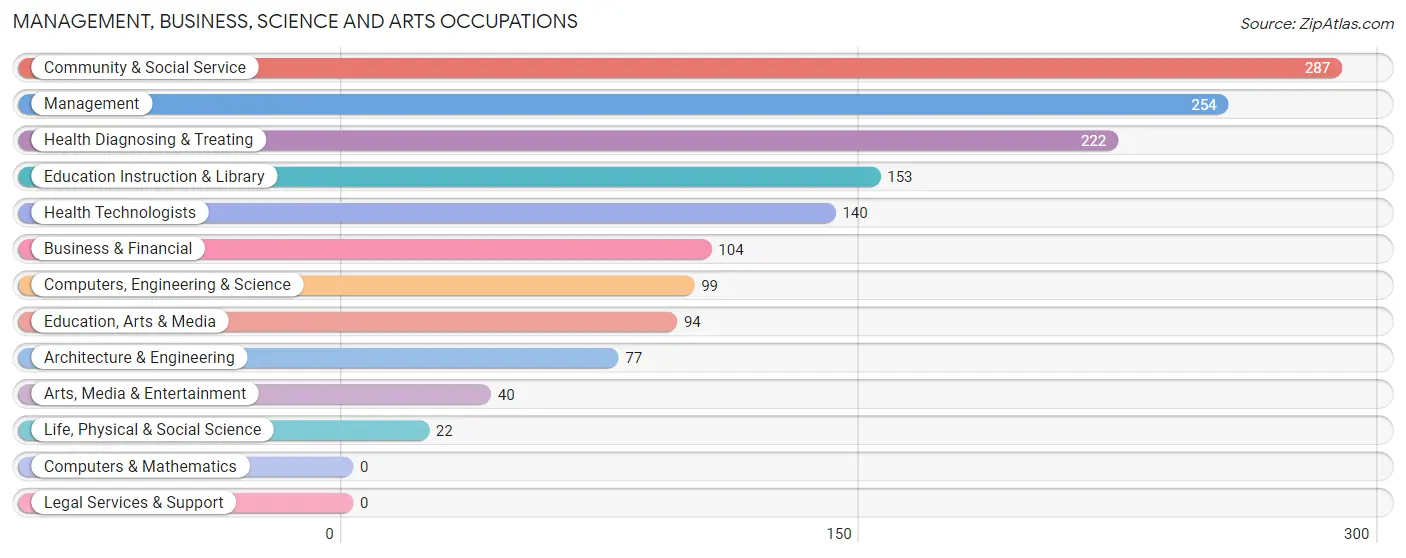
Management, Business, Science and Arts Occupations
The most common Management, Business, Science and Arts occupations in Coffeyville are Community & Social Service (287 | 8.5%), Management (254 | 7.5%), Health Diagnosing & Treating (222 | 6.6%), Education Instruction & Library (153 | 4.5%), and Health Technologists (140 | 4.1%).
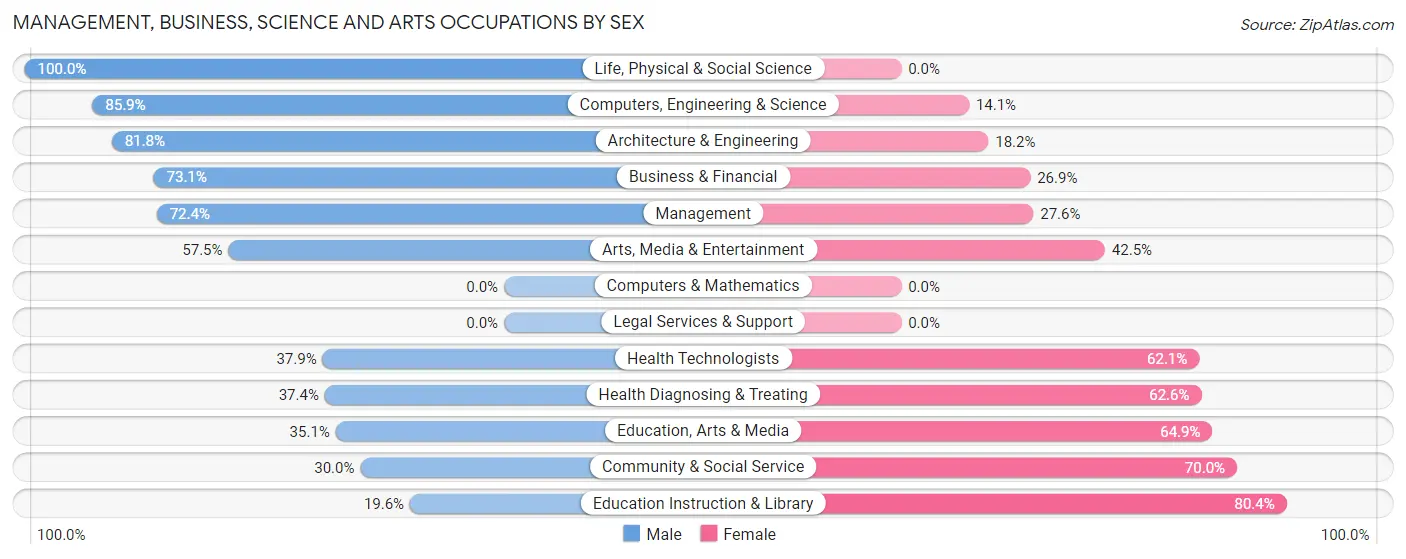
Management, Business, Science and Arts Occupations by Sex
Within the Management, Business, Science and Arts occupations in Coffeyville, the most male-oriented occupations are Life, Physical & Social Science (100.0%), Computers, Engineering & Science (85.9%), and Architecture & Engineering (81.8%), while the most female-oriented occupations are Education Instruction & Library (80.4%), Community & Social Service (70.0%), and Education, Arts & Media (64.9%).
| Occupation | Male | Female |
| Management | 184 (72.4%) | 70 (27.6%) |
| Business & Financial | 76 (73.1%) | 28 (26.9%) |
| Computers, Engineering & Science | 85 (85.9%) | 14 (14.1%) |
| Computers & Mathematics | 0 (0.0%) | 0 (0.0%) |
| Architecture & Engineering | 63 (81.8%) | 14 (18.2%) |
| Life, Physical & Social Science | 22 (100.0%) | 0 (0.0%) |
| Community & Social Service | 86 (30.0%) | 201 (70.0%) |
| Education, Arts & Media | 33 (35.1%) | 61 (64.9%) |
| Legal Services & Support | 0 (0.0%) | 0 (0.0%) |
| Education Instruction & Library | 30 (19.6%) | 123 (80.4%) |
| Arts, Media & Entertainment | 23 (57.5%) | 17 (42.5%) |
| Health Diagnosing & Treating | 83 (37.4%) | 139 (62.6%) |
| Health Technologists | 53 (37.9%) | 87 (62.1%) |
| Total (Category) | 514 (53.2%) | 452 (46.8%) |
| Total (Overall) | 1,639 (48.5%) | 1,741 (51.5%) |
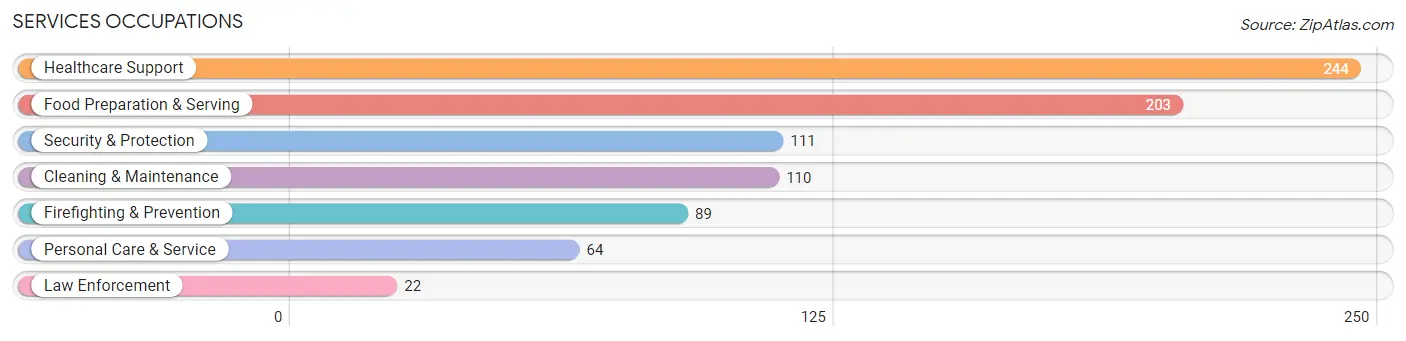
Services Occupations
The most common Services occupations in Coffeyville are Healthcare Support (244 | 7.2%), Food Preparation & Serving (203 | 6.0%), Security & Protection (111 | 3.3%), Cleaning & Maintenance (110 | 3.3%), and Firefighting & Prevention (89 | 2.6%).
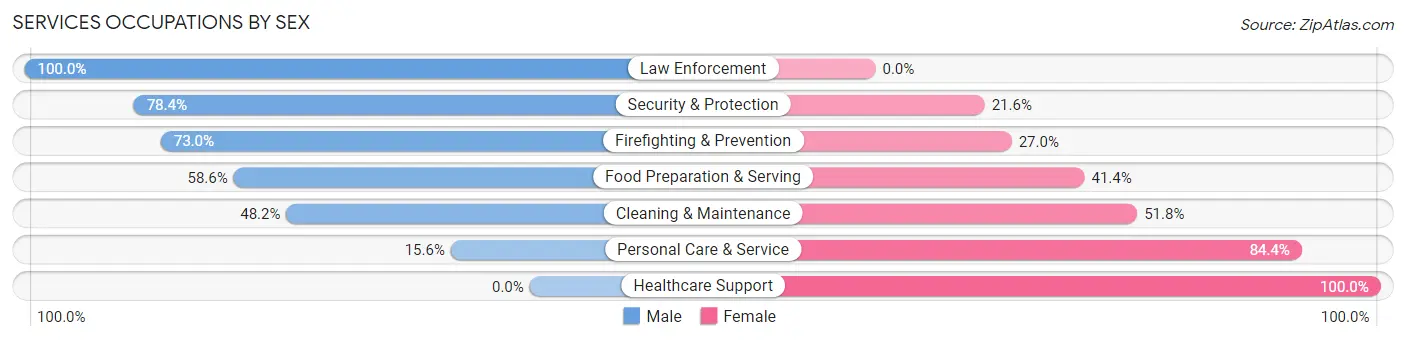
Services Occupations by Sex
Within the Services occupations in Coffeyville, the most male-oriented occupations are Law Enforcement (100.0%), Security & Protection (78.4%), and Firefighting & Prevention (73.0%), while the most female-oriented occupations are Healthcare Support (100.0%), Personal Care & Service (84.4%), and Cleaning & Maintenance (51.8%).
| Occupation | Male | Female |
| Healthcare Support | 0 (0.0%) | 244 (100.0%) |
| Security & Protection | 87 (78.4%) | 24 (21.6%) |
| Firefighting & Prevention | 65 (73.0%) | 24 (27.0%) |
| Law Enforcement | 22 (100.0%) | 0 (0.0%) |
| Food Preparation & Serving | 119 (58.6%) | 84 (41.4%) |
| Cleaning & Maintenance | 53 (48.2%) | 57 (51.8%) |
| Personal Care & Service | 10 (15.6%) | 54 (84.4%) |
| Total (Category) | 269 (36.7%) | 463 (63.2%) |
| Total (Overall) | 1,639 (48.5%) | 1,741 (51.5%) |
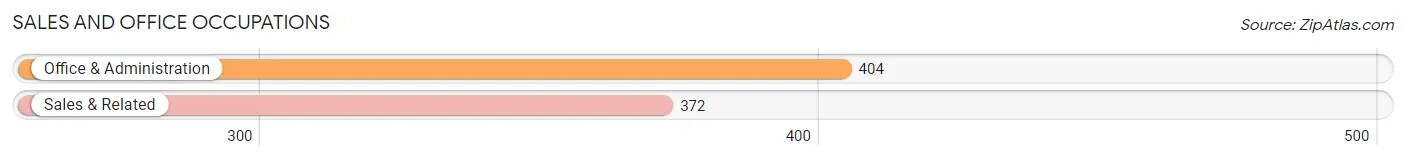
Sales and Office Occupations
The most common Sales and Office occupations in Coffeyville are Office & Administration (404 | 11.9%), and Sales & Related (372 | 11.0%).
Sales and Office Occupations by Sex
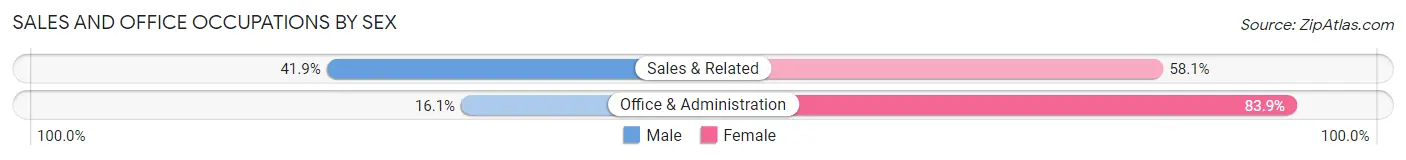
| Occupation | Male | Female |
| Sales & Related | 156 (41.9%) | 216 (58.1%) |
| Office & Administration | 65 (16.1%) | 339 (83.9%) |
| Total (Category) | 221 (28.5%) | 555 (71.5%) |
| Total (Overall) | 1,639 (48.5%) | 1,741 (51.5%) |
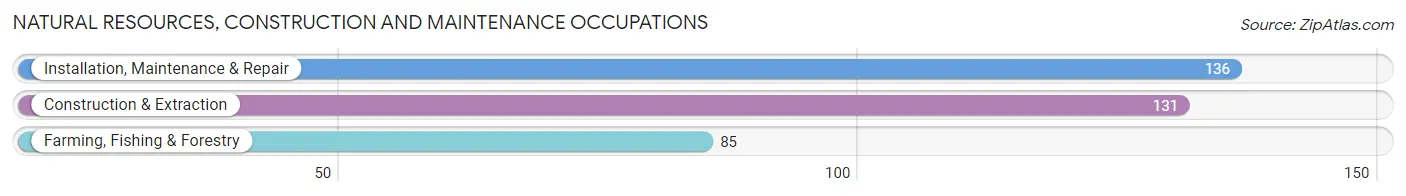
Natural Resources, Construction and Maintenance Occupations
The most common Natural Resources, Construction and Maintenance occupations in Coffeyville are Installation, Maintenance & Repair (136 | 4.0%), Construction & Extraction (131 | 3.9%), and Farming, Fishing & Forestry (85 | 2.5%).
Natural Resources, Construction and Maintenance Occupations by Sex
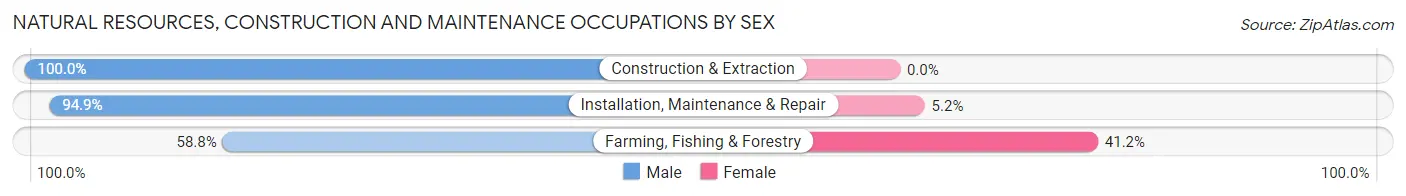
| Occupation | Male | Female |
| Farming, Fishing & Forestry | 50 (58.8%) | 35 (41.2%) |
| Construction & Extraction | 131 (100.0%) | 0 (0.0%) |
| Installation, Maintenance & Repair | 129 (94.9%) | 7 (5.1%) |
| Total (Category) | 310 (88.1%) | 42 (11.9%) |
| Total (Overall) | 1,639 (48.5%) | 1,741 (51.5%) |
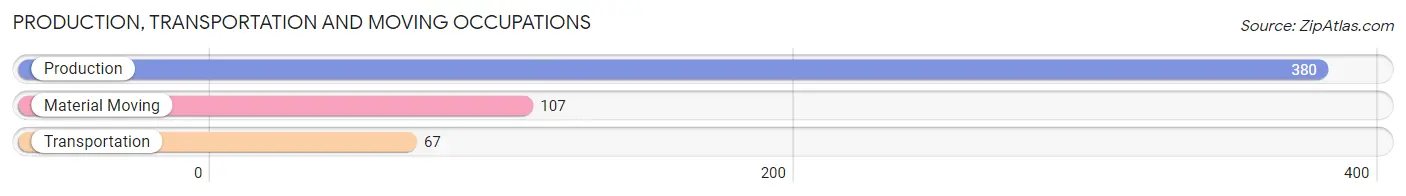
Production, Transportation and Moving Occupations
The most common Production, Transportation and Moving occupations in Coffeyville are Production (380 | 11.2%), Material Moving (107 | 3.2%), and Transportation (67 | 2.0%).
Production, Transportation and Moving Occupations by Sex
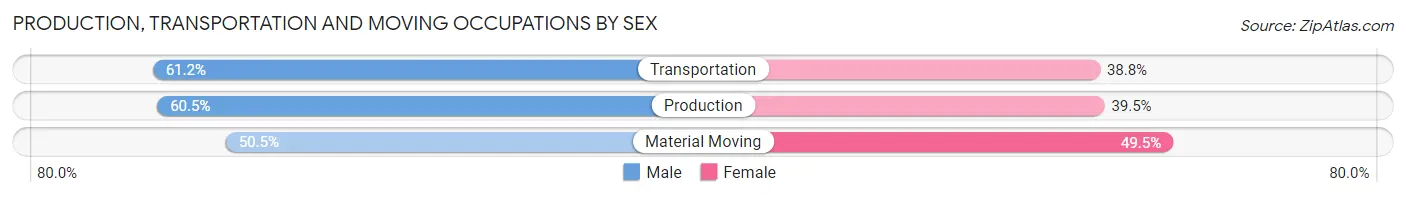
| Occupation | Male | Female |
| Production | 230 (60.5%) | 150 (39.5%) |
| Transportation | 41 (61.2%) | 26 (38.8%) |
| Material Moving | 54 (50.5%) | 53 (49.5%) |
| Total (Category) | 325 (58.7%) | 229 (41.3%) |
| Total (Overall) | 1,639 (48.5%) | 1,741 (51.5%) |
Employment Industries by Sex in Coffeyville
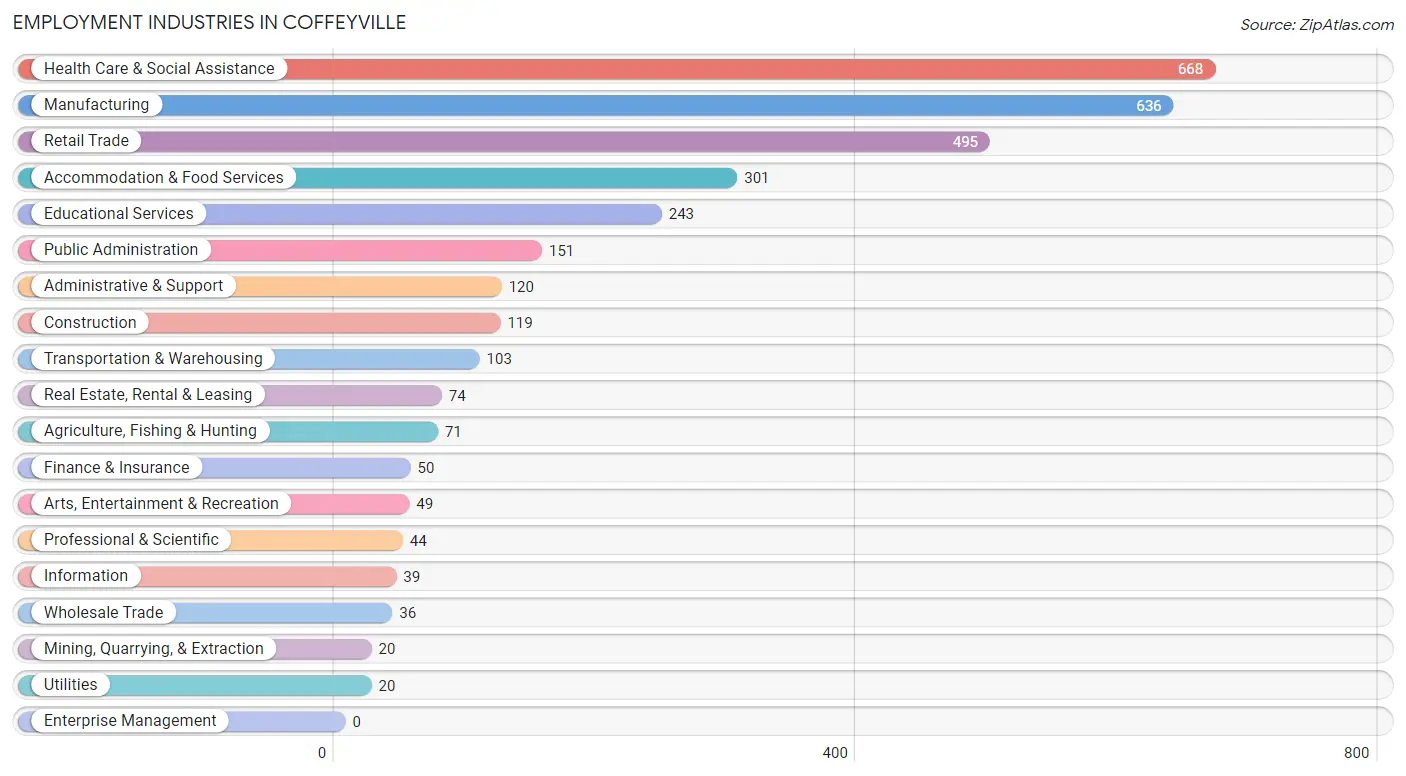
Employment Industries in Coffeyville
The major employment industries in Coffeyville include Health Care & Social Assistance (668 | 19.8%), Manufacturing (636 | 18.8%), Retail Trade (495 | 14.6%), Accommodation & Food Services (301 | 8.9%), and Educational Services (243 | 7.2%).
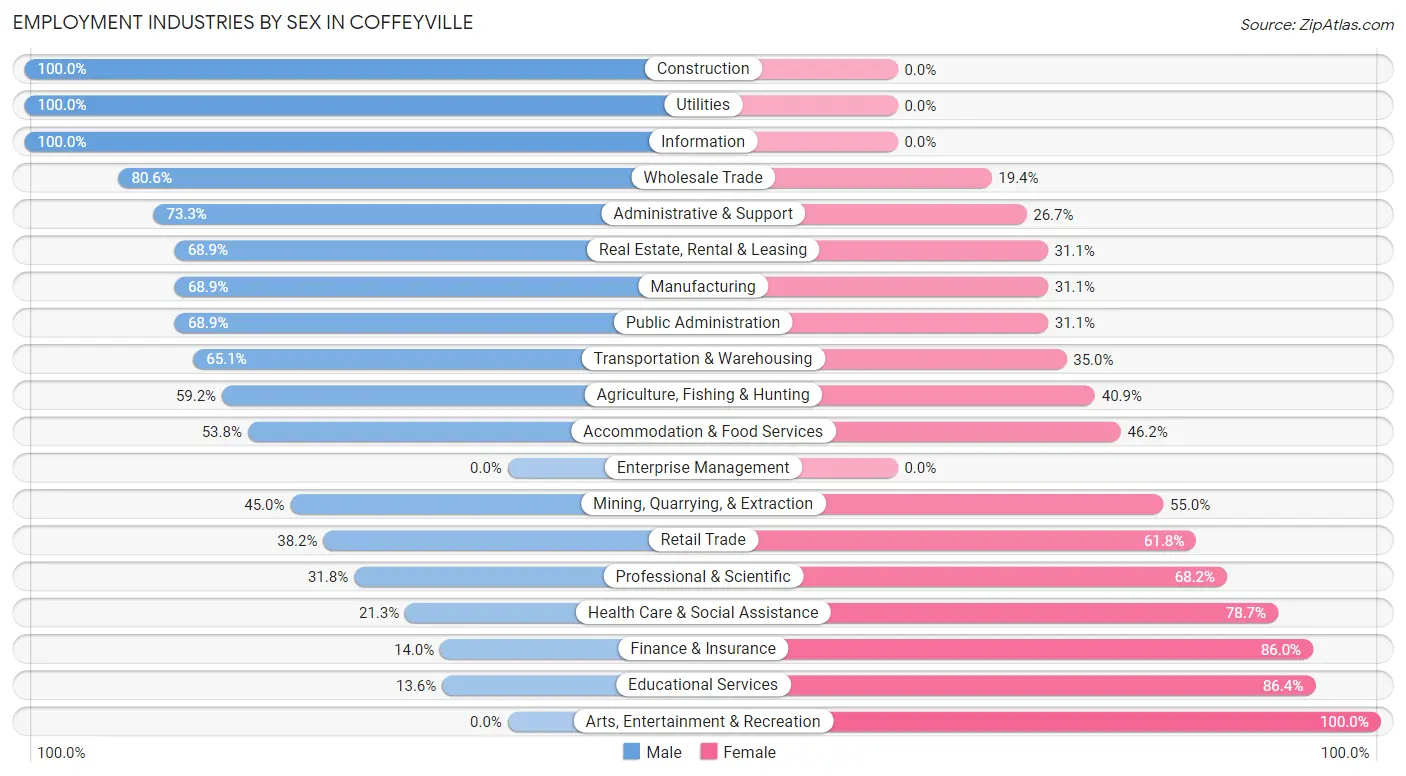
Employment Industries by Sex in Coffeyville
The Coffeyville industries that see more men than women are Construction (100.0%), Utilities (100.0%), and Information (100.0%), whereas the industries that tend to have a higher number of women are Arts, Entertainment & Recreation (100.0%), Educational Services (86.4%), and Finance & Insurance (86.0%).
| Industry | Male | Female |
| Agriculture, Fishing & Hunting | 42 (59.2%) | 29 (40.8%) |
| Mining, Quarrying, & Extraction | 9 (45.0%) | 11 (55.0%) |
| Construction | 119 (100.0%) | 0 (0.0%) |
| Manufacturing | 438 (68.9%) | 198 (31.1%) |
| Wholesale Trade | 29 (80.6%) | 7 (19.4%) |
| Retail Trade | 189 (38.2%) | 306 (61.8%) |
| Transportation & Warehousing | 67 (65.0%) | 36 (34.9%) |
| Utilities | 20 (100.0%) | 0 (0.0%) |
| Information | 39 (100.0%) | 0 (0.0%) |
| Finance & Insurance | 7 (14.0%) | 43 (86.0%) |
| Real Estate, Rental & Leasing | 51 (68.9%) | 23 (31.1%) |
| Professional & Scientific | 14 (31.8%) | 30 (68.2%) |
| Enterprise Management | 0 (0.0%) | 0 (0.0%) |
| Administrative & Support | 88 (73.3%) | 32 (26.7%) |
| Educational Services | 33 (13.6%) | 210 (86.4%) |
| Health Care & Social Assistance | 142 (21.3%) | 526 (78.7%) |
| Arts, Entertainment & Recreation | 0 (0.0%) | 49 (100.0%) |
| Accommodation & Food Services | 162 (53.8%) | 139 (46.2%) |
| Public Administration | 104 (68.9%) | 47 (31.1%) |
| Total | 1,639 (48.5%) | 1,741 (51.5%) |
Education in Coffeyville
School Enrollment in Coffeyville
The most common levels of schooling among the 2,275 students in Coffeyville are college / undergraduate (557 | 24.5%), high school (499 | 21.9%), and elementary school (456 | 20.0%).
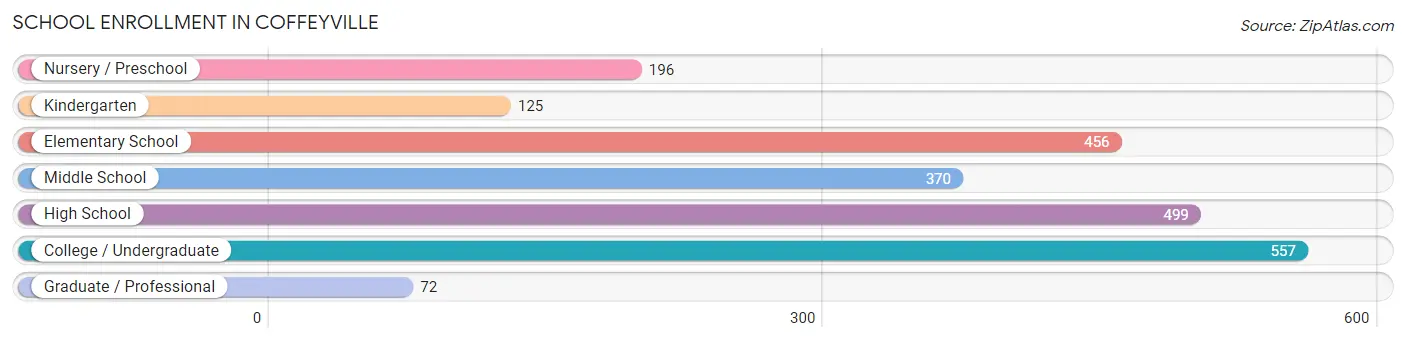
| School Level | # Students | % Students |
| Nursery / Preschool | 196 | 8.6% |
| Kindergarten | 125 | 5.5% |
| Elementary School | 456 | 20.0% |
| Middle School | 370 | 16.3% |
| High School | 499 | 21.9% |
| College / Undergraduate | 557 | 24.5% |
| Graduate / Professional | 72 | 3.2% |
| Total | 2,275 | 100.0% |
School Enrollment by Age by Funding Source in Coffeyville
Out of a total of 2,275 students who are enrolled in schools in Coffeyville, 375 (16.5%) attend a private institution, while the remaining 1,900 (83.5%) are enrolled in public schools. The age group of 35 years and over has the highest likelihood of being enrolled in private schools, with 23 (38.3% in the age bracket) enrolled. Conversely, the age group of 18 to 19 year olds has the lowest likelihood of being enrolled in a private school, with 365 (96.6% in the age bracket) attending a public institution.
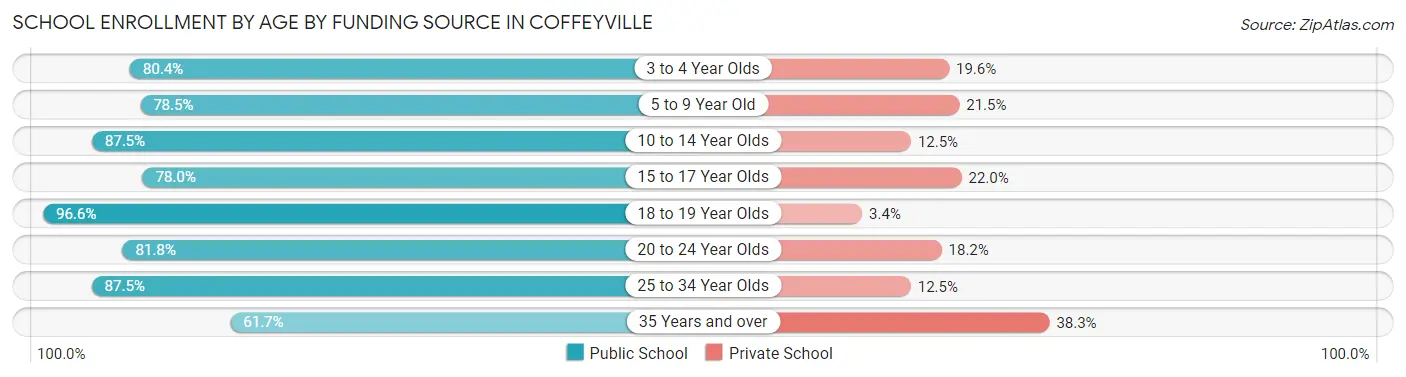
| Age Bracket | Public School | Private School |
| 3 to 4 Year Olds | 127 (80.4%) | 31 (19.6%) |
| 5 to 9 Year Old | 459 (78.5%) | 126 (21.5%) |
| 10 to 14 Year Olds | 363 (87.5%) | 52 (12.5%) |
| 15 to 17 Year Olds | 302 (78.0%) | 85 (22.0%) |
| 18 to 19 Year Olds | 365 (96.6%) | 13 (3.4%) |
| 20 to 24 Year Olds | 121 (81.8%) | 27 (18.2%) |
| 25 to 34 Year Olds | 126 (87.5%) | 18 (12.5%) |
| 35 Years and over | 37 (61.7%) | 23 (38.3%) |
| Total | 1,900 (83.5%) | 375 (16.5%) |
Educational Attainment by Field of Study in Coffeyville
Education (229 | 25.4%), bio, nature & agricultural (104 | 11.5%), business (103 | 11.4%), computers & mathematics (91 | 10.1%), and arts & humanities (87 | 9.7%) are the most common fields of study among 901 individuals in Coffeyville who have obtained a bachelor's degree or higher.
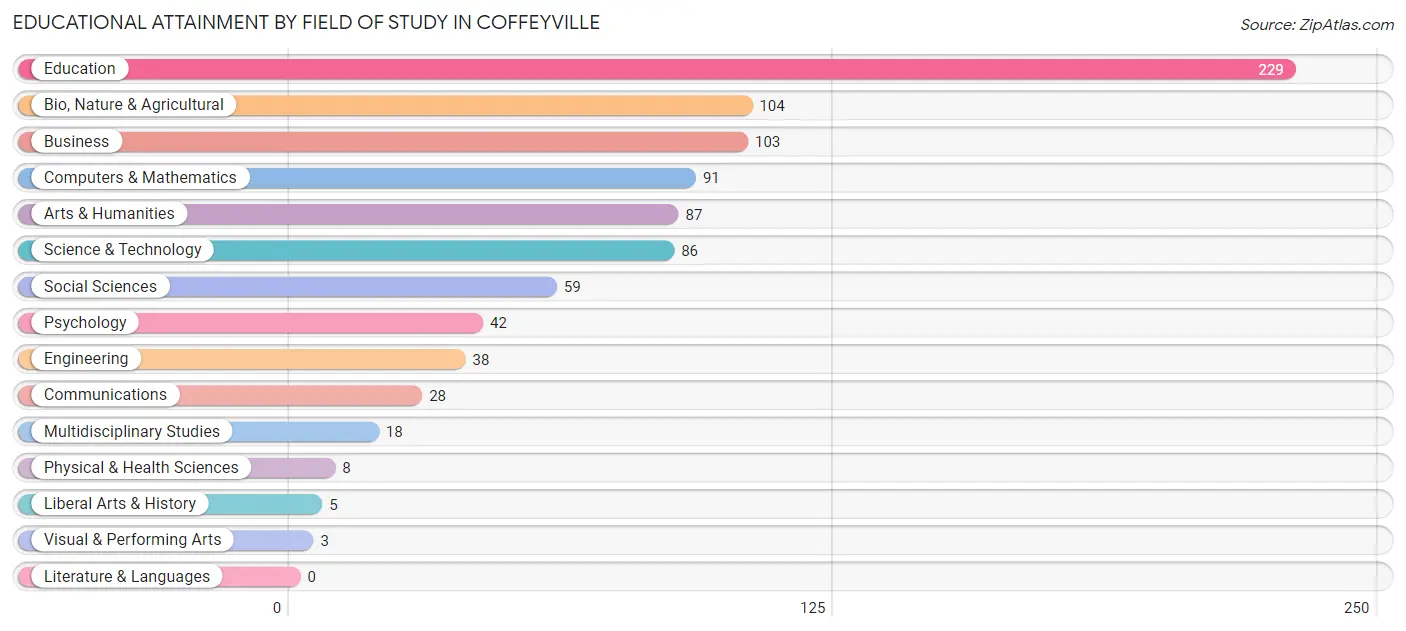
| Field of Study | # Graduates | % Graduates |
| Computers & Mathematics | 91 | 10.1% |
| Bio, Nature & Agricultural | 104 | 11.5% |
| Physical & Health Sciences | 8 | 0.9% |
| Psychology | 42 | 4.7% |
| Social Sciences | 59 | 6.6% |
| Engineering | 38 | 4.2% |
| Multidisciplinary Studies | 18 | 2.0% |
| Science & Technology | 86 | 9.5% |
| Business | 103 | 11.4% |
| Education | 229 | 25.4% |
| Literature & Languages | 0 | 0.0% |
| Liberal Arts & History | 5 | 0.5% |
| Visual & Performing Arts | 3 | 0.3% |
| Communications | 28 | 3.1% |
| Arts & Humanities | 87 | 9.7% |
| Total | 901 | 100.0% |
Transportation & Commute in Coffeyville
Vehicle Availability by Sex in Coffeyville
The most prevalent vehicle ownership categories in Coffeyville are males with 2 vehicles (701, accounting for 43.3%) and females with 2 vehicles (491, making up 41.2%).
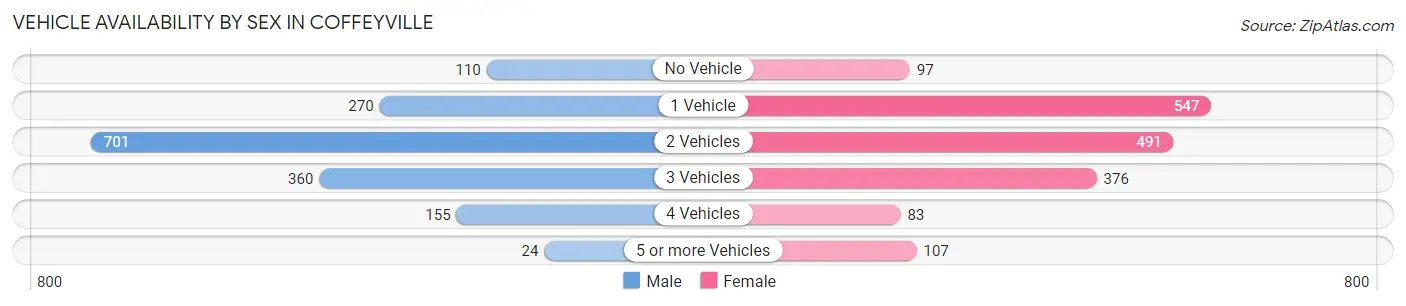
| Vehicles Available | Male | Female |
| No Vehicle | 110 (6.8%) | 97 (5.7%) |
| 1 Vehicle | 270 (16.7%) | 547 (32.2%) |
| 2 Vehicles | 701 (43.3%) | 491 (28.9%) |
| 3 Vehicles | 360 (22.2%) | 376 (22.1%) |
| 4 Vehicles | 155 (9.6%) | 83 (4.9%) |
| 5 or more Vehicles | 24 (1.5%) | 107 (6.3%) |
| Total | 1,620 (100.0%) | 1,701 (100.0%) |
Commute Time in Coffeyville
The most frequently occuring commute durations in Coffeyville are 5 to 9 minutes (788 commuters, 24.1%), 10 to 14 minutes (606 commuters, 18.5%), and less than 5 minutes (449 commuters, 13.7%).
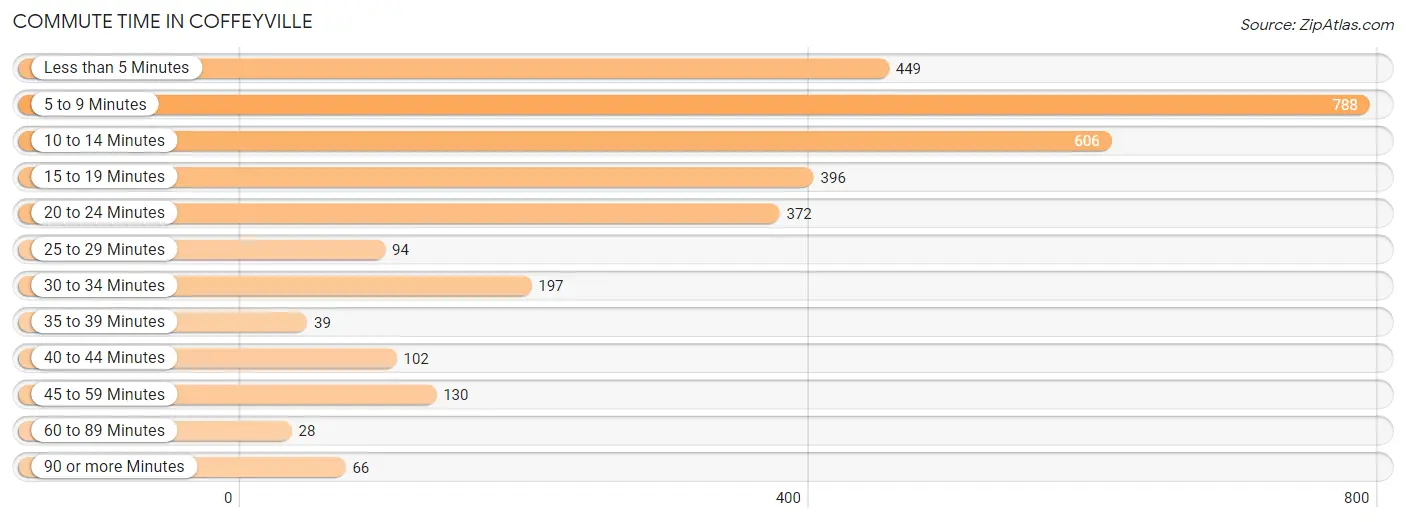
| Commute Time | # Commuters | % Commuters |
| Less than 5 Minutes | 449 | 13.7% |
| 5 to 9 Minutes | 788 | 24.1% |
| 10 to 14 Minutes | 606 | 18.5% |
| 15 to 19 Minutes | 396 | 12.1% |
| 20 to 24 Minutes | 372 | 11.4% |
| 25 to 29 Minutes | 94 | 2.9% |
| 30 to 34 Minutes | 197 | 6.0% |
| 35 to 39 Minutes | 39 | 1.2% |
| 40 to 44 Minutes | 102 | 3.1% |
| 45 to 59 Minutes | 130 | 4.0% |
| 60 to 89 Minutes | 28 | 0.9% |
| 90 or more Minutes | 66 | 2.0% |
Commute Time by Sex in Coffeyville
The most common commute times in Coffeyville are 10 to 14 minutes (447 commuters, 27.8%) for males and 5 to 9 minutes (418 commuters, 25.2%) for females.
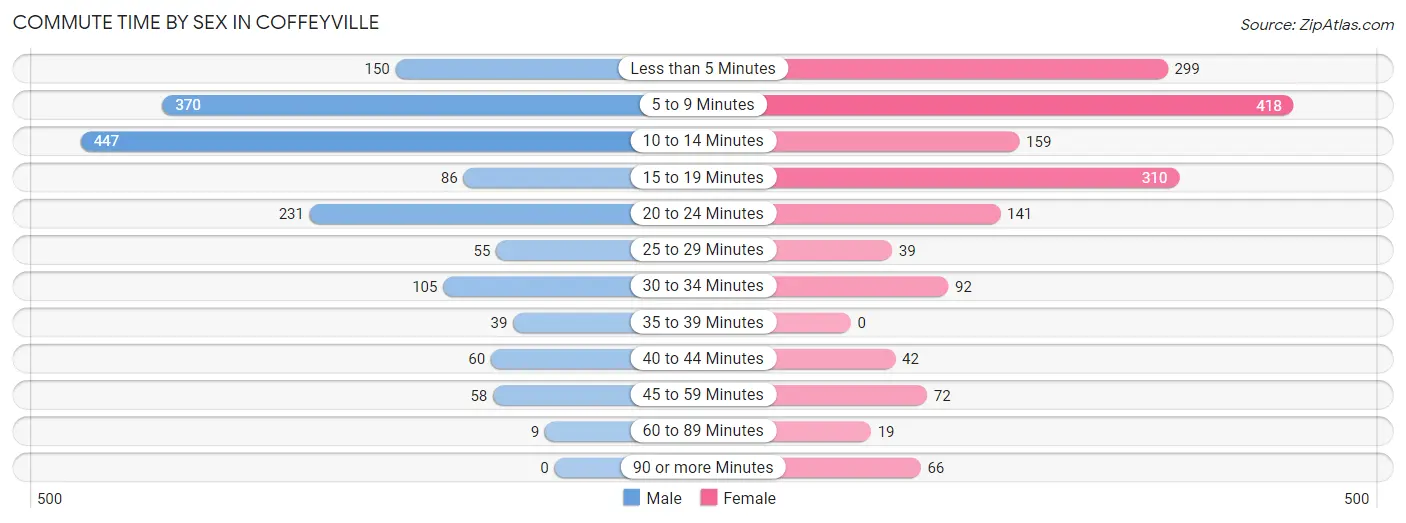
| Commute Time | Male | Female |
| Less than 5 Minutes | 150 (9.3%) | 299 (18.0%) |
| 5 to 9 Minutes | 370 (23.0%) | 418 (25.2%) |
| 10 to 14 Minutes | 447 (27.8%) | 159 (9.6%) |
| 15 to 19 Minutes | 86 (5.3%) | 310 (18.7%) |
| 20 to 24 Minutes | 231 (14.3%) | 141 (8.5%) |
| 25 to 29 Minutes | 55 (3.4%) | 39 (2.4%) |
| 30 to 34 Minutes | 105 (6.5%) | 92 (5.6%) |
| 35 to 39 Minutes | 39 (2.4%) | 0 (0.0%) |
| 40 to 44 Minutes | 60 (3.7%) | 42 (2.5%) |
| 45 to 59 Minutes | 58 (3.6%) | 72 (4.3%) |
| 60 to 89 Minutes | 9 (0.6%) | 19 (1.1%) |
| 90 or more Minutes | 0 (0.0%) | 66 (4.0%) |
Time of Departure to Work by Sex in Coffeyville
The most frequent times of departure to work in Coffeyville are 6:30 AM to 6:59 AM (318, 19.8%) for males and 12:00 PM to 3:59 PM (276, 16.7%) for females.
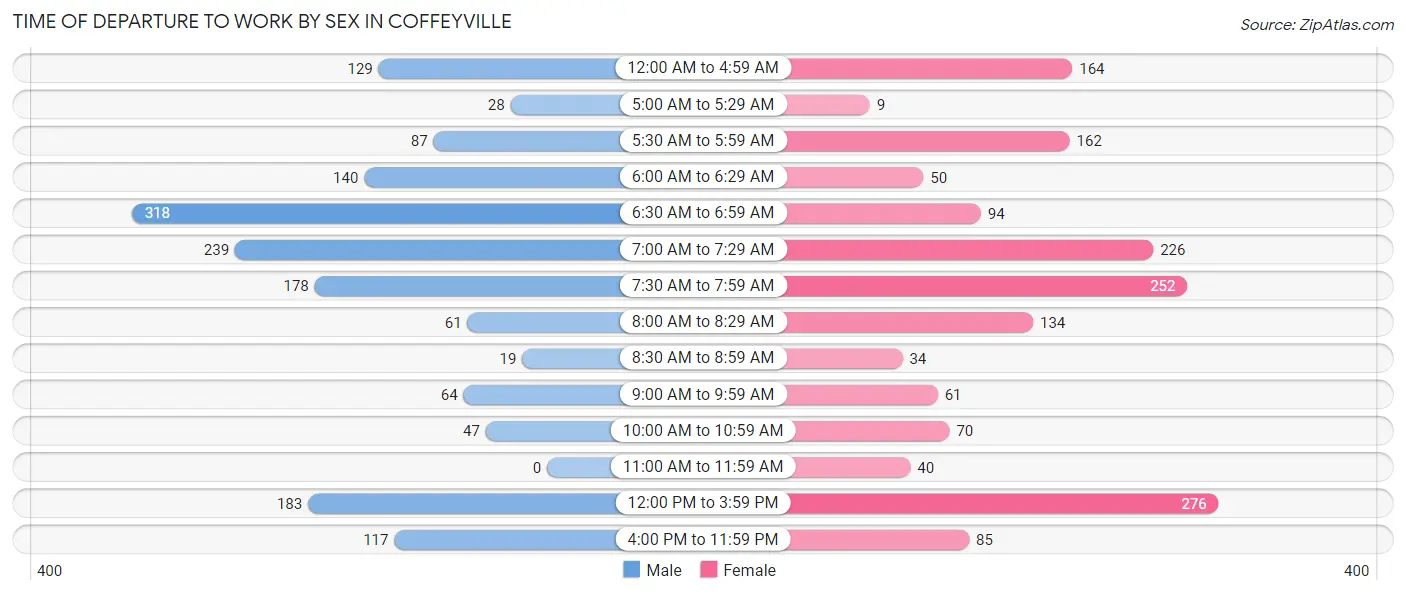
| Time of Departure | Male | Female |
| 12:00 AM to 4:59 AM | 129 (8.0%) | 164 (9.9%) |
| 5:00 AM to 5:29 AM | 28 (1.7%) | 9 (0.5%) |
| 5:30 AM to 5:59 AM | 87 (5.4%) | 162 (9.8%) |
| 6:00 AM to 6:29 AM | 140 (8.7%) | 50 (3.0%) |
| 6:30 AM to 6:59 AM | 318 (19.8%) | 94 (5.7%) |
| 7:00 AM to 7:29 AM | 239 (14.8%) | 226 (13.6%) |
| 7:30 AM to 7:59 AM | 178 (11.1%) | 252 (15.2%) |
| 8:00 AM to 8:29 AM | 61 (3.8%) | 134 (8.1%) |
| 8:30 AM to 8:59 AM | 19 (1.2%) | 34 (2.1%) |
| 9:00 AM to 9:59 AM | 64 (4.0%) | 61 (3.7%) |
| 10:00 AM to 10:59 AM | 47 (2.9%) | 70 (4.2%) |
| 11:00 AM to 11:59 AM | 0 (0.0%) | 40 (2.4%) |
| 12:00 PM to 3:59 PM | 183 (11.4%) | 276 (16.7%) |
| 4:00 PM to 11:59 PM | 117 (7.3%) | 85 (5.1%) |
| Total | 1,610 (100.0%) | 1,657 (100.0%) |
Housing Occupancy in Coffeyville
Occupancy by Ownership in Coffeyville
Of the total 3,575 dwellings in Coffeyville, owner-occupied units account for 2,300 (64.3%), while renter-occupied units make up 1,275 (35.7%).
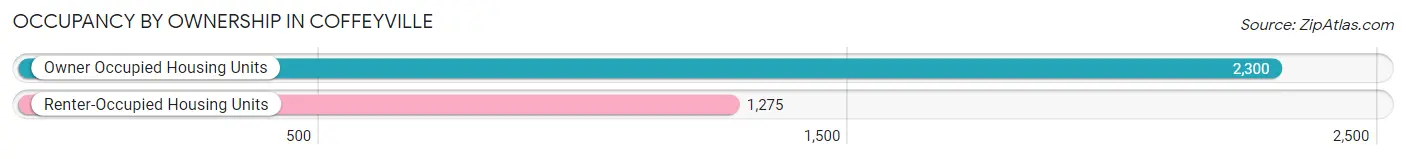
| Occupancy | # Housing Units | % Housing Units |
| Owner Occupied Housing Units | 2,300 | 64.3% |
| Renter-Occupied Housing Units | 1,275 | 35.7% |
| Total Occupied Housing Units | 3,575 | 100.0% |
Occupancy by Household Size in Coffeyville
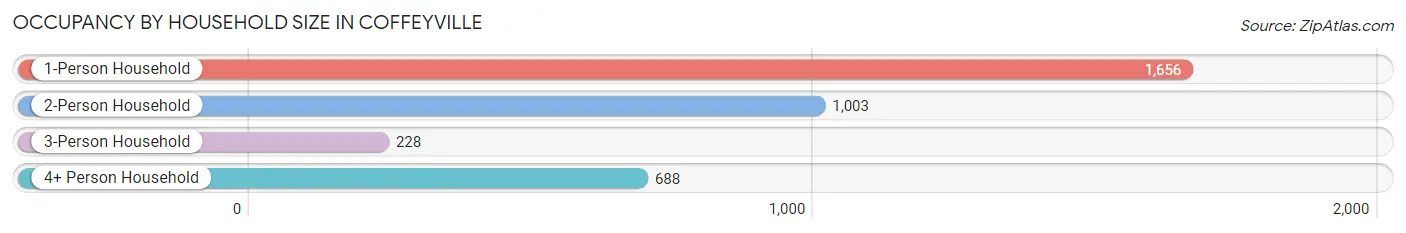
| Household Size | # Housing Units | % Housing Units |
| 1-Person Household | 1,656 | 46.3% |
| 2-Person Household | 1,003 | 28.1% |
| 3-Person Household | 228 | 6.4% |
| 4+ Person Household | 688 | 19.2% |
| Total Housing Units | 3,575 | 100.0% |
Occupancy by Ownership by Household Size in Coffeyville
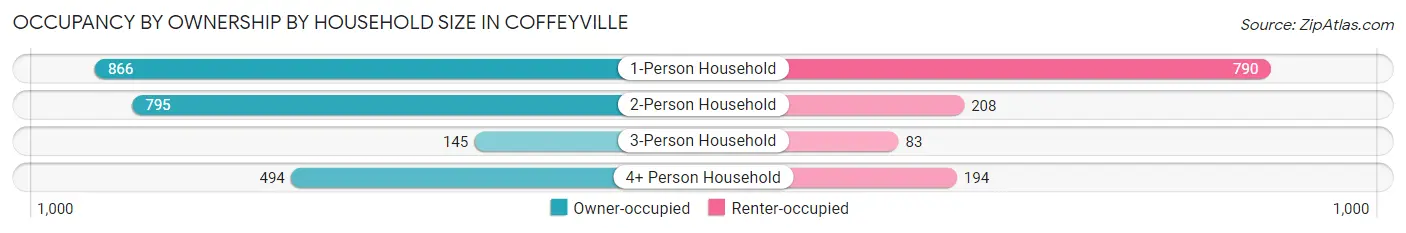
| Household Size | Owner-occupied | Renter-occupied |
| 1-Person Household | 866 (52.3%) | 790 (47.7%) |
| 2-Person Household | 795 (79.3%) | 208 (20.7%) |
| 3-Person Household | 145 (63.6%) | 83 (36.4%) |
| 4+ Person Household | 494 (71.8%) | 194 (28.2%) |
| Total Housing Units | 2,300 (64.3%) | 1,275 (35.7%) |
Occupancy by Educational Attainment in Coffeyville
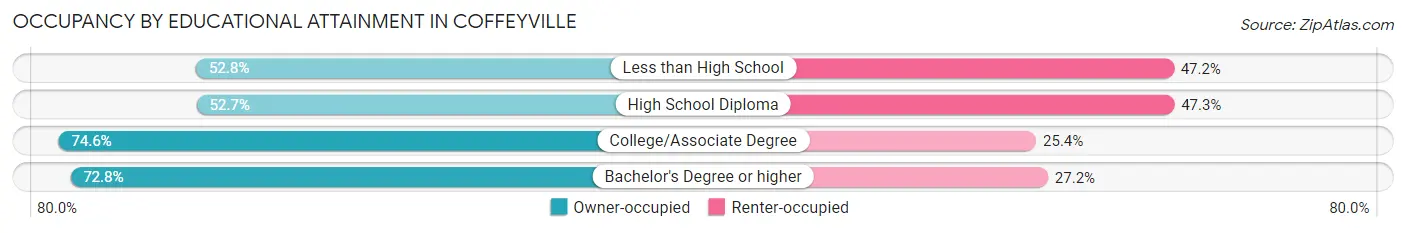
| Household Size | Owner-occupied | Renter-occupied |
| Less than High School | 301 (52.8%) | 269 (47.2%) |
| High School Diploma | 560 (52.7%) | 502 (47.3%) |
| College/Associate Degree | 1,009 (74.6%) | 343 (25.4%) |
| Bachelor's Degree or higher | 430 (72.8%) | 161 (27.2%) |
Occupancy by Age of Householder in Coffeyville
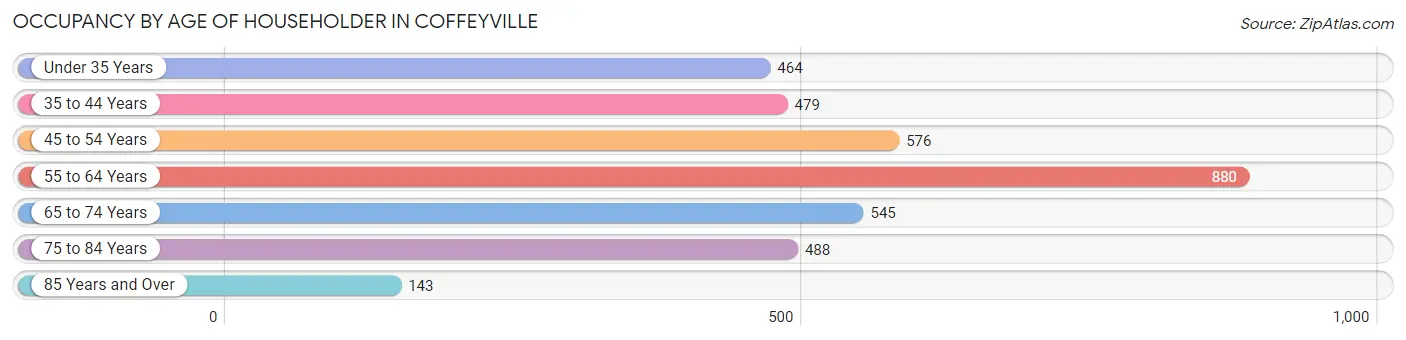
| Age Bracket | # Households | % Households |
| Under 35 Years | 464 | 13.0% |
| 35 to 44 Years | 479 | 13.4% |
| 45 to 54 Years | 576 | 16.1% |
| 55 to 64 Years | 880 | 24.6% |
| 65 to 74 Years | 545 | 15.2% |
| 75 to 84 Years | 488 | 13.7% |
| 85 Years and Over | 143 | 4.0% |
| Total | 3,575 | 100.0% |
Housing Finances in Coffeyville
Median Income by Occupancy in Coffeyville
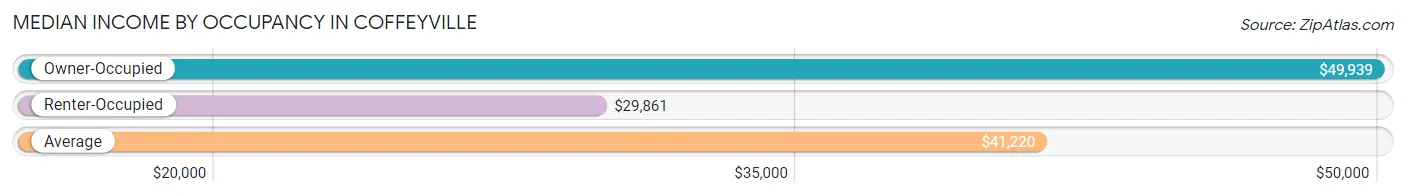
| Occupancy Type | # Households | Median Income |
| Owner-Occupied | 2,300 (64.3%) | $49,939 |
| Renter-Occupied | 1,275 (35.7%) | $29,861 |
| Average | 3,575 (100.0%) | $41,220 |
Occupancy by Householder Income Bracket in Coffeyville
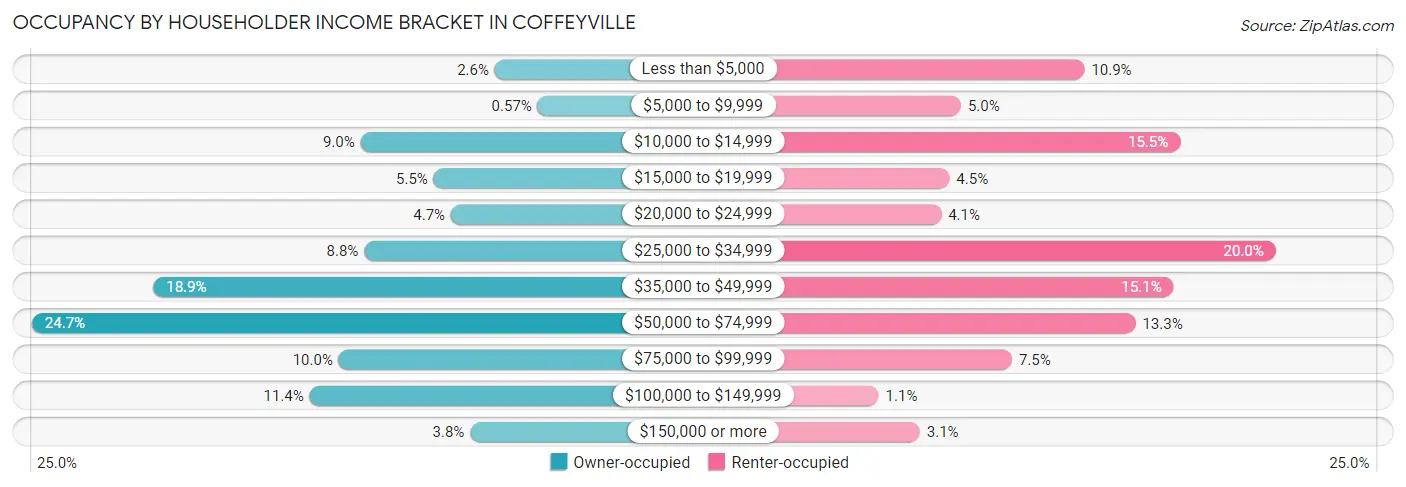
| Income Bracket | Owner-occupied | Renter-occupied |
| Less than $5,000 | 60 (2.6%) | 139 (10.9%) |
| $5,000 to $9,999 | 13 (0.6%) | 64 (5.0%) |
| $10,000 to $14,999 | 207 (9.0%) | 197 (15.4%) |
| $15,000 to $19,999 | 127 (5.5%) | 57 (4.5%) |
| $20,000 to $24,999 | 108 (4.7%) | 52 (4.1%) |
| $25,000 to $34,999 | 203 (8.8%) | 255 (20.0%) |
| $35,000 to $49,999 | 434 (18.9%) | 193 (15.1%) |
| $50,000 to $74,999 | 567 (24.6%) | 170 (13.3%) |
| $75,000 to $99,999 | 231 (10.0%) | 95 (7.4%) |
| $100,000 to $149,999 | 263 (11.4%) | 14 (1.1%) |
| $150,000 or more | 87 (3.8%) | 39 (3.1%) |
| Total | 2,300 (100.0%) | 1,275 (100.0%) |
Monthly Housing Cost Tiers in Coffeyville
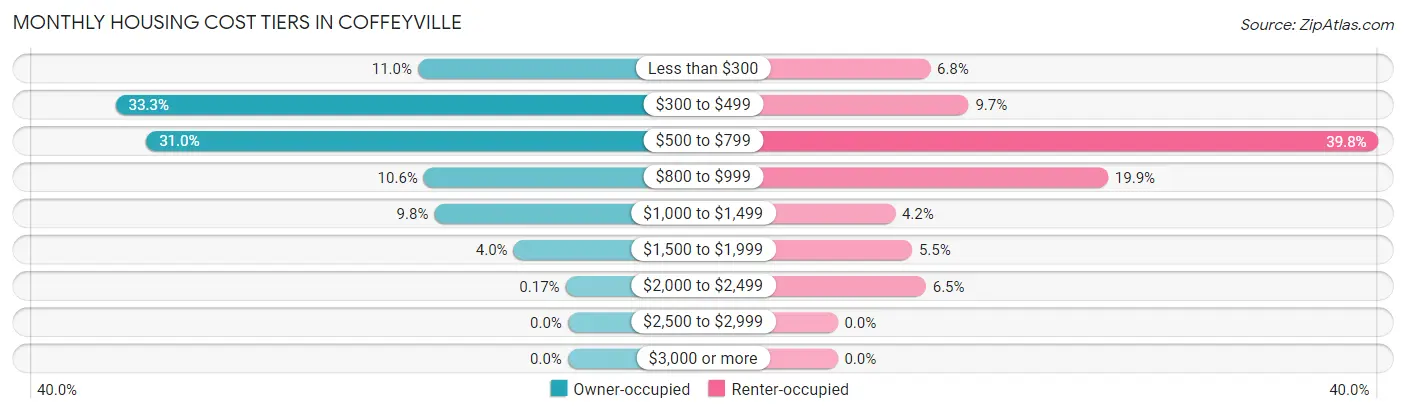
| Monthly Cost | Owner-occupied | Renter-occupied |
| Less than $300 | 254 (11.0%) | 87 (6.8%) |
| $300 to $499 | 766 (33.3%) | 123 (9.7%) |
| $500 to $799 | 714 (31.0%) | 508 (39.8%) |
| $800 to $999 | 244 (10.6%) | 254 (19.9%) |
| $1,000 to $1,499 | 226 (9.8%) | 54 (4.2%) |
| $1,500 to $1,999 | 92 (4.0%) | 70 (5.5%) |
| $2,000 to $2,499 | 4 (0.2%) | 83 (6.5%) |
| $2,500 to $2,999 | 0 (0.0%) | 0 (0.0%) |
| $3,000 or more | 0 (0.0%) | 0 (0.0%) |
| Total | 2,300 (100.0%) | 1,275 (100.0%) |
Physical Housing Characteristics in Coffeyville
Housing Structures in Coffeyville
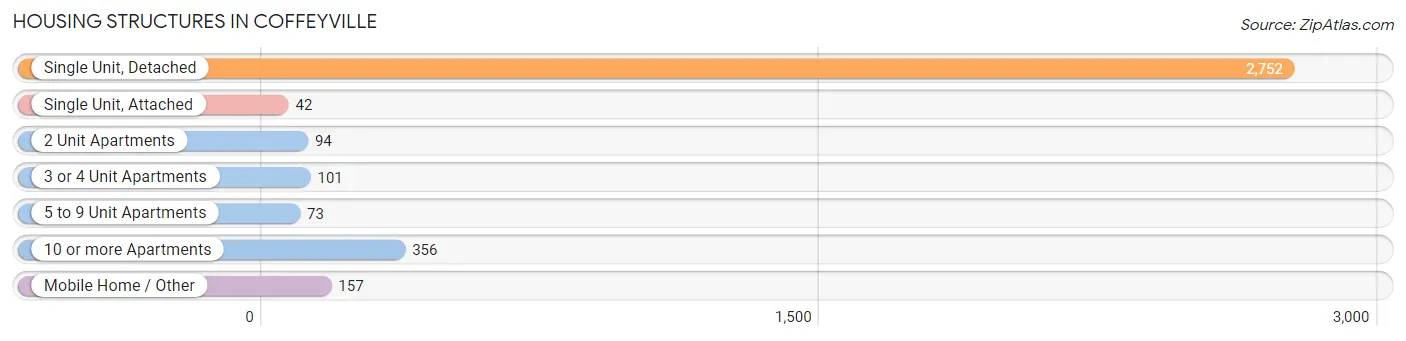
| Structure Type | # Housing Units | % Housing Units |
| Single Unit, Detached | 2,752 | 77.0% |
| Single Unit, Attached | 42 | 1.2% |
| 2 Unit Apartments | 94 | 2.6% |
| 3 or 4 Unit Apartments | 101 | 2.8% |
| 5 to 9 Unit Apartments | 73 | 2.0% |
| 10 or more Apartments | 356 | 10.0% |
| Mobile Home / Other | 157 | 4.4% |
| Total | 3,575 | 100.0% |
Housing Structures by Occupancy in Coffeyville
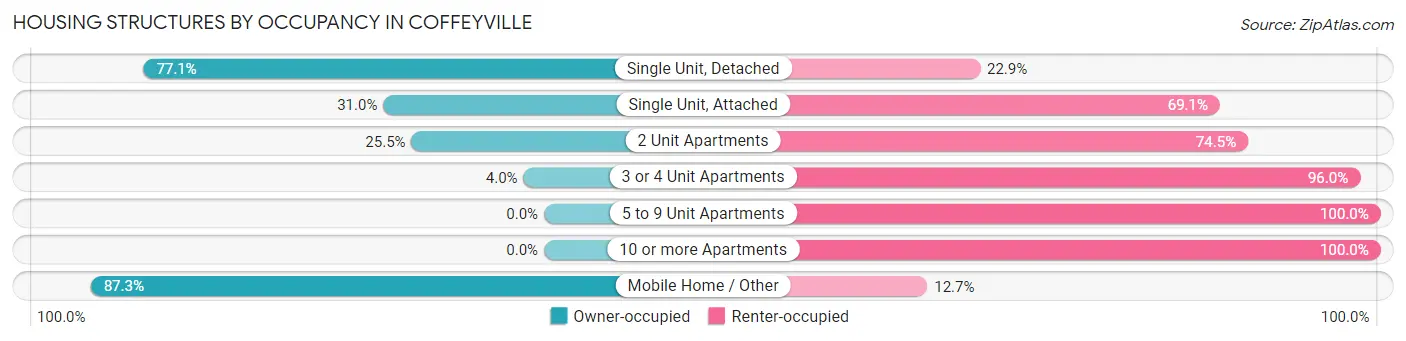
| Structure Type | Owner-occupied | Renter-occupied |
| Single Unit, Detached | 2,122 (77.1%) | 630 (22.9%) |
| Single Unit, Attached | 13 (30.9%) | 29 (69.1%) |
| 2 Unit Apartments | 24 (25.5%) | 70 (74.5%) |
| 3 or 4 Unit Apartments | 4 (4.0%) | 97 (96.0%) |
| 5 to 9 Unit Apartments | 0 (0.0%) | 73 (100.0%) |
| 10 or more Apartments | 0 (0.0%) | 356 (100.0%) |
| Mobile Home / Other | 137 (87.3%) | 20 (12.7%) |
| Total | 2,300 (64.3%) | 1,275 (35.7%) |
Housing Structures by Number of Rooms in Coffeyville
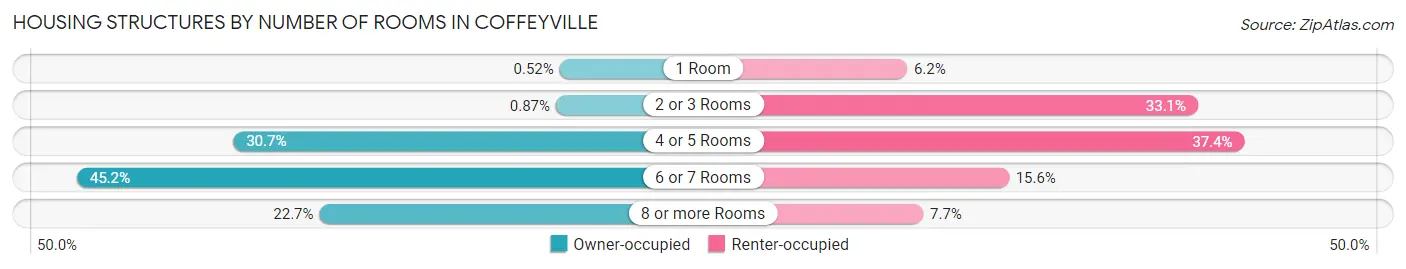
| Number of Rooms | Owner-occupied | Renter-occupied |
| 1 Room | 12 (0.5%) | 79 (6.2%) |
| 2 or 3 Rooms | 20 (0.9%) | 422 (33.1%) |
| 4 or 5 Rooms | 706 (30.7%) | 477 (37.4%) |
| 6 or 7 Rooms | 1,039 (45.2%) | 199 (15.6%) |
| 8 or more Rooms | 523 (22.7%) | 98 (7.7%) |
| Total | 2,300 (100.0%) | 1,275 (100.0%) |
Housing Structure by Heating Type in Coffeyville
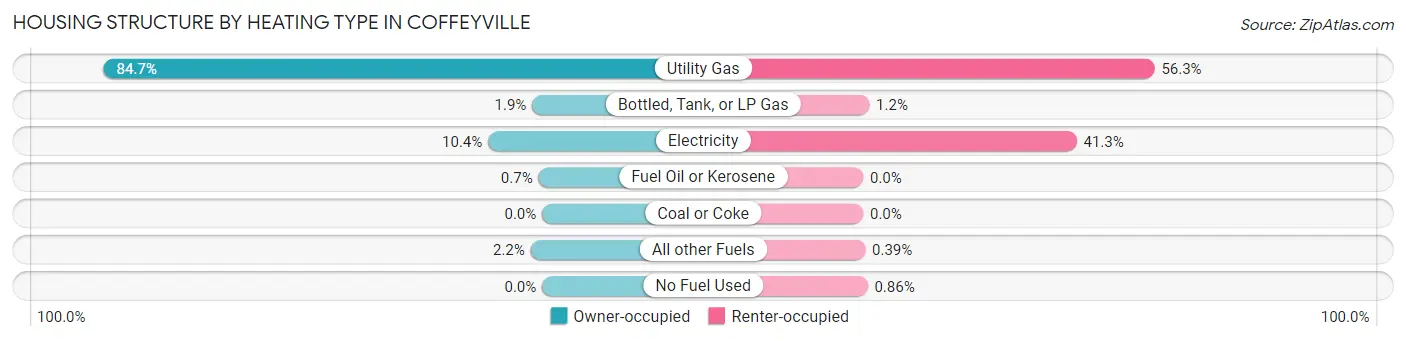
| Heating Type | Owner-occupied | Renter-occupied |
| Utility Gas | 1,949 (84.7%) | 718 (56.3%) |
| Bottled, Tank, or LP Gas | 44 (1.9%) | 15 (1.2%) |
| Electricity | 240 (10.4%) | 526 (41.2%) |
| Fuel Oil or Kerosene | 16 (0.7%) | 0 (0.0%) |
| Coal or Coke | 0 (0.0%) | 0 (0.0%) |
| All other Fuels | 51 (2.2%) | 5 (0.4%) |
| No Fuel Used | 0 (0.0%) | 11 (0.9%) |
| Total | 2,300 (100.0%) | 1,275 (100.0%) |
Household Vehicle Usage in Coffeyville
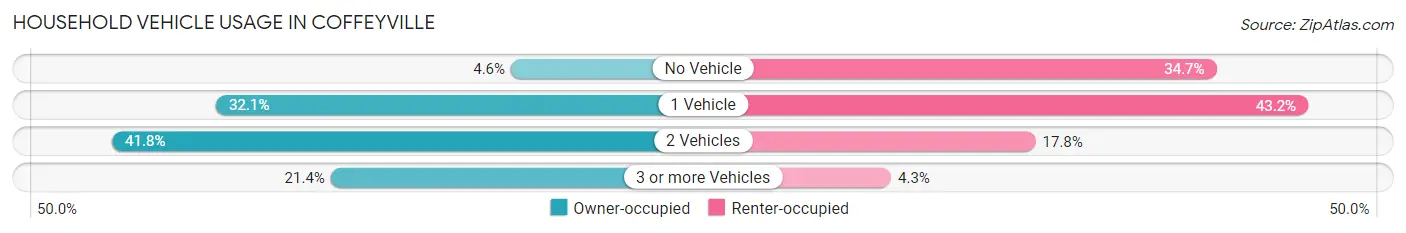
| Vehicles per Household | Owner-occupied | Renter-occupied |
| No Vehicle | 106 (4.6%) | 442 (34.7%) |
| 1 Vehicle | 739 (32.1%) | 551 (43.2%) |
| 2 Vehicles | 962 (41.8%) | 227 (17.8%) |
| 3 or more Vehicles | 493 (21.4%) | 55 (4.3%) |
| Total | 2,300 (100.0%) | 1,275 (100.0%) |
Real Estate & Mortgages in Coffeyville
Real Estate and Mortgage Overview in Coffeyville
| Characteristic | Without Mortgage | With Mortgage |
| Housing Units | 1,462 | 838 |
| Median Property Value | $47,100 | $76,700 |
| Median Household Income | $48,140 | $41 |
| Monthly Housing Costs | $451 | $0 |
| Real Estate Taxes | $862 | $0 |
Property Value by Mortgage Status in Coffeyville
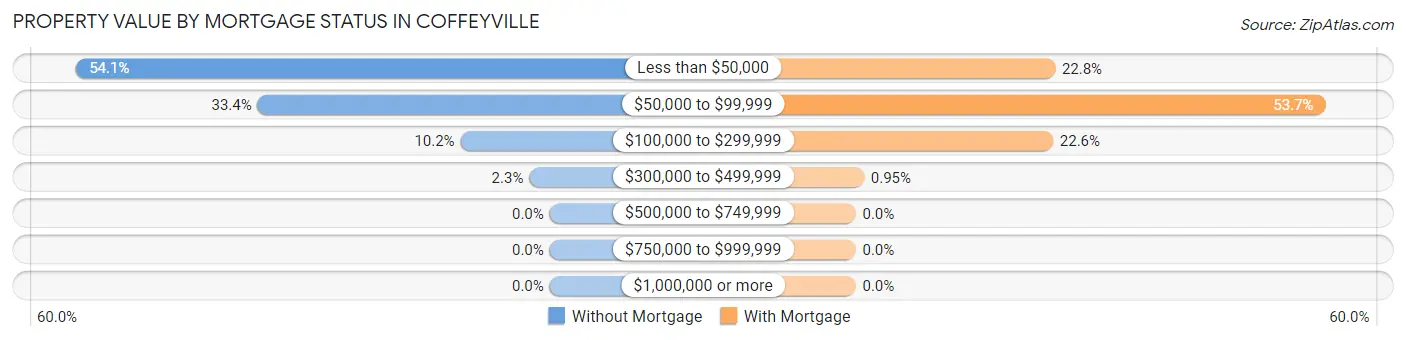
| Property Value | Without Mortgage | With Mortgage |
| Less than $50,000 | 791 (54.1%) | 191 (22.8%) |
| $50,000 to $99,999 | 488 (33.4%) | 450 (53.7%) |
| $100,000 to $299,999 | 149 (10.2%) | 189 (22.6%) |
| $300,000 to $499,999 | 34 (2.3%) | 8 (0.9%) |
| $500,000 to $749,999 | 0 (0.0%) | 0 (0.0%) |
| $750,000 to $999,999 | 0 (0.0%) | 0 (0.0%) |
| $1,000,000 or more | 0 (0.0%) | 0 (0.0%) |
| Total | 1,462 (100.0%) | 838 (100.0%) |
Household Income by Mortgage Status in Coffeyville
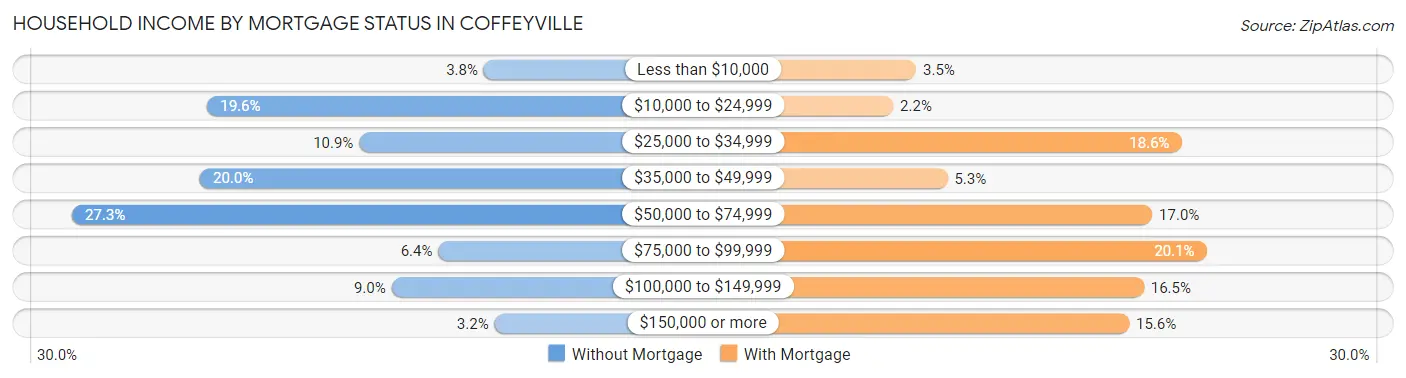
| Household Income | Without Mortgage | With Mortgage |
| Less than $10,000 | 55 (3.8%) | 29 (3.5%) |
| $10,000 to $24,999 | 286 (19.6%) | 18 (2.1%) |
| $25,000 to $34,999 | 159 (10.9%) | 156 (18.6%) |
| $35,000 to $49,999 | 292 (20.0%) | 44 (5.2%) |
| $50,000 to $74,999 | 399 (27.3%) | 142 (17.0%) |
| $75,000 to $99,999 | 93 (6.4%) | 168 (20.1%) |
| $100,000 to $149,999 | 132 (9.0%) | 138 (16.5%) |
| $150,000 or more | 46 (3.2%) | 131 (15.6%) |
| Total | 1,462 (100.0%) | 838 (100.0%) |
Property Value to Household Income Ratio in Coffeyville
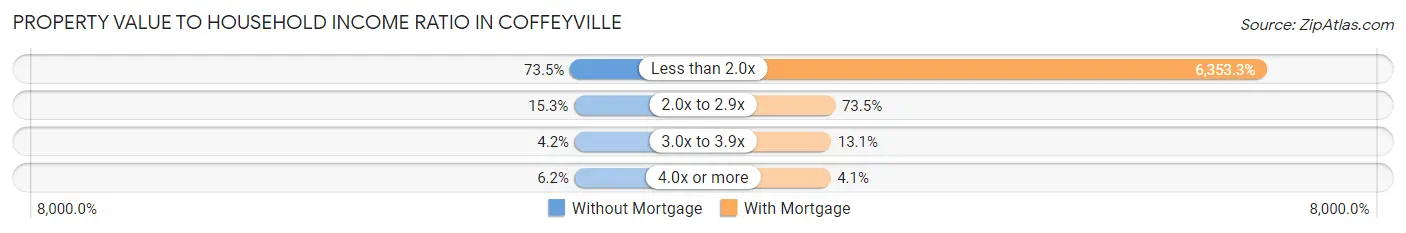
| Value-to-Income Ratio | Without Mortgage | With Mortgage |
| Less than 2.0x | 1,074 (73.5%) | 53,241 (6,353.3%) |
| 2.0x to 2.9x | 223 (15.2%) | 616 (73.5%) |
| 3.0x to 3.9x | 61 (4.2%) | 110 (13.1%) |
| 4.0x or more | 90 (6.2%) | 34 (4.1%) |
| Total | 1,462 (100.0%) | 838 (100.0%) |
Real Estate Taxes by Mortgage Status in Coffeyville
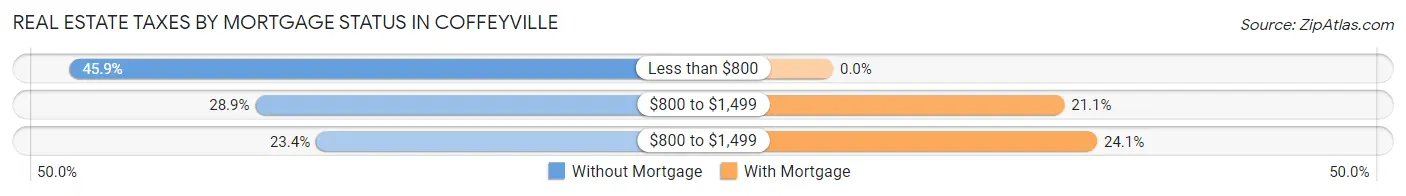
| Property Taxes | Without Mortgage | With Mortgage |
| Less than $800 | 671 (45.9%) | 0 (0.0%) |
| $800 to $1,499 | 423 (28.9%) | 177 (21.1%) |
| $800 to $1,499 | 342 (23.4%) | 202 (24.1%) |
| Total | 1,462 (100.0%) | 838 (100.0%) |
Health & Disability in Coffeyville
Health Insurance Coverage by Age in Coffeyville
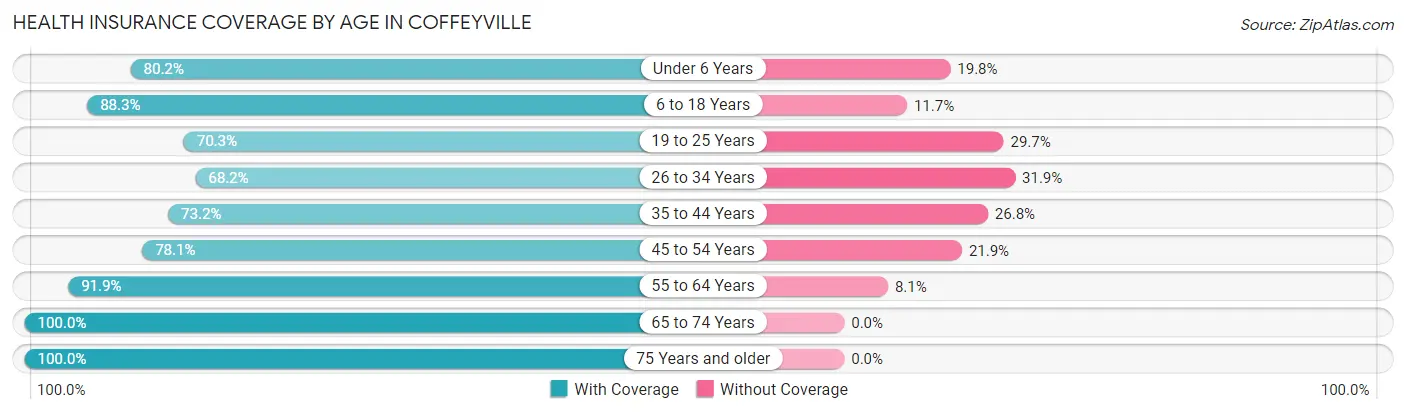
| Age Bracket | With Coverage | Without Coverage |
| Under 6 Years | 511 (80.2%) | 126 (19.8%) |
| 6 to 18 Years | 1,352 (88.3%) | 179 (11.7%) |
| 19 to 25 Years | 497 (70.3%) | 210 (29.7%) |
| 26 to 34 Years | 687 (68.1%) | 321 (31.9%) |
| 35 to 44 Years | 607 (73.2%) | 222 (26.8%) |
| 45 to 54 Years | 758 (78.1%) | 213 (21.9%) |
| 55 to 64 Years | 1,286 (91.9%) | 114 (8.1%) |
| 65 to 74 Years | 793 (100.0%) | 0 (0.0%) |
| 75 Years and older | 761 (100.0%) | 0 (0.0%) |
| Total | 7,252 (84.0%) | 1,385 (16.0%) |
Health Insurance Coverage by Citizenship Status in Coffeyville
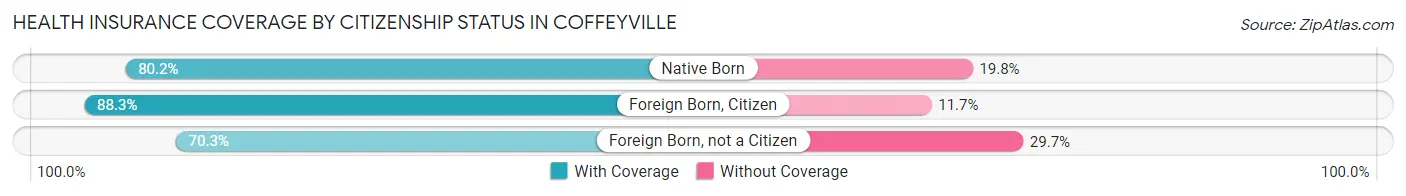
| Citizenship Status | With Coverage | Without Coverage |
| Native Born | 511 (80.2%) | 126 (19.8%) |
| Foreign Born, Citizen | 1,352 (88.3%) | 179 (11.7%) |
| Foreign Born, not a Citizen | 497 (70.3%) | 210 (29.7%) |
Health Insurance Coverage by Household Income in Coffeyville
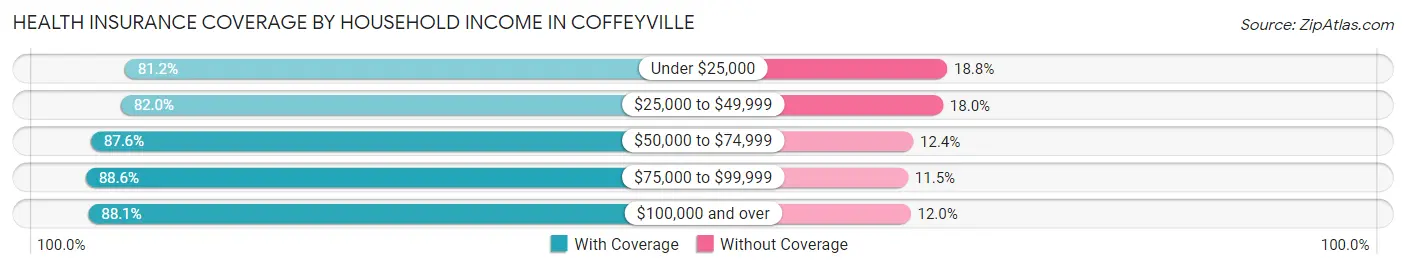
| Household Income | With Coverage | Without Coverage |
| Under $25,000 | 1,371 (81.2%) | 317 (18.8%) |
| $25,000 to $49,999 | 1,967 (82.0%) | 432 (18.0%) |
| $50,000 to $74,999 | 1,806 (87.6%) | 256 (12.4%) |
| $75,000 to $99,999 | 719 (88.5%) | 93 (11.5%) |
| $100,000 and over | 1,157 (88.0%) | 157 (11.9%) |
Public vs Private Health Insurance Coverage by Age in Coffeyville
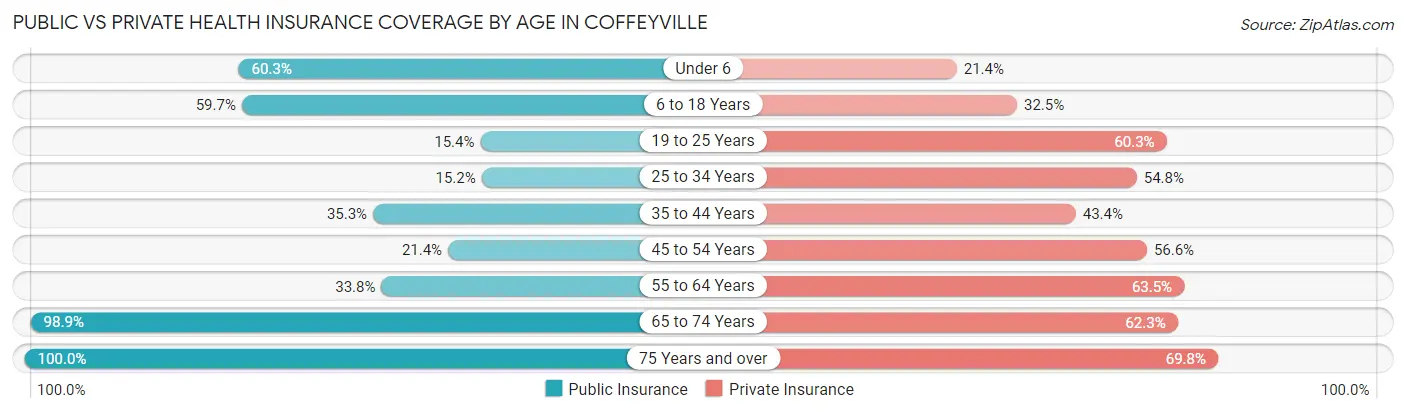
| Age Bracket | Public Insurance | Private Insurance |
| Under 6 | 384 (60.3%) | 136 (21.3%) |
| 6 to 18 Years | 914 (59.7%) | 498 (32.5%) |
| 19 to 25 Years | 109 (15.4%) | 426 (60.3%) |
| 25 to 34 Years | 153 (15.2%) | 552 (54.8%) |
| 35 to 44 Years | 293 (35.3%) | 360 (43.4%) |
| 45 to 54 Years | 208 (21.4%) | 550 (56.6%) |
| 55 to 64 Years | 473 (33.8%) | 889 (63.5%) |
| 65 to 74 Years | 784 (98.9%) | 494 (62.3%) |
| 75 Years and over | 761 (100.0%) | 531 (69.8%) |
| Total | 4,079 (47.2%) | 4,436 (51.4%) |
Disability Status by Sex by Age in Coffeyville
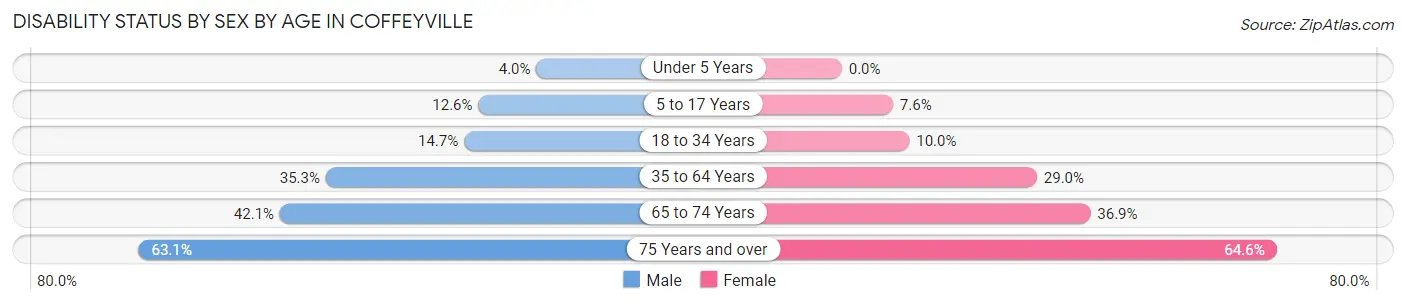
| Age Bracket | Male | Female |
| Under 5 Years | 11 (4.0%) | 0 (0.0%) |
| 5 to 17 Years | 77 (12.6%) | 61 (7.6%) |
| 18 to 34 Years | 156 (14.7%) | 90 (10.0%) |
| 35 to 64 Years | 576 (35.3%) | 454 (29.0%) |
| 65 to 74 Years | 173 (42.1%) | 141 (36.9%) |
| 75 Years and over | 222 (63.1%) | 264 (64.5%) |
Disability Class by Sex by Age in Coffeyville
Disability Class: Hearing Difficulty
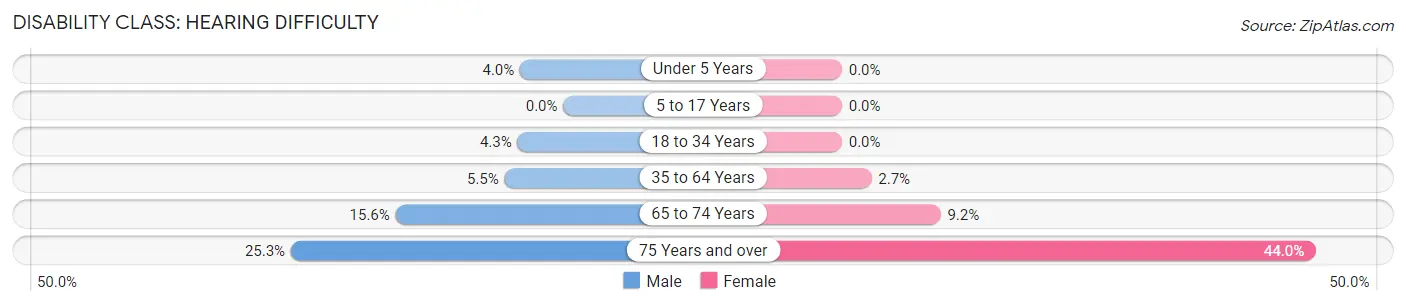
| Age Bracket | Male | Female |
| Under 5 Years | 11 (4.0%) | 0 (0.0%) |
| 5 to 17 Years | 0 (0.0%) | 0 (0.0%) |
| 18 to 34 Years | 45 (4.3%) | 0 (0.0%) |
| 35 to 64 Years | 89 (5.4%) | 43 (2.7%) |
| 65 to 74 Years | 64 (15.6%) | 35 (9.2%) |
| 75 Years and over | 89 (25.3%) | 180 (44.0%) |
Disability Class: Vision Difficulty
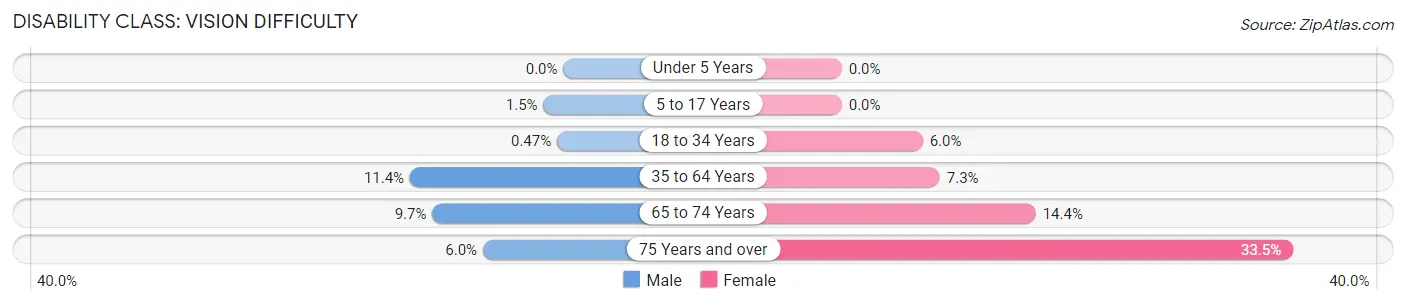
| Age Bracket | Male | Female |
| Under 5 Years | 0 (0.0%) | 0 (0.0%) |
| 5 to 17 Years | 9 (1.5%) | 0 (0.0%) |
| 18 to 34 Years | 5 (0.5%) | 54 (6.0%) |
| 35 to 64 Years | 186 (11.4%) | 114 (7.3%) |
| 65 to 74 Years | 40 (9.7%) | 55 (14.4%) |
| 75 Years and over | 21 (6.0%) | 137 (33.5%) |
Disability Class: Cognitive Difficulty
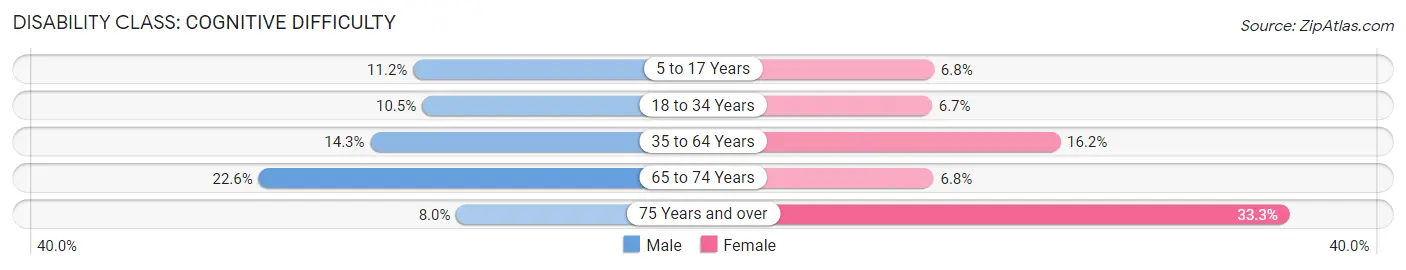
| Age Bracket | Male | Female |
| 5 to 17 Years | 68 (11.2%) | 55 (6.8%) |
| 18 to 34 Years | 111 (10.5%) | 60 (6.7%) |
| 35 to 64 Years | 234 (14.3%) | 254 (16.2%) |
| 65 to 74 Years | 93 (22.6%) | 26 (6.8%) |
| 75 Years and over | 28 (8.0%) | 136 (33.3%) |
Disability Class: Ambulatory Difficulty
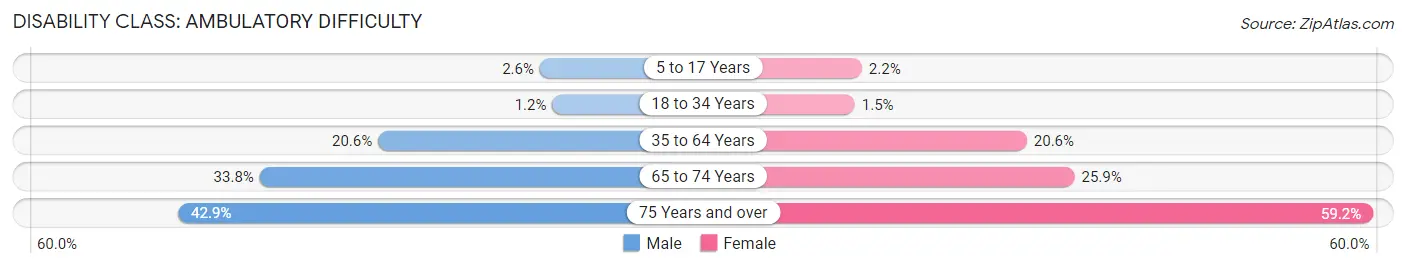
| Age Bracket | Male | Female |
| 5 to 17 Years | 16 (2.6%) | 18 (2.2%) |
| 18 to 34 Years | 13 (1.2%) | 13 (1.5%) |
| 35 to 64 Years | 337 (20.6%) | 323 (20.6%) |
| 65 to 74 Years | 139 (33.8%) | 99 (25.9%) |
| 75 Years and over | 151 (42.9%) | 242 (59.2%) |
Disability Class: Self-Care Difficulty
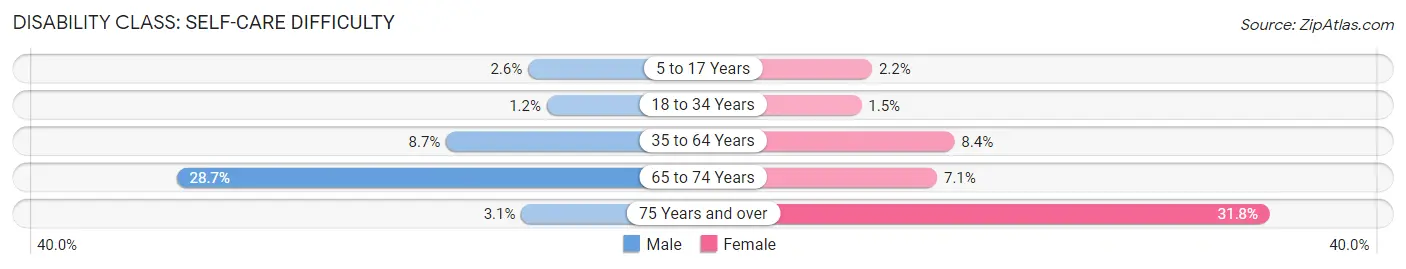
| Age Bracket | Male | Female |
| 5 to 17 Years | 16 (2.6%) | 18 (2.2%) |
| 18 to 34 Years | 13 (1.2%) | 13 (1.5%) |
| 35 to 64 Years | 142 (8.7%) | 131 (8.4%) |
| 65 to 74 Years | 118 (28.7%) | 27 (7.1%) |
| 75 Years and over | 11 (3.1%) | 130 (31.8%) |
Technology Access in Coffeyville
Computing Device Access in Coffeyville
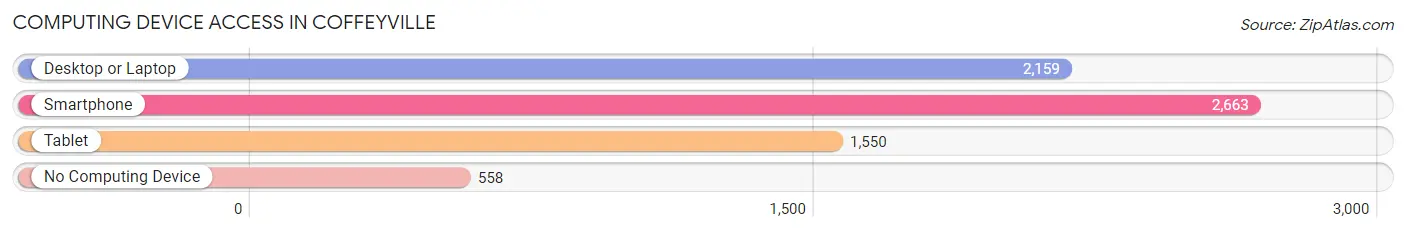
| Device Type | # Households | % Households |
| Desktop or Laptop | 2,159 | 60.4% |
| Smartphone | 2,663 | 74.5% |
| Tablet | 1,550 | 43.4% |
| No Computing Device | 558 | 15.6% |
| Total | 3,575 | 100.0% |
Internet Access in Coffeyville
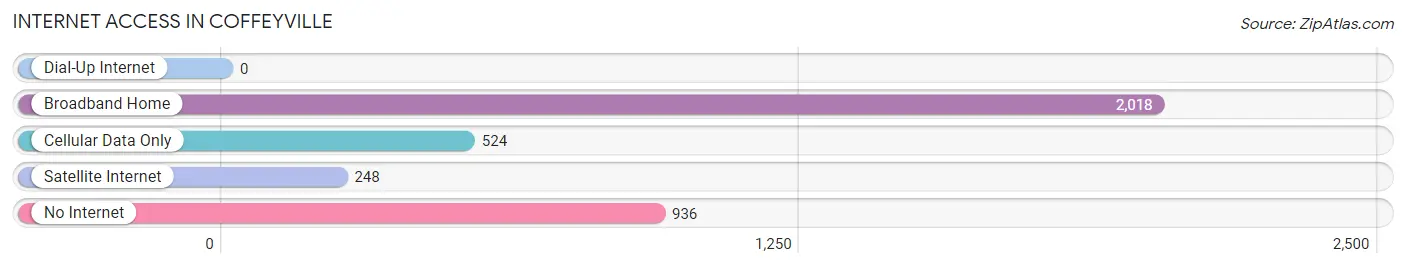
| Internet Type | # Households | % Households |
| Dial-Up Internet | 0 | 0.0% |
| Broadband Home | 2,018 | 56.5% |
| Cellular Data Only | 524 | 14.7% |
| Satellite Internet | 248 | 6.9% |
| No Internet | 936 | 26.2% |
| Total | 3,575 | 100.0% |
Coffeyville Summary
Coffeyville, Kansas is a small city located in Montgomery County in the southeastern corner of the state. It is situated along the Verdigris River, and is the county seat of Montgomery County. The city has a population of 10,295 as of the 2010 census, and is part of the Coffeyville Micropolitan Statistical Area.
History
Coffeyville was founded in 1869 by Colonel James A. Coffey, a Civil War veteran who had moved to the area from Ohio. The city was named after him, and he was instrumental in the development of the city. The city was incorporated in 1872, and the first post office was established in 1873.
In 1882, the Kansas City, Fort Scott and Gulf Railroad arrived in Coffeyville, and the city quickly became a major shipping center for the region. The railroad also helped to spur the growth of the city, and by the turn of the century, Coffeyville had become a major industrial center.
In the early 1900s, the city was home to several large oil refineries, including the Coffeyville Refining Company, which was the largest refinery in the world at the time. The city also had a large number of manufacturing plants, including a glass factory, a flour mill, and a furniture factory.
Geography
Coffeyville is located in southeastern Kansas, in Montgomery County. It is situated along the Verdigris River, and is about 50 miles south of the Kansas-Oklahoma border. The city has a total area of 5.3 square miles, all of which is land.
The city has a humid subtropical climate, with hot, humid summers and cold, dry winters. The average annual temperature is around 54°F, and the average annual precipitation is around 37 inches.
Economy
Coffeyville’s economy is largely based on manufacturing and agriculture. The city is home to several large manufacturing plants, including a glass factory, a flour mill, and a furniture factory. The city is also home to several large oil refineries, including the Coffeyville Refining Company, which is the largest refinery in the world.
Agriculture is also an important part of the local economy. The city is home to several large farms, and the surrounding area is known for its production of wheat, corn, soybeans, and other crops.
Demographics
As of the 2010 census, the population of Coffeyville was 10,295. The racial makeup of the city was 79.2% White, 15.2% African American, 0.7% Native American, 0.5% Asian, 0.1% Pacific Islander, 1.3% from other races, and 2.9% from two or more races. Hispanic or Latino of any race were 4.2% of the population.
The median household income in Coffeyville was $32,917, and the median family income was $41,917. The per capita income was $17,845. About 17.2% of the population was below the poverty line.
Common Questions
What is Per Capita Income in Coffeyville?
Per Capita income in Coffeyville is $24,060.
What is the Median Family Income in Coffeyville?
Median Family Income in Coffeyville is $53,657.
What is the Median Household income in Coffeyville?
Median Household Income in Coffeyville is $41,220.
What is Income or Wage Gap in Coffeyville?
Income or Wage Gap in Coffeyville is 30.5%.
Women in Coffeyville earn 69.5 cents for every dollar earned by a man.
What is Family Income Deficit in Coffeyville?
Family Income Deficit in Coffeyville is $12,667.
Families that are below poverty line in Coffeyville earn $12,667 less on average than the poverty threshold level.
What is Inequality or Gini Index in Coffeyville?
Inequality or Gini Index in Coffeyville is 0.45.
What is the Total Population of Coffeyville?
Total Population of Coffeyville is 8,842.
What is the Total Male Population of Coffeyville?
Total Male Population of Coffeyville is 4,392.
What is the Total Female Population of Coffeyville?
Total Female Population of Coffeyville is 4,450.
What is the Ratio of Males per 100 Females in Coffeyville?
There are 98.70 Males per 100 Females in Coffeyville.
What is the Ratio of Females per 100 Males in Coffeyville?
There are 101.32 Females per 100 Males in Coffeyville.
What is the Median Population Age in Coffeyville?
Median Population Age in Coffeyville is 41.0 Years.
What is the Average Family Size in Coffeyville
Average Family Size in Coffeyville is 3.4 People.
What is the Average Household Size in Coffeyville
Average Household Size in Coffeyville is 2.3 People.
How Large is the Labor Force in Coffeyville?
There are 3,670 People in the Labor Forcein in Coffeyville.
What is the Percentage of People in the Labor Force in Coffeyville?
51.0% of People are in the Labor Force in Coffeyville.
What is the Unemployment Rate in Coffeyville?
Unemployment Rate in Coffeyville is 7.0%.