Labelle, FL Map & Demographics
Labelle Map
Labelle Overview
$25,776
PER CAPITA INCOME
$55,605
AVG FAMILY INCOME
$49,371
AVG HOUSEHOLD INCOME
14.5%
WAGE / INCOME GAP [ % ]
85.5¢/ $1
WAGE / INCOME GAP [ $ ]
0.53
INEQUALITY / GINI INDEX
4,963
TOTAL POPULATION
2,949
MALE POPULATION
2,014
FEMALE POPULATION
146.43
MALES / 100 FEMALES
68.29
FEMALES / 100 MALES
38.3
MEDIAN AGE
3.2
AVG FAMILY SIZE
2.9
AVG HOUSEHOLD SIZE
2,378
LABOR FORCE [ PEOPLE ]
60.0%
PERCENT IN LABOR FORCE
3.3%
UNEMPLOYMENT RATE
Labelle Zip Codes
Labelle Area Codes
Income in Labelle
Income Overview in Labelle
Per Capita Income in Labelle is $25,776, while median incomes of families and households are $55,605 and $49,371 respectively.
| Characteristic | Number | Measure |
| Per Capita Income | 4,963 | $25,776 |
| Median Family Income | 1,300 | $55,605 |
| Mean Family Income | 1,300 | $83,733 |
| Median Household Income | 1,578 | $49,371 |
| Mean Household Income | 1,578 | $76,038 |
| Income Deficit | 1,300 | $0 |
| Wage / Income Gap (%) | 4,963 | 14.50% |
| Wage / Income Gap ($) | 4,963 | 85.50¢ per $1 |
| Gini / Inequality Index | 4,963 | 0.53 |
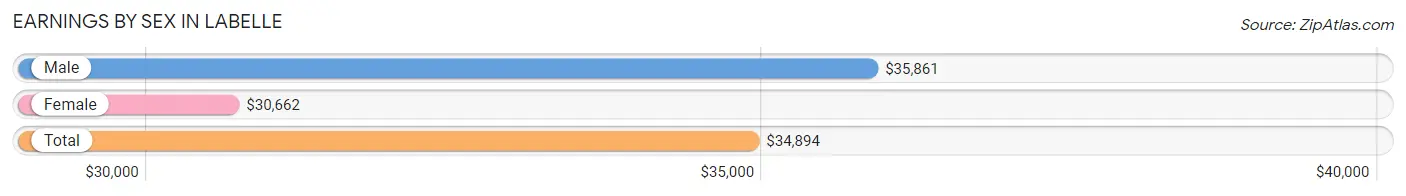
Earnings by Sex in Labelle
Average Earnings in Labelle are $34,894, $35,861 for men and $30,662 for women, a difference of 14.5%.
| Sex | Number | Average Earnings |
| Male | 1,744 (70.4%) | $35,861 |
| Female | 734 (29.6%) | $30,662 |
| Total | 2,478 (100.0%) | $34,894 |
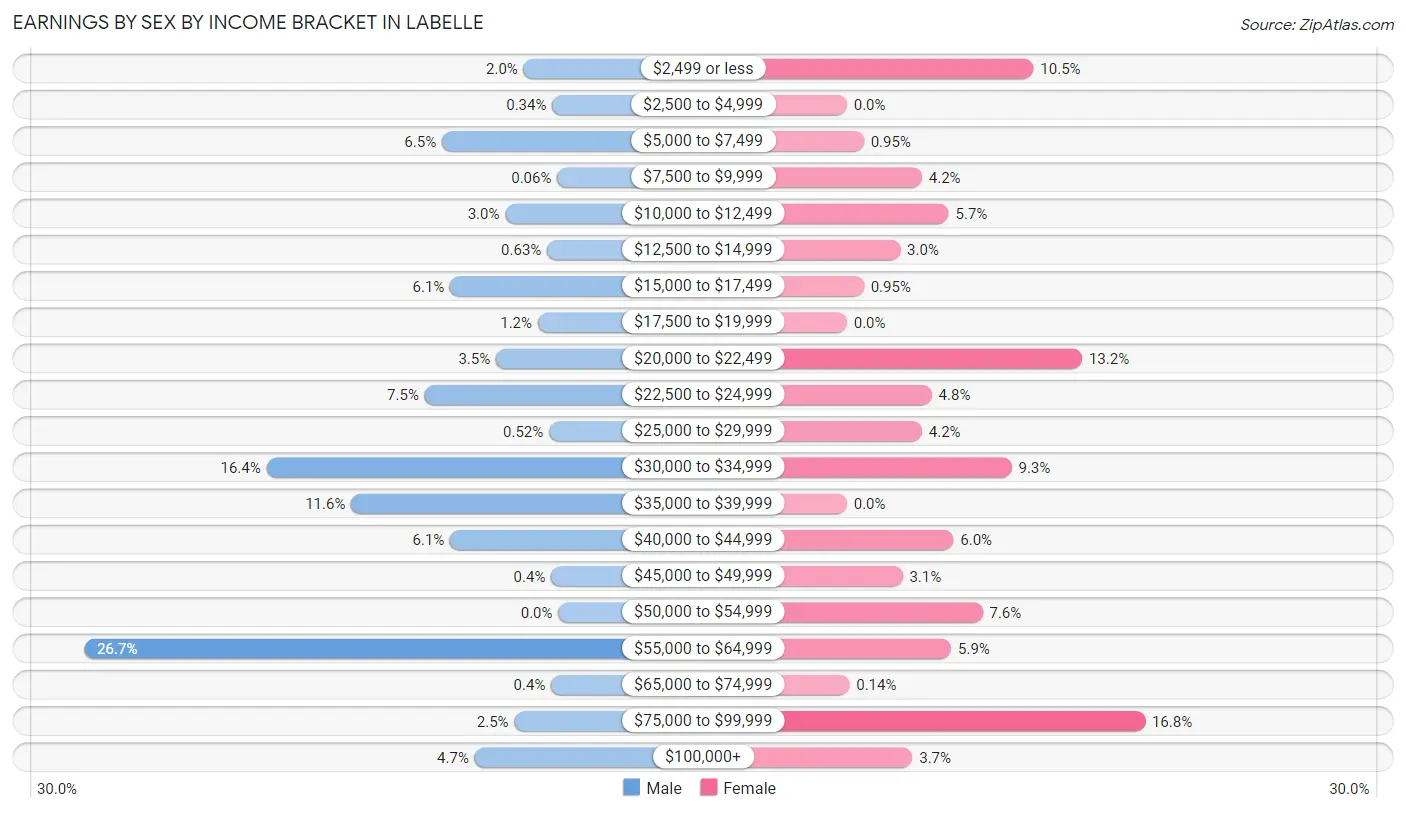
Earnings by Sex by Income Bracket in Labelle
The most common earnings brackets in Labelle are $55,000 to $64,999 for men (465 | 26.7%) and $75,000 to $99,999 for women (123 | 16.8%).
| Income | Male | Female |
| $2,499 or less | 34 (1.9%) | 77 (10.5%) |
| $2,500 to $4,999 | 6 (0.3%) | 0 (0.0%) |
| $5,000 to $7,499 | 114 (6.5%) | 7 (0.9%) |
| $7,500 to $9,999 | 1 (0.1%) | 31 (4.2%) |
| $10,000 to $12,499 | 52 (3.0%) | 42 (5.7%) |
| $12,500 to $14,999 | 11 (0.6%) | 22 (3.0%) |
| $15,000 to $17,499 | 106 (6.1%) | 7 (0.9%) |
| $17,500 to $19,999 | 20 (1.1%) | 0 (0.0%) |
| $20,000 to $22,499 | 61 (3.5%) | 97 (13.2%) |
| $22,500 to $24,999 | 131 (7.5%) | 35 (4.8%) |
| $25,000 to $29,999 | 9 (0.5%) | 31 (4.2%) |
| $30,000 to $34,999 | 286 (16.4%) | 68 (9.3%) |
| $35,000 to $39,999 | 203 (11.6%) | 0 (0.0%) |
| $40,000 to $44,999 | 106 (6.1%) | 44 (6.0%) |
| $45,000 to $49,999 | 7 (0.4%) | 23 (3.1%) |
| $50,000 to $54,999 | 0 (0.0%) | 56 (7.6%) |
| $55,000 to $64,999 | 465 (26.7%) | 43 (5.9%) |
| $65,000 to $74,999 | 7 (0.4%) | 1 (0.1%) |
| $75,000 to $99,999 | 43 (2.5%) | 123 (16.8%) |
| $100,000+ | 82 (4.7%) | 27 (3.7%) |
| Total | 1,744 (100.0%) | 734 (100.0%) |
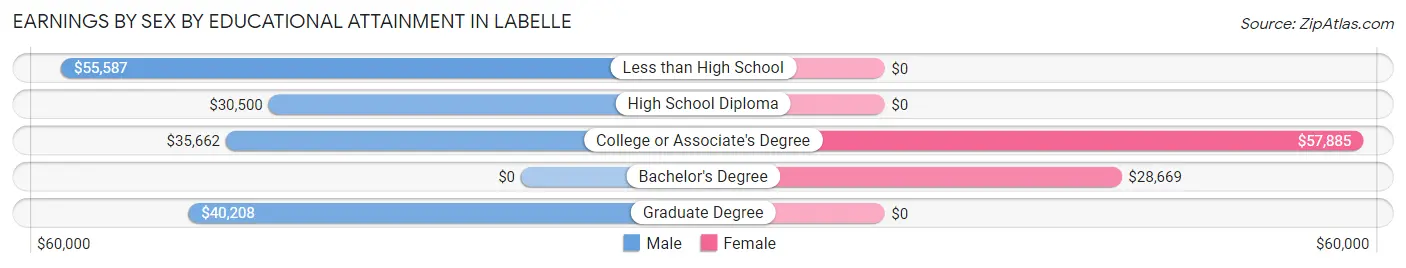
Earnings by Sex by Educational Attainment in Labelle
Average earnings in Labelle are $37,515 for men and $40,729 for women, a difference of 7.9%. Men with an educational attainment of less than high school enjoy the highest average annual earnings of $55,587, while those with high school diploma education earn the least with $30,500. Women with an educational attainment of college or associate's degree earn the most with the average annual earnings of $57,885, while those with bachelor's degree education have the smallest earnings of $28,669.
| Educational Attainment | Male Income | Female Income |
| Less than High School | $55,587 | $0 |
| High School Diploma | $30,500 | $0 |
| College or Associate's Degree | $35,662 | $57,885 |
| Bachelor's Degree | - | - |
| Graduate Degree | $40,208 | $0 |
| Total | $37,515 | $40,729 |
Family Income in Labelle
Family Income Brackets in Labelle
According to the Labelle family income data, there are 269 families falling into the $50,000 to $74,999 income range, which is the most common income bracket and makes up 20.7% of all families. Conversely, the $10,000 to $14,999 income bracket is the least frequent group with only 58 families (4.5%) belonging to this category.
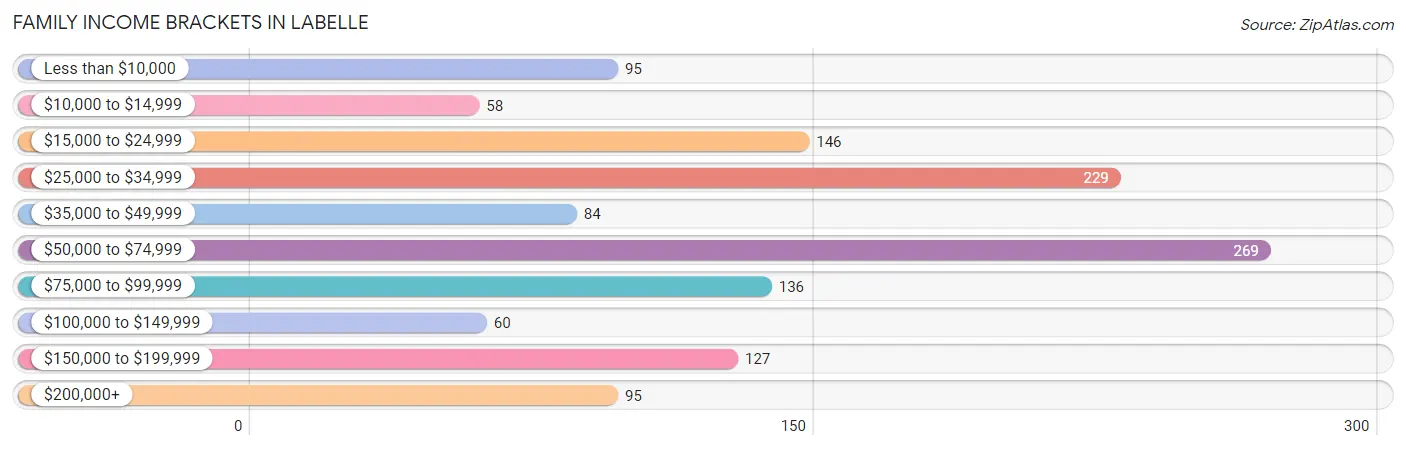
| Income Bracket | # Families | % Families |
| Less than $10,000 | 95 | 7.3% |
| $10,000 to $14,999 | 58 | 4.5% |
| $15,000 to $24,999 | 146 | 11.2% |
| $25,000 to $34,999 | 229 | 17.6% |
| $35,000 to $49,999 | 84 | 6.5% |
| $50,000 to $74,999 | 269 | 20.7% |
| $75,000 to $99,999 | 136 | 10.5% |
| $100,000 to $149,999 | 60 | 4.6% |
| $150,000 to $199,999 | 127 | 9.8% |
| $200,000+ | 95 | 7.3% |
Family Income by Famaliy Size in Labelle
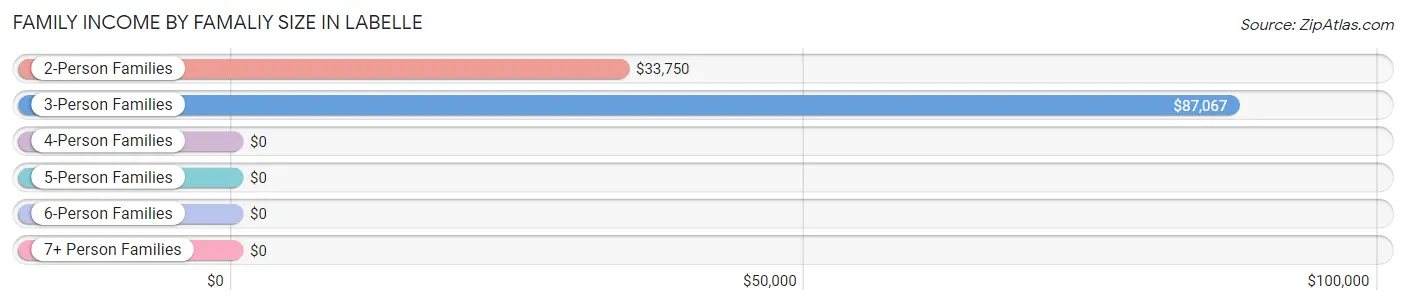
3-person families (285 | 21.9%) account for the highest median family income in Labelle with $87,067 per family, while 3-person families (285 | 21.9%) have the highest median income of $29,022 per family member.
| Income Bracket | # Families | Median Income |
| 2-Person Families | 636 (48.9%) | $33,750 |
| 3-Person Families | 285 (21.9%) | $87,067 |
| 4-Person Families | 257 (19.8%) | $0 |
| 5-Person Families | 59 (4.5%) | $0 |
| 6-Person Families | 28 (2.1%) | $0 |
| 7+ Person Families | 35 (2.7%) | $0 |
| Total | 1,300 (100.0%) | $55,605 |
Family Income by Number of Earners in Labelle
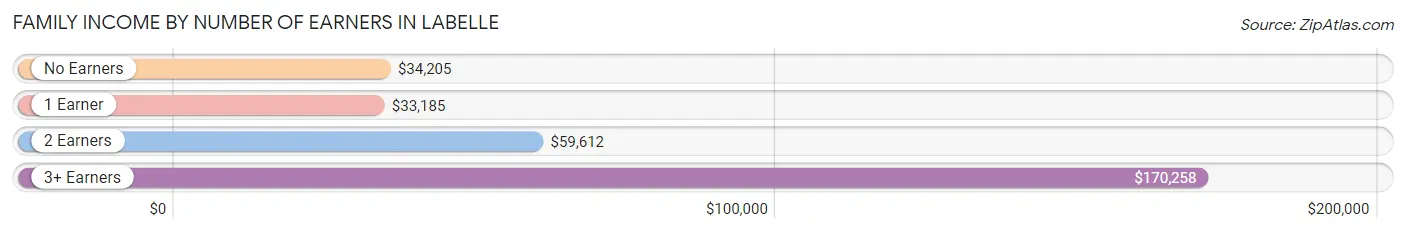
The median family income in Labelle is $55,605, with families comprising 3+ earners (174) having the highest median family income of $170,258, while families with 1 earner (533) have the lowest median family income of $33,185, accounting for 13.4% and 41.0% of families, respectively.
| Number of Earners | # Families | Median Income |
| No Earners | 211 (16.2%) | $34,205 |
| 1 Earner | 533 (41.0%) | $33,185 |
| 2 Earners | 382 (29.4%) | $59,612 |
| 3+ Earners | 174 (13.4%) | $170,258 |
| Total | 1,300 (100.0%) | $55,605 |
Household Income in Labelle
Household Income Brackets in Labelle
With 306 households falling in the category, the $50,000 to $74,999 income range is the most frequent in Labelle, accounting for 19.4% of all households. In contrast, only 58 households (3.7%) fall into the $10,000 to $14,999 income bracket, making it the least populous group.
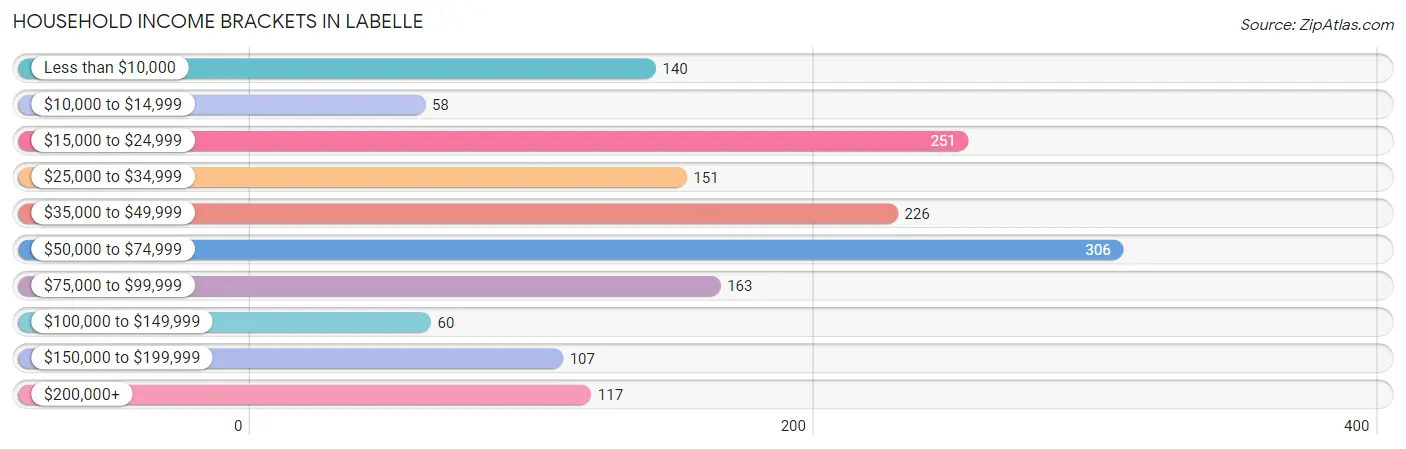
| Income Bracket | # Households | % Households |
| Less than $10,000 | 140 | 8.9% |
| $10,000 to $14,999 | 58 | 3.7% |
| $15,000 to $24,999 | 251 | 15.9% |
| $25,000 to $34,999 | 151 | 9.6% |
| $35,000 to $49,999 | 226 | 14.3% |
| $50,000 to $74,999 | 306 | 19.4% |
| $75,000 to $99,999 | 163 | 10.3% |
| $100,000 to $149,999 | 60 | 3.8% |
| $150,000 to $199,999 | 107 | 6.8% |
| $200,000+ | 117 | 7.4% |
Household Income by Householder Age in Labelle
The median household income in Labelle is $49,371, with the highest median household income of $57,836 found in the 25 to 44 years age bracket for the primary householder. A total of 514 households (32.6%) fall into this category. Meanwhile, the 15 to 24 years age bracket for the primary householder has the lowest median household income of $0, with 43 households (2.7%) in this group.
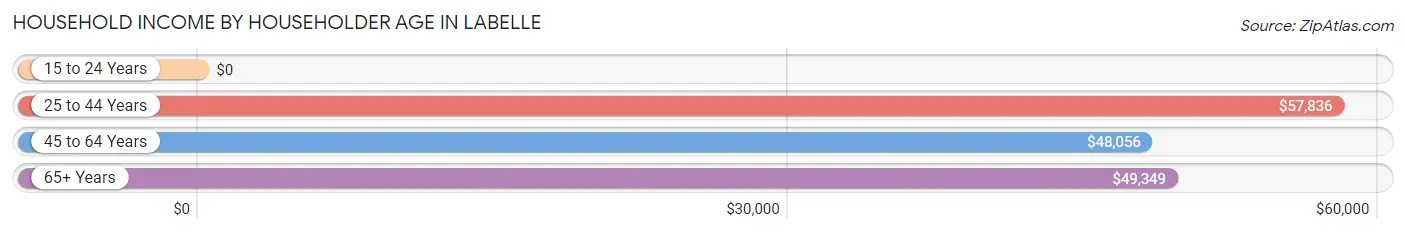
| Income Bracket | # Households | Median Income |
| 15 to 24 Years | 43 (2.7%) | $0 |
| 25 to 44 Years | 514 (32.6%) | $57,836 |
| 45 to 64 Years | 458 (29.0%) | $48,056 |
| 65+ Years | 563 (35.7%) | $49,349 |
| Total | 1,578 (100.0%) | $49,371 |
Poverty in Labelle
Income Below Poverty by Sex and Age in Labelle
With 21.5% poverty level for males and 19.7% for females among the residents of Labelle, 15 year old males and 16 and 17 year old females are the most vulnerable to poverty, with 37 males (100.0%) and 63 females (91.3%) in their respective age groups living below the poverty level.
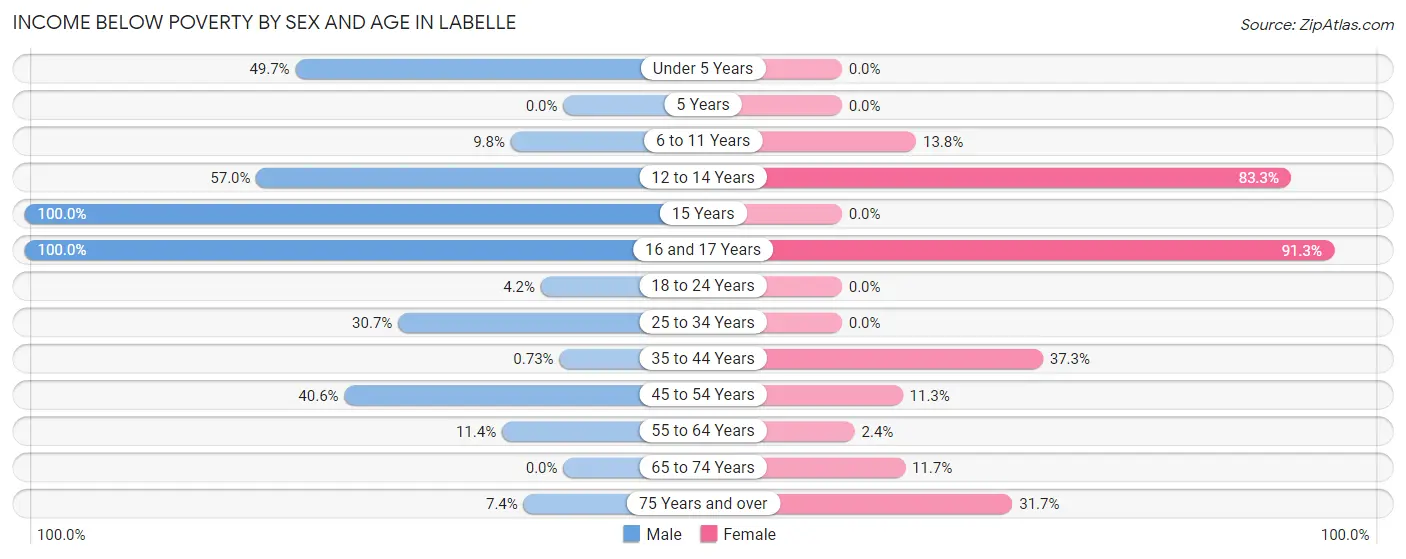
| Age Bracket | Male | Female |
| Under 5 Years | 92 (49.7%) | 0 (0.0%) |
| 5 Years | 0 (0.0%) | 0 (0.0%) |
| 6 to 11 Years | 23 (9.8%) | 35 (13.8%) |
| 12 to 14 Years | 49 (57.0%) | 35 (83.3%) |
| 15 Years | 37 (100.0%) | 0 (0.0%) |
| 16 and 17 Years | 74 (100.0%) | 63 (91.3%) |
| 18 to 24 Years | 9 (4.2%) | 0 (0.0%) |
| 25 to 34 Years | 145 (30.7%) | 0 (0.0%) |
| 35 to 44 Years | 2 (0.7%) | 75 (37.3%) |
| 45 to 54 Years | 76 (40.6%) | 28 (11.3%) |
| 55 to 64 Years | 67 (11.4%) | 3 (2.4%) |
| 65 to 74 Years | 0 (0.0%) | 19 (11.7%) |
| 75 Years and over | 11 (7.4%) | 119 (31.7%) |
| Total | 585 (21.5%) | 377 (19.7%) |
Income Above Poverty by Sex and Age in Labelle
According to the poverty statistics in Labelle, males aged 5 years and females aged under 5 years are the age groups that are most secure financially, with 100.0% of males and 100.0% of females in these age groups living above the poverty line.
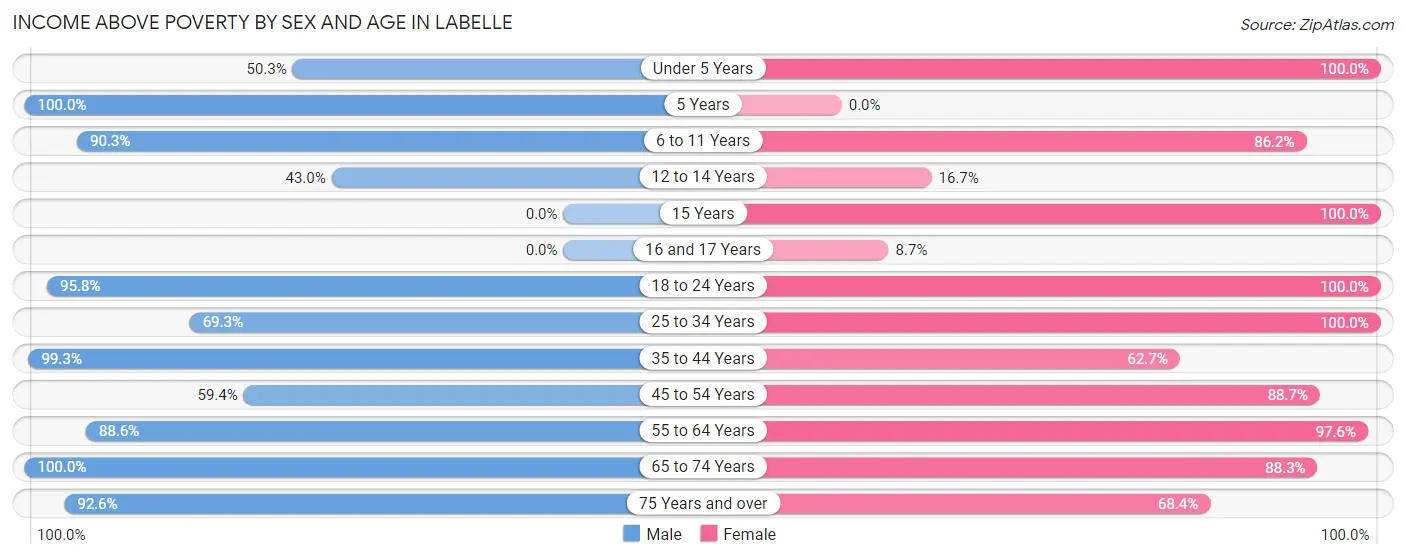
| Age Bracket | Male | Female |
| Under 5 Years | 93 (50.3%) | 91 (100.0%) |
| 5 Years | 55 (100.0%) | 0 (0.0%) |
| 6 to 11 Years | 213 (90.2%) | 219 (86.2%) |
| 12 to 14 Years | 37 (43.0%) | 7 (16.7%) |
| 15 Years | 0 (0.0%) | 14 (100.0%) |
| 16 and 17 Years | 0 (0.0%) | 6 (8.7%) |
| 18 to 24 Years | 207 (95.8%) | 214 (100.0%) |
| 25 to 34 Years | 328 (69.3%) | 117 (100.0%) |
| 35 to 44 Years | 273 (99.3%) | 126 (62.7%) |
| 45 to 54 Years | 111 (59.4%) | 220 (88.7%) |
| 55 to 64 Years | 521 (88.6%) | 123 (97.6%) |
| 65 to 74 Years | 163 (100.0%) | 143 (88.3%) |
| 75 Years and over | 138 (92.6%) | 257 (68.3%) |
| Total | 2,139 (78.5%) | 1,537 (80.3%) |
Income Below Poverty Among Married-Couple Families in Labelle
The poverty statistics for married-couple families in Labelle show that 9.9% or 83 of the total 836 families live below the poverty line. Families with 3 or 4 children have the highest poverty rate of 100.0%, comprising of 28 families. On the other hand, families with 1 or 2 children have the lowest poverty rate of 0.0%, which includes 0 families.
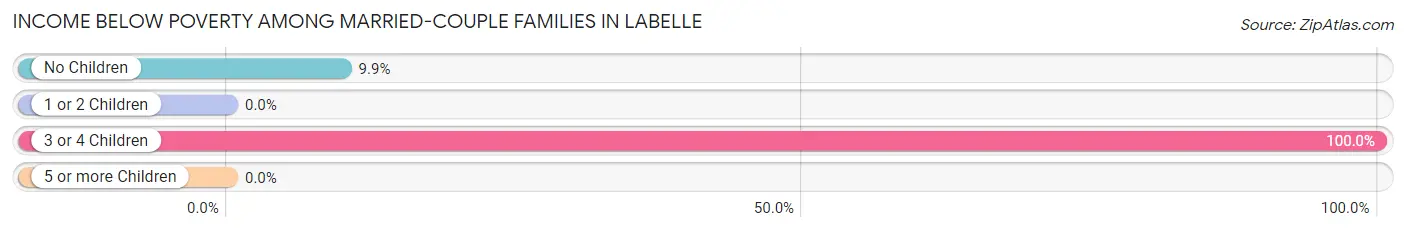
| Children | Above Poverty | Below Poverty |
| No Children | 501 (90.1%) | 55 (9.9%) |
| 1 or 2 Children | 238 (100.0%) | 0 (0.0%) |
| 3 or 4 Children | 0 (0.0%) | 28 (100.0%) |
| 5 or more Children | 14 (100.0%) | 0 (0.0%) |
| Total | 753 (90.1%) | 83 (9.9%) |
Income Below Poverty Among Single-Parent Households in Labelle
According to the poverty data in Labelle, 56.4% or 124 single-father households and 32.4% or 79 single-mother households are living below the poverty line. Among single-father households, those with no children have the highest poverty rate, with 47 households (100.0%) experiencing poverty. Likewise, among single-mother households, those with 3 or 4 children have the highest poverty rate, with 57 households (72.2%) falling below the poverty line.
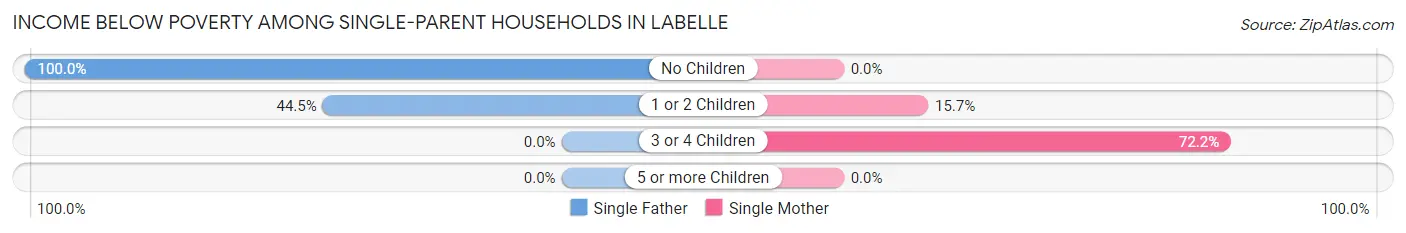
| Children | Single Father | Single Mother |
| No Children | 47 (100.0%) | 0 (0.0%) |
| 1 or 2 Children | 77 (44.5%) | 22 (15.7%) |
| 3 or 4 Children | 0 (0.0%) | 57 (72.2%) |
| 5 or more Children | 0 (0.0%) | 0 (0.0%) |
| Total | 124 (56.4%) | 79 (32.4%) |
Income Below Poverty Among Married-Couple vs Single-Parent Households in Labelle
The poverty data for Labelle shows that 83 of the married-couple family households (9.9%) and 203 of the single-parent households (43.8%) are living below the poverty level. Within the married-couple family households, those with 3 or 4 children have the highest poverty rate, with 28 households (100.0%) falling below the poverty line. Among the single-parent households, those with 3 or 4 children have the highest poverty rate, with 57 household (72.2%) living below poverty.
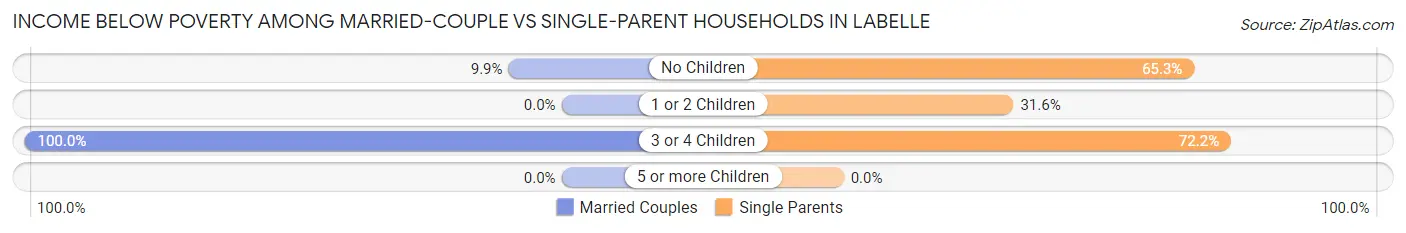
| Children | Married-Couple Families | Single-Parent Households |
| No Children | 55 (9.9%) | 47 (65.3%) |
| 1 or 2 Children | 0 (0.0%) | 99 (31.6%) |
| 3 or 4 Children | 28 (100.0%) | 57 (72.2%) |
| 5 or more Children | 0 (0.0%) | 0 (0.0%) |
| Total | 83 (9.9%) | 203 (43.8%) |
Race in Labelle
The most populous races in Labelle are White / Caucasian (3,900 | 78.6%), Hispanic or Latino (2,927 | 59.0%), and Two or more Races (792 | 16.0%).
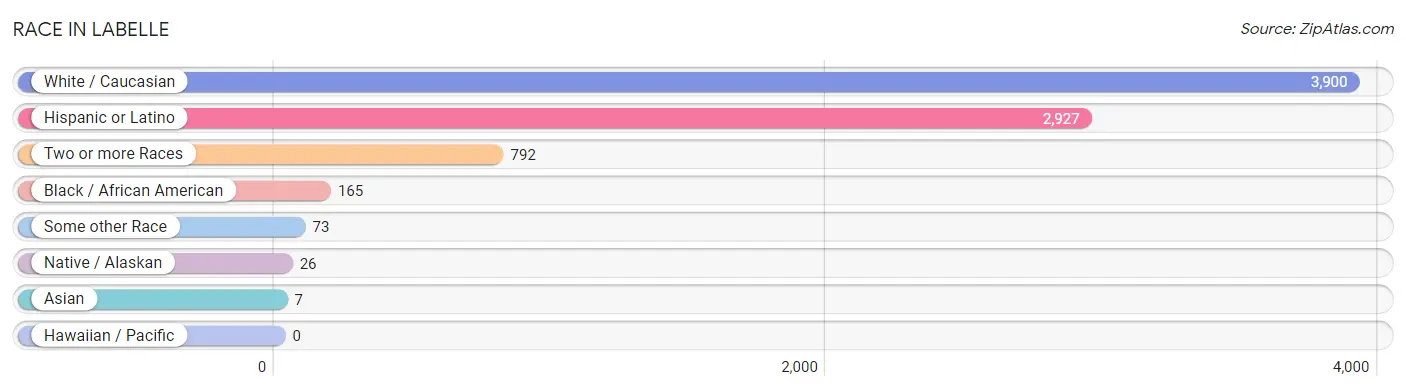
| Race | # Population | % Population |
| Asian | 7 | 0.1% |
| Black / African American | 165 | 3.3% |
| Hawaiian / Pacific | 0 | 0.0% |
| Hispanic or Latino | 2,927 | 59.0% |
| Native / Alaskan | 26 | 0.5% |
| White / Caucasian | 3,900 | 78.6% |
| Two or more Races | 792 | 16.0% |
| Some other Race | 73 | 1.5% |
| Total | 4,963 | 100.0% |
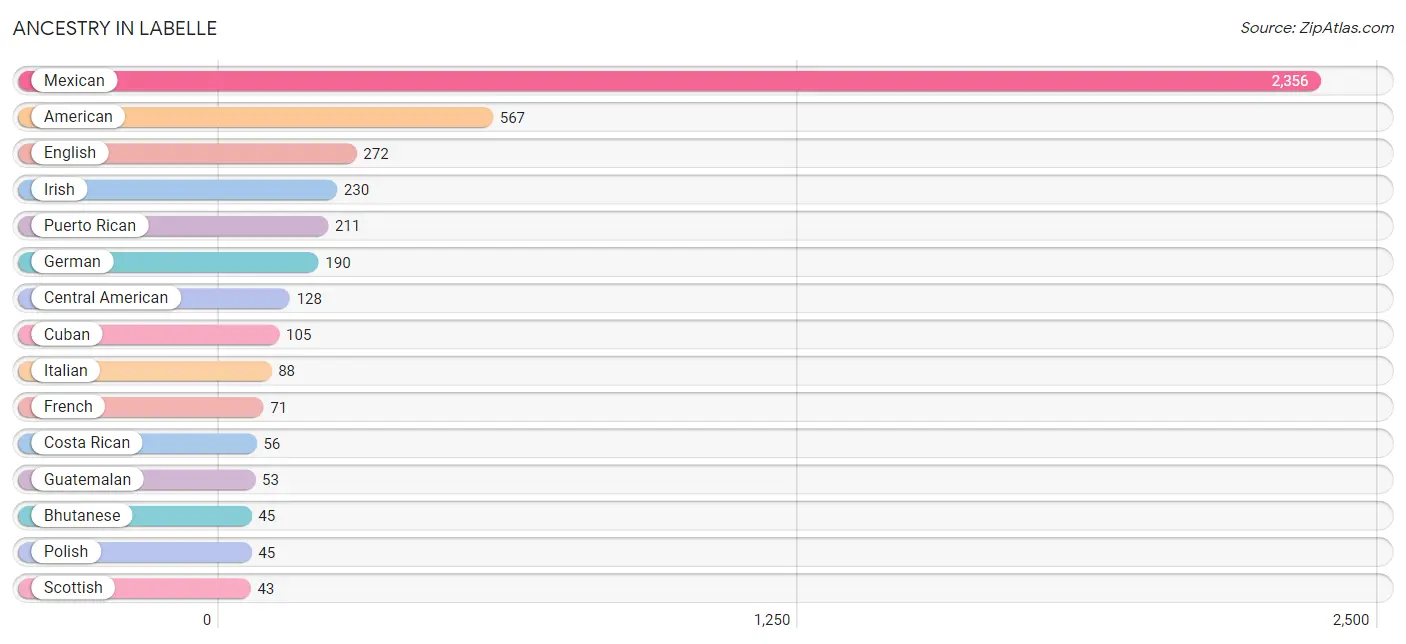
Ancestry in Labelle
The most populous ancestries reported in Labelle are Mexican (2,356 | 47.5%), American (567 | 11.4%), English (272 | 5.5%), Irish (230 | 4.6%), and Puerto Rican (211 | 4.3%), together accounting for 73.2% of all Labelle residents.
| Ancestry | # Population | % Population |
| Alaska Native | 3 | 0.1% |
| American | 567 | 11.4% |
| Argentinean | 6 | 0.1% |
| Bhutanese | 45 | 0.9% |
| Canadian | 14 | 0.3% |
| Celtic | 27 | 0.5% |
| Central American | 128 | 2.6% |
| Colombian | 15 | 0.3% |
| Costa Rican | 56 | 1.1% |
| Cuban | 105 | 2.1% |
| Dominican | 11 | 0.2% |
| Dutch | 19 | 0.4% |
| English | 272 | 5.5% |
| French | 71 | 1.4% |
| French Canadian | 5 | 0.1% |
| German | 190 | 3.8% |
| Guatemalan | 53 | 1.1% |
| Haitian | 7 | 0.1% |
| Hungarian | 3 | 0.1% |
| Irish | 230 | 4.6% |
| Italian | 88 | 1.8% |
| Jamaican | 7 | 0.1% |
| Latvian | 5 | 0.1% |
| Mexican | 2,356 | 47.5% |
| Native Hawaiian | 21 | 0.4% |
| Polish | 45 | 0.9% |
| Puerto Rican | 211 | 4.3% |
| Russian | 7 | 0.1% |
| Salvadoran | 19 | 0.4% |
| Scotch-Irish | 38 | 0.8% |
| Scottish | 43 | 0.9% |
| Sioux | 26 | 0.5% |
| South American | 23 | 0.5% |
| Spanish | 42 | 0.9% |
| Swedish | 8 | 0.2% |
| Thai | 38 | 0.8% |
| Venezuelan | 2 | 0.0% | View All 37 Rows |
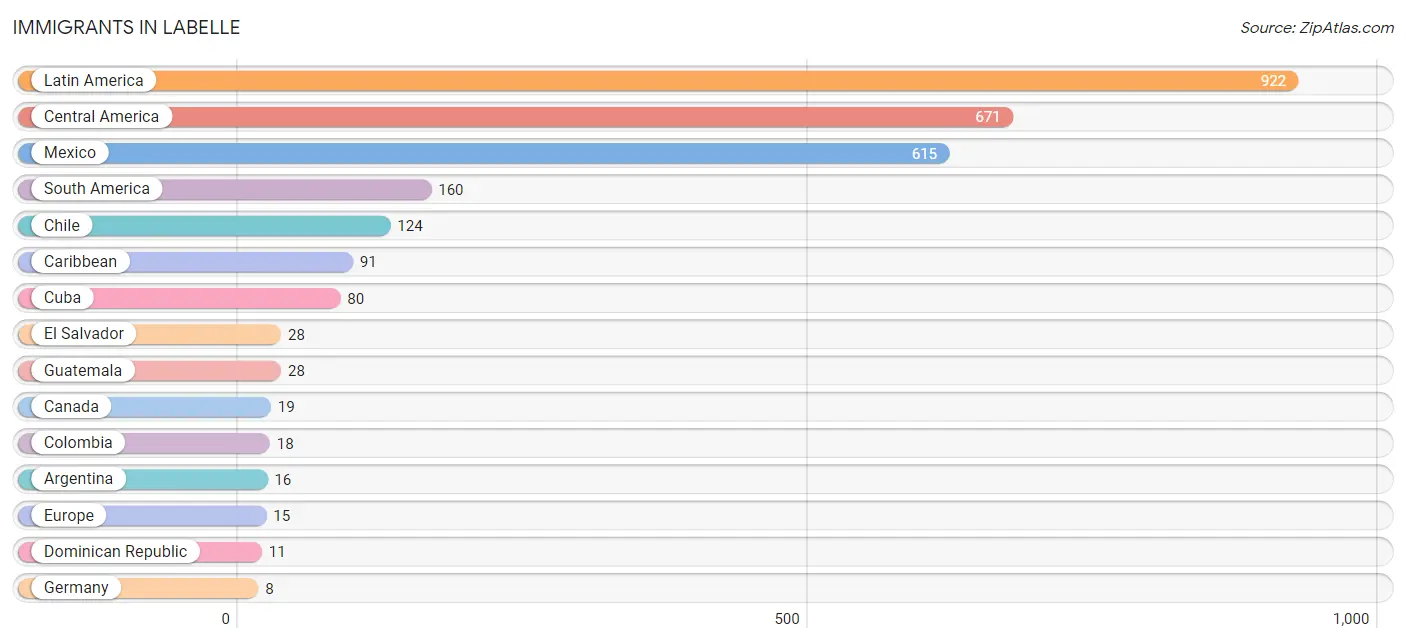
Immigrants in Labelle
The most numerous immigrant groups reported in Labelle came from Latin America (922 | 18.6%), Central America (671 | 13.5%), Mexico (615 | 12.4%), South America (160 | 3.2%), and Chile (124 | 2.5%), together accounting for 50.2% of all Labelle residents.
| Immigration Origin | # Population | % Population |
| Argentina | 16 | 0.3% |
| Asia | 7 | 0.1% |
| Canada | 19 | 0.4% |
| Caribbean | 91 | 1.8% |
| Central America | 671 | 13.5% |
| Chile | 124 | 2.5% |
| Colombia | 18 | 0.4% |
| Cuba | 80 | 1.6% |
| Dominican Republic | 11 | 0.2% |
| Eastern Asia | 7 | 0.1% |
| El Salvador | 28 | 0.6% |
| England | 7 | 0.1% |
| Europe | 15 | 0.3% |
| Germany | 8 | 0.2% |
| Guatemala | 28 | 0.6% |
| Japan | 7 | 0.1% |
| Latin America | 922 | 18.6% |
| Mexico | 615 | 12.4% |
| Northern Europe | 7 | 0.1% |
| South America | 160 | 3.2% |
| Venezuela | 2 | 0.0% |
| Western Europe | 8 | 0.2% | View All 22 Rows |
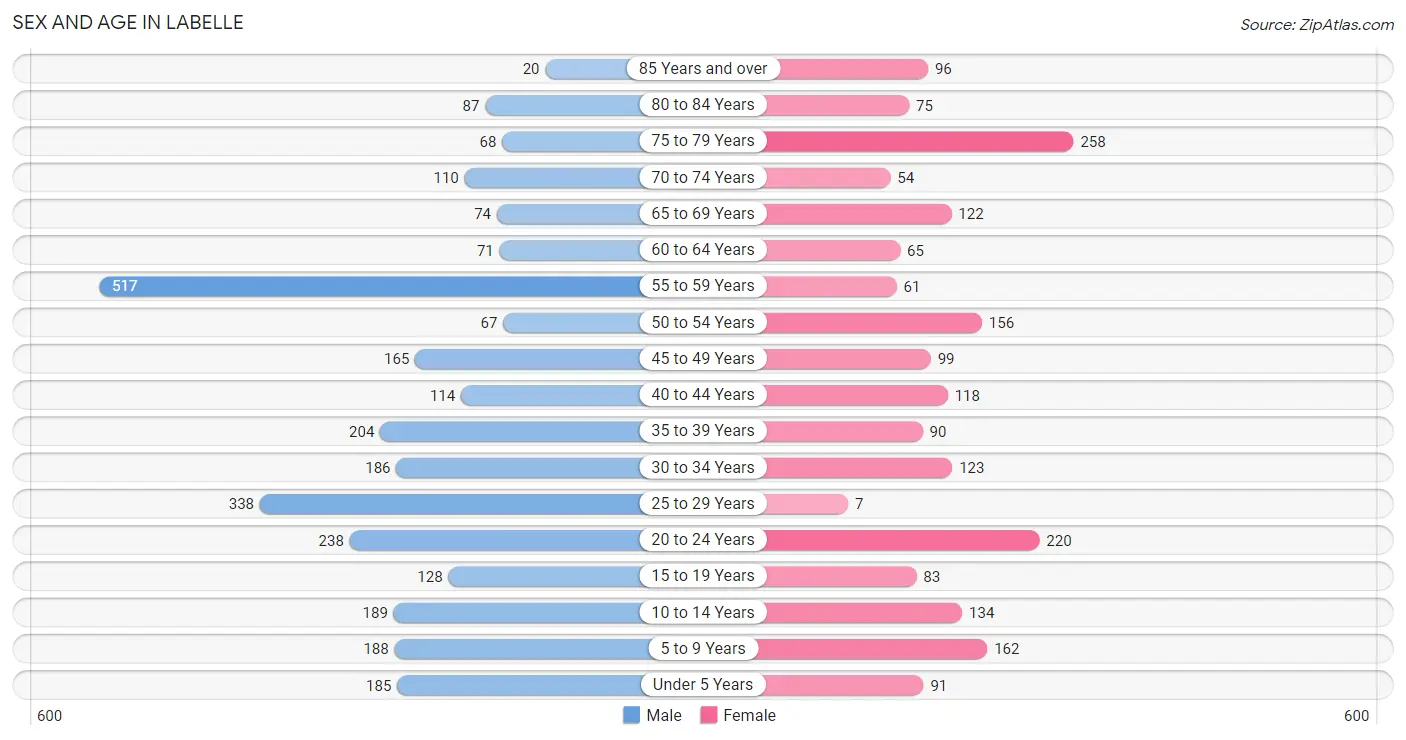
Sex and Age in Labelle
Sex and Age in Labelle
The most populous age groups in Labelle are 55 to 59 Years (517 | 17.5%) for men and 75 to 79 Years (258 | 12.8%) for women.
| Age Bracket | Male | Female |
| Under 5 Years | 185 (6.3%) | 91 (4.5%) |
| 5 to 9 Years | 188 (6.4%) | 162 (8.0%) |
| 10 to 14 Years | 189 (6.4%) | 134 (6.7%) |
| 15 to 19 Years | 128 (4.3%) | 83 (4.1%) |
| 20 to 24 Years | 238 (8.1%) | 220 (10.9%) |
| 25 to 29 Years | 338 (11.5%) | 7 (0.4%) |
| 30 to 34 Years | 186 (6.3%) | 123 (6.1%) |
| 35 to 39 Years | 204 (6.9%) | 90 (4.5%) |
| 40 to 44 Years | 114 (3.9%) | 118 (5.9%) |
| 45 to 49 Years | 165 (5.6%) | 99 (4.9%) |
| 50 to 54 Years | 67 (2.3%) | 156 (7.7%) |
| 55 to 59 Years | 517 (17.5%) | 61 (3.0%) |
| 60 to 64 Years | 71 (2.4%) | 65 (3.2%) |
| 65 to 69 Years | 74 (2.5%) | 122 (6.1%) |
| 70 to 74 Years | 110 (3.7%) | 54 (2.7%) |
| 75 to 79 Years | 68 (2.3%) | 258 (12.8%) |
| 80 to 84 Years | 87 (2.9%) | 75 (3.7%) |
| 85 Years and over | 20 (0.7%) | 96 (4.8%) |
| Total | 2,949 (100.0%) | 2,014 (100.0%) |
Families and Households in Labelle
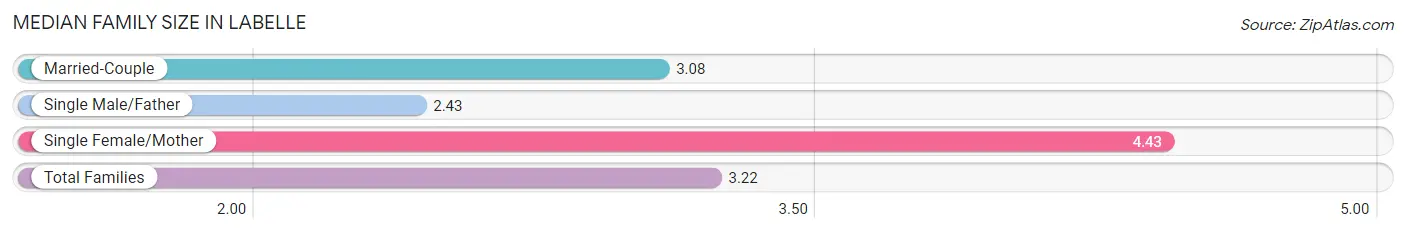
Median Family Size in Labelle
The median family size in Labelle is 3.22 persons per family, with single female/mother families (244 | 18.8%) accounting for the largest median family size of 4.43 persons per family. On the other hand, single male/father families (220 | 16.9%) represent the smallest median family size with 2.43 persons per family.
| Family Type | # Families | Family Size |
| Married-Couple | 836 (64.3%) | 3.08 |
| Single Male/Father | 220 (16.9%) | 2.43 |
| Single Female/Mother | 244 (18.8%) | 4.43 |
| Total Families | 1,300 (100.0%) | 3.22 |
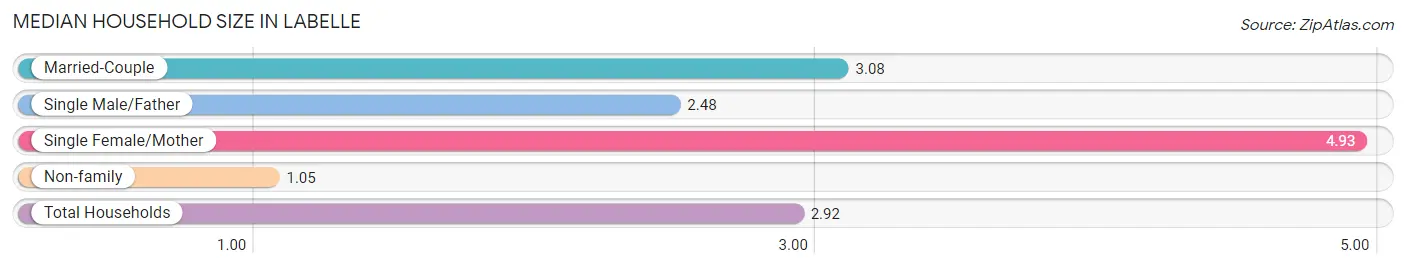
Median Household Size in Labelle
The median household size in Labelle is 2.92 persons per household, with single female/mother households (244 | 15.5%) accounting for the largest median household size of 4.93 persons per household. non-family households (278 | 17.6%) represent the smallest median household size with 1.05 persons per household.
| Household Type | # Households | Household Size |
| Married-Couple | 836 (53.0%) | 3.08 |
| Single Male/Father | 220 (13.9%) | 2.48 |
| Single Female/Mother | 244 (15.5%) | 4.93 |
| Non-family | 278 (17.6%) | 1.05 |
| Total Households | 1,578 (100.0%) | 2.92 |
Household Size by Marriage Status in Labelle
Out of a total of 1,578 households in Labelle, 1,300 (82.4%) are family households, while 278 (17.6%) are nonfamily households. The most numerous type of family households are 2-person households, comprising 589, and the most common type of nonfamily households are 1-person households, comprising 260.
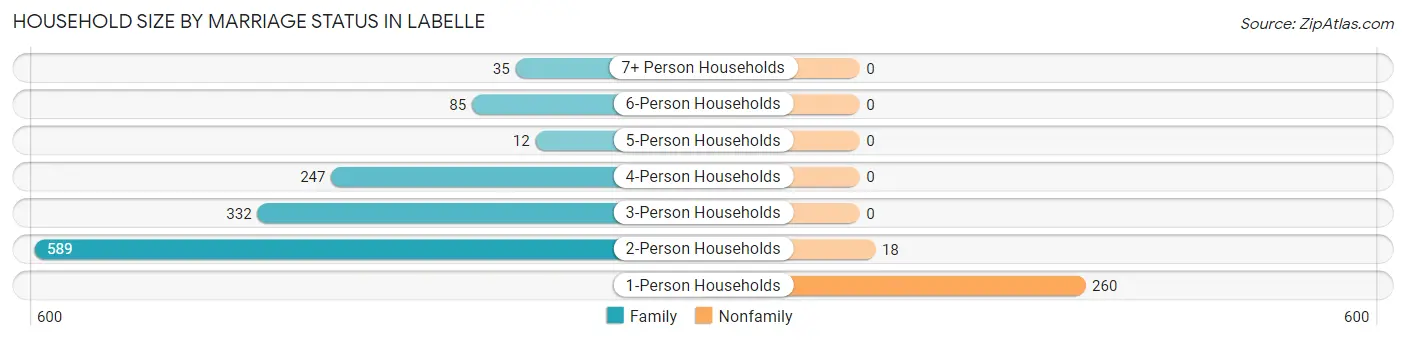
| Household Size | Family Households | Nonfamily Households |
| 1-Person Households | - | 260 (16.5%) |
| 2-Person Households | 589 (37.3%) | 18 (1.1%) |
| 3-Person Households | 332 (21.0%) | 0 (0.0%) |
| 4-Person Households | 247 (15.7%) | 0 (0.0%) |
| 5-Person Households | 12 (0.8%) | 0 (0.0%) |
| 6-Person Households | 85 (5.4%) | 0 (0.0%) |
| 7+ Person Households | 35 (2.2%) | 0 (0.0%) |
| Total | 1,300 (82.4%) | 278 (17.6%) |
Female Fertility in Labelle
Fertility by Age in Labelle
Average fertility rate in Labelle is 1.0 births per 1,000 women. Women in the age bracket of 20 to 34 years have the highest fertility rate with 3.0 births per 1,000 women. Women in the age bracket of 20 to 34 years acount for 100.0% of all women with births.
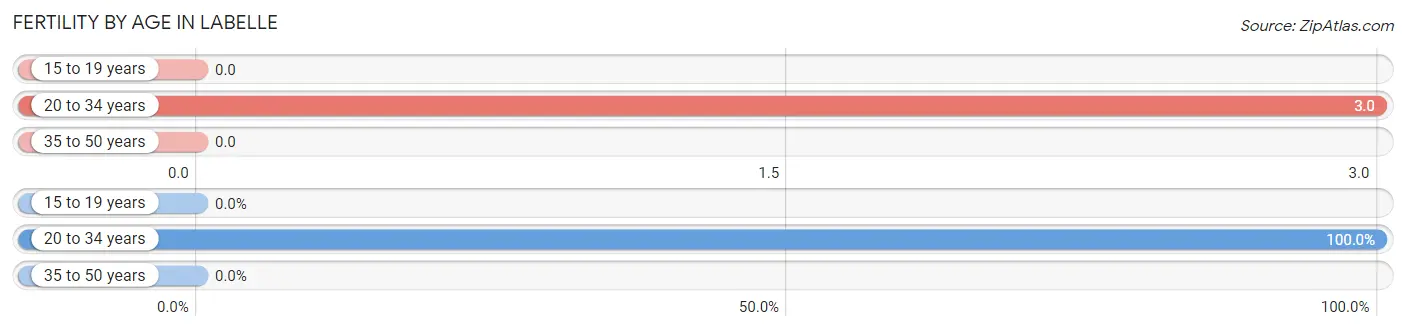
| Age Bracket | Women with Births | Births / 1,000 Women |
| 15 to 19 years | 0 (0.0%) | 0.0 |
| 20 to 34 years | 1 (100.0%) | 3.0 |
| 35 to 50 years | 0 (0.0%) | 0.0 |
| Total | 1 (100.0%) | 1.0 |
Fertility by Age by Marriage Status in Labelle
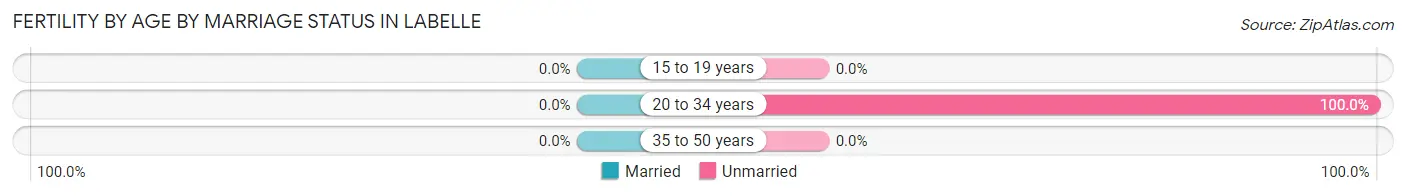
| Age Bracket | Married | Unmarried |
| 15 to 19 years | 0 (0.0%) | 0 (0.0%) |
| 20 to 34 years | 0 (0.0%) | 1 (100.0%) |
| 35 to 50 years | 0 (0.0%) | 0 (0.0%) |
| Total | 0 (0.0%) | 1 (100.0%) |
Fertility by Education in Labelle
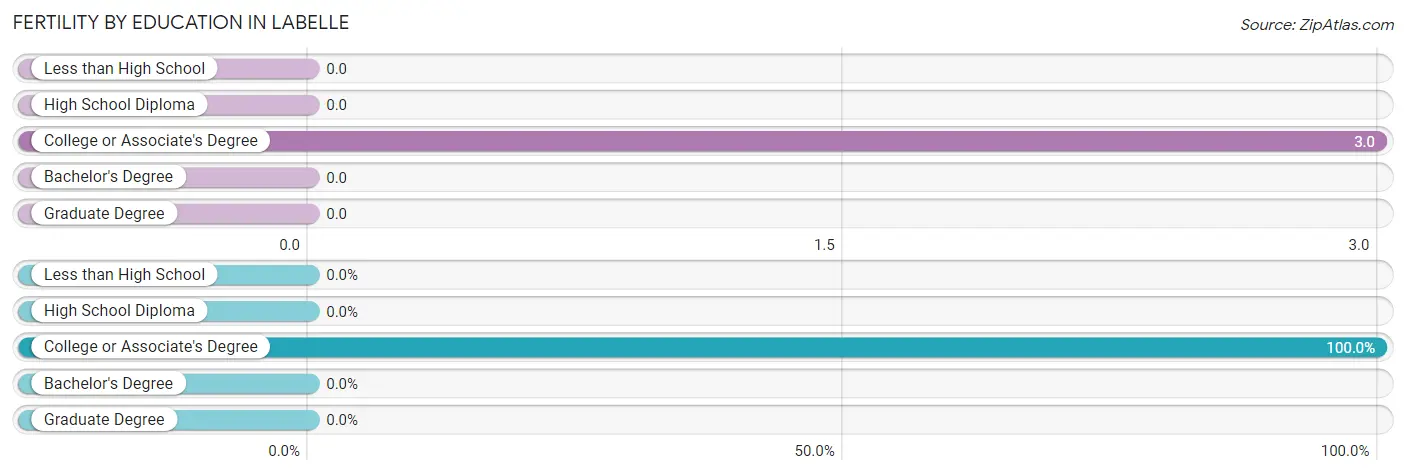
| Educational Attainment | Women with Births | Births / 1,000 Women |
| Less than High School | 0 (0.0%) | 0.0 |
| High School Diploma | 0 (0.0%) | 0.0 |
| College or Associate's Degree | 1 (100.0%) | 3.0 |
| Bachelor's Degree | 0 (0.0%) | 0.0 |
| Graduate Degree | 0 (0.0%) | 0.0 |
| Total | 1 (100.0%) | 1.0 |
Fertility by Education by Marriage Status in Labelle
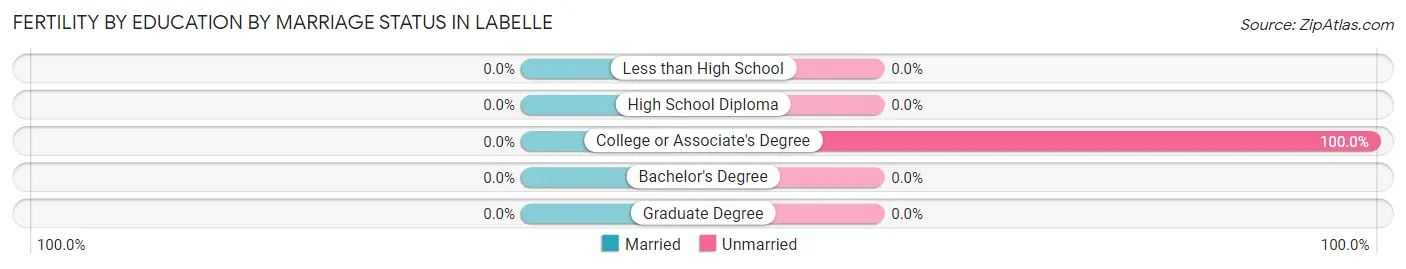
| Educational Attainment | Married | Unmarried |
| Less than High School | 0 (0.0%) | 0 (0.0%) |
| High School Diploma | 0 (0.0%) | 0 (0.0%) |
| College or Associate's Degree | 0 (0.0%) | 1 (100.0%) |
| Bachelor's Degree | 0 (0.0%) | 0 (0.0%) |
| Graduate Degree | 0 (0.0%) | 0 (0.0%) |
| Total | 0 (0.0%) | 1 (100.0%) |
Employment Characteristics in Labelle
Employment by Class of Employer in Labelle
Among the 2,265 employed individuals in Labelle, private company employees (1,702 | 75.1%), local government employees (200 | 8.8%), and state government employees (145 | 6.4%) make up the most common classes of employment.
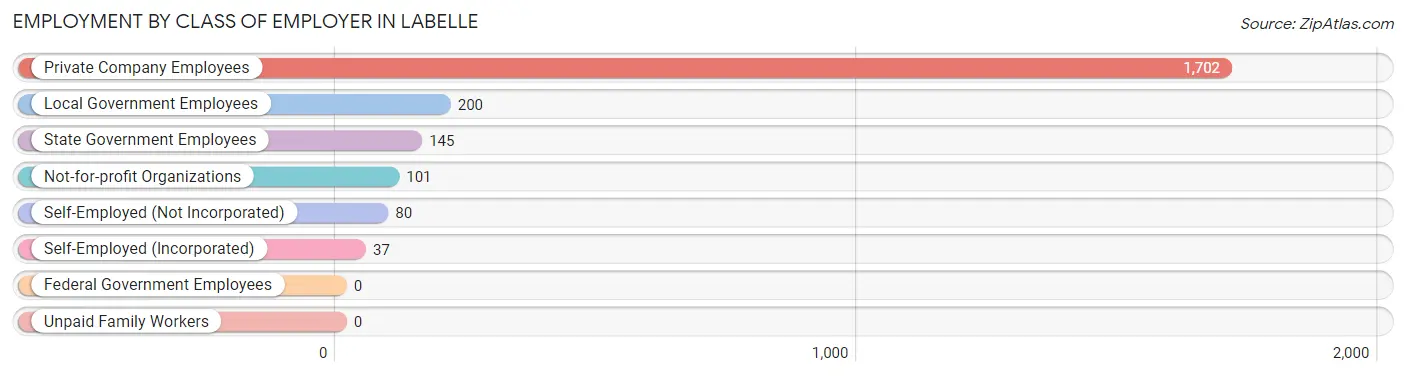
| Employer Class | # Employees | % Employees |
| Private Company Employees | 1,702 | 75.1% |
| Self-Employed (Incorporated) | 37 | 1.6% |
| Self-Employed (Not Incorporated) | 80 | 3.5% |
| Not-for-profit Organizations | 101 | 4.5% |
| Local Government Employees | 200 | 8.8% |
| State Government Employees | 145 | 6.4% |
| Federal Government Employees | 0 | 0.0% |
| Unpaid Family Workers | 0 | 0.0% |
| Total | 2,265 | 100.0% |
Employment Status by Age in Labelle
According to the labor force statistics for Labelle, out of the total population over 16 years of age (3,963), 60.0% or 2,378 individuals are in the labor force, with 3.3% or 78 of them unemployed. The age group with the highest labor force participation rate is 55 to 59 years, with 90.8% or 525 individuals in the labor force. Within the labor force, the 16 to 19 years age range has the highest percentage of unemployed individuals, with 50.0% or 9 of them being unemployed.
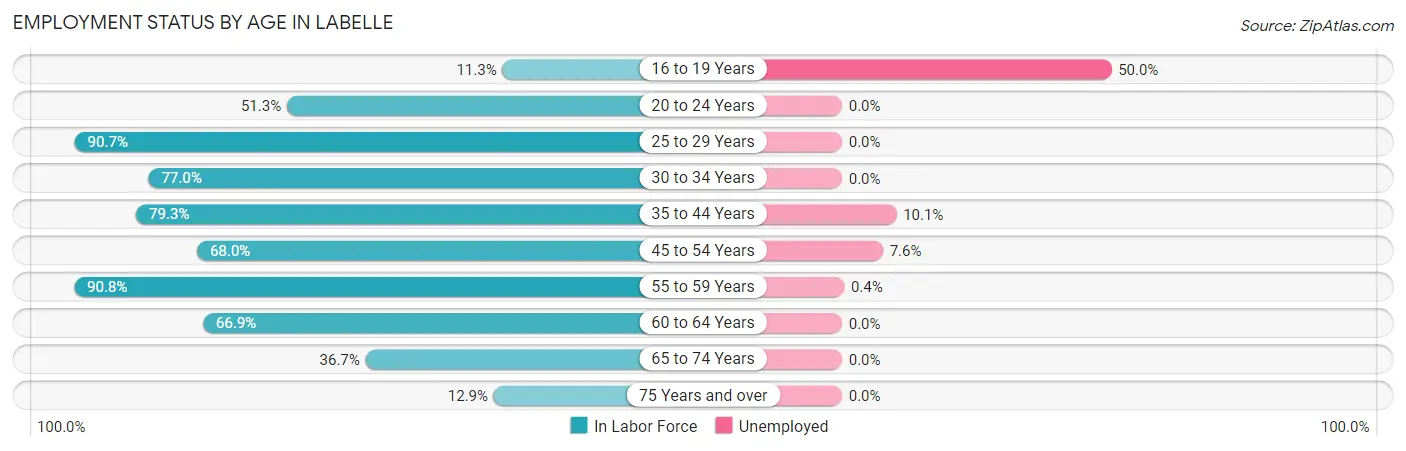
| Age Bracket | In Labor Force | Unemployed |
| 16 to 19 Years | 18 (11.3%) | 9 (50.0%) |
| 20 to 24 Years | 235 (51.3%) | 0 (0.0%) |
| 25 to 29 Years | 313 (90.7%) | 0 (0.0%) |
| 30 to 34 Years | 238 (77.0%) | 0 (0.0%) |
| 35 to 44 Years | 417 (79.3%) | 42 (10.1%) |
| 45 to 54 Years | 331 (68.0%) | 25 (7.6%) |
| 55 to 59 Years | 525 (90.8%) | 2 (0.4%) |
| 60 to 64 Years | 91 (66.9%) | 0 (0.0%) |
| 65 to 74 Years | 132 (36.7%) | 0 (0.0%) |
| 75 Years and over | 78 (12.9%) | 0 (0.0%) |
| Total | 2,378 (60.0%) | 78 (3.3%) |
Employment Status by Educational Attainment in Labelle
According to labor force statistics for Labelle, 80.4% of individuals (1,914) out of the total population between 25 and 64 years of age (2,381) are in the labor force, with 3.6% or 69 of them being unemployed. The group with the highest labor force participation rate are those with the educational attainment of college / associate degree, with 86.9% or 583 individuals in the labor force. Within the labor force, individuals with high school diploma education have the highest percentage of unemployment, with 7.4% or 42 of them being unemployed.
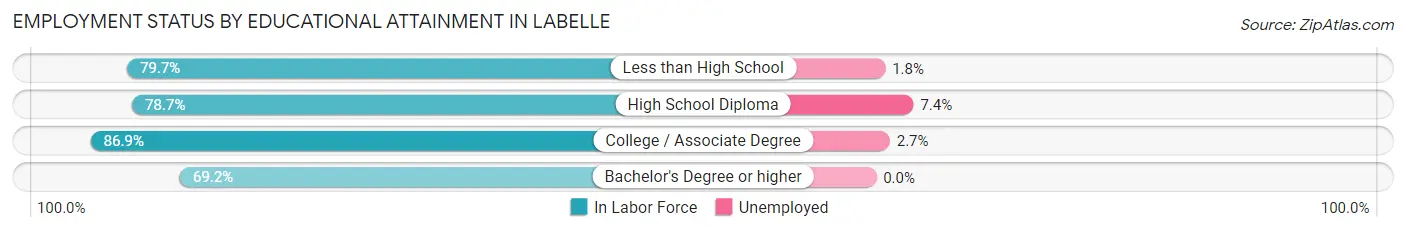
| Educational Attainment | In Labor Force | Unemployed |
| Less than High School | 607 (79.7%) | 14 (1.8%) |
| High School Diploma | 570 (78.7%) | 54 (7.4%) |
| College / Associate Degree | 583 (86.9%) | 18 (2.7%) |
| Bachelor's Degree or higher | 155 (69.2%) | 0 (0.0%) |
| Total | 1,914 (80.4%) | 86 (3.6%) |
Employment Occupations by Sex in Labelle
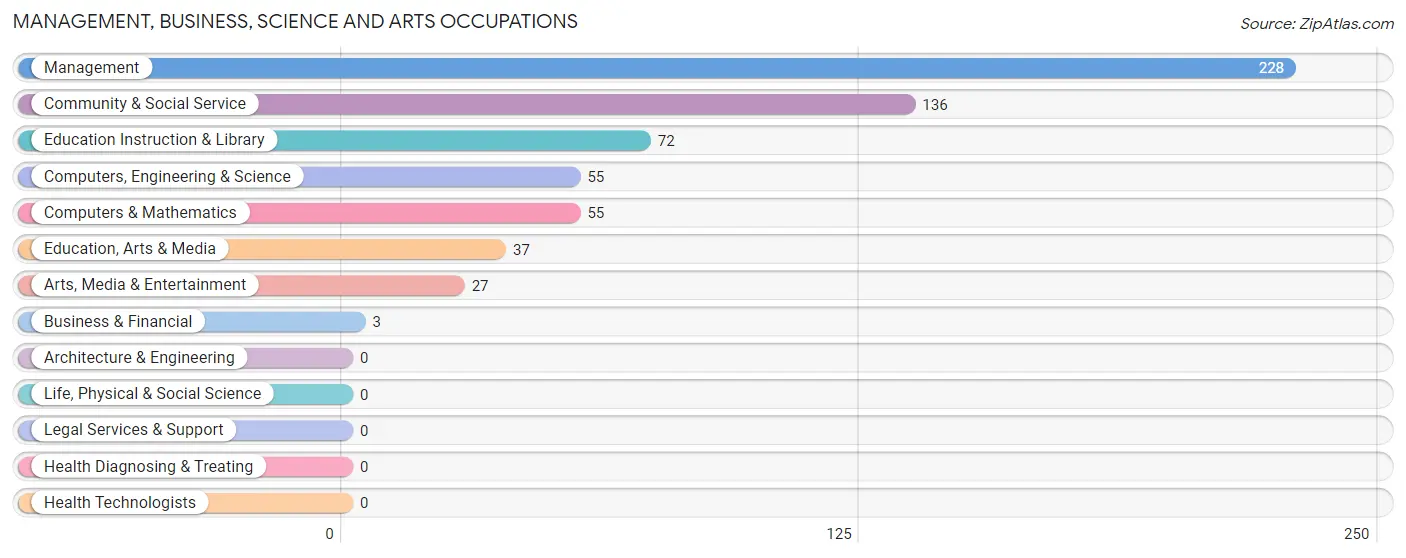
Management, Business, Science and Arts Occupations
The most common Management, Business, Science and Arts occupations in Labelle are Management (228 | 9.9%), Community & Social Service (136 | 5.9%), Education Instruction & Library (72 | 3.1%), Computers, Engineering & Science (55 | 2.4%), and Computers & Mathematics (55 | 2.4%).
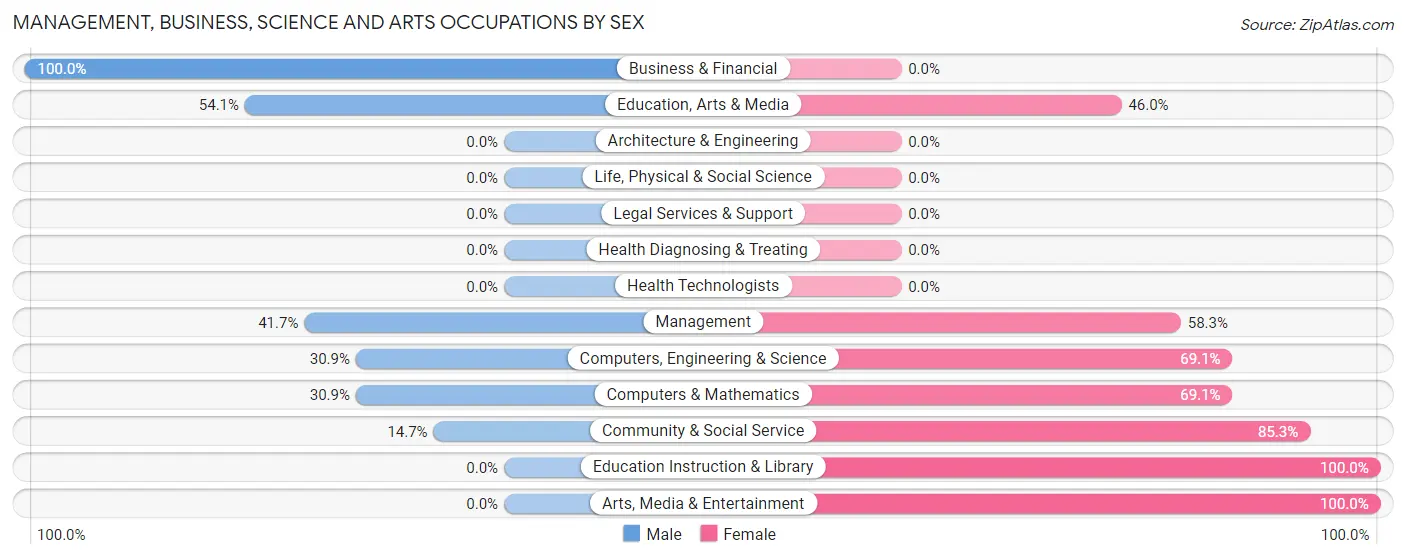
Management, Business, Science and Arts Occupations by Sex
Within the Management, Business, Science and Arts occupations in Labelle, the most male-oriented occupations are Business & Financial (100.0%), Education, Arts & Media (54.0%), and Management (41.7%), while the most female-oriented occupations are Education Instruction & Library (100.0%), Arts, Media & Entertainment (100.0%), and Community & Social Service (85.3%).
| Occupation | Male | Female |
| Management | 95 (41.7%) | 133 (58.3%) |
| Business & Financial | 3 (100.0%) | 0 (0.0%) |
| Computers, Engineering & Science | 17 (30.9%) | 38 (69.1%) |
| Computers & Mathematics | 17 (30.9%) | 38 (69.1%) |
| Architecture & Engineering | 0 (0.0%) | 0 (0.0%) |
| Life, Physical & Social Science | 0 (0.0%) | 0 (0.0%) |
| Community & Social Service | 20 (14.7%) | 116 (85.3%) |
| Education, Arts & Media | 20 (54.0%) | 17 (46.0%) |
| Legal Services & Support | 0 (0.0%) | 0 (0.0%) |
| Education Instruction & Library | 0 (0.0%) | 72 (100.0%) |
| Arts, Media & Entertainment | 0 (0.0%) | 27 (100.0%) |
| Health Diagnosing & Treating | 0 (0.0%) | 0 (0.0%) |
| Health Technologists | 0 (0.0%) | 0 (0.0%) |
| Total (Category) | 135 (32.0%) | 287 (68.0%) |
| Total (Overall) | 1,628 (70.8%) | 672 (29.2%) |
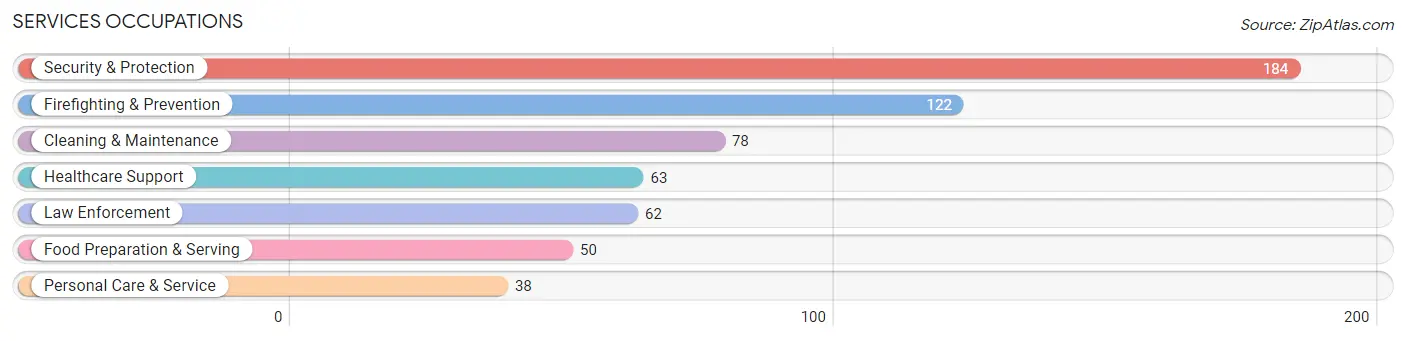
Services Occupations
The most common Services occupations in Labelle are Security & Protection (184 | 8.0%), Firefighting & Prevention (122 | 5.3%), Cleaning & Maintenance (78 | 3.4%), Healthcare Support (63 | 2.7%), and Law Enforcement (62 | 2.7%).
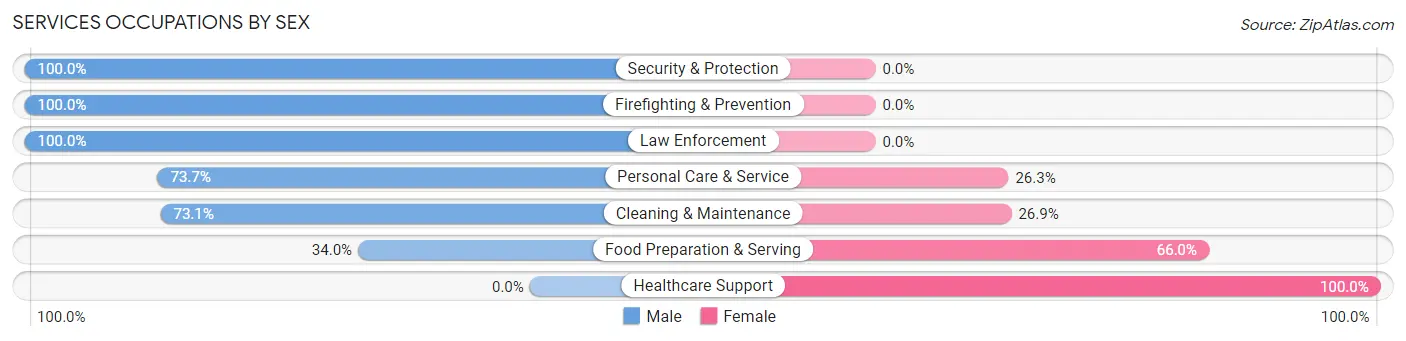
Services Occupations by Sex
Within the Services occupations in Labelle, the most male-oriented occupations are Security & Protection (100.0%), Firefighting & Prevention (100.0%), and Law Enforcement (100.0%), while the most female-oriented occupations are Healthcare Support (100.0%), Food Preparation & Serving (66.0%), and Cleaning & Maintenance (26.9%).
| Occupation | Male | Female |
| Healthcare Support | 0 (0.0%) | 63 (100.0%) |
| Security & Protection | 184 (100.0%) | 0 (0.0%) |
| Firefighting & Prevention | 122 (100.0%) | 0 (0.0%) |
| Law Enforcement | 62 (100.0%) | 0 (0.0%) |
| Food Preparation & Serving | 17 (34.0%) | 33 (66.0%) |
| Cleaning & Maintenance | 57 (73.1%) | 21 (26.9%) |
| Personal Care & Service | 28 (73.7%) | 10 (26.3%) |
| Total (Category) | 286 (69.3%) | 127 (30.7%) |
| Total (Overall) | 1,628 (70.8%) | 672 (29.2%) |
Sales and Office Occupations
The most common Sales and Office occupations in Labelle are Sales & Related (253 | 11.0%), and Office & Administration (221 | 9.6%).
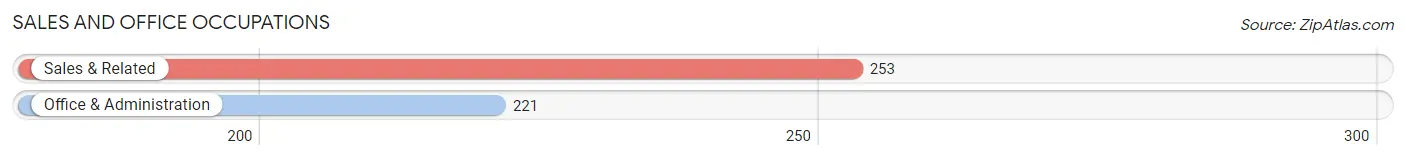
Sales and Office Occupations by Sex
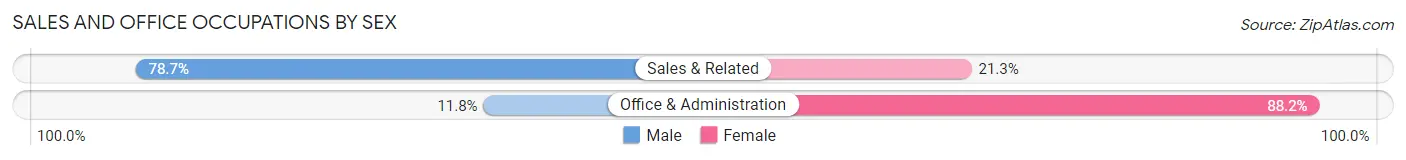
| Occupation | Male | Female |
| Sales & Related | 199 (78.7%) | 54 (21.3%) |
| Office & Administration | 26 (11.8%) | 195 (88.2%) |
| Total (Category) | 225 (47.5%) | 249 (52.5%) |
| Total (Overall) | 1,628 (70.8%) | 672 (29.2%) |
Natural Resources, Construction and Maintenance Occupations
The most common Natural Resources, Construction and Maintenance occupations in Labelle are Construction & Extraction (640 | 27.8%), Farming, Fishing & Forestry (126 | 5.5%), and Installation, Maintenance & Repair (31 | 1.3%).
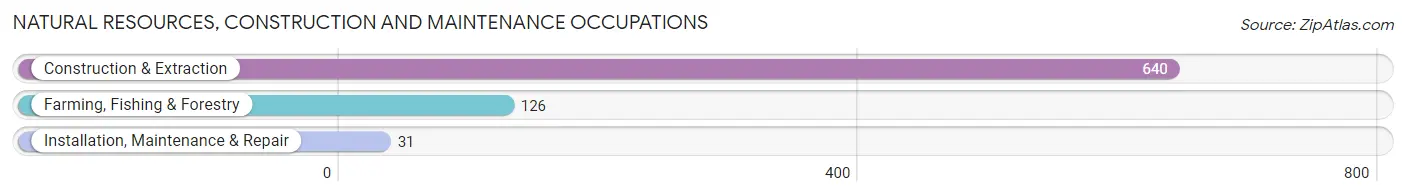
Natural Resources, Construction and Maintenance Occupations by Sex
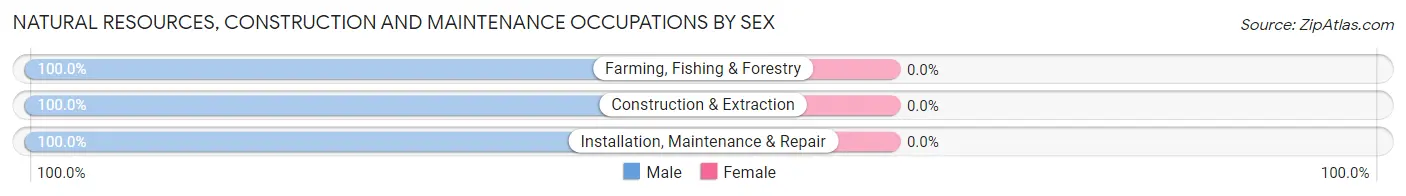
| Occupation | Male | Female |
| Farming, Fishing & Forestry | 126 (100.0%) | 0 (0.0%) |
| Construction & Extraction | 640 (100.0%) | 0 (0.0%) |
| Installation, Maintenance & Repair | 31 (100.0%) | 0 (0.0%) |
| Total (Category) | 797 (100.0%) | 0 (0.0%) |
| Total (Overall) | 1,628 (70.8%) | 672 (29.2%) |
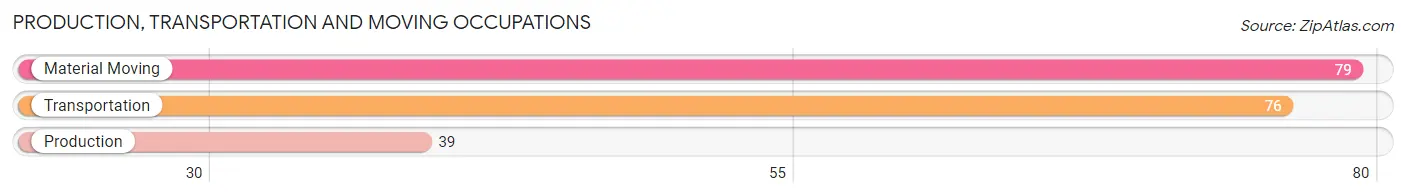
Production, Transportation and Moving Occupations
The most common Production, Transportation and Moving occupations in Labelle are Material Moving (79 | 3.4%), Transportation (76 | 3.3%), and Production (39 | 1.7%).
Production, Transportation and Moving Occupations by Sex
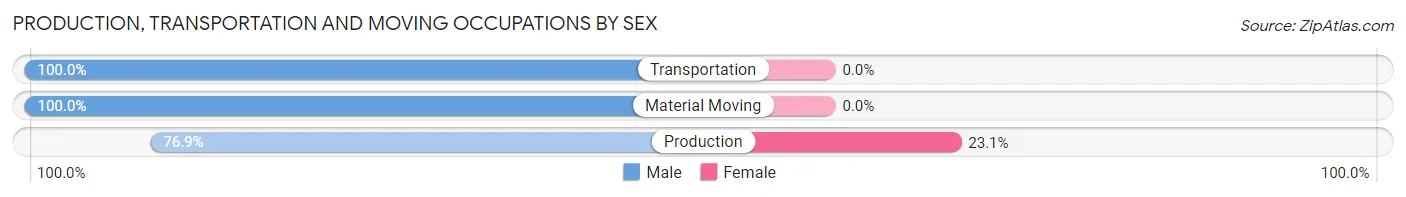
| Occupation | Male | Female |
| Production | 30 (76.9%) | 9 (23.1%) |
| Transportation | 76 (100.0%) | 0 (0.0%) |
| Material Moving | 79 (100.0%) | 0 (0.0%) |
| Total (Category) | 185 (95.4%) | 9 (4.6%) |
| Total (Overall) | 1,628 (70.8%) | 672 (29.2%) |
Employment Industries by Sex in Labelle
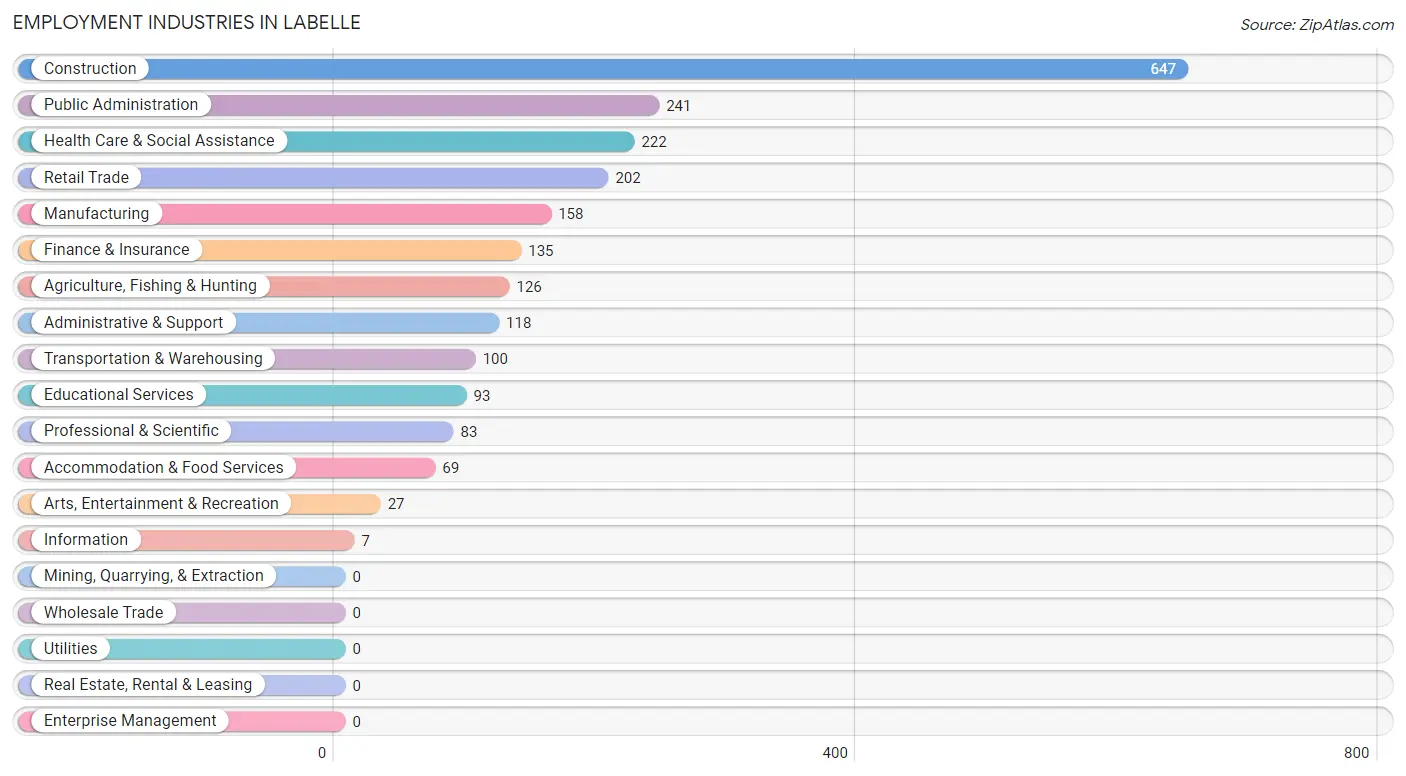
Employment Industries in Labelle
The major employment industries in Labelle include Construction (647 | 28.1%), Public Administration (241 | 10.5%), Health Care & Social Assistance (222 | 9.7%), Retail Trade (202 | 8.8%), and Manufacturing (158 | 6.9%).
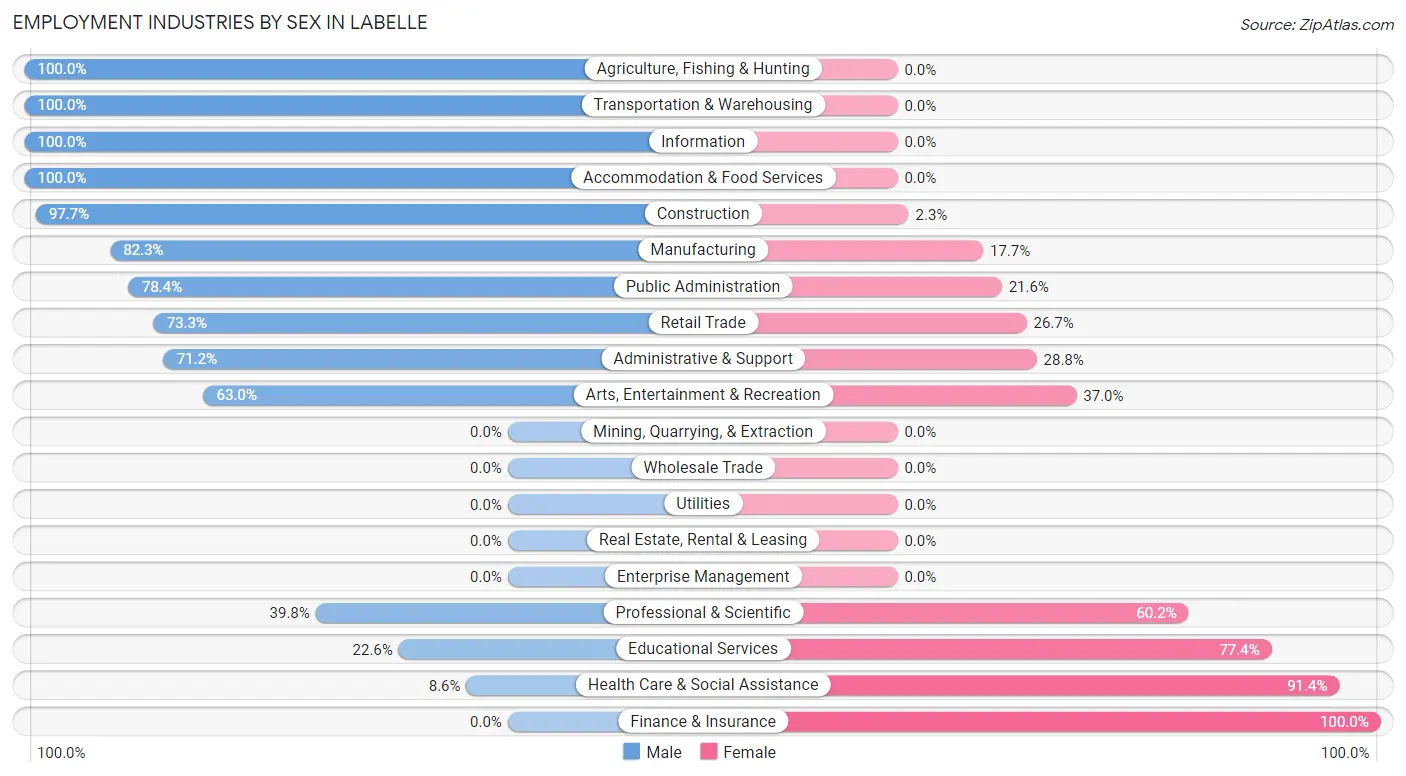
Employment Industries by Sex in Labelle
The Labelle industries that see more men than women are Agriculture, Fishing & Hunting (100.0%), Transportation & Warehousing (100.0%), and Information (100.0%), whereas the industries that tend to have a higher number of women are Finance & Insurance (100.0%), Health Care & Social Assistance (91.4%), and Educational Services (77.4%).
| Industry | Male | Female |
| Agriculture, Fishing & Hunting | 126 (100.0%) | 0 (0.0%) |
| Mining, Quarrying, & Extraction | 0 (0.0%) | 0 (0.0%) |
| Construction | 632 (97.7%) | 15 (2.3%) |
| Manufacturing | 130 (82.3%) | 28 (17.7%) |
| Wholesale Trade | 0 (0.0%) | 0 (0.0%) |
| Retail Trade | 148 (73.3%) | 54 (26.7%) |
| Transportation & Warehousing | 100 (100.0%) | 0 (0.0%) |
| Utilities | 0 (0.0%) | 0 (0.0%) |
| Information | 7 (100.0%) | 0 (0.0%) |
| Finance & Insurance | 0 (0.0%) | 135 (100.0%) |
| Real Estate, Rental & Leasing | 0 (0.0%) | 0 (0.0%) |
| Professional & Scientific | 33 (39.8%) | 50 (60.2%) |
| Enterprise Management | 0 (0.0%) | 0 (0.0%) |
| Administrative & Support | 84 (71.2%) | 34 (28.8%) |
| Educational Services | 21 (22.6%) | 72 (77.4%) |
| Health Care & Social Assistance | 19 (8.6%) | 203 (91.4%) |
| Arts, Entertainment & Recreation | 17 (63.0%) | 10 (37.0%) |
| Accommodation & Food Services | 69 (100.0%) | 0 (0.0%) |
| Public Administration | 189 (78.4%) | 52 (21.6%) |
| Total | 1,628 (70.8%) | 672 (29.2%) |
Education in Labelle
School Enrollment in Labelle
The most common levels of schooling among the 888 students in Labelle are elementary school (277 | 31.2%), middle school (274 | 30.9%), and high school (188 | 21.2%).
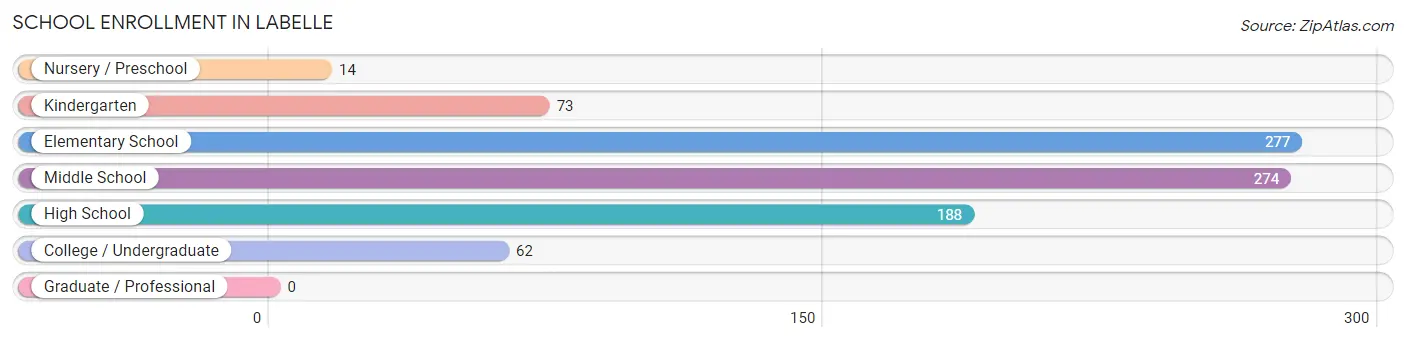
| School Level | # Students | % Students |
| Nursery / Preschool | 14 | 1.6% |
| Kindergarten | 73 | 8.2% |
| Elementary School | 277 | 31.2% |
| Middle School | 274 | 30.9% |
| High School | 188 | 21.2% |
| College / Undergraduate | 62 | 7.0% |
| Graduate / Professional | 0 | 0.0% |
| Total | 888 | 100.0% |
School Enrollment by Age by Funding Source in Labelle
Out of a total of 888 students who are enrolled in schools in Labelle, 45 (5.1%) attend a private institution, while the remaining 843 (94.9%) are enrolled in public schools. The age group of 20 to 24 year olds has the highest likelihood of being enrolled in private schools, with 8 (18.6% in the age bracket) enrolled. Conversely, the age group of 3 to 4 year olds has the lowest likelihood of being enrolled in a private school, with 14 (100.0% in the age bracket) attending a public institution.
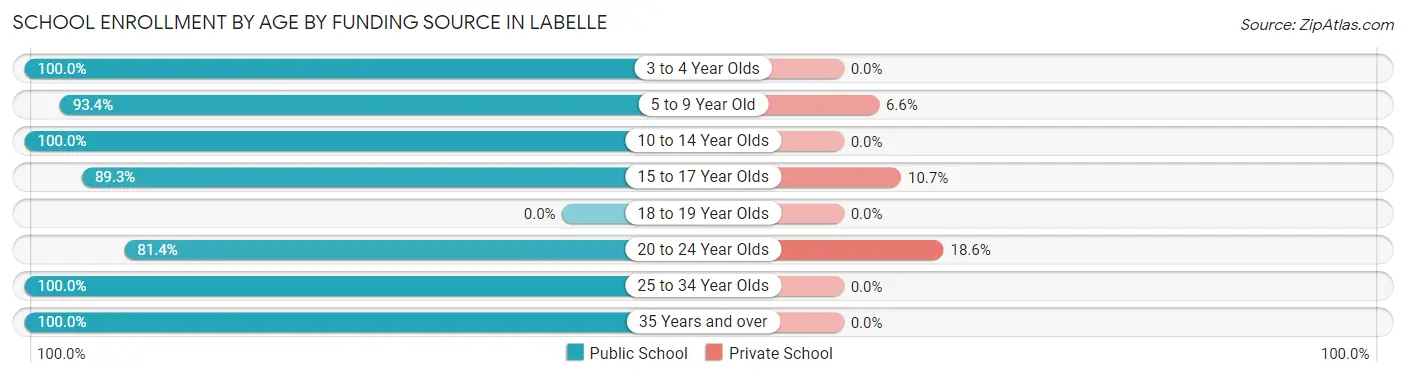
| Age Bracket | Public School | Private School |
| 3 to 4 Year Olds | 14 (100.0%) | 0 (0.0%) |
| 5 to 9 Year Old | 327 (93.4%) | 23 (6.6%) |
| 10 to 14 Year Olds | 323 (100.0%) | 0 (0.0%) |
| 15 to 17 Year Olds | 117 (89.3%) | 14 (10.7%) |
| 18 to 19 Year Olds | 0 (0.0%) | 0 (0.0%) |
| 20 to 24 Year Olds | 35 (81.4%) | 8 (18.6%) |
| 25 to 34 Year Olds | 19 (100.0%) | 0 (0.0%) |
| 35 Years and over | 8 (100.0%) | 0 (0.0%) |
| Total | 843 (94.9%) | 45 (5.1%) |
Educational Attainment by Field of Study in Labelle
Liberal arts & history (112 | 25.4%), education (67 | 15.2%), engineering (58 | 13.2%), multidisciplinary studies (53 | 12.0%), and visual & performing arts (34 | 7.7%) are the most common fields of study among 441 individuals in Labelle who have obtained a bachelor's degree or higher.
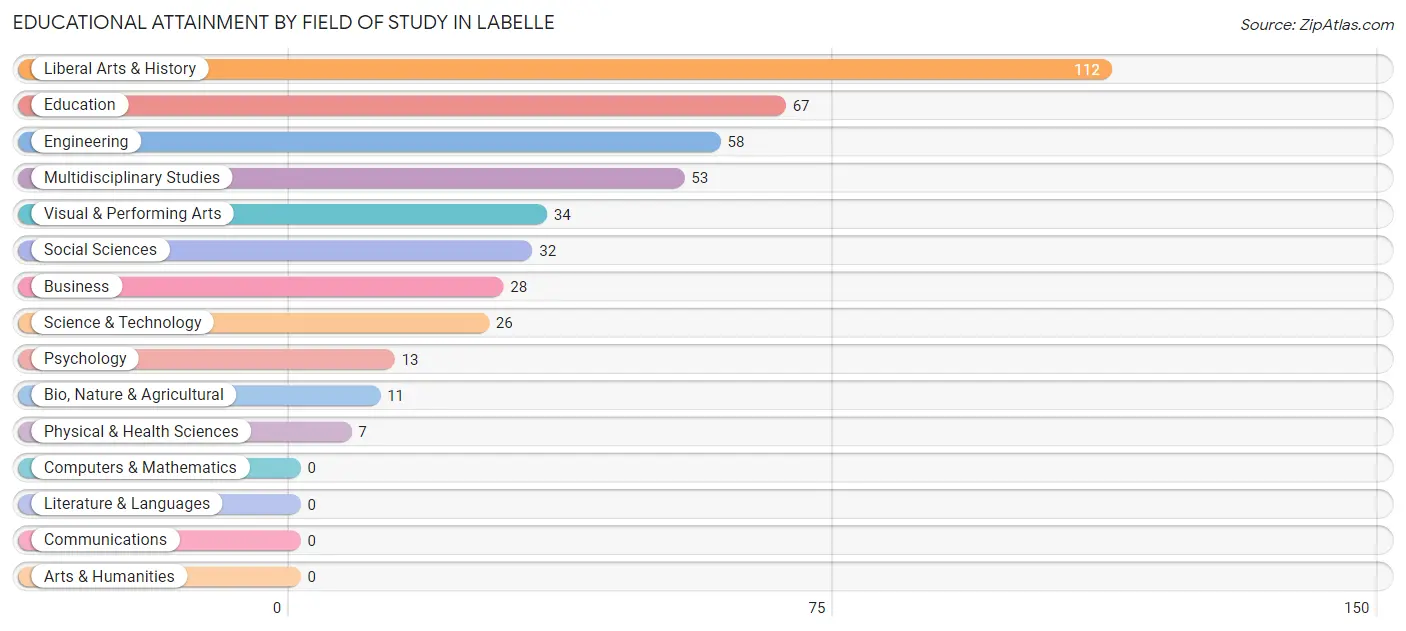
| Field of Study | # Graduates | % Graduates |
| Computers & Mathematics | 0 | 0.0% |
| Bio, Nature & Agricultural | 11 | 2.5% |
| Physical & Health Sciences | 7 | 1.6% |
| Psychology | 13 | 2.9% |
| Social Sciences | 32 | 7.3% |
| Engineering | 58 | 13.2% |
| Multidisciplinary Studies | 53 | 12.0% |
| Science & Technology | 26 | 5.9% |
| Business | 28 | 6.4% |
| Education | 67 | 15.2% |
| Literature & Languages | 0 | 0.0% |
| Liberal Arts & History | 112 | 25.4% |
| Visual & Performing Arts | 34 | 7.7% |
| Communications | 0 | 0.0% |
| Arts & Humanities | 0 | 0.0% |
| Total | 441 | 100.0% |
Transportation & Commute in Labelle
Vehicle Availability by Sex in Labelle
The most prevalent vehicle ownership categories in Labelle are males with 5 or more vehicles (503, accounting for 31.5%) and females with 5 or more vehicles (115, making up 76.1%).
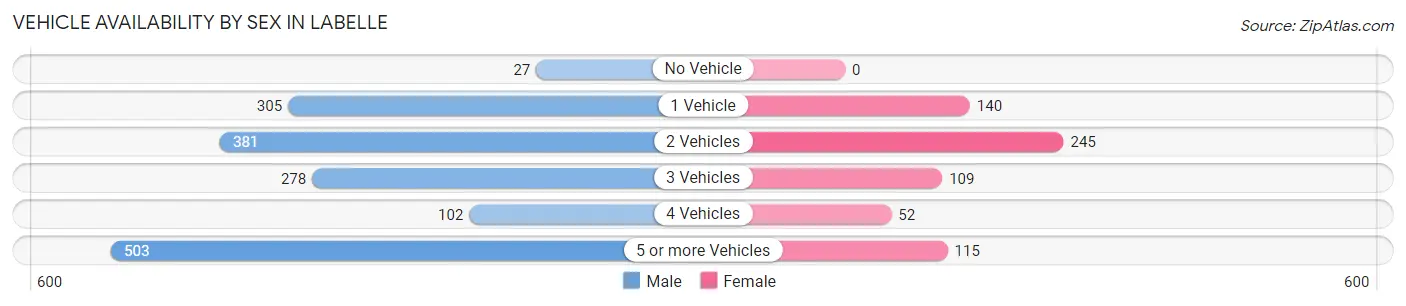
| Vehicles Available | Male | Female |
| No Vehicle | 27 (1.7%) | 0 (0.0%) |
| 1 Vehicle | 305 (19.1%) | 140 (21.2%) |
| 2 Vehicles | 381 (23.9%) | 245 (37.1%) |
| 3 Vehicles | 278 (17.4%) | 109 (16.5%) |
| 4 Vehicles | 102 (6.4%) | 52 (7.9%) |
| 5 or more Vehicles | 503 (31.5%) | 115 (17.4%) |
| Total | 1,596 (100.0%) | 661 (100.0%) |
Commute Time in Labelle
The most frequently occuring commute durations in Labelle are 60 to 89 minutes (731 commuters, 35.8%), 15 to 19 minutes (326 commuters, 16.0%), and 5 to 9 minutes (275 commuters, 13.5%).
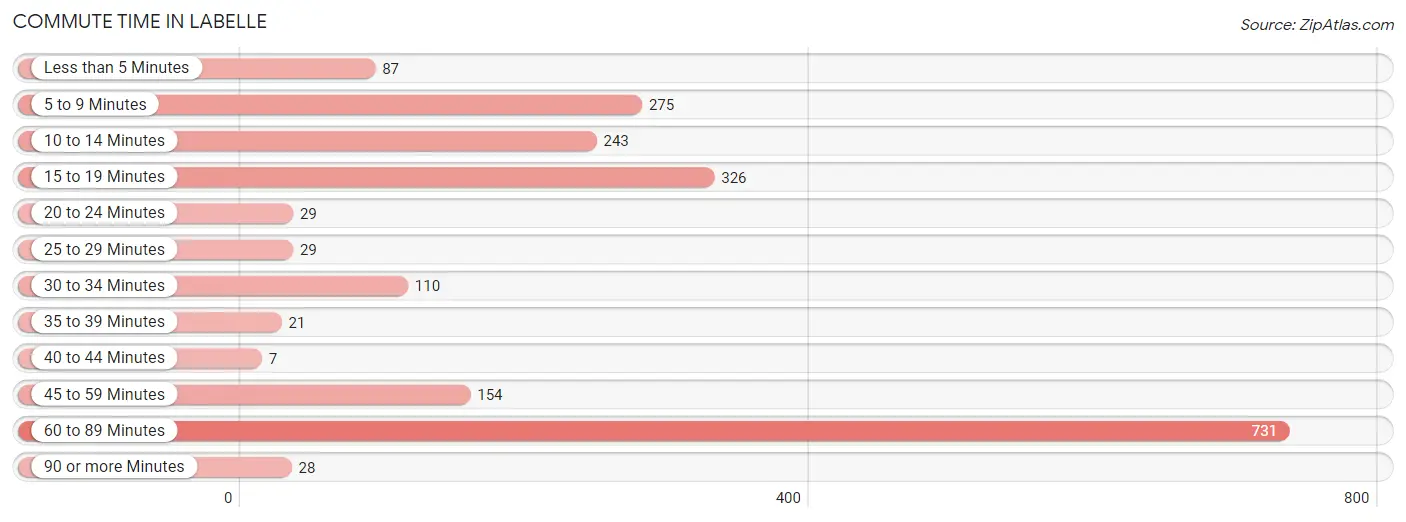
| Commute Time | # Commuters | % Commuters |
| Less than 5 Minutes | 87 | 4.3% |
| 5 to 9 Minutes | 275 | 13.5% |
| 10 to 14 Minutes | 243 | 11.9% |
| 15 to 19 Minutes | 326 | 16.0% |
| 20 to 24 Minutes | 29 | 1.4% |
| 25 to 29 Minutes | 29 | 1.4% |
| 30 to 34 Minutes | 110 | 5.4% |
| 35 to 39 Minutes | 21 | 1.0% |
| 40 to 44 Minutes | 7 | 0.3% |
| 45 to 59 Minutes | 154 | 7.5% |
| 60 to 89 Minutes | 731 | 35.8% |
| 90 or more Minutes | 28 | 1.4% |
Commute Time by Sex in Labelle
The most common commute times in Labelle are 60 to 89 minutes (652 commuters, 41.8%) for males and 10 to 14 minutes (111 commuters, 23.1%) for females.
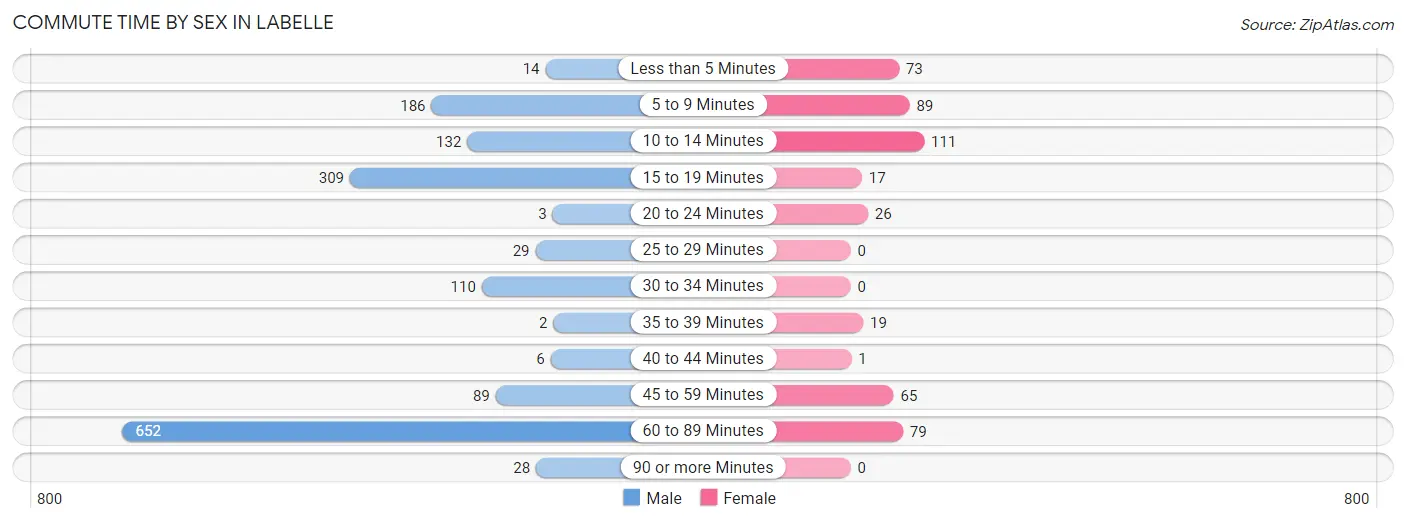
| Commute Time | Male | Female |
| Less than 5 Minutes | 14 (0.9%) | 73 (15.2%) |
| 5 to 9 Minutes | 186 (11.9%) | 89 (18.5%) |
| 10 to 14 Minutes | 132 (8.5%) | 111 (23.1%) |
| 15 to 19 Minutes | 309 (19.8%) | 17 (3.5%) |
| 20 to 24 Minutes | 3 (0.2%) | 26 (5.4%) |
| 25 to 29 Minutes | 29 (1.9%) | 0 (0.0%) |
| 30 to 34 Minutes | 110 (7.0%) | 0 (0.0%) |
| 35 to 39 Minutes | 2 (0.1%) | 19 (4.0%) |
| 40 to 44 Minutes | 6 (0.4%) | 1 (0.2%) |
| 45 to 59 Minutes | 89 (5.7%) | 65 (13.5%) |
| 60 to 89 Minutes | 652 (41.8%) | 79 (16.5%) |
| 90 or more Minutes | 28 (1.8%) | 0 (0.0%) |
Time of Departure to Work by Sex in Labelle
The most frequent times of departure to work in Labelle are 6:30 AM to 6:59 AM (529, 33.9%) for males and 7:00 AM to 7:29 AM (154, 32.1%) for females.
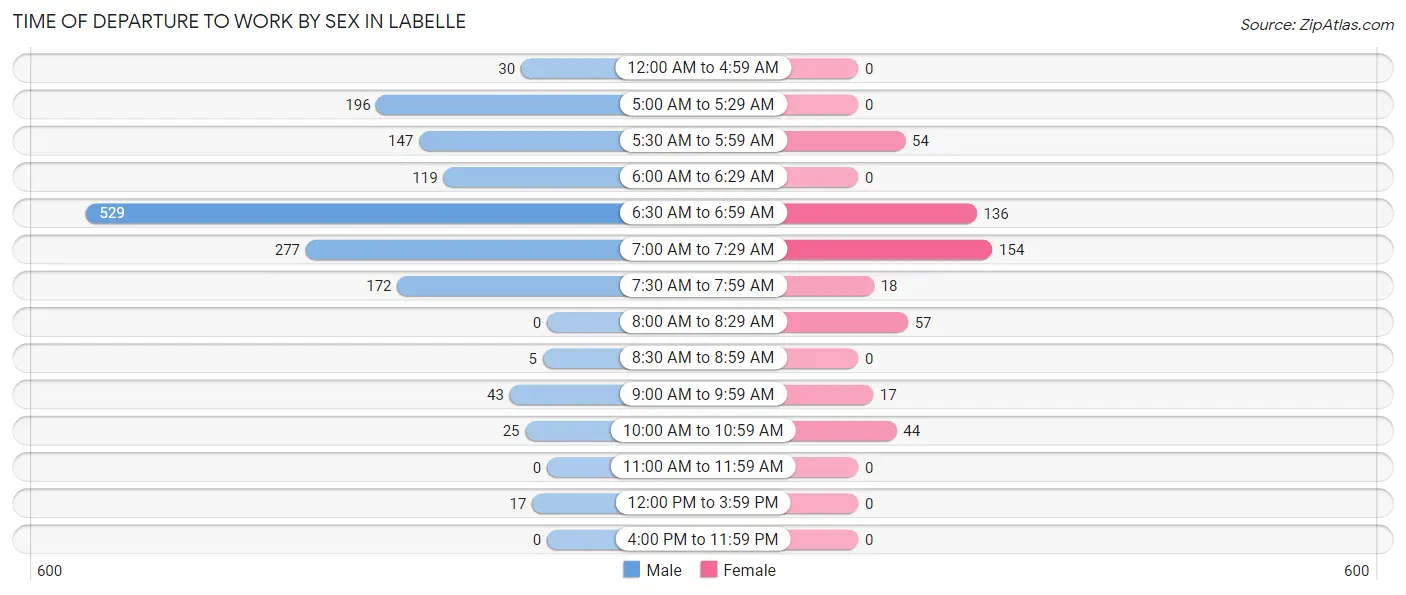
| Time of Departure | Male | Female |
| 12:00 AM to 4:59 AM | 30 (1.9%) | 0 (0.0%) |
| 5:00 AM to 5:29 AM | 196 (12.6%) | 0 (0.0%) |
| 5:30 AM to 5:59 AM | 147 (9.4%) | 54 (11.3%) |
| 6:00 AM to 6:29 AM | 119 (7.6%) | 0 (0.0%) |
| 6:30 AM to 6:59 AM | 529 (33.9%) | 136 (28.3%) |
| 7:00 AM to 7:29 AM | 277 (17.8%) | 154 (32.1%) |
| 7:30 AM to 7:59 AM | 172 (11.0%) | 18 (3.7%) |
| 8:00 AM to 8:29 AM | 0 (0.0%) | 57 (11.9%) |
| 8:30 AM to 8:59 AM | 5 (0.3%) | 0 (0.0%) |
| 9:00 AM to 9:59 AM | 43 (2.8%) | 17 (3.5%) |
| 10:00 AM to 10:59 AM | 25 (1.6%) | 44 (9.2%) |
| 11:00 AM to 11:59 AM | 0 (0.0%) | 0 (0.0%) |
| 12:00 PM to 3:59 PM | 17 (1.1%) | 0 (0.0%) |
| 4:00 PM to 11:59 PM | 0 (0.0%) | 0 (0.0%) |
| Total | 1,560 (100.0%) | 480 (100.0%) |
Housing Occupancy in Labelle
Occupancy by Ownership in Labelle
Of the total 1,578 dwellings in Labelle, owner-occupied units account for 1,101 (69.8%), while renter-occupied units make up 477 (30.2%).
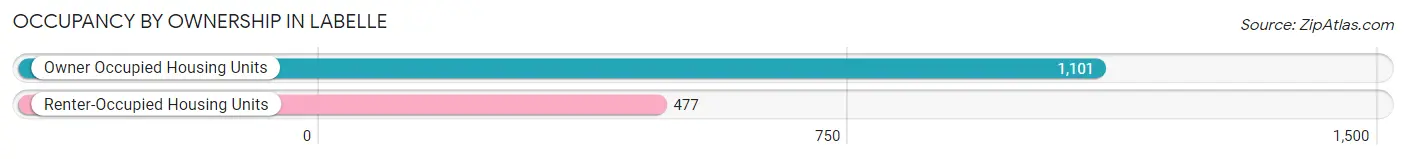
| Occupancy | # Housing Units | % Housing Units |
| Owner Occupied Housing Units | 1,101 | 69.8% |
| Renter-Occupied Housing Units | 477 | 30.2% |
| Total Occupied Housing Units | 1,578 | 100.0% |
Occupancy by Household Size in Labelle
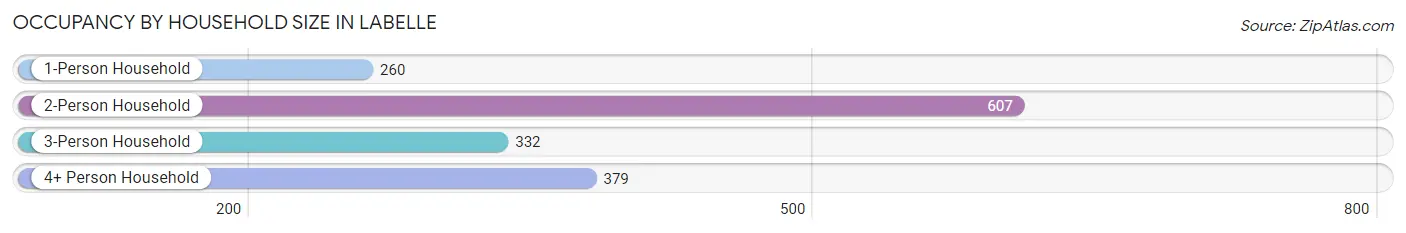
| Household Size | # Housing Units | % Housing Units |
| 1-Person Household | 260 | 16.5% |
| 2-Person Household | 607 | 38.5% |
| 3-Person Household | 332 | 21.0% |
| 4+ Person Household | 379 | 24.0% |
| Total Housing Units | 1,578 | 100.0% |
Occupancy by Ownership by Household Size in Labelle
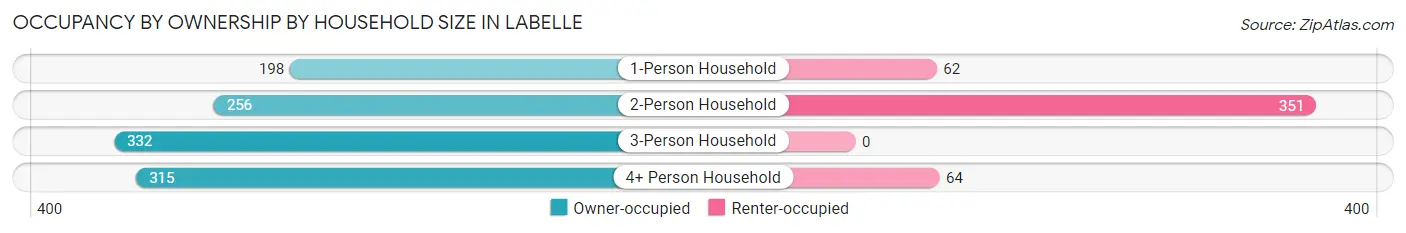
| Household Size | Owner-occupied | Renter-occupied |
| 1-Person Household | 198 (76.1%) | 62 (23.8%) |
| 2-Person Household | 256 (42.2%) | 351 (57.8%) |
| 3-Person Household | 332 (100.0%) | 0 (0.0%) |
| 4+ Person Household | 315 (83.1%) | 64 (16.9%) |
| Total Housing Units | 1,101 (69.8%) | 477 (30.2%) |
Occupancy by Educational Attainment in Labelle
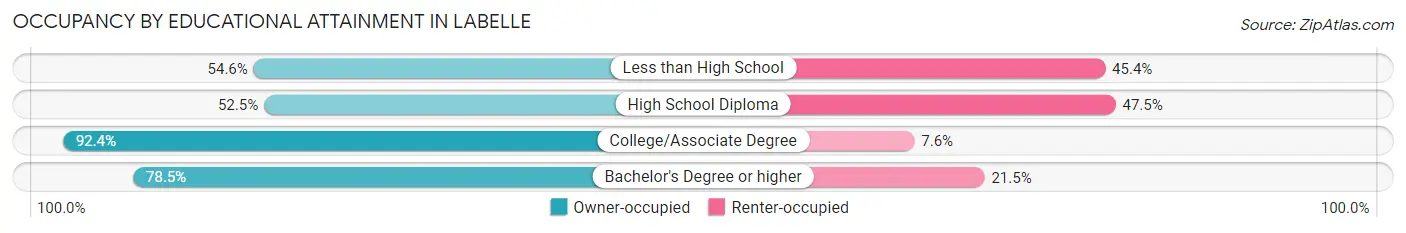
| Household Size | Owner-occupied | Renter-occupied |
| Less than High School | 178 (54.6%) | 148 (45.4%) |
| High School Diploma | 259 (52.5%) | 234 (47.5%) |
| College/Associate Degree | 452 (92.4%) | 37 (7.6%) |
| Bachelor's Degree or higher | 212 (78.5%) | 58 (21.5%) |
Occupancy by Age of Householder in Labelle
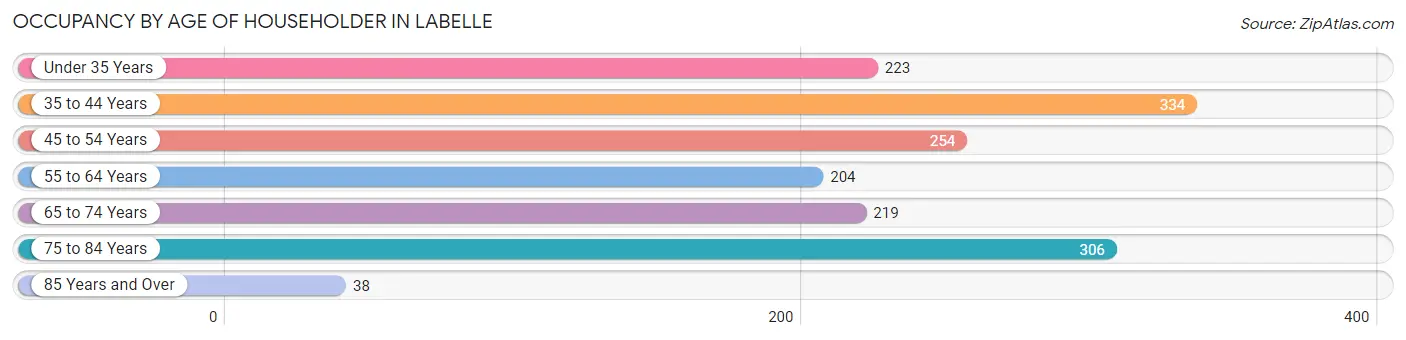
| Age Bracket | # Households | % Households |
| Under 35 Years | 223 | 14.1% |
| 35 to 44 Years | 334 | 21.2% |
| 45 to 54 Years | 254 | 16.1% |
| 55 to 64 Years | 204 | 12.9% |
| 65 to 74 Years | 219 | 13.9% |
| 75 to 84 Years | 306 | 19.4% |
| 85 Years and Over | 38 | 2.4% |
| Total | 1,578 | 100.0% |
Housing Finances in Labelle
Median Income by Occupancy in Labelle
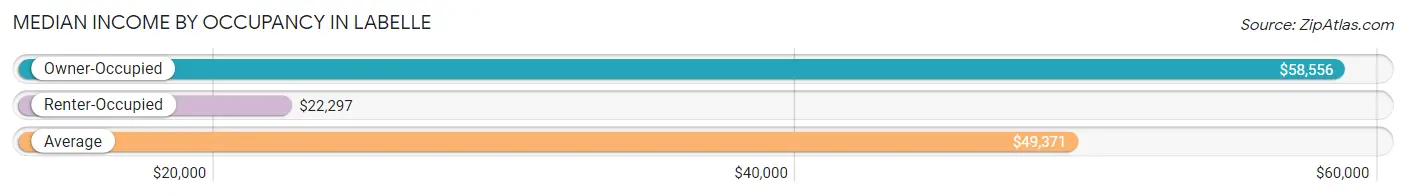
| Occupancy Type | # Households | Median Income |
| Owner-Occupied | 1,101 (69.8%) | $58,556 |
| Renter-Occupied | 477 (30.2%) | $22,297 |
| Average | 1,578 (100.0%) | $49,371 |
Occupancy by Householder Income Bracket in Labelle
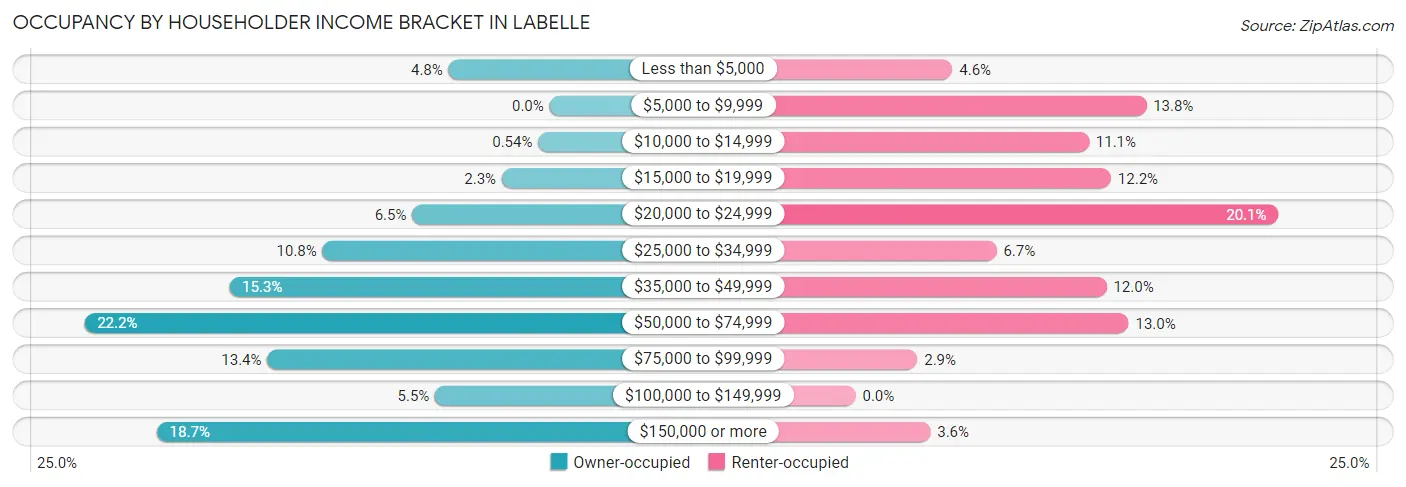
| Income Bracket | Owner-occupied | Renter-occupied |
| Less than $5,000 | 53 (4.8%) | 22 (4.6%) |
| $5,000 to $9,999 | 0 (0.0%) | 66 (13.8%) |
| $10,000 to $14,999 | 6 (0.5%) | 53 (11.1%) |
| $15,000 to $19,999 | 25 (2.3%) | 58 (12.2%) |
| $20,000 to $24,999 | 72 (6.5%) | 96 (20.1%) |
| $25,000 to $34,999 | 119 (10.8%) | 32 (6.7%) |
| $35,000 to $49,999 | 168 (15.3%) | 57 (11.9%) |
| $50,000 to $74,999 | 244 (22.2%) | 62 (13.0%) |
| $75,000 to $99,999 | 148 (13.4%) | 14 (2.9%) |
| $100,000 to $149,999 | 60 (5.4%) | 0 (0.0%) |
| $150,000 or more | 206 (18.7%) | 17 (3.6%) |
| Total | 1,101 (100.0%) | 477 (100.0%) |
Monthly Housing Cost Tiers in Labelle
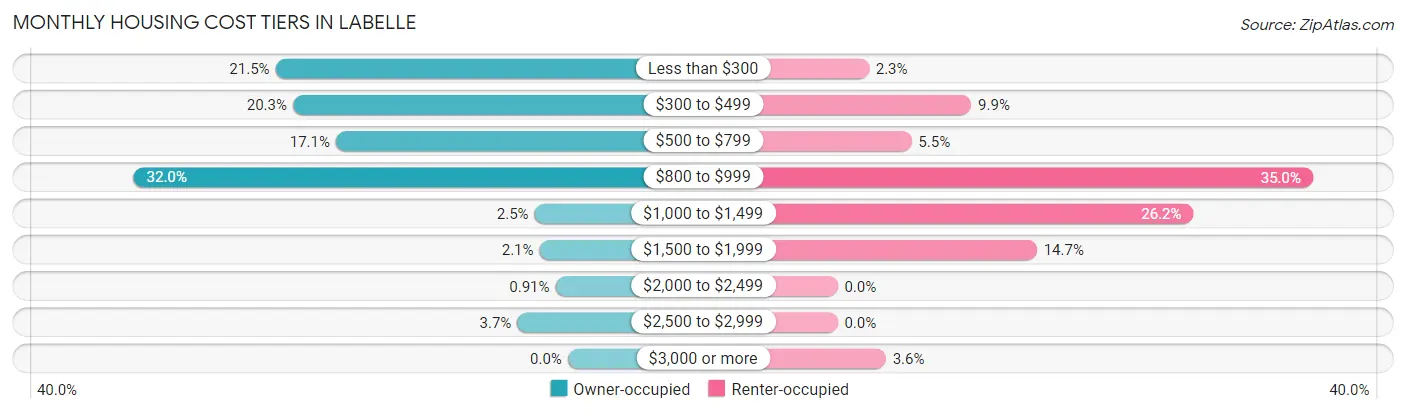
| Monthly Cost | Owner-occupied | Renter-occupied |
| Less than $300 | 237 (21.5%) | 11 (2.3%) |
| $300 to $499 | 223 (20.3%) | 47 (9.9%) |
| $500 to $799 | 188 (17.1%) | 26 (5.4%) |
| $800 to $999 | 352 (32.0%) | 167 (35.0%) |
| $1,000 to $1,499 | 27 (2.5%) | 125 (26.2%) |
| $1,500 to $1,999 | 23 (2.1%) | 70 (14.7%) |
| $2,000 to $2,499 | 10 (0.9%) | 0 (0.0%) |
| $2,500 to $2,999 | 41 (3.7%) | 0 (0.0%) |
| $3,000 or more | 0 (0.0%) | 17 (3.6%) |
| Total | 1,101 (100.0%) | 477 (100.0%) |
Physical Housing Characteristics in Labelle
Housing Structures in Labelle
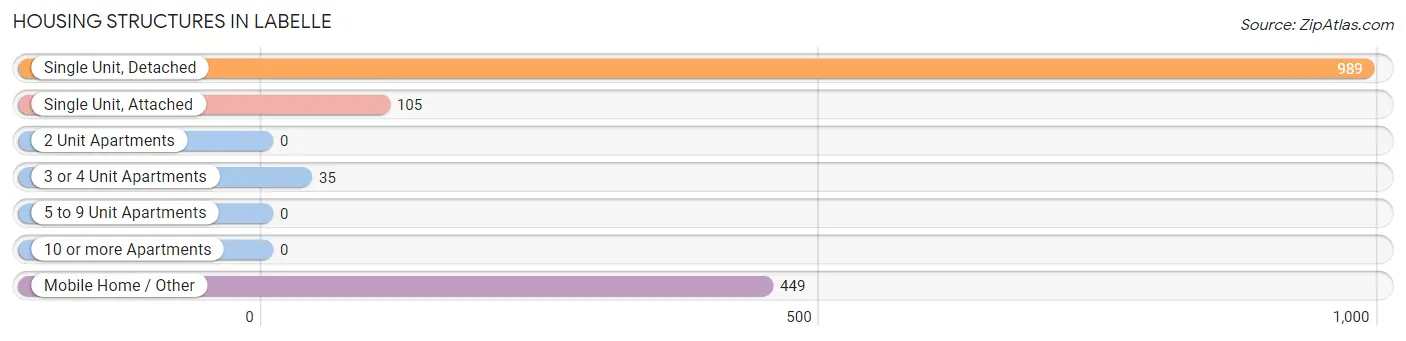
| Structure Type | # Housing Units | % Housing Units |
| Single Unit, Detached | 989 | 62.7% |
| Single Unit, Attached | 105 | 6.7% |
| 2 Unit Apartments | 0 | 0.0% |
| 3 or 4 Unit Apartments | 35 | 2.2% |
| 5 to 9 Unit Apartments | 0 | 0.0% |
| 10 or more Apartments | 0 | 0.0% |
| Mobile Home / Other | 449 | 28.4% |
| Total | 1,578 | 100.0% |
Housing Structures by Occupancy in Labelle
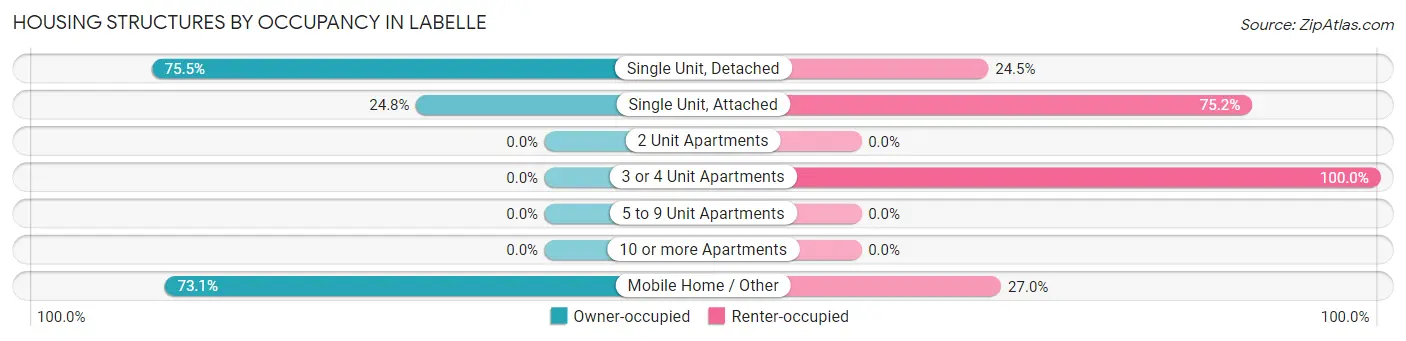
| Structure Type | Owner-occupied | Renter-occupied |
| Single Unit, Detached | 747 (75.5%) | 242 (24.5%) |
| Single Unit, Attached | 26 (24.8%) | 79 (75.2%) |
| 2 Unit Apartments | 0 (0.0%) | 0 (0.0%) |
| 3 or 4 Unit Apartments | 0 (0.0%) | 35 (100.0%) |
| 5 to 9 Unit Apartments | 0 (0.0%) | 0 (0.0%) |
| 10 or more Apartments | 0 (0.0%) | 0 (0.0%) |
| Mobile Home / Other | 328 (73.1%) | 121 (27.0%) |
| Total | 1,101 (69.8%) | 477 (30.2%) |
Housing Structures by Number of Rooms in Labelle
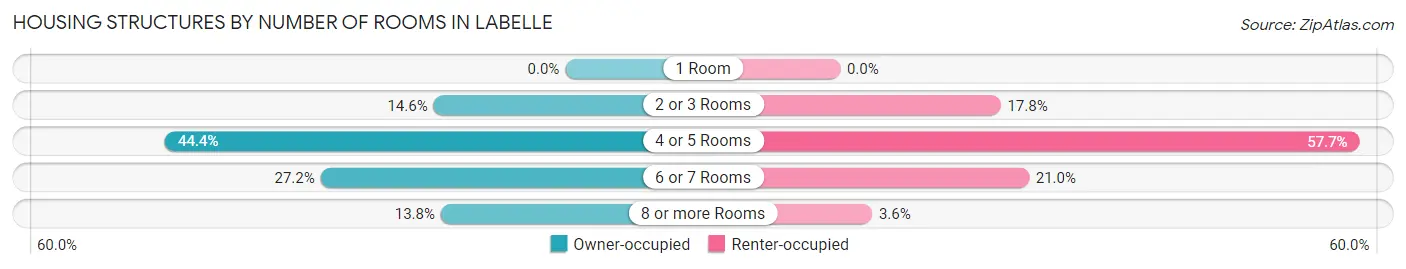
| Number of Rooms | Owner-occupied | Renter-occupied |
| 1 Room | 0 (0.0%) | 0 (0.0%) |
| 2 or 3 Rooms | 161 (14.6%) | 85 (17.8%) |
| 4 or 5 Rooms | 489 (44.4%) | 275 (57.7%) |
| 6 or 7 Rooms | 299 (27.2%) | 100 (21.0%) |
| 8 or more Rooms | 152 (13.8%) | 17 (3.6%) |
| Total | 1,101 (100.0%) | 477 (100.0%) |
Housing Structure by Heating Type in Labelle
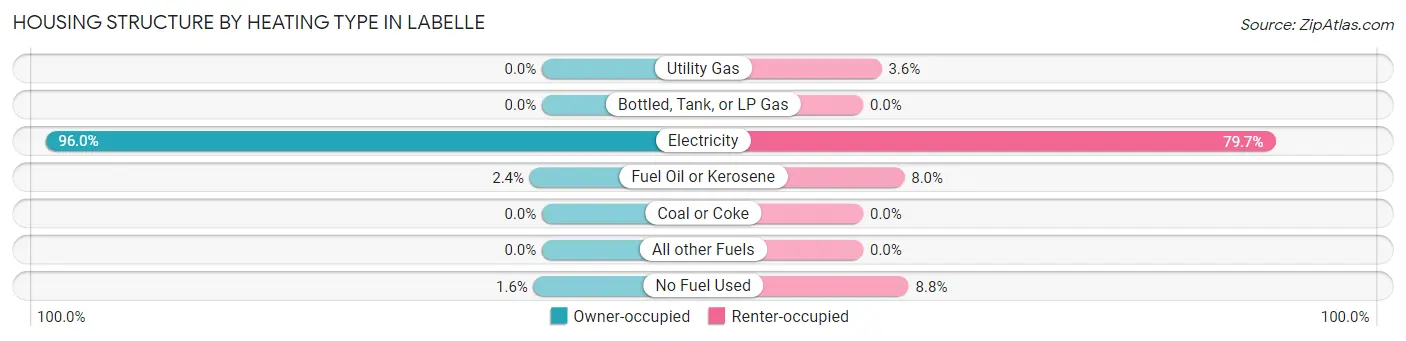
| Heating Type | Owner-occupied | Renter-occupied |
| Utility Gas | 0 (0.0%) | 17 (3.6%) |
| Bottled, Tank, or LP Gas | 0 (0.0%) | 0 (0.0%) |
| Electricity | 1,057 (96.0%) | 380 (79.7%) |
| Fuel Oil or Kerosene | 26 (2.4%) | 38 (8.0%) |
| Coal or Coke | 0 (0.0%) | 0 (0.0%) |
| All other Fuels | 0 (0.0%) | 0 (0.0%) |
| No Fuel Used | 18 (1.6%) | 42 (8.8%) |
| Total | 1,101 (100.0%) | 477 (100.0%) |
Household Vehicle Usage in Labelle
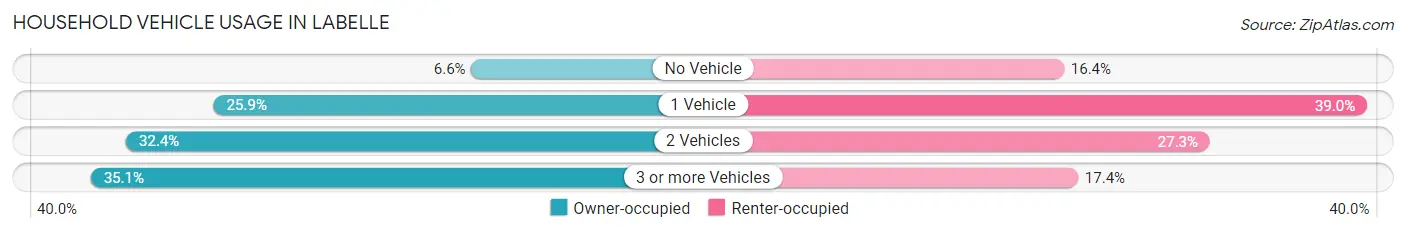
| Vehicles per Household | Owner-occupied | Renter-occupied |
| No Vehicle | 73 (6.6%) | 78 (16.4%) |
| 1 Vehicle | 285 (25.9%) | 186 (39.0%) |
| 2 Vehicles | 357 (32.4%) | 130 (27.3%) |
| 3 or more Vehicles | 386 (35.1%) | 83 (17.4%) |
| Total | 1,101 (100.0%) | 477 (100.0%) |
Real Estate & Mortgages in Labelle
Real Estate and Mortgage Overview in Labelle
| Characteristic | Without Mortgage | With Mortgage |
| Housing Units | 695 | 406 |
| Median Property Value | $112,700 | $160,000 |
| Median Household Income | $59,625 | $51 |
| Monthly Housing Costs | $400 | $0 |
| Real Estate Taxes | $1,022 | $18 |
Property Value by Mortgage Status in Labelle
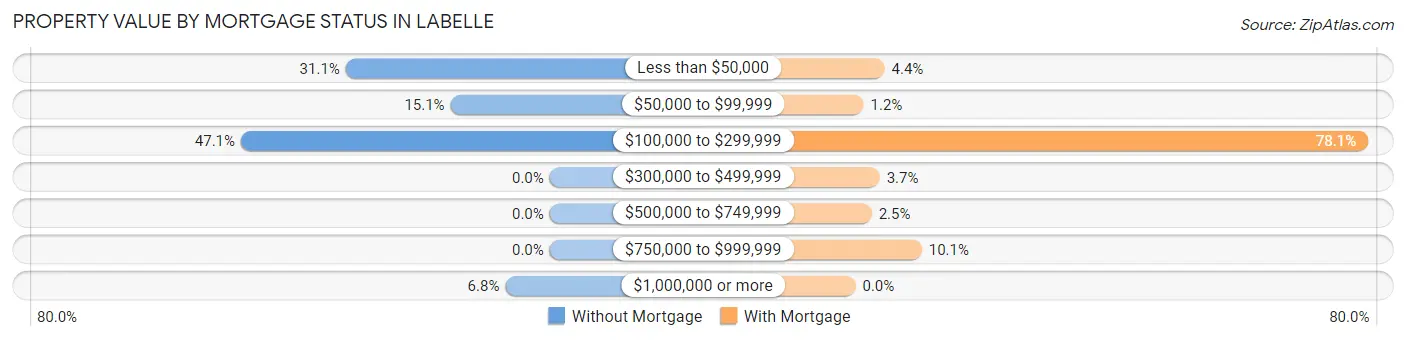
| Property Value | Without Mortgage | With Mortgage |
| Less than $50,000 | 216 (31.1%) | 18 (4.4%) |
| $50,000 to $99,999 | 105 (15.1%) | 5 (1.2%) |
| $100,000 to $299,999 | 327 (47.0%) | 317 (78.1%) |
| $300,000 to $499,999 | 0 (0.0%) | 15 (3.7%) |
| $500,000 to $749,999 | 0 (0.0%) | 10 (2.5%) |
| $750,000 to $999,999 | 0 (0.0%) | 41 (10.1%) |
| $1,000,000 or more | 47 (6.8%) | 0 (0.0%) |
| Total | 695 (100.0%) | 406 (100.0%) |
Household Income by Mortgage Status in Labelle
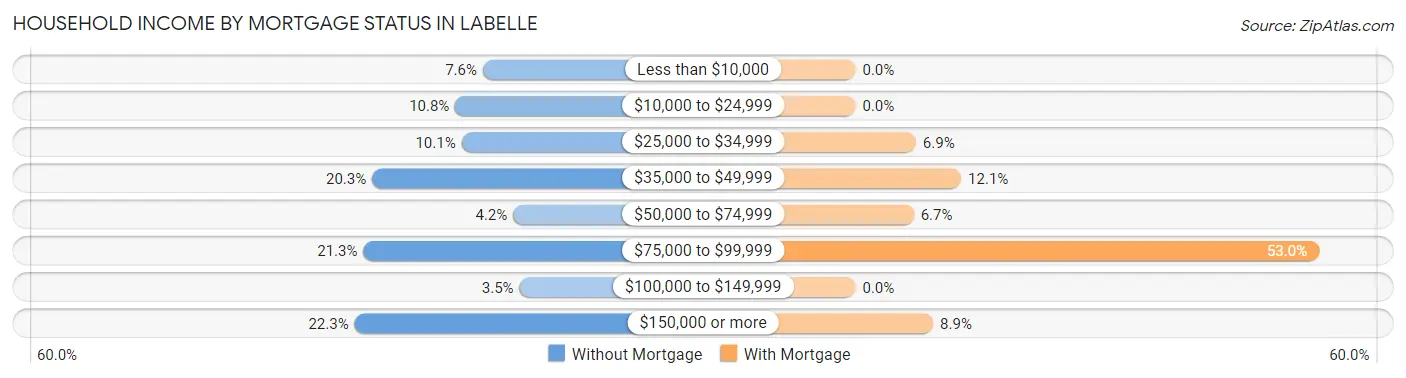
| Household Income | Without Mortgage | With Mortgage |
| Less than $10,000 | 53 (7.6%) | 0 (0.0%) |
| $10,000 to $24,999 | 75 (10.8%) | 0 (0.0%) |
| $25,000 to $34,999 | 70 (10.1%) | 28 (6.9%) |
| $35,000 to $49,999 | 141 (20.3%) | 49 (12.1%) |
| $50,000 to $74,999 | 29 (4.2%) | 27 (6.7%) |
| $75,000 to $99,999 | 148 (21.3%) | 215 (53.0%) |
| $100,000 to $149,999 | 24 (3.5%) | 0 (0.0%) |
| $150,000 or more | 155 (22.3%) | 36 (8.9%) |
| Total | 695 (100.0%) | 406 (100.0%) |
Property Value to Household Income Ratio in Labelle
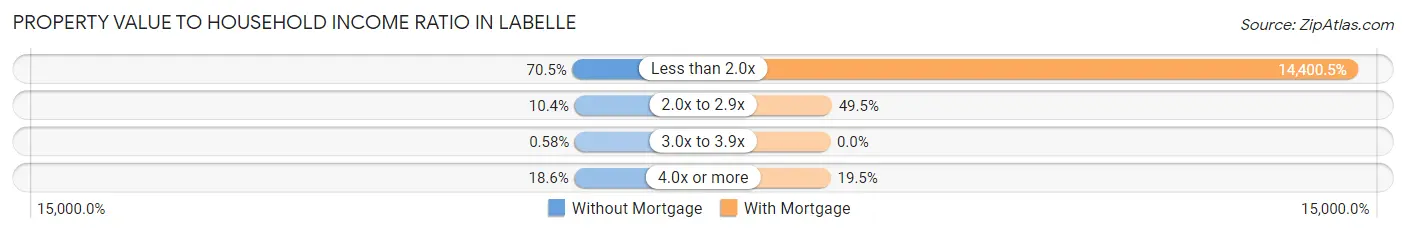
| Value-to-Income Ratio | Without Mortgage | With Mortgage |
| Less than 2.0x | 490 (70.5%) | 58,466 (14,400.5%) |
| 2.0x to 2.9x | 72 (10.4%) | 201 (49.5%) |
| 3.0x to 3.9x | 4 (0.6%) | 0 (0.0%) |
| 4.0x or more | 129 (18.6%) | 79 (19.5%) |
| Total | 695 (100.0%) | 406 (100.0%) |
Real Estate Taxes by Mortgage Status in Labelle
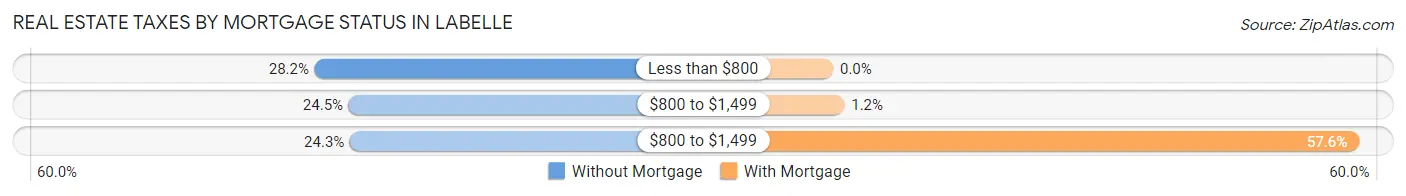
| Property Taxes | Without Mortgage | With Mortgage |
| Less than $800 | 196 (28.2%) | 0 (0.0%) |
| $800 to $1,499 | 170 (24.5%) | 5 (1.2%) |
| $800 to $1,499 | 169 (24.3%) | 234 (57.6%) |
| Total | 695 (100.0%) | 406 (100.0%) |
Health & Disability in Labelle
Health Insurance Coverage by Age in Labelle
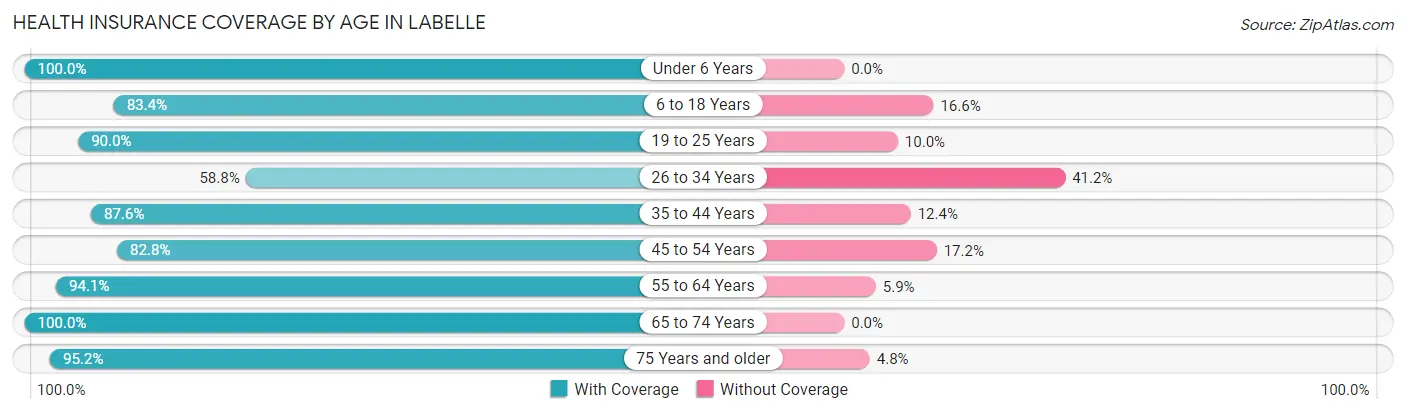
| Age Bracket | With Coverage | Without Coverage |
| Under 6 Years | 331 (100.0%) | 0 (0.0%) |
| 6 to 18 Years | 677 (83.4%) | 135 (16.6%) |
| 19 to 25 Years | 387 (90.0%) | 43 (10.0%) |
| 26 to 34 Years | 347 (58.8%) | 243 (41.2%) |
| 35 to 44 Years | 417 (87.6%) | 59 (12.4%) |
| 45 to 54 Years | 360 (82.8%) | 75 (17.2%) |
| 55 to 64 Years | 672 (94.1%) | 42 (5.9%) |
| 65 to 74 Years | 325 (100.0%) | 0 (0.0%) |
| 75 Years and older | 500 (95.2%) | 25 (4.8%) |
| Total | 4,016 (86.6%) | 622 (13.4%) |
Health Insurance Coverage by Citizenship Status in Labelle
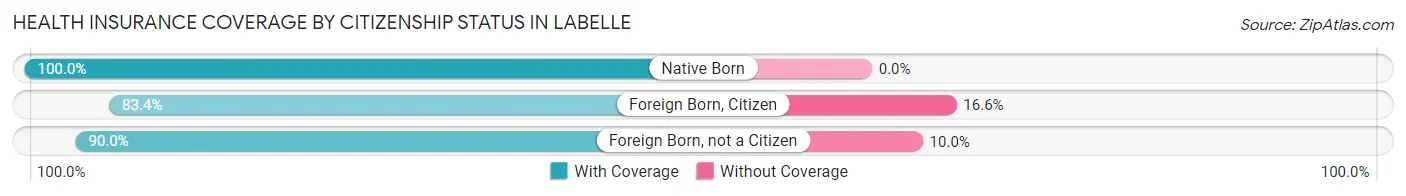
| Citizenship Status | With Coverage | Without Coverage |
| Native Born | 331 (100.0%) | 0 (0.0%) |
| Foreign Born, Citizen | 677 (83.4%) | 135 (16.6%) |
| Foreign Born, not a Citizen | 387 (90.0%) | 43 (10.0%) |
Health Insurance Coverage by Household Income in Labelle
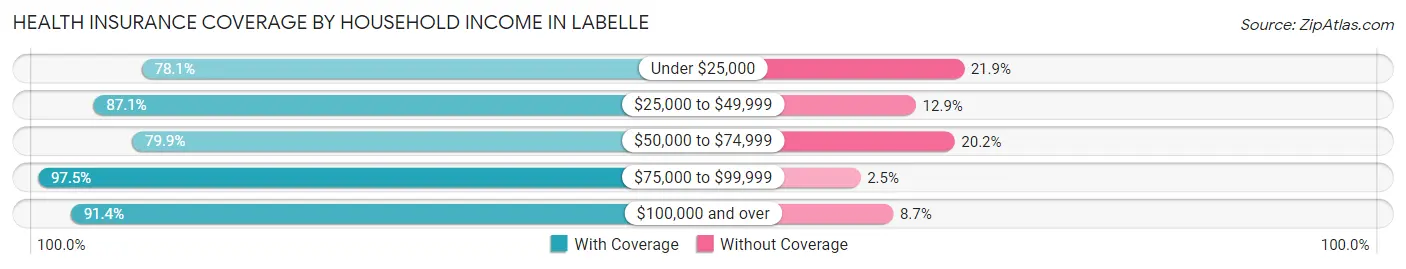
| Household Income | With Coverage | Without Coverage |
| Under $25,000 | 677 (78.1%) | 190 (21.9%) |
| $25,000 to $49,999 | 1,026 (87.1%) | 152 (12.9%) |
| $50,000 to $74,999 | 539 (79.8%) | 136 (20.2%) |
| $75,000 to $99,999 | 505 (97.5%) | 13 (2.5%) |
| $100,000 and over | 1,257 (91.3%) | 119 (8.6%) |
Public vs Private Health Insurance Coverage by Age in Labelle
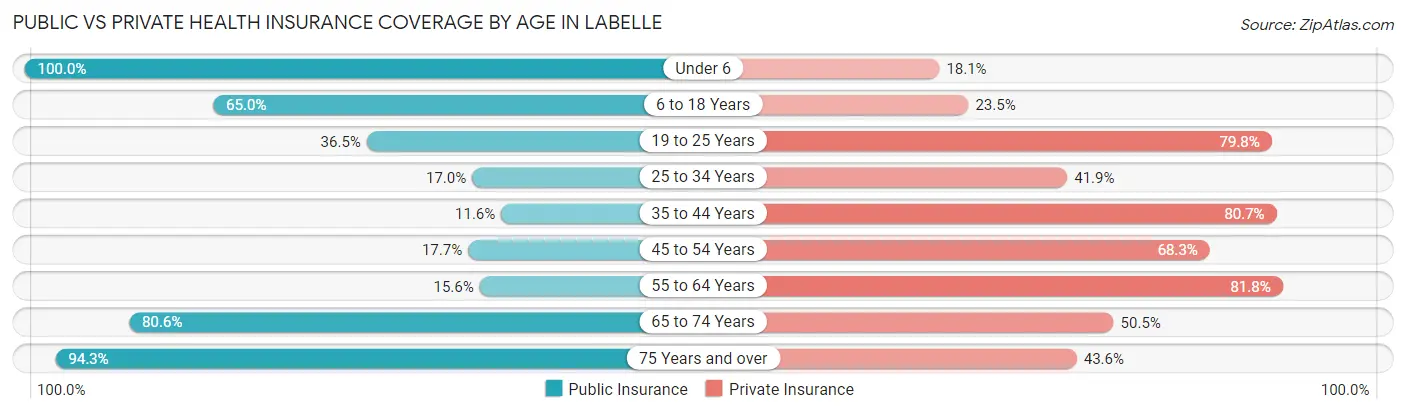
| Age Bracket | Public Insurance | Private Insurance |
| Under 6 | 331 (100.0%) | 60 (18.1%) |
| 6 to 18 Years | 528 (65.0%) | 191 (23.5%) |
| 19 to 25 Years | 157 (36.5%) | 343 (79.8%) |
| 25 to 34 Years | 100 (17.0%) | 247 (41.9%) |
| 35 to 44 Years | 55 (11.6%) | 384 (80.7%) |
| 45 to 54 Years | 77 (17.7%) | 297 (68.3%) |
| 55 to 64 Years | 111 (15.5%) | 584 (81.8%) |
| 65 to 74 Years | 262 (80.6%) | 164 (50.5%) |
| 75 Years and over | 495 (94.3%) | 229 (43.6%) |
| Total | 2,116 (45.6%) | 2,499 (53.9%) |
Disability Status by Sex by Age in Labelle
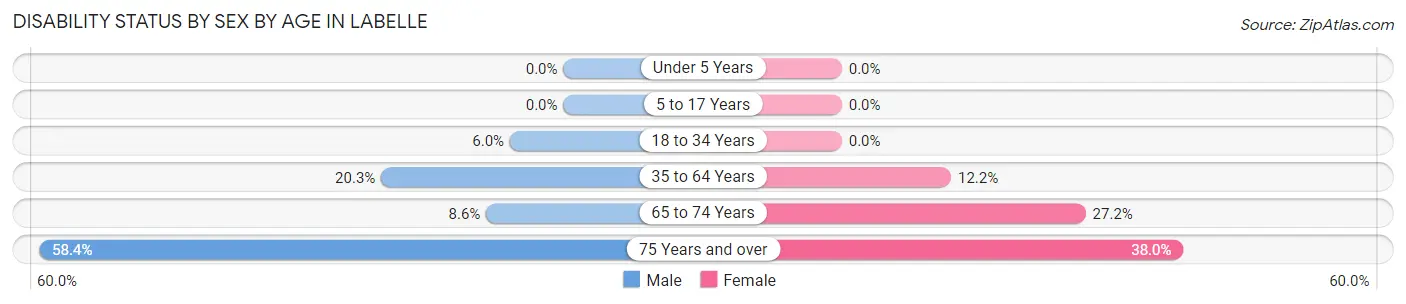
| Age Bracket | Male | Female |
| Under 5 Years | 0 (0.0%) | 0 (0.0%) |
| 5 to 17 Years | 0 (0.0%) | 0 (0.0%) |
| 18 to 34 Years | 41 (5.9%) | 0 (0.0%) |
| 35 to 64 Years | 213 (20.3%) | 70 (12.2%) |
| 65 to 74 Years | 14 (8.6%) | 44 (27.2%) |
| 75 Years and over | 87 (58.4%) | 143 (38.0%) |
Disability Class by Sex by Age in Labelle
Disability Class: Hearing Difficulty
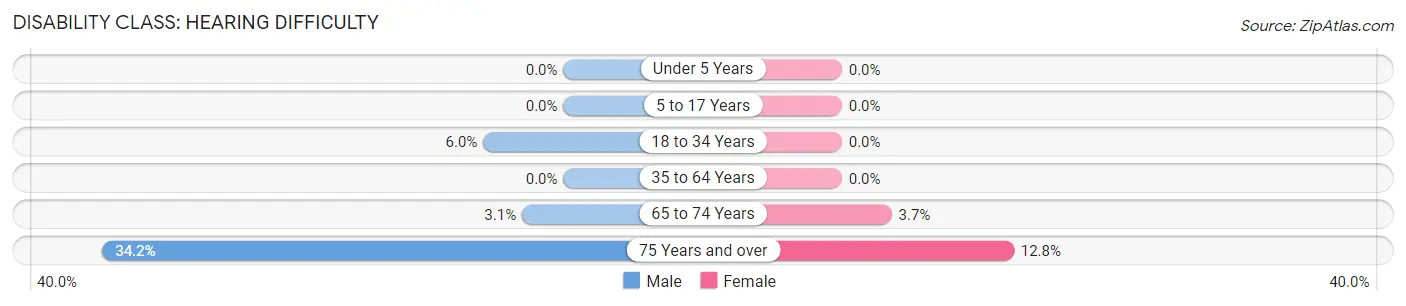
| Age Bracket | Male | Female |
| Under 5 Years | 0 (0.0%) | 0 (0.0%) |
| 5 to 17 Years | 0 (0.0%) | 0 (0.0%) |
| 18 to 34 Years | 41 (5.9%) | 0 (0.0%) |
| 35 to 64 Years | 0 (0.0%) | 0 (0.0%) |
| 65 to 74 Years | 5 (3.1%) | 6 (3.7%) |
| 75 Years and over | 51 (34.2%) | 48 (12.8%) |
Disability Class: Vision Difficulty
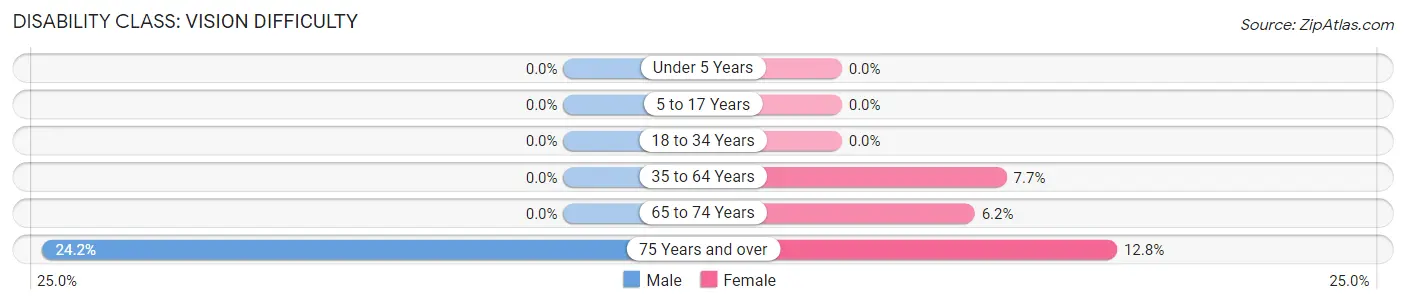
| Age Bracket | Male | Female |
| Under 5 Years | 0 (0.0%) | 0 (0.0%) |
| 5 to 17 Years | 0 (0.0%) | 0 (0.0%) |
| 18 to 34 Years | 0 (0.0%) | 0 (0.0%) |
| 35 to 64 Years | 0 (0.0%) | 44 (7.6%) |
| 65 to 74 Years | 0 (0.0%) | 10 (6.2%) |
| 75 Years and over | 36 (24.2%) | 48 (12.8%) |
Disability Class: Cognitive Difficulty
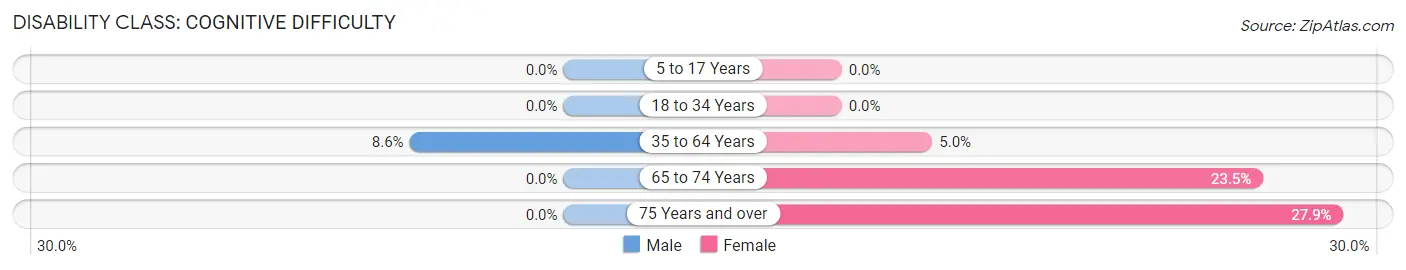
| Age Bracket | Male | Female |
| 5 to 17 Years | 0 (0.0%) | 0 (0.0%) |
| 18 to 34 Years | 0 (0.0%) | 0 (0.0%) |
| 35 to 64 Years | 90 (8.6%) | 29 (5.0%) |
| 65 to 74 Years | 0 (0.0%) | 38 (23.5%) |
| 75 Years and over | 0 (0.0%) | 105 (27.9%) |
Disability Class: Ambulatory Difficulty
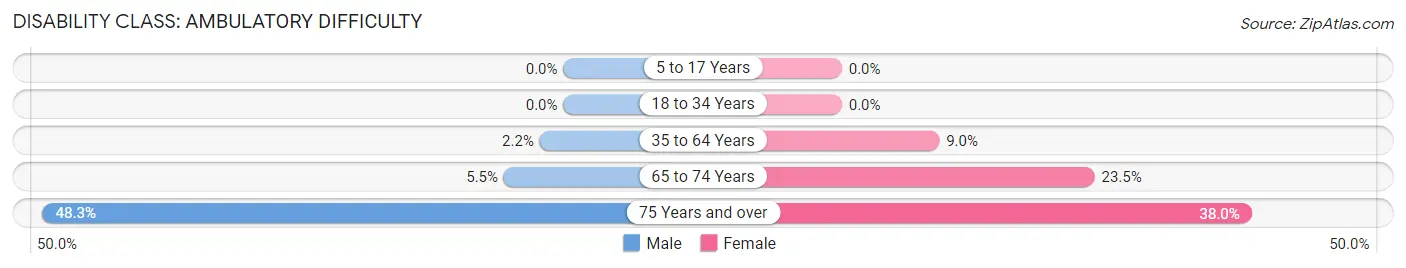
| Age Bracket | Male | Female |
| 5 to 17 Years | 0 (0.0%) | 0 (0.0%) |
| 18 to 34 Years | 0 (0.0%) | 0 (0.0%) |
| 35 to 64 Years | 23 (2.2%) | 52 (9.0%) |
| 65 to 74 Years | 9 (5.5%) | 38 (23.5%) |
| 75 Years and over | 72 (48.3%) | 143 (38.0%) |
Disability Class: Self-Care Difficulty
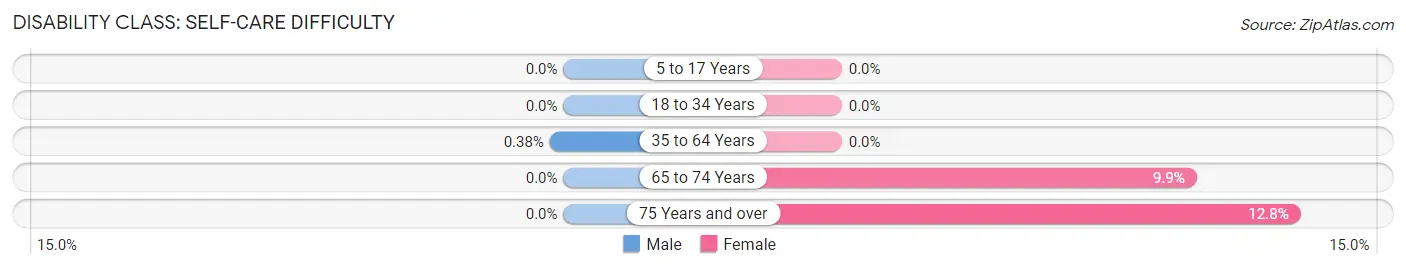
| Age Bracket | Male | Female |
| 5 to 17 Years | 0 (0.0%) | 0 (0.0%) |
| 18 to 34 Years | 0 (0.0%) | 0 (0.0%) |
| 35 to 64 Years | 4 (0.4%) | 0 (0.0%) |
| 65 to 74 Years | 0 (0.0%) | 16 (9.9%) |
| 75 Years and over | 0 (0.0%) | 48 (12.8%) |
Technology Access in Labelle
Computing Device Access in Labelle
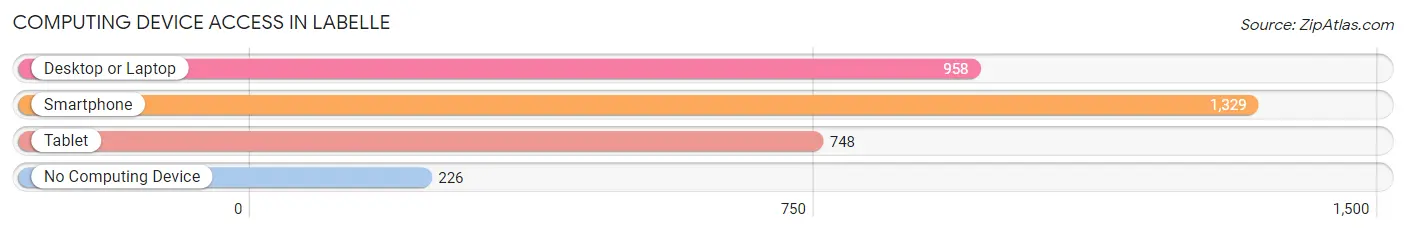
| Device Type | # Households | % Households |
| Desktop or Laptop | 958 | 60.7% |
| Smartphone | 1,329 | 84.2% |
| Tablet | 748 | 47.4% |
| No Computing Device | 226 | 14.3% |
| Total | 1,578 | 100.0% |
Internet Access in Labelle
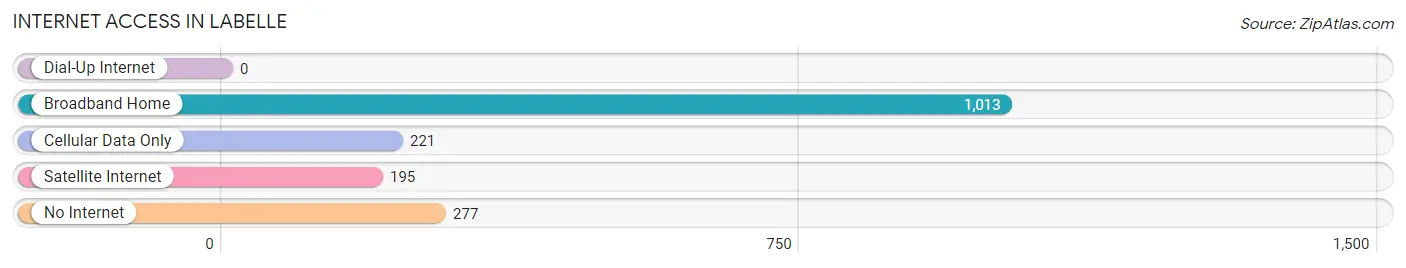
| Internet Type | # Households | % Households |
| Dial-Up Internet | 0 | 0.0% |
| Broadband Home | 1,013 | 64.2% |
| Cellular Data Only | 221 | 14.0% |
| Satellite Internet | 195 | 12.4% |
| No Internet | 277 | 17.5% |
| Total | 1,578 | 100.0% |
Labelle Summary
Labelle is a small city located in Hendry County, Florida. It is situated on the Caloosahatchee River, about 25 miles east of Fort Myers. The city was founded in 1888 and was named after the wife of one of the first settlers, Captain Francis Asbury Hendry. The city has a population of about 6,000 people and is the county seat of Hendry County.
History
Labelle was founded in 1888 by Captain Francis Asbury Hendry, who named the city after his wife, LaBelle. The city was originally a trading post and a stop on the Caloosahatchee River. In the early 1900s, the city began to grow as a center for the cattle industry. The city was incorporated in 1913 and the first mayor was elected in 1914.
In the 1920s, the city began to develop as a tourist destination. The city was home to several resorts, including the LaBelle Hotel, which was built in 1925. The city also had a movie theater, a bowling alley, and a golf course.
In the 1950s, the city began to experience a decline in population as people moved away to larger cities. The city was also affected by the construction of the Caloosahatchee River Bridge, which diverted traffic away from the city.
In the 1970s, the city began to experience a resurgence in population as people moved back to the area. The city was also home to a number of new businesses, including a shopping center and a hospital.
Geography
Labelle is located in Hendry County, Florida. The city is situated on the Caloosahatchee River, about 25 miles east of Fort Myers. The city is surrounded by the Big Cypress National Preserve to the north, the Caloosahatchee River to the east, and the Fisheating Creek to the south. The city has a total area of 4.2 square miles, all of which is land.
Economy
The economy of LaBelle is largely based on agriculture and tourism. The city is home to several large agricultural operations, including citrus groves, cattle ranches, and vegetable farms. The city is also home to several tourist attractions, including the LaBelle Hotel, the LaBelle Golf Course, and the LaBelle Movie Theater.
The city is also home to several manufacturing companies, including a paper mill and a plastics factory. The city is also home to several retail stores, restaurants, and other businesses.
Demographics
As of the 2010 census, the population of LaBelle was 6,000. The racial makeup of the city was 75.3% White, 17.2% African American, 0.7% Native American, 0.7% Asian, 0.1% Pacific Islander, and 4.9% from other races. Hispanic or Latino of any race were 16.2% of the population.
The median household income in LaBelle was $30,938, and the median family income was $37,813. The per capita income for the city was $15,945. About 17.2% of the population was below the poverty line.
The city is served by the Hendry County School District, which includes LaBelle Elementary School, LaBelle Middle School, and LaBelle High School. The city is also home to several private schools, including LaBelle Christian Academy and LaBelle Montessori School.
Common Questions
What is Per Capita Income in Labelle?
Per Capita income in Labelle is $25,776.
What is the Median Family Income in Labelle?
Median Family Income in Labelle is $55,605.
What is the Median Household income in Labelle?
Median Household Income in Labelle is $49,371.
What is Income or Wage Gap in Labelle?
Income or Wage Gap in Labelle is 14.5%.
Women in Labelle earn 85.5 cents for every dollar earned by a man.
What is Inequality or Gini Index in Labelle?
Inequality or Gini Index in Labelle is 0.53.
What is the Total Population of Labelle?
Total Population of Labelle is 4,963.
What is the Total Male Population of Labelle?
Total Male Population of Labelle is 2,949.
What is the Total Female Population of Labelle?
Total Female Population of Labelle is 2,014.
What is the Ratio of Males per 100 Females in Labelle?
There are 146.43 Males per 100 Females in Labelle.
What is the Ratio of Females per 100 Males in Labelle?
There are 68.29 Females per 100 Males in Labelle.
What is the Median Population Age in Labelle?
Median Population Age in Labelle is 38.3 Years.
What is the Average Family Size in Labelle
Average Family Size in Labelle is 3.2 People.
What is the Average Household Size in Labelle
Average Household Size in Labelle is 2.9 People.
How Large is the Labor Force in Labelle?
There are 2,378 People in the Labor Forcein in Labelle.
What is the Percentage of People in the Labor Force in Labelle?
60.0% of People are in the Labor Force in Labelle.
What is the Unemployment Rate in Labelle?
Unemployment Rate in Labelle is 3.3%.