Milan, TN Map & Demographics
Milan Map
Milan Overview
$25,981
PER CAPITA INCOME
$63,589
AVG FAMILY INCOME
$42,909
AVG HOUSEHOLD INCOME
18.0%
WAGE / INCOME GAP [ % ]
82.0¢/ $1
WAGE / INCOME GAP [ $ ]
$8,917
FAMILY INCOME DEFICIT
0.47
INEQUALITY / GINI INDEX
8,165
TOTAL POPULATION
3,781
MALE POPULATION
4,384
FEMALE POPULATION
86.25
MALES / 100 FEMALES
115.95
FEMALES / 100 MALES
36.9
MEDIAN AGE
3.3
AVG FAMILY SIZE
2.5
AVG HOUSEHOLD SIZE
3,464
LABOR FORCE [ PEOPLE ]
57.3%
PERCENT IN LABOR FORCE
4.9%
UNEMPLOYMENT RATE
Milan Zip Codes
Milan Area Codes
Income in Milan
Income Overview in Milan
Per Capita Income in Milan is $25,981, while median incomes of families and households are $63,589 and $42,909 respectively.
| Characteristic | Number | Measure |
| Per Capita Income | 8,165 | $25,981 |
| Median Family Income | 1,938 | $63,589 |
| Mean Family Income | 1,938 | $84,003 |
| Median Household Income | 3,183 | $42,909 |
| Mean Household Income | 3,183 | $66,428 |
| Income Deficit | 1,938 | $8,917 |
| Wage / Income Gap (%) | 8,165 | 18.02% |
| Wage / Income Gap ($) | 8,165 | 81.98¢ per $1 |
| Gini / Inequality Index | 8,165 | 0.47 |
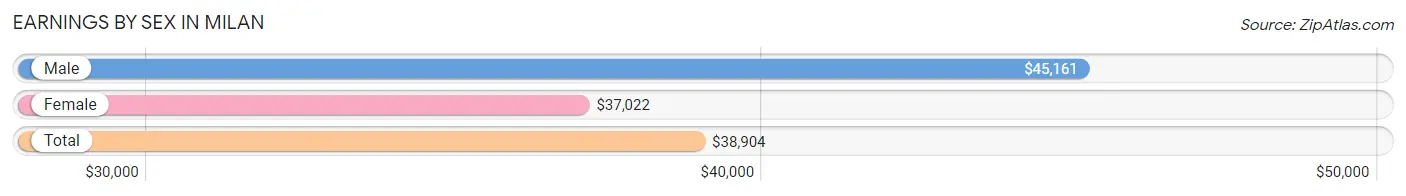
Earnings by Sex in Milan
Average Earnings in Milan are $38,904, $45,161 for men and $37,022 for women, a difference of 18.0%.
| Sex | Number | Average Earnings |
| Male | 1,805 (51.3%) | $45,161 |
| Female | 1,712 (48.7%) | $37,022 |
| Total | 3,517 (100.0%) | $38,904 |
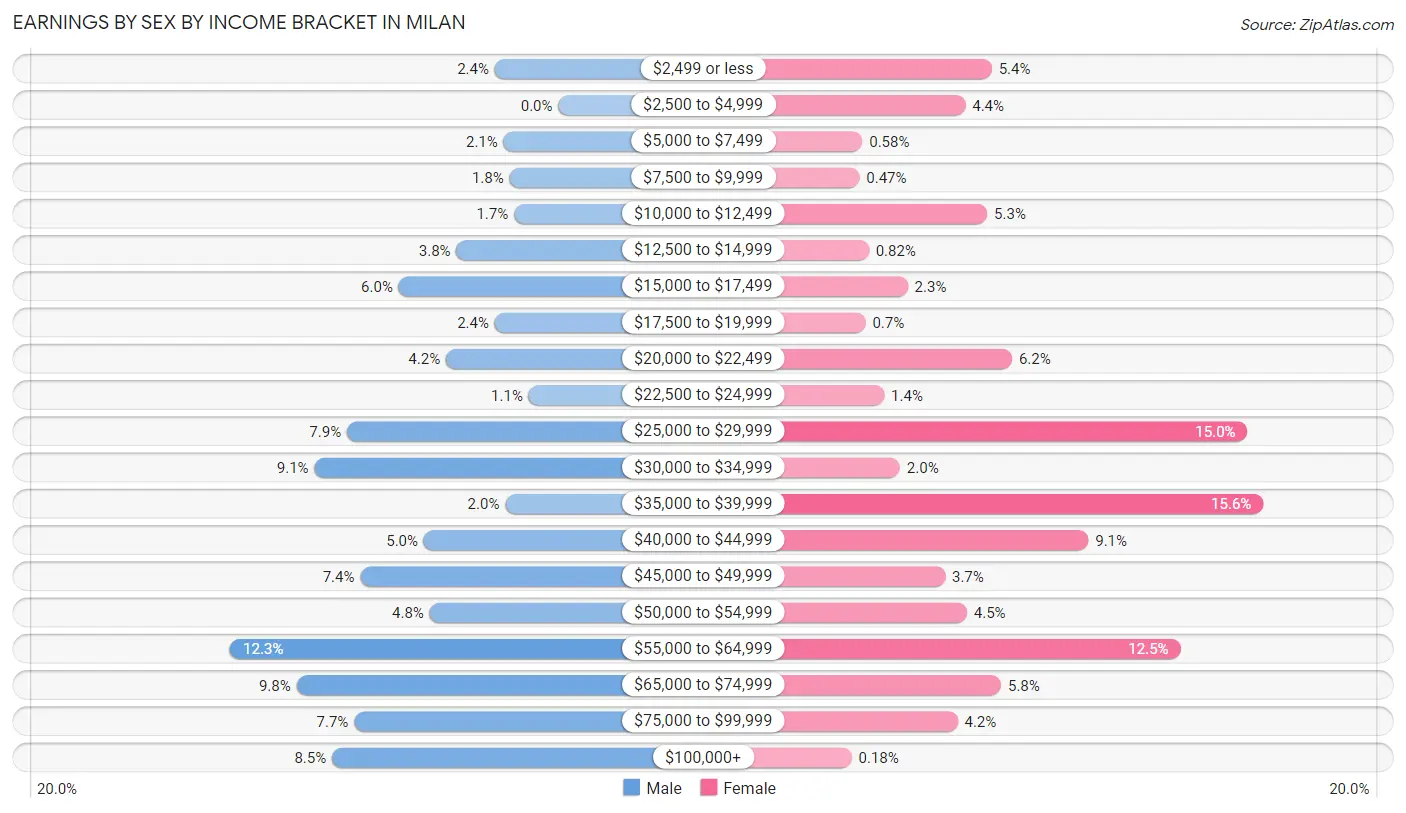
Earnings by Sex by Income Bracket in Milan
The most common earnings brackets in Milan are $55,000 to $64,999 for men (222 | 12.3%) and $35,000 to $39,999 for women (267 | 15.6%).
| Income | Male | Female |
| $2,499 or less | 43 (2.4%) | 93 (5.4%) |
| $2,500 to $4,999 | 0 (0.0%) | 76 (4.4%) |
| $5,000 to $7,499 | 37 (2.1%) | 10 (0.6%) |
| $7,500 to $9,999 | 33 (1.8%) | 8 (0.5%) |
| $10,000 to $12,499 | 30 (1.7%) | 90 (5.3%) |
| $12,500 to $14,999 | 69 (3.8%) | 14 (0.8%) |
| $15,000 to $17,499 | 108 (6.0%) | 39 (2.3%) |
| $17,500 to $19,999 | 43 (2.4%) | 12 (0.7%) |
| $20,000 to $22,499 | 76 (4.2%) | 106 (6.2%) |
| $22,500 to $24,999 | 20 (1.1%) | 24 (1.4%) |
| $25,000 to $29,999 | 143 (7.9%) | 257 (15.0%) |
| $30,000 to $34,999 | 165 (9.1%) | 34 (2.0%) |
| $35,000 to $39,999 | 36 (2.0%) | 267 (15.6%) |
| $40,000 to $44,999 | 91 (5.0%) | 155 (9.0%) |
| $45,000 to $49,999 | 134 (7.4%) | 63 (3.7%) |
| $50,000 to $54,999 | 87 (4.8%) | 77 (4.5%) |
| $55,000 to $64,999 | 222 (12.3%) | 214 (12.5%) |
| $65,000 to $74,999 | 177 (9.8%) | 99 (5.8%) |
| $75,000 to $99,999 | 138 (7.6%) | 71 (4.2%) |
| $100,000+ | 153 (8.5%) | 3 (0.2%) |
| Total | 1,805 (100.0%) | 1,712 (100.0%) |
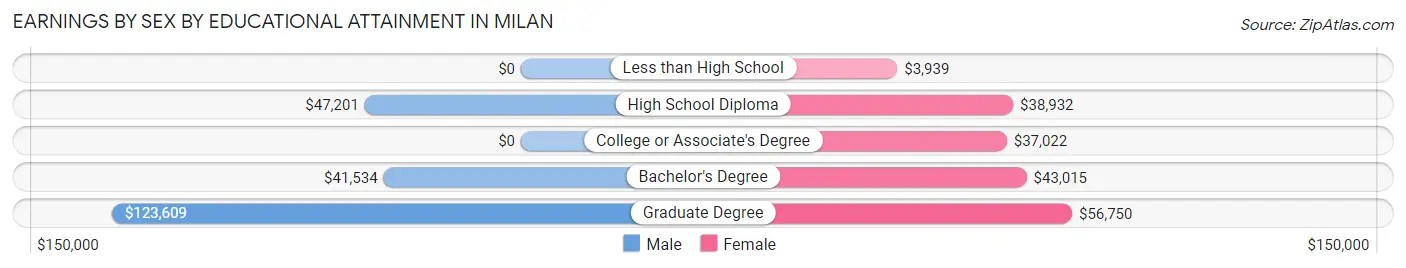
Earnings by Sex by Educational Attainment in Milan
Average earnings in Milan are $46,553 for men and $38,224 for women, a difference of 17.9%. Men with an educational attainment of graduate degree enjoy the highest average annual earnings of $123,609, while those with bachelor's degree education earn the least with $41,534. Women with an educational attainment of graduate degree earn the most with the average annual earnings of $56,750, while those with less than high school education have the smallest earnings of $3,939.
| Educational Attainment | Male Income | Female Income |
| Less than High School | - | - |
| High School Diploma | $47,201 | $38,932 |
| College or Associate's Degree | - | - |
| Bachelor's Degree | $41,534 | $43,015 |
| Graduate Degree | $123,609 | $56,750 |
| Total | $46,553 | $38,224 |
Family Income in Milan
Family Income Brackets in Milan
According to the Milan family income data, there are 378 families falling into the $100,000 to $149,999 income range, which is the most common income bracket and makes up 19.5% of all families. Conversely, the less than $10,000 income bracket is the least frequent group with only 17 families (0.9%) belonging to this category.
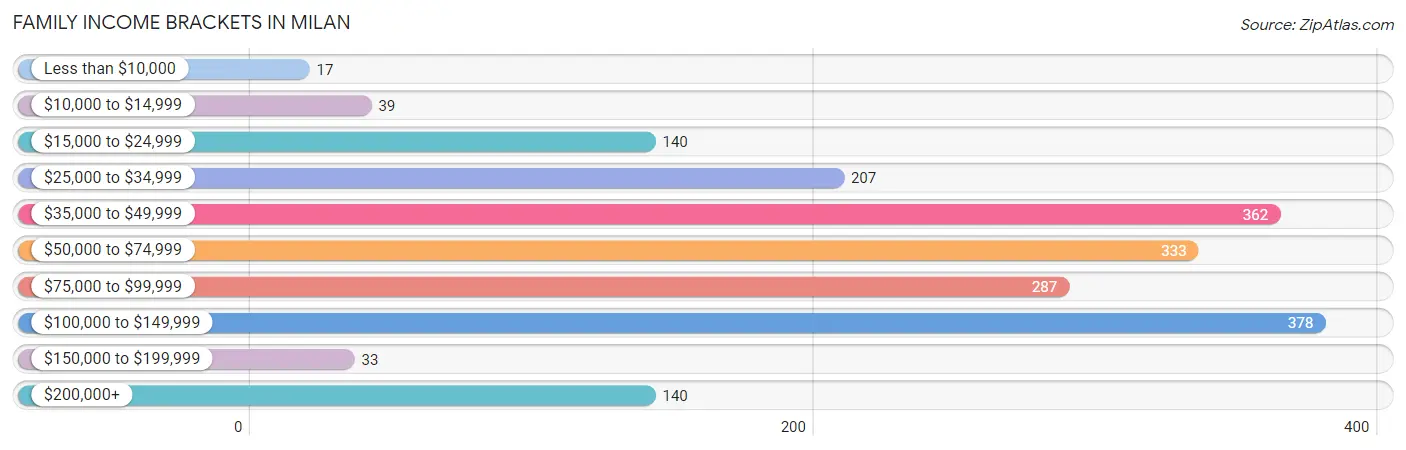
| Income Bracket | # Families | % Families |
| Less than $10,000 | 17 | 0.9% |
| $10,000 to $14,999 | 39 | 2.0% |
| $15,000 to $24,999 | 140 | 7.2% |
| $25,000 to $34,999 | 207 | 10.7% |
| $35,000 to $49,999 | 362 | 18.7% |
| $50,000 to $74,999 | 333 | 17.2% |
| $75,000 to $99,999 | 287 | 14.8% |
| $100,000 to $149,999 | 378 | 19.5% |
| $150,000 to $199,999 | 33 | 1.7% |
| $200,000+ | 140 | 7.2% |
Family Income by Famaliy Size in Milan
4-person families (321 | 16.6%) account for the highest median family income in Milan with $99,076 per family, while 2-person families (809 | 41.7%) have the highest median income of $30,986 per family member.
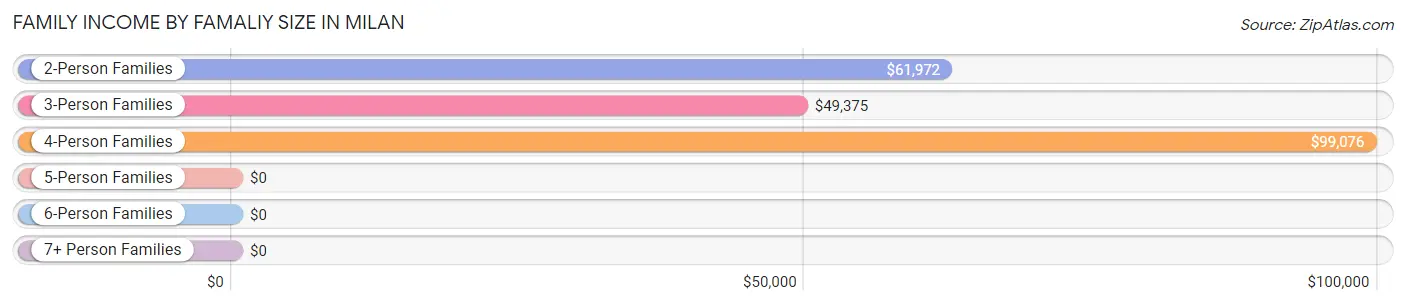
| Income Bracket | # Families | Median Income |
| 2-Person Families | 809 (41.7%) | $61,972 |
| 3-Person Families | 532 (27.5%) | $49,375 |
| 4-Person Families | 321 (16.6%) | $99,076 |
| 5-Person Families | 184 (9.5%) | $0 |
| 6-Person Families | 74 (3.8%) | $0 |
| 7+ Person Families | 18 (0.9%) | $0 |
| Total | 1,938 (100.0%) | $63,589 |
Family Income by Number of Earners in Milan
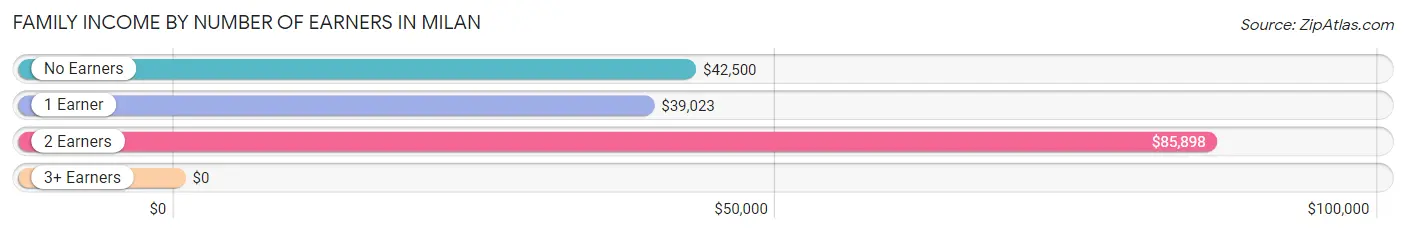
| Number of Earners | # Families | Median Income |
| No Earners | 272 (14.0%) | $42,500 |
| 1 Earner | 674 (34.8%) | $39,023 |
| 2 Earners | 862 (44.5%) | $85,898 |
| 3+ Earners | 130 (6.7%) | $0 |
| Total | 1,938 (100.0%) | $63,589 |
Household Income in Milan
Household Income Brackets in Milan
With 551 households falling in the category, the $100,000 to $149,999 income range is the most frequent in Milan, accounting for 17.3% of all households. In contrast, only 48 households (1.5%) fall into the $150,000 to $199,999 income bracket, making it the least populous group.
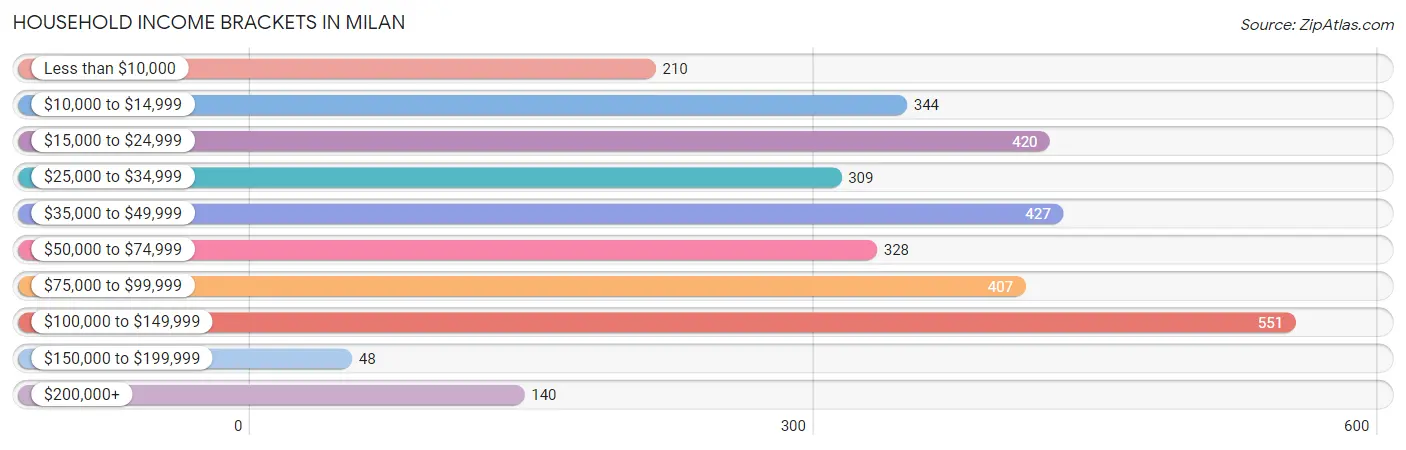
| Income Bracket | # Households | % Households |
| Less than $10,000 | 210 | 6.6% |
| $10,000 to $14,999 | 344 | 10.8% |
| $15,000 to $24,999 | 420 | 13.2% |
| $25,000 to $34,999 | 309 | 9.7% |
| $35,000 to $49,999 | 427 | 13.4% |
| $50,000 to $74,999 | 328 | 10.3% |
| $75,000 to $99,999 | 407 | 12.8% |
| $100,000 to $149,999 | 551 | 17.3% |
| $150,000 to $199,999 | 48 | 1.5% |
| $200,000+ | 140 | 4.4% |
Household Income by Householder Age in Milan
The median household income in Milan is $42,909, with the highest median household income of $62,396 found in the 25 to 44 years age bracket for the primary householder. A total of 1,185 households (37.2%) fall into this category. Meanwhile, the 15 to 24 years age bracket for the primary householder has the lowest median household income of $0, with 68 households (2.1%) in this group.
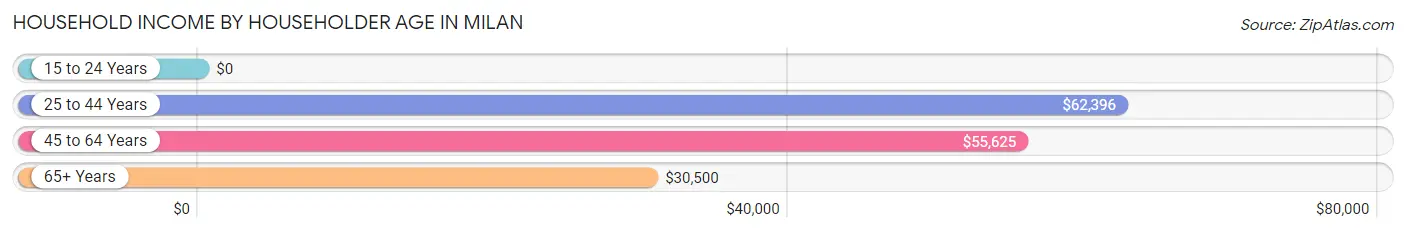
| Income Bracket | # Households | Median Income |
| 15 to 24 Years | 68 (2.1%) | $0 |
| 25 to 44 Years | 1,185 (37.2%) | $62,396 |
| 45 to 64 Years | 1,174 (36.9%) | $55,625 |
| 65+ Years | 756 (23.7%) | $30,500 |
| Total | 3,183 (100.0%) | $42,909 |
Poverty in Milan
Income Below Poverty by Sex and Age in Milan
With 17.1% poverty level for males and 21.4% for females among the residents of Milan, under 5 year old males and 15 year old females are the most vulnerable to poverty, with 142 males (59.4%) and 35 females (66.0%) in their respective age groups living below the poverty level.
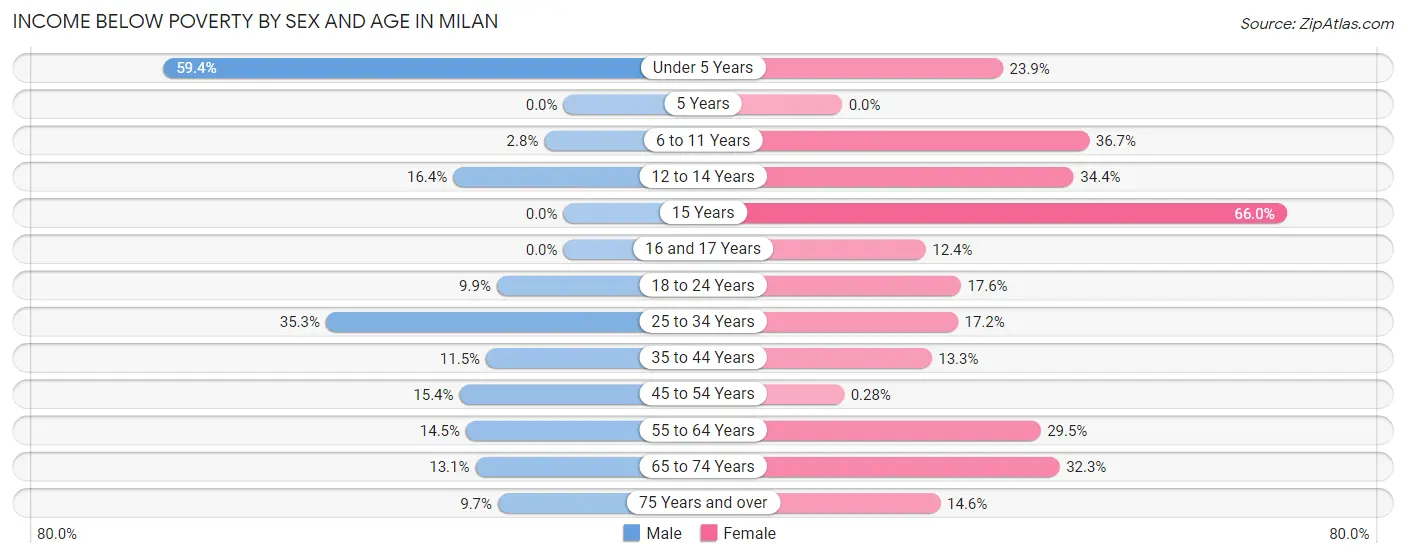
| Age Bracket | Male | Female |
| Under 5 Years | 142 (59.4%) | 48 (23.9%) |
| 5 Years | 0 (0.0%) | 0 (0.0%) |
| 6 to 11 Years | 10 (2.8%) | 135 (36.7%) |
| 12 to 14 Years | 57 (16.4%) | 119 (34.4%) |
| 15 Years | 0 (0.0%) | 35 (66.0%) |
| 16 and 17 Years | 0 (0.0%) | 18 (12.4%) |
| 18 to 24 Years | 28 (9.9%) | 34 (17.6%) |
| 25 to 34 Years | 164 (35.3%) | 77 (17.2%) |
| 35 to 44 Years | 79 (11.5%) | 86 (13.3%) |
| 45 to 54 Years | 61 (15.4%) | 1 (0.3%) |
| 55 to 64 Years | 43 (14.5%) | 198 (29.5%) |
| 65 to 74 Years | 31 (13.1%) | 112 (32.3%) |
| 75 Years and over | 14 (9.7%) | 46 (14.6%) |
| Total | 629 (17.1%) | 909 (21.4%) |
Income Above Poverty by Sex and Age in Milan
According to the poverty statistics in Milan, males aged 5 years and females aged 5 years are the age groups that are most secure financially, with 100.0% of males and 100.0% of females in these age groups living above the poverty line.
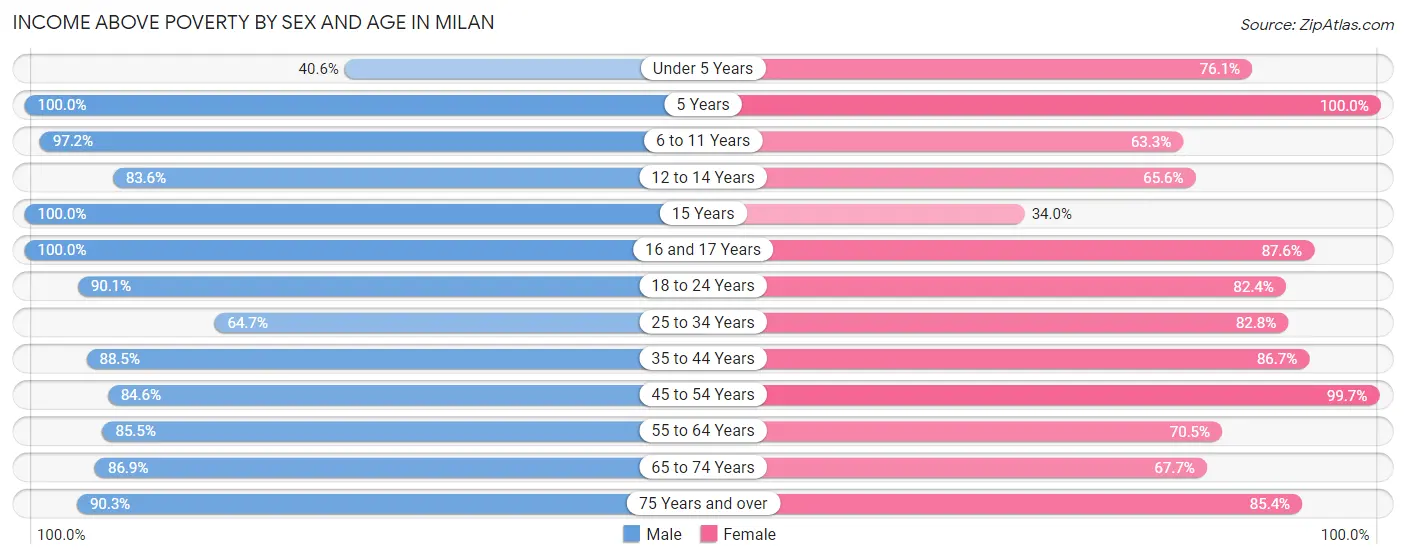
| Age Bracket | Male | Female |
| Under 5 Years | 97 (40.6%) | 153 (76.1%) |
| 5 Years | 12 (100.0%) | 158 (100.0%) |
| 6 to 11 Years | 342 (97.2%) | 233 (63.3%) |
| 12 to 14 Years | 291 (83.6%) | 227 (65.6%) |
| 15 Years | 29 (100.0%) | 18 (34.0%) |
| 16 and 17 Years | 187 (100.0%) | 127 (87.6%) |
| 18 to 24 Years | 255 (90.1%) | 159 (82.4%) |
| 25 to 34 Years | 301 (64.7%) | 371 (82.8%) |
| 35 to 44 Years | 608 (88.5%) | 561 (86.7%) |
| 45 to 54 Years | 334 (84.6%) | 356 (99.7%) |
| 55 to 64 Years | 254 (85.5%) | 474 (70.5%) |
| 65 to 74 Years | 206 (86.9%) | 235 (67.7%) |
| 75 Years and over | 130 (90.3%) | 269 (85.4%) |
| Total | 3,046 (82.9%) | 3,341 (78.6%) |
Income Below Poverty Among Married-Couple Families in Milan
The poverty statistics for married-couple families in Milan show that 9.0% or 119 of the total 1,318 families live below the poverty line. Families with 3 or 4 children have the highest poverty rate of 81.3%, comprising of 109 families. On the other hand, families with no children have the lowest poverty rate of 0.0%, which includes 0 families.
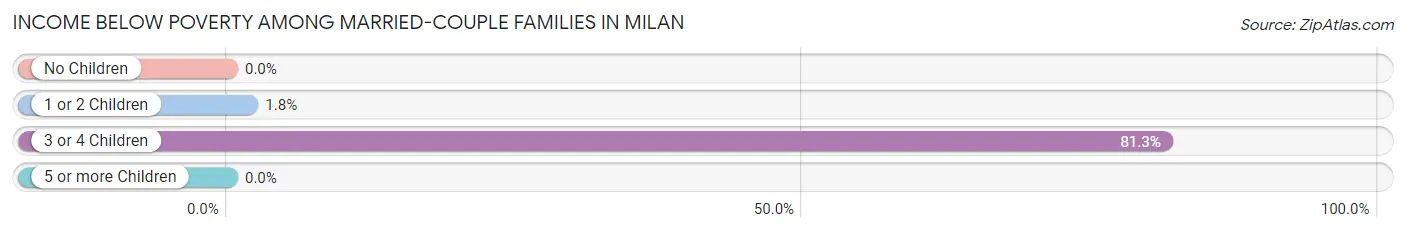
| Children | Above Poverty | Below Poverty |
| No Children | 616 (100.0%) | 0 (0.0%) |
| 1 or 2 Children | 554 (98.2%) | 10 (1.8%) |
| 3 or 4 Children | 25 (18.7%) | 109 (81.3%) |
| 5 or more Children | 4 (100.0%) | 0 (0.0%) |
| Total | 1,199 (91.0%) | 119 (9.0%) |
Income Below Poverty Among Single-Parent Households in Milan
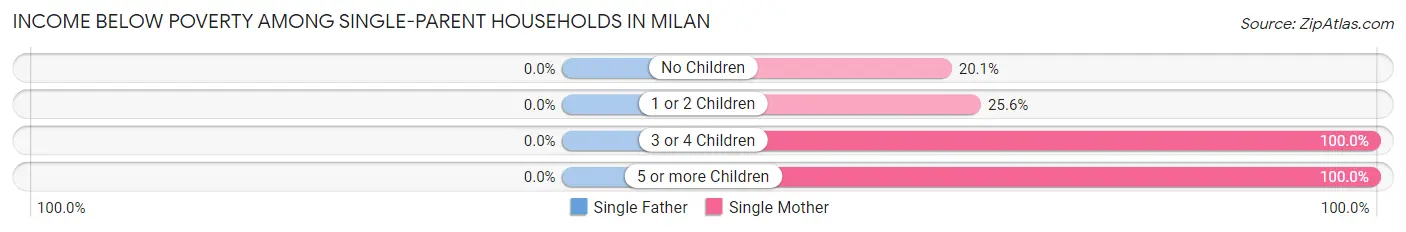
| Children | Single Father | Single Mother |
| No Children | 0 (0.0%) | 29 (20.1%) |
| 1 or 2 Children | 0 (0.0%) | 84 (25.6%) |
| 3 or 4 Children | 0 (0.0%) | 6 (100.0%) |
| 5 or more Children | 0 (0.0%) | 14 (100.0%) |
| Total | 0 (0.0%) | 133 (27.0%) |
Income Below Poverty Among Married-Couple vs Single-Parent Households in Milan
The poverty data for Milan shows that 119 of the married-couple family households (9.0%) and 133 of the single-parent households (21.4%) are living below the poverty level. Within the married-couple family households, those with 3 or 4 children have the highest poverty rate, with 109 households (81.3%) falling below the poverty line. Among the single-parent households, those with 5 or more children have the highest poverty rate, with 14 household (100.0%) living below poverty.
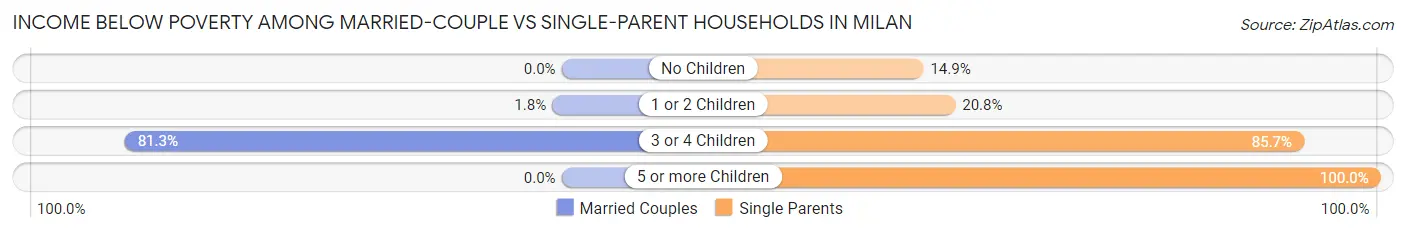
| Children | Married-Couple Families | Single-Parent Households |
| No Children | 0 (0.0%) | 29 (14.9%) |
| 1 or 2 Children | 10 (1.8%) | 84 (20.8%) |
| 3 or 4 Children | 109 (81.3%) | 6 (85.7%) |
| 5 or more Children | 0 (0.0%) | 14 (100.0%) |
| Total | 119 (9.0%) | 133 (21.4%) |
Race in Milan
The most populous races in Milan are White / Caucasian (5,406 | 66.2%), Black / African American (2,082 | 25.5%), and Two or more Races (658 | 8.1%).
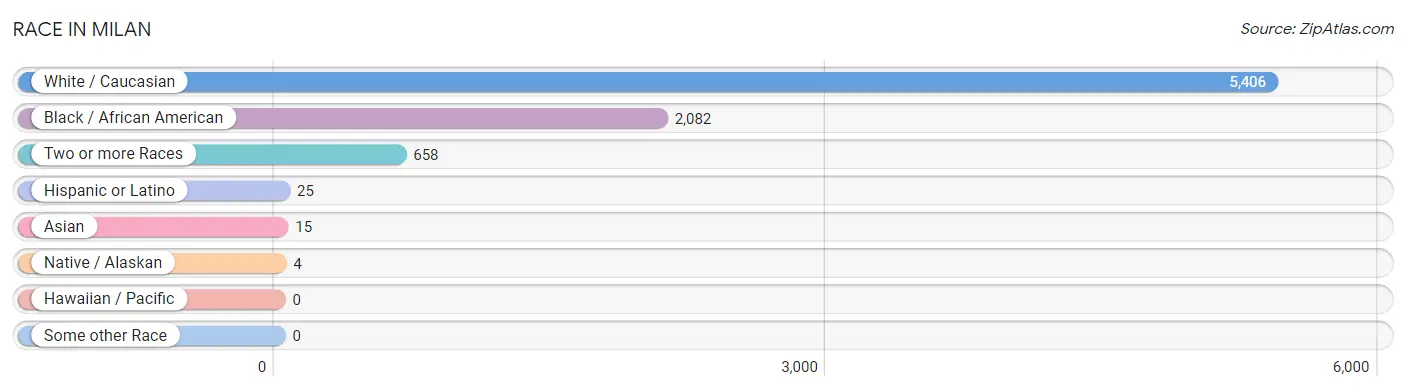
| Race | # Population | % Population |
| Asian | 15 | 0.2% |
| Black / African American | 2,082 | 25.5% |
| Hawaiian / Pacific | 0 | 0.0% |
| Hispanic or Latino | 25 | 0.3% |
| Native / Alaskan | 4 | 0.1% |
| White / Caucasian | 5,406 | 66.2% |
| Two or more Races | 658 | 8.1% |
| Some other Race | 0 | 0.0% |
| Total | 8,165 | 100.0% |
Ancestry in Milan
The most populous ancestries reported in Milan are English (1,019 | 12.5%), American (731 | 8.9%), Irish (630 | 7.7%), German (601 | 7.4%), and Italian (156 | 1.9%), together accounting for 38.4% of all Milan residents.
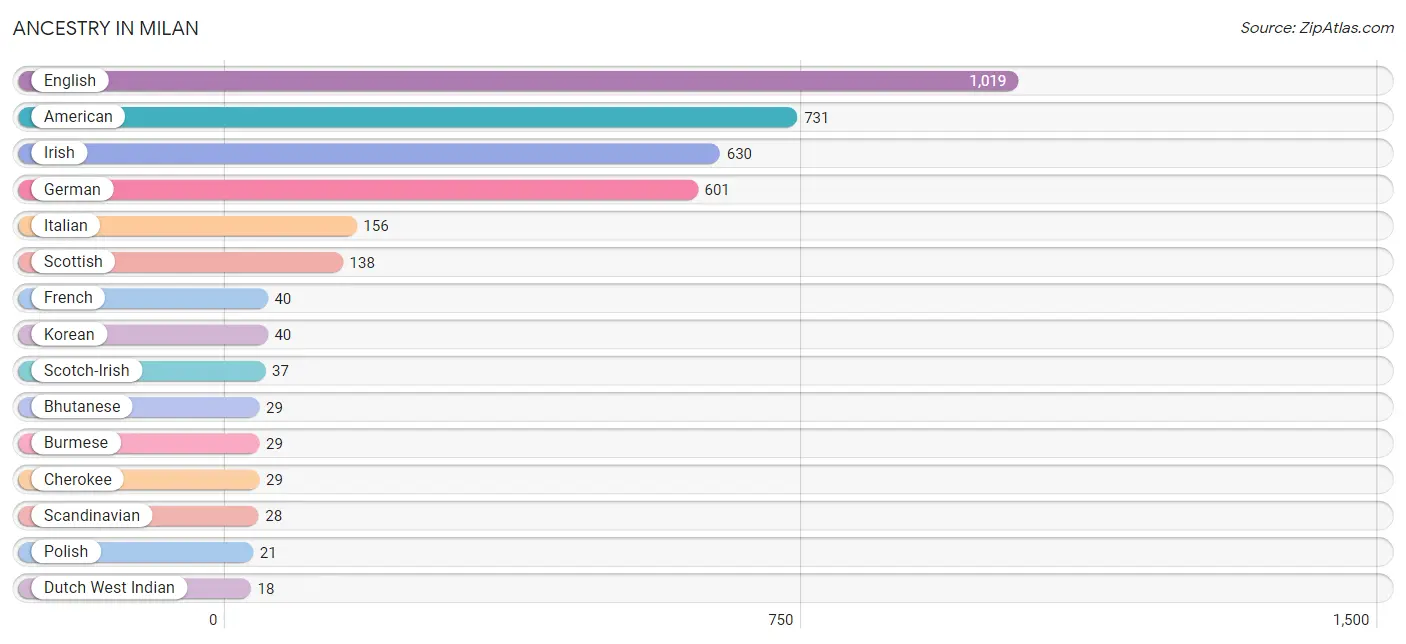
| Ancestry | # Population | % Population |
| American | 731 | 8.9% |
| Apache | 11 | 0.1% |
| Bhutanese | 29 | 0.4% |
| Blackfeet | 15 | 0.2% |
| Burmese | 29 | 0.4% |
| Central American | 2 | 0.0% |
| Cherokee | 29 | 0.4% |
| Dutch | 3 | 0.0% |
| Dutch West Indian | 18 | 0.2% |
| English | 1,019 | 12.5% |
| French | 40 | 0.5% |
| German | 601 | 7.4% |
| Honduran | 2 | 0.0% |
| Indian (Asian) | 15 | 0.2% |
| Irish | 630 | 7.7% |
| Italian | 156 | 1.9% |
| Korean | 40 | 0.5% |
| Mexican | 17 | 0.2% |
| Polish | 21 | 0.3% |
| Puerto Rican | 6 | 0.1% |
| Scandinavian | 28 | 0.3% |
| Scotch-Irish | 37 | 0.4% |
| Scottish | 138 | 1.7% |
| Serbian | 7 | 0.1% |
| Welsh | 18 | 0.2% | View All 25 Rows |
Immigrants in Milan
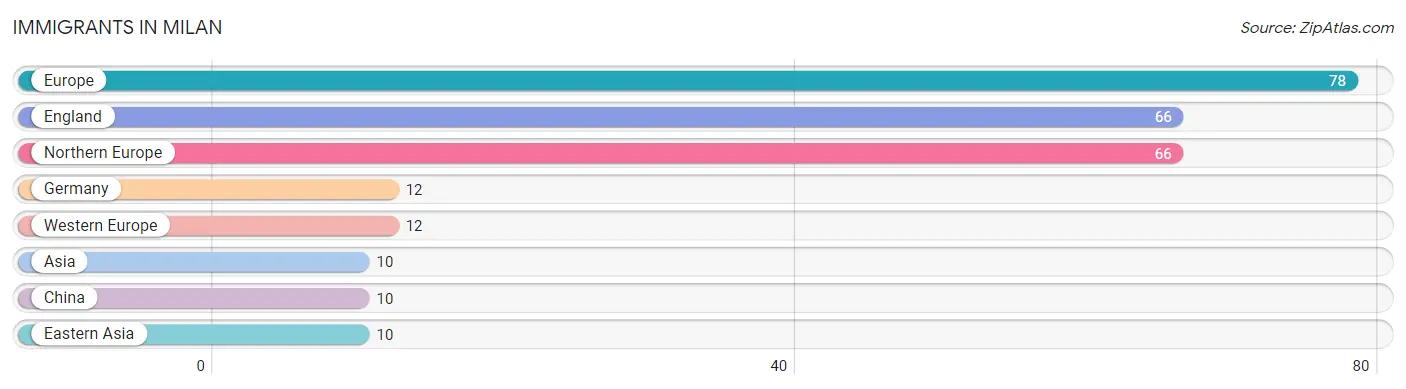
The most numerous immigrant groups reported in Milan came from Europe (78 | 1.0%), England (66 | 0.8%), Northern Europe (66 | 0.8%), Germany (12 | 0.2%), and Western Europe (12 | 0.2%), together accounting for 2.9% of all Milan residents.
| Immigration Origin | # Population | % Population |
| Asia | 10 | 0.1% |
| China | 10 | 0.1% |
| Eastern Asia | 10 | 0.1% |
| England | 66 | 0.8% |
| Europe | 78 | 1.0% |
| Germany | 12 | 0.2% |
| Northern Europe | 66 | 0.8% |
| Western Europe | 12 | 0.2% | View All 8 Rows |
Sex and Age in Milan
Sex and Age in Milan
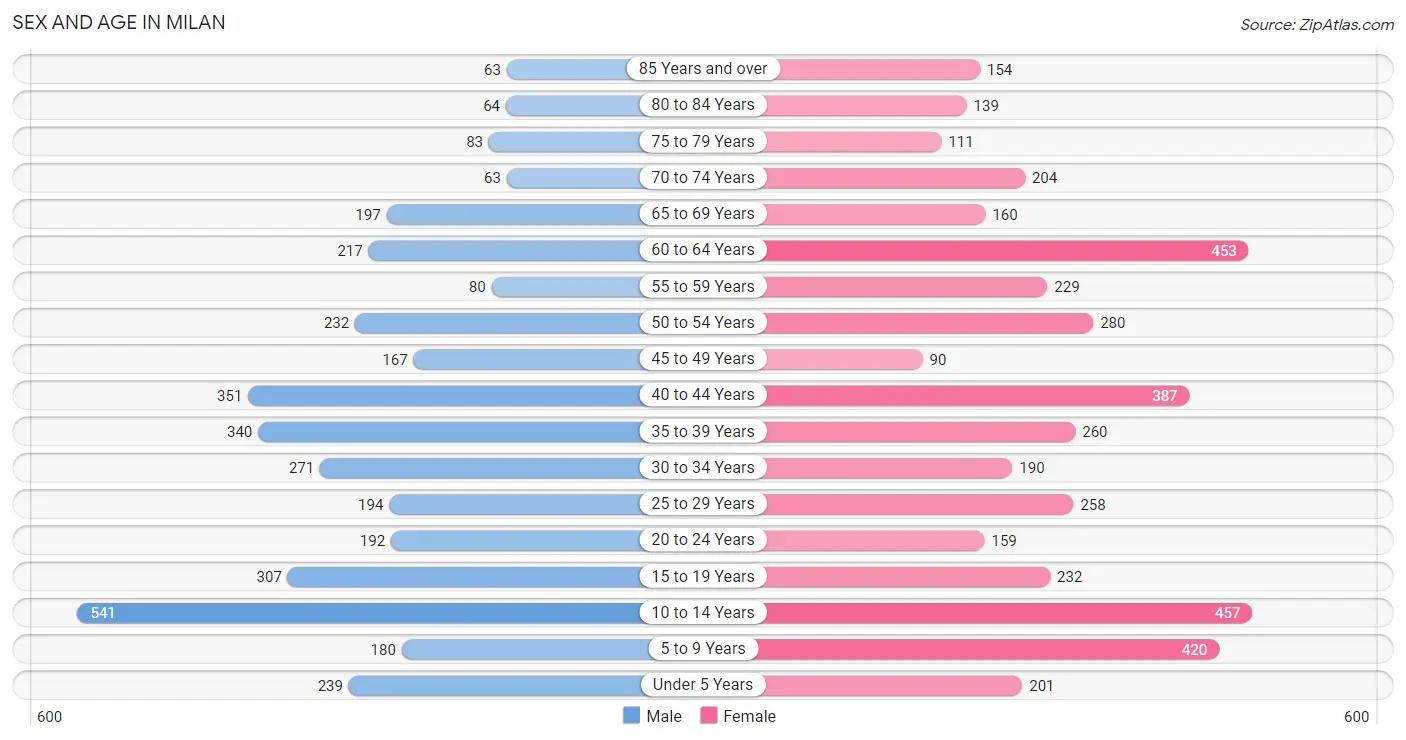
The most populous age groups in Milan are 10 to 14 Years (541 | 14.3%) for men and 10 to 14 Years (457 | 10.4%) for women.
| Age Bracket | Male | Female |
| Under 5 Years | 239 (6.3%) | 201 (4.6%) |
| 5 to 9 Years | 180 (4.8%) | 420 (9.6%) |
| 10 to 14 Years | 541 (14.3%) | 457 (10.4%) |
| 15 to 19 Years | 307 (8.1%) | 232 (5.3%) |
| 20 to 24 Years | 192 (5.1%) | 159 (3.6%) |
| 25 to 29 Years | 194 (5.1%) | 258 (5.9%) |
| 30 to 34 Years | 271 (7.2%) | 190 (4.3%) |
| 35 to 39 Years | 340 (9.0%) | 260 (5.9%) |
| 40 to 44 Years | 351 (9.3%) | 387 (8.8%) |
| 45 to 49 Years | 167 (4.4%) | 90 (2.1%) |
| 50 to 54 Years | 232 (6.1%) | 280 (6.4%) |
| 55 to 59 Years | 80 (2.1%) | 229 (5.2%) |
| 60 to 64 Years | 217 (5.7%) | 453 (10.3%) |
| 65 to 69 Years | 197 (5.2%) | 160 (3.6%) |
| 70 to 74 Years | 63 (1.7%) | 204 (4.6%) |
| 75 to 79 Years | 83 (2.2%) | 111 (2.5%) |
| 80 to 84 Years | 64 (1.7%) | 139 (3.2%) |
| 85 Years and over | 63 (1.7%) | 154 (3.5%) |
| Total | 3,781 (100.0%) | 4,384 (100.0%) |
Families and Households in Milan
Median Family Size in Milan
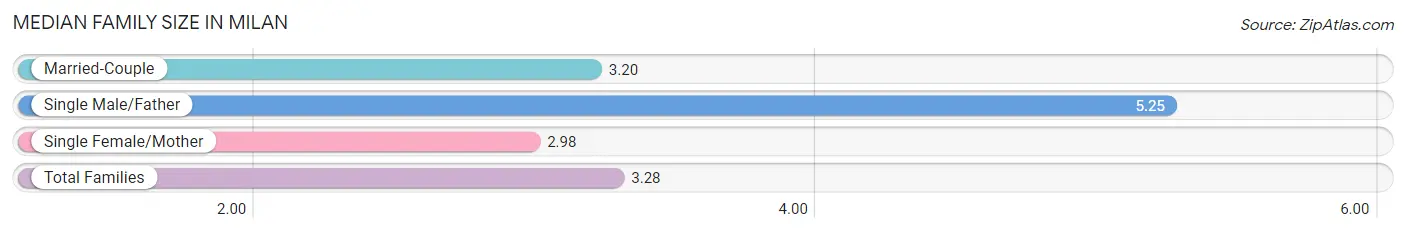
The median family size in Milan is 3.28 persons per family, with single male/father families (128 | 6.6%) accounting for the largest median family size of 5.25 persons per family. On the other hand, single female/mother families (492 | 25.4%) represent the smallest median family size with 2.98 persons per family.
| Family Type | # Families | Family Size |
| Married-Couple | 1,318 (68.0%) | 3.20 |
| Single Male/Father | 128 (6.6%) | 5.25 |
| Single Female/Mother | 492 (25.4%) | 2.98 |
| Total Families | 1,938 (100.0%) | 3.28 |
Median Household Size in Milan
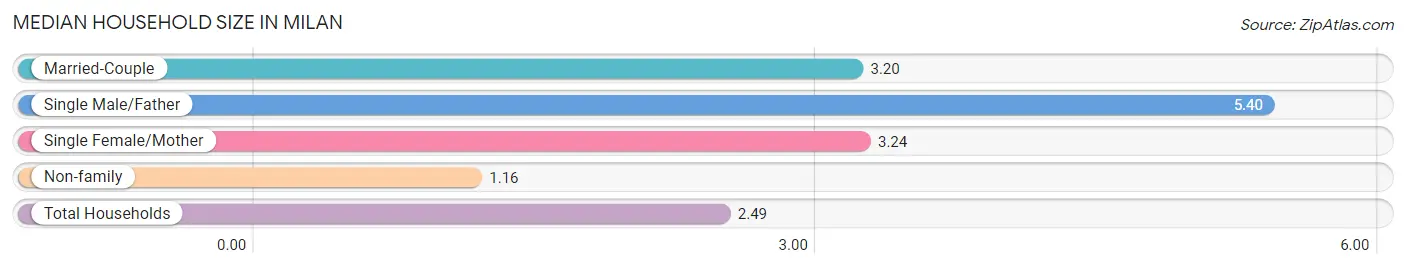
The median household size in Milan is 2.49 persons per household, with single male/father households (128 | 4.0%) accounting for the largest median household size of 5.4 persons per household. non-family households (1,245 | 39.1%) represent the smallest median household size with 1.16 persons per household.
| Household Type | # Households | Household Size |
| Married-Couple | 1,318 (41.4%) | 3.20 |
| Single Male/Father | 128 (4.0%) | 5.40 |
| Single Female/Mother | 492 (15.5%) | 3.24 |
| Non-family | 1,245 (39.1%) | 1.16 |
| Total Households | 3,183 (100.0%) | 2.49 |
Household Size by Marriage Status in Milan
Out of a total of 3,183 households in Milan, 1,938 (60.9%) are family households, while 1,245 (39.1%) are nonfamily households. The most numerous type of family households are 2-person households, comprising 738, and the most common type of nonfamily households are 1-person households, comprising 1,095.
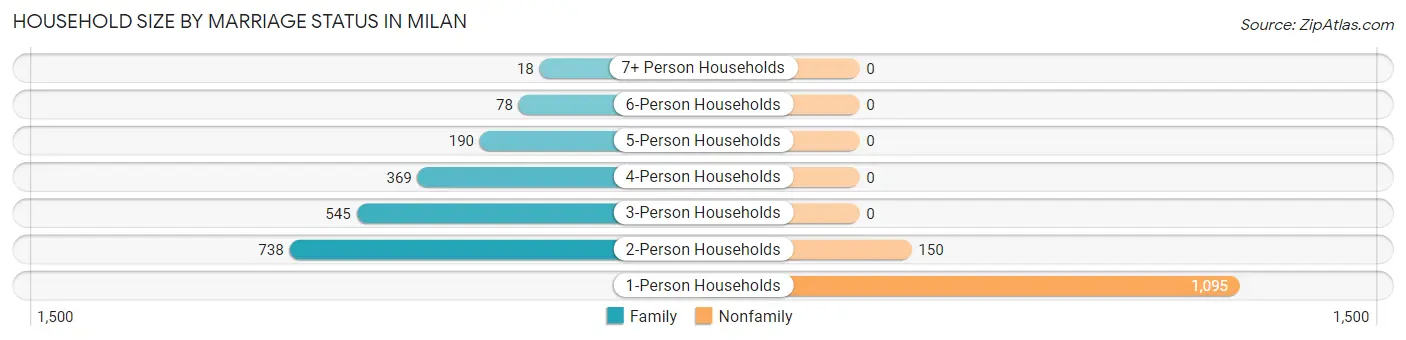
| Household Size | Family Households | Nonfamily Households |
| 1-Person Households | - | 1,095 (34.4%) |
| 2-Person Households | 738 (23.2%) | 150 (4.7%) |
| 3-Person Households | 545 (17.1%) | 0 (0.0%) |
| 4-Person Households | 369 (11.6%) | 0 (0.0%) |
| 5-Person Households | 190 (6.0%) | 0 (0.0%) |
| 6-Person Households | 78 (2.5%) | 0 (0.0%) |
| 7+ Person Households | 18 (0.6%) | 0 (0.0%) |
| Total | 1,938 (60.9%) | 1,245 (39.1%) |
Female Fertility in Milan
Fertility by Age in Milan
Average fertility rate in Milan is 42.0 births per 1,000 women. Women in the age bracket of 20 to 34 years have the highest fertility rate with 107.0 births per 1,000 women. Women in the age bracket of 20 to 34 years acount for 92.9% of all women with births.
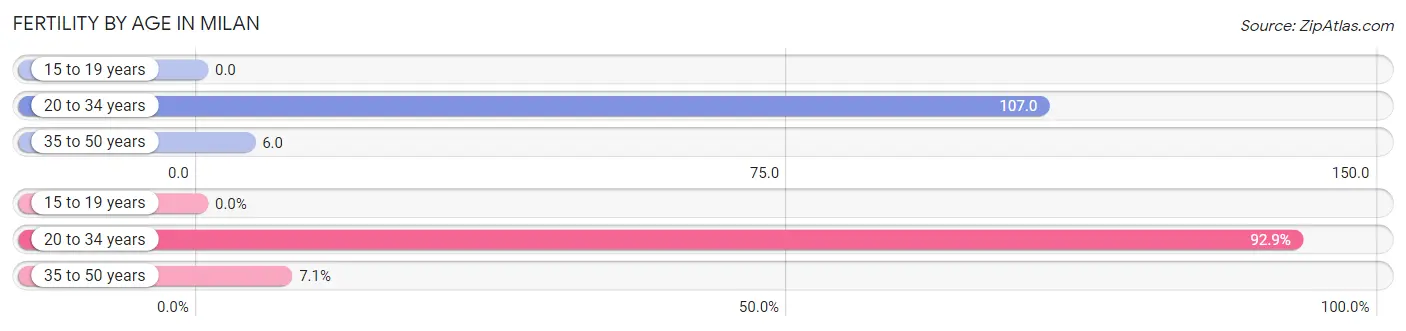
| Age Bracket | Women with Births | Births / 1,000 Women |
| 15 to 19 years | 0 (0.0%) | 0.0 |
| 20 to 34 years | 65 (92.9%) | 107.0 |
| 35 to 50 years | 5 (7.1%) | 6.0 |
| Total | 70 (100.0%) | 42.0 |
Fertility by Age by Marriage Status in Milan
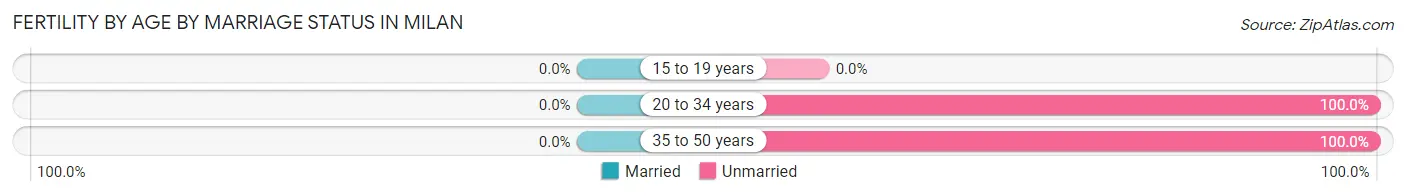
| Age Bracket | Married | Unmarried |
| 15 to 19 years | 0 (0.0%) | 0 (0.0%) |
| 20 to 34 years | 0 (0.0%) | 65 (100.0%) |
| 35 to 50 years | 0 (0.0%) | 5 (100.0%) |
| Total | 0 (0.0%) | 70 (100.0%) |
Fertility by Education in Milan
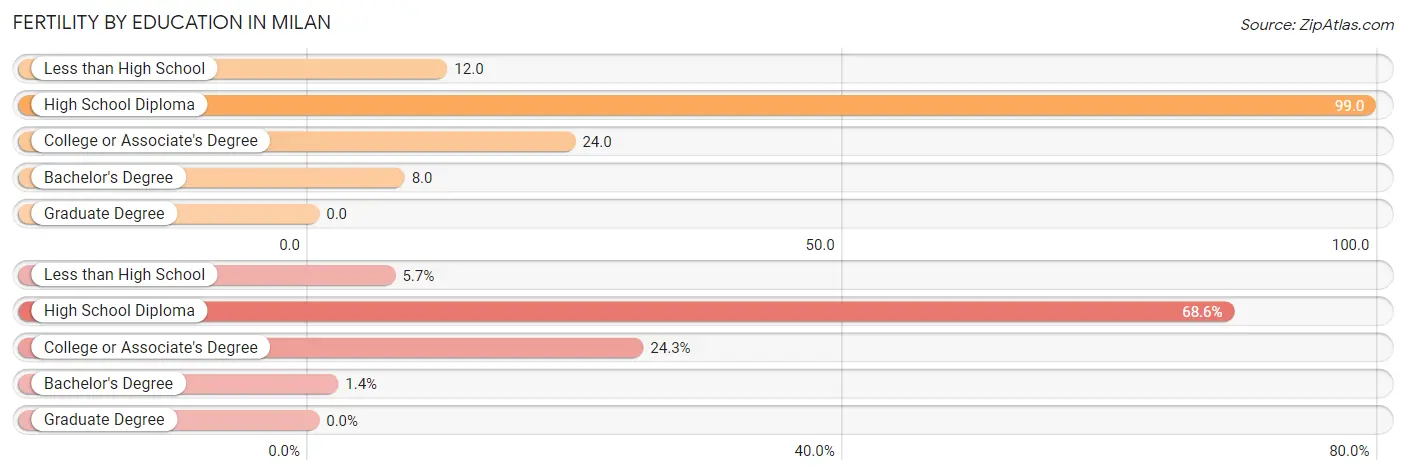
| Educational Attainment | Women with Births | Births / 1,000 Women |
| Less than High School | 4 (5.7%) | 12.0 |
| High School Diploma | 48 (68.6%) | 99.0 |
| College or Associate's Degree | 17 (24.3%) | 24.0 |
| Bachelor's Degree | 1 (1.4%) | 8.0 |
| Graduate Degree | 0 (0.0%) | 0.0 |
| Total | 70 (100.0%) | 42.0 |
Fertility by Education by Marriage Status in Milan
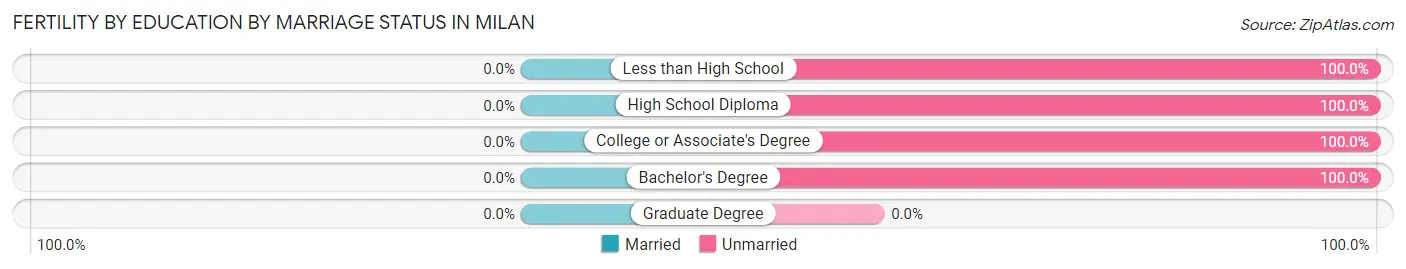
| Educational Attainment | Married | Unmarried |
| Less than High School | 0 (0.0%) | 4 (100.0%) |
| High School Diploma | 0 (0.0%) | 48 (100.0%) |
| College or Associate's Degree | 0 (0.0%) | 17 (100.0%) |
| Bachelor's Degree | 0 (0.0%) | 1 (100.0%) |
| Graduate Degree | 0 (0.0%) | 0 (0.0%) |
| Total | 0 (0.0%) | 70 (100.0%) |
Employment Characteristics in Milan
Employment by Class of Employer in Milan
Among the 3,089 employed individuals in Milan, private company employees (2,001 | 64.8%), local government employees (385 | 12.5%), and self-employed (incorporated) (249 | 8.1%) make up the most common classes of employment.
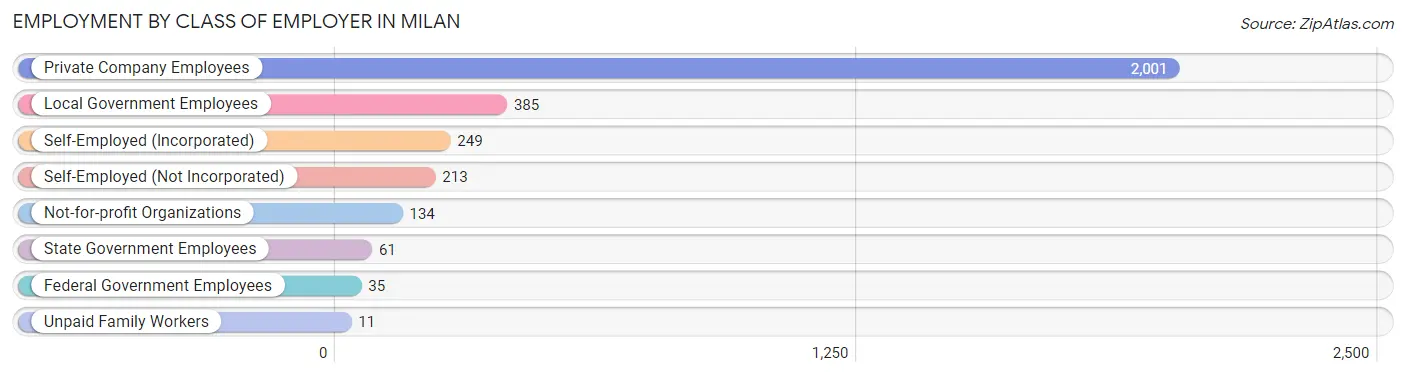
| Employer Class | # Employees | % Employees |
| Private Company Employees | 2,001 | 64.8% |
| Self-Employed (Incorporated) | 249 | 8.1% |
| Self-Employed (Not Incorporated) | 213 | 6.9% |
| Not-for-profit Organizations | 134 | 4.3% |
| Local Government Employees | 385 | 12.5% |
| State Government Employees | 61 | 2.0% |
| Federal Government Employees | 35 | 1.1% |
| Unpaid Family Workers | 11 | 0.4% |
| Total | 3,089 | 100.0% |
Employment Status by Age in Milan
According to the labor force statistics for Milan, out of the total population over 16 years of age (6,045), 57.3% or 3,464 individuals are in the labor force, with 4.9% or 170 of them unemployed. The age group with the highest labor force participation rate is 35 to 44 years, with 86.2% or 1,153 individuals in the labor force. Within the labor force, the 25 to 29 years age range has the highest percentage of unemployed individuals, with 34.1% or 121 of them being unemployed.
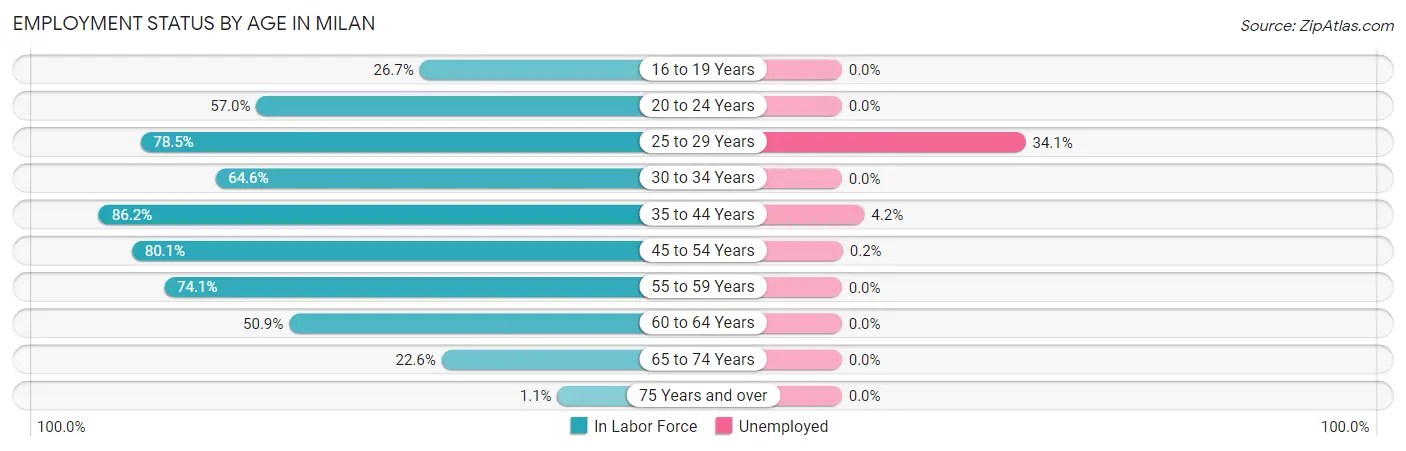
| Age Bracket | In Labor Force | Unemployed |
| 16 to 19 Years | 122 (26.7%) | 0 (0.0%) |
| 20 to 24 Years | 200 (57.0%) | 0 (0.0%) |
| 25 to 29 Years | 355 (78.5%) | 121 (34.1%) |
| 30 to 34 Years | 298 (64.6%) | 0 (0.0%) |
| 35 to 44 Years | 1,153 (86.2%) | 48 (4.2%) |
| 45 to 54 Years | 616 (80.1%) | 1 (0.2%) |
| 55 to 59 Years | 229 (74.1%) | 0 (0.0%) |
| 60 to 64 Years | 341 (50.9%) | 0 (0.0%) |
| 65 to 74 Years | 141 (22.6%) | 0 (0.0%) |
| 75 Years and over | 7 (1.1%) | 0 (0.0%) |
| Total | 3,464 (57.3%) | 170 (4.9%) |
Employment Status by Educational Attainment in Milan
According to labor force statistics for Milan, 74.8% of individuals (2,991) out of the total population between 25 and 64 years of age (3,999) are in the labor force, with 5.7% or 170 of them being unemployed. The group with the highest labor force participation rate are those with the educational attainment of bachelor's degree or higher, with 88.7% or 528 individuals in the labor force. Within the labor force, individuals with less than high school education have the highest percentage of unemployment, with 29.0% or 54 of them being unemployed.
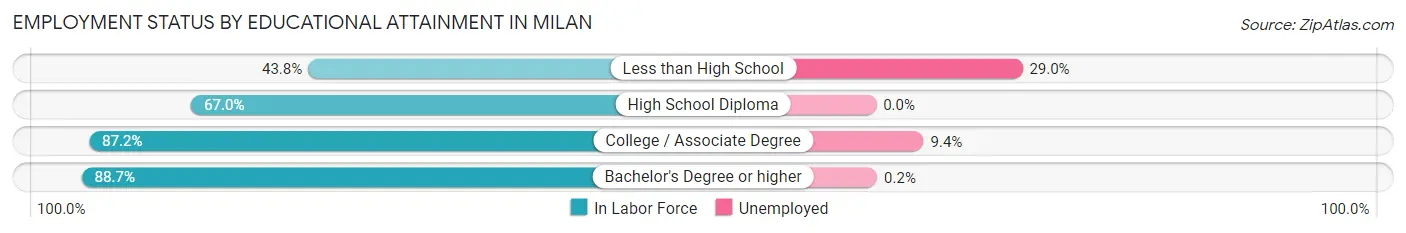
| Educational Attainment | In Labor Force | Unemployed |
| Less than High School | 186 (43.8%) | 123 (29.0%) |
| High School Diploma | 1,061 (67.0%) | 0 (0.0%) |
| College / Associate Degree | 1,217 (87.2%) | 131 (9.4%) |
| Bachelor's Degree or higher | 528 (88.7%) | 1 (0.2%) |
| Total | 2,991 (74.8%) | 228 (5.7%) |
Employment Occupations by Sex in Milan
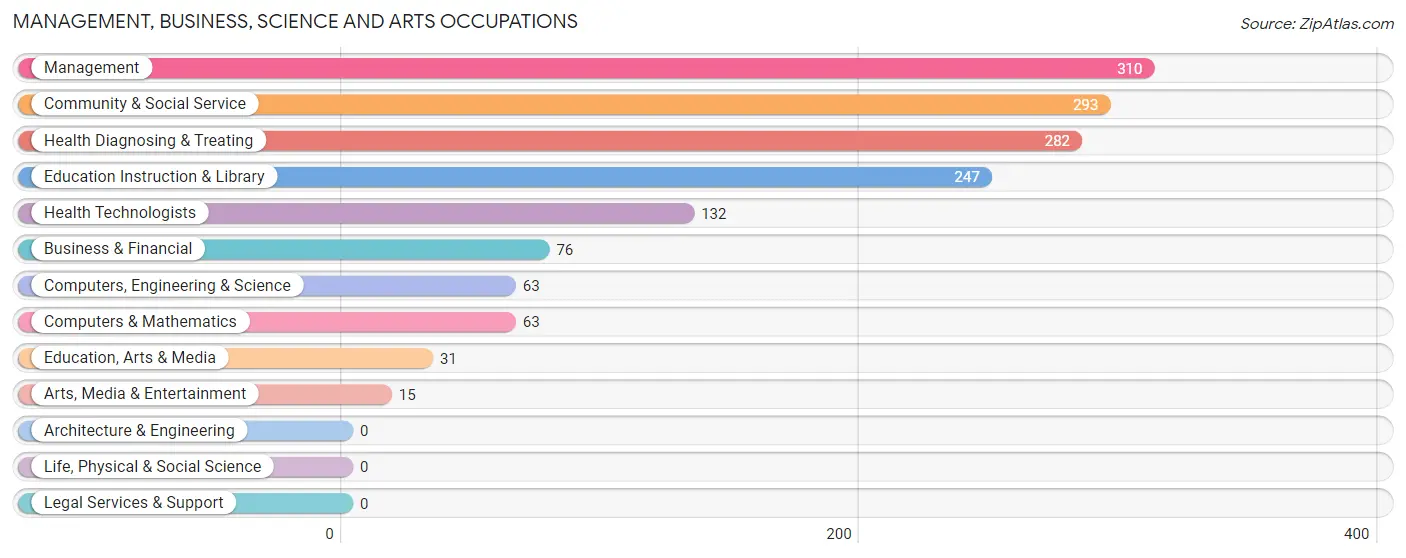
Management, Business, Science and Arts Occupations
The most common Management, Business, Science and Arts occupations in Milan are Management (310 | 9.4%), Community & Social Service (293 | 8.9%), Health Diagnosing & Treating (282 | 8.6%), Education Instruction & Library (247 | 7.5%), and Health Technologists (132 | 4.0%).
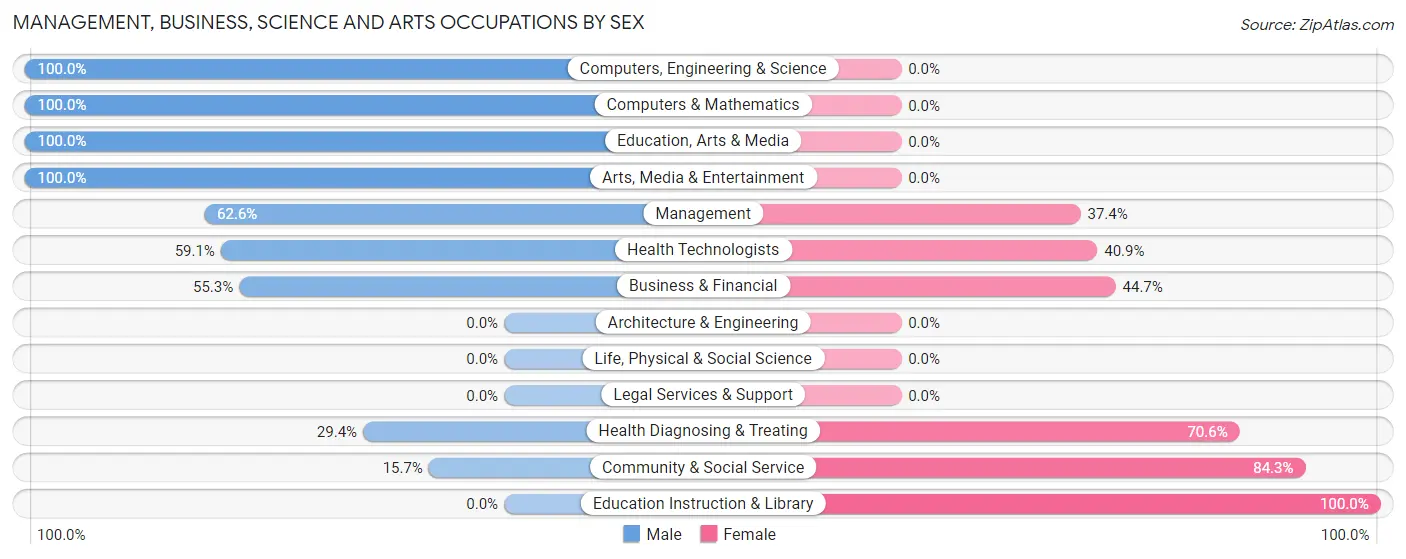
Management, Business, Science and Arts Occupations by Sex
Within the Management, Business, Science and Arts occupations in Milan, the most male-oriented occupations are Computers, Engineering & Science (100.0%), Computers & Mathematics (100.0%), and Education, Arts & Media (100.0%), while the most female-oriented occupations are Education Instruction & Library (100.0%), Community & Social Service (84.3%), and Health Diagnosing & Treating (70.6%).
| Occupation | Male | Female |
| Management | 194 (62.6%) | 116 (37.4%) |
| Business & Financial | 42 (55.3%) | 34 (44.7%) |
| Computers, Engineering & Science | 63 (100.0%) | 0 (0.0%) |
| Computers & Mathematics | 63 (100.0%) | 0 (0.0%) |
| Architecture & Engineering | 0 (0.0%) | 0 (0.0%) |
| Life, Physical & Social Science | 0 (0.0%) | 0 (0.0%) |
| Community & Social Service | 46 (15.7%) | 247 (84.3%) |
| Education, Arts & Media | 31 (100.0%) | 0 (0.0%) |
| Legal Services & Support | 0 (0.0%) | 0 (0.0%) |
| Education Instruction & Library | 0 (0.0%) | 247 (100.0%) |
| Arts, Media & Entertainment | 15 (100.0%) | 0 (0.0%) |
| Health Diagnosing & Treating | 83 (29.4%) | 199 (70.6%) |
| Health Technologists | 78 (59.1%) | 54 (40.9%) |
| Total (Category) | 428 (41.8%) | 596 (58.2%) |
| Total (Overall) | 1,745 (53.0%) | 1,548 (47.0%) |
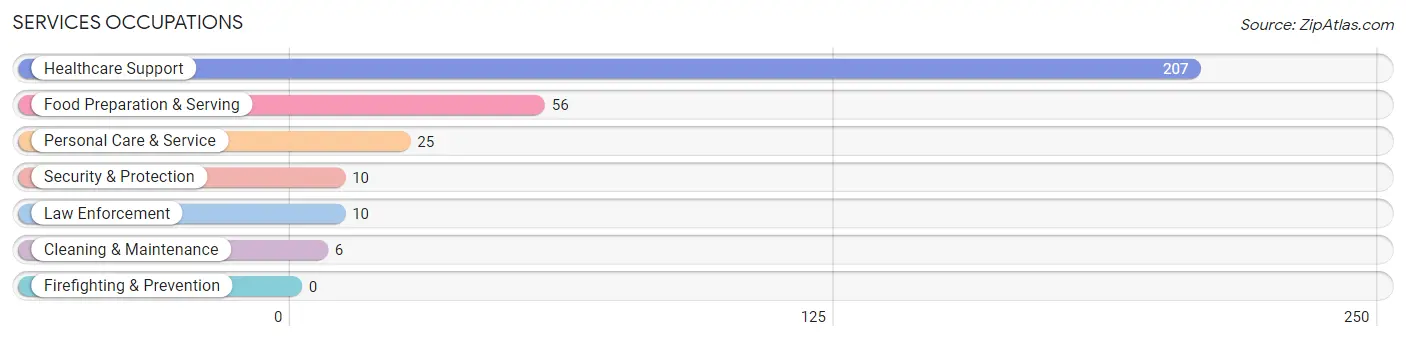
Services Occupations
The most common Services occupations in Milan are Healthcare Support (207 | 6.3%), Food Preparation & Serving (56 | 1.7%), Personal Care & Service (25 | 0.8%), Security & Protection (10 | 0.3%), and Law Enforcement (10 | 0.3%).
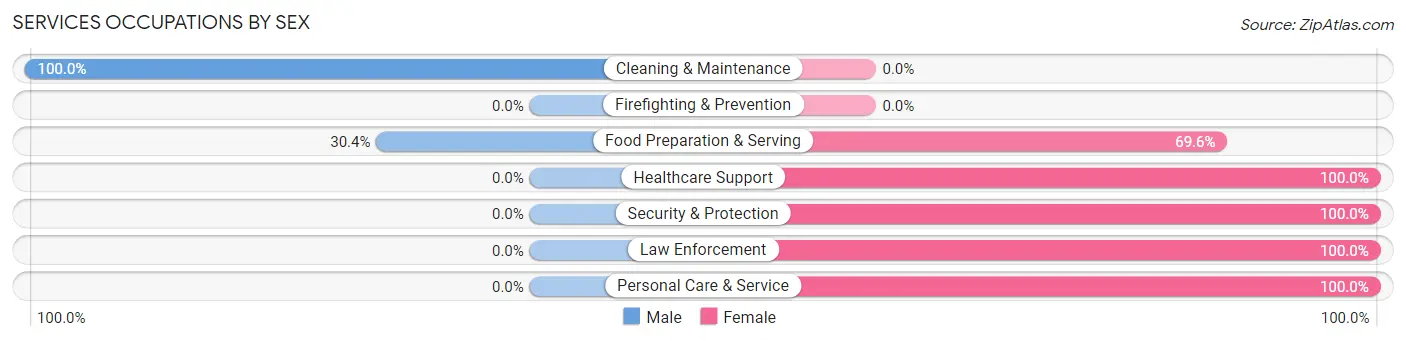
Services Occupations by Sex
Within the Services occupations in Milan, the most male-oriented occupations are Cleaning & Maintenance (100.0%), and Food Preparation & Serving (30.4%), while the most female-oriented occupations are Healthcare Support (100.0%), Security & Protection (100.0%), and Law Enforcement (100.0%).
| Occupation | Male | Female |
| Healthcare Support | 0 (0.0%) | 207 (100.0%) |
| Security & Protection | 0 (0.0%) | 10 (100.0%) |
| Firefighting & Prevention | 0 (0.0%) | 0 (0.0%) |
| Law Enforcement | 0 (0.0%) | 10 (100.0%) |
| Food Preparation & Serving | 17 (30.4%) | 39 (69.6%) |
| Cleaning & Maintenance | 6 (100.0%) | 0 (0.0%) |
| Personal Care & Service | 0 (0.0%) | 25 (100.0%) |
| Total (Category) | 23 (7.6%) | 281 (92.4%) |
| Total (Overall) | 1,745 (53.0%) | 1,548 (47.0%) |
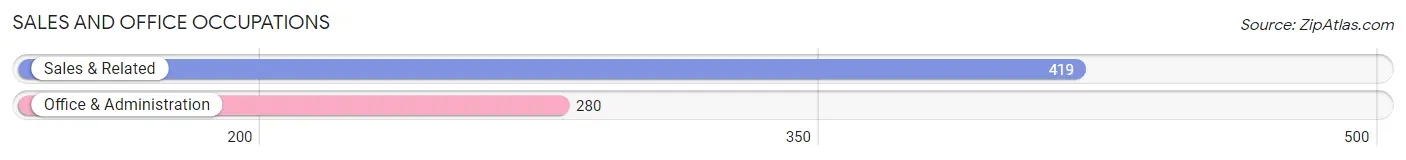
Sales and Office Occupations
The most common Sales and Office occupations in Milan are Sales & Related (419 | 12.7%), and Office & Administration (280 | 8.5%).
Sales and Office Occupations by Sex

| Occupation | Male | Female |
| Sales & Related | 245 (58.5%) | 174 (41.5%) |
| Office & Administration | 34 (12.1%) | 246 (87.9%) |
| Total (Category) | 279 (39.9%) | 420 (60.1%) |
| Total (Overall) | 1,745 (53.0%) | 1,548 (47.0%) |
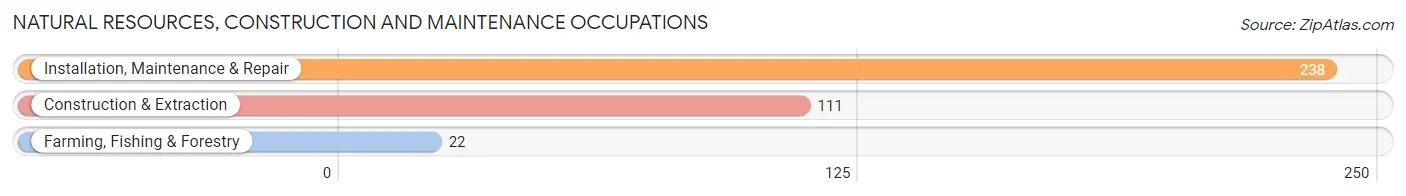
Natural Resources, Construction and Maintenance Occupations
The most common Natural Resources, Construction and Maintenance occupations in Milan are Installation, Maintenance & Repair (238 | 7.2%), Construction & Extraction (111 | 3.4%), and Farming, Fishing & Forestry (22 | 0.7%).
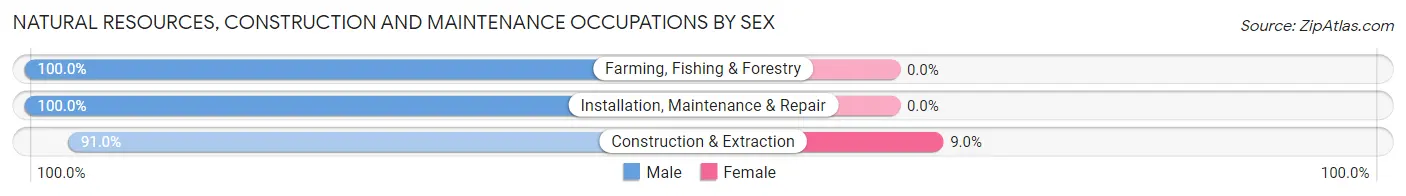
Natural Resources, Construction and Maintenance Occupations by Sex
| Occupation | Male | Female |
| Farming, Fishing & Forestry | 22 (100.0%) | 0 (0.0%) |
| Construction & Extraction | 101 (91.0%) | 10 (9.0%) |
| Installation, Maintenance & Repair | 238 (100.0%) | 0 (0.0%) |
| Total (Category) | 361 (97.3%) | 10 (2.7%) |
| Total (Overall) | 1,745 (53.0%) | 1,548 (47.0%) |
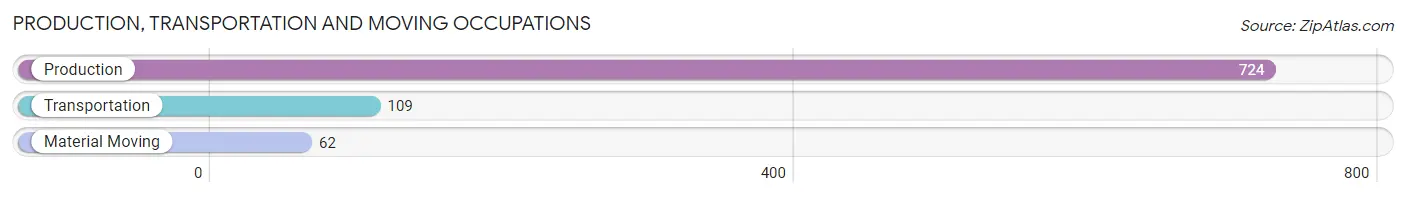
Production, Transportation and Moving Occupations
The most common Production, Transportation and Moving occupations in Milan are Production (724 | 22.0%), Transportation (109 | 3.3%), and Material Moving (62 | 1.9%).
Production, Transportation and Moving Occupations by Sex
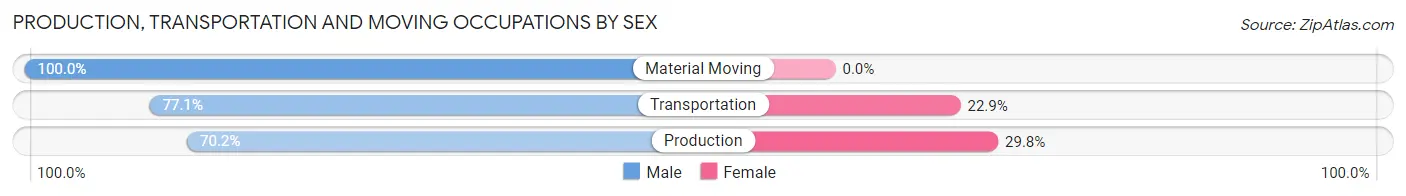
| Occupation | Male | Female |
| Production | 508 (70.2%) | 216 (29.8%) |
| Transportation | 84 (77.1%) | 25 (22.9%) |
| Material Moving | 62 (100.0%) | 0 (0.0%) |
| Total (Category) | 654 (73.1%) | 241 (26.9%) |
| Total (Overall) | 1,745 (53.0%) | 1,548 (47.0%) |
Employment Industries by Sex in Milan
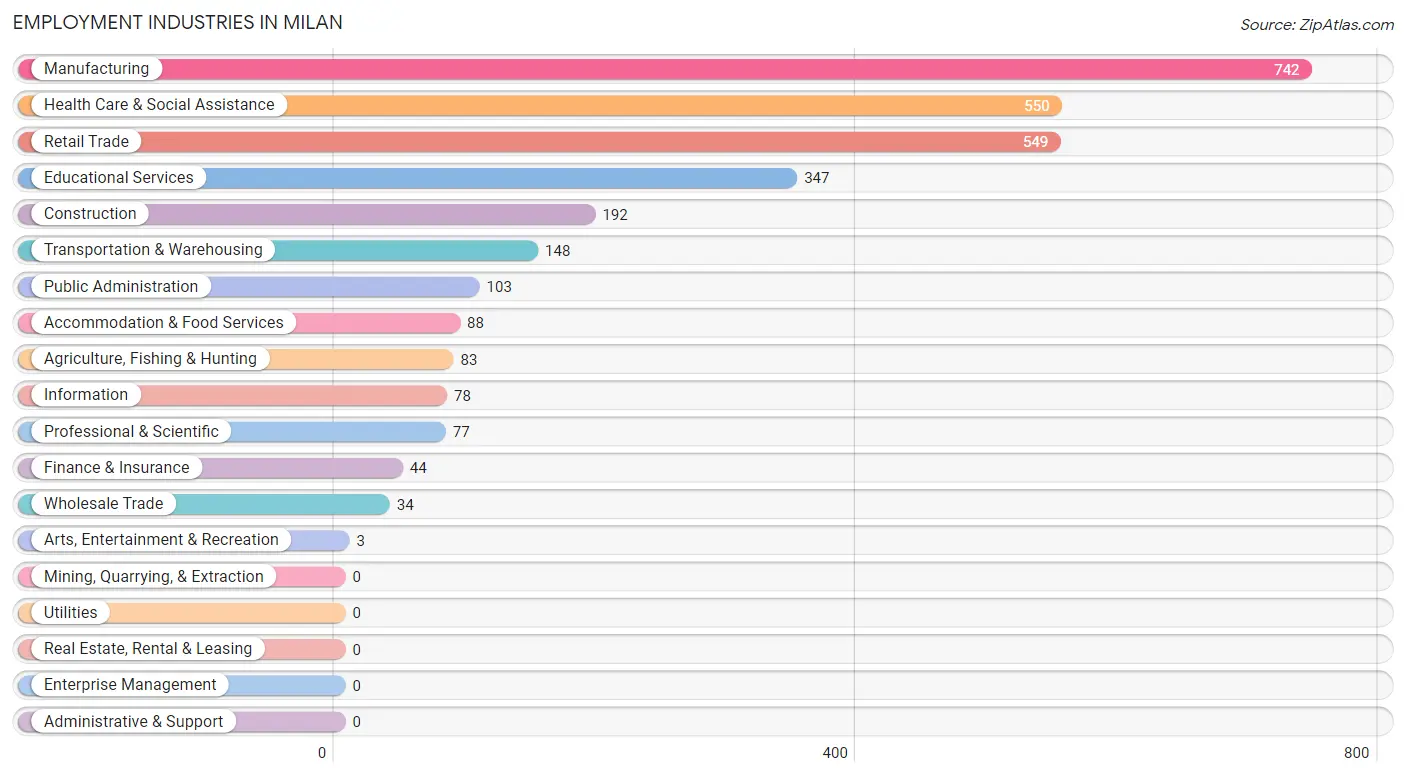
Employment Industries in Milan
The major employment industries in Milan include Manufacturing (742 | 22.5%), Health Care & Social Assistance (550 | 16.7%), Retail Trade (549 | 16.7%), Educational Services (347 | 10.5%), and Construction (192 | 5.8%).
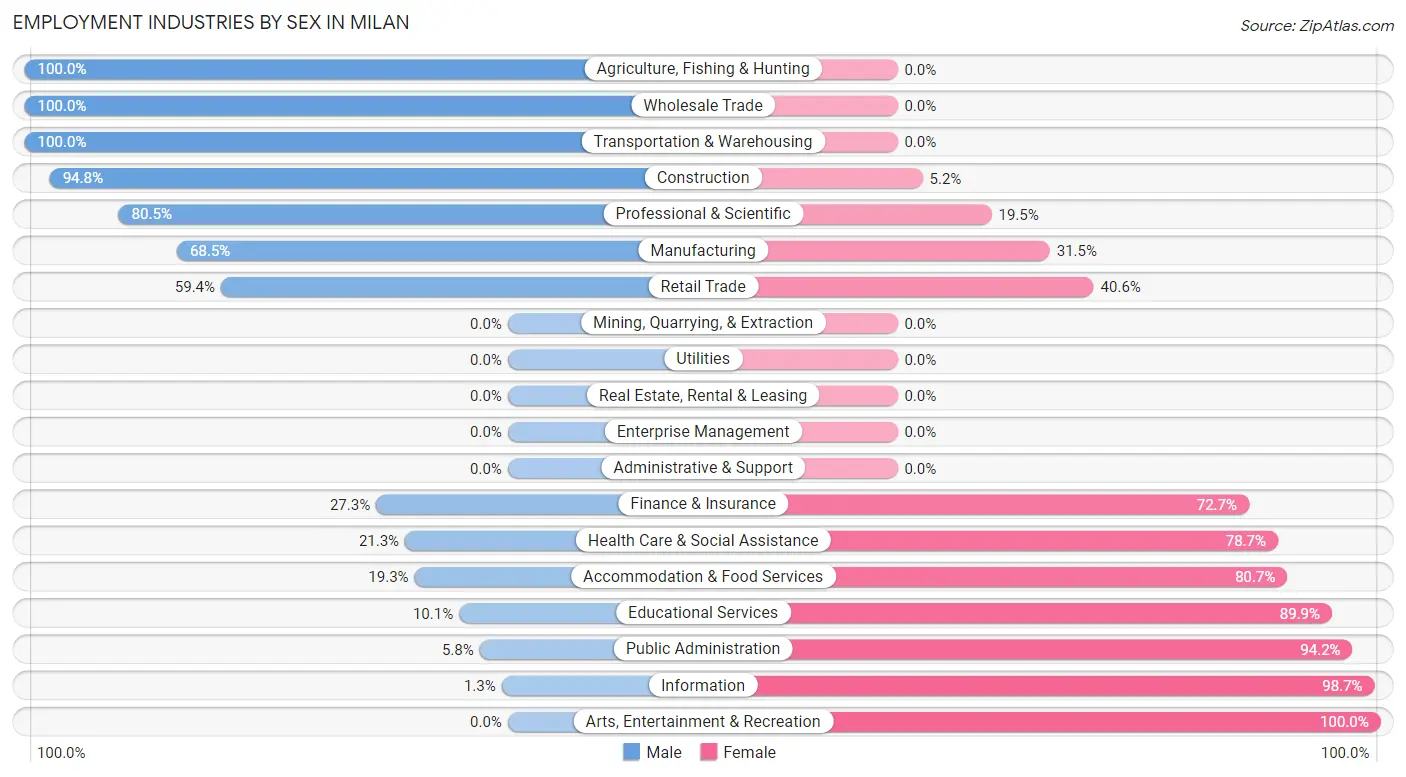
Employment Industries by Sex in Milan
The Milan industries that see more men than women are Agriculture, Fishing & Hunting (100.0%), Wholesale Trade (100.0%), and Transportation & Warehousing (100.0%), whereas the industries that tend to have a higher number of women are Arts, Entertainment & Recreation (100.0%), Information (98.7%), and Public Administration (94.2%).
| Industry | Male | Female |
| Agriculture, Fishing & Hunting | 83 (100.0%) | 0 (0.0%) |
| Mining, Quarrying, & Extraction | 0 (0.0%) | 0 (0.0%) |
| Construction | 182 (94.8%) | 10 (5.2%) |
| Manufacturing | 508 (68.5%) | 234 (31.5%) |
| Wholesale Trade | 34 (100.0%) | 0 (0.0%) |
| Retail Trade | 326 (59.4%) | 223 (40.6%) |
| Transportation & Warehousing | 148 (100.0%) | 0 (0.0%) |
| Utilities | 0 (0.0%) | 0 (0.0%) |
| Information | 1 (1.3%) | 77 (98.7%) |
| Finance & Insurance | 12 (27.3%) | 32 (72.7%) |
| Real Estate, Rental & Leasing | 0 (0.0%) | 0 (0.0%) |
| Professional & Scientific | 62 (80.5%) | 15 (19.5%) |
| Enterprise Management | 0 (0.0%) | 0 (0.0%) |
| Administrative & Support | 0 (0.0%) | 0 (0.0%) |
| Educational Services | 35 (10.1%) | 312 (89.9%) |
| Health Care & Social Assistance | 117 (21.3%) | 433 (78.7%) |
| Arts, Entertainment & Recreation | 0 (0.0%) | 3 (100.0%) |
| Accommodation & Food Services | 17 (19.3%) | 71 (80.7%) |
| Public Administration | 6 (5.8%) | 97 (94.2%) |
| Total | 1,745 (53.0%) | 1,548 (47.0%) |
Education in Milan
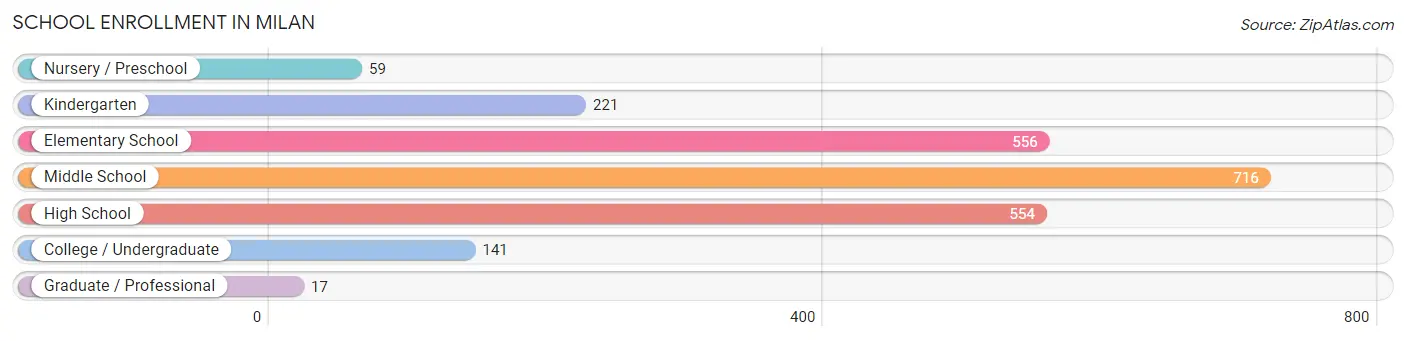
School Enrollment in Milan
The most common levels of schooling among the 2,264 students in Milan are middle school (716 | 31.6%), elementary school (556 | 24.6%), and high school (554 | 24.5%).
| School Level | # Students | % Students |
| Nursery / Preschool | 59 | 2.6% |
| Kindergarten | 221 | 9.8% |
| Elementary School | 556 | 24.6% |
| Middle School | 716 | 31.6% |
| High School | 554 | 24.5% |
| College / Undergraduate | 141 | 6.2% |
| Graduate / Professional | 17 | 0.7% |
| Total | 2,264 | 100.0% |
School Enrollment by Age by Funding Source in Milan
Out of a total of 2,264 students who are enrolled in schools in Milan, 428 (18.9%) attend a private institution, while the remaining 1,836 (81.1%) are enrolled in public schools. The age group of 18 to 19 year olds has the highest likelihood of being enrolled in private schools, with 67 (74.4% in the age bracket) enrolled. Conversely, the age group of 3 to 4 year olds has the lowest likelihood of being enrolled in a private school, with 46 (100.0% in the age bracket) attending a public institution.
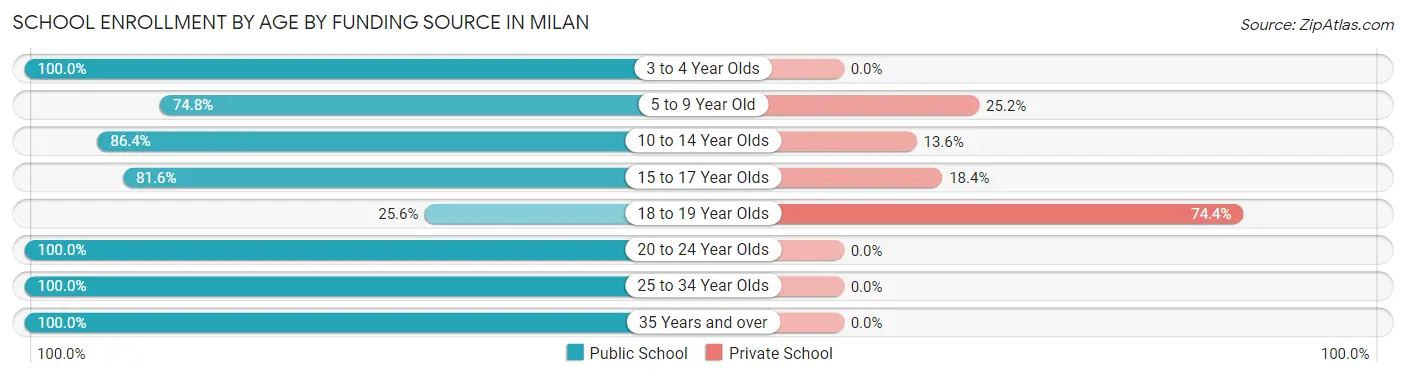
| Age Bracket | Public School | Private School |
| 3 to 4 Year Olds | 46 (100.0%) | 0 (0.0%) |
| 5 to 9 Year Old | 445 (74.8%) | 150 (25.2%) |
| 10 to 14 Year Olds | 860 (86.4%) | 135 (13.6%) |
| 15 to 17 Year Olds | 338 (81.6%) | 76 (18.4%) |
| 18 to 19 Year Olds | 23 (25.6%) | 67 (74.4%) |
| 20 to 24 Year Olds | 22 (100.0%) | 0 (0.0%) |
| 25 to 34 Year Olds | 18 (100.0%) | 0 (0.0%) |
| 35 Years and over | 84 (100.0%) | 0 (0.0%) |
| Total | 1,836 (81.1%) | 428 (18.9%) |
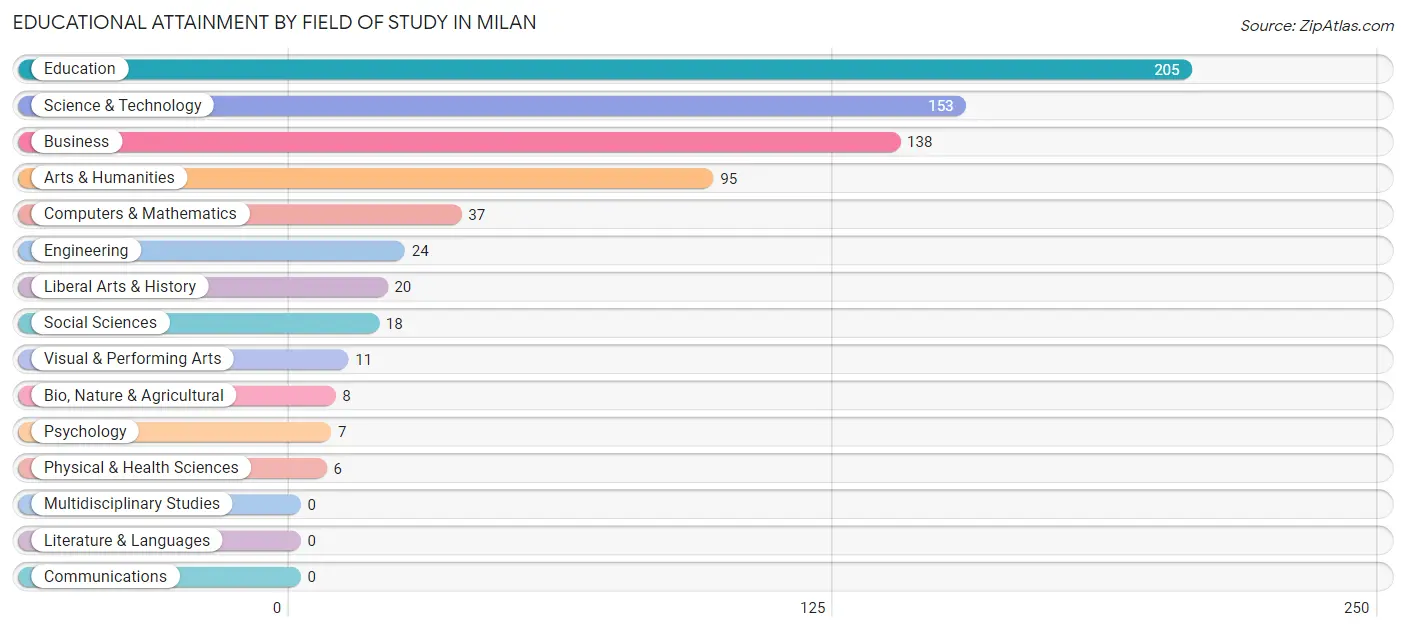
Educational Attainment by Field of Study in Milan
Education (205 | 28.4%), science & technology (153 | 21.2%), business (138 | 19.1%), arts & humanities (95 | 13.2%), and computers & mathematics (37 | 5.1%) are the most common fields of study among 722 individuals in Milan who have obtained a bachelor's degree or higher.
| Field of Study | # Graduates | % Graduates |
| Computers & Mathematics | 37 | 5.1% |
| Bio, Nature & Agricultural | 8 | 1.1% |
| Physical & Health Sciences | 6 | 0.8% |
| Psychology | 7 | 1.0% |
| Social Sciences | 18 | 2.5% |
| Engineering | 24 | 3.3% |
| Multidisciplinary Studies | 0 | 0.0% |
| Science & Technology | 153 | 21.2% |
| Business | 138 | 19.1% |
| Education | 205 | 28.4% |
| Literature & Languages | 0 | 0.0% |
| Liberal Arts & History | 20 | 2.8% |
| Visual & Performing Arts | 11 | 1.5% |
| Communications | 0 | 0.0% |
| Arts & Humanities | 95 | 13.2% |
| Total | 722 | 100.0% |
Transportation & Commute in Milan
Vehicle Availability by Sex in Milan
The most prevalent vehicle ownership categories in Milan are males with 2 vehicles (661, accounting for 41.4%) and females with 2 vehicles (511, making up 44.3%).
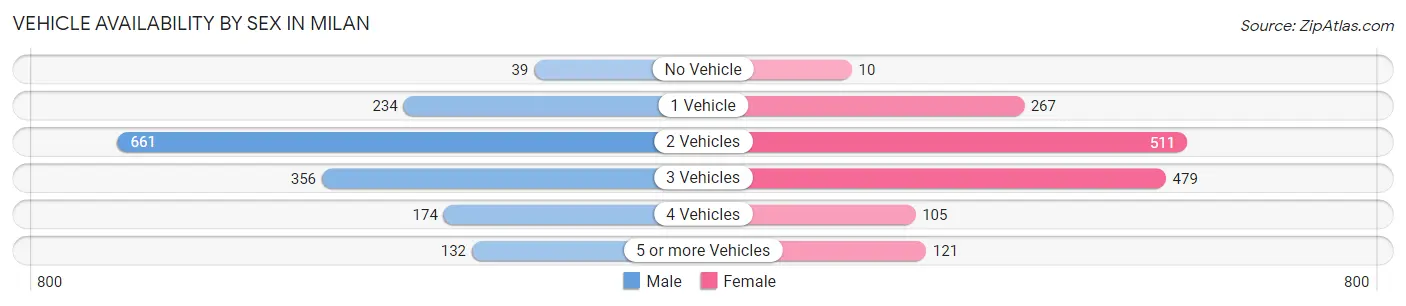
| Vehicles Available | Male | Female |
| No Vehicle | 39 (2.4%) | 10 (0.7%) |
| 1 Vehicle | 234 (14.7%) | 267 (17.9%) |
| 2 Vehicles | 661 (41.4%) | 511 (34.2%) |
| 3 Vehicles | 356 (22.3%) | 479 (32.1%) |
| 4 Vehicles | 174 (10.9%) | 105 (7.0%) |
| 5 or more Vehicles | 132 (8.3%) | 121 (8.1%) |
| Total | 1,596 (100.0%) | 1,493 (100.0%) |
Commute Time in Milan
The most frequently occuring commute durations in Milan are 30 to 34 minutes (544 commuters, 18.2%), 25 to 29 minutes (429 commuters, 14.3%), and 5 to 9 minutes (412 commuters, 13.8%).
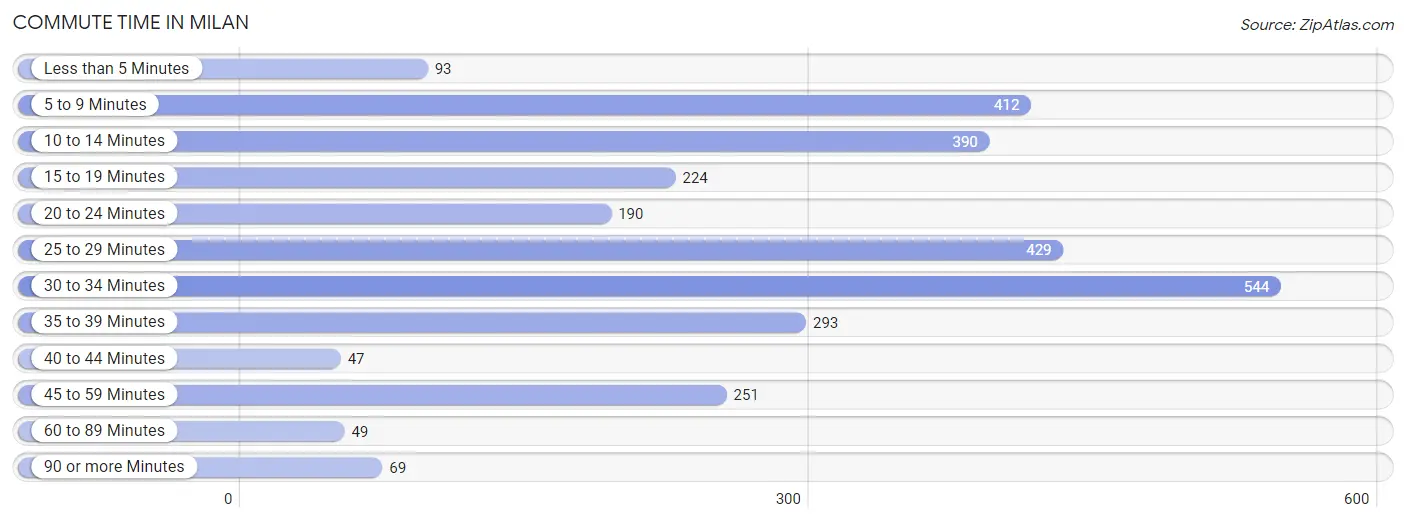
| Commute Time | # Commuters | % Commuters |
| Less than 5 Minutes | 93 | 3.1% |
| 5 to 9 Minutes | 412 | 13.8% |
| 10 to 14 Minutes | 390 | 13.0% |
| 15 to 19 Minutes | 224 | 7.5% |
| 20 to 24 Minutes | 190 | 6.4% |
| 25 to 29 Minutes | 429 | 14.3% |
| 30 to 34 Minutes | 544 | 18.2% |
| 35 to 39 Minutes | 293 | 9.8% |
| 40 to 44 Minutes | 47 | 1.6% |
| 45 to 59 Minutes | 251 | 8.4% |
| 60 to 89 Minutes | 49 | 1.6% |
| 90 or more Minutes | 69 | 2.3% |
Commute Time by Sex in Milan
The most common commute times in Milan are 30 to 34 minutes (268 commuters, 17.4%) for males and 30 to 34 minutes (276 commuters, 19.0%) for females.
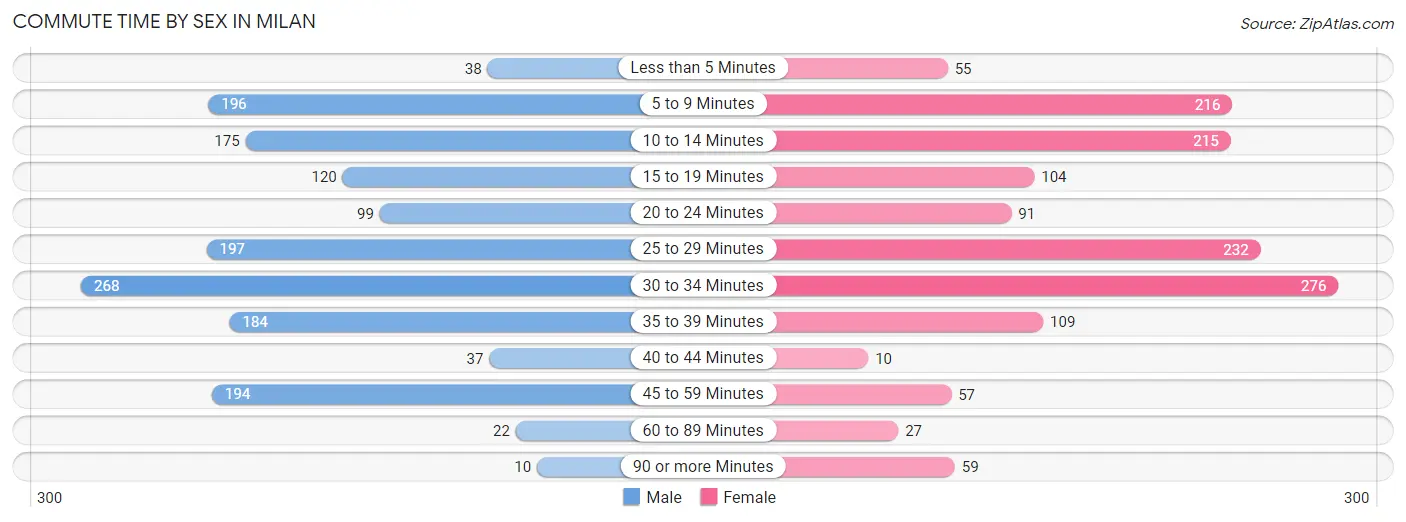
| Commute Time | Male | Female |
| Less than 5 Minutes | 38 (2.5%) | 55 (3.8%) |
| 5 to 9 Minutes | 196 (12.7%) | 216 (14.9%) |
| 10 to 14 Minutes | 175 (11.4%) | 215 (14.8%) |
| 15 to 19 Minutes | 120 (7.8%) | 104 (7.2%) |
| 20 to 24 Minutes | 99 (6.4%) | 91 (6.3%) |
| 25 to 29 Minutes | 197 (12.8%) | 232 (16.0%) |
| 30 to 34 Minutes | 268 (17.4%) | 276 (19.0%) |
| 35 to 39 Minutes | 184 (11.9%) | 109 (7.5%) |
| 40 to 44 Minutes | 37 (2.4%) | 10 (0.7%) |
| 45 to 59 Minutes | 194 (12.6%) | 57 (3.9%) |
| 60 to 89 Minutes | 22 (1.4%) | 27 (1.9%) |
| 90 or more Minutes | 10 (0.6%) | 59 (4.1%) |
Time of Departure to Work by Sex in Milan
The most frequent times of departure to work in Milan are 4:00 PM to 11:59 PM (312, 20.3%) for males and 7:30 AM to 7:59 AM (226, 15.6%) for females.
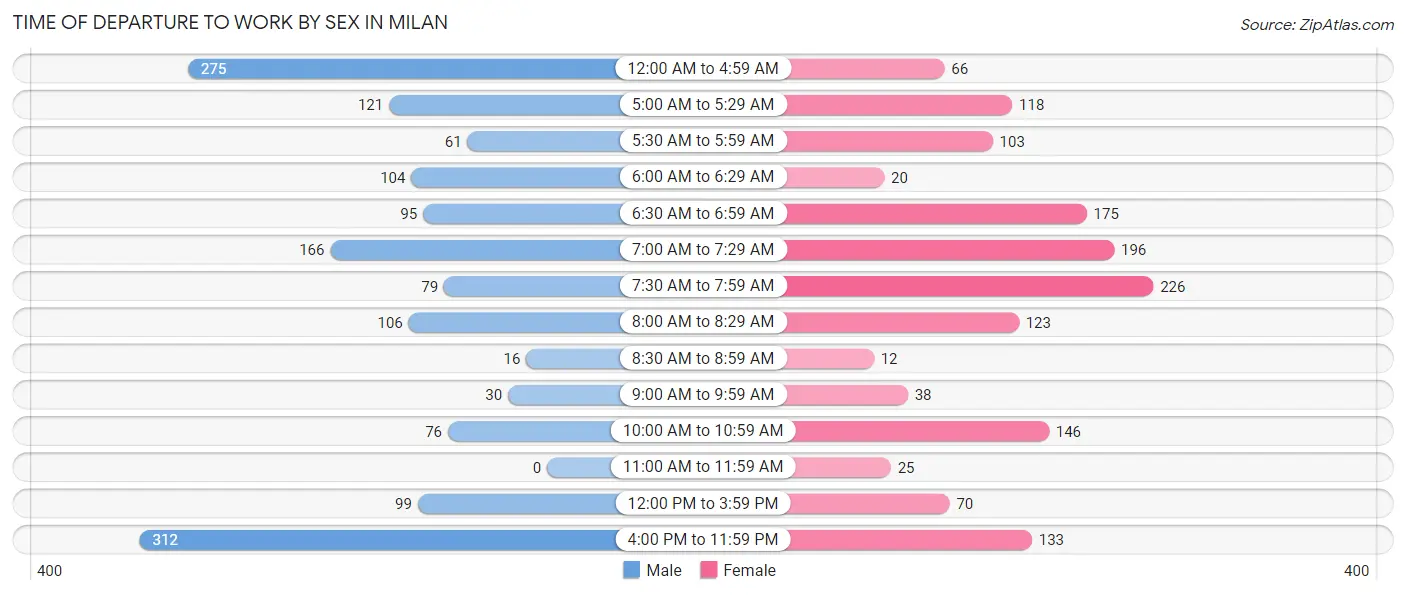
| Time of Departure | Male | Female |
| 12:00 AM to 4:59 AM | 275 (17.9%) | 66 (4.5%) |
| 5:00 AM to 5:29 AM | 121 (7.9%) | 118 (8.1%) |
| 5:30 AM to 5:59 AM | 61 (4.0%) | 103 (7.1%) |
| 6:00 AM to 6:29 AM | 104 (6.8%) | 20 (1.4%) |
| 6:30 AM to 6:59 AM | 95 (6.2%) | 175 (12.1%) |
| 7:00 AM to 7:29 AM | 166 (10.8%) | 196 (13.5%) |
| 7:30 AM to 7:59 AM | 79 (5.1%) | 226 (15.6%) |
| 8:00 AM to 8:29 AM | 106 (6.9%) | 123 (8.5%) |
| 8:30 AM to 8:59 AM | 16 (1.0%) | 12 (0.8%) |
| 9:00 AM to 9:59 AM | 30 (1.9%) | 38 (2.6%) |
| 10:00 AM to 10:59 AM | 76 (4.9%) | 146 (10.1%) |
| 11:00 AM to 11:59 AM | 0 (0.0%) | 25 (1.7%) |
| 12:00 PM to 3:59 PM | 99 (6.4%) | 70 (4.8%) |
| 4:00 PM to 11:59 PM | 312 (20.3%) | 133 (9.2%) |
| Total | 1,540 (100.0%) | 1,451 (100.0%) |
Housing Occupancy in Milan
Occupancy by Ownership in Milan
Of the total 3,183 dwellings in Milan, owner-occupied units account for 1,659 (52.1%), while renter-occupied units make up 1,524 (47.9%).
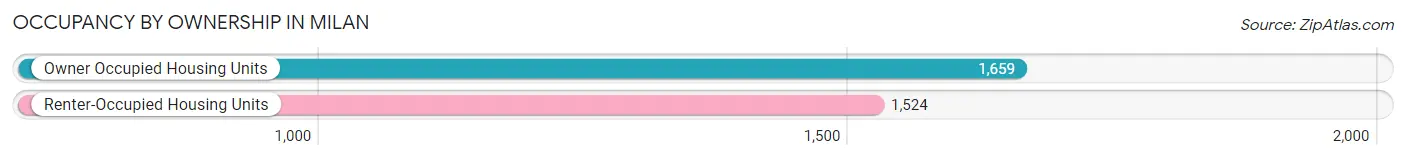
| Occupancy | # Housing Units | % Housing Units |
| Owner Occupied Housing Units | 1,659 | 52.1% |
| Renter-Occupied Housing Units | 1,524 | 47.9% |
| Total Occupied Housing Units | 3,183 | 100.0% |
Occupancy by Household Size in Milan
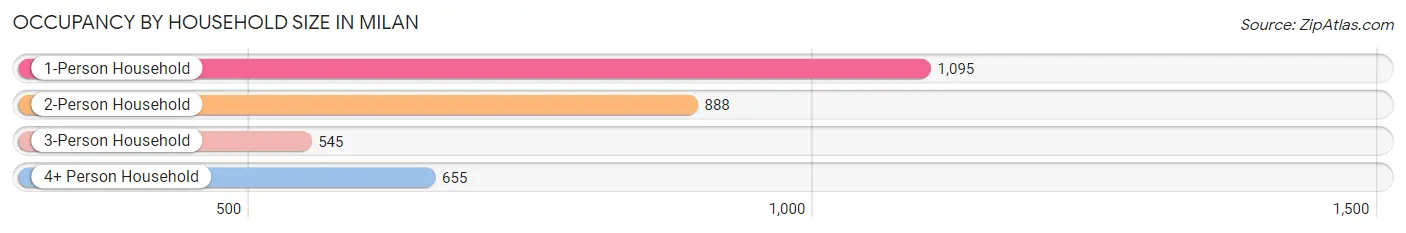
| Household Size | # Housing Units | % Housing Units |
| 1-Person Household | 1,095 | 34.4% |
| 2-Person Household | 888 | 27.9% |
| 3-Person Household | 545 | 17.1% |
| 4+ Person Household | 655 | 20.6% |
| Total Housing Units | 3,183 | 100.0% |
Occupancy by Ownership by Household Size in Milan
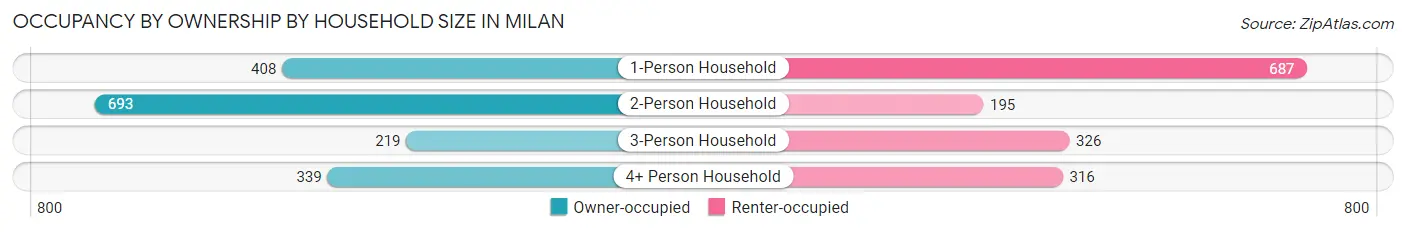
| Household Size | Owner-occupied | Renter-occupied |
| 1-Person Household | 408 (37.3%) | 687 (62.7%) |
| 2-Person Household | 693 (78.0%) | 195 (22.0%) |
| 3-Person Household | 219 (40.2%) | 326 (59.8%) |
| 4+ Person Household | 339 (51.8%) | 316 (48.2%) |
| Total Housing Units | 1,659 (52.1%) | 1,524 (47.9%) |
Occupancy by Educational Attainment in Milan
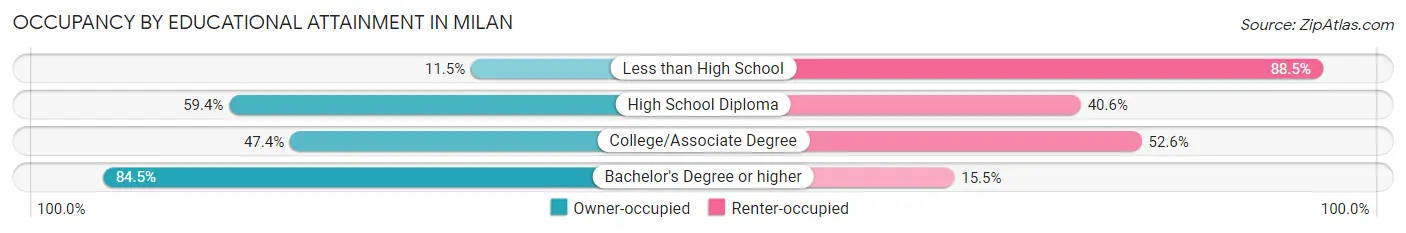
| Household Size | Owner-occupied | Renter-occupied |
| Less than High School | 49 (11.5%) | 378 (88.5%) |
| High School Diploma | 696 (59.4%) | 475 (40.6%) |
| College/Associate Degree | 543 (47.4%) | 603 (52.6%) |
| Bachelor's Degree or higher | 371 (84.5%) | 68 (15.5%) |
Occupancy by Age of Householder in Milan
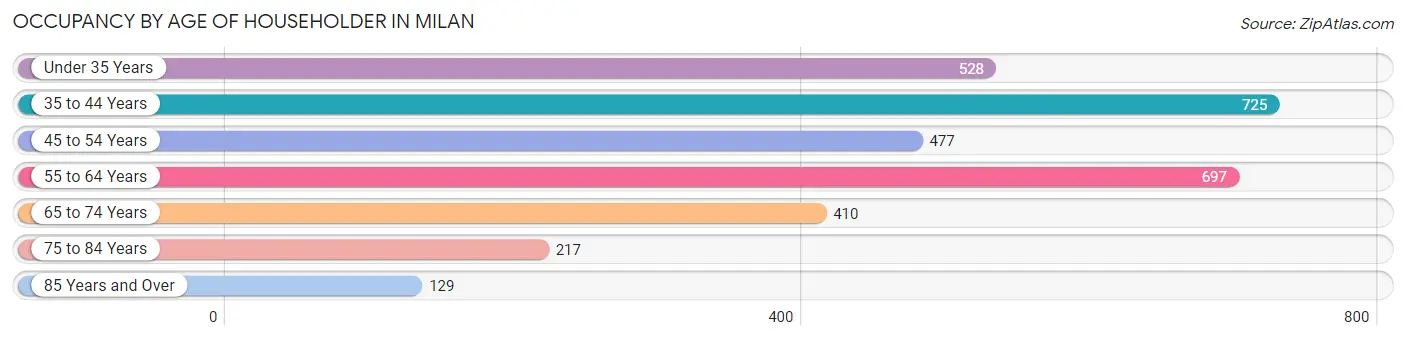
| Age Bracket | # Households | % Households |
| Under 35 Years | 528 | 16.6% |
| 35 to 44 Years | 725 | 22.8% |
| 45 to 54 Years | 477 | 15.0% |
| 55 to 64 Years | 697 | 21.9% |
| 65 to 74 Years | 410 | 12.9% |
| 75 to 84 Years | 217 | 6.8% |
| 85 Years and Over | 129 | 4.1% |
| Total | 3,183 | 100.0% |
Housing Finances in Milan
Median Income by Occupancy in Milan
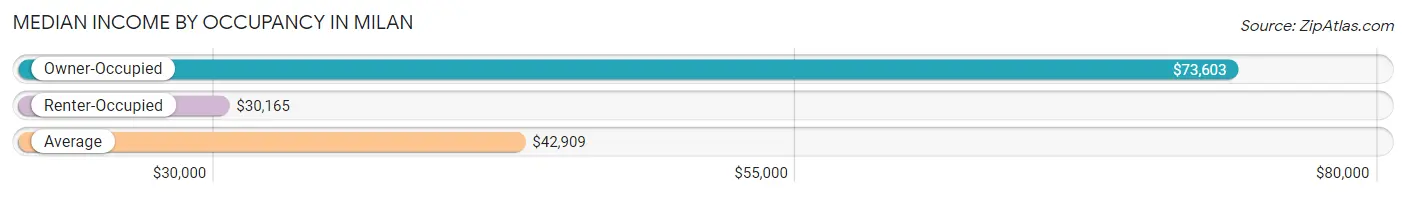
| Occupancy Type | # Households | Median Income |
| Owner-Occupied | 1,659 (52.1%) | $73,603 |
| Renter-Occupied | 1,524 (47.9%) | $30,165 |
| Average | 3,183 (100.0%) | $42,909 |
Occupancy by Householder Income Bracket in Milan
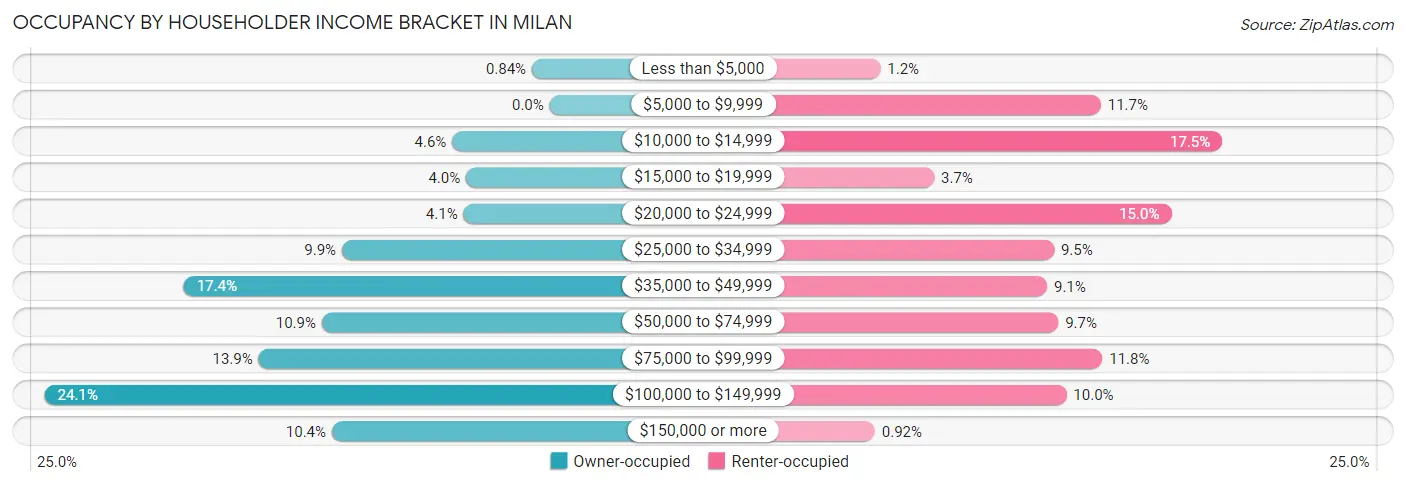
| Income Bracket | Owner-occupied | Renter-occupied |
| Less than $5,000 | 14 (0.8%) | 18 (1.2%) |
| $5,000 to $9,999 | 0 (0.0%) | 178 (11.7%) |
| $10,000 to $14,999 | 77 (4.6%) | 266 (17.4%) |
| $15,000 to $19,999 | 66 (4.0%) | 57 (3.7%) |
| $20,000 to $24,999 | 68 (4.1%) | 229 (15.0%) |
| $25,000 to $34,999 | 164 (9.9%) | 144 (9.5%) |
| $35,000 to $49,999 | 289 (17.4%) | 139 (9.1%) |
| $50,000 to $74,999 | 180 (10.8%) | 147 (9.7%) |
| $75,000 to $99,999 | 230 (13.9%) | 179 (11.7%) |
| $100,000 to $149,999 | 399 (24.0%) | 153 (10.0%) |
| $150,000 or more | 172 (10.4%) | 14 (0.9%) |
| Total | 1,659 (100.0%) | 1,524 (100.0%) |
Monthly Housing Cost Tiers in Milan
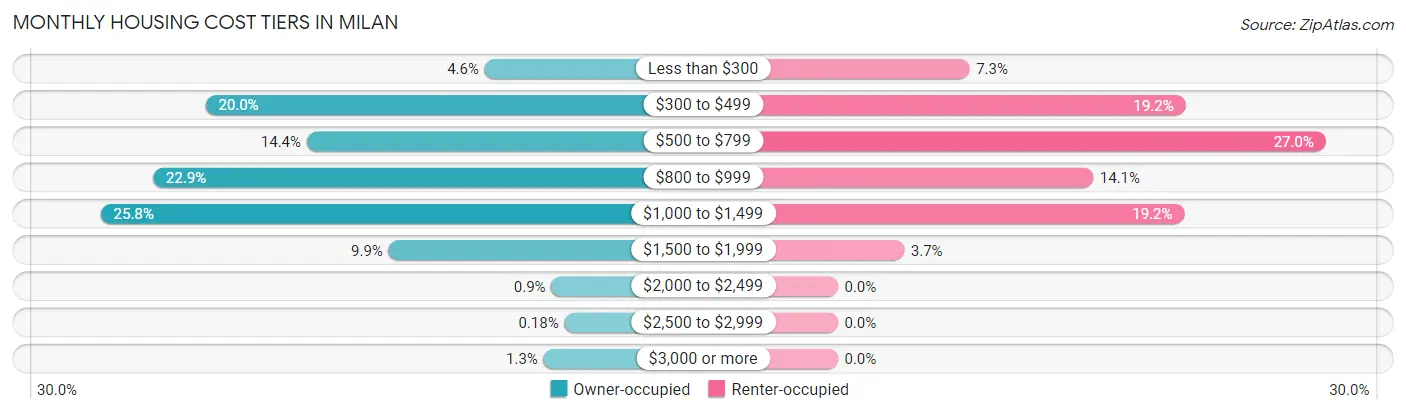
| Monthly Cost | Owner-occupied | Renter-occupied |
| Less than $300 | 76 (4.6%) | 111 (7.3%) |
| $300 to $499 | 332 (20.0%) | 293 (19.2%) |
| $500 to $799 | 239 (14.4%) | 411 (27.0%) |
| $800 to $999 | 380 (22.9%) | 215 (14.1%) |
| $1,000 to $1,499 | 428 (25.8%) | 292 (19.2%) |
| $1,500 to $1,999 | 164 (9.9%) | 56 (3.7%) |
| $2,000 to $2,499 | 15 (0.9%) | 0 (0.0%) |
| $2,500 to $2,999 | 3 (0.2%) | 0 (0.0%) |
| $3,000 or more | 22 (1.3%) | 0 (0.0%) |
| Total | 1,659 (100.0%) | 1,524 (100.0%) |
Physical Housing Characteristics in Milan
Housing Structures in Milan
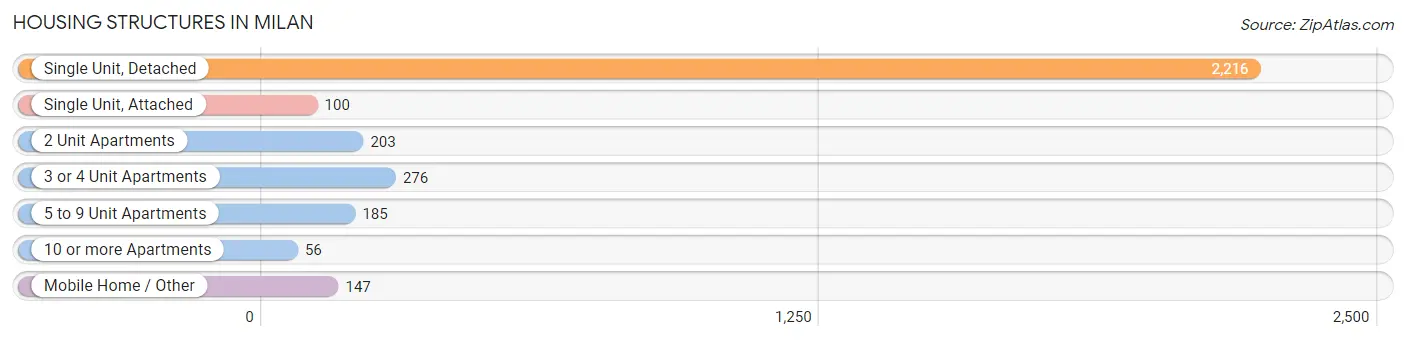
| Structure Type | # Housing Units | % Housing Units |
| Single Unit, Detached | 2,216 | 69.6% |
| Single Unit, Attached | 100 | 3.1% |
| 2 Unit Apartments | 203 | 6.4% |
| 3 or 4 Unit Apartments | 276 | 8.7% |
| 5 to 9 Unit Apartments | 185 | 5.8% |
| 10 or more Apartments | 56 | 1.8% |
| Mobile Home / Other | 147 | 4.6% |
| Total | 3,183 | 100.0% |
Housing Structures by Occupancy in Milan
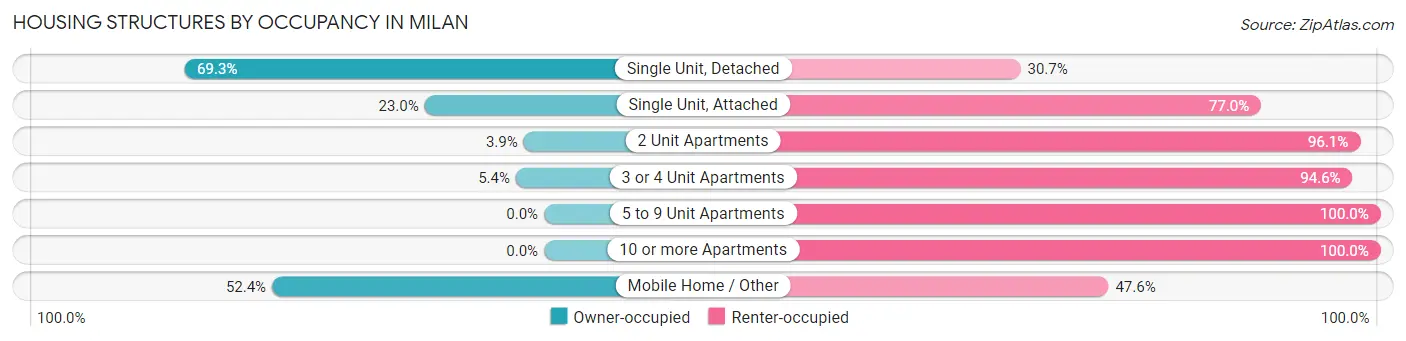
| Structure Type | Owner-occupied | Renter-occupied |
| Single Unit, Detached | 1,536 (69.3%) | 680 (30.7%) |
| Single Unit, Attached | 23 (23.0%) | 77 (77.0%) |
| 2 Unit Apartments | 8 (3.9%) | 195 (96.1%) |
| 3 or 4 Unit Apartments | 15 (5.4%) | 261 (94.6%) |
| 5 to 9 Unit Apartments | 0 (0.0%) | 185 (100.0%) |
| 10 or more Apartments | 0 (0.0%) | 56 (100.0%) |
| Mobile Home / Other | 77 (52.4%) | 70 (47.6%) |
| Total | 1,659 (52.1%) | 1,524 (47.9%) |
Housing Structures by Number of Rooms in Milan
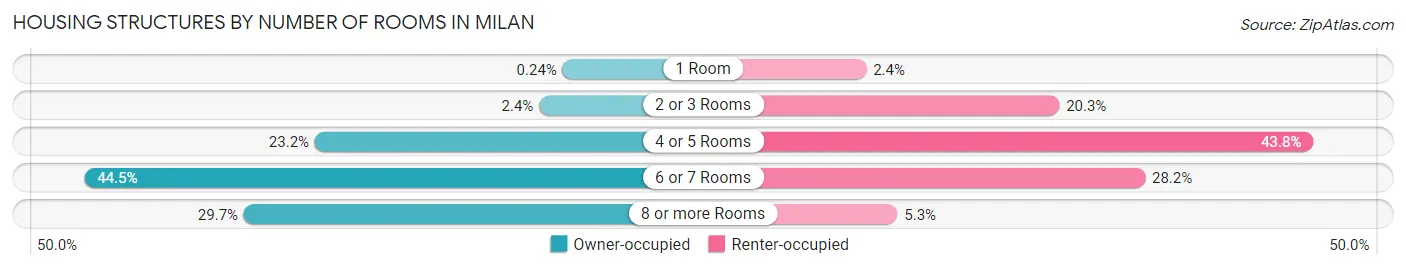
| Number of Rooms | Owner-occupied | Renter-occupied |
| 1 Room | 4 (0.2%) | 37 (2.4%) |
| 2 or 3 Rooms | 40 (2.4%) | 309 (20.3%) |
| 4 or 5 Rooms | 384 (23.2%) | 667 (43.8%) |
| 6 or 7 Rooms | 738 (44.5%) | 430 (28.2%) |
| 8 or more Rooms | 493 (29.7%) | 81 (5.3%) |
| Total | 1,659 (100.0%) | 1,524 (100.0%) |
Housing Structure by Heating Type in Milan
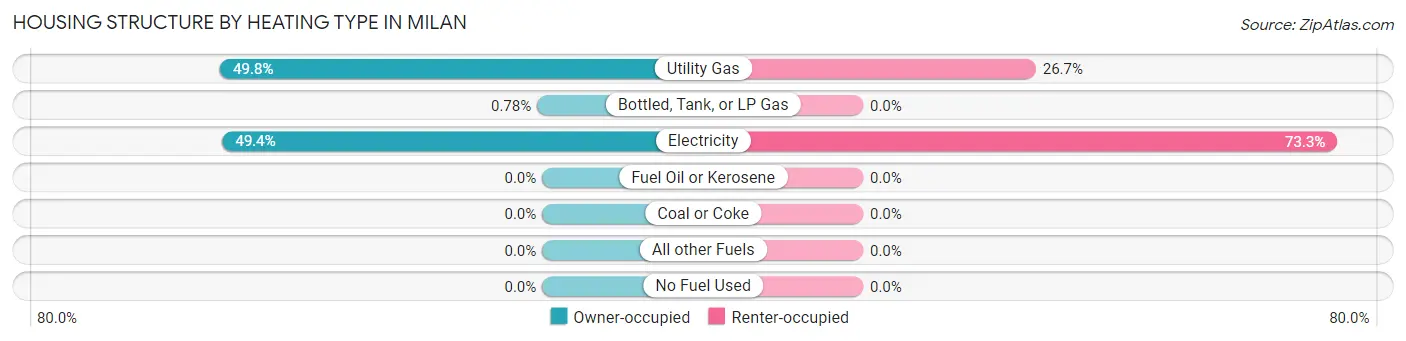
| Heating Type | Owner-occupied | Renter-occupied |
| Utility Gas | 826 (49.8%) | 407 (26.7%) |
| Bottled, Tank, or LP Gas | 13 (0.8%) | 0 (0.0%) |
| Electricity | 820 (49.4%) | 1,117 (73.3%) |
| Fuel Oil or Kerosene | 0 (0.0%) | 0 (0.0%) |
| Coal or Coke | 0 (0.0%) | 0 (0.0%) |
| All other Fuels | 0 (0.0%) | 0 (0.0%) |
| No Fuel Used | 0 (0.0%) | 0 (0.0%) |
| Total | 1,659 (100.0%) | 1,524 (100.0%) |
Household Vehicle Usage in Milan
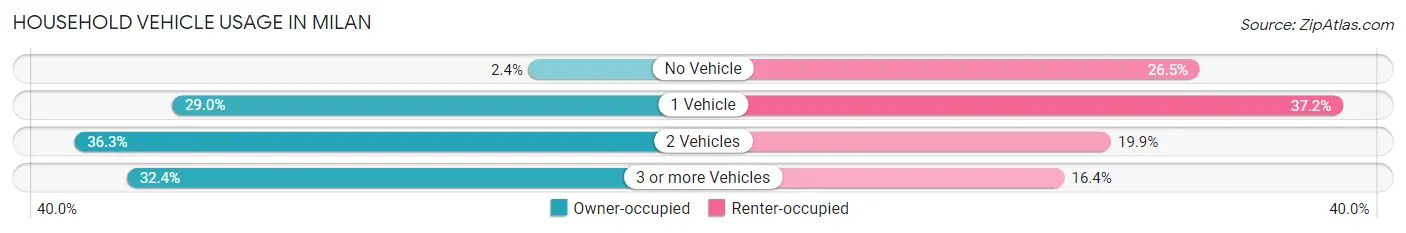
| Vehicles per Household | Owner-occupied | Renter-occupied |
| No Vehicle | 39 (2.4%) | 404 (26.5%) |
| 1 Vehicle | 481 (29.0%) | 567 (37.2%) |
| 2 Vehicles | 602 (36.3%) | 303 (19.9%) |
| 3 or more Vehicles | 537 (32.4%) | 250 (16.4%) |
| Total | 1,659 (100.0%) | 1,524 (100.0%) |
Real Estate & Mortgages in Milan
Real Estate and Mortgage Overview in Milan
| Characteristic | Without Mortgage | With Mortgage |
| Housing Units | 541 | 1,118 |
| Median Property Value | $111,400 | $125,900 |
| Median Household Income | $29,375 | $170 |
| Monthly Housing Costs | $437 | $9 |
| Real Estate Taxes | $898 | $87 |
Property Value by Mortgage Status in Milan
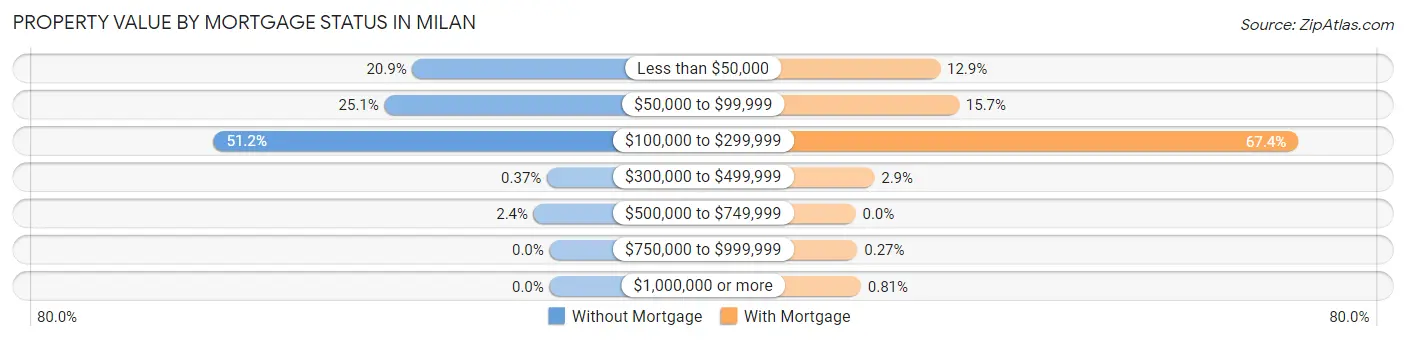
| Property Value | Without Mortgage | With Mortgage |
| Less than $50,000 | 113 (20.9%) | 144 (12.9%) |
| $50,000 to $99,999 | 136 (25.1%) | 176 (15.7%) |
| $100,000 to $299,999 | 277 (51.2%) | 754 (67.4%) |
| $300,000 to $499,999 | 2 (0.4%) | 32 (2.9%) |
| $500,000 to $749,999 | 13 (2.4%) | 0 (0.0%) |
| $750,000 to $999,999 | 0 (0.0%) | 3 (0.3%) |
| $1,000,000 or more | 0 (0.0%) | 9 (0.8%) |
| Total | 541 (100.0%) | 1,118 (100.0%) |
Household Income by Mortgage Status in Milan
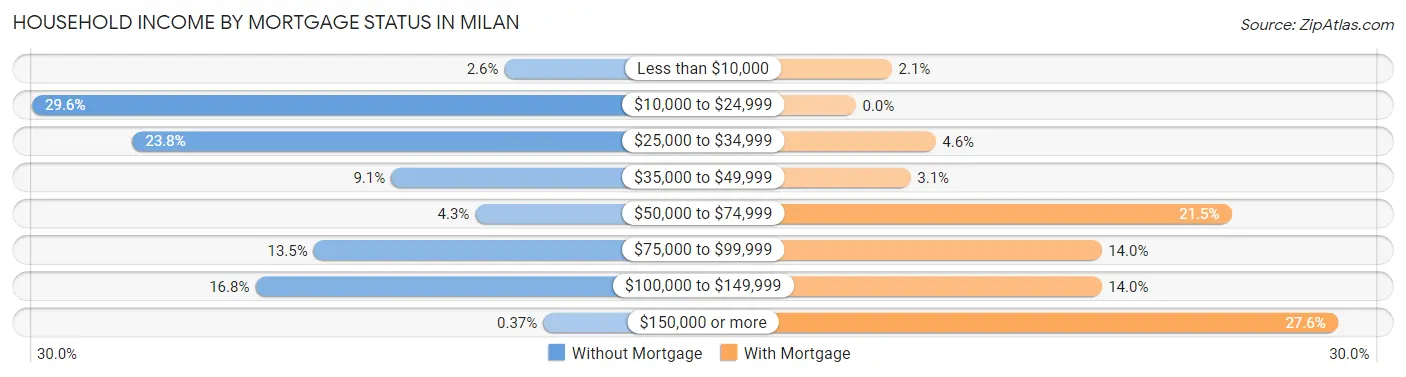
| Household Income | Without Mortgage | With Mortgage |
| Less than $10,000 | 14 (2.6%) | 23 (2.1%) |
| $10,000 to $24,999 | 160 (29.6%) | 0 (0.0%) |
| $25,000 to $34,999 | 129 (23.8%) | 51 (4.6%) |
| $35,000 to $49,999 | 49 (9.1%) | 35 (3.1%) |
| $50,000 to $74,999 | 23 (4.3%) | 240 (21.5%) |
| $75,000 to $99,999 | 73 (13.5%) | 157 (14.0%) |
| $100,000 to $149,999 | 91 (16.8%) | 157 (14.0%) |
| $150,000 or more | 2 (0.4%) | 308 (27.6%) |
| Total | 541 (100.0%) | 1,118 (100.0%) |
Property Value to Household Income Ratio in Milan
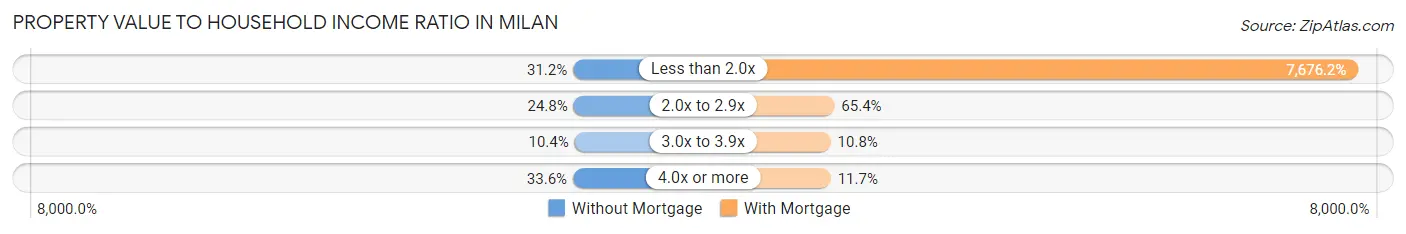
| Value-to-Income Ratio | Without Mortgage | With Mortgage |
| Less than 2.0x | 169 (31.2%) | 85,820 (7,676.2%) |
| 2.0x to 2.9x | 134 (24.8%) | 731 (65.4%) |
| 3.0x to 3.9x | 56 (10.3%) | 121 (10.8%) |
| 4.0x or more | 182 (33.6%) | 131 (11.7%) |
| Total | 541 (100.0%) | 1,118 (100.0%) |
Real Estate Taxes by Mortgage Status in Milan
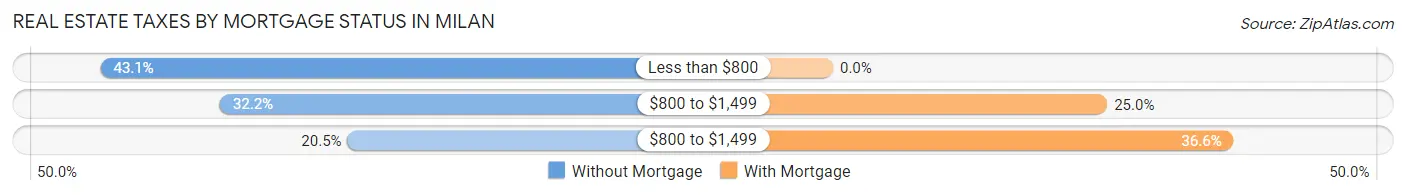
| Property Taxes | Without Mortgage | With Mortgage |
| Less than $800 | 233 (43.1%) | 0 (0.0%) |
| $800 to $1,499 | 174 (32.2%) | 280 (25.0%) |
| $800 to $1,499 | 111 (20.5%) | 409 (36.6%) |
| Total | 541 (100.0%) | 1,118 (100.0%) |
Health & Disability in Milan
Health Insurance Coverage by Age in Milan
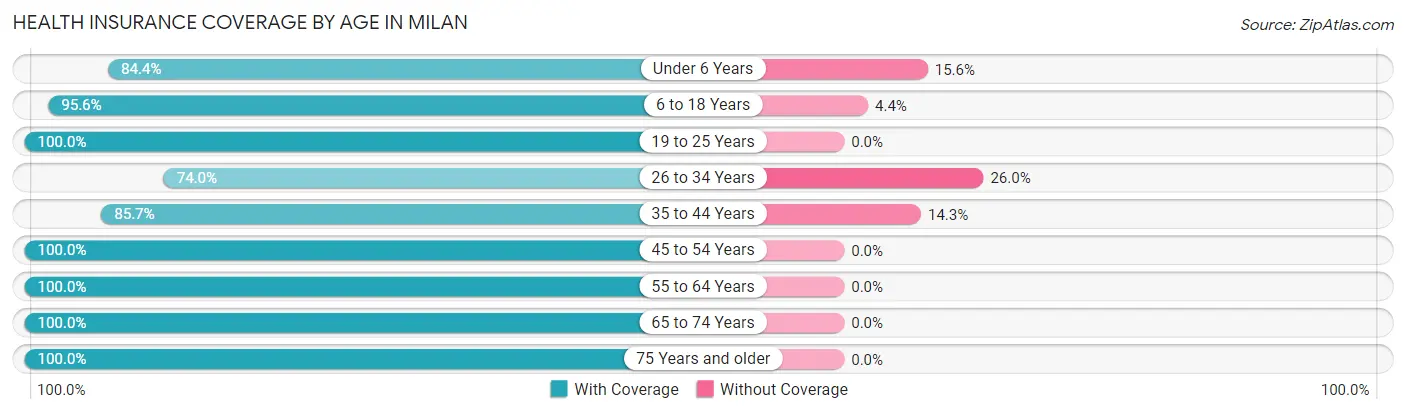
| Age Bracket | With Coverage | Without Coverage |
| Under 6 Years | 515 (84.4%) | 95 (15.6%) |
| 6 to 18 Years | 1,853 (95.6%) | 86 (4.4%) |
| 19 to 25 Years | 379 (100.0%) | 0 (0.0%) |
| 26 to 34 Years | 676 (74.0%) | 237 (26.0%) |
| 35 to 44 Years | 1,143 (85.7%) | 191 (14.3%) |
| 45 to 54 Years | 752 (100.0%) | 0 (0.0%) |
| 55 to 64 Years | 969 (100.0%) | 0 (0.0%) |
| 65 to 74 Years | 584 (100.0%) | 0 (0.0%) |
| 75 Years and older | 459 (100.0%) | 0 (0.0%) |
| Total | 7,330 (92.3%) | 609 (7.7%) |
Health Insurance Coverage by Citizenship Status in Milan
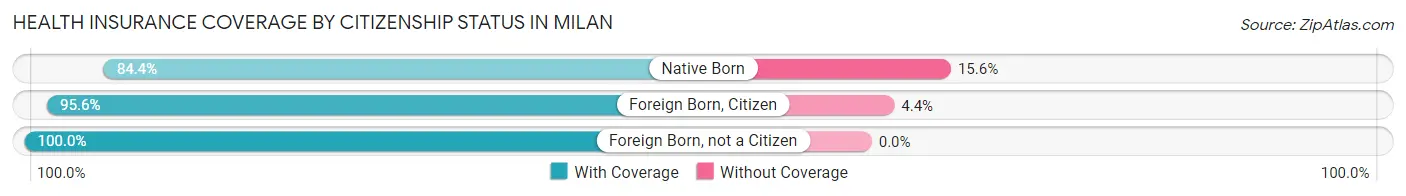
| Citizenship Status | With Coverage | Without Coverage |
| Native Born | 515 (84.4%) | 95 (15.6%) |
| Foreign Born, Citizen | 1,853 (95.6%) | 86 (4.4%) |
| Foreign Born, not a Citizen | 379 (100.0%) | 0 (0.0%) |
Health Insurance Coverage by Household Income in Milan
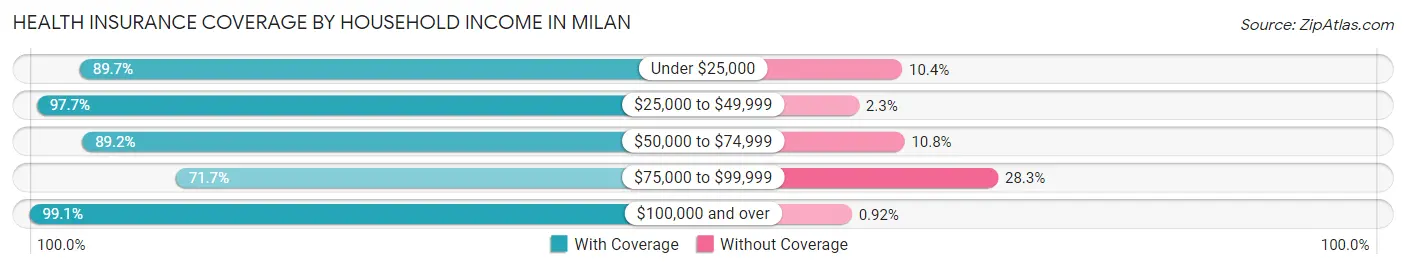
| Household Income | With Coverage | Without Coverage |
| Under $25,000 | 1,317 (89.6%) | 152 (10.3%) |
| $25,000 to $49,999 | 2,020 (97.7%) | 47 (2.3%) |
| $50,000 to $74,999 | 776 (89.2%) | 94 (10.8%) |
| $75,000 to $99,999 | 741 (71.7%) | 293 (28.3%) |
| $100,000 and over | 2,476 (99.1%) | 23 (0.9%) |
Public vs Private Health Insurance Coverage by Age in Milan
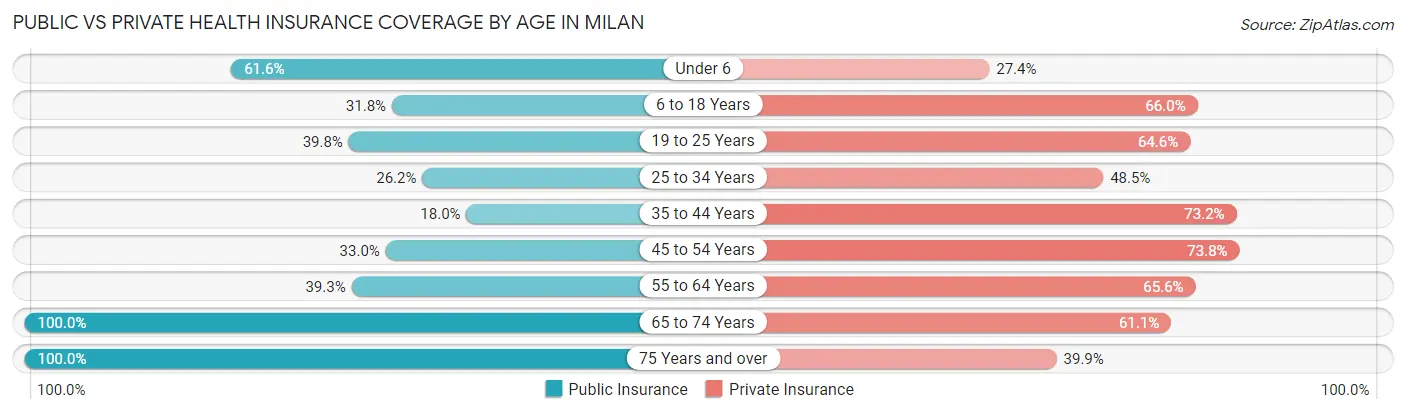
| Age Bracket | Public Insurance | Private Insurance |
| Under 6 | 376 (61.6%) | 167 (27.4%) |
| 6 to 18 Years | 617 (31.8%) | 1,280 (66.0%) |
| 19 to 25 Years | 151 (39.8%) | 245 (64.6%) |
| 25 to 34 Years | 239 (26.2%) | 443 (48.5%) |
| 35 to 44 Years | 240 (18.0%) | 977 (73.2%) |
| 45 to 54 Years | 248 (33.0%) | 555 (73.8%) |
| 55 to 64 Years | 381 (39.3%) | 636 (65.6%) |
| 65 to 74 Years | 584 (100.0%) | 357 (61.1%) |
| 75 Years and over | 459 (100.0%) | 183 (39.9%) |
| Total | 3,295 (41.5%) | 4,843 (61.0%) |
Disability Status by Sex by Age in Milan
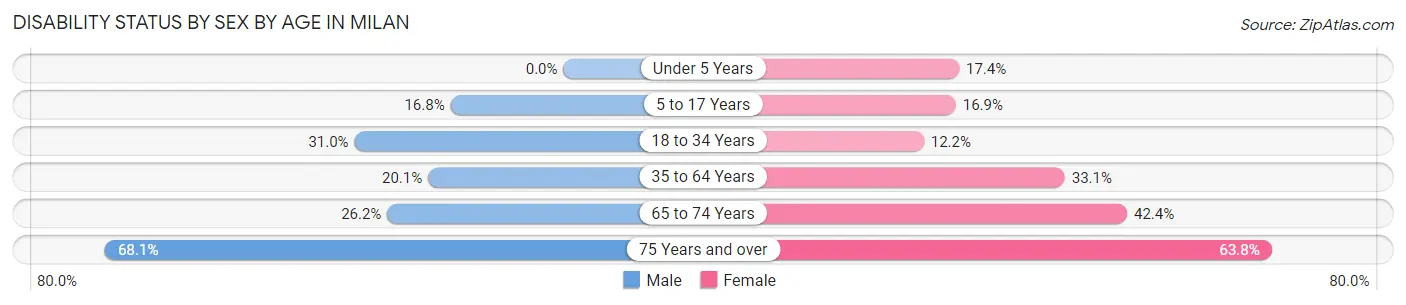
| Age Bracket | Male | Female |
| Under 5 Years | 0 (0.0%) | 35 (17.4%) |
| 5 to 17 Years | 157 (16.8%) | 182 (16.9%) |
| 18 to 34 Years | 232 (31.0%) | 78 (12.2%) |
| 35 to 64 Years | 277 (20.1%) | 555 (33.1%) |
| 65 to 74 Years | 62 (26.2%) | 147 (42.4%) |
| 75 Years and over | 98 (68.1%) | 201 (63.8%) |
Disability Class by Sex by Age in Milan
Disability Class: Hearing Difficulty
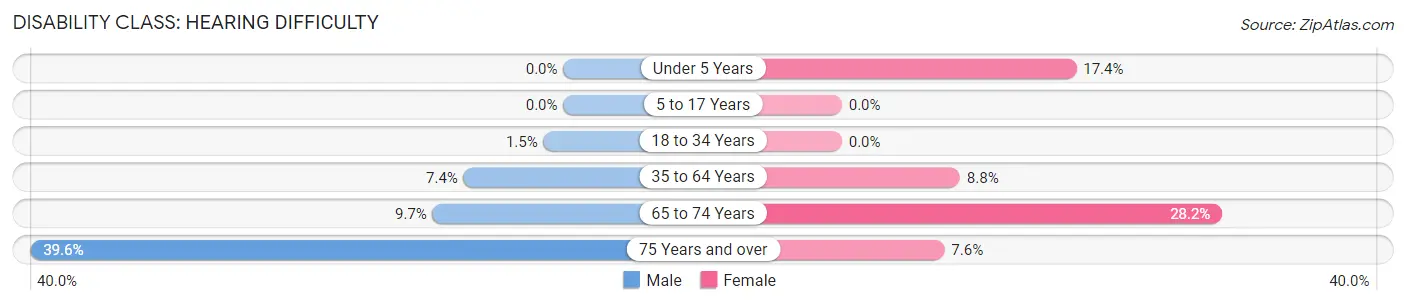
| Age Bracket | Male | Female |
| Under 5 Years | 0 (0.0%) | 35 (17.4%) |
| 5 to 17 Years | 0 (0.0%) | 0 (0.0%) |
| 18 to 34 Years | 11 (1.5%) | 0 (0.0%) |
| 35 to 64 Years | 102 (7.4%) | 147 (8.8%) |
| 65 to 74 Years | 23 (9.7%) | 98 (28.2%) |
| 75 Years and over | 57 (39.6%) | 24 (7.6%) |
Disability Class: Vision Difficulty
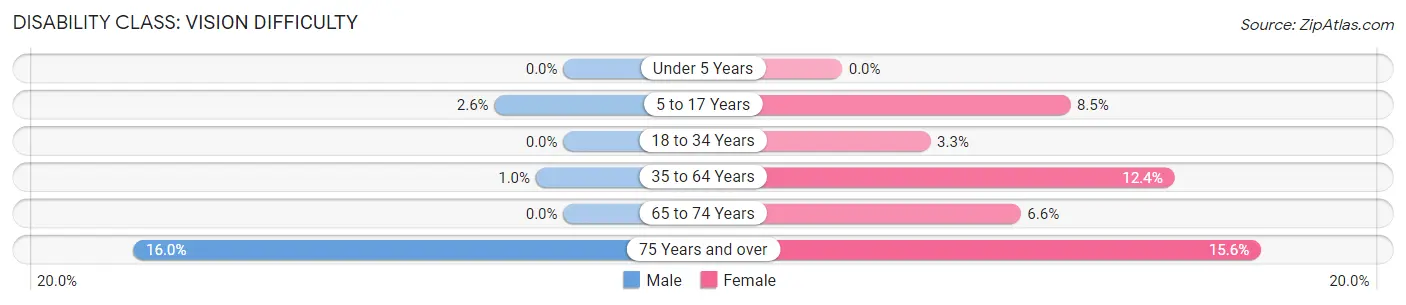
| Age Bracket | Male | Female |
| Under 5 Years | 0 (0.0%) | 0 (0.0%) |
| 5 to 17 Years | 24 (2.6%) | 91 (8.5%) |
| 18 to 34 Years | 0 (0.0%) | 21 (3.3%) |
| 35 to 64 Years | 14 (1.0%) | 207 (12.3%) |
| 65 to 74 Years | 0 (0.0%) | 23 (6.6%) |
| 75 Years and over | 23 (16.0%) | 49 (15.6%) |
Disability Class: Cognitive Difficulty
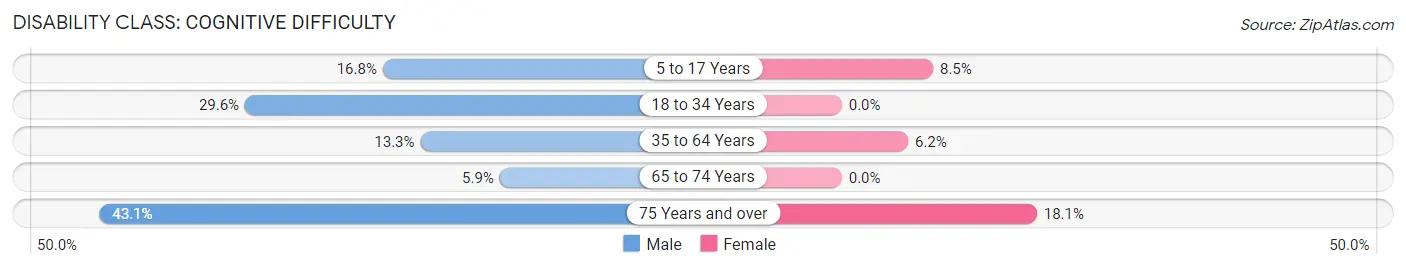
| Age Bracket | Male | Female |
| 5 to 17 Years | 157 (16.8%) | 91 (8.5%) |
| 18 to 34 Years | 221 (29.5%) | 0 (0.0%) |
| 35 to 64 Years | 183 (13.3%) | 103 (6.1%) |
| 65 to 74 Years | 14 (5.9%) | 0 (0.0%) |
| 75 Years and over | 62 (43.1%) | 57 (18.1%) |
Disability Class: Ambulatory Difficulty
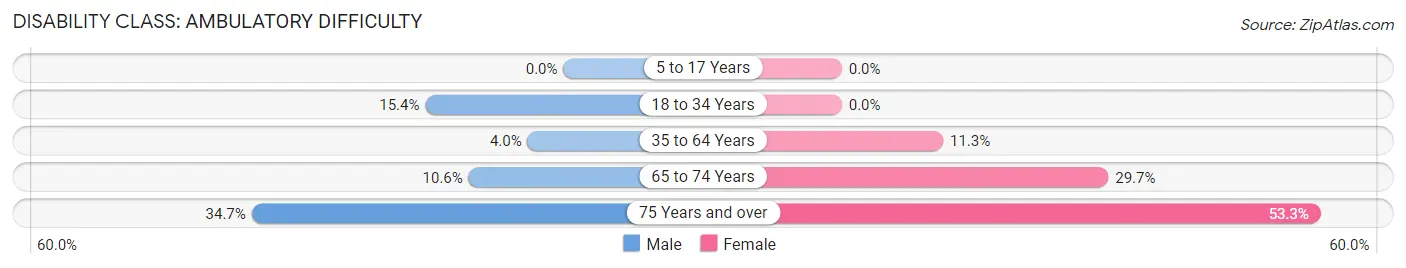
| Age Bracket | Male | Female |
| 5 to 17 Years | 0 (0.0%) | 0 (0.0%) |
| 18 to 34 Years | 115 (15.4%) | 0 (0.0%) |
| 35 to 64 Years | 55 (4.0%) | 189 (11.3%) |
| 65 to 74 Years | 25 (10.5%) | 103 (29.7%) |
| 75 Years and over | 50 (34.7%) | 168 (53.3%) |
Disability Class: Self-Care Difficulty
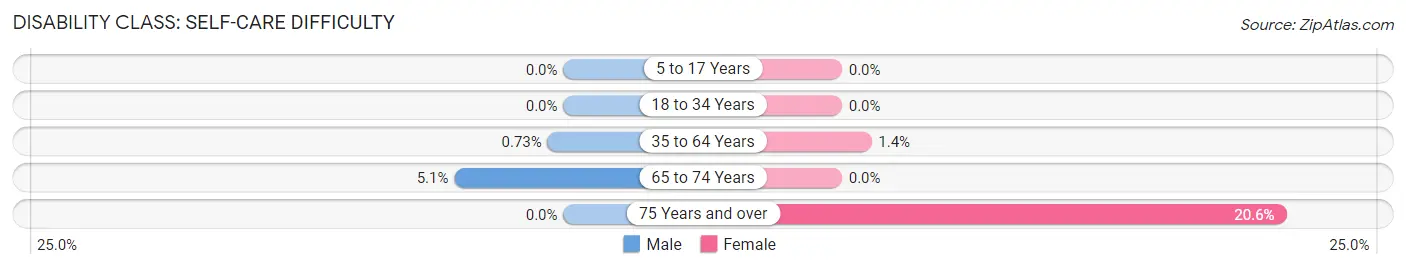
| Age Bracket | Male | Female |
| 5 to 17 Years | 0 (0.0%) | 0 (0.0%) |
| 18 to 34 Years | 0 (0.0%) | 0 (0.0%) |
| 35 to 64 Years | 10 (0.7%) | 23 (1.4%) |
| 65 to 74 Years | 12 (5.1%) | 0 (0.0%) |
| 75 Years and over | 0 (0.0%) | 65 (20.6%) |
Technology Access in Milan
Computing Device Access in Milan
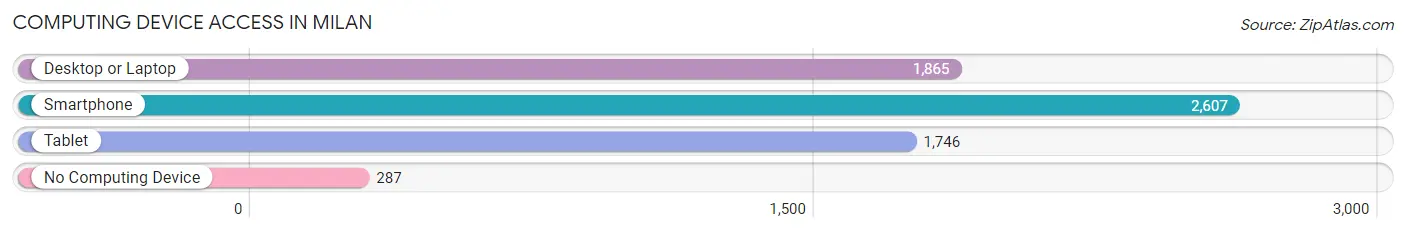
| Device Type | # Households | % Households |
| Desktop or Laptop | 1,865 | 58.6% |
| Smartphone | 2,607 | 81.9% |
| Tablet | 1,746 | 54.8% |
| No Computing Device | 287 | 9.0% |
| Total | 3,183 | 100.0% |
Internet Access in Milan
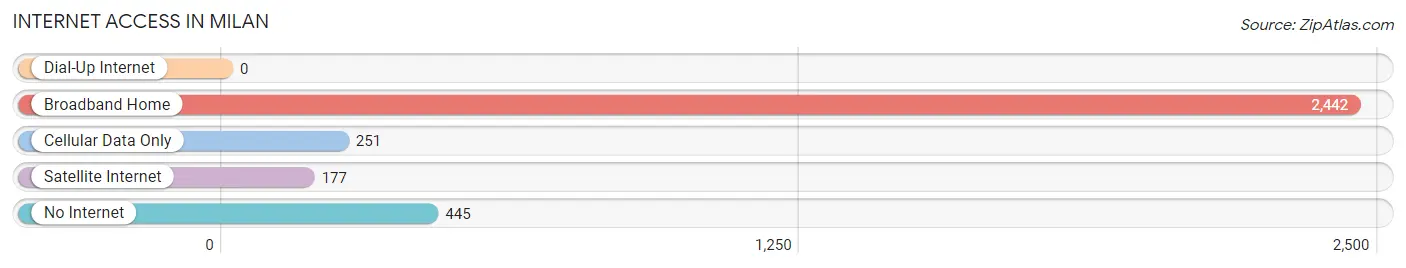
| Internet Type | # Households | % Households |
| Dial-Up Internet | 0 | 0.0% |
| Broadband Home | 2,442 | 76.7% |
| Cellular Data Only | 251 | 7.9% |
| Satellite Internet | 177 | 5.6% |
| No Internet | 445 | 14.0% |
| Total | 3,183 | 100.0% |
Milan Summary
Milan, Tennessee is a small city located in Gibson County, in the western part of the state. It is situated along the banks of the South Fork of the Obion River, and is part of the Jackson Metropolitan Statistical Area. The city has a population of around 8,000 people, and is the county seat of Gibson County.
History
The area that is now Milan was first settled in the early 1800s by settlers from North Carolina and Virginia. The town was originally known as “Miles Station”, after the Miles family who owned the land. In 1836, the town was renamed “Milan”, after the Italian city of the same name. The town was officially incorporated in 1845.
In the late 1800s, Milan was a thriving agricultural center, with a large number of cotton plantations. The town was also home to several manufacturing businesses, including a cotton mill, a furniture factory, and a brickyard.
In the early 1900s, Milan experienced a period of growth and prosperity. The town was home to several banks, a newspaper, and a number of other businesses. The town also had a thriving entertainment scene, with several theaters, a movie house, and a number of restaurants.
Geography
Milan is located in western Tennessee, in Gibson County. The city is situated along the banks of the South Fork of the Obion River. The city is located about 80 miles northeast of Memphis, and about 50 miles west of Jackson.
The city has a total area of 8.3 square miles, of which 8.2 square miles is land and 0.1 square miles is water. The city is located in a hilly region, with elevations ranging from 500 to 800 feet above sea level.
Economy
The economy of Milan is largely based on agriculture and manufacturing. The city is home to several large farms, which produce a variety of crops, including cotton, soybeans, corn, and wheat. The city is also home to several manufacturing businesses, including a furniture factory, a brickyard, and a cotton mill.
The city is also home to several retail businesses, including a number of restaurants, grocery stores, and other shops. The city is also home to a number of medical facilities, including a hospital and several clinics.
Demographics
As of the 2010 census, the population of Milan was 8,068. The racial makeup of the city was 79.2% White, 17.7% African American, 0.3% Native American, 0.4% Asian, 0.1% Pacific Islander, 0.7% from other races, and 1.6% from two or more races. Hispanic or Latino of any race were 2.2% of the population.
The median household income in Milan was $31,944, and the median family income was $41,944. The per capita income for the city was $17,845. About 17.2% of the population was below the poverty line.
Common Questions
What is Per Capita Income in Milan?
Per Capita income in Milan is $25,981.
What is the Median Family Income in Milan?
Median Family Income in Milan is $63,589.
What is the Median Household income in Milan?
Median Household Income in Milan is $42,909.
What is Income or Wage Gap in Milan?
Income or Wage Gap in Milan is 18.0%.
Women in Milan earn 82.0 cents for every dollar earned by a man.
What is Family Income Deficit in Milan?
Family Income Deficit in Milan is $8,917.
Families that are below poverty line in Milan earn $8,917 less on average than the poverty threshold level.
What is Inequality or Gini Index in Milan?
Inequality or Gini Index in Milan is 0.47.
What is the Total Population of Milan?
Total Population of Milan is 8,165.
What is the Total Male Population of Milan?
Total Male Population of Milan is 3,781.
What is the Total Female Population of Milan?
Total Female Population of Milan is 4,384.
What is the Ratio of Males per 100 Females in Milan?
There are 86.25 Males per 100 Females in Milan.
What is the Ratio of Females per 100 Males in Milan?
There are 115.95 Females per 100 Males in Milan.
What is the Median Population Age in Milan?
Median Population Age in Milan is 36.9 Years.
What is the Average Family Size in Milan
Average Family Size in Milan is 3.3 People.
What is the Average Household Size in Milan
Average Household Size in Milan is 2.5 People.
How Large is the Labor Force in Milan?
There are 3,464 People in the Labor Forcein in Milan.
What is the Percentage of People in the Labor Force in Milan?
57.3% of People are in the Labor Force in Milan.
What is the Unemployment Rate in Milan?
Unemployment Rate in Milan is 4.9%.