Edgewater, MD Map & Demographics
Edgewater Map
Edgewater Overview
$49,072
PER CAPITA INCOME
$130,194
AVG FAMILY INCOME
$105,849
AVG HOUSEHOLD INCOME
10.1%
WAGE / INCOME GAP [ % ]
89.9¢/ $1
WAGE / INCOME GAP [ $ ]
$11,163
FAMILY INCOME DEFICIT
0.37
INEQUALITY / GINI INDEX
8,928
TOTAL POPULATION
4,482
MALE POPULATION
4,446
FEMALE POPULATION
100.81
MALES / 100 FEMALES
99.20
FEMALES / 100 MALES
40.7
MEDIAN AGE
3.0
AVG FAMILY SIZE
2.4
AVG HOUSEHOLD SIZE
5,009
LABOR FORCE [ PEOPLE ]
66.6%
PERCENT IN LABOR FORCE
4.5%
UNEMPLOYMENT RATE
Edgewater Zip Codes
Income in Edgewater
Income Overview in Edgewater
Per Capita Income in Edgewater is $49,072, while median incomes of families and households are $130,194 and $105,849 respectively.
| Characteristic | Number | Measure |
| Per Capita Income | 8,928 | $49,072 |
| Median Family Income | 2,301 | $130,194 |
| Mean Family Income | 2,301 | $135,374 |
| Median Household Income | 3,608 | $105,849 |
| Mean Household Income | 3,608 | $119,317 |
| Income Deficit | 2,301 | $11,163 |
| Wage / Income Gap (%) | 8,928 | 10.13% |
| Wage / Income Gap ($) | 8,928 | 89.87¢ per $1 |
| Gini / Inequality Index | 8,928 | 0.37 |
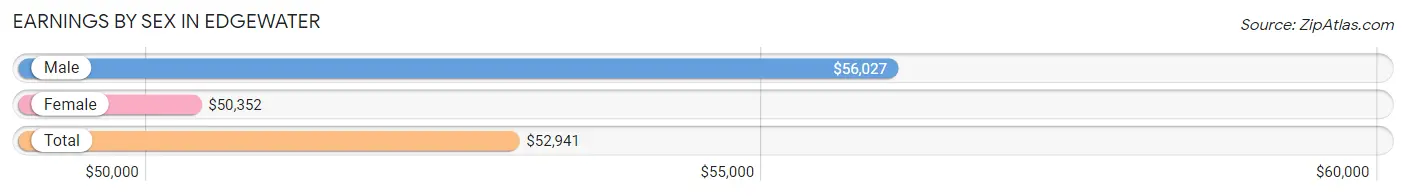
Earnings by Sex in Edgewater
Average Earnings in Edgewater are $52,941, $56,027 for men and $50,352 for women, a difference of 10.1%.
| Sex | Number | Average Earnings |
| Male | 2,883 (56.0%) | $56,027 |
| Female | 2,266 (44.0%) | $50,352 |
| Total | 5,149 (100.0%) | $52,941 |
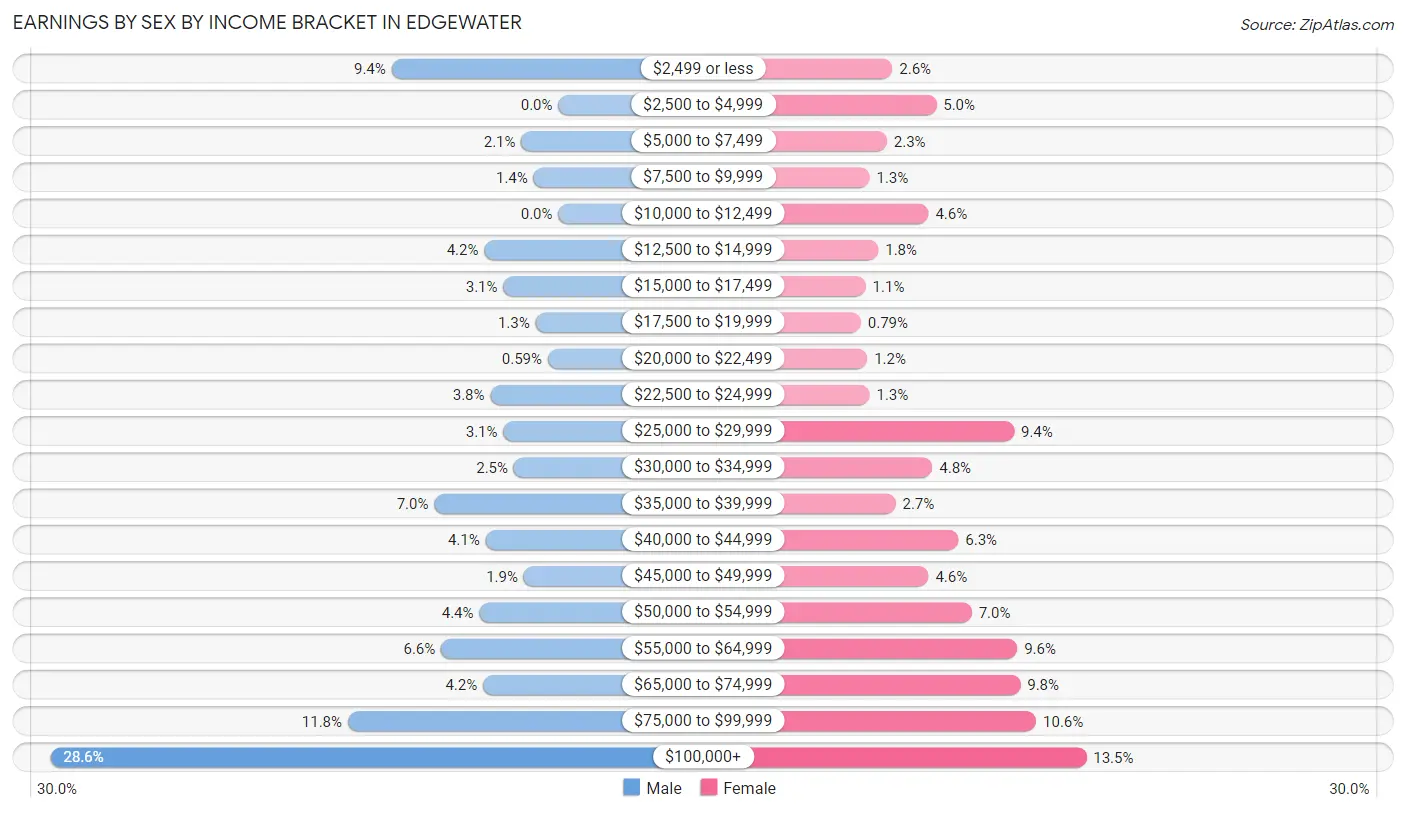
Earnings by Sex by Income Bracket in Edgewater
The most common earnings brackets in Edgewater are $100,000+ for men (823 | 28.5%) and $100,000+ for women (305 | 13.5%).
| Income | Male | Female |
| $2,499 or less | 270 (9.4%) | 58 (2.6%) |
| $2,500 to $4,999 | 0 (0.0%) | 114 (5.0%) |
| $5,000 to $7,499 | 60 (2.1%) | 51 (2.2%) |
| $7,500 to $9,999 | 40 (1.4%) | 29 (1.3%) |
| $10,000 to $12,499 | 0 (0.0%) | 104 (4.6%) |
| $12,500 to $14,999 | 120 (4.2%) | 40 (1.8%) |
| $15,000 to $17,499 | 89 (3.1%) | 24 (1.1%) |
| $17,500 to $19,999 | 37 (1.3%) | 18 (0.8%) |
| $20,000 to $22,499 | 17 (0.6%) | 26 (1.1%) |
| $22,500 to $24,999 | 110 (3.8%) | 29 (1.3%) |
| $25,000 to $29,999 | 89 (3.1%) | 213 (9.4%) |
| $30,000 to $34,999 | 72 (2.5%) | 109 (4.8%) |
| $35,000 to $39,999 | 201 (7.0%) | 62 (2.7%) |
| $40,000 to $44,999 | 118 (4.1%) | 142 (6.3%) |
| $45,000 to $49,999 | 56 (1.9%) | 104 (4.6%) |
| $50,000 to $54,999 | 128 (4.4%) | 159 (7.0%) |
| $55,000 to $64,999 | 190 (6.6%) | 217 (9.6%) |
| $65,000 to $74,999 | 122 (4.2%) | 221 (9.8%) |
| $75,000 to $99,999 | 341 (11.8%) | 241 (10.6%) |
| $100,000+ | 823 (28.5%) | 305 (13.5%) |
| Total | 2,883 (100.0%) | 2,266 (100.0%) |
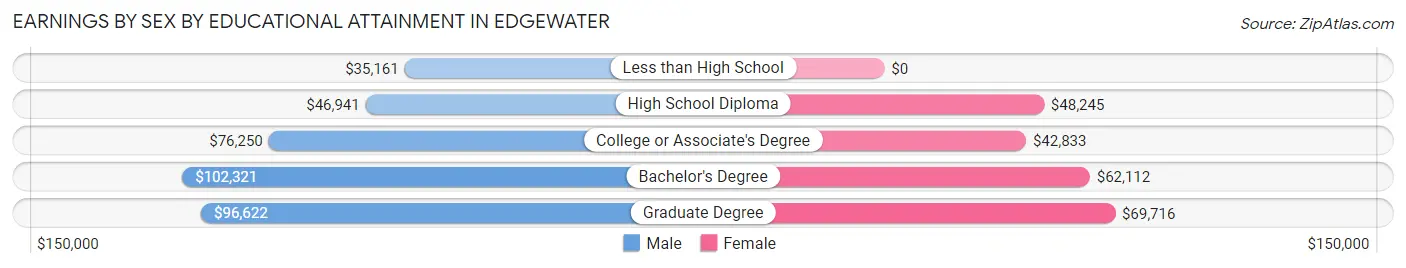
Earnings by Sex by Educational Attainment in Edgewater
Average earnings in Edgewater are $65,694 for men and $52,342 for women, a difference of 20.3%. Men with an educational attainment of bachelor's degree enjoy the highest average annual earnings of $102,321, while those with less than high school education earn the least with $35,161. Women with an educational attainment of graduate degree earn the most with the average annual earnings of $69,716, while those with college or associate's degree education have the smallest earnings of $42,833.
| Educational Attainment | Male Income | Female Income |
| Less than High School | $35,161 | $0 |
| High School Diploma | $46,941 | $48,245 |
| College or Associate's Degree | $76,250 | $42,833 |
| Bachelor's Degree | $102,321 | $62,112 |
| Graduate Degree | $96,622 | $69,716 |
| Total | $65,694 | $52,342 |
Family Income in Edgewater
Family Income Brackets in Edgewater
According to the Edgewater family income data, there are 582 families falling into the $100,000 to $149,999 income range, which is the most common income bracket and makes up 25.3% of all families. Conversely, the $25,000 to $34,999 income bracket is the least frequent group with only 16 families (0.7%) belonging to this category.
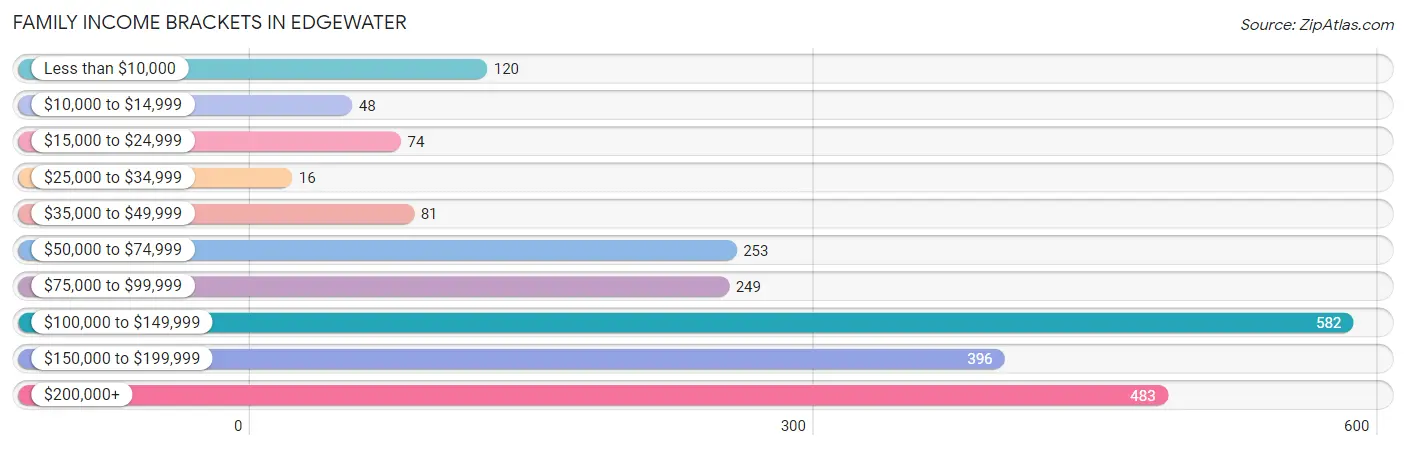
| Income Bracket | # Families | % Families |
| Less than $10,000 | 120 | 5.2% |
| $10,000 to $14,999 | 48 | 2.1% |
| $15,000 to $24,999 | 74 | 3.2% |
| $25,000 to $34,999 | 16 | 0.7% |
| $35,000 to $49,999 | 81 | 3.5% |
| $50,000 to $74,999 | 253 | 11.0% |
| $75,000 to $99,999 | 249 | 10.8% |
| $100,000 to $149,999 | 582 | 25.3% |
| $150,000 to $199,999 | 396 | 17.2% |
| $200,000+ | 483 | 21.0% |
Family Income by Famaliy Size in Edgewater
5-person families (116 | 5.0%) account for the highest median family income in Edgewater with $152,059 per family, while 2-person families (1,017 | 44.2%) have the highest median income of $65,104 per family member.
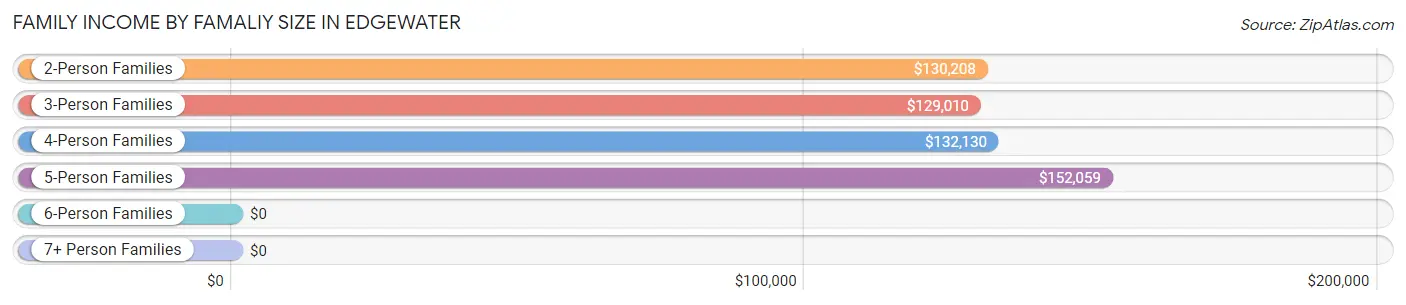
| Income Bracket | # Families | Median Income |
| 2-Person Families | 1,017 (44.2%) | $130,208 |
| 3-Person Families | 712 (30.9%) | $129,010 |
| 4-Person Families | 368 (16.0%) | $132,130 |
| 5-Person Families | 116 (5.0%) | $152,059 |
| 6-Person Families | 74 (3.2%) | $0 |
| 7+ Person Families | 14 (0.6%) | $0 |
| Total | 2,301 (100.0%) | $130,194 |
Family Income by Number of Earners in Edgewater
The median family income in Edgewater is $130,194, with families comprising 3+ earners (253) having the highest median family income of $168,884, while families with no earners (270) have the lowest median family income of $81,170, accounting for 11.0% and 11.7% of families, respectively.
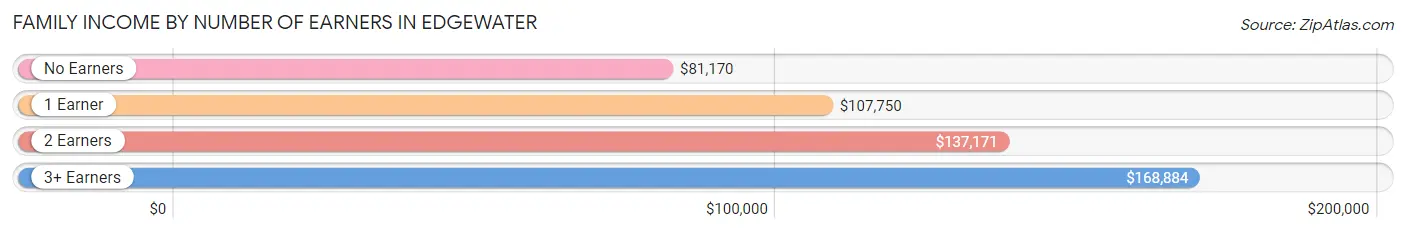
| Number of Earners | # Families | Median Income |
| No Earners | 270 (11.7%) | $81,170 |
| 1 Earner | 484 (21.0%) | $107,750 |
| 2 Earners | 1,294 (56.2%) | $137,171 |
| 3+ Earners | 253 (11.0%) | $168,884 |
| Total | 2,301 (100.0%) | $130,194 |
Household Income in Edgewater
Household Income Brackets in Edgewater
With 895 households falling in the category, the $100,000 to $149,999 income range is the most frequent in Edgewater, accounting for 24.8% of all households. In contrast, only 29 households (0.8%) fall into the $10,000 to $14,999 income bracket, making it the least populous group.
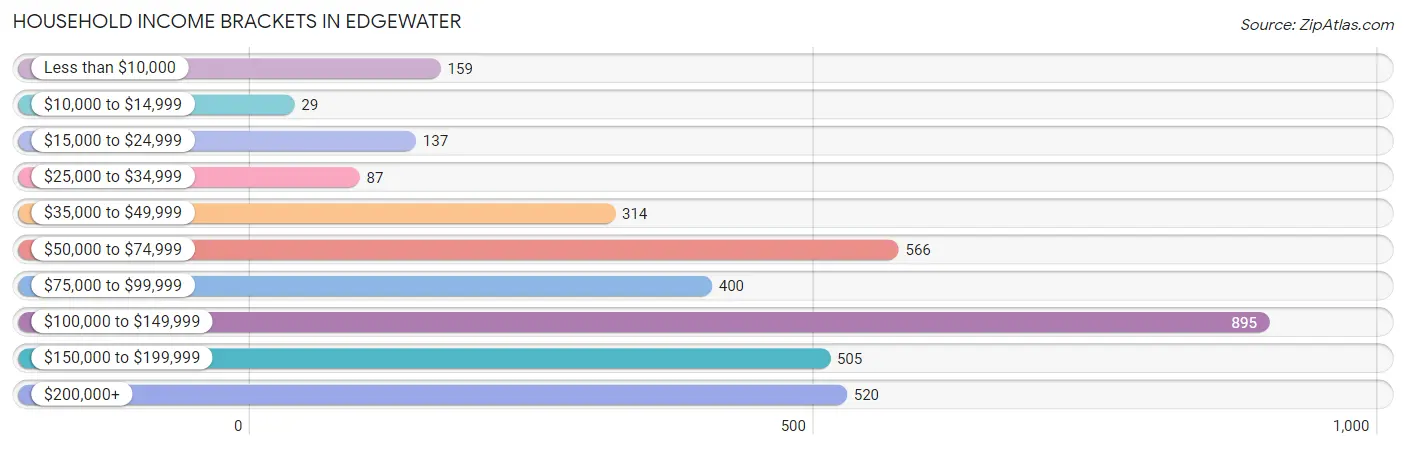
| Income Bracket | # Households | % Households |
| Less than $10,000 | 159 | 4.4% |
| $10,000 to $14,999 | 29 | 0.8% |
| $15,000 to $24,999 | 137 | 3.8% |
| $25,000 to $34,999 | 87 | 2.4% |
| $35,000 to $49,999 | 314 | 8.7% |
| $50,000 to $74,999 | 566 | 15.7% |
| $75,000 to $99,999 | 400 | 11.1% |
| $100,000 to $149,999 | 895 | 24.8% |
| $150,000 to $199,999 | 505 | 14.0% |
| $200,000+ | 520 | 14.4% |
Household Income by Householder Age in Edgewater
The median household income in Edgewater is $105,849, with the highest median household income of $119,063 found in the 25 to 44 years age bracket for the primary householder. A total of 1,029 households (28.5%) fall into this category. Meanwhile, the 15 to 24 years age bracket for the primary householder has the lowest median household income of $0, with 36 households (1.0%) in this group.
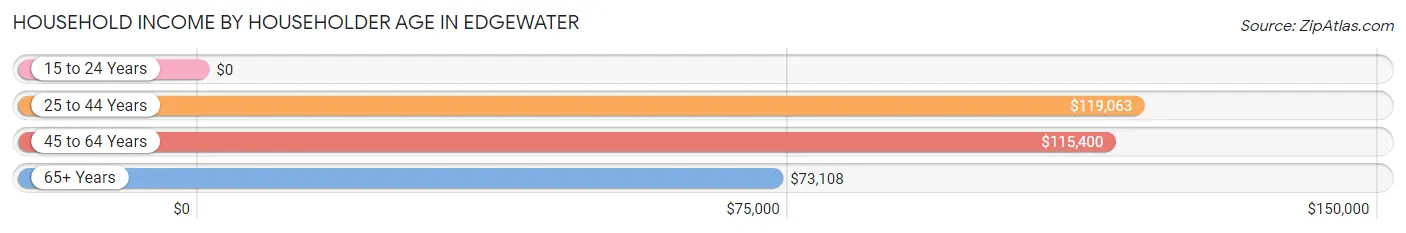
| Income Bracket | # Households | Median Income |
| 15 to 24 Years | 36 (1.0%) | $0 |
| 25 to 44 Years | 1,029 (28.5%) | $119,063 |
| 45 to 64 Years | 1,402 (38.9%) | $115,400 |
| 65+ Years | 1,141 (31.6%) | $73,108 |
| Total | 3,608 (100.0%) | $105,849 |
Poverty in Edgewater
Income Below Poverty by Sex and Age in Edgewater
With 8.6% poverty level for males and 13.3% for females among the residents of Edgewater, 16 and 17 year old males and under 5 year old females are the most vulnerable to poverty, with 62 males (31.5%) and 80 females (34.8%) in their respective age groups living below the poverty level.
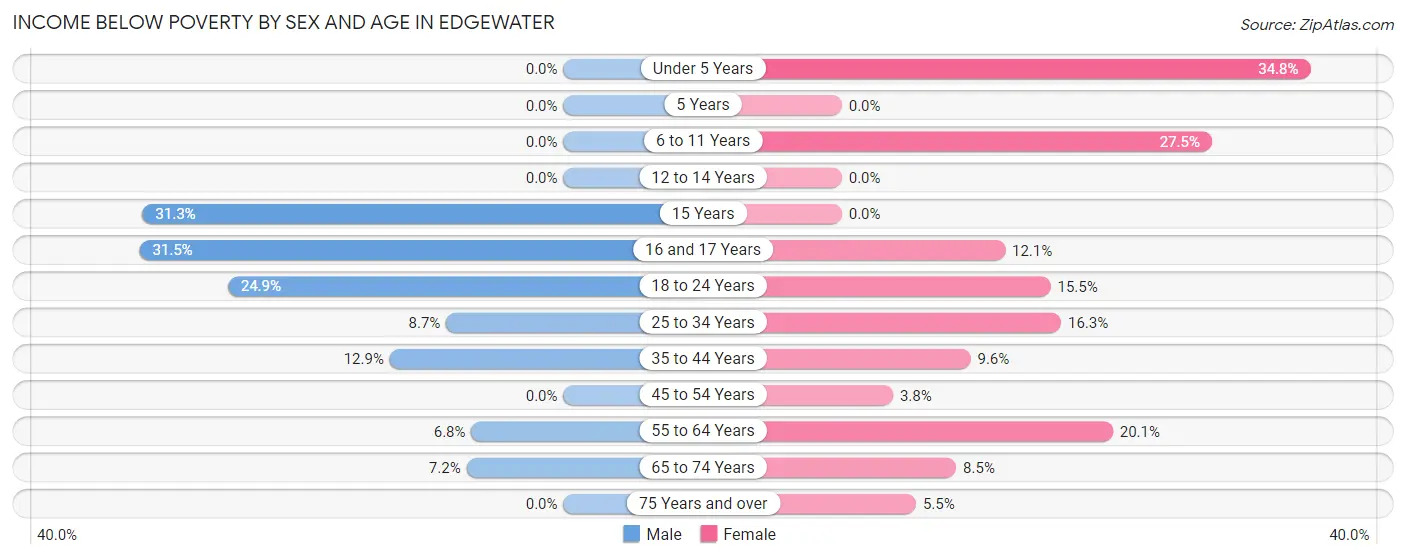
| Age Bracket | Male | Female |
| Under 5 Years | 0 (0.0%) | 80 (34.8%) |
| 5 Years | 0 (0.0%) | 0 (0.0%) |
| 6 to 11 Years | 0 (0.0%) | 89 (27.5%) |
| 12 to 14 Years | 0 (0.0%) | 0 (0.0%) |
| 15 Years | 30 (31.2%) | 0 (0.0%) |
| 16 and 17 Years | 62 (31.5%) | 8 (12.1%) |
| 18 to 24 Years | 73 (24.9%) | 31 (15.5%) |
| 25 to 34 Years | 64 (8.7%) | 111 (16.3%) |
| 35 to 44 Years | 92 (12.9%) | 50 (9.6%) |
| 45 to 54 Years | 0 (0.0%) | 21 (3.8%) |
| 55 to 64 Years | 34 (6.8%) | 129 (20.1%) |
| 65 to 74 Years | 24 (7.2%) | 46 (8.5%) |
| 75 Years and over | 0 (0.0%) | 20 (5.5%) |
| Total | 379 (8.6%) | 585 (13.3%) |
Income Above Poverty by Sex and Age in Edgewater
According to the poverty statistics in Edgewater, males aged under 5 years and females aged 5 years are the age groups that are most secure financially, with 100.0% of males and 100.0% of females in these age groups living above the poverty line.
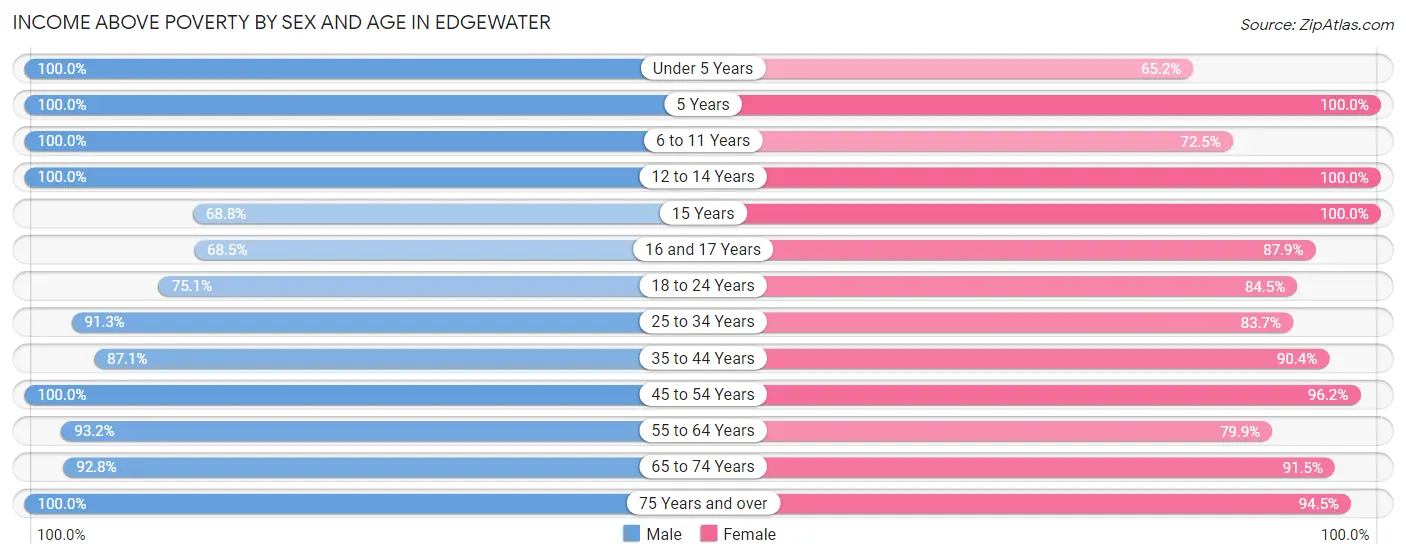
| Age Bracket | Male | Female |
| Under 5 Years | 155 (100.0%) | 150 (65.2%) |
| 5 Years | 35 (100.0%) | 55 (100.0%) |
| 6 to 11 Years | 179 (100.0%) | 235 (72.5%) |
| 12 to 14 Years | 92 (100.0%) | 203 (100.0%) |
| 15 Years | 66 (68.8%) | 30 (100.0%) |
| 16 and 17 Years | 135 (68.5%) | 58 (87.9%) |
| 18 to 24 Years | 220 (75.1%) | 169 (84.5%) |
| 25 to 34 Years | 672 (91.3%) | 571 (83.7%) |
| 35 to 44 Years | 622 (87.1%) | 473 (90.4%) |
| 45 to 54 Years | 614 (100.0%) | 532 (96.2%) |
| 55 to 64 Years | 464 (93.2%) | 512 (79.9%) |
| 65 to 74 Years | 310 (92.8%) | 496 (91.5%) |
| 75 Years and over | 456 (100.0%) | 343 (94.5%) |
| Total | 4,020 (91.4%) | 3,827 (86.7%) |
Income Below Poverty Among Married-Couple Families in Edgewater
The poverty statistics for married-couple families in Edgewater show that 6.4% or 113 of the total 1,779 families live below the poverty line. Families with 1 or 2 children have the highest poverty rate of 16.0%, comprising of 90 families. On the other hand, families with 3 or 4 children have the lowest poverty rate of 0.0%, which includes 0 families.
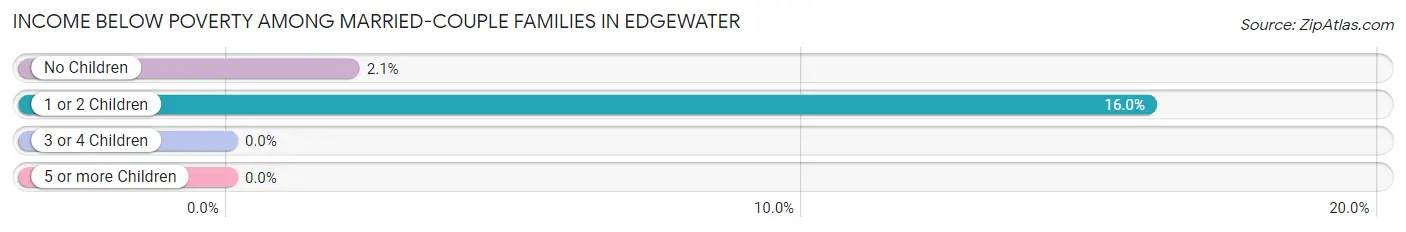
| Children | Above Poverty | Below Poverty |
| No Children | 1,061 (97.9%) | 23 (2.1%) |
| 1 or 2 Children | 473 (84.0%) | 90 (16.0%) |
| 3 or 4 Children | 132 (100.0%) | 0 (0.0%) |
| 5 or more Children | 0 (0.0%) | 0 (0.0%) |
| Total | 1,666 (93.6%) | 113 (6.4%) |
Income Below Poverty Among Single-Parent Households in Edgewater
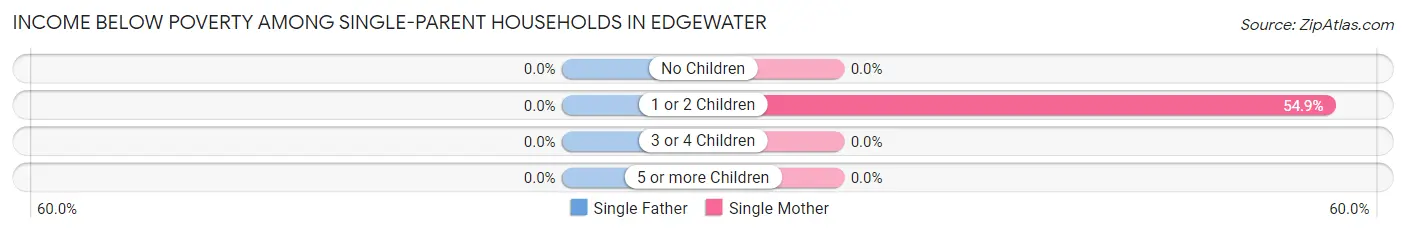
| Children | Single Father | Single Mother |
| No Children | 0 (0.0%) | 0 (0.0%) |
| 1 or 2 Children | 0 (0.0%) | 128 (54.9%) |
| 3 or 4 Children | 0 (0.0%) | 0 (0.0%) |
| 5 or more Children | 0 (0.0%) | 0 (0.0%) |
| Total | 0 (0.0%) | 128 (28.7%) |
Income Below Poverty Among Married-Couple vs Single-Parent Households in Edgewater
The poverty data for Edgewater shows that 113 of the married-couple family households (6.4%) and 128 of the single-parent households (24.5%) are living below the poverty level. Within the married-couple family households, those with 1 or 2 children have the highest poverty rate, with 90 households (16.0%) falling below the poverty line. Among the single-parent households, those with 1 or 2 children have the highest poverty rate, with 128 household (49.2%) living below poverty.
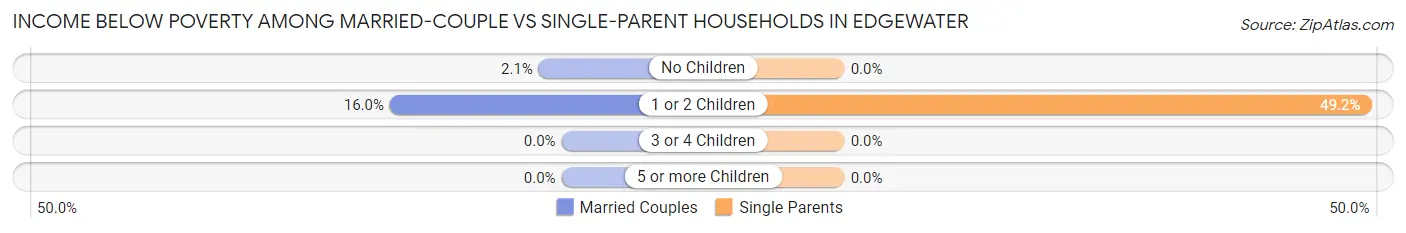
| Children | Married-Couple Families | Single-Parent Households |
| No Children | 23 (2.1%) | 0 (0.0%) |
| 1 or 2 Children | 90 (16.0%) | 128 (49.2%) |
| 3 or 4 Children | 0 (0.0%) | 0 (0.0%) |
| 5 or more Children | 0 (0.0%) | 0 (0.0%) |
| Total | 113 (6.4%) | 128 (24.5%) |
Race in Edgewater
The most populous races in Edgewater are White / Caucasian (7,996 | 89.6%), Hispanic or Latino (707 | 7.9%), and Black / African American (587 | 6.6%).
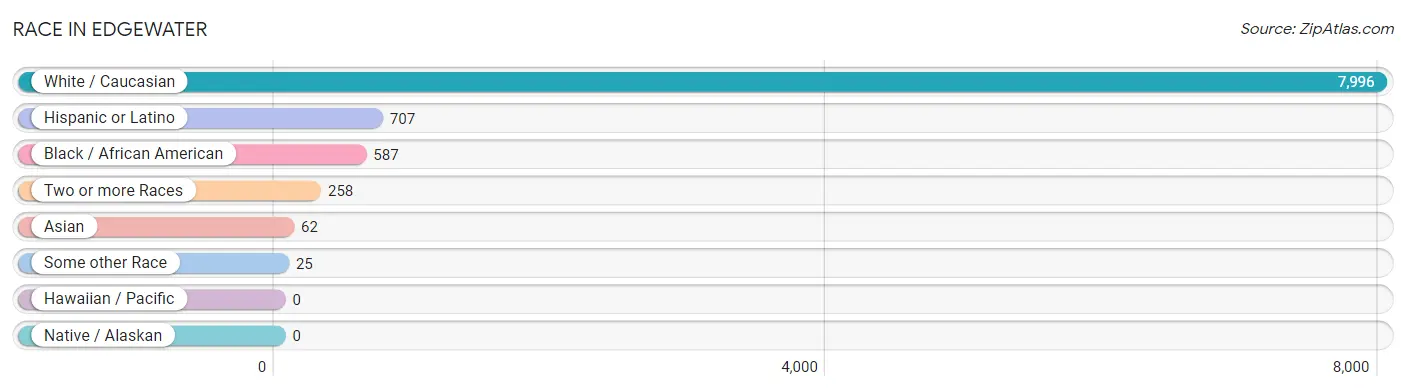
| Race | # Population | % Population |
| Asian | 62 | 0.7% |
| Black / African American | 587 | 6.6% |
| Hawaiian / Pacific | 0 | 0.0% |
| Hispanic or Latino | 707 | 7.9% |
| Native / Alaskan | 0 | 0.0% |
| White / Caucasian | 7,996 | 89.6% |
| Two or more Races | 258 | 2.9% |
| Some other Race | 25 | 0.3% |
| Total | 8,928 | 100.0% |
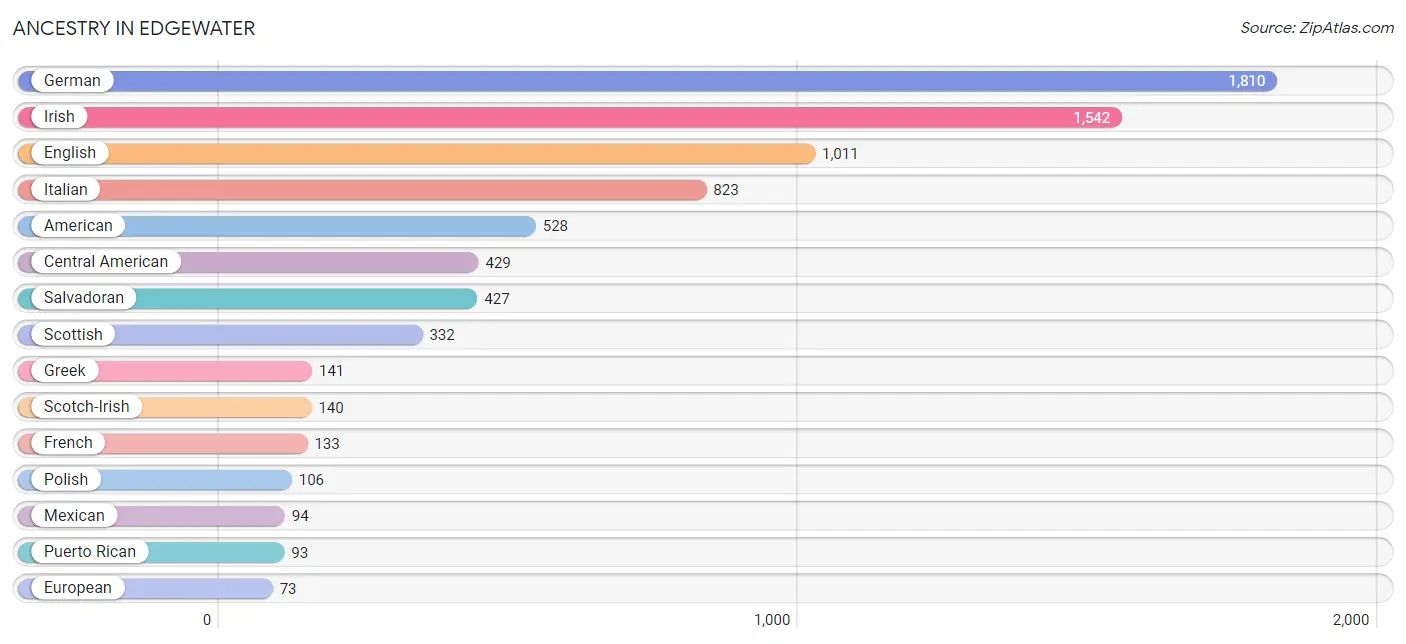
Ancestry in Edgewater
The most populous ancestries reported in Edgewater are German (1,810 | 20.3%), Irish (1,542 | 17.3%), English (1,011 | 11.3%), Italian (823 | 9.2%), and American (528 | 5.9%), together accounting for 64.0% of all Edgewater residents.
| Ancestry | # Population | % Population |
| American | 528 | 5.9% |
| Arab | 38 | 0.4% |
| Argentinean | 32 | 0.4% |
| Brazilian | 8 | 0.1% |
| British | 26 | 0.3% |
| Canadian | 8 | 0.1% |
| Carpatho Rusyn | 6 | 0.1% |
| Central American | 429 | 4.8% |
| Colombian | 16 | 0.2% |
| Cuban | 12 | 0.1% |
| Czech | 14 | 0.2% |
| Danish | 24 | 0.3% |
| Delaware | 10 | 0.1% |
| Dutch | 60 | 0.7% |
| Eastern European | 71 | 0.8% |
| English | 1,011 | 11.3% |
| European | 73 | 0.8% |
| French | 133 | 1.5% |
| French Canadian | 33 | 0.4% |
| German | 1,810 | 20.3% |
| Ghanaian | 22 | 0.3% |
| Greek | 141 | 1.6% |
| Guatemalan | 2 | 0.0% |
| Hungarian | 57 | 0.6% |
| Icelander | 21 | 0.2% |
| Iranian | 11 | 0.1% |
| Irish | 1,542 | 17.3% |
| Israeli | 8 | 0.1% |
| Italian | 823 | 9.2% |
| Korean | 31 | 0.4% |
| Lebanese | 20 | 0.2% |
| Lithuanian | 10 | 0.1% |
| Malaysian | 20 | 0.2% |
| Mexican | 94 | 1.1% |
| Nigerian | 15 | 0.2% |
| Norwegian | 29 | 0.3% |
| Pennsylvania German | 23 | 0.3% |
| Polish | 106 | 1.2% |
| Portuguese | 20 | 0.2% |
| Puerto Rican | 93 | 1.0% |
| Russian | 30 | 0.3% |
| Salvadoran | 427 | 4.8% |
| Scandinavian | 32 | 0.4% |
| Scotch-Irish | 140 | 1.6% |
| Scottish | 332 | 3.7% |
| Serbian | 58 | 0.6% |
| South African | 22 | 0.3% |
| South American | 48 | 0.5% |
| Spaniard | 23 | 0.3% |
| Spanish | 8 | 0.1% |
| Sri Lankan | 9 | 0.1% |
| Subsaharan African | 59 | 0.7% |
| Swedish | 32 | 0.4% |
| Swiss | 12 | 0.1% |
| Thai | 16 | 0.2% |
| Turkish | 29 | 0.3% |
| Ukrainian | 14 | 0.2% |
| Welsh | 53 | 0.6% | View All 58 Rows |
Immigrants in Edgewater
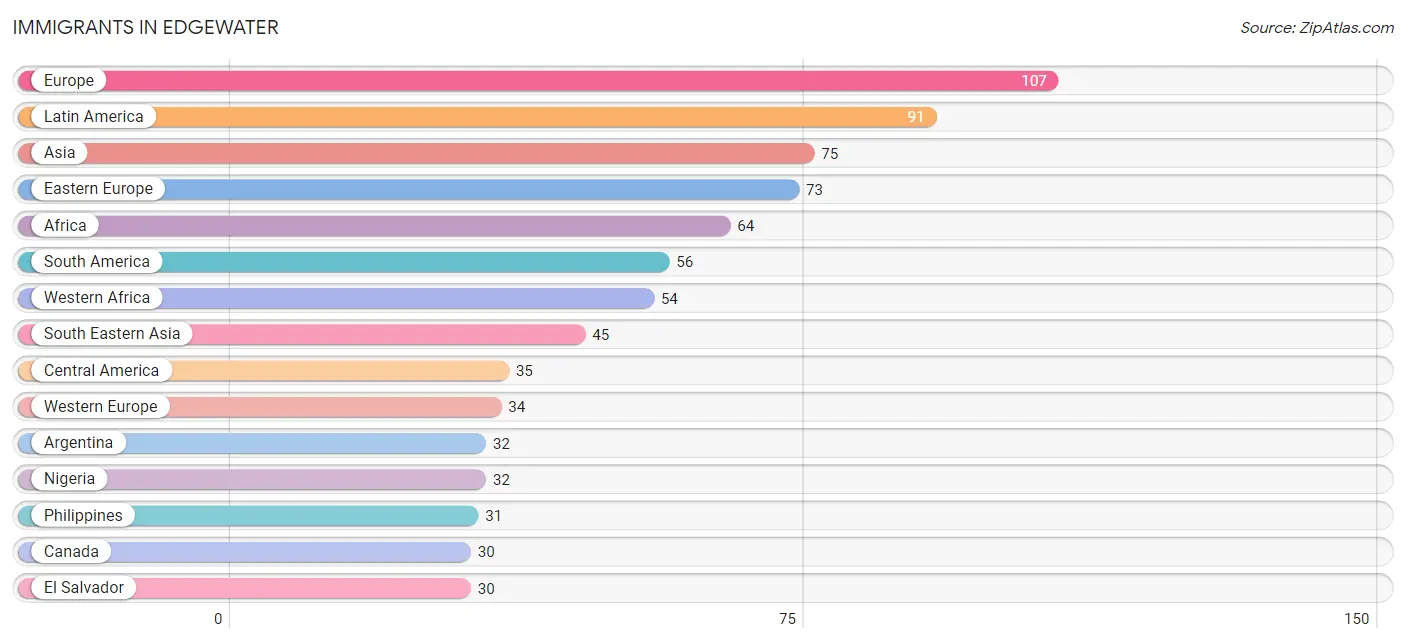
The most numerous immigrant groups reported in Edgewater came from Europe (107 | 1.2%), Latin America (91 | 1.0%), Asia (75 | 0.8%), Eastern Europe (73 | 0.8%), and Africa (64 | 0.7%), together accounting for 4.6% of all Edgewater residents.
| Immigration Origin | # Population | % Population |
| Africa | 64 | 0.7% |
| Albania | 20 | 0.2% |
| Argentina | 32 | 0.4% |
| Asia | 75 | 0.8% |
| Bosnia and Herzegovina | 15 | 0.2% |
| Brazil | 8 | 0.1% |
| Canada | 30 | 0.3% |
| Central America | 35 | 0.4% |
| Colombia | 16 | 0.2% |
| Eastern Europe | 73 | 0.8% |
| El Salvador | 30 | 0.3% |
| Europe | 107 | 1.2% |
| Germany | 25 | 0.3% |
| Ghana | 22 | 0.3% |
| Hungary | 24 | 0.3% |
| India | 5 | 0.1% |
| Jordan | 10 | 0.1% |
| Latin America | 91 | 1.0% |
| Mexico | 5 | 0.1% |
| Netherlands | 9 | 0.1% |
| Nigeria | 32 | 0.4% |
| Philippines | 31 | 0.4% |
| Serbia | 14 | 0.2% |
| South Africa | 10 | 0.1% |
| South America | 56 | 0.6% |
| South Central Asia | 5 | 0.1% |
| South Eastern Asia | 45 | 0.5% |
| Turkey | 15 | 0.2% |
| Vietnam | 14 | 0.2% |
| Western Africa | 54 | 0.6% |
| Western Asia | 25 | 0.3% |
| Western Europe | 34 | 0.4% | View All 32 Rows |
Sex and Age in Edgewater
Sex and Age in Edgewater
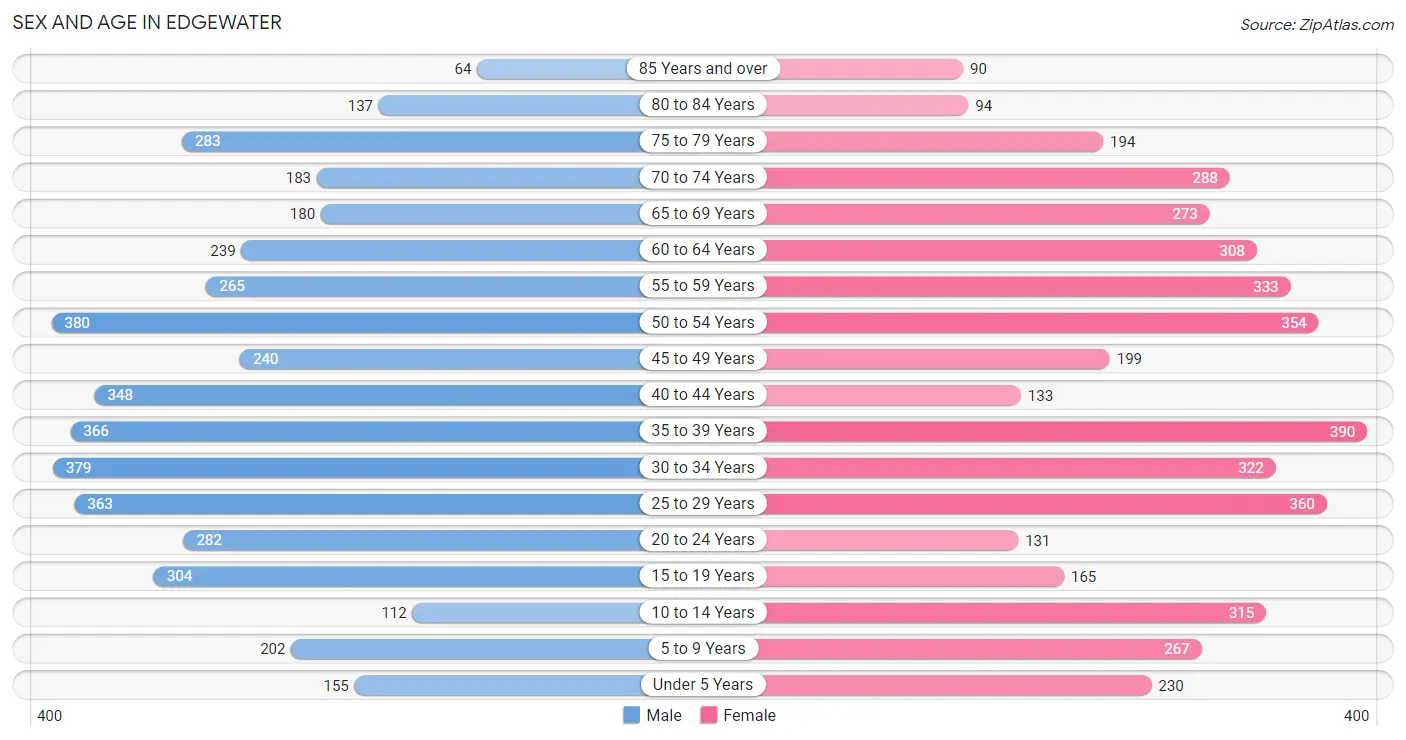
The most populous age groups in Edgewater are 50 to 54 Years (380 | 8.5%) for men and 35 to 39 Years (390 | 8.8%) for women.
| Age Bracket | Male | Female |
| Under 5 Years | 155 (3.5%) | 230 (5.2%) |
| 5 to 9 Years | 202 (4.5%) | 267 (6.0%) |
| 10 to 14 Years | 112 (2.5%) | 315 (7.1%) |
| 15 to 19 Years | 304 (6.8%) | 165 (3.7%) |
| 20 to 24 Years | 282 (6.3%) | 131 (2.9%) |
| 25 to 29 Years | 363 (8.1%) | 360 (8.1%) |
| 30 to 34 Years | 379 (8.5%) | 322 (7.2%) |
| 35 to 39 Years | 366 (8.2%) | 390 (8.8%) |
| 40 to 44 Years | 348 (7.8%) | 133 (3.0%) |
| 45 to 49 Years | 240 (5.3%) | 199 (4.5%) |
| 50 to 54 Years | 380 (8.5%) | 354 (8.0%) |
| 55 to 59 Years | 265 (5.9%) | 333 (7.5%) |
| 60 to 64 Years | 239 (5.3%) | 308 (6.9%) |
| 65 to 69 Years | 180 (4.0%) | 273 (6.1%) |
| 70 to 74 Years | 183 (4.1%) | 288 (6.5%) |
| 75 to 79 Years | 283 (6.3%) | 194 (4.4%) |
| 80 to 84 Years | 137 (3.1%) | 94 (2.1%) |
| 85 Years and over | 64 (1.4%) | 90 (2.0%) |
| Total | 4,482 (100.0%) | 4,446 (100.0%) |
Families and Households in Edgewater
Median Family Size in Edgewater
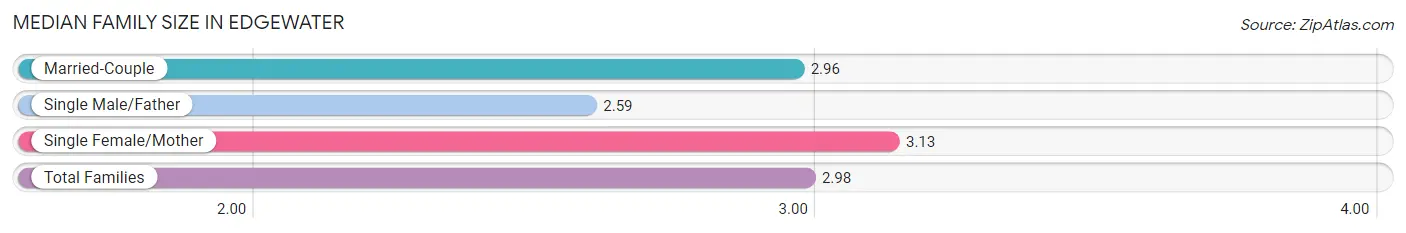
The median family size in Edgewater is 2.98 persons per family, with single female/mother families (446 | 19.4%) accounting for the largest median family size of 3.13 persons per family. On the other hand, single male/father families (76 | 3.3%) represent the smallest median family size with 2.59 persons per family.
| Family Type | # Families | Family Size |
| Married-Couple | 1,779 (77.3%) | 2.96 |
| Single Male/Father | 76 (3.3%) | 2.59 |
| Single Female/Mother | 446 (19.4%) | 3.13 |
| Total Families | 2,301 (100.0%) | 2.98 |
Median Household Size in Edgewater
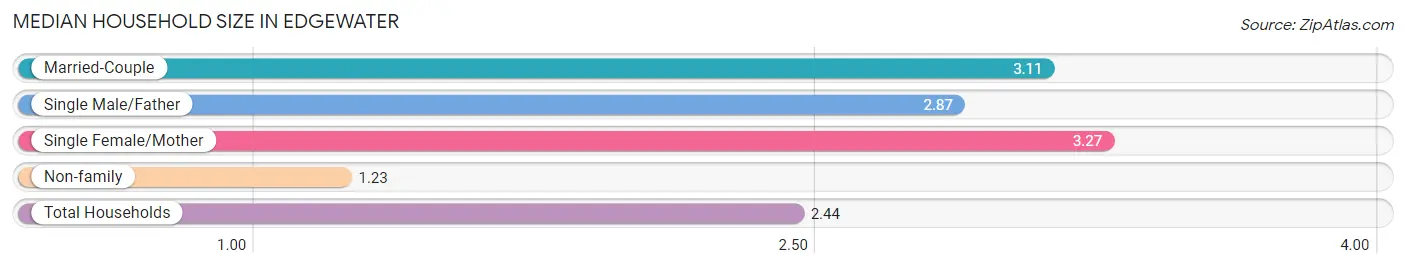
The median household size in Edgewater is 2.44 persons per household, with single female/mother households (446 | 12.4%) accounting for the largest median household size of 3.27 persons per household. non-family households (1,307 | 36.2%) represent the smallest median household size with 1.23 persons per household.
| Household Type | # Households | Household Size |
| Married-Couple | 1,779 (49.3%) | 3.11 |
| Single Male/Father | 76 (2.1%) | 2.87 |
| Single Female/Mother | 446 (12.4%) | 3.27 |
| Non-family | 1,307 (36.2%) | 1.23 |
| Total Households | 3,608 (100.0%) | 2.44 |
Household Size by Marriage Status in Edgewater
Out of a total of 3,608 households in Edgewater, 2,301 (63.8%) are family households, while 1,307 (36.2%) are nonfamily households. The most numerous type of family households are 2-person households, comprising 968, and the most common type of nonfamily households are 1-person households, comprising 1,076.
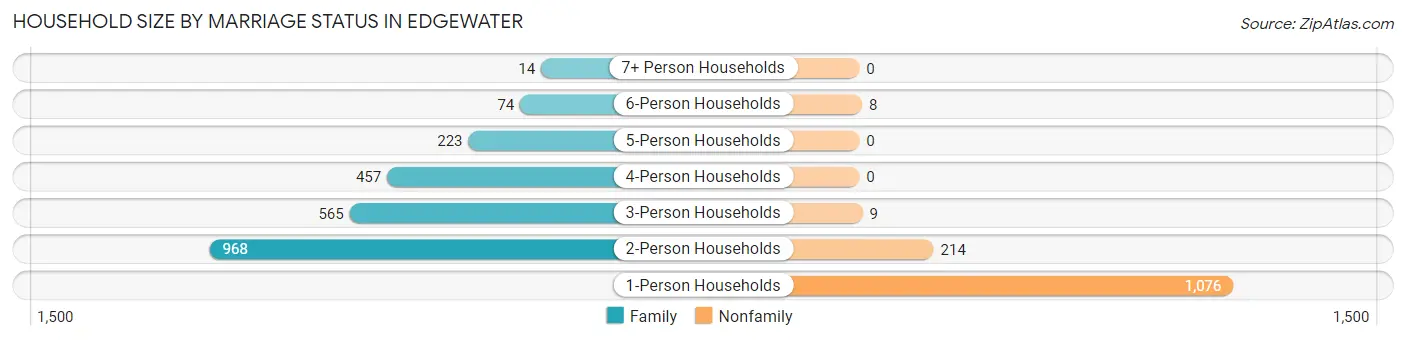
| Household Size | Family Households | Nonfamily Households |
| 1-Person Households | - | 1,076 (29.8%) |
| 2-Person Households | 968 (26.8%) | 214 (5.9%) |
| 3-Person Households | 565 (15.7%) | 9 (0.3%) |
| 4-Person Households | 457 (12.7%) | 0 (0.0%) |
| 5-Person Households | 223 (6.2%) | 0 (0.0%) |
| 6-Person Households | 74 (2.1%) | 8 (0.2%) |
| 7+ Person Households | 14 (0.4%) | 0 (0.0%) |
| Total | 2,301 (63.8%) | 1,307 (36.2%) |
Female Fertility in Edgewater
Fertility by Age in Edgewater
Average fertility rate in Edgewater is 23.0 births per 1,000 women. Women in the age bracket of 35 to 50 years have the highest fertility rate with 39.0 births per 1,000 women. Women in the age bracket of 35 to 50 years acount for 75.6% of all women with births.
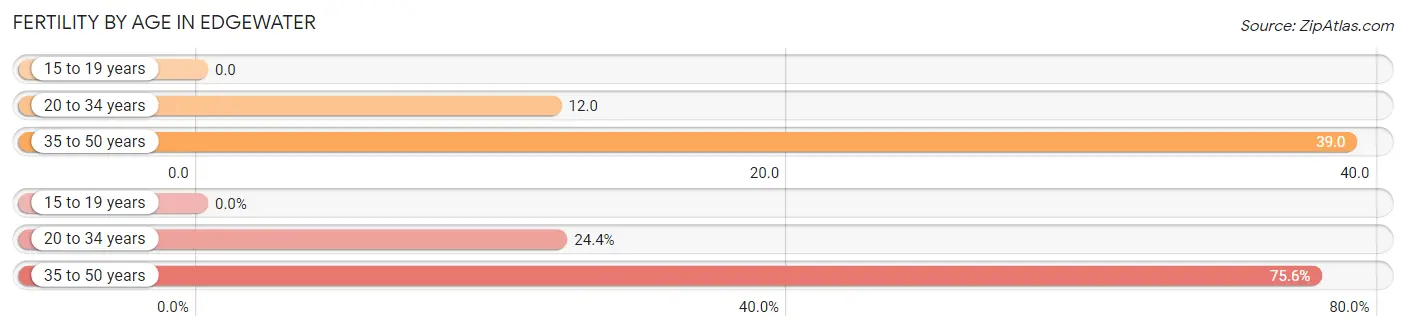
| Age Bracket | Women with Births | Births / 1,000 Women |
| 15 to 19 years | 0 (0.0%) | 0.0 |
| 20 to 34 years | 10 (24.4%) | 12.0 |
| 35 to 50 years | 31 (75.6%) | 39.0 |
| Total | 41 (100.0%) | 23.0 |
Fertility by Age by Marriage Status in Edgewater
80.5% of women with births (41) in Edgewater are married. The highest percentage of unmarried women with births falls into 35 to 50 years age bracket with 25.8% of them unmarried at the time of birth, while the lowest percentage of unmarried women with births belong to 20 to 34 years age bracket with 0.0% of them unmarried.
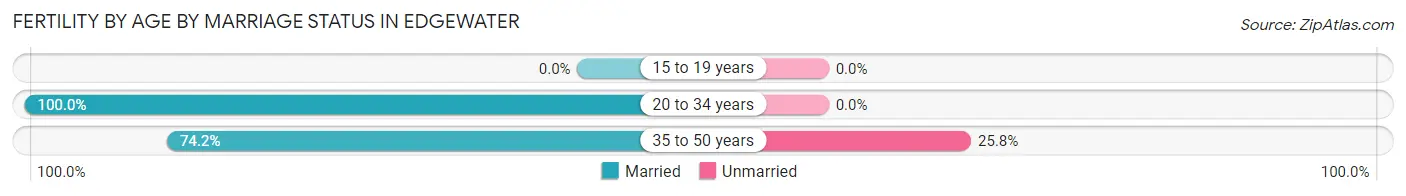
| Age Bracket | Married | Unmarried |
| 15 to 19 years | 0 (0.0%) | 0 (0.0%) |
| 20 to 34 years | 10 (100.0%) | 0 (0.0%) |
| 35 to 50 years | 23 (74.2%) | 8 (25.8%) |
| Total | 33 (80.5%) | 8 (19.5%) |
Fertility by Education in Edgewater
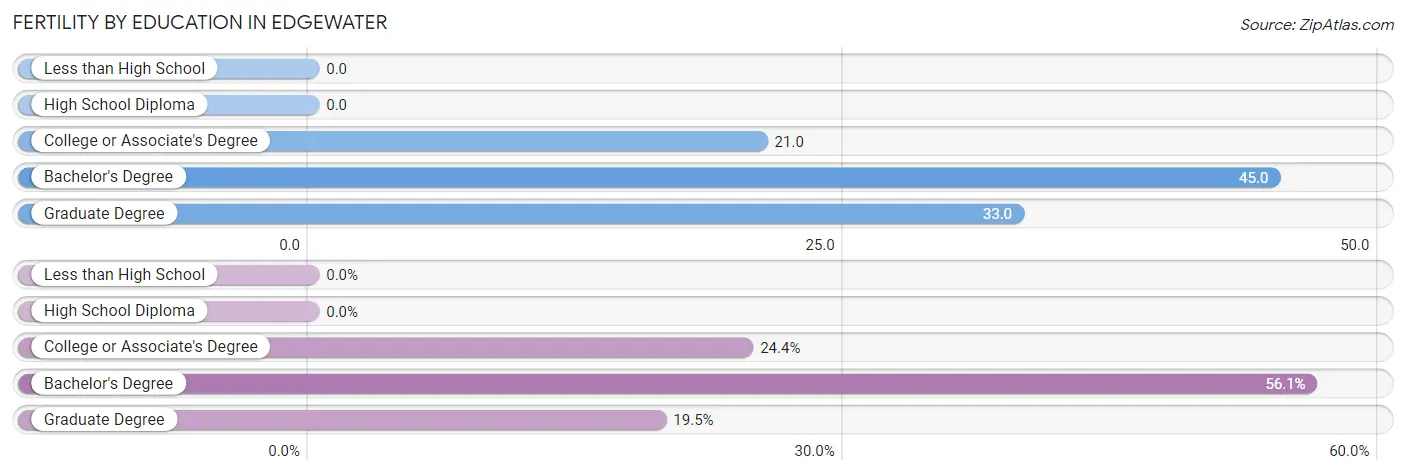
| Educational Attainment | Women with Births | Births / 1,000 Women |
| Less than High School | 0 (0.0%) | 0.0 |
| High School Diploma | 0 (0.0%) | 0.0 |
| College or Associate's Degree | 10 (24.4%) | 21.0 |
| Bachelor's Degree | 23 (56.1%) | 45.0 |
| Graduate Degree | 8 (19.5%) | 33.0 |
| Total | 41 (100.0%) | 23.0 |
Fertility by Education by Marriage Status in Edgewater
19.5% of women with births in Edgewater are unmarried. Women with the educational attainment of college or associate's degree are most likely to be married with 100.0% of them married at childbirth, while women with the educational attainment of bachelor's degree are least likely to be married with 34.8% of them unmarried at childbirth.
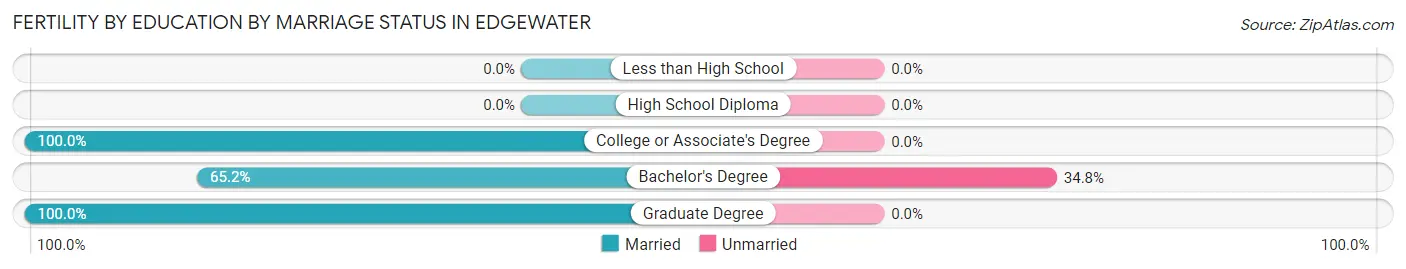
| Educational Attainment | Married | Unmarried |
| Less than High School | 0 (0.0%) | 0 (0.0%) |
| High School Diploma | 0 (0.0%) | 0 (0.0%) |
| College or Associate's Degree | 10 (100.0%) | 0 (0.0%) |
| Bachelor's Degree | 15 (65.2%) | 8 (34.8%) |
| Graduate Degree | 8 (100.0%) | 0 (0.0%) |
| Total | 33 (80.5%) | 8 (19.5%) |
Employment Characteristics in Edgewater
Employment by Class of Employer in Edgewater
Among the 4,736 employed individuals in Edgewater, private company employees (2,893 | 61.1%), self-employed (not incorporated) (460 | 9.7%), and federal government employees (442 | 9.3%) make up the most common classes of employment.
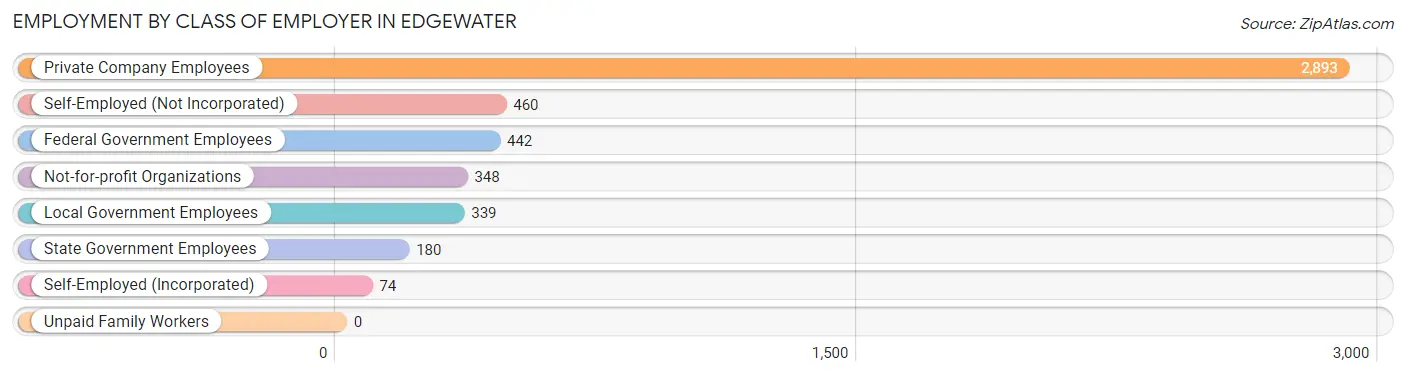
| Employer Class | # Employees | % Employees |
| Private Company Employees | 2,893 | 61.1% |
| Self-Employed (Incorporated) | 74 | 1.6% |
| Self-Employed (Not Incorporated) | 460 | 9.7% |
| Not-for-profit Organizations | 348 | 7.3% |
| Local Government Employees | 339 | 7.2% |
| State Government Employees | 180 | 3.8% |
| Federal Government Employees | 442 | 9.3% |
| Unpaid Family Workers | 0 | 0.0% |
| Total | 4,736 | 100.0% |
Employment Status by Age in Edgewater
According to the labor force statistics for Edgewater, out of the total population over 16 years of age (7,521), 66.6% or 5,009 individuals are in the labor force, with 4.5% or 225 of them unemployed. The age group with the highest labor force participation rate is 30 to 34 years, with 99.1% or 695 individuals in the labor force. Within the labor force, the 20 to 24 years age range has the highest percentage of unemployed individuals, with 25.3% or 82 of them being unemployed.
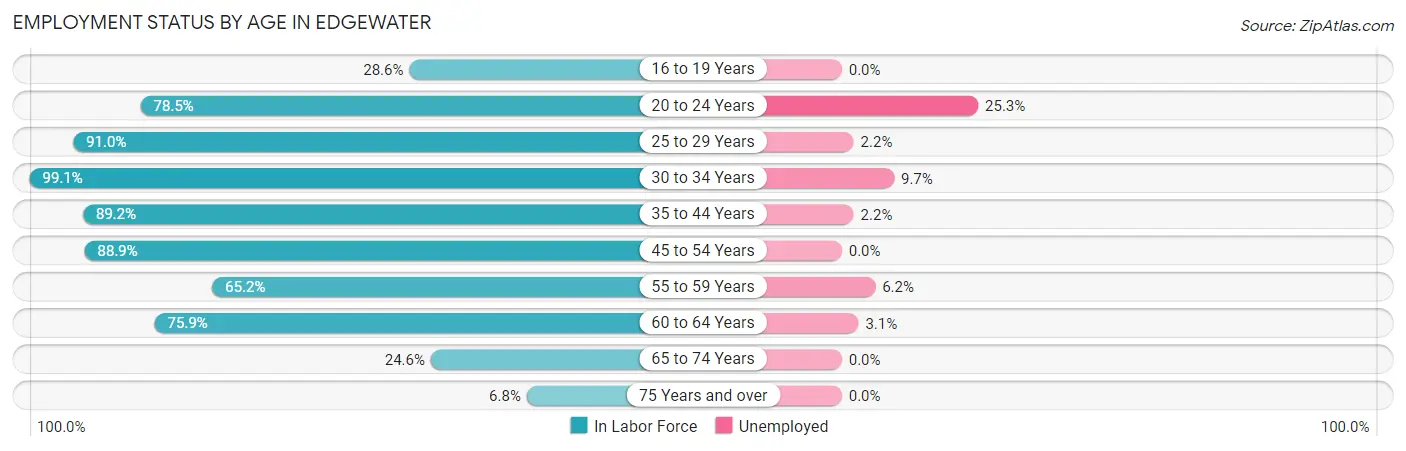
| Age Bracket | In Labor Force | Unemployed |
| 16 to 19 Years | 98 (28.6%) | 0 (0.0%) |
| 20 to 24 Years | 324 (78.5%) | 82 (25.3%) |
| 25 to 29 Years | 658 (91.0%) | 14 (2.2%) |
| 30 to 34 Years | 695 (99.1%) | 67 (9.7%) |
| 35 to 44 Years | 1,103 (89.2%) | 24 (2.2%) |
| 45 to 54 Years | 1,043 (88.9%) | 0 (0.0%) |
| 55 to 59 Years | 390 (65.2%) | 24 (6.2%) |
| 60 to 64 Years | 415 (75.9%) | 13 (3.1%) |
| 65 to 74 Years | 227 (24.6%) | 0 (0.0%) |
| 75 Years and over | 59 (6.8%) | 0 (0.0%) |
| Total | 5,009 (66.6%) | 225 (4.5%) |
Employment Status by Educational Attainment in Edgewater
According to labor force statistics for Edgewater, 86.4% of individuals (4,302) out of the total population between 25 and 64 years of age (4,979) are in the labor force, with 3.3% or 142 of them being unemployed. The group with the highest labor force participation rate are those with the educational attainment of bachelor's degree or higher, with 94.4% or 1,873 individuals in the labor force. Within the labor force, individuals with college / associate degree education have the highest percentage of unemployment, with 7.6% or 79 of them being unemployed.
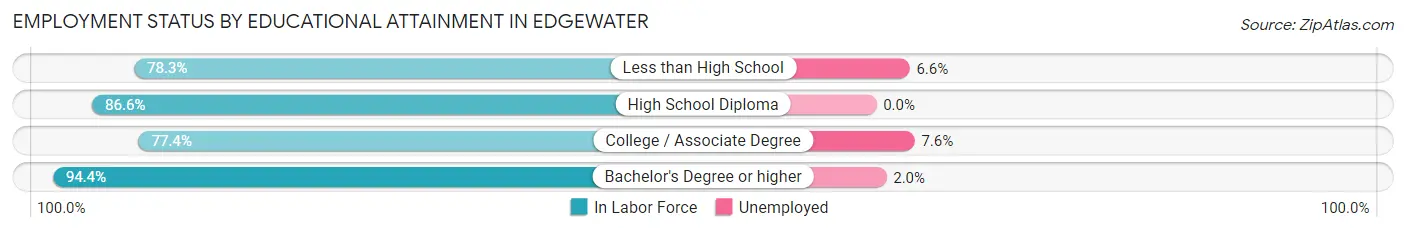
| Educational Attainment | In Labor Force | Unemployed |
| Less than High School | 364 (78.3%) | 31 (6.6%) |
| High School Diploma | 1,024 (86.6%) | 0 (0.0%) |
| College / Associate Degree | 1,043 (77.4%) | 102 (7.6%) |
| Bachelor's Degree or higher | 1,873 (94.4%) | 40 (2.0%) |
| Total | 4,302 (86.4%) | 164 (3.3%) |
Employment Occupations by Sex in Edgewater
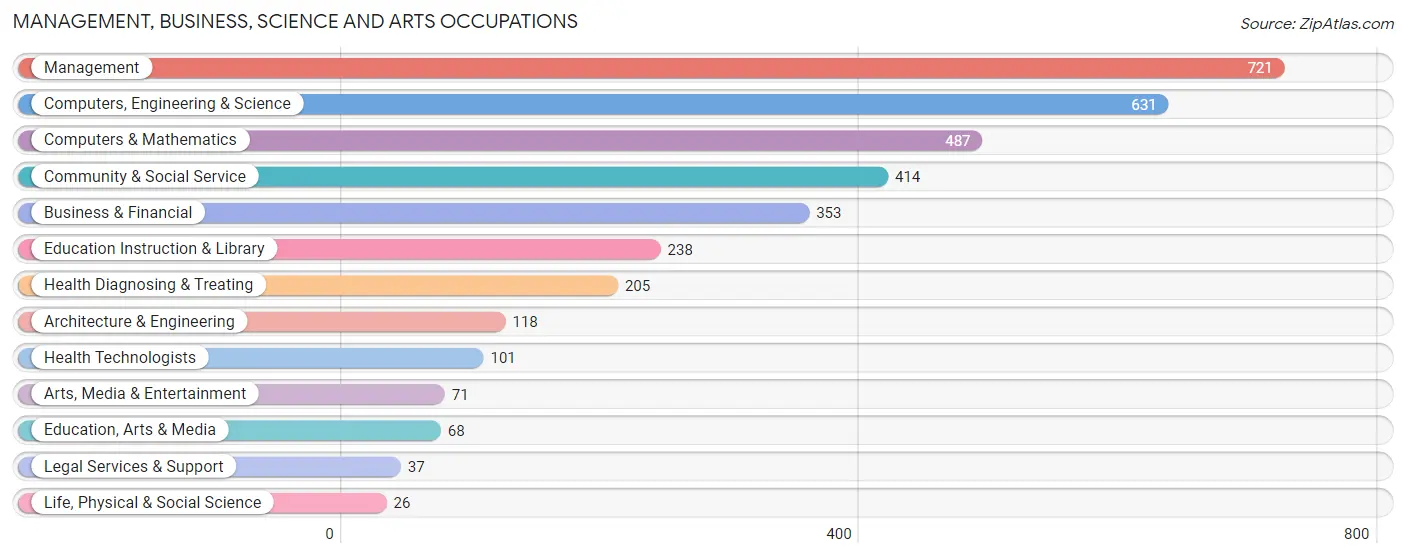
Management, Business, Science and Arts Occupations
The most common Management, Business, Science and Arts occupations in Edgewater are Management (721 | 15.2%), Computers, Engineering & Science (631 | 13.3%), Computers & Mathematics (487 | 10.3%), Community & Social Service (414 | 8.7%), and Business & Financial (353 | 7.5%).
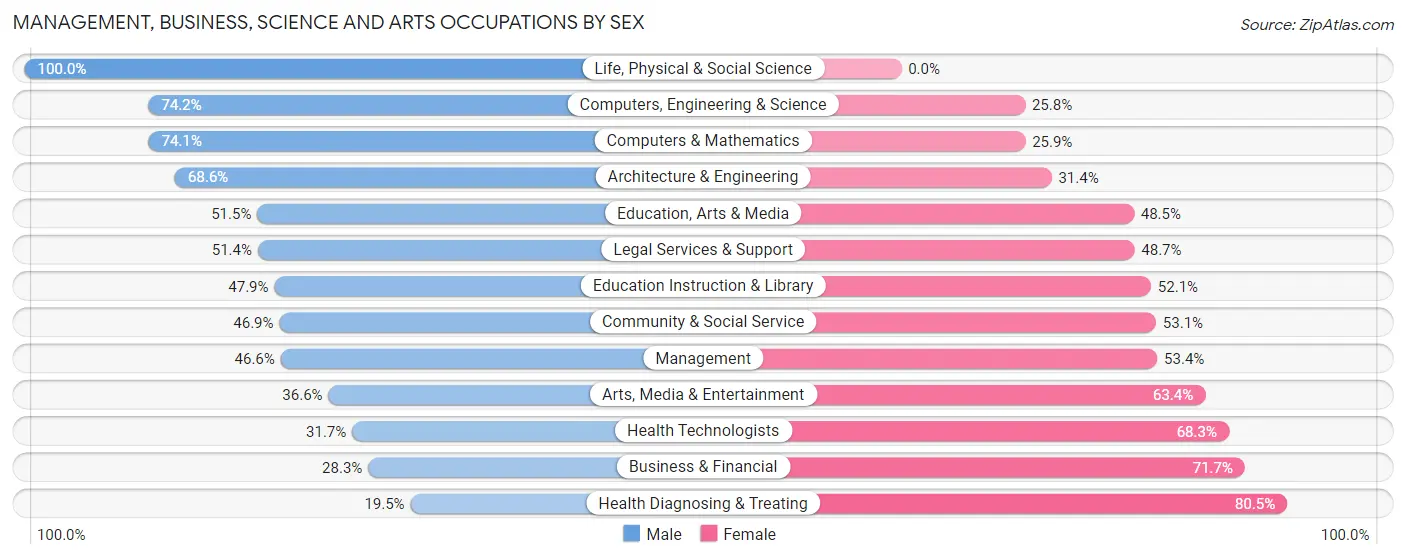
Management, Business, Science and Arts Occupations by Sex
Within the Management, Business, Science and Arts occupations in Edgewater, the most male-oriented occupations are Life, Physical & Social Science (100.0%), Computers, Engineering & Science (74.2%), and Computers & Mathematics (74.1%), while the most female-oriented occupations are Health Diagnosing & Treating (80.5%), Business & Financial (71.7%), and Health Technologists (68.3%).
| Occupation | Male | Female |
| Management | 336 (46.6%) | 385 (53.4%) |
| Business & Financial | 100 (28.3%) | 253 (71.7%) |
| Computers, Engineering & Science | 468 (74.2%) | 163 (25.8%) |
| Computers & Mathematics | 361 (74.1%) | 126 (25.9%) |
| Architecture & Engineering | 81 (68.6%) | 37 (31.4%) |
| Life, Physical & Social Science | 26 (100.0%) | 0 (0.0%) |
| Community & Social Service | 194 (46.9%) | 220 (53.1%) |
| Education, Arts & Media | 35 (51.5%) | 33 (48.5%) |
| Legal Services & Support | 19 (51.3%) | 18 (48.6%) |
| Education Instruction & Library | 114 (47.9%) | 124 (52.1%) |
| Arts, Media & Entertainment | 26 (36.6%) | 45 (63.4%) |
| Health Diagnosing & Treating | 40 (19.5%) | 165 (80.5%) |
| Health Technologists | 32 (31.7%) | 69 (68.3%) |
| Total (Category) | 1,138 (49.0%) | 1,186 (51.0%) |
| Total (Overall) | 2,642 (55.8%) | 2,089 (44.2%) |
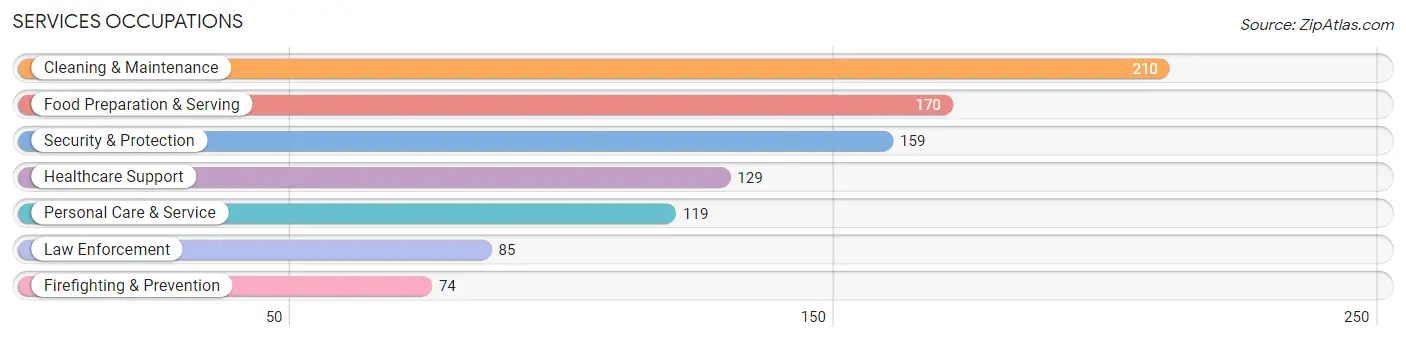
Services Occupations
The most common Services occupations in Edgewater are Cleaning & Maintenance (210 | 4.4%), Food Preparation & Serving (170 | 3.6%), Security & Protection (159 | 3.4%), Healthcare Support (129 | 2.7%), and Personal Care & Service (119 | 2.5%).
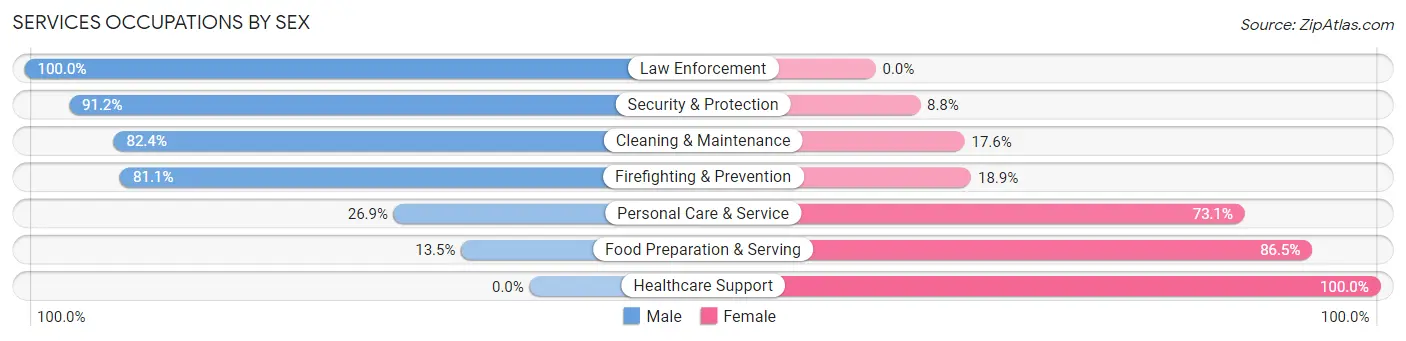
Services Occupations by Sex
Within the Services occupations in Edgewater, the most male-oriented occupations are Law Enforcement (100.0%), Security & Protection (91.2%), and Cleaning & Maintenance (82.4%), while the most female-oriented occupations are Healthcare Support (100.0%), Food Preparation & Serving (86.5%), and Personal Care & Service (73.1%).
| Occupation | Male | Female |
| Healthcare Support | 0 (0.0%) | 129 (100.0%) |
| Security & Protection | 145 (91.2%) | 14 (8.8%) |
| Firefighting & Prevention | 60 (81.1%) | 14 (18.9%) |
| Law Enforcement | 85 (100.0%) | 0 (0.0%) |
| Food Preparation & Serving | 23 (13.5%) | 147 (86.5%) |
| Cleaning & Maintenance | 173 (82.4%) | 37 (17.6%) |
| Personal Care & Service | 32 (26.9%) | 87 (73.1%) |
| Total (Category) | 373 (47.4%) | 414 (52.6%) |
| Total (Overall) | 2,642 (55.8%) | 2,089 (44.2%) |
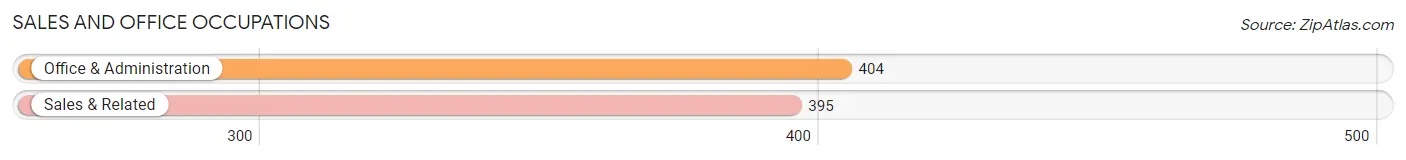
Sales and Office Occupations
The most common Sales and Office occupations in Edgewater are Office & Administration (404 | 8.5%), and Sales & Related (395 | 8.4%).
Sales and Office Occupations by Sex
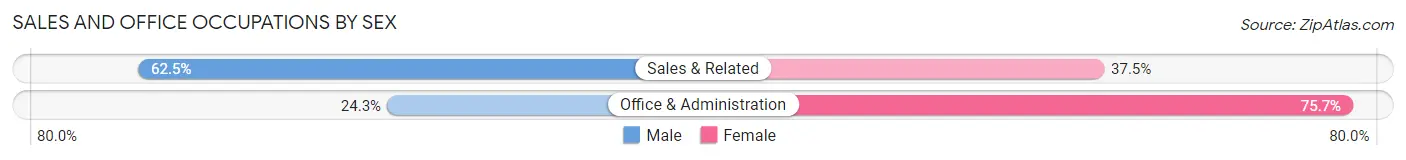
| Occupation | Male | Female |
| Sales & Related | 247 (62.5%) | 148 (37.5%) |
| Office & Administration | 98 (24.3%) | 306 (75.7%) |
| Total (Category) | 345 (43.2%) | 454 (56.8%) |
| Total (Overall) | 2,642 (55.8%) | 2,089 (44.2%) |
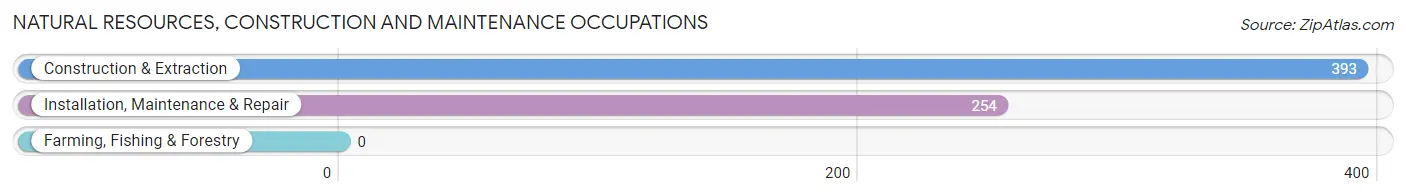
Natural Resources, Construction and Maintenance Occupations
The most common Natural Resources, Construction and Maintenance occupations in Edgewater are Construction & Extraction (393 | 8.3%), and Installation, Maintenance & Repair (254 | 5.4%).
Natural Resources, Construction and Maintenance Occupations by Sex
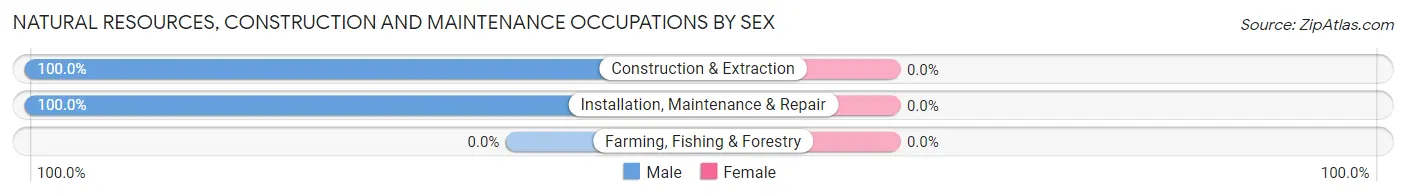
| Occupation | Male | Female |
| Farming, Fishing & Forestry | 0 (0.0%) | 0 (0.0%) |
| Construction & Extraction | 393 (100.0%) | 0 (0.0%) |
| Installation, Maintenance & Repair | 254 (100.0%) | 0 (0.0%) |
| Total (Category) | 647 (100.0%) | 0 (0.0%) |
| Total (Overall) | 2,642 (55.8%) | 2,089 (44.2%) |
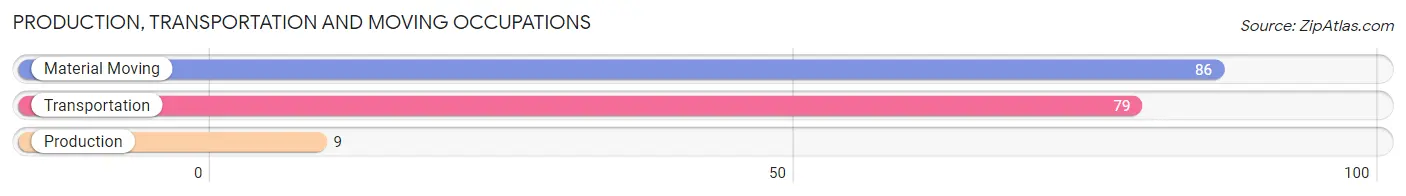
Production, Transportation and Moving Occupations
The most common Production, Transportation and Moving occupations in Edgewater are Material Moving (86 | 1.8%), Transportation (79 | 1.7%), and Production (9 | 0.2%).
Production, Transportation and Moving Occupations by Sex
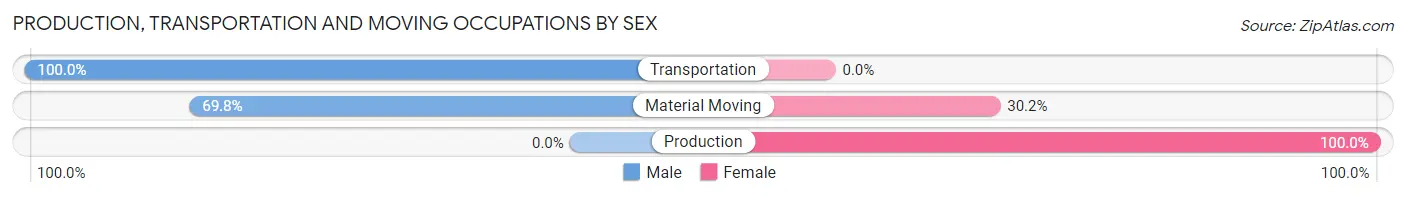
| Occupation | Male | Female |
| Production | 0 (0.0%) | 9 (100.0%) |
| Transportation | 79 (100.0%) | 0 (0.0%) |
| Material Moving | 60 (69.8%) | 26 (30.2%) |
| Total (Category) | 139 (79.9%) | 35 (20.1%) |
| Total (Overall) | 2,642 (55.8%) | 2,089 (44.2%) |
Employment Industries by Sex in Edgewater
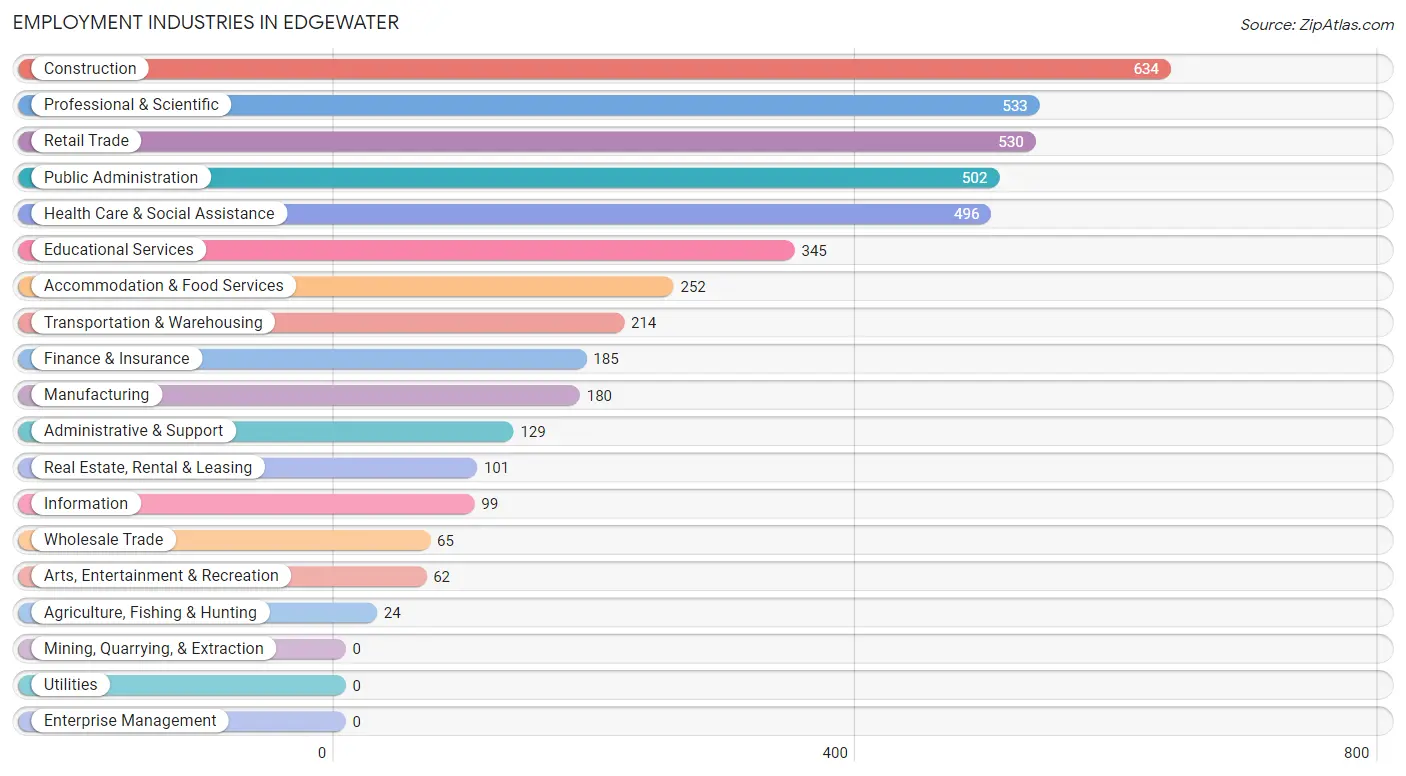
Employment Industries in Edgewater
The major employment industries in Edgewater include Construction (634 | 13.4%), Professional & Scientific (533 | 11.3%), Retail Trade (530 | 11.2%), Public Administration (502 | 10.6%), and Health Care & Social Assistance (496 | 10.5%).
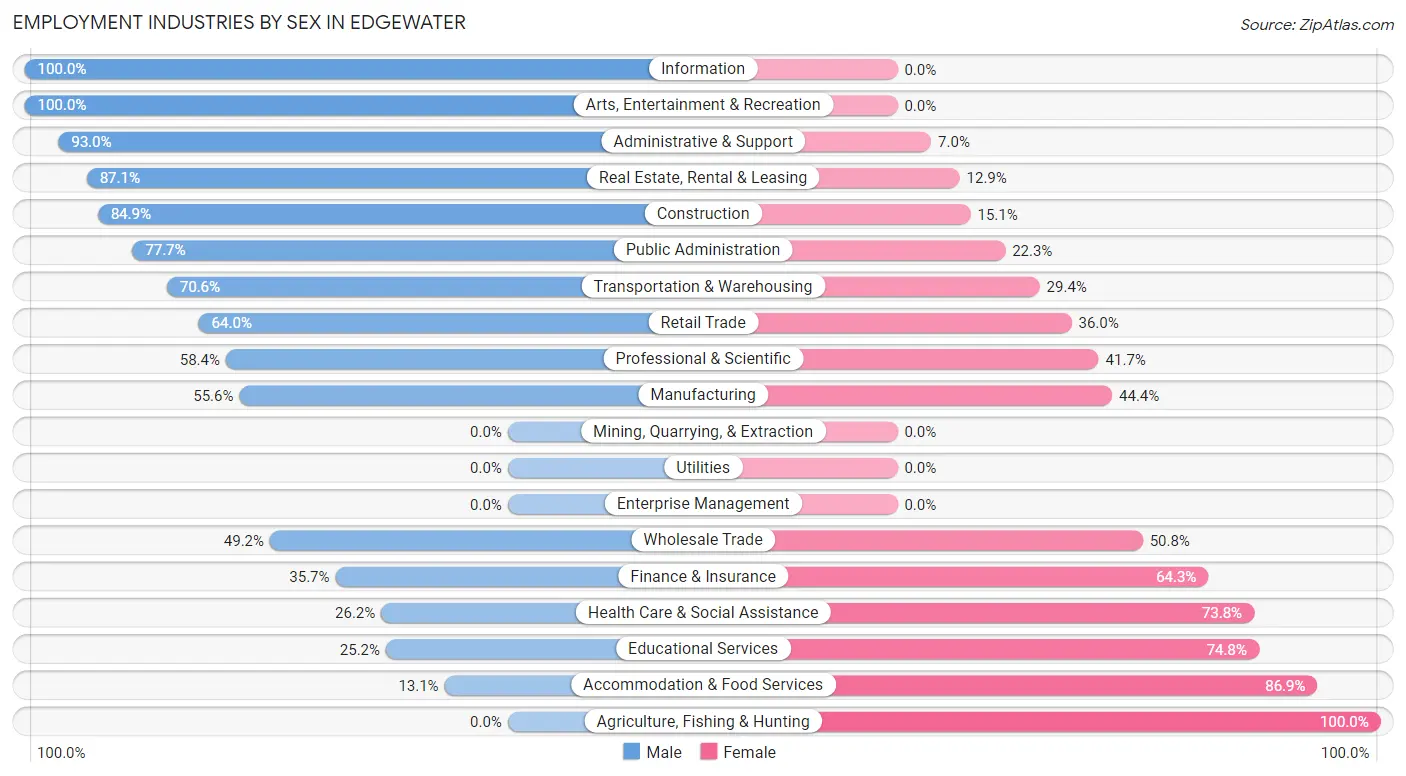
Employment Industries by Sex in Edgewater
The Edgewater industries that see more men than women are Information (100.0%), Arts, Entertainment & Recreation (100.0%), and Administrative & Support (93.0%), whereas the industries that tend to have a higher number of women are Agriculture, Fishing & Hunting (100.0%), Accommodation & Food Services (86.9%), and Educational Services (74.8%).
| Industry | Male | Female |
| Agriculture, Fishing & Hunting | 0 (0.0%) | 24 (100.0%) |
| Mining, Quarrying, & Extraction | 0 (0.0%) | 0 (0.0%) |
| Construction | 538 (84.9%) | 96 (15.1%) |
| Manufacturing | 100 (55.6%) | 80 (44.4%) |
| Wholesale Trade | 32 (49.2%) | 33 (50.8%) |
| Retail Trade | 339 (64.0%) | 191 (36.0%) |
| Transportation & Warehousing | 151 (70.6%) | 63 (29.4%) |
| Utilities | 0 (0.0%) | 0 (0.0%) |
| Information | 99 (100.0%) | 0 (0.0%) |
| Finance & Insurance | 66 (35.7%) | 119 (64.3%) |
| Real Estate, Rental & Leasing | 88 (87.1%) | 13 (12.9%) |
| Professional & Scientific | 311 (58.4%) | 222 (41.6%) |
| Enterprise Management | 0 (0.0%) | 0 (0.0%) |
| Administrative & Support | 120 (93.0%) | 9 (7.0%) |
| Educational Services | 87 (25.2%) | 258 (74.8%) |
| Health Care & Social Assistance | 130 (26.2%) | 366 (73.8%) |
| Arts, Entertainment & Recreation | 62 (100.0%) | 0 (0.0%) |
| Accommodation & Food Services | 33 (13.1%) | 219 (86.9%) |
| Public Administration | 390 (77.7%) | 112 (22.3%) |
| Total | 2,642 (55.8%) | 2,089 (44.2%) |
Education in Edgewater
School Enrollment in Edgewater
The most common levels of schooling among the 1,783 students in Edgewater are high school (433 | 24.3%), elementary school (392 | 22.0%), and middle school (324 | 18.2%).
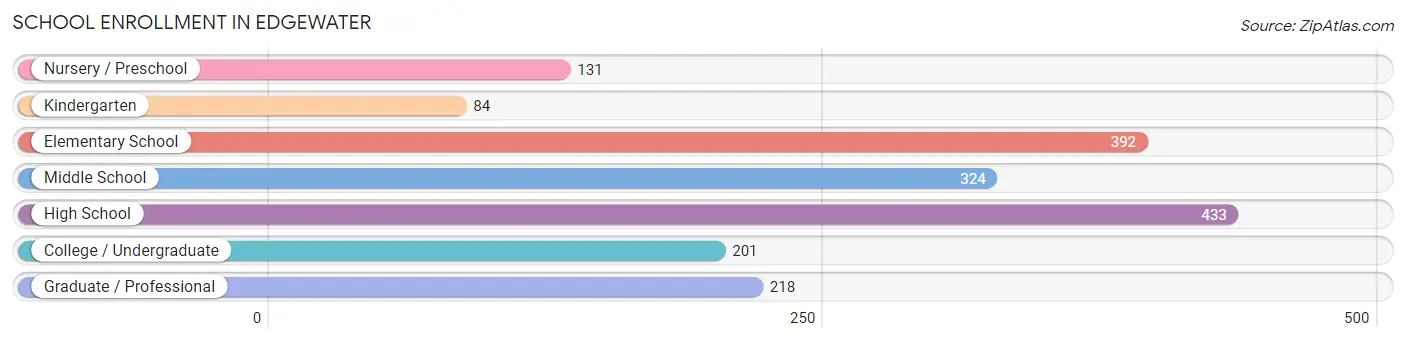
| School Level | # Students | % Students |
| Nursery / Preschool | 131 | 7.3% |
| Kindergarten | 84 | 4.7% |
| Elementary School | 392 | 22.0% |
| Middle School | 324 | 18.2% |
| High School | 433 | 24.3% |
| College / Undergraduate | 201 | 11.3% |
| Graduate / Professional | 218 | 12.2% |
| Total | 1,783 | 100.0% |
School Enrollment by Age by Funding Source in Edgewater
Out of a total of 1,783 students who are enrolled in schools in Edgewater, 287 (16.1%) attend a private institution, while the remaining 1,496 (83.9%) are enrolled in public schools. The age group of 3 to 4 year olds has the highest likelihood of being enrolled in private schools, with 103 (100.0% in the age bracket) enrolled. Conversely, the age group of 18 to 19 year olds has the lowest likelihood of being enrolled in a private school, with 49 (100.0% in the age bracket) attending a public institution.
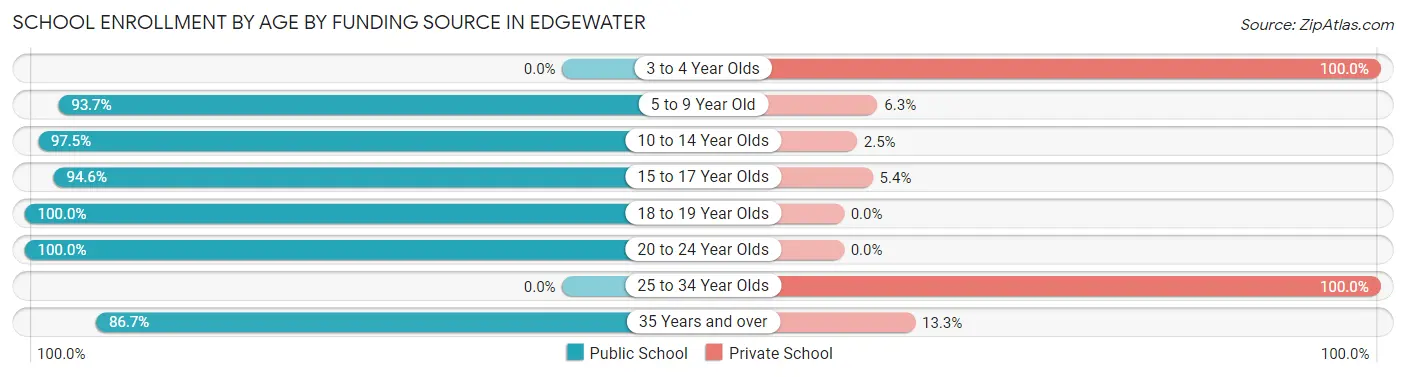
| Age Bracket | Public School | Private School |
| 3 to 4 Year Olds | 0 (0.0%) | 103 (100.0%) |
| 5 to 9 Year Old | 418 (93.7%) | 28 (6.3%) |
| 10 to 14 Year Olds | 397 (97.5%) | 10 (2.5%) |
| 15 to 17 Year Olds | 368 (94.6%) | 21 (5.4%) |
| 18 to 19 Year Olds | 49 (100.0%) | 0 (0.0%) |
| 20 to 24 Year Olds | 75 (100.0%) | 0 (0.0%) |
| 25 to 34 Year Olds | 0 (0.0%) | 96 (100.0%) |
| 35 Years and over | 189 (86.7%) | 29 (13.3%) |
| Total | 1,496 (83.9%) | 287 (16.1%) |
Educational Attainment by Field of Study in Edgewater
Business (555 | 19.5%), liberal arts & history (321 | 11.3%), social sciences (316 | 11.1%), education (310 | 10.9%), and engineering (227 | 8.0%) are the most common fields of study among 2,842 individuals in Edgewater who have obtained a bachelor's degree or higher.
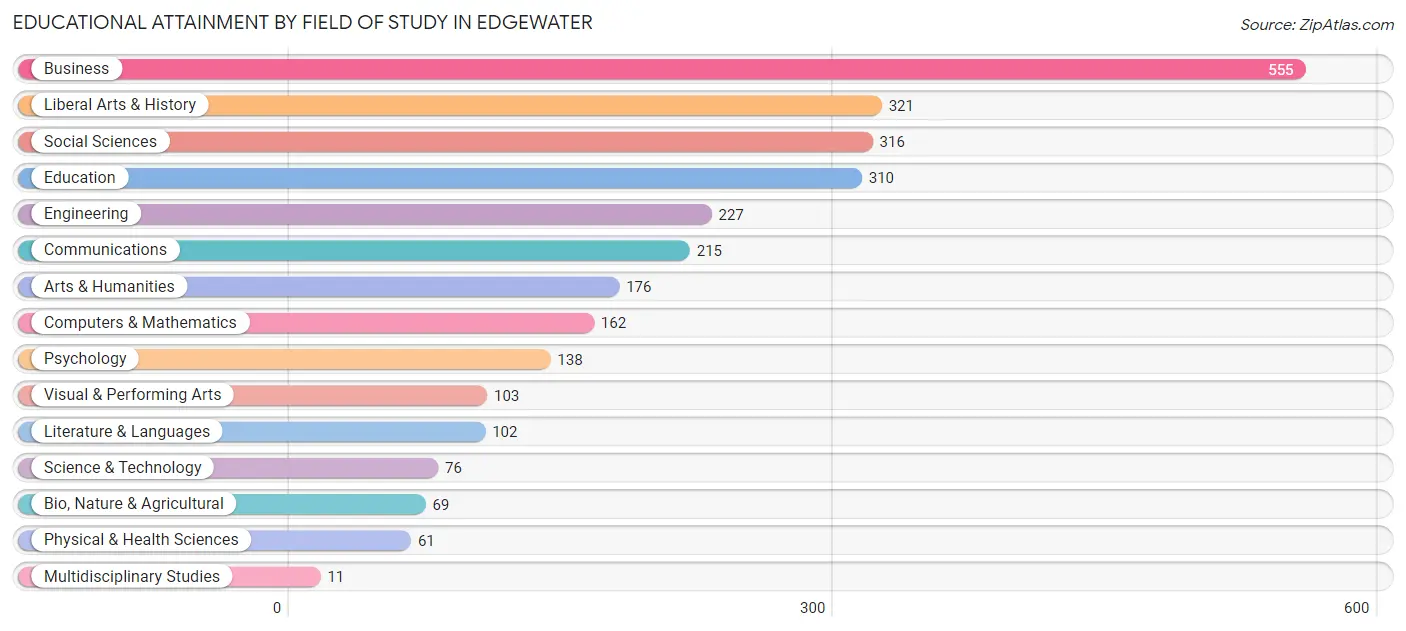
| Field of Study | # Graduates | % Graduates |
| Computers & Mathematics | 162 | 5.7% |
| Bio, Nature & Agricultural | 69 | 2.4% |
| Physical & Health Sciences | 61 | 2.1% |
| Psychology | 138 | 4.9% |
| Social Sciences | 316 | 11.1% |
| Engineering | 227 | 8.0% |
| Multidisciplinary Studies | 11 | 0.4% |
| Science & Technology | 76 | 2.7% |
| Business | 555 | 19.5% |
| Education | 310 | 10.9% |
| Literature & Languages | 102 | 3.6% |
| Liberal Arts & History | 321 | 11.3% |
| Visual & Performing Arts | 103 | 3.6% |
| Communications | 215 | 7.6% |
| Arts & Humanities | 176 | 6.2% |
| Total | 2,842 | 100.0% |
Transportation & Commute in Edgewater
Vehicle Availability by Sex in Edgewater
The most prevalent vehicle ownership categories in Edgewater are males with 2 vehicles (1,239, accounting for 46.3%) and females with 2 vehicles (1,007, making up 60.2%).
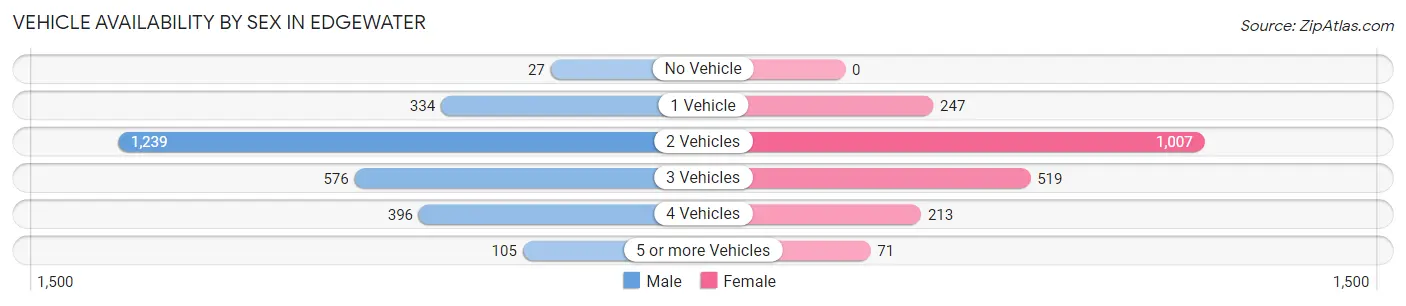
| Vehicles Available | Male | Female |
| No Vehicle | 27 (1.0%) | 0 (0.0%) |
| 1 Vehicle | 334 (12.5%) | 247 (12.0%) |
| 2 Vehicles | 1,239 (46.3%) | 1,007 (48.9%) |
| 3 Vehicles | 576 (21.5%) | 519 (25.2%) |
| 4 Vehicles | 396 (14.8%) | 213 (10.3%) |
| 5 or more Vehicles | 105 (3.9%) | 71 (3.5%) |
| Total | 2,677 (100.0%) | 2,057 (100.0%) |
Commute Time in Edgewater
The most frequently occuring commute durations in Edgewater are 45 to 59 minutes (674 commuters, 16.7%), 60 to 89 minutes (551 commuters, 13.6%), and 15 to 19 minutes (457 commuters, 11.3%).
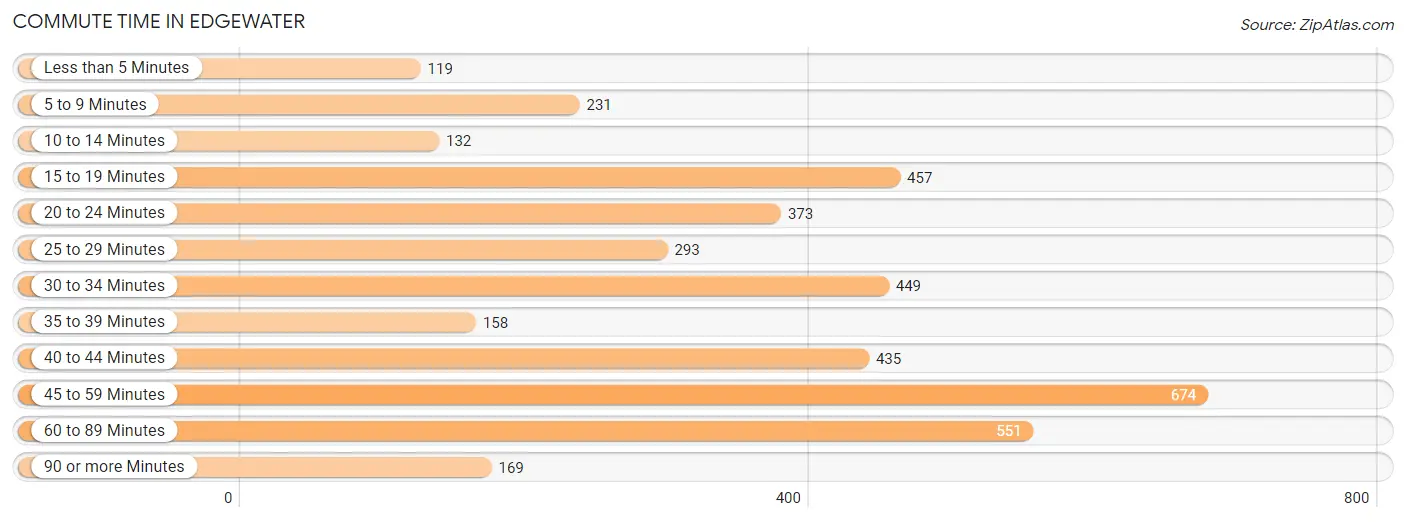
| Commute Time | # Commuters | % Commuters |
| Less than 5 Minutes | 119 | 2.9% |
| 5 to 9 Minutes | 231 | 5.7% |
| 10 to 14 Minutes | 132 | 3.3% |
| 15 to 19 Minutes | 457 | 11.3% |
| 20 to 24 Minutes | 373 | 9.2% |
| 25 to 29 Minutes | 293 | 7.2% |
| 30 to 34 Minutes | 449 | 11.1% |
| 35 to 39 Minutes | 158 | 3.9% |
| 40 to 44 Minutes | 435 | 10.8% |
| 45 to 59 Minutes | 674 | 16.7% |
| 60 to 89 Minutes | 551 | 13.6% |
| 90 or more Minutes | 169 | 4.2% |
Commute Time by Sex in Edgewater
The most common commute times in Edgewater are 45 to 59 minutes (477 commuters, 20.5%) for males and 15 to 19 minutes (244 commuters, 14.2%) for females.
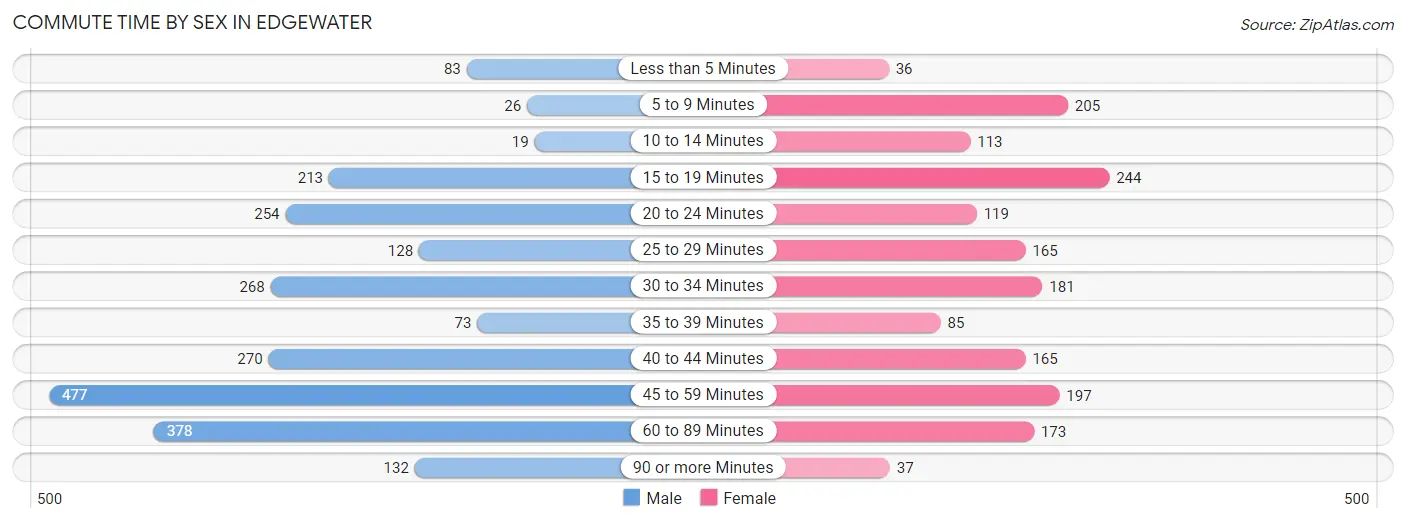
| Commute Time | Male | Female |
| Less than 5 Minutes | 83 (3.6%) | 36 (2.1%) |
| 5 to 9 Minutes | 26 (1.1%) | 205 (11.9%) |
| 10 to 14 Minutes | 19 (0.8%) | 113 (6.6%) |
| 15 to 19 Minutes | 213 (9.2%) | 244 (14.2%) |
| 20 to 24 Minutes | 254 (10.9%) | 119 (6.9%) |
| 25 to 29 Minutes | 128 (5.5%) | 165 (9.6%) |
| 30 to 34 Minutes | 268 (11.6%) | 181 (10.5%) |
| 35 to 39 Minutes | 73 (3.2%) | 85 (4.9%) |
| 40 to 44 Minutes | 270 (11.6%) | 165 (9.6%) |
| 45 to 59 Minutes | 477 (20.5%) | 197 (11.5%) |
| 60 to 89 Minutes | 378 (16.3%) | 173 (10.1%) |
| 90 or more Minutes | 132 (5.7%) | 37 (2.1%) |
Time of Departure to Work by Sex in Edgewater
The most frequent times of departure to work in Edgewater are 7:00 AM to 7:29 AM (492, 21.2%) for males and 7:30 AM to 7:59 AM (402, 23.4%) for females.
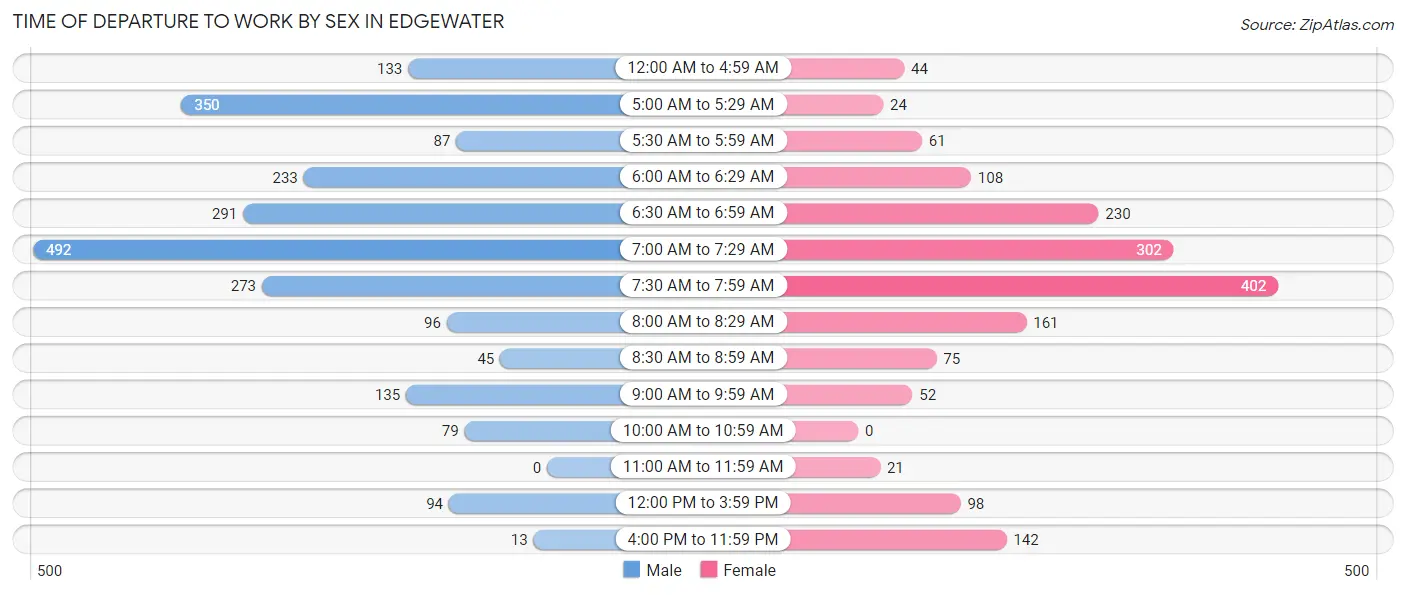
| Time of Departure | Male | Female |
| 12:00 AM to 4:59 AM | 133 (5.7%) | 44 (2.6%) |
| 5:00 AM to 5:29 AM | 350 (15.1%) | 24 (1.4%) |
| 5:30 AM to 5:59 AM | 87 (3.7%) | 61 (3.5%) |
| 6:00 AM to 6:29 AM | 233 (10.0%) | 108 (6.3%) |
| 6:30 AM to 6:59 AM | 291 (12.5%) | 230 (13.4%) |
| 7:00 AM to 7:29 AM | 492 (21.2%) | 302 (17.6%) |
| 7:30 AM to 7:59 AM | 273 (11.8%) | 402 (23.4%) |
| 8:00 AM to 8:29 AM | 96 (4.1%) | 161 (9.4%) |
| 8:30 AM to 8:59 AM | 45 (1.9%) | 75 (4.4%) |
| 9:00 AM to 9:59 AM | 135 (5.8%) | 52 (3.0%) |
| 10:00 AM to 10:59 AM | 79 (3.4%) | 0 (0.0%) |
| 11:00 AM to 11:59 AM | 0 (0.0%) | 21 (1.2%) |
| 12:00 PM to 3:59 PM | 94 (4.1%) | 98 (5.7%) |
| 4:00 PM to 11:59 PM | 13 (0.6%) | 142 (8.3%) |
| Total | 2,321 (100.0%) | 1,720 (100.0%) |
Housing Occupancy in Edgewater
Occupancy by Ownership in Edgewater
Of the total 3,608 dwellings in Edgewater, owner-occupied units account for 3,025 (83.8%), while renter-occupied units make up 583 (16.2%).
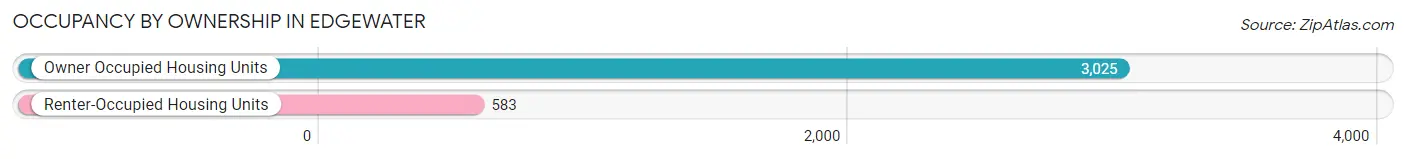
| Occupancy | # Housing Units | % Housing Units |
| Owner Occupied Housing Units | 3,025 | 83.8% |
| Renter-Occupied Housing Units | 583 | 16.2% |
| Total Occupied Housing Units | 3,608 | 100.0% |
Occupancy by Household Size in Edgewater
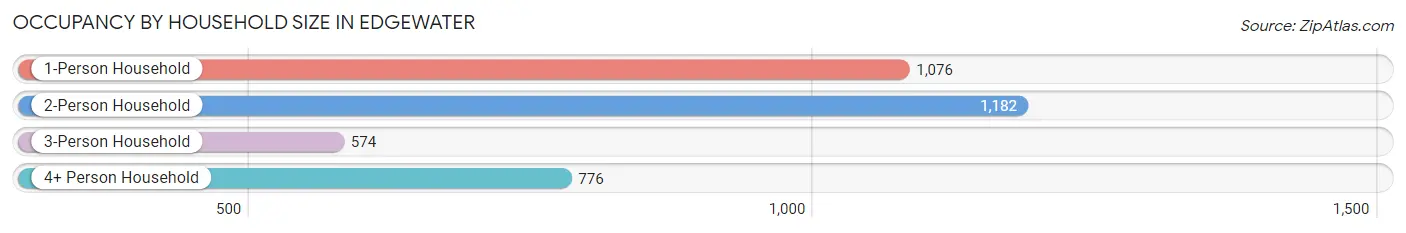
| Household Size | # Housing Units | % Housing Units |
| 1-Person Household | 1,076 | 29.8% |
| 2-Person Household | 1,182 | 32.8% |
| 3-Person Household | 574 | 15.9% |
| 4+ Person Household | 776 | 21.5% |
| Total Housing Units | 3,608 | 100.0% |
Occupancy by Ownership by Household Size in Edgewater
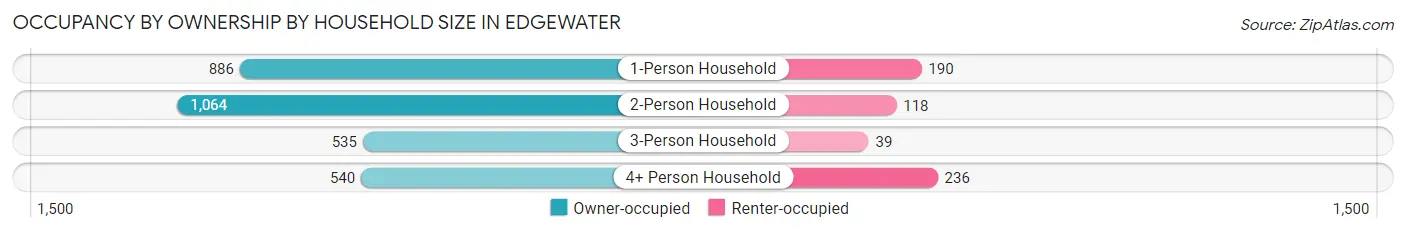
| Household Size | Owner-occupied | Renter-occupied |
| 1-Person Household | 886 (82.3%) | 190 (17.7%) |
| 2-Person Household | 1,064 (90.0%) | 118 (10.0%) |
| 3-Person Household | 535 (93.2%) | 39 (6.8%) |
| 4+ Person Household | 540 (69.6%) | 236 (30.4%) |
| Total Housing Units | 3,025 (83.8%) | 583 (16.2%) |
Occupancy by Educational Attainment in Edgewater
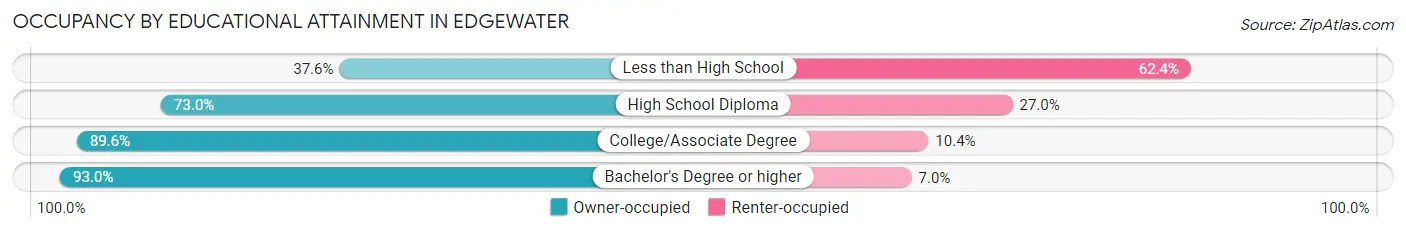
| Household Size | Owner-occupied | Renter-occupied |
| Less than High School | 88 (37.6%) | 146 (62.4%) |
| High School Diploma | 602 (73.0%) | 223 (27.0%) |
| College/Associate Degree | 934 (89.6%) | 108 (10.4%) |
| Bachelor's Degree or higher | 1,401 (93.0%) | 106 (7.0%) |
Occupancy by Age of Householder in Edgewater
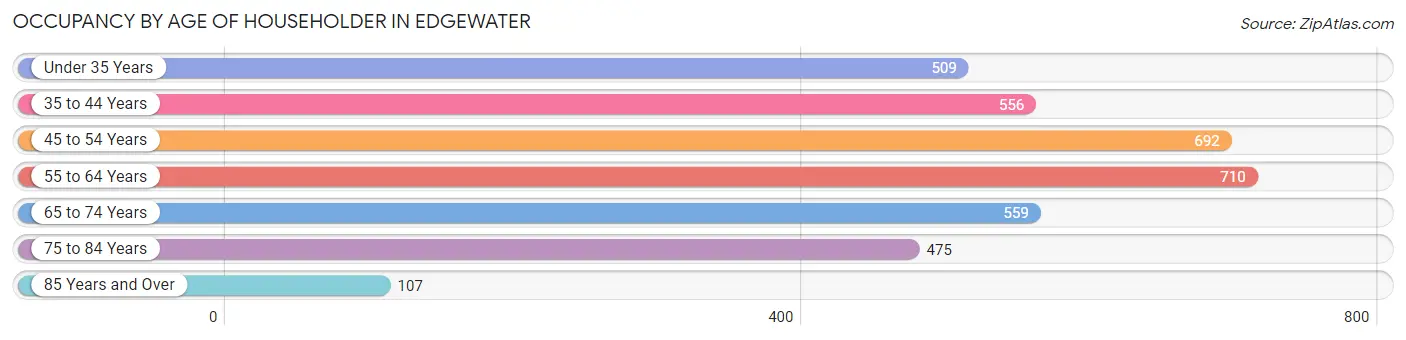
| Age Bracket | # Households | % Households |
| Under 35 Years | 509 | 14.1% |
| 35 to 44 Years | 556 | 15.4% |
| 45 to 54 Years | 692 | 19.2% |
| 55 to 64 Years | 710 | 19.7% |
| 65 to 74 Years | 559 | 15.5% |
| 75 to 84 Years | 475 | 13.2% |
| 85 Years and Over | 107 | 3.0% |
| Total | 3,608 | 100.0% |
Housing Finances in Edgewater
Median Income by Occupancy in Edgewater
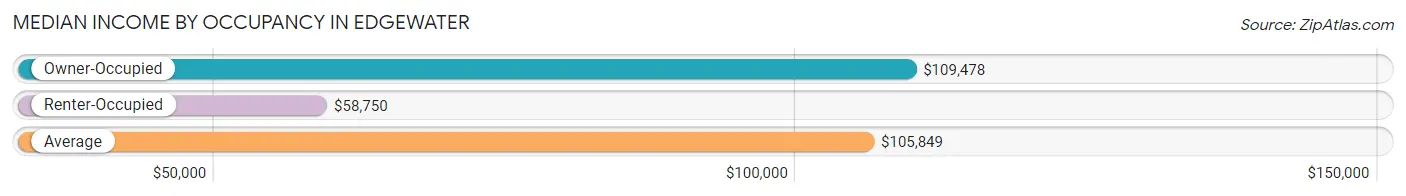
| Occupancy Type | # Households | Median Income |
| Owner-Occupied | 3,025 (83.8%) | $109,478 |
| Renter-Occupied | 583 (16.2%) | $58,750 |
| Average | 3,608 (100.0%) | $105,849 |
Occupancy by Householder Income Bracket in Edgewater
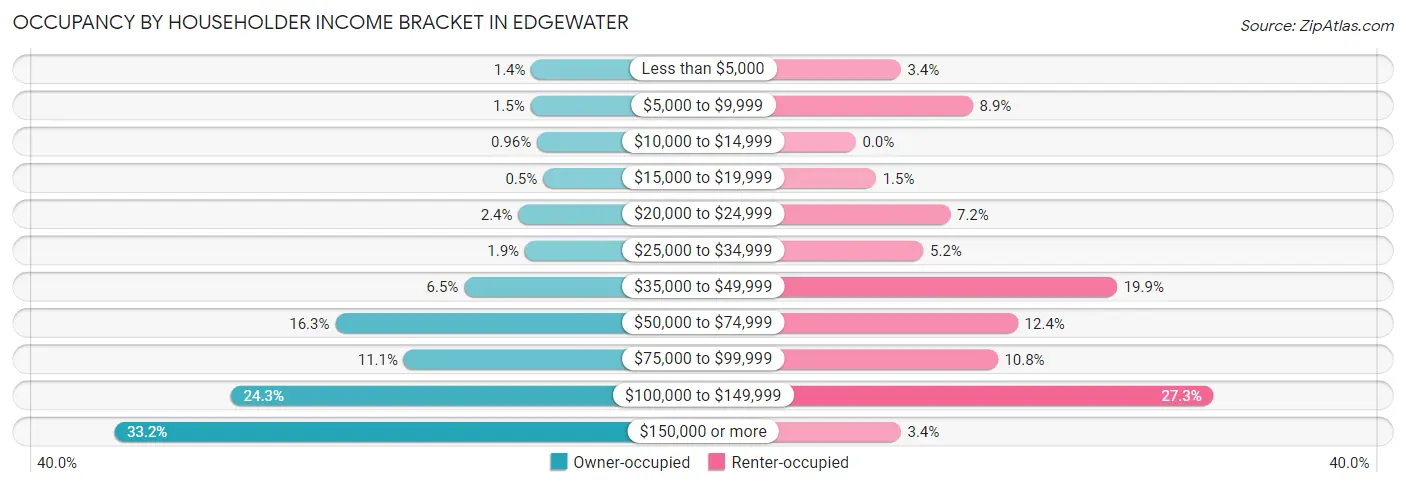
| Income Bracket | Owner-occupied | Renter-occupied |
| Less than $5,000 | 42 (1.4%) | 20 (3.4%) |
| $5,000 to $9,999 | 44 (1.5%) | 52 (8.9%) |
| $10,000 to $14,999 | 29 (1.0%) | 0 (0.0%) |
| $15,000 to $19,999 | 15 (0.5%) | 9 (1.5%) |
| $20,000 to $24,999 | 72 (2.4%) | 42 (7.2%) |
| $25,000 to $34,999 | 57 (1.9%) | 30 (5.1%) |
| $35,000 to $49,999 | 197 (6.5%) | 116 (19.9%) |
| $50,000 to $74,999 | 494 (16.3%) | 72 (12.3%) |
| $75,000 to $99,999 | 336 (11.1%) | 63 (10.8%) |
| $100,000 to $149,999 | 735 (24.3%) | 159 (27.3%) |
| $150,000 or more | 1,004 (33.2%) | 20 (3.4%) |
| Total | 3,025 (100.0%) | 583 (100.0%) |
Monthly Housing Cost Tiers in Edgewater
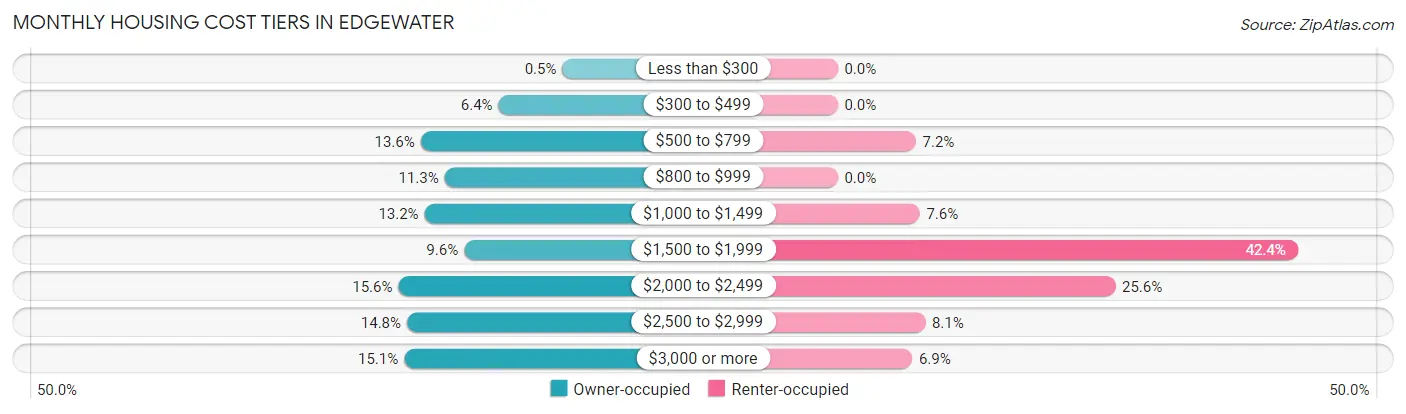
| Monthly Cost | Owner-occupied | Renter-occupied |
| Less than $300 | 15 (0.5%) | 0 (0.0%) |
| $300 to $499 | 193 (6.4%) | 0 (0.0%) |
| $500 to $799 | 410 (13.6%) | 42 (7.2%) |
| $800 to $999 | 343 (11.3%) | 0 (0.0%) |
| $1,000 to $1,499 | 399 (13.2%) | 44 (7.5%) |
| $1,500 to $1,999 | 289 (9.6%) | 247 (42.4%) |
| $2,000 to $2,499 | 472 (15.6%) | 149 (25.6%) |
| $2,500 to $2,999 | 448 (14.8%) | 47 (8.1%) |
| $3,000 or more | 456 (15.1%) | 40 (6.9%) |
| Total | 3,025 (100.0%) | 583 (100.0%) |
Physical Housing Characteristics in Edgewater
Housing Structures in Edgewater
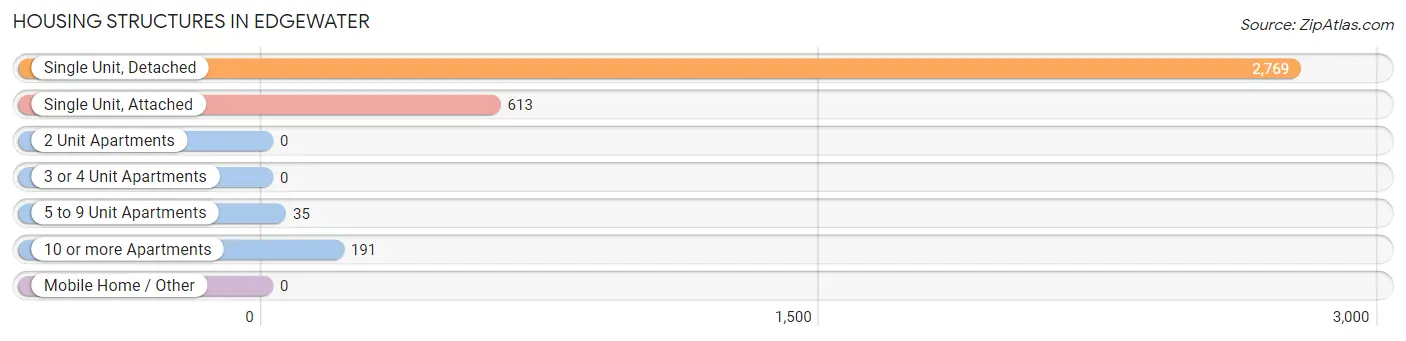
| Structure Type | # Housing Units | % Housing Units |
| Single Unit, Detached | 2,769 | 76.7% |
| Single Unit, Attached | 613 | 17.0% |
| 2 Unit Apartments | 0 | 0.0% |
| 3 or 4 Unit Apartments | 0 | 0.0% |
| 5 to 9 Unit Apartments | 35 | 1.0% |
| 10 or more Apartments | 191 | 5.3% |
| Mobile Home / Other | 0 | 0.0% |
| Total | 3,608 | 100.0% |
Housing Structures by Occupancy in Edgewater
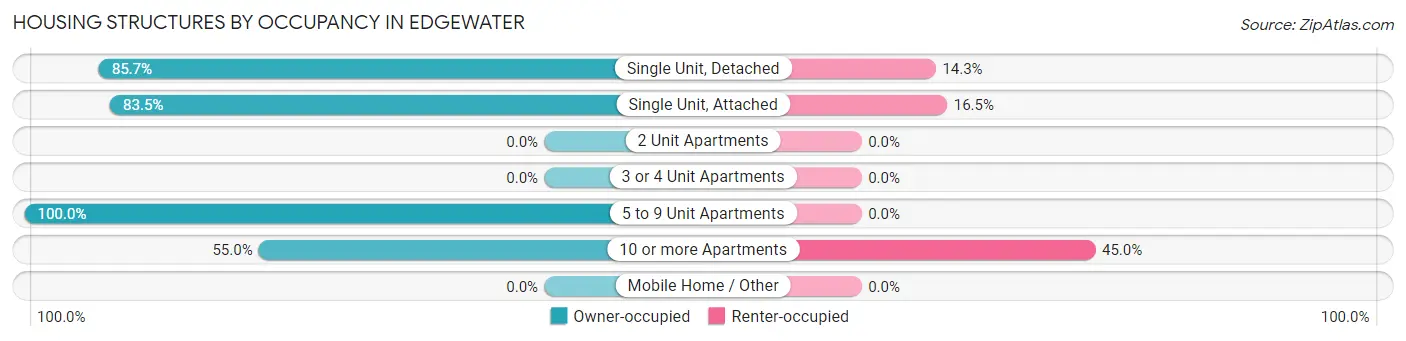
| Structure Type | Owner-occupied | Renter-occupied |
| Single Unit, Detached | 2,373 (85.7%) | 396 (14.3%) |
| Single Unit, Attached | 512 (83.5%) | 101 (16.5%) |
| 2 Unit Apartments | 0 (0.0%) | 0 (0.0%) |
| 3 or 4 Unit Apartments | 0 (0.0%) | 0 (0.0%) |
| 5 to 9 Unit Apartments | 35 (100.0%) | 0 (0.0%) |
| 10 or more Apartments | 105 (55.0%) | 86 (45.0%) |
| Mobile Home / Other | 0 (0.0%) | 0 (0.0%) |
| Total | 3,025 (83.8%) | 583 (16.2%) |
Housing Structures by Number of Rooms in Edgewater
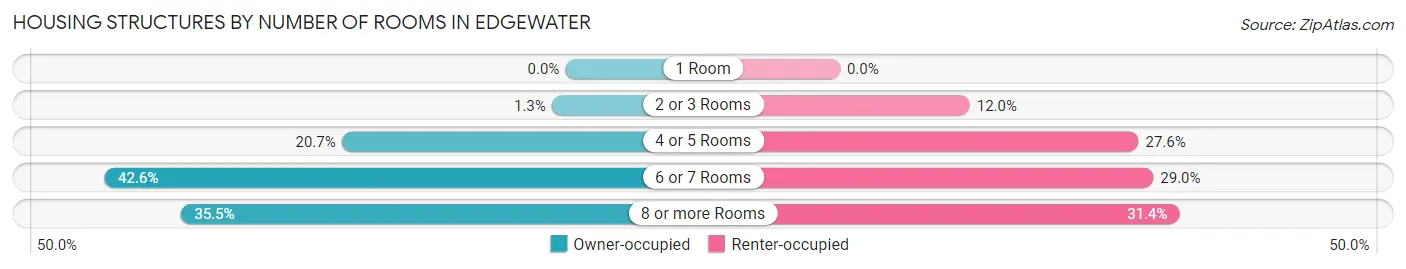
| Number of Rooms | Owner-occupied | Renter-occupied |
| 1 Room | 0 (0.0%) | 0 (0.0%) |
| 2 or 3 Rooms | 38 (1.3%) | 70 (12.0%) |
| 4 or 5 Rooms | 626 (20.7%) | 161 (27.6%) |
| 6 or 7 Rooms | 1,287 (42.5%) | 169 (29.0%) |
| 8 or more Rooms | 1,074 (35.5%) | 183 (31.4%) |
| Total | 3,025 (100.0%) | 583 (100.0%) |
Housing Structure by Heating Type in Edgewater
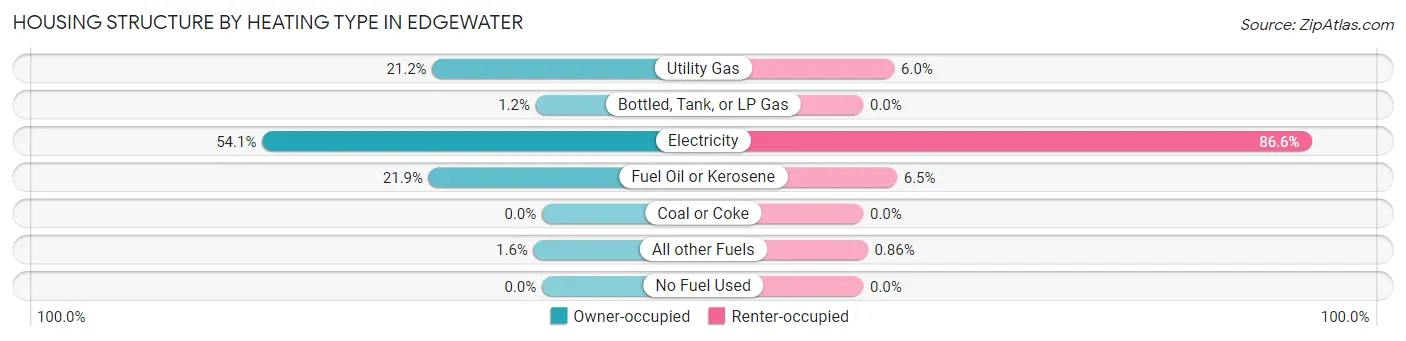
| Heating Type | Owner-occupied | Renter-occupied |
| Utility Gas | 641 (21.2%) | 35 (6.0%) |
| Bottled, Tank, or LP Gas | 37 (1.2%) | 0 (0.0%) |
| Electricity | 1,636 (54.1%) | 505 (86.6%) |
| Fuel Oil or Kerosene | 662 (21.9%) | 38 (6.5%) |
| Coal or Coke | 0 (0.0%) | 0 (0.0%) |
| All other Fuels | 49 (1.6%) | 5 (0.9%) |
| No Fuel Used | 0 (0.0%) | 0 (0.0%) |
| Total | 3,025 (100.0%) | 583 (100.0%) |
Household Vehicle Usage in Edgewater
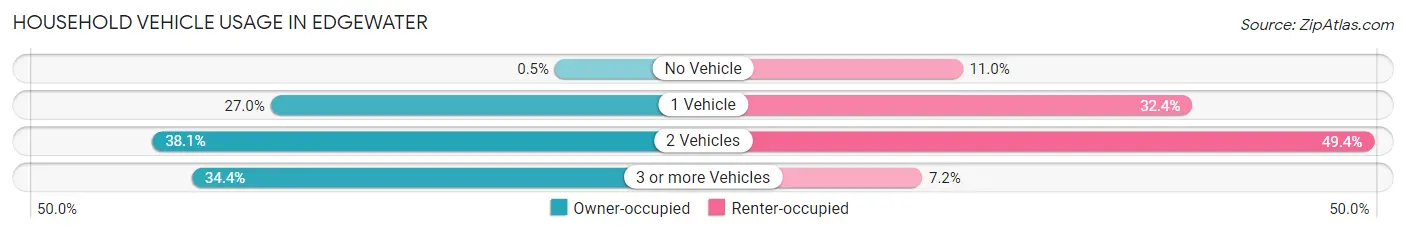
| Vehicles per Household | Owner-occupied | Renter-occupied |
| No Vehicle | 15 (0.5%) | 64 (11.0%) |
| 1 Vehicle | 818 (27.0%) | 189 (32.4%) |
| 2 Vehicles | 1,152 (38.1%) | 288 (49.4%) |
| 3 or more Vehicles | 1,040 (34.4%) | 42 (7.2%) |
| Total | 3,025 (100.0%) | 583 (100.0%) |
Real Estate & Mortgages in Edgewater
Real Estate and Mortgage Overview in Edgewater
| Characteristic | Without Mortgage | With Mortgage |
| Housing Units | 1,043 | 1,982 |
| Median Property Value | $356,000 | $420,300 |
| Median Household Income | $73,842 | $827 |
| Monthly Housing Costs | $768 | $456 |
| Real Estate Taxes | $3,221 | $10 |
Property Value by Mortgage Status in Edgewater
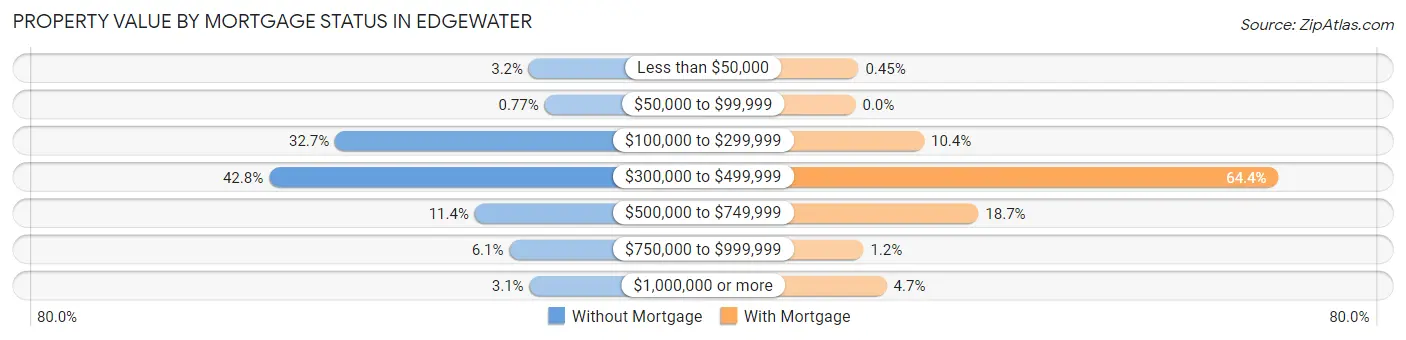
| Property Value | Without Mortgage | With Mortgage |
| Less than $50,000 | 33 (3.2%) | 9 (0.4%) |
| $50,000 to $99,999 | 8 (0.8%) | 0 (0.0%) |
| $100,000 to $299,999 | 341 (32.7%) | 207 (10.4%) |
| $300,000 to $499,999 | 446 (42.8%) | 1,277 (64.4%) |
| $500,000 to $749,999 | 119 (11.4%) | 371 (18.7%) |
| $750,000 to $999,999 | 64 (6.1%) | 24 (1.2%) |
| $1,000,000 or more | 32 (3.1%) | 94 (4.7%) |
| Total | 1,043 (100.0%) | 1,982 (100.0%) |
Household Income by Mortgage Status in Edgewater
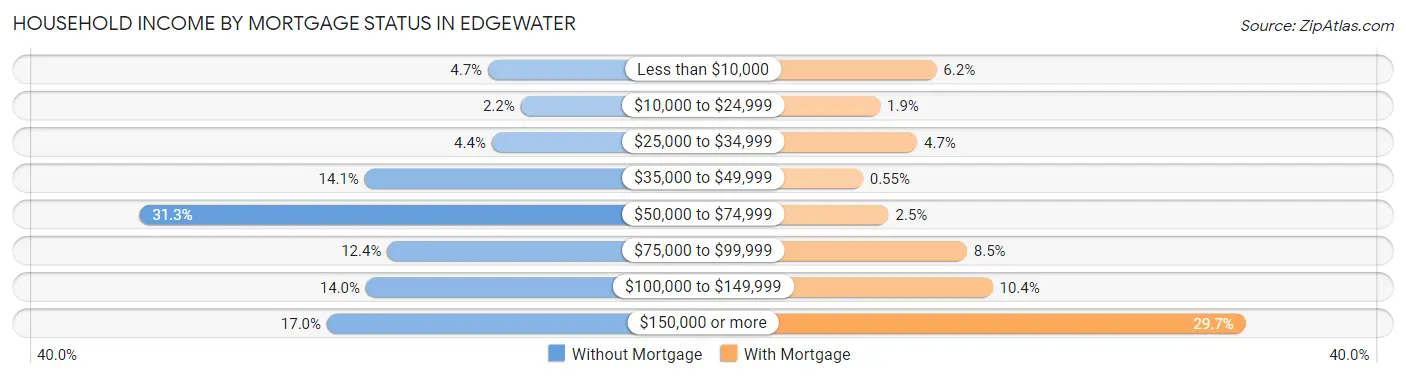
| Household Income | Without Mortgage | With Mortgage |
| Less than $10,000 | 49 (4.7%) | 122 (6.2%) |
| $10,000 to $24,999 | 23 (2.2%) | 37 (1.9%) |
| $25,000 to $34,999 | 46 (4.4%) | 93 (4.7%) |
| $35,000 to $49,999 | 147 (14.1%) | 11 (0.5%) |
| $50,000 to $74,999 | 326 (31.3%) | 50 (2.5%) |
| $75,000 to $99,999 | 129 (12.4%) | 168 (8.5%) |
| $100,000 to $149,999 | 146 (14.0%) | 207 (10.4%) |
| $150,000 or more | 177 (17.0%) | 589 (29.7%) |
| Total | 1,043 (100.0%) | 1,982 (100.0%) |
Property Value to Household Income Ratio in Edgewater
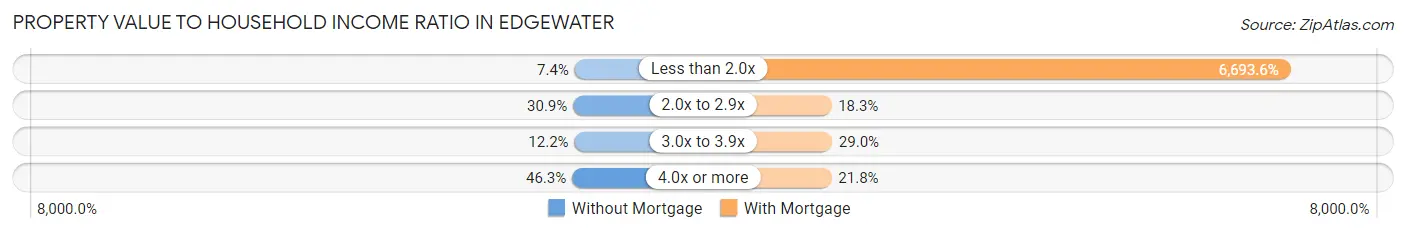
| Value-to-Income Ratio | Without Mortgage | With Mortgage |
| Less than 2.0x | 77 (7.4%) | 132,667 (6,693.6%) |
| 2.0x to 2.9x | 322 (30.9%) | 363 (18.3%) |
| 3.0x to 3.9x | 127 (12.2%) | 574 (29.0%) |
| 4.0x or more | 483 (46.3%) | 432 (21.8%) |
| Total | 1,043 (100.0%) | 1,982 (100.0%) |
Real Estate Taxes by Mortgage Status in Edgewater
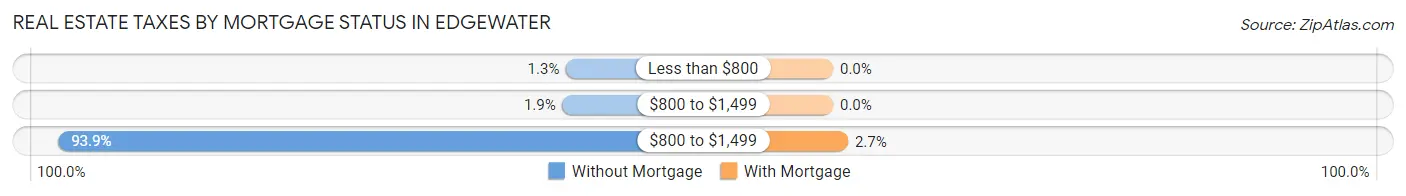
| Property Taxes | Without Mortgage | With Mortgage |
| Less than $800 | 13 (1.3%) | 0 (0.0%) |
| $800 to $1,499 | 20 (1.9%) | 0 (0.0%) |
| $800 to $1,499 | 979 (93.9%) | 54 (2.7%) |
| Total | 1,043 (100.0%) | 1,982 (100.0%) |
Health & Disability in Edgewater
Health Insurance Coverage by Age in Edgewater
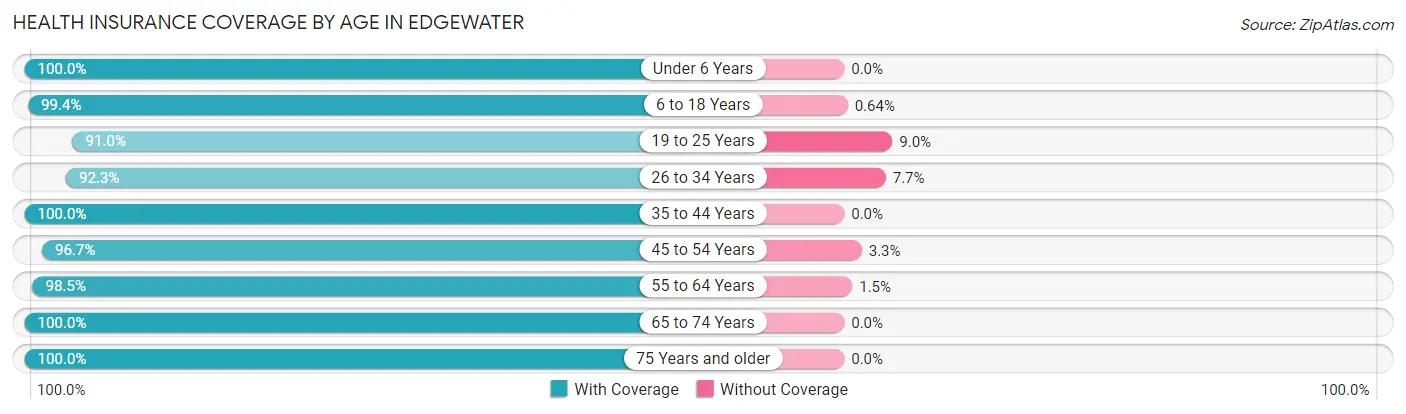
| Age Bracket | With Coverage | Without Coverage |
| Under 6 Years | 475 (100.0%) | 0 (0.0%) |
| 6 to 18 Years | 1,248 (99.4%) | 8 (0.6%) |
| 19 to 25 Years | 610 (91.0%) | 60 (9.0%) |
| 26 to 34 Years | 1,049 (92.3%) | 88 (7.7%) |
| 35 to 44 Years | 1,220 (100.0%) | 0 (0.0%) |
| 45 to 54 Years | 1,129 (96.7%) | 38 (3.3%) |
| 55 to 64 Years | 1,122 (98.5%) | 17 (1.5%) |
| 65 to 74 Years | 876 (100.0%) | 0 (0.0%) |
| 75 Years and older | 819 (100.0%) | 0 (0.0%) |
| Total | 8,548 (97.6%) | 211 (2.4%) |
Health Insurance Coverage by Citizenship Status in Edgewater
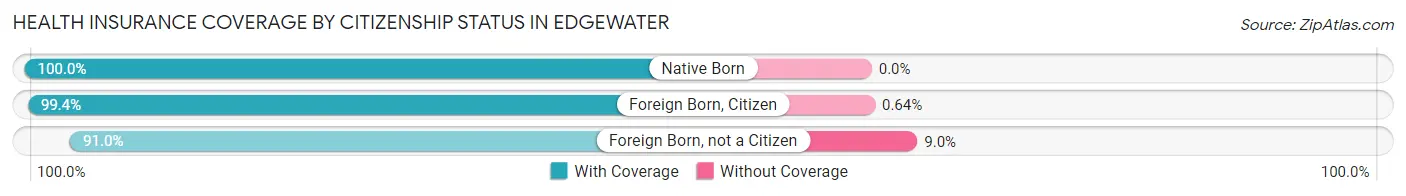
| Citizenship Status | With Coverage | Without Coverage |
| Native Born | 475 (100.0%) | 0 (0.0%) |
| Foreign Born, Citizen | 1,248 (99.4%) | 8 (0.6%) |
| Foreign Born, not a Citizen | 610 (91.0%) | 60 (9.0%) |
Health Insurance Coverage by Household Income in Edgewater
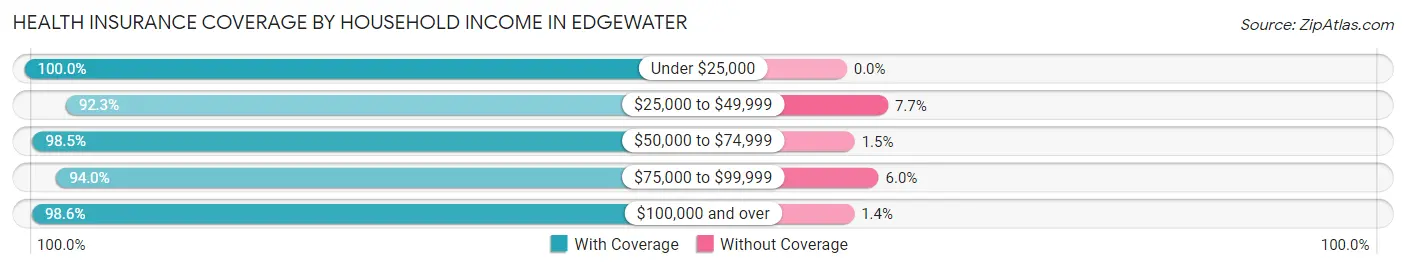
| Household Income | With Coverage | Without Coverage |
| Under $25,000 | 533 (100.0%) | 0 (0.0%) |
| $25,000 to $49,999 | 765 (92.3%) | 64 (7.7%) |
| $50,000 to $74,999 | 1,055 (98.5%) | 16 (1.5%) |
| $75,000 to $99,999 | 883 (94.0%) | 56 (6.0%) |
| $100,000 and over | 5,310 (98.6%) | 75 (1.4%) |
Public vs Private Health Insurance Coverage by Age in Edgewater
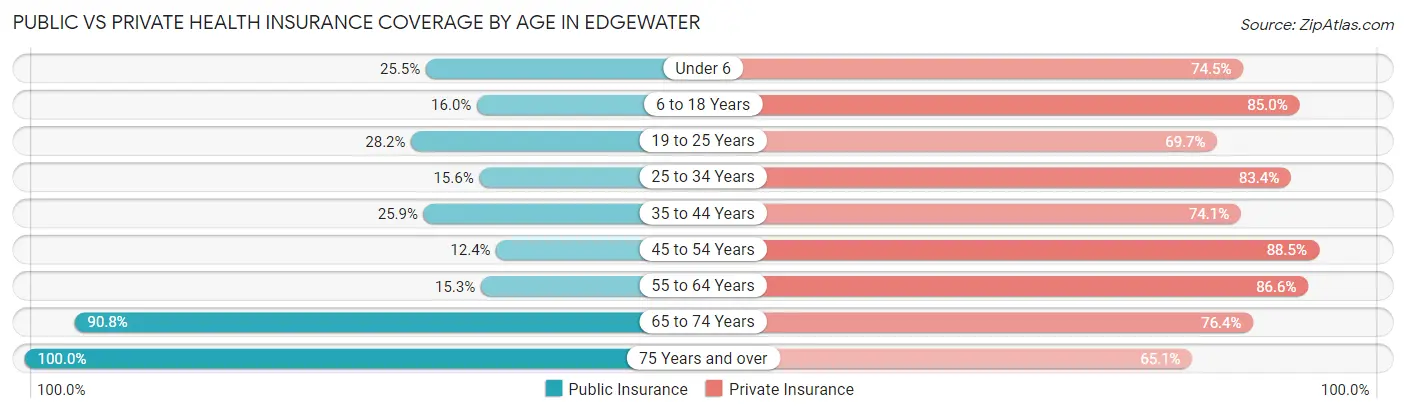
| Age Bracket | Public Insurance | Private Insurance |
| Under 6 | 121 (25.5%) | 354 (74.5%) |
| 6 to 18 Years | 201 (16.0%) | 1,067 (85.0%) |
| 19 to 25 Years | 189 (28.2%) | 467 (69.7%) |
| 25 to 34 Years | 177 (15.6%) | 948 (83.4%) |
| 35 to 44 Years | 316 (25.9%) | 904 (74.1%) |
| 45 to 54 Years | 145 (12.4%) | 1,033 (88.5%) |
| 55 to 64 Years | 174 (15.3%) | 986 (86.6%) |
| 65 to 74 Years | 795 (90.7%) | 669 (76.4%) |
| 75 Years and over | 819 (100.0%) | 533 (65.1%) |
| Total | 2,937 (33.5%) | 6,961 (79.5%) |
Disability Status by Sex by Age in Edgewater
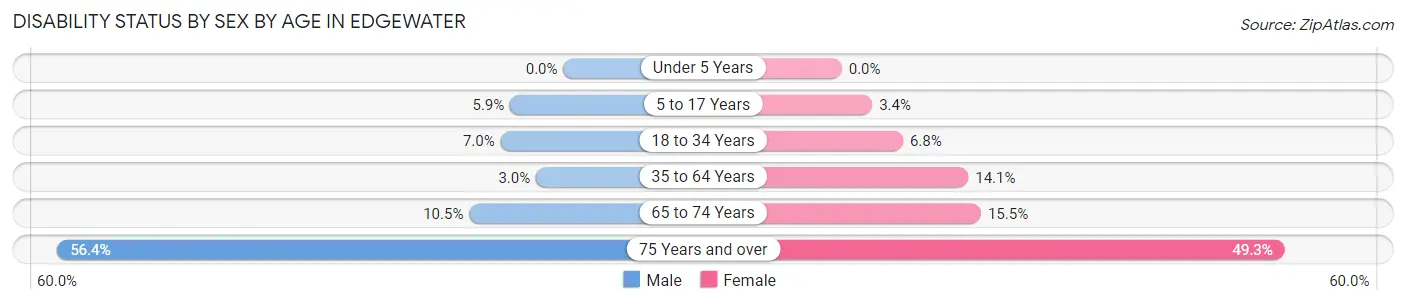
| Age Bracket | Male | Female |
| Under 5 Years | 0 (0.0%) | 0 (0.0%) |
| 5 to 17 Years | 36 (5.9%) | 23 (3.4%) |
| 18 to 34 Years | 70 (7.0%) | 59 (6.8%) |
| 35 to 64 Years | 55 (3.0%) | 242 (14.1%) |
| 65 to 74 Years | 35 (10.5%) | 84 (15.5%) |
| 75 Years and over | 257 (56.4%) | 179 (49.3%) |
Disability Class by Sex by Age in Edgewater
Disability Class: Hearing Difficulty
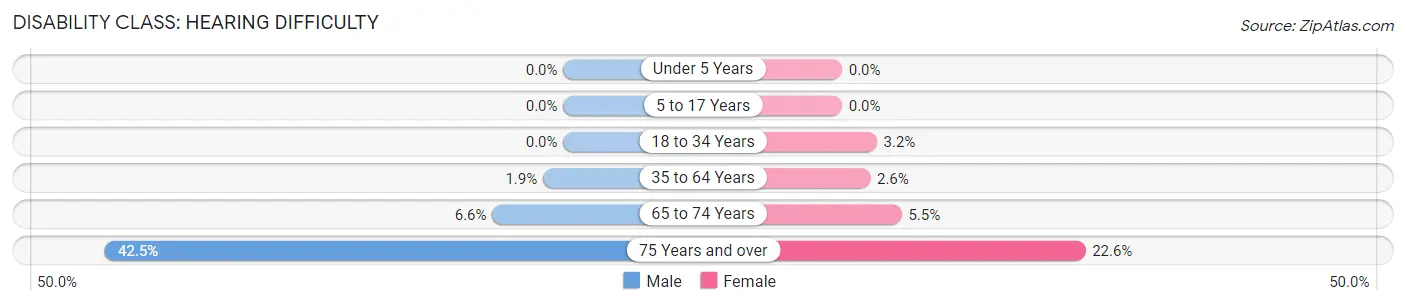
| Age Bracket | Male | Female |
| Under 5 Years | 0 (0.0%) | 0 (0.0%) |
| 5 to 17 Years | 0 (0.0%) | 0 (0.0%) |
| 18 to 34 Years | 0 (0.0%) | 28 (3.2%) |
| 35 to 64 Years | 34 (1.9%) | 45 (2.6%) |
| 65 to 74 Years | 22 (6.6%) | 30 (5.5%) |
| 75 Years and over | 194 (42.5%) | 82 (22.6%) |
Disability Class: Vision Difficulty
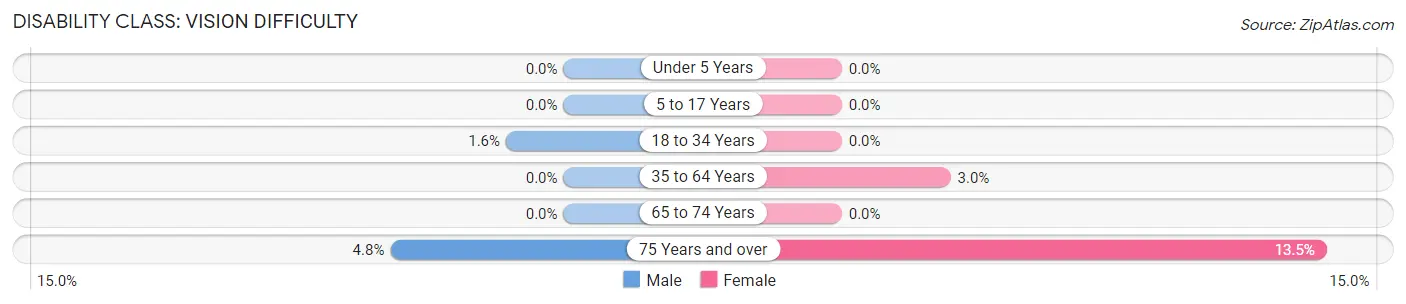
| Age Bracket | Male | Female |
| Under 5 Years | 0 (0.0%) | 0 (0.0%) |
| 5 to 17 Years | 0 (0.0%) | 0 (0.0%) |
| 18 to 34 Years | 16 (1.6%) | 0 (0.0%) |
| 35 to 64 Years | 0 (0.0%) | 52 (3.0%) |
| 65 to 74 Years | 0 (0.0%) | 0 (0.0%) |
| 75 Years and over | 22 (4.8%) | 49 (13.5%) |
Disability Class: Cognitive Difficulty
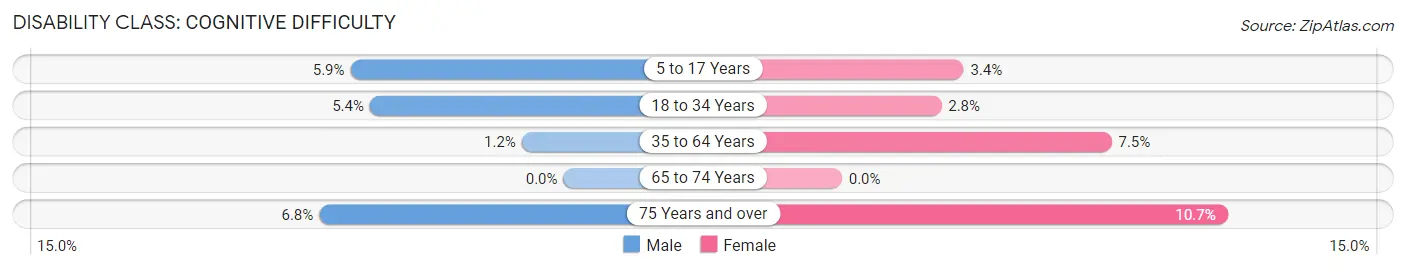
| Age Bracket | Male | Female |
| 5 to 17 Years | 36 (5.9%) | 23 (3.4%) |
| 18 to 34 Years | 54 (5.4%) | 24 (2.8%) |
| 35 to 64 Years | 21 (1.2%) | 129 (7.5%) |
| 65 to 74 Years | 0 (0.0%) | 0 (0.0%) |
| 75 Years and over | 31 (6.8%) | 39 (10.7%) |
Disability Class: Ambulatory Difficulty
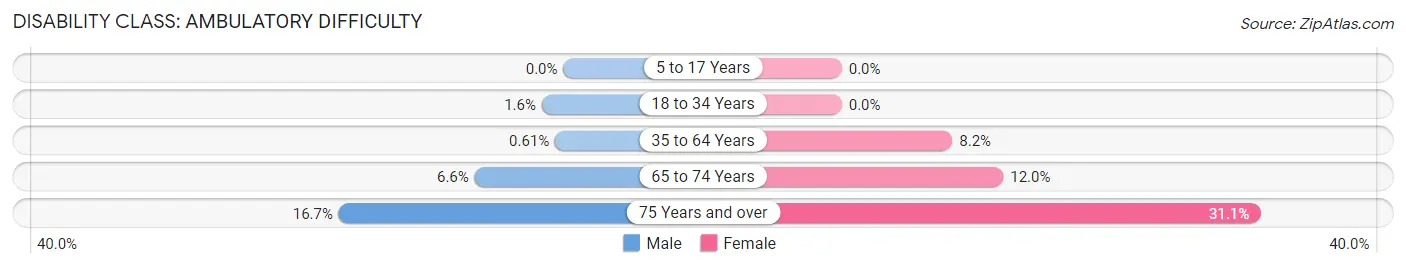
| Age Bracket | Male | Female |
| 5 to 17 Years | 0 (0.0%) | 0 (0.0%) |
| 18 to 34 Years | 16 (1.6%) | 0 (0.0%) |
| 35 to 64 Years | 11 (0.6%) | 141 (8.2%) |
| 65 to 74 Years | 22 (6.6%) | 65 (12.0%) |
| 75 Years and over | 76 (16.7%) | 113 (31.1%) |
Disability Class: Self-Care Difficulty
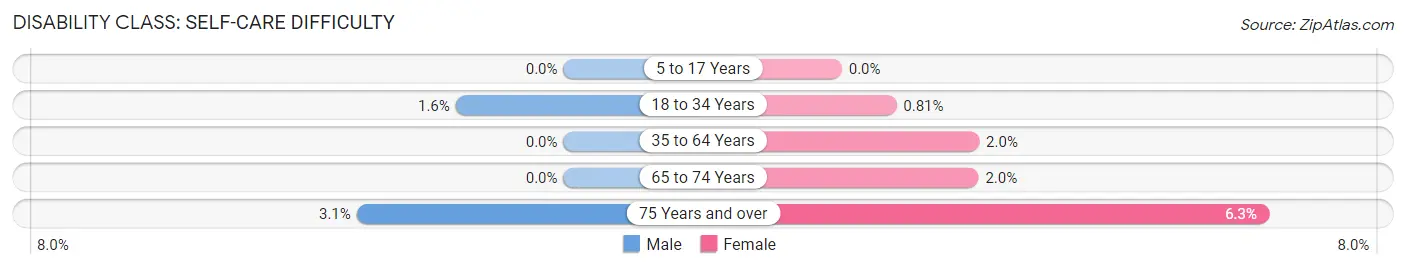
| Age Bracket | Male | Female |
| 5 to 17 Years | 0 (0.0%) | 0 (0.0%) |
| 18 to 34 Years | 16 (1.6%) | 7 (0.8%) |
| 35 to 64 Years | 0 (0.0%) | 35 (2.0%) |
| 65 to 74 Years | 0 (0.0%) | 11 (2.0%) |
| 75 Years and over | 14 (3.1%) | 23 (6.3%) |
Technology Access in Edgewater
Computing Device Access in Edgewater
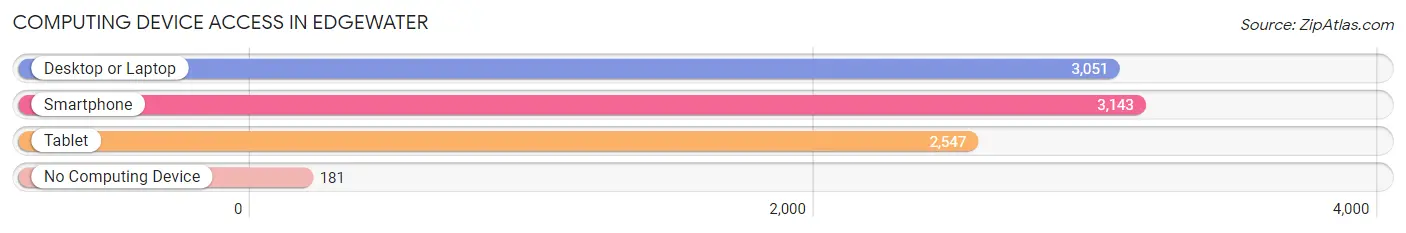
| Device Type | # Households | % Households |
| Desktop or Laptop | 3,051 | 84.6% |
| Smartphone | 3,143 | 87.1% |
| Tablet | 2,547 | 70.6% |
| No Computing Device | 181 | 5.0% |
| Total | 3,608 | 100.0% |
Internet Access in Edgewater
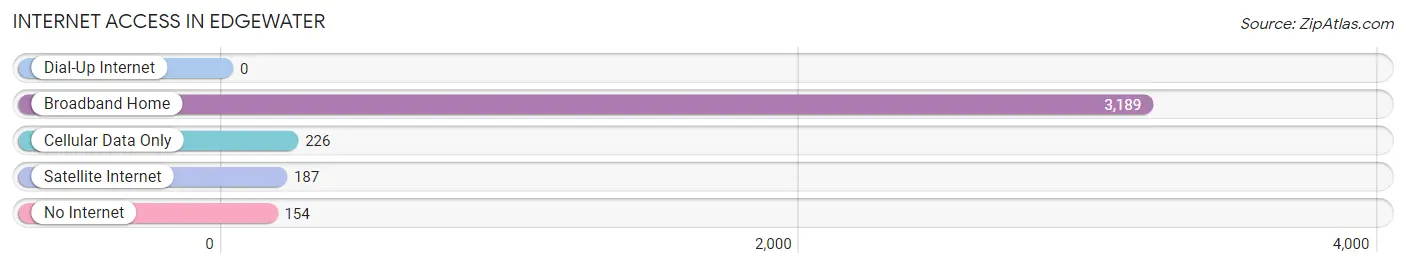
| Internet Type | # Households | % Households |
| Dial-Up Internet | 0 | 0.0% |
| Broadband Home | 3,189 | 88.4% |
| Cellular Data Only | 226 | 6.3% |
| Satellite Internet | 187 | 5.2% |
| No Internet | 154 | 4.3% |
| Total | 3,608 | 100.0% |
Edgewater Summary
Edgewater, Maryland is a small town located in Anne Arundel County, Maryland, United States. It is situated on the western shore of the Chesapeake Bay, approximately 10 miles south of Annapolis. The town has a population of approximately 10,000 people and is part of the Baltimore-Washington metropolitan area.
History
The area that is now Edgewater was first settled in the early 1700s by English colonists. The town was originally known as Broad Creek Landing, and was a popular port for ships traveling up and down the Chesapeake Bay. In the late 1800s, the town was renamed Edgewater after the nearby Edgewater Beach Hotel. The hotel was a popular destination for wealthy vacationers from Baltimore and Washington, D.C.
In the early 1900s, Edgewater began to grow as a residential community. The town was incorporated in 1945 and has since become a popular bedroom community for commuters to Washington, D.C. and Baltimore.
Geography
Edgewater is located on the western shore of the Chesapeake Bay, approximately 10 miles south of Annapolis. The town is bordered by the South River to the east and the Rhode River to the west. The town is situated on a peninsula, with the Chesapeake Bay to the south and the South River to the north.
The town has a total area of 4.2 square miles, of which 0.2 square miles is water. The terrain is mostly flat, with some rolling hills.
Economy
Edgewater’s economy is largely based on tourism and retail. The town is home to several marinas, which attract visitors from all over the region. The town also has several restaurants, bars, and shops, which attract both locals and tourists.
The town is also home to several small businesses, including a boat repair shop, a boat storage facility, and a boat sales and service center.
Demographics
As of the 2010 census, Edgewater had a population of 10,214 people. The racial makeup of the town was 87.3% White, 5.7% African American, 0.3% Native American, 2.2% Asian, 0.1% Pacific Islander, 1.7% from other races, and 2.9% from two or more races. Hispanic or Latino of any race were 5.2% of the population.
The median income for a household in Edgewater was $76,945, and the median income for a family was $90,945. The per capita income for the town was $37,945. About 4.2% of families and 5.7% of the population were below the poverty line, including 6.3% of those under age 18 and 4.2% of those age 65 or over.
Common Questions
What is Per Capita Income in Edgewater?
Per Capita income in Edgewater is $49,072.
What is the Median Family Income in Edgewater?
Median Family Income in Edgewater is $130,194.
What is the Median Household income in Edgewater?
Median Household Income in Edgewater is $105,849.
What is Income or Wage Gap in Edgewater?
Income or Wage Gap in Edgewater is 10.1%.
Women in Edgewater earn 89.9 cents for every dollar earned by a man.
What is Family Income Deficit in Edgewater?
Family Income Deficit in Edgewater is $11,163.
Families that are below poverty line in Edgewater earn $11,163 less on average than the poverty threshold level.
What is Inequality or Gini Index in Edgewater?
Inequality or Gini Index in Edgewater is 0.37.
What is the Total Population of Edgewater?
Total Population of Edgewater is 8,928.
What is the Total Male Population of Edgewater?
Total Male Population of Edgewater is 4,482.
What is the Total Female Population of Edgewater?
Total Female Population of Edgewater is 4,446.
What is the Ratio of Males per 100 Females in Edgewater?
There are 100.81 Males per 100 Females in Edgewater.
What is the Ratio of Females per 100 Males in Edgewater?
There are 99.20 Females per 100 Males in Edgewater.
What is the Median Population Age in Edgewater?
Median Population Age in Edgewater is 40.7 Years.
What is the Average Family Size in Edgewater
Average Family Size in Edgewater is 3.0 People.
What is the Average Household Size in Edgewater
Average Household Size in Edgewater is 2.4 People.
How Large is the Labor Force in Edgewater?
There are 5,009 People in the Labor Forcein in Edgewater.
What is the Percentage of People in the Labor Force in Edgewater?
66.6% of People are in the Labor Force in Edgewater.
What is the Unemployment Rate in Edgewater?
Unemployment Rate in Edgewater is 4.5%.