High Springs, FL Map & Demographics
High Springs Map
High Springs Overview
$31,820
PER CAPITA INCOME
$89,357
AVG FAMILY INCOME
$76,760
AVG HOUSEHOLD INCOME
12.3%
WAGE / INCOME GAP [ % ]
87.7¢/ $1
WAGE / INCOME GAP [ $ ]
0.42
INEQUALITY / GINI INDEX
6,283
TOTAL POPULATION
2,963
MALE POPULATION
3,320
FEMALE POPULATION
89.25
MALES / 100 FEMALES
112.05
FEMALES / 100 MALES
36.8
MEDIAN AGE
3.7
AVG FAMILY SIZE
3.2
AVG HOUSEHOLD SIZE
2,761
LABOR FORCE [ PEOPLE ]
60.3%
PERCENT IN LABOR FORCE
2.9%
UNEMPLOYMENT RATE
High Springs Zip Codes
High Springs Area Codes
Income in High Springs
Income Overview in High Springs
Per Capita Income in High Springs is $31,820, while median incomes of families and households are $89,357 and $76,760 respectively.
| Characteristic | Number | Measure |
| Per Capita Income | 6,283 | $31,820 |
| Median Family Income | 1,505 | $89,357 |
| Mean Family Income | 1,505 | $105,893 |
| Median Household Income | 1,939 | $76,760 |
| Mean Household Income | 1,939 | $96,655 |
| Income Deficit | 1,505 | $0 |
| Wage / Income Gap (%) | 6,283 | 12.31% |
| Wage / Income Gap ($) | 6,283 | 87.69¢ per $1 |
| Gini / Inequality Index | 6,283 | 0.42 |
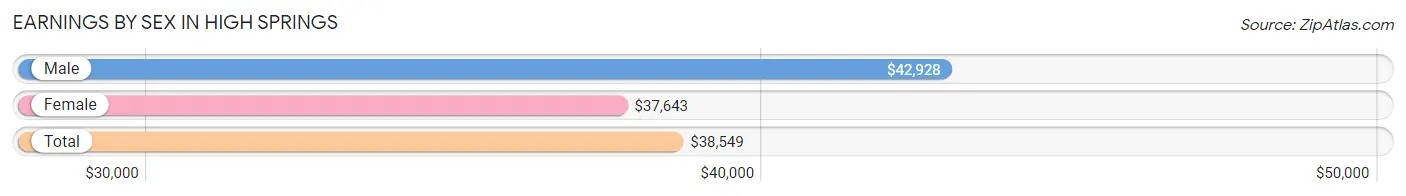
Earnings by Sex in High Springs
Average Earnings in High Springs are $38,549, $42,928 for men and $37,643 for women, a difference of 12.3%.
| Sex | Number | Average Earnings |
| Male | 1,455 (48.1%) | $42,928 |
| Female | 1,569 (51.9%) | $37,643 |
| Total | 3,024 (100.0%) | $38,549 |
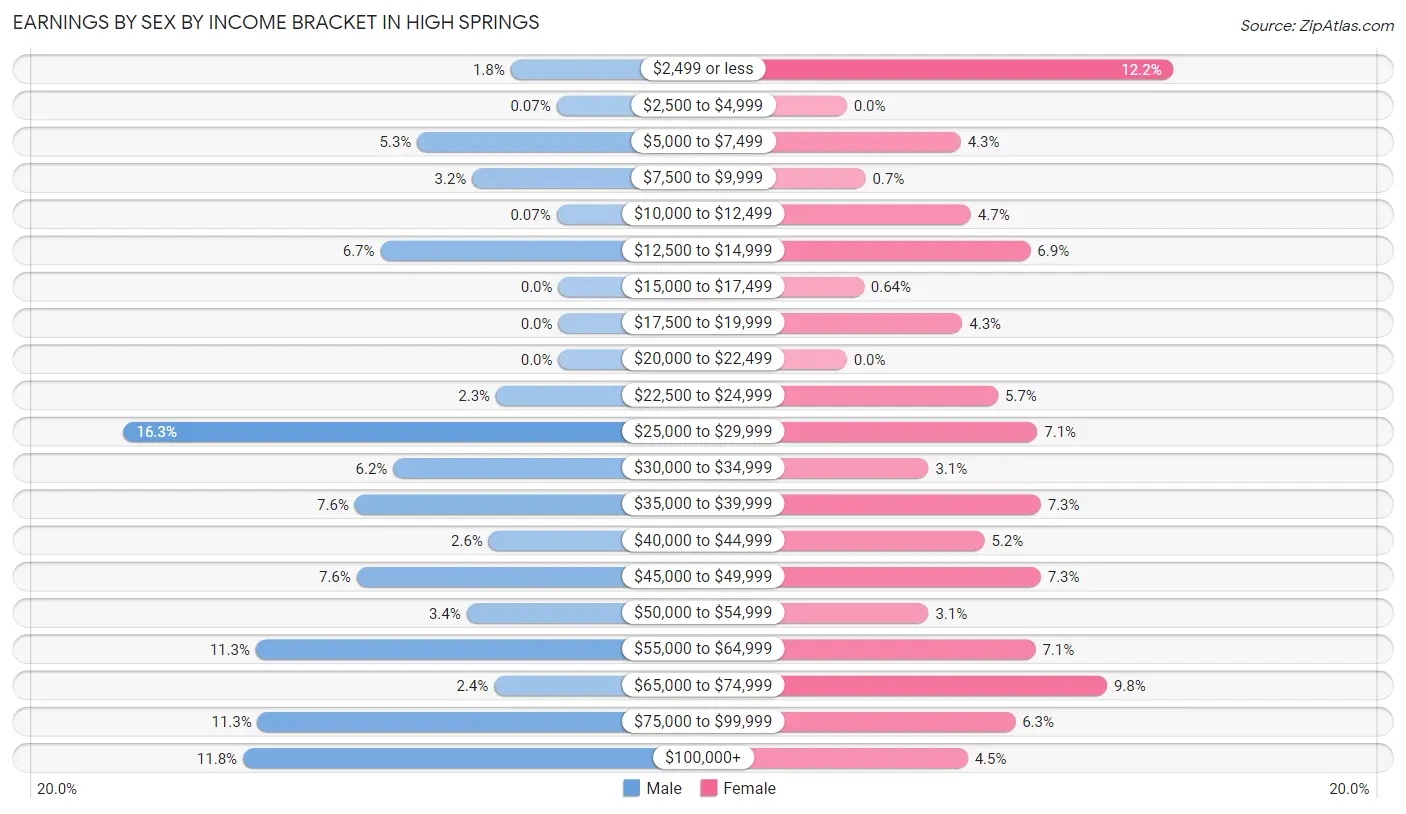
Earnings by Sex by Income Bracket in High Springs
The most common earnings brackets in High Springs are $25,000 to $29,999 for men (237 | 16.3%) and $2,499 or less for women (192 | 12.2%).
| Income | Male | Female |
| $2,499 or less | 26 (1.8%) | 192 (12.2%) |
| $2,500 to $4,999 | 1 (0.1%) | 0 (0.0%) |
| $5,000 to $7,499 | 77 (5.3%) | 67 (4.3%) |
| $7,500 to $9,999 | 47 (3.2%) | 11 (0.7%) |
| $10,000 to $12,499 | 1 (0.1%) | 73 (4.6%) |
| $12,500 to $14,999 | 97 (6.7%) | 108 (6.9%) |
| $15,000 to $17,499 | 0 (0.0%) | 10 (0.6%) |
| $17,500 to $19,999 | 0 (0.0%) | 68 (4.3%) |
| $20,000 to $22,499 | 0 (0.0%) | 0 (0.0%) |
| $22,500 to $24,999 | 34 (2.3%) | 89 (5.7%) |
| $25,000 to $29,999 | 237 (16.3%) | 112 (7.1%) |
| $30,000 to $34,999 | 90 (6.2%) | 48 (3.1%) |
| $35,000 to $39,999 | 111 (7.6%) | 114 (7.3%) |
| $40,000 to $44,999 | 38 (2.6%) | 81 (5.2%) |
| $45,000 to $49,999 | 110 (7.6%) | 114 (7.3%) |
| $50,000 to $54,999 | 50 (3.4%) | 48 (3.1%) |
| $55,000 to $64,999 | 165 (11.3%) | 111 (7.1%) |
| $65,000 to $74,999 | 35 (2.4%) | 153 (9.8%) |
| $75,000 to $99,999 | 164 (11.3%) | 99 (6.3%) |
| $100,000+ | 172 (11.8%) | 71 (4.5%) |
| Total | 1,455 (100.0%) | 1,569 (100.0%) |
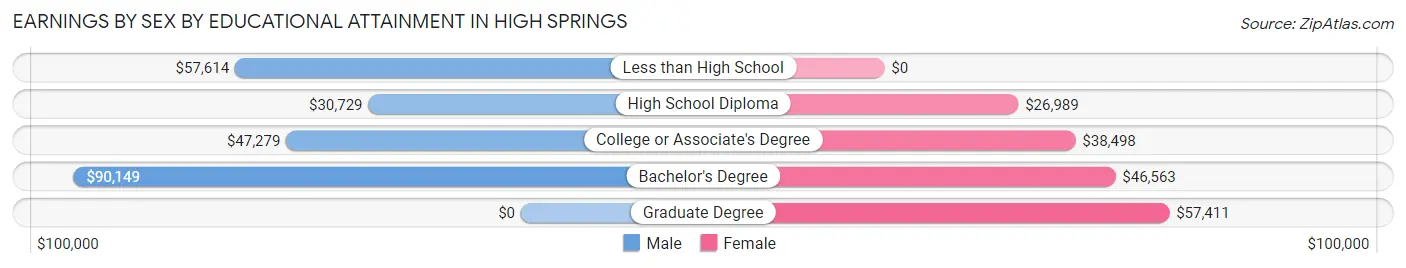
Earnings by Sex by Educational Attainment in High Springs
Average earnings in High Springs are $52,775 for men and $43,321 for women, a difference of 17.9%. Men with an educational attainment of bachelor's degree enjoy the highest average annual earnings of $90,149, while those with high school diploma education earn the least with $30,729. Women with an educational attainment of graduate degree earn the most with the average annual earnings of $57,411, while those with high school diploma education have the smallest earnings of $26,989.
| Educational Attainment | Male Income | Female Income |
| Less than High School | $57,614 | $0 |
| High School Diploma | $30,729 | $26,989 |
| College or Associate's Degree | $47,279 | $38,498 |
| Bachelor's Degree | $90,149 | $46,563 |
| Graduate Degree | - | - |
| Total | $52,775 | $43,321 |
Family Income in High Springs
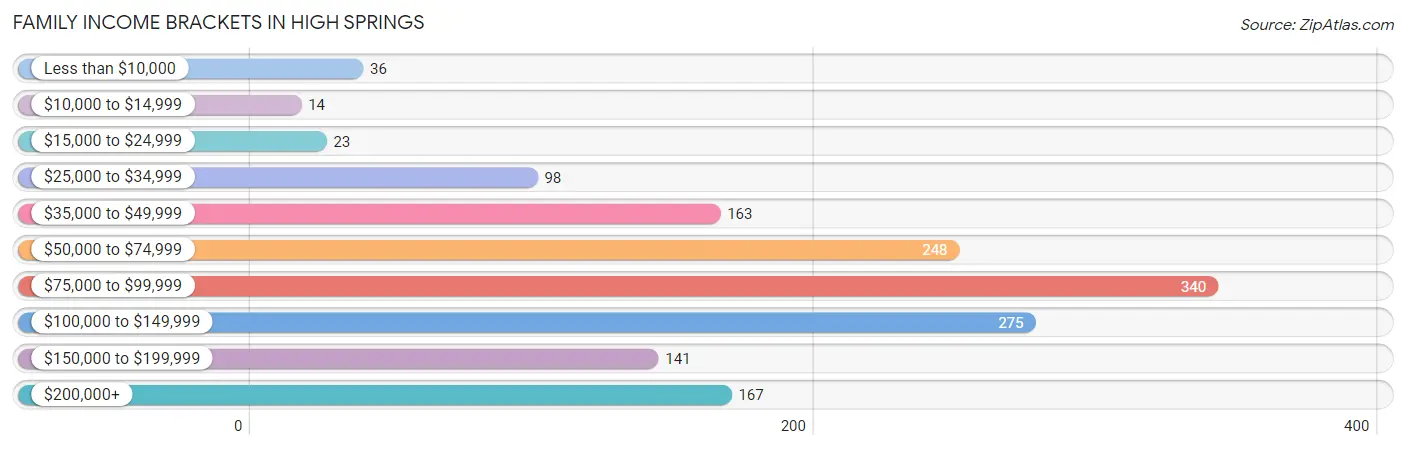
Family Income Brackets in High Springs
According to the High Springs family income data, there are 340 families falling into the $75,000 to $99,999 income range, which is the most common income bracket and makes up 22.6% of all families. Conversely, the $10,000 to $14,999 income bracket is the least frequent group with only 14 families (0.9%) belonging to this category.
| Income Bracket | # Families | % Families |
| Less than $10,000 | 36 | 2.4% |
| $10,000 to $14,999 | 14 | 0.9% |
| $15,000 to $24,999 | 23 | 1.5% |
| $25,000 to $34,999 | 98 | 6.5% |
| $35,000 to $49,999 | 163 | 10.8% |
| $50,000 to $74,999 | 248 | 16.5% |
| $75,000 to $99,999 | 340 | 22.6% |
| $100,000 to $149,999 | 275 | 18.3% |
| $150,000 to $199,999 | 141 | 9.4% |
| $200,000+ | 167 | 11.1% |
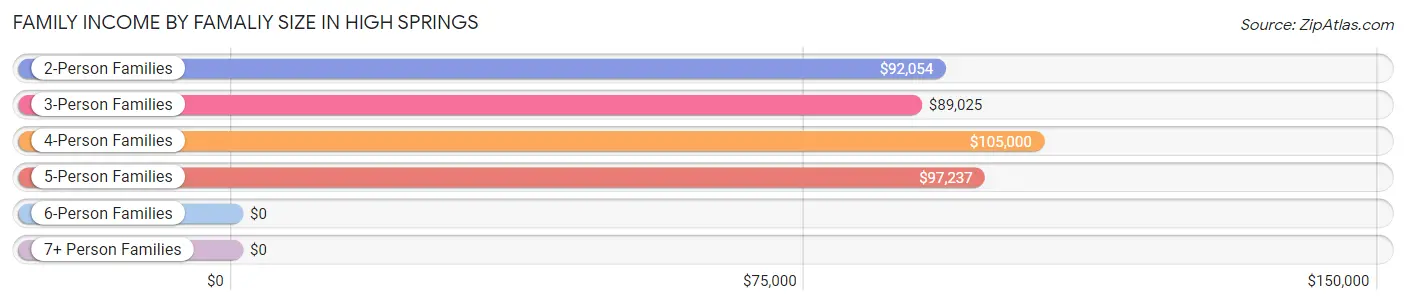
Family Income by Famaliy Size in High Springs
4-person families (256 | 17.0%) account for the highest median family income in High Springs with $105,000 per family, while 2-person families (588 | 39.1%) have the highest median income of $46,027 per family member.
| Income Bracket | # Families | Median Income |
| 2-Person Families | 588 (39.1%) | $92,054 |
| 3-Person Families | 442 (29.4%) | $89,025 |
| 4-Person Families | 256 (17.0%) | $105,000 |
| 5-Person Families | 66 (4.4%) | $97,237 |
| 6-Person Families | 45 (3.0%) | $0 |
| 7+ Person Families | 108 (7.2%) | $0 |
| Total | 1,505 (100.0%) | $89,357 |
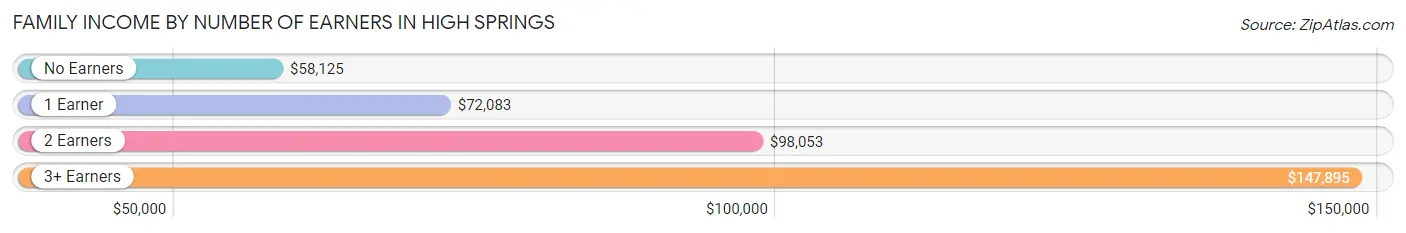
Family Income by Number of Earners in High Springs
The median family income in High Springs is $89,357, with families comprising 3+ earners (214) having the highest median family income of $147,895, while families with no earners (191) have the lowest median family income of $58,125, accounting for 14.2% and 12.7% of families, respectively.
| Number of Earners | # Families | Median Income |
| No Earners | 191 (12.7%) | $58,125 |
| 1 Earner | 503 (33.4%) | $72,083 |
| 2 Earners | 597 (39.7%) | $98,053 |
| 3+ Earners | 214 (14.2%) | $147,895 |
| Total | 1,505 (100.0%) | $89,357 |
Household Income in High Springs
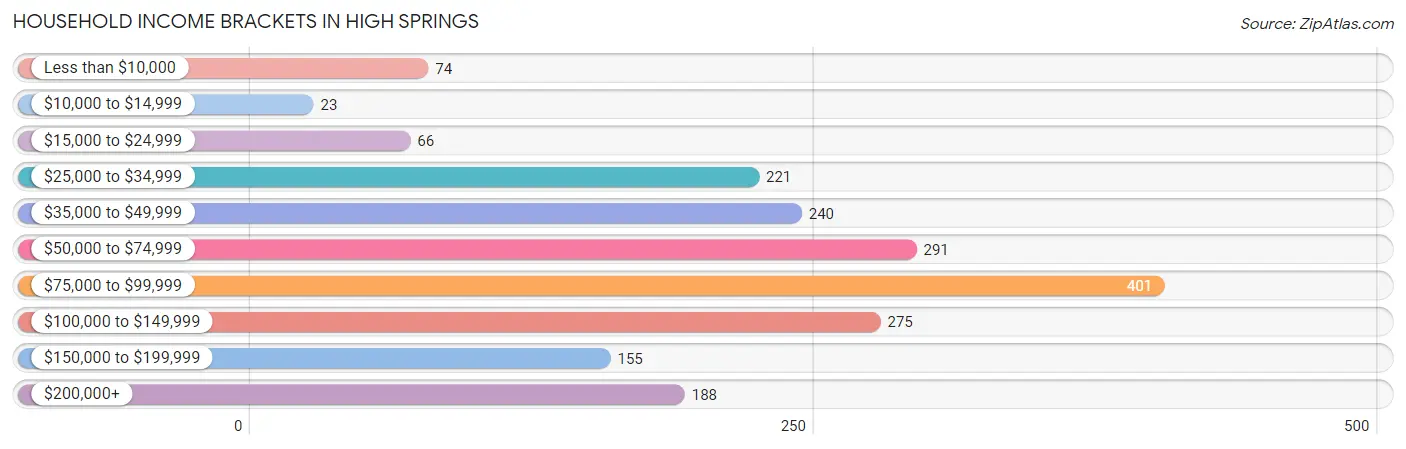
Household Income Brackets in High Springs
With 401 households falling in the category, the $75,000 to $99,999 income range is the most frequent in High Springs, accounting for 20.7% of all households. In contrast, only 23 households (1.2%) fall into the $10,000 to $14,999 income bracket, making it the least populous group.
| Income Bracket | # Households | % Households |
| Less than $10,000 | 74 | 3.8% |
| $10,000 to $14,999 | 23 | 1.2% |
| $15,000 to $24,999 | 66 | 3.4% |
| $25,000 to $34,999 | 221 | 11.4% |
| $35,000 to $49,999 | 240 | 12.4% |
| $50,000 to $74,999 | 291 | 15.0% |
| $75,000 to $99,999 | 401 | 20.7% |
| $100,000 to $149,999 | 275 | 14.2% |
| $150,000 to $199,999 | 155 | 8.0% |
| $200,000+ | 188 | 9.7% |
Household Income by Householder Age in High Springs
The median household income in High Springs is $76,760, with the highest median household income of $91,518 found in the 45 to 64 years age bracket for the primary householder. A total of 678 households (35.0%) fall into this category. Meanwhile, the 15 to 24 years age bracket for the primary householder has the lowest median household income of $0, with 17 households (0.9%) in this group.
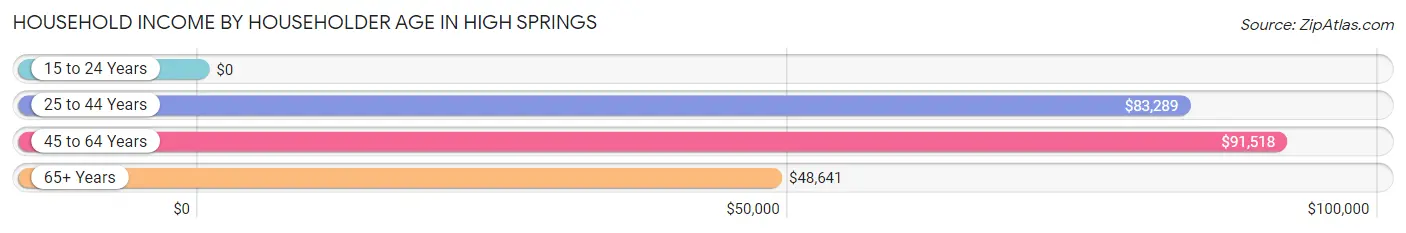
| Income Bracket | # Households | Median Income |
| 15 to 24 Years | 17 (0.9%) | $0 |
| 25 to 44 Years | 658 (33.9%) | $83,289 |
| 45 to 64 Years | 678 (35.0%) | $91,518 |
| 65+ Years | 586 (30.2%) | $48,641 |
| Total | 1,939 (100.0%) | $76,760 |
Poverty in High Springs
Income Below Poverty by Sex and Age in High Springs
With 24.5% poverty level for males and 12.6% for females among the residents of High Springs, 6 to 11 year old males and 35 to 44 year old females are the most vulnerable to poverty, with 322 males (72.0%) and 94 females (21.9%) in their respective age groups living below the poverty level.
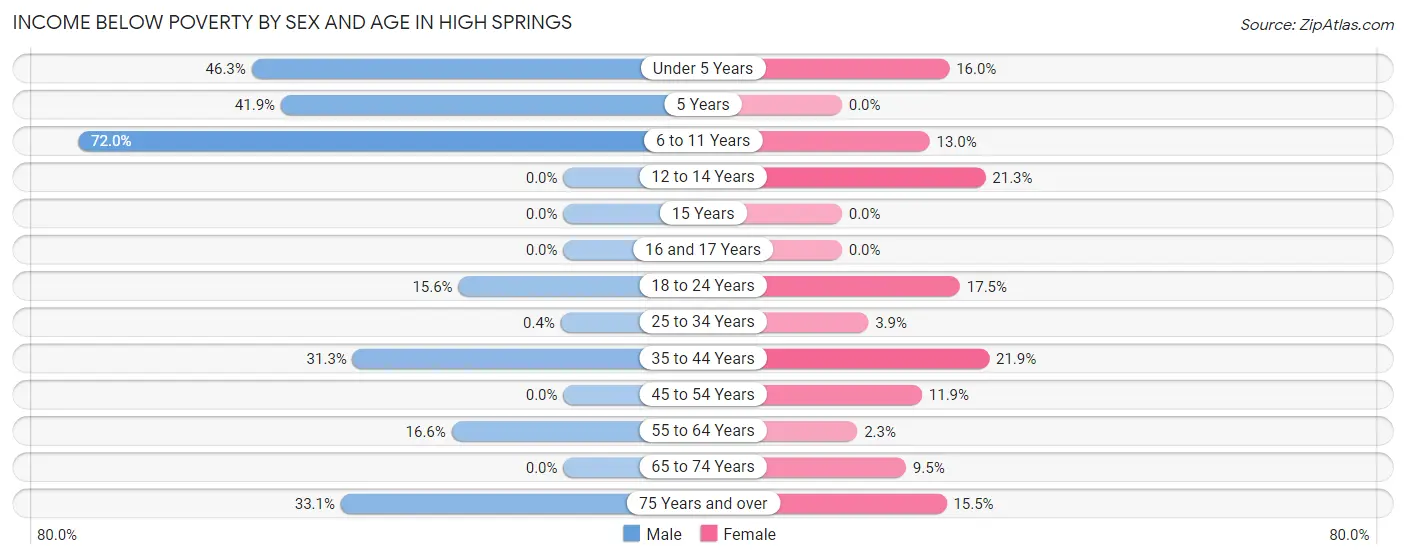
| Age Bracket | Male | Female |
| Under 5 Years | 106 (46.3%) | 26 (16.0%) |
| 5 Years | 13 (41.9%) | 0 (0.0%) |
| 6 to 11 Years | 322 (72.0%) | 31 (13.0%) |
| 12 to 14 Years | 0 (0.0%) | 68 (21.3%) |
| 15 Years | 0 (0.0%) | 0 (0.0%) |
| 16 and 17 Years | 0 (0.0%) | 0 (0.0%) |
| 18 to 24 Years | 55 (15.6%) | 51 (17.5%) |
| 25 to 34 Years | 1 (0.4%) | 14 (3.9%) |
| 35 to 44 Years | 143 (31.3%) | 94 (21.9%) |
| 45 to 54 Years | 0 (0.0%) | 49 (11.9%) |
| 55 to 64 Years | 37 (16.6%) | 9 (2.3%) |
| 65 to 74 Years | 0 (0.0%) | 22 (9.5%) |
| 75 Years and over | 39 (33.1%) | 55 (15.5%) |
| Total | 716 (24.5%) | 419 (12.6%) |
Income Above Poverty by Sex and Age in High Springs
According to the poverty statistics in High Springs, males aged 12 to 14 years and females aged 5 years are the age groups that are most secure financially, with 100.0% of males and 100.0% of females in these age groups living above the poverty line.
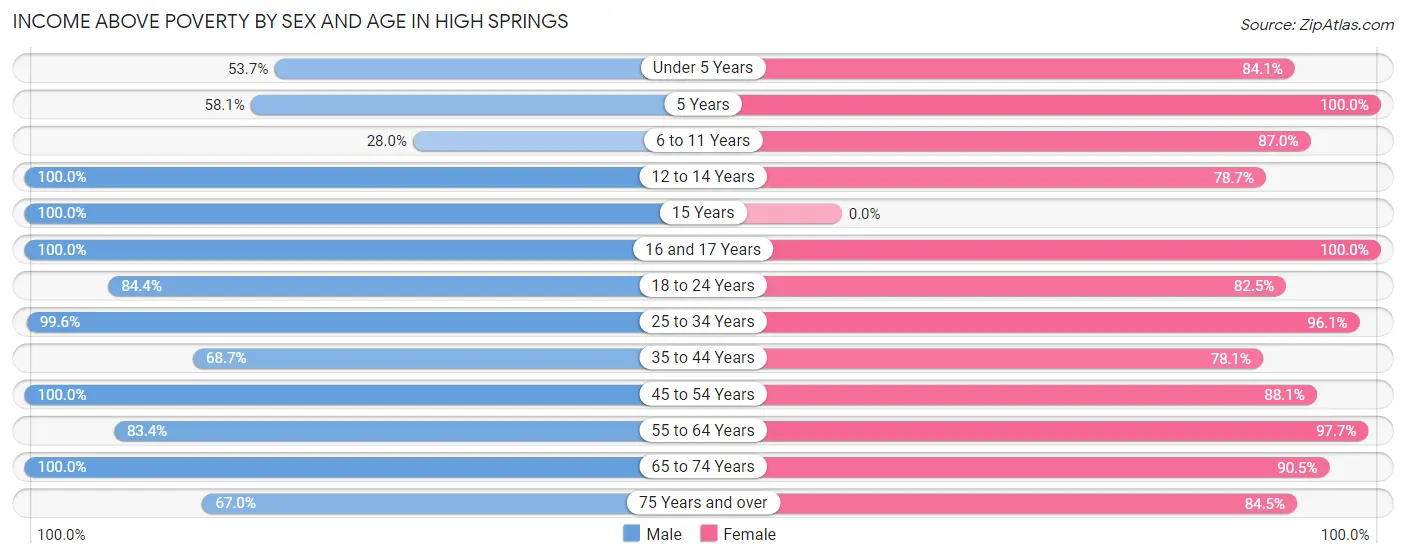
| Age Bracket | Male | Female |
| Under 5 Years | 123 (53.7%) | 137 (84.1%) |
| 5 Years | 18 (58.1%) | 75 (100.0%) |
| 6 to 11 Years | 125 (28.0%) | 207 (87.0%) |
| 12 to 14 Years | 101 (100.0%) | 251 (78.7%) |
| 15 Years | 58 (100.0%) | 0 (0.0%) |
| 16 and 17 Years | 50 (100.0%) | 56 (100.0%) |
| 18 to 24 Years | 298 (84.4%) | 240 (82.5%) |
| 25 to 34 Years | 246 (99.6%) | 343 (96.1%) |
| 35 to 44 Years | 314 (68.7%) | 336 (78.1%) |
| 45 to 54 Years | 315 (100.0%) | 363 (88.1%) |
| 55 to 64 Years | 186 (83.4%) | 384 (97.7%) |
| 65 to 74 Years | 291 (100.0%) | 209 (90.5%) |
| 75 Years and over | 79 (66.9%) | 299 (84.5%) |
| Total | 2,204 (75.5%) | 2,900 (87.4%) |
Income Below Poverty Among Married-Couple Families in High Springs
The poverty statistics for married-couple families in High Springs show that 10.6% or 127 of the total 1,202 families live below the poverty line. Families with 5 or more children have the highest poverty rate of 85.2%, comprising of 92 families. On the other hand, families with 1 or 2 children have the lowest poverty rate of 0.0%, which includes 0 families.
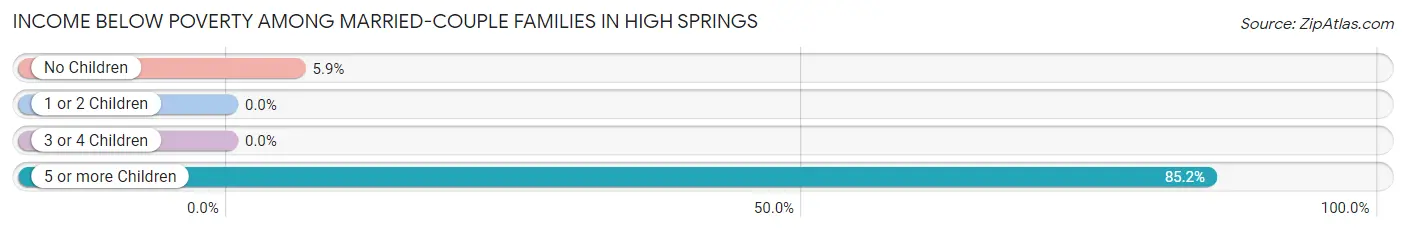
| Children | Above Poverty | Below Poverty |
| No Children | 560 (94.1%) | 35 (5.9%) |
| 1 or 2 Children | 463 (100.0%) | 0 (0.0%) |
| 3 or 4 Children | 36 (100.0%) | 0 (0.0%) |
| 5 or more Children | 16 (14.8%) | 92 (85.2%) |
| Total | 1,075 (89.4%) | 127 (10.6%) |
Income Below Poverty Among Single-Parent Households in High Springs
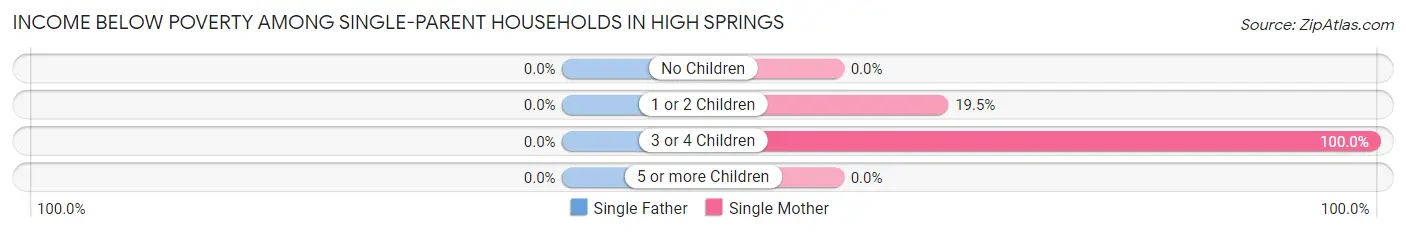
| Children | Single Father | Single Mother |
| No Children | 0 (0.0%) | 0 (0.0%) |
| 1 or 2 Children | 0 (0.0%) | 22 (19.5%) |
| 3 or 4 Children | 0 (0.0%) | 14 (100.0%) |
| 5 or more Children | 0 (0.0%) | 0 (0.0%) |
| Total | 0 (0.0%) | 36 (13.0%) |
Income Below Poverty Among Married-Couple vs Single-Parent Households in High Springs
The poverty data for High Springs shows that 127 of the married-couple family households (10.6%) and 36 of the single-parent households (11.9%) are living below the poverty level. Within the married-couple family households, those with 5 or more children have the highest poverty rate, with 92 households (85.2%) falling below the poverty line. Among the single-parent households, those with 3 or 4 children have the highest poverty rate, with 14 household (100.0%) living below poverty.
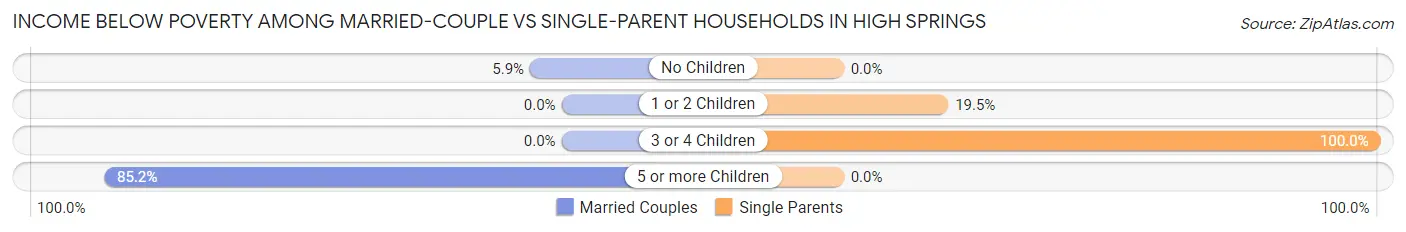
| Children | Married-Couple Families | Single-Parent Households |
| No Children | 35 (5.9%) | 0 (0.0%) |
| 1 or 2 Children | 0 (0.0%) | 22 (19.5%) |
| 3 or 4 Children | 0 (0.0%) | 14 (100.0%) |
| 5 or more Children | 92 (85.2%) | 0 (0.0%) |
| Total | 127 (10.6%) | 36 (11.9%) |
Race in High Springs
The most populous races in High Springs are White / Caucasian (4,978 | 79.2%), Black / African American (1,073 | 17.1%), and Hispanic or Latino (536 | 8.5%).
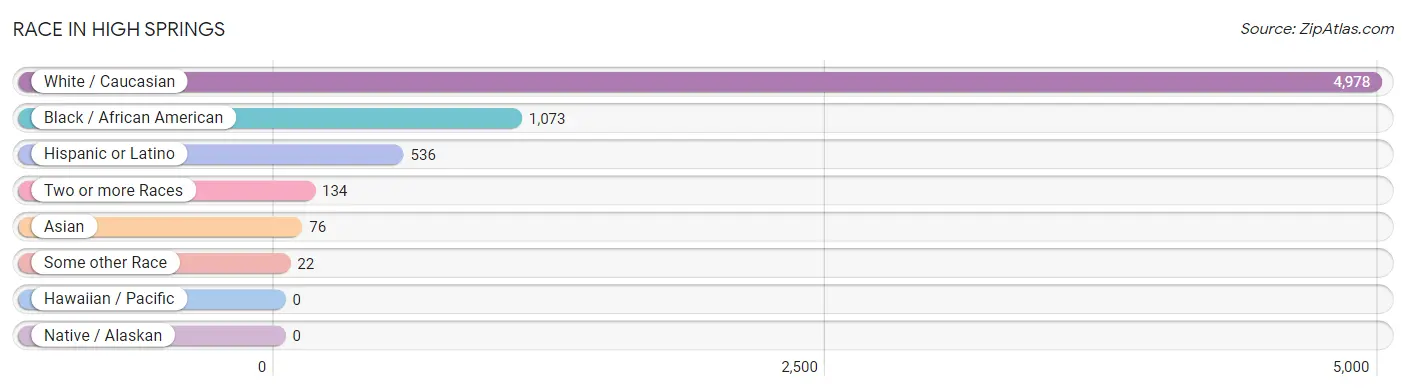
| Race | # Population | % Population |
| Asian | 76 | 1.2% |
| Black / African American | 1,073 | 17.1% |
| Hawaiian / Pacific | 0 | 0.0% |
| Hispanic or Latino | 536 | 8.5% |
| Native / Alaskan | 0 | 0.0% |
| White / Caucasian | 4,978 | 79.2% |
| Two or more Races | 134 | 2.1% |
| Some other Race | 22 | 0.4% |
| Total | 6,283 | 100.0% |
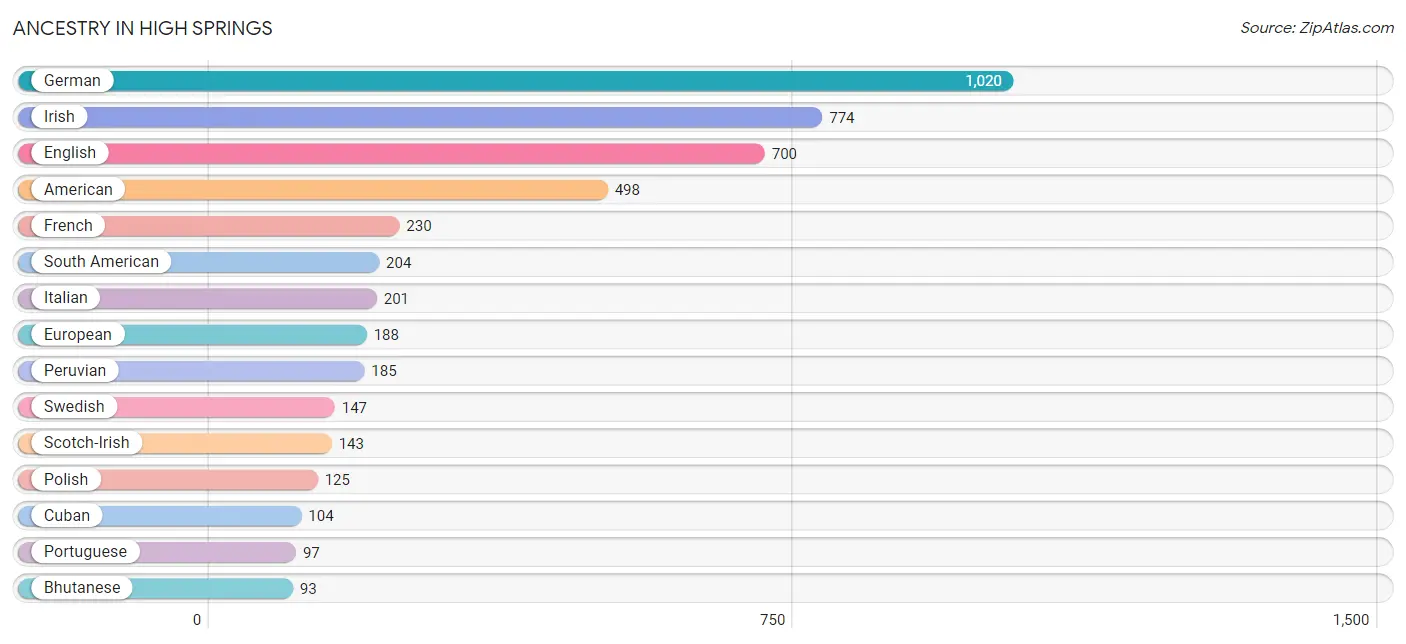
Ancestry in High Springs
The most populous ancestries reported in High Springs are German (1,020 | 16.2%), Irish (774 | 12.3%), English (700 | 11.1%), American (498 | 7.9%), and French (230 | 3.7%), together accounting for 51.3% of all High Springs residents.
| Ancestry | # Population | % Population |
| American | 498 | 7.9% |
| Austrian | 58 | 0.9% |
| Bhutanese | 93 | 1.5% |
| Brazilian | 21 | 0.3% |
| British | 69 | 1.1% |
| Central American | 20 | 0.3% |
| Cherokee | 14 | 0.2% |
| Chippewa | 50 | 0.8% |
| Cuban | 104 | 1.7% |
| Czechoslovakian | 11 | 0.2% |
| Danish | 9 | 0.1% |
| Dutch | 77 | 1.2% |
| Eastern European | 24 | 0.4% |
| Ecuadorian | 19 | 0.3% |
| English | 700 | 11.1% |
| European | 188 | 3.0% |
| French | 230 | 3.7% |
| French Canadian | 46 | 0.7% |
| German | 1,020 | 16.2% |
| Guatemalan | 1 | 0.0% |
| Hungarian | 38 | 0.6% |
| Irish | 774 | 12.3% |
| Italian | 201 | 3.2% |
| Mexican | 39 | 0.6% |
| Norwegian | 9 | 0.1% |
| Panamanian | 19 | 0.3% |
| Peruvian | 185 | 2.9% |
| Polish | 125 | 2.0% |
| Portuguese | 97 | 1.5% |
| Puerto Rican | 42 | 0.7% |
| Russian | 68 | 1.1% |
| Scandinavian | 55 | 0.9% |
| Scotch-Irish | 143 | 2.3% |
| Scottish | 55 | 0.9% |
| South American | 204 | 3.3% |
| Swedish | 147 | 2.3% |
| Welsh | 15 | 0.2% | View All 37 Rows |
Immigrants in High Springs
The most numerous immigrant groups reported in High Springs came from Latin America (160 | 2.5%), Caribbean (117 | 1.9%), Cuba (117 | 1.9%), Asia (76 | 1.2%), and Eastern Asia (76 | 1.2%), together accounting for 8.7% of all High Springs residents.
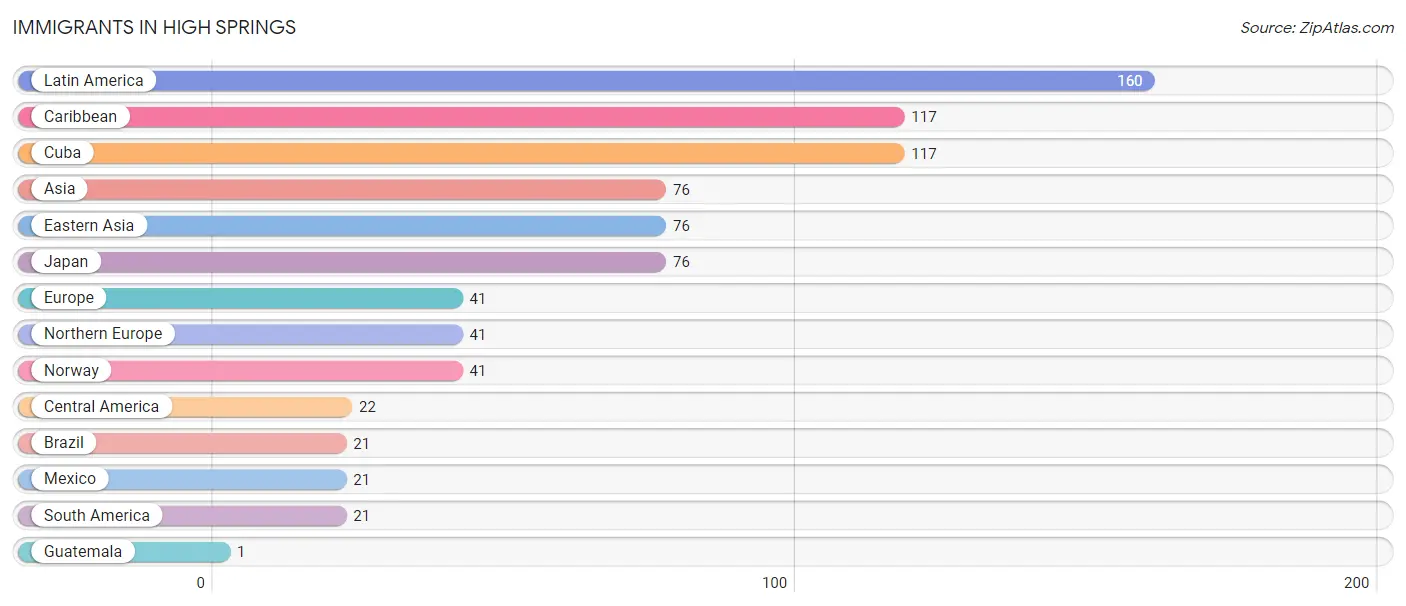
| Immigration Origin | # Population | % Population |
| Asia | 76 | 1.2% |
| Brazil | 21 | 0.3% |
| Caribbean | 117 | 1.9% |
| Central America | 22 | 0.4% |
| Cuba | 117 | 1.9% |
| Eastern Asia | 76 | 1.2% |
| Europe | 41 | 0.6% |
| Guatemala | 1 | 0.0% |
| Japan | 76 | 1.2% |
| Latin America | 160 | 2.5% |
| Mexico | 21 | 0.3% |
| Northern Europe | 41 | 0.6% |
| Norway | 41 | 0.6% |
| South America | 21 | 0.3% | View All 14 Rows |
Sex and Age in High Springs
Sex and Age in High Springs
The most populous age groups in High Springs are 5 to 9 Years (332 | 11.2%) for men and 10 to 14 Years (384 | 11.6%) for women.
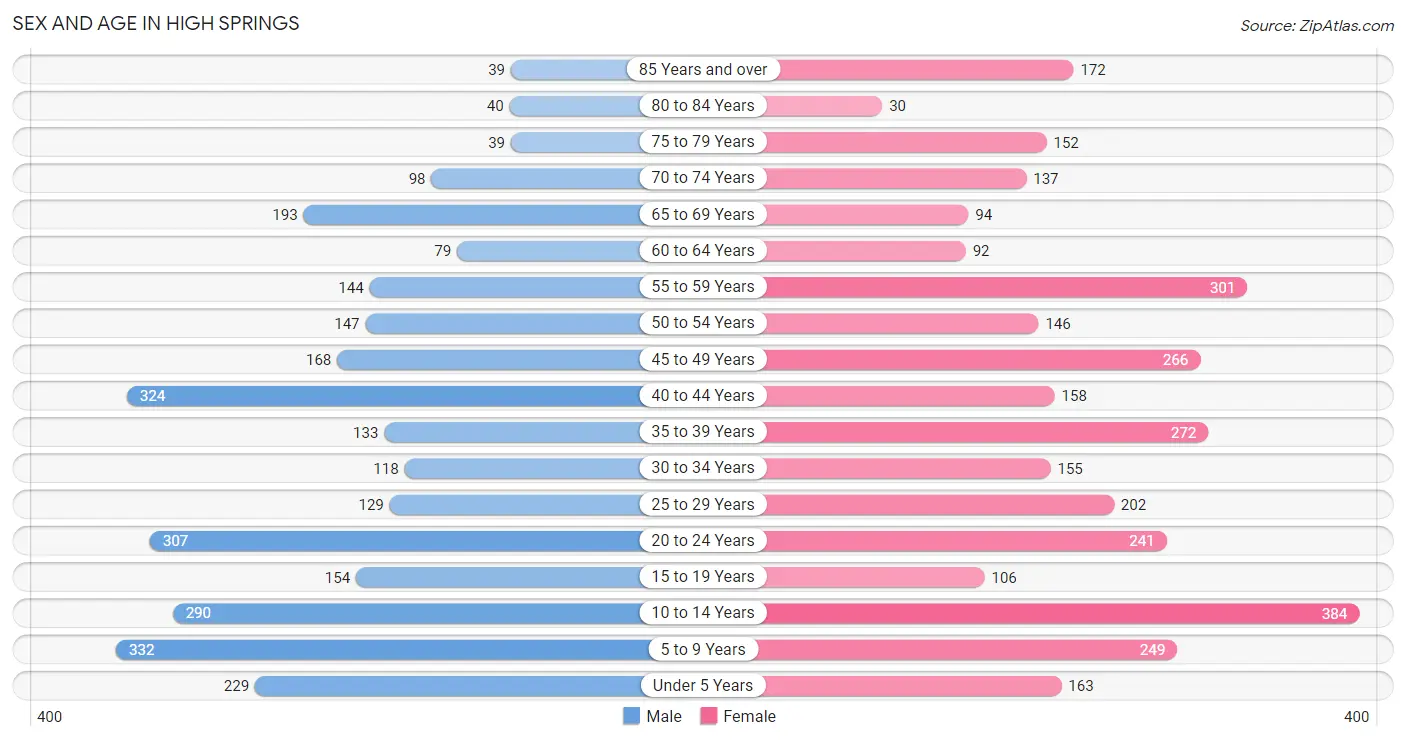
| Age Bracket | Male | Female |
| Under 5 Years | 229 (7.7%) | 163 (4.9%) |
| 5 to 9 Years | 332 (11.2%) | 249 (7.5%) |
| 10 to 14 Years | 290 (9.8%) | 384 (11.6%) |
| 15 to 19 Years | 154 (5.2%) | 106 (3.2%) |
| 20 to 24 Years | 307 (10.4%) | 241 (7.3%) |
| 25 to 29 Years | 129 (4.3%) | 202 (6.1%) |
| 30 to 34 Years | 118 (4.0%) | 155 (4.7%) |
| 35 to 39 Years | 133 (4.5%) | 272 (8.2%) |
| 40 to 44 Years | 324 (10.9%) | 158 (4.8%) |
| 45 to 49 Years | 168 (5.7%) | 266 (8.0%) |
| 50 to 54 Years | 147 (5.0%) | 146 (4.4%) |
| 55 to 59 Years | 144 (4.9%) | 301 (9.1%) |
| 60 to 64 Years | 79 (2.7%) | 92 (2.8%) |
| 65 to 69 Years | 193 (6.5%) | 94 (2.8%) |
| 70 to 74 Years | 98 (3.3%) | 137 (4.1%) |
| 75 to 79 Years | 39 (1.3%) | 152 (4.6%) |
| 80 to 84 Years | 40 (1.3%) | 30 (0.9%) |
| 85 Years and over | 39 (1.3%) | 172 (5.2%) |
| Total | 2,963 (100.0%) | 3,320 (100.0%) |
Families and Households in High Springs
Median Family Size in High Springs
The median family size in High Springs is 3.73 persons per family, with married-couple families (1,202 | 79.9%) accounting for the largest median family size of 3.82 persons per family. On the other hand, single male/father families (25 | 1.7%) represent the smallest median family size with 2.24 persons per family.
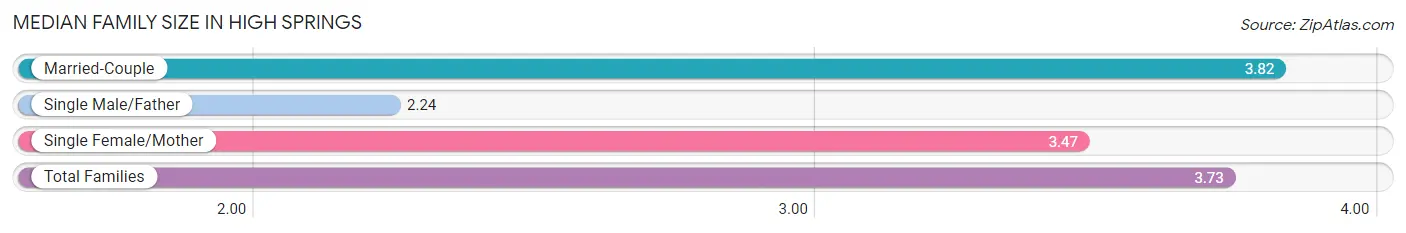
| Family Type | # Families | Family Size |
| Married-Couple | 1,202 (79.9%) | 3.82 |
| Single Male/Father | 25 (1.7%) | 2.24 |
| Single Female/Mother | 278 (18.5%) | 3.47 |
| Total Families | 1,505 (100.0%) | 3.73 |
Median Household Size in High Springs
The median household size in High Springs is 3.24 persons per household, with married-couple households (1,202 | 62.0%) accounting for the largest median household size of 3.86 persons per household. non-family households (434 | 22.4%) represent the smallest median household size with 1.21 persons per household.
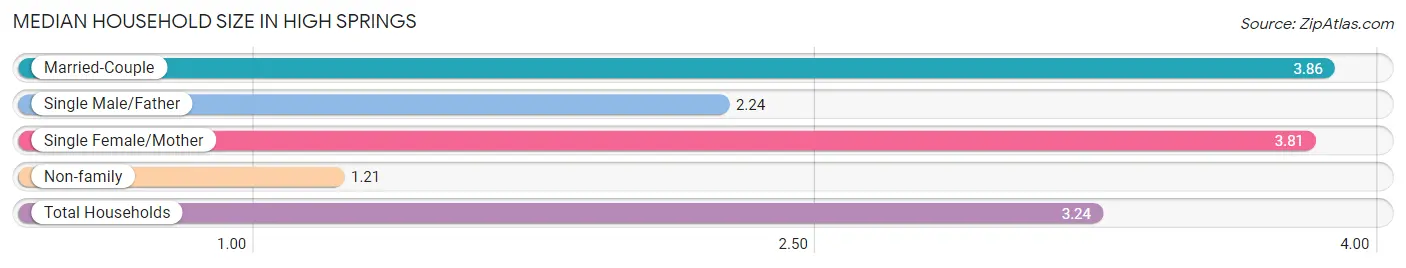
| Household Type | # Households | Household Size |
| Married-Couple | 1,202 (62.0%) | 3.86 |
| Single Male/Father | 25 (1.3%) | 2.24 |
| Single Female/Mother | 278 (14.3%) | 3.81 |
| Non-family | 434 (22.4%) | 1.21 |
| Total Households | 1,939 (100.0%) | 3.24 |
Household Size by Marriage Status in High Springs
Out of a total of 1,939 households in High Springs, 1,505 (77.6%) are family households, while 434 (22.4%) are nonfamily households. The most numerous type of family households are 2-person households, comprising 565, and the most common type of nonfamily households are 1-person households, comprising 381.
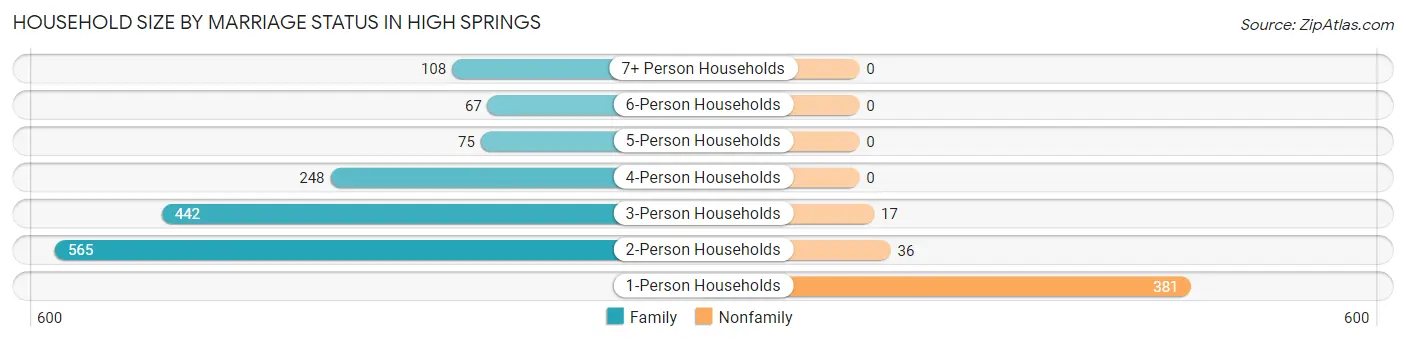
| Household Size | Family Households | Nonfamily Households |
| 1-Person Households | - | 381 (19.7%) |
| 2-Person Households | 565 (29.1%) | 36 (1.9%) |
| 3-Person Households | 442 (22.8%) | 17 (0.9%) |
| 4-Person Households | 248 (12.8%) | 0 (0.0%) |
| 5-Person Households | 75 (3.9%) | 0 (0.0%) |
| 6-Person Households | 67 (3.5%) | 0 (0.0%) |
| 7+ Person Households | 108 (5.6%) | 0 (0.0%) |
| Total | 1,505 (77.6%) | 434 (22.4%) |
Female Fertility in High Springs
Fertility by Age in High Springs
Average fertility rate in High Springs is 122.0 births per 1,000 women. Women in the age bracket of 35 to 50 years have the highest fertility rate with 135.0 births per 1,000 women. Women in the age bracket of 35 to 50 years acount for 56.3% of all women with births.
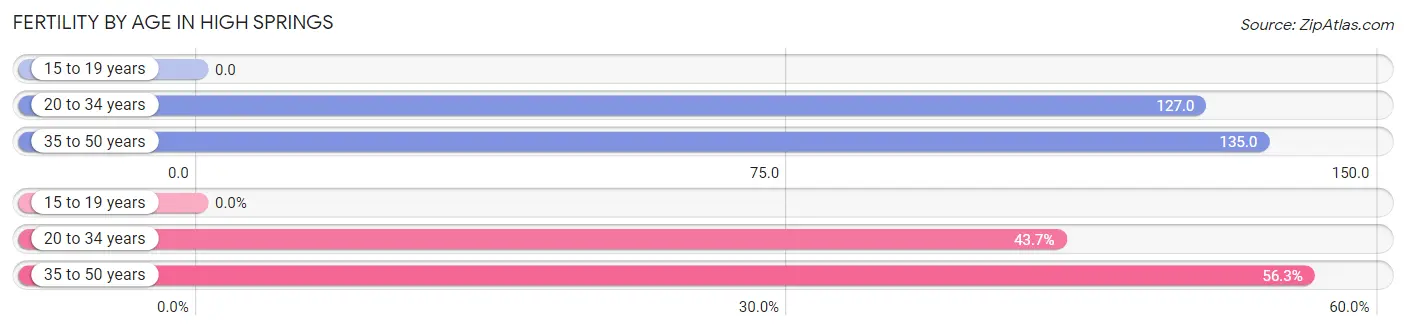
| Age Bracket | Women with Births | Births / 1,000 Women |
| 15 to 19 years | 0 (0.0%) | 0.0 |
| 20 to 34 years | 76 (43.7%) | 127.0 |
| 35 to 50 years | 98 (56.3%) | 135.0 |
| Total | 174 (100.0%) | 122.0 |
Fertility by Age by Marriage Status in High Springs
70.7% of women with births (174) in High Springs are married. The highest percentage of unmarried women with births falls into 20 to 34 years age bracket with 67.1% of them unmarried at the time of birth, while the lowest percentage of unmarried women with births belong to 35 to 50 years age bracket with 0.0% of them unmarried.
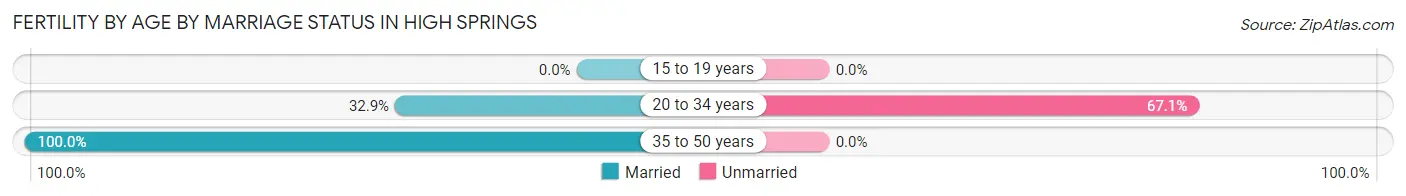
| Age Bracket | Married | Unmarried |
| 15 to 19 years | 0 (0.0%) | 0 (0.0%) |
| 20 to 34 years | 25 (32.9%) | 51 (67.1%) |
| 35 to 50 years | 98 (100.0%) | 0 (0.0%) |
| Total | 123 (70.7%) | 51 (29.3%) |
Fertility by Education in High Springs
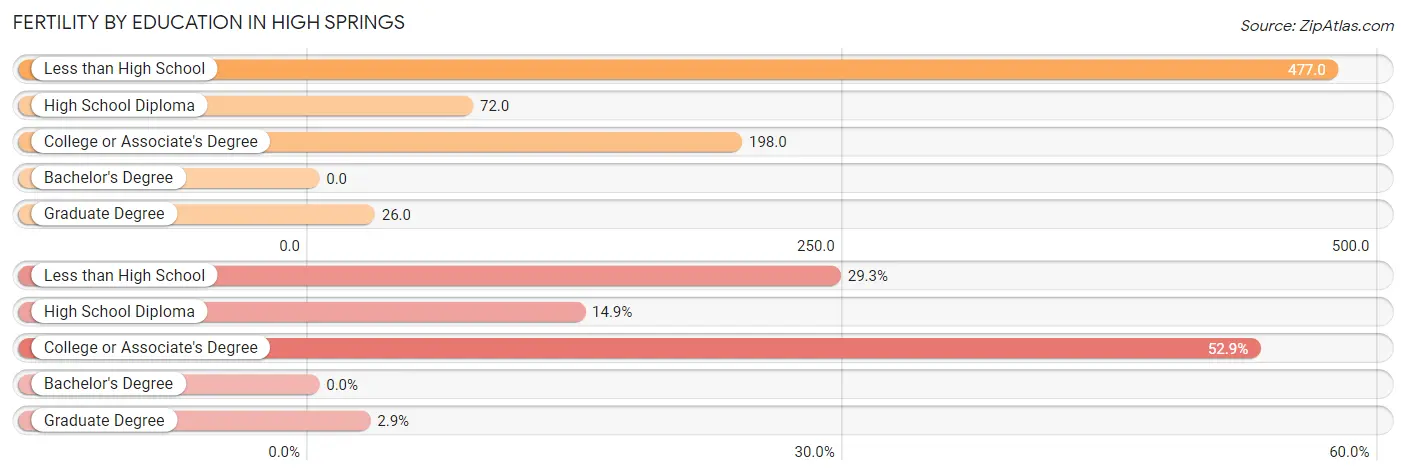
| Educational Attainment | Women with Births | Births / 1,000 Women |
| Less than High School | 51 (29.3%) | 477.0 |
| High School Diploma | 26 (14.9%) | 72.0 |
| College or Associate's Degree | 92 (52.9%) | 198.0 |
| Bachelor's Degree | 0 (0.0%) | 0.0 |
| Graduate Degree | 5 (2.9%) | 26.0 |
| Total | 174 (100.0%) | 122.0 |
Fertility by Education by Marriage Status in High Springs
29.3% of women with births in High Springs are unmarried. Women with the educational attainment of high school diploma are most likely to be married with 100.0% of them married at childbirth, while women with the educational attainment of less than high school are least likely to be married with 100.0% of them unmarried at childbirth.
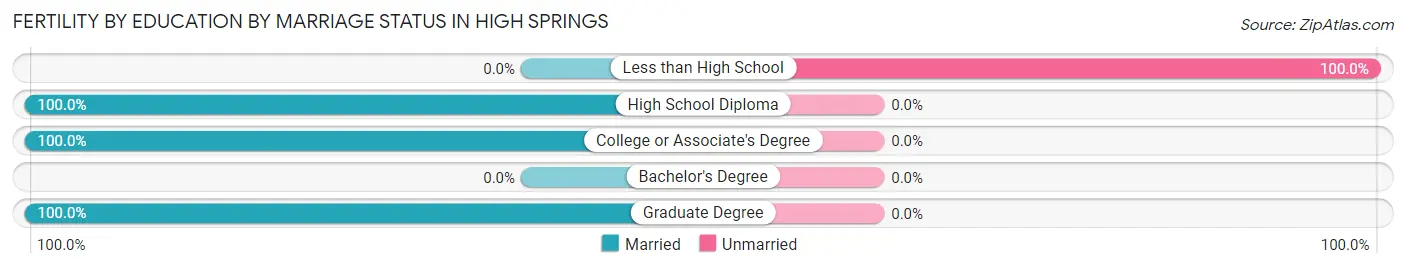
| Educational Attainment | Married | Unmarried |
| Less than High School | 0 (0.0%) | 51 (100.0%) |
| High School Diploma | 26 (100.0%) | 0 (0.0%) |
| College or Associate's Degree | 92 (100.0%) | 0 (0.0%) |
| Bachelor's Degree | 0 (0.0%) | 0 (0.0%) |
| Graduate Degree | 5 (100.0%) | 0 (0.0%) |
| Total | 123 (70.7%) | 51 (29.3%) |
Employment Characteristics in High Springs
Employment by Class of Employer in High Springs
Among the 2,617 employed individuals in High Springs, private company employees (1,484 | 56.7%), local government employees (288 | 11.0%), and state government employees (238 | 9.1%) make up the most common classes of employment.
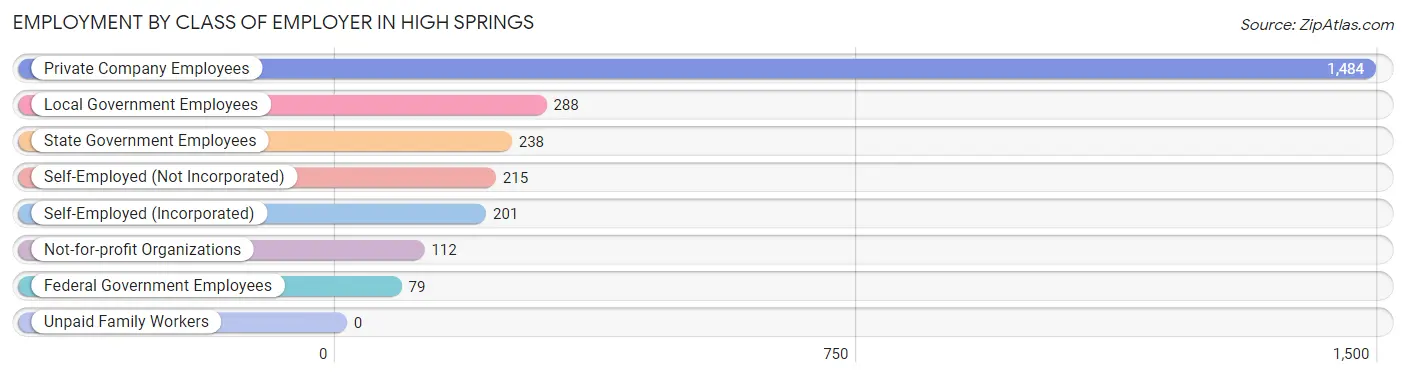
| Employer Class | # Employees | % Employees |
| Private Company Employees | 1,484 | 56.7% |
| Self-Employed (Incorporated) | 201 | 7.7% |
| Self-Employed (Not Incorporated) | 215 | 8.2% |
| Not-for-profit Organizations | 112 | 4.3% |
| Local Government Employees | 288 | 11.0% |
| State Government Employees | 238 | 9.1% |
| Federal Government Employees | 79 | 3.0% |
| Unpaid Family Workers | 0 | 0.0% |
| Total | 2,617 | 100.0% |
Employment Status by Age in High Springs
According to the labor force statistics for High Springs, out of the total population over 16 years of age (4,578), 60.3% or 2,761 individuals are in the labor force, with 2.9% or 80 of them unemployed. The age group with the highest labor force participation rate is 30 to 34 years, with 100.0% or 273 individuals in the labor force. Within the labor force, the 60 to 64 years age range has the highest percentage of unemployed individuals, with 24.7% or 20 of them being unemployed.
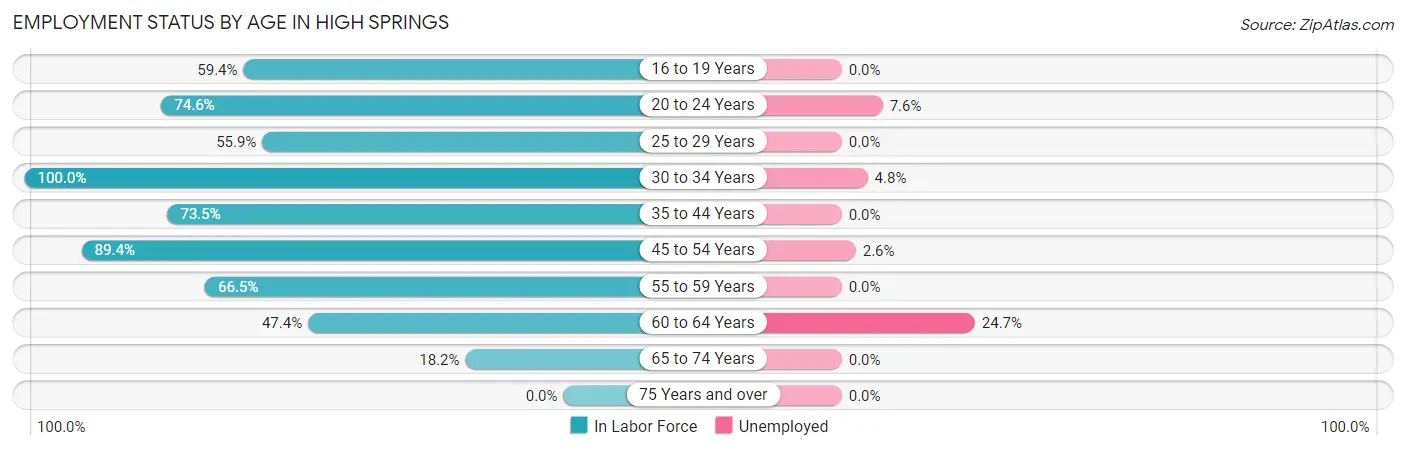
| Age Bracket | In Labor Force | Unemployed |
| 16 to 19 Years | 120 (59.4%) | 0 (0.0%) |
| 20 to 24 Years | 409 (74.6%) | 31 (7.6%) |
| 25 to 29 Years | 185 (55.9%) | 0 (0.0%) |
| 30 to 34 Years | 273 (100.0%) | 13 (4.8%) |
| 35 to 44 Years | 652 (73.5%) | 0 (0.0%) |
| 45 to 54 Years | 650 (89.4%) | 17 (2.6%) |
| 55 to 59 Years | 296 (66.5%) | 0 (0.0%) |
| 60 to 64 Years | 81 (47.4%) | 20 (24.7%) |
| 65 to 74 Years | 95 (18.2%) | 0 (0.0%) |
| 75 Years and over | 0 (0.0%) | 0 (0.0%) |
| Total | 2,761 (60.3%) | 80 (2.9%) |
Employment Status by Educational Attainment in High Springs
According to labor force statistics for High Springs, 75.4% of individuals (2,137) out of the total population between 25 and 64 years of age (2,834) are in the labor force, with 2.3% or 49 of them being unemployed. The group with the highest labor force participation rate are those with the educational attainment of bachelor's degree or higher, with 93.0% or 904 individuals in the labor force. Within the labor force, individuals with college / associate degree education have the highest percentage of unemployment, with 4.7% or 33 of them being unemployed.
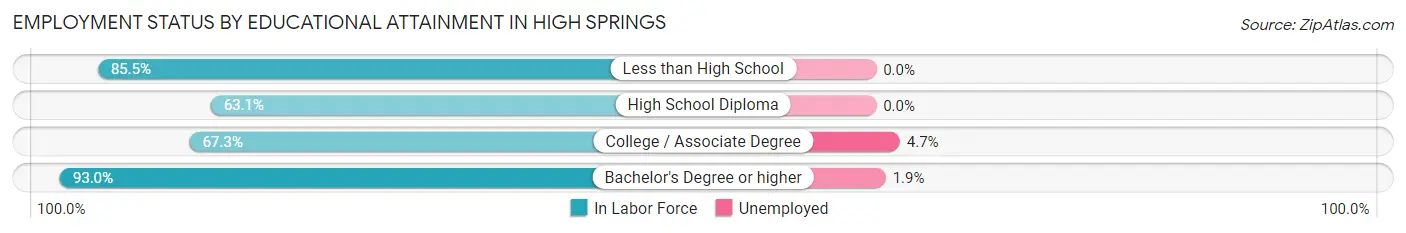
| Educational Attainment | In Labor Force | Unemployed |
| Less than High School | 53 (85.5%) | 0 (0.0%) |
| High School Diploma | 474 (63.1%) | 0 (0.0%) |
| College / Associate Degree | 706 (67.3%) | 49 (4.7%) |
| Bachelor's Degree or higher | 904 (93.0%) | 18 (1.9%) |
| Total | 2,137 (75.4%) | 65 (2.3%) |
Employment Occupations by Sex in High Springs
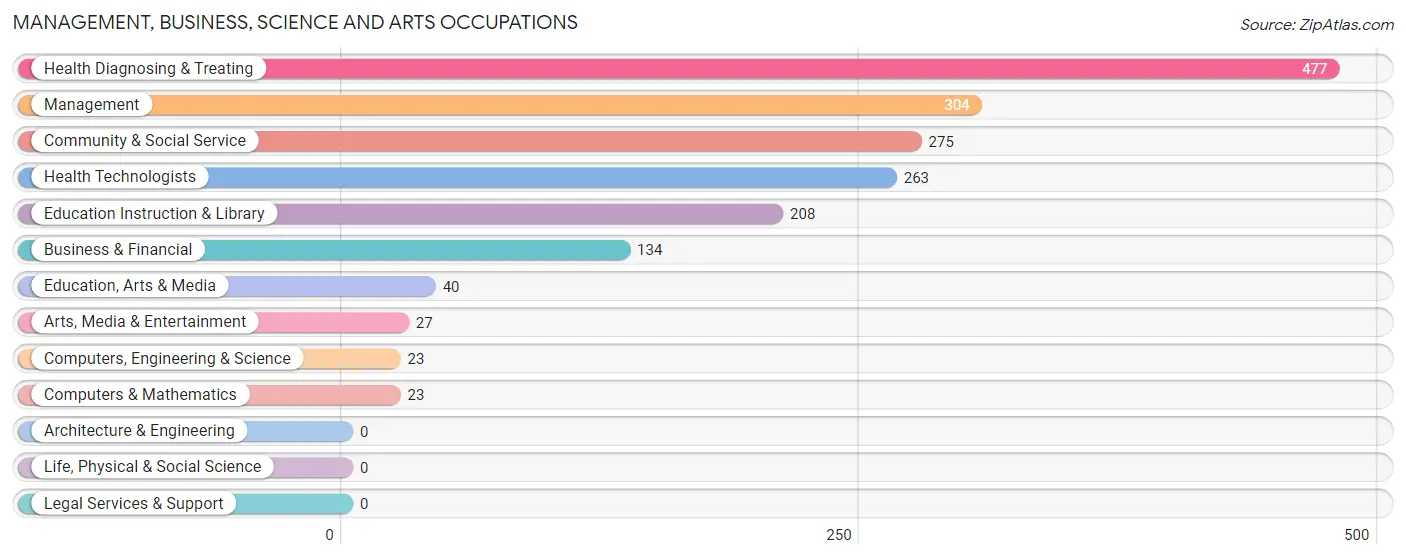
Management, Business, Science and Arts Occupations
The most common Management, Business, Science and Arts occupations in High Springs are Health Diagnosing & Treating (477 | 17.8%), Management (304 | 11.3%), Community & Social Service (275 | 10.3%), Health Technologists (263 | 9.8%), and Education Instruction & Library (208 | 7.8%).
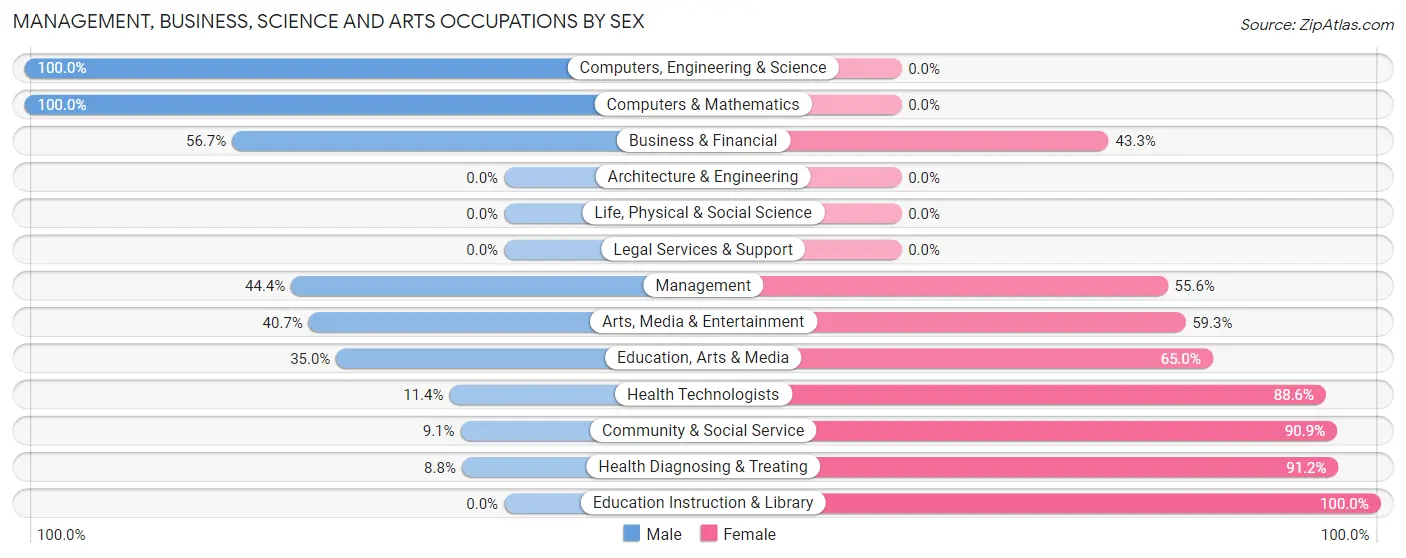
Management, Business, Science and Arts Occupations by Sex
Within the Management, Business, Science and Arts occupations in High Springs, the most male-oriented occupations are Computers, Engineering & Science (100.0%), Computers & Mathematics (100.0%), and Business & Financial (56.7%), while the most female-oriented occupations are Education Instruction & Library (100.0%), Health Diagnosing & Treating (91.2%), and Community & Social Service (90.9%).
| Occupation | Male | Female |
| Management | 135 (44.4%) | 169 (55.6%) |
| Business & Financial | 76 (56.7%) | 58 (43.3%) |
| Computers, Engineering & Science | 23 (100.0%) | 0 (0.0%) |
| Computers & Mathematics | 23 (100.0%) | 0 (0.0%) |
| Architecture & Engineering | 0 (0.0%) | 0 (0.0%) |
| Life, Physical & Social Science | 0 (0.0%) | 0 (0.0%) |
| Community & Social Service | 25 (9.1%) | 250 (90.9%) |
| Education, Arts & Media | 14 (35.0%) | 26 (65.0%) |
| Legal Services & Support | 0 (0.0%) | 0 (0.0%) |
| Education Instruction & Library | 0 (0.0%) | 208 (100.0%) |
| Arts, Media & Entertainment | 11 (40.7%) | 16 (59.3%) |
| Health Diagnosing & Treating | 42 (8.8%) | 435 (91.2%) |
| Health Technologists | 30 (11.4%) | 233 (88.6%) |
| Total (Category) | 301 (24.8%) | 912 (75.2%) |
| Total (Overall) | 1,369 (51.1%) | 1,311 (48.9%) |
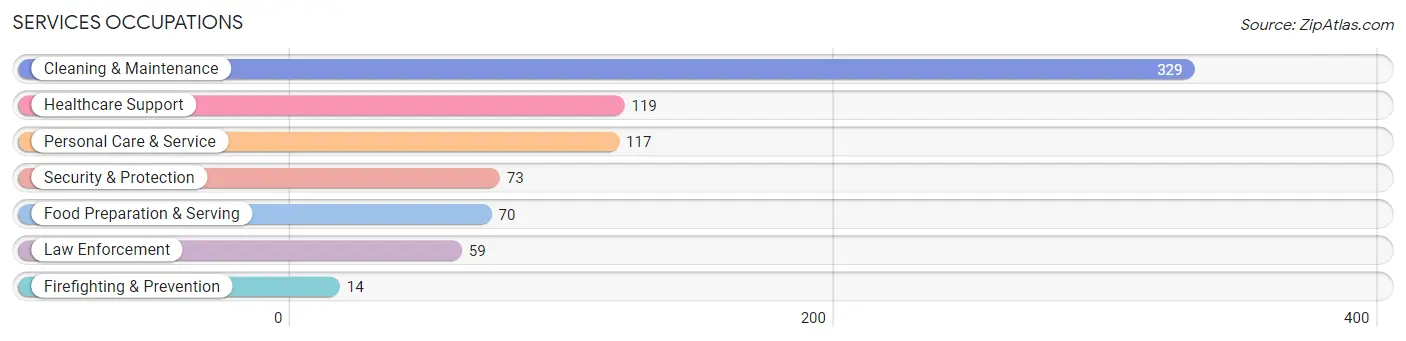
Services Occupations
The most common Services occupations in High Springs are Cleaning & Maintenance (329 | 12.3%), Healthcare Support (119 | 4.4%), Personal Care & Service (117 | 4.4%), Security & Protection (73 | 2.7%), and Food Preparation & Serving (70 | 2.6%).
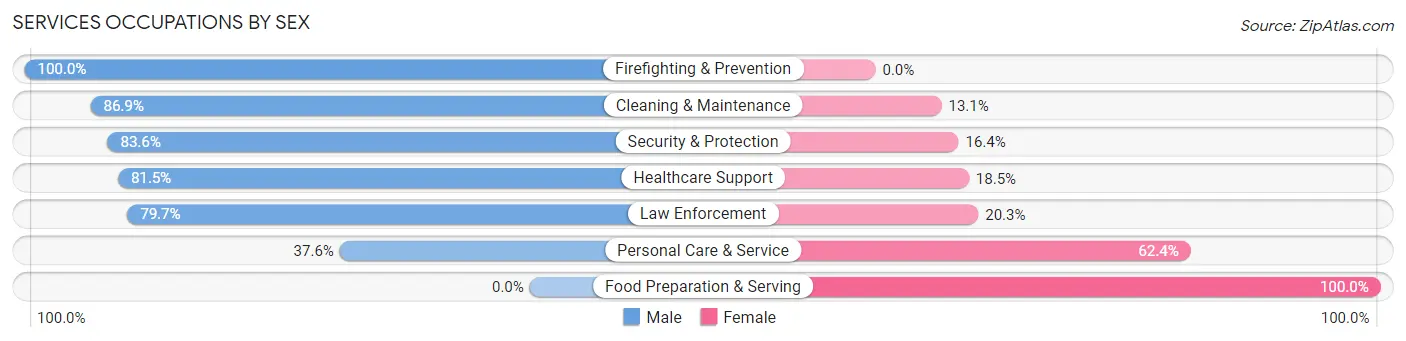
Services Occupations by Sex
Within the Services occupations in High Springs, the most male-oriented occupations are Firefighting & Prevention (100.0%), Cleaning & Maintenance (86.9%), and Security & Protection (83.6%), while the most female-oriented occupations are Food Preparation & Serving (100.0%), Personal Care & Service (62.4%), and Law Enforcement (20.3%).
| Occupation | Male | Female |
| Healthcare Support | 97 (81.5%) | 22 (18.5%) |
| Security & Protection | 61 (83.6%) | 12 (16.4%) |
| Firefighting & Prevention | 14 (100.0%) | 0 (0.0%) |
| Law Enforcement | 47 (79.7%) | 12 (20.3%) |
| Food Preparation & Serving | 0 (0.0%) | 70 (100.0%) |
| Cleaning & Maintenance | 286 (86.9%) | 43 (13.1%) |
| Personal Care & Service | 44 (37.6%) | 73 (62.4%) |
| Total (Category) | 488 (68.9%) | 220 (31.1%) |
| Total (Overall) | 1,369 (51.1%) | 1,311 (48.9%) |
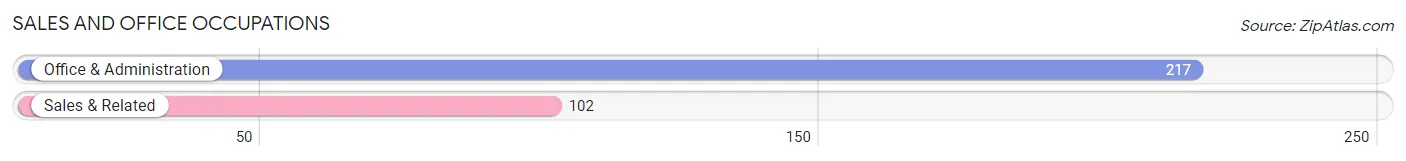
Sales and Office Occupations
The most common Sales and Office occupations in High Springs are Office & Administration (217 | 8.1%), and Sales & Related (102 | 3.8%).
Sales and Office Occupations by Sex
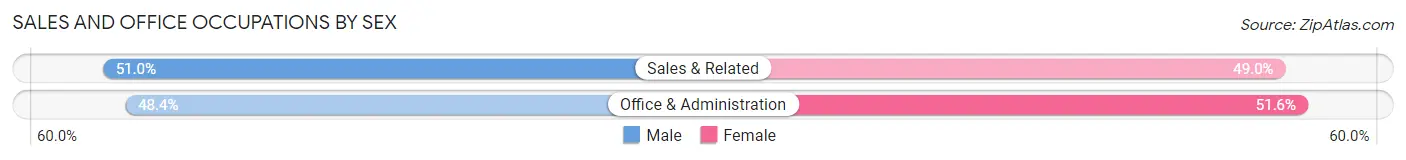
| Occupation | Male | Female |
| Sales & Related | 52 (51.0%) | 50 (49.0%) |
| Office & Administration | 105 (48.4%) | 112 (51.6%) |
| Total (Category) | 157 (49.2%) | 162 (50.8%) |
| Total (Overall) | 1,369 (51.1%) | 1,311 (48.9%) |
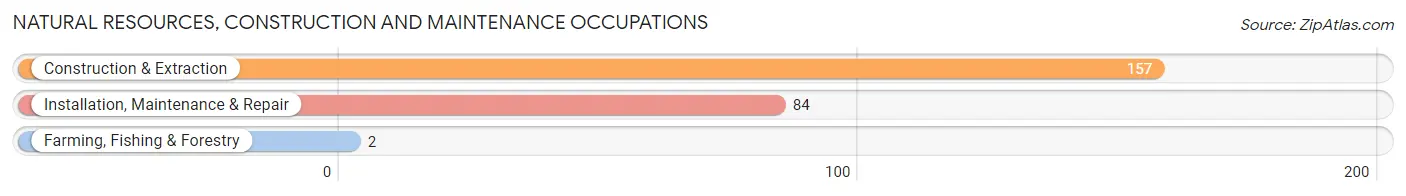
Natural Resources, Construction and Maintenance Occupations
The most common Natural Resources, Construction and Maintenance occupations in High Springs are Construction & Extraction (157 | 5.9%), Installation, Maintenance & Repair (84 | 3.1%), and Farming, Fishing & Forestry (2 | 0.1%).
Natural Resources, Construction and Maintenance Occupations by Sex
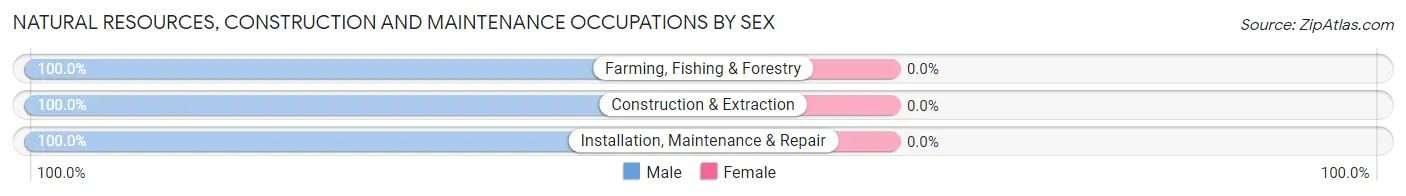
| Occupation | Male | Female |
| Farming, Fishing & Forestry | 2 (100.0%) | 0 (0.0%) |
| Construction & Extraction | 157 (100.0%) | 0 (0.0%) |
| Installation, Maintenance & Repair | 84 (100.0%) | 0 (0.0%) |
| Total (Category) | 243 (100.0%) | 0 (0.0%) |
| Total (Overall) | 1,369 (51.1%) | 1,311 (48.9%) |
Production, Transportation and Moving Occupations
The most common Production, Transportation and Moving occupations in High Springs are Transportation (100 | 3.7%), Material Moving (63 | 2.4%), and Production (34 | 1.3%).
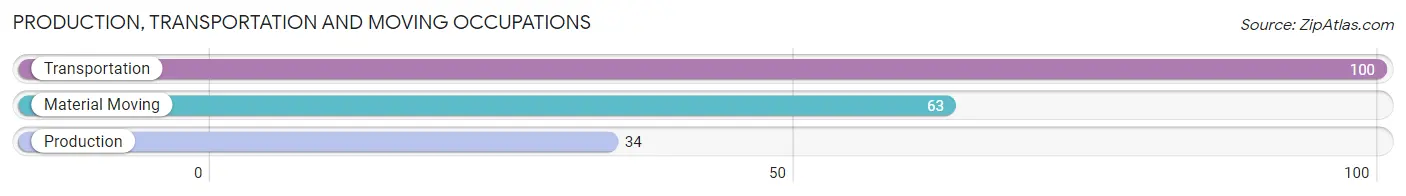
Production, Transportation and Moving Occupations by Sex
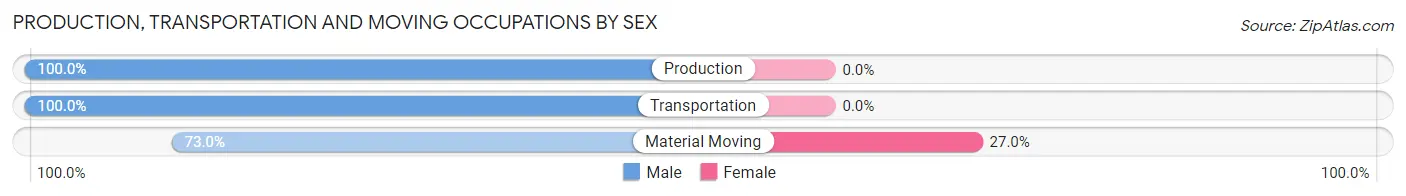
| Occupation | Male | Female |
| Production | 34 (100.0%) | 0 (0.0%) |
| Transportation | 100 (100.0%) | 0 (0.0%) |
| Material Moving | 46 (73.0%) | 17 (27.0%) |
| Total (Category) | 180 (91.4%) | 17 (8.6%) |
| Total (Overall) | 1,369 (51.1%) | 1,311 (48.9%) |
Employment Industries by Sex in High Springs
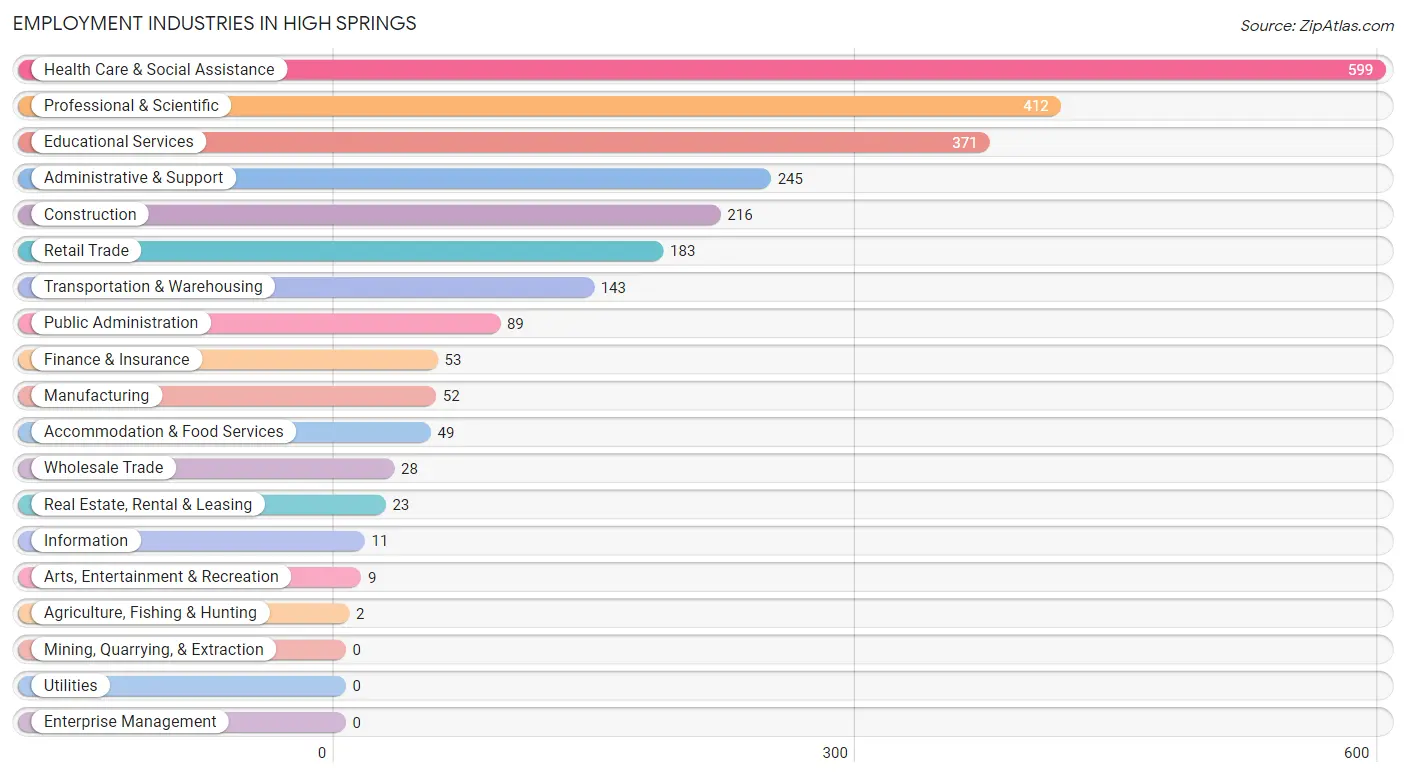
Employment Industries in High Springs
The major employment industries in High Springs include Health Care & Social Assistance (599 | 22.4%), Professional & Scientific (412 | 15.4%), Educational Services (371 | 13.8%), Administrative & Support (245 | 9.1%), and Construction (216 | 8.1%).
Employment Industries by Sex in High Springs
The High Springs industries that see more men than women are Agriculture, Fishing & Hunting (100.0%), Wholesale Trade (100.0%), and Transportation & Warehousing (100.0%), whereas the industries that tend to have a higher number of women are Real Estate, Rental & Leasing (100.0%), Arts, Entertainment & Recreation (100.0%), and Health Care & Social Assistance (86.5%).
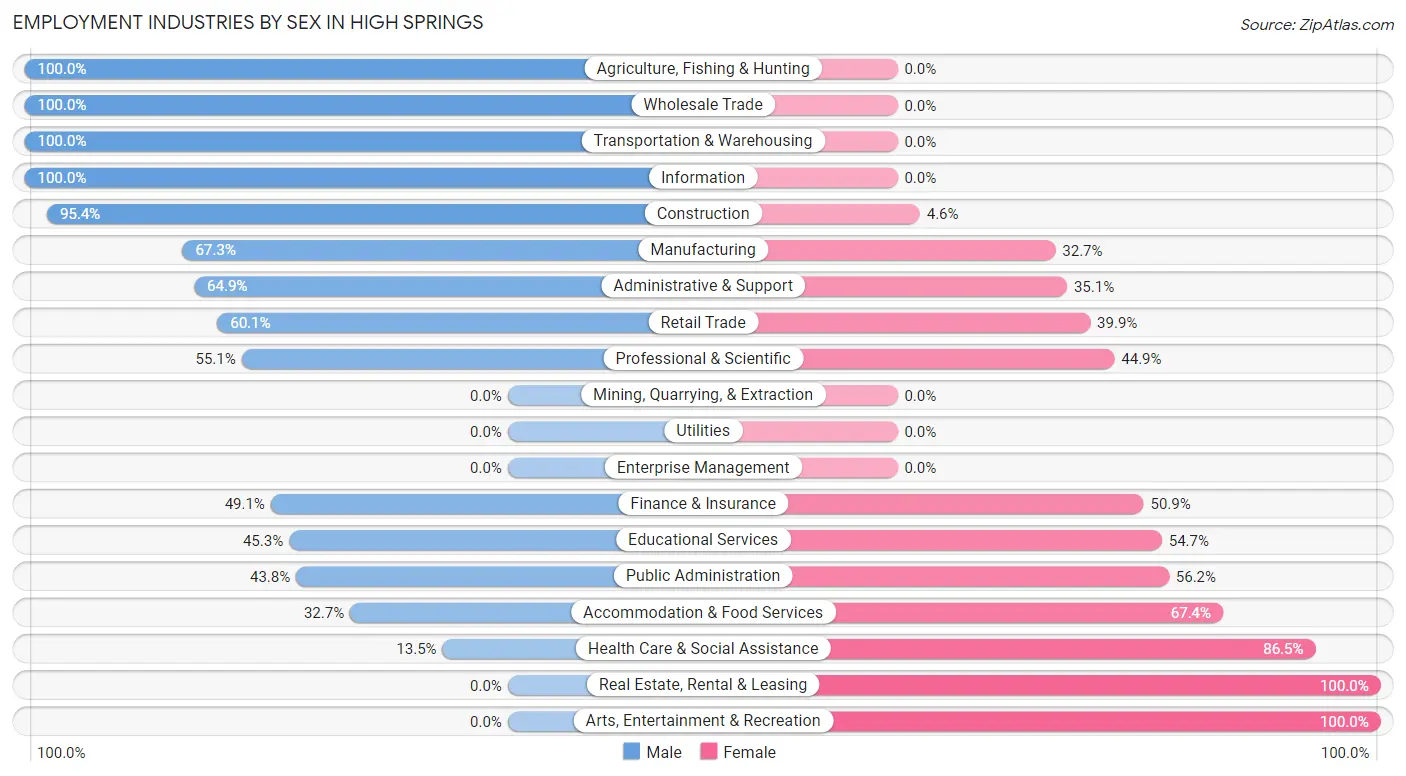
| Industry | Male | Female |
| Agriculture, Fishing & Hunting | 2 (100.0%) | 0 (0.0%) |
| Mining, Quarrying, & Extraction | 0 (0.0%) | 0 (0.0%) |
| Construction | 206 (95.4%) | 10 (4.6%) |
| Manufacturing | 35 (67.3%) | 17 (32.7%) |
| Wholesale Trade | 28 (100.0%) | 0 (0.0%) |
| Retail Trade | 110 (60.1%) | 73 (39.9%) |
| Transportation & Warehousing | 143 (100.0%) | 0 (0.0%) |
| Utilities | 0 (0.0%) | 0 (0.0%) |
| Information | 11 (100.0%) | 0 (0.0%) |
| Finance & Insurance | 26 (49.1%) | 27 (50.9%) |
| Real Estate, Rental & Leasing | 0 (0.0%) | 23 (100.0%) |
| Professional & Scientific | 227 (55.1%) | 185 (44.9%) |
| Enterprise Management | 0 (0.0%) | 0 (0.0%) |
| Administrative & Support | 159 (64.9%) | 86 (35.1%) |
| Educational Services | 168 (45.3%) | 203 (54.7%) |
| Health Care & Social Assistance | 81 (13.5%) | 518 (86.5%) |
| Arts, Entertainment & Recreation | 0 (0.0%) | 9 (100.0%) |
| Accommodation & Food Services | 16 (32.7%) | 33 (67.3%) |
| Public Administration | 39 (43.8%) | 50 (56.2%) |
| Total | 1,369 (51.1%) | 1,311 (48.9%) |
Education in High Springs
School Enrollment in High Springs
The most common levels of schooling among the 1,850 students in High Springs are middle school (642 | 34.7%), elementary school (483 | 26.1%), and college / undergraduate (343 | 18.5%).
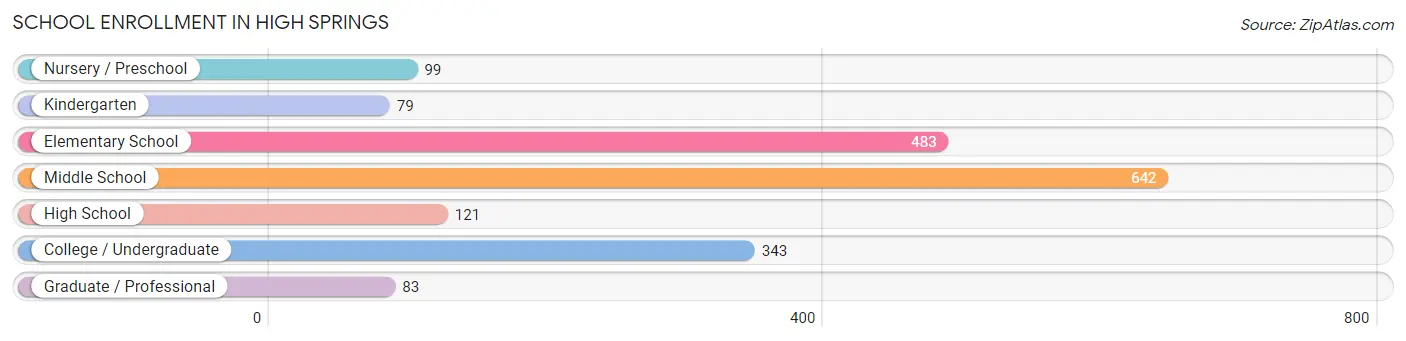
| School Level | # Students | % Students |
| Nursery / Preschool | 99 | 5.3% |
| Kindergarten | 79 | 4.3% |
| Elementary School | 483 | 26.1% |
| Middle School | 642 | 34.7% |
| High School | 121 | 6.5% |
| College / Undergraduate | 343 | 18.5% |
| Graduate / Professional | 83 | 4.5% |
| Total | 1,850 | 100.0% |
School Enrollment by Age by Funding Source in High Springs
Out of a total of 1,850 students who are enrolled in schools in High Springs, 405 (21.9%) attend a private institution, while the remaining 1,445 (78.1%) are enrolled in public schools. The age group of 3 to 4 year olds has the highest likelihood of being enrolled in private schools, with 18 (36.7% in the age bracket) enrolled. Conversely, the age group of 15 to 17 year olds has the lowest likelihood of being enrolled in a private school, with 121 (100.0% in the age bracket) attending a public institution.
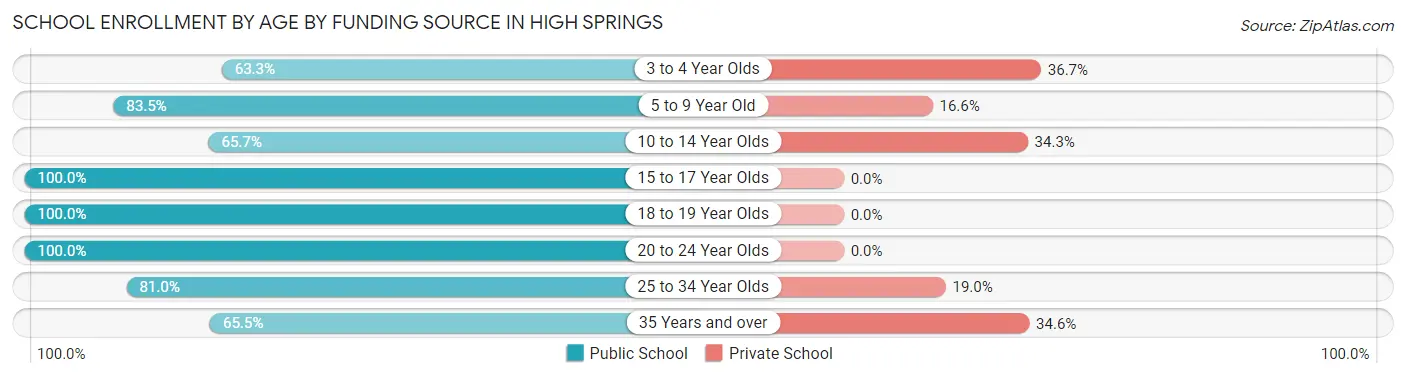
| Age Bracket | Public School | Private School |
| 3 to 4 Year Olds | 31 (63.3%) | 18 (36.7%) |
| 5 to 9 Year Old | 484 (83.5%) | 96 (16.6%) |
| 10 to 14 Year Olds | 443 (65.7%) | 231 (34.3%) |
| 15 to 17 Year Olds | 121 (100.0%) | 0 (0.0%) |
| 18 to 19 Year Olds | 50 (100.0%) | 0 (0.0%) |
| 20 to 24 Year Olds | 105 (100.0%) | 0 (0.0%) |
| 25 to 34 Year Olds | 175 (81.0%) | 41 (19.0%) |
| 35 Years and over | 36 (65.4%) | 19 (34.5%) |
| Total | 1,445 (78.1%) | 405 (21.9%) |
Educational Attainment by Field of Study in High Springs
Science & technology (283 | 22.7%), education (235 | 18.8%), business (126 | 10.1%), liberal arts & history (109 | 8.7%), and arts & humanities (103 | 8.3%) are the most common fields of study among 1,248 individuals in High Springs who have obtained a bachelor's degree or higher.
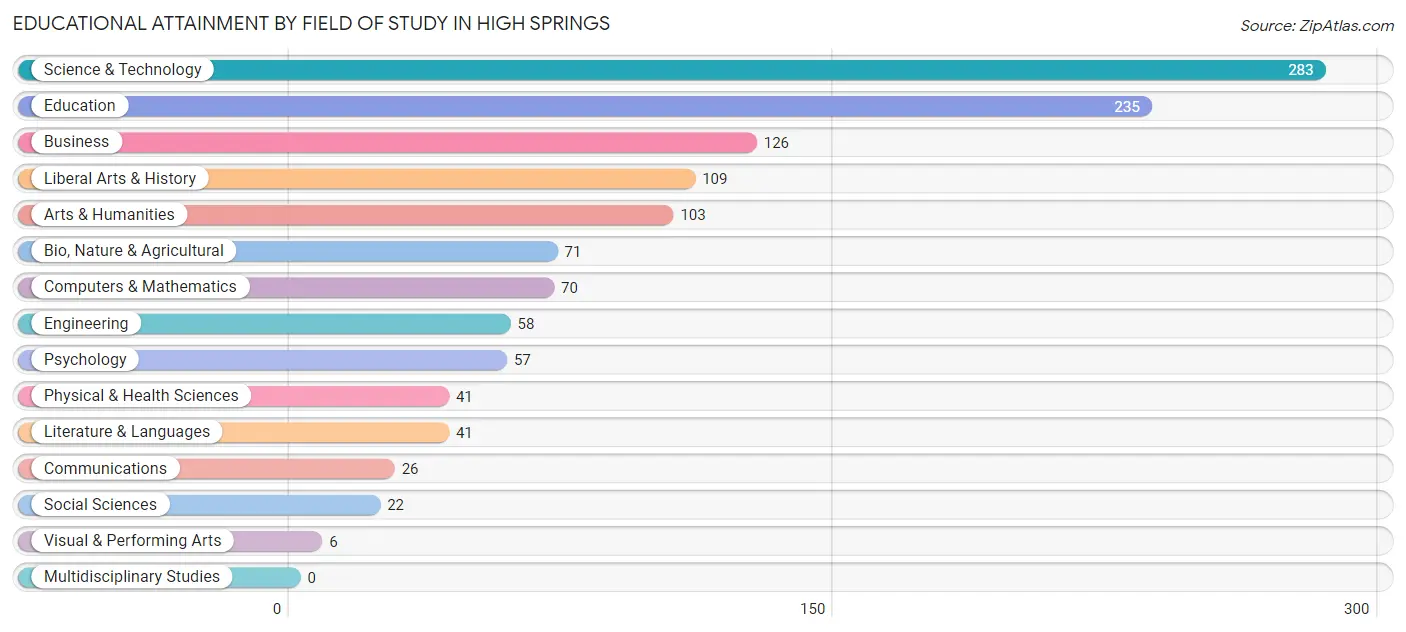
| Field of Study | # Graduates | % Graduates |
| Computers & Mathematics | 70 | 5.6% |
| Bio, Nature & Agricultural | 71 | 5.7% |
| Physical & Health Sciences | 41 | 3.3% |
| Psychology | 57 | 4.6% |
| Social Sciences | 22 | 1.8% |
| Engineering | 58 | 4.6% |
| Multidisciplinary Studies | 0 | 0.0% |
| Science & Technology | 283 | 22.7% |
| Business | 126 | 10.1% |
| Education | 235 | 18.8% |
| Literature & Languages | 41 | 3.3% |
| Liberal Arts & History | 109 | 8.7% |
| Visual & Performing Arts | 6 | 0.5% |
| Communications | 26 | 2.1% |
| Arts & Humanities | 103 | 8.3% |
| Total | 1,248 | 100.0% |
Transportation & Commute in High Springs
Vehicle Availability by Sex in High Springs
The most prevalent vehicle ownership categories in High Springs are males with 3 vehicles (463, accounting for 34.3%) and females with 3 vehicles (431, making up 36.7%).
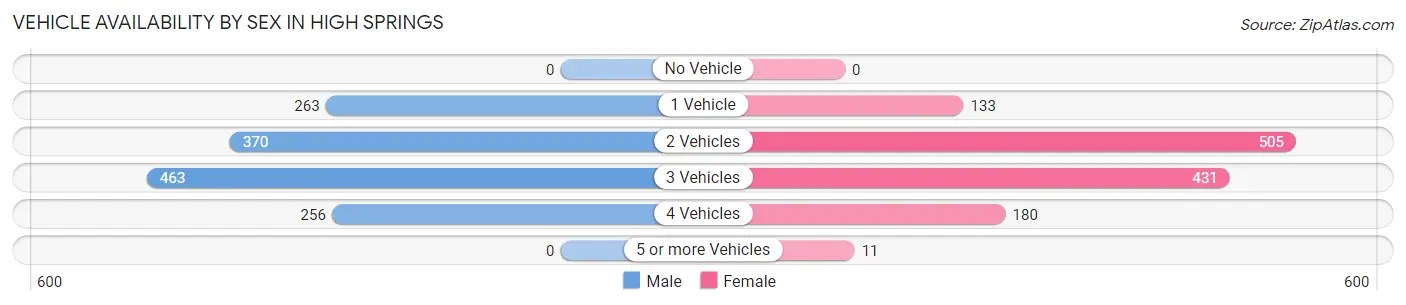
| Vehicles Available | Male | Female |
| No Vehicle | 0 (0.0%) | 0 (0.0%) |
| 1 Vehicle | 263 (19.5%) | 133 (10.6%) |
| 2 Vehicles | 370 (27.4%) | 505 (40.1%) |
| 3 Vehicles | 463 (34.3%) | 431 (34.2%) |
| 4 Vehicles | 256 (18.9%) | 180 (14.3%) |
| 5 or more Vehicles | 0 (0.0%) | 11 (0.9%) |
| Total | 1,352 (100.0%) | 1,260 (100.0%) |
Commute Time in High Springs
The most frequently occuring commute durations in High Springs are 30 to 34 minutes (629 commuters, 26.1%), 15 to 19 minutes (298 commuters, 12.3%), and 25 to 29 minutes (291 commuters, 12.0%).
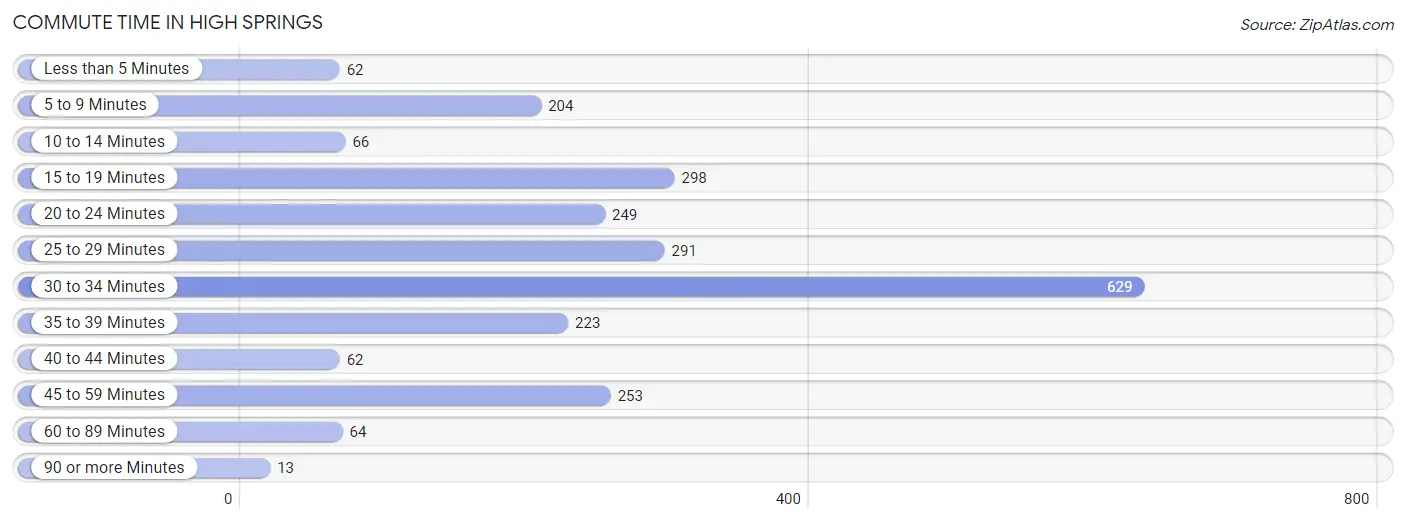
| Commute Time | # Commuters | % Commuters |
| Less than 5 Minutes | 62 | 2.6% |
| 5 to 9 Minutes | 204 | 8.5% |
| 10 to 14 Minutes | 66 | 2.7% |
| 15 to 19 Minutes | 298 | 12.3% |
| 20 to 24 Minutes | 249 | 10.3% |
| 25 to 29 Minutes | 291 | 12.0% |
| 30 to 34 Minutes | 629 | 26.1% |
| 35 to 39 Minutes | 223 | 9.2% |
| 40 to 44 Minutes | 62 | 2.6% |
| 45 to 59 Minutes | 253 | 10.5% |
| 60 to 89 Minutes | 64 | 2.6% |
| 90 or more Minutes | 13 | 0.5% |
Commute Time by Sex in High Springs
The most common commute times in High Springs are 30 to 34 minutes (346 commuters, 27.4%) for males and 30 to 34 minutes (283 commuters, 24.6%) for females.
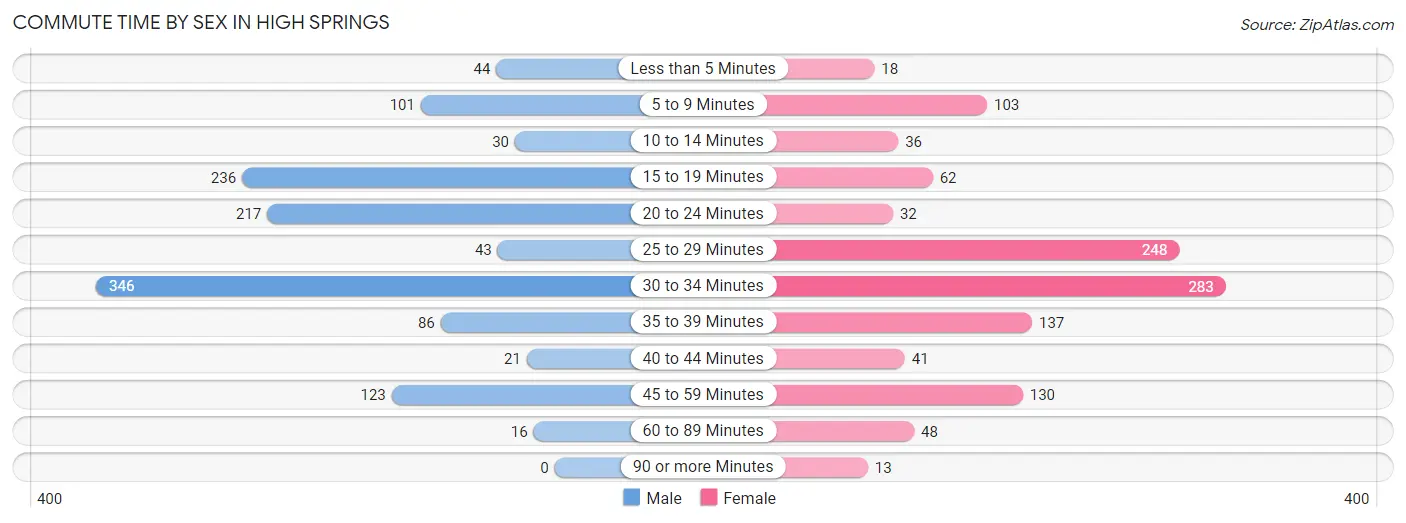
| Commute Time | Male | Female |
| Less than 5 Minutes | 44 (3.5%) | 18 (1.6%) |
| 5 to 9 Minutes | 101 (8.0%) | 103 (8.9%) |
| 10 to 14 Minutes | 30 (2.4%) | 36 (3.1%) |
| 15 to 19 Minutes | 236 (18.7%) | 62 (5.4%) |
| 20 to 24 Minutes | 217 (17.2%) | 32 (2.8%) |
| 25 to 29 Minutes | 43 (3.4%) | 248 (21.5%) |
| 30 to 34 Minutes | 346 (27.4%) | 283 (24.6%) |
| 35 to 39 Minutes | 86 (6.8%) | 137 (11.9%) |
| 40 to 44 Minutes | 21 (1.7%) | 41 (3.6%) |
| 45 to 59 Minutes | 123 (9.7%) | 130 (11.3%) |
| 60 to 89 Minutes | 16 (1.3%) | 48 (4.2%) |
| 90 or more Minutes | 0 (0.0%) | 13 (1.1%) |
Time of Departure to Work by Sex in High Springs
The most frequent times of departure to work in High Springs are 7:30 AM to 7:59 AM (280, 22.2%) for males and 7:00 AM to 7:29 AM (297, 25.8%) for females.
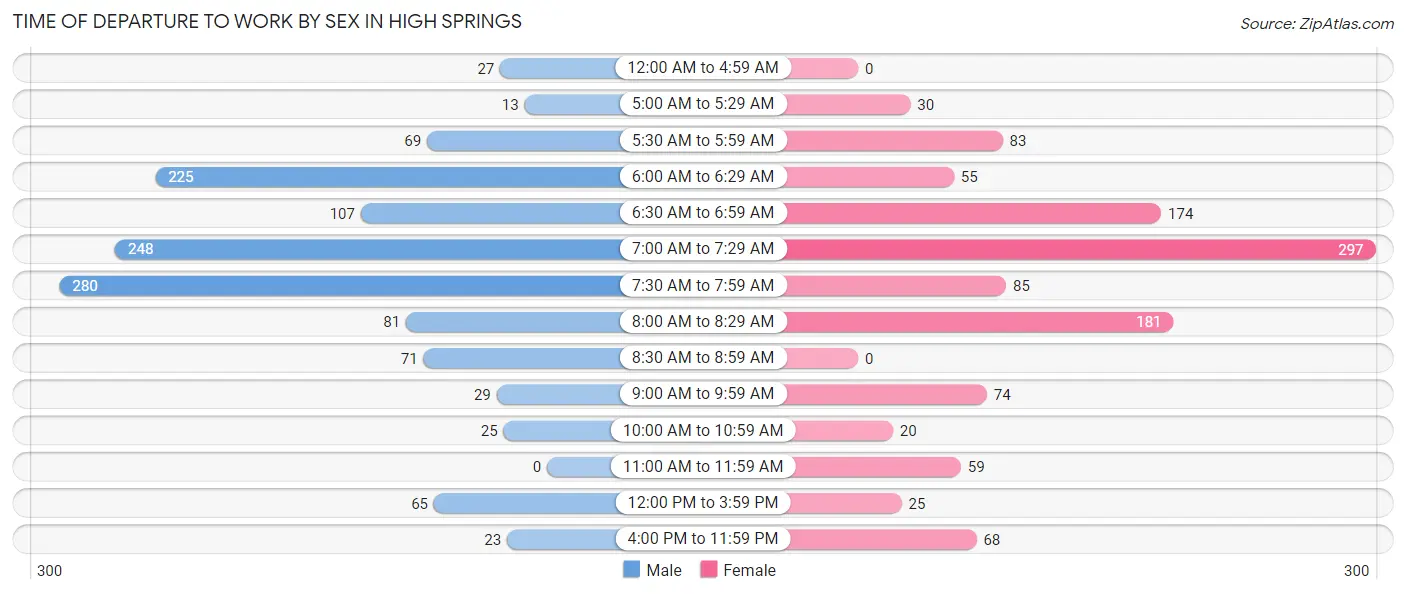
| Time of Departure | Male | Female |
| 12:00 AM to 4:59 AM | 27 (2.1%) | 0 (0.0%) |
| 5:00 AM to 5:29 AM | 13 (1.0%) | 30 (2.6%) |
| 5:30 AM to 5:59 AM | 69 (5.5%) | 83 (7.2%) |
| 6:00 AM to 6:29 AM | 225 (17.8%) | 55 (4.8%) |
| 6:30 AM to 6:59 AM | 107 (8.5%) | 174 (15.1%) |
| 7:00 AM to 7:29 AM | 248 (19.6%) | 297 (25.8%) |
| 7:30 AM to 7:59 AM | 280 (22.2%) | 85 (7.4%) |
| 8:00 AM to 8:29 AM | 81 (6.4%) | 181 (15.7%) |
| 8:30 AM to 8:59 AM | 71 (5.6%) | 0 (0.0%) |
| 9:00 AM to 9:59 AM | 29 (2.3%) | 74 (6.4%) |
| 10:00 AM to 10:59 AM | 25 (2.0%) | 20 (1.7%) |
| 11:00 AM to 11:59 AM | 0 (0.0%) | 59 (5.1%) |
| 12:00 PM to 3:59 PM | 65 (5.1%) | 25 (2.2%) |
| 4:00 PM to 11:59 PM | 23 (1.8%) | 68 (5.9%) |
| Total | 1,263 (100.0%) | 1,151 (100.0%) |
Housing Occupancy in High Springs
Occupancy by Ownership in High Springs
Of the total 1,939 dwellings in High Springs, owner-occupied units account for 1,523 (78.5%), while renter-occupied units make up 416 (21.4%).
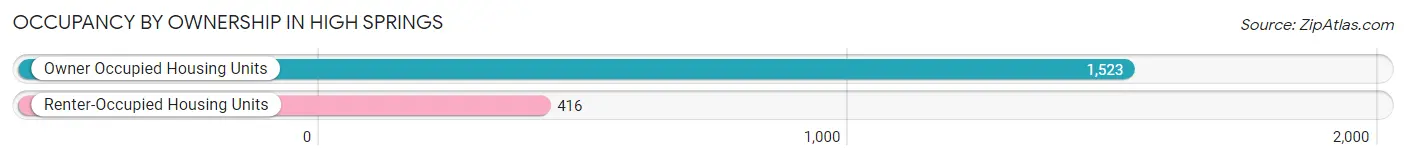
| Occupancy | # Housing Units | % Housing Units |
| Owner Occupied Housing Units | 1,523 | 78.5% |
| Renter-Occupied Housing Units | 416 | 21.4% |
| Total Occupied Housing Units | 1,939 | 100.0% |
Occupancy by Household Size in High Springs
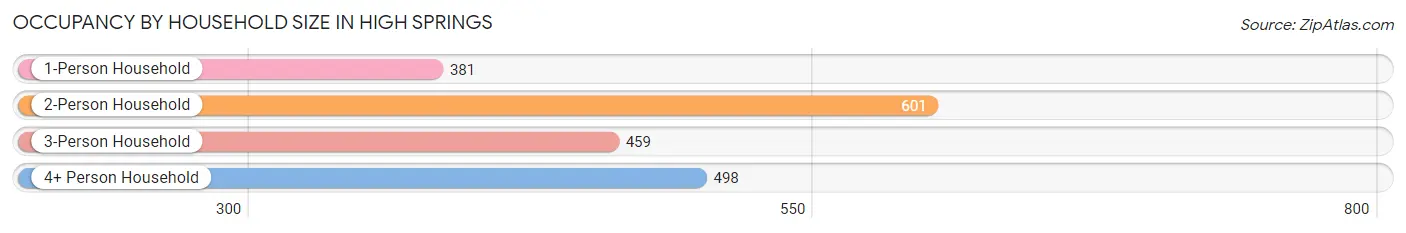
| Household Size | # Housing Units | % Housing Units |
| 1-Person Household | 381 | 19.7% |
| 2-Person Household | 601 | 31.0% |
| 3-Person Household | 459 | 23.7% |
| 4+ Person Household | 498 | 25.7% |
| Total Housing Units | 1,939 | 100.0% |
Occupancy by Ownership by Household Size in High Springs
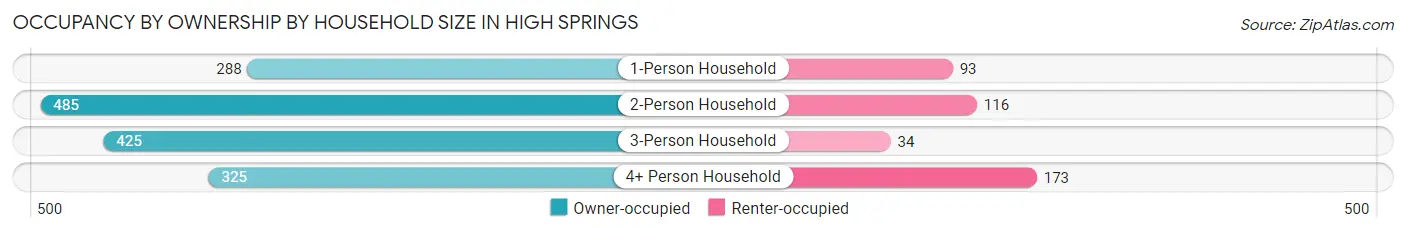
| Household Size | Owner-occupied | Renter-occupied |
| 1-Person Household | 288 (75.6%) | 93 (24.4%) |
| 2-Person Household | 485 (80.7%) | 116 (19.3%) |
| 3-Person Household | 425 (92.6%) | 34 (7.4%) |
| 4+ Person Household | 325 (65.3%) | 173 (34.7%) |
| Total Housing Units | 1,523 (78.5%) | 416 (21.4%) |
Occupancy by Educational Attainment in High Springs
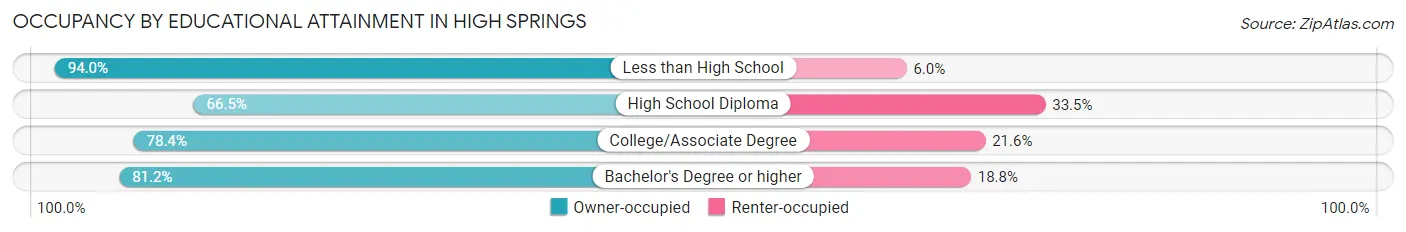
| Household Size | Owner-occupied | Renter-occupied |
| Less than High School | 141 (94.0%) | 9 (6.0%) |
| High School Diploma | 226 (66.5%) | 114 (33.5%) |
| College/Associate Degree | 580 (78.4%) | 160 (21.6%) |
| Bachelor's Degree or higher | 576 (81.2%) | 133 (18.8%) |
Occupancy by Age of Householder in High Springs
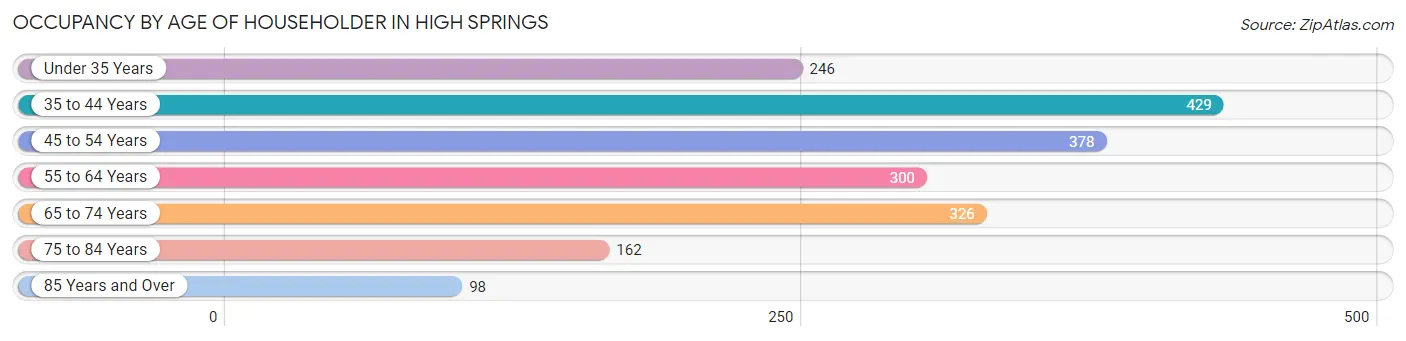
| Age Bracket | # Households | % Households |
| Under 35 Years | 246 | 12.7% |
| 35 to 44 Years | 429 | 22.1% |
| 45 to 54 Years | 378 | 19.5% |
| 55 to 64 Years | 300 | 15.5% |
| 65 to 74 Years | 326 | 16.8% |
| 75 to 84 Years | 162 | 8.4% |
| 85 Years and Over | 98 | 5.1% |
| Total | 1,939 | 100.0% |
Housing Finances in High Springs
Median Income by Occupancy in High Springs
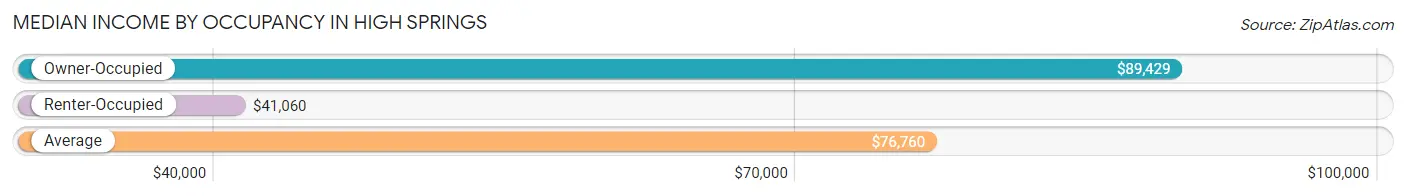
| Occupancy Type | # Households | Median Income |
| Owner-Occupied | 1,523 (78.5%) | $89,429 |
| Renter-Occupied | 416 (21.4%) | $41,060 |
| Average | 1,939 (100.0%) | $76,760 |
Occupancy by Householder Income Bracket in High Springs
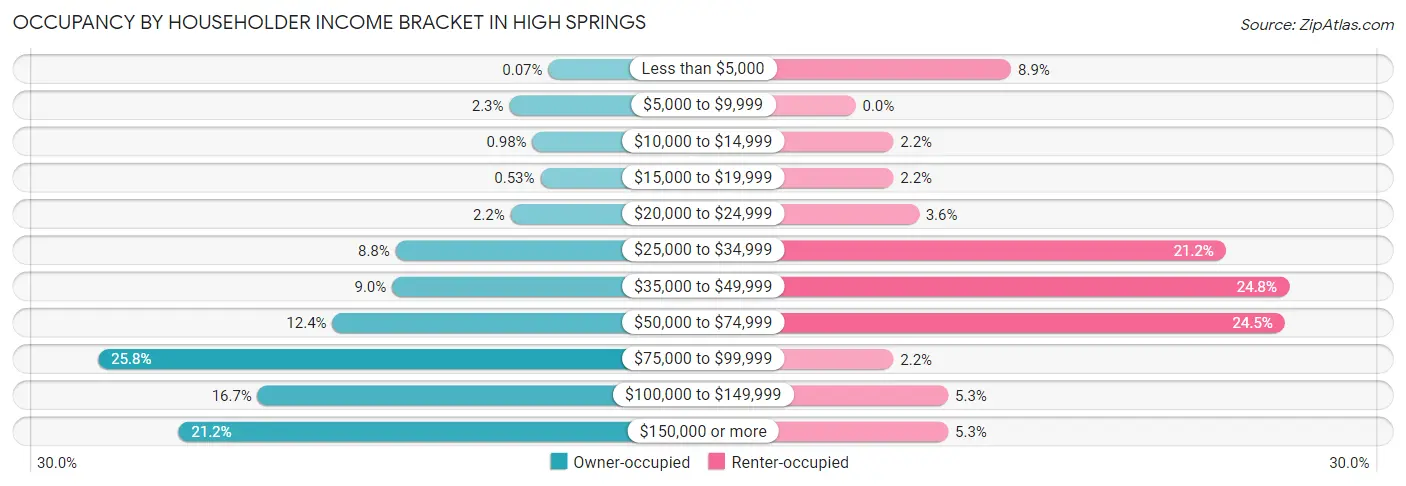
| Income Bracket | Owner-occupied | Renter-occupied |
| Less than $5,000 | 1 (0.1%) | 37 (8.9%) |
| $5,000 to $9,999 | 35 (2.3%) | 0 (0.0%) |
| $10,000 to $14,999 | 15 (1.0%) | 9 (2.2%) |
| $15,000 to $19,999 | 8 (0.5%) | 9 (2.2%) |
| $20,000 to $24,999 | 34 (2.2%) | 15 (3.6%) |
| $25,000 to $34,999 | 134 (8.8%) | 88 (21.1%) |
| $35,000 to $49,999 | 137 (9.0%) | 103 (24.8%) |
| $50,000 to $74,999 | 189 (12.4%) | 102 (24.5%) |
| $75,000 to $99,999 | 393 (25.8%) | 9 (2.2%) |
| $100,000 to $149,999 | 254 (16.7%) | 22 (5.3%) |
| $150,000 or more | 323 (21.2%) | 22 (5.3%) |
| Total | 1,523 (100.0%) | 416 (100.0%) |
Monthly Housing Cost Tiers in High Springs
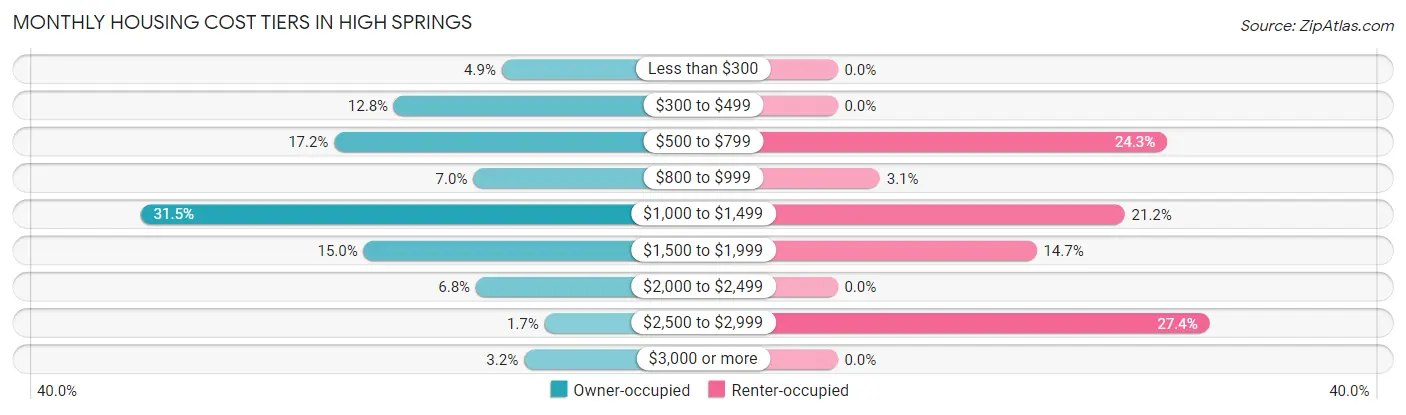
| Monthly Cost | Owner-occupied | Renter-occupied |
| Less than $300 | 74 (4.9%) | 0 (0.0%) |
| $300 to $499 | 195 (12.8%) | 0 (0.0%) |
| $500 to $799 | 262 (17.2%) | 101 (24.3%) |
| $800 to $999 | 106 (7.0%) | 13 (3.1%) |
| $1,000 to $1,499 | 479 (31.5%) | 88 (21.1%) |
| $1,500 to $1,999 | 229 (15.0%) | 61 (14.7%) |
| $2,000 to $2,499 | 103 (6.8%) | 0 (0.0%) |
| $2,500 to $2,999 | 26 (1.7%) | 114 (27.4%) |
| $3,000 or more | 49 (3.2%) | 0 (0.0%) |
| Total | 1,523 (100.0%) | 416 (100.0%) |
Physical Housing Characteristics in High Springs
Housing Structures in High Springs
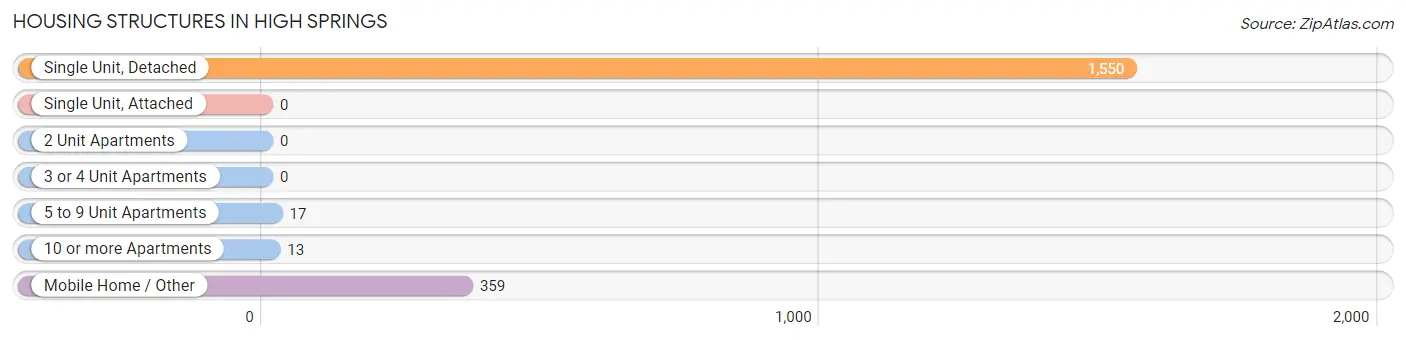
| Structure Type | # Housing Units | % Housing Units |
| Single Unit, Detached | 1,550 | 79.9% |
| Single Unit, Attached | 0 | 0.0% |
| 2 Unit Apartments | 0 | 0.0% |
| 3 or 4 Unit Apartments | 0 | 0.0% |
| 5 to 9 Unit Apartments | 17 | 0.9% |
| 10 or more Apartments | 13 | 0.7% |
| Mobile Home / Other | 359 | 18.5% |
| Total | 1,939 | 100.0% |
Housing Structures by Occupancy in High Springs
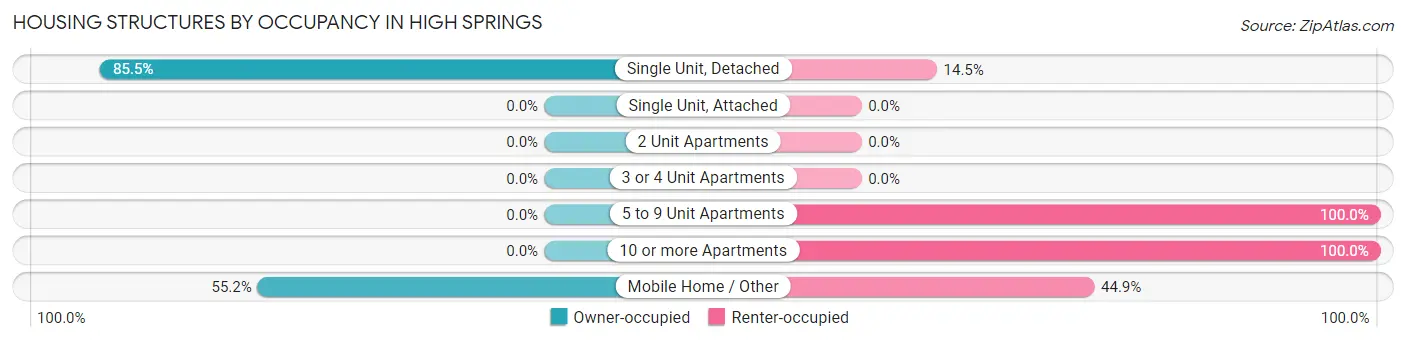
| Structure Type | Owner-occupied | Renter-occupied |
| Single Unit, Detached | 1,325 (85.5%) | 225 (14.5%) |
| Single Unit, Attached | 0 (0.0%) | 0 (0.0%) |
| 2 Unit Apartments | 0 (0.0%) | 0 (0.0%) |
| 3 or 4 Unit Apartments | 0 (0.0%) | 0 (0.0%) |
| 5 to 9 Unit Apartments | 0 (0.0%) | 17 (100.0%) |
| 10 or more Apartments | 0 (0.0%) | 13 (100.0%) |
| Mobile Home / Other | 198 (55.1%) | 161 (44.9%) |
| Total | 1,523 (78.5%) | 416 (21.4%) |
Housing Structures by Number of Rooms in High Springs
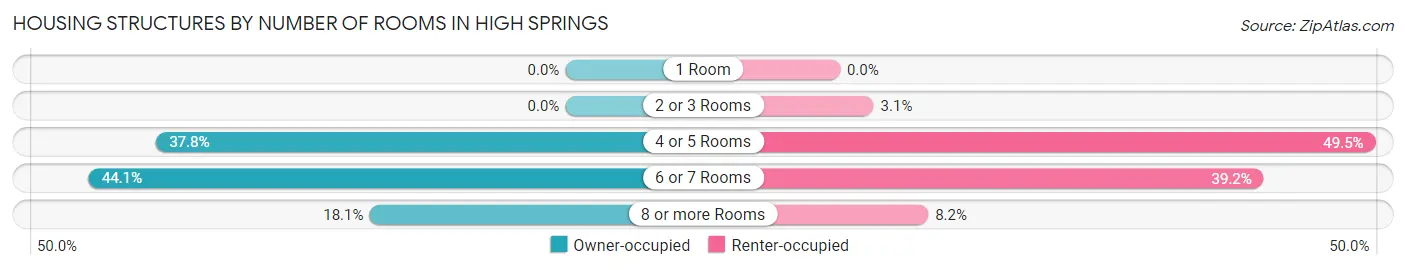
| Number of Rooms | Owner-occupied | Renter-occupied |
| 1 Room | 0 (0.0%) | 0 (0.0%) |
| 2 or 3 Rooms | 0 (0.0%) | 13 (3.1%) |
| 4 or 5 Rooms | 576 (37.8%) | 206 (49.5%) |
| 6 or 7 Rooms | 671 (44.1%) | 163 (39.2%) |
| 8 or more Rooms | 276 (18.1%) | 34 (8.2%) |
| Total | 1,523 (100.0%) | 416 (100.0%) |
Housing Structure by Heating Type in High Springs
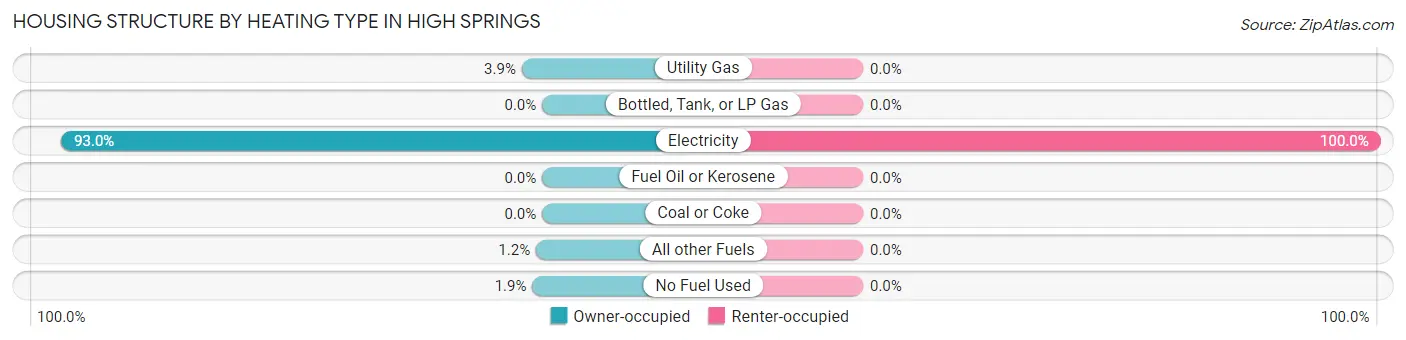
| Heating Type | Owner-occupied | Renter-occupied |
| Utility Gas | 60 (3.9%) | 0 (0.0%) |
| Bottled, Tank, or LP Gas | 0 (0.0%) | 0 (0.0%) |
| Electricity | 1,416 (93.0%) | 416 (100.0%) |
| Fuel Oil or Kerosene | 0 (0.0%) | 0 (0.0%) |
| Coal or Coke | 0 (0.0%) | 0 (0.0%) |
| All other Fuels | 18 (1.2%) | 0 (0.0%) |
| No Fuel Used | 29 (1.9%) | 0 (0.0%) |
| Total | 1,523 (100.0%) | 416 (100.0%) |
Household Vehicle Usage in High Springs
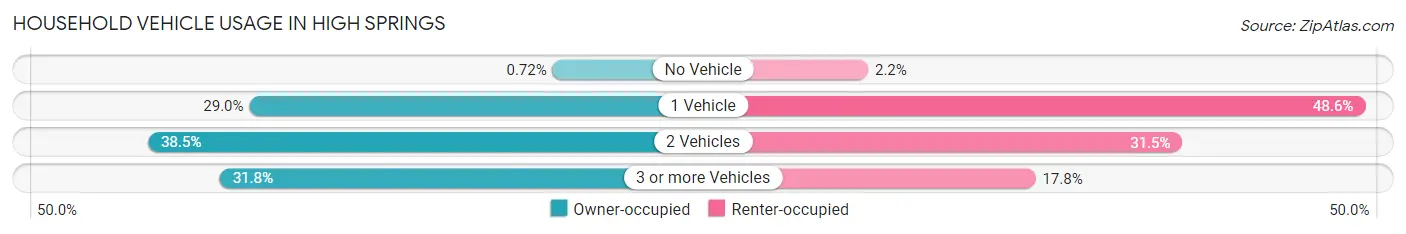
| Vehicles per Household | Owner-occupied | Renter-occupied |
| No Vehicle | 11 (0.7%) | 9 (2.2%) |
| 1 Vehicle | 442 (29.0%) | 202 (48.6%) |
| 2 Vehicles | 586 (38.5%) | 131 (31.5%) |
| 3 or more Vehicles | 484 (31.8%) | 74 (17.8%) |
| Total | 1,523 (100.0%) | 416 (100.0%) |
Real Estate & Mortgages in High Springs
Real Estate and Mortgage Overview in High Springs
| Characteristic | Without Mortgage | With Mortgage |
| Housing Units | 536 | 987 |
| Median Property Value | $255,800 | $253,500 |
| Median Household Income | $58,472 | $211 |
| Monthly Housing Costs | $499 | $49 |
| Real Estate Taxes | $2,283 | $11 |
Property Value by Mortgage Status in High Springs
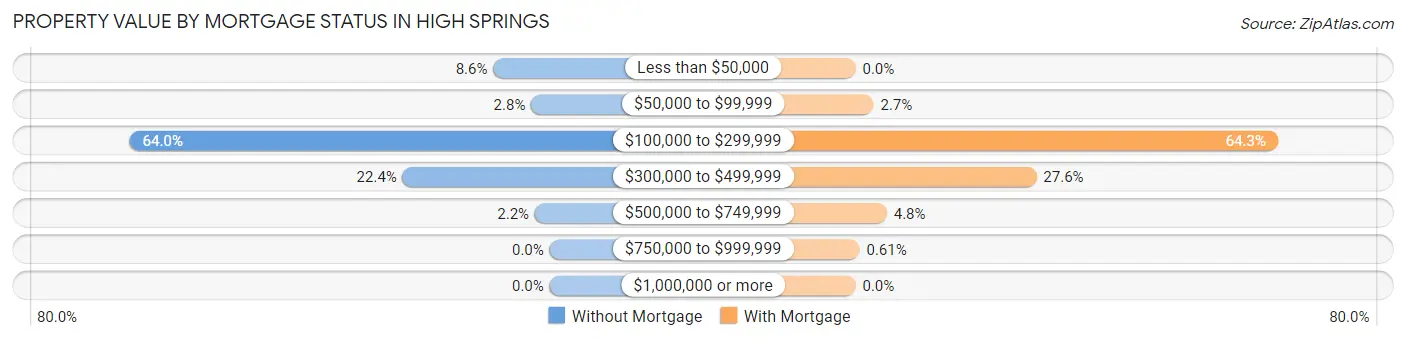
| Property Value | Without Mortgage | With Mortgage |
| Less than $50,000 | 46 (8.6%) | 0 (0.0%) |
| $50,000 to $99,999 | 15 (2.8%) | 27 (2.7%) |
| $100,000 to $299,999 | 343 (64.0%) | 635 (64.3%) |
| $300,000 to $499,999 | 120 (22.4%) | 272 (27.6%) |
| $500,000 to $749,999 | 12 (2.2%) | 47 (4.8%) |
| $750,000 to $999,999 | 0 (0.0%) | 6 (0.6%) |
| $1,000,000 or more | 0 (0.0%) | 0 (0.0%) |
| Total | 536 (100.0%) | 987 (100.0%) |
Household Income by Mortgage Status in High Springs
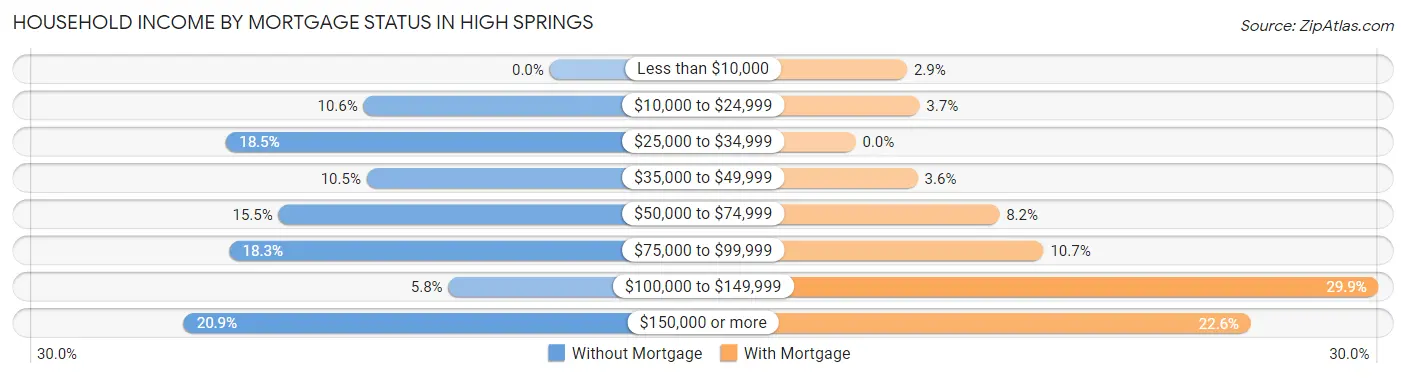
| Household Income | Without Mortgage | With Mortgage |
| Less than $10,000 | 0 (0.0%) | 29 (2.9%) |
| $10,000 to $24,999 | 57 (10.6%) | 36 (3.6%) |
| $25,000 to $34,999 | 99 (18.5%) | 0 (0.0%) |
| $35,000 to $49,999 | 56 (10.4%) | 35 (3.5%) |
| $50,000 to $74,999 | 83 (15.5%) | 81 (8.2%) |
| $75,000 to $99,999 | 98 (18.3%) | 106 (10.7%) |
| $100,000 to $149,999 | 31 (5.8%) | 295 (29.9%) |
| $150,000 or more | 112 (20.9%) | 223 (22.6%) |
| Total | 536 (100.0%) | 987 (100.0%) |
Property Value to Household Income Ratio in High Springs
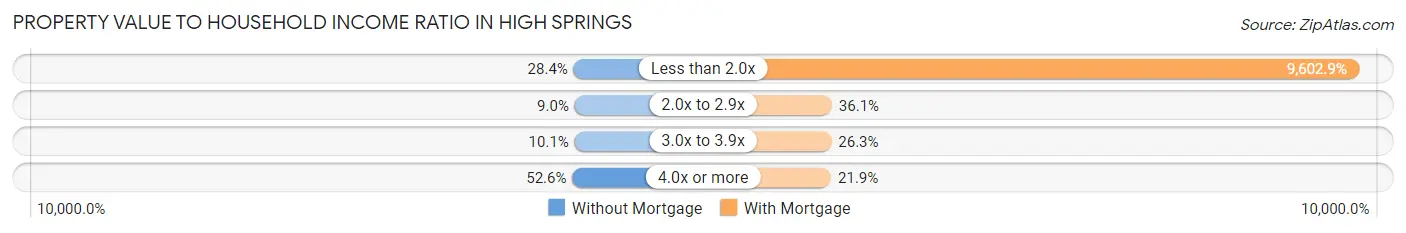
| Value-to-Income Ratio | Without Mortgage | With Mortgage |
| Less than 2.0x | 152 (28.4%) | 94,781 (9,602.9%) |
| 2.0x to 2.9x | 48 (9.0%) | 356 (36.1%) |
| 3.0x to 3.9x | 54 (10.1%) | 260 (26.3%) |
| 4.0x or more | 282 (52.6%) | 216 (21.9%) |
| Total | 536 (100.0%) | 987 (100.0%) |
Real Estate Taxes by Mortgage Status in High Springs
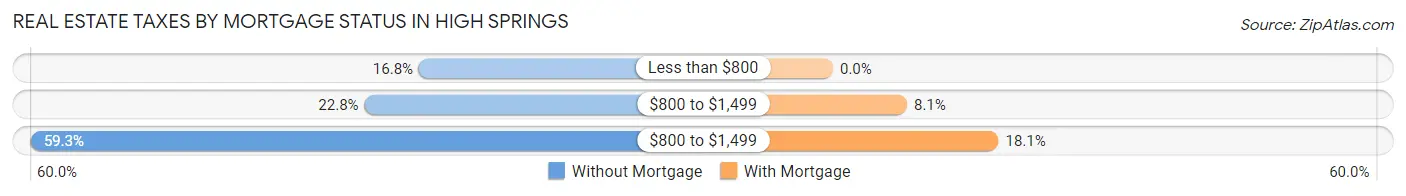
| Property Taxes | Without Mortgage | With Mortgage |
| Less than $800 | 90 (16.8%) | 0 (0.0%) |
| $800 to $1,499 | 122 (22.8%) | 80 (8.1%) |
| $800 to $1,499 | 318 (59.3%) | 179 (18.1%) |
| Total | 536 (100.0%) | 987 (100.0%) |
Health & Disability in High Springs
Health Insurance Coverage by Age in High Springs
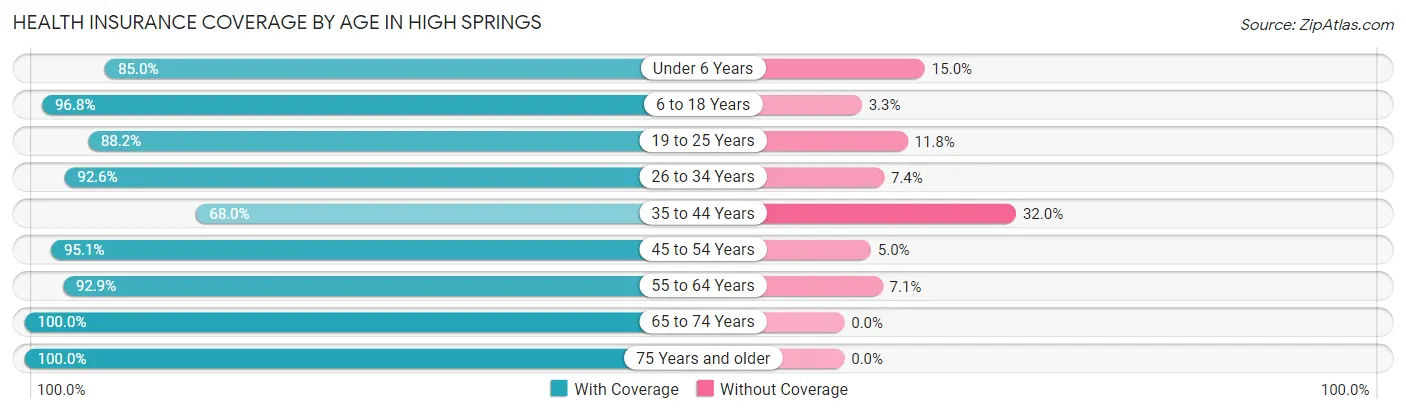
| Age Bracket | With Coverage | Without Coverage |
| Under 6 Years | 424 (85.0%) | 75 (15.0%) |
| 6 to 18 Years | 1,309 (96.8%) | 44 (3.3%) |
| 19 to 25 Years | 553 (88.2%) | 74 (11.8%) |
| 26 to 34 Years | 537 (92.6%) | 43 (7.4%) |
| 35 to 44 Years | 603 (68.0%) | 284 (32.0%) |
| 45 to 54 Years | 691 (95.1%) | 36 (5.0%) |
| 55 to 64 Years | 572 (92.9%) | 44 (7.1%) |
| 65 to 74 Years | 522 (100.0%) | 0 (0.0%) |
| 75 Years and older | 472 (100.0%) | 0 (0.0%) |
| Total | 5,683 (90.4%) | 600 (9.6%) |
Health Insurance Coverage by Citizenship Status in High Springs
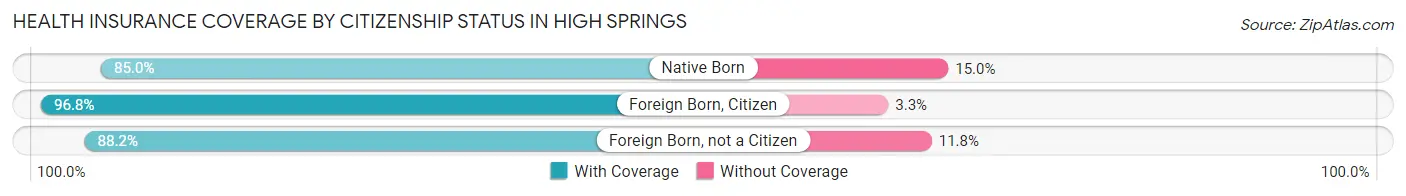
| Citizenship Status | With Coverage | Without Coverage |
| Native Born | 424 (85.0%) | 75 (15.0%) |
| Foreign Born, Citizen | 1,309 (96.8%) | 44 (3.3%) |
| Foreign Born, not a Citizen | 553 (88.2%) | 74 (11.8%) |
Health Insurance Coverage by Household Income in High Springs
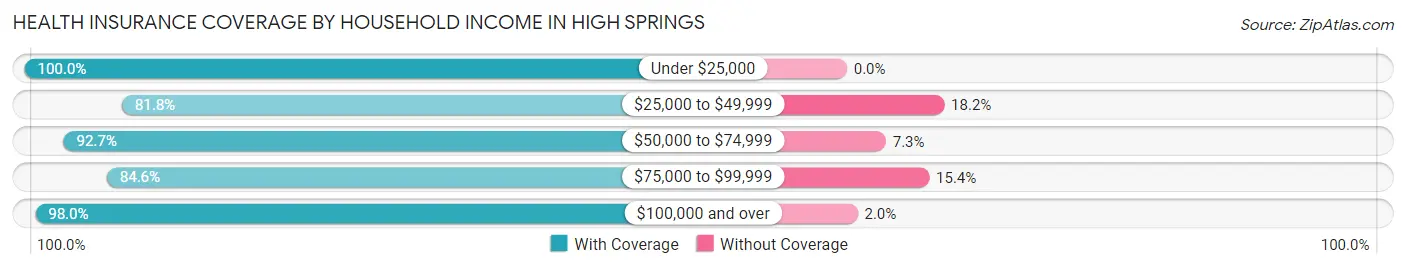
| Household Income | With Coverage | Without Coverage |
| Under $25,000 | 218 (100.0%) | 0 (0.0%) |
| $25,000 to $49,999 | 1,125 (81.8%) | 251 (18.2%) |
| $50,000 to $74,999 | 951 (92.7%) | 75 (7.3%) |
| $75,000 to $99,999 | 1,245 (84.6%) | 227 (15.4%) |
| $100,000 and over | 2,141 (98.0%) | 44 (2.0%) |
Public vs Private Health Insurance Coverage by Age in High Springs
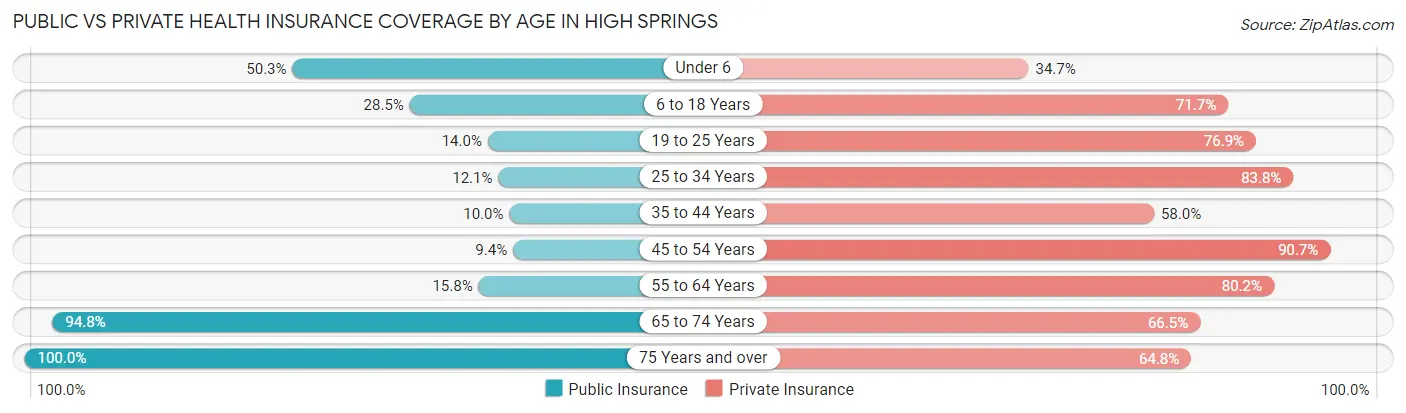
| Age Bracket | Public Insurance | Private Insurance |
| Under 6 | 251 (50.3%) | 173 (34.7%) |
| 6 to 18 Years | 386 (28.5%) | 970 (71.7%) |
| 19 to 25 Years | 88 (14.0%) | 482 (76.9%) |
| 25 to 34 Years | 70 (12.1%) | 486 (83.8%) |
| 35 to 44 Years | 89 (10.0%) | 514 (58.0%) |
| 45 to 54 Years | 68 (9.3%) | 659 (90.6%) |
| 55 to 64 Years | 97 (15.8%) | 494 (80.2%) |
| 65 to 74 Years | 495 (94.8%) | 347 (66.5%) |
| 75 Years and over | 472 (100.0%) | 306 (64.8%) |
| Total | 2,016 (32.1%) | 4,431 (70.5%) |
Disability Status by Sex by Age in High Springs
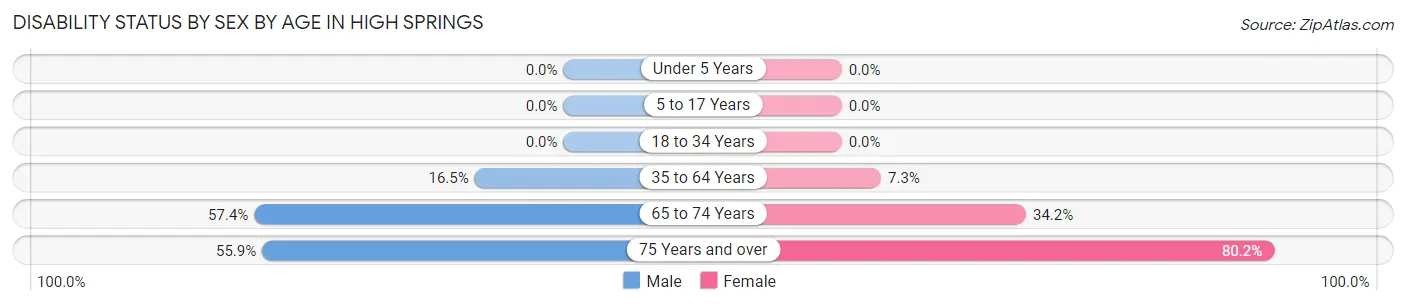
| Age Bracket | Male | Female |
| Under 5 Years | 0 (0.0%) | 0 (0.0%) |
| 5 to 17 Years | 0 (0.0%) | 0 (0.0%) |
| 18 to 34 Years | 0 (0.0%) | 0 (0.0%) |
| 35 to 64 Years | 164 (16.5%) | 90 (7.3%) |
| 65 to 74 Years | 167 (57.4%) | 79 (34.2%) |
| 75 Years and over | 66 (55.9%) | 284 (80.2%) |
Disability Class by Sex by Age in High Springs
Disability Class: Hearing Difficulty
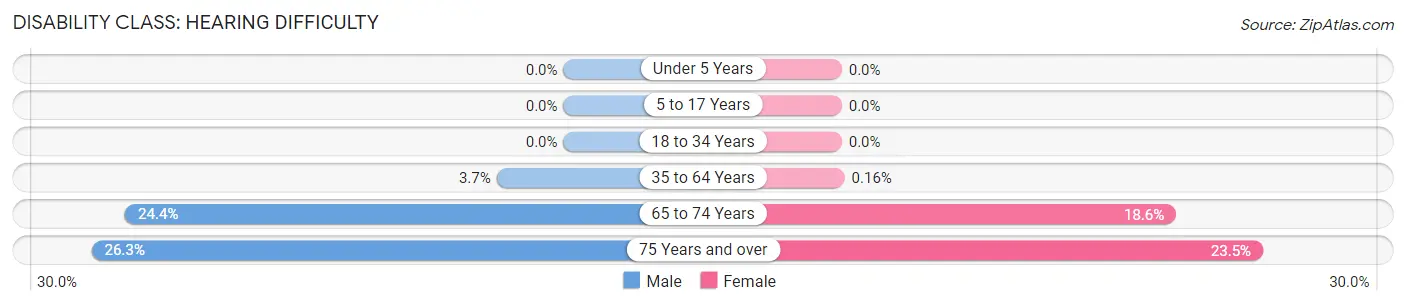
| Age Bracket | Male | Female |
| Under 5 Years | 0 (0.0%) | 0 (0.0%) |
| 5 to 17 Years | 0 (0.0%) | 0 (0.0%) |
| 18 to 34 Years | 0 (0.0%) | 0 (0.0%) |
| 35 to 64 Years | 37 (3.7%) | 2 (0.2%) |
| 65 to 74 Years | 71 (24.4%) | 43 (18.6%) |
| 75 Years and over | 31 (26.3%) | 83 (23.4%) |
Disability Class: Vision Difficulty
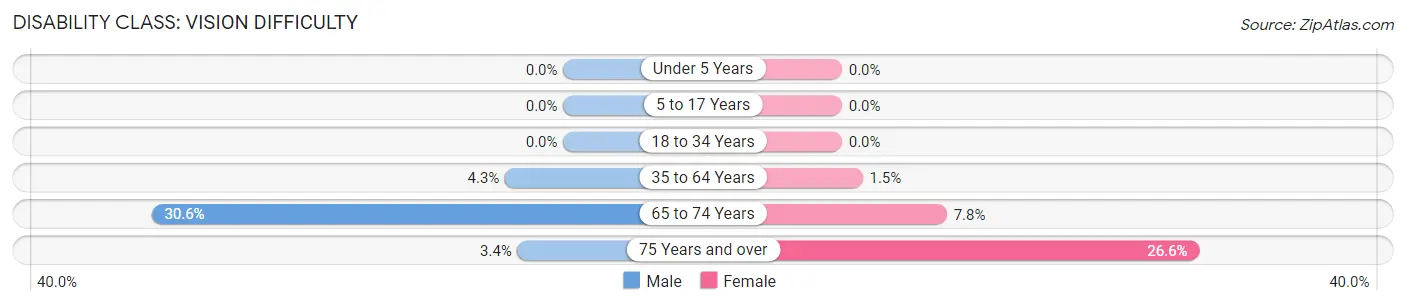
| Age Bracket | Male | Female |
| Under 5 Years | 0 (0.0%) | 0 (0.0%) |
| 5 to 17 Years | 0 (0.0%) | 0 (0.0%) |
| 18 to 34 Years | 0 (0.0%) | 0 (0.0%) |
| 35 to 64 Years | 43 (4.3%) | 19 (1.5%) |
| 65 to 74 Years | 89 (30.6%) | 18 (7.8%) |
| 75 Years and over | 4 (3.4%) | 94 (26.6%) |
Disability Class: Cognitive Difficulty
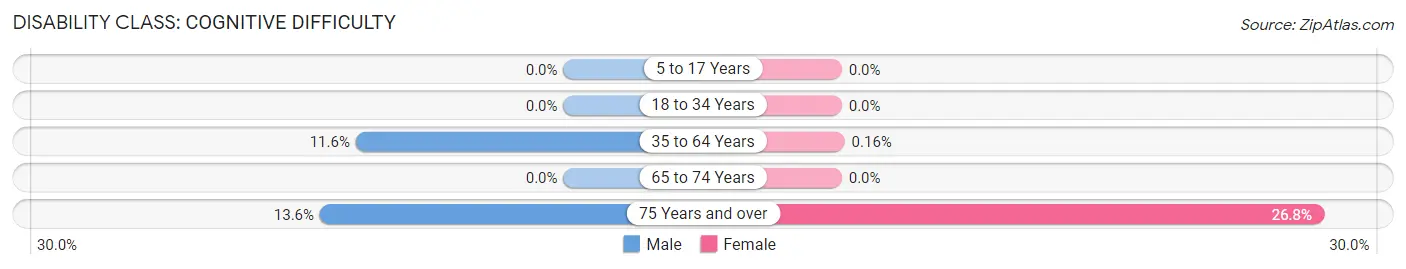
| Age Bracket | Male | Female |
| 5 to 17 Years | 0 (0.0%) | 0 (0.0%) |
| 18 to 34 Years | 0 (0.0%) | 0 (0.0%) |
| 35 to 64 Years | 115 (11.6%) | 2 (0.2%) |
| 65 to 74 Years | 0 (0.0%) | 0 (0.0%) |
| 75 Years and over | 16 (13.6%) | 95 (26.8%) |
Disability Class: Ambulatory Difficulty
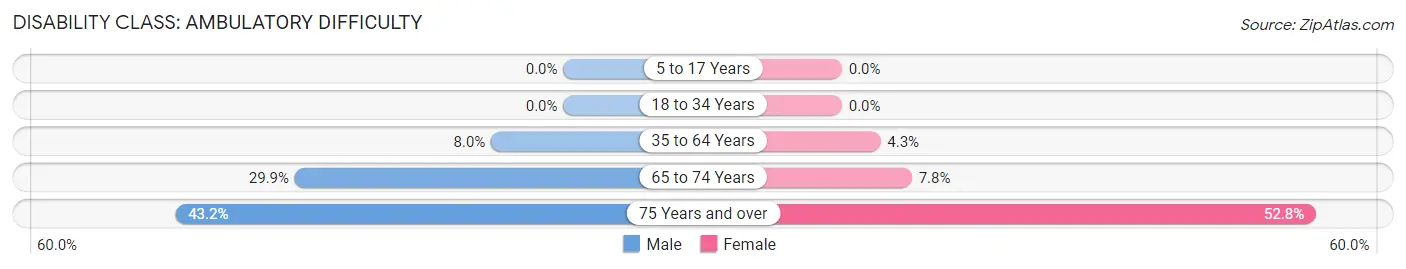
| Age Bracket | Male | Female |
| 5 to 17 Years | 0 (0.0%) | 0 (0.0%) |
| 18 to 34 Years | 0 (0.0%) | 0 (0.0%) |
| 35 to 64 Years | 80 (8.0%) | 53 (4.3%) |
| 65 to 74 Years | 87 (29.9%) | 18 (7.8%) |
| 75 Years and over | 51 (43.2%) | 187 (52.8%) |
Disability Class: Self-Care Difficulty
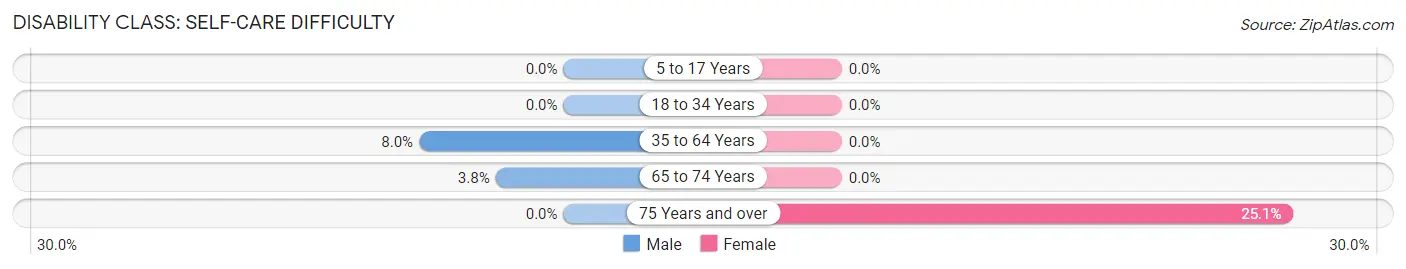
| Age Bracket | Male | Female |
| 5 to 17 Years | 0 (0.0%) | 0 (0.0%) |
| 18 to 34 Years | 0 (0.0%) | 0 (0.0%) |
| 35 to 64 Years | 80 (8.0%) | 0 (0.0%) |
| 65 to 74 Years | 11 (3.8%) | 0 (0.0%) |
| 75 Years and over | 0 (0.0%) | 89 (25.1%) |
Technology Access in High Springs
Computing Device Access in High Springs
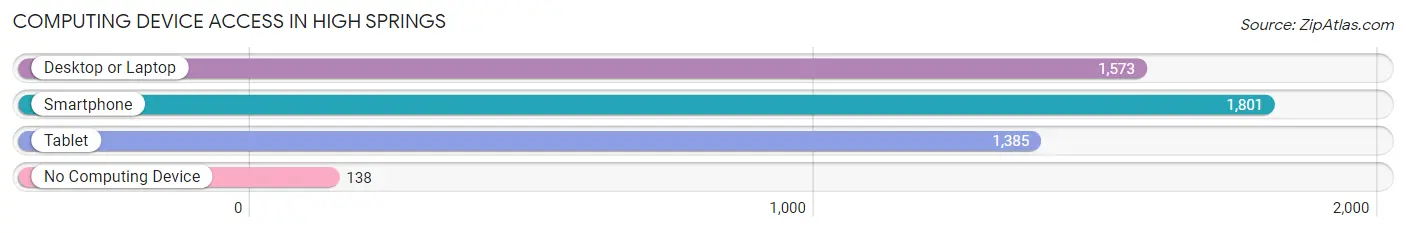
| Device Type | # Households | % Households |
| Desktop or Laptop | 1,573 | 81.1% |
| Smartphone | 1,801 | 92.9% |
| Tablet | 1,385 | 71.4% |
| No Computing Device | 138 | 7.1% |
| Total | 1,939 | 100.0% |
Internet Access in High Springs
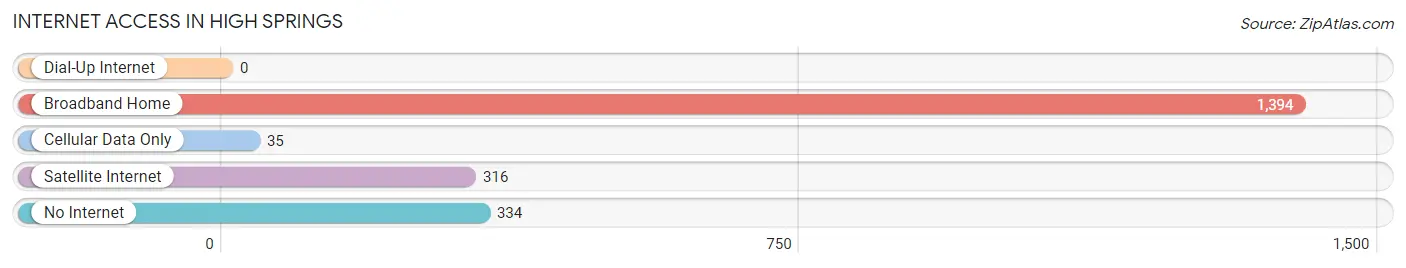
| Internet Type | # Households | % Households |
| Dial-Up Internet | 0 | 0.0% |
| Broadband Home | 1,394 | 71.9% |
| Cellular Data Only | 35 | 1.8% |
| Satellite Internet | 316 | 16.3% |
| No Internet | 334 | 17.2% |
| Total | 1,939 | 100.0% |
High Springs Summary
History
High Springs is a small city located in Alachua County, Florida. It is situated in the north-central part of the state, approximately 20 miles northwest of Gainesville. The city was founded in 1884 by a group of settlers from Georgia, who named it after the nearby springs. The springs were a popular destination for visitors, and the city quickly grew to become a popular tourist destination.
High Springs was incorporated in 1887, and the city quickly developed into a thriving agricultural center. The city was home to a number of citrus groves, as well as a number of other crops, such as cotton, corn, and peanuts. The city also had a thriving lumber industry, and the railroad was a major factor in the city’s growth.
In the early 1900s, High Springs began to attract tourists from all over the country. The city was home to a number of resorts, and the springs were a popular destination for swimming and fishing. The city also had a number of attractions, such as the High Springs Opera House, which opened in 1908.
High Springs experienced a period of decline in the mid-20th century, as the city’s economy shifted away from agriculture and tourism. The city’s population decreased, and the city’s economy shifted to manufacturing and service industries. In the late 20th century, the city began to experience a resurgence, as the city’s economy shifted back to tourism and recreation.
Geography
High Springs is located in north-central Florida, approximately 20 miles northwest of Gainesville. The city is situated in the Suwannee River Valley, and is surrounded by rolling hills and forests. The city is located at the intersection of State Road 45 and US Highway 441.
The city has a total area of 4.2 square miles, of which 4.1 square miles is land and 0.1 square miles is water. The city is located at an elevation of approximately 100 feet above sea level.
The climate in High Springs is classified as humid subtropical, with hot, humid summers and mild winters. The average temperature in the summer is around 90 degrees Fahrenheit, and the average temperature in the winter is around 60 degrees Fahrenheit.
Economy
High Springs has a diverse economy, with a mix of manufacturing, service, and tourism industries. The city is home to a number of manufacturing companies, including a paper mill, a plastics factory, and a metal fabrication plant. The city is also home to a number of service industries, such as healthcare, education, and retail.
The city is also a popular tourist destination, and the city’s economy is heavily reliant on tourism. The city is home to a number of attractions, such as the High Springs Opera House, the High Springs Museum, and the High Springs Nature Park. The city is also home to a number of festivals, such as the High Springs Music Festival and the High Springs Farmers Market.
Demographics
As of the 2010 census, High Springs had a population of 5,350. The racial makeup of the city was 79.2% White, 15.3% African American, 0.4% Native American, 0.7% Asian, 0.1% Pacific Islander, 2.2% from other races, and 2.2% from two or more races. Hispanic or Latino of any race were 8.2% of the population.
The median income for a household in High Springs was $37,917, and the median income for a family was $45,938. The per capita income for the city was $20,945. About 15.3% of families and 19.2% of the population were below the poverty line, including 28.2% of those under age 18 and 8.2% of those age 65 or over.
Common Questions
What is Per Capita Income in High Springs?
Per Capita income in High Springs is $31,820.
What is the Median Family Income in High Springs?
Median Family Income in High Springs is $89,357.
What is the Median Household income in High Springs?
Median Household Income in High Springs is $76,760.
What is Income or Wage Gap in High Springs?
Income or Wage Gap in High Springs is 12.3%.
Women in High Springs earn 87.7 cents for every dollar earned by a man.
What is Inequality or Gini Index in High Springs?
Inequality or Gini Index in High Springs is 0.42.
What is the Total Population of High Springs?
Total Population of High Springs is 6,283.
What is the Total Male Population of High Springs?
Total Male Population of High Springs is 2,963.
What is the Total Female Population of High Springs?
Total Female Population of High Springs is 3,320.
What is the Ratio of Males per 100 Females in High Springs?
There are 89.25 Males per 100 Females in High Springs.
What is the Ratio of Females per 100 Males in High Springs?
There are 112.05 Females per 100 Males in High Springs.
What is the Median Population Age in High Springs?
Median Population Age in High Springs is 36.8 Years.
What is the Average Family Size in High Springs
Average Family Size in High Springs is 3.7 People.
What is the Average Household Size in High Springs
Average Household Size in High Springs is 3.2 People.
How Large is the Labor Force in High Springs?
There are 2,761 People in the Labor Forcein in High Springs.
What is the Percentage of People in the Labor Force in High Springs?
60.3% of People are in the Labor Force in High Springs.
What is the Unemployment Rate in High Springs?
Unemployment Rate in High Springs is 2.9%.