Bentleyville borough, PA Map & Demographics
Bentleyville borough Overview
$26,040
PER CAPITA INCOME
$65,361
AVG FAMILY INCOME
$53,152
AVG HOUSEHOLD INCOME
49.9%
WAGE / INCOME GAP [ % ]
50.1¢/ $1
WAGE / INCOME GAP [ $ ]
$12,474
FAMILY INCOME DEFICIT
0.44
INEQUALITY / GINI INDEX
2,409
TOTAL POPULATION
1,112
MALE POPULATION
1,297
FEMALE POPULATION
85.74
MALES / 100 FEMALES
116.64
FEMALES / 100 MALES
36.8
MEDIAN AGE
3.3
AVG FAMILY SIZE
2.5
AVG HOUSEHOLD SIZE
957
LABOR FORCE [ PEOPLE ]
52.3%
PERCENT IN LABOR FORCE
4.8%
UNEMPLOYMENT RATE
Income in Bentleyville borough
Income Overview in Bentleyville borough
Per Capita Income in Bentleyville borough is $26,040, while median incomes of families and households are $65,361 and $53,152 respectively.
| Characteristic | Number | Measure |
| Per Capita Income | 2,409 | $26,040 |
| Median Family Income | 589 | $65,361 |
| Mean Family Income | 589 | $71,904 |
| Median Household Income | 938 | $53,152 |
| Mean Household Income | 938 | $63,897 |
| Income Deficit | 589 | $12,474 |
| Wage / Income Gap (%) | 2,409 | 49.86% |
| Wage / Income Gap ($) | 2,409 | 50.14¢ per $1 |
| Gini / Inequality Index | 2,409 | 0.44 |
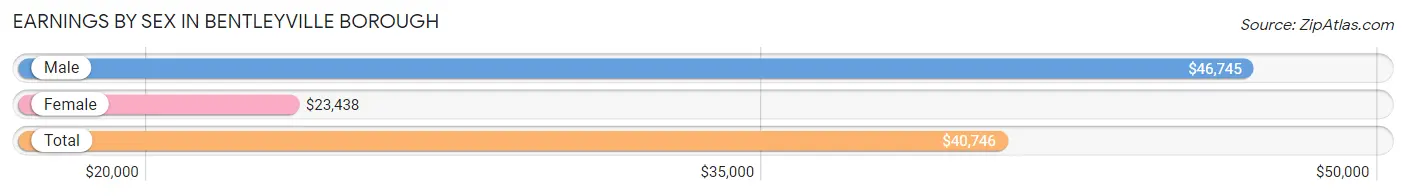
Earnings by Sex in Bentleyville borough
Average Earnings in Bentleyville borough are $40,746, $46,745 for men and $23,438 for women, a difference of 49.9%.
| Sex | Number | Average Earnings |
| Male | 451 (44.8%) | $46,745 |
| Female | 555 (55.2%) | $23,438 |
| Total | 1,006 (100.0%) | $40,746 |
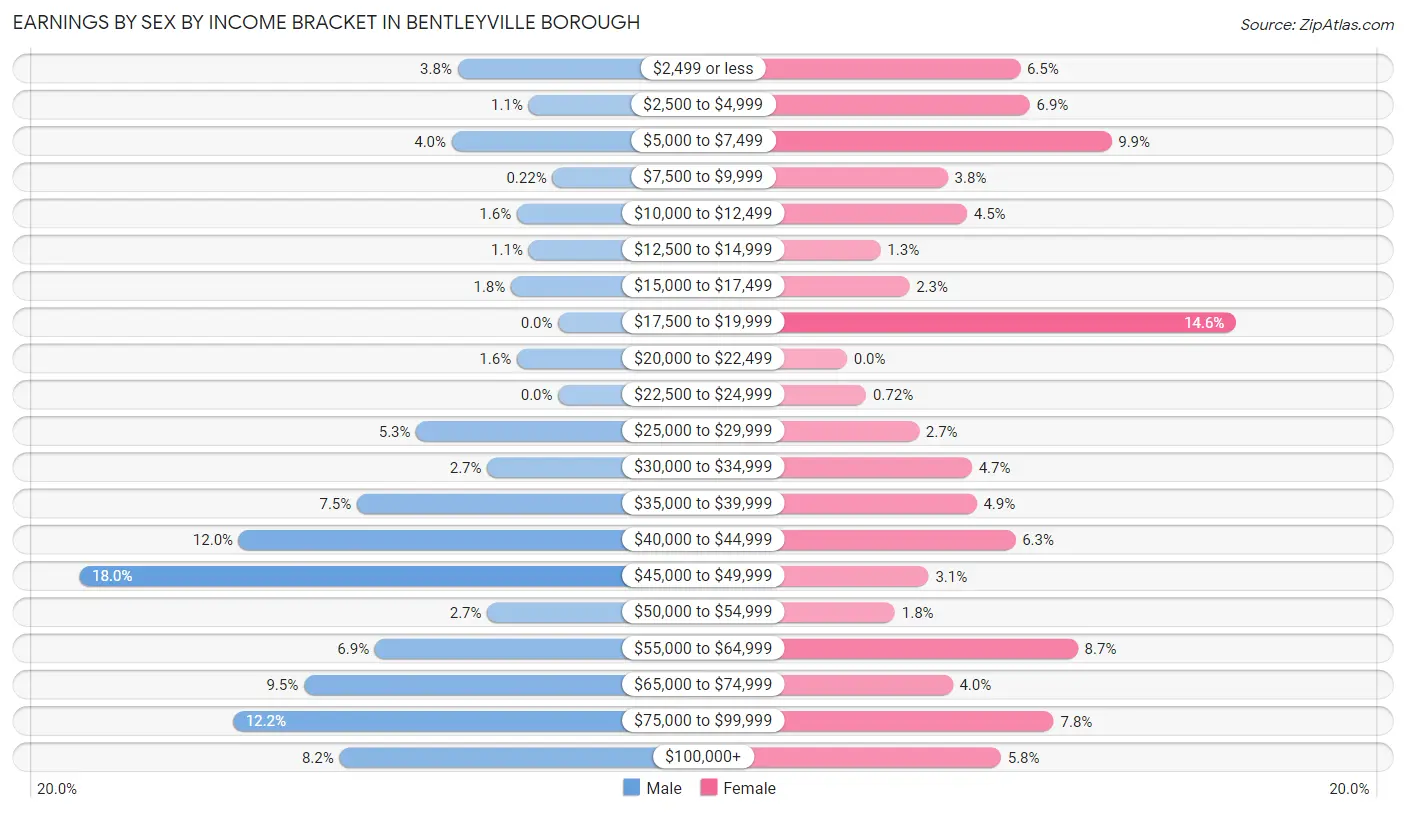
Earnings by Sex by Income Bracket in Bentleyville borough
The most common earnings brackets in Bentleyville borough are $45,000 to $49,999 for men (81 | 18.0%) and $17,500 to $19,999 for women (81 | 14.6%).
| Income | Male | Female |
| $2,499 or less | 17 (3.8%) | 36 (6.5%) |
| $2,500 to $4,999 | 5 (1.1%) | 38 (6.9%) |
| $5,000 to $7,499 | 18 (4.0%) | 55 (9.9%) |
| $7,500 to $9,999 | 1 (0.2%) | 21 (3.8%) |
| $10,000 to $12,499 | 7 (1.5%) | 25 (4.5%) |
| $12,500 to $14,999 | 5 (1.1%) | 7 (1.3%) |
| $15,000 to $17,499 | 8 (1.8%) | 13 (2.3%) |
| $17,500 to $19,999 | 0 (0.0%) | 81 (14.6%) |
| $20,000 to $22,499 | 7 (1.5%) | 0 (0.0%) |
| $22,500 to $24,999 | 0 (0.0%) | 4 (0.7%) |
| $25,000 to $29,999 | 24 (5.3%) | 15 (2.7%) |
| $30,000 to $34,999 | 12 (2.7%) | 26 (4.7%) |
| $35,000 to $39,999 | 34 (7.5%) | 27 (4.9%) |
| $40,000 to $44,999 | 54 (12.0%) | 35 (6.3%) |
| $45,000 to $49,999 | 81 (18.0%) | 17 (3.1%) |
| $50,000 to $54,999 | 12 (2.7%) | 10 (1.8%) |
| $55,000 to $64,999 | 31 (6.9%) | 48 (8.6%) |
| $65,000 to $74,999 | 43 (9.5%) | 22 (4.0%) |
| $75,000 to $99,999 | 55 (12.2%) | 43 (7.7%) |
| $100,000+ | 37 (8.2%) | 32 (5.8%) |
| Total | 451 (100.0%) | 555 (100.0%) |
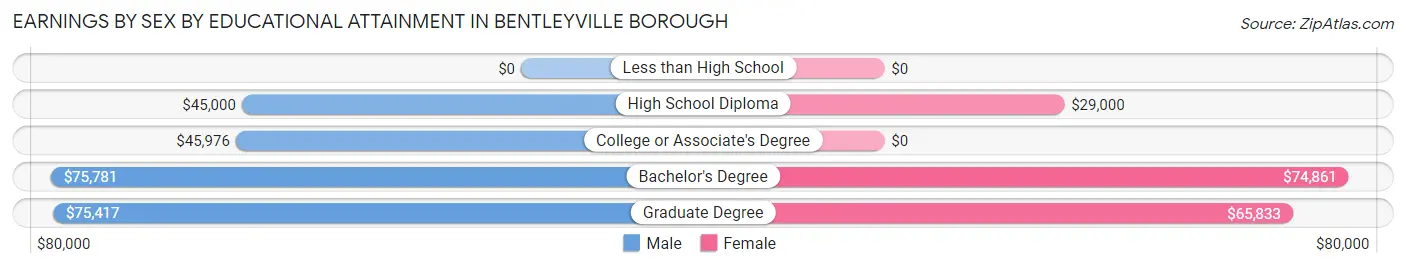
Earnings by Sex by Educational Attainment in Bentleyville borough
Average earnings in Bentleyville borough are $48,295 for men and $38,000 for women, a difference of 21.3%. Men with an educational attainment of bachelor's degree enjoy the highest average annual earnings of $75,781, while those with high school diploma education earn the least with $45,000. Women with an educational attainment of bachelor's degree earn the most with the average annual earnings of $74,861, while those with high school diploma education have the smallest earnings of $29,000.
| Educational Attainment | Male Income | Female Income |
| Less than High School | - | - |
| High School Diploma | $45,000 | $29,000 |
| College or Associate's Degree | $45,976 | $0 |
| Bachelor's Degree | $75,781 | $74,861 |
| Graduate Degree | $75,417 | $65,833 |
| Total | $48,295 | $38,000 |
Family Income in Bentleyville borough
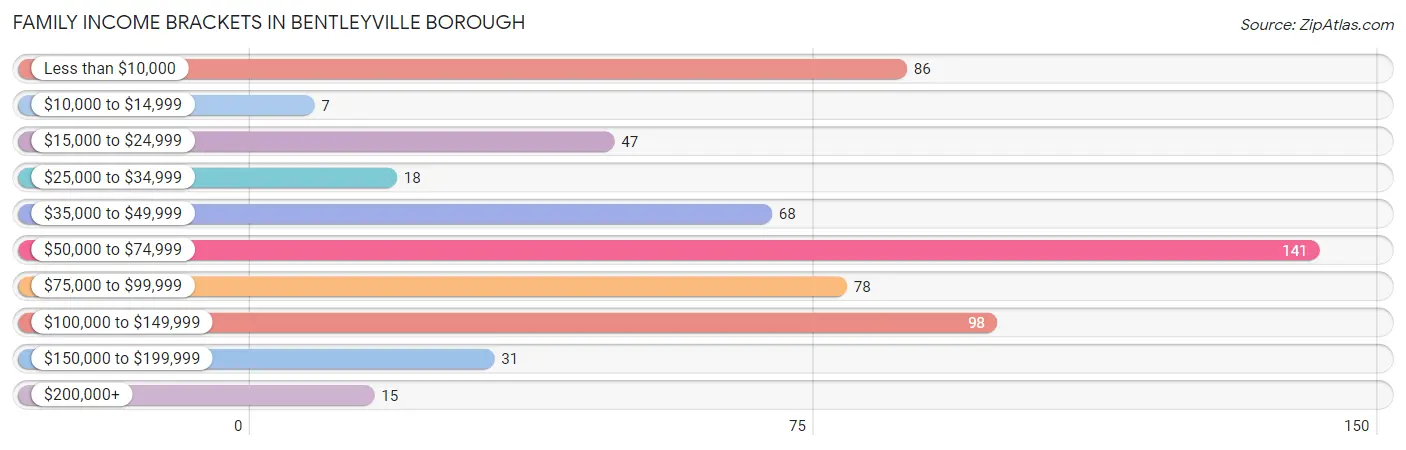
Family Income Brackets in Bentleyville borough
According to the Bentleyville borough family income data, there are 141 families falling into the $50,000 to $74,999 income range, which is the most common income bracket and makes up 23.9% of all families. Conversely, the $10,000 to $14,999 income bracket is the least frequent group with only 7 families (1.2%) belonging to this category.
| Income Bracket | # Families | % Families |
| Less than $10,000 | 86 | 14.6% |
| $10,000 to $14,999 | 7 | 1.2% |
| $15,000 to $24,999 | 47 | 8.0% |
| $25,000 to $34,999 | 18 | 3.1% |
| $35,000 to $49,999 | 68 | 11.5% |
| $50,000 to $74,999 | 141 | 23.9% |
| $75,000 to $99,999 | 78 | 13.2% |
| $100,000 to $149,999 | 98 | 16.6% |
| $150,000 to $199,999 | 31 | 5.3% |
| $200,000+ | 15 | 2.5% |
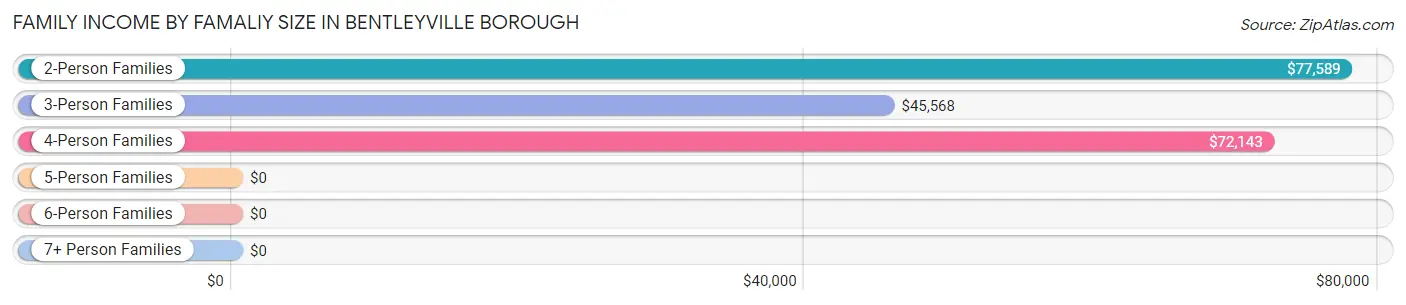
Family Income by Famaliy Size in Bentleyville borough
2-person families (291 | 49.4%) account for the highest median family income in Bentleyville borough with $77,589 per family, while 2-person families (291 | 49.4%) have the highest median income of $38,794 per family member.
| Income Bracket | # Families | Median Income |
| 2-Person Families | 291 (49.4%) | $77,589 |
| 3-Person Families | 168 (28.5%) | $45,568 |
| 4-Person Families | 74 (12.6%) | $72,143 |
| 5-Person Families | 20 (3.4%) | $0 |
| 6-Person Families | 36 (6.1%) | $0 |
| 7+ Person Families | 0 (0.0%) | $0 |
| Total | 589 (100.0%) | $65,361 |
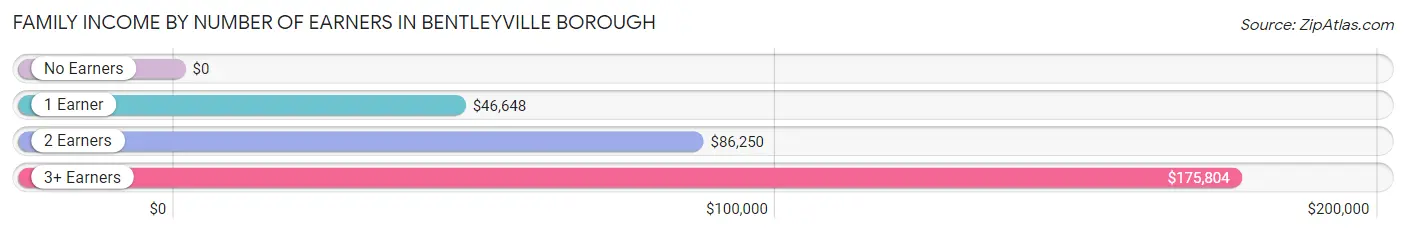
Family Income by Number of Earners in Bentleyville borough
| Number of Earners | # Families | Median Income |
| No Earners | 173 (29.4%) | $0 |
| 1 Earner | 189 (32.1%) | $46,648 |
| 2 Earners | 198 (33.6%) | $86,250 |
| 3+ Earners | 29 (4.9%) | $175,804 |
| Total | 589 (100.0%) | $65,361 |
Household Income in Bentleyville borough
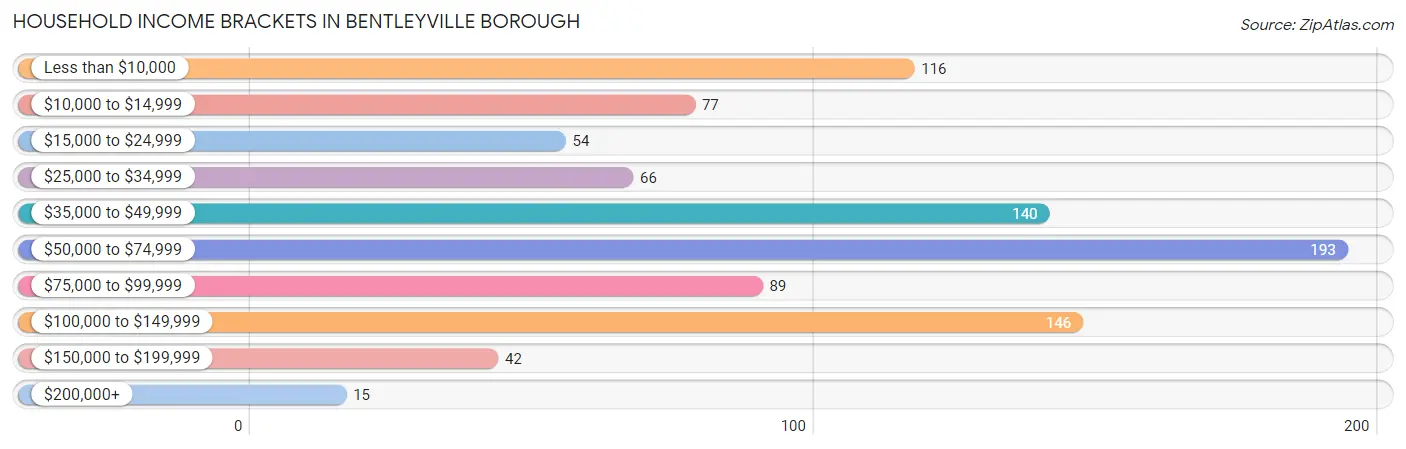
Household Income Brackets in Bentleyville borough
With 193 households falling in the category, the $50,000 to $74,999 income range is the most frequent in Bentleyville borough, accounting for 20.6% of all households. In contrast, only 15 households (1.6%) fall into the $200,000+ income bracket, making it the least populous group.
| Income Bracket | # Households | % Households |
| Less than $10,000 | 116 | 12.4% |
| $10,000 to $14,999 | 77 | 8.2% |
| $15,000 to $24,999 | 54 | 5.8% |
| $25,000 to $34,999 | 66 | 7.0% |
| $35,000 to $49,999 | 140 | 14.9% |
| $50,000 to $74,999 | 193 | 20.6% |
| $75,000 to $99,999 | 89 | 9.5% |
| $100,000 to $149,999 | 146 | 15.6% |
| $150,000 to $199,999 | 42 | 4.5% |
| $200,000+ | 15 | 1.6% |
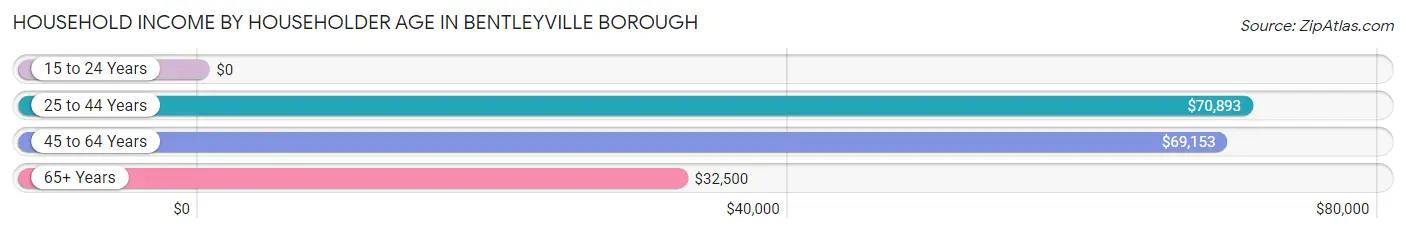
Household Income by Householder Age in Bentleyville borough
The median household income in Bentleyville borough is $53,152, with the highest median household income of $70,893 found in the 25 to 44 years age bracket for the primary householder. A total of 246 households (26.2%) fall into this category. Meanwhile, the 15 to 24 years age bracket for the primary householder has the lowest median household income of $0, with 41 households (4.4%) in this group.
| Income Bracket | # Households | Median Income |
| 15 to 24 Years | 41 (4.4%) | $0 |
| 25 to 44 Years | 246 (26.2%) | $70,893 |
| 45 to 64 Years | 333 (35.5%) | $69,153 |
| 65+ Years | 318 (33.9%) | $32,500 |
| Total | 938 (100.0%) | $53,152 |
Poverty in Bentleyville borough
Income Below Poverty by Sex and Age in Bentleyville borough
With 23.7% poverty level for males and 27.1% for females among the residents of Bentleyville borough, 5 year old males and 12 to 14 year old females are the most vulnerable to poverty, with 41 males (62.1%) and 34 females (72.3%) in their respective age groups living below the poverty level.
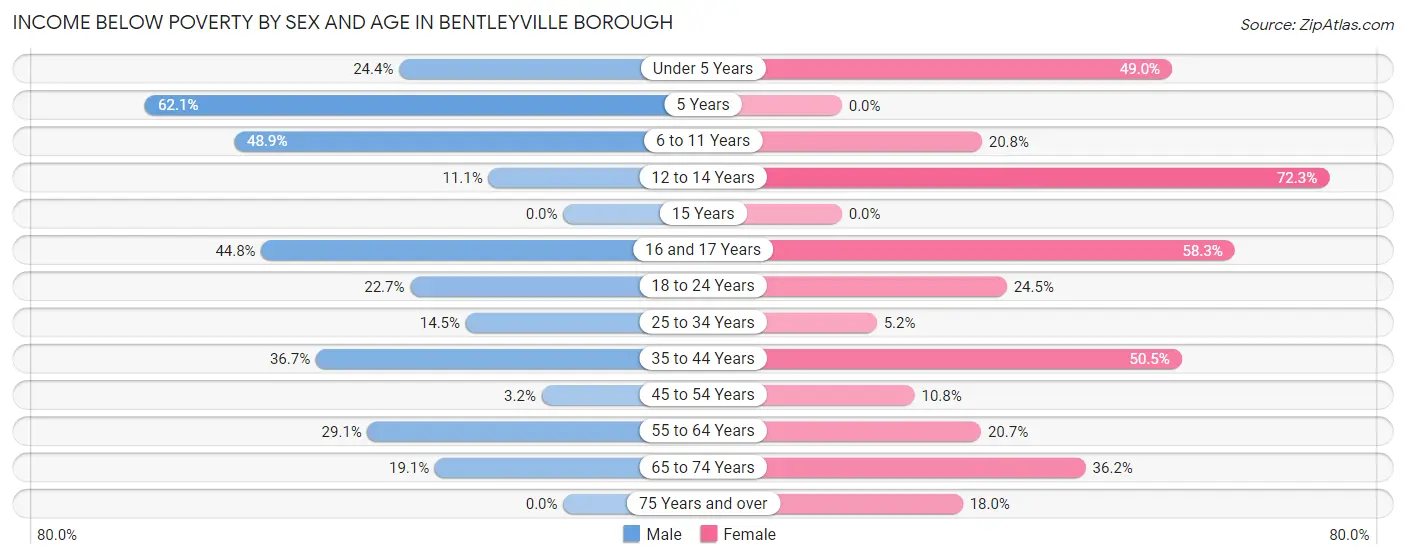
| Age Bracket | Male | Female |
| Under 5 Years | 29 (24.4%) | 50 (49.0%) |
| 5 Years | 41 (62.1%) | 0 (0.0%) |
| 6 to 11 Years | 22 (48.9%) | 21 (20.8%) |
| 12 to 14 Years | 7 (11.1%) | 34 (72.3%) |
| 15 Years | 0 (0.0%) | 0 (0.0%) |
| 16 and 17 Years | 13 (44.8%) | 14 (58.3%) |
| 18 to 24 Years | 15 (22.7%) | 36 (24.5%) |
| 25 to 34 Years | 21 (14.5%) | 7 (5.2%) |
| 35 to 44 Years | 54 (36.7%) | 56 (50.4%) |
| 45 to 54 Years | 5 (3.2%) | 19 (10.8%) |
| 55 to 64 Years | 34 (29.1%) | 31 (20.7%) |
| 65 to 74 Years | 20 (19.1%) | 63 (36.2%) |
| 75 Years and over | 0 (0.0%) | 21 (17.9%) |
| Total | 261 (23.7%) | 352 (27.1%) |
Income Above Poverty by Sex and Age in Bentleyville borough
According to the poverty statistics in Bentleyville borough, males aged 15 years and females aged 5 years are the age groups that are most secure financially, with 100.0% of males and 100.0% of females in these age groups living above the poverty line.
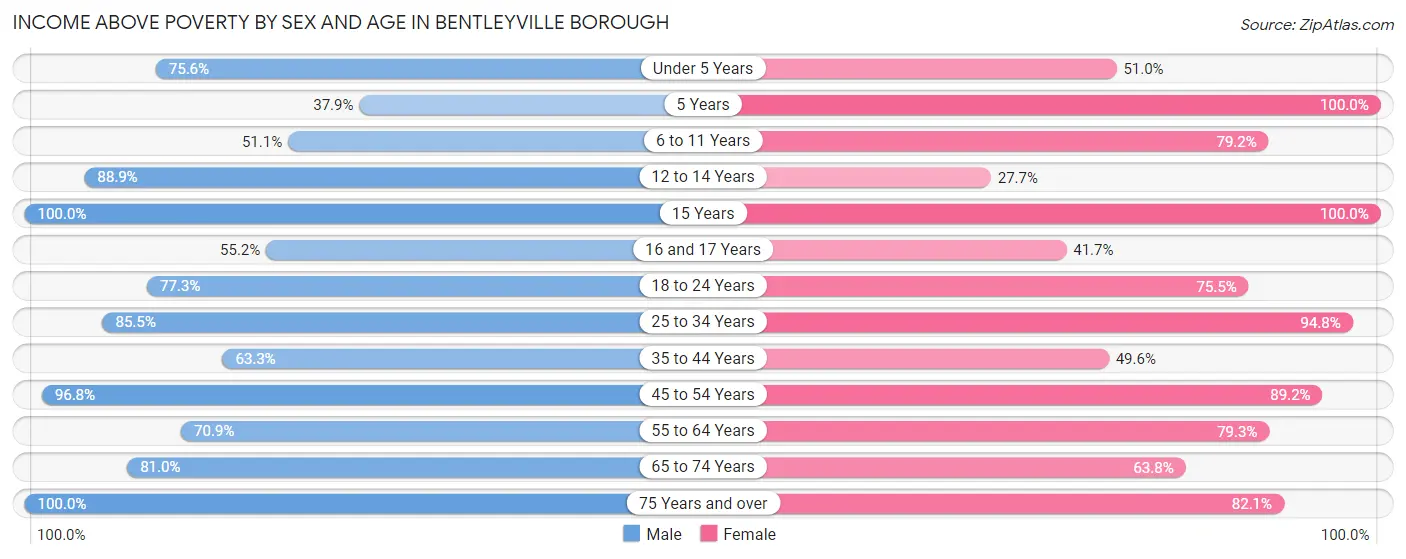
| Age Bracket | Male | Female |
| Under 5 Years | 90 (75.6%) | 52 (51.0%) |
| 5 Years | 25 (37.9%) | 7 (100.0%) |
| 6 to 11 Years | 23 (51.1%) | 80 (79.2%) |
| 12 to 14 Years | 56 (88.9%) | 13 (27.7%) |
| 15 Years | 24 (100.0%) | 6 (100.0%) |
| 16 and 17 Years | 16 (55.2%) | 10 (41.7%) |
| 18 to 24 Years | 51 (77.3%) | 111 (75.5%) |
| 25 to 34 Years | 124 (85.5%) | 128 (94.8%) |
| 35 to 44 Years | 93 (63.3%) | 55 (49.5%) |
| 45 to 54 Years | 151 (96.8%) | 157 (89.2%) |
| 55 to 64 Years | 83 (70.9%) | 119 (79.3%) |
| 65 to 74 Years | 85 (80.9%) | 111 (63.8%) |
| 75 Years and over | 19 (100.0%) | 96 (82.1%) |
| Total | 840 (76.3%) | 945 (72.9%) |
Income Below Poverty Among Married-Couple Families in Bentleyville borough
The poverty statistics for married-couple families in Bentleyville borough show that 4.0% or 12 of the total 303 families live below the poverty line. Families with 3 or 4 children have the highest poverty rate of 6.2%, comprising of 3 families. On the other hand, families with 1 or 2 children have the lowest poverty rate of 0.0%, which includes 0 families.
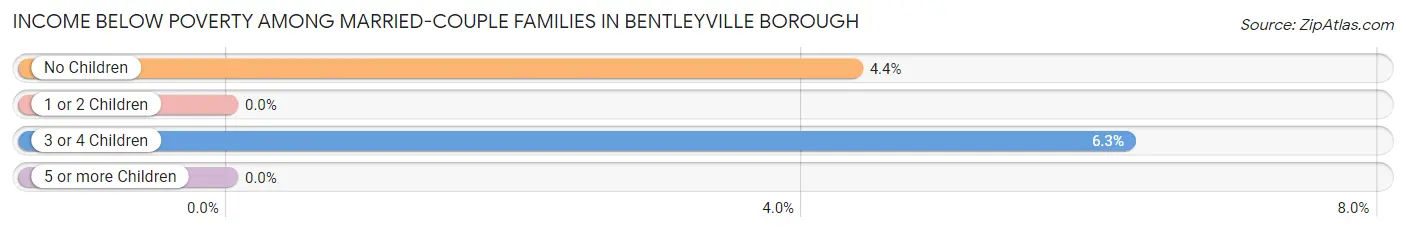
| Children | Above Poverty | Below Poverty |
| No Children | 198 (95.7%) | 9 (4.3%) |
| 1 or 2 Children | 48 (100.0%) | 0 (0.0%) |
| 3 or 4 Children | 45 (93.8%) | 3 (6.2%) |
| 5 or more Children | 0 (0.0%) | 0 (0.0%) |
| Total | 291 (96.0%) | 12 (4.0%) |
Income Below Poverty Among Single-Parent Households in Bentleyville borough
According to the poverty data in Bentleyville borough, 54.5% or 54 single-father households and 39.0% or 73 single-mother households are living below the poverty line. Among single-father households, those with 3 or 4 children have the highest poverty rate, with 21 households (100.0%) experiencing poverty. Likewise, among single-mother households, those with 1 or 2 children have the highest poverty rate, with 73 households (58.4%) falling below the poverty line.
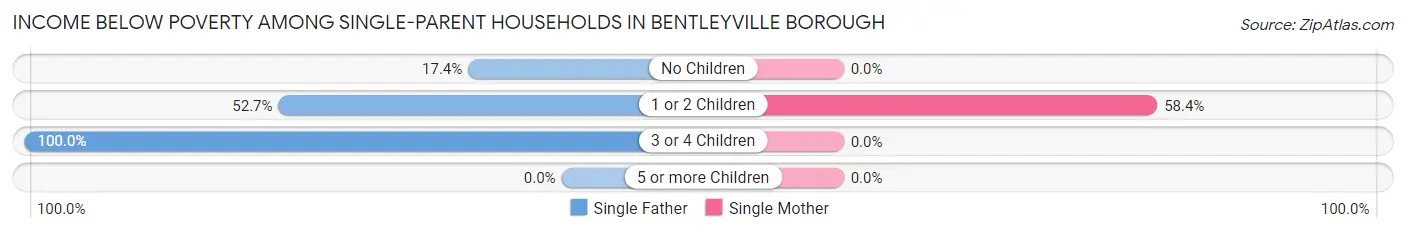
| Children | Single Father | Single Mother |
| No Children | 4 (17.4%) | 0 (0.0%) |
| 1 or 2 Children | 29 (52.7%) | 73 (58.4%) |
| 3 or 4 Children | 21 (100.0%) | 0 (0.0%) |
| 5 or more Children | 0 (0.0%) | 0 (0.0%) |
| Total | 54 (54.5%) | 73 (39.0%) |
Income Below Poverty Among Married-Couple vs Single-Parent Households in Bentleyville borough
The poverty data for Bentleyville borough shows that 12 of the married-couple family households (4.0%) and 127 of the single-parent households (44.4%) are living below the poverty level. Within the married-couple family households, those with 3 or 4 children have the highest poverty rate, with 3 households (6.2%) falling below the poverty line. Among the single-parent households, those with 3 or 4 children have the highest poverty rate, with 21 household (100.0%) living below poverty.
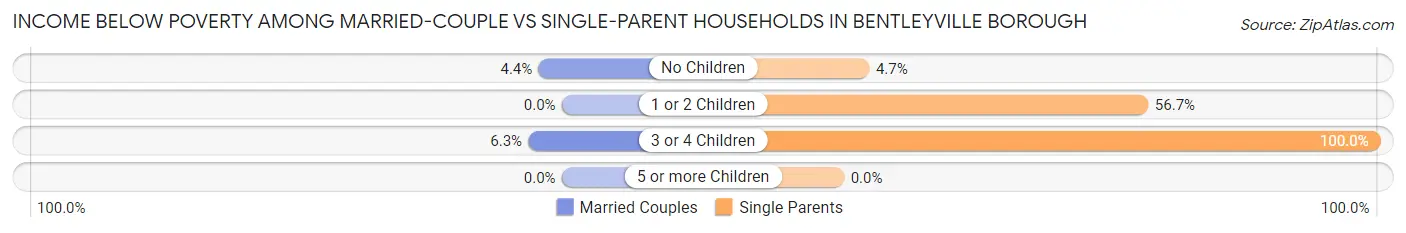
| Children | Married-Couple Families | Single-Parent Households |
| No Children | 9 (4.3%) | 4 (4.7%) |
| 1 or 2 Children | 0 (0.0%) | 102 (56.7%) |
| 3 or 4 Children | 3 (6.2%) | 21 (100.0%) |
| 5 or more Children | 0 (0.0%) | 0 (0.0%) |
| Total | 12 (4.0%) | 127 (44.4%) |
Race in Bentleyville borough
The most populous races in Bentleyville borough are White / Caucasian (2,136 | 88.7%), Two or more Races (136 | 5.7%), and Hispanic or Latino (87 | 3.6%).
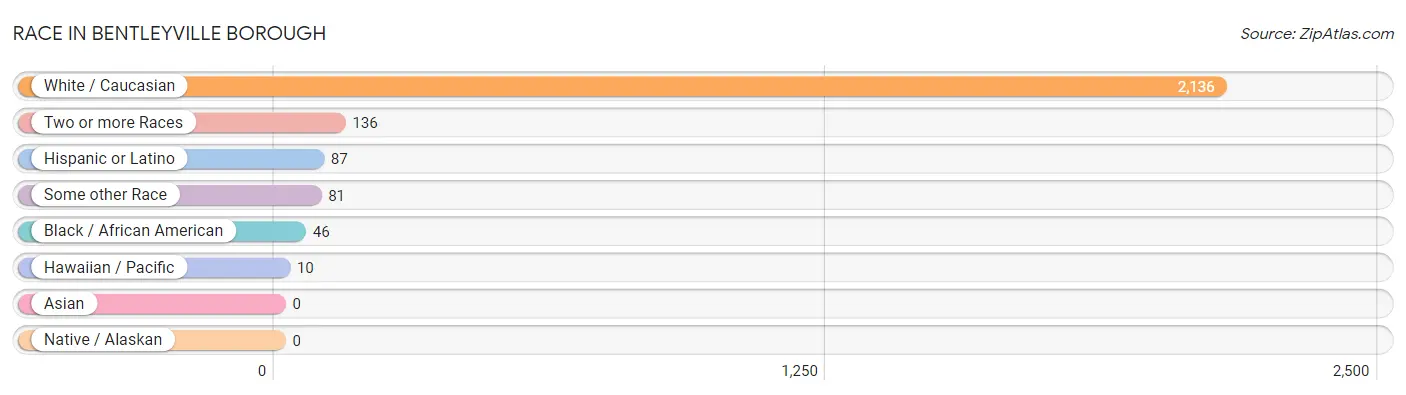
| Race | # Population | % Population |
| Asian | 0 | 0.0% |
| Black / African American | 46 | 1.9% |
| Hawaiian / Pacific | 10 | 0.4% |
| Hispanic or Latino | 87 | 3.6% |
| Native / Alaskan | 0 | 0.0% |
| White / Caucasian | 2,136 | 88.7% |
| Two or more Races | 136 | 5.7% |
| Some other Race | 81 | 3.4% |
| Total | 2,409 | 100.0% |
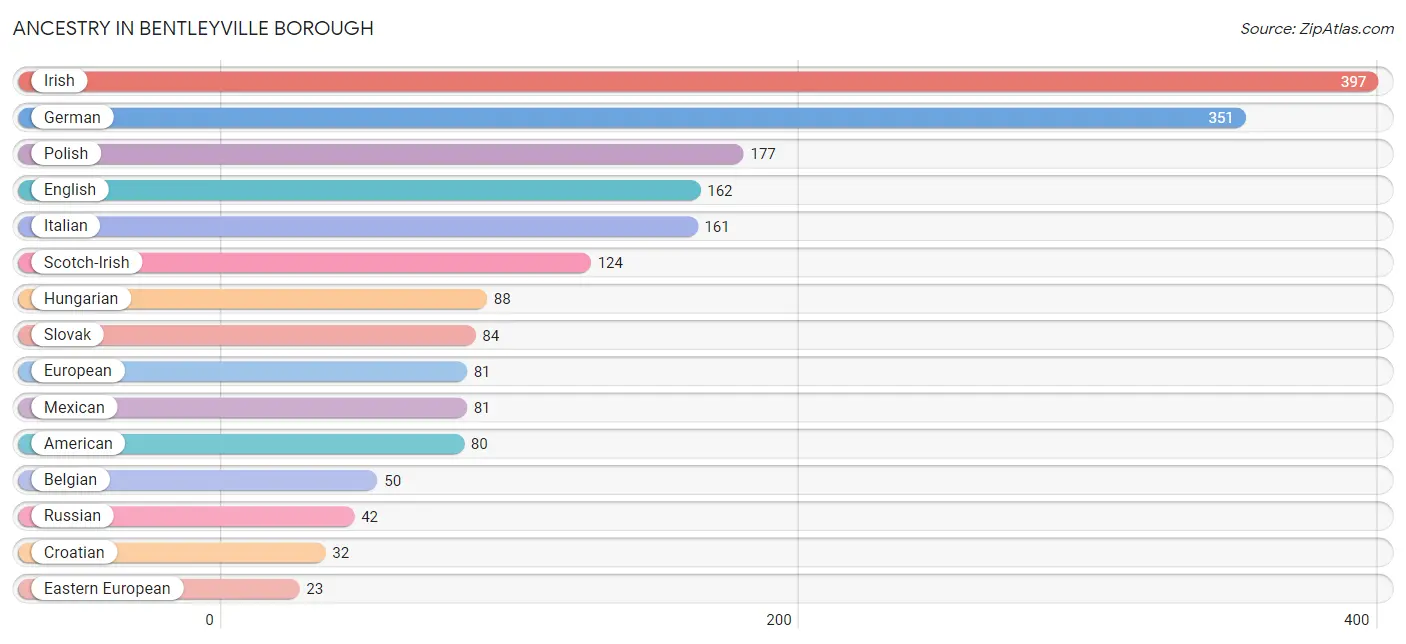
Ancestry in Bentleyville borough
The most populous ancestries reported in Bentleyville borough are Irish (397 | 16.5%), German (351 | 14.6%), Polish (177 | 7.3%), English (162 | 6.7%), and Italian (161 | 6.7%), together accounting for 51.8% of all Bentleyville borough residents.
| Ancestry | # Population | % Population |
| African | 16 | 0.7% |
| American | 80 | 3.3% |
| Belgian | 50 | 2.1% |
| Blackfeet | 1 | 0.0% |
| Burmese | 22 | 0.9% |
| Cherokee | 2 | 0.1% |
| Croatian | 32 | 1.3% |
| Czech | 20 | 0.8% |
| Czechoslovakian | 3 | 0.1% |
| Delaware | 1 | 0.0% |
| Dutch | 1 | 0.0% |
| Eastern European | 23 | 0.9% |
| English | 162 | 6.7% |
| European | 81 | 3.4% |
| French | 12 | 0.5% |
| German | 351 | 14.6% |
| Greek | 10 | 0.4% |
| Guamanian / Chamorro | 10 | 0.4% |
| Hungarian | 88 | 3.6% |
| Irish | 397 | 16.5% |
| Italian | 161 | 6.7% |
| Lithuanian | 2 | 0.1% |
| Mexican | 81 | 3.4% |
| Norwegian | 5 | 0.2% |
| Pennsylvania German | 15 | 0.6% |
| Polish | 177 | 7.3% |
| Puerto Rican | 6 | 0.3% |
| Romanian | 15 | 0.6% |
| Russian | 42 | 1.7% |
| Samoan | 10 | 0.4% |
| Scotch-Irish | 124 | 5.1% |
| Scottish | 15 | 0.6% |
| Slovak | 84 | 3.5% |
| Slovene | 9 | 0.4% |
| Subsaharan African | 16 | 0.7% |
| Swedish | 11 | 0.5% |
| Swiss | 6 | 0.3% |
| Ukrainian | 15 | 0.6% |
| Welsh | 6 | 0.3% | View All 39 Rows |
Immigrants in Bentleyville borough
The most numerous immigrant groups reported in Bentleyville borough came from Central America (66 | 2.7%), Latin America (66 | 2.7%), Mexico (66 | 2.7%), Asia (5 | 0.2%), and Eastern Asia (5 | 0.2%), together accounting for 8.6% of all Bentleyville borough residents.
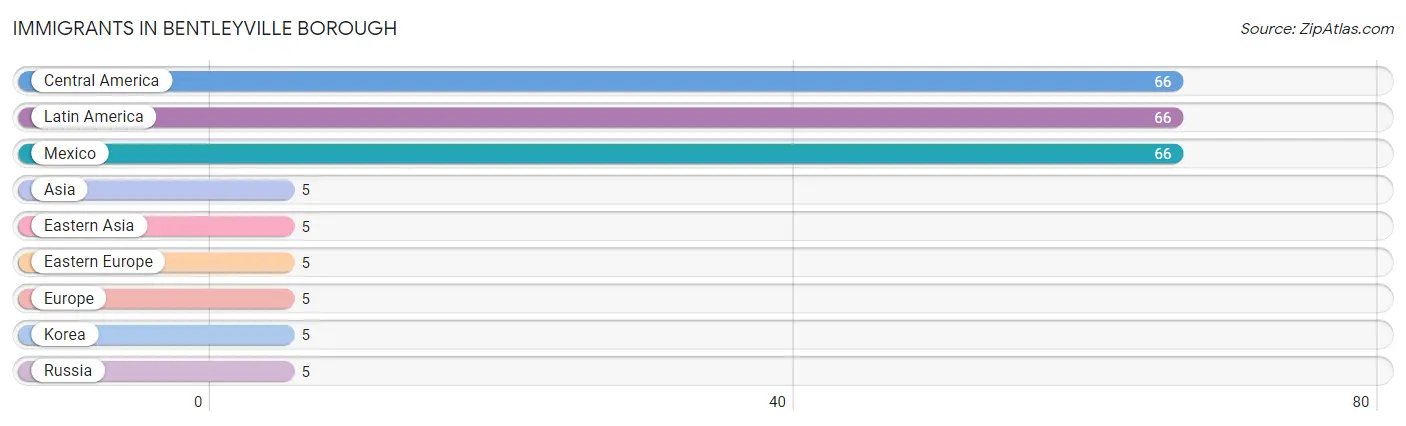
| Immigration Origin | # Population | % Population |
| Asia | 5 | 0.2% |
| Central America | 66 | 2.7% |
| Eastern Asia | 5 | 0.2% |
| Eastern Europe | 5 | 0.2% |
| Europe | 5 | 0.2% |
| Korea | 5 | 0.2% |
| Latin America | 66 | 2.7% |
| Mexico | 66 | 2.7% |
| Russia | 5 | 0.2% | View All 9 Rows |
Sex and Age in Bentleyville borough
Sex and Age in Bentleyville borough
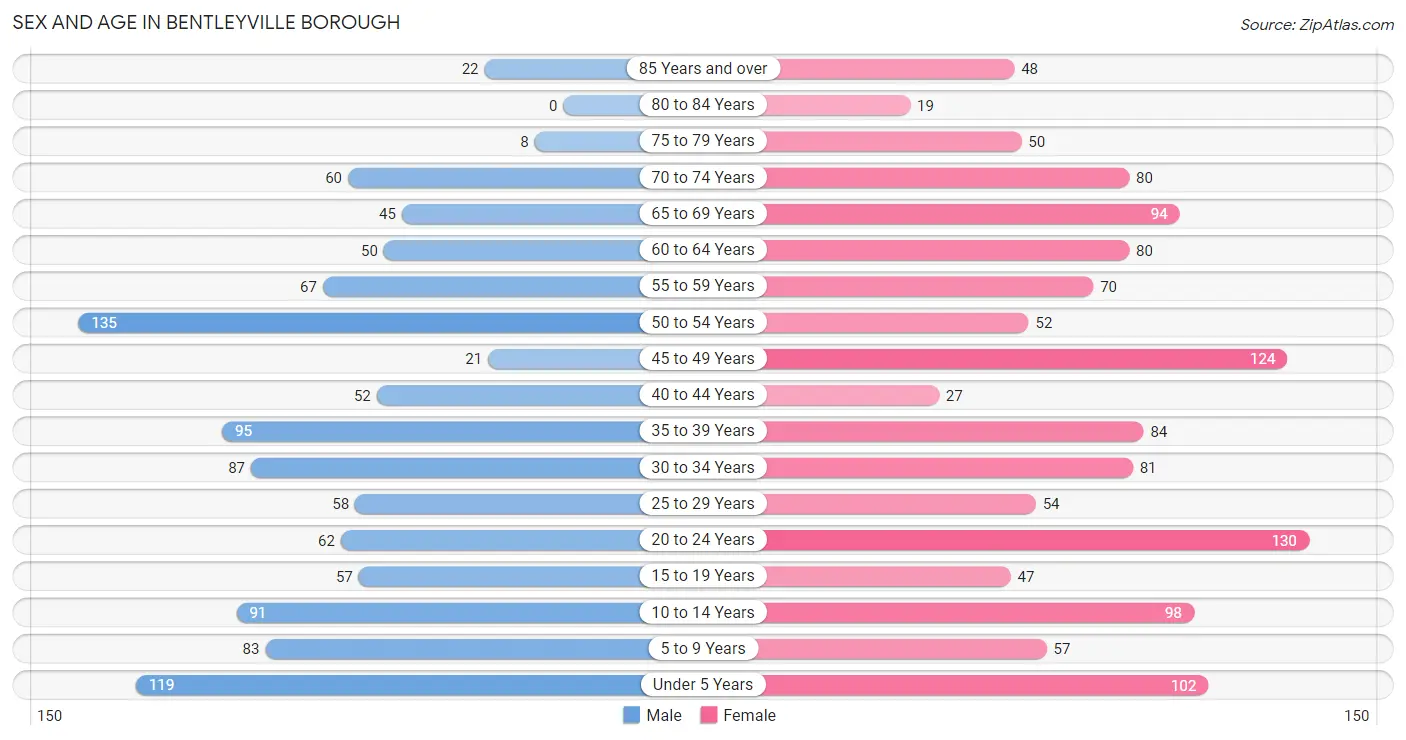
The most populous age groups in Bentleyville borough are 50 to 54 Years (135 | 12.1%) for men and 20 to 24 Years (130 | 10.0%) for women.
| Age Bracket | Male | Female |
| Under 5 Years | 119 (10.7%) | 102 (7.9%) |
| 5 to 9 Years | 83 (7.5%) | 57 (4.4%) |
| 10 to 14 Years | 91 (8.2%) | 98 (7.6%) |
| 15 to 19 Years | 57 (5.1%) | 47 (3.6%) |
| 20 to 24 Years | 62 (5.6%) | 130 (10.0%) |
| 25 to 29 Years | 58 (5.2%) | 54 (4.2%) |
| 30 to 34 Years | 87 (7.8%) | 81 (6.2%) |
| 35 to 39 Years | 95 (8.5%) | 84 (6.5%) |
| 40 to 44 Years | 52 (4.7%) | 27 (2.1%) |
| 45 to 49 Years | 21 (1.9%) | 124 (9.6%) |
| 50 to 54 Years | 135 (12.1%) | 52 (4.0%) |
| 55 to 59 Years | 67 (6.0%) | 70 (5.4%) |
| 60 to 64 Years | 50 (4.5%) | 80 (6.2%) |
| 65 to 69 Years | 45 (4.1%) | 94 (7.2%) |
| 70 to 74 Years | 60 (5.4%) | 80 (6.2%) |
| 75 to 79 Years | 8 (0.7%) | 50 (3.9%) |
| 80 to 84 Years | 0 (0.0%) | 19 (1.5%) |
| 85 Years and over | 22 (2.0%) | 48 (3.7%) |
| Total | 1,112 (100.0%) | 1,297 (100.0%) |
Families and Households in Bentleyville borough
Median Family Size in Bentleyville borough
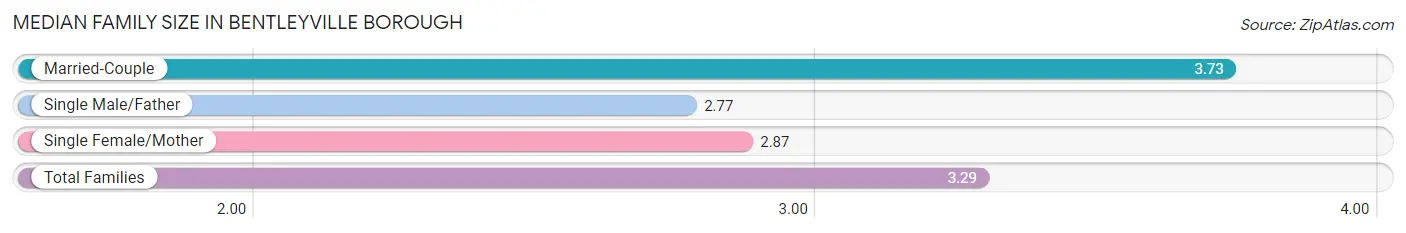
The median family size in Bentleyville borough is 3.29 persons per family, with married-couple families (303 | 51.4%) accounting for the largest median family size of 3.73 persons per family. On the other hand, single male/father families (99 | 16.8%) represent the smallest median family size with 2.77 persons per family.
| Family Type | # Families | Family Size |
| Married-Couple | 303 (51.4%) | 3.73 |
| Single Male/Father | 99 (16.8%) | 2.77 |
| Single Female/Mother | 187 (31.8%) | 2.87 |
| Total Families | 589 (100.0%) | 3.29 |
Median Household Size in Bentleyville borough
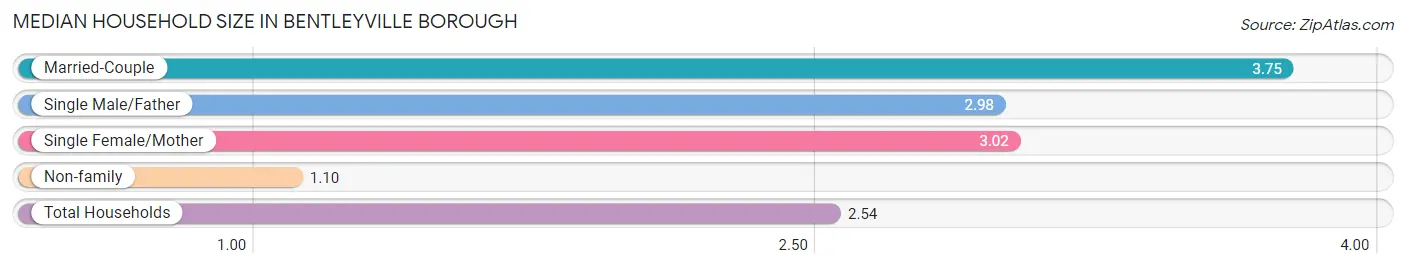
The median household size in Bentleyville borough is 2.54 persons per household, with married-couple households (303 | 32.3%) accounting for the largest median household size of 3.75 persons per household. non-family households (349 | 37.2%) represent the smallest median household size with 1.10 persons per household.
| Household Type | # Households | Household Size |
| Married-Couple | 303 (32.3%) | 3.75 |
| Single Male/Father | 99 (10.5%) | 2.98 |
| Single Female/Mother | 187 (19.9%) | 3.02 |
| Non-family | 349 (37.2%) | 1.10 |
| Total Households | 938 (100.0%) | 2.54 |
Household Size by Marriage Status in Bentleyville borough
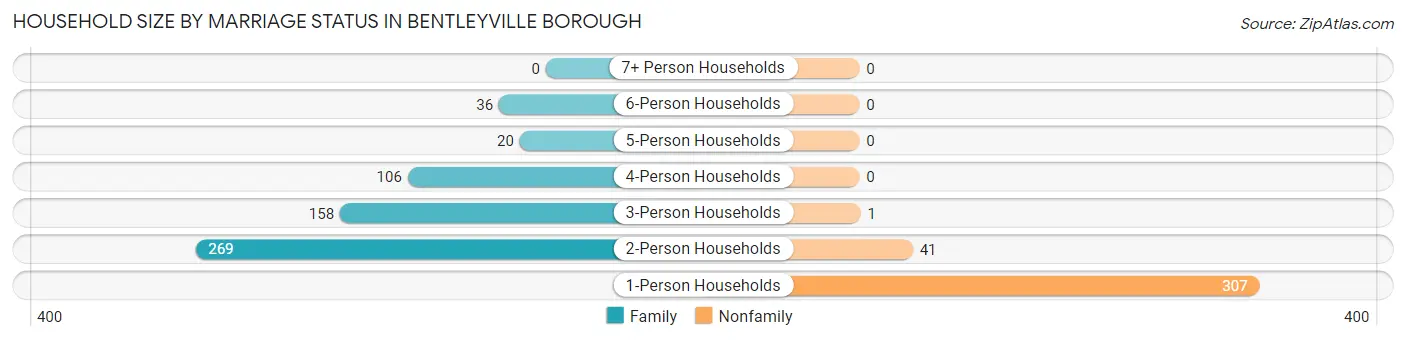
Out of a total of 938 households in Bentleyville borough, 589 (62.8%) are family households, while 349 (37.2%) are nonfamily households. The most numerous type of family households are 2-person households, comprising 269, and the most common type of nonfamily households are 1-person households, comprising 307.
| Household Size | Family Households | Nonfamily Households |
| 1-Person Households | - | 307 (32.7%) |
| 2-Person Households | 269 (28.7%) | 41 (4.4%) |
| 3-Person Households | 158 (16.8%) | 1 (0.1%) |
| 4-Person Households | 106 (11.3%) | 0 (0.0%) |
| 5-Person Households | 20 (2.1%) | 0 (0.0%) |
| 6-Person Households | 36 (3.8%) | 0 (0.0%) |
| 7+ Person Households | 0 (0.0%) | 0 (0.0%) |
| Total | 589 (62.8%) | 349 (37.2%) |
Female Fertility in Bentleyville borough
Fertility by Age in Bentleyville borough
Average fertility rate in Bentleyville borough is 3.0 births per 1,000 women. Women in the age bracket of 35 to 50 years have the highest fertility rate with 8.0 births per 1,000 women. Women in the age bracket of 35 to 50 years acount for 100.0% of all women with births.
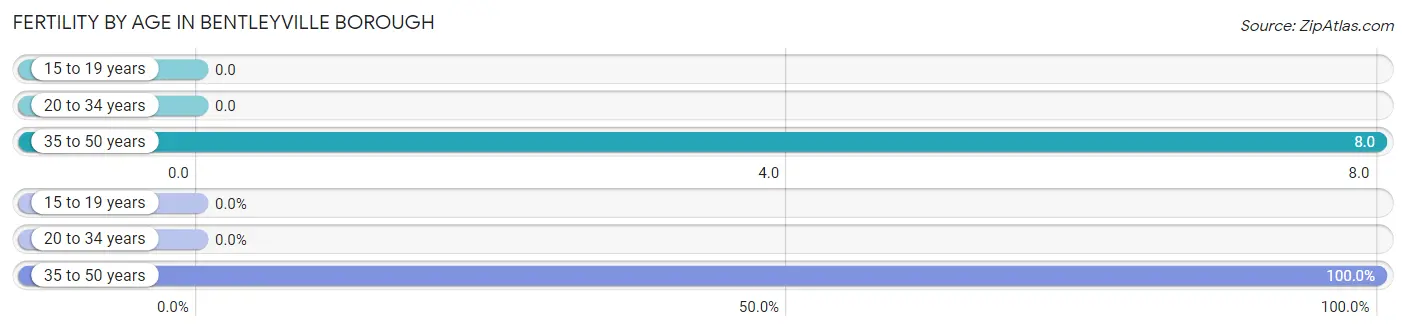
| Age Bracket | Women with Births | Births / 1,000 Women |
| 15 to 19 years | 0 (0.0%) | 0.0 |
| 20 to 34 years | 0 (0.0%) | 0.0 |
| 35 to 50 years | 2 (100.0%) | 8.0 |
| Total | 2 (100.0%) | 3.0 |
Fertility by Age by Marriage Status in Bentleyville borough
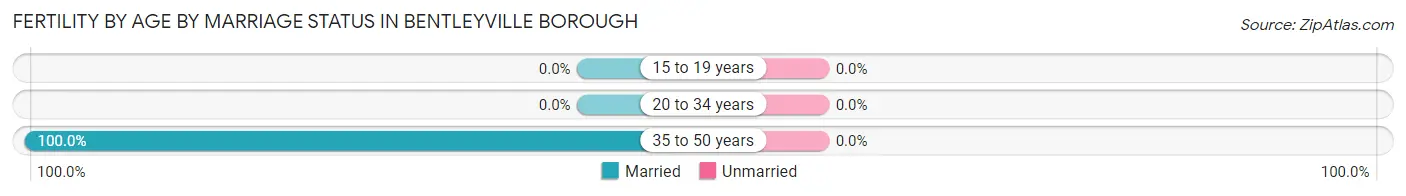
| Age Bracket | Married | Unmarried |
| 15 to 19 years | 0 (0.0%) | 0 (0.0%) |
| 20 to 34 years | 0 (0.0%) | 0 (0.0%) |
| 35 to 50 years | 2 (100.0%) | 0 (0.0%) |
| Total | 2 (100.0%) | 0 (0.0%) |
Fertility by Education in Bentleyville borough
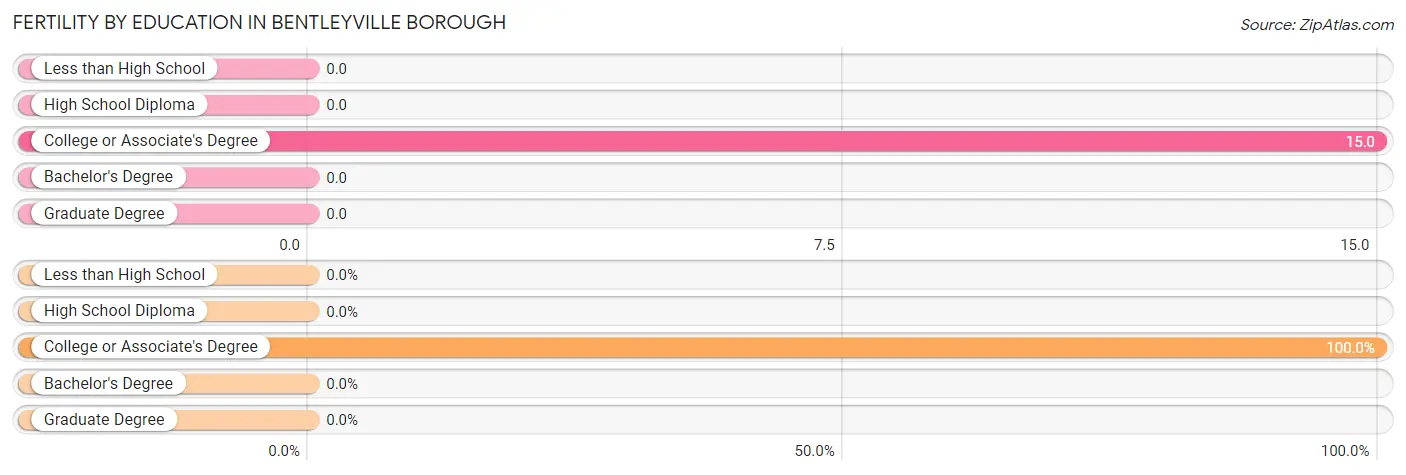
| Educational Attainment | Women with Births | Births / 1,000 Women |
| Less than High School | 0 (0.0%) | 0.0 |
| High School Diploma | 0 (0.0%) | 0.0 |
| College or Associate's Degree | 2 (100.0%) | 15.0 |
| Bachelor's Degree | 0 (0.0%) | 0.0 |
| Graduate Degree | 0 (0.0%) | 0.0 |
| Total | 2 (100.0%) | 3.0 |
Fertility by Education by Marriage Status in Bentleyville borough
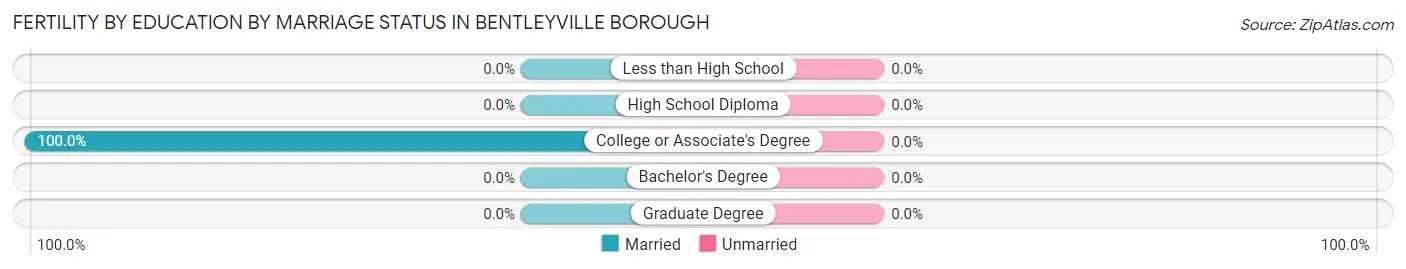
| Educational Attainment | Married | Unmarried |
| Less than High School | 0 (0.0%) | 0 (0.0%) |
| High School Diploma | 0 (0.0%) | 0 (0.0%) |
| College or Associate's Degree | 2 (100.0%) | 0 (0.0%) |
| Bachelor's Degree | 0 (0.0%) | 0 (0.0%) |
| Graduate Degree | 0 (0.0%) | 0 (0.0%) |
| Total | 2 (100.0%) | 0 (0.0%) |
Employment Characteristics in Bentleyville borough
Employment by Class of Employer in Bentleyville borough
Among the 831 employed individuals in Bentleyville borough, private company employees (595 | 71.6%), not-for-profit organizations (90 | 10.8%), and local government employees (54 | 6.5%) make up the most common classes of employment.
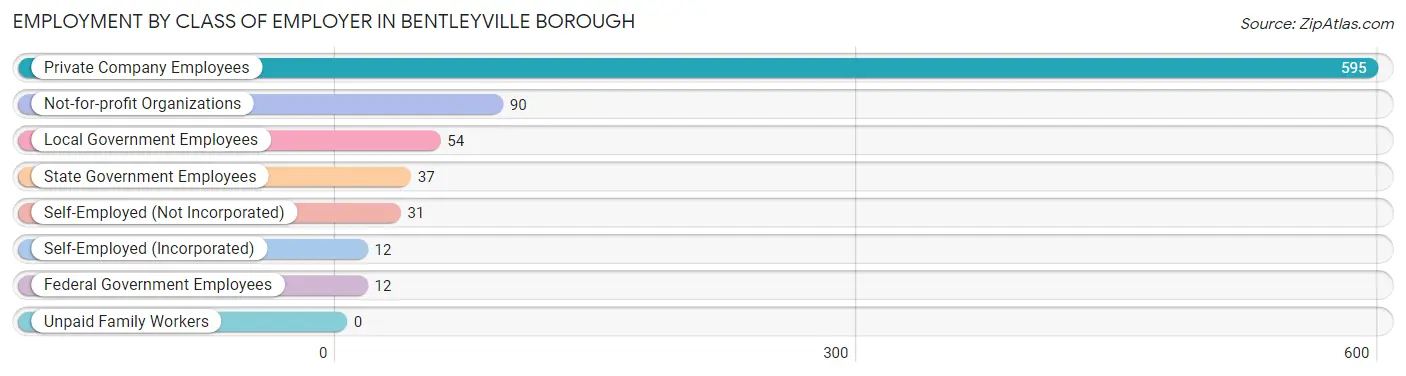
| Employer Class | # Employees | % Employees |
| Private Company Employees | 595 | 71.6% |
| Self-Employed (Incorporated) | 12 | 1.4% |
| Self-Employed (Not Incorporated) | 31 | 3.7% |
| Not-for-profit Organizations | 90 | 10.8% |
| Local Government Employees | 54 | 6.5% |
| State Government Employees | 37 | 4.4% |
| Federal Government Employees | 12 | 1.4% |
| Unpaid Family Workers | 0 | 0.0% |
| Total | 831 | 100.0% |
Employment Status by Age in Bentleyville borough
According to the labor force statistics for Bentleyville borough, out of the total population over 16 years of age (1,829), 52.3% or 957 individuals are in the labor force, with 4.8% or 46 of them unemployed. The age group with the highest labor force participation rate is 20 to 24 years, with 78.1% or 150 individuals in the labor force. Within the labor force, the 16 to 19 years age range has the highest percentage of unemployed individuals, with 23.8% or 5 of them being unemployed.
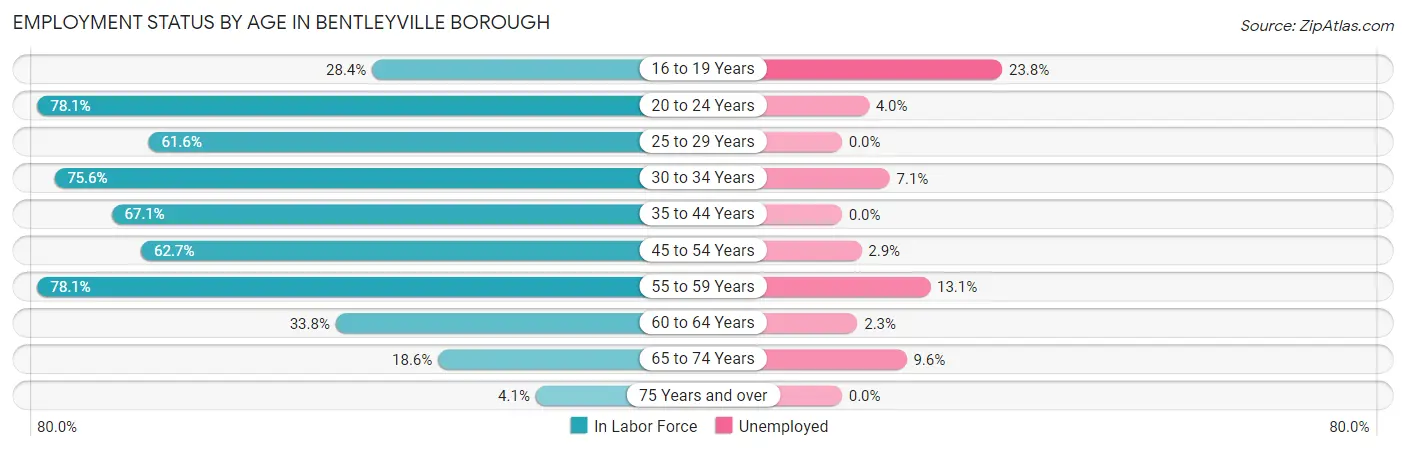
| Age Bracket | In Labor Force | Unemployed |
| 16 to 19 Years | 21 (28.4%) | 5 (23.8%) |
| 20 to 24 Years | 150 (78.1%) | 6 (4.0%) |
| 25 to 29 Years | 69 (61.6%) | 0 (0.0%) |
| 30 to 34 Years | 127 (75.6%) | 9 (7.1%) |
| 35 to 44 Years | 173 (67.1%) | 0 (0.0%) |
| 45 to 54 Years | 208 (62.7%) | 6 (2.9%) |
| 55 to 59 Years | 107 (78.1%) | 14 (13.1%) |
| 60 to 64 Years | 44 (33.8%) | 1 (2.3%) |
| 65 to 74 Years | 52 (18.6%) | 5 (9.6%) |
| 75 Years and over | 6 (4.1%) | 0 (0.0%) |
| Total | 957 (52.3%) | 46 (4.8%) |
Employment Status by Educational Attainment in Bentleyville borough
According to labor force statistics for Bentleyville borough, 64.0% of individuals (728) out of the total population between 25 and 64 years of age (1,137) are in the labor force, with 4.1% or 30 of them being unemployed. The group with the highest labor force participation rate are those with the educational attainment of bachelor's degree or higher, with 87.1% or 183 individuals in the labor force. Within the labor force, individuals with college / associate degree education have the highest percentage of unemployment, with 8.2% or 23 of them being unemployed.
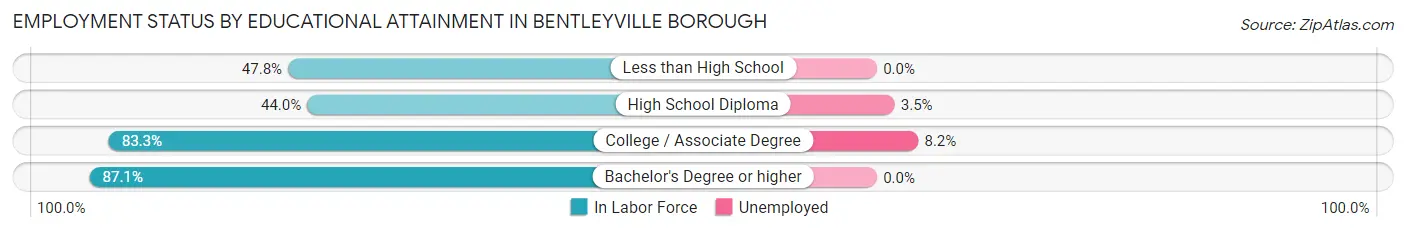
| Educational Attainment | In Labor Force | Unemployed |
| Less than High School | 65 (47.8%) | 0 (0.0%) |
| High School Diploma | 200 (44.0%) | 16 (3.5%) |
| College / Associate Degree | 280 (83.3%) | 28 (8.2%) |
| Bachelor's Degree or higher | 183 (87.1%) | 0 (0.0%) |
| Total | 728 (64.0%) | 47 (4.1%) |
Employment Occupations by Sex in Bentleyville borough
Management, Business, Science and Arts Occupations
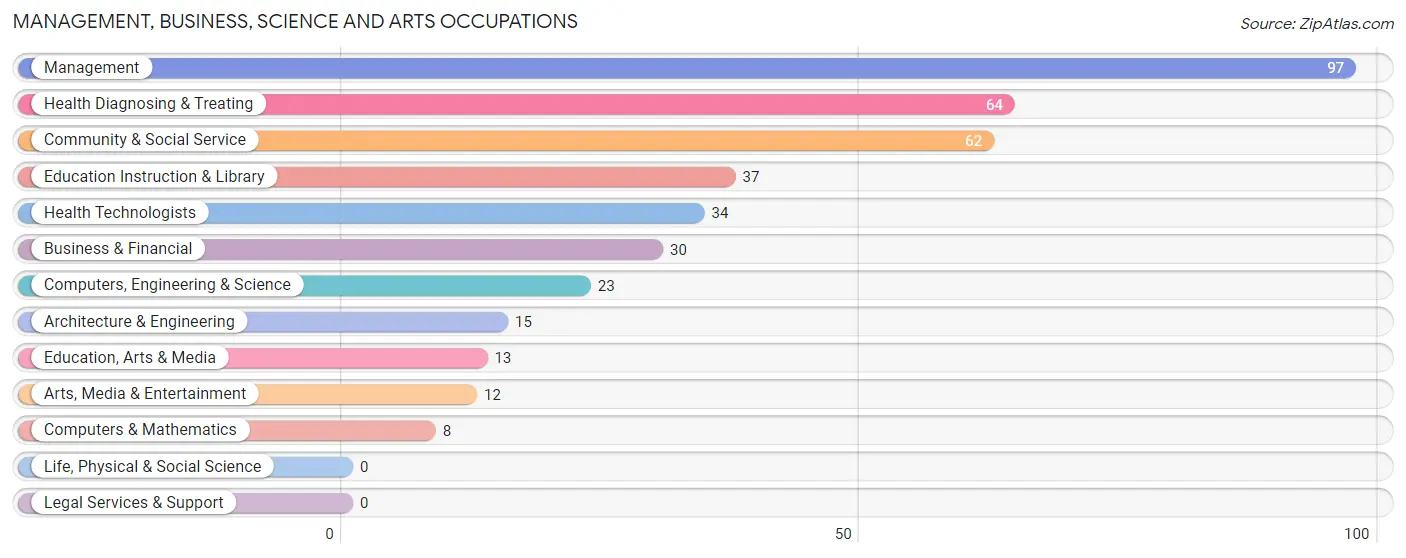
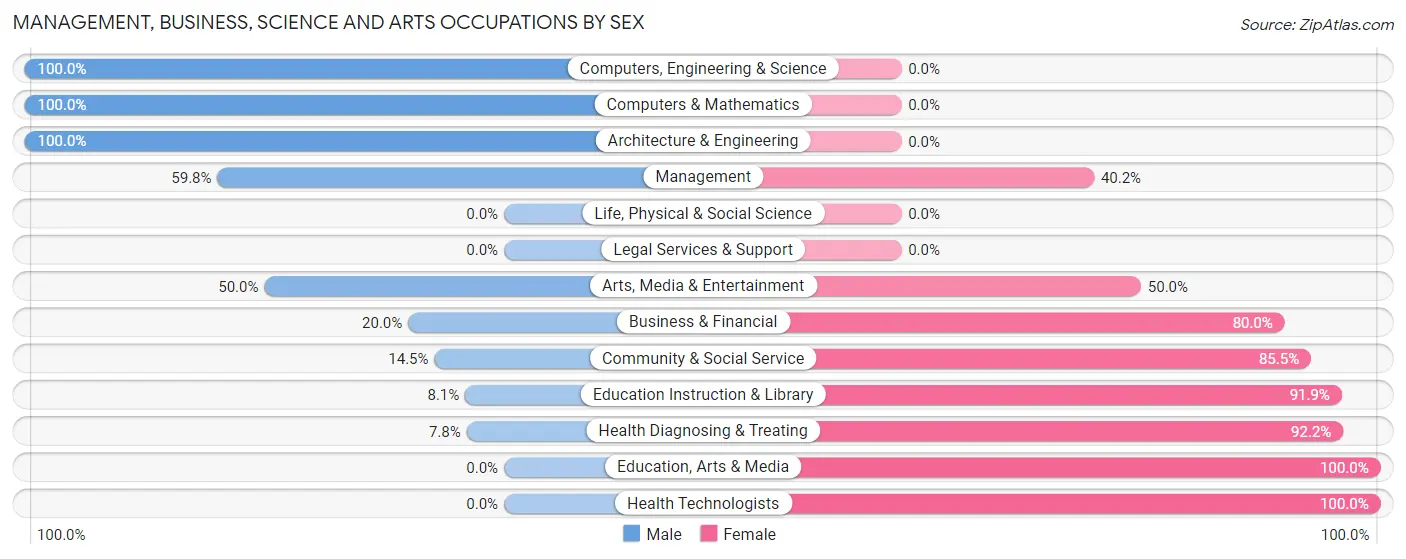
The most common Management, Business, Science and Arts occupations in Bentleyville borough are Management (97 | 10.6%), Health Diagnosing & Treating (64 | 7.0%), Community & Social Service (62 | 6.8%), Education Instruction & Library (37 | 4.1%), and Health Technologists (34 | 3.7%).
Management, Business, Science and Arts Occupations by Sex
Within the Management, Business, Science and Arts occupations in Bentleyville borough, the most male-oriented occupations are Computers, Engineering & Science (100.0%), Computers & Mathematics (100.0%), and Architecture & Engineering (100.0%), while the most female-oriented occupations are Education, Arts & Media (100.0%), Health Technologists (100.0%), and Health Diagnosing & Treating (92.2%).
| Occupation | Male | Female |
| Management | 58 (59.8%) | 39 (40.2%) |
| Business & Financial | 6 (20.0%) | 24 (80.0%) |
| Computers, Engineering & Science | 23 (100.0%) | 0 (0.0%) |
| Computers & Mathematics | 8 (100.0%) | 0 (0.0%) |
| Architecture & Engineering | 15 (100.0%) | 0 (0.0%) |
| Life, Physical & Social Science | 0 (0.0%) | 0 (0.0%) |
| Community & Social Service | 9 (14.5%) | 53 (85.5%) |
| Education, Arts & Media | 0 (0.0%) | 13 (100.0%) |
| Legal Services & Support | 0 (0.0%) | 0 (0.0%) |
| Education Instruction & Library | 3 (8.1%) | 34 (91.9%) |
| Arts, Media & Entertainment | 6 (50.0%) | 6 (50.0%) |
| Health Diagnosing & Treating | 5 (7.8%) | 59 (92.2%) |
| Health Technologists | 0 (0.0%) | 34 (100.0%) |
| Total (Category) | 101 (36.6%) | 175 (63.4%) |
| Total (Overall) | 412 (45.2%) | 499 (54.8%) |
Services Occupations
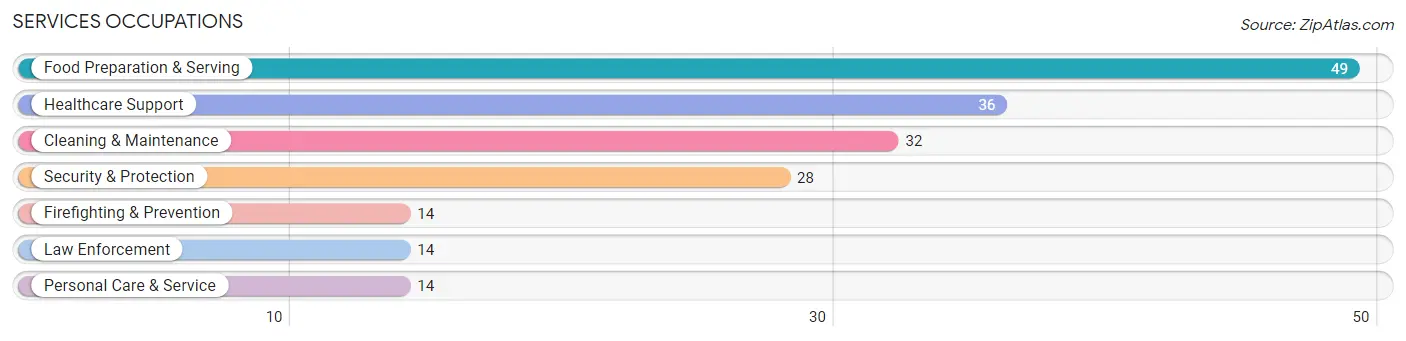
The most common Services occupations in Bentleyville borough are Food Preparation & Serving (49 | 5.4%), Healthcare Support (36 | 4.0%), Cleaning & Maintenance (32 | 3.5%), Security & Protection (28 | 3.1%), and Firefighting & Prevention (14 | 1.5%).
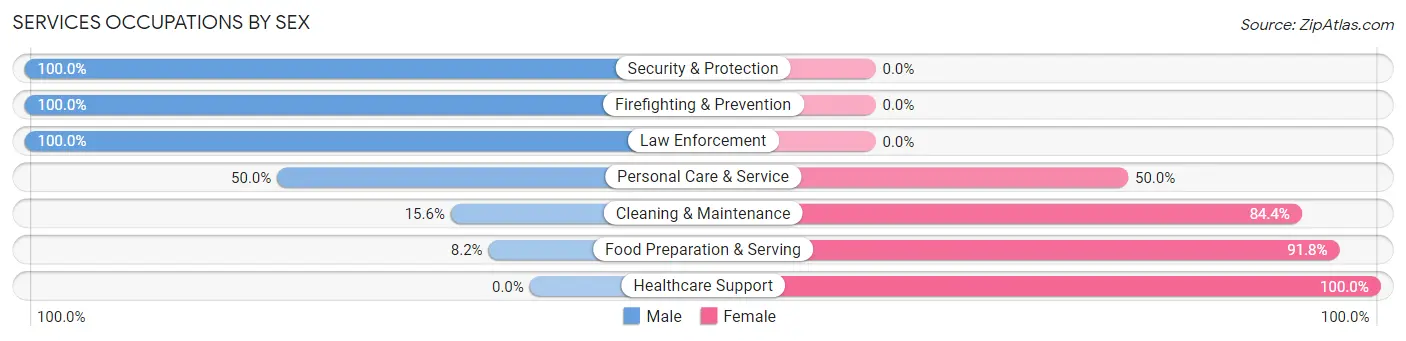
Services Occupations by Sex
Within the Services occupations in Bentleyville borough, the most male-oriented occupations are Security & Protection (100.0%), Firefighting & Prevention (100.0%), and Law Enforcement (100.0%), while the most female-oriented occupations are Healthcare Support (100.0%), Food Preparation & Serving (91.8%), and Cleaning & Maintenance (84.4%).
| Occupation | Male | Female |
| Healthcare Support | 0 (0.0%) | 36 (100.0%) |
| Security & Protection | 28 (100.0%) | 0 (0.0%) |
| Firefighting & Prevention | 14 (100.0%) | 0 (0.0%) |
| Law Enforcement | 14 (100.0%) | 0 (0.0%) |
| Food Preparation & Serving | 4 (8.2%) | 45 (91.8%) |
| Cleaning & Maintenance | 5 (15.6%) | 27 (84.4%) |
| Personal Care & Service | 7 (50.0%) | 7 (50.0%) |
| Total (Category) | 44 (27.7%) | 115 (72.3%) |
| Total (Overall) | 412 (45.2%) | 499 (54.8%) |
Sales and Office Occupations
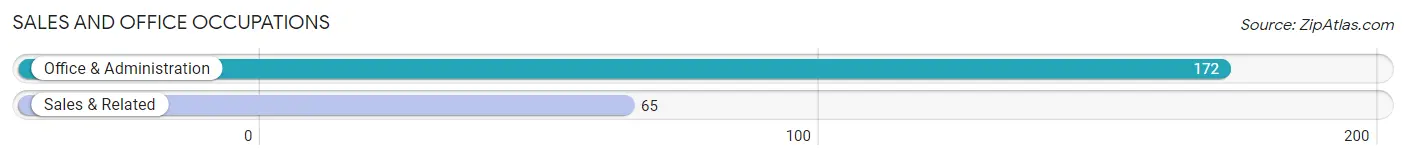
The most common Sales and Office occupations in Bentleyville borough are Office & Administration (172 | 18.9%), and Sales & Related (65 | 7.1%).
Sales and Office Occupations by Sex
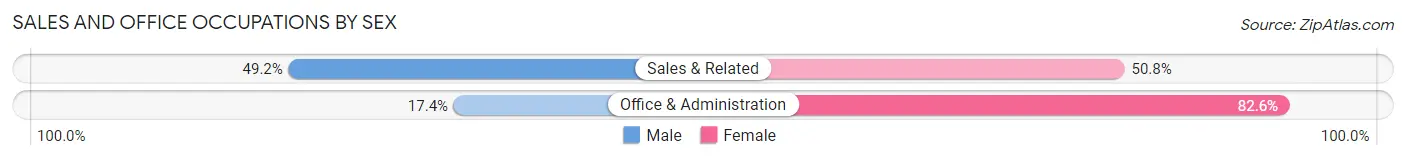
| Occupation | Male | Female |
| Sales & Related | 32 (49.2%) | 33 (50.8%) |
| Office & Administration | 30 (17.4%) | 142 (82.6%) |
| Total (Category) | 62 (26.2%) | 175 (73.8%) |
| Total (Overall) | 412 (45.2%) | 499 (54.8%) |
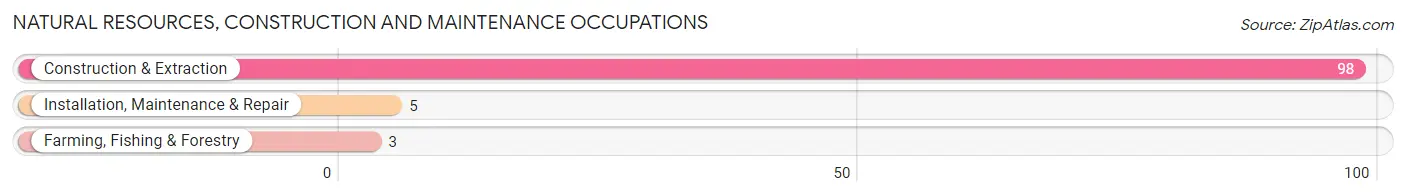
Natural Resources, Construction and Maintenance Occupations
The most common Natural Resources, Construction and Maintenance occupations in Bentleyville borough are Construction & Extraction (98 | 10.8%), Installation, Maintenance & Repair (5 | 0.5%), and Farming, Fishing & Forestry (3 | 0.3%).
Natural Resources, Construction and Maintenance Occupations by Sex
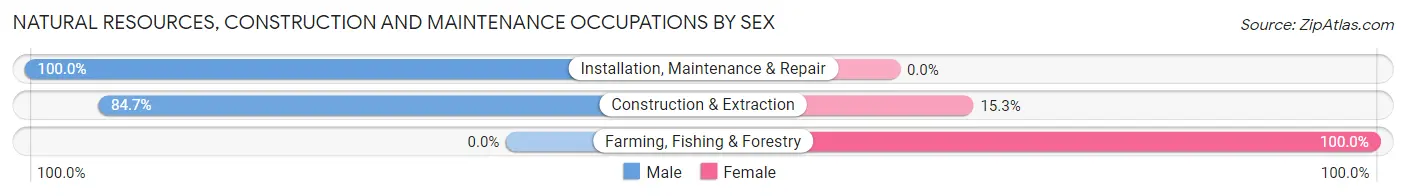
| Occupation | Male | Female |
| Farming, Fishing & Forestry | 0 (0.0%) | 3 (100.0%) |
| Construction & Extraction | 83 (84.7%) | 15 (15.3%) |
| Installation, Maintenance & Repair | 5 (100.0%) | 0 (0.0%) |
| Total (Category) | 88 (83.0%) | 18 (17.0%) |
| Total (Overall) | 412 (45.2%) | 499 (54.8%) |
Production, Transportation and Moving Occupations
The most common Production, Transportation and Moving occupations in Bentleyville borough are Production (81 | 8.9%), Material Moving (48 | 5.3%), and Transportation (4 | 0.4%).
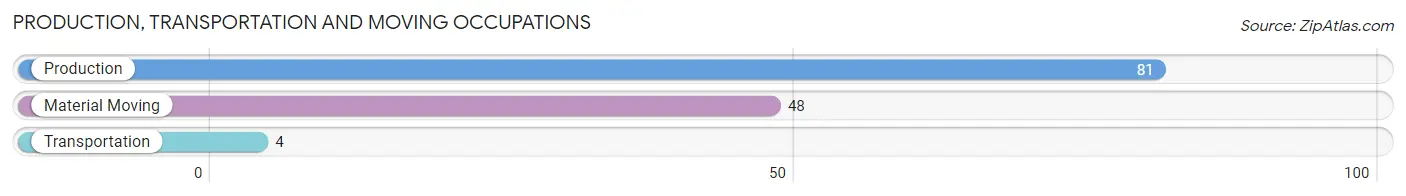
Production, Transportation and Moving Occupations by Sex
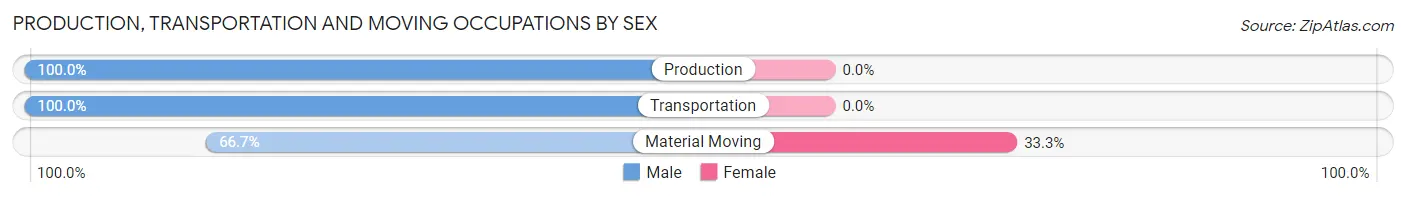
| Occupation | Male | Female |
| Production | 81 (100.0%) | 0 (0.0%) |
| Transportation | 4 (100.0%) | 0 (0.0%) |
| Material Moving | 32 (66.7%) | 16 (33.3%) |
| Total (Category) | 117 (88.0%) | 16 (12.0%) |
| Total (Overall) | 412 (45.2%) | 499 (54.8%) |
Employment Industries by Sex in Bentleyville borough
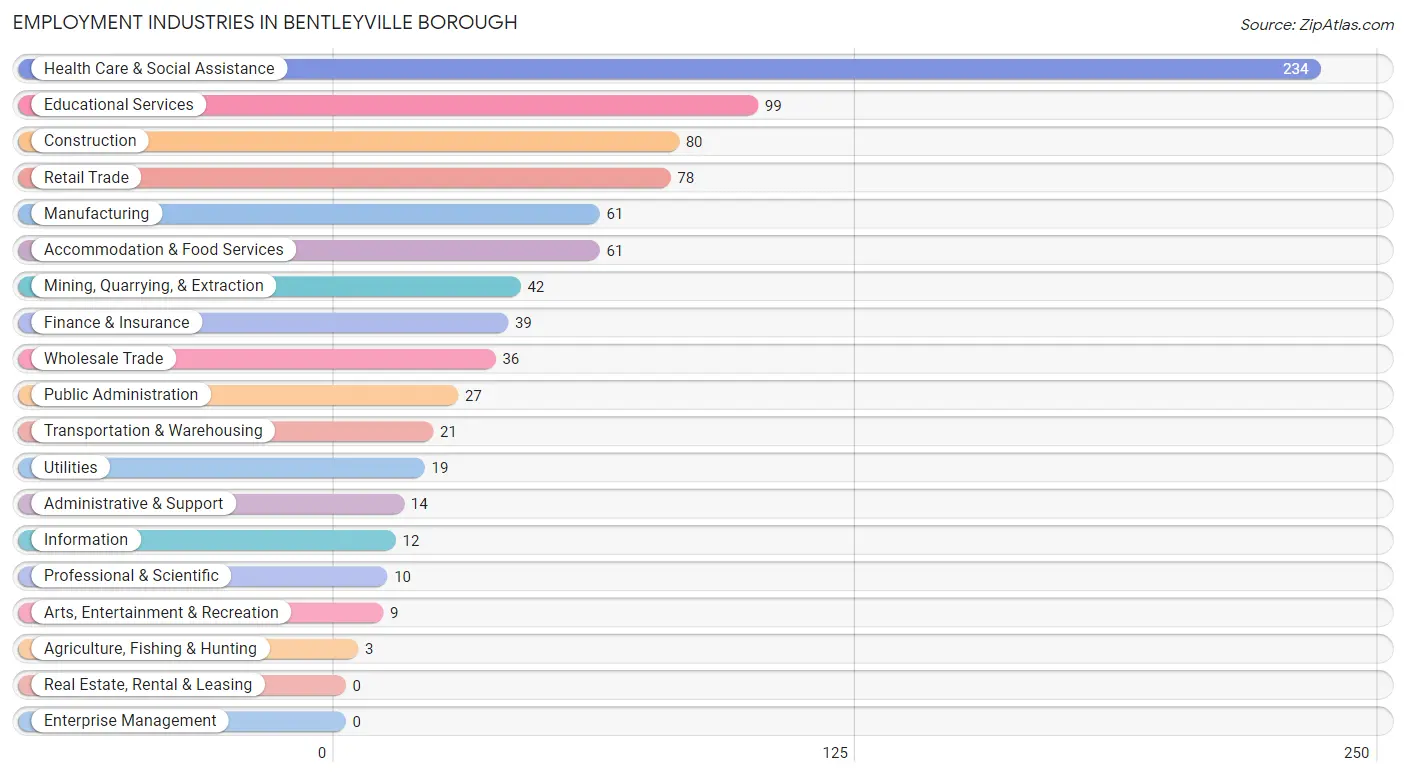
Employment Industries in Bentleyville borough
The major employment industries in Bentleyville borough include Health Care & Social Assistance (234 | 25.7%), Educational Services (99 | 10.9%), Construction (80 | 8.8%), Retail Trade (78 | 8.6%), and Manufacturing (61 | 6.7%).
Employment Industries by Sex in Bentleyville borough
The Bentleyville borough industries that see more men than women are Transportation & Warehousing (100.0%), Utilities (100.0%), and Administrative & Support (100.0%), whereas the industries that tend to have a higher number of women are Agriculture, Fishing & Hunting (100.0%), Information (100.0%), and Professional & Scientific (100.0%).
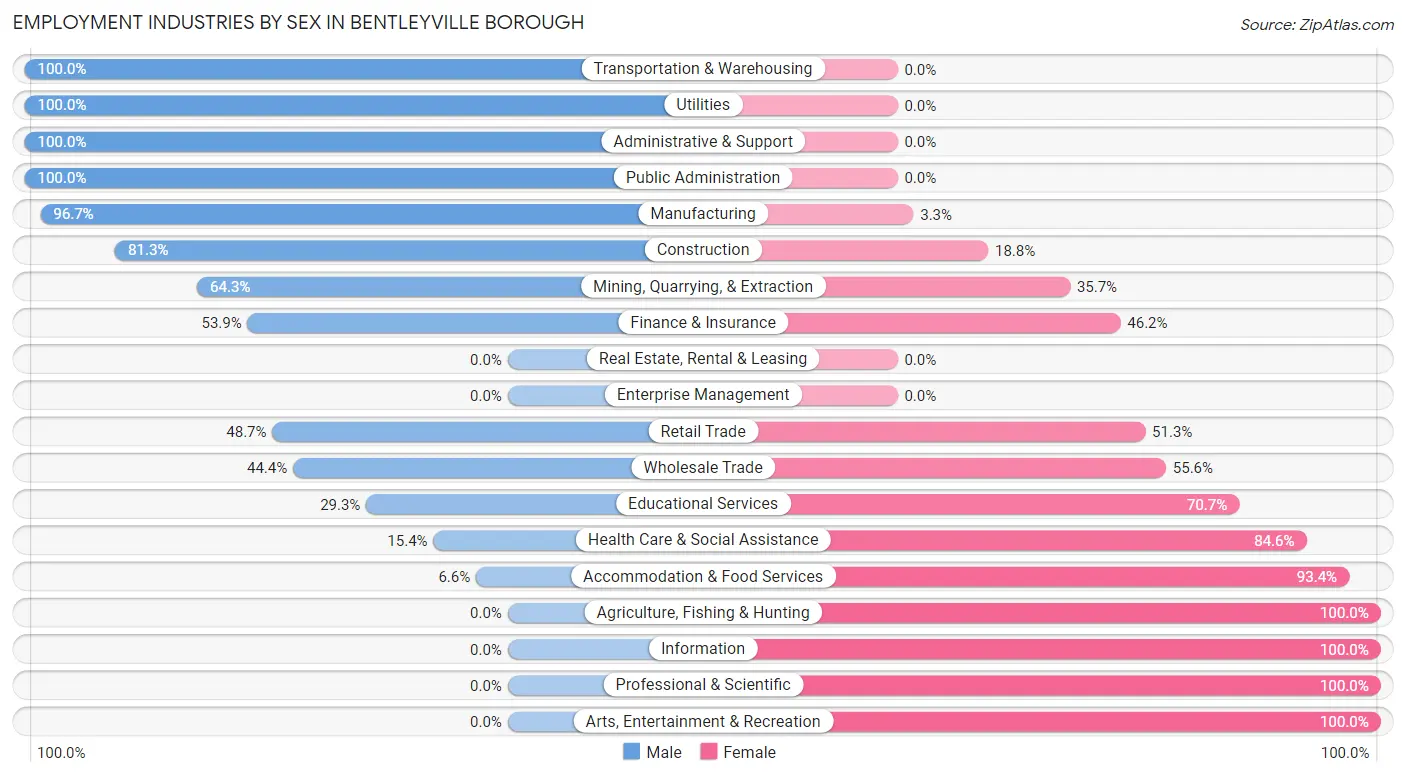
| Industry | Male | Female |
| Agriculture, Fishing & Hunting | 0 (0.0%) | 3 (100.0%) |
| Mining, Quarrying, & Extraction | 27 (64.3%) | 15 (35.7%) |
| Construction | 65 (81.2%) | 15 (18.8%) |
| Manufacturing | 59 (96.7%) | 2 (3.3%) |
| Wholesale Trade | 16 (44.4%) | 20 (55.6%) |
| Retail Trade | 38 (48.7%) | 40 (51.3%) |
| Transportation & Warehousing | 21 (100.0%) | 0 (0.0%) |
| Utilities | 19 (100.0%) | 0 (0.0%) |
| Information | 0 (0.0%) | 12 (100.0%) |
| Finance & Insurance | 21 (53.8%) | 18 (46.2%) |
| Real Estate, Rental & Leasing | 0 (0.0%) | 0 (0.0%) |
| Professional & Scientific | 0 (0.0%) | 10 (100.0%) |
| Enterprise Management | 0 (0.0%) | 0 (0.0%) |
| Administrative & Support | 14 (100.0%) | 0 (0.0%) |
| Educational Services | 29 (29.3%) | 70 (70.7%) |
| Health Care & Social Assistance | 36 (15.4%) | 198 (84.6%) |
| Arts, Entertainment & Recreation | 0 (0.0%) | 9 (100.0%) |
| Accommodation & Food Services | 4 (6.6%) | 57 (93.4%) |
| Public Administration | 27 (100.0%) | 0 (0.0%) |
| Total | 412 (45.2%) | 499 (54.8%) |
Education in Bentleyville borough
School Enrollment in Bentleyville borough
The most common levels of schooling among the 525 students in Bentleyville borough are college / undergraduate (161 | 30.7%), high school (103 | 19.6%), and middle school (89 | 17.0%).
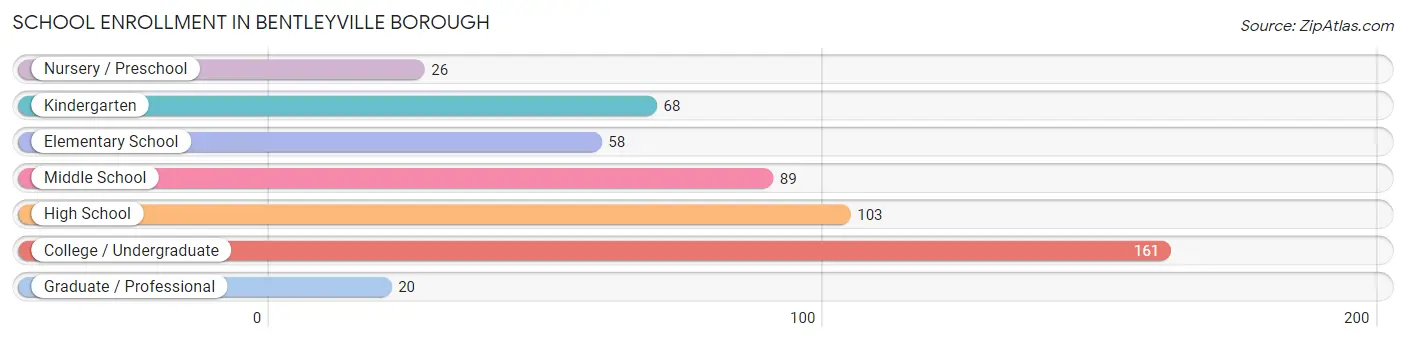
| School Level | # Students | % Students |
| Nursery / Preschool | 26 | 5.0% |
| Kindergarten | 68 | 13.0% |
| Elementary School | 58 | 11.1% |
| Middle School | 89 | 17.0% |
| High School | 103 | 19.6% |
| College / Undergraduate | 161 | 30.7% |
| Graduate / Professional | 20 | 3.8% |
| Total | 525 | 100.0% |
School Enrollment by Age by Funding Source in Bentleyville borough
Out of a total of 525 students who are enrolled in schools in Bentleyville borough, 103 (19.6%) attend a private institution, while the remaining 422 (80.4%) are enrolled in public schools. The age group of 20 to 24 year olds has the highest likelihood of being enrolled in private schools, with 79 (66.9% in the age bracket) enrolled. Conversely, the age group of 3 to 4 year olds has the lowest likelihood of being enrolled in a private school, with 19 (100.0% in the age bracket) attending a public institution.
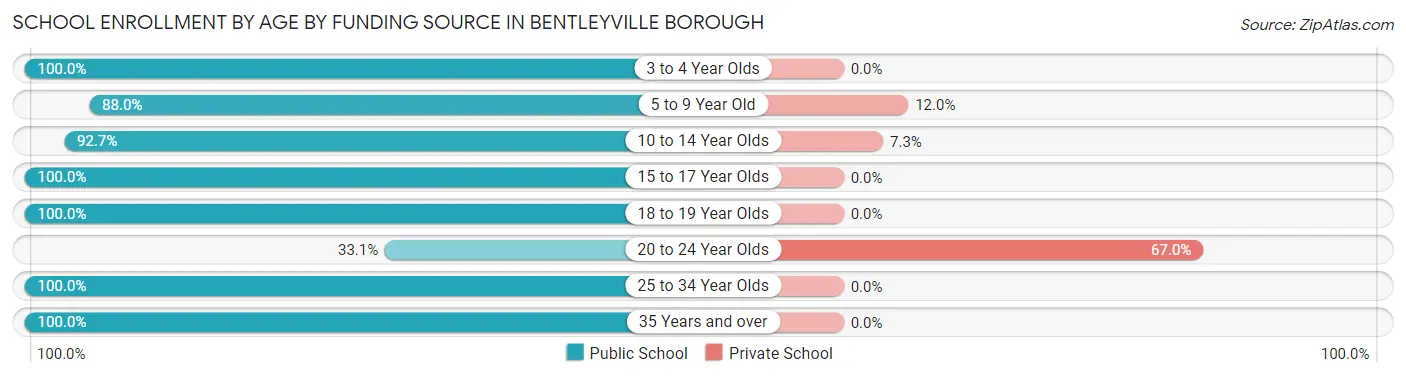
| Age Bracket | Public School | Private School |
| 3 to 4 Year Olds | 19 (100.0%) | 0 (0.0%) |
| 5 to 9 Year Old | 117 (88.0%) | 16 (12.0%) |
| 10 to 14 Year Olds | 101 (92.7%) | 8 (7.3%) |
| 15 to 17 Year Olds | 83 (100.0%) | 0 (0.0%) |
| 18 to 19 Year Olds | 8 (100.0%) | 0 (0.0%) |
| 20 to 24 Year Olds | 39 (33.1%) | 79 (66.9%) |
| 25 to 34 Year Olds | 49 (100.0%) | 0 (0.0%) |
| 35 Years and over | 6 (100.0%) | 0 (0.0%) |
| Total | 422 (80.4%) | 103 (19.6%) |
Educational Attainment by Field of Study in Bentleyville borough
Education (102 | 34.6%), science & technology (51 | 17.3%), business (34 | 11.5%), engineering (25 | 8.5%), and bio, nature & agricultural (22 | 7.5%) are the most common fields of study among 295 individuals in Bentleyville borough who have obtained a bachelor's degree or higher.
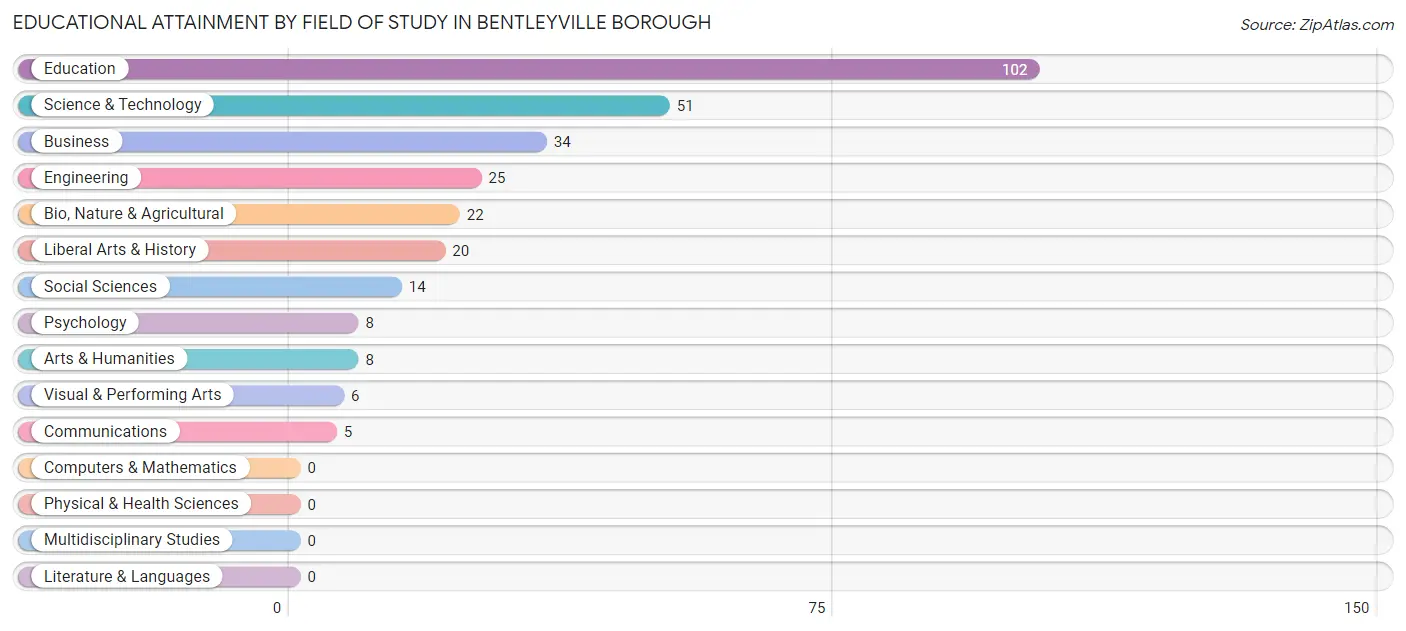
| Field of Study | # Graduates | % Graduates |
| Computers & Mathematics | 0 | 0.0% |
| Bio, Nature & Agricultural | 22 | 7.5% |
| Physical & Health Sciences | 0 | 0.0% |
| Psychology | 8 | 2.7% |
| Social Sciences | 14 | 4.8% |
| Engineering | 25 | 8.5% |
| Multidisciplinary Studies | 0 | 0.0% |
| Science & Technology | 51 | 17.3% |
| Business | 34 | 11.5% |
| Education | 102 | 34.6% |
| Literature & Languages | 0 | 0.0% |
| Liberal Arts & History | 20 | 6.8% |
| Visual & Performing Arts | 6 | 2.0% |
| Communications | 5 | 1.7% |
| Arts & Humanities | 8 | 2.7% |
| Total | 295 | 100.0% |
Transportation & Commute in Bentleyville borough
Vehicle Availability by Sex in Bentleyville borough
The most prevalent vehicle ownership categories in Bentleyville borough are males with 2 vehicles (231, accounting for 56.1%) and females with 2 vehicles (184, making up 56.1%).
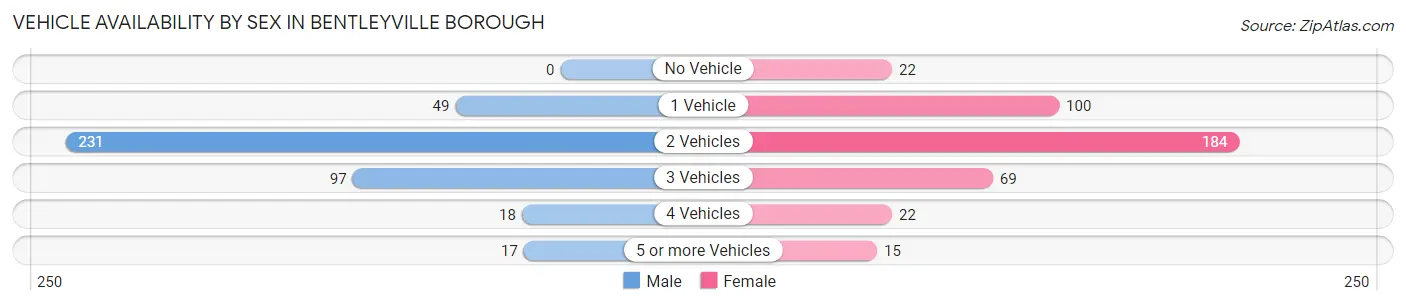
| Vehicles Available | Male | Female |
| No Vehicle | 0 (0.0%) | 22 (5.3%) |
| 1 Vehicle | 49 (11.9%) | 100 (24.3%) |
| 2 Vehicles | 231 (56.1%) | 184 (44.7%) |
| 3 Vehicles | 97 (23.5%) | 69 (16.8%) |
| 4 Vehicles | 18 (4.4%) | 22 (5.3%) |
| 5 or more Vehicles | 17 (4.1%) | 15 (3.6%) |
| Total | 412 (100.0%) | 412 (100.0%) |
Commute Time in Bentleyville borough
The most frequently occuring commute durations in Bentleyville borough are 30 to 34 minutes (147 commuters, 18.9%), 45 to 59 minutes (105 commuters, 13.5%), and 60 to 89 minutes (89 commuters, 11.5%).
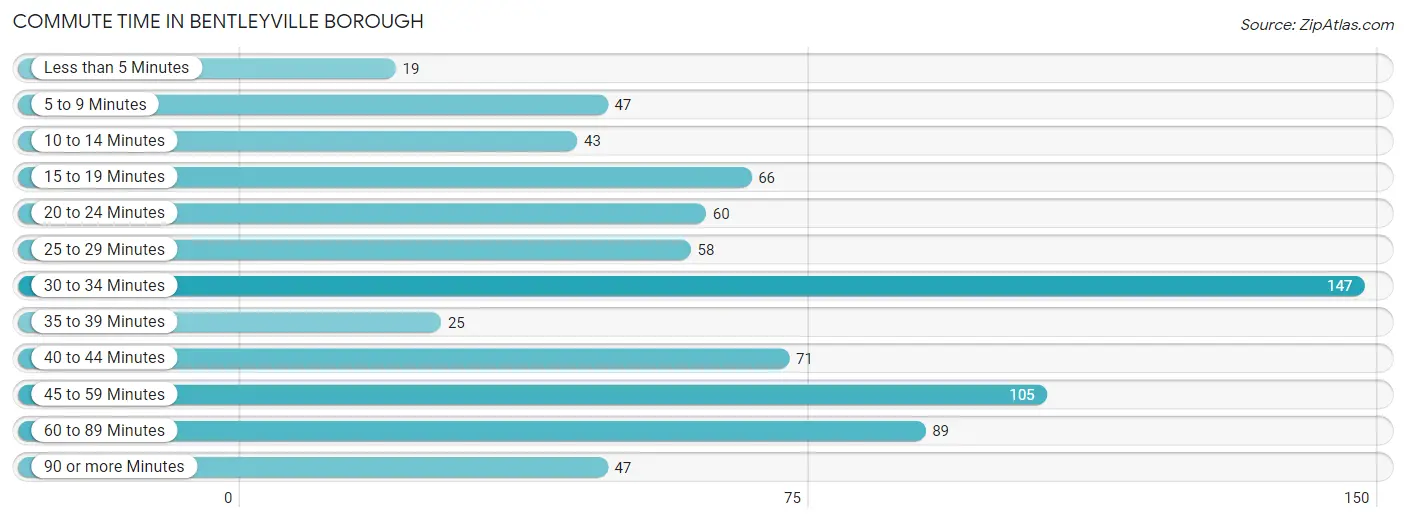
| Commute Time | # Commuters | % Commuters |
| Less than 5 Minutes | 19 | 2.5% |
| 5 to 9 Minutes | 47 | 6.0% |
| 10 to 14 Minutes | 43 | 5.5% |
| 15 to 19 Minutes | 66 | 8.5% |
| 20 to 24 Minutes | 60 | 7.7% |
| 25 to 29 Minutes | 58 | 7.5% |
| 30 to 34 Minutes | 147 | 18.9% |
| 35 to 39 Minutes | 25 | 3.2% |
| 40 to 44 Minutes | 71 | 9.1% |
| 45 to 59 Minutes | 105 | 13.5% |
| 60 to 89 Minutes | 89 | 11.5% |
| 90 or more Minutes | 47 | 6.0% |
Commute Time by Sex in Bentleyville borough
The most common commute times in Bentleyville borough are 30 to 34 minutes (84 commuters, 20.9%) for males and 30 to 34 minutes (63 commuters, 16.8%) for females.
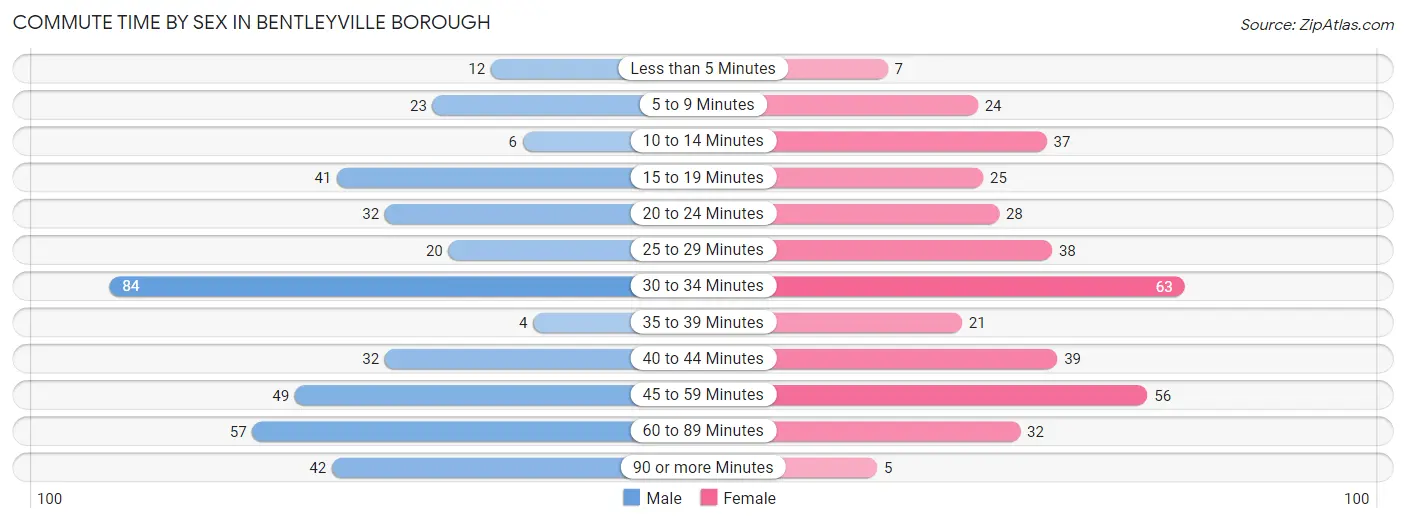
| Commute Time | Male | Female |
| Less than 5 Minutes | 12 (3.0%) | 7 (1.9%) |
| 5 to 9 Minutes | 23 (5.7%) | 24 (6.4%) |
| 10 to 14 Minutes | 6 (1.5%) | 37 (9.9%) |
| 15 to 19 Minutes | 41 (10.2%) | 25 (6.7%) |
| 20 to 24 Minutes | 32 (8.0%) | 28 (7.5%) |
| 25 to 29 Minutes | 20 (5.0%) | 38 (10.1%) |
| 30 to 34 Minutes | 84 (20.9%) | 63 (16.8%) |
| 35 to 39 Minutes | 4 (1.0%) | 21 (5.6%) |
| 40 to 44 Minutes | 32 (8.0%) | 39 (10.4%) |
| 45 to 59 Minutes | 49 (12.2%) | 56 (14.9%) |
| 60 to 89 Minutes | 57 (14.2%) | 32 (8.5%) |
| 90 or more Minutes | 42 (10.4%) | 5 (1.3%) |
Time of Departure to Work by Sex in Bentleyville borough
The most frequent times of departure to work in Bentleyville borough are 7:00 AM to 7:29 AM (112, 27.9%) for males and 6:30 AM to 6:59 AM (51, 13.6%) for females.
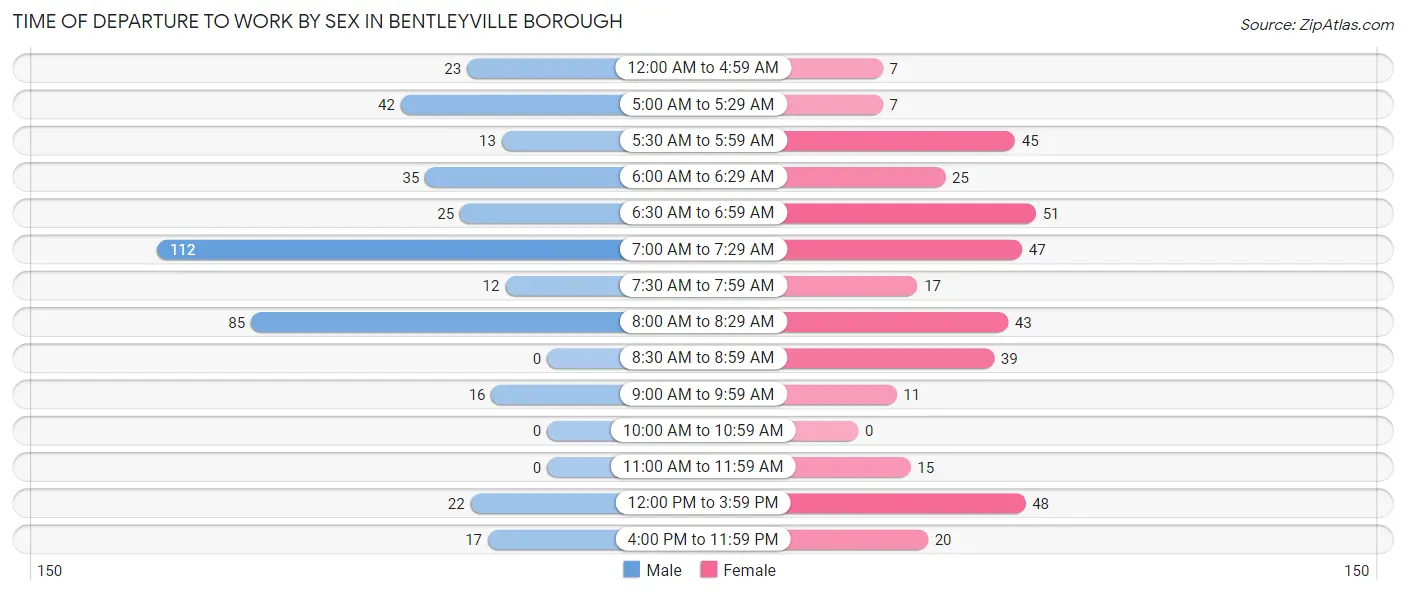
| Time of Departure | Male | Female |
| 12:00 AM to 4:59 AM | 23 (5.7%) | 7 (1.9%) |
| 5:00 AM to 5:29 AM | 42 (10.4%) | 7 (1.9%) |
| 5:30 AM to 5:59 AM | 13 (3.2%) | 45 (12.0%) |
| 6:00 AM to 6:29 AM | 35 (8.7%) | 25 (6.7%) |
| 6:30 AM to 6:59 AM | 25 (6.2%) | 51 (13.6%) |
| 7:00 AM to 7:29 AM | 112 (27.9%) | 47 (12.5%) |
| 7:30 AM to 7:59 AM | 12 (3.0%) | 17 (4.5%) |
| 8:00 AM to 8:29 AM | 85 (21.1%) | 43 (11.5%) |
| 8:30 AM to 8:59 AM | 0 (0.0%) | 39 (10.4%) |
| 9:00 AM to 9:59 AM | 16 (4.0%) | 11 (2.9%) |
| 10:00 AM to 10:59 AM | 0 (0.0%) | 0 (0.0%) |
| 11:00 AM to 11:59 AM | 0 (0.0%) | 15 (4.0%) |
| 12:00 PM to 3:59 PM | 22 (5.5%) | 48 (12.8%) |
| 4:00 PM to 11:59 PM | 17 (4.2%) | 20 (5.3%) |
| Total | 402 (100.0%) | 375 (100.0%) |
Housing Occupancy in Bentleyville borough
Occupancy by Ownership in Bentleyville borough
Of the total 938 dwellings in Bentleyville borough, owner-occupied units account for 571 (60.9%), while renter-occupied units make up 367 (39.1%).
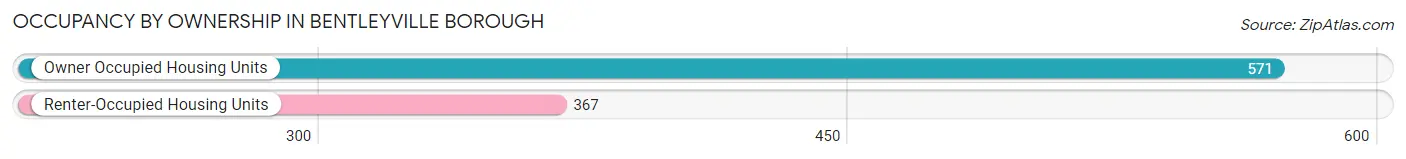
| Occupancy | # Housing Units | % Housing Units |
| Owner Occupied Housing Units | 571 | 60.9% |
| Renter-Occupied Housing Units | 367 | 39.1% |
| Total Occupied Housing Units | 938 | 100.0% |
Occupancy by Household Size in Bentleyville borough
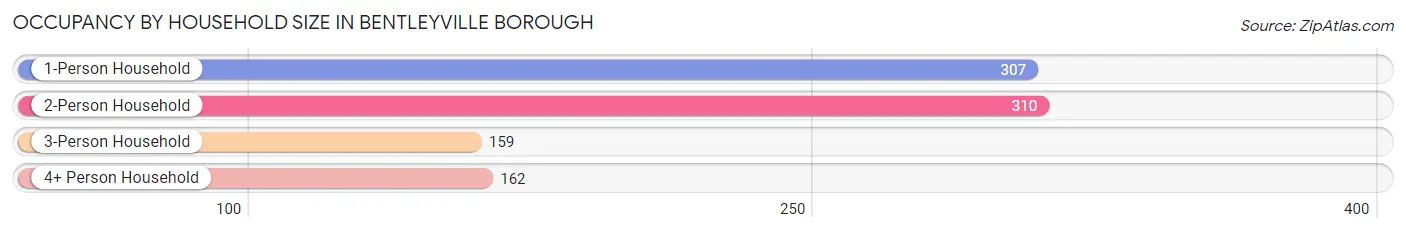
| Household Size | # Housing Units | % Housing Units |
| 1-Person Household | 307 | 32.7% |
| 2-Person Household | 310 | 33.1% |
| 3-Person Household | 159 | 17.0% |
| 4+ Person Household | 162 | 17.3% |
| Total Housing Units | 938 | 100.0% |
Occupancy by Ownership by Household Size in Bentleyville borough
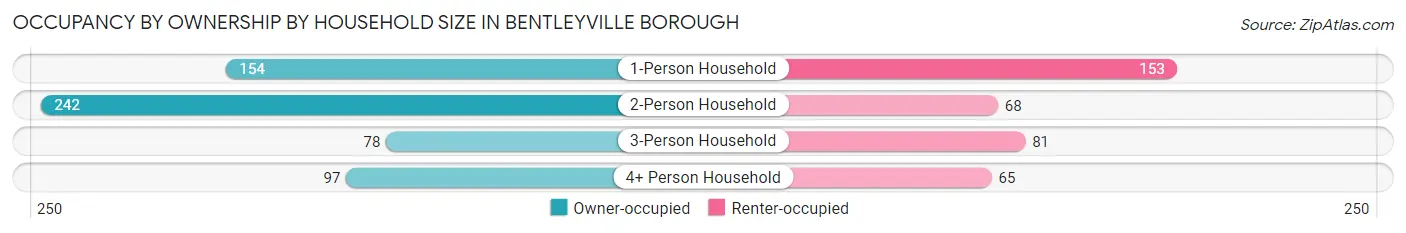
| Household Size | Owner-occupied | Renter-occupied |
| 1-Person Household | 154 (50.2%) | 153 (49.8%) |
| 2-Person Household | 242 (78.1%) | 68 (21.9%) |
| 3-Person Household | 78 (49.1%) | 81 (50.9%) |
| 4+ Person Household | 97 (59.9%) | 65 (40.1%) |
| Total Housing Units | 571 (60.9%) | 367 (39.1%) |
Occupancy by Educational Attainment in Bentleyville borough
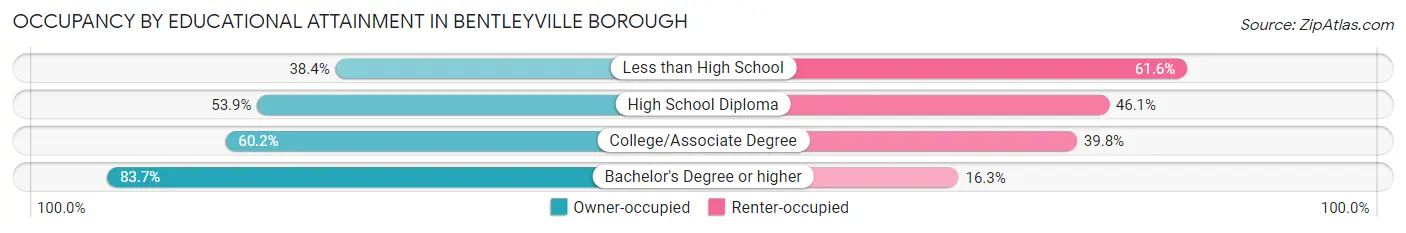
| Household Size | Owner-occupied | Renter-occupied |
| Less than High School | 28 (38.4%) | 45 (61.6%) |
| High School Diploma | 202 (53.9%) | 173 (46.1%) |
| College/Associate Degree | 177 (60.2%) | 117 (39.8%) |
| Bachelor's Degree or higher | 164 (83.7%) | 32 (16.3%) |
Occupancy by Age of Householder in Bentleyville borough
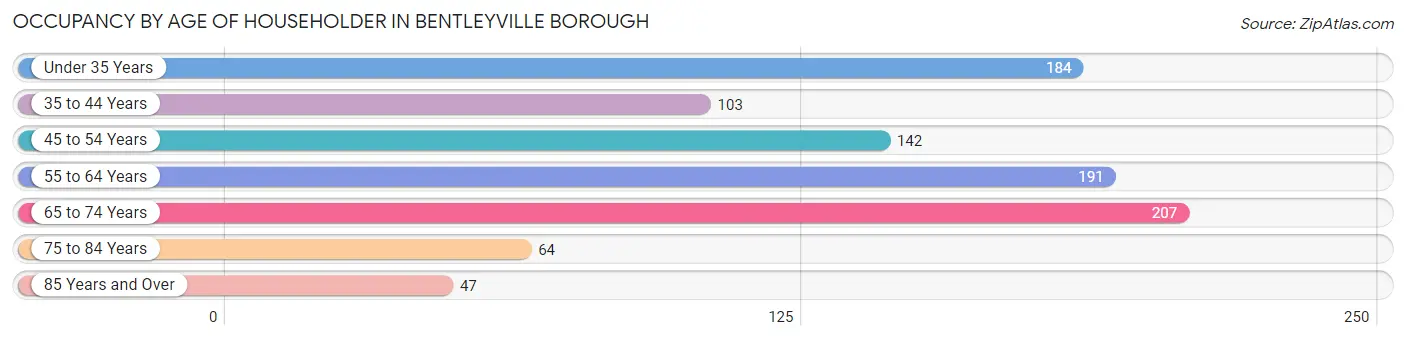
| Age Bracket | # Households | % Households |
| Under 35 Years | 184 | 19.6% |
| 35 to 44 Years | 103 | 11.0% |
| 45 to 54 Years | 142 | 15.1% |
| 55 to 64 Years | 191 | 20.4% |
| 65 to 74 Years | 207 | 22.1% |
| 75 to 84 Years | 64 | 6.8% |
| 85 Years and Over | 47 | 5.0% |
| Total | 938 | 100.0% |
Housing Finances in Bentleyville borough
Median Income by Occupancy in Bentleyville borough
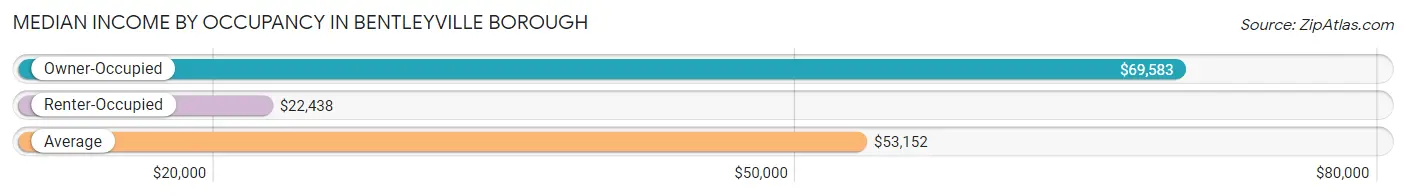
| Occupancy Type | # Households | Median Income |
| Owner-Occupied | 571 (60.9%) | $69,583 |
| Renter-Occupied | 367 (39.1%) | $22,438 |
| Average | 938 (100.0%) | $53,152 |
Occupancy by Householder Income Bracket in Bentleyville borough
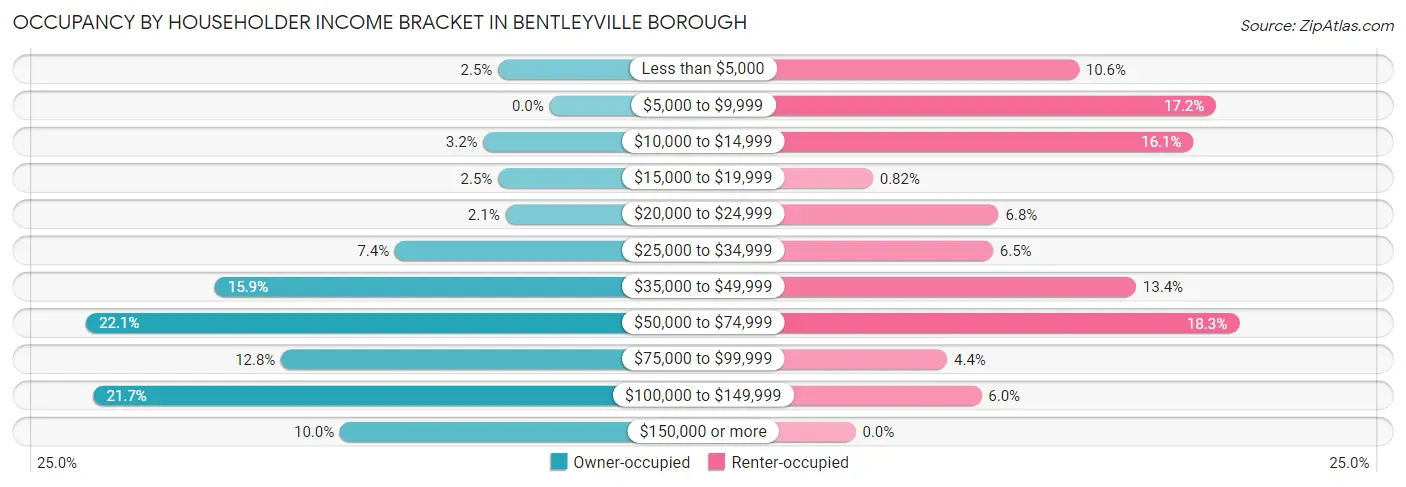
| Income Bracket | Owner-occupied | Renter-occupied |
| Less than $5,000 | 14 (2.5%) | 39 (10.6%) |
| $5,000 to $9,999 | 0 (0.0%) | 63 (17.2%) |
| $10,000 to $14,999 | 18 (3.2%) | 59 (16.1%) |
| $15,000 to $19,999 | 14 (2.5%) | 3 (0.8%) |
| $20,000 to $24,999 | 12 (2.1%) | 25 (6.8%) |
| $25,000 to $34,999 | 42 (7.4%) | 24 (6.5%) |
| $35,000 to $49,999 | 91 (15.9%) | 49 (13.4%) |
| $50,000 to $74,999 | 126 (22.1%) | 67 (18.3%) |
| $75,000 to $99,999 | 73 (12.8%) | 16 (4.4%) |
| $100,000 to $149,999 | 124 (21.7%) | 22 (6.0%) |
| $150,000 or more | 57 (10.0%) | 0 (0.0%) |
| Total | 571 (100.0%) | 367 (100.0%) |
Monthly Housing Cost Tiers in Bentleyville borough
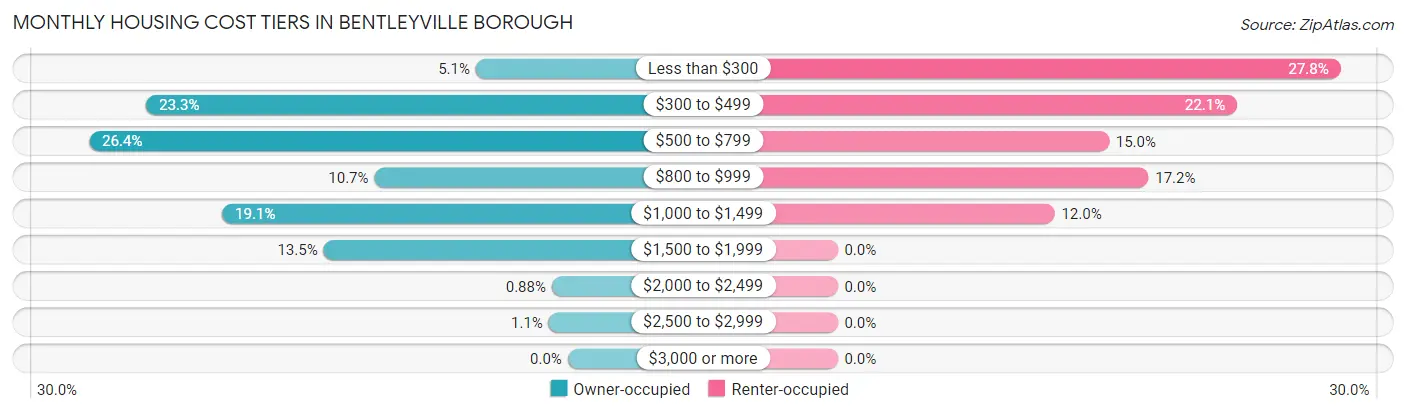
| Monthly Cost | Owner-occupied | Renter-occupied |
| Less than $300 | 29 (5.1%) | 102 (27.8%) |
| $300 to $499 | 133 (23.3%) | 81 (22.1%) |
| $500 to $799 | 151 (26.4%) | 55 (15.0%) |
| $800 to $999 | 61 (10.7%) | 63 (17.2%) |
| $1,000 to $1,499 | 109 (19.1%) | 44 (12.0%) |
| $1,500 to $1,999 | 77 (13.5%) | 0 (0.0%) |
| $2,000 to $2,499 | 5 (0.9%) | 0 (0.0%) |
| $2,500 to $2,999 | 6 (1.1%) | 0 (0.0%) |
| $3,000 or more | 0 (0.0%) | 0 (0.0%) |
| Total | 571 (100.0%) | 367 (100.0%) |
Physical Housing Characteristics in Bentleyville borough
Housing Structures in Bentleyville borough
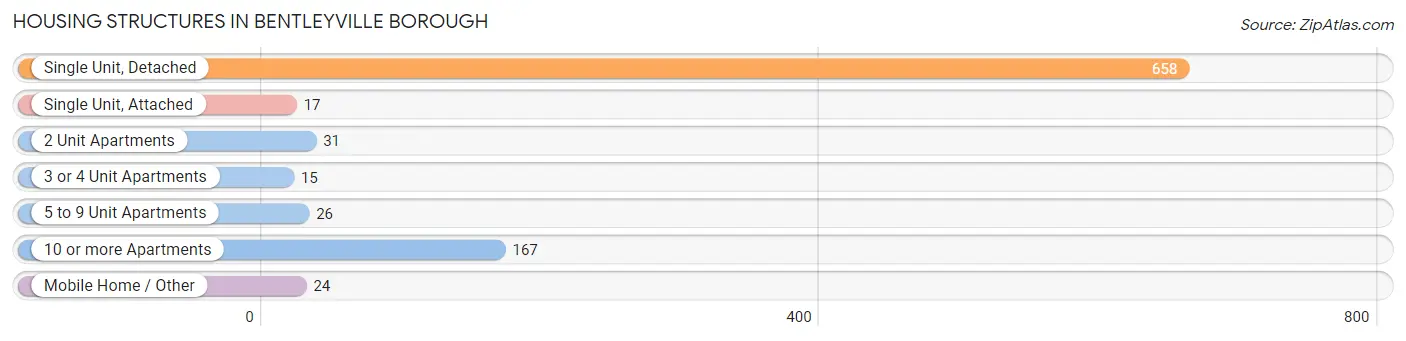
| Structure Type | # Housing Units | % Housing Units |
| Single Unit, Detached | 658 | 70.2% |
| Single Unit, Attached | 17 | 1.8% |
| 2 Unit Apartments | 31 | 3.3% |
| 3 or 4 Unit Apartments | 15 | 1.6% |
| 5 to 9 Unit Apartments | 26 | 2.8% |
| 10 or more Apartments | 167 | 17.8% |
| Mobile Home / Other | 24 | 2.6% |
| Total | 938 | 100.0% |
Housing Structures by Occupancy in Bentleyville borough
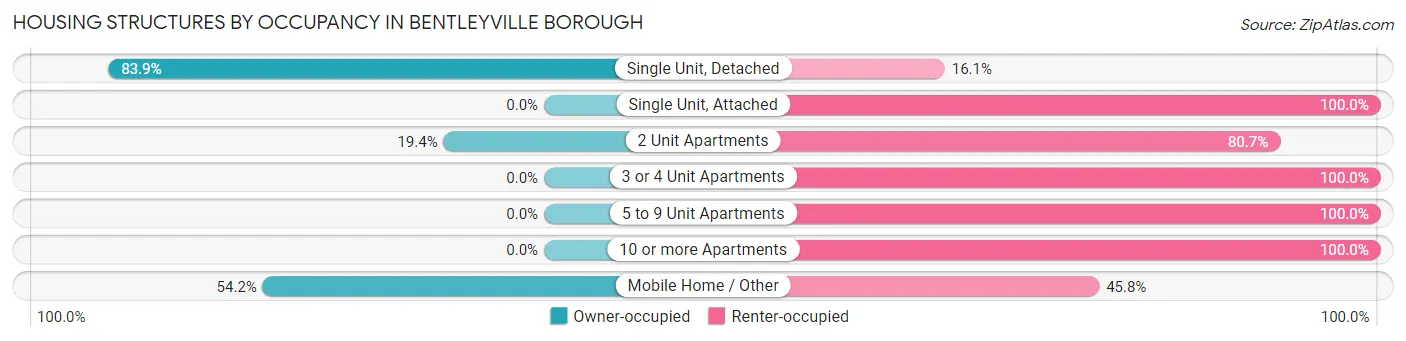
| Structure Type | Owner-occupied | Renter-occupied |
| Single Unit, Detached | 552 (83.9%) | 106 (16.1%) |
| Single Unit, Attached | 0 (0.0%) | 17 (100.0%) |
| 2 Unit Apartments | 6 (19.4%) | 25 (80.6%) |
| 3 or 4 Unit Apartments | 0 (0.0%) | 15 (100.0%) |
| 5 to 9 Unit Apartments | 0 (0.0%) | 26 (100.0%) |
| 10 or more Apartments | 0 (0.0%) | 167 (100.0%) |
| Mobile Home / Other | 13 (54.2%) | 11 (45.8%) |
| Total | 571 (60.9%) | 367 (39.1%) |
Housing Structures by Number of Rooms in Bentleyville borough
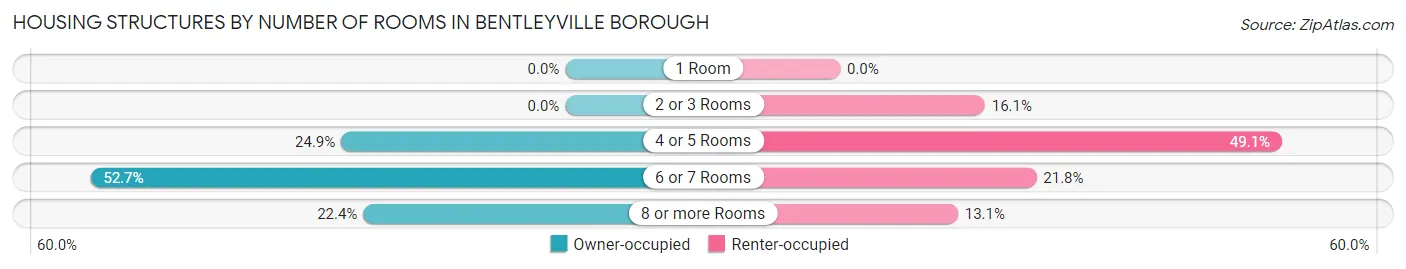
| Number of Rooms | Owner-occupied | Renter-occupied |
| 1 Room | 0 (0.0%) | 0 (0.0%) |
| 2 or 3 Rooms | 0 (0.0%) | 59 (16.1%) |
| 4 or 5 Rooms | 142 (24.9%) | 180 (49.0%) |
| 6 or 7 Rooms | 301 (52.7%) | 80 (21.8%) |
| 8 or more Rooms | 128 (22.4%) | 48 (13.1%) |
| Total | 571 (100.0%) | 367 (100.0%) |
Housing Structure by Heating Type in Bentleyville borough
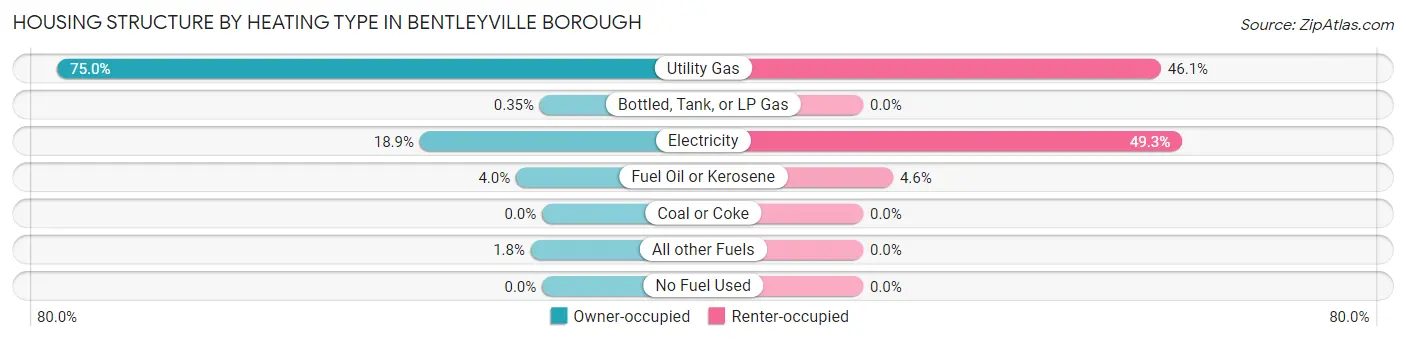
| Heating Type | Owner-occupied | Renter-occupied |
| Utility Gas | 428 (75.0%) | 169 (46.1%) |
| Bottled, Tank, or LP Gas | 2 (0.4%) | 0 (0.0%) |
| Electricity | 108 (18.9%) | 181 (49.3%) |
| Fuel Oil or Kerosene | 23 (4.0%) | 17 (4.6%) |
| Coal or Coke | 0 (0.0%) | 0 (0.0%) |
| All other Fuels | 10 (1.8%) | 0 (0.0%) |
| No Fuel Used | 0 (0.0%) | 0 (0.0%) |
| Total | 571 (100.0%) | 367 (100.0%) |
Household Vehicle Usage in Bentleyville borough
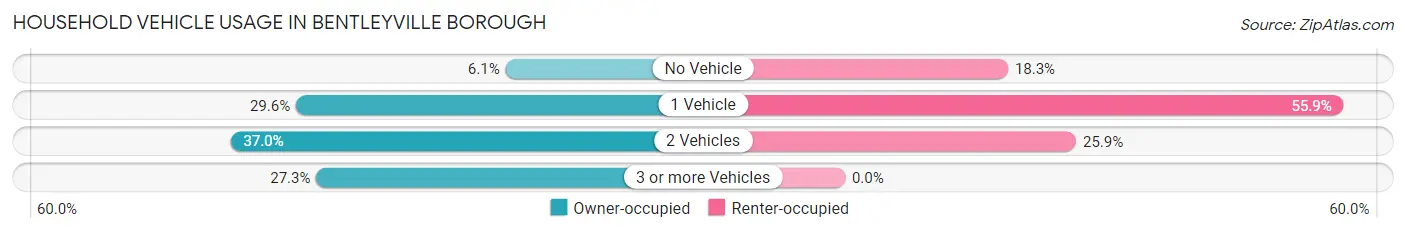
| Vehicles per Household | Owner-occupied | Renter-occupied |
| No Vehicle | 35 (6.1%) | 67 (18.3%) |
| 1 Vehicle | 169 (29.6%) | 205 (55.9%) |
| 2 Vehicles | 211 (36.9%) | 95 (25.9%) |
| 3 or more Vehicles | 156 (27.3%) | 0 (0.0%) |
| Total | 571 (100.0%) | 367 (100.0%) |
Real Estate & Mortgages in Bentleyville borough
Real Estate and Mortgage Overview in Bentleyville borough
| Characteristic | Without Mortgage | With Mortgage |
| Housing Units | 284 | 287 |
| Median Property Value | $140,600 | $142,100 |
| Median Household Income | $53,229 | $27 |
| Monthly Housing Costs | $467 | $0 |
| Real Estate Taxes | $1,387 | $0 |
Property Value by Mortgage Status in Bentleyville borough
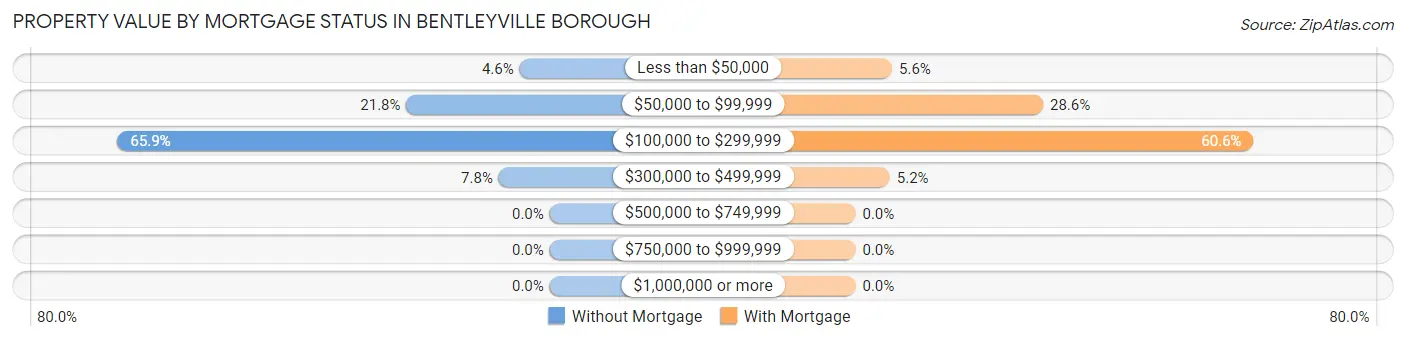
| Property Value | Without Mortgage | With Mortgage |
| Less than $50,000 | 13 (4.6%) | 16 (5.6%) |
| $50,000 to $99,999 | 62 (21.8%) | 82 (28.6%) |
| $100,000 to $299,999 | 187 (65.8%) | 174 (60.6%) |
| $300,000 to $499,999 | 22 (7.7%) | 15 (5.2%) |
| $500,000 to $749,999 | 0 (0.0%) | 0 (0.0%) |
| $750,000 to $999,999 | 0 (0.0%) | 0 (0.0%) |
| $1,000,000 or more | 0 (0.0%) | 0 (0.0%) |
| Total | 284 (100.0%) | 287 (100.0%) |
Household Income by Mortgage Status in Bentleyville borough
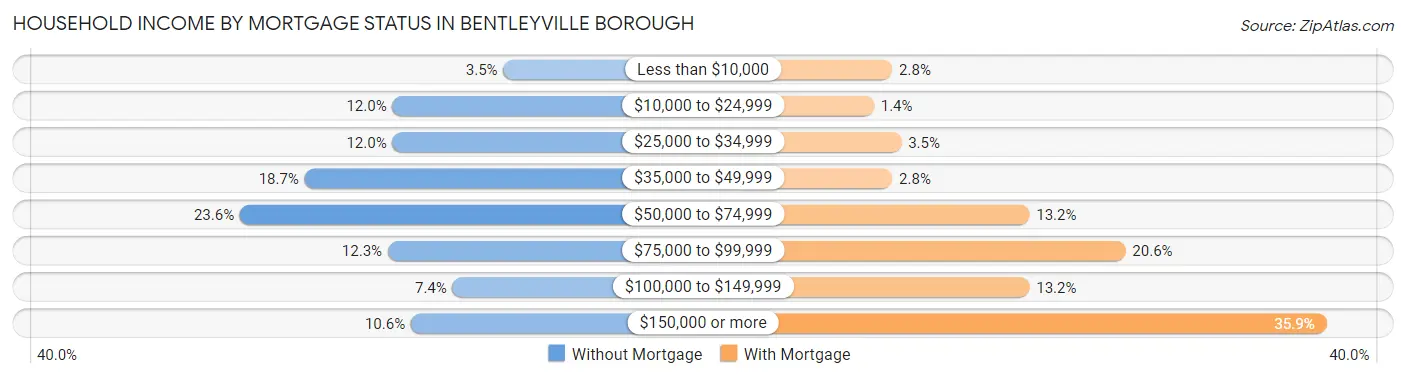
| Household Income | Without Mortgage | With Mortgage |
| Less than $10,000 | 10 (3.5%) | 8 (2.8%) |
| $10,000 to $24,999 | 34 (12.0%) | 4 (1.4%) |
| $25,000 to $34,999 | 34 (12.0%) | 10 (3.5%) |
| $35,000 to $49,999 | 53 (18.7%) | 8 (2.8%) |
| $50,000 to $74,999 | 67 (23.6%) | 38 (13.2%) |
| $75,000 to $99,999 | 35 (12.3%) | 59 (20.6%) |
| $100,000 to $149,999 | 21 (7.4%) | 38 (13.2%) |
| $150,000 or more | 30 (10.6%) | 103 (35.9%) |
| Total | 284 (100.0%) | 287 (100.0%) |
Property Value to Household Income Ratio in Bentleyville borough
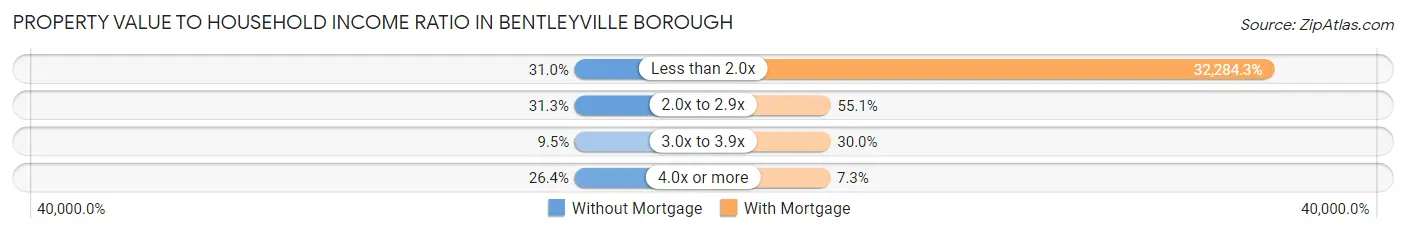
| Value-to-Income Ratio | Without Mortgage | With Mortgage |
| Less than 2.0x | 88 (31.0%) | 92,656 (32,284.3%) |
| 2.0x to 2.9x | 89 (31.3%) | 158 (55.0%) |
| 3.0x to 3.9x | 27 (9.5%) | 86 (30.0%) |
| 4.0x or more | 75 (26.4%) | 21 (7.3%) |
| Total | 284 (100.0%) | 287 (100.0%) |
Real Estate Taxes by Mortgage Status in Bentleyville borough
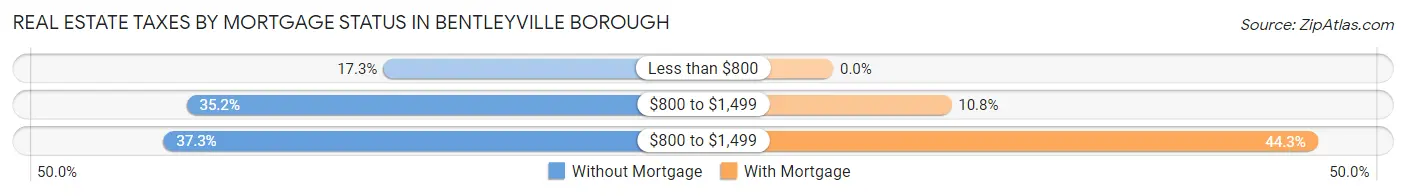
| Property Taxes | Without Mortgage | With Mortgage |
| Less than $800 | 49 (17.2%) | 0 (0.0%) |
| $800 to $1,499 | 100 (35.2%) | 31 (10.8%) |
| $800 to $1,499 | 106 (37.3%) | 127 (44.3%) |
| Total | 284 (100.0%) | 287 (100.0%) |
Health & Disability in Bentleyville borough
Health Insurance Coverage by Age in Bentleyville borough
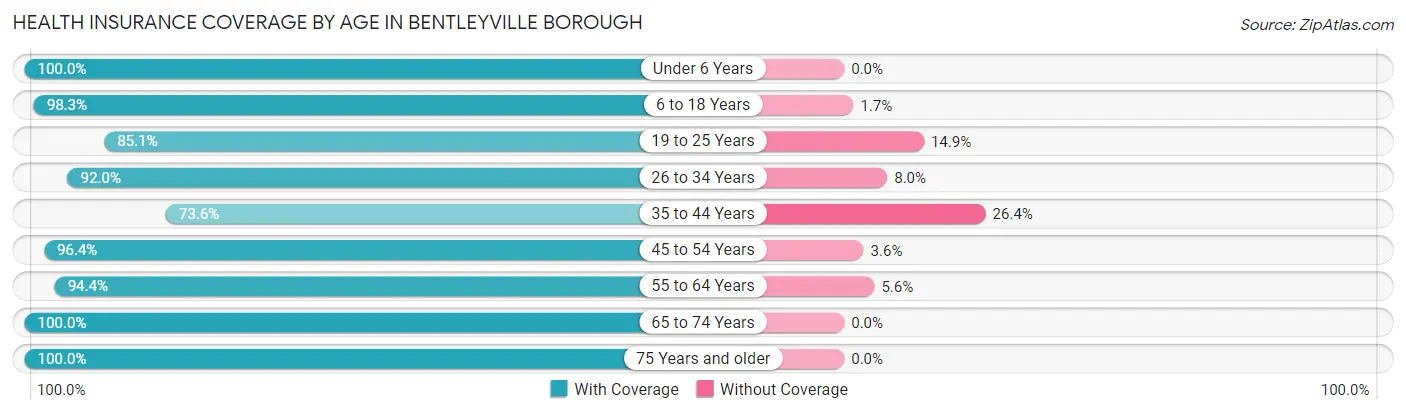
| Age Bracket | With Coverage | Without Coverage |
| Under 6 Years | 294 (100.0%) | 0 (0.0%) |
| 6 to 18 Years | 342 (98.3%) | 6 (1.7%) |
| 19 to 25 Years | 189 (85.1%) | 33 (14.9%) |
| 26 to 34 Years | 241 (92.0%) | 21 (8.0%) |
| 35 to 44 Years | 190 (73.6%) | 68 (26.4%) |
| 45 to 54 Years | 320 (96.4%) | 12 (3.6%) |
| 55 to 64 Years | 252 (94.4%) | 15 (5.6%) |
| 65 to 74 Years | 279 (100.0%) | 0 (0.0%) |
| 75 Years and older | 136 (100.0%) | 0 (0.0%) |
| Total | 2,243 (93.5%) | 155 (6.5%) |
Health Insurance Coverage by Citizenship Status in Bentleyville borough
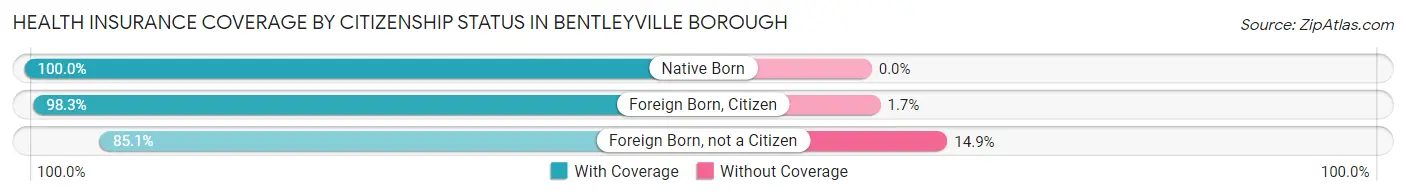
| Citizenship Status | With Coverage | Without Coverage |
| Native Born | 294 (100.0%) | 0 (0.0%) |
| Foreign Born, Citizen | 342 (98.3%) | 6 (1.7%) |
| Foreign Born, not a Citizen | 189 (85.1%) | 33 (14.9%) |
Health Insurance Coverage by Household Income in Bentleyville borough
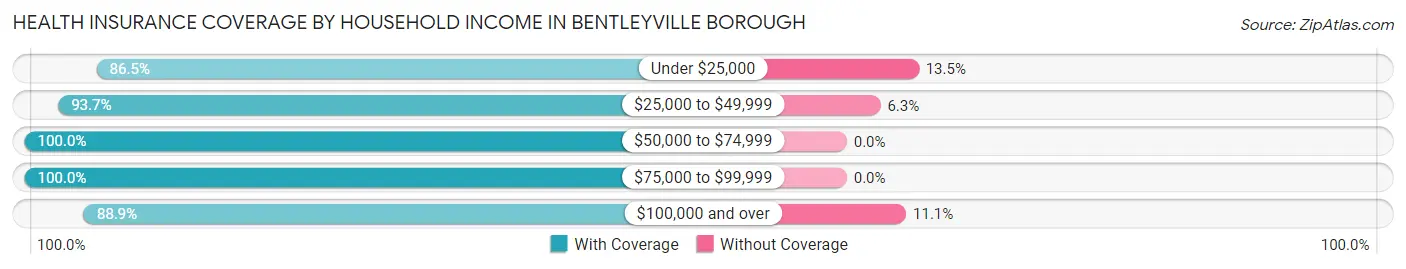
| Household Income | With Coverage | Without Coverage |
| Under $25,000 | 488 (86.5%) | 76 (13.5%) |
| $25,000 to $49,999 | 312 (93.7%) | 21 (6.3%) |
| $50,000 to $74,999 | 674 (100.0%) | 0 (0.0%) |
| $75,000 to $99,999 | 286 (100.0%) | 0 (0.0%) |
| $100,000 and over | 464 (88.9%) | 58 (11.1%) |
Public vs Private Health Insurance Coverage by Age in Bentleyville borough
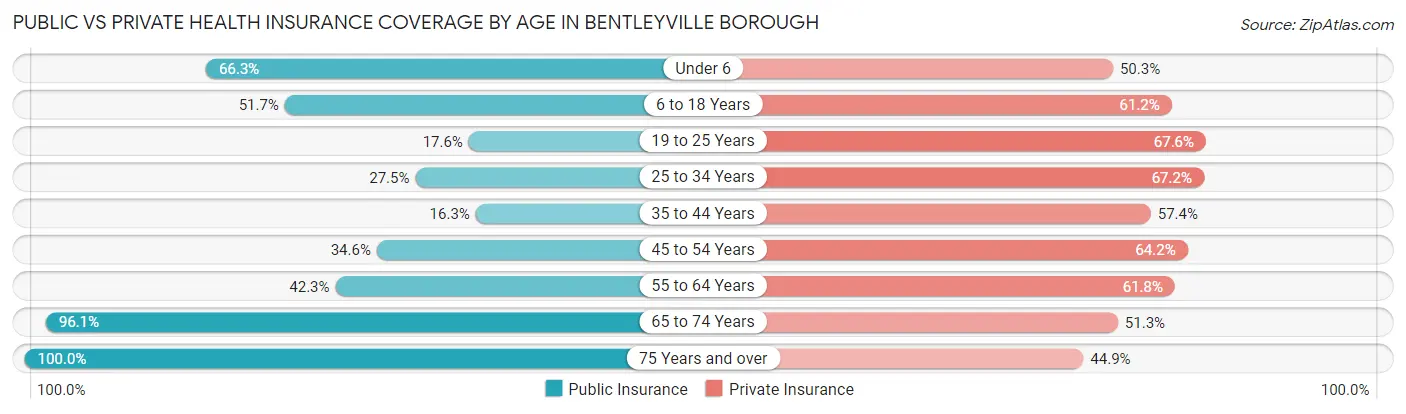
| Age Bracket | Public Insurance | Private Insurance |
| Under 6 | 195 (66.3%) | 148 (50.3%) |
| 6 to 18 Years | 180 (51.7%) | 213 (61.2%) |
| 19 to 25 Years | 39 (17.6%) | 150 (67.6%) |
| 25 to 34 Years | 72 (27.5%) | 176 (67.2%) |
| 35 to 44 Years | 42 (16.3%) | 148 (57.4%) |
| 45 to 54 Years | 115 (34.6%) | 213 (64.2%) |
| 55 to 64 Years | 113 (42.3%) | 165 (61.8%) |
| 65 to 74 Years | 268 (96.1%) | 143 (51.2%) |
| 75 Years and over | 136 (100.0%) | 61 (44.9%) |
| Total | 1,160 (48.4%) | 1,417 (59.1%) |
Disability Status by Sex by Age in Bentleyville borough
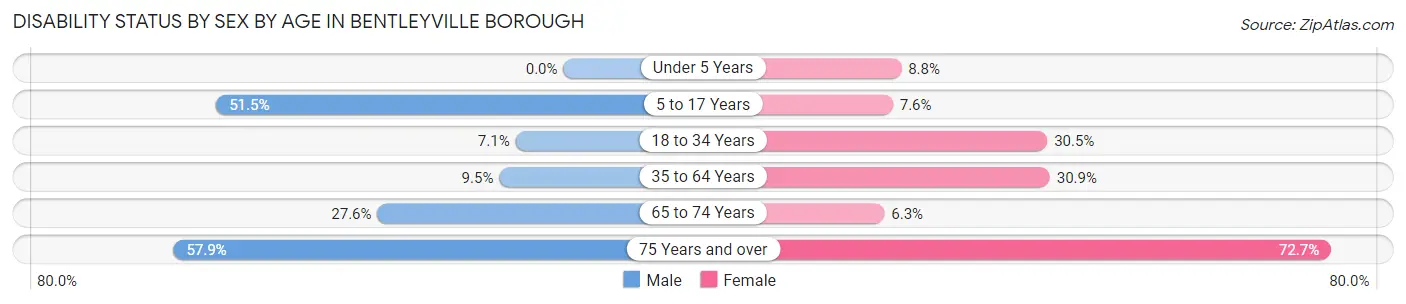
| Age Bracket | Male | Female |
| Under 5 Years | 0 (0.0%) | 9 (8.8%) |
| 5 to 17 Years | 117 (51.5%) | 14 (7.6%) |
| 18 to 34 Years | 15 (7.1%) | 86 (30.5%) |
| 35 to 64 Years | 40 (9.5%) | 135 (30.9%) |
| 65 to 74 Years | 29 (27.6%) | 11 (6.3%) |
| 75 Years and over | 11 (57.9%) | 85 (72.7%) |
Disability Class by Sex by Age in Bentleyville borough
Disability Class: Hearing Difficulty
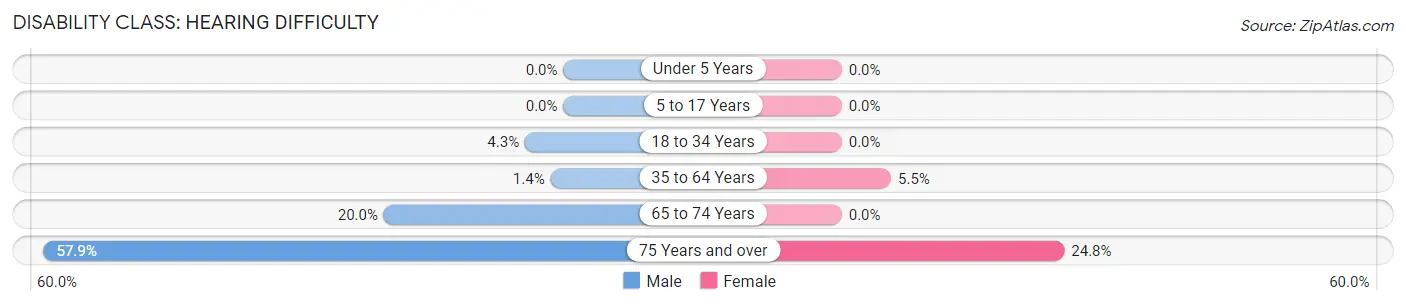
| Age Bracket | Male | Female |
| Under 5 Years | 0 (0.0%) | 0 (0.0%) |
| 5 to 17 Years | 0 (0.0%) | 0 (0.0%) |
| 18 to 34 Years | 9 (4.3%) | 0 (0.0%) |
| 35 to 64 Years | 6 (1.4%) | 24 (5.5%) |
| 65 to 74 Years | 21 (20.0%) | 0 (0.0%) |
| 75 Years and over | 11 (57.9%) | 29 (24.8%) |
Disability Class: Vision Difficulty
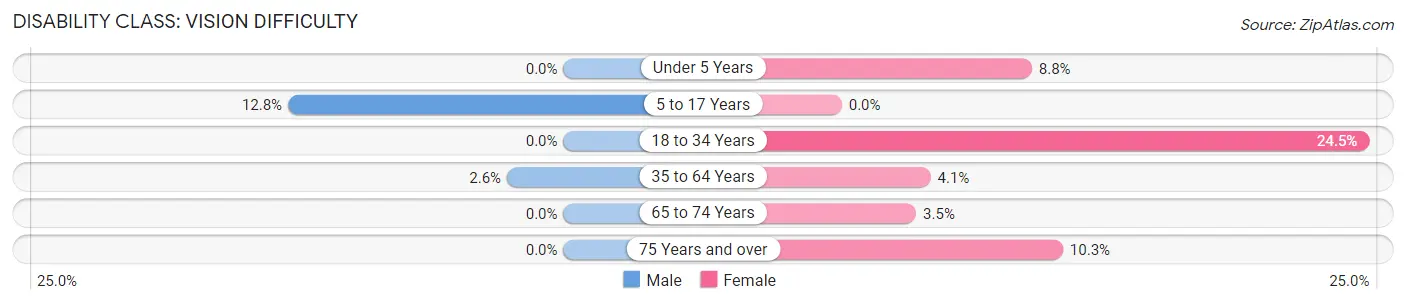
| Age Bracket | Male | Female |
| Under 5 Years | 0 (0.0%) | 9 (8.8%) |
| 5 to 17 Years | 29 (12.8%) | 0 (0.0%) |
| 18 to 34 Years | 0 (0.0%) | 69 (24.5%) |
| 35 to 64 Years | 11 (2.6%) | 18 (4.1%) |
| 65 to 74 Years | 0 (0.0%) | 6 (3.5%) |
| 75 Years and over | 0 (0.0%) | 12 (10.3%) |
Disability Class: Cognitive Difficulty
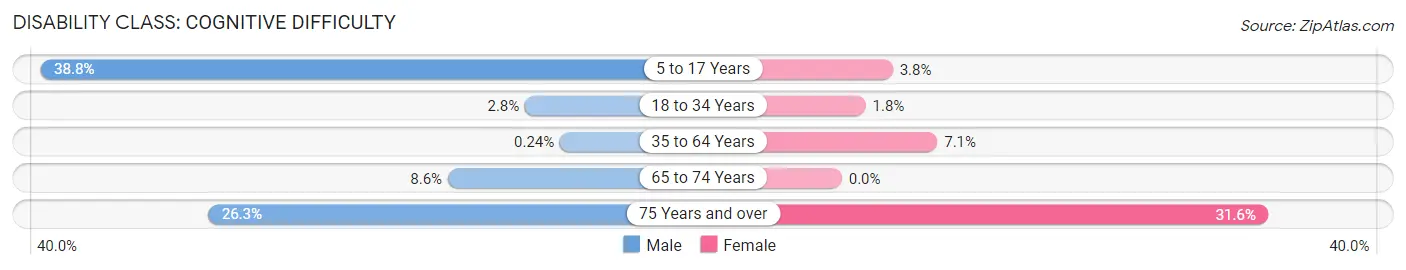
| Age Bracket | Male | Female |
| 5 to 17 Years | 88 (38.8%) | 7 (3.8%) |
| 18 to 34 Years | 6 (2.8%) | 5 (1.8%) |
| 35 to 64 Years | 1 (0.2%) | 31 (7.1%) |
| 65 to 74 Years | 9 (8.6%) | 0 (0.0%) |
| 75 Years and over | 5 (26.3%) | 37 (31.6%) |
Disability Class: Ambulatory Difficulty
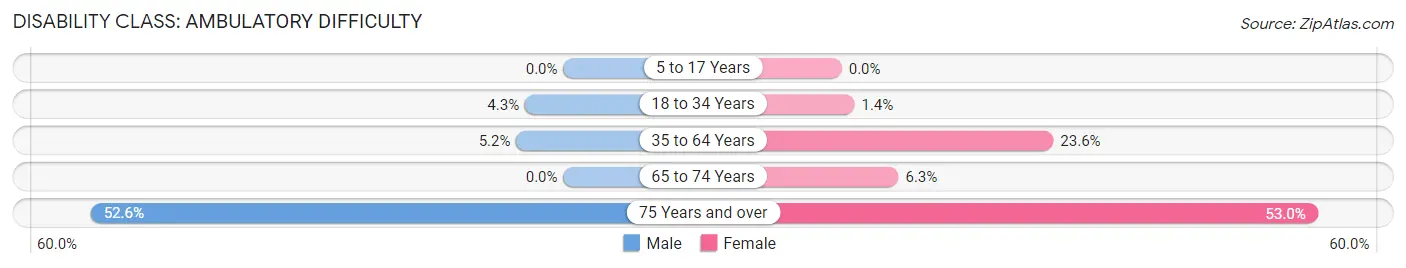
| Age Bracket | Male | Female |
| 5 to 17 Years | 0 (0.0%) | 0 (0.0%) |
| 18 to 34 Years | 9 (4.3%) | 4 (1.4%) |
| 35 to 64 Years | 22 (5.2%) | 103 (23.6%) |
| 65 to 74 Years | 0 (0.0%) | 11 (6.3%) |
| 75 Years and over | 10 (52.6%) | 62 (53.0%) |
Disability Class: Self-Care Difficulty
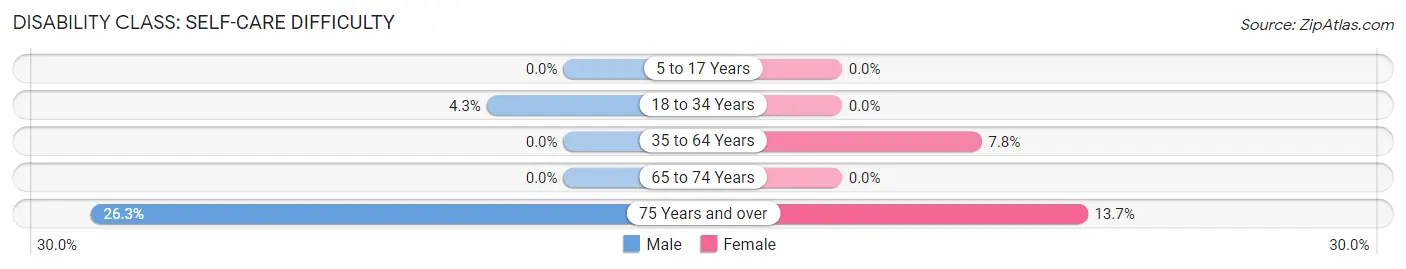
| Age Bracket | Male | Female |
| 5 to 17 Years | 0 (0.0%) | 0 (0.0%) |
| 18 to 34 Years | 9 (4.3%) | 0 (0.0%) |
| 35 to 64 Years | 0 (0.0%) | 34 (7.8%) |
| 65 to 74 Years | 0 (0.0%) | 0 (0.0%) |
| 75 Years and over | 5 (26.3%) | 16 (13.7%) |
Technology Access in Bentleyville borough
Computing Device Access in Bentleyville borough
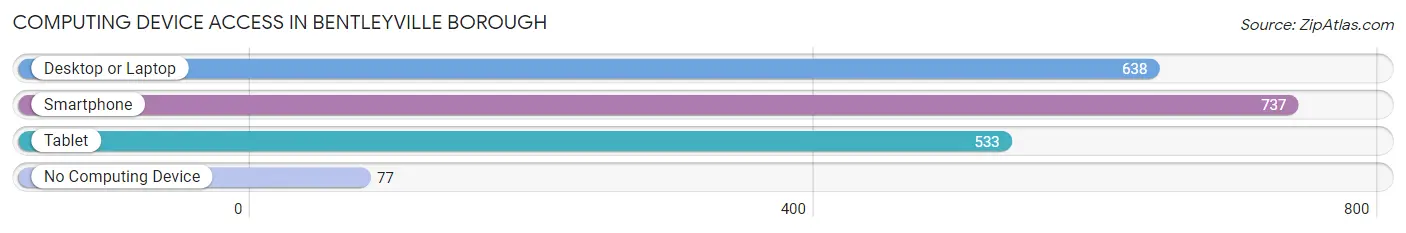
| Device Type | # Households | % Households |
| Desktop or Laptop | 638 | 68.0% |
| Smartphone | 737 | 78.6% |
| Tablet | 533 | 56.8% |
| No Computing Device | 77 | 8.2% |
| Total | 938 | 100.0% |
Internet Access in Bentleyville borough
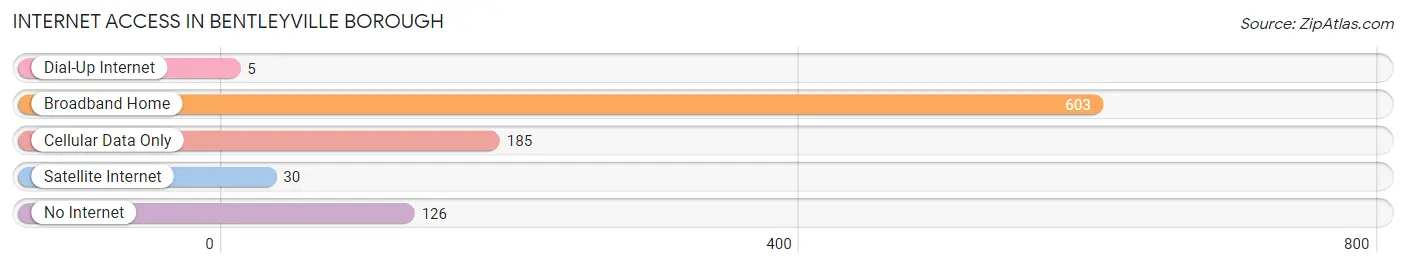
| Internet Type | # Households | % Households |
| Dial-Up Internet | 5 | 0.5% |
| Broadband Home | 603 | 64.3% |
| Cellular Data Only | 185 | 19.7% |
| Satellite Internet | 30 | 3.2% |
| No Internet | 126 | 13.4% |
| Total | 938 | 100.0% |
Bentleyville borough Summary
Bentleyville Borough is a small borough located in Washington County, Pennsylvania. It is situated in the southwestern corner of the state, approximately 25 miles south of Pittsburgh. The borough is bordered by the townships of North Bethlehem, South Bethlehem, and Donegal. As of the 2010 census, the population of Bentleyville was 1,165.
History
The area that is now Bentleyville was first settled in the late 1700s by a group of German immigrants. The town was originally known as “Bentley’s Mill” after the first settler, John Bentley. The town was officially incorporated as a borough in 1891.
In the early 1900s, Bentleyville was a thriving industrial town. The town was home to several coal mines, a brickyard, and a steel mill. The steel mill was the largest employer in the area and provided jobs for many of the town’s residents.
The town’s economy began to decline in the mid-1900s as the steel industry moved away from the area. The coal mines and brickyard also closed down, leaving the town without its major sources of income.
Geography
Bentleyville is located in the southwestern corner of Washington County, Pennsylvania. It is situated in the Monongahela Valley, which is part of the Appalachian Plateau. The borough is bordered by the townships of North Bethlehem, South Bethlehem, and Donegal.
The borough has a total area of 0.8 square miles, all of which is land. The borough is located at an elevation of 1,068 feet above sea level.
Economy
The economy of Bentleyville is largely based on the service industry. The town is home to several restaurants, retail stores, and other businesses. The town also has a small industrial park, which is home to several manufacturing companies.
The town is also home to a small airport which is used for private and corporate flights
Demographics
As of the 2010 census, the population of Bentleyville was 1,165. The racial makeup of the borough was 97.3% White, 0.9% African American, 0.2% Native American, 0.2% Asian, 0.2% from other races, and 1.2% from two or more races. Hispanic or Latino of any race were 0.7% of the population.
The median income for a household in the borough was $37,500, and the median income for a family was $45,000. The per capita income for the borough was $19,845. About 8.3% of families and 10.2% of the population were below the poverty line, including 14.3% of those under age 18 and 6.2% of those age 65 or over.
Conclusion
Bentleyville Borough is a small borough located in Washington County, Pennsylvania. It is situated in the southwestern corner of the state, approximately 25 miles south of Pittsburgh. The borough is bordered by the townships of North Bethlehem, South Bethlehem, and Donegal. As of the 2010 census, the population of Bentleyville was 1,165. The economy of Bentleyville is largely based on the service industry, with a small industrial park and airport also providing employment opportunities. The racial makeup of the borough was 97.3% White, 0.9% African American, 0.2% Native American, 0.2% Asian, 0.2% from other races, and 1.2% from two or more races. The median income for a household in the borough was $37,500, and the median income for a family was $45,000.
Common Questions
What is Per Capita Income in Bentleyville borough?
Per Capita income in Bentleyville borough is $26,040.
What is the Median Family Income in Bentleyville borough?
Median Family Income in Bentleyville borough is $65,361.
What is the Median Household income in Bentleyville borough?
Median Household Income in Bentleyville borough is $53,152.
What is Income or Wage Gap in Bentleyville borough?
Income or Wage Gap in Bentleyville borough is 49.9%.
Women in Bentleyville borough earn 50.1 cents for every dollar earned by a man.
What is Family Income Deficit in Bentleyville borough?
Family Income Deficit in Bentleyville borough is $12,474.
Families that are below poverty line in Bentleyville borough earn $12,474 less on average than the poverty threshold level.
What is Inequality or Gini Index in Bentleyville borough?
Inequality or Gini Index in Bentleyville borough is 0.44.
What is the Total Population of Bentleyville borough?
Total Population of Bentleyville borough is 2,409.
What is the Total Male Population of Bentleyville borough?
Total Male Population of Bentleyville borough is 1,112.
What is the Total Female Population of Bentleyville borough?
Total Female Population of Bentleyville borough is 1,297.
What is the Ratio of Males per 100 Females in Bentleyville borough?
There are 85.74 Males per 100 Females in Bentleyville borough.
What is the Ratio of Females per 100 Males in Bentleyville borough?
There are 116.64 Females per 100 Males in Bentleyville borough.
What is the Median Population Age in Bentleyville borough?
Median Population Age in Bentleyville borough is 36.8 Years.
What is the Average Family Size in Bentleyville borough
Average Family Size in Bentleyville borough is 3.3 People.
What is the Average Household Size in Bentleyville borough
Average Household Size in Bentleyville borough is 2.5 People.
How Large is the Labor Force in Bentleyville borough?
There are 957 People in the Labor Forcein in Bentleyville borough.
What is the Percentage of People in the Labor Force in Bentleyville borough?
52.3% of People are in the Labor Force in Bentleyville borough.
What is the Unemployment Rate in Bentleyville borough?
Unemployment Rate in Bentleyville borough is 4.8%.