Robertsdale, AL Map & Demographics
Robertsdale Map
Robertsdale Overview
$35,633
PER CAPITA INCOME
$71,306
AVG FAMILY INCOME
$55,345
AVG HOUSEHOLD INCOME
27.8%
WAGE / INCOME GAP [ % ]
72.2¢/ $1
WAGE / INCOME GAP [ $ ]
0.53
INEQUALITY / GINI INDEX
6,793
TOTAL POPULATION
3,304
MALE POPULATION
3,489
FEMALE POPULATION
94.70
MALES / 100 FEMALES
105.60
FEMALES / 100 MALES
38.4
MEDIAN AGE
3.2
AVG FAMILY SIZE
2.6
AVG HOUSEHOLD SIZE
3,354
LABOR FORCE [ PEOPLE ]
61.0%
PERCENT IN LABOR FORCE
1.5%
UNEMPLOYMENT RATE
Robertsdale Zip Codes
Robertsdale Area Codes
Income in Robertsdale
Income Overview in Robertsdale
Per Capita Income in Robertsdale is $35,633, while median incomes of families and households are $71,306 and $55,345 respectively.
| Characteristic | Number | Measure |
| Per Capita Income | 6,793 | $35,633 |
| Median Family Income | 1,779 | $71,306 |
| Mean Family Income | 1,779 | $112,951 |
| Median Household Income | 2,525 | $55,345 |
| Mean Household Income | 2,525 | $91,088 |
| Income Deficit | 1,779 | $0 |
| Wage / Income Gap (%) | 6,793 | 27.81% |
| Wage / Income Gap ($) | 6,793 | 72.19¢ per $1 |
| Gini / Inequality Index | 6,793 | 0.53 |
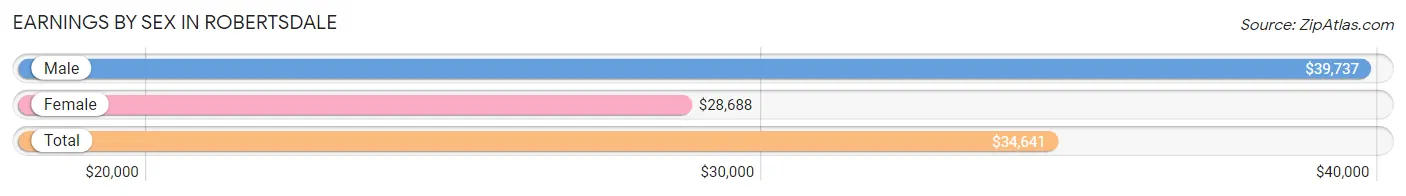
Earnings by Sex in Robertsdale
Average Earnings in Robertsdale are $34,641, $39,737 for men and $28,688 for women, a difference of 27.8%.
| Sex | Number | Average Earnings |
| Male | 1,698 (46.9%) | $39,737 |
| Female | 1,925 (53.1%) | $28,688 |
| Total | 3,623 (100.0%) | $34,641 |
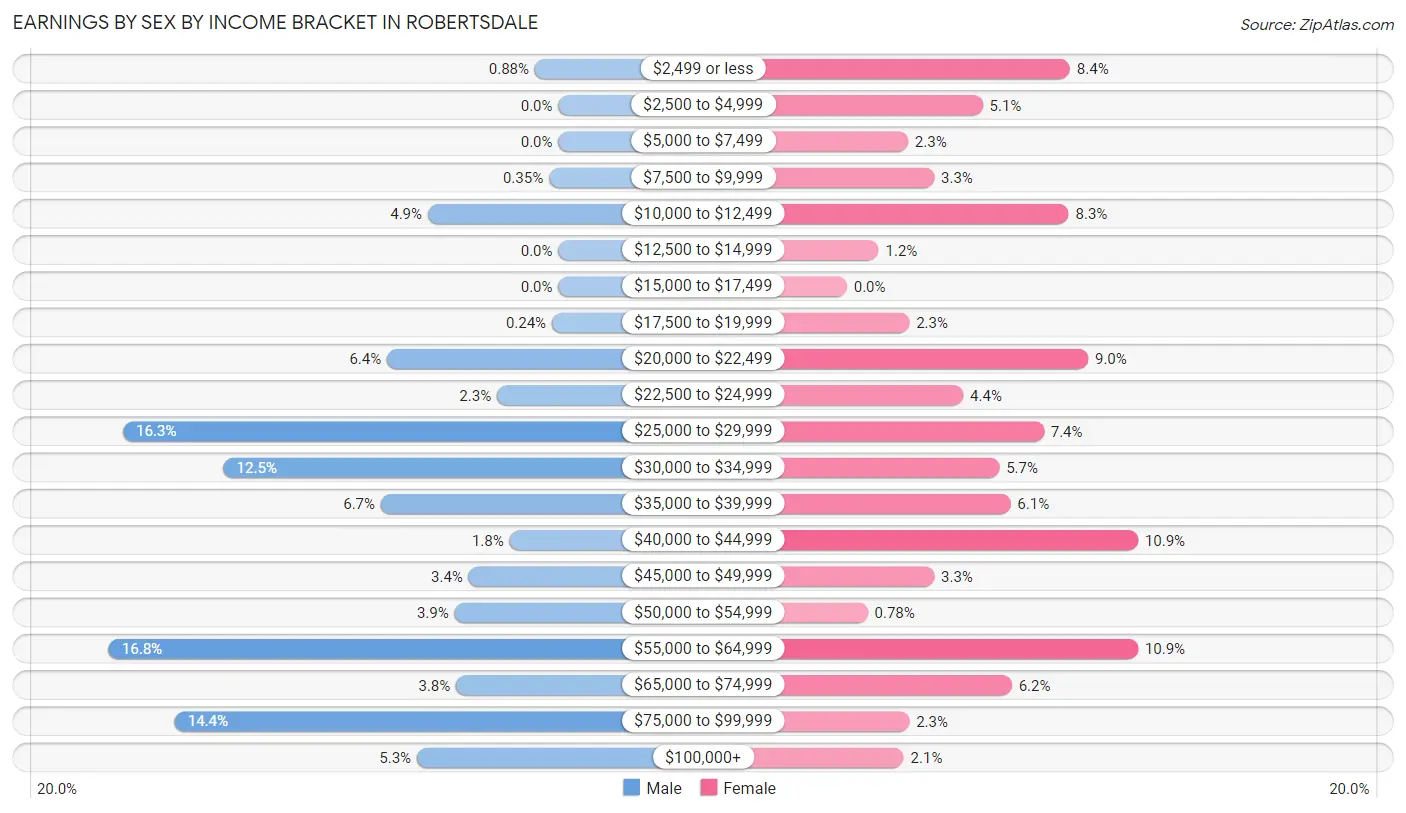
Earnings by Sex by Income Bracket in Robertsdale
The most common earnings brackets in Robertsdale are $55,000 to $64,999 for men (286 | 16.8%) and $40,000 to $44,999 for women (210 | 10.9%).
| Income | Male | Female |
| $2,499 or less | 15 (0.9%) | 161 (8.4%) |
| $2,500 to $4,999 | 0 (0.0%) | 98 (5.1%) |
| $5,000 to $7,499 | 0 (0.0%) | 44 (2.3%) |
| $7,500 to $9,999 | 6 (0.4%) | 63 (3.3%) |
| $10,000 to $12,499 | 83 (4.9%) | 160 (8.3%) |
| $12,500 to $14,999 | 0 (0.0%) | 23 (1.2%) |
| $15,000 to $17,499 | 0 (0.0%) | 0 (0.0%) |
| $17,500 to $19,999 | 4 (0.2%) | 45 (2.3%) |
| $20,000 to $22,499 | 109 (6.4%) | 174 (9.0%) |
| $22,500 to $24,999 | 39 (2.3%) | 84 (4.4%) |
| $25,000 to $29,999 | 277 (16.3%) | 142 (7.4%) |
| $30,000 to $34,999 | 213 (12.5%) | 110 (5.7%) |
| $35,000 to $39,999 | 113 (6.7%) | 118 (6.1%) |
| $40,000 to $44,999 | 31 (1.8%) | 210 (10.9%) |
| $45,000 to $49,999 | 57 (3.4%) | 63 (3.3%) |
| $50,000 to $54,999 | 66 (3.9%) | 15 (0.8%) |
| $55,000 to $64,999 | 286 (16.8%) | 210 (10.9%) |
| $65,000 to $74,999 | 65 (3.8%) | 119 (6.2%) |
| $75,000 to $99,999 | 244 (14.4%) | 45 (2.3%) |
| $100,000+ | 90 (5.3%) | 41 (2.1%) |
| Total | 1,698 (100.0%) | 1,925 (100.0%) |
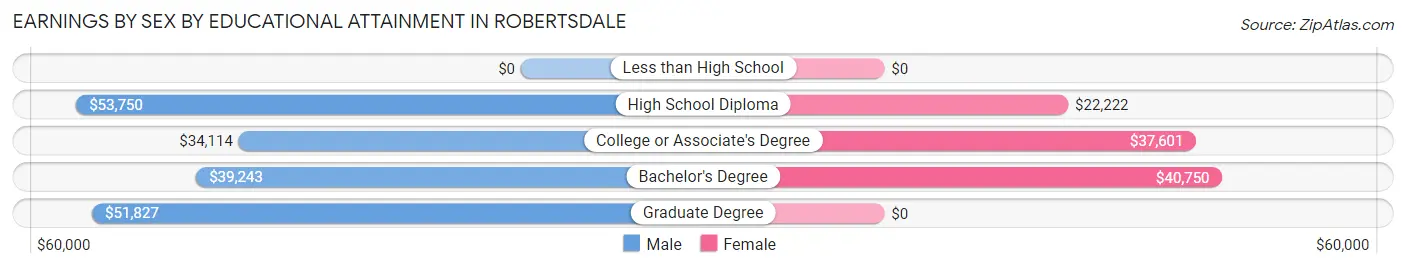
Earnings by Sex by Educational Attainment in Robertsdale
Average earnings in Robertsdale are $41,734 for men and $30,885 for women, a difference of 26.0%. Men with an educational attainment of high school diploma enjoy the highest average annual earnings of $53,750, while those with college or associate's degree education earn the least with $34,114. Women with an educational attainment of bachelor's degree earn the most with the average annual earnings of $40,750, while those with high school diploma education have the smallest earnings of $22,222.
| Educational Attainment | Male Income | Female Income |
| Less than High School | - | - |
| High School Diploma | $53,750 | $22,222 |
| College or Associate's Degree | $34,114 | $37,601 |
| Bachelor's Degree | $39,243 | $40,750 |
| Graduate Degree | $51,827 | $0 |
| Total | $41,734 | $30,885 |
Family Income in Robertsdale
Family Income Brackets in Robertsdale
According to the Robertsdale family income data, there are 475 families falling into the $50,000 to $74,999 income range, which is the most common income bracket and makes up 26.7% of all families. Conversely, the $10,000 to $14,999 income bracket is the least frequent group with only 12 families (0.7%) belonging to this category.
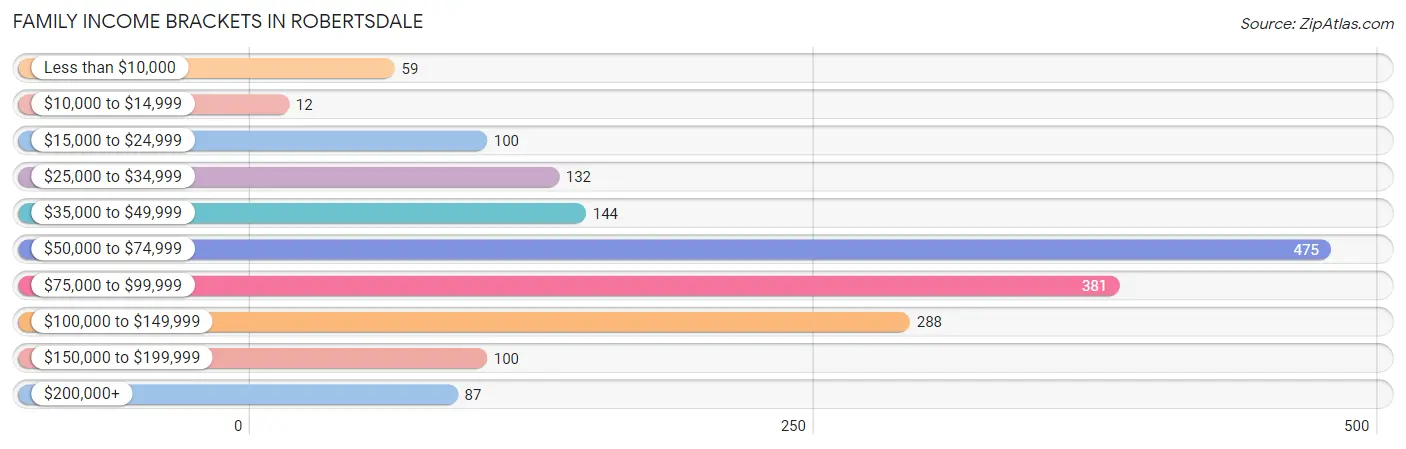
| Income Bracket | # Families | % Families |
| Less than $10,000 | 59 | 3.3% |
| $10,000 to $14,999 | 12 | 0.7% |
| $15,000 to $24,999 | 100 | 5.6% |
| $25,000 to $34,999 | 132 | 7.4% |
| $35,000 to $49,999 | 144 | 8.1% |
| $50,000 to $74,999 | 475 | 26.7% |
| $75,000 to $99,999 | 381 | 21.4% |
| $100,000 to $149,999 | 288 | 16.2% |
| $150,000 to $199,999 | 100 | 5.6% |
| $200,000+ | 87 | 4.9% |
Family Income by Famaliy Size in Robertsdale
5-person families (57 | 3.2%) account for the highest median family income in Robertsdale with $250,001 per family, while 5-person families (57 | 3.2%) have the highest median income of $50,000 per family member.
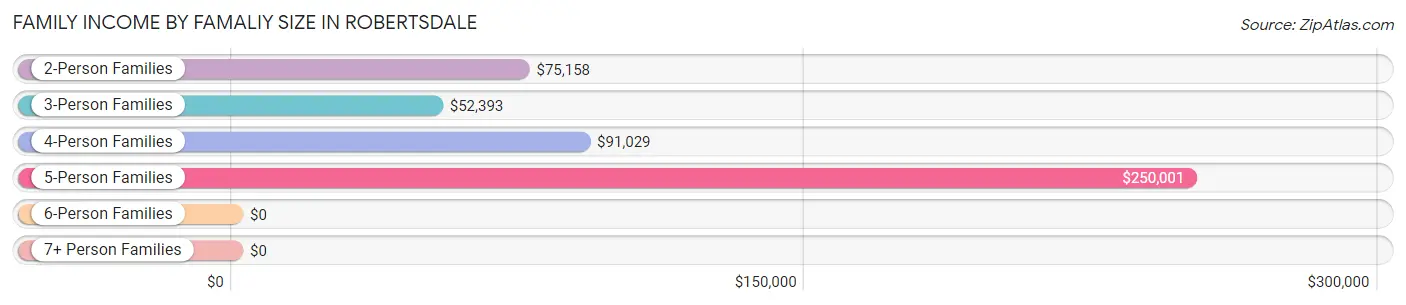
| Income Bracket | # Families | Median Income |
| 2-Person Families | 725 (40.7%) | $75,158 |
| 3-Person Families | 642 (36.1%) | $52,393 |
| 4-Person Families | 332 (18.7%) | $91,029 |
| 5-Person Families | 57 (3.2%) | $250,001 |
| 6-Person Families | 6 (0.3%) | $0 |
| 7+ Person Families | 17 (1.0%) | $0 |
| Total | 1,779 (100.0%) | $71,306 |
Family Income by Number of Earners in Robertsdale
The median family income in Robertsdale is $71,306, with families comprising 3+ earners (122) having the highest median family income of $131,029, while families with no earners (147) have the lowest median family income of $37,917, accounting for 6.9% and 8.3% of families, respectively.
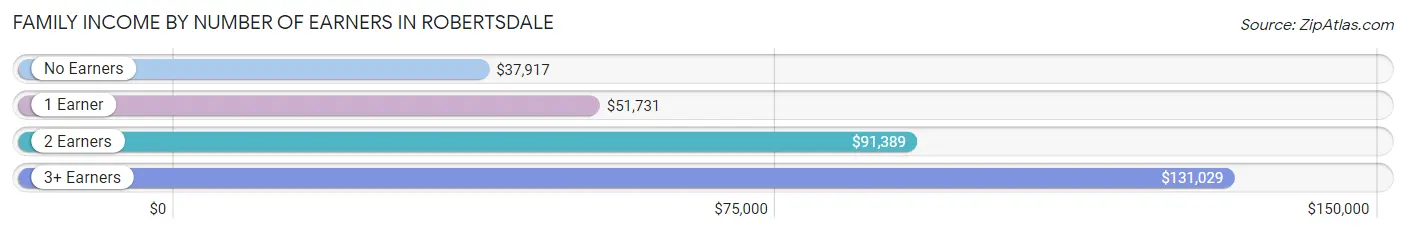
| Number of Earners | # Families | Median Income |
| No Earners | 147 (8.3%) | $37,917 |
| 1 Earner | 584 (32.8%) | $51,731 |
| 2 Earners | 926 (52.0%) | $91,389 |
| 3+ Earners | 122 (6.9%) | $131,029 |
| Total | 1,779 (100.0%) | $71,306 |
Household Income in Robertsdale
Household Income Brackets in Robertsdale
With 586 households falling in the category, the $50,000 to $74,999 income range is the most frequent in Robertsdale, accounting for 23.2% of all households. In contrast, only 58 households (2.3%) fall into the $10,000 to $14,999 income bracket, making it the least populous group.
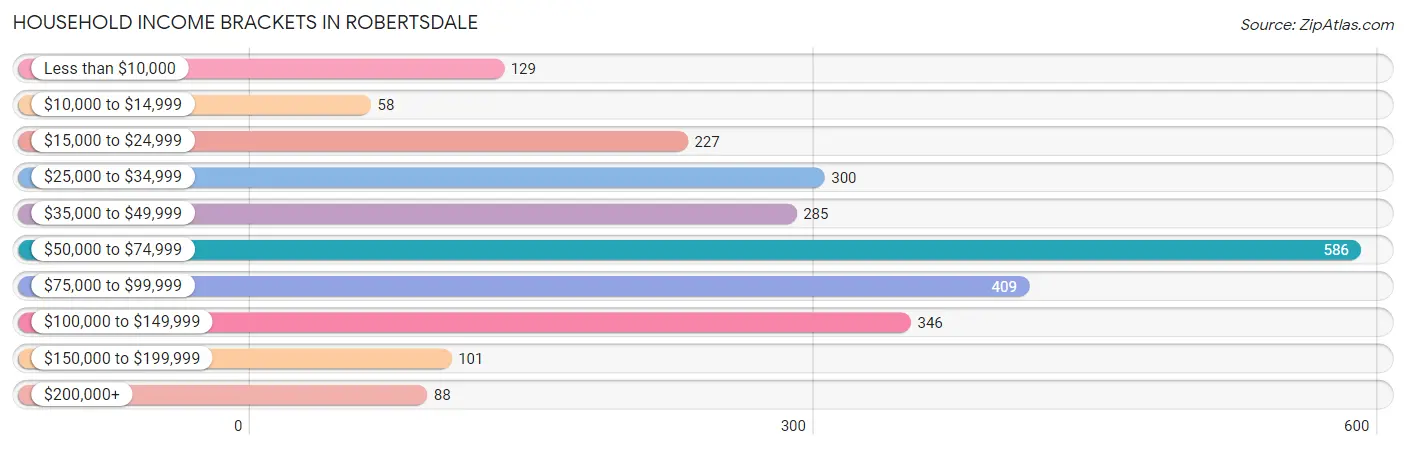
| Income Bracket | # Households | % Households |
| Less than $10,000 | 129 | 5.1% |
| $10,000 to $14,999 | 58 | 2.3% |
| $15,000 to $24,999 | 227 | 9.0% |
| $25,000 to $34,999 | 300 | 11.9% |
| $35,000 to $49,999 | 285 | 11.3% |
| $50,000 to $74,999 | 586 | 23.2% |
| $75,000 to $99,999 | 409 | 16.2% |
| $100,000 to $149,999 | 346 | 13.7% |
| $150,000 to $199,999 | 101 | 4.0% |
| $200,000+ | 88 | 3.5% |
Household Income by Householder Age in Robertsdale
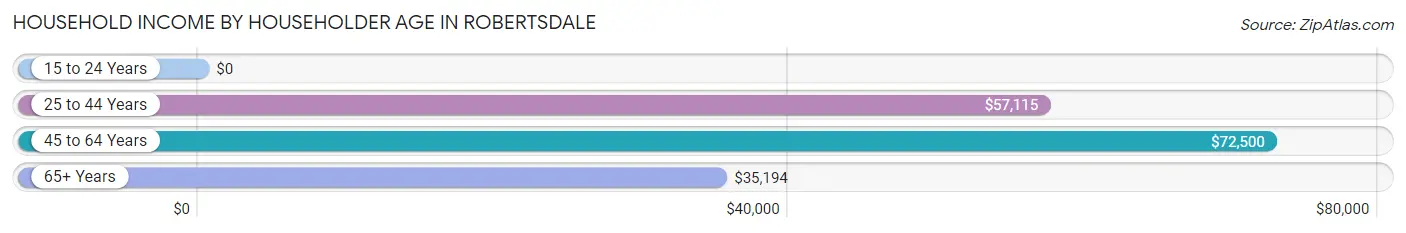
The median household income in Robertsdale is $55,345, with the highest median household income of $72,500 found in the 45 to 64 years age bracket for the primary householder. A total of 756 households (29.9%) fall into this category.
| Income Bracket | # Households | Median Income |
| 15 to 24 Years | 0 (0.0%) | $0 |
| 25 to 44 Years | 1,152 (45.6%) | $57,115 |
| 45 to 64 Years | 756 (29.9%) | $72,500 |
| 65+ Years | 617 (24.4%) | $35,194 |
| Total | 2,525 (100.0%) | $55,345 |
Poverty in Robertsdale
Income Below Poverty by Sex and Age in Robertsdale
With 9.8% poverty level for males and 10.8% for females among the residents of Robertsdale, 5 year old males and 16 and 17 year old females are the most vulnerable to poverty, with 67 males (72.0%) and 48 females (42.1%) in their respective age groups living below the poverty level.
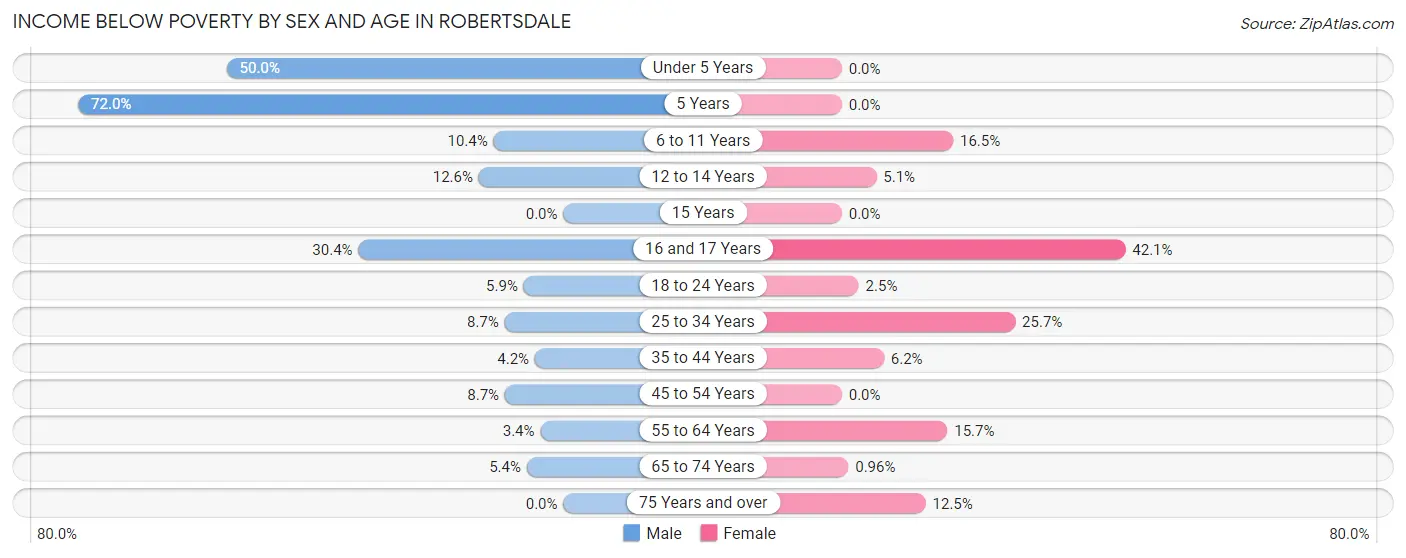
| Age Bracket | Male | Female |
| Under 5 Years | 48 (50.0%) | 0 (0.0%) |
| 5 Years | 67 (72.0%) | 0 (0.0%) |
| 6 to 11 Years | 28 (10.4%) | 37 (16.5%) |
| 12 to 14 Years | 25 (12.6%) | 6 (5.1%) |
| 15 Years | 0 (0.0%) | 0 (0.0%) |
| 16 and 17 Years | 7 (30.4%) | 48 (42.1%) |
| 18 to 24 Years | 26 (5.9%) | 4 (2.5%) |
| 25 to 34 Years | 47 (8.7%) | 121 (25.7%) |
| 35 to 44 Years | 24 (4.2%) | 46 (6.2%) |
| 45 to 54 Years | 23 (8.7%) | 0 (0.0%) |
| 55 to 64 Years | 12 (3.4%) | 71 (15.7%) |
| 65 to 74 Years | 10 (5.4%) | 3 (1.0%) |
| 75 Years and over | 0 (0.0%) | 31 (12.4%) |
| Total | 317 (9.8%) | 367 (10.8%) |
Income Above Poverty by Sex and Age in Robertsdale
According to the poverty statistics in Robertsdale, males aged 15 years and females aged under 5 years are the age groups that are most secure financially, with 100.0% of males and 100.0% of females in these age groups living above the poverty line.
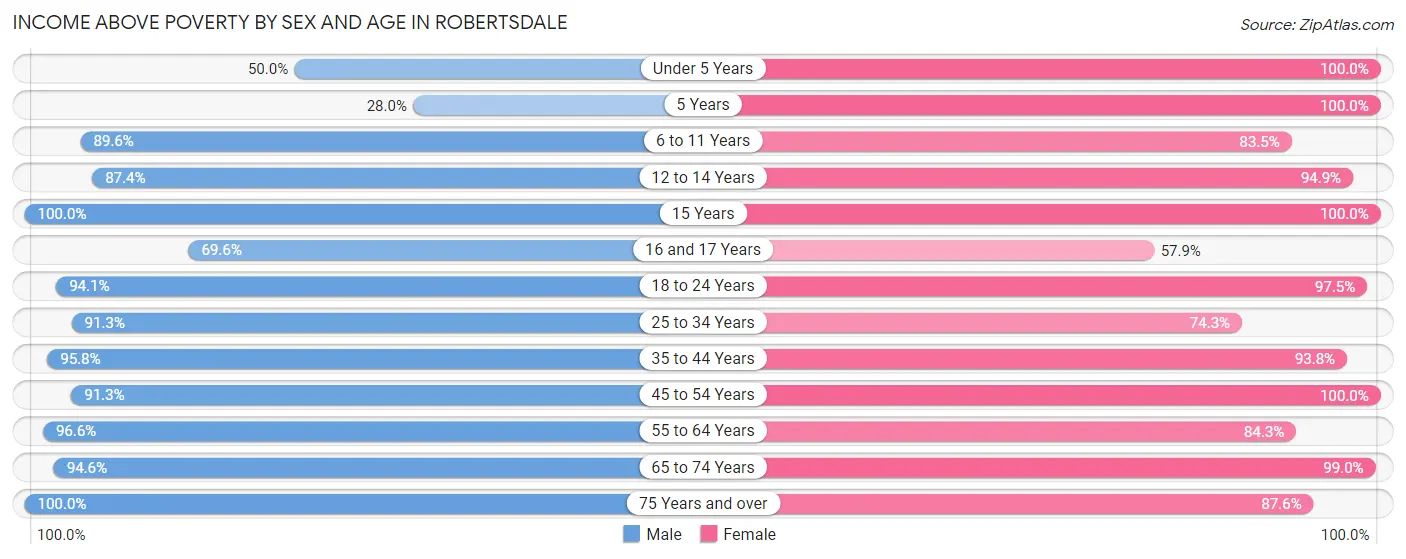
| Age Bracket | Male | Female |
| Under 5 Years | 48 (50.0%) | 180 (100.0%) |
| 5 Years | 26 (28.0%) | 7 (100.0%) |
| 6 to 11 Years | 242 (89.6%) | 187 (83.5%) |
| 12 to 14 Years | 174 (87.4%) | 111 (94.9%) |
| 15 Years | 72 (100.0%) | 33 (100.0%) |
| 16 and 17 Years | 16 (69.6%) | 66 (57.9%) |
| 18 to 24 Years | 416 (94.1%) | 156 (97.5%) |
| 25 to 34 Years | 492 (91.3%) | 349 (74.3%) |
| 35 to 44 Years | 545 (95.8%) | 691 (93.8%) |
| 45 to 54 Years | 242 (91.3%) | 342 (100.0%) |
| 55 to 64 Years | 340 (96.6%) | 382 (84.3%) |
| 65 to 74 Years | 174 (94.6%) | 310 (99.0%) |
| 75 Years and over | 123 (100.0%) | 218 (87.5%) |
| Total | 2,910 (90.2%) | 3,032 (89.2%) |
Income Below Poverty Among Married-Couple Families in Robertsdale
The poverty statistics for married-couple families in Robertsdale show that 1.0% or 13 of the total 1,340 families live below the poverty line. Families with no children have the highest poverty rate of 1.4%, comprising of 13 families. On the other hand, families with 1 or 2 children have the lowest poverty rate of 0.0%, which includes 0 families.
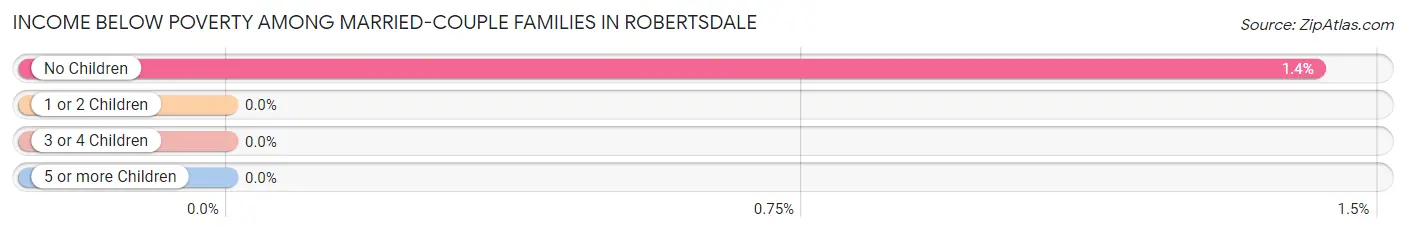
| Children | Above Poverty | Below Poverty |
| No Children | 905 (98.6%) | 13 (1.4%) |
| 1 or 2 Children | 353 (100.0%) | 0 (0.0%) |
| 3 or 4 Children | 69 (100.0%) | 0 (0.0%) |
| 5 or more Children | 0 (0.0%) | 0 (0.0%) |
| Total | 1,327 (99.0%) | 13 (1.0%) |
Income Below Poverty Among Single-Parent Households in Robertsdale
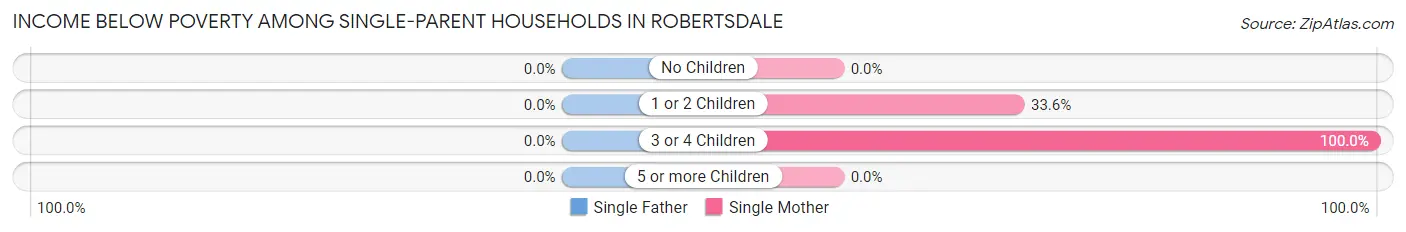
| Children | Single Father | Single Mother |
| No Children | 0 (0.0%) | 0 (0.0%) |
| 1 or 2 Children | 0 (0.0%) | 83 (33.6%) |
| 3 or 4 Children | 0 (0.0%) | 25 (100.0%) |
| 5 or more Children | 0 (0.0%) | 0 (0.0%) |
| Total | 0 (0.0%) | 108 (27.1%) |
Income Below Poverty Among Married-Couple vs Single-Parent Households in Robertsdale
The poverty data for Robertsdale shows that 13 of the married-couple family households (1.0%) and 108 of the single-parent households (24.6%) are living below the poverty level. Within the married-couple family households, those with no children have the highest poverty rate, with 13 households (1.4%) falling below the poverty line. Among the single-parent households, those with 3 or 4 children have the highest poverty rate, with 25 household (58.1%) living below poverty.
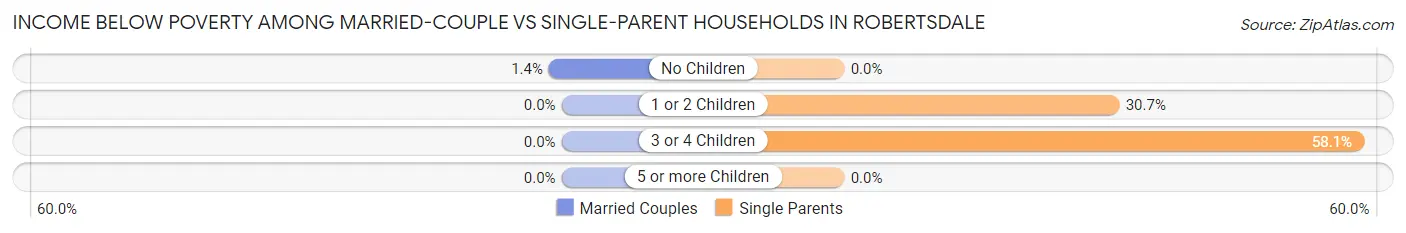
| Children | Married-Couple Families | Single-Parent Households |
| No Children | 13 (1.4%) | 0 (0.0%) |
| 1 or 2 Children | 0 (0.0%) | 83 (30.7%) |
| 3 or 4 Children | 0 (0.0%) | 25 (58.1%) |
| 5 or more Children | 0 (0.0%) | 0 (0.0%) |
| Total | 13 (1.0%) | 108 (24.6%) |
Race in Robertsdale
The most populous races in Robertsdale are White / Caucasian (5,683 | 83.7%), Black / African American (846 | 12.4%), and Hispanic or Latino (490 | 7.2%).
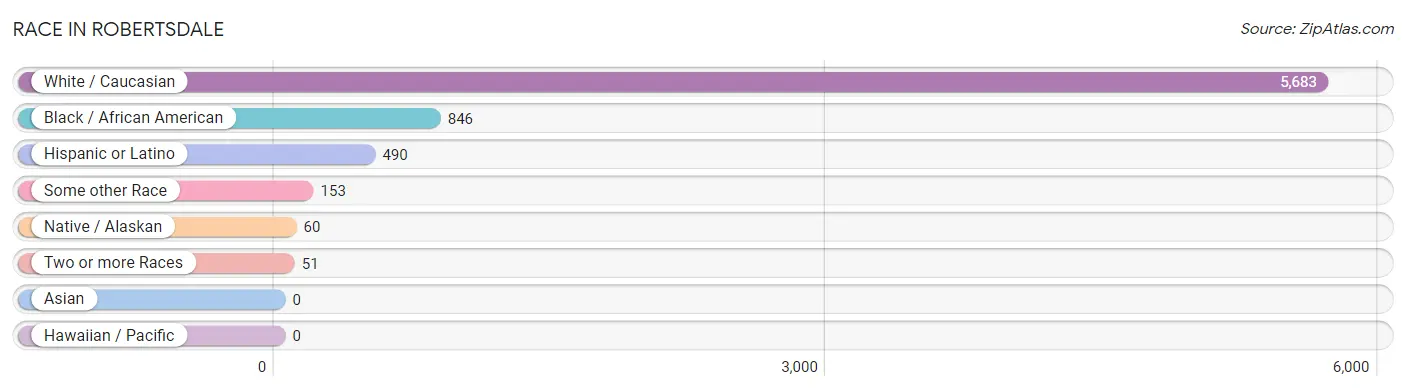
| Race | # Population | % Population |
| Asian | 0 | 0.0% |
| Black / African American | 846 | 12.4% |
| Hawaiian / Pacific | 0 | 0.0% |
| Hispanic or Latino | 490 | 7.2% |
| Native / Alaskan | 60 | 0.9% |
| White / Caucasian | 5,683 | 83.7% |
| Two or more Races | 51 | 0.7% |
| Some other Race | 153 | 2.2% |
| Total | 6,793 | 100.0% |
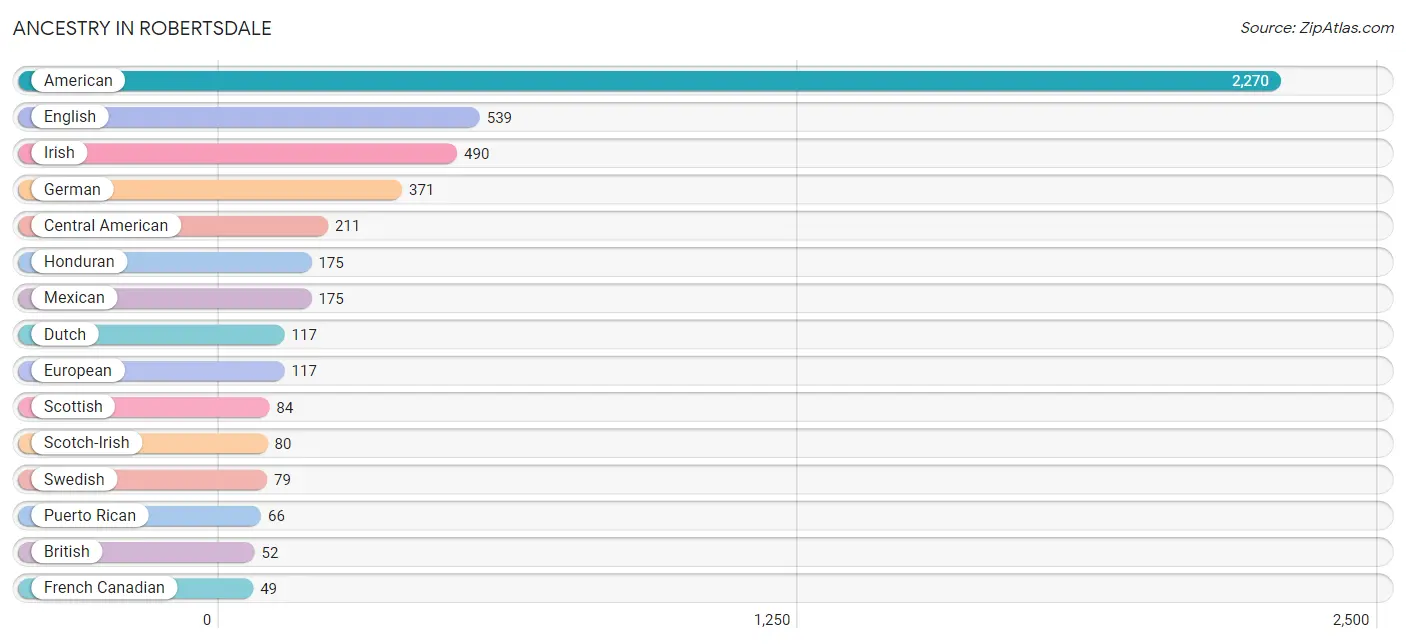
Ancestry in Robertsdale
The most populous ancestries reported in Robertsdale are American (2,270 | 33.4%), English (539 | 7.9%), Irish (490 | 7.2%), German (371 | 5.5%), and Central American (211 | 3.1%), together accounting for 57.1% of all Robertsdale residents.
| Ancestry | # Population | % Population |
| African | 12 | 0.2% |
| American | 2,270 | 33.4% |
| Brazilian | 6 | 0.1% |
| British | 52 | 0.8% |
| British West Indian | 14 | 0.2% |
| Cajun | 13 | 0.2% |
| Central American | 211 | 3.1% |
| Creek | 28 | 0.4% |
| Czech | 16 | 0.2% |
| Czechoslovakian | 6 | 0.1% |
| Dutch | 117 | 1.7% |
| English | 539 | 7.9% |
| European | 117 | 1.7% |
| French | 19 | 0.3% |
| French Canadian | 49 | 0.7% |
| German | 371 | 5.5% |
| Greek | 11 | 0.2% |
| Honduran | 175 | 2.6% |
| Irish | 490 | 7.2% |
| Italian | 22 | 0.3% |
| Jamaican | 16 | 0.2% |
| Mexican | 175 | 2.6% |
| Norwegian | 4 | 0.1% |
| Polish | 39 | 0.6% |
| Puerto Rican | 66 | 1.0% |
| Salvadoran | 36 | 0.5% |
| Scandinavian | 2 | 0.0% |
| Scotch-Irish | 80 | 1.2% |
| Scottish | 84 | 1.2% |
| Subsaharan African | 12 | 0.2% |
| Swedish | 79 | 1.2% |
| Welsh | 27 | 0.4% | View All 32 Rows |
Immigrants in Robertsdale
The most numerous immigrant groups reported in Robertsdale came from Latin America (161 | 2.4%), Central America (141 | 2.1%), Mexico (73 | 1.1%), Honduras (44 | 0.6%), and El Salvador (24 | 0.4%), together accounting for 6.5% of all Robertsdale residents.
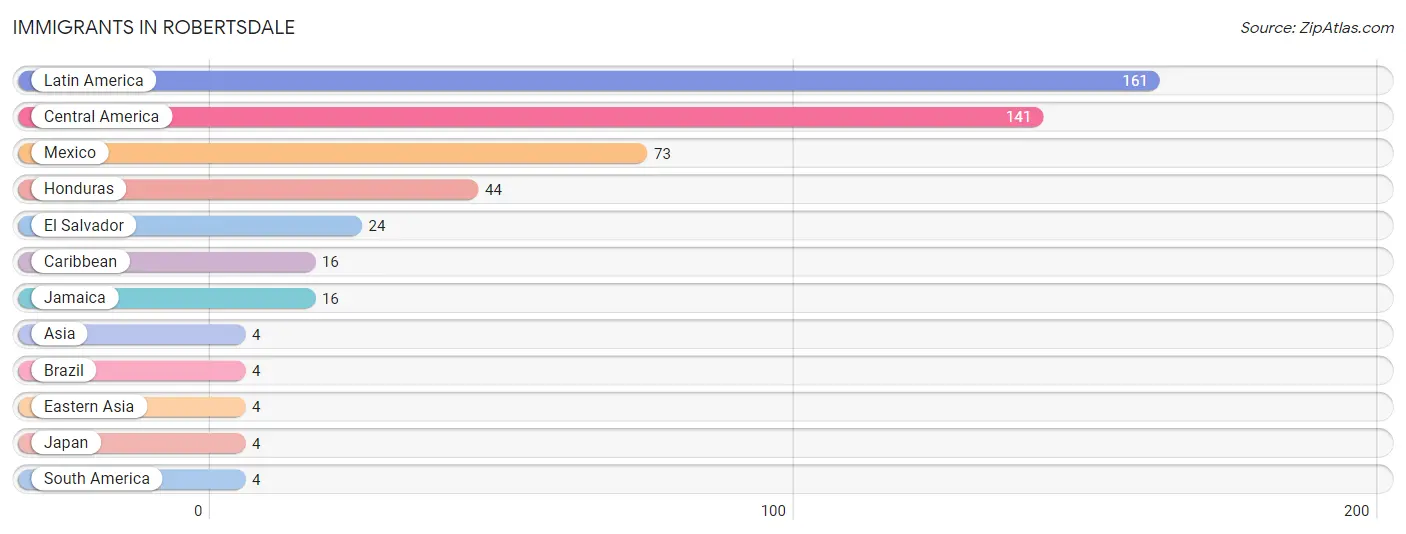
| Immigration Origin | # Population | % Population |
| Asia | 4 | 0.1% |
| Brazil | 4 | 0.1% |
| Caribbean | 16 | 0.2% |
| Central America | 141 | 2.1% |
| Eastern Asia | 4 | 0.1% |
| El Salvador | 24 | 0.4% |
| Honduras | 44 | 0.6% |
| Jamaica | 16 | 0.2% |
| Japan | 4 | 0.1% |
| Latin America | 161 | 2.4% |
| Mexico | 73 | 1.1% |
| South America | 4 | 0.1% | View All 12 Rows |
Sex and Age in Robertsdale
Sex and Age in Robertsdale
The most populous age groups in Robertsdale are 10 to 14 Years (337 | 10.2%) for men and 35 to 39 Years (489 | 14.0%) for women.
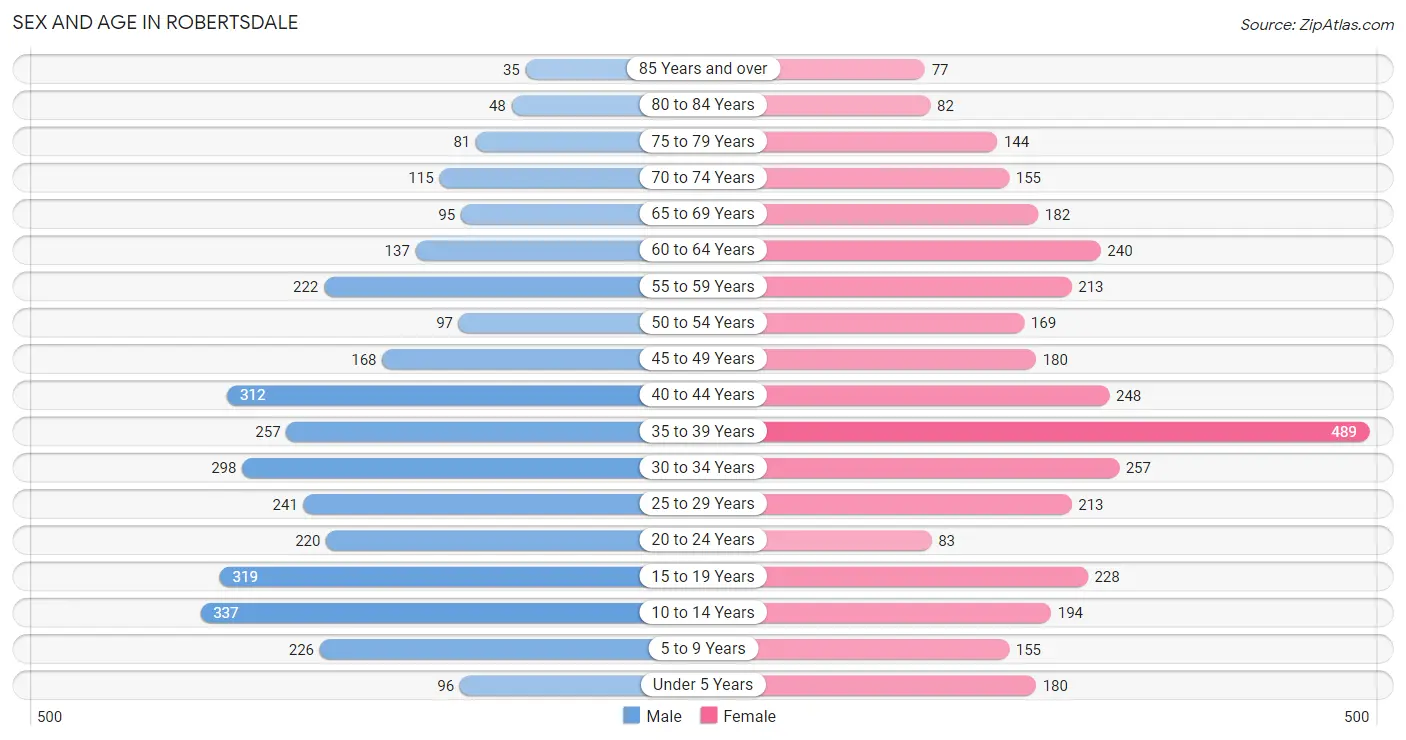
| Age Bracket | Male | Female |
| Under 5 Years | 96 (2.9%) | 180 (5.2%) |
| 5 to 9 Years | 226 (6.8%) | 155 (4.4%) |
| 10 to 14 Years | 337 (10.2%) | 194 (5.6%) |
| 15 to 19 Years | 319 (9.7%) | 228 (6.5%) |
| 20 to 24 Years | 220 (6.7%) | 83 (2.4%) |
| 25 to 29 Years | 241 (7.3%) | 213 (6.1%) |
| 30 to 34 Years | 298 (9.0%) | 257 (7.4%) |
| 35 to 39 Years | 257 (7.8%) | 489 (14.0%) |
| 40 to 44 Years | 312 (9.4%) | 248 (7.1%) |
| 45 to 49 Years | 168 (5.1%) | 180 (5.2%) |
| 50 to 54 Years | 97 (2.9%) | 169 (4.8%) |
| 55 to 59 Years | 222 (6.7%) | 213 (6.1%) |
| 60 to 64 Years | 137 (4.2%) | 240 (6.9%) |
| 65 to 69 Years | 95 (2.9%) | 182 (5.2%) |
| 70 to 74 Years | 115 (3.5%) | 155 (4.4%) |
| 75 to 79 Years | 81 (2.5%) | 144 (4.1%) |
| 80 to 84 Years | 48 (1.5%) | 82 (2.4%) |
| 85 Years and over | 35 (1.1%) | 77 (2.2%) |
| Total | 3,304 (100.0%) | 3,489 (100.0%) |
Families and Households in Robertsdale
Median Family Size in Robertsdale
The median family size in Robertsdale is 3.16 persons per family, with single female/mother families (398 | 22.4%) accounting for the largest median family size of 3.71 persons per family. On the other hand, married-couple families (1,340 | 75.3%) represent the smallest median family size with 2.98 persons per family.
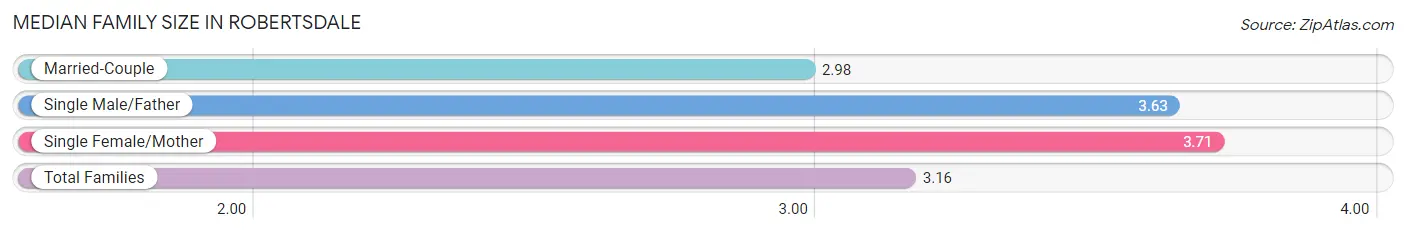
| Family Type | # Families | Family Size |
| Married-Couple | 1,340 (75.3%) | 2.98 |
| Single Male/Father | 41 (2.3%) | 3.63 |
| Single Female/Mother | 398 (22.4%) | 3.71 |
| Total Families | 1,779 (100.0%) | 3.16 |
Median Household Size in Robertsdale
The median household size in Robertsdale is 2.61 persons per household, with single male/father households (41 | 1.6%) accounting for the largest median household size of 3.98 persons per household. non-family households (746 | 29.5%) represent the smallest median household size with 1.14 persons per household.
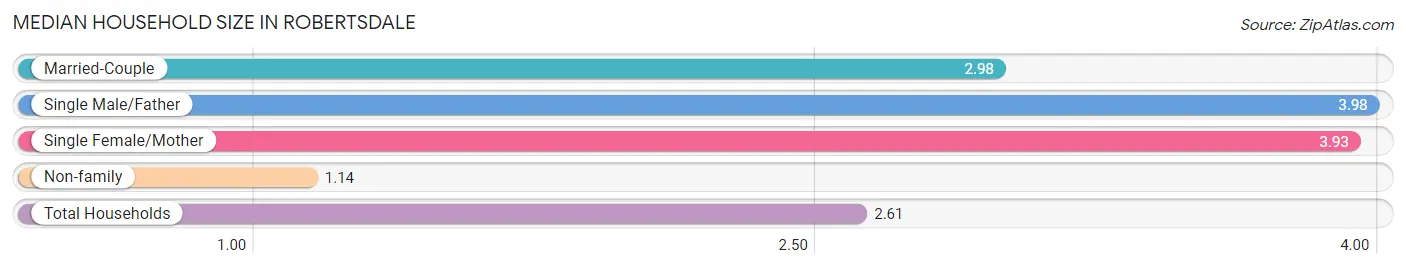
| Household Type | # Households | Household Size |
| Married-Couple | 1,340 (53.1%) | 2.98 |
| Single Male/Father | 41 (1.6%) | 3.98 |
| Single Female/Mother | 398 (15.8%) | 3.93 |
| Non-family | 746 (29.5%) | 1.14 |
| Total Households | 2,525 (100.0%) | 2.61 |
Household Size by Marriage Status in Robertsdale
Out of a total of 2,525 households in Robertsdale, 1,779 (70.5%) are family households, while 746 (29.5%) are nonfamily households. The most numerous type of family households are 2-person households, comprising 715, and the most common type of nonfamily households are 1-person households, comprising 675.
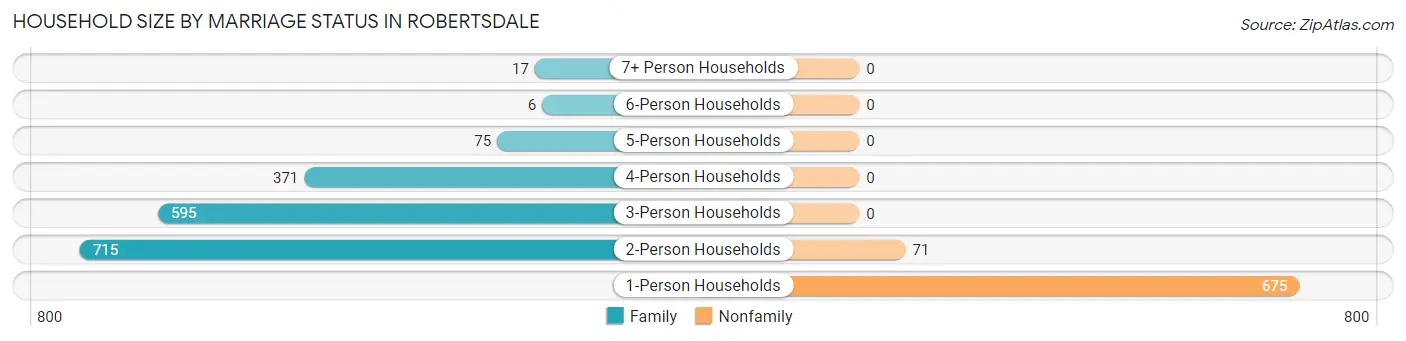
| Household Size | Family Households | Nonfamily Households |
| 1-Person Households | - | 675 (26.7%) |
| 2-Person Households | 715 (28.3%) | 71 (2.8%) |
| 3-Person Households | 595 (23.6%) | 0 (0.0%) |
| 4-Person Households | 371 (14.7%) | 0 (0.0%) |
| 5-Person Households | 75 (3.0%) | 0 (0.0%) |
| 6-Person Households | 6 (0.2%) | 0 (0.0%) |
| 7+ Person Households | 17 (0.7%) | 0 (0.0%) |
| Total | 1,779 (70.5%) | 746 (29.5%) |
Female Fertility in Robertsdale
Fertility by Age in Robertsdale
Average fertility rate in Robertsdale is 3.0 births per 1,000 women. Women in the age bracket of 20 to 34 years have the highest fertility rate with 11.0 births per 1,000 women. Women in the age bracket of 20 to 34 years acount for 100.0% of all women with births.
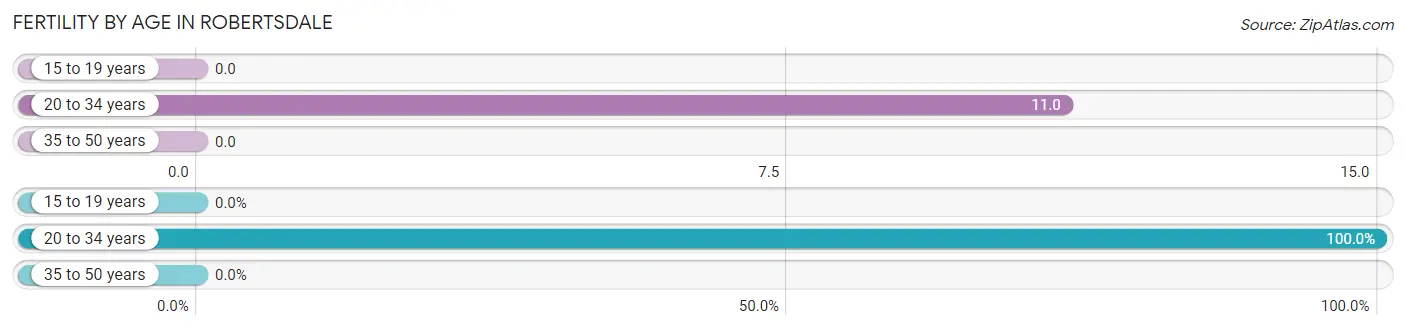
| Age Bracket | Women with Births | Births / 1,000 Women |
| 15 to 19 years | 0 (0.0%) | 0.0 |
| 20 to 34 years | 6 (100.0%) | 11.0 |
| 35 to 50 years | 0 (0.0%) | 0.0 |
| Total | 6 (100.0%) | 3.0 |
Fertility by Age by Marriage Status in Robertsdale
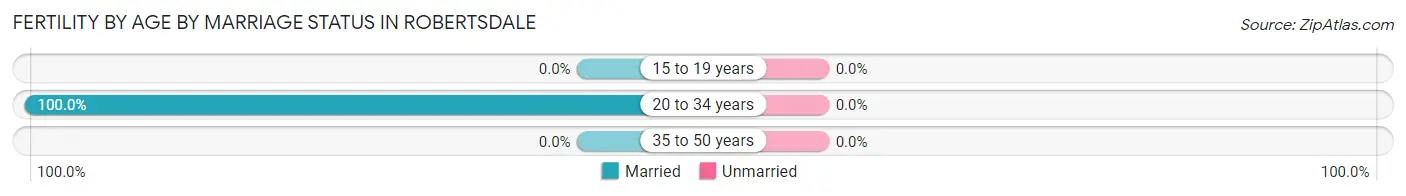
| Age Bracket | Married | Unmarried |
| 15 to 19 years | 0 (0.0%) | 0 (0.0%) |
| 20 to 34 years | 6 (100.0%) | 0 (0.0%) |
| 35 to 50 years | 0 (0.0%) | 0 (0.0%) |
| Total | 6 (100.0%) | 0 (0.0%) |
Fertility by Education in Robertsdale
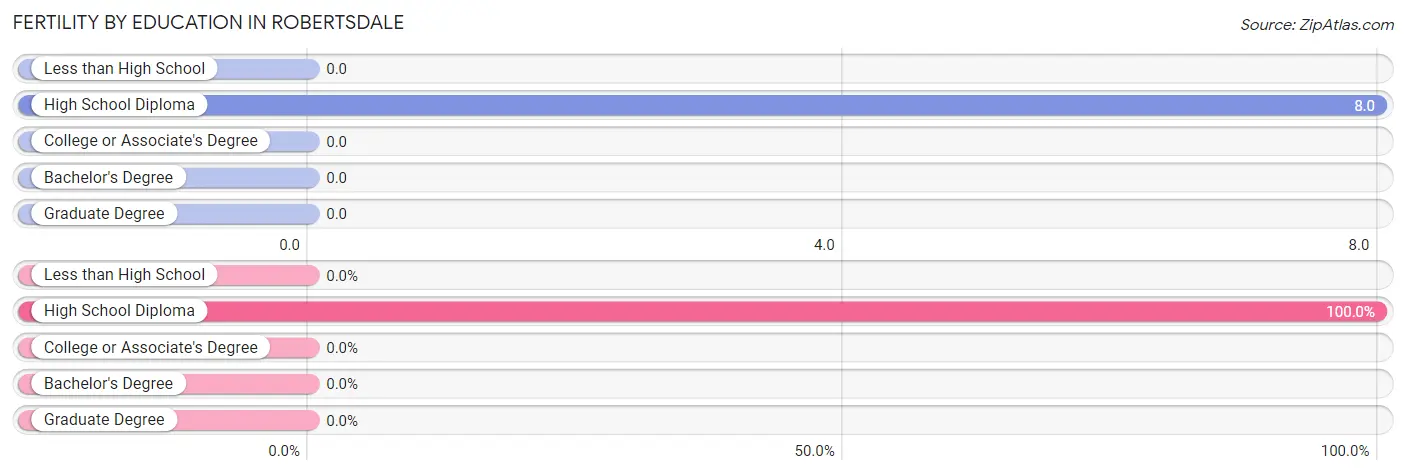
| Educational Attainment | Women with Births | Births / 1,000 Women |
| Less than High School | 0 (0.0%) | 0.0 |
| High School Diploma | 6 (100.0%) | 8.0 |
| College or Associate's Degree | 0 (0.0%) | 0.0 |
| Bachelor's Degree | 0 (0.0%) | 0.0 |
| Graduate Degree | 0 (0.0%) | 0.0 |
| Total | 6 (100.0%) | 3.0 |
Fertility by Education by Marriage Status in Robertsdale
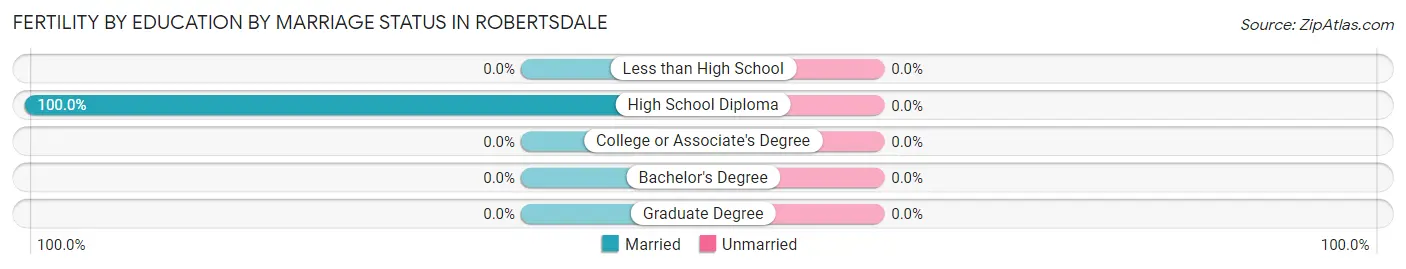
| Educational Attainment | Married | Unmarried |
| Less than High School | 0 (0.0%) | 0 (0.0%) |
| High School Diploma | 6 (100.0%) | 0 (0.0%) |
| College or Associate's Degree | 0 (0.0%) | 0 (0.0%) |
| Bachelor's Degree | 0 (0.0%) | 0 (0.0%) |
| Graduate Degree | 0 (0.0%) | 0 (0.0%) |
| Total | 6 (100.0%) | 0 (0.0%) |
Employment Characteristics in Robertsdale
Employment by Class of Employer in Robertsdale
Among the 3,226 employed individuals in Robertsdale, private company employees (2,446 | 75.8%), local government employees (339 | 10.5%), and self-employed (not incorporated) (137 | 4.3%) make up the most common classes of employment.
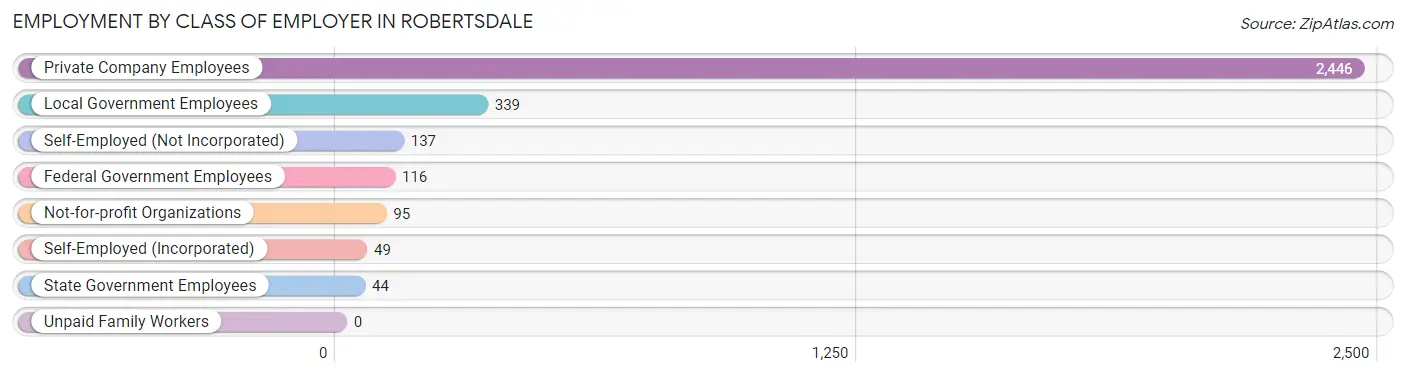
| Employer Class | # Employees | % Employees |
| Private Company Employees | 2,446 | 75.8% |
| Self-Employed (Incorporated) | 49 | 1.5% |
| Self-Employed (Not Incorporated) | 137 | 4.3% |
| Not-for-profit Organizations | 95 | 2.9% |
| Local Government Employees | 339 | 10.5% |
| State Government Employees | 44 | 1.4% |
| Federal Government Employees | 116 | 3.6% |
| Unpaid Family Workers | 0 | 0.0% |
| Total | 3,226 | 100.0% |
Employment Status by Age in Robertsdale
According to the labor force statistics for Robertsdale, out of the total population over 16 years of age (5,498), 61.0% or 3,354 individuals are in the labor force, with 1.5% or 50 of them unemployed. The age group with the highest labor force participation rate is 25 to 29 years, with 92.1% or 418 individuals in the labor force. Within the labor force, the 25 to 29 years age range has the highest percentage of unemployed individuals, with 6.0% or 25 of them being unemployed.
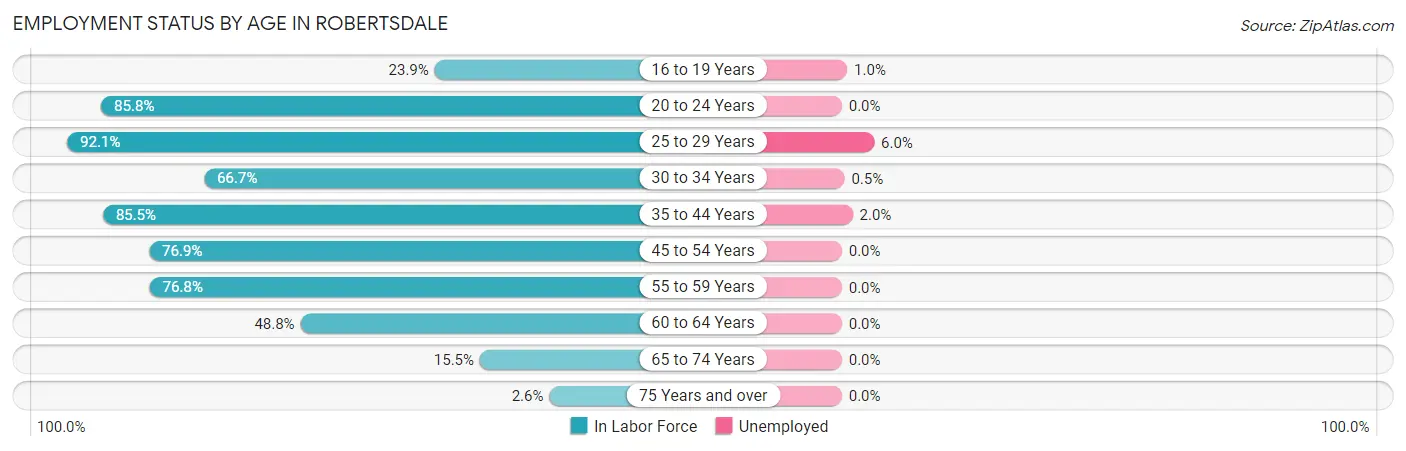
| Age Bracket | In Labor Force | Unemployed |
| 16 to 19 Years | 105 (23.9%) | 1 (1.0%) |
| 20 to 24 Years | 260 (85.8%) | 0 (0.0%) |
| 25 to 29 Years | 418 (92.1%) | 25 (6.0%) |
| 30 to 34 Years | 370 (66.7%) | 2 (0.5%) |
| 35 to 44 Years | 1,117 (85.5%) | 22 (2.0%) |
| 45 to 54 Years | 472 (76.9%) | 0 (0.0%) |
| 55 to 59 Years | 334 (76.8%) | 0 (0.0%) |
| 60 to 64 Years | 184 (48.8%) | 0 (0.0%) |
| 65 to 74 Years | 85 (15.5%) | 0 (0.0%) |
| 75 Years and over | 12 (2.6%) | 0 (0.0%) |
| Total | 3,354 (61.0%) | 50 (1.5%) |
Employment Status by Educational Attainment in Robertsdale
According to labor force statistics for Robertsdale, 77.4% of individuals (2,896) out of the total population between 25 and 64 years of age (3,741) are in the labor force, with 1.7% or 49 of them being unemployed. The group with the highest labor force participation rate are those with the educational attainment of bachelor's degree or higher, with 82.4% or 402 individuals in the labor force. Within the labor force, individuals with high school diploma education have the highest percentage of unemployment, with 3.6% or 47 of them being unemployed.
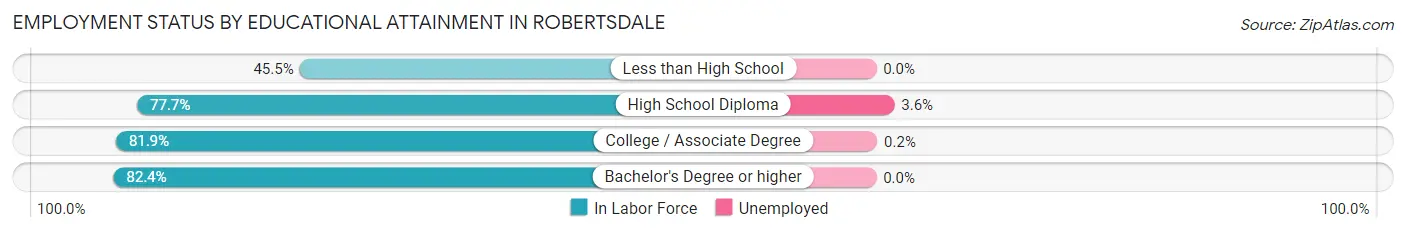
| Educational Attainment | In Labor Force | Unemployed |
| Less than High School | 126 (45.5%) | 0 (0.0%) |
| High School Diploma | 1,298 (77.7%) | 60 (3.6%) |
| College / Associate Degree | 1,070 (81.9%) | 3 (0.2%) |
| Bachelor's Degree or higher | 402 (82.4%) | 0 (0.0%) |
| Total | 2,896 (77.4%) | 64 (1.7%) |
Employment Occupations by Sex in Robertsdale
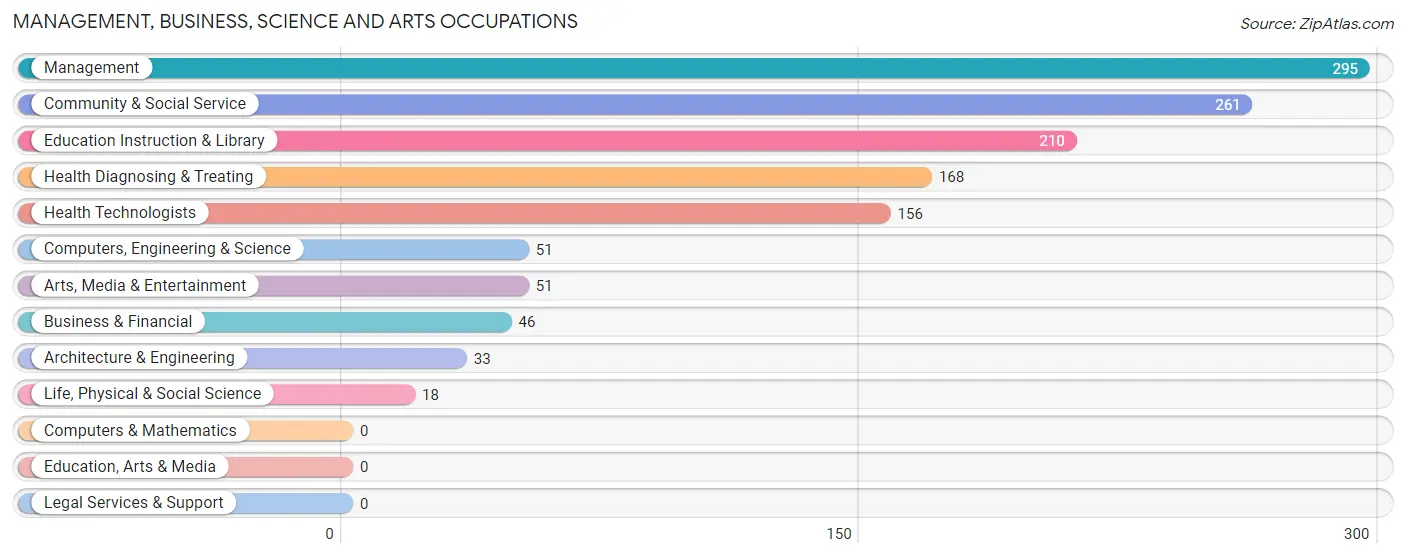
Management, Business, Science and Arts Occupations
The most common Management, Business, Science and Arts occupations in Robertsdale are Management (295 | 8.9%), Community & Social Service (261 | 7.9%), Education Instruction & Library (210 | 6.4%), Health Diagnosing & Treating (168 | 5.1%), and Health Technologists (156 | 4.7%).
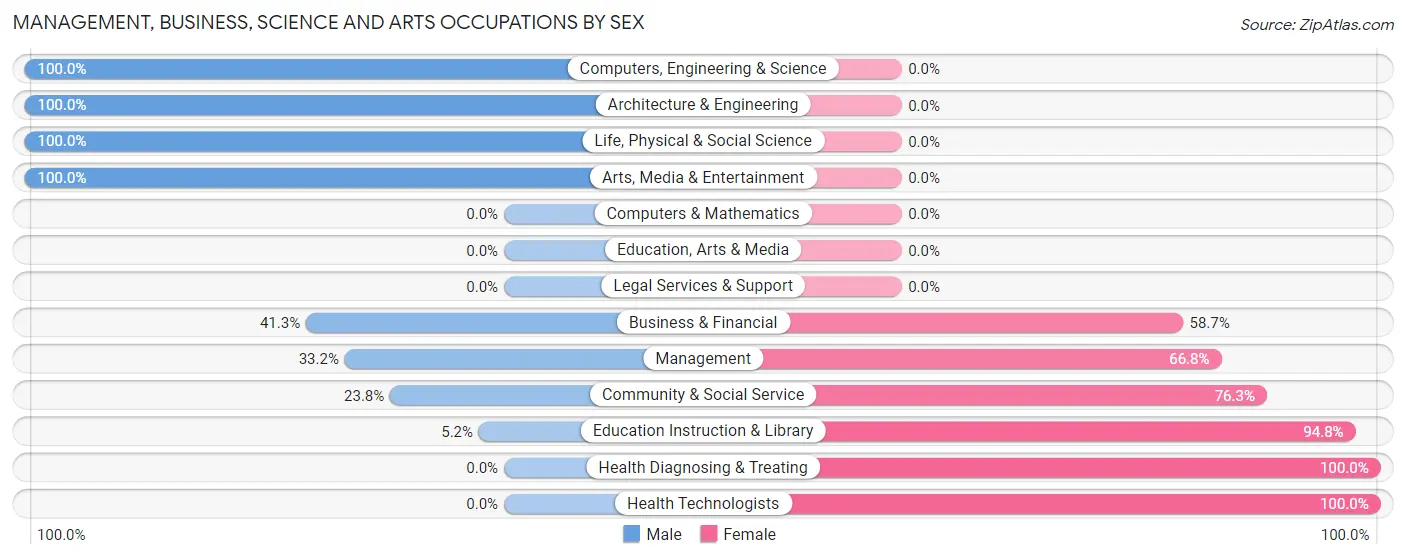
Management, Business, Science and Arts Occupations by Sex
Within the Management, Business, Science and Arts occupations in Robertsdale, the most male-oriented occupations are Computers, Engineering & Science (100.0%), Architecture & Engineering (100.0%), and Life, Physical & Social Science (100.0%), while the most female-oriented occupations are Health Diagnosing & Treating (100.0%), Health Technologists (100.0%), and Education Instruction & Library (94.8%).
| Occupation | Male | Female |
| Management | 98 (33.2%) | 197 (66.8%) |
| Business & Financial | 19 (41.3%) | 27 (58.7%) |
| Computers, Engineering & Science | 51 (100.0%) | 0 (0.0%) |
| Computers & Mathematics | 0 (0.0%) | 0 (0.0%) |
| Architecture & Engineering | 33 (100.0%) | 0 (0.0%) |
| Life, Physical & Social Science | 18 (100.0%) | 0 (0.0%) |
| Community & Social Service | 62 (23.7%) | 199 (76.2%) |
| Education, Arts & Media | 0 (0.0%) | 0 (0.0%) |
| Legal Services & Support | 0 (0.0%) | 0 (0.0%) |
| Education Instruction & Library | 11 (5.2%) | 199 (94.8%) |
| Arts, Media & Entertainment | 51 (100.0%) | 0 (0.0%) |
| Health Diagnosing & Treating | 0 (0.0%) | 168 (100.0%) |
| Health Technologists | 0 (0.0%) | 156 (100.0%) |
| Total (Category) | 230 (28.0%) | 591 (72.0%) |
| Total (Overall) | 1,671 (50.6%) | 1,633 (49.4%) |
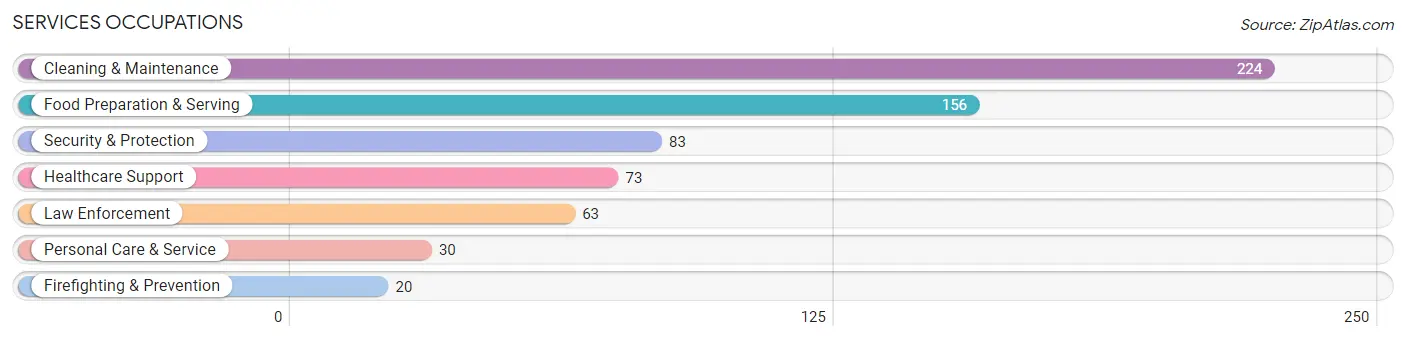
Services Occupations
The most common Services occupations in Robertsdale are Cleaning & Maintenance (224 | 6.8%), Food Preparation & Serving (156 | 4.7%), Security & Protection (83 | 2.5%), Healthcare Support (73 | 2.2%), and Law Enforcement (63 | 1.9%).
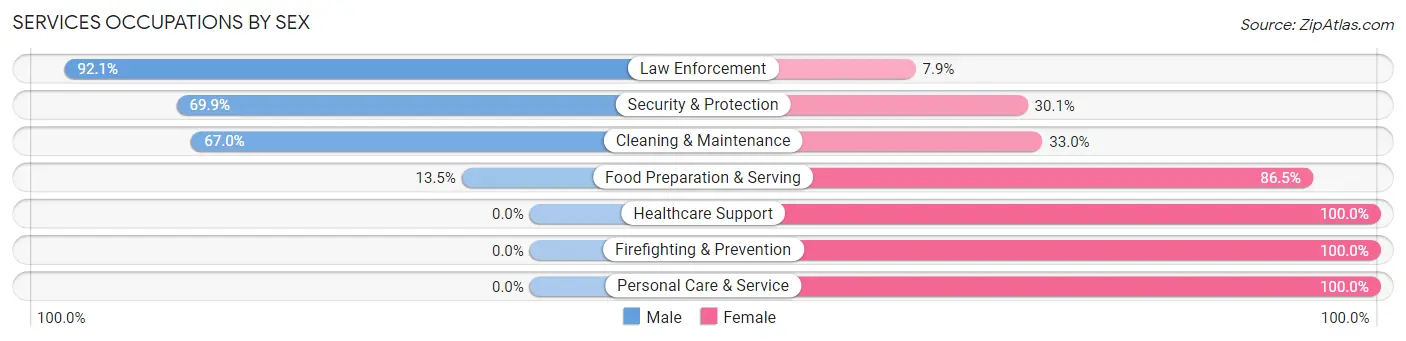
Services Occupations by Sex
Within the Services occupations in Robertsdale, the most male-oriented occupations are Law Enforcement (92.1%), Security & Protection (69.9%), and Cleaning & Maintenance (67.0%), while the most female-oriented occupations are Healthcare Support (100.0%), Firefighting & Prevention (100.0%), and Personal Care & Service (100.0%).
| Occupation | Male | Female |
| Healthcare Support | 0 (0.0%) | 73 (100.0%) |
| Security & Protection | 58 (69.9%) | 25 (30.1%) |
| Firefighting & Prevention | 0 (0.0%) | 20 (100.0%) |
| Law Enforcement | 58 (92.1%) | 5 (7.9%) |
| Food Preparation & Serving | 21 (13.5%) | 135 (86.5%) |
| Cleaning & Maintenance | 150 (67.0%) | 74 (33.0%) |
| Personal Care & Service | 0 (0.0%) | 30 (100.0%) |
| Total (Category) | 229 (40.5%) | 337 (59.5%) |
| Total (Overall) | 1,671 (50.6%) | 1,633 (49.4%) |
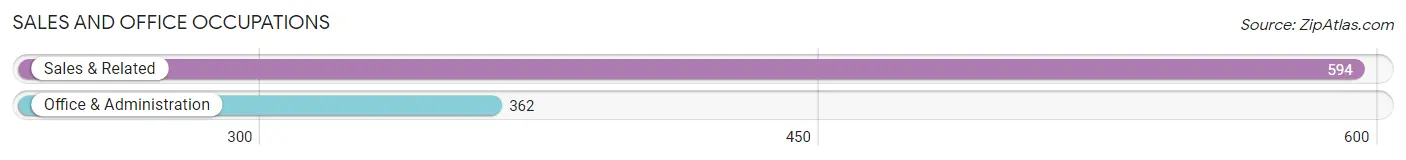
Sales and Office Occupations
The most common Sales and Office occupations in Robertsdale are Sales & Related (594 | 18.0%), and Office & Administration (362 | 11.0%).
Sales and Office Occupations by Sex
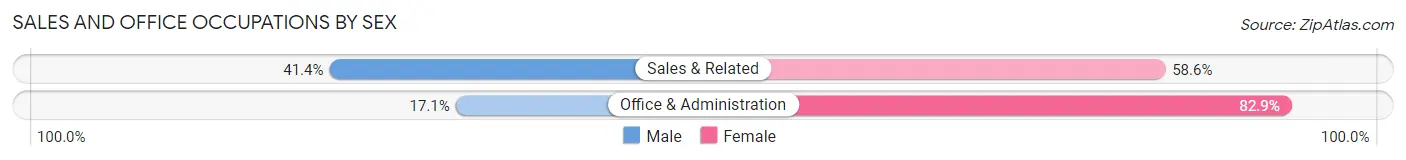
| Occupation | Male | Female |
| Sales & Related | 246 (41.4%) | 348 (58.6%) |
| Office & Administration | 62 (17.1%) | 300 (82.9%) |
| Total (Category) | 308 (32.2%) | 648 (67.8%) |
| Total (Overall) | 1,671 (50.6%) | 1,633 (49.4%) |
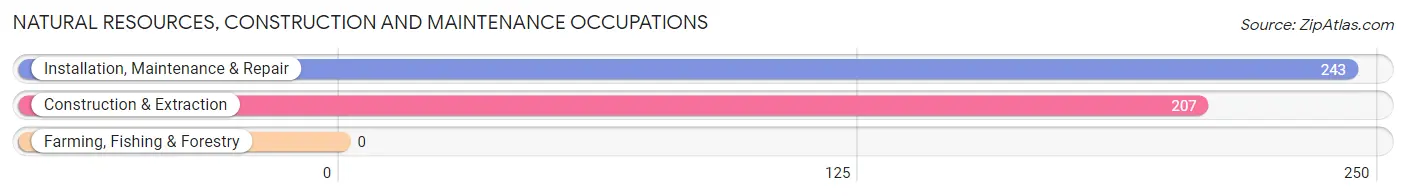
Natural Resources, Construction and Maintenance Occupations
The most common Natural Resources, Construction and Maintenance occupations in Robertsdale are Installation, Maintenance & Repair (243 | 7.3%), and Construction & Extraction (207 | 6.3%).
Natural Resources, Construction and Maintenance Occupations by Sex
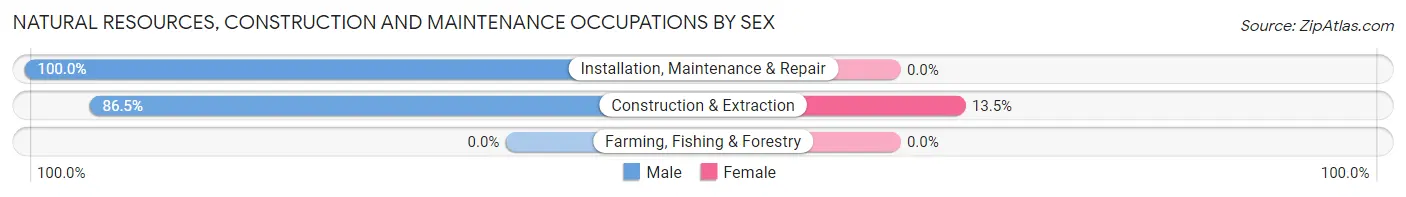
| Occupation | Male | Female |
| Farming, Fishing & Forestry | 0 (0.0%) | 0 (0.0%) |
| Construction & Extraction | 179 (86.5%) | 28 (13.5%) |
| Installation, Maintenance & Repair | 243 (100.0%) | 0 (0.0%) |
| Total (Category) | 422 (93.8%) | 28 (6.2%) |
| Total (Overall) | 1,671 (50.6%) | 1,633 (49.4%) |
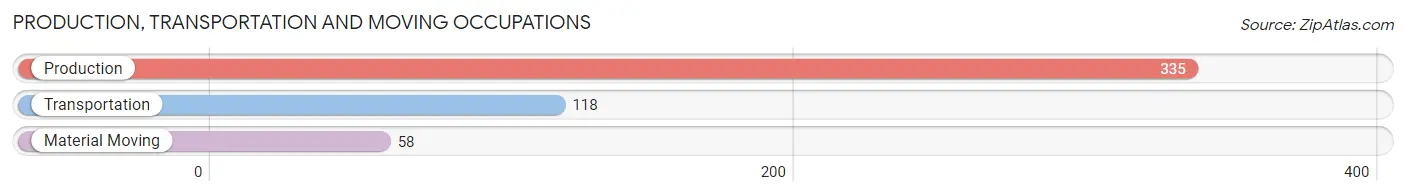
Production, Transportation and Moving Occupations
The most common Production, Transportation and Moving occupations in Robertsdale are Production (335 | 10.1%), Transportation (118 | 3.6%), and Material Moving (58 | 1.8%).
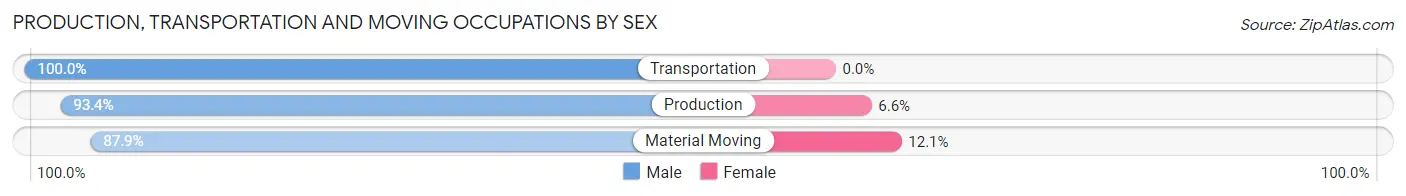
Production, Transportation and Moving Occupations by Sex
| Occupation | Male | Female |
| Production | 313 (93.4%) | 22 (6.6%) |
| Transportation | 118 (100.0%) | 0 (0.0%) |
| Material Moving | 51 (87.9%) | 7 (12.1%) |
| Total (Category) | 482 (94.3%) | 29 (5.7%) |
| Total (Overall) | 1,671 (50.6%) | 1,633 (49.4%) |
Employment Industries by Sex in Robertsdale
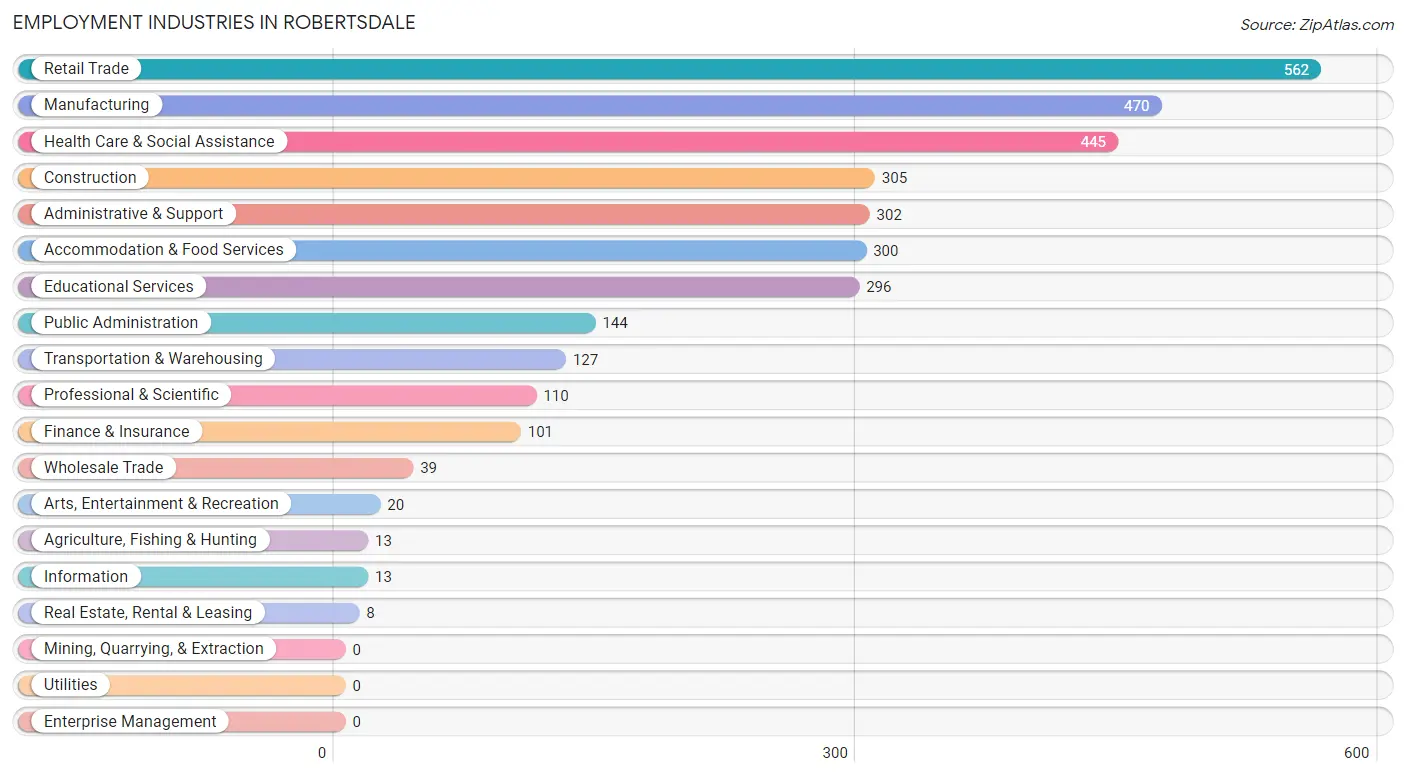
Employment Industries in Robertsdale
The major employment industries in Robertsdale include Retail Trade (562 | 17.0%), Manufacturing (470 | 14.2%), Health Care & Social Assistance (445 | 13.5%), Construction (305 | 9.2%), and Administrative & Support (302 | 9.1%).
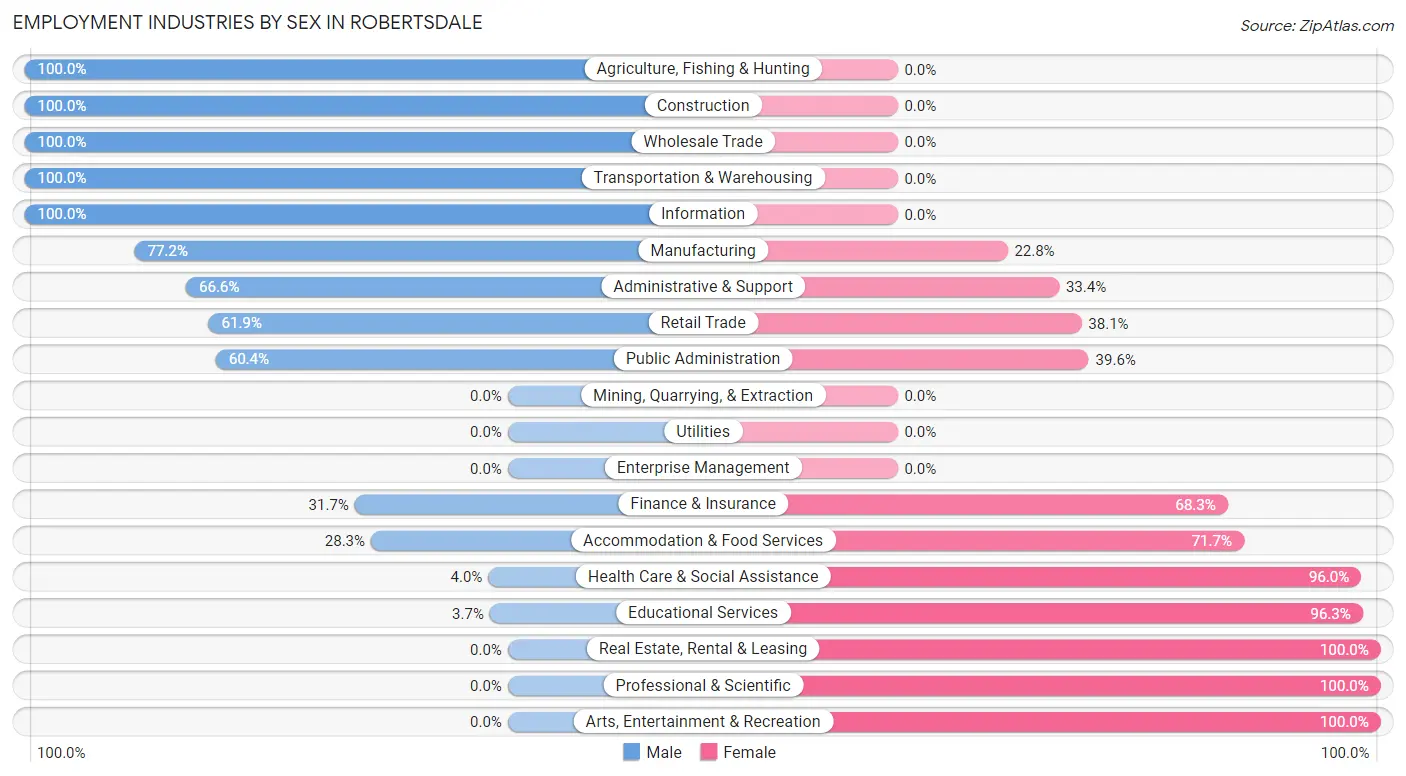
Employment Industries by Sex in Robertsdale
The Robertsdale industries that see more men than women are Agriculture, Fishing & Hunting (100.0%), Construction (100.0%), and Wholesale Trade (100.0%), whereas the industries that tend to have a higher number of women are Real Estate, Rental & Leasing (100.0%), Professional & Scientific (100.0%), and Arts, Entertainment & Recreation (100.0%).
| Industry | Male | Female |
| Agriculture, Fishing & Hunting | 13 (100.0%) | 0 (0.0%) |
| Mining, Quarrying, & Extraction | 0 (0.0%) | 0 (0.0%) |
| Construction | 305 (100.0%) | 0 (0.0%) |
| Manufacturing | 363 (77.2%) | 107 (22.8%) |
| Wholesale Trade | 39 (100.0%) | 0 (0.0%) |
| Retail Trade | 348 (61.9%) | 214 (38.1%) |
| Transportation & Warehousing | 127 (100.0%) | 0 (0.0%) |
| Utilities | 0 (0.0%) | 0 (0.0%) |
| Information | 13 (100.0%) | 0 (0.0%) |
| Finance & Insurance | 32 (31.7%) | 69 (68.3%) |
| Real Estate, Rental & Leasing | 0 (0.0%) | 8 (100.0%) |
| Professional & Scientific | 0 (0.0%) | 110 (100.0%) |
| Enterprise Management | 0 (0.0%) | 0 (0.0%) |
| Administrative & Support | 201 (66.6%) | 101 (33.4%) |
| Educational Services | 11 (3.7%) | 285 (96.3%) |
| Health Care & Social Assistance | 18 (4.0%) | 427 (96.0%) |
| Arts, Entertainment & Recreation | 0 (0.0%) | 20 (100.0%) |
| Accommodation & Food Services | 85 (28.3%) | 215 (71.7%) |
| Public Administration | 87 (60.4%) | 57 (39.6%) |
| Total | 1,671 (50.6%) | 1,633 (49.4%) |
Education in Robertsdale
School Enrollment in Robertsdale
The most common levels of schooling among the 1,541 students in Robertsdale are high school (472 | 30.6%), middle school (435 | 28.2%), and elementary school (309 | 20.1%).
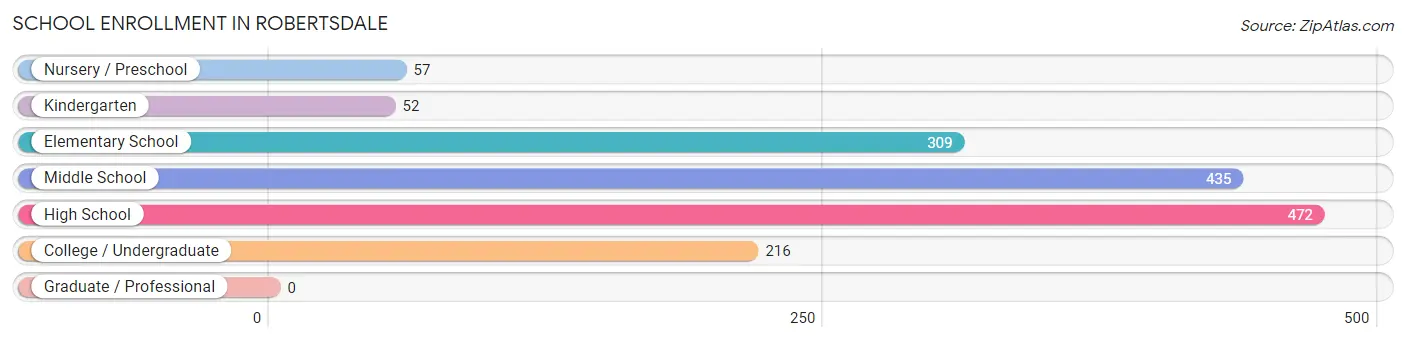
| School Level | # Students | % Students |
| Nursery / Preschool | 57 | 3.7% |
| Kindergarten | 52 | 3.4% |
| Elementary School | 309 | 20.1% |
| Middle School | 435 | 28.2% |
| High School | 472 | 30.6% |
| College / Undergraduate | 216 | 14.0% |
| Graduate / Professional | 0 | 0.0% |
| Total | 1,541 | 100.0% |
School Enrollment by Age by Funding Source in Robertsdale
Out of a total of 1,541 students who are enrolled in schools in Robertsdale, 43 (2.8%) attend a private institution, while the remaining 1,498 (97.2%) are enrolled in public schools. The age group of 3 to 4 year olds has the highest likelihood of being enrolled in private schools, with 18 (100.0% in the age bracket) enrolled. Conversely, the age group of 5 to 9 year old has the lowest likelihood of being enrolled in a private school, with 352 (100.0% in the age bracket) attending a public institution.
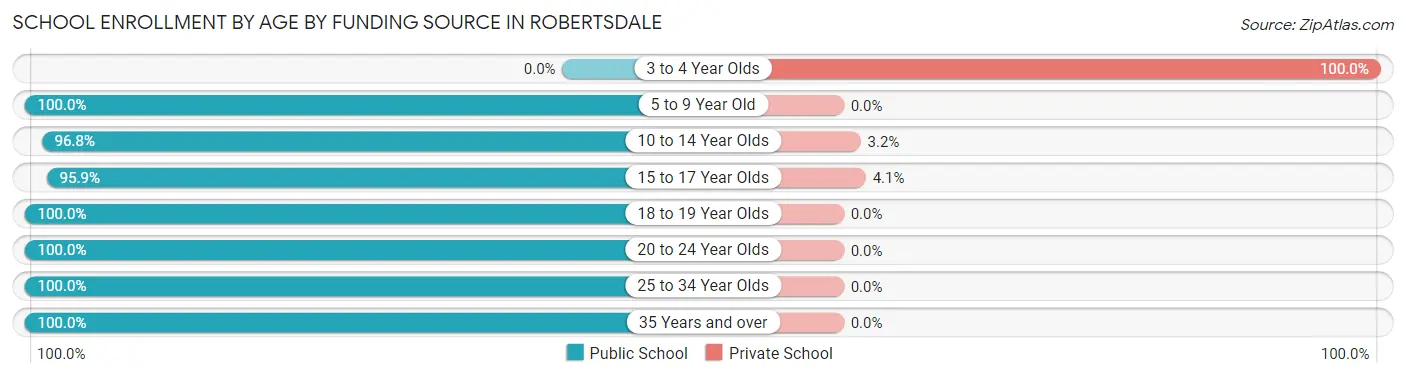
| Age Bracket | Public School | Private School |
| 3 to 4 Year Olds | 0 (0.0%) | 18 (100.0%) |
| 5 to 9 Year Old | 352 (100.0%) | 0 (0.0%) |
| 10 to 14 Year Olds | 490 (96.8%) | 16 (3.2%) |
| 15 to 17 Year Olds | 210 (95.9%) | 9 (4.1%) |
| 18 to 19 Year Olds | 252 (100.0%) | 0 (0.0%) |
| 20 to 24 Year Olds | 18 (100.0%) | 0 (0.0%) |
| 25 to 34 Year Olds | 107 (100.0%) | 0 (0.0%) |
| 35 Years and over | 69 (100.0%) | 0 (0.0%) |
| Total | 1,498 (97.2%) | 43 (2.8%) |
Educational Attainment by Field of Study in Robertsdale
Education (164 | 23.8%), business (127 | 18.4%), science & technology (65 | 9.4%), engineering (48 | 7.0%), and multidisciplinary studies (48 | 7.0%) are the most common fields of study among 689 individuals in Robertsdale who have obtained a bachelor's degree or higher.
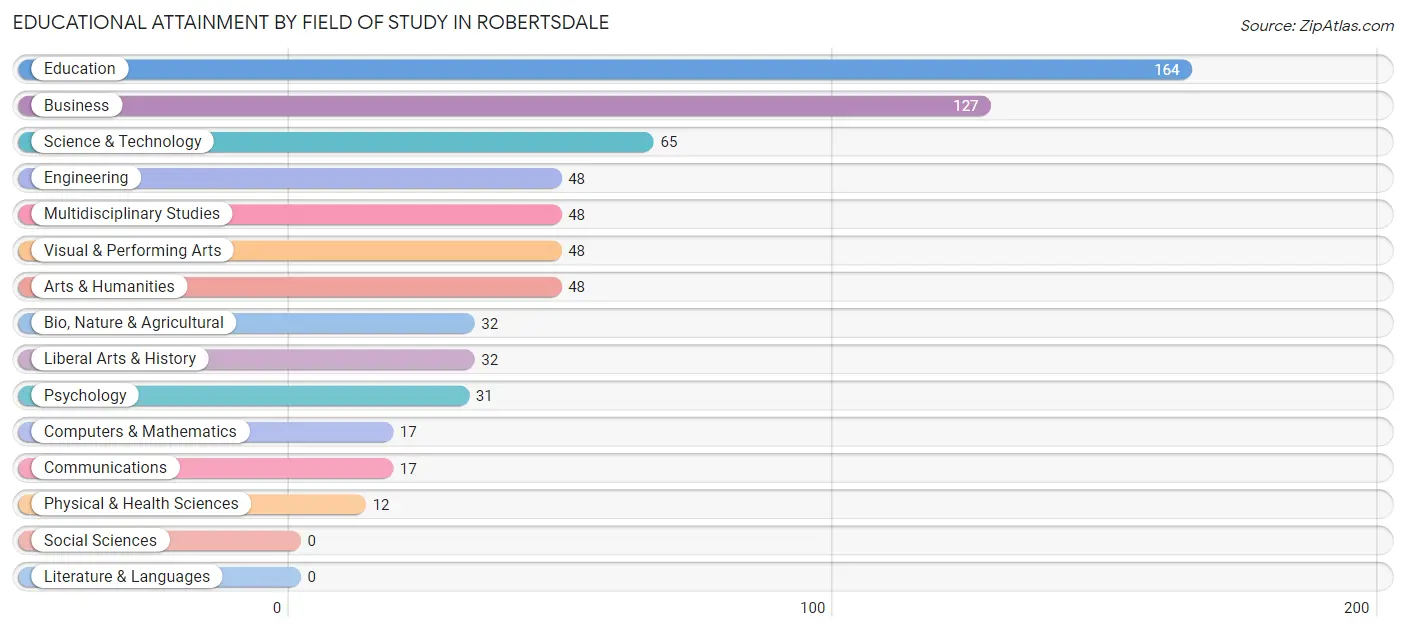
| Field of Study | # Graduates | % Graduates |
| Computers & Mathematics | 17 | 2.5% |
| Bio, Nature & Agricultural | 32 | 4.6% |
| Physical & Health Sciences | 12 | 1.7% |
| Psychology | 31 | 4.5% |
| Social Sciences | 0 | 0.0% |
| Engineering | 48 | 7.0% |
| Multidisciplinary Studies | 48 | 7.0% |
| Science & Technology | 65 | 9.4% |
| Business | 127 | 18.4% |
| Education | 164 | 23.8% |
| Literature & Languages | 0 | 0.0% |
| Liberal Arts & History | 32 | 4.6% |
| Visual & Performing Arts | 48 | 7.0% |
| Communications | 17 | 2.5% |
| Arts & Humanities | 48 | 7.0% |
| Total | 689 | 100.0% |
Transportation & Commute in Robertsdale
Vehicle Availability by Sex in Robertsdale
The most prevalent vehicle ownership categories in Robertsdale are males with 2 vehicles (832, accounting for 51.5%) and females with 2 vehicles (848, making up 52.5%).
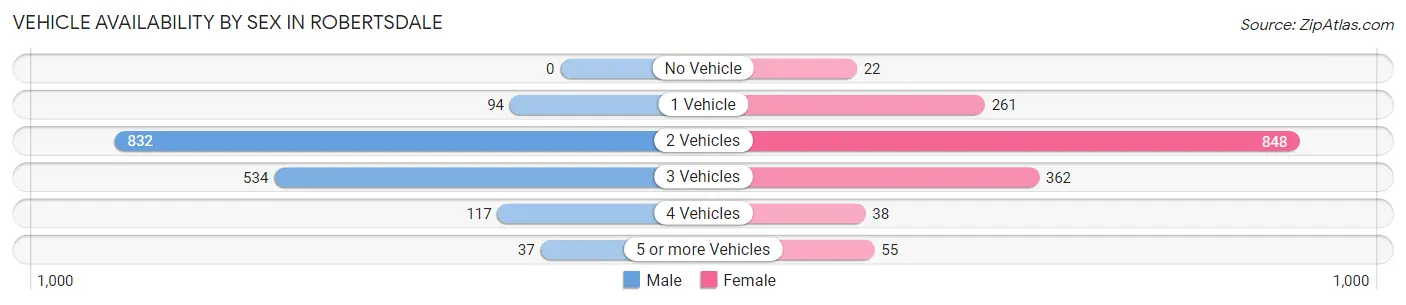
| Vehicles Available | Male | Female |
| No Vehicle | 0 (0.0%) | 22 (1.4%) |
| 1 Vehicle | 94 (5.8%) | 261 (16.5%) |
| 2 Vehicles | 832 (51.5%) | 848 (53.5%) |
| 3 Vehicles | 534 (33.1%) | 362 (22.8%) |
| 4 Vehicles | 117 (7.2%) | 38 (2.4%) |
| 5 or more Vehicles | 37 (2.3%) | 55 (3.5%) |
| Total | 1,614 (100.0%) | 1,586 (100.0%) |
Commute Time in Robertsdale
The most frequently occuring commute durations in Robertsdale are 30 to 34 minutes (633 commuters, 20.3%), 60 to 89 minutes (469 commuters, 15.1%), and 25 to 29 minutes (413 commuters, 13.3%).
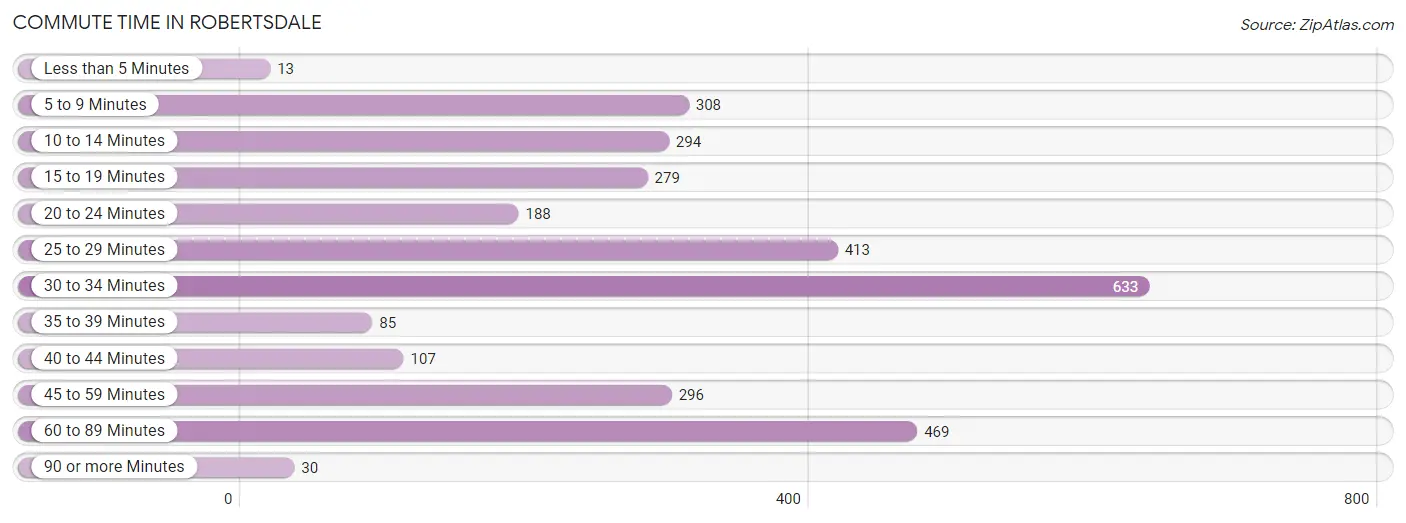
| Commute Time | # Commuters | % Commuters |
| Less than 5 Minutes | 13 | 0.4% |
| 5 to 9 Minutes | 308 | 9.9% |
| 10 to 14 Minutes | 294 | 9.4% |
| 15 to 19 Minutes | 279 | 9.0% |
| 20 to 24 Minutes | 188 | 6.0% |
| 25 to 29 Minutes | 413 | 13.3% |
| 30 to 34 Minutes | 633 | 20.3% |
| 35 to 39 Minutes | 85 | 2.7% |
| 40 to 44 Minutes | 107 | 3.4% |
| 45 to 59 Minutes | 296 | 9.5% |
| 60 to 89 Minutes | 469 | 15.1% |
| 90 or more Minutes | 30 | 1.0% |
Commute Time by Sex in Robertsdale
The most common commute times in Robertsdale are 60 to 89 minutes (372 commuters, 23.3%) for males and 30 to 34 minutes (345 commuters, 22.7%) for females.
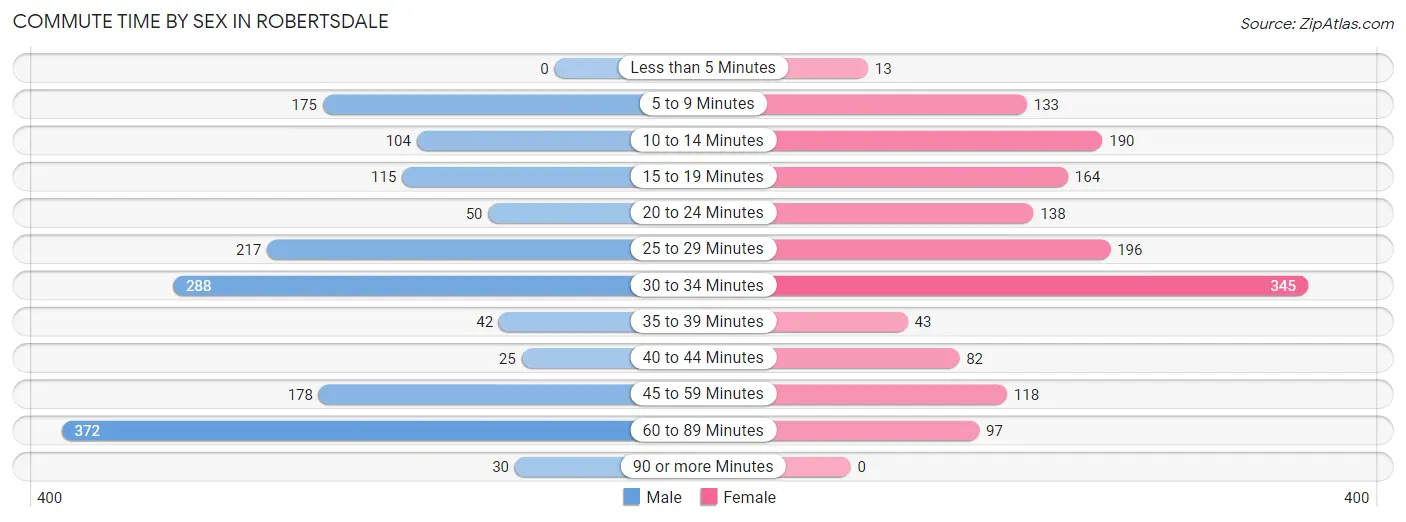
| Commute Time | Male | Female |
| Less than 5 Minutes | 0 (0.0%) | 13 (0.9%) |
| 5 to 9 Minutes | 175 (11.0%) | 133 (8.8%) |
| 10 to 14 Minutes | 104 (6.5%) | 190 (12.5%) |
| 15 to 19 Minutes | 115 (7.2%) | 164 (10.8%) |
| 20 to 24 Minutes | 50 (3.1%) | 138 (9.1%) |
| 25 to 29 Minutes | 217 (13.6%) | 196 (12.9%) |
| 30 to 34 Minutes | 288 (18.0%) | 345 (22.7%) |
| 35 to 39 Minutes | 42 (2.6%) | 43 (2.8%) |
| 40 to 44 Minutes | 25 (1.6%) | 82 (5.4%) |
| 45 to 59 Minutes | 178 (11.2%) | 118 (7.8%) |
| 60 to 89 Minutes | 372 (23.3%) | 97 (6.4%) |
| 90 or more Minutes | 30 (1.9%) | 0 (0.0%) |
Time of Departure to Work by Sex in Robertsdale
The most frequent times of departure to work in Robertsdale are 6:00 AM to 6:29 AM (313, 19.6%) for males and 7:00 AM to 7:29 AM (449, 29.6%) for females.
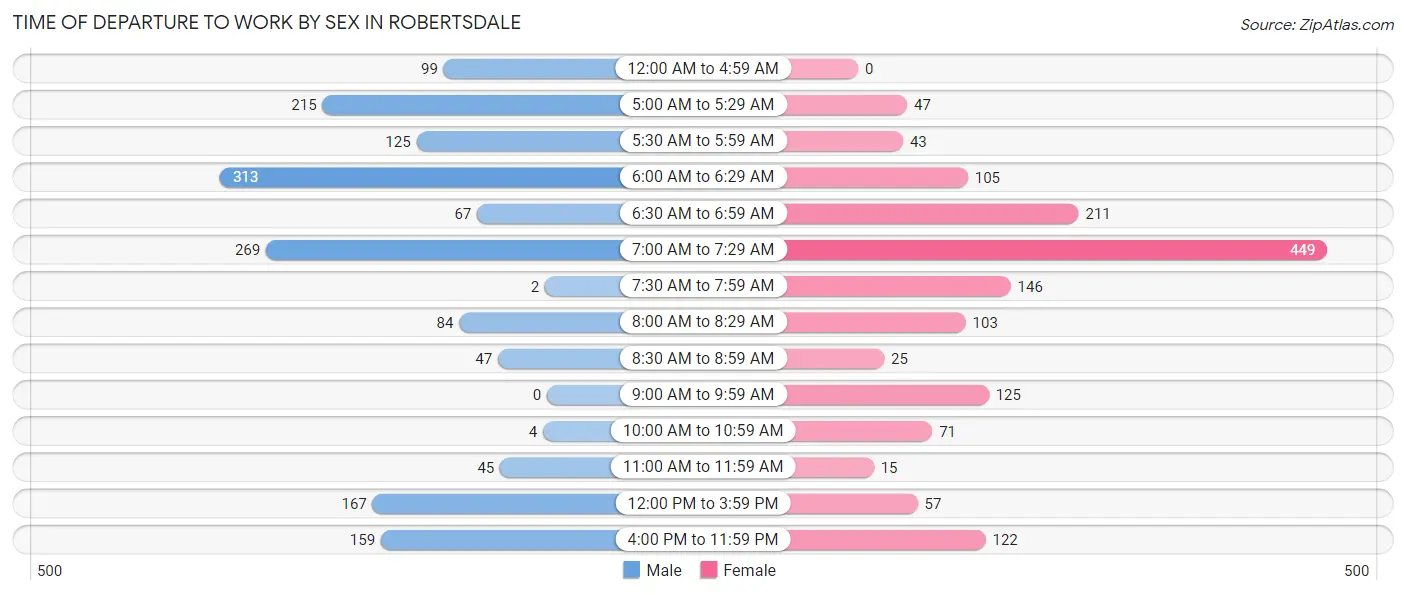
| Time of Departure | Male | Female |
| 12:00 AM to 4:59 AM | 99 (6.2%) | 0 (0.0%) |
| 5:00 AM to 5:29 AM | 215 (13.5%) | 47 (3.1%) |
| 5:30 AM to 5:59 AM | 125 (7.8%) | 43 (2.8%) |
| 6:00 AM to 6:29 AM | 313 (19.6%) | 105 (6.9%) |
| 6:30 AM to 6:59 AM | 67 (4.2%) | 211 (13.9%) |
| 7:00 AM to 7:29 AM | 269 (16.9%) | 449 (29.6%) |
| 7:30 AM to 7:59 AM | 2 (0.1%) | 146 (9.6%) |
| 8:00 AM to 8:29 AM | 84 (5.3%) | 103 (6.8%) |
| 8:30 AM to 8:59 AM | 47 (2.9%) | 25 (1.7%) |
| 9:00 AM to 9:59 AM | 0 (0.0%) | 125 (8.2%) |
| 10:00 AM to 10:59 AM | 4 (0.3%) | 71 (4.7%) |
| 11:00 AM to 11:59 AM | 45 (2.8%) | 15 (1.0%) |
| 12:00 PM to 3:59 PM | 167 (10.5%) | 57 (3.7%) |
| 4:00 PM to 11:59 PM | 159 (10.0%) | 122 (8.0%) |
| Total | 1,596 (100.0%) | 1,519 (100.0%) |
Housing Occupancy in Robertsdale
Occupancy by Ownership in Robertsdale
Of the total 2,525 dwellings in Robertsdale, owner-occupied units account for 1,651 (65.4%), while renter-occupied units make up 874 (34.6%).
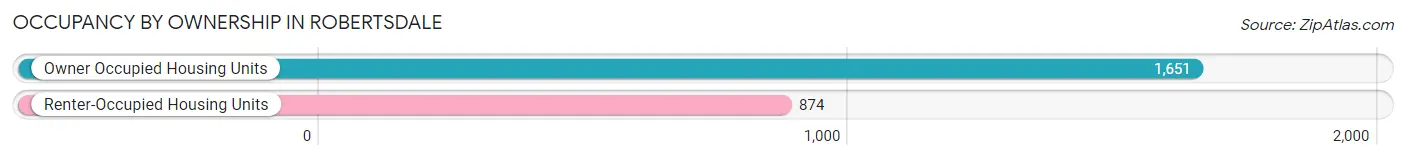
| Occupancy | # Housing Units | % Housing Units |
| Owner Occupied Housing Units | 1,651 | 65.4% |
| Renter-Occupied Housing Units | 874 | 34.6% |
| Total Occupied Housing Units | 2,525 | 100.0% |
Occupancy by Household Size in Robertsdale
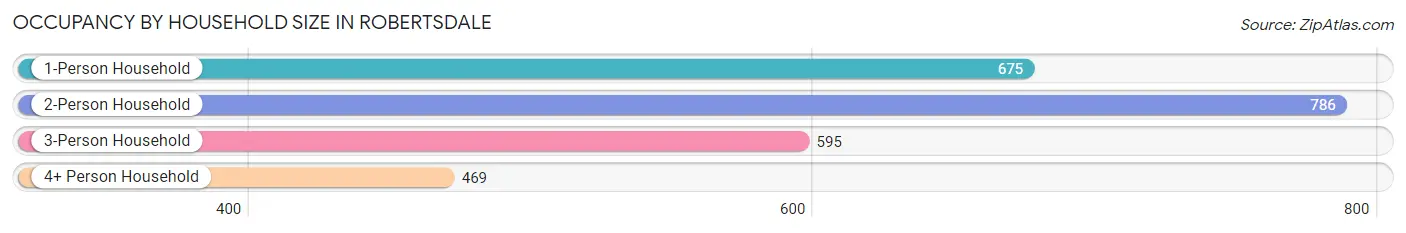
| Household Size | # Housing Units | % Housing Units |
| 1-Person Household | 675 | 26.7% |
| 2-Person Household | 786 | 31.1% |
| 3-Person Household | 595 | 23.6% |
| 4+ Person Household | 469 | 18.6% |
| Total Housing Units | 2,525 | 100.0% |
Occupancy by Ownership by Household Size in Robertsdale
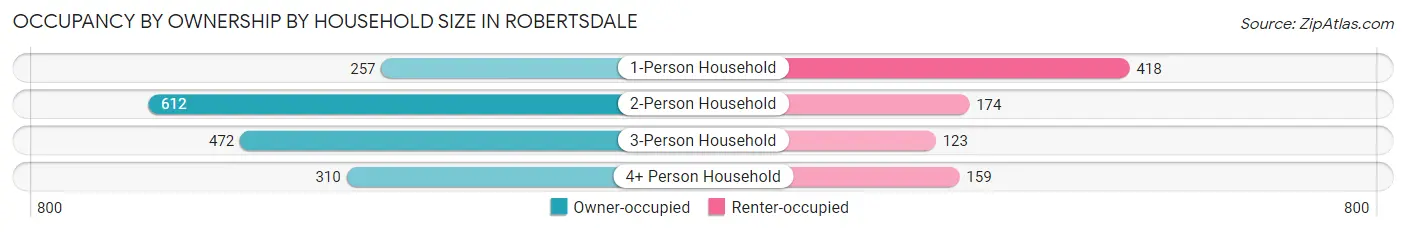
| Household Size | Owner-occupied | Renter-occupied |
| 1-Person Household | 257 (38.1%) | 418 (61.9%) |
| 2-Person Household | 612 (77.9%) | 174 (22.1%) |
| 3-Person Household | 472 (79.3%) | 123 (20.7%) |
| 4+ Person Household | 310 (66.1%) | 159 (33.9%) |
| Total Housing Units | 1,651 (65.4%) | 874 (34.6%) |
Occupancy by Educational Attainment in Robertsdale
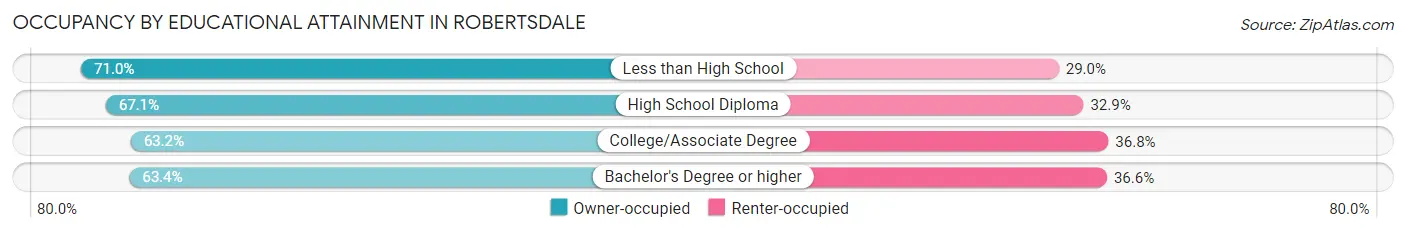
| Household Size | Owner-occupied | Renter-occupied |
| Less than High School | 130 (71.0%) | 53 (29.0%) |
| High School Diploma | 692 (67.1%) | 339 (32.9%) |
| College/Associate Degree | 571 (63.2%) | 333 (36.8%) |
| Bachelor's Degree or higher | 258 (63.4%) | 149 (36.6%) |
Occupancy by Age of Householder in Robertsdale
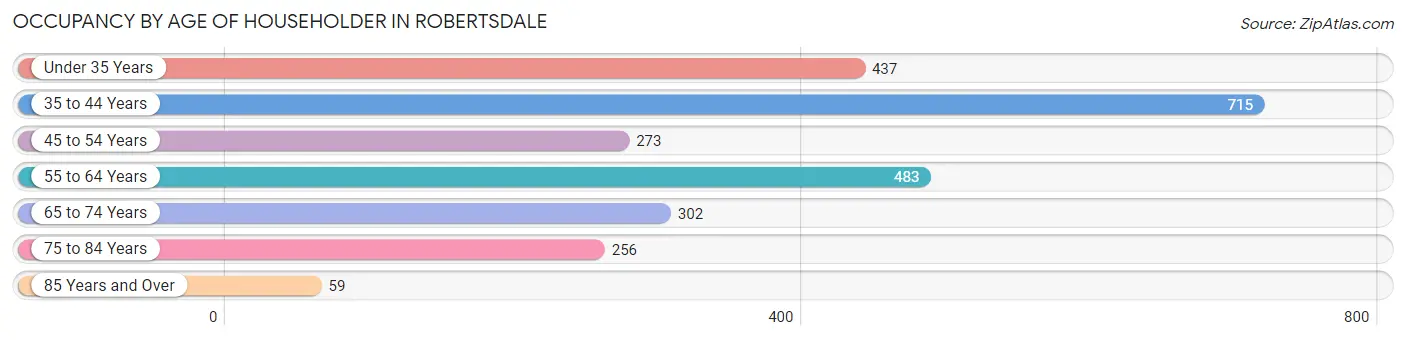
| Age Bracket | # Households | % Households |
| Under 35 Years | 437 | 17.3% |
| 35 to 44 Years | 715 | 28.3% |
| 45 to 54 Years | 273 | 10.8% |
| 55 to 64 Years | 483 | 19.1% |
| 65 to 74 Years | 302 | 12.0% |
| 75 to 84 Years | 256 | 10.1% |
| 85 Years and Over | 59 | 2.3% |
| Total | 2,525 | 100.0% |
Housing Finances in Robertsdale
Median Income by Occupancy in Robertsdale
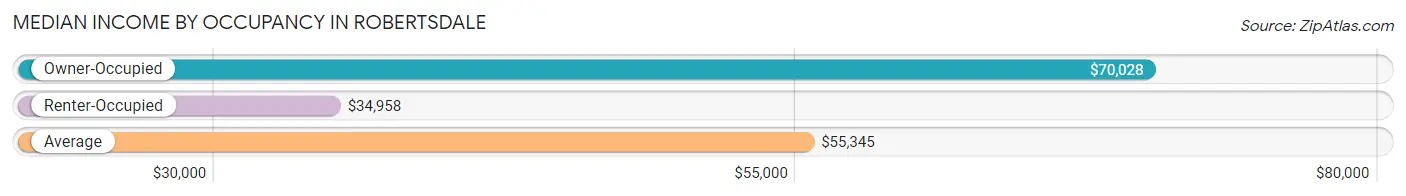
| Occupancy Type | # Households | Median Income |
| Owner-Occupied | 1,651 (65.4%) | $70,028 |
| Renter-Occupied | 874 (34.6%) | $34,958 |
| Average | 2,525 (100.0%) | $55,345 |
Occupancy by Householder Income Bracket in Robertsdale
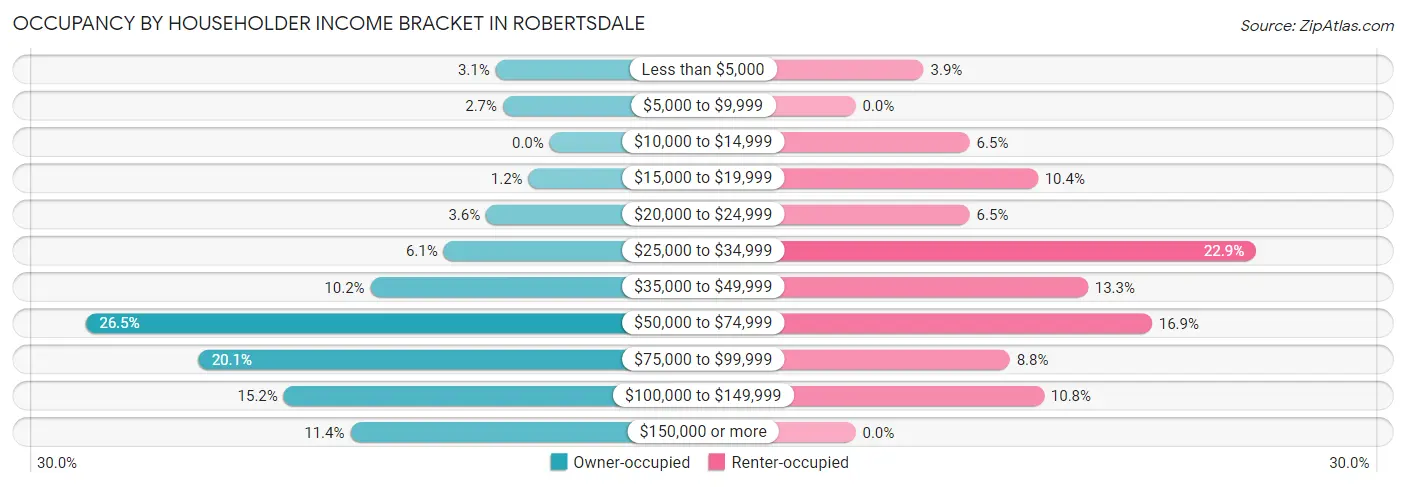
| Income Bracket | Owner-occupied | Renter-occupied |
| Less than $5,000 | 51 (3.1%) | 34 (3.9%) |
| $5,000 to $9,999 | 44 (2.7%) | 0 (0.0%) |
| $10,000 to $14,999 | 0 (0.0%) | 57 (6.5%) |
| $15,000 to $19,999 | 20 (1.2%) | 91 (10.4%) |
| $20,000 to $24,999 | 60 (3.6%) | 57 (6.5%) |
| $25,000 to $34,999 | 100 (6.1%) | 200 (22.9%) |
| $35,000 to $49,999 | 169 (10.2%) | 116 (13.3%) |
| $50,000 to $74,999 | 437 (26.5%) | 148 (16.9%) |
| $75,000 to $99,999 | 331 (20.1%) | 77 (8.8%) |
| $100,000 to $149,999 | 251 (15.2%) | 94 (10.8%) |
| $150,000 or more | 188 (11.4%) | 0 (0.0%) |
| Total | 1,651 (100.0%) | 874 (100.0%) |
Monthly Housing Cost Tiers in Robertsdale
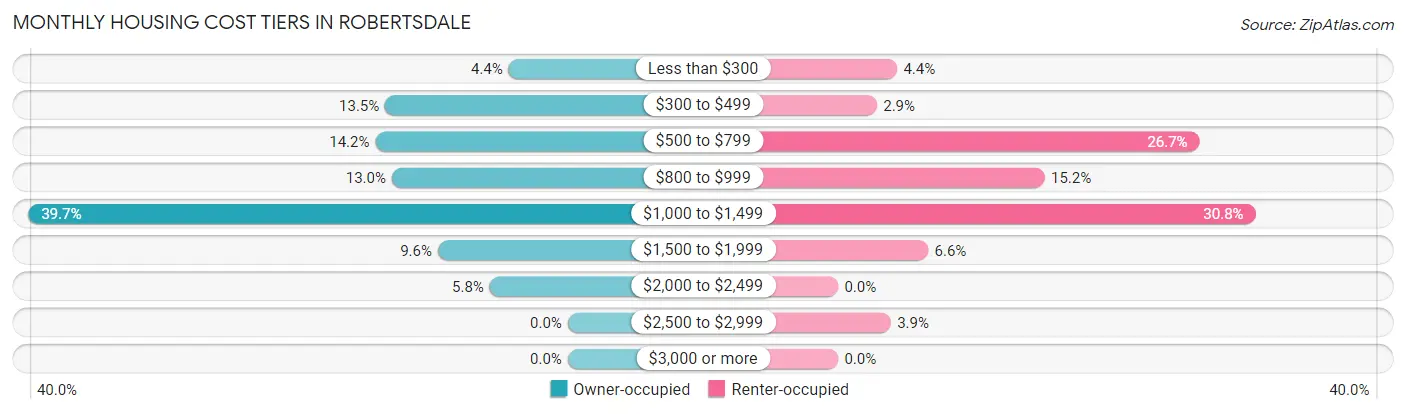
| Monthly Cost | Owner-occupied | Renter-occupied |
| Less than $300 | 72 (4.4%) | 38 (4.3%) |
| $300 to $499 | 222 (13.5%) | 25 (2.9%) |
| $500 to $799 | 234 (14.2%) | 233 (26.7%) |
| $800 to $999 | 214 (13.0%) | 133 (15.2%) |
| $1,000 to $1,499 | 656 (39.7%) | 269 (30.8%) |
| $1,500 to $1,999 | 158 (9.6%) | 58 (6.6%) |
| $2,000 to $2,499 | 95 (5.8%) | 0 (0.0%) |
| $2,500 to $2,999 | 0 (0.0%) | 34 (3.9%) |
| $3,000 or more | 0 (0.0%) | 0 (0.0%) |
| Total | 1,651 (100.0%) | 874 (100.0%) |
Physical Housing Characteristics in Robertsdale
Housing Structures in Robertsdale
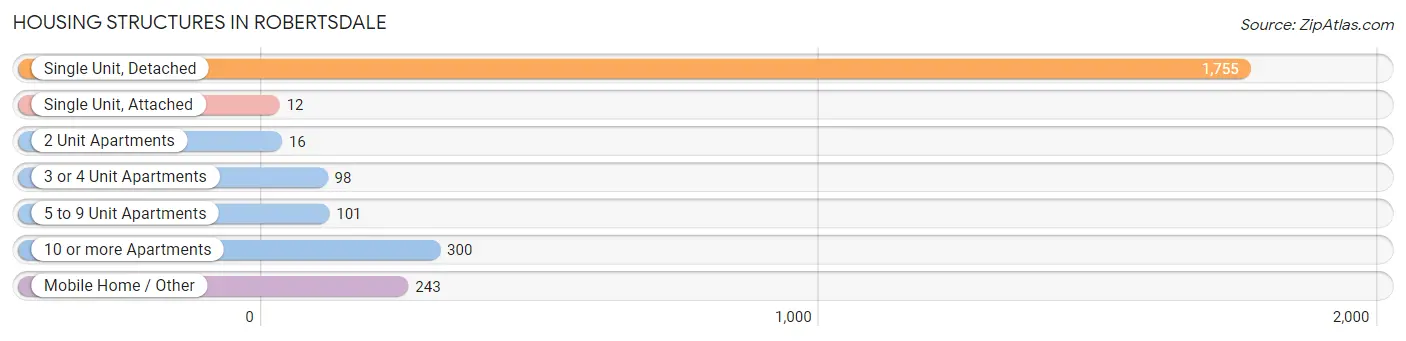
| Structure Type | # Housing Units | % Housing Units |
| Single Unit, Detached | 1,755 | 69.5% |
| Single Unit, Attached | 12 | 0.5% |
| 2 Unit Apartments | 16 | 0.6% |
| 3 or 4 Unit Apartments | 98 | 3.9% |
| 5 to 9 Unit Apartments | 101 | 4.0% |
| 10 or more Apartments | 300 | 11.9% |
| Mobile Home / Other | 243 | 9.6% |
| Total | 2,525 | 100.0% |
Housing Structures by Occupancy in Robertsdale
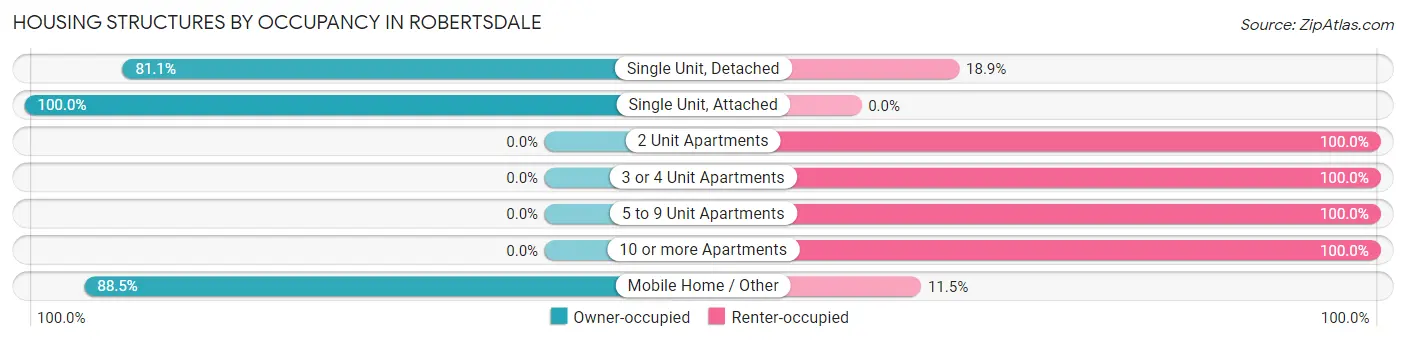
| Structure Type | Owner-occupied | Renter-occupied |
| Single Unit, Detached | 1,424 (81.1%) | 331 (18.9%) |
| Single Unit, Attached | 12 (100.0%) | 0 (0.0%) |
| 2 Unit Apartments | 0 (0.0%) | 16 (100.0%) |
| 3 or 4 Unit Apartments | 0 (0.0%) | 98 (100.0%) |
| 5 to 9 Unit Apartments | 0 (0.0%) | 101 (100.0%) |
| 10 or more Apartments | 0 (0.0%) | 300 (100.0%) |
| Mobile Home / Other | 215 (88.5%) | 28 (11.5%) |
| Total | 1,651 (65.4%) | 874 (34.6%) |
Housing Structures by Number of Rooms in Robertsdale
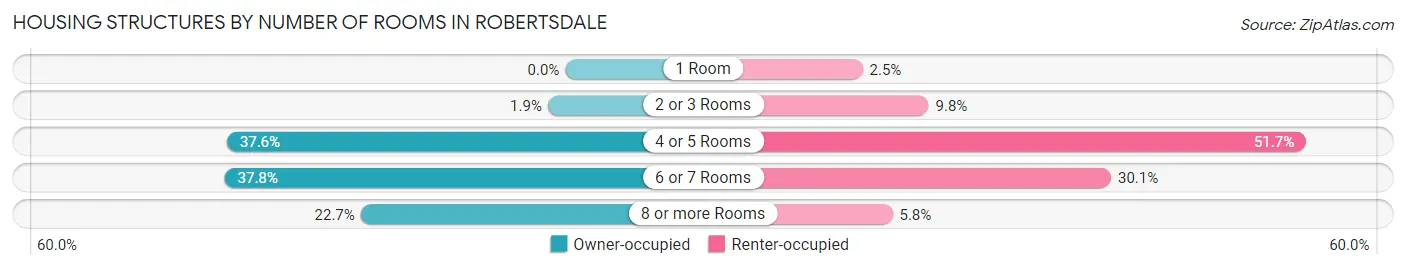
| Number of Rooms | Owner-occupied | Renter-occupied |
| 1 Room | 0 (0.0%) | 22 (2.5%) |
| 2 or 3 Rooms | 32 (1.9%) | 86 (9.8%) |
| 4 or 5 Rooms | 620 (37.6%) | 452 (51.7%) |
| 6 or 7 Rooms | 624 (37.8%) | 263 (30.1%) |
| 8 or more Rooms | 375 (22.7%) | 51 (5.8%) |
| Total | 1,651 (100.0%) | 874 (100.0%) |
Housing Structure by Heating Type in Robertsdale
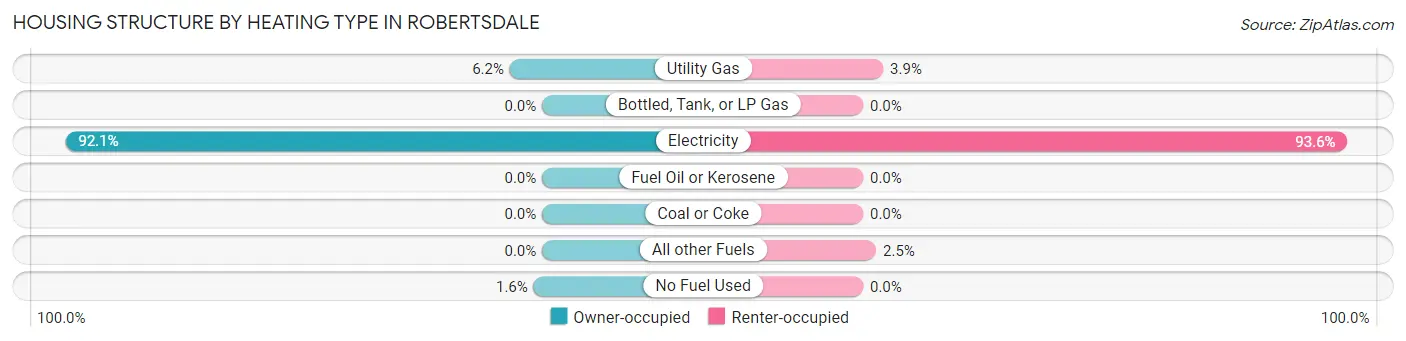
| Heating Type | Owner-occupied | Renter-occupied |
| Utility Gas | 103 (6.2%) | 34 (3.9%) |
| Bottled, Tank, or LP Gas | 0 (0.0%) | 0 (0.0%) |
| Electricity | 1,521 (92.1%) | 818 (93.6%) |
| Fuel Oil or Kerosene | 0 (0.0%) | 0 (0.0%) |
| Coal or Coke | 0 (0.0%) | 0 (0.0%) |
| All other Fuels | 0 (0.0%) | 22 (2.5%) |
| No Fuel Used | 27 (1.6%) | 0 (0.0%) |
| Total | 1,651 (100.0%) | 874 (100.0%) |
Household Vehicle Usage in Robertsdale
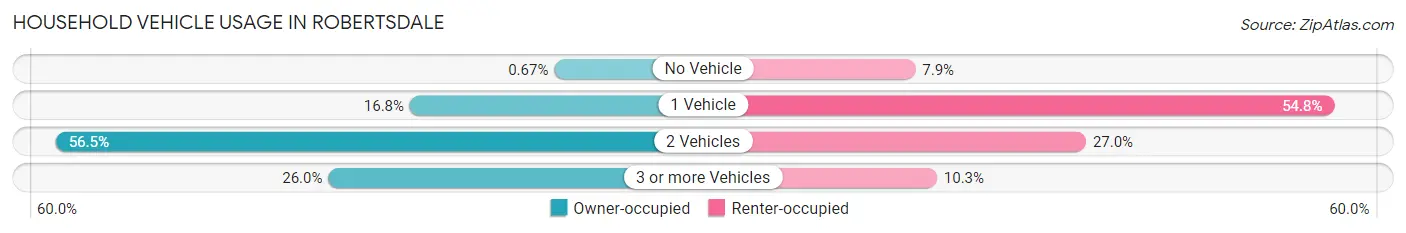
| Vehicles per Household | Owner-occupied | Renter-occupied |
| No Vehicle | 11 (0.7%) | 69 (7.9%) |
| 1 Vehicle | 278 (16.8%) | 479 (54.8%) |
| 2 Vehicles | 933 (56.5%) | 236 (27.0%) |
| 3 or more Vehicles | 429 (26.0%) | 90 (10.3%) |
| Total | 1,651 (100.0%) | 874 (100.0%) |
Real Estate & Mortgages in Robertsdale
Real Estate and Mortgage Overview in Robertsdale
| Characteristic | Without Mortgage | With Mortgage |
| Housing Units | 400 | 1,251 |
| Median Property Value | $171,400 | $175,600 |
| Median Household Income | $39,318 | $175 |
| Monthly Housing Costs | $345 | $0 |
| Real Estate Taxes | $563 | $265 |
Property Value by Mortgage Status in Robertsdale
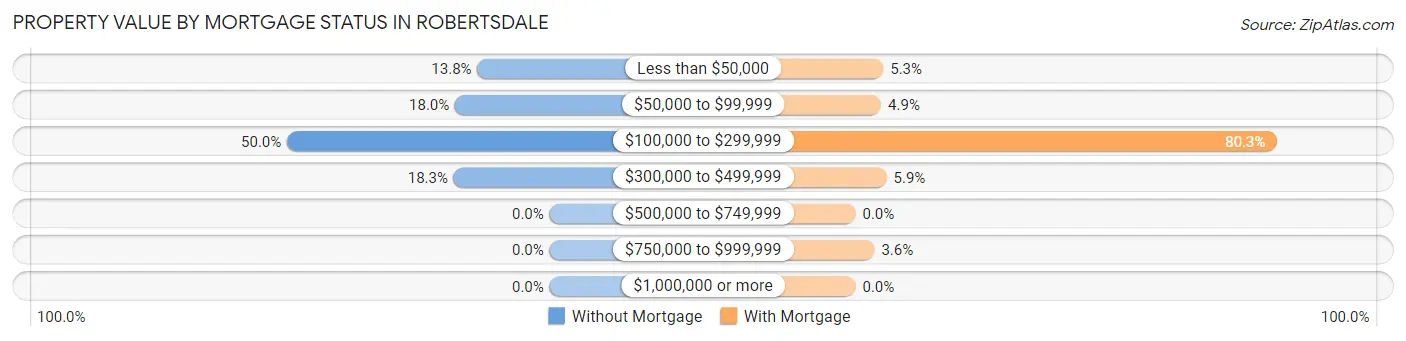
| Property Value | Without Mortgage | With Mortgage |
| Less than $50,000 | 55 (13.8%) | 66 (5.3%) |
| $50,000 to $99,999 | 72 (18.0%) | 61 (4.9%) |
| $100,000 to $299,999 | 200 (50.0%) | 1,005 (80.3%) |
| $300,000 to $499,999 | 73 (18.2%) | 74 (5.9%) |
| $500,000 to $749,999 | 0 (0.0%) | 0 (0.0%) |
| $750,000 to $999,999 | 0 (0.0%) | 45 (3.6%) |
| $1,000,000 or more | 0 (0.0%) | 0 (0.0%) |
| Total | 400 (100.0%) | 1,251 (100.0%) |
Household Income by Mortgage Status in Robertsdale
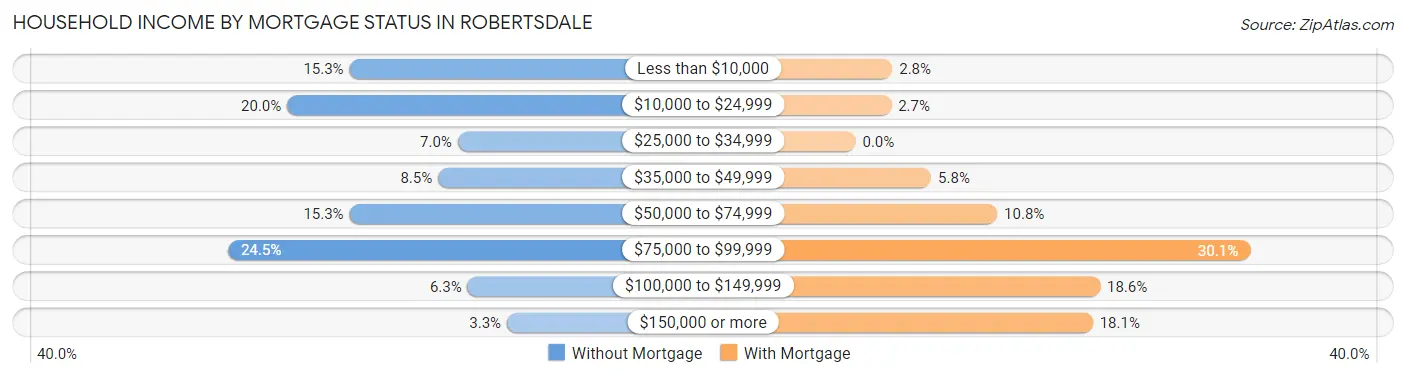
| Household Income | Without Mortgage | With Mortgage |
| Less than $10,000 | 61 (15.2%) | 35 (2.8%) |
| $10,000 to $24,999 | 80 (20.0%) | 34 (2.7%) |
| $25,000 to $34,999 | 28 (7.0%) | 0 (0.0%) |
| $35,000 to $49,999 | 34 (8.5%) | 72 (5.8%) |
| $50,000 to $74,999 | 61 (15.2%) | 135 (10.8%) |
| $75,000 to $99,999 | 98 (24.5%) | 376 (30.1%) |
| $100,000 to $149,999 | 25 (6.2%) | 233 (18.6%) |
| $150,000 or more | 13 (3.3%) | 226 (18.1%) |
| Total | 400 (100.0%) | 1,251 (100.0%) |
Property Value to Household Income Ratio in Robertsdale
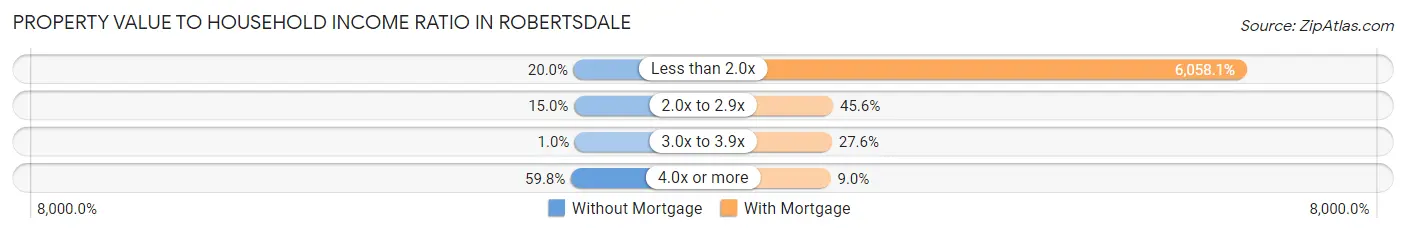
| Value-to-Income Ratio | Without Mortgage | With Mortgage |
| Less than 2.0x | 80 (20.0%) | 75,787 (6,058.1%) |
| 2.0x to 2.9x | 60 (15.0%) | 571 (45.6%) |
| 3.0x to 3.9x | 4 (1.0%) | 345 (27.6%) |
| 4.0x or more | 239 (59.8%) | 112 (8.9%) |
| Total | 400 (100.0%) | 1,251 (100.0%) |
Real Estate Taxes by Mortgage Status in Robertsdale
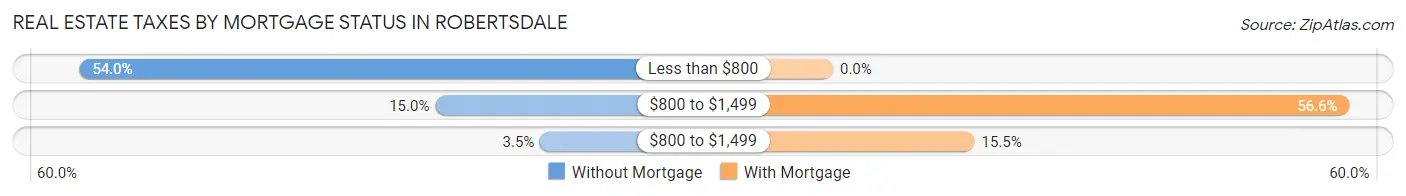
| Property Taxes | Without Mortgage | With Mortgage |
| Less than $800 | 216 (54.0%) | 0 (0.0%) |
| $800 to $1,499 | 60 (15.0%) | 708 (56.6%) |
| $800 to $1,499 | 14 (3.5%) | 194 (15.5%) |
| Total | 400 (100.0%) | 1,251 (100.0%) |
Health & Disability in Robertsdale
Health Insurance Coverage by Age in Robertsdale
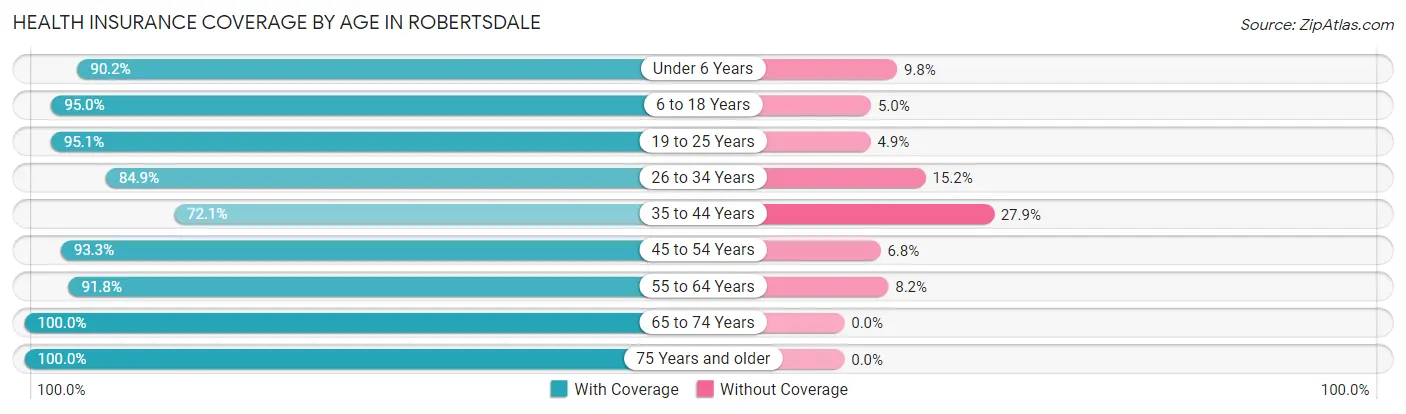
| Age Bracket | With Coverage | Without Coverage |
| Under 6 Years | 339 (90.2%) | 37 (9.8%) |
| 6 to 18 Years | 1,240 (95.0%) | 65 (5.0%) |
| 19 to 25 Years | 506 (95.1%) | 26 (4.9%) |
| 26 to 34 Years | 700 (84.9%) | 125 (15.1%) |
| 35 to 44 Years | 942 (72.1%) | 364 (27.9%) |
| 45 to 54 Years | 566 (93.2%) | 41 (6.8%) |
| 55 to 64 Years | 739 (91.8%) | 66 (8.2%) |
| 65 to 74 Years | 497 (100.0%) | 0 (0.0%) |
| 75 Years and older | 372 (100.0%) | 0 (0.0%) |
| Total | 5,901 (89.1%) | 724 (10.9%) |
Health Insurance Coverage by Citizenship Status in Robertsdale
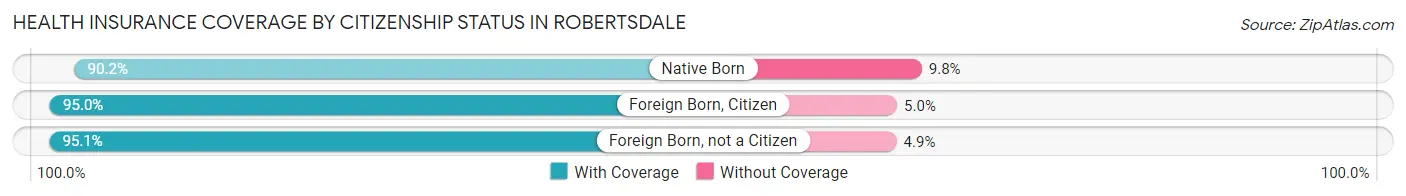
| Citizenship Status | With Coverage | Without Coverage |
| Native Born | 339 (90.2%) | 37 (9.8%) |
| Foreign Born, Citizen | 1,240 (95.0%) | 65 (5.0%) |
| Foreign Born, not a Citizen | 506 (95.1%) | 26 (4.9%) |
Health Insurance Coverage by Household Income in Robertsdale
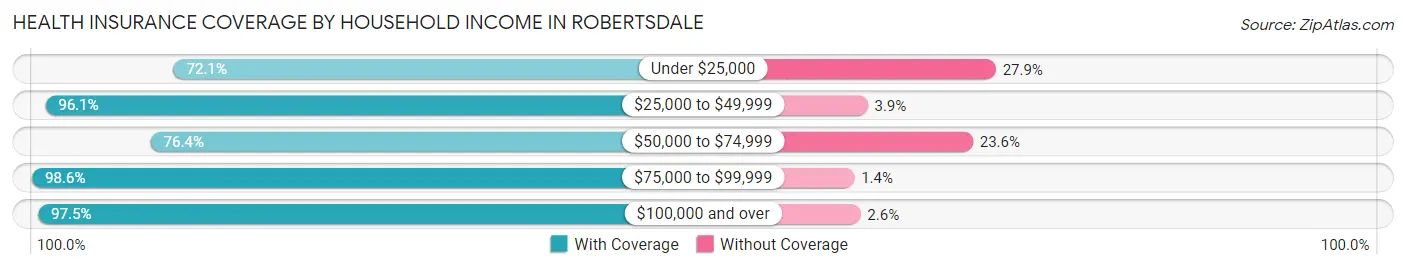
| Household Income | With Coverage | Without Coverage |
| Under $25,000 | 584 (72.1%) | 226 (27.9%) |
| $25,000 to $49,999 | 992 (96.1%) | 40 (3.9%) |
| $50,000 to $74,999 | 1,210 (76.4%) | 374 (23.6%) |
| $75,000 to $99,999 | 1,138 (98.6%) | 16 (1.4%) |
| $100,000 and over | 1,949 (97.5%) | 51 (2.5%) |
Public vs Private Health Insurance Coverage by Age in Robertsdale
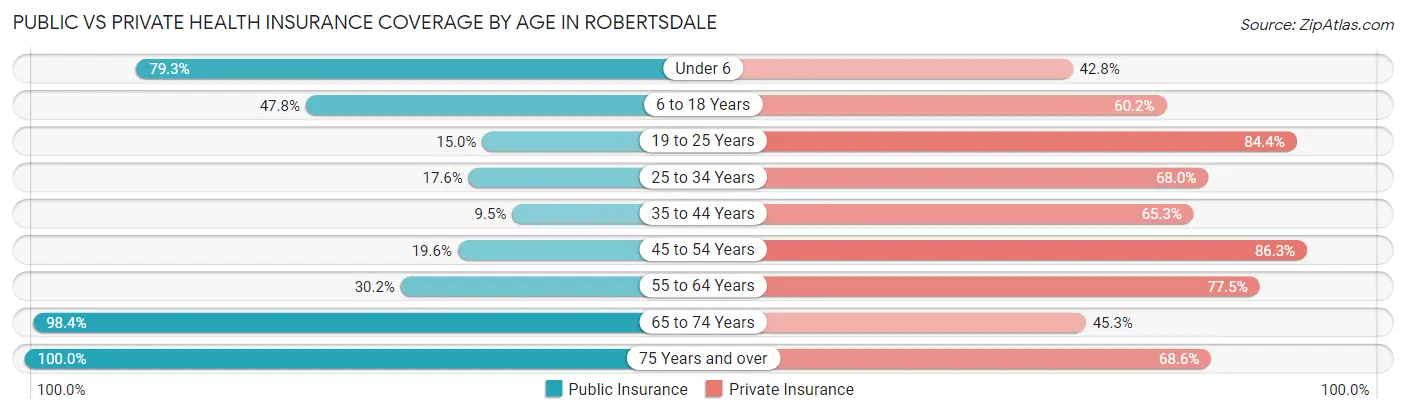
| Age Bracket | Public Insurance | Private Insurance |
| Under 6 | 298 (79.3%) | 161 (42.8%) |
| 6 to 18 Years | 624 (47.8%) | 786 (60.2%) |
| 19 to 25 Years | 80 (15.0%) | 449 (84.4%) |
| 25 to 34 Years | 145 (17.6%) | 561 (68.0%) |
| 35 to 44 Years | 124 (9.5%) | 853 (65.3%) |
| 45 to 54 Years | 119 (19.6%) | 524 (86.3%) |
| 55 to 64 Years | 243 (30.2%) | 624 (77.5%) |
| 65 to 74 Years | 489 (98.4%) | 225 (45.3%) |
| 75 Years and over | 372 (100.0%) | 255 (68.5%) |
| Total | 2,494 (37.7%) | 4,438 (67.0%) |
Disability Status by Sex by Age in Robertsdale
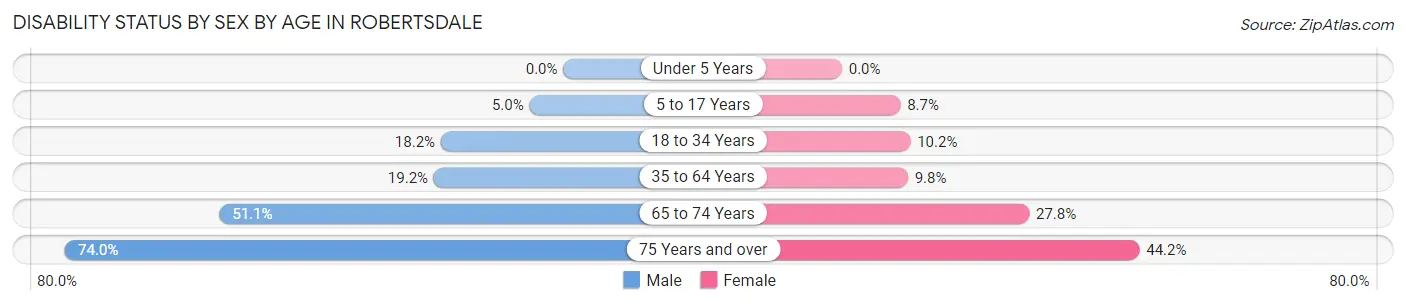
| Age Bracket | Male | Female |
| Under 5 Years | 0 (0.0%) | 0 (0.0%) |
| 5 to 17 Years | 33 (5.0%) | 43 (8.7%) |
| 18 to 34 Years | 178 (18.2%) | 64 (10.2%) |
| 35 to 64 Years | 228 (19.2%) | 150 (9.8%) |
| 65 to 74 Years | 94 (51.1%) | 87 (27.8%) |
| 75 Years and over | 91 (74.0%) | 110 (44.2%) |
Disability Class by Sex by Age in Robertsdale
Disability Class: Hearing Difficulty
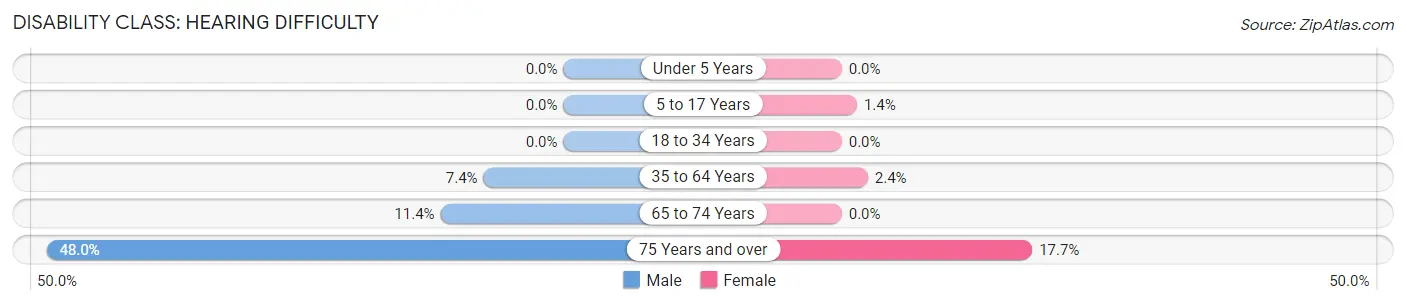
| Age Bracket | Male | Female |
| Under 5 Years | 0 (0.0%) | 0 (0.0%) |
| 5 to 17 Years | 0 (0.0%) | 7 (1.4%) |
| 18 to 34 Years | 0 (0.0%) | 0 (0.0%) |
| 35 to 64 Years | 88 (7.4%) | 37 (2.4%) |
| 65 to 74 Years | 21 (11.4%) | 0 (0.0%) |
| 75 Years and over | 59 (48.0%) | 44 (17.7%) |
Disability Class: Vision Difficulty
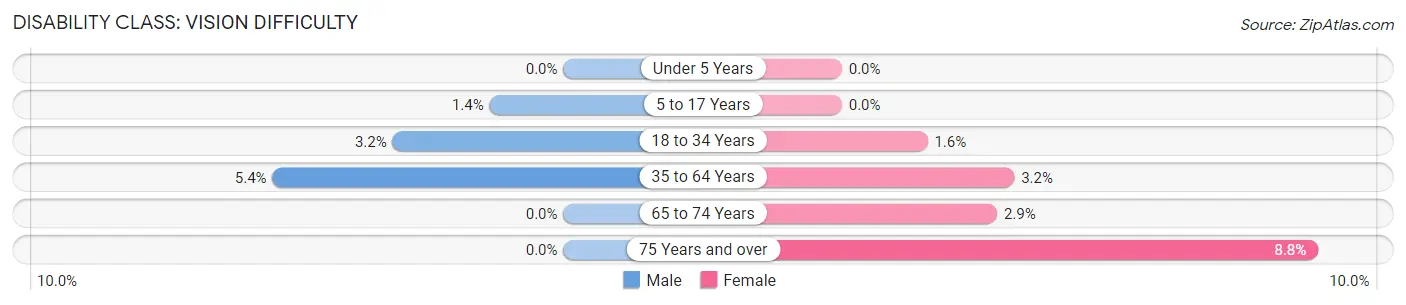
| Age Bracket | Male | Female |
| Under 5 Years | 0 (0.0%) | 0 (0.0%) |
| 5 to 17 Years | 9 (1.4%) | 0 (0.0%) |
| 18 to 34 Years | 31 (3.2%) | 10 (1.6%) |
| 35 to 64 Years | 64 (5.4%) | 49 (3.2%) |
| 65 to 74 Years | 0 (0.0%) | 9 (2.9%) |
| 75 Years and over | 0 (0.0%) | 22 (8.8%) |
Disability Class: Cognitive Difficulty
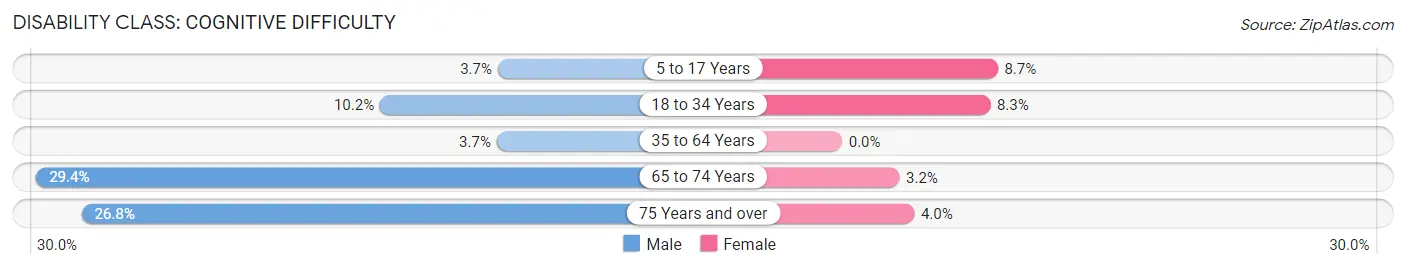
| Age Bracket | Male | Female |
| 5 to 17 Years | 24 (3.6%) | 43 (8.7%) |
| 18 to 34 Years | 100 (10.2%) | 52 (8.3%) |
| 35 to 64 Years | 44 (3.7%) | 0 (0.0%) |
| 65 to 74 Years | 54 (29.3%) | 10 (3.2%) |
| 75 Years and over | 33 (26.8%) | 10 (4.0%) |
Disability Class: Ambulatory Difficulty
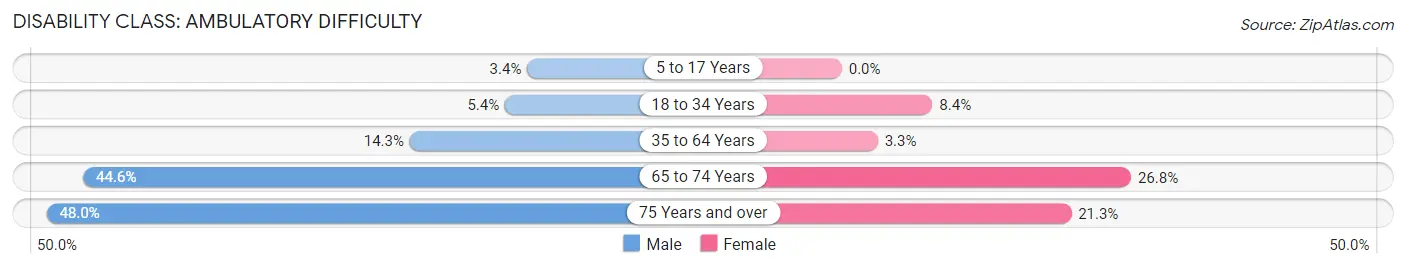
| Age Bracket | Male | Female |
| 5 to 17 Years | 22 (3.4%) | 0 (0.0%) |
| 18 to 34 Years | 53 (5.4%) | 53 (8.4%) |
| 35 to 64 Years | 169 (14.2%) | 51 (3.3%) |
| 65 to 74 Years | 82 (44.6%) | 84 (26.8%) |
| 75 Years and over | 59 (48.0%) | 53 (21.3%) |
Disability Class: Self-Care Difficulty
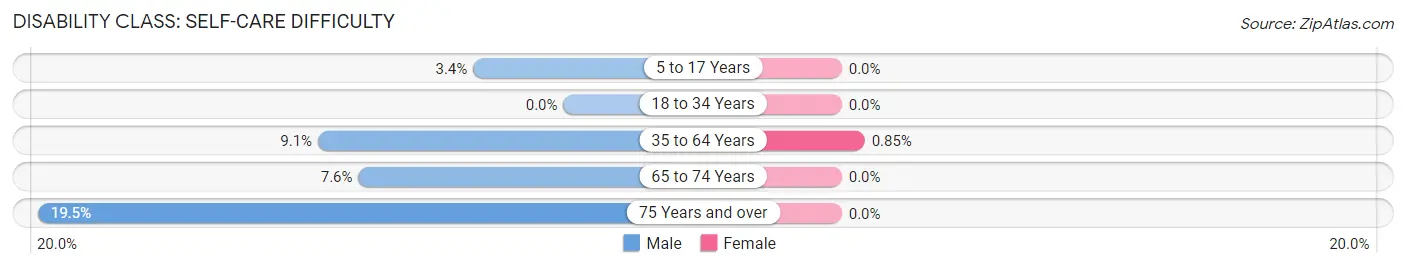
| Age Bracket | Male | Female |
| 5 to 17 Years | 22 (3.4%) | 0 (0.0%) |
| 18 to 34 Years | 0 (0.0%) | 0 (0.0%) |
| 35 to 64 Years | 108 (9.1%) | 13 (0.9%) |
| 65 to 74 Years | 14 (7.6%) | 0 (0.0%) |
| 75 Years and over | 24 (19.5%) | 0 (0.0%) |
Technology Access in Robertsdale
Computing Device Access in Robertsdale
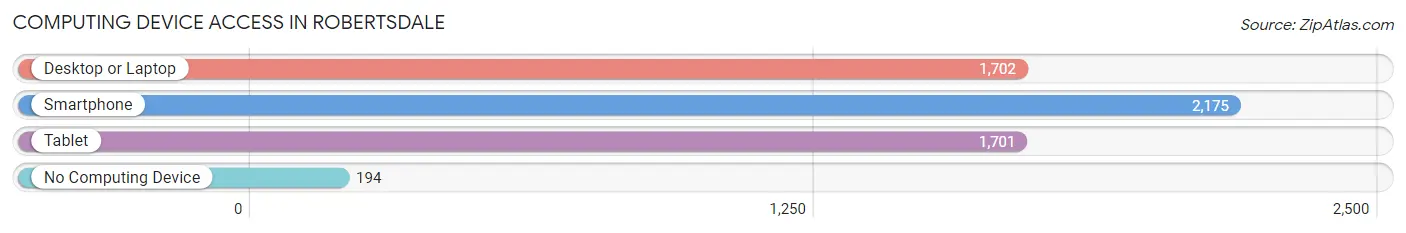
| Device Type | # Households | % Households |
| Desktop or Laptop | 1,702 | 67.4% |
| Smartphone | 2,175 | 86.1% |
| Tablet | 1,701 | 67.4% |
| No Computing Device | 194 | 7.7% |
| Total | 2,525 | 100.0% |
Internet Access in Robertsdale
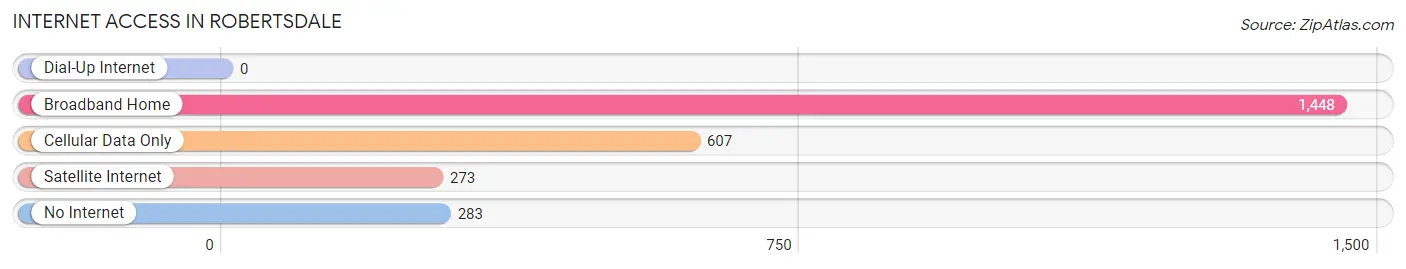
| Internet Type | # Households | % Households |
| Dial-Up Internet | 0 | 0.0% |
| Broadband Home | 1,448 | 57.4% |
| Cellular Data Only | 607 | 24.0% |
| Satellite Internet | 273 | 10.8% |
| No Internet | 283 | 11.2% |
| Total | 2,525 | 100.0% |
Robertsdale Summary
Introduction
Located in Baldwin County, Alabama, Robertsdale is a small city with a population of 5,276 as of the 2010 census. It is located in the southern part of the state, about 25 miles northeast of Mobile. The city is known for its rural charm and its proximity to the Gulf Coast. It is also home to the Baldwin County Fair, which is held annually in October.
History
The area that is now Robertsdale was first settled in the early 1800s by settlers from Georgia and the Carolinas. The town was originally known as "Cedar Grove" and was located near the intersection of two major roads, the Old Federal Road and the Old Spanish Trail. In 1891, the town was renamed "Robertsdale" after a local landowner, William Roberts.
The town grew slowly over the next few decades, and by the 1930s it had become a thriving agricultural community. The town was incorporated in 1947, and in the 1950s it began to experience a population boom as people moved to the area to take advantage of the booming economy.
Geography
Robertsdale is located in the southern part of Baldwin County, about 25 miles northeast of Mobile. The city is situated on the banks of the Perdido River, which flows into the Gulf of Mexico. The city is surrounded by rolling hills and forests, and is home to several small lakes.
The climate in Robertsdale is humid subtropical, with hot, humid summers and mild winters. The average annual temperature is around 70 degrees Fahrenheit, and the average annual precipitation is around 55 inches.
Economy
The economy of Robertsdale is largely based on agriculture and tourism. The city is home to several farms, and the surrounding area is known for its production of cotton, soybeans, and other crops. The city is also home to several small businesses, including restaurants, retail stores, and service providers.
Tourism is also an important part of the local economy. The city is home to several attractions, including the Baldwin County Fair, which is held annually in October. The city is also home to several parks and recreational areas, including the Perdido River Wildlife Management Area.
Demographics
As of the 2010 census, the population of Robertsdale was 5,276. The racial makeup of the city was 79.3% White, 17.2% African American, 0.7% Native American, 0.5% Asian, 0.1% Pacific Islander, and 2.2% from other races. Hispanic or Latino of any race were 2.7% of the population.
The median household income in Robertsdale was $37,917, and the median family income was $45,938. The per capita income was $19,945. About 16.2% of the population was below the poverty line.
Conclusion
Robertsdale is a small city located in Baldwin County, Alabama. It is known for its rural charm and its proximity to the Gulf Coast. The economy of the city is largely based on agriculture and tourism, and the city is home to several attractions, including the Baldwin County Fair. The population of Robertsdale was 5,276 as of the 2010 census, and the median household income was $37,917.
Common Questions
What is Per Capita Income in Robertsdale?
Per Capita income in Robertsdale is $35,633.
What is the Median Family Income in Robertsdale?
Median Family Income in Robertsdale is $71,306.
What is the Median Household income in Robertsdale?
Median Household Income in Robertsdale is $55,345.
What is Income or Wage Gap in Robertsdale?
Income or Wage Gap in Robertsdale is 27.8%.
Women in Robertsdale earn 72.2 cents for every dollar earned by a man.
What is Inequality or Gini Index in Robertsdale?
Inequality or Gini Index in Robertsdale is 0.53.
What is the Total Population of Robertsdale?
Total Population of Robertsdale is 6,793.
What is the Total Male Population of Robertsdale?
Total Male Population of Robertsdale is 3,304.
What is the Total Female Population of Robertsdale?
Total Female Population of Robertsdale is 3,489.
What is the Ratio of Males per 100 Females in Robertsdale?
There are 94.70 Males per 100 Females in Robertsdale.
What is the Ratio of Females per 100 Males in Robertsdale?
There are 105.60 Females per 100 Males in Robertsdale.
What is the Median Population Age in Robertsdale?
Median Population Age in Robertsdale is 38.4 Years.
What is the Average Family Size in Robertsdale
Average Family Size in Robertsdale is 3.2 People.
What is the Average Household Size in Robertsdale
Average Household Size in Robertsdale is 2.6 People.
How Large is the Labor Force in Robertsdale?
There are 3,354 People in the Labor Forcein in Robertsdale.
What is the Percentage of People in the Labor Force in Robertsdale?
61.0% of People are in the Labor Force in Robertsdale.
What is the Unemployment Rate in Robertsdale?
Unemployment Rate in Robertsdale is 1.5%.