Fillmore, UT Map & Demographics
Fillmore Map
Fillmore Overview
$26,436
PER CAPITA INCOME
$77,396
AVG FAMILY INCOME
$71,250
AVG HOUSEHOLD INCOME
50.3%
WAGE / INCOME GAP [ % ]
49.7¢/ $1
WAGE / INCOME GAP [ $ ]
0.40
INEQUALITY / GINI INDEX
2,572
TOTAL POPULATION
1,369
MALE POPULATION
1,203
FEMALE POPULATION
113.80
MALES / 100 FEMALES
87.87
FEMALES / 100 MALES
35.7
MEDIAN AGE
3.8
AVG FAMILY SIZE
3.4
AVG HOUSEHOLD SIZE
1,233
LABOR FORCE [ PEOPLE ]
65.7%
PERCENT IN LABOR FORCE
5.9%
UNEMPLOYMENT RATE
Fillmore Zip Codes
Fillmore Area Codes
Income in Fillmore
Income Overview in Fillmore
Per Capita Income in Fillmore is $26,436, while median incomes of families and households are $77,396 and $71,250 respectively.
| Characteristic | Number | Measure |
| Per Capita Income | 2,572 | $26,436 |
| Median Family Income | 618 | $77,396 |
| Mean Family Income | 618 | $97,622 |
| Median Household Income | 747 | $71,250 |
| Mean Household Income | 747 | $90,497 |
| Income Deficit | 618 | $0 |
| Wage / Income Gap (%) | 2,572 | 50.28% |
| Wage / Income Gap ($) | 2,572 | 49.72¢ per $1 |
| Gini / Inequality Index | 2,572 | 0.40 |
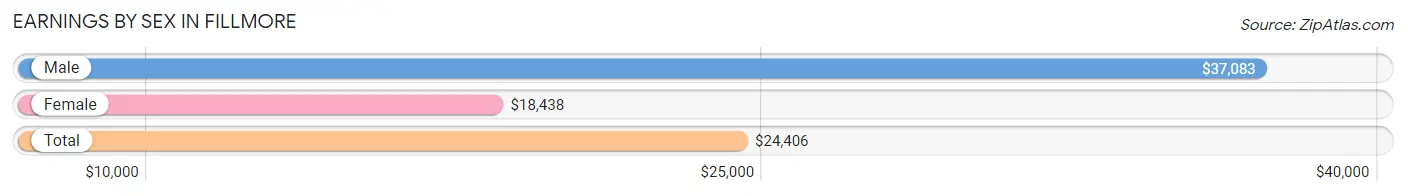
Earnings by Sex in Fillmore
Average Earnings in Fillmore are $24,406, $37,083 for men and $18,438 for women, a difference of 50.3%.
| Sex | Number | Average Earnings |
| Male | 802 (57.7%) | $37,083 |
| Female | 589 (42.3%) | $18,438 |
| Total | 1,391 (100.0%) | $24,406 |
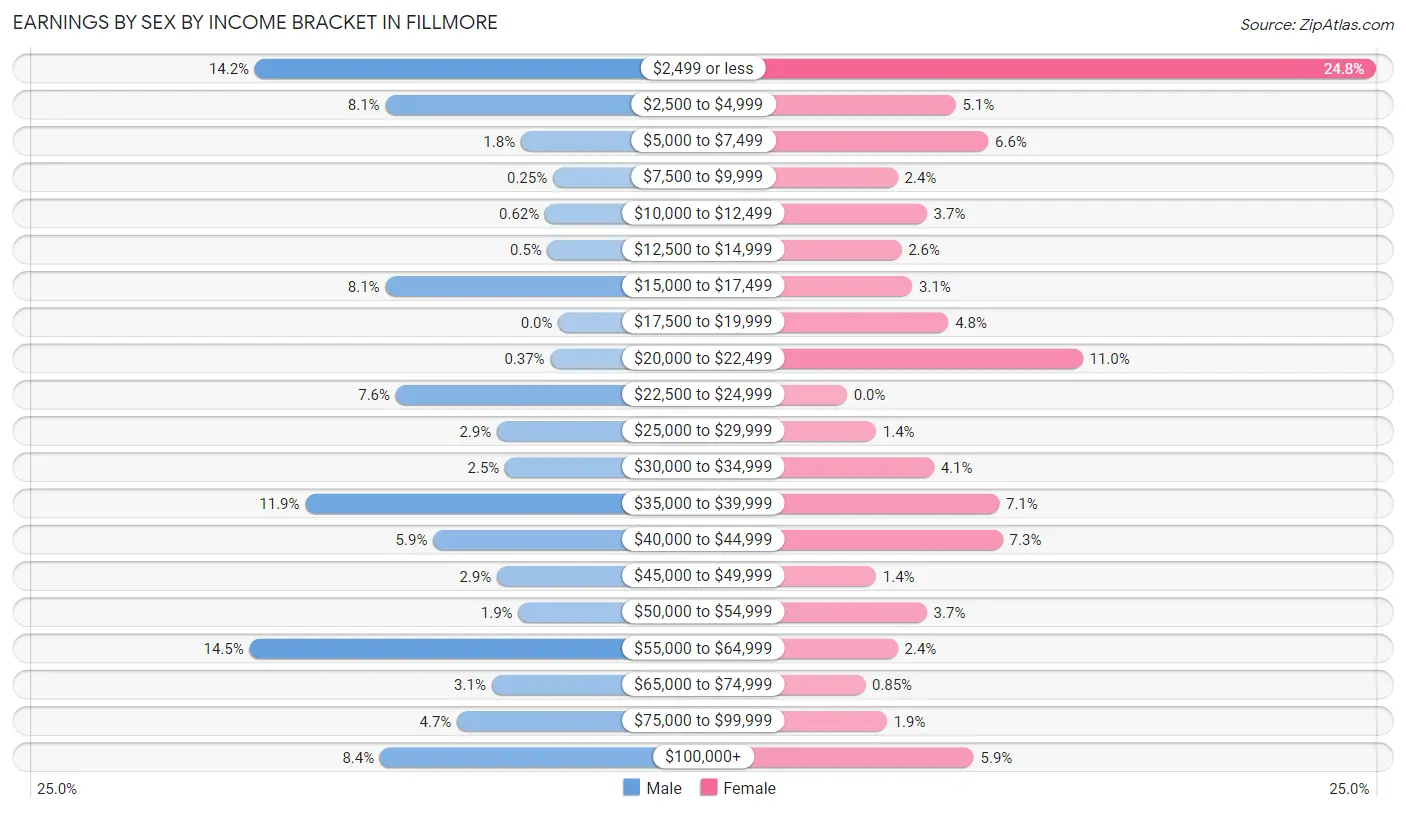
Earnings by Sex by Income Bracket in Fillmore
The most common earnings brackets in Fillmore are $55,000 to $64,999 for men (116 | 14.5%) and $2,499 or less for women (146 | 24.8%).
| Income | Male | Female |
| $2,499 or less | 114 (14.2%) | 146 (24.8%) |
| $2,500 to $4,999 | 65 (8.1%) | 30 (5.1%) |
| $5,000 to $7,499 | 14 (1.8%) | 39 (6.6%) |
| $7,500 to $9,999 | 2 (0.3%) | 14 (2.4%) |
| $10,000 to $12,499 | 5 (0.6%) | 22 (3.7%) |
| $12,500 to $14,999 | 4 (0.5%) | 15 (2.5%) |
| $15,000 to $17,499 | 65 (8.1%) | 18 (3.1%) |
| $17,500 to $19,999 | 0 (0.0%) | 28 (4.8%) |
| $20,000 to $22,499 | 3 (0.4%) | 65 (11.0%) |
| $22,500 to $24,999 | 61 (7.6%) | 0 (0.0%) |
| $25,000 to $29,999 | 23 (2.9%) | 8 (1.4%) |
| $30,000 to $34,999 | 20 (2.5%) | 24 (4.1%) |
| $35,000 to $39,999 | 95 (11.8%) | 42 (7.1%) |
| $40,000 to $44,999 | 47 (5.9%) | 43 (7.3%) |
| $45,000 to $49,999 | 23 (2.9%) | 8 (1.4%) |
| $50,000 to $54,999 | 15 (1.9%) | 22 (3.7%) |
| $55,000 to $64,999 | 116 (14.5%) | 14 (2.4%) |
| $65,000 to $74,999 | 25 (3.1%) | 5 (0.9%) |
| $75,000 to $99,999 | 38 (4.7%) | 11 (1.9%) |
| $100,000+ | 67 (8.4%) | 35 (5.9%) |
| Total | 802 (100.0%) | 589 (100.0%) |
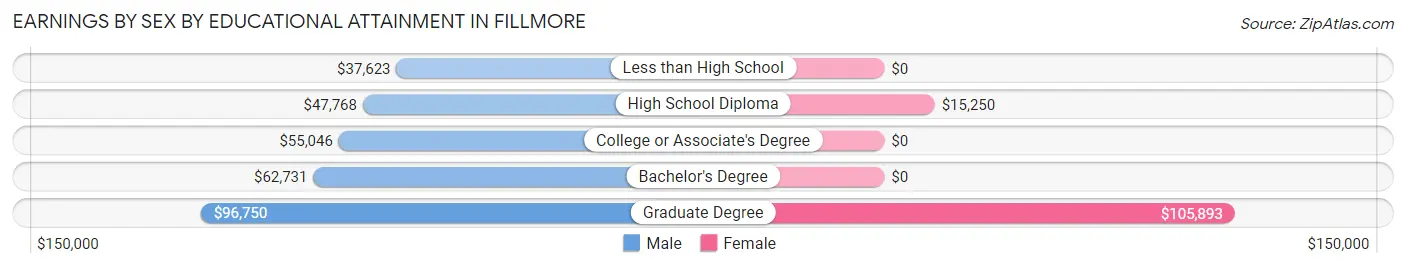
Earnings by Sex by Educational Attainment in Fillmore
Average earnings in Fillmore are $40,291 for men and $21,371 for women, a difference of 47.0%. Men with an educational attainment of graduate degree enjoy the highest average annual earnings of $96,750, while those with less than high school education earn the least with $37,623. Women with an educational attainment of graduate degree earn the most with the average annual earnings of $105,893, while those with high school diploma education have the smallest earnings of $15,250.
| Educational Attainment | Male Income | Female Income |
| Less than High School | $37,623 | $0 |
| High School Diploma | $47,768 | $15,250 |
| College or Associate's Degree | $55,046 | $0 |
| Bachelor's Degree | $62,731 | $0 |
| Graduate Degree | $96,750 | $105,893 |
| Total | $40,291 | $21,371 |
Family Income in Fillmore
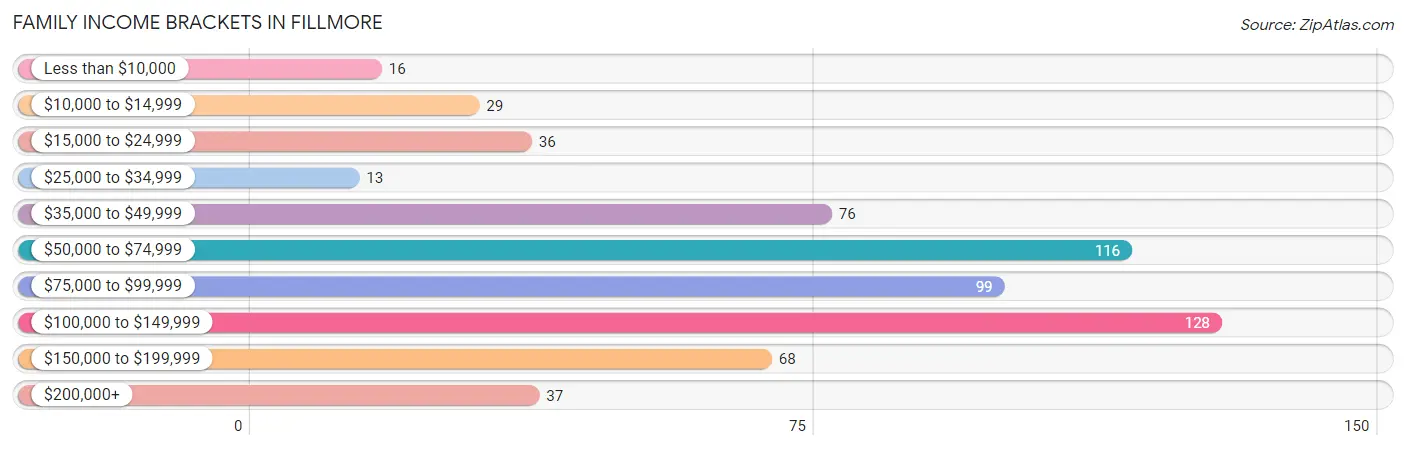
Family Income Brackets in Fillmore
According to the Fillmore family income data, there are 128 families falling into the $100,000 to $149,999 income range, which is the most common income bracket and makes up 20.7% of all families. Conversely, the $25,000 to $34,999 income bracket is the least frequent group with only 13 families (2.1%) belonging to this category.
| Income Bracket | # Families | % Families |
| Less than $10,000 | 16 | 2.6% |
| $10,000 to $14,999 | 29 | 4.7% |
| $15,000 to $24,999 | 36 | 5.8% |
| $25,000 to $34,999 | 13 | 2.1% |
| $35,000 to $49,999 | 76 | 12.3% |
| $50,000 to $74,999 | 116 | 18.8% |
| $75,000 to $99,999 | 99 | 16.0% |
| $100,000 to $149,999 | 128 | 20.7% |
| $150,000 to $199,999 | 68 | 11.0% |
| $200,000+ | 37 | 6.0% |
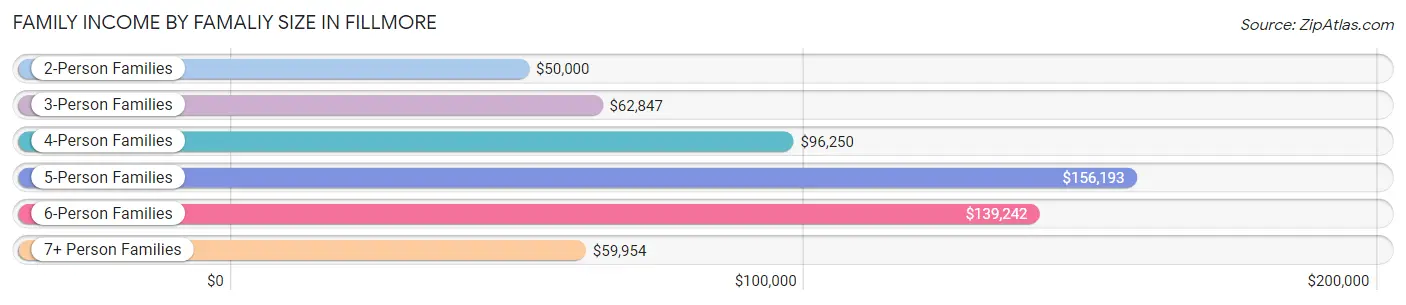
Family Income by Famaliy Size in Fillmore
5-person families (37 | 6.0%) account for the highest median family income in Fillmore with $156,193 per family, while 5-person families (37 | 6.0%) have the highest median income of $31,239 per family member.
| Income Bracket | # Families | Median Income |
| 2-Person Families | 282 (45.6%) | $50,000 |
| 3-Person Families | 81 (13.1%) | $62,847 |
| 4-Person Families | 56 (9.1%) | $96,250 |
| 5-Person Families | 37 (6.0%) | $156,193 |
| 6-Person Families | 109 (17.6%) | $139,242 |
| 7+ Person Families | 53 (8.6%) | $59,954 |
| Total | 618 (100.0%) | $77,396 |
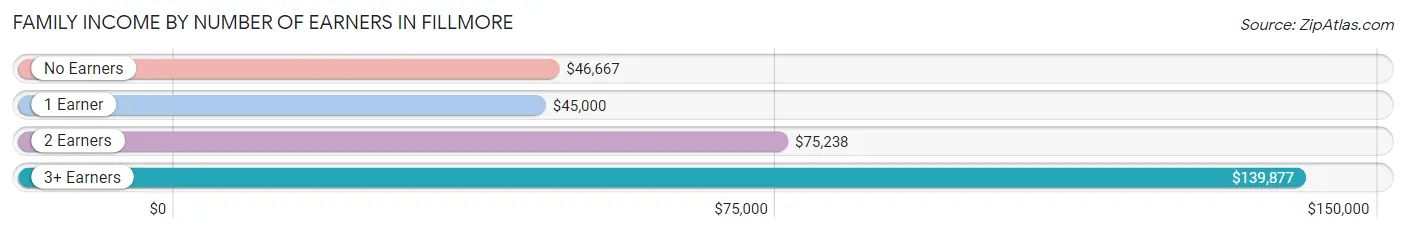
Family Income by Number of Earners in Fillmore
The median family income in Fillmore is $77,396, with families comprising 3+ earners (156) having the highest median family income of $139,877, while families with 1 earner (130) have the lowest median family income of $45,000, accounting for 25.2% and 21.0% of families, respectively.
| Number of Earners | # Families | Median Income |
| No Earners | 112 (18.1%) | $46,667 |
| 1 Earner | 130 (21.0%) | $45,000 |
| 2 Earners | 220 (35.6%) | $75,238 |
| 3+ Earners | 156 (25.2%) | $139,877 |
| Total | 618 (100.0%) | $77,396 |
Household Income in Fillmore
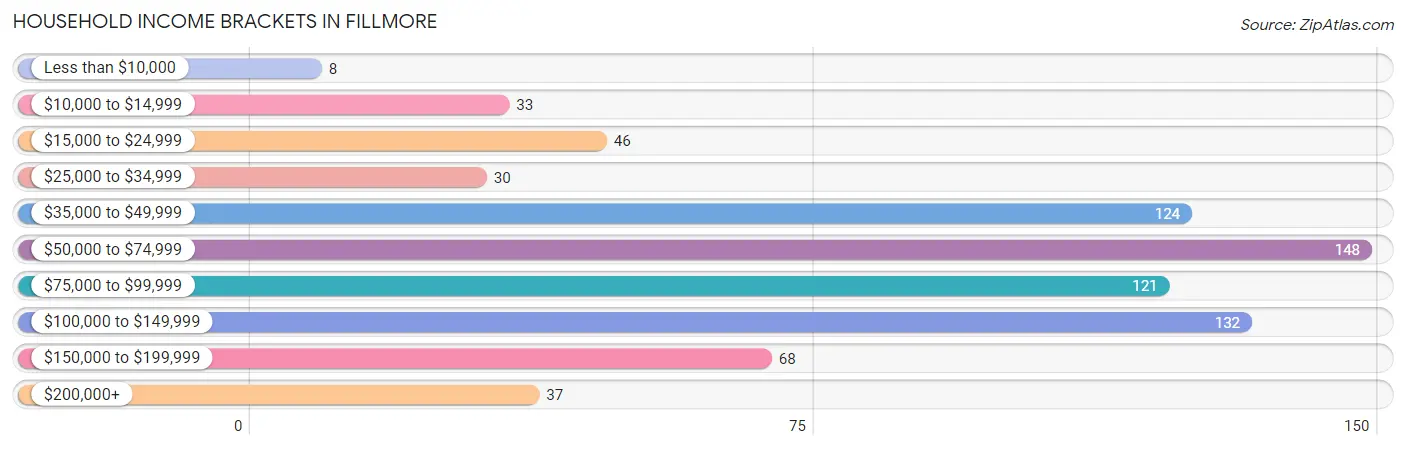
Household Income Brackets in Fillmore
With 148 households falling in the category, the $50,000 to $74,999 income range is the most frequent in Fillmore, accounting for 19.8% of all households. In contrast, only 8 households (1.1%) fall into the less than $10,000 income bracket, making it the least populous group.
| Income Bracket | # Households | % Households |
| Less than $10,000 | 8 | 1.1% |
| $10,000 to $14,999 | 33 | 4.4% |
| $15,000 to $24,999 | 46 | 6.2% |
| $25,000 to $34,999 | 30 | 4.0% |
| $35,000 to $49,999 | 124 | 16.6% |
| $50,000 to $74,999 | 148 | 19.8% |
| $75,000 to $99,999 | 121 | 16.2% |
| $100,000 to $149,999 | 132 | 17.7% |
| $150,000 to $199,999 | 68 | 9.1% |
| $200,000+ | 37 | 5.0% |
Household Income by Householder Age in Fillmore
The median household income in Fillmore is $71,250, with the highest median household income of $77,031 found in the 25 to 44 years age bracket for the primary householder. A total of 355 households (47.5%) fall into this category. Meanwhile, the 15 to 24 years age bracket for the primary householder has the lowest median household income of $45,781, with 22 households (2.9%) in this group.
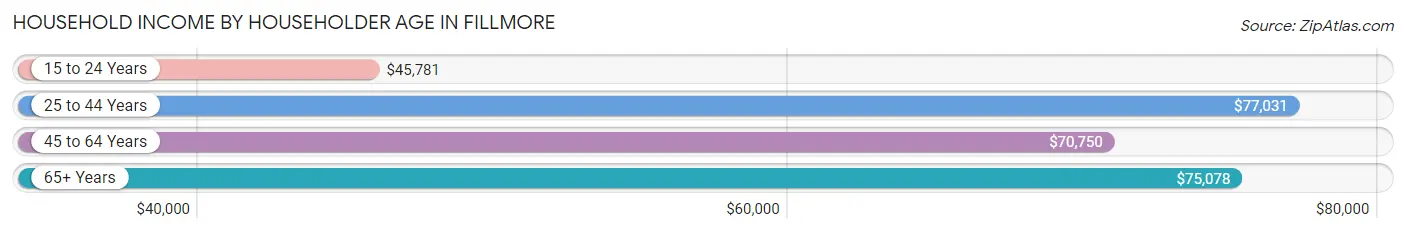
| Income Bracket | # Households | Median Income |
| 15 to 24 Years | 22 (2.9%) | $45,781 |
| 25 to 44 Years | 355 (47.5%) | $77,031 |
| 45 to 64 Years | 175 (23.4%) | $70,750 |
| 65+ Years | 195 (26.1%) | $75,078 |
| Total | 747 (100.0%) | $71,250 |
Poverty in Fillmore
Income Below Poverty by Sex and Age in Fillmore
With 5.8% poverty level for males and 11.7% for females among the residents of Fillmore, 5 year old males and 5 year old females are the most vulnerable to poverty, with 14 males (38.9%) and 57 females (82.6%) in their respective age groups living below the poverty level.
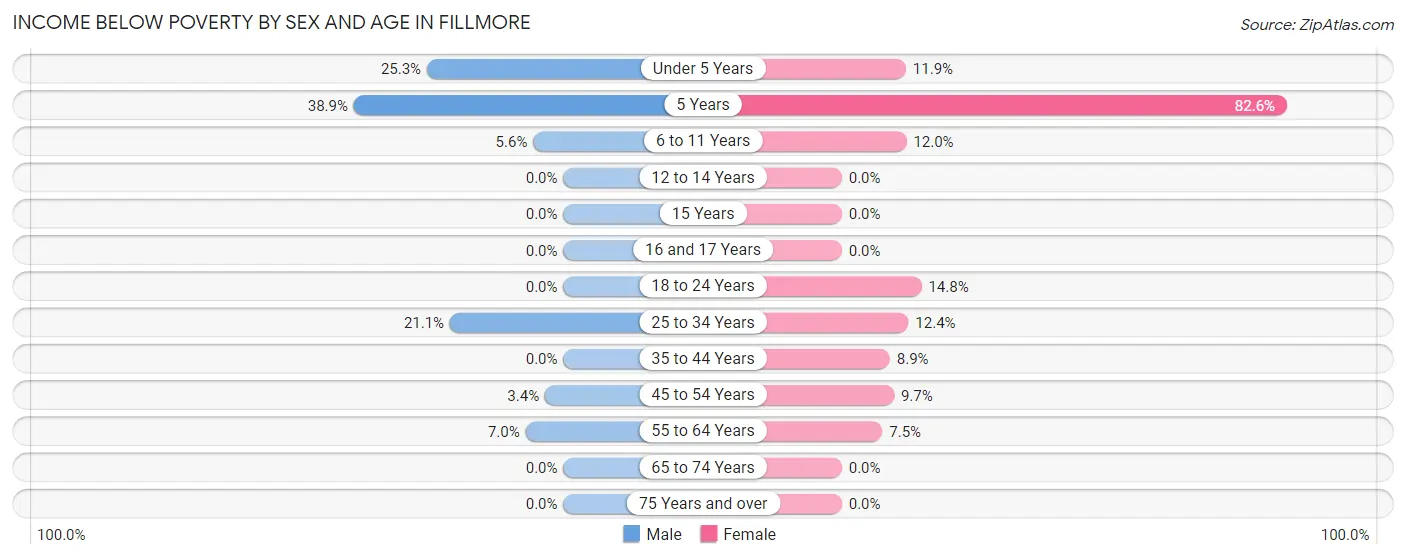
| Age Bracket | Male | Female |
| Under 5 Years | 20 (25.3%) | 5 (11.9%) |
| 5 Years | 14 (38.9%) | 57 (82.6%) |
| 6 to 11 Years | 8 (5.6%) | 9 (12.0%) |
| 12 to 14 Years | 0 (0.0%) | 0 (0.0%) |
| 15 Years | 0 (0.0%) | 0 (0.0%) |
| 16 and 17 Years | 0 (0.0%) | 0 (0.0%) |
| 18 to 24 Years | 0 (0.0%) | 21 (14.8%) |
| 25 to 34 Years | 24 (21.0%) | 11 (12.4%) |
| 35 to 44 Years | 0 (0.0%) | 19 (8.9%) |
| 45 to 54 Years | 3 (3.4%) | 6 (9.7%) |
| 55 to 64 Years | 8 (7.0%) | 11 (7.5%) |
| 65 to 74 Years | 0 (0.0%) | 0 (0.0%) |
| 75 Years and over | 0 (0.0%) | 0 (0.0%) |
| Total | 77 (5.8%) | 139 (11.7%) |
Income Above Poverty by Sex and Age in Fillmore
According to the poverty statistics in Fillmore, males aged 12 to 14 years and females aged 12 to 14 years are the age groups that are most secure financially, with 100.0% of males and 100.0% of females in these age groups living above the poverty line.
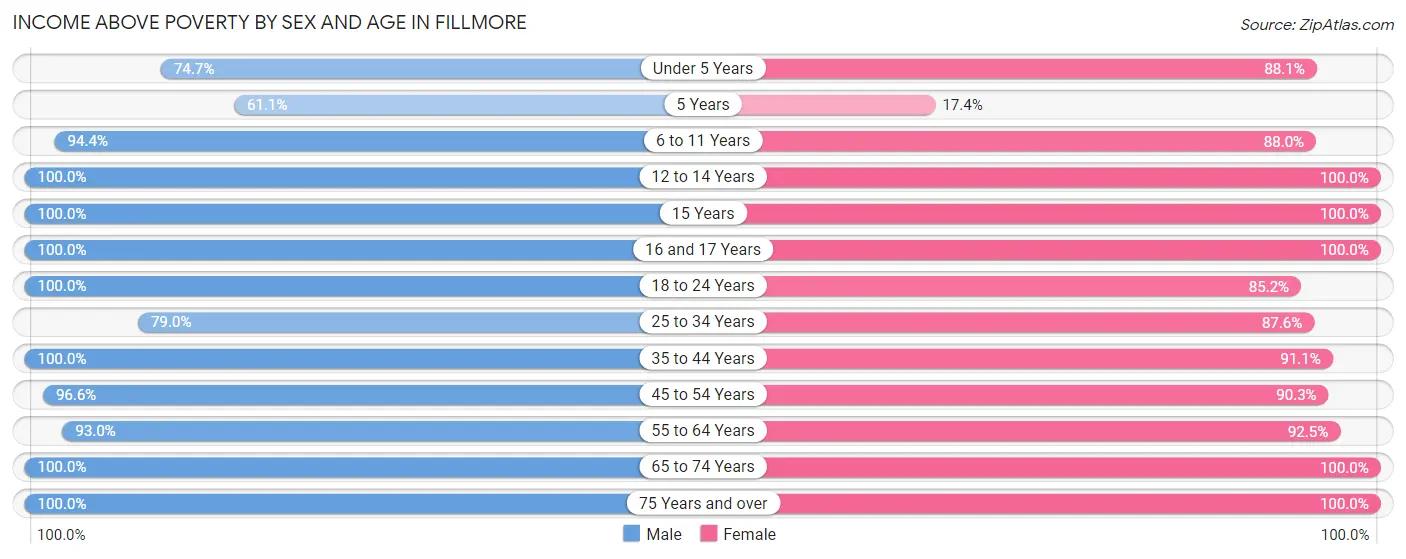
| Age Bracket | Male | Female |
| Under 5 Years | 59 (74.7%) | 37 (88.1%) |
| 5 Years | 22 (61.1%) | 12 (17.4%) |
| 6 to 11 Years | 135 (94.4%) | 66 (88.0%) |
| 12 to 14 Years | 131 (100.0%) | 61 (100.0%) |
| 15 Years | 1 (100.0%) | 59 (100.0%) |
| 16 and 17 Years | 104 (100.0%) | 25 (100.0%) |
| 18 to 24 Years | 75 (100.0%) | 121 (85.2%) |
| 25 to 34 Years | 90 (78.9%) | 78 (87.6%) |
| 35 to 44 Years | 259 (100.0%) | 194 (91.1%) |
| 45 to 54 Years | 85 (96.6%) | 56 (90.3%) |
| 55 to 64 Years | 106 (93.0%) | 135 (92.5%) |
| 65 to 74 Years | 71 (100.0%) | 97 (100.0%) |
| 75 Years and over | 115 (100.0%) | 106 (100.0%) |
| Total | 1,253 (94.2%) | 1,047 (88.3%) |
Income Below Poverty Among Married-Couple Families in Fillmore
The poverty statistics for married-couple families in Fillmore show that 2.9% or 14 of the total 491 families live below the poverty line. Families with 3 or 4 children have the highest poverty rate of 9.3%, comprising of 5 families. On the other hand, families with 1 or 2 children have the lowest poverty rate of 0.0%, which includes 0 families.
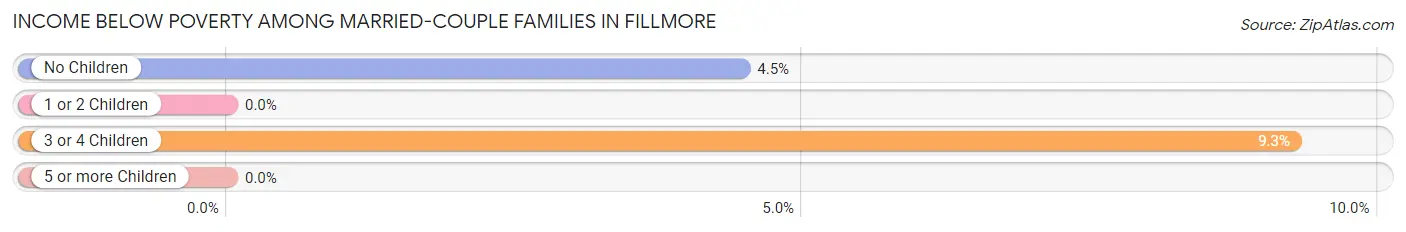
| Children | Above Poverty | Below Poverty |
| No Children | 193 (95.5%) | 9 (4.5%) |
| 1 or 2 Children | 182 (100.0%) | 0 (0.0%) |
| 3 or 4 Children | 49 (90.7%) | 5 (9.3%) |
| 5 or more Children | 53 (100.0%) | 0 (0.0%) |
| Total | 477 (97.2%) | 14 (2.9%) |
Income Below Poverty Among Single-Parent Households in Fillmore
According to the poverty data in Fillmore, 70.8% or 17 single-father households and 36.9% or 38 single-mother households are living below the poverty line. Among single-father households, those with 1 or 2 children have the highest poverty rate, with 17 households (85.0%) experiencing poverty. Likewise, among single-mother households, those with 1 or 2 children have the highest poverty rate, with 38 households (60.3%) falling below the poverty line.
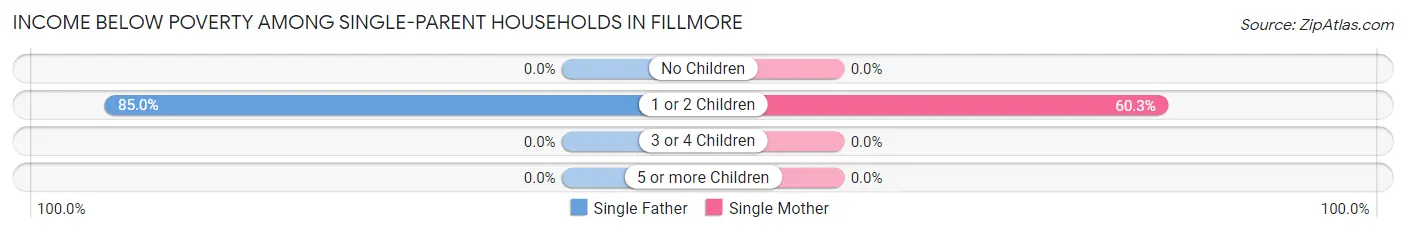
| Children | Single Father | Single Mother |
| No Children | 0 (0.0%) | 0 (0.0%) |
| 1 or 2 Children | 17 (85.0%) | 38 (60.3%) |
| 3 or 4 Children | 0 (0.0%) | 0 (0.0%) |
| 5 or more Children | 0 (0.0%) | 0 (0.0%) |
| Total | 17 (70.8%) | 38 (36.9%) |
Income Below Poverty Among Married-Couple vs Single-Parent Households in Fillmore
The poverty data for Fillmore shows that 14 of the married-couple family households (2.9%) and 55 of the single-parent households (43.3%) are living below the poverty level. Within the married-couple family households, those with 3 or 4 children have the highest poverty rate, with 5 households (9.3%) falling below the poverty line. Among the single-parent households, those with 1 or 2 children have the highest poverty rate, with 55 household (66.3%) living below poverty.
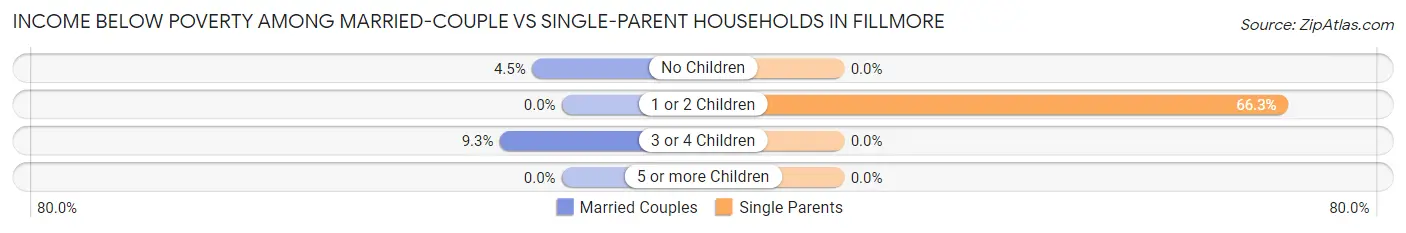
| Children | Married-Couple Families | Single-Parent Households |
| No Children | 9 (4.5%) | 0 (0.0%) |
| 1 or 2 Children | 0 (0.0%) | 55 (66.3%) |
| 3 or 4 Children | 5 (9.3%) | 0 (0.0%) |
| 5 or more Children | 0 (0.0%) | 0 (0.0%) |
| Total | 14 (2.9%) | 55 (43.3%) |
Race in Fillmore
The most populous races in Fillmore are White / Caucasian (1,962 | 76.3%), Hispanic or Latino (575 | 22.4%), and Some other Race (432 | 16.8%).
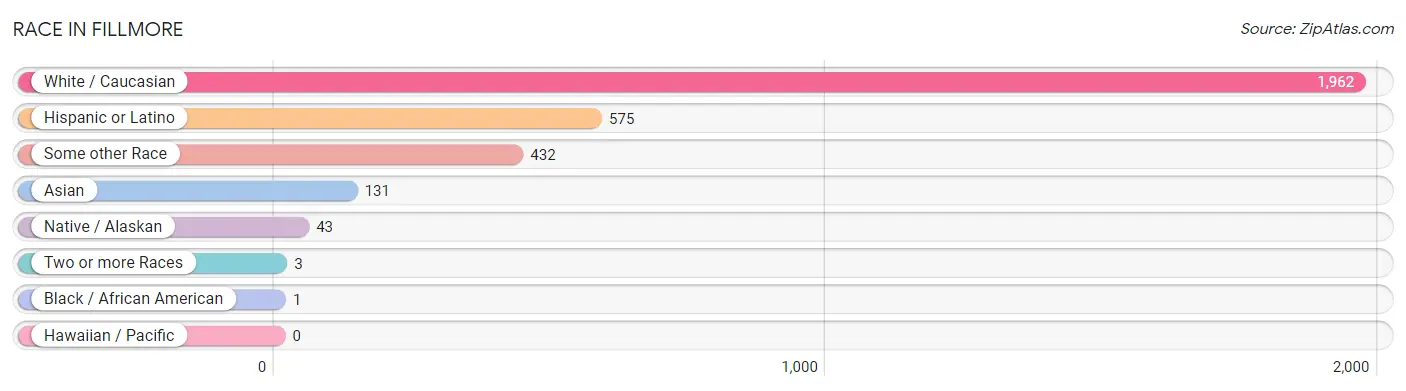
| Race | # Population | % Population |
| Asian | 131 | 5.1% |
| Black / African American | 1 | 0.0% |
| Hawaiian / Pacific | 0 | 0.0% |
| Hispanic or Latino | 575 | 22.4% |
| Native / Alaskan | 43 | 1.7% |
| White / Caucasian | 1,962 | 76.3% |
| Two or more Races | 3 | 0.1% |
| Some other Race | 432 | 16.8% |
| Total | 2,572 | 100.0% |
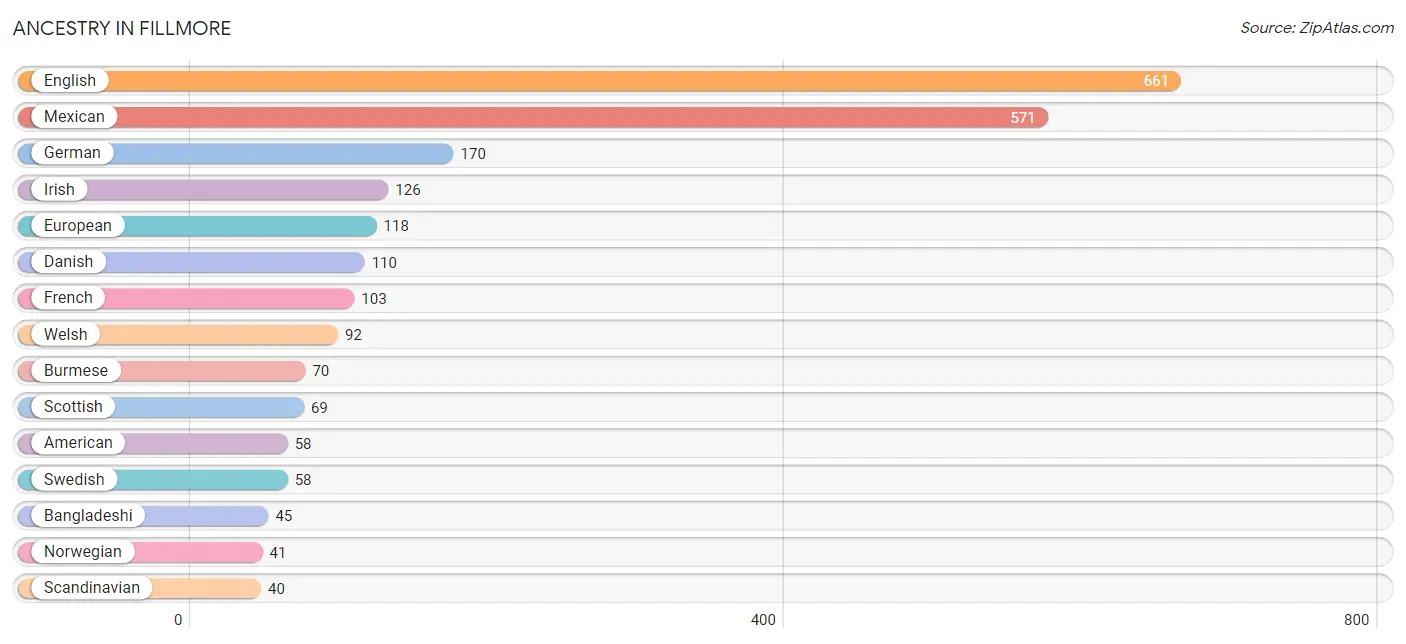
Ancestry in Fillmore
The most populous ancestries reported in Fillmore are English (661 | 25.7%), Mexican (571 | 22.2%), German (170 | 6.6%), Irish (126 | 4.9%), and European (118 | 4.6%), together accounting for 64.0% of all Fillmore residents.
| Ancestry | # Population | % Population |
| American | 58 | 2.3% |
| Bangladeshi | 45 | 1.8% |
| Bhutanese | 4 | 0.2% |
| British | 35 | 1.4% |
| Burmese | 70 | 2.7% |
| Czech | 3 | 0.1% |
| Danish | 110 | 4.3% |
| Dutch | 29 | 1.1% |
| English | 661 | 25.7% |
| European | 118 | 4.6% |
| French | 103 | 4.0% |
| German | 170 | 6.6% |
| Irish | 126 | 4.9% |
| Italian | 34 | 1.3% |
| Malaysian | 12 | 0.5% |
| Mexican | 571 | 22.2% |
| Mexican American Indian | 6 | 0.2% |
| Norwegian | 41 | 1.6% |
| Paiute | 37 | 1.4% |
| Polish | 9 | 0.4% |
| Puerto Rican | 1 | 0.0% |
| Russian | 12 | 0.5% |
| Scandinavian | 40 | 1.6% |
| Scottish | 69 | 2.7% |
| South African | 4 | 0.2% |
| Subsaharan African | 4 | 0.2% |
| Swedish | 58 | 2.3% |
| Welsh | 92 | 3.6% | View All 28 Rows |
Immigrants in Fillmore
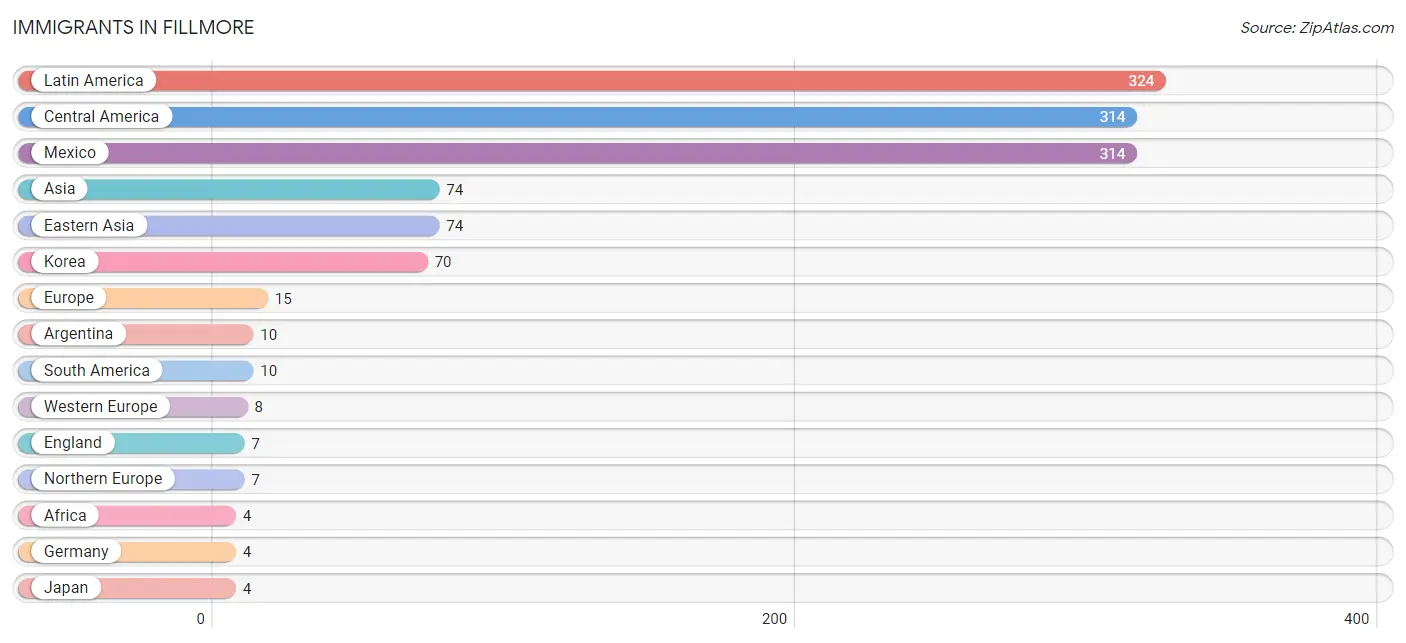
The most numerous immigrant groups reported in Fillmore came from Latin America (324 | 12.6%), Central America (314 | 12.2%), Mexico (314 | 12.2%), Asia (74 | 2.9%), and Eastern Asia (74 | 2.9%), together accounting for 42.8% of all Fillmore residents.
| Immigration Origin | # Population | % Population |
| Africa | 4 | 0.2% |
| Argentina | 10 | 0.4% |
| Asia | 74 | 2.9% |
| Central America | 314 | 12.2% |
| Eastern Asia | 74 | 2.9% |
| England | 7 | 0.3% |
| Europe | 15 | 0.6% |
| Germany | 4 | 0.2% |
| Japan | 4 | 0.2% |
| Korea | 70 | 2.7% |
| Latin America | 324 | 12.6% |
| Mexico | 314 | 12.2% |
| Netherlands | 4 | 0.2% |
| Northern Europe | 7 | 0.3% |
| South Africa | 4 | 0.2% |
| South America | 10 | 0.4% |
| Western Europe | 8 | 0.3% | View All 17 Rows |
Sex and Age in Fillmore
Sex and Age in Fillmore
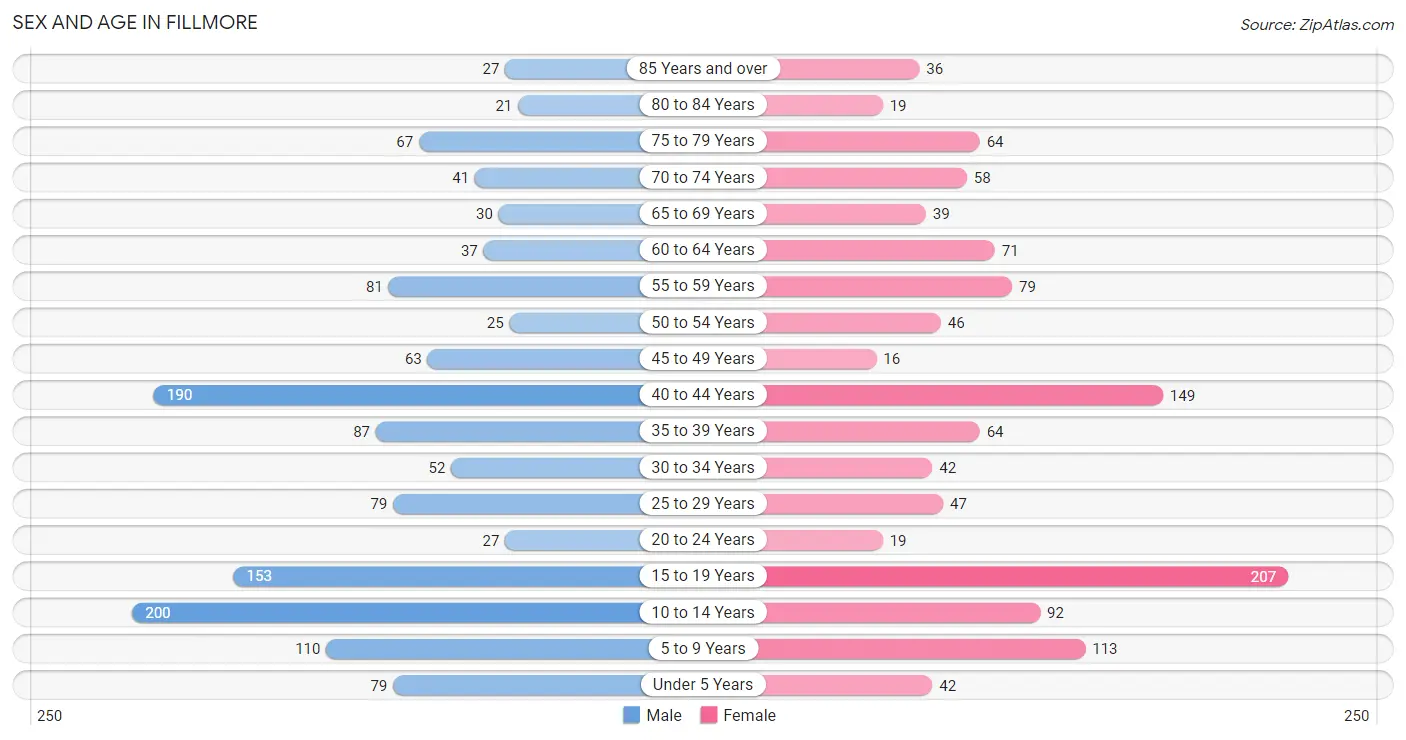
The most populous age groups in Fillmore are 10 to 14 Years (200 | 14.6%) for men and 15 to 19 Years (207 | 17.2%) for women.
| Age Bracket | Male | Female |
| Under 5 Years | 79 (5.8%) | 42 (3.5%) |
| 5 to 9 Years | 110 (8.0%) | 113 (9.4%) |
| 10 to 14 Years | 200 (14.6%) | 92 (7.6%) |
| 15 to 19 Years | 153 (11.2%) | 207 (17.2%) |
| 20 to 24 Years | 27 (2.0%) | 19 (1.6%) |
| 25 to 29 Years | 79 (5.8%) | 47 (3.9%) |
| 30 to 34 Years | 52 (3.8%) | 42 (3.5%) |
| 35 to 39 Years | 87 (6.4%) | 64 (5.3%) |
| 40 to 44 Years | 190 (13.9%) | 149 (12.4%) |
| 45 to 49 Years | 63 (4.6%) | 16 (1.3%) |
| 50 to 54 Years | 25 (1.8%) | 46 (3.8%) |
| 55 to 59 Years | 81 (5.9%) | 79 (6.6%) |
| 60 to 64 Years | 37 (2.7%) | 71 (5.9%) |
| 65 to 69 Years | 30 (2.2%) | 39 (3.2%) |
| 70 to 74 Years | 41 (3.0%) | 58 (4.8%) |
| 75 to 79 Years | 67 (4.9%) | 64 (5.3%) |
| 80 to 84 Years | 21 (1.5%) | 19 (1.6%) |
| 85 Years and over | 27 (2.0%) | 36 (3.0%) |
| Total | 1,369 (100.0%) | 1,203 (100.0%) |
Families and Households in Fillmore
Median Family Size in Fillmore
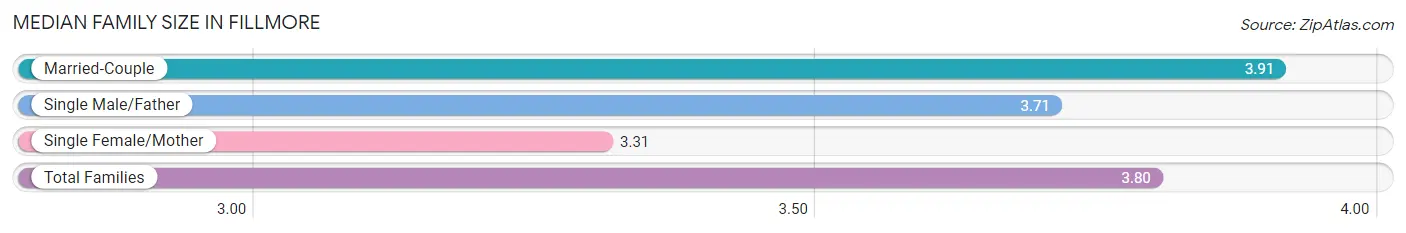
The median family size in Fillmore is 3.80 persons per family, with married-couple families (491 | 79.4%) accounting for the largest median family size of 3.91 persons per family. On the other hand, single female/mother families (103 | 16.7%) represent the smallest median family size with 3.31 persons per family.
| Family Type | # Families | Family Size |
| Married-Couple | 491 (79.4%) | 3.91 |
| Single Male/Father | 24 (3.9%) | 3.71 |
| Single Female/Mother | 103 (16.7%) | 3.31 |
| Total Families | 618 (100.0%) | 3.80 |
Median Household Size in Fillmore
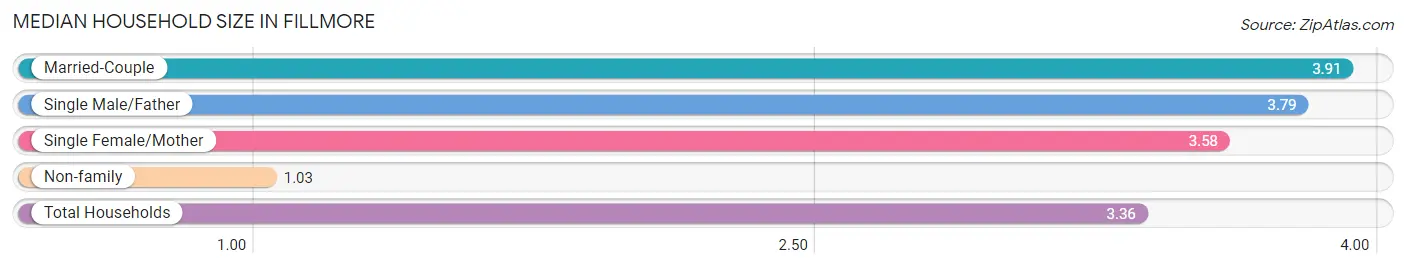
The median household size in Fillmore is 3.36 persons per household, with married-couple households (491 | 65.7%) accounting for the largest median household size of 3.91 persons per household. non-family households (129 | 17.3%) represent the smallest median household size with 1.03 persons per household.
| Household Type | # Households | Household Size |
| Married-Couple | 491 (65.7%) | 3.91 |
| Single Male/Father | 24 (3.2%) | 3.79 |
| Single Female/Mother | 103 (13.8%) | 3.58 |
| Non-family | 129 (17.3%) | 1.03 |
| Total Households | 747 (100.0%) | 3.36 |
Household Size by Marriage Status in Fillmore
Out of a total of 747 households in Fillmore, 618 (82.7%) are family households, while 129 (17.3%) are nonfamily households. The most numerous type of family households are 2-person households, comprising 263, and the most common type of nonfamily households are 1-person households, comprising 125.
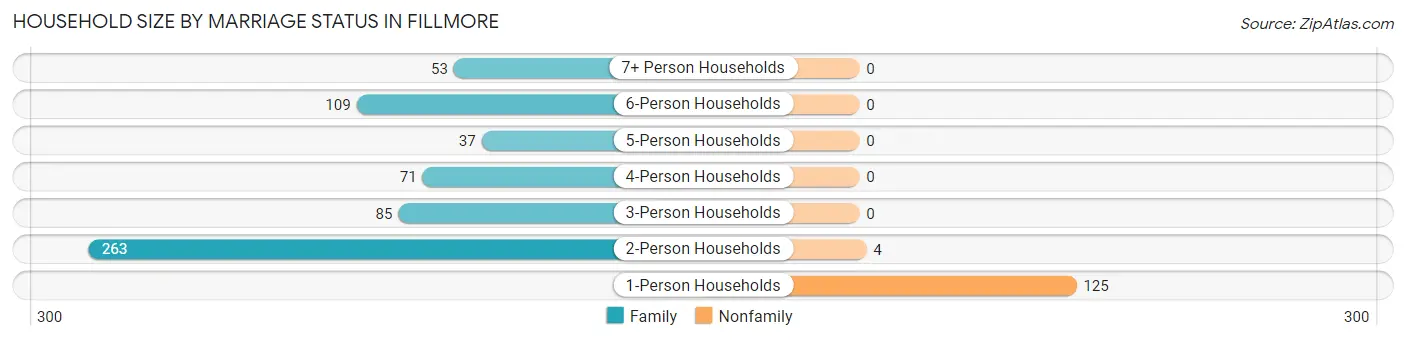
| Household Size | Family Households | Nonfamily Households |
| 1-Person Households | - | 125 (16.7%) |
| 2-Person Households | 263 (35.2%) | 4 (0.5%) |
| 3-Person Households | 85 (11.4%) | 0 (0.0%) |
| 4-Person Households | 71 (9.5%) | 0 (0.0%) |
| 5-Person Households | 37 (5.0%) | 0 (0.0%) |
| 6-Person Households | 109 (14.6%) | 0 (0.0%) |
| 7+ Person Households | 53 (7.1%) | 0 (0.0%) |
| Total | 618 (82.7%) | 129 (17.3%) |
Female Fertility in Fillmore
Fertility by Age in Fillmore
Average fertility rate in Fillmore is 70.0 births per 1,000 women. Women in the age bracket of 20 to 34 years have the highest fertility rate with 139.0 births per 1,000 women. Women in the age bracket of 35 to 50 years acount for 60.5% of all women with births.
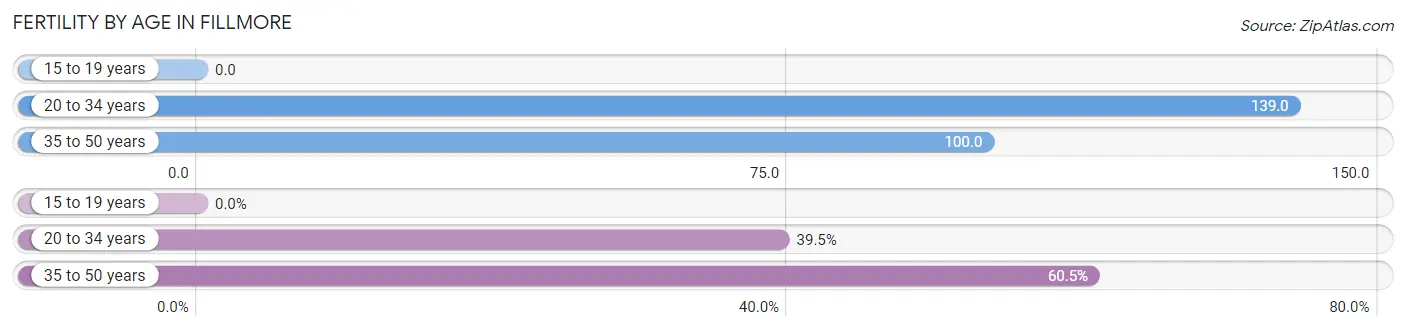
| Age Bracket | Women with Births | Births / 1,000 Women |
| 15 to 19 years | 0 (0.0%) | 0.0 |
| 20 to 34 years | 15 (39.5%) | 139.0 |
| 35 to 50 years | 23 (60.5%) | 100.0 |
| Total | 38 (100.0%) | 70.0 |
Fertility by Age by Marriage Status in Fillmore
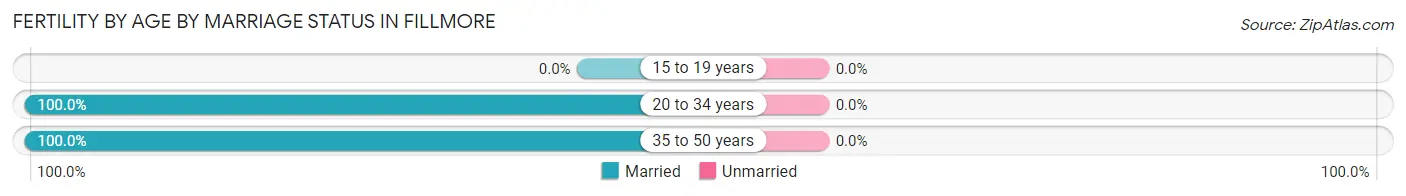
| Age Bracket | Married | Unmarried |
| 15 to 19 years | 0 (0.0%) | 0 (0.0%) |
| 20 to 34 years | 15 (100.0%) | 0 (0.0%) |
| 35 to 50 years | 23 (100.0%) | 0 (0.0%) |
| Total | 38 (100.0%) | 0 (0.0%) |
Fertility by Education in Fillmore
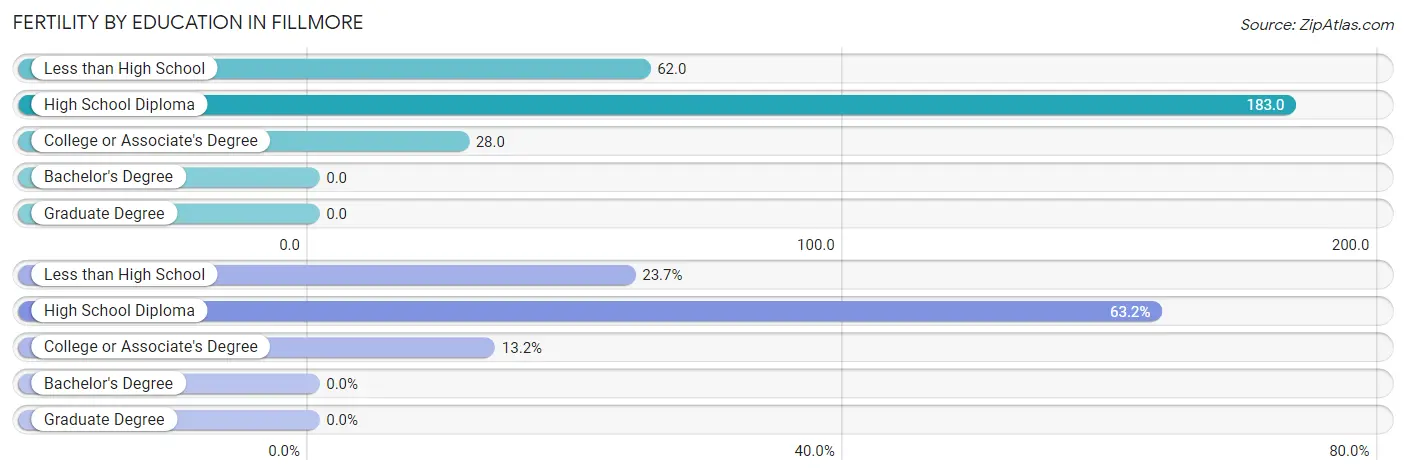
| Educational Attainment | Women with Births | Births / 1,000 Women |
| Less than High School | 9 (23.7%) | 62.0 |
| High School Diploma | 24 (63.2%) | 183.0 |
| College or Associate's Degree | 5 (13.2%) | 28.0 |
| Bachelor's Degree | 0 (0.0%) | 0.0 |
| Graduate Degree | 0 (0.0%) | 0.0 |
| Total | 38 (100.0%) | 70.0 |
Fertility by Education by Marriage Status in Fillmore
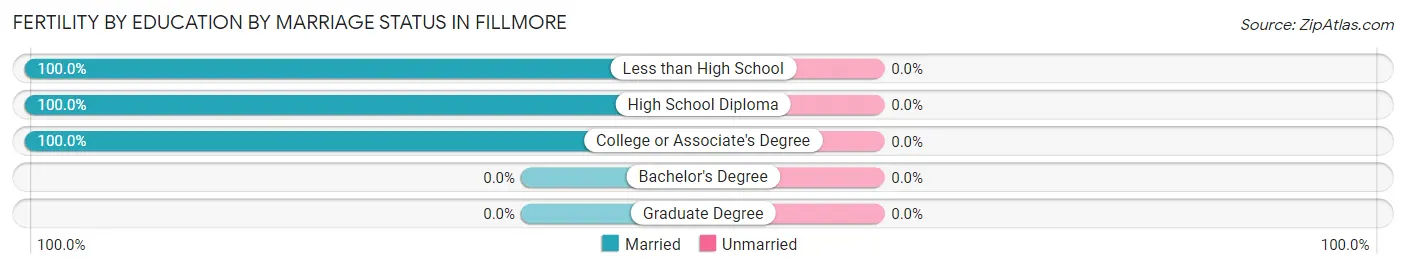
| Educational Attainment | Married | Unmarried |
| Less than High School | 9 (100.0%) | 0 (0.0%) |
| High School Diploma | 24 (100.0%) | 0 (0.0%) |
| College or Associate's Degree | 5 (100.0%) | 0 (0.0%) |
| Bachelor's Degree | 0 (0.0%) | 0 (0.0%) |
| Graduate Degree | 0 (0.0%) | 0 (0.0%) |
| Total | 38 (100.0%) | 0 (0.0%) |
Employment Characteristics in Fillmore
Employment by Class of Employer in Fillmore
Among the 1,098 employed individuals in Fillmore, private company employees (763 | 69.5%), local government employees (143 | 13.0%), and state government employees (58 | 5.3%) make up the most common classes of employment.
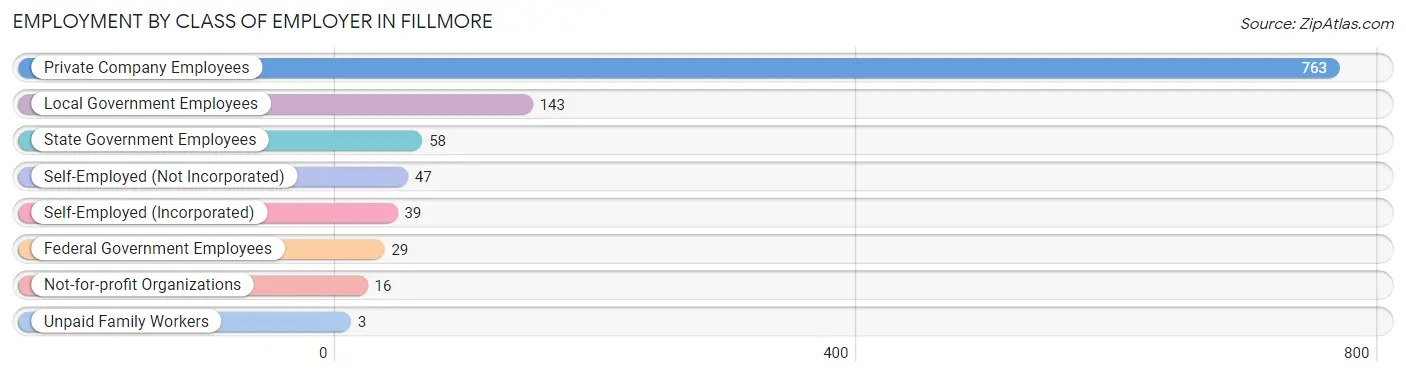
| Employer Class | # Employees | % Employees |
| Private Company Employees | 763 | 69.5% |
| Self-Employed (Incorporated) | 39 | 3.5% |
| Self-Employed (Not Incorporated) | 47 | 4.3% |
| Not-for-profit Organizations | 16 | 1.5% |
| Local Government Employees | 143 | 13.0% |
| State Government Employees | 58 | 5.3% |
| Federal Government Employees | 29 | 2.6% |
| Unpaid Family Workers | 3 | 0.3% |
| Total | 1,098 | 100.0% |
Employment Status by Age in Fillmore
According to the labor force statistics for Fillmore, out of the total population over 16 years of age (1,876), 65.7% or 1,233 individuals are in the labor force, with 5.9% or 73 of them unemployed. The age group with the highest labor force participation rate is 16 to 19 years, with 87.7% or 263 individuals in the labor force. Within the labor force, the 16 to 19 years age range has the highest percentage of unemployed individuals, with 25.9% or 68 of them being unemployed.
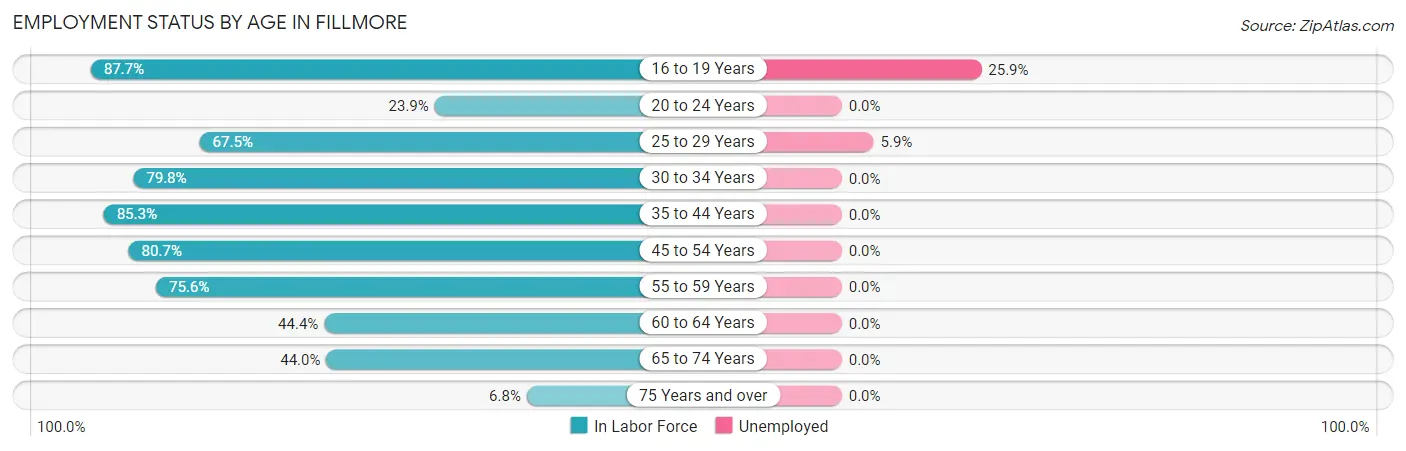
| Age Bracket | In Labor Force | Unemployed |
| 16 to 19 Years | 263 (87.7%) | 68 (25.9%) |
| 20 to 24 Years | 11 (23.9%) | 0 (0.0%) |
| 25 to 29 Years | 85 (67.5%) | 5 (5.9%) |
| 30 to 34 Years | 75 (79.8%) | 0 (0.0%) |
| 35 to 44 Years | 418 (85.3%) | 0 (0.0%) |
| 45 to 54 Years | 121 (80.7%) | 0 (0.0%) |
| 55 to 59 Years | 121 (75.6%) | 0 (0.0%) |
| 60 to 64 Years | 48 (44.4%) | 0 (0.0%) |
| 65 to 74 Years | 74 (44.0%) | 0 (0.0%) |
| 75 Years and over | 16 (6.8%) | 0 (0.0%) |
| Total | 1,233 (65.7%) | 73 (5.9%) |
Employment Status by Educational Attainment in Fillmore
According to labor force statistics for Fillmore, 77.0% of individuals (869) out of the total population between 25 and 64 years of age (1,128) are in the labor force, with 0.6% or 5 of them being unemployed. The group with the highest labor force participation rate are those with the educational attainment of bachelor's degree or higher, with 90.9% or 241 individuals in the labor force. Within the labor force, individuals with high school diploma education have the highest percentage of unemployment, with 3.0% or 5 of them being unemployed.
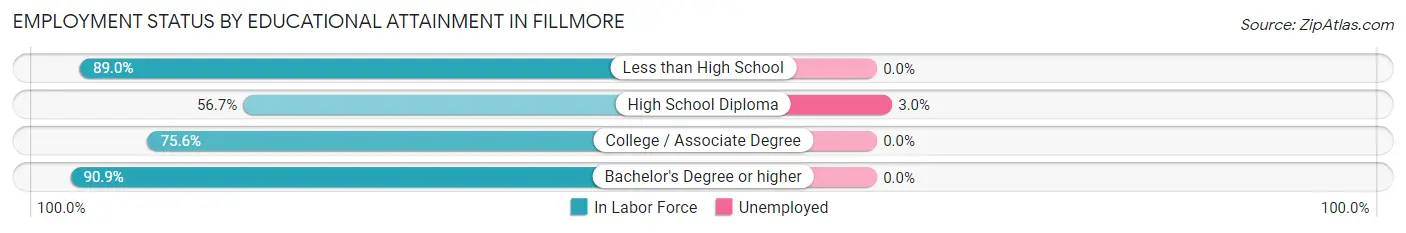
| Educational Attainment | In Labor Force | Unemployed |
| Less than High School | 195 (89.0%) | 0 (0.0%) |
| High School Diploma | 165 (56.7%) | 9 (3.0%) |
| College / Associate Degree | 267 (75.6%) | 0 (0.0%) |
| Bachelor's Degree or higher | 241 (90.9%) | 0 (0.0%) |
| Total | 869 (77.0%) | 7 (0.6%) |
Employment Occupations by Sex in Fillmore
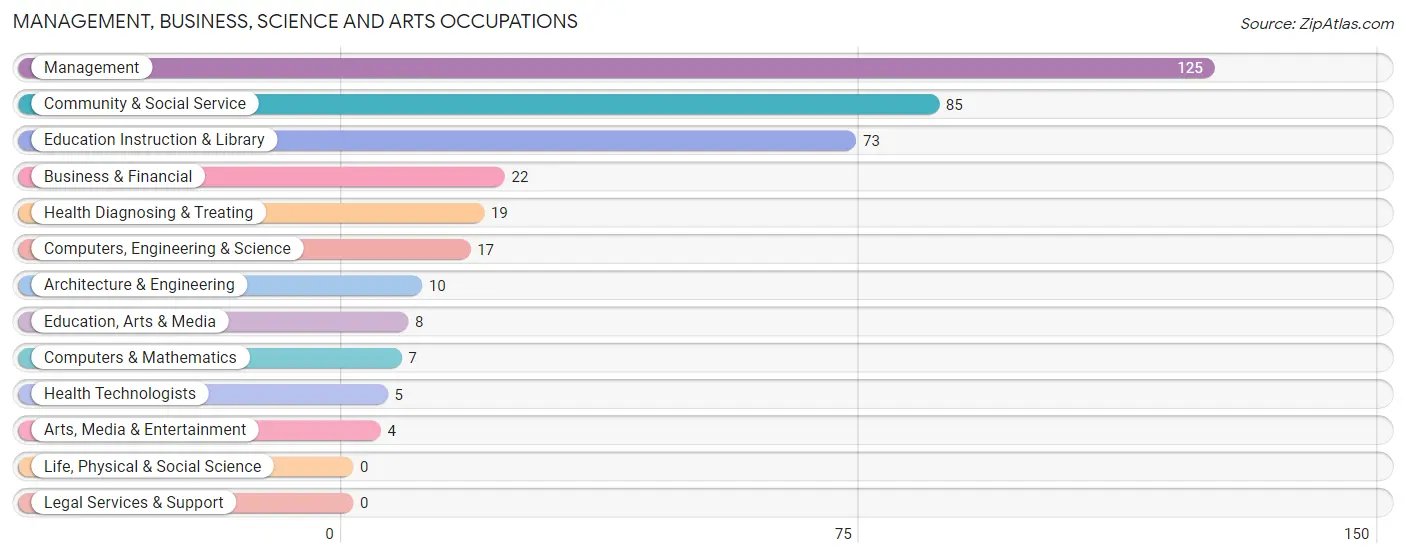
Management, Business, Science and Arts Occupations
The most common Management, Business, Science and Arts occupations in Fillmore are Management (125 | 10.8%), Community & Social Service (85 | 7.3%), Education Instruction & Library (73 | 6.3%), Business & Financial (22 | 1.9%), and Health Diagnosing & Treating (19 | 1.6%).
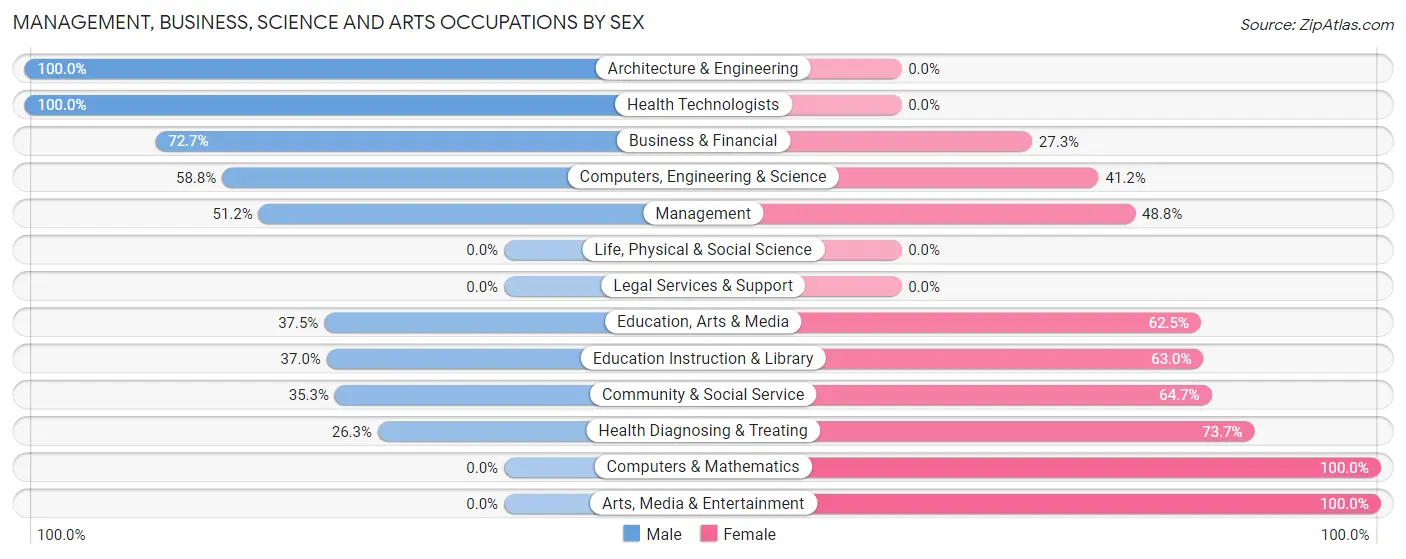
Management, Business, Science and Arts Occupations by Sex
Within the Management, Business, Science and Arts occupations in Fillmore, the most male-oriented occupations are Architecture & Engineering (100.0%), Health Technologists (100.0%), and Business & Financial (72.7%), while the most female-oriented occupations are Computers & Mathematics (100.0%), Arts, Media & Entertainment (100.0%), and Health Diagnosing & Treating (73.7%).
| Occupation | Male | Female |
| Management | 64 (51.2%) | 61 (48.8%) |
| Business & Financial | 16 (72.7%) | 6 (27.3%) |
| Computers, Engineering & Science | 10 (58.8%) | 7 (41.2%) |
| Computers & Mathematics | 0 (0.0%) | 7 (100.0%) |
| Architecture & Engineering | 10 (100.0%) | 0 (0.0%) |
| Life, Physical & Social Science | 0 (0.0%) | 0 (0.0%) |
| Community & Social Service | 30 (35.3%) | 55 (64.7%) |
| Education, Arts & Media | 3 (37.5%) | 5 (62.5%) |
| Legal Services & Support | 0 (0.0%) | 0 (0.0%) |
| Education Instruction & Library | 27 (37.0%) | 46 (63.0%) |
| Arts, Media & Entertainment | 0 (0.0%) | 4 (100.0%) |
| Health Diagnosing & Treating | 5 (26.3%) | 14 (73.7%) |
| Health Technologists | 5 (100.0%) | 0 (0.0%) |
| Total (Category) | 125 (46.6%) | 143 (53.4%) |
| Total (Overall) | 681 (58.8%) | 478 (41.2%) |
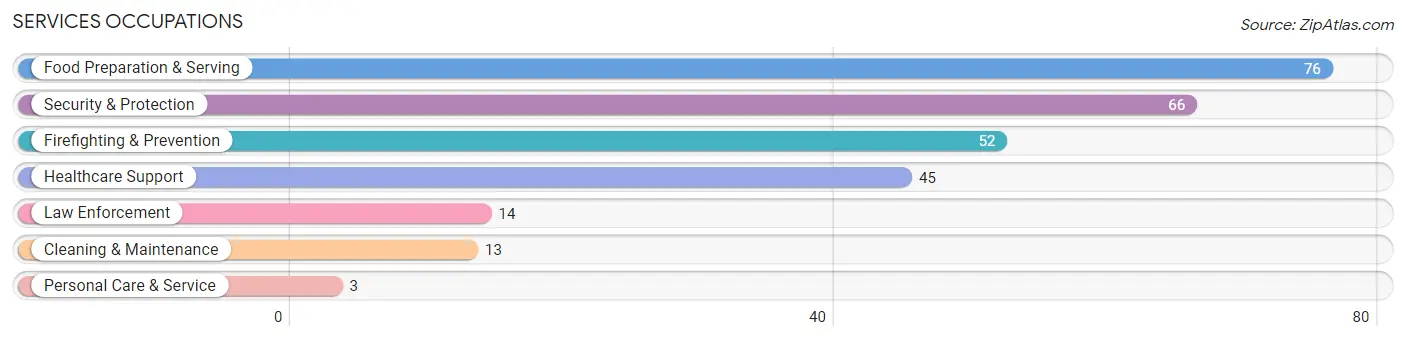
Services Occupations
The most common Services occupations in Fillmore are Food Preparation & Serving (76 | 6.6%), Security & Protection (66 | 5.7%), Firefighting & Prevention (52 | 4.5%), Healthcare Support (45 | 3.9%), and Law Enforcement (14 | 1.2%).
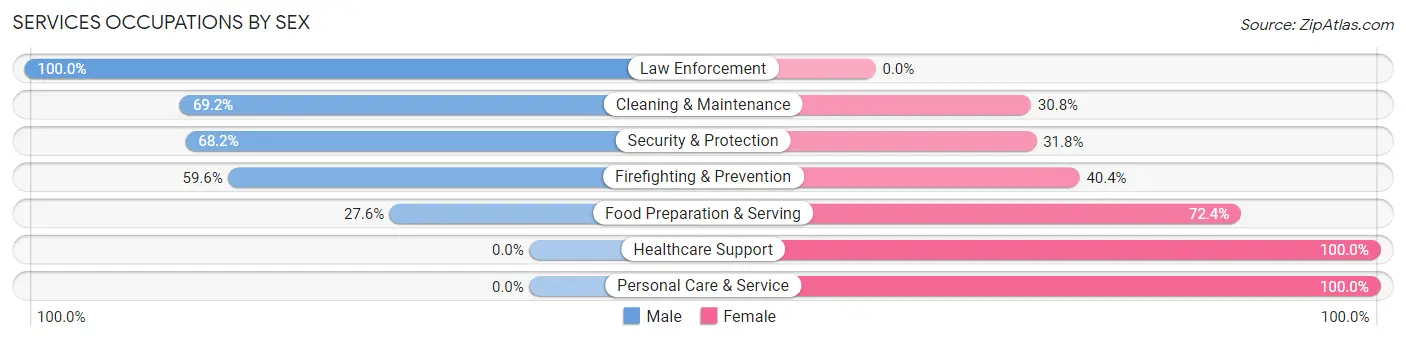
Services Occupations by Sex
Within the Services occupations in Fillmore, the most male-oriented occupations are Law Enforcement (100.0%), Cleaning & Maintenance (69.2%), and Security & Protection (68.2%), while the most female-oriented occupations are Healthcare Support (100.0%), Personal Care & Service (100.0%), and Food Preparation & Serving (72.4%).
| Occupation | Male | Female |
| Healthcare Support | 0 (0.0%) | 45 (100.0%) |
| Security & Protection | 45 (68.2%) | 21 (31.8%) |
| Firefighting & Prevention | 31 (59.6%) | 21 (40.4%) |
| Law Enforcement | 14 (100.0%) | 0 (0.0%) |
| Food Preparation & Serving | 21 (27.6%) | 55 (72.4%) |
| Cleaning & Maintenance | 9 (69.2%) | 4 (30.8%) |
| Personal Care & Service | 0 (0.0%) | 3 (100.0%) |
| Total (Category) | 75 (36.9%) | 128 (63.0%) |
| Total (Overall) | 681 (58.8%) | 478 (41.2%) |
Sales and Office Occupations
The most common Sales and Office occupations in Fillmore are Sales & Related (85 | 7.3%), and Office & Administration (80 | 6.9%).
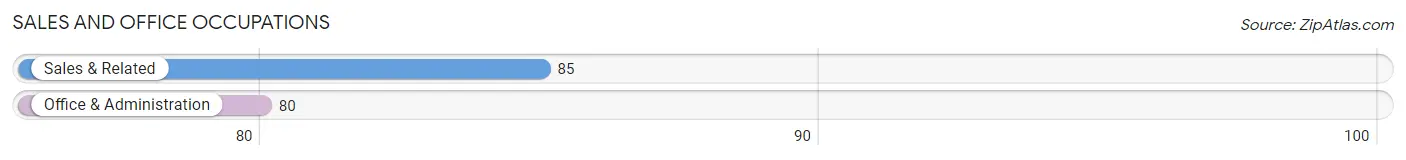
Sales and Office Occupations by Sex
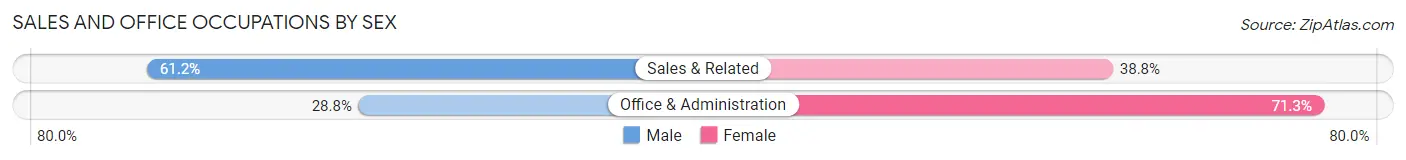
| Occupation | Male | Female |
| Sales & Related | 52 (61.2%) | 33 (38.8%) |
| Office & Administration | 23 (28.7%) | 57 (71.3%) |
| Total (Category) | 75 (45.5%) | 90 (54.5%) |
| Total (Overall) | 681 (58.8%) | 478 (41.2%) |
Natural Resources, Construction and Maintenance Occupations
The most common Natural Resources, Construction and Maintenance occupations in Fillmore are Farming, Fishing & Forestry (112 | 9.7%), Installation, Maintenance & Repair (78 | 6.7%), and Construction & Extraction (19 | 1.6%).
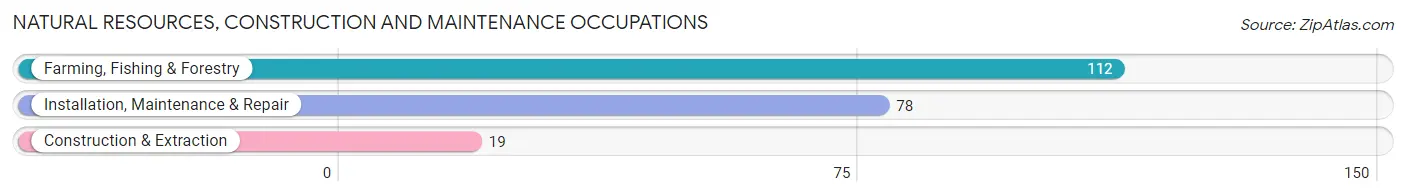
Natural Resources, Construction and Maintenance Occupations by Sex
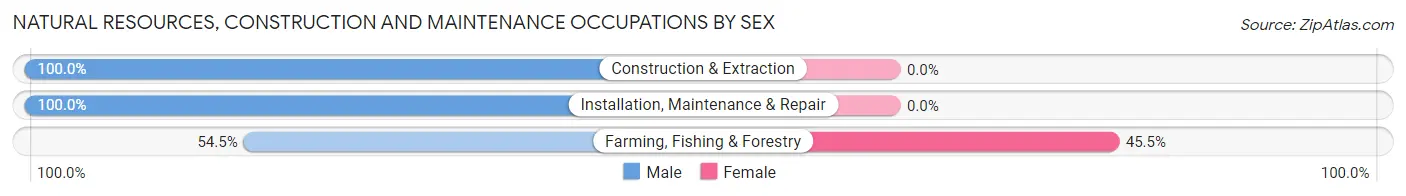
| Occupation | Male | Female |
| Farming, Fishing & Forestry | 61 (54.5%) | 51 (45.5%) |
| Construction & Extraction | 19 (100.0%) | 0 (0.0%) |
| Installation, Maintenance & Repair | 78 (100.0%) | 0 (0.0%) |
| Total (Category) | 158 (75.6%) | 51 (24.4%) |
| Total (Overall) | 681 (58.8%) | 478 (41.2%) |
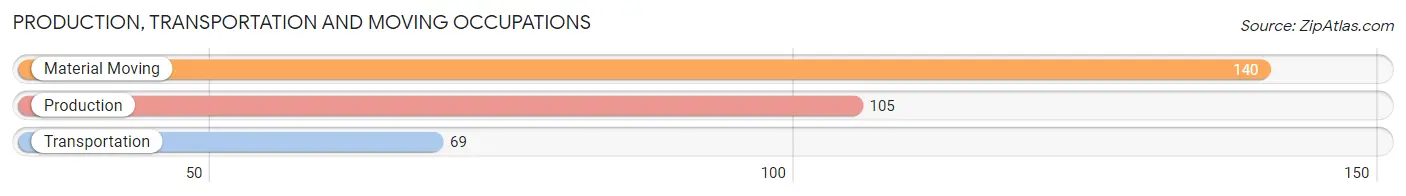
Production, Transportation and Moving Occupations
The most common Production, Transportation and Moving occupations in Fillmore are Material Moving (140 | 12.1%), Production (105 | 9.1%), and Transportation (69 | 5.9%).
Production, Transportation and Moving Occupations by Sex
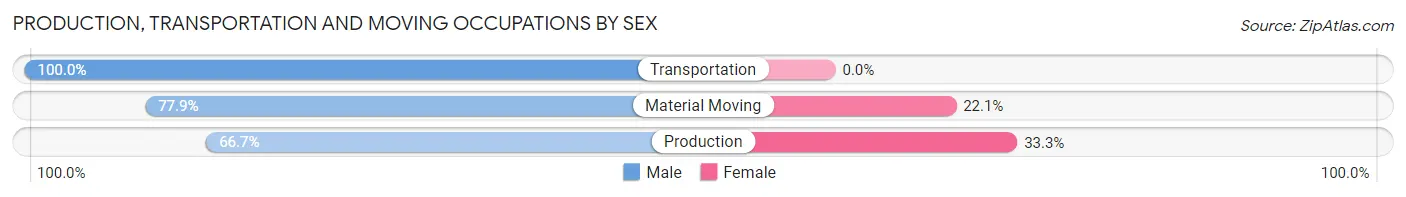
| Occupation | Male | Female |
| Production | 70 (66.7%) | 35 (33.3%) |
| Transportation | 69 (100.0%) | 0 (0.0%) |
| Material Moving | 109 (77.9%) | 31 (22.1%) |
| Total (Category) | 248 (79.0%) | 66 (21.0%) |
| Total (Overall) | 681 (58.8%) | 478 (41.2%) |
Employment Industries by Sex in Fillmore
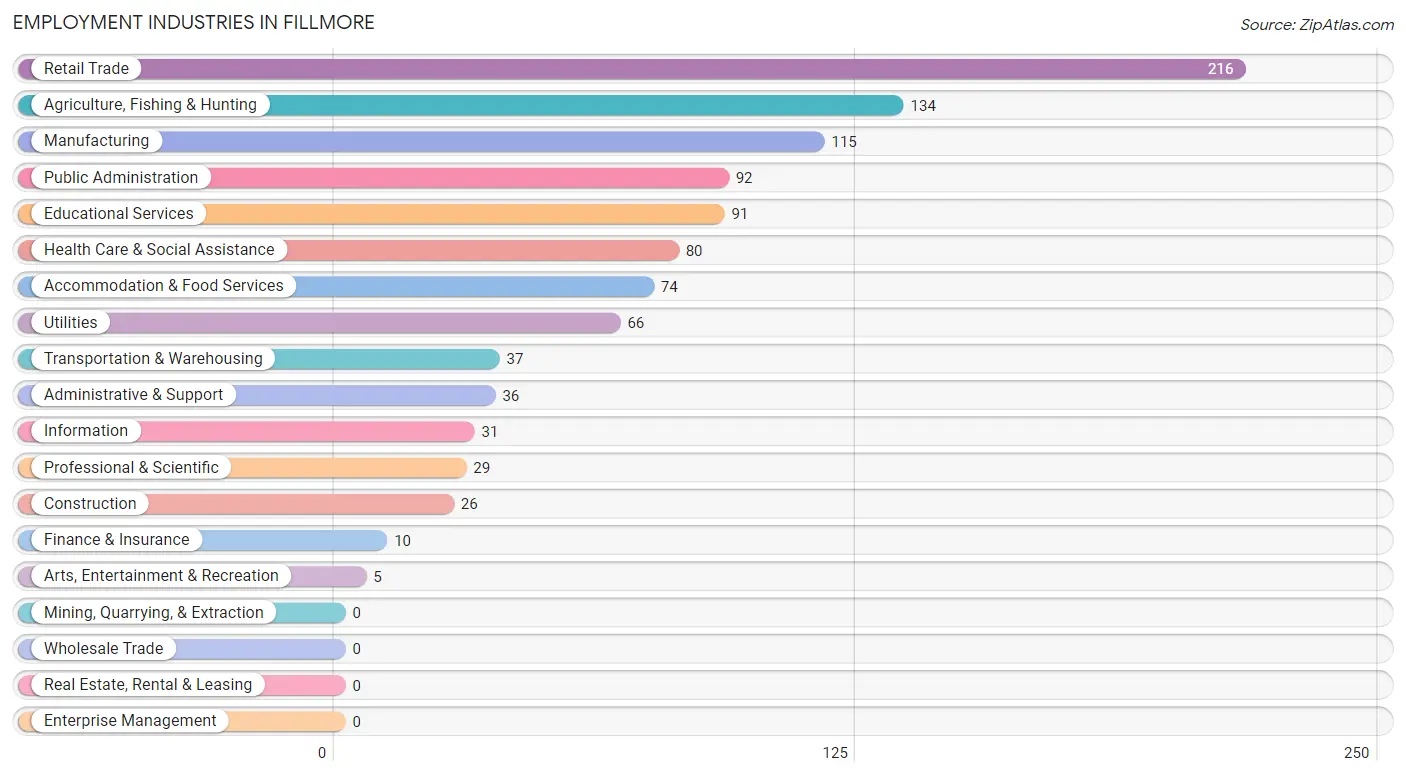
Employment Industries in Fillmore
The major employment industries in Fillmore include Retail Trade (216 | 18.6%), Agriculture, Fishing & Hunting (134 | 11.6%), Manufacturing (115 | 9.9%), Public Administration (92 | 7.9%), and Educational Services (91 | 7.9%).
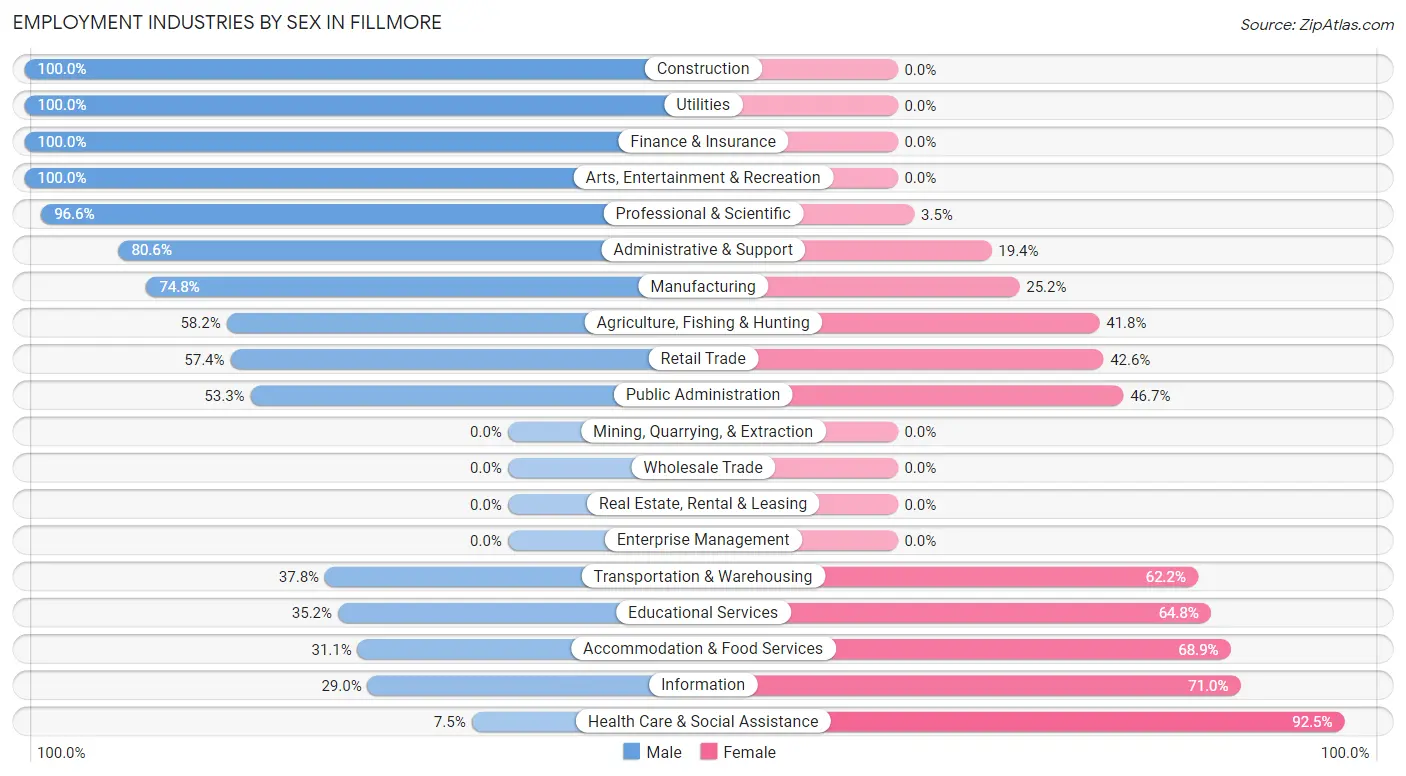
Employment Industries by Sex in Fillmore
The Fillmore industries that see more men than women are Construction (100.0%), Utilities (100.0%), and Finance & Insurance (100.0%), whereas the industries that tend to have a higher number of women are Health Care & Social Assistance (92.5%), Information (71.0%), and Accommodation & Food Services (68.9%).
| Industry | Male | Female |
| Agriculture, Fishing & Hunting | 78 (58.2%) | 56 (41.8%) |
| Mining, Quarrying, & Extraction | 0 (0.0%) | 0 (0.0%) |
| Construction | 26 (100.0%) | 0 (0.0%) |
| Manufacturing | 86 (74.8%) | 29 (25.2%) |
| Wholesale Trade | 0 (0.0%) | 0 (0.0%) |
| Retail Trade | 124 (57.4%) | 92 (42.6%) |
| Transportation & Warehousing | 14 (37.8%) | 23 (62.2%) |
| Utilities | 66 (100.0%) | 0 (0.0%) |
| Information | 9 (29.0%) | 22 (71.0%) |
| Finance & Insurance | 10 (100.0%) | 0 (0.0%) |
| Real Estate, Rental & Leasing | 0 (0.0%) | 0 (0.0%) |
| Professional & Scientific | 28 (96.6%) | 1 (3.5%) |
| Enterprise Management | 0 (0.0%) | 0 (0.0%) |
| Administrative & Support | 29 (80.6%) | 7 (19.4%) |
| Educational Services | 32 (35.2%) | 59 (64.8%) |
| Health Care & Social Assistance | 6 (7.5%) | 74 (92.5%) |
| Arts, Entertainment & Recreation | 5 (100.0%) | 0 (0.0%) |
| Accommodation & Food Services | 23 (31.1%) | 51 (68.9%) |
| Public Administration | 49 (53.3%) | 43 (46.7%) |
| Total | 681 (58.8%) | 478 (41.2%) |
Education in Fillmore
School Enrollment in Fillmore
The most common levels of schooling among the 869 students in Fillmore are high school (358 | 41.2%), middle school (211 | 24.3%), and elementary school (156 | 17.9%).
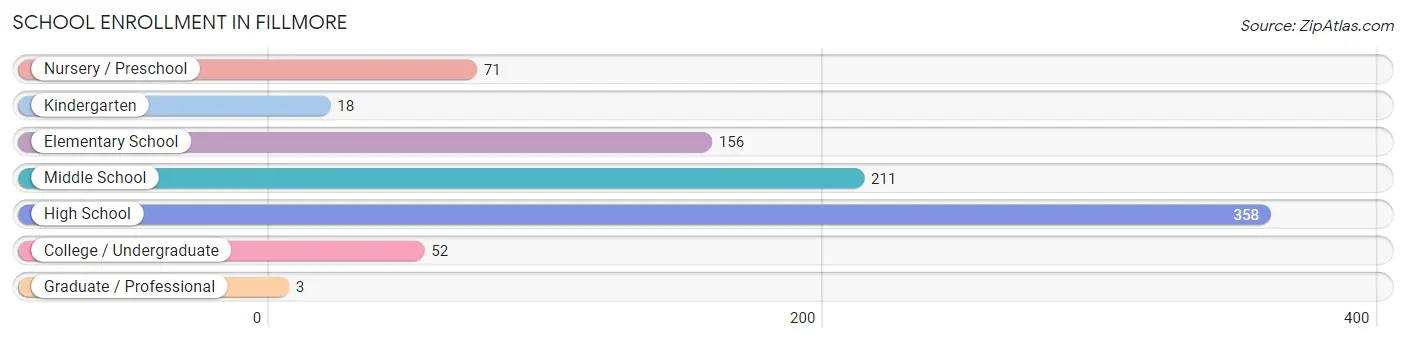
| School Level | # Students | % Students |
| Nursery / Preschool | 71 | 8.2% |
| Kindergarten | 18 | 2.1% |
| Elementary School | 156 | 17.9% |
| Middle School | 211 | 24.3% |
| High School | 358 | 41.2% |
| College / Undergraduate | 52 | 6.0% |
| Graduate / Professional | 3 | 0.4% |
| Total | 869 | 100.0% |
School Enrollment by Age by Funding Source in Fillmore
Out of a total of 869 students who are enrolled in schools in Fillmore, 14 (1.6%) attend a private institution, while the remaining 855 (98.4%) are enrolled in public schools. The age group of 35 years and over has the highest likelihood of being enrolled in private schools, with 14 (31.8% in the age bracket) enrolled. Conversely, the age group of 5 to 9 year old has the lowest likelihood of being enrolled in a private school, with 198 (100.0% in the age bracket) attending a public institution.
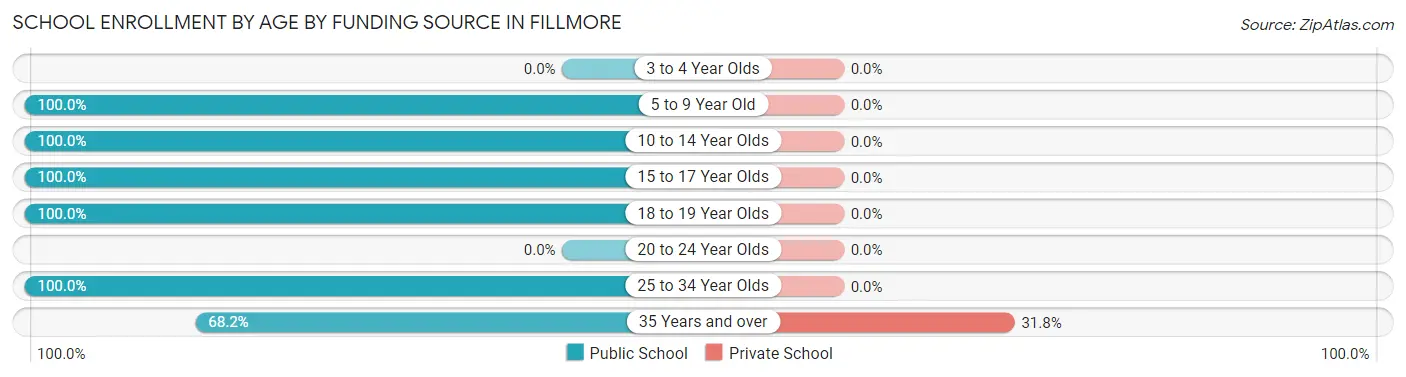
| Age Bracket | Public School | Private School |
| 3 to 4 Year Olds | 0 (0.0%) | 0 (0.0%) |
| 5 to 9 Year Old | 198 (100.0%) | 0 (0.0%) |
| 10 to 14 Year Olds | 292 (100.0%) | 0 (0.0%) |
| 15 to 17 Year Olds | 189 (100.0%) | 0 (0.0%) |
| 18 to 19 Year Olds | 135 (100.0%) | 0 (0.0%) |
| 20 to 24 Year Olds | 0 (0.0%) | 0 (0.0%) |
| 25 to 34 Year Olds | 11 (100.0%) | 0 (0.0%) |
| 35 Years and over | 30 (68.2%) | 14 (31.8%) |
| Total | 855 (98.4%) | 14 (1.6%) |
Educational Attainment by Field of Study in Fillmore
Education (102 | 29.1%), arts & humanities (43 | 12.2%), engineering (34 | 9.7%), business (31 | 8.8%), and bio, nature & agricultural (28 | 8.0%) are the most common fields of study among 351 individuals in Fillmore who have obtained a bachelor's degree or higher.
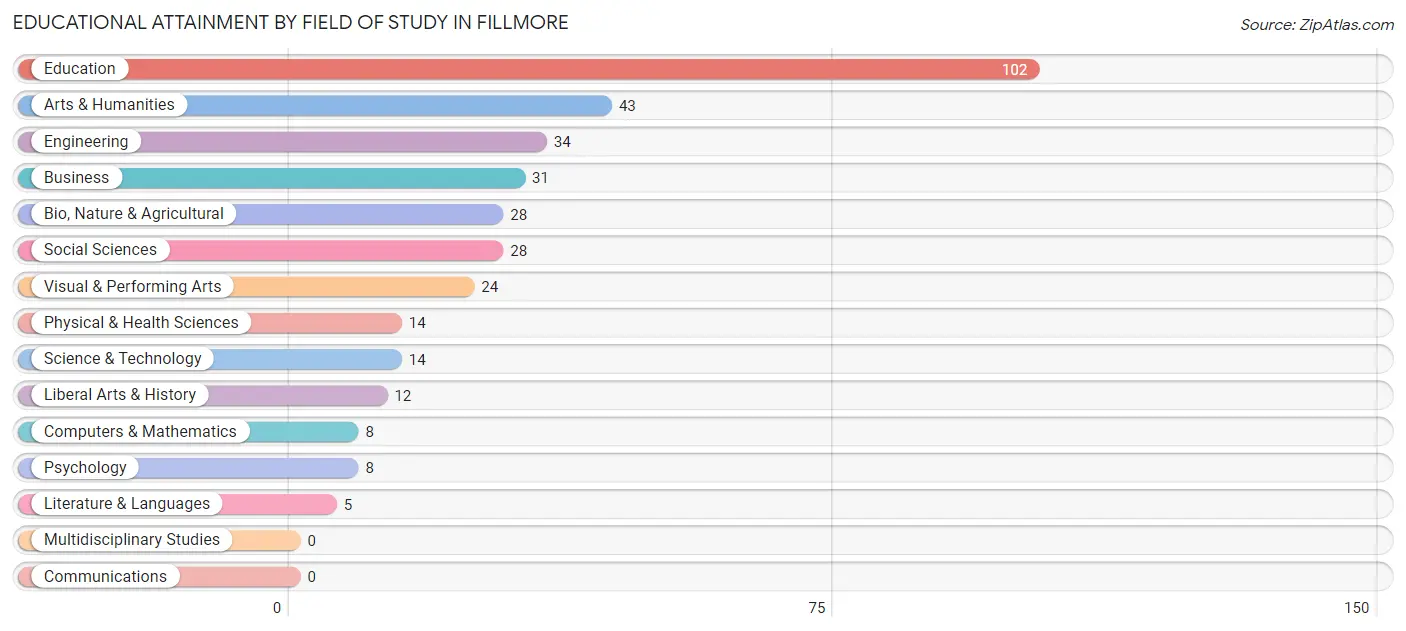
| Field of Study | # Graduates | % Graduates |
| Computers & Mathematics | 8 | 2.3% |
| Bio, Nature & Agricultural | 28 | 8.0% |
| Physical & Health Sciences | 14 | 4.0% |
| Psychology | 8 | 2.3% |
| Social Sciences | 28 | 8.0% |
| Engineering | 34 | 9.7% |
| Multidisciplinary Studies | 0 | 0.0% |
| Science & Technology | 14 | 4.0% |
| Business | 31 | 8.8% |
| Education | 102 | 29.1% |
| Literature & Languages | 5 | 1.4% |
| Liberal Arts & History | 12 | 3.4% |
| Visual & Performing Arts | 24 | 6.8% |
| Communications | 0 | 0.0% |
| Arts & Humanities | 43 | 12.2% |
| Total | 351 | 100.0% |
Transportation & Commute in Fillmore
Vehicle Availability by Sex in Fillmore
The most prevalent vehicle ownership categories in Fillmore are males with 4 vehicles (244, accounting for 39.5%) and females with 4 vehicles (145, making up 51.0%).
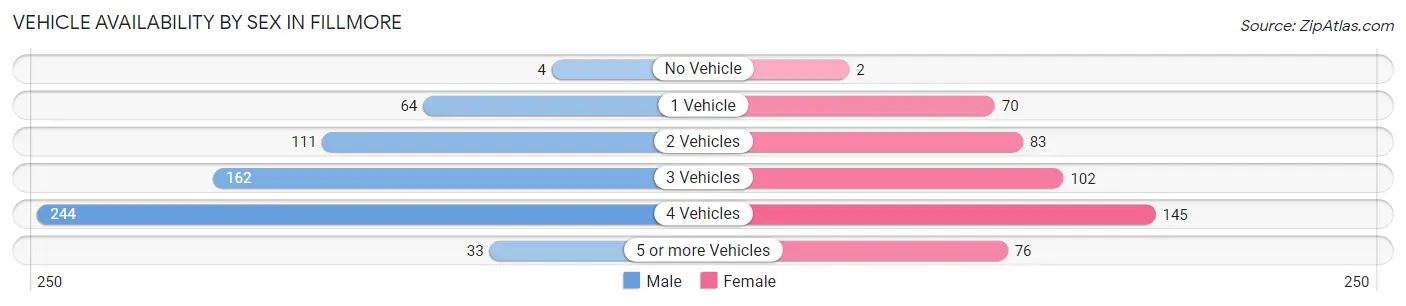
| Vehicles Available | Male | Female |
| No Vehicle | 4 (0.6%) | 2 (0.4%) |
| 1 Vehicle | 64 (10.4%) | 70 (14.6%) |
| 2 Vehicles | 111 (18.0%) | 83 (17.4%) |
| 3 Vehicles | 162 (26.2%) | 102 (21.3%) |
| 4 Vehicles | 244 (39.5%) | 145 (30.3%) |
| 5 or more Vehicles | 33 (5.3%) | 76 (15.9%) |
| Total | 618 (100.0%) | 478 (100.0%) |
Commute Time in Fillmore
The most frequently occuring commute durations in Fillmore are 5 to 9 minutes (386 commuters, 37.1%), 10 to 14 minutes (283 commuters, 27.2%), and less than 5 minutes (201 commuters, 19.3%).
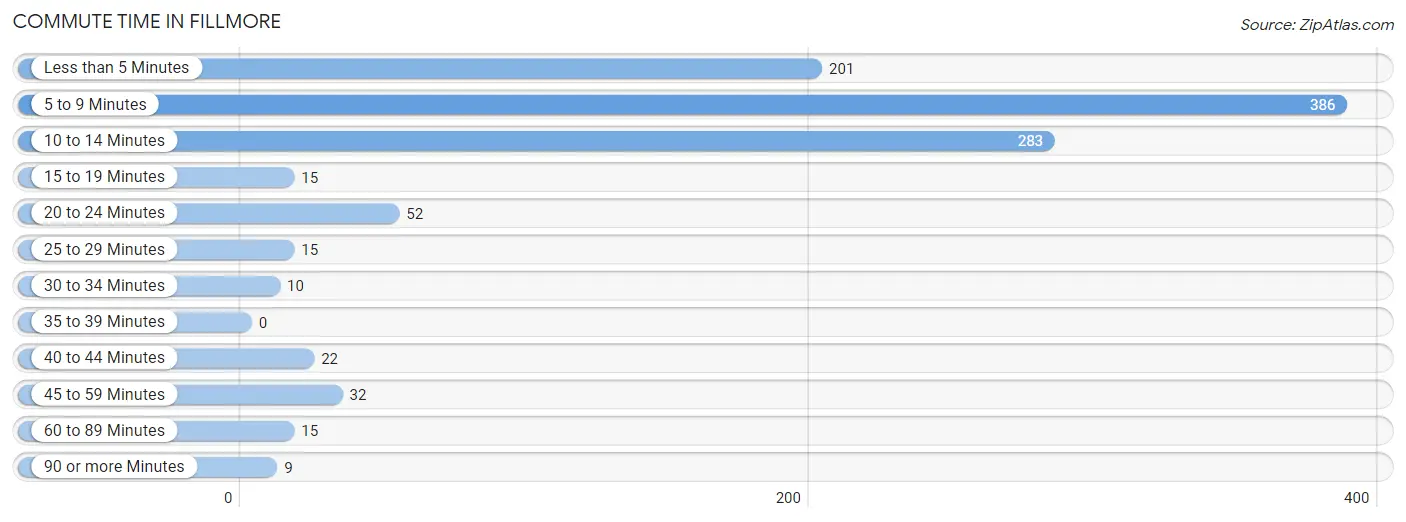
| Commute Time | # Commuters | % Commuters |
| Less than 5 Minutes | 201 | 19.3% |
| 5 to 9 Minutes | 386 | 37.1% |
| 10 to 14 Minutes | 283 | 27.2% |
| 15 to 19 Minutes | 15 | 1.4% |
| 20 to 24 Minutes | 52 | 5.0% |
| 25 to 29 Minutes | 15 | 1.4% |
| 30 to 34 Minutes | 10 | 1.0% |
| 35 to 39 Minutes | 0 | 0.0% |
| 40 to 44 Minutes | 22 | 2.1% |
| 45 to 59 Minutes | 32 | 3.1% |
| 60 to 89 Minutes | 15 | 1.4% |
| 90 or more Minutes | 9 | 0.9% |
Commute Time by Sex in Fillmore
The most common commute times in Fillmore are 5 to 9 minutes (204 commuters, 33.7%) for males and 5 to 9 minutes (182 commuters, 41.8%) for females.
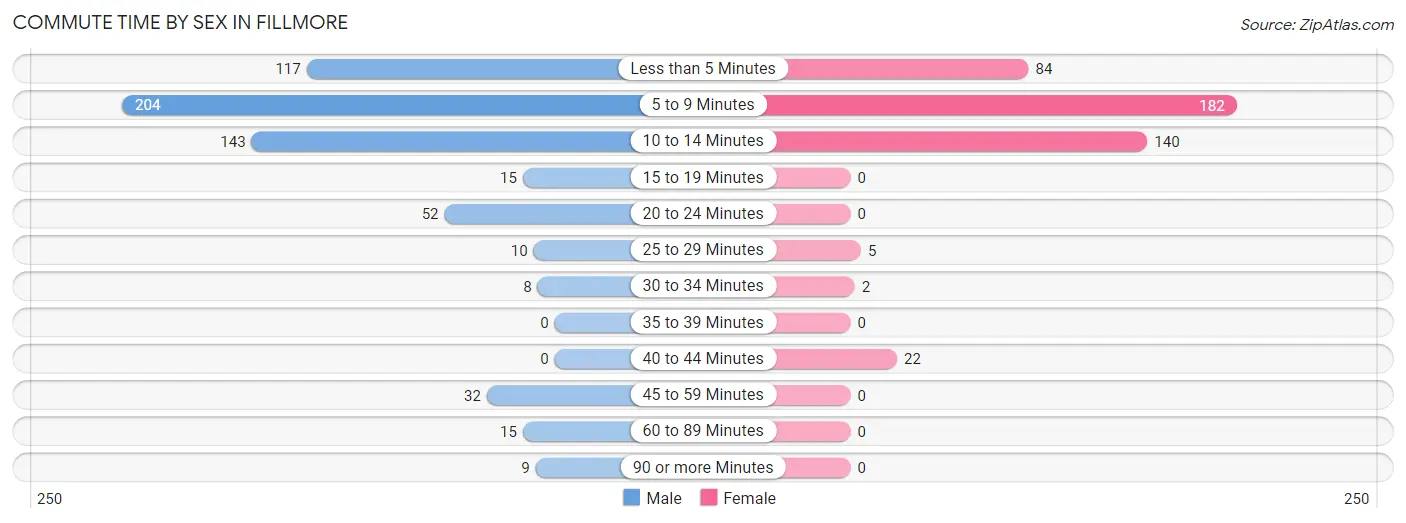
| Commute Time | Male | Female |
| Less than 5 Minutes | 117 (19.3%) | 84 (19.3%) |
| 5 to 9 Minutes | 204 (33.7%) | 182 (41.8%) |
| 10 to 14 Minutes | 143 (23.6%) | 140 (32.2%) |
| 15 to 19 Minutes | 15 (2.5%) | 0 (0.0%) |
| 20 to 24 Minutes | 52 (8.6%) | 0 (0.0%) |
| 25 to 29 Minutes | 10 (1.7%) | 5 (1.1%) |
| 30 to 34 Minutes | 8 (1.3%) | 2 (0.5%) |
| 35 to 39 Minutes | 0 (0.0%) | 0 (0.0%) |
| 40 to 44 Minutes | 0 (0.0%) | 22 (5.1%) |
| 45 to 59 Minutes | 32 (5.3%) | 0 (0.0%) |
| 60 to 89 Minutes | 15 (2.5%) | 0 (0.0%) |
| 90 or more Minutes | 9 (1.5%) | 0 (0.0%) |
Time of Departure to Work by Sex in Fillmore
The most frequent times of departure to work in Fillmore are 12:00 PM to 3:59 PM (117, 19.3%) for males and 7:30 AM to 7:59 AM (93, 21.4%) for females.
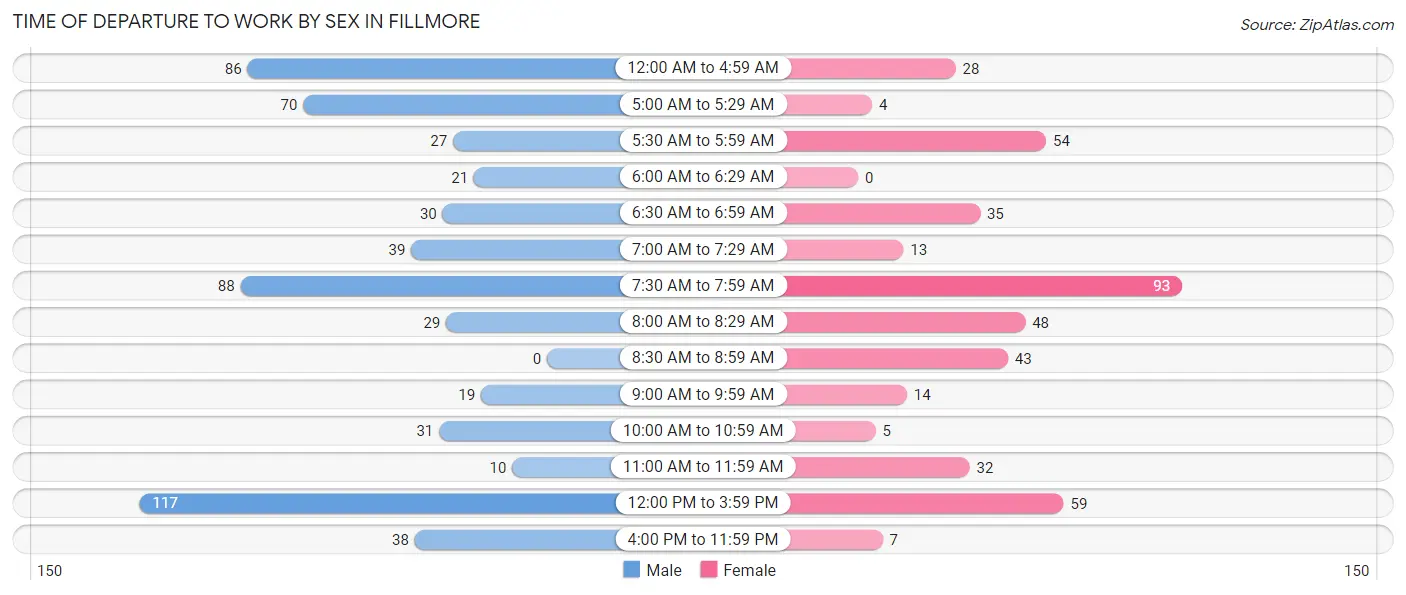
| Time of Departure | Male | Female |
| 12:00 AM to 4:59 AM | 86 (14.2%) | 28 (6.4%) |
| 5:00 AM to 5:29 AM | 70 (11.6%) | 4 (0.9%) |
| 5:30 AM to 5:59 AM | 27 (4.5%) | 54 (12.4%) |
| 6:00 AM to 6:29 AM | 21 (3.5%) | 0 (0.0%) |
| 6:30 AM to 6:59 AM | 30 (5.0%) | 35 (8.1%) |
| 7:00 AM to 7:29 AM | 39 (6.5%) | 13 (3.0%) |
| 7:30 AM to 7:59 AM | 88 (14.5%) | 93 (21.4%) |
| 8:00 AM to 8:29 AM | 29 (4.8%) | 48 (11.0%) |
| 8:30 AM to 8:59 AM | 0 (0.0%) | 43 (9.9%) |
| 9:00 AM to 9:59 AM | 19 (3.1%) | 14 (3.2%) |
| 10:00 AM to 10:59 AM | 31 (5.1%) | 5 (1.1%) |
| 11:00 AM to 11:59 AM | 10 (1.7%) | 32 (7.4%) |
| 12:00 PM to 3:59 PM | 117 (19.3%) | 59 (13.6%) |
| 4:00 PM to 11:59 PM | 38 (6.3%) | 7 (1.6%) |
| Total | 605 (100.0%) | 435 (100.0%) |
Housing Occupancy in Fillmore
Occupancy by Ownership in Fillmore
Of the total 747 dwellings in Fillmore, owner-occupied units account for 575 (77.0%), while renter-occupied units make up 172 (23.0%).
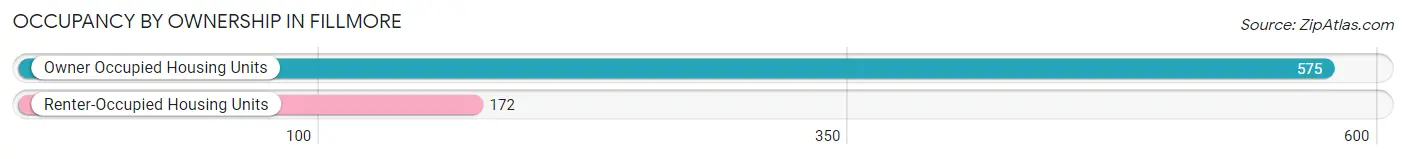
| Occupancy | # Housing Units | % Housing Units |
| Owner Occupied Housing Units | 575 | 77.0% |
| Renter-Occupied Housing Units | 172 | 23.0% |
| Total Occupied Housing Units | 747 | 100.0% |
Occupancy by Household Size in Fillmore
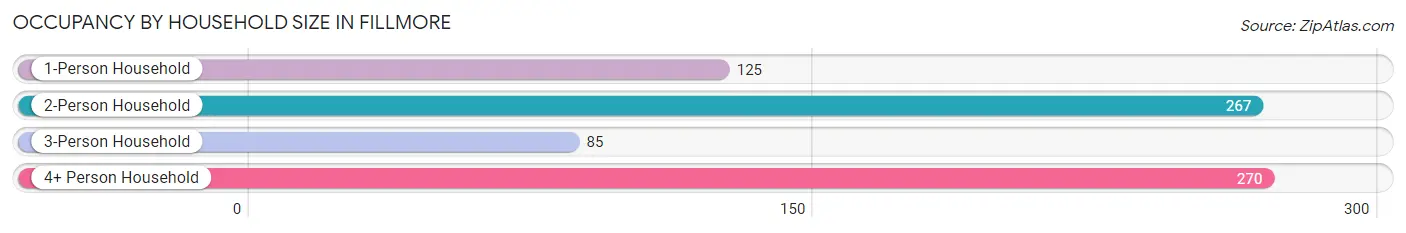
| Household Size | # Housing Units | % Housing Units |
| 1-Person Household | 125 | 16.7% |
| 2-Person Household | 267 | 35.7% |
| 3-Person Household | 85 | 11.4% |
| 4+ Person Household | 270 | 36.1% |
| Total Housing Units | 747 | 100.0% |
Occupancy by Ownership by Household Size in Fillmore
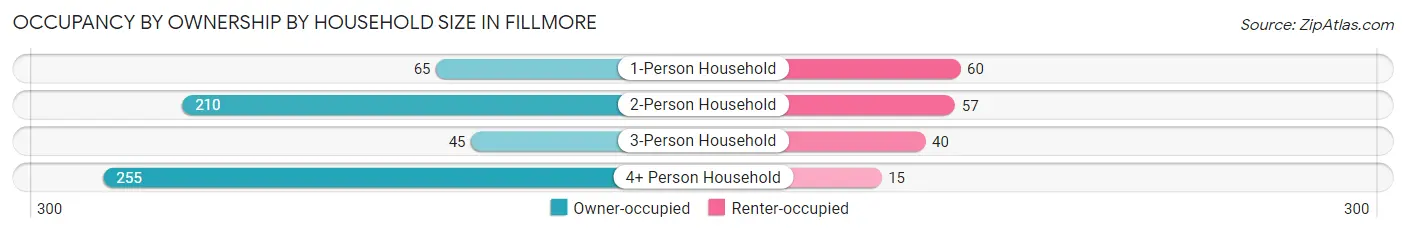
| Household Size | Owner-occupied | Renter-occupied |
| 1-Person Household | 65 (52.0%) | 60 (48.0%) |
| 2-Person Household | 210 (78.6%) | 57 (21.3%) |
| 3-Person Household | 45 (52.9%) | 40 (47.1%) |
| 4+ Person Household | 255 (94.4%) | 15 (5.6%) |
| Total Housing Units | 575 (77.0%) | 172 (23.0%) |
Occupancy by Educational Attainment in Fillmore
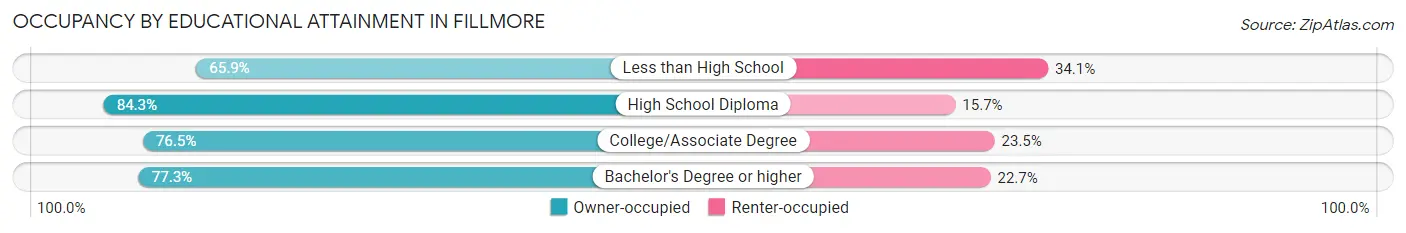
| Household Size | Owner-occupied | Renter-occupied |
| Less than High School | 89 (65.9%) | 46 (34.1%) |
| High School Diploma | 177 (84.3%) | 33 (15.7%) |
| College/Associate Degree | 176 (76.5%) | 54 (23.5%) |
| Bachelor's Degree or higher | 133 (77.3%) | 39 (22.7%) |
Occupancy by Age of Householder in Fillmore
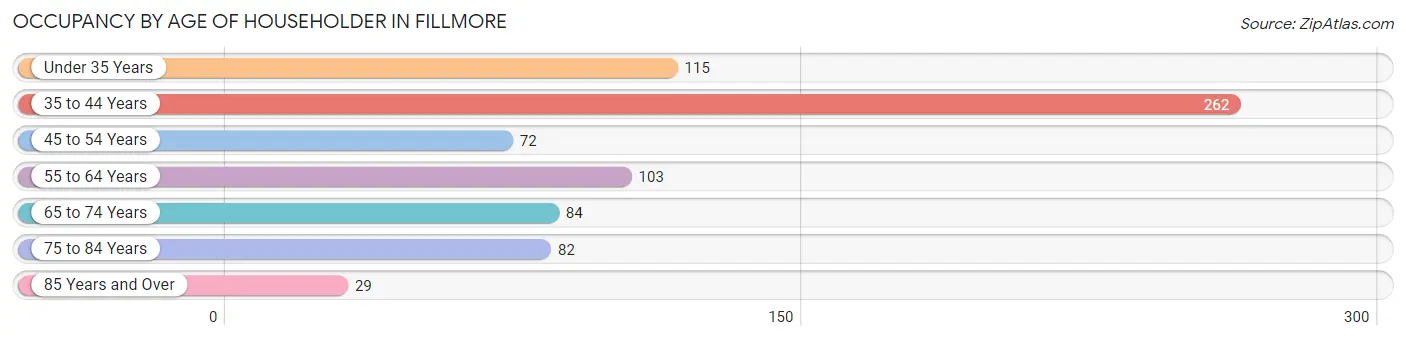
| Age Bracket | # Households | % Households |
| Under 35 Years | 115 | 15.4% |
| 35 to 44 Years | 262 | 35.1% |
| 45 to 54 Years | 72 | 9.6% |
| 55 to 64 Years | 103 | 13.8% |
| 65 to 74 Years | 84 | 11.2% |
| 75 to 84 Years | 82 | 11.0% |
| 85 Years and Over | 29 | 3.9% |
| Total | 747 | 100.0% |
Housing Finances in Fillmore
Median Income by Occupancy in Fillmore
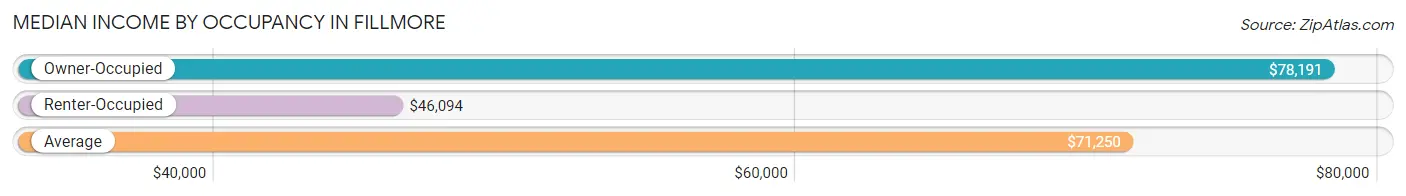
| Occupancy Type | # Households | Median Income |
| Owner-Occupied | 575 (77.0%) | $78,191 |
| Renter-Occupied | 172 (23.0%) | $46,094 |
| Average | 747 (100.0%) | $71,250 |
Occupancy by Householder Income Bracket in Fillmore
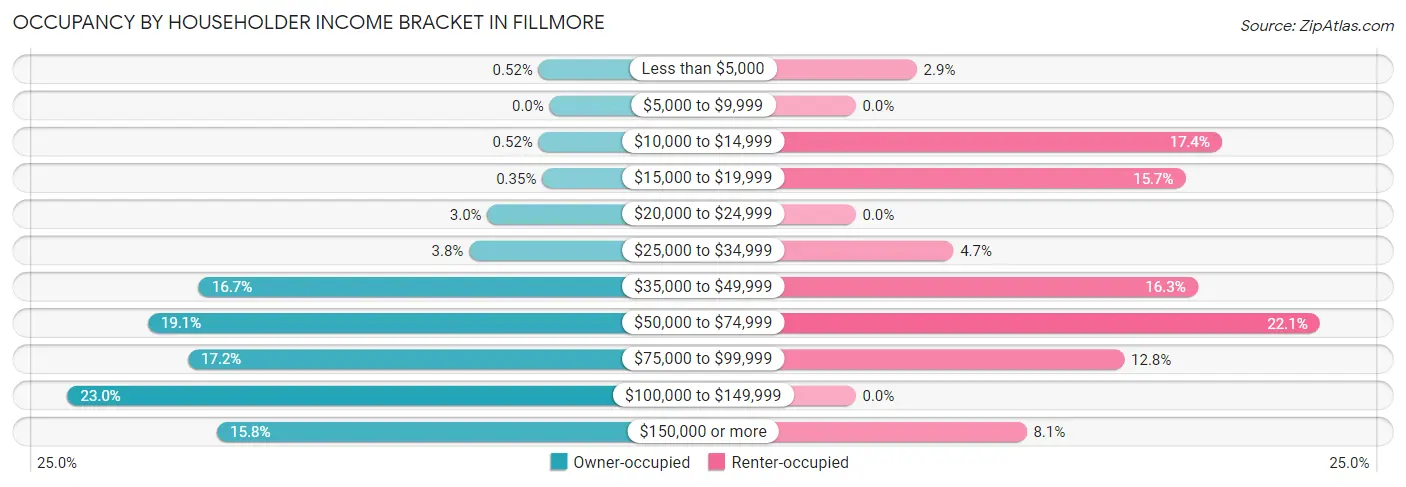
| Income Bracket | Owner-occupied | Renter-occupied |
| Less than $5,000 | 3 (0.5%) | 5 (2.9%) |
| $5,000 to $9,999 | 0 (0.0%) | 0 (0.0%) |
| $10,000 to $14,999 | 3 (0.5%) | 30 (17.4%) |
| $15,000 to $19,999 | 2 (0.4%) | 27 (15.7%) |
| $20,000 to $24,999 | 17 (3.0%) | 0 (0.0%) |
| $25,000 to $34,999 | 22 (3.8%) | 8 (4.6%) |
| $35,000 to $49,999 | 96 (16.7%) | 28 (16.3%) |
| $50,000 to $74,999 | 110 (19.1%) | 38 (22.1%) |
| $75,000 to $99,999 | 99 (17.2%) | 22 (12.8%) |
| $100,000 to $149,999 | 132 (23.0%) | 0 (0.0%) |
| $150,000 or more | 91 (15.8%) | 14 (8.1%) |
| Total | 575 (100.0%) | 172 (100.0%) |
Monthly Housing Cost Tiers in Fillmore
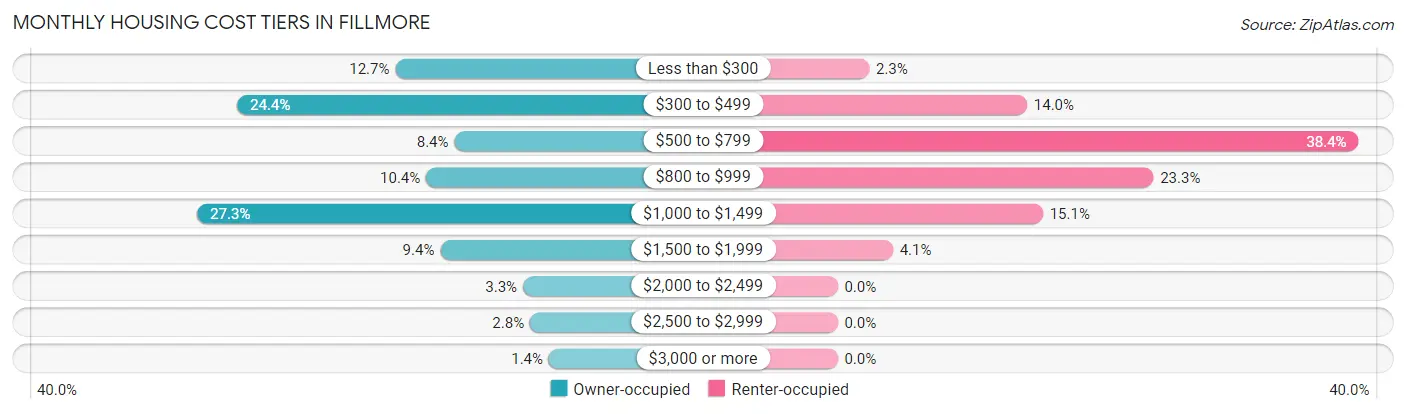
| Monthly Cost | Owner-occupied | Renter-occupied |
| Less than $300 | 73 (12.7%) | 4 (2.3%) |
| $300 to $499 | 140 (24.3%) | 24 (14.0%) |
| $500 to $799 | 48 (8.4%) | 66 (38.4%) |
| $800 to $999 | 60 (10.4%) | 40 (23.3%) |
| $1,000 to $1,499 | 157 (27.3%) | 26 (15.1%) |
| $1,500 to $1,999 | 54 (9.4%) | 7 (4.1%) |
| $2,000 to $2,499 | 19 (3.3%) | 0 (0.0%) |
| $2,500 to $2,999 | 16 (2.8%) | 0 (0.0%) |
| $3,000 or more | 8 (1.4%) | 0 (0.0%) |
| Total | 575 (100.0%) | 172 (100.0%) |
Physical Housing Characteristics in Fillmore
Housing Structures in Fillmore
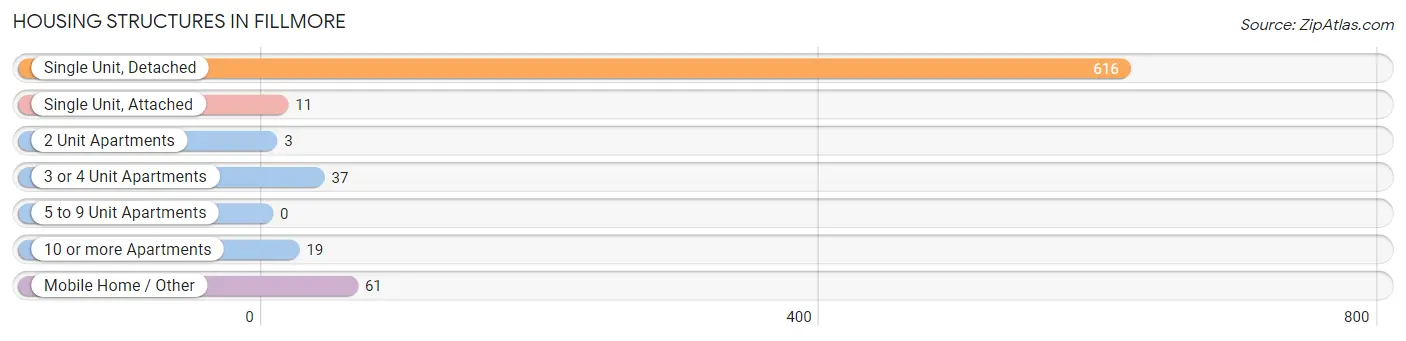
| Structure Type | # Housing Units | % Housing Units |
| Single Unit, Detached | 616 | 82.5% |
| Single Unit, Attached | 11 | 1.5% |
| 2 Unit Apartments | 3 | 0.4% |
| 3 or 4 Unit Apartments | 37 | 5.0% |
| 5 to 9 Unit Apartments | 0 | 0.0% |
| 10 or more Apartments | 19 | 2.5% |
| Mobile Home / Other | 61 | 8.2% |
| Total | 747 | 100.0% |
Housing Structures by Occupancy in Fillmore
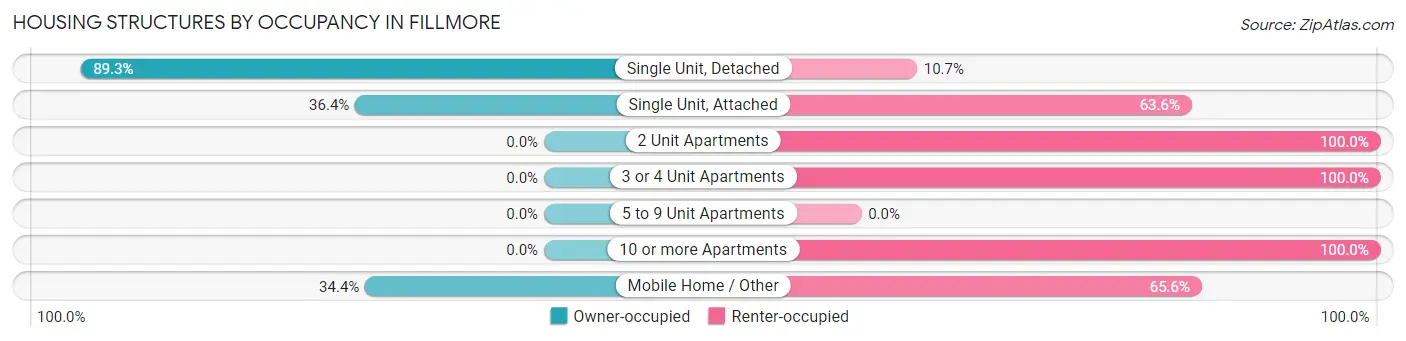
| Structure Type | Owner-occupied | Renter-occupied |
| Single Unit, Detached | 550 (89.3%) | 66 (10.7%) |
| Single Unit, Attached | 4 (36.4%) | 7 (63.6%) |
| 2 Unit Apartments | 0 (0.0%) | 3 (100.0%) |
| 3 or 4 Unit Apartments | 0 (0.0%) | 37 (100.0%) |
| 5 to 9 Unit Apartments | 0 (0.0%) | 0 (0.0%) |
| 10 or more Apartments | 0 (0.0%) | 19 (100.0%) |
| Mobile Home / Other | 21 (34.4%) | 40 (65.6%) |
| Total | 575 (77.0%) | 172 (23.0%) |
Housing Structures by Number of Rooms in Fillmore
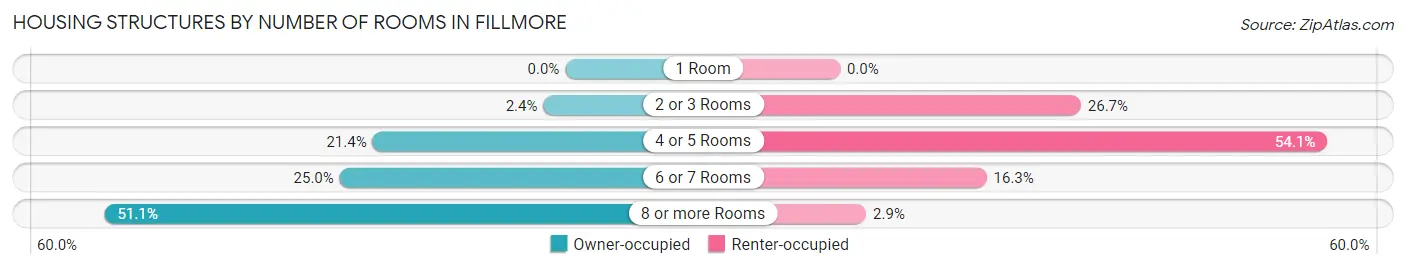
| Number of Rooms | Owner-occupied | Renter-occupied |
| 1 Room | 0 (0.0%) | 0 (0.0%) |
| 2 or 3 Rooms | 14 (2.4%) | 46 (26.7%) |
| 4 or 5 Rooms | 123 (21.4%) | 93 (54.1%) |
| 6 or 7 Rooms | 144 (25.0%) | 28 (16.3%) |
| 8 or more Rooms | 294 (51.1%) | 5 (2.9%) |
| Total | 575 (100.0%) | 172 (100.0%) |
Housing Structure by Heating Type in Fillmore
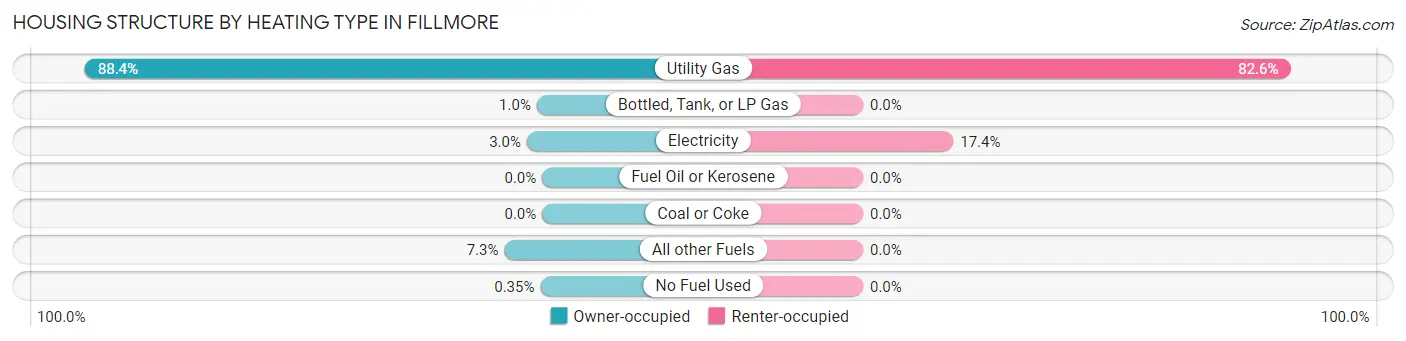
| Heating Type | Owner-occupied | Renter-occupied |
| Utility Gas | 508 (88.3%) | 142 (82.6%) |
| Bottled, Tank, or LP Gas | 6 (1.0%) | 0 (0.0%) |
| Electricity | 17 (3.0%) | 30 (17.4%) |
| Fuel Oil or Kerosene | 0 (0.0%) | 0 (0.0%) |
| Coal or Coke | 0 (0.0%) | 0 (0.0%) |
| All other Fuels | 42 (7.3%) | 0 (0.0%) |
| No Fuel Used | 2 (0.4%) | 0 (0.0%) |
| Total | 575 (100.0%) | 172 (100.0%) |
Household Vehicle Usage in Fillmore
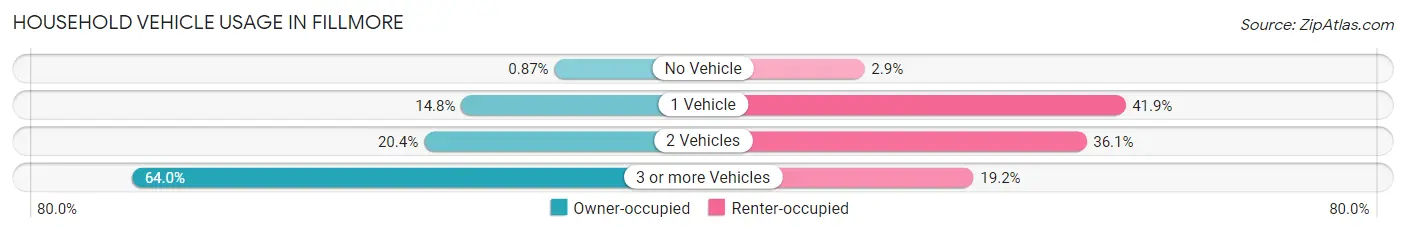
| Vehicles per Household | Owner-occupied | Renter-occupied |
| No Vehicle | 5 (0.9%) | 5 (2.9%) |
| 1 Vehicle | 85 (14.8%) | 72 (41.9%) |
| 2 Vehicles | 117 (20.3%) | 62 (36.0%) |
| 3 or more Vehicles | 368 (64.0%) | 33 (19.2%) |
| Total | 575 (100.0%) | 172 (100.0%) |
Real Estate & Mortgages in Fillmore
Real Estate and Mortgage Overview in Fillmore
| Characteristic | Without Mortgage | With Mortgage |
| Housing Units | 274 | 301 |
| Median Property Value | $241,500 | $238,100 |
| Median Household Income | $75,313 | $65 |
| Monthly Housing Costs | $346 | $8 |
| Real Estate Taxes | $1,116 | $3 |
Property Value by Mortgage Status in Fillmore
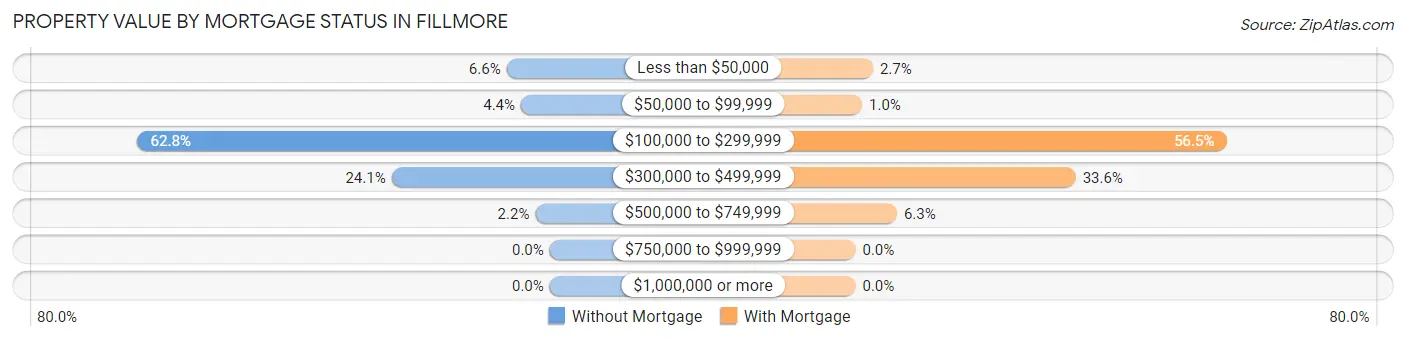
| Property Value | Without Mortgage | With Mortgage |
| Less than $50,000 | 18 (6.6%) | 8 (2.7%) |
| $50,000 to $99,999 | 12 (4.4%) | 3 (1.0%) |
| $100,000 to $299,999 | 172 (62.8%) | 170 (56.5%) |
| $300,000 to $499,999 | 66 (24.1%) | 101 (33.6%) |
| $500,000 to $749,999 | 6 (2.2%) | 19 (6.3%) |
| $750,000 to $999,999 | 0 (0.0%) | 0 (0.0%) |
| $1,000,000 or more | 0 (0.0%) | 0 (0.0%) |
| Total | 274 (100.0%) | 301 (100.0%) |
Household Income by Mortgage Status in Fillmore
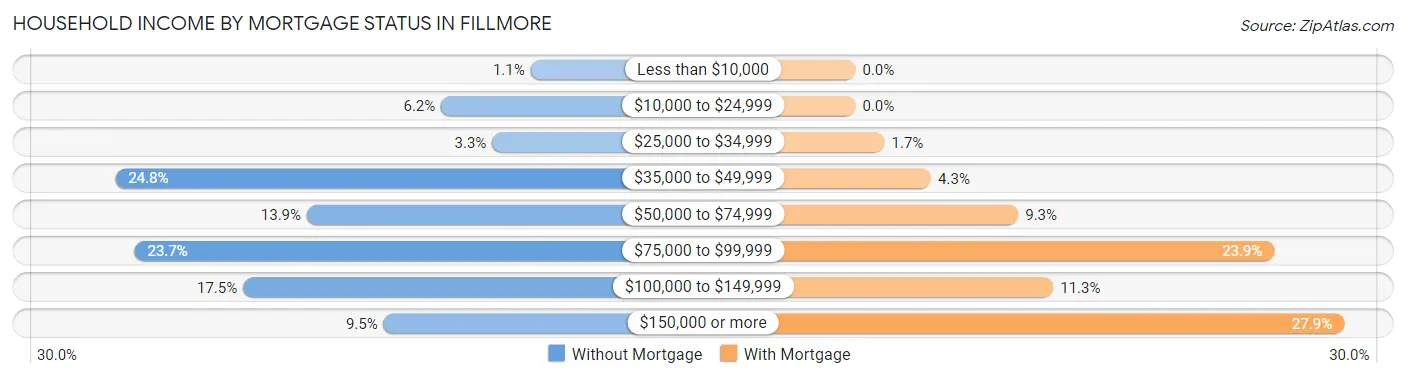
| Household Income | Without Mortgage | With Mortgage |
| Less than $10,000 | 3 (1.1%) | 0 (0.0%) |
| $10,000 to $24,999 | 17 (6.2%) | 0 (0.0%) |
| $25,000 to $34,999 | 9 (3.3%) | 5 (1.7%) |
| $35,000 to $49,999 | 68 (24.8%) | 13 (4.3%) |
| $50,000 to $74,999 | 38 (13.9%) | 28 (9.3%) |
| $75,000 to $99,999 | 65 (23.7%) | 72 (23.9%) |
| $100,000 to $149,999 | 48 (17.5%) | 34 (11.3%) |
| $150,000 or more | 26 (9.5%) | 84 (27.9%) |
| Total | 274 (100.0%) | 301 (100.0%) |
Property Value to Household Income Ratio in Fillmore
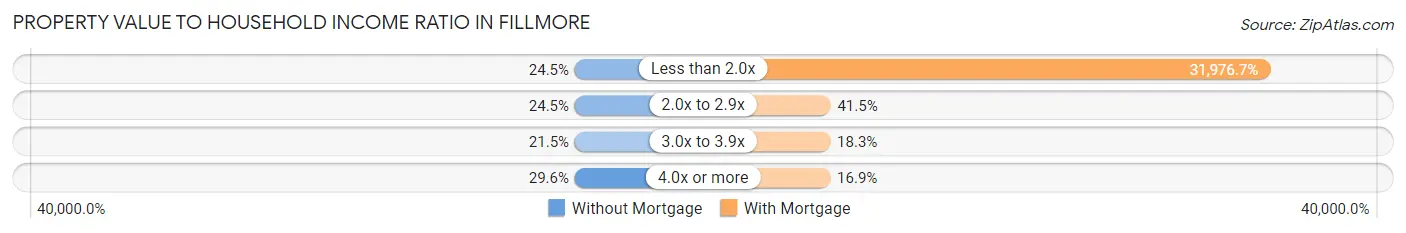
| Value-to-Income Ratio | Without Mortgage | With Mortgage |
| Less than 2.0x | 67 (24.4%) | 96,250 (31,976.7%) |
| 2.0x to 2.9x | 67 (24.4%) | 125 (41.5%) |
| 3.0x to 3.9x | 59 (21.5%) | 55 (18.3%) |
| 4.0x or more | 81 (29.6%) | 51 (16.9%) |
| Total | 274 (100.0%) | 301 (100.0%) |
Real Estate Taxes by Mortgage Status in Fillmore
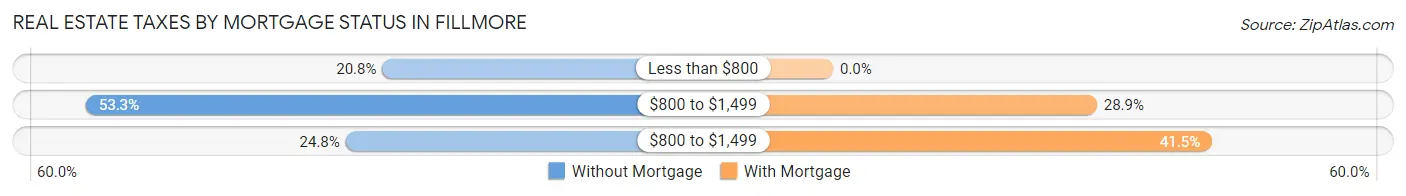
| Property Taxes | Without Mortgage | With Mortgage |
| Less than $800 | 57 (20.8%) | 0 (0.0%) |
| $800 to $1,499 | 146 (53.3%) | 87 (28.9%) |
| $800 to $1,499 | 68 (24.8%) | 125 (41.5%) |
| Total | 274 (100.0%) | 301 (100.0%) |
Health & Disability in Fillmore
Health Insurance Coverage by Age in Fillmore
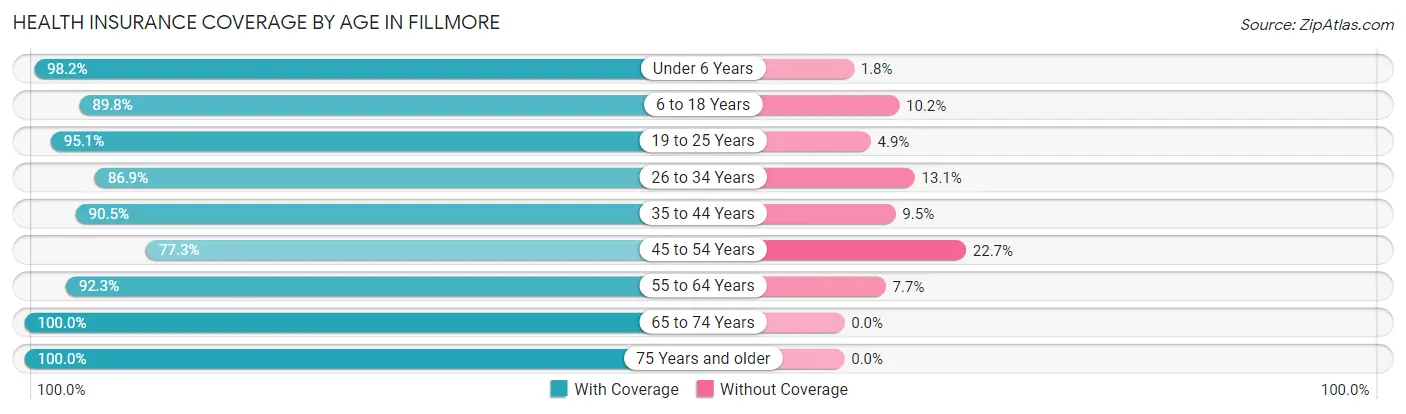
| Age Bracket | With Coverage | Without Coverage |
| Under 6 Years | 222 (98.2%) | 4 (1.8%) |
| 6 to 18 Years | 659 (89.8%) | 75 (10.2%) |
| 19 to 25 Years | 97 (95.1%) | 5 (4.9%) |
| 26 to 34 Years | 159 (86.9%) | 24 (13.1%) |
| 35 to 44 Years | 427 (90.5%) | 45 (9.5%) |
| 45 to 54 Years | 116 (77.3%) | 34 (22.7%) |
| 55 to 64 Years | 240 (92.3%) | 20 (7.7%) |
| 65 to 74 Years | 168 (100.0%) | 0 (0.0%) |
| 75 Years and older | 221 (100.0%) | 0 (0.0%) |
| Total | 2,309 (91.8%) | 207 (8.2%) |
Health Insurance Coverage by Citizenship Status in Fillmore
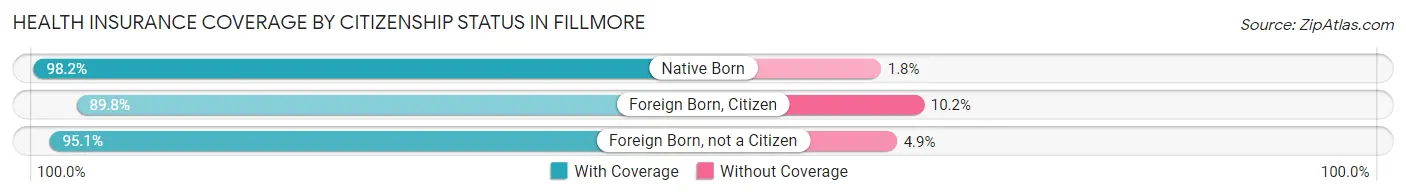
| Citizenship Status | With Coverage | Without Coverage |
| Native Born | 222 (98.2%) | 4 (1.8%) |
| Foreign Born, Citizen | 659 (89.8%) | 75 (10.2%) |
| Foreign Born, not a Citizen | 97 (95.1%) | 5 (4.9%) |
Health Insurance Coverage by Household Income in Fillmore
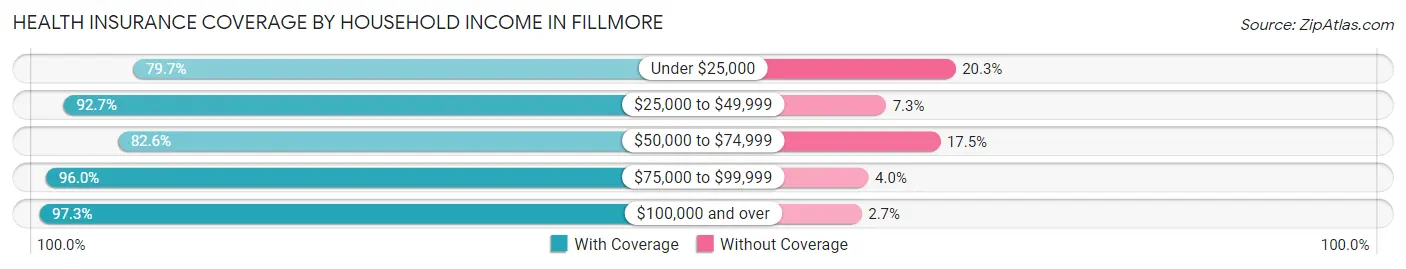
| Household Income | With Coverage | Without Coverage |
| Under $25,000 | 153 (79.7%) | 39 (20.3%) |
| $25,000 to $49,999 | 369 (92.7%) | 29 (7.3%) |
| $50,000 to $74,999 | 454 (82.6%) | 96 (17.4%) |
| $75,000 to $99,999 | 360 (96.0%) | 15 (4.0%) |
| $100,000 and over | 971 (97.3%) | 27 (2.7%) |
Public vs Private Health Insurance Coverage by Age in Fillmore
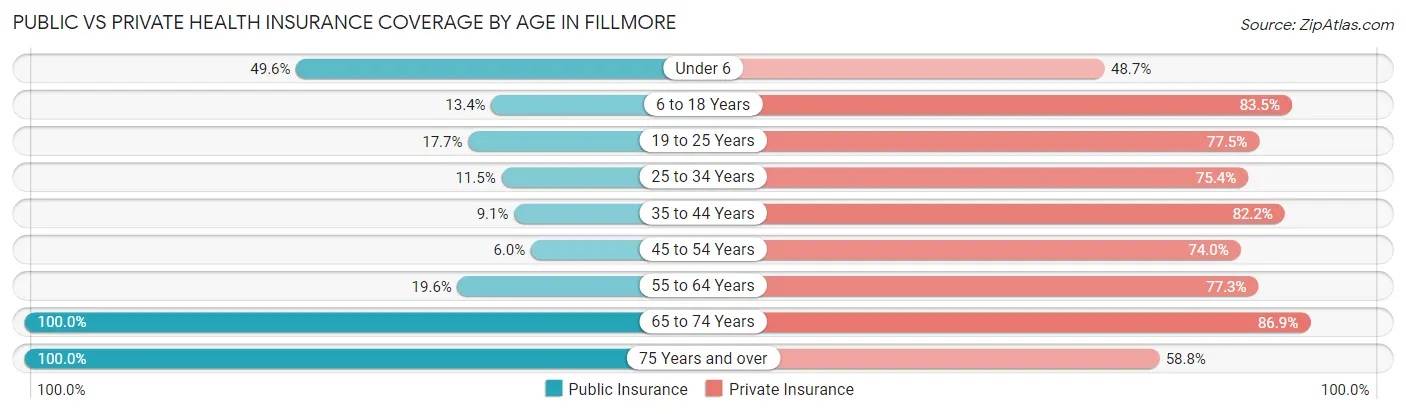
| Age Bracket | Public Insurance | Private Insurance |
| Under 6 | 112 (49.6%) | 110 (48.7%) |
| 6 to 18 Years | 98 (13.4%) | 613 (83.5%) |
| 19 to 25 Years | 18 (17.6%) | 79 (77.4%) |
| 25 to 34 Years | 21 (11.5%) | 138 (75.4%) |
| 35 to 44 Years | 43 (9.1%) | 388 (82.2%) |
| 45 to 54 Years | 9 (6.0%) | 111 (74.0%) |
| 55 to 64 Years | 51 (19.6%) | 201 (77.3%) |
| 65 to 74 Years | 168 (100.0%) | 146 (86.9%) |
| 75 Years and over | 221 (100.0%) | 130 (58.8%) |
| Total | 741 (29.4%) | 1,916 (76.1%) |
Disability Status by Sex by Age in Fillmore
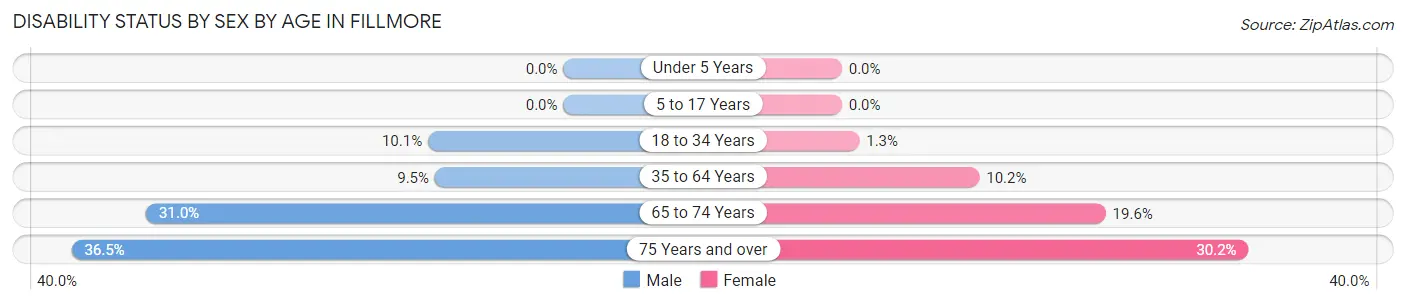
| Age Bracket | Male | Female |
| Under 5 Years | 0 (0.0%) | 0 (0.0%) |
| 5 to 17 Years | 0 (0.0%) | 0 (0.0%) |
| 18 to 34 Years | 19 (10.1%) | 3 (1.3%) |
| 35 to 64 Years | 44 (9.5%) | 43 (10.2%) |
| 65 to 74 Years | 22 (31.0%) | 19 (19.6%) |
| 75 Years and over | 42 (36.5%) | 32 (30.2%) |
Disability Class by Sex by Age in Fillmore
Disability Class: Hearing Difficulty
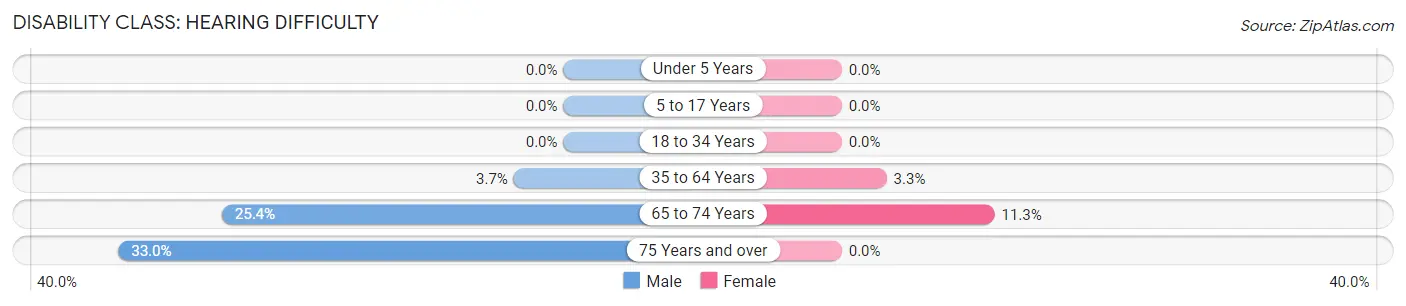
| Age Bracket | Male | Female |
| Under 5 Years | 0 (0.0%) | 0 (0.0%) |
| 5 to 17 Years | 0 (0.0%) | 0 (0.0%) |
| 18 to 34 Years | 0 (0.0%) | 0 (0.0%) |
| 35 to 64 Years | 17 (3.7%) | 14 (3.3%) |
| 65 to 74 Years | 18 (25.4%) | 11 (11.3%) |
| 75 Years and over | 38 (33.0%) | 0 (0.0%) |
Disability Class: Vision Difficulty
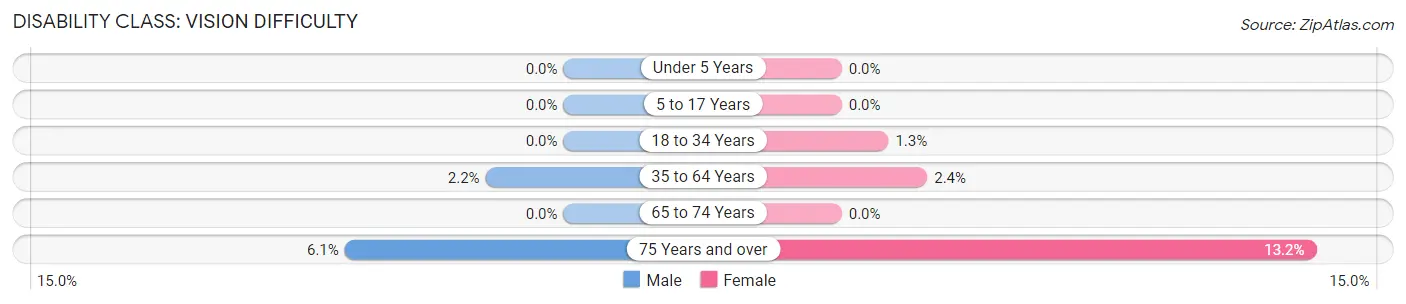
| Age Bracket | Male | Female |
| Under 5 Years | 0 (0.0%) | 0 (0.0%) |
| 5 to 17 Years | 0 (0.0%) | 0 (0.0%) |
| 18 to 34 Years | 0 (0.0%) | 3 (1.3%) |
| 35 to 64 Years | 10 (2.2%) | 10 (2.4%) |
| 65 to 74 Years | 0 (0.0%) | 0 (0.0%) |
| 75 Years and over | 7 (6.1%) | 14 (13.2%) |
Disability Class: Cognitive Difficulty
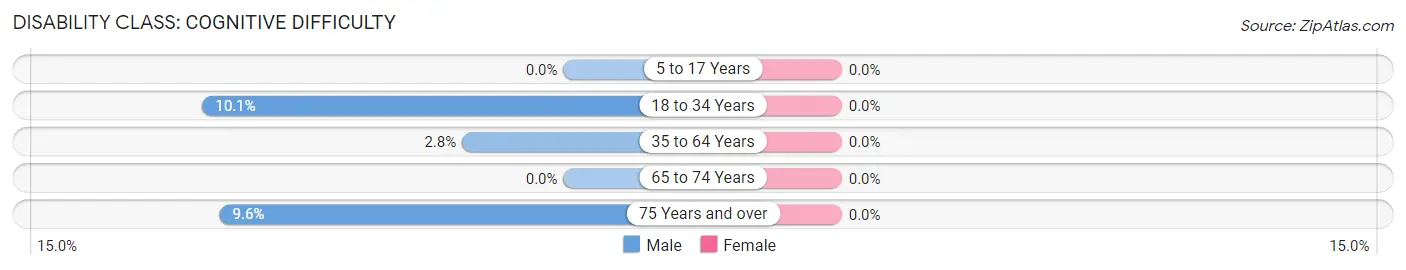
| Age Bracket | Male | Female |
| 5 to 17 Years | 0 (0.0%) | 0 (0.0%) |
| 18 to 34 Years | 19 (10.1%) | 0 (0.0%) |
| 35 to 64 Years | 13 (2.8%) | 0 (0.0%) |
| 65 to 74 Years | 0 (0.0%) | 0 (0.0%) |
| 75 Years and over | 11 (9.6%) | 0 (0.0%) |
Disability Class: Ambulatory Difficulty
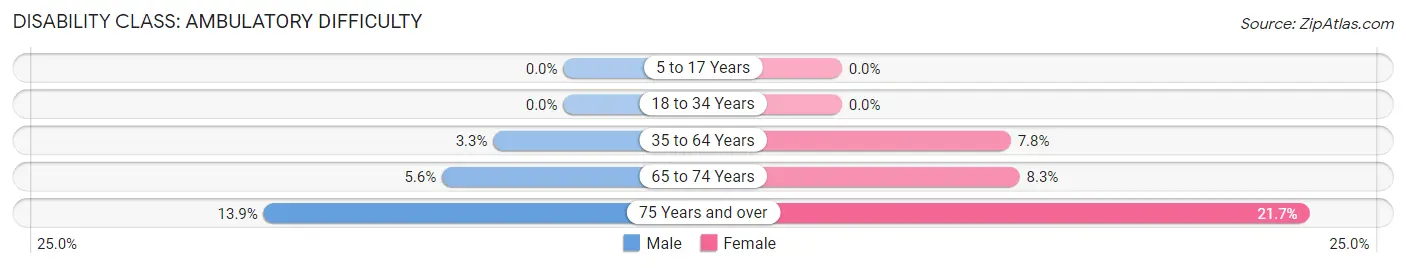
| Age Bracket | Male | Female |
| 5 to 17 Years | 0 (0.0%) | 0 (0.0%) |
| 18 to 34 Years | 0 (0.0%) | 0 (0.0%) |
| 35 to 64 Years | 15 (3.3%) | 33 (7.8%) |
| 65 to 74 Years | 4 (5.6%) | 8 (8.3%) |
| 75 Years and over | 16 (13.9%) | 23 (21.7%) |
Disability Class: Self-Care Difficulty
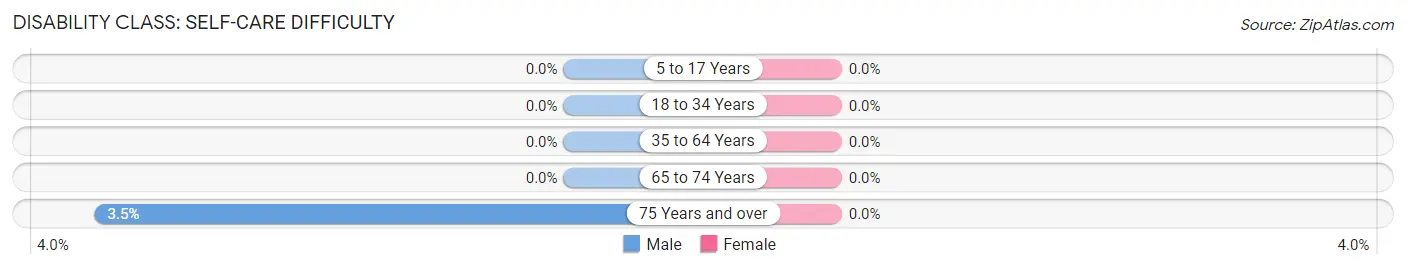
| Age Bracket | Male | Female |
| 5 to 17 Years | 0 (0.0%) | 0 (0.0%) |
| 18 to 34 Years | 0 (0.0%) | 0 (0.0%) |
| 35 to 64 Years | 0 (0.0%) | 0 (0.0%) |
| 65 to 74 Years | 0 (0.0%) | 0 (0.0%) |
| 75 Years and over | 4 (3.5%) | 0 (0.0%) |
Technology Access in Fillmore
Computing Device Access in Fillmore
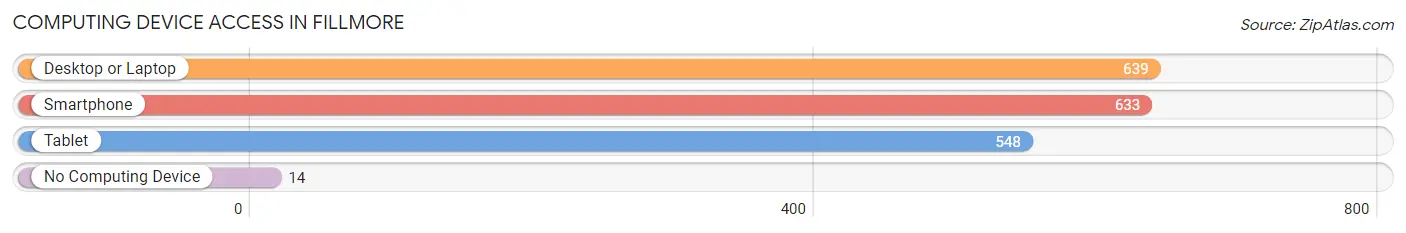
| Device Type | # Households | % Households |
| Desktop or Laptop | 639 | 85.5% |
| Smartphone | 633 | 84.7% |
| Tablet | 548 | 73.4% |
| No Computing Device | 14 | 1.9% |
| Total | 747 | 100.0% |
Internet Access in Fillmore
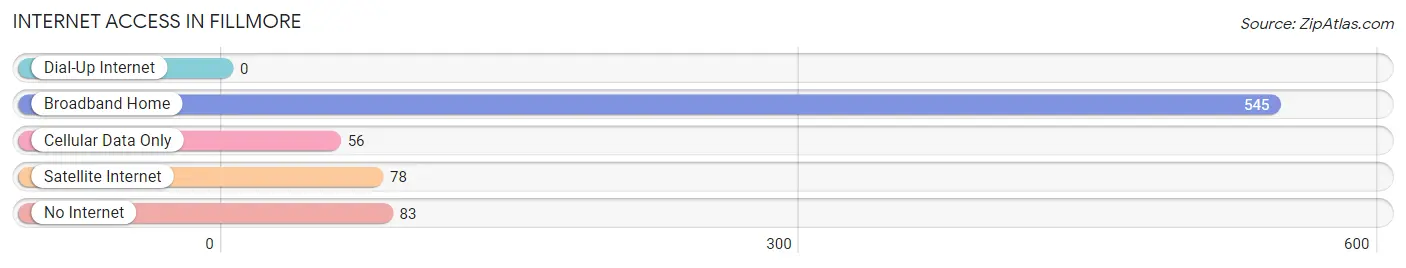
| Internet Type | # Households | % Households |
| Dial-Up Internet | 0 | 0.0% |
| Broadband Home | 545 | 73.0% |
| Cellular Data Only | 56 | 7.5% |
| Satellite Internet | 78 | 10.4% |
| No Internet | 83 | 11.1% |
| Total | 747 | 100.0% |
Fillmore Summary
Fillmore, Utah is a small city located in Millard County, Utah. It is the county seat of Millard County and is located about 120 miles south of Salt Lake City. The city has a population of 2,253 as of the 2020 census.
History
Fillmore was founded in 1851 by Mormon pioneers, who were sent by Brigham Young to establish a settlement in the area. The city was named after President Millard Fillmore, who was the 13th President of the United States. The city was originally intended to be the capital of the State of Deseret, which was a proposed state of the United States that would have encompassed much of the Great Basin. However, the proposal was rejected by Congress and the city of Fillmore was instead made the county seat of Millard County.
The city was an important stop on the Pony Express and the Overland Stage Line, which ran through the city from 1858 to 1861. The city was also an important stop on the transcontinental railroad, which was completed in 1869.
Geography
Fillmore is located in the Great Basin region of Utah, which is characterized by its dry climate and sparse vegetation. The city is located in the Pahvant Valley, which is a large valley surrounded by mountains. The city is located at an elevation of 4,719 feet above sea level.
The city is located in the Great Basin Desert, which is a large desert that covers much of the western United States. The city is located in the northern part of the desert, which is characterized by its dry climate and sparse vegetation.
Economy
The economy of Fillmore is largely based on agriculture and tourism. The city is home to several farms and ranches, which produce a variety of crops and livestock. The city is also home to several tourist attractions, including the Fillmore Pioneer Village, which is a living history museum that showcases the history of the city and the surrounding area.
The city is also home to several manufacturing companies, which produce a variety of products, including furniture, clothing, and electronics. The city is also home to several retail stores, which sell a variety of goods and services.
Demographics
As of the 2020 census, the population of Fillmore was 2,253. The city has a population that is predominantly white (94.2%), with small percentages of other races, including Hispanic or Latino (2.3%), Native American (1.2%), and Asian (0.7%).
The median household income in Fillmore is $45,938, which is lower than the national median of $61,937. The median home value in Fillmore is $179,400, which is lower than the national median of $219,700. The city has a poverty rate of 11.2%, which is higher than the national poverty rate of 10.5%.
Conclusion
Fillmore, Utah is a small city located in Millard County, Utah. It is the county seat of Millard County and is located about 120 miles south of Salt Lake City. The city has a population of 2,253 as of the 2020 census. The city was founded in 1851 by Mormon pioneers and was an important stop on the Pony Express and the transcontinental railroad. The economy of Fillmore is largely based on agriculture and tourism, and the city has a predominantly white population. The median household income in Fillmore is $45,938, which is lower than the national median, and the city has a poverty rate of 11.2%.
Common Questions
What is Per Capita Income in Fillmore?
Per Capita income in Fillmore is $26,436.
What is the Median Family Income in Fillmore?
Median Family Income in Fillmore is $77,396.
What is the Median Household income in Fillmore?
Median Household Income in Fillmore is $71,250.
What is Income or Wage Gap in Fillmore?
Income or Wage Gap in Fillmore is 50.3%.
Women in Fillmore earn 49.7 cents for every dollar earned by a man.
What is Inequality or Gini Index in Fillmore?
Inequality or Gini Index in Fillmore is 0.40.
What is the Total Population of Fillmore?
Total Population of Fillmore is 2,572.
What is the Total Male Population of Fillmore?
Total Male Population of Fillmore is 1,369.
What is the Total Female Population of Fillmore?
Total Female Population of Fillmore is 1,203.
What is the Ratio of Males per 100 Females in Fillmore?
There are 113.80 Males per 100 Females in Fillmore.
What is the Ratio of Females per 100 Males in Fillmore?
There are 87.87 Females per 100 Males in Fillmore.
What is the Median Population Age in Fillmore?
Median Population Age in Fillmore is 35.7 Years.
What is the Average Family Size in Fillmore
Average Family Size in Fillmore is 3.8 People.
What is the Average Household Size in Fillmore
Average Household Size in Fillmore is 3.4 People.
How Large is the Labor Force in Fillmore?
There are 1,233 People in the Labor Forcein in Fillmore.
What is the Percentage of People in the Labor Force in Fillmore?
65.7% of People are in the Labor Force in Fillmore.
What is the Unemployment Rate in Fillmore?
Unemployment Rate in Fillmore is 5.9%.