Brownfield, TX Map & Demographics
Brownfield Map
Brownfield Overview
$24,221
PER CAPITA INCOME
$52,595
AVG FAMILY INCOME
$41,228
AVG HOUSEHOLD INCOME
38.0%
WAGE / INCOME GAP [ % ]
62.0¢/ $1
WAGE / INCOME GAP [ $ ]
$13,246
FAMILY INCOME DEFICIT
0.47
INEQUALITY / GINI INDEX
8,912
TOTAL POPULATION
5,059
MALE POPULATION
3,853
FEMALE POPULATION
131.30
MALES / 100 FEMALES
76.16
FEMALES / 100 MALES
35.7
MEDIAN AGE
3.1
AVG FAMILY SIZE
2.4
AVG HOUSEHOLD SIZE
3,964
LABOR FORCE [ PEOPLE ]
57.9%
PERCENT IN LABOR FORCE
5.8%
UNEMPLOYMENT RATE
Brownfield Zip Codes
Brownfield Area Codes
Income in Brownfield
Income Overview in Brownfield
Per Capita Income in Brownfield is $24,221, while median incomes of families and households are $52,595 and $41,228 respectively.
| Characteristic | Number | Measure |
| Per Capita Income | 8,912 | $24,221 |
| Median Family Income | 2,163 | $52,595 |
| Mean Family Income | 2,163 | $71,784 |
| Median Household Income | 3,352 | $41,228 |
| Mean Household Income | 3,352 | $61,693 |
| Income Deficit | 2,163 | $13,246 |
| Wage / Income Gap (%) | 8,912 | 38.01% |
| Wage / Income Gap ($) | 8,912 | 61.99¢ per $1 |
| Gini / Inequality Index | 8,912 | 0.47 |
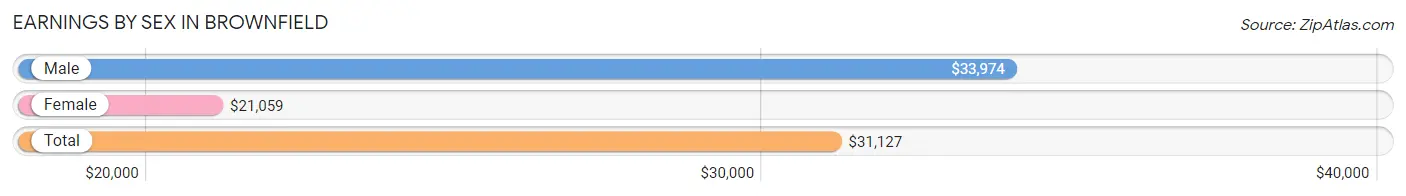
Earnings by Sex in Brownfield
Average Earnings in Brownfield are $31,127, $33,974 for men and $21,059 for women, a difference of 38.0%.
| Sex | Number | Average Earnings |
| Male | 2,497 (56.9%) | $33,974 |
| Female | 1,895 (43.1%) | $21,059 |
| Total | 4,392 (100.0%) | $31,127 |
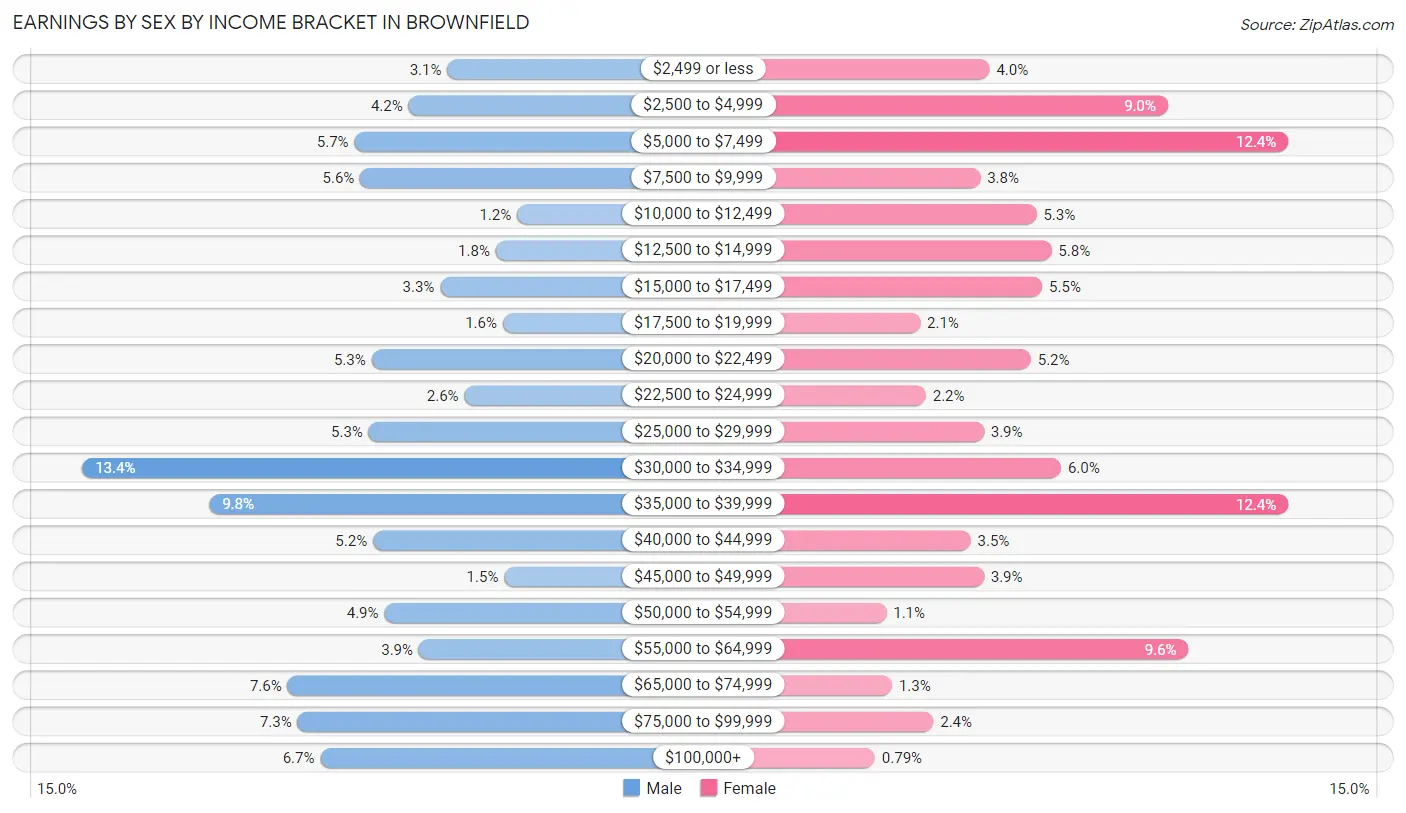
Earnings by Sex by Income Bracket in Brownfield
The most common earnings brackets in Brownfield are $30,000 to $34,999 for men (334 | 13.4%) and $5,000 to $7,499 for women (235 | 12.4%).
| Income | Male | Female |
| $2,499 or less | 78 (3.1%) | 76 (4.0%) |
| $2,500 to $4,999 | 105 (4.2%) | 171 (9.0%) |
| $5,000 to $7,499 | 143 (5.7%) | 235 (12.4%) |
| $7,500 to $9,999 | 139 (5.6%) | 71 (3.7%) |
| $10,000 to $12,499 | 29 (1.2%) | 101 (5.3%) |
| $12,500 to $14,999 | 44 (1.8%) | 109 (5.8%) |
| $15,000 to $17,499 | 83 (3.3%) | 104 (5.5%) |
| $17,500 to $19,999 | 39 (1.6%) | 39 (2.1%) |
| $20,000 to $22,499 | 131 (5.2%) | 98 (5.2%) |
| $22,500 to $24,999 | 66 (2.6%) | 42 (2.2%) |
| $25,000 to $29,999 | 133 (5.3%) | 73 (3.8%) |
| $30,000 to $34,999 | 334 (13.4%) | 114 (6.0%) |
| $35,000 to $39,999 | 245 (9.8%) | 235 (12.4%) |
| $40,000 to $44,999 | 130 (5.2%) | 66 (3.5%) |
| $45,000 to $49,999 | 38 (1.5%) | 73 (3.8%) |
| $50,000 to $54,999 | 122 (4.9%) | 21 (1.1%) |
| $55,000 to $64,999 | 98 (3.9%) | 182 (9.6%) |
| $65,000 to $74,999 | 190 (7.6%) | 24 (1.3%) |
| $75,000 to $99,999 | 183 (7.3%) | 46 (2.4%) |
| $100,000+ | 167 (6.7%) | 15 (0.8%) |
| Total | 2,497 (100.0%) | 1,895 (100.0%) |
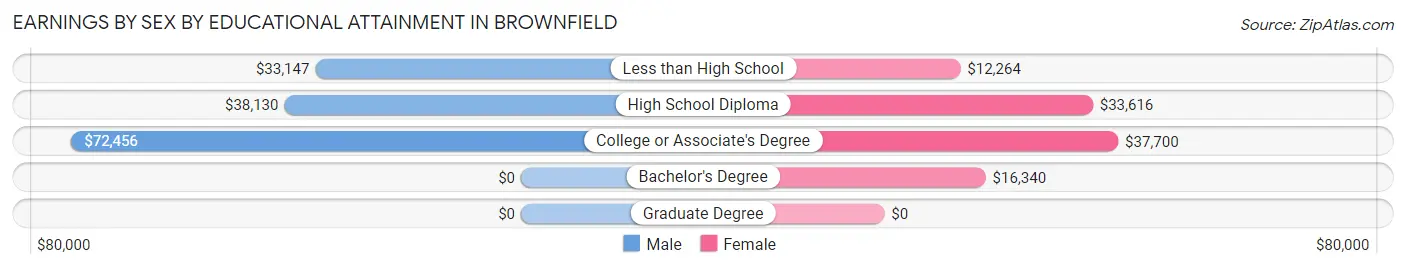
Earnings by Sex by Educational Attainment in Brownfield
Average earnings in Brownfield are $37,157 for men and $32,151 for women, a difference of 13.5%. Men with an educational attainment of college or associate's degree enjoy the highest average annual earnings of $72,456, while those with less than high school education earn the least with $33,147. Women with an educational attainment of college or associate's degree earn the most with the average annual earnings of $37,700, while those with less than high school education have the smallest earnings of $12,264.
| Educational Attainment | Male Income | Female Income |
| Less than High School | $33,147 | $12,264 |
| High School Diploma | $38,130 | $33,616 |
| College or Associate's Degree | $72,456 | $37,700 |
| Bachelor's Degree | - | - |
| Graduate Degree | - | - |
| Total | $37,157 | $32,151 |
Family Income in Brownfield
Family Income Brackets in Brownfield
According to the Brownfield family income data, there are 459 families falling into the $35,000 to $49,999 income range, which is the most common income bracket and makes up 21.2% of all families. Conversely, the $10,000 to $14,999 income bracket is the least frequent group with only 61 families (2.8%) belonging to this category.
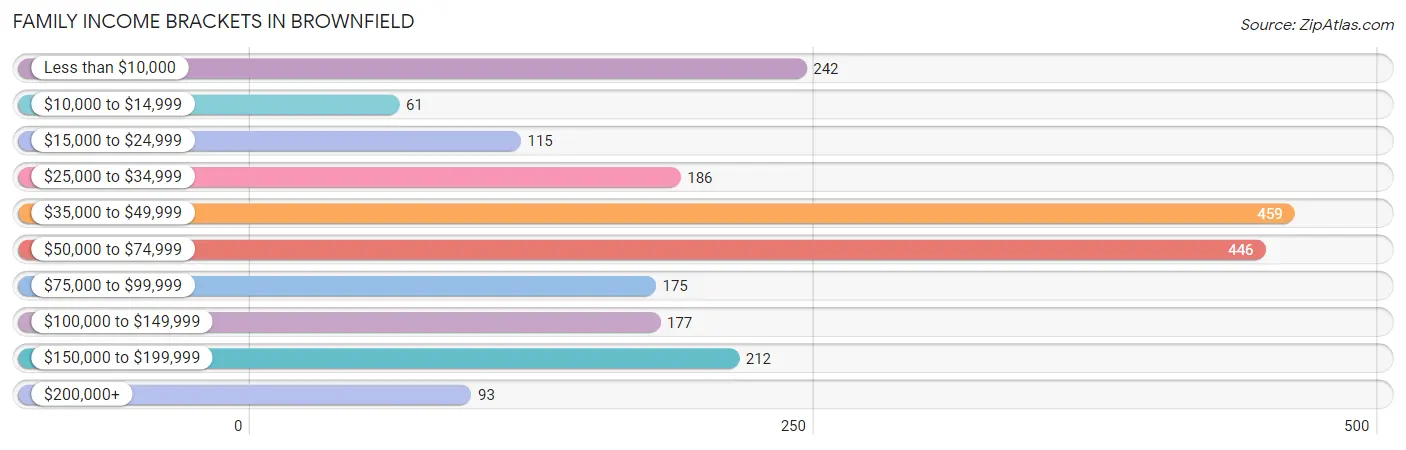
| Income Bracket | # Families | % Families |
| Less than $10,000 | 242 | 11.2% |
| $10,000 to $14,999 | 61 | 2.8% |
| $15,000 to $24,999 | 115 | 5.3% |
| $25,000 to $34,999 | 186 | 8.6% |
| $35,000 to $49,999 | 459 | 21.2% |
| $50,000 to $74,999 | 446 | 20.6% |
| $75,000 to $99,999 | 175 | 8.1% |
| $100,000 to $149,999 | 177 | 8.2% |
| $150,000 to $199,999 | 212 | 9.8% |
| $200,000+ | 93 | 4.3% |
Family Income by Famaliy Size in Brownfield
4-person families (352 | 16.3%) account for the highest median family income in Brownfield with $77,273 per family, while 2-person families (821 | 38.0%) have the highest median income of $26,469 per family member.
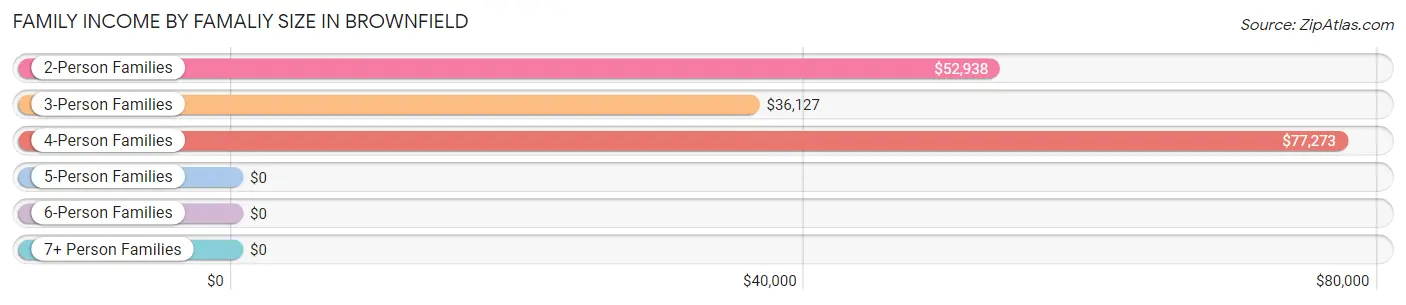
| Income Bracket | # Families | Median Income |
| 2-Person Families | 821 (38.0%) | $52,938 |
| 3-Person Families | 682 (31.5%) | $36,127 |
| 4-Person Families | 352 (16.3%) | $77,273 |
| 5-Person Families | 218 (10.1%) | $0 |
| 6-Person Families | 14 (0.6%) | $0 |
| 7+ Person Families | 76 (3.5%) | $0 |
| Total | 2,163 (100.0%) | $52,595 |
Family Income by Number of Earners in Brownfield
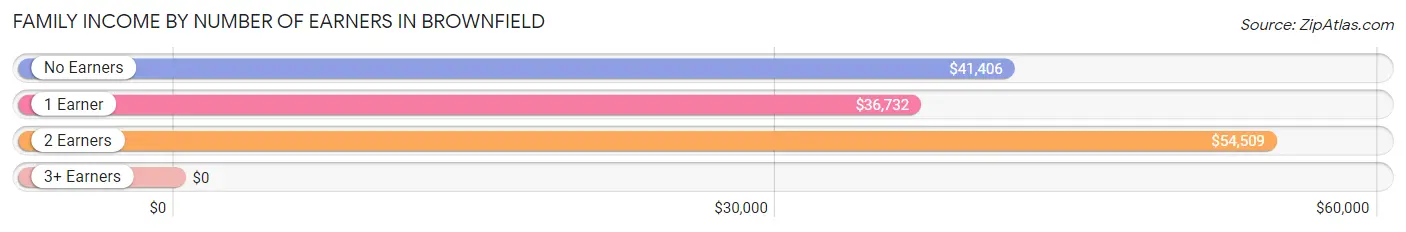
| Number of Earners | # Families | Median Income |
| No Earners | 401 (18.5%) | $41,406 |
| 1 Earner | 847 (39.2%) | $36,732 |
| 2 Earners | 634 (29.3%) | $54,509 |
| 3+ Earners | 281 (13.0%) | $0 |
| Total | 2,163 (100.0%) | $52,595 |
Household Income in Brownfield
Household Income Brackets in Brownfield
With 707 households falling in the category, the $35,000 to $49,999 income range is the most frequent in Brownfield, accounting for 21.1% of all households. In contrast, only 101 households (3.0%) fall into the $200,000+ income bracket, making it the least populous group.
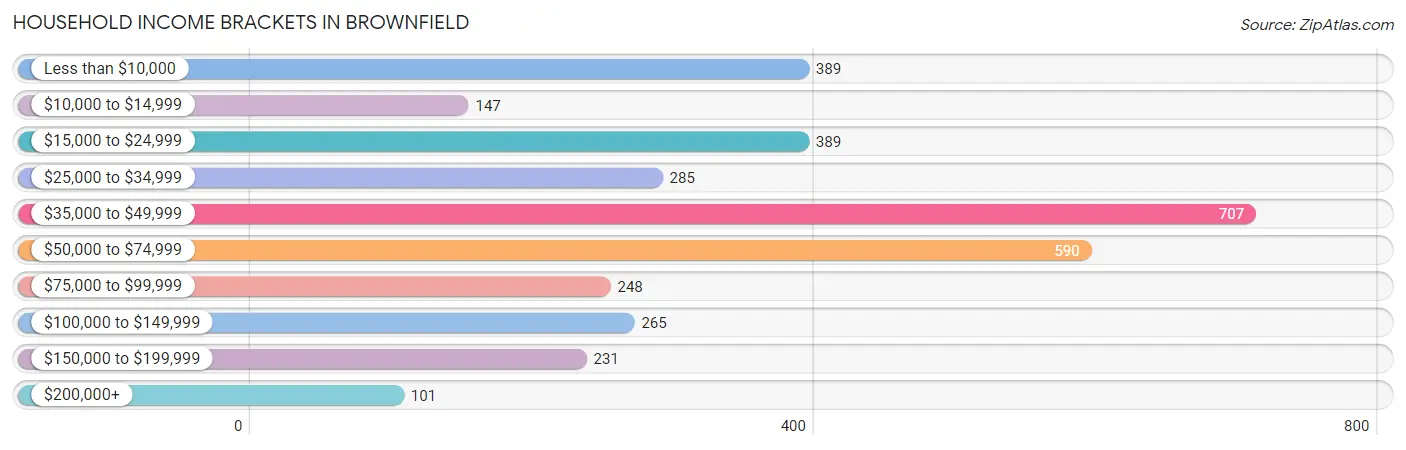
| Income Bracket | # Households | % Households |
| Less than $10,000 | 389 | 11.6% |
| $10,000 to $14,999 | 147 | 4.4% |
| $15,000 to $24,999 | 389 | 11.6% |
| $25,000 to $34,999 | 285 | 8.5% |
| $35,000 to $49,999 | 707 | 21.1% |
| $50,000 to $74,999 | 590 | 17.6% |
| $75,000 to $99,999 | 248 | 7.4% |
| $100,000 to $149,999 | 265 | 7.9% |
| $150,000 to $199,999 | 231 | 6.9% |
| $200,000+ | 101 | 3.0% |
Household Income by Householder Age in Brownfield
The median household income in Brownfield is $41,228, with the highest median household income of $56,984 found in the 25 to 44 years age bracket for the primary householder. A total of 1,032 households (30.8%) fall into this category. Meanwhile, the 15 to 24 years age bracket for the primary householder has the lowest median household income of $0, with 286 households (8.5%) in this group.
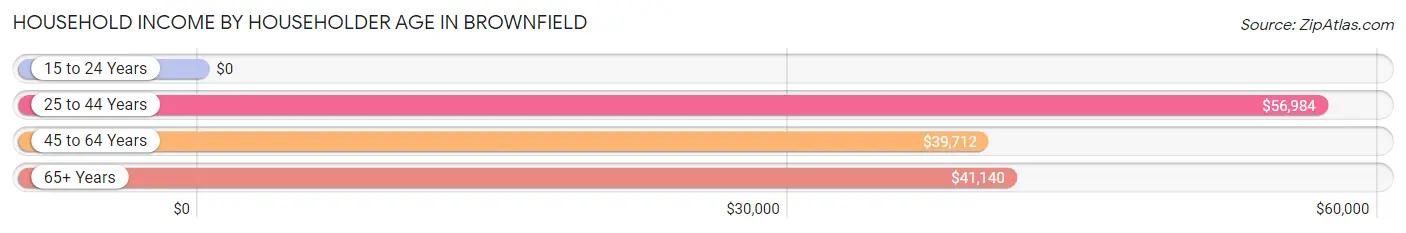
| Income Bracket | # Households | Median Income |
| 15 to 24 Years | 286 (8.5%) | $0 |
| 25 to 44 Years | 1,032 (30.8%) | $56,984 |
| 45 to 64 Years | 1,187 (35.4%) | $39,712 |
| 65+ Years | 847 (25.3%) | $41,140 |
| Total | 3,352 (100.0%) | $41,228 |
Poverty in Brownfield
Income Below Poverty by Sex and Age in Brownfield
With 19.5% poverty level for males and 32.6% for females among the residents of Brownfield, 5 year old males and 15 year old females are the most vulnerable to poverty, with 112 males (76.2%) and 24 females (100.0%) in their respective age groups living below the poverty level.
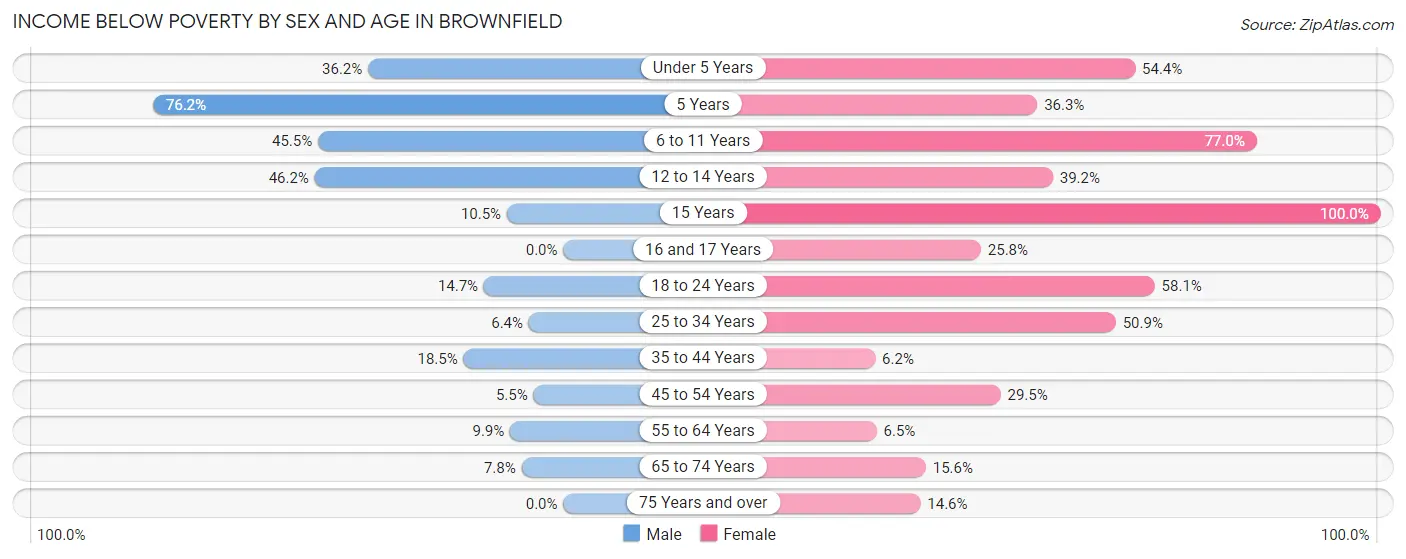
| Age Bracket | Male | Female |
| Under 5 Years | 166 (36.2%) | 49 (54.4%) |
| 5 Years | 112 (76.2%) | 37 (36.3%) |
| 6 to 11 Years | 138 (45.5%) | 258 (77.0%) |
| 12 to 14 Years | 126 (46.2%) | 56 (39.2%) |
| 15 Years | 20 (10.5%) | 24 (100.0%) |
| 16 and 17 Years | 0 (0.0%) | 24 (25.8%) |
| 18 to 24 Years | 60 (14.7%) | 259 (58.1%) |
| 25 to 34 Years | 33 (6.4%) | 240 (50.8%) |
| 35 to 44 Years | 90 (18.5%) | 34 (6.2%) |
| 45 to 54 Years | 24 (5.5%) | 119 (29.5%) |
| 55 to 64 Years | 50 (9.9%) | 27 (6.5%) |
| 65 to 74 Years | 26 (7.8%) | 58 (15.6%) |
| 75 Years and over | 0 (0.0%) | 50 (14.6%) |
| Total | 845 (19.5%) | 1,235 (32.6%) |
Income Above Poverty by Sex and Age in Brownfield
According to the poverty statistics in Brownfield, males aged 16 and 17 years and females aged 35 to 44 years are the age groups that are most secure financially, with 100.0% of males and 93.8% of females in these age groups living above the poverty line.
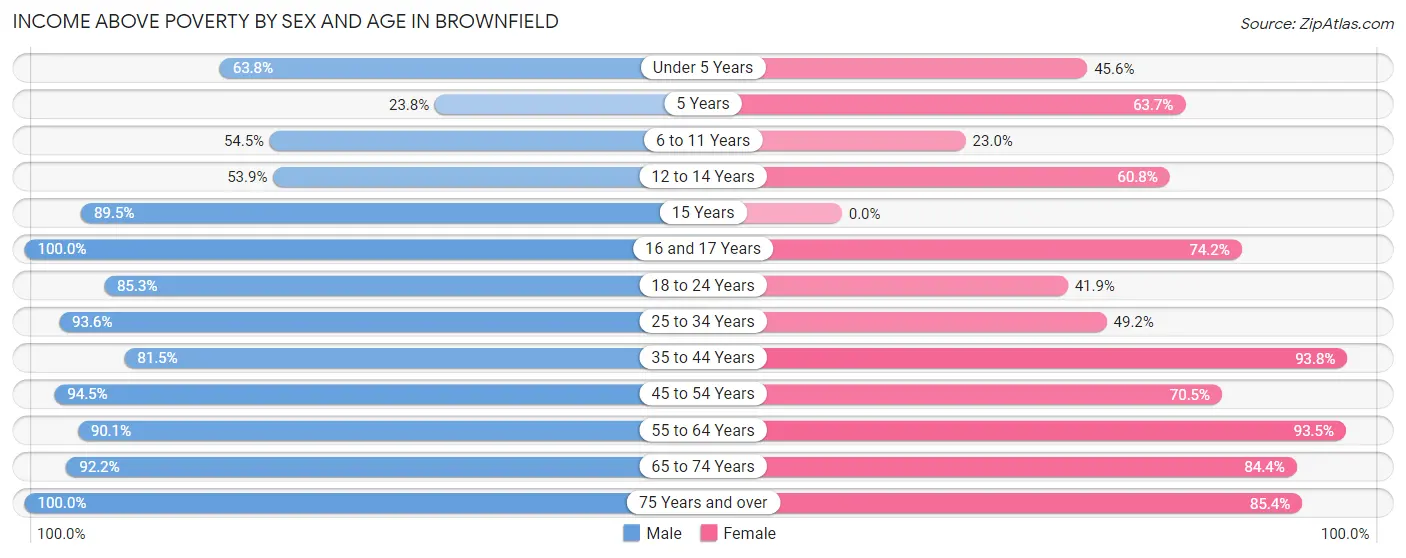
| Age Bracket | Male | Female |
| Under 5 Years | 292 (63.8%) | 41 (45.6%) |
| 5 Years | 35 (23.8%) | 65 (63.7%) |
| 6 to 11 Years | 165 (54.5%) | 77 (23.0%) |
| 12 to 14 Years | 147 (53.8%) | 87 (60.8%) |
| 15 Years | 171 (89.5%) | 0 (0.0%) |
| 16 and 17 Years | 68 (100.0%) | 69 (74.2%) |
| 18 to 24 Years | 347 (85.3%) | 187 (41.9%) |
| 25 to 34 Years | 483 (93.6%) | 232 (49.1%) |
| 35 to 44 Years | 396 (81.5%) | 515 (93.8%) |
| 45 to 54 Years | 410 (94.5%) | 285 (70.5%) |
| 55 to 64 Years | 456 (90.1%) | 391 (93.5%) |
| 65 to 74 Years | 309 (92.2%) | 314 (84.4%) |
| 75 Years and over | 211 (100.0%) | 293 (85.4%) |
| Total | 3,490 (80.5%) | 2,556 (67.4%) |
Income Below Poverty Among Married-Couple Families in Brownfield
The poverty statistics for married-couple families in Brownfield show that 11.4% or 143 of the total 1,250 families live below the poverty line. Families with 5 or more children have the highest poverty rate of 100.0%, comprising of 76 families. On the other hand, families with 1 or 2 children have the lowest poverty rate of 0.0%, which includes 0 families.
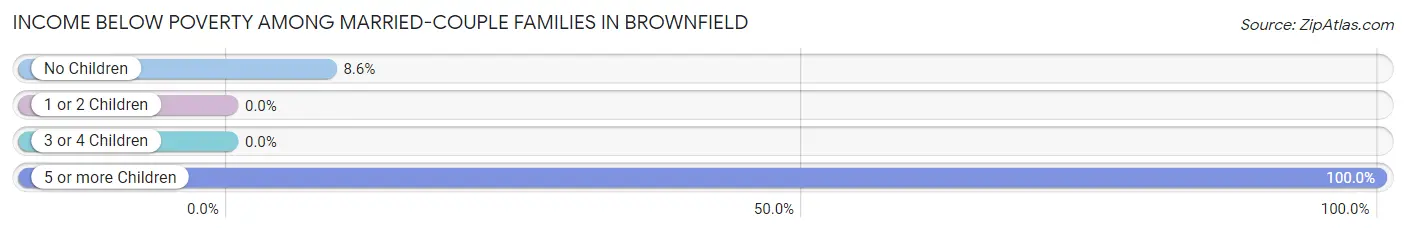
| Children | Above Poverty | Below Poverty |
| No Children | 715 (91.4%) | 67 (8.6%) |
| 1 or 2 Children | 303 (100.0%) | 0 (0.0%) |
| 3 or 4 Children | 89 (100.0%) | 0 (0.0%) |
| 5 or more Children | 0 (0.0%) | 76 (100.0%) |
| Total | 1,107 (88.6%) | 143 (11.4%) |
Income Below Poverty Among Single-Parent Households in Brownfield
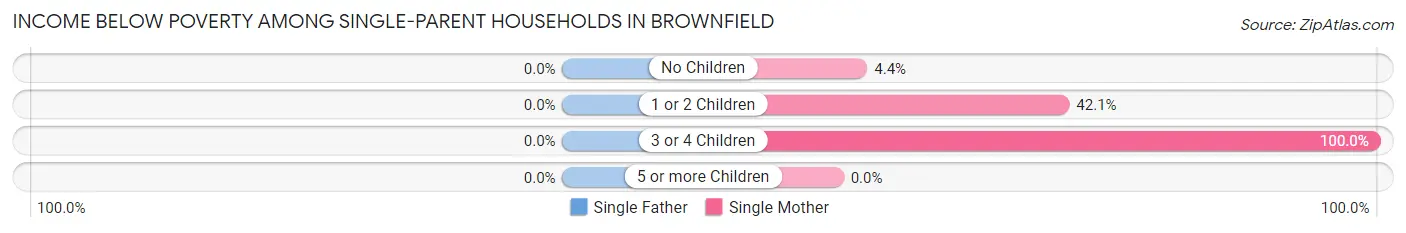
| Children | Single Father | Single Mother |
| No Children | 0 (0.0%) | 9 (4.4%) |
| 1 or 2 Children | 0 (0.0%) | 164 (42.0%) |
| 3 or 4 Children | 0 (0.0%) | 158 (100.0%) |
| 5 or more Children | 0 (0.0%) | 0 (0.0%) |
| Total | 0 (0.0%) | 331 (44.0%) |
Income Below Poverty Among Married-Couple vs Single-Parent Households in Brownfield
The poverty data for Brownfield shows that 143 of the married-couple family households (11.4%) and 331 of the single-parent households (36.2%) are living below the poverty level. Within the married-couple family households, those with 5 or more children have the highest poverty rate, with 76 households (100.0%) falling below the poverty line. Among the single-parent households, those with 3 or 4 children have the highest poverty rate, with 158 household (100.0%) living below poverty.
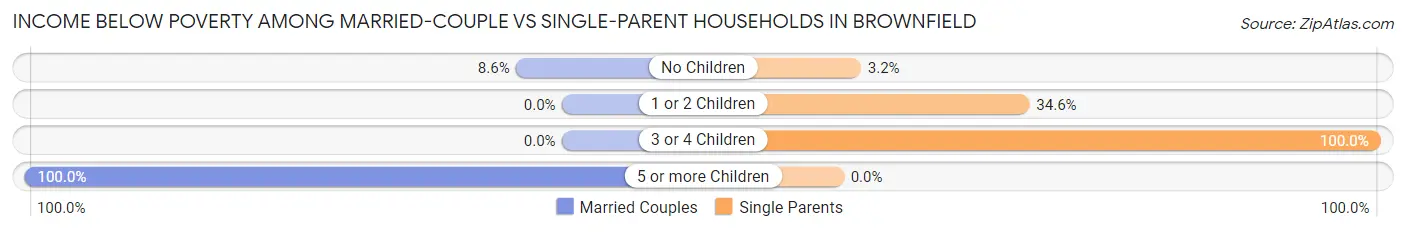
| Children | Married-Couple Families | Single-Parent Households |
| No Children | 67 (8.6%) | 9 (3.2%) |
| 1 or 2 Children | 0 (0.0%) | 164 (34.6%) |
| 3 or 4 Children | 0 (0.0%) | 158 (100.0%) |
| 5 or more Children | 76 (100.0%) | 0 (0.0%) |
| Total | 143 (11.4%) | 331 (36.2%) |
Race in Brownfield
The most populous races in Brownfield are Hispanic or Latino (5,654 | 63.4%), White / Caucasian (5,373 | 60.3%), and Two or more Races (2,605 | 29.2%).
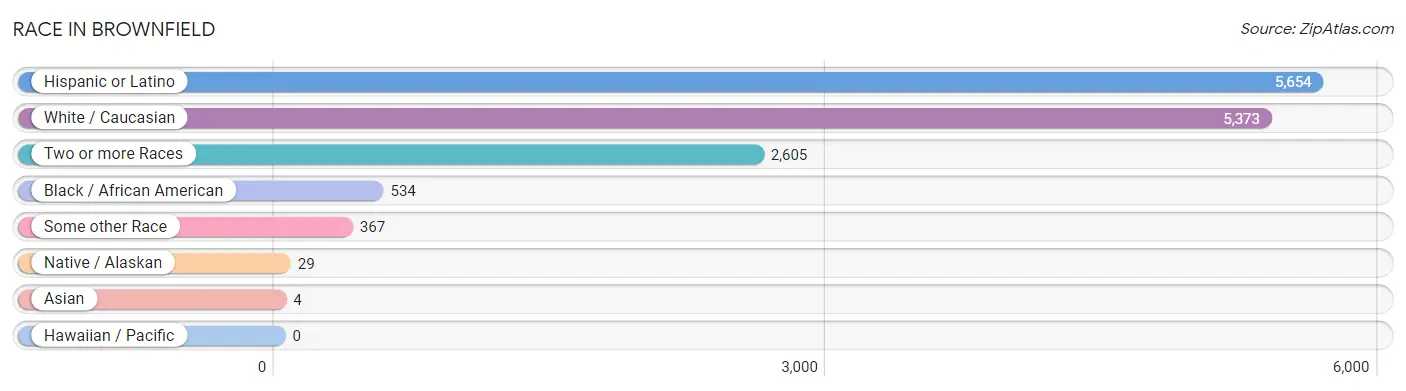
| Race | # Population | % Population |
| Asian | 4 | 0.0% |
| Black / African American | 534 | 6.0% |
| Hawaiian / Pacific | 0 | 0.0% |
| Hispanic or Latino | 5,654 | 63.4% |
| Native / Alaskan | 29 | 0.3% |
| White / Caucasian | 5,373 | 60.3% |
| Two or more Races | 2,605 | 29.2% |
| Some other Race | 367 | 4.1% |
| Total | 8,912 | 100.0% |
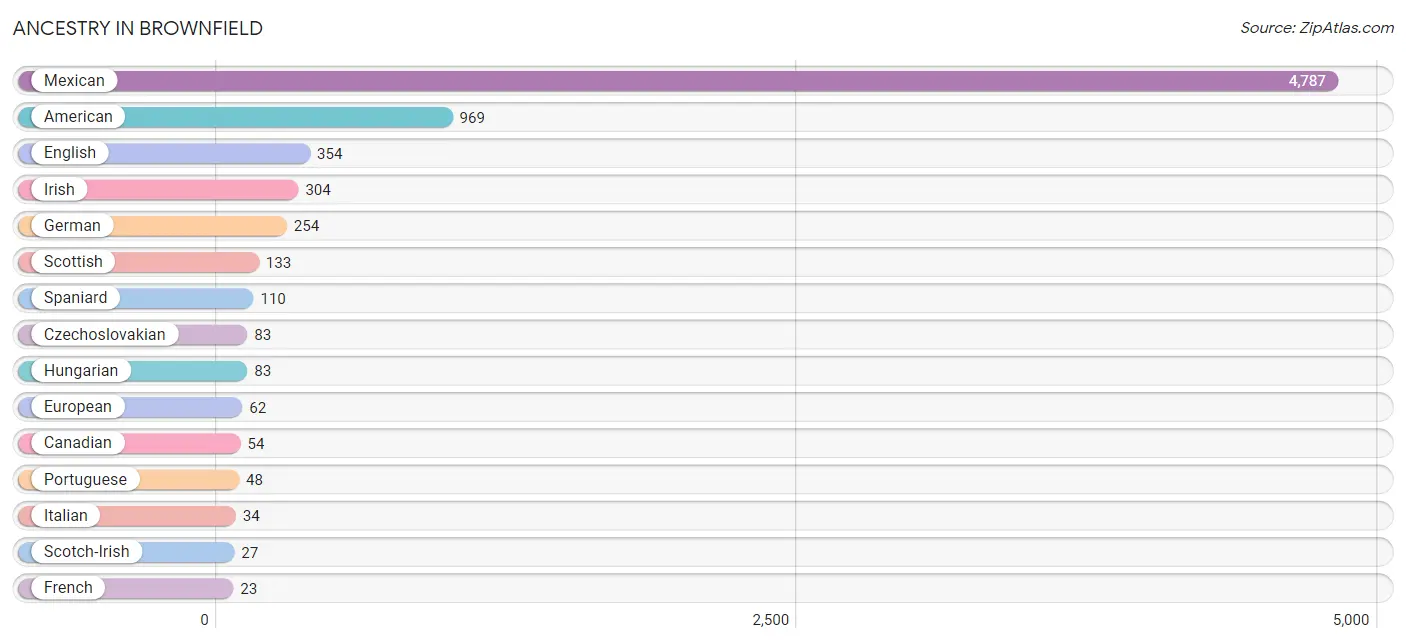
Ancestry in Brownfield
The most populous ancestries reported in Brownfield are Mexican (4,787 | 53.7%), American (969 | 10.9%), English (354 | 4.0%), Irish (304 | 3.4%), and German (254 | 2.9%), together accounting for 74.8% of all Brownfield residents.
| Ancestry | # Population | % Population |
| African | 16 | 0.2% |
| American | 969 | 10.9% |
| Arab | 5 | 0.1% |
| Blackfeet | 9 | 0.1% |
| British | 16 | 0.2% |
| Canadian | 54 | 0.6% |
| Central American | 9 | 0.1% |
| Central American Indian | 10 | 0.1% |
| Czech | 8 | 0.1% |
| Czechoslovakian | 83 | 0.9% |
| Dominican | 6 | 0.1% |
| Dutch | 13 | 0.2% |
| English | 354 | 4.0% |
| European | 62 | 0.7% |
| French | 23 | 0.3% |
| German | 254 | 2.9% |
| Guatemalan | 9 | 0.1% |
| Haitian | 12 | 0.1% |
| Hungarian | 83 | 0.9% |
| Iraqi | 5 | 0.1% |
| Irish | 304 | 3.4% |
| Italian | 34 | 0.4% |
| Jamaican | 12 | 0.1% |
| Korean | 6 | 0.1% |
| Mexican | 4,787 | 53.7% |
| Norwegian | 6 | 0.1% |
| Portuguese | 48 | 0.5% |
| Puerto Rican | 4 | 0.0% |
| Scandinavian | 11 | 0.1% |
| Scotch-Irish | 27 | 0.3% |
| Scottish | 133 | 1.5% |
| Spaniard | 110 | 1.2% |
| Sri Lankan | 4 | 0.0% |
| Subsaharan African | 16 | 0.2% |
| Swedish | 21 | 0.2% |
| Ute | 10 | 0.1% | View All 36 Rows |
Immigrants in Brownfield
The most numerous immigrant groups reported in Brownfield came from Central America (698 | 7.8%), Latin America (698 | 7.8%), Mexico (698 | 7.8%), Europe (13 | 0.2%), and Germany (13 | 0.2%), together accounting for 23.8% of all Brownfield residents.
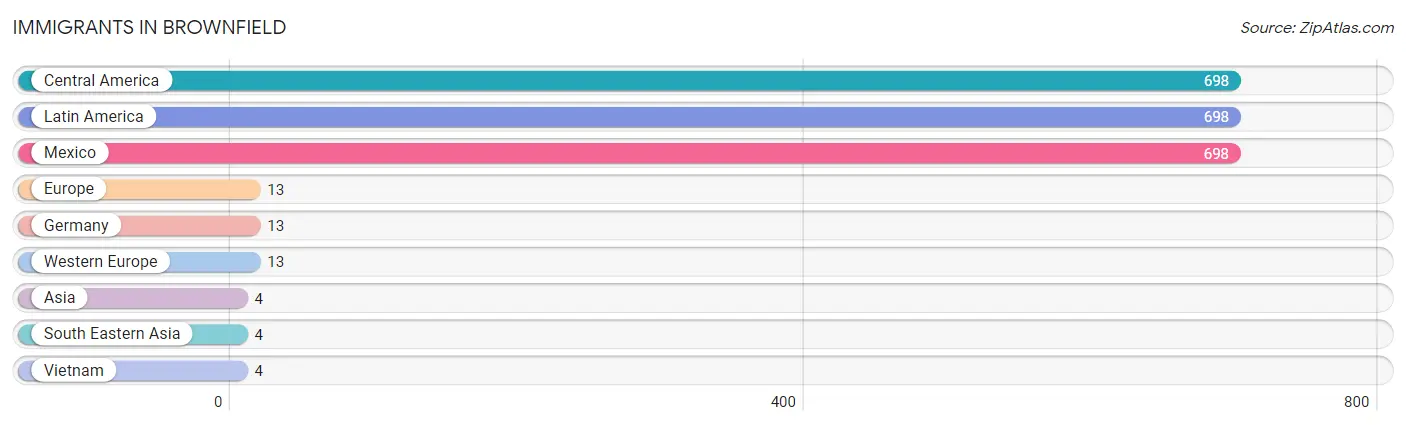
| Immigration Origin | # Population | % Population |
| Asia | 4 | 0.0% |
| Central America | 698 | 7.8% |
| Europe | 13 | 0.2% |
| Germany | 13 | 0.2% |
| Latin America | 698 | 7.8% |
| Mexico | 698 | 7.8% |
| South Eastern Asia | 4 | 0.0% |
| Vietnam | 4 | 0.0% |
| Western Europe | 13 | 0.2% | View All 9 Rows |
Sex and Age in Brownfield
Sex and Age in Brownfield
The most populous age groups in Brownfield are 35 to 39 Years (556 | 11.0%) for men and 5 to 9 Years (396 | 10.3%) for women.
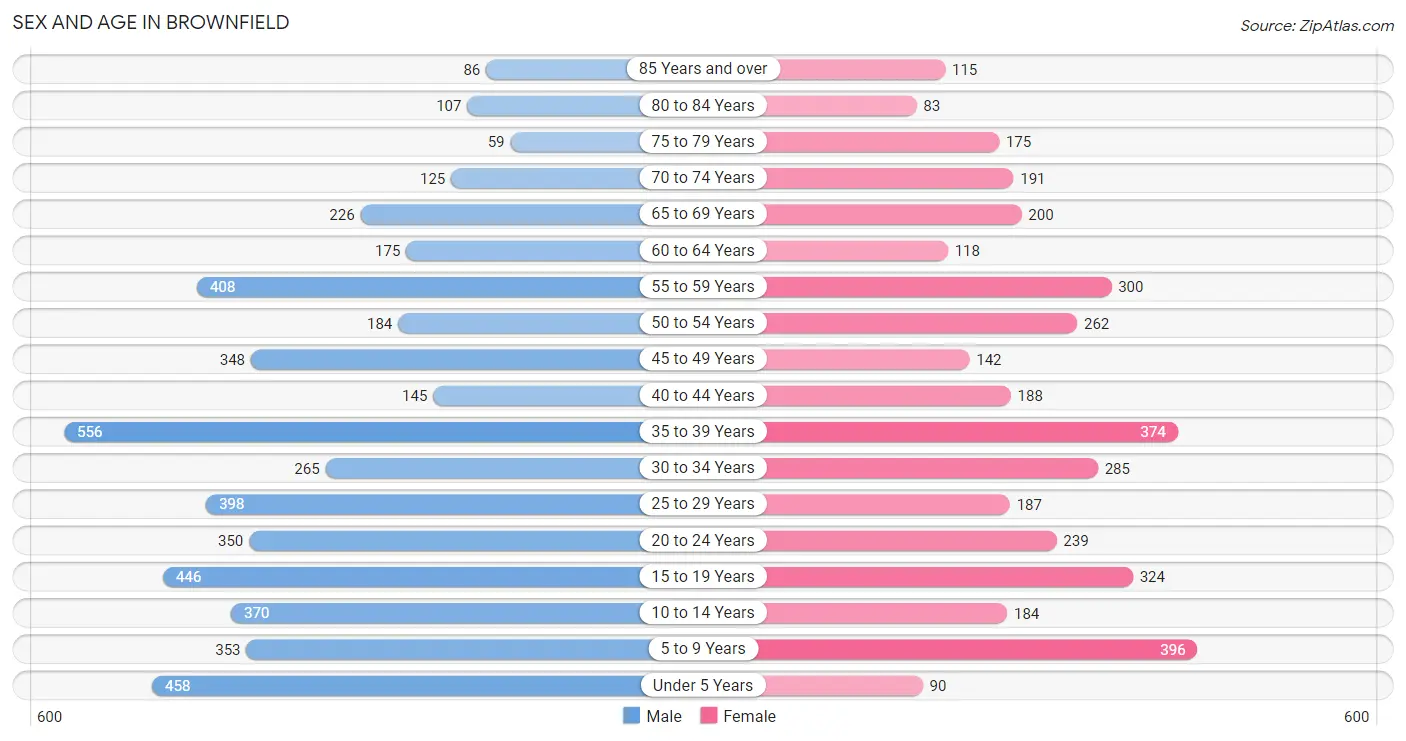
| Age Bracket | Male | Female |
| Under 5 Years | 458 (9.0%) | 90 (2.3%) |
| 5 to 9 Years | 353 (7.0%) | 396 (10.3%) |
| 10 to 14 Years | 370 (7.3%) | 184 (4.8%) |
| 15 to 19 Years | 446 (8.8%) | 324 (8.4%) |
| 20 to 24 Years | 350 (6.9%) | 239 (6.2%) |
| 25 to 29 Years | 398 (7.9%) | 187 (4.9%) |
| 30 to 34 Years | 265 (5.2%) | 285 (7.4%) |
| 35 to 39 Years | 556 (11.0%) | 374 (9.7%) |
| 40 to 44 Years | 145 (2.9%) | 188 (4.9%) |
| 45 to 49 Years | 348 (6.9%) | 142 (3.7%) |
| 50 to 54 Years | 184 (3.6%) | 262 (6.8%) |
| 55 to 59 Years | 408 (8.1%) | 300 (7.8%) |
| 60 to 64 Years | 175 (3.5%) | 118 (3.1%) |
| 65 to 69 Years | 226 (4.5%) | 200 (5.2%) |
| 70 to 74 Years | 125 (2.5%) | 191 (5.0%) |
| 75 to 79 Years | 59 (1.2%) | 175 (4.5%) |
| 80 to 84 Years | 107 (2.1%) | 83 (2.1%) |
| 85 Years and over | 86 (1.7%) | 115 (3.0%) |
| Total | 5,059 (100.0%) | 3,853 (100.0%) |
Families and Households in Brownfield
Median Family Size in Brownfield
The median family size in Brownfield is 3.08 persons per family, with single female/mother families (752 | 34.8%) accounting for the largest median family size of 3.2 persons per family. On the other hand, married-couple families (1,250 | 57.8%) represent the smallest median family size with 3.01 persons per family.
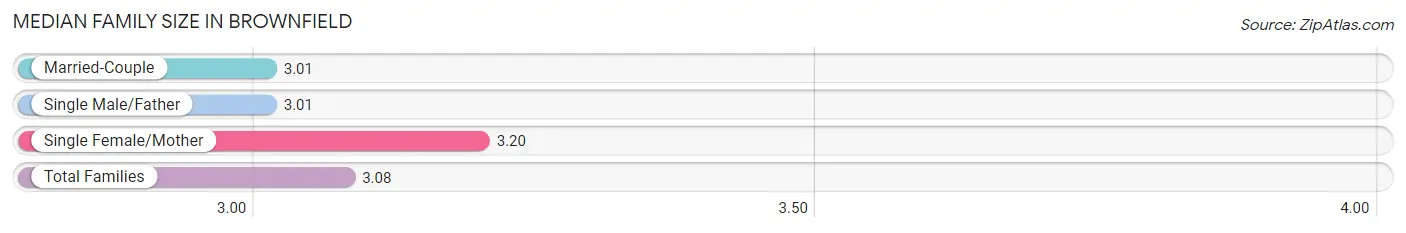
| Family Type | # Families | Family Size |
| Married-Couple | 1,250 (57.8%) | 3.01 |
| Single Male/Father | 161 (7.4%) | 3.01 |
| Single Female/Mother | 752 (34.8%) | 3.20 |
| Total Families | 2,163 (100.0%) | 3.08 |
Median Household Size in Brownfield
The median household size in Brownfield is 2.42 persons per household, with single male/father households (161 | 4.8%) accounting for the largest median household size of 3.41 persons per household. non-family households (1,189 | 35.5%) represent the smallest median household size with 1.17 persons per household.
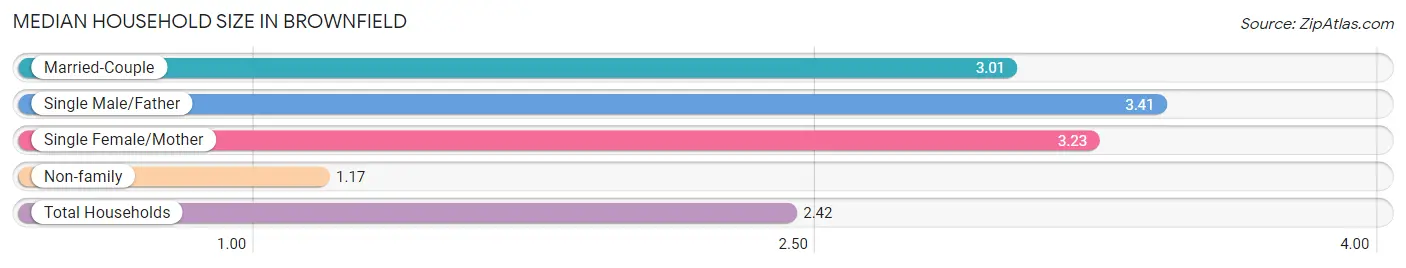
| Household Type | # Households | Household Size |
| Married-Couple | 1,250 (37.3%) | 3.01 |
| Single Male/Father | 161 (4.8%) | 3.41 |
| Single Female/Mother | 752 (22.4%) | 3.23 |
| Non-family | 1,189 (35.5%) | 1.17 |
| Total Households | 3,352 (100.0%) | 2.42 |
Household Size by Marriage Status in Brownfield
Out of a total of 3,352 households in Brownfield, 2,163 (64.5%) are family households, while 1,189 (35.5%) are nonfamily households. The most numerous type of family households are 2-person households, comprising 821, and the most common type of nonfamily households are 1-person households, comprising 1,000.
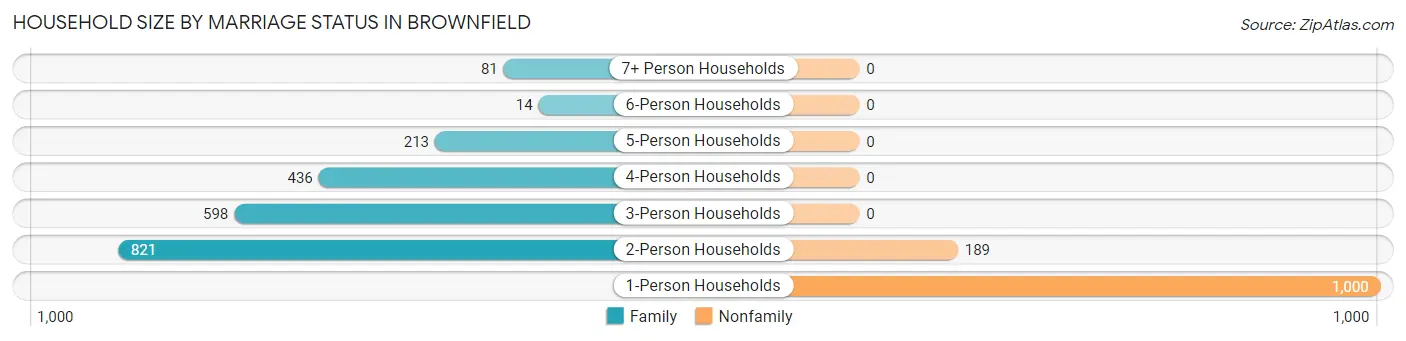
| Household Size | Family Households | Nonfamily Households |
| 1-Person Households | - | 1,000 (29.8%) |
| 2-Person Households | 821 (24.5%) | 189 (5.6%) |
| 3-Person Households | 598 (17.8%) | 0 (0.0%) |
| 4-Person Households | 436 (13.0%) | 0 (0.0%) |
| 5-Person Households | 213 (6.4%) | 0 (0.0%) |
| 6-Person Households | 14 (0.4%) | 0 (0.0%) |
| 7+ Person Households | 81 (2.4%) | 0 (0.0%) |
| Total | 2,163 (64.5%) | 1,189 (35.5%) |
Female Fertility in Brownfield
Fertility by Age in Brownfield
Average fertility rate in Brownfield is 33.0 births per 1,000 women. Women in the age bracket of 20 to 34 years have the highest fertility rate with 82.0 births per 1,000 women. Women in the age bracket of 20 to 34 years acount for 100.0% of all women with births.
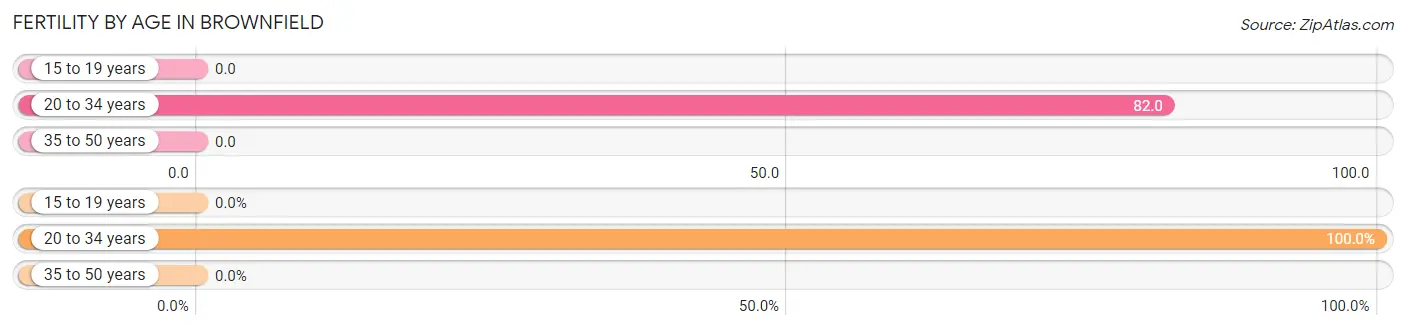
| Age Bracket | Women with Births | Births / 1,000 Women |
| 15 to 19 years | 0 (0.0%) | 0.0 |
| 20 to 34 years | 58 (100.0%) | 82.0 |
| 35 to 50 years | 0 (0.0%) | 0.0 |
| Total | 58 (100.0%) | 33.0 |
Fertility by Age by Marriage Status in Brownfield
75.9% of women with births (58) in Brownfield are married. The highest percentage of unmarried women with births falls into 20 to 34 years age bracket with 24.1% of them unmarried at the time of birth, while the lowest percentage of unmarried women with births belong to 20 to 34 years age bracket with 24.1% of them unmarried.
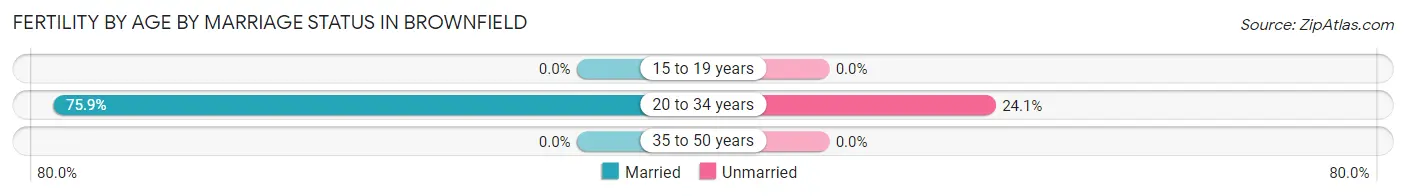
| Age Bracket | Married | Unmarried |
| 15 to 19 years | 0 (0.0%) | 0 (0.0%) |
| 20 to 34 years | 44 (75.9%) | 14 (24.1%) |
| 35 to 50 years | 0 (0.0%) | 0 (0.0%) |
| Total | 44 (75.9%) | 14 (24.1%) |
Fertility by Education in Brownfield
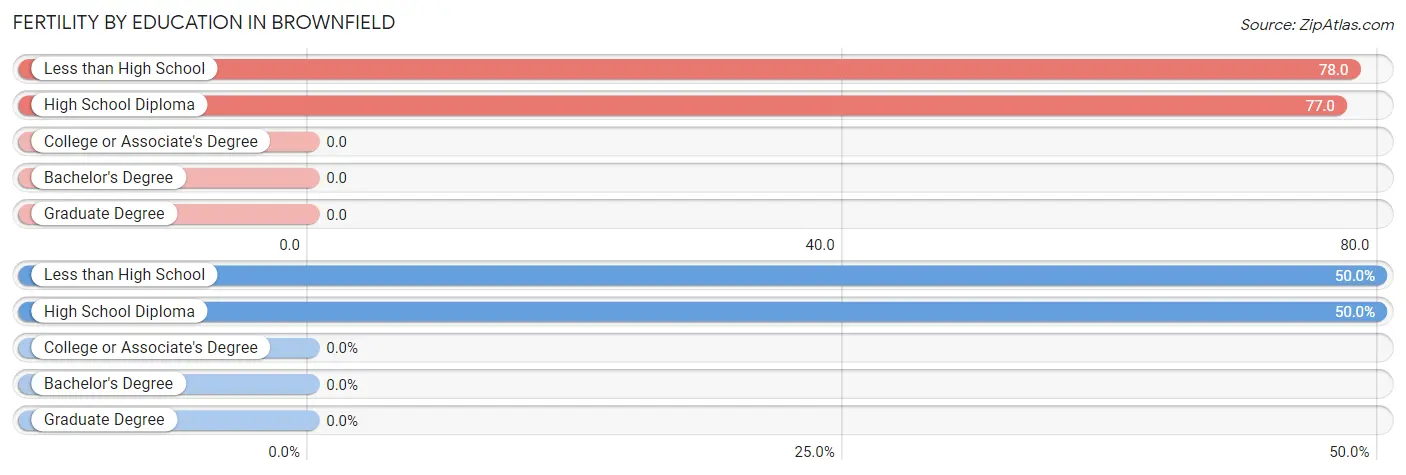
| Educational Attainment | Women with Births | Births / 1,000 Women |
| Less than High School | 29 (50.0%) | 78.0 |
| High School Diploma | 29 (50.0%) | 77.0 |
| College or Associate's Degree | 0 (0.0%) | 0.0 |
| Bachelor's Degree | 0 (0.0%) | 0.0 |
| Graduate Degree | 0 (0.0%) | 0.0 |
| Total | 58 (100.0%) | 33.0 |
Fertility by Education by Marriage Status in Brownfield
24.1% of women with births in Brownfield are unmarried. Women with the educational attainment of high school diploma are most likely to be married with 100.0% of them married at childbirth, while women with the educational attainment of less than high school are least likely to be married with 48.3% of them unmarried at childbirth.
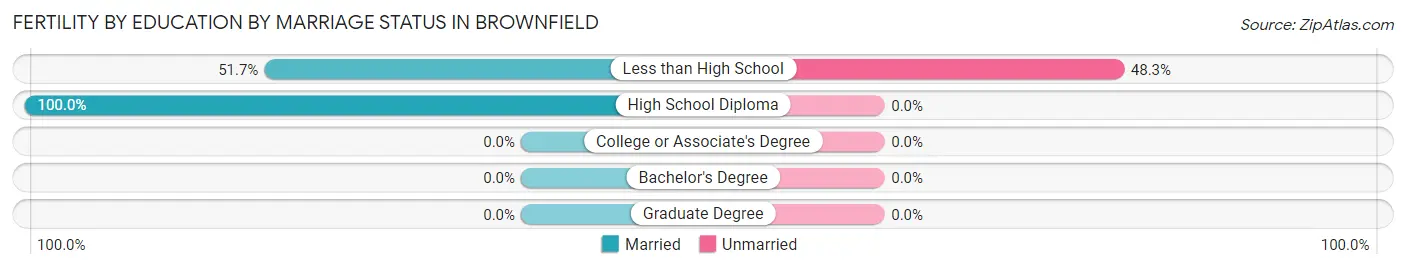
| Educational Attainment | Married | Unmarried |
| Less than High School | 15 (51.7%) | 14 (48.3%) |
| High School Diploma | 29 (100.0%) | 0 (0.0%) |
| College or Associate's Degree | 0 (0.0%) | 0 (0.0%) |
| Bachelor's Degree | 0 (0.0%) | 0 (0.0%) |
| Graduate Degree | 0 (0.0%) | 0 (0.0%) |
| Total | 44 (75.9%) | 14 (24.1%) |
Employment Characteristics in Brownfield
Employment by Class of Employer in Brownfield
Among the 3,724 employed individuals in Brownfield, private company employees (2,873 | 77.1%), not-for-profit organizations (301 | 8.1%), and local government employees (226 | 6.1%) make up the most common classes of employment.
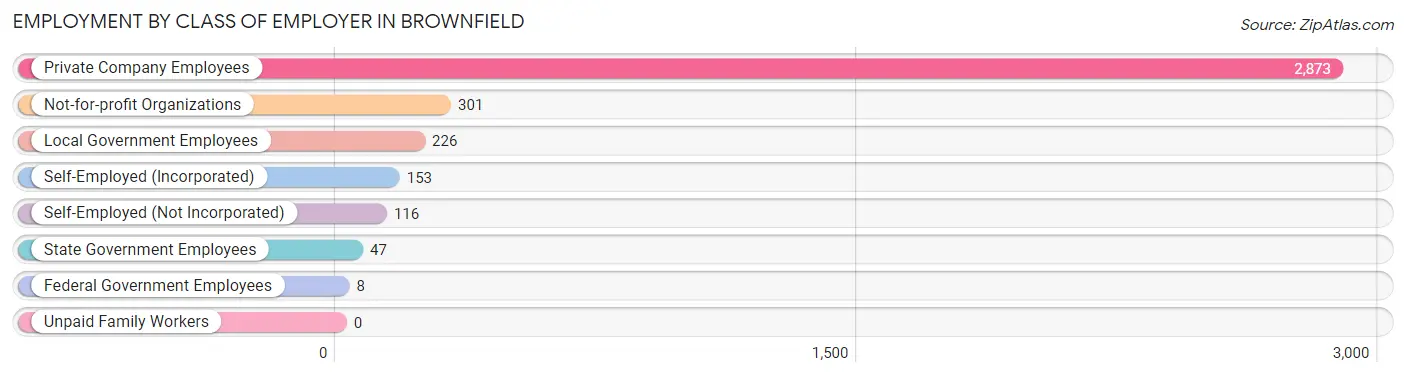
| Employer Class | # Employees | % Employees |
| Private Company Employees | 2,873 | 77.1% |
| Self-Employed (Incorporated) | 153 | 4.1% |
| Self-Employed (Not Incorporated) | 116 | 3.1% |
| Not-for-profit Organizations | 301 | 8.1% |
| Local Government Employees | 226 | 6.1% |
| State Government Employees | 47 | 1.3% |
| Federal Government Employees | 8 | 0.2% |
| Unpaid Family Workers | 0 | 0.0% |
| Total | 3,724 | 100.0% |
Employment Status by Age in Brownfield
According to the labor force statistics for Brownfield, out of the total population over 16 years of age (6,846), 57.9% or 3,964 individuals are in the labor force, with 5.8% or 230 of them unemployed. The age group with the highest labor force participation rate is 25 to 29 years, with 85.8% or 502 individuals in the labor force. Within the labor force, the 16 to 19 years age range has the highest percentage of unemployed individuals, with 21.3% or 54 of them being unemployed.
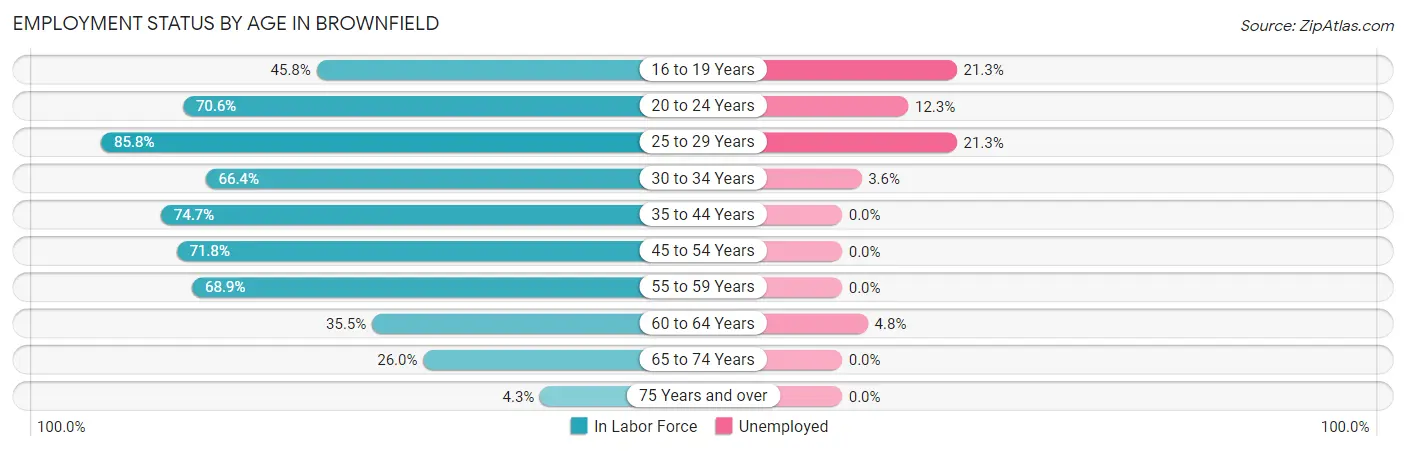
| Age Bracket | In Labor Force | Unemployed |
| 16 to 19 Years | 254 (45.8%) | 54 (21.3%) |
| 20 to 24 Years | 416 (70.6%) | 51 (12.3%) |
| 25 to 29 Years | 502 (85.8%) | 107 (21.3%) |
| 30 to 34 Years | 365 (66.4%) | 13 (3.6%) |
| 35 to 44 Years | 943 (74.7%) | 0 (0.0%) |
| 45 to 54 Years | 672 (71.8%) | 0 (0.0%) |
| 55 to 59 Years | 488 (68.9%) | 0 (0.0%) |
| 60 to 64 Years | 104 (35.5%) | 5 (4.8%) |
| 65 to 74 Years | 193 (26.0%) | 0 (0.0%) |
| 75 Years and over | 27 (4.3%) | 0 (0.0%) |
| Total | 3,964 (57.9%) | 230 (5.8%) |
Employment Status by Educational Attainment in Brownfield
According to labor force statistics for Brownfield, 70.9% of individuals (3,074) out of the total population between 25 and 64 years of age (4,335) are in the labor force, with 4.1% or 126 of them being unemployed. The group with the highest labor force participation rate are those with the educational attainment of college / associate degree, with 74.9% or 1,046 individuals in the labor force. Within the labor force, individuals with high school diploma education have the highest percentage of unemployment, with 10.1% or 120 of them being unemployed.
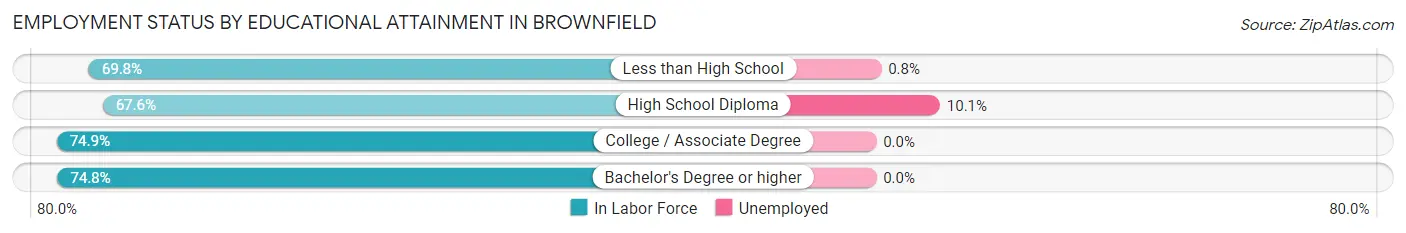
| Educational Attainment | In Labor Force | Unemployed |
| Less than High School | 600 (69.8%) | 7 (0.8%) |
| High School Diploma | 1,187 (67.6%) | 177 (10.1%) |
| College / Associate Degree | 1,046 (74.9%) | 0 (0.0%) |
| Bachelor's Degree or higher | 241 (74.8%) | 0 (0.0%) |
| Total | 3,074 (70.9%) | 178 (4.1%) |
Employment Occupations by Sex in Brownfield
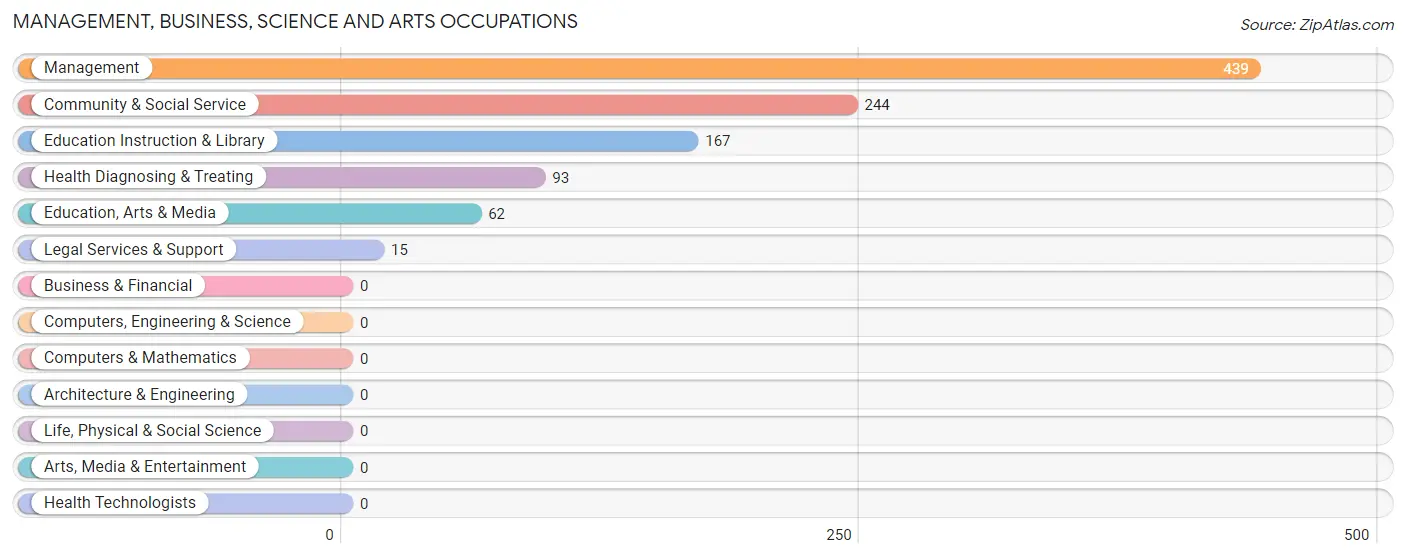
Management, Business, Science and Arts Occupations
The most common Management, Business, Science and Arts occupations in Brownfield are Management (439 | 11.7%), Community & Social Service (244 | 6.5%), Education Instruction & Library (167 | 4.5%), Health Diagnosing & Treating (93 | 2.5%), and Education, Arts & Media (62 | 1.7%).
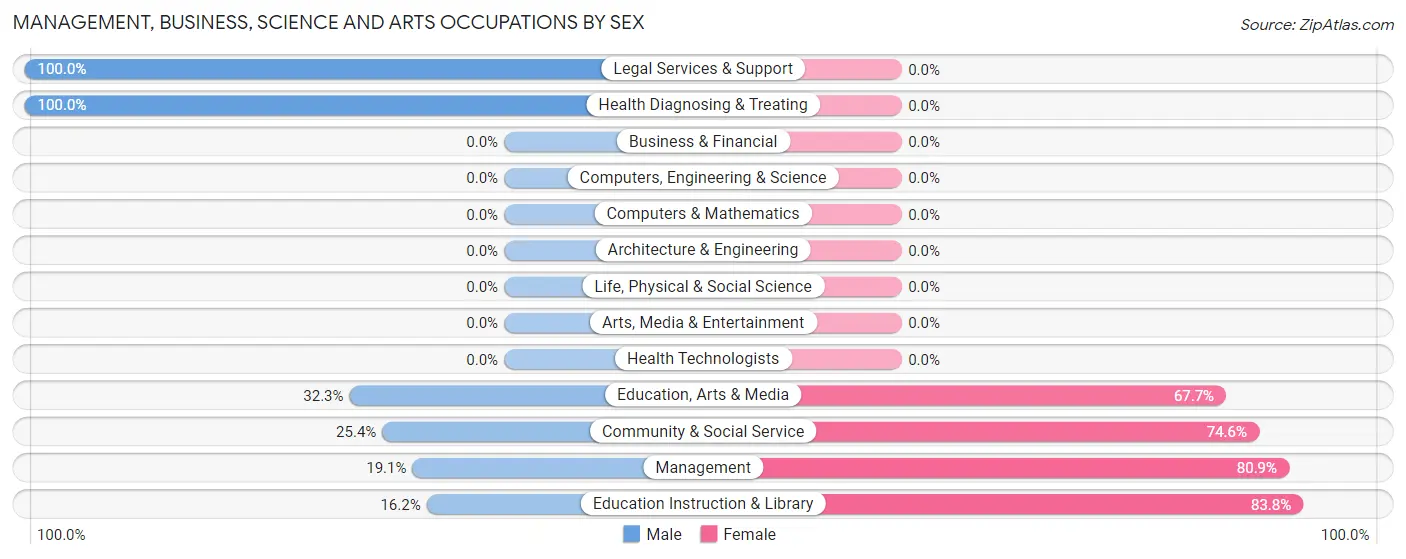
Management, Business, Science and Arts Occupations by Sex
Within the Management, Business, Science and Arts occupations in Brownfield, the most male-oriented occupations are Legal Services & Support (100.0%), Health Diagnosing & Treating (100.0%), and Education, Arts & Media (32.3%), while the most female-oriented occupations are Education Instruction & Library (83.8%), Management (80.9%), and Community & Social Service (74.6%).
| Occupation | Male | Female |
| Management | 84 (19.1%) | 355 (80.9%) |
| Business & Financial | 0 (0.0%) | 0 (0.0%) |
| Computers, Engineering & Science | 0 (0.0%) | 0 (0.0%) |
| Computers & Mathematics | 0 (0.0%) | 0 (0.0%) |
| Architecture & Engineering | 0 (0.0%) | 0 (0.0%) |
| Life, Physical & Social Science | 0 (0.0%) | 0 (0.0%) |
| Community & Social Service | 62 (25.4%) | 182 (74.6%) |
| Education, Arts & Media | 20 (32.3%) | 42 (67.7%) |
| Legal Services & Support | 15 (100.0%) | 0 (0.0%) |
| Education Instruction & Library | 27 (16.2%) | 140 (83.8%) |
| Arts, Media & Entertainment | 0 (0.0%) | 0 (0.0%) |
| Health Diagnosing & Treating | 93 (100.0%) | 0 (0.0%) |
| Health Technologists | 0 (0.0%) | 0 (0.0%) |
| Total (Category) | 239 (30.8%) | 537 (69.2%) |
| Total (Overall) | 1,954 (52.3%) | 1,781 (47.7%) |
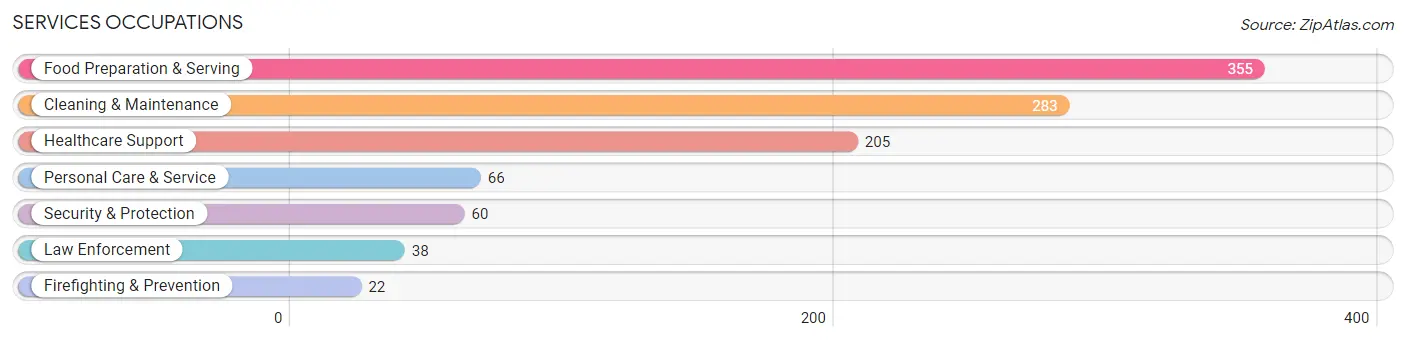
Services Occupations
The most common Services occupations in Brownfield are Food Preparation & Serving (355 | 9.5%), Cleaning & Maintenance (283 | 7.6%), Healthcare Support (205 | 5.5%), Personal Care & Service (66 | 1.8%), and Security & Protection (60 | 1.6%).
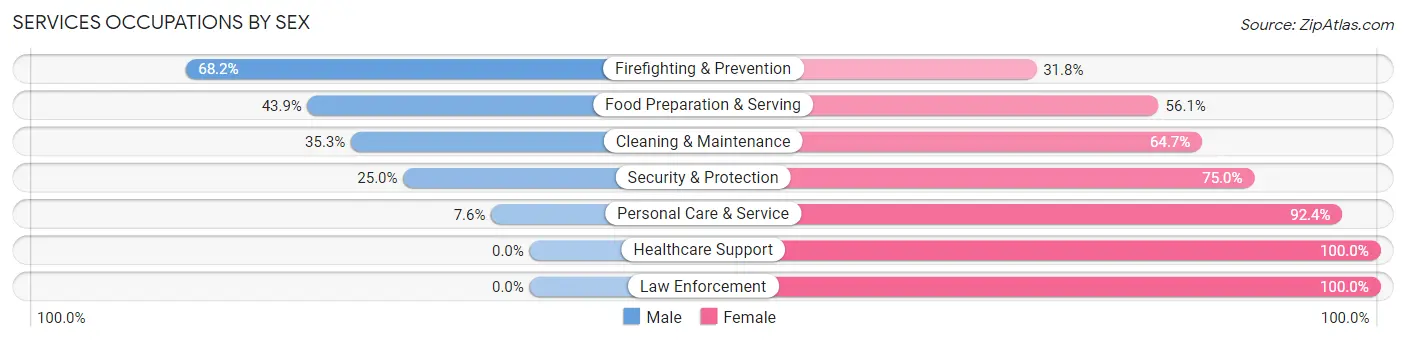
Services Occupations by Sex
Within the Services occupations in Brownfield, the most male-oriented occupations are Firefighting & Prevention (68.2%), Food Preparation & Serving (43.9%), and Cleaning & Maintenance (35.3%), while the most female-oriented occupations are Healthcare Support (100.0%), Law Enforcement (100.0%), and Personal Care & Service (92.4%).
| Occupation | Male | Female |
| Healthcare Support | 0 (0.0%) | 205 (100.0%) |
| Security & Protection | 15 (25.0%) | 45 (75.0%) |
| Firefighting & Prevention | 15 (68.2%) | 7 (31.8%) |
| Law Enforcement | 0 (0.0%) | 38 (100.0%) |
| Food Preparation & Serving | 156 (43.9%) | 199 (56.1%) |
| Cleaning & Maintenance | 100 (35.3%) | 183 (64.7%) |
| Personal Care & Service | 5 (7.6%) | 61 (92.4%) |
| Total (Category) | 276 (28.5%) | 693 (71.5%) |
| Total (Overall) | 1,954 (52.3%) | 1,781 (47.7%) |
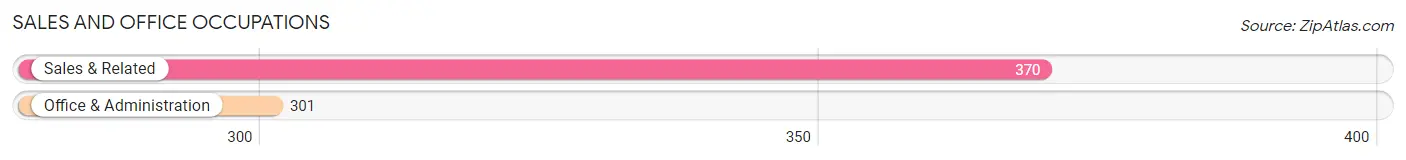
Sales and Office Occupations
The most common Sales and Office occupations in Brownfield are Sales & Related (370 | 9.9%), and Office & Administration (301 | 8.1%).
Sales and Office Occupations by Sex
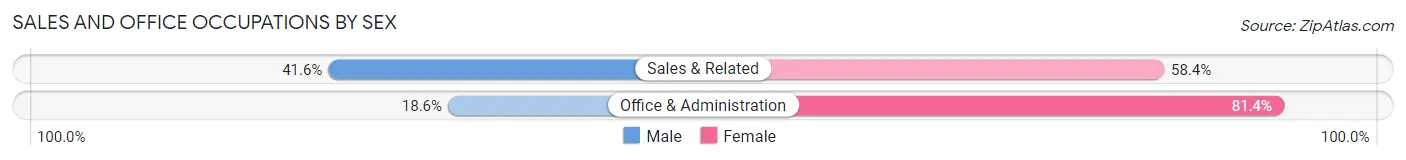
| Occupation | Male | Female |
| Sales & Related | 154 (41.6%) | 216 (58.4%) |
| Office & Administration | 56 (18.6%) | 245 (81.4%) |
| Total (Category) | 210 (31.3%) | 461 (68.7%) |
| Total (Overall) | 1,954 (52.3%) | 1,781 (47.7%) |
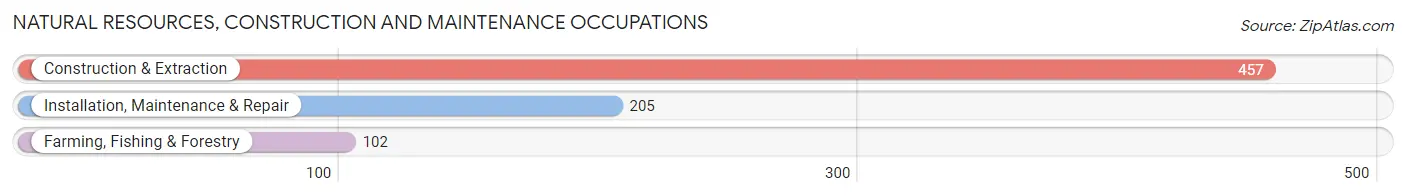
Natural Resources, Construction and Maintenance Occupations
The most common Natural Resources, Construction and Maintenance occupations in Brownfield are Construction & Extraction (457 | 12.2%), Installation, Maintenance & Repair (205 | 5.5%), and Farming, Fishing & Forestry (102 | 2.7%).
Natural Resources, Construction and Maintenance Occupations by Sex
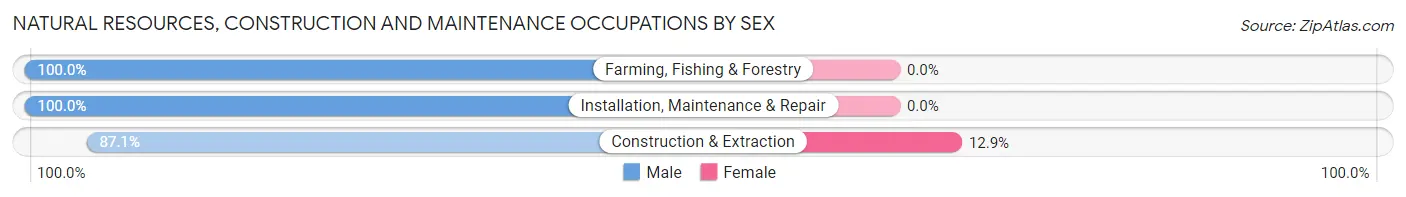
| Occupation | Male | Female |
| Farming, Fishing & Forestry | 102 (100.0%) | 0 (0.0%) |
| Construction & Extraction | 398 (87.1%) | 59 (12.9%) |
| Installation, Maintenance & Repair | 205 (100.0%) | 0 (0.0%) |
| Total (Category) | 705 (92.3%) | 59 (7.7%) |
| Total (Overall) | 1,954 (52.3%) | 1,781 (47.7%) |
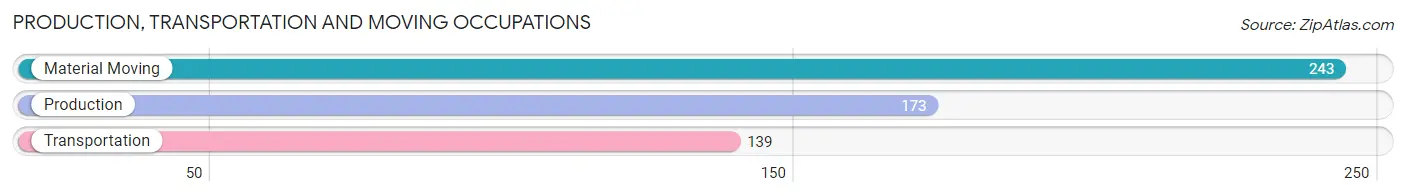
Production, Transportation and Moving Occupations
The most common Production, Transportation and Moving occupations in Brownfield are Material Moving (243 | 6.5%), Production (173 | 4.6%), and Transportation (139 | 3.7%).
Production, Transportation and Moving Occupations by Sex
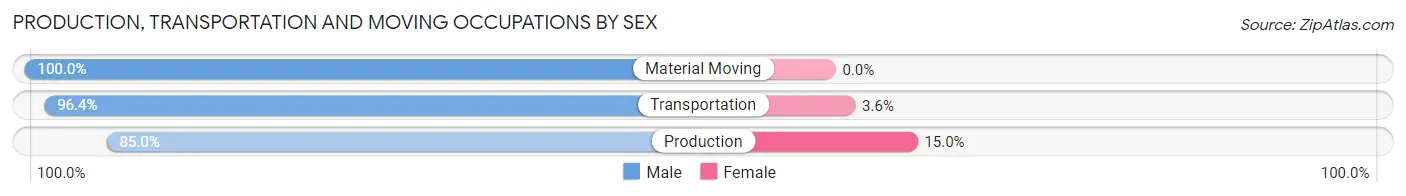
| Occupation | Male | Female |
| Production | 147 (85.0%) | 26 (15.0%) |
| Transportation | 134 (96.4%) | 5 (3.6%) |
| Material Moving | 243 (100.0%) | 0 (0.0%) |
| Total (Category) | 524 (94.4%) | 31 (5.6%) |
| Total (Overall) | 1,954 (52.3%) | 1,781 (47.7%) |
Employment Industries by Sex in Brownfield
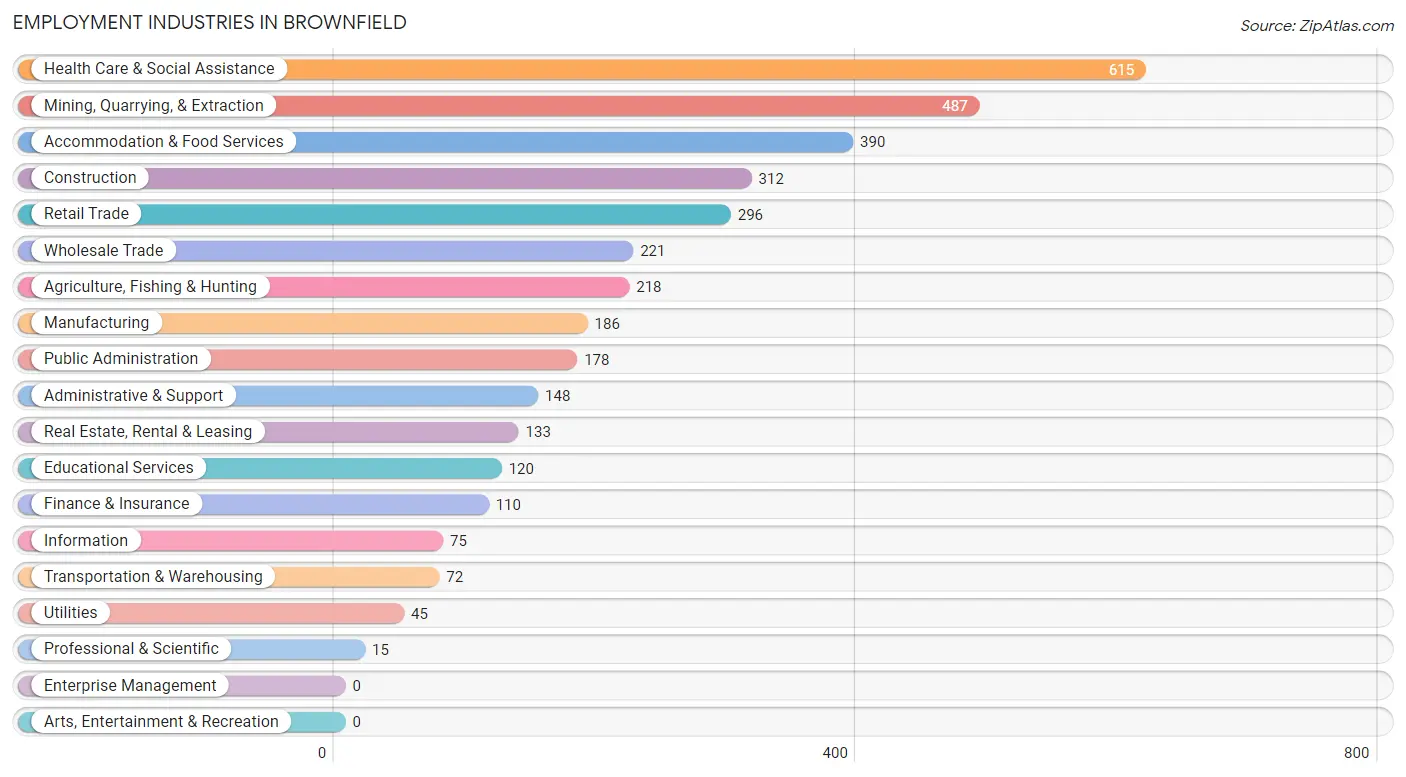
Employment Industries in Brownfield
The major employment industries in Brownfield include Health Care & Social Assistance (615 | 16.5%), Mining, Quarrying, & Extraction (487 | 13.0%), Accommodation & Food Services (390 | 10.4%), Construction (312 | 8.4%), and Retail Trade (296 | 7.9%).
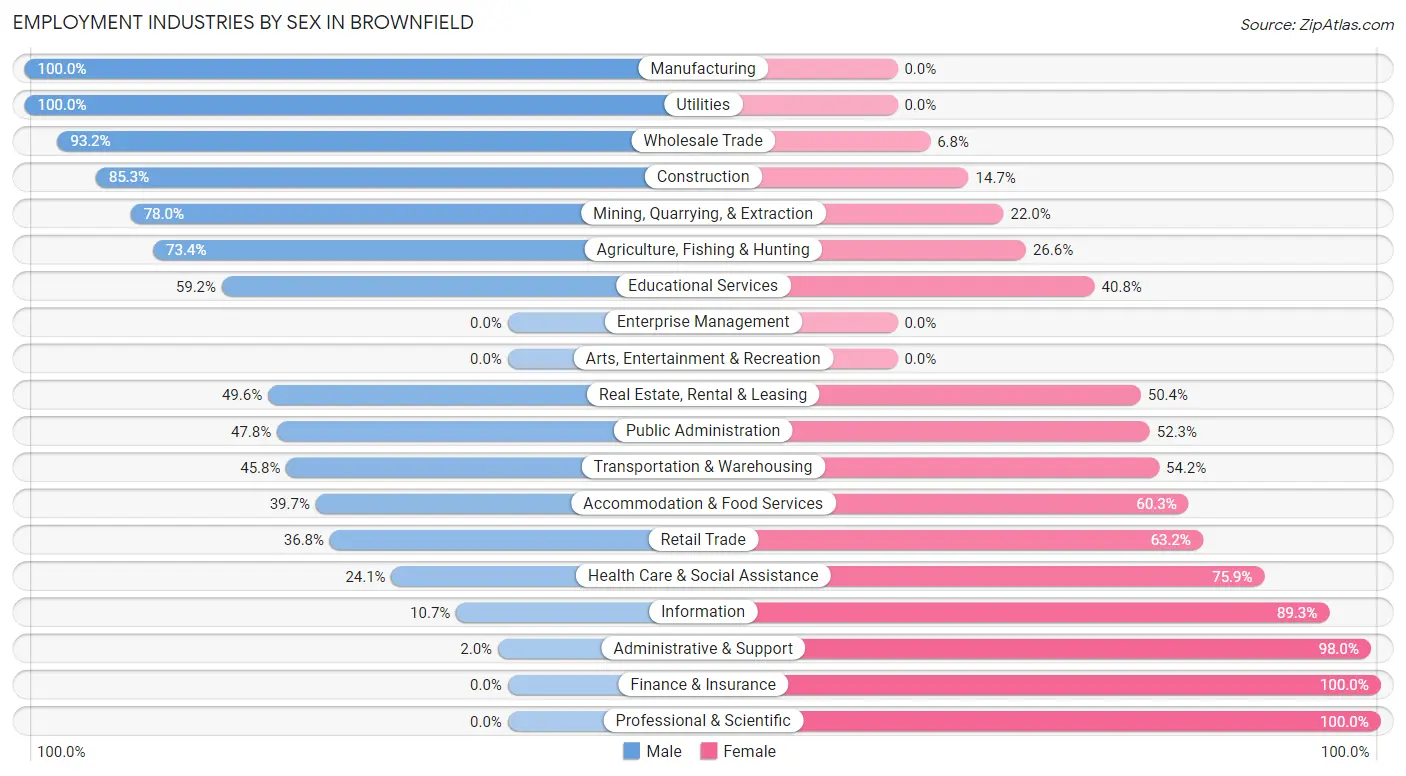
Employment Industries by Sex in Brownfield
The Brownfield industries that see more men than women are Manufacturing (100.0%), Utilities (100.0%), and Wholesale Trade (93.2%), whereas the industries that tend to have a higher number of women are Finance & Insurance (100.0%), Professional & Scientific (100.0%), and Administrative & Support (98.0%).
| Industry | Male | Female |
| Agriculture, Fishing & Hunting | 160 (73.4%) | 58 (26.6%) |
| Mining, Quarrying, & Extraction | 380 (78.0%) | 107 (22.0%) |
| Construction | 266 (85.3%) | 46 (14.7%) |
| Manufacturing | 186 (100.0%) | 0 (0.0%) |
| Wholesale Trade | 206 (93.2%) | 15 (6.8%) |
| Retail Trade | 109 (36.8%) | 187 (63.2%) |
| Transportation & Warehousing | 33 (45.8%) | 39 (54.2%) |
| Utilities | 45 (100.0%) | 0 (0.0%) |
| Information | 8 (10.7%) | 67 (89.3%) |
| Finance & Insurance | 0 (0.0%) | 110 (100.0%) |
| Real Estate, Rental & Leasing | 66 (49.6%) | 67 (50.4%) |
| Professional & Scientific | 0 (0.0%) | 15 (100.0%) |
| Enterprise Management | 0 (0.0%) | 0 (0.0%) |
| Administrative & Support | 3 (2.0%) | 145 (98.0%) |
| Educational Services | 71 (59.2%) | 49 (40.8%) |
| Health Care & Social Assistance | 148 (24.1%) | 467 (75.9%) |
| Arts, Entertainment & Recreation | 0 (0.0%) | 0 (0.0%) |
| Accommodation & Food Services | 155 (39.7%) | 235 (60.3%) |
| Public Administration | 85 (47.7%) | 93 (52.2%) |
| Total | 1,954 (52.3%) | 1,781 (47.7%) |
Education in Brownfield
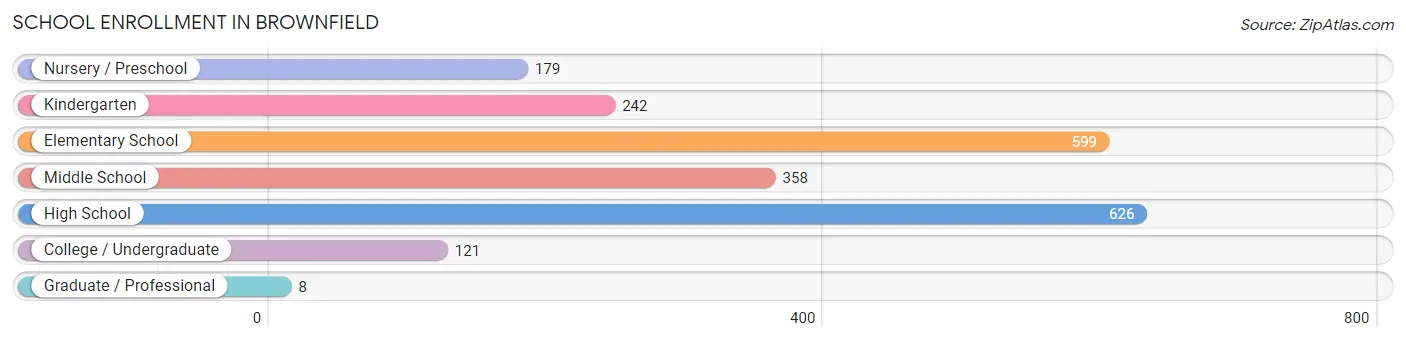
School Enrollment in Brownfield
The most common levels of schooling among the 2,133 students in Brownfield are high school (626 | 29.3%), elementary school (599 | 28.1%), and middle school (358 | 16.8%).
| School Level | # Students | % Students |
| Nursery / Preschool | 179 | 8.4% |
| Kindergarten | 242 | 11.4% |
| Elementary School | 599 | 28.1% |
| Middle School | 358 | 16.8% |
| High School | 626 | 29.3% |
| College / Undergraduate | 121 | 5.7% |
| Graduate / Professional | 8 | 0.4% |
| Total | 2,133 | 100.0% |
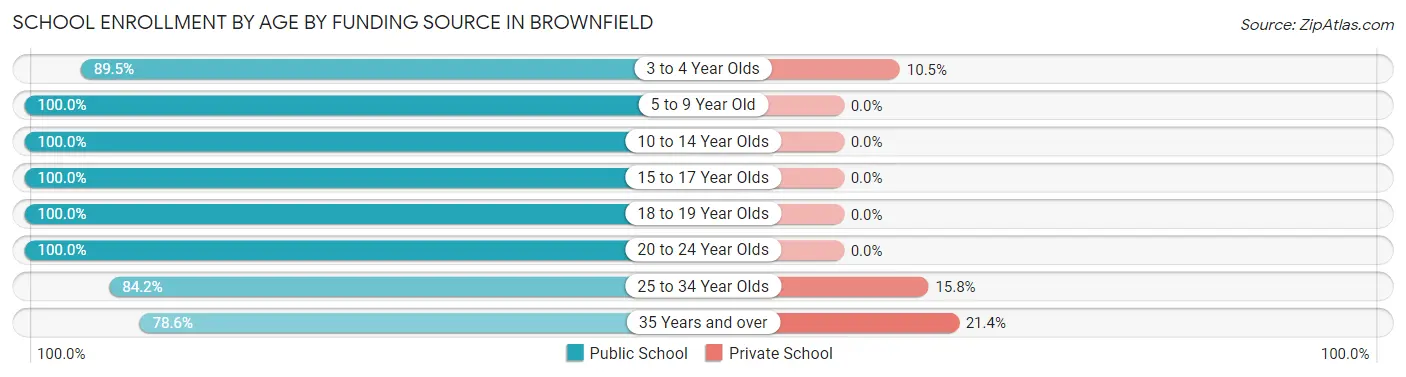
School Enrollment by Age by Funding Source in Brownfield
Out of a total of 2,133 students who are enrolled in schools in Brownfield, 36 (1.7%) attend a private institution, while the remaining 2,097 (98.3%) are enrolled in public schools. The age group of 35 years and over has the highest likelihood of being enrolled in private schools, with 15 (21.4% in the age bracket) enrolled. Conversely, the age group of 5 to 9 year old has the lowest likelihood of being enrolled in a private school, with 749 (100.0% in the age bracket) attending a public institution.
| Age Bracket | Public School | Private School |
| 3 to 4 Year Olds | 154 (89.5%) | 18 (10.5%) |
| 5 to 9 Year Old | 749 (100.0%) | 0 (0.0%) |
| 10 to 14 Year Olds | 554 (100.0%) | 0 (0.0%) |
| 15 to 17 Year Olds | 376 (100.0%) | 0 (0.0%) |
| 18 to 19 Year Olds | 189 (100.0%) | 0 (0.0%) |
| 20 to 24 Year Olds | 4 (100.0%) | 0 (0.0%) |
| 25 to 34 Year Olds | 16 (84.2%) | 3 (15.8%) |
| 35 Years and over | 55 (78.6%) | 15 (21.4%) |
| Total | 2,097 (98.3%) | 36 (1.7%) |
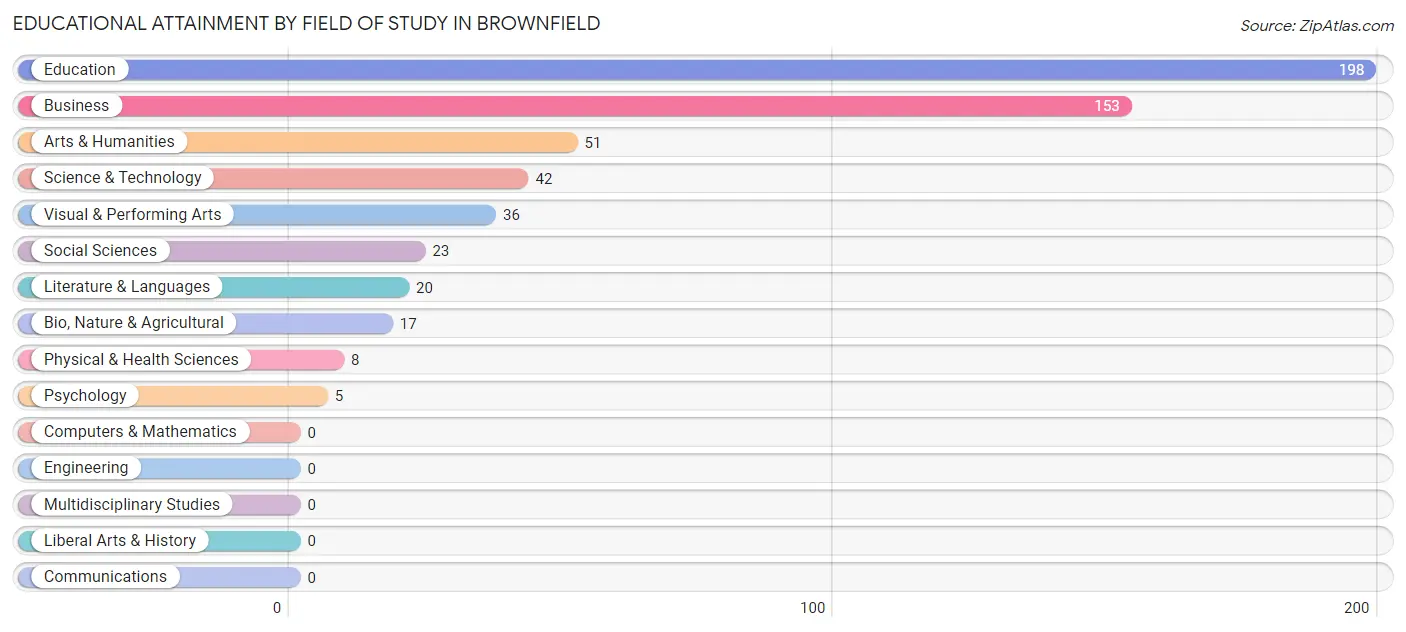
Educational Attainment by Field of Study in Brownfield
Education (198 | 35.8%), business (153 | 27.7%), arts & humanities (51 | 9.2%), science & technology (42 | 7.6%), and visual & performing arts (36 | 6.5%) are the most common fields of study among 553 individuals in Brownfield who have obtained a bachelor's degree or higher.
| Field of Study | # Graduates | % Graduates |
| Computers & Mathematics | 0 | 0.0% |
| Bio, Nature & Agricultural | 17 | 3.1% |
| Physical & Health Sciences | 8 | 1.5% |
| Psychology | 5 | 0.9% |
| Social Sciences | 23 | 4.2% |
| Engineering | 0 | 0.0% |
| Multidisciplinary Studies | 0 | 0.0% |
| Science & Technology | 42 | 7.6% |
| Business | 153 | 27.7% |
| Education | 198 | 35.8% |
| Literature & Languages | 20 | 3.6% |
| Liberal Arts & History | 0 | 0.0% |
| Visual & Performing Arts | 36 | 6.5% |
| Communications | 0 | 0.0% |
| Arts & Humanities | 51 | 9.2% |
| Total | 553 | 100.0% |
Transportation & Commute in Brownfield
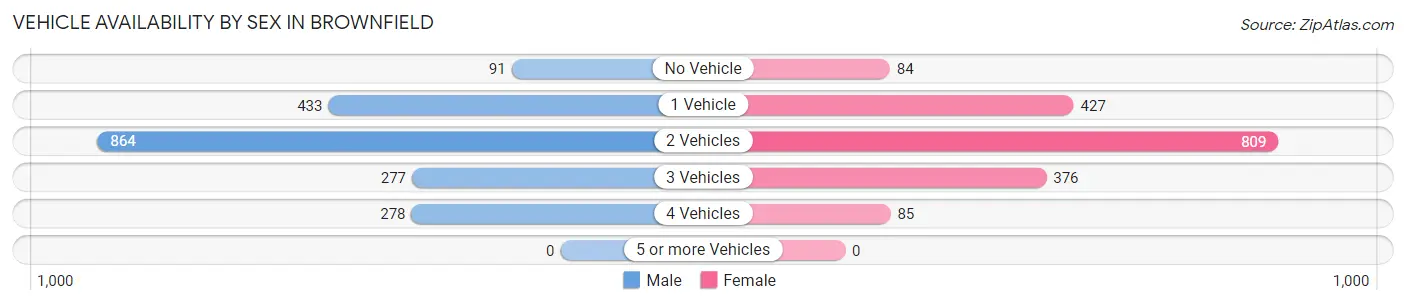
Vehicle Availability by Sex in Brownfield
The most prevalent vehicle ownership categories in Brownfield are males with 2 vehicles (864, accounting for 44.5%) and females with 2 vehicles (809, making up 48.5%).
| Vehicles Available | Male | Female |
| No Vehicle | 91 (4.7%) | 84 (4.7%) |
| 1 Vehicle | 433 (22.3%) | 427 (24.0%) |
| 2 Vehicles | 864 (44.5%) | 809 (45.4%) |
| 3 Vehicles | 277 (14.3%) | 376 (21.1%) |
| 4 Vehicles | 278 (14.3%) | 85 (4.8%) |
| 5 or more Vehicles | 0 (0.0%) | 0 (0.0%) |
| Total | 1,943 (100.0%) | 1,781 (100.0%) |
Commute Time in Brownfield
The most frequently occuring commute durations in Brownfield are 5 to 9 minutes (1,386 commuters, 39.0%), less than 5 minutes (501 commuters, 14.1%), and 15 to 19 minutes (463 commuters, 13.0%).
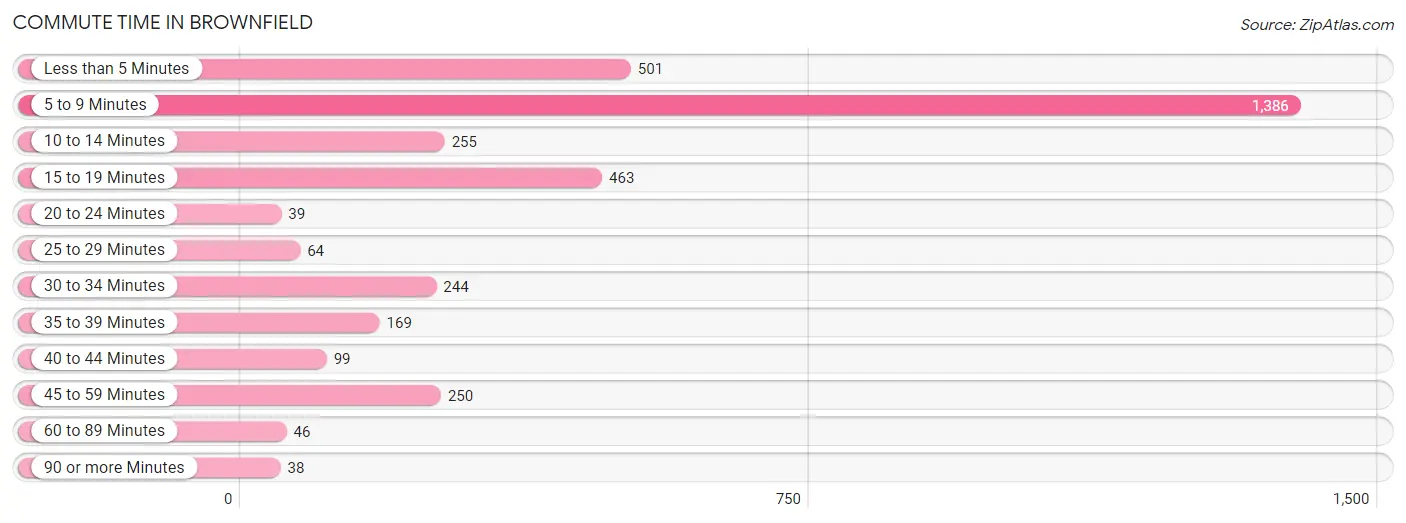
| Commute Time | # Commuters | % Commuters |
| Less than 5 Minutes | 501 | 14.1% |
| 5 to 9 Minutes | 1,386 | 39.0% |
| 10 to 14 Minutes | 255 | 7.2% |
| 15 to 19 Minutes | 463 | 13.0% |
| 20 to 24 Minutes | 39 | 1.1% |
| 25 to 29 Minutes | 64 | 1.8% |
| 30 to 34 Minutes | 244 | 6.9% |
| 35 to 39 Minutes | 169 | 4.8% |
| 40 to 44 Minutes | 99 | 2.8% |
| 45 to 59 Minutes | 250 | 7.0% |
| 60 to 89 Minutes | 46 | 1.3% |
| 90 or more Minutes | 38 | 1.1% |
Commute Time by Sex in Brownfield
The most common commute times in Brownfield are 5 to 9 minutes (628 commuters, 32.3%) for males and 5 to 9 minutes (758 commuters, 47.0%) for females.
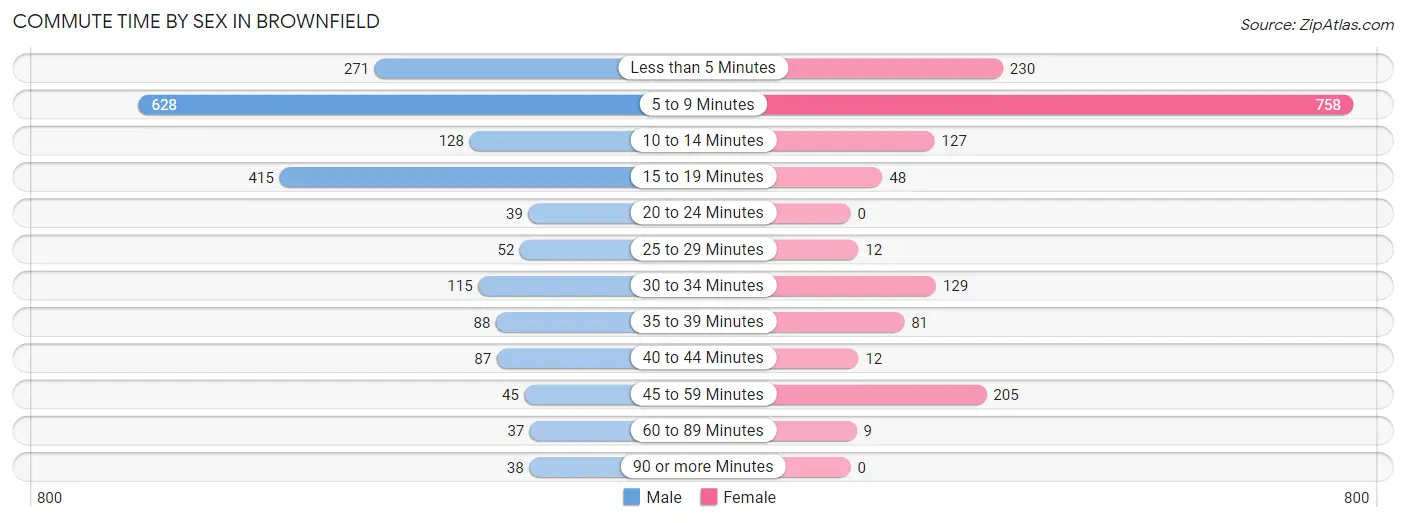
| Commute Time | Male | Female |
| Less than 5 Minutes | 271 (14.0%) | 230 (14.3%) |
| 5 to 9 Minutes | 628 (32.3%) | 758 (47.0%) |
| 10 to 14 Minutes | 128 (6.6%) | 127 (7.9%) |
| 15 to 19 Minutes | 415 (21.4%) | 48 (3.0%) |
| 20 to 24 Minutes | 39 (2.0%) | 0 (0.0%) |
| 25 to 29 Minutes | 52 (2.7%) | 12 (0.7%) |
| 30 to 34 Minutes | 115 (5.9%) | 129 (8.0%) |
| 35 to 39 Minutes | 88 (4.5%) | 81 (5.0%) |
| 40 to 44 Minutes | 87 (4.5%) | 12 (0.7%) |
| 45 to 59 Minutes | 45 (2.3%) | 205 (12.7%) |
| 60 to 89 Minutes | 37 (1.9%) | 9 (0.6%) |
| 90 or more Minutes | 38 (2.0%) | 0 (0.0%) |
Time of Departure to Work by Sex in Brownfield
The most frequent times of departure to work in Brownfield are 6:30 AM to 6:59 AM (543, 28.0%) for males and 8:30 AM to 8:59 AM (296, 18.4%) for females.
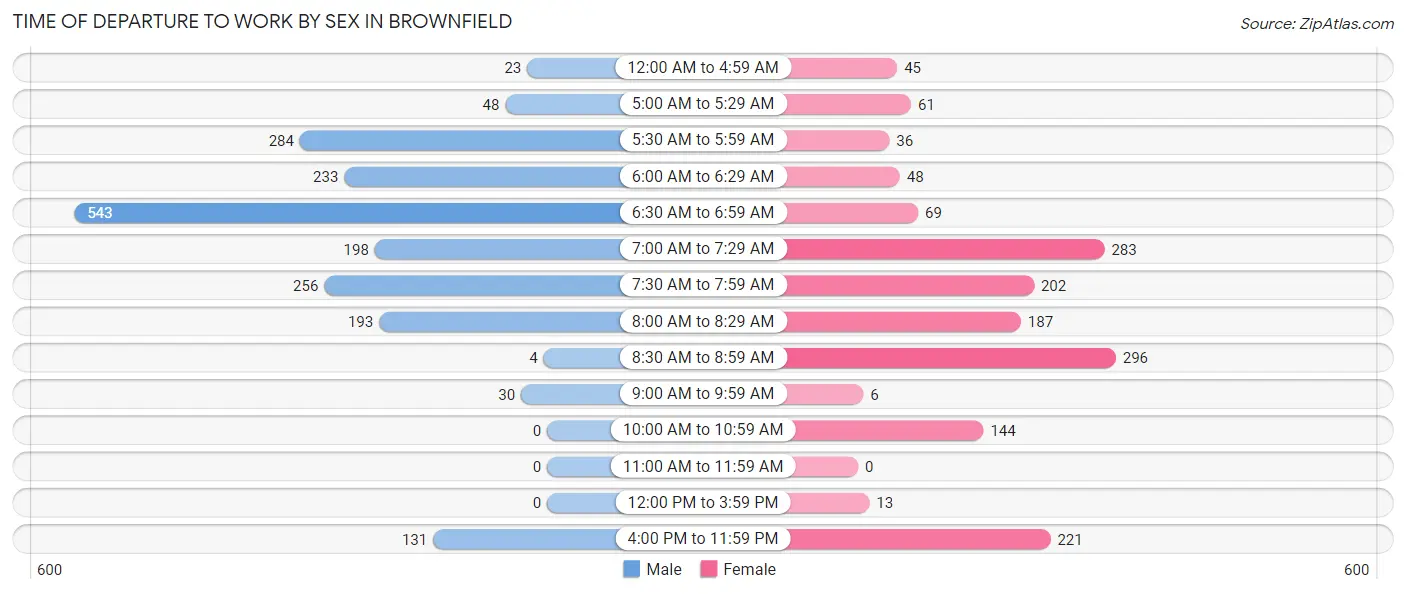
| Time of Departure | Male | Female |
| 12:00 AM to 4:59 AM | 23 (1.2%) | 45 (2.8%) |
| 5:00 AM to 5:29 AM | 48 (2.5%) | 61 (3.8%) |
| 5:30 AM to 5:59 AM | 284 (14.6%) | 36 (2.2%) |
| 6:00 AM to 6:29 AM | 233 (12.0%) | 48 (3.0%) |
| 6:30 AM to 6:59 AM | 543 (28.0%) | 69 (4.3%) |
| 7:00 AM to 7:29 AM | 198 (10.2%) | 283 (17.6%) |
| 7:30 AM to 7:59 AM | 256 (13.2%) | 202 (12.5%) |
| 8:00 AM to 8:29 AM | 193 (9.9%) | 187 (11.6%) |
| 8:30 AM to 8:59 AM | 4 (0.2%) | 296 (18.4%) |
| 9:00 AM to 9:59 AM | 30 (1.5%) | 6 (0.4%) |
| 10:00 AM to 10:59 AM | 0 (0.0%) | 144 (8.9%) |
| 11:00 AM to 11:59 AM | 0 (0.0%) | 0 (0.0%) |
| 12:00 PM to 3:59 PM | 0 (0.0%) | 13 (0.8%) |
| 4:00 PM to 11:59 PM | 131 (6.7%) | 221 (13.7%) |
| Total | 1,943 (100.0%) | 1,611 (100.0%) |
Housing Occupancy in Brownfield
Occupancy by Ownership in Brownfield
Of the total 3,352 dwellings in Brownfield, owner-occupied units account for 2,163 (64.5%), while renter-occupied units make up 1,189 (35.5%).
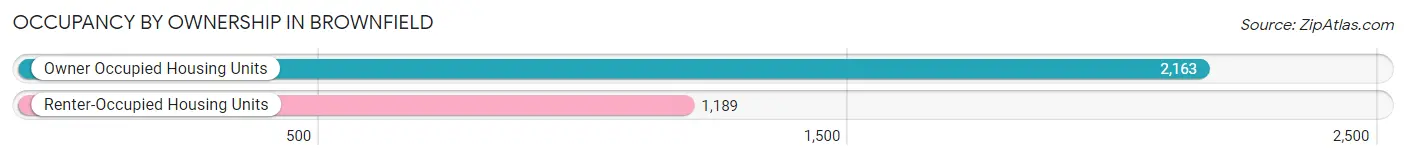
| Occupancy | # Housing Units | % Housing Units |
| Owner Occupied Housing Units | 2,163 | 64.5% |
| Renter-Occupied Housing Units | 1,189 | 35.5% |
| Total Occupied Housing Units | 3,352 | 100.0% |
Occupancy by Household Size in Brownfield
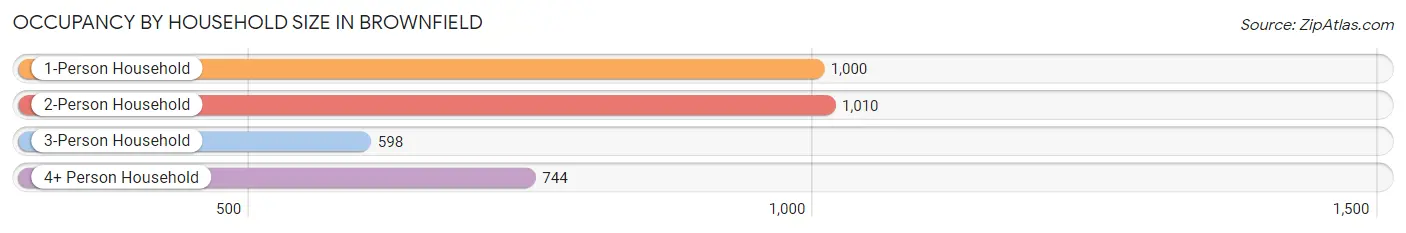
| Household Size | # Housing Units | % Housing Units |
| 1-Person Household | 1,000 | 29.8% |
| 2-Person Household | 1,010 | 30.1% |
| 3-Person Household | 598 | 17.8% |
| 4+ Person Household | 744 | 22.2% |
| Total Housing Units | 3,352 | 100.0% |
Occupancy by Ownership by Household Size in Brownfield
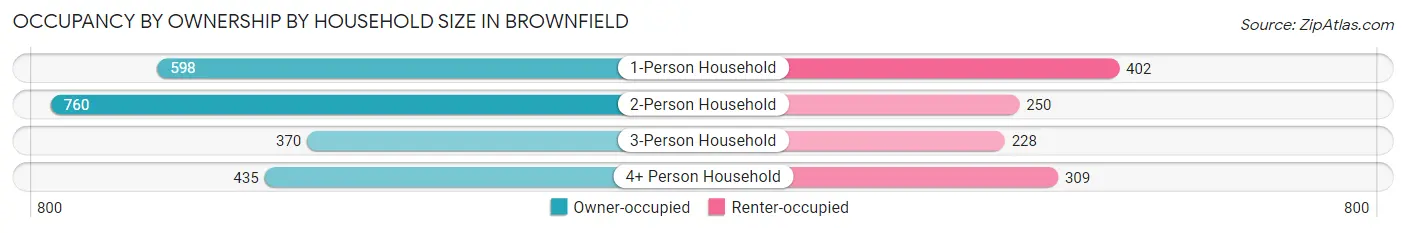
| Household Size | Owner-occupied | Renter-occupied |
| 1-Person Household | 598 (59.8%) | 402 (40.2%) |
| 2-Person Household | 760 (75.2%) | 250 (24.7%) |
| 3-Person Household | 370 (61.9%) | 228 (38.1%) |
| 4+ Person Household | 435 (58.5%) | 309 (41.5%) |
| Total Housing Units | 2,163 (64.5%) | 1,189 (35.5%) |
Occupancy by Educational Attainment in Brownfield
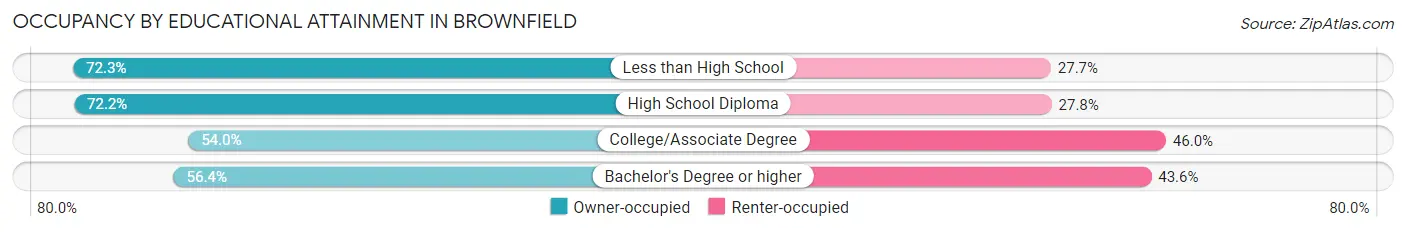
| Household Size | Owner-occupied | Renter-occupied |
| Less than High School | 540 (72.3%) | 207 (27.7%) |
| High School Diploma | 835 (72.2%) | 322 (27.8%) |
| College/Associate Degree | 655 (54.0%) | 557 (46.0%) |
| Bachelor's Degree or higher | 133 (56.4%) | 103 (43.6%) |
Occupancy by Age of Householder in Brownfield
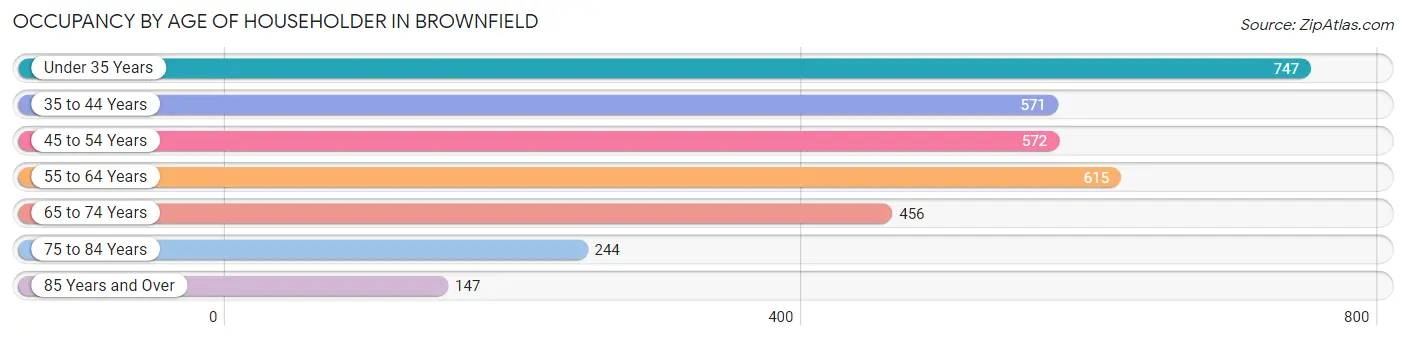
| Age Bracket | # Households | % Households |
| Under 35 Years | 747 | 22.3% |
| 35 to 44 Years | 571 | 17.0% |
| 45 to 54 Years | 572 | 17.1% |
| 55 to 64 Years | 615 | 18.3% |
| 65 to 74 Years | 456 | 13.6% |
| 75 to 84 Years | 244 | 7.3% |
| 85 Years and Over | 147 | 4.4% |
| Total | 3,352 | 100.0% |
Housing Finances in Brownfield
Median Income by Occupancy in Brownfield
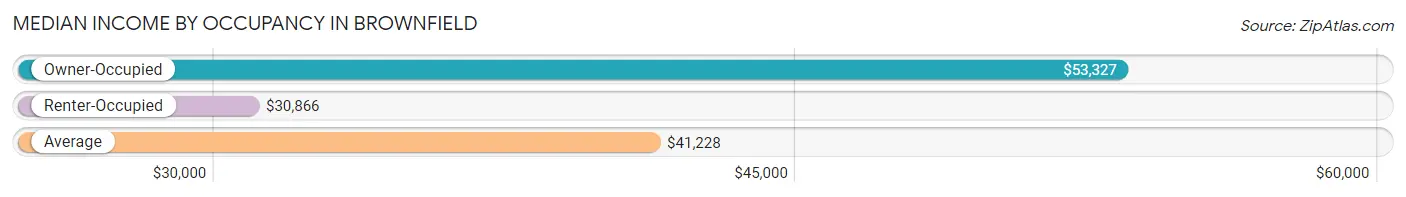
| Occupancy Type | # Households | Median Income |
| Owner-Occupied | 2,163 (64.5%) | $53,327 |
| Renter-Occupied | 1,189 (35.5%) | $30,866 |
| Average | 3,352 (100.0%) | $41,228 |
Occupancy by Householder Income Bracket in Brownfield
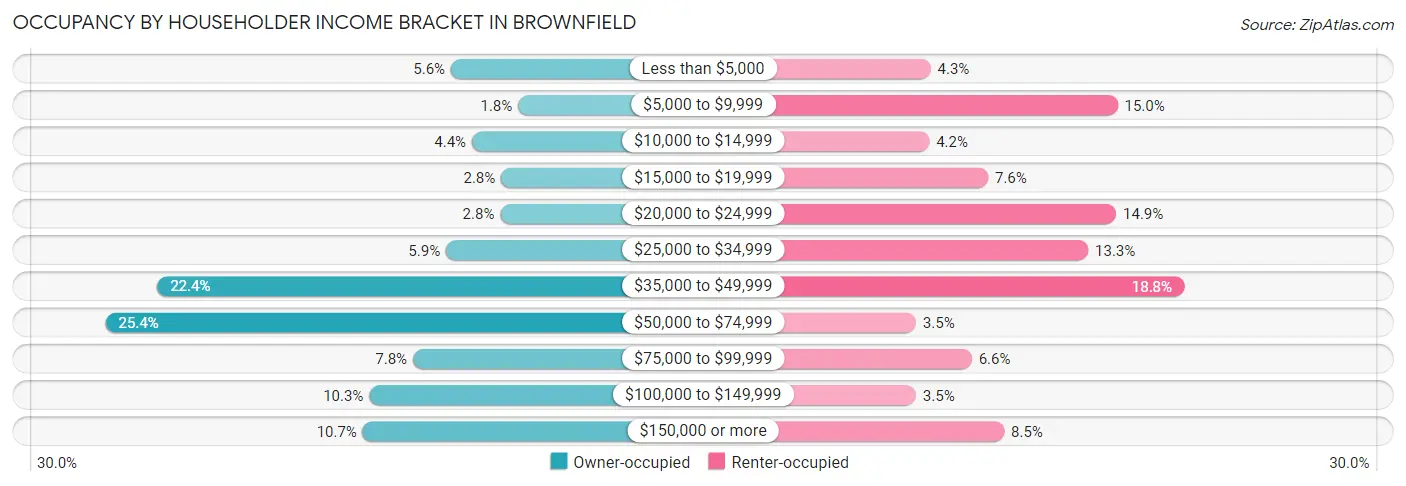
| Income Bracket | Owner-occupied | Renter-occupied |
| Less than $5,000 | 122 (5.6%) | 51 (4.3%) |
| $5,000 to $9,999 | 39 (1.8%) | 178 (15.0%) |
| $10,000 to $14,999 | 96 (4.4%) | 50 (4.2%) |
| $15,000 to $19,999 | 60 (2.8%) | 90 (7.6%) |
| $20,000 to $24,999 | 61 (2.8%) | 177 (14.9%) |
| $25,000 to $34,999 | 128 (5.9%) | 158 (13.3%) |
| $35,000 to $49,999 | 485 (22.4%) | 223 (18.8%) |
| $50,000 to $74,999 | 549 (25.4%) | 41 (3.5%) |
| $75,000 to $99,999 | 169 (7.8%) | 79 (6.6%) |
| $100,000 to $149,999 | 223 (10.3%) | 41 (3.5%) |
| $150,000 or more | 231 (10.7%) | 101 (8.5%) |
| Total | 2,163 (100.0%) | 1,189 (100.0%) |
Monthly Housing Cost Tiers in Brownfield
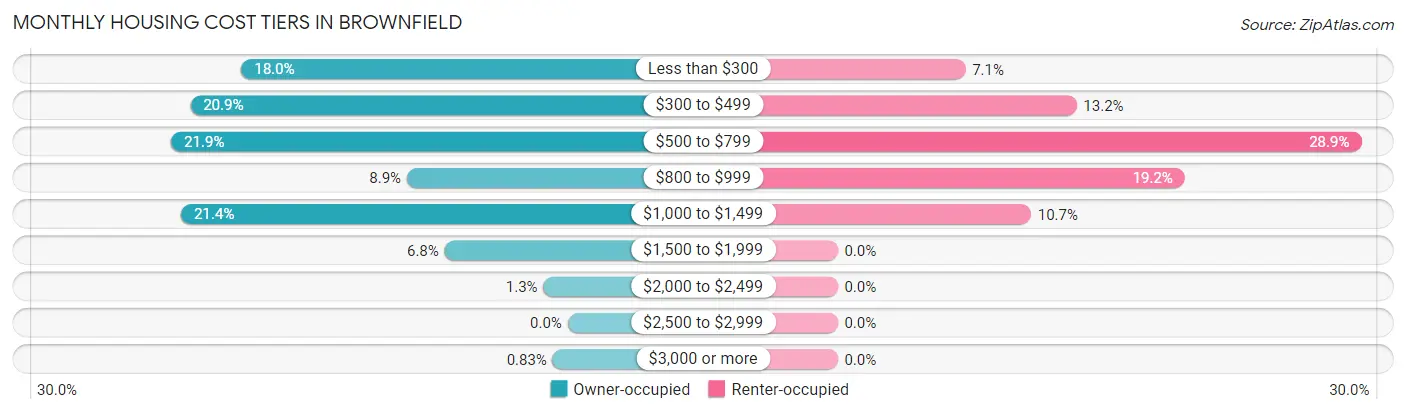
| Monthly Cost | Owner-occupied | Renter-occupied |
| Less than $300 | 390 (18.0%) | 84 (7.1%) |
| $300 to $499 | 451 (20.8%) | 157 (13.2%) |
| $500 to $799 | 474 (21.9%) | 344 (28.9%) |
| $800 to $999 | 192 (8.9%) | 228 (19.2%) |
| $1,000 to $1,499 | 462 (21.4%) | 127 (10.7%) |
| $1,500 to $1,999 | 147 (6.8%) | 0 (0.0%) |
| $2,000 to $2,499 | 29 (1.3%) | 0 (0.0%) |
| $2,500 to $2,999 | 0 (0.0%) | 0 (0.0%) |
| $3,000 or more | 18 (0.8%) | 0 (0.0%) |
| Total | 2,163 (100.0%) | 1,189 (100.0%) |
Physical Housing Characteristics in Brownfield
Housing Structures in Brownfield
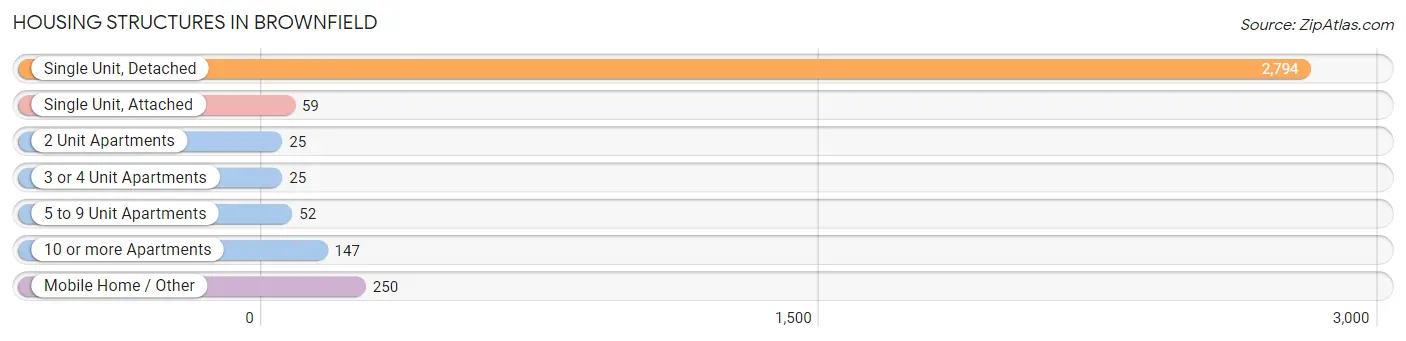
| Structure Type | # Housing Units | % Housing Units |
| Single Unit, Detached | 2,794 | 83.4% |
| Single Unit, Attached | 59 | 1.8% |
| 2 Unit Apartments | 25 | 0.7% |
| 3 or 4 Unit Apartments | 25 | 0.7% |
| 5 to 9 Unit Apartments | 52 | 1.5% |
| 10 or more Apartments | 147 | 4.4% |
| Mobile Home / Other | 250 | 7.5% |
| Total | 3,352 | 100.0% |
Housing Structures by Occupancy in Brownfield
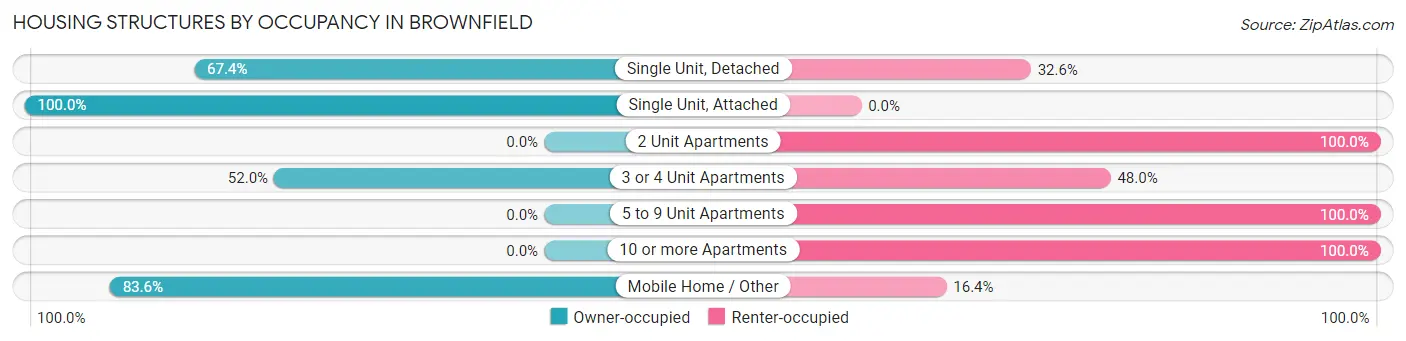
| Structure Type | Owner-occupied | Renter-occupied |
| Single Unit, Detached | 1,882 (67.4%) | 912 (32.6%) |
| Single Unit, Attached | 59 (100.0%) | 0 (0.0%) |
| 2 Unit Apartments | 0 (0.0%) | 25 (100.0%) |
| 3 or 4 Unit Apartments | 13 (52.0%) | 12 (48.0%) |
| 5 to 9 Unit Apartments | 0 (0.0%) | 52 (100.0%) |
| 10 or more Apartments | 0 (0.0%) | 147 (100.0%) |
| Mobile Home / Other | 209 (83.6%) | 41 (16.4%) |
| Total | 2,163 (64.5%) | 1,189 (35.5%) |
Housing Structures by Number of Rooms in Brownfield
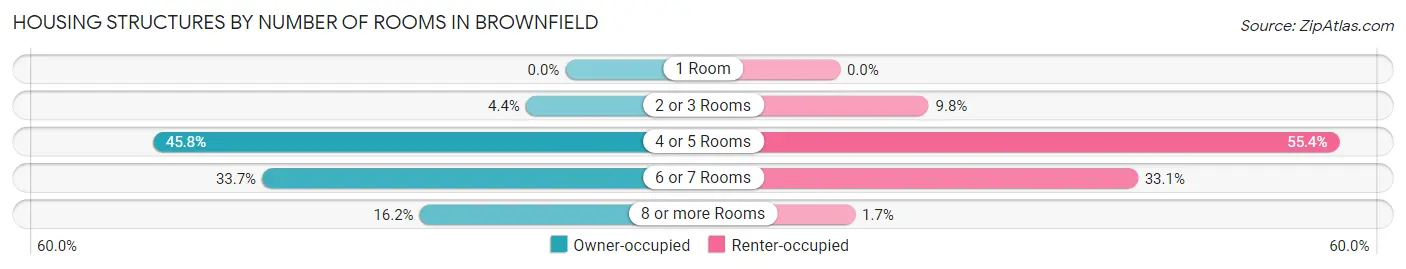
| Number of Rooms | Owner-occupied | Renter-occupied |
| 1 Room | 0 (0.0%) | 0 (0.0%) |
| 2 or 3 Rooms | 95 (4.4%) | 117 (9.8%) |
| 4 or 5 Rooms | 990 (45.8%) | 659 (55.4%) |
| 6 or 7 Rooms | 728 (33.7%) | 393 (33.1%) |
| 8 or more Rooms | 350 (16.2%) | 20 (1.7%) |
| Total | 2,163 (100.0%) | 1,189 (100.0%) |
Housing Structure by Heating Type in Brownfield
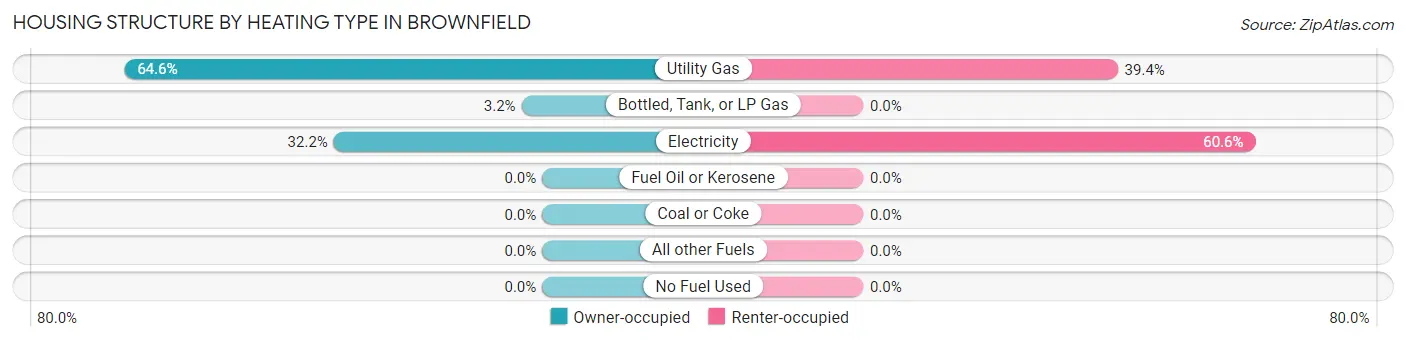
| Heating Type | Owner-occupied | Renter-occupied |
| Utility Gas | 1,397 (64.6%) | 468 (39.4%) |
| Bottled, Tank, or LP Gas | 69 (3.2%) | 0 (0.0%) |
| Electricity | 697 (32.2%) | 721 (60.6%) |
| Fuel Oil or Kerosene | 0 (0.0%) | 0 (0.0%) |
| Coal or Coke | 0 (0.0%) | 0 (0.0%) |
| All other Fuels | 0 (0.0%) | 0 (0.0%) |
| No Fuel Used | 0 (0.0%) | 0 (0.0%) |
| Total | 2,163 (100.0%) | 1,189 (100.0%) |
Household Vehicle Usage in Brownfield
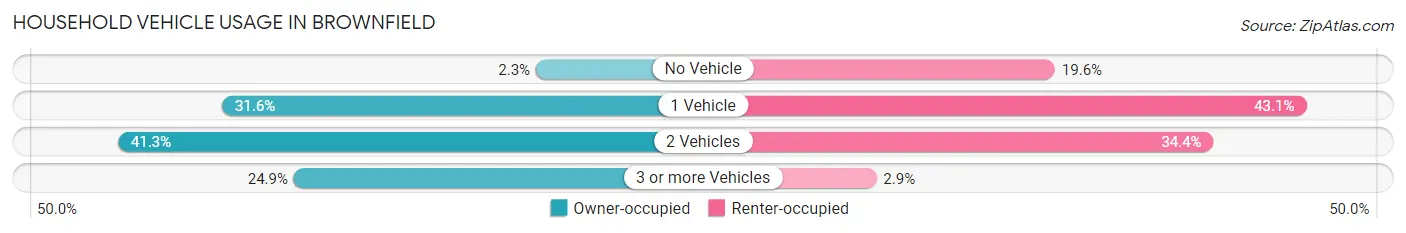
| Vehicles per Household | Owner-occupied | Renter-occupied |
| No Vehicle | 49 (2.3%) | 233 (19.6%) |
| 1 Vehicle | 683 (31.6%) | 512 (43.1%) |
| 2 Vehicles | 893 (41.3%) | 409 (34.4%) |
| 3 or more Vehicles | 538 (24.9%) | 35 (2.9%) |
| Total | 2,163 (100.0%) | 1,189 (100.0%) |
Real Estate & Mortgages in Brownfield
Real Estate and Mortgage Overview in Brownfield
| Characteristic | Without Mortgage | With Mortgage |
| Housing Units | 1,406 | 757 |
| Median Property Value | $84,100 | $119,100 |
| Median Household Income | $52,851 | $155 |
| Monthly Housing Costs | $390 | $0 |
| Real Estate Taxes | $1,036 | $13 |
Property Value by Mortgage Status in Brownfield
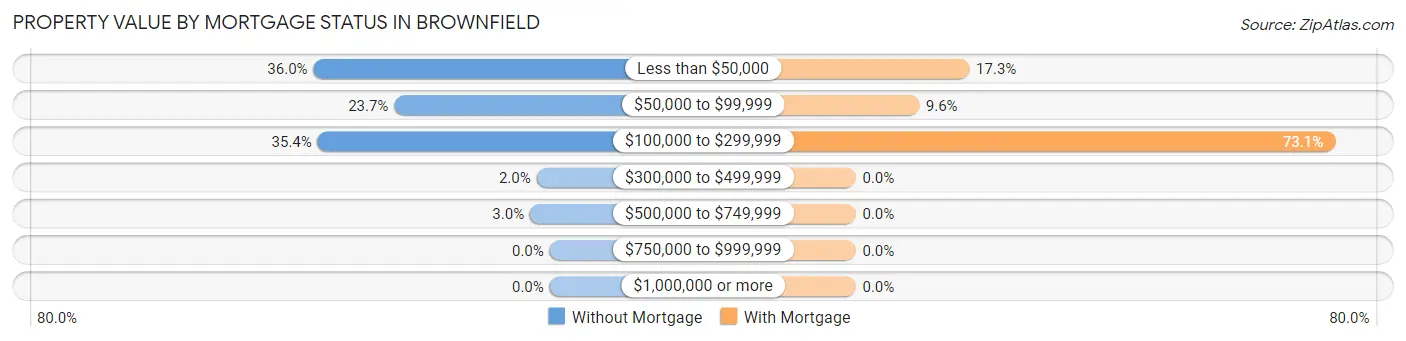
| Property Value | Without Mortgage | With Mortgage |
| Less than $50,000 | 506 (36.0%) | 131 (17.3%) |
| $50,000 to $99,999 | 333 (23.7%) | 73 (9.6%) |
| $100,000 to $299,999 | 497 (35.3%) | 553 (73.1%) |
| $300,000 to $499,999 | 28 (2.0%) | 0 (0.0%) |
| $500,000 to $749,999 | 42 (3.0%) | 0 (0.0%) |
| $750,000 to $999,999 | 0 (0.0%) | 0 (0.0%) |
| $1,000,000 or more | 0 (0.0%) | 0 (0.0%) |
| Total | 1,406 (100.0%) | 757 (100.0%) |
Household Income by Mortgage Status in Brownfield
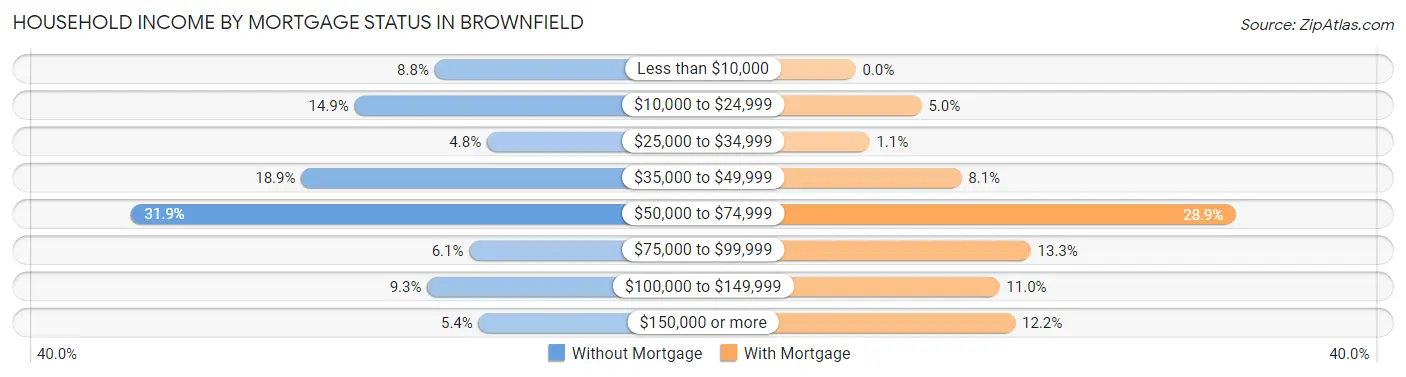
| Household Income | Without Mortgage | With Mortgage |
| Less than $10,000 | 123 (8.7%) | 0 (0.0%) |
| $10,000 to $24,999 | 209 (14.9%) | 38 (5.0%) |
| $25,000 to $34,999 | 67 (4.8%) | 8 (1.1%) |
| $35,000 to $49,999 | 266 (18.9%) | 61 (8.1%) |
| $50,000 to $74,999 | 448 (31.9%) | 219 (28.9%) |
| $75,000 to $99,999 | 86 (6.1%) | 101 (13.3%) |
| $100,000 to $149,999 | 131 (9.3%) | 83 (11.0%) |
| $150,000 or more | 76 (5.4%) | 92 (12.1%) |
| Total | 1,406 (100.0%) | 757 (100.0%) |
Property Value to Household Income Ratio in Brownfield
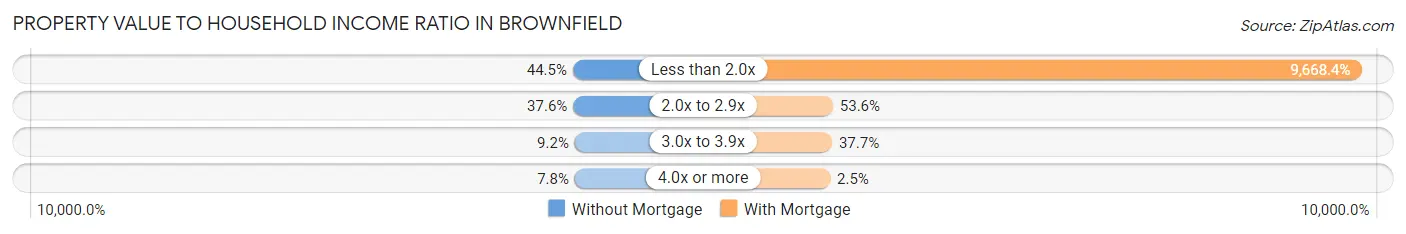
| Value-to-Income Ratio | Without Mortgage | With Mortgage |
| Less than 2.0x | 626 (44.5%) | 73,190 (9,668.4%) |
| 2.0x to 2.9x | 528 (37.6%) | 406 (53.6%) |
| 3.0x to 3.9x | 129 (9.2%) | 285 (37.7%) |
| 4.0x or more | 110 (7.8%) | 19 (2.5%) |
| Total | 1,406 (100.0%) | 757 (100.0%) |
Real Estate Taxes by Mortgage Status in Brownfield
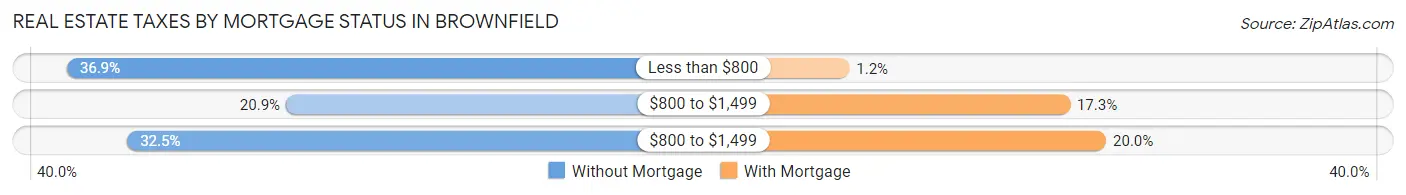
| Property Taxes | Without Mortgage | With Mortgage |
| Less than $800 | 519 (36.9%) | 9 (1.2%) |
| $800 to $1,499 | 294 (20.9%) | 131 (17.3%) |
| $800 to $1,499 | 457 (32.5%) | 151 (20.0%) |
| Total | 1,406 (100.0%) | 757 (100.0%) |
Health & Disability in Brownfield
Health Insurance Coverage by Age in Brownfield
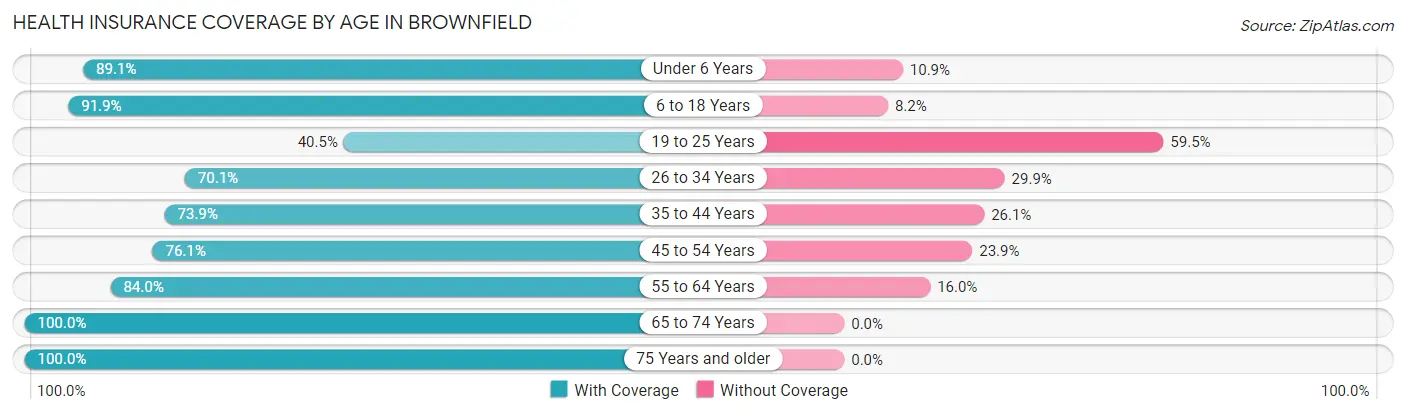
| Age Bracket | With Coverage | Without Coverage |
| Under 6 Years | 710 (89.1%) | 87 (10.9%) |
| 6 to 18 Years | 1,442 (91.8%) | 128 (8.2%) |
| 19 to 25 Years | 311 (40.5%) | 457 (59.5%) |
| 26 to 34 Years | 654 (70.1%) | 279 (29.9%) |
| 35 to 44 Years | 765 (73.9%) | 270 (26.1%) |
| 45 to 54 Years | 638 (76.1%) | 200 (23.9%) |
| 55 to 64 Years | 776 (84.0%) | 148 (16.0%) |
| 65 to 74 Years | 707 (100.0%) | 0 (0.0%) |
| 75 Years and older | 554 (100.0%) | 0 (0.0%) |
| Total | 6,557 (80.7%) | 1,569 (19.3%) |
Health Insurance Coverage by Citizenship Status in Brownfield
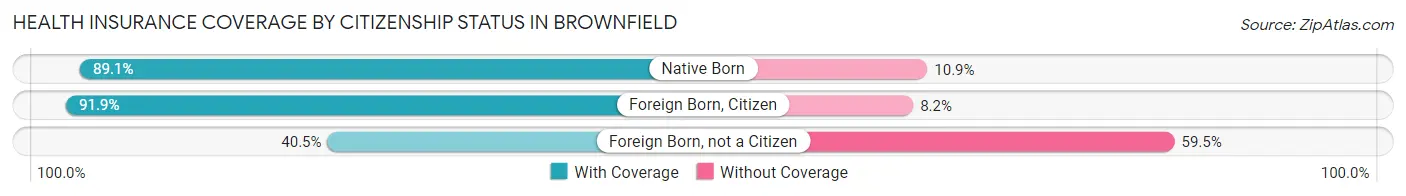
| Citizenship Status | With Coverage | Without Coverage |
| Native Born | 710 (89.1%) | 87 (10.9%) |
| Foreign Born, Citizen | 1,442 (91.8%) | 128 (8.2%) |
| Foreign Born, not a Citizen | 311 (40.5%) | 457 (59.5%) |
Health Insurance Coverage by Household Income in Brownfield
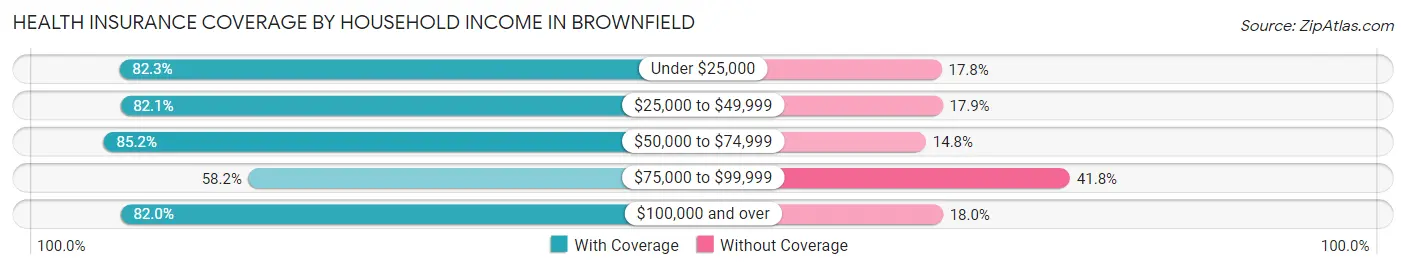
| Household Income | With Coverage | Without Coverage |
| Under $25,000 | 1,636 (82.3%) | 353 (17.7%) |
| $25,000 to $49,999 | 1,763 (82.1%) | 385 (17.9%) |
| $50,000 to $74,999 | 1,346 (85.2%) | 234 (14.8%) |
| $75,000 to $99,999 | 401 (58.2%) | 288 (41.8%) |
| $100,000 and over | 1,411 (82.0%) | 309 (18.0%) |
Public vs Private Health Insurance Coverage by Age in Brownfield
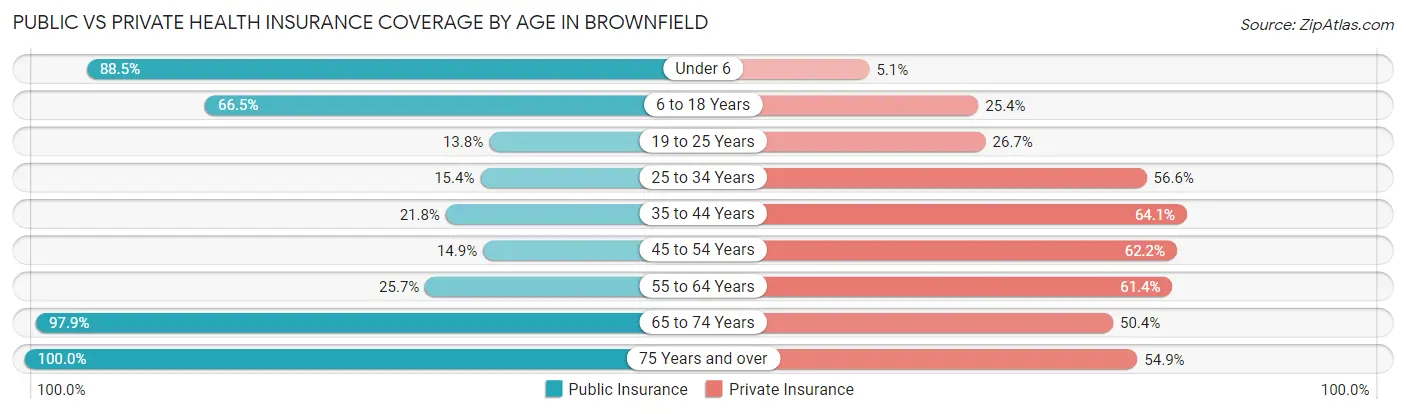
| Age Bracket | Public Insurance | Private Insurance |
| Under 6 | 705 (88.5%) | 41 (5.1%) |
| 6 to 18 Years | 1,044 (66.5%) | 398 (25.4%) |
| 19 to 25 Years | 106 (13.8%) | 205 (26.7%) |
| 25 to 34 Years | 144 (15.4%) | 528 (56.6%) |
| 35 to 44 Years | 226 (21.8%) | 663 (64.1%) |
| 45 to 54 Years | 125 (14.9%) | 521 (62.2%) |
| 55 to 64 Years | 237 (25.7%) | 567 (61.4%) |
| 65 to 74 Years | 692 (97.9%) | 356 (50.3%) |
| 75 Years and over | 554 (100.0%) | 304 (54.9%) |
| Total | 3,833 (47.2%) | 3,583 (44.1%) |
Disability Status by Sex by Age in Brownfield
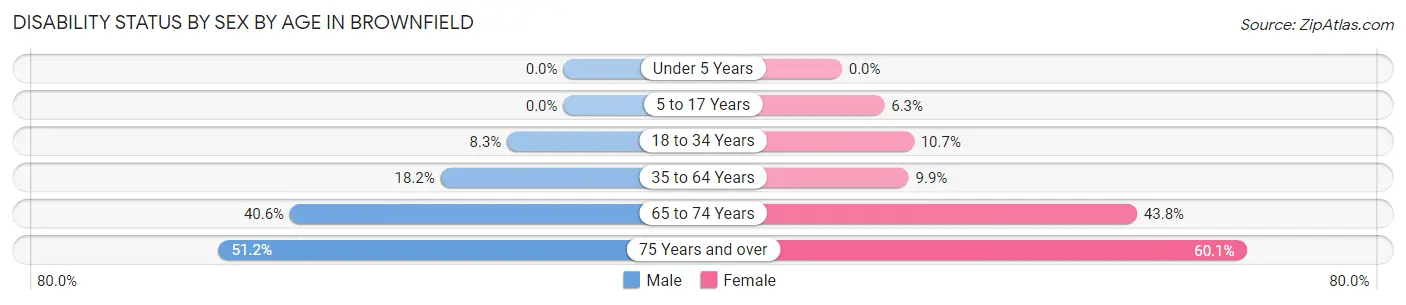
| Age Bracket | Male | Female |
| Under 5 Years | 0 (0.0%) | 0 (0.0%) |
| 5 to 17 Years | 0 (0.0%) | 44 (6.3%) |
| 18 to 34 Years | 77 (8.3%) | 98 (10.7%) |
| 35 to 64 Years | 260 (18.2%) | 136 (9.9%) |
| 65 to 74 Years | 136 (40.6%) | 163 (43.8%) |
| 75 Years and over | 108 (51.2%) | 206 (60.1%) |
Disability Class by Sex by Age in Brownfield
Disability Class: Hearing Difficulty
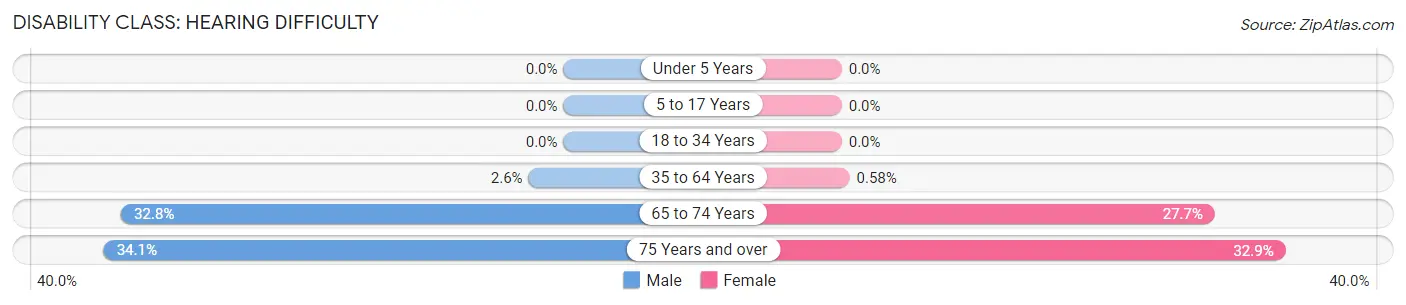
| Age Bracket | Male | Female |
| Under 5 Years | 0 (0.0%) | 0 (0.0%) |
| 5 to 17 Years | 0 (0.0%) | 0 (0.0%) |
| 18 to 34 Years | 0 (0.0%) | 0 (0.0%) |
| 35 to 64 Years | 37 (2.6%) | 8 (0.6%) |
| 65 to 74 Years | 110 (32.8%) | 103 (27.7%) |
| 75 Years and over | 72 (34.1%) | 113 (32.9%) |
Disability Class: Vision Difficulty
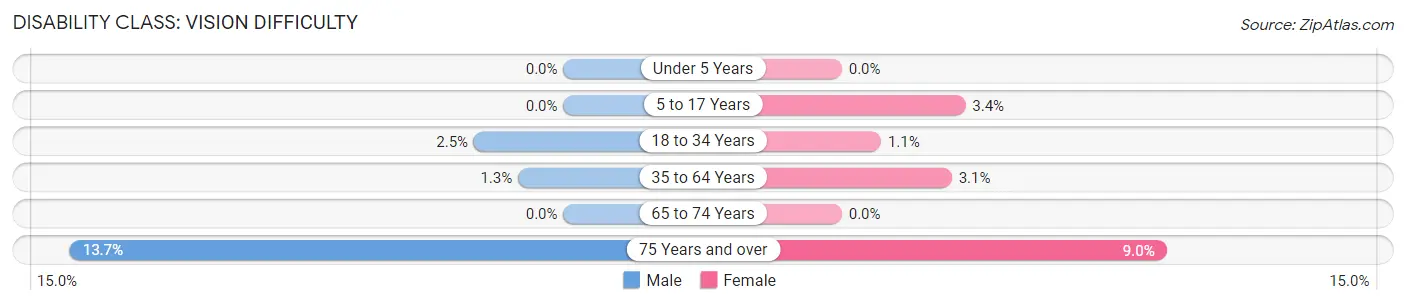
| Age Bracket | Male | Female |
| Under 5 Years | 0 (0.0%) | 0 (0.0%) |
| 5 to 17 Years | 0 (0.0%) | 24 (3.4%) |
| 18 to 34 Years | 23 (2.5%) | 10 (1.1%) |
| 35 to 64 Years | 18 (1.3%) | 42 (3.1%) |
| 65 to 74 Years | 0 (0.0%) | 0 (0.0%) |
| 75 Years and over | 29 (13.7%) | 31 (9.0%) |
Disability Class: Cognitive Difficulty
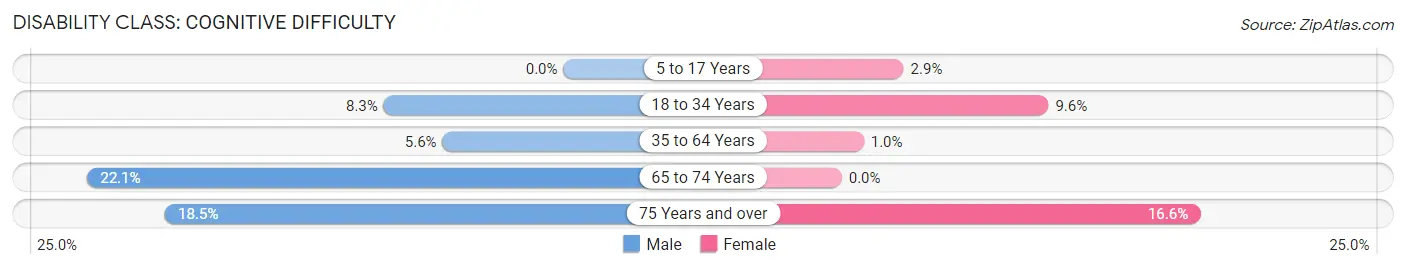
| Age Bracket | Male | Female |
| 5 to 17 Years | 0 (0.0%) | 20 (2.9%) |
| 18 to 34 Years | 77 (8.3%) | 88 (9.6%) |
| 35 to 64 Years | 80 (5.6%) | 14 (1.0%) |
| 65 to 74 Years | 74 (22.1%) | 0 (0.0%) |
| 75 Years and over | 39 (18.5%) | 57 (16.6%) |
Disability Class: Ambulatory Difficulty
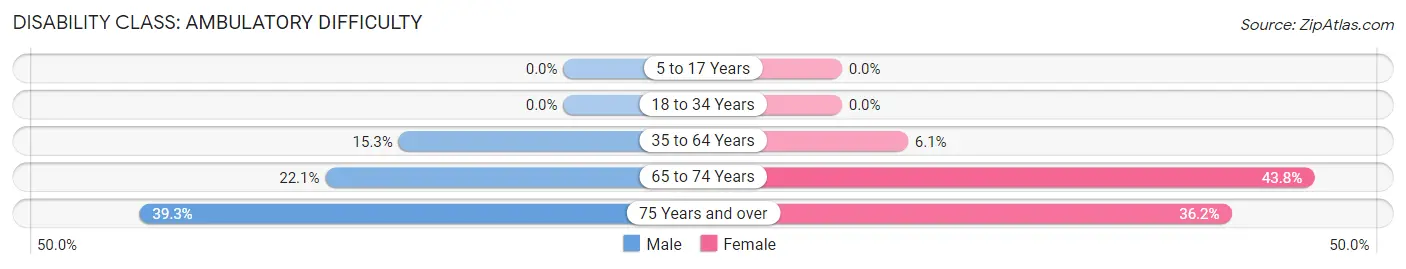
| Age Bracket | Male | Female |
| 5 to 17 Years | 0 (0.0%) | 0 (0.0%) |
| 18 to 34 Years | 0 (0.0%) | 0 (0.0%) |
| 35 to 64 Years | 218 (15.3%) | 84 (6.1%) |
| 65 to 74 Years | 74 (22.1%) | 163 (43.8%) |
| 75 Years and over | 83 (39.3%) | 124 (36.1%) |
Disability Class: Self-Care Difficulty
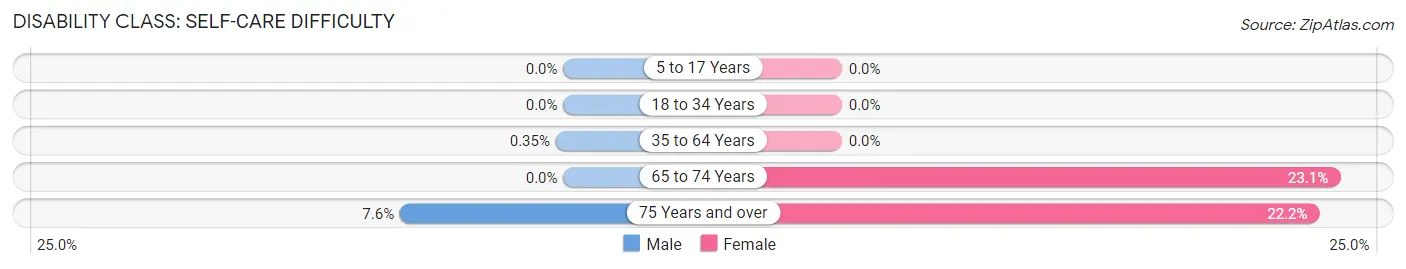
| Age Bracket | Male | Female |
| 5 to 17 Years | 0 (0.0%) | 0 (0.0%) |
| 18 to 34 Years | 0 (0.0%) | 0 (0.0%) |
| 35 to 64 Years | 5 (0.4%) | 0 (0.0%) |
| 65 to 74 Years | 0 (0.0%) | 86 (23.1%) |
| 75 Years and over | 16 (7.6%) | 76 (22.2%) |
Technology Access in Brownfield
Computing Device Access in Brownfield
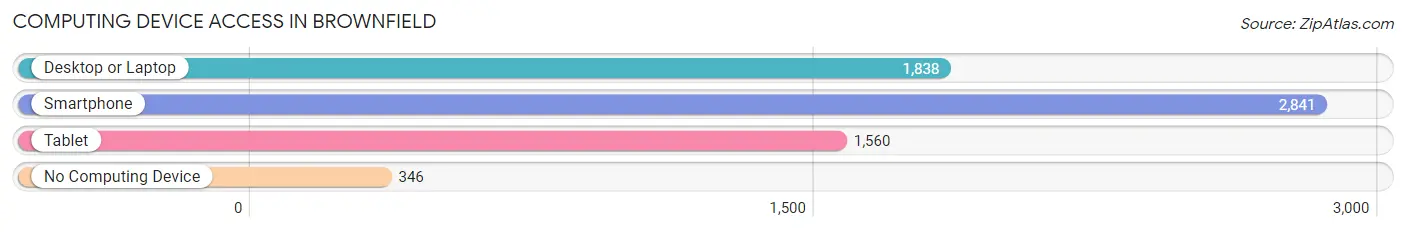
| Device Type | # Households | % Households |
| Desktop or Laptop | 1,838 | 54.8% |
| Smartphone | 2,841 | 84.8% |
| Tablet | 1,560 | 46.5% |
| No Computing Device | 346 | 10.3% |
| Total | 3,352 | 100.0% |
Internet Access in Brownfield
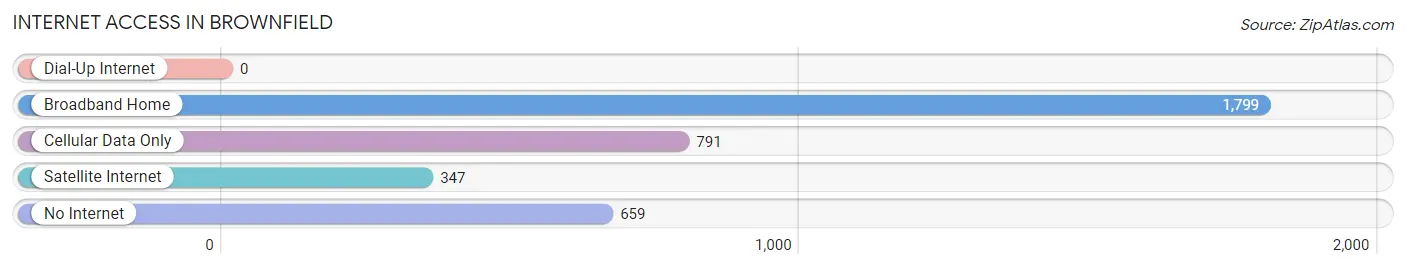
| Internet Type | # Households | % Households |
| Dial-Up Internet | 0 | 0.0% |
| Broadband Home | 1,799 | 53.7% |
| Cellular Data Only | 791 | 23.6% |
| Satellite Internet | 347 | 10.3% |
| No Internet | 659 | 19.7% |
| Total | 3,352 | 100.0% |
Brownfield Summary
Brownfield, Texas is a small city located in Terry County, Texas. It is situated in the South Plains region of the state, approximately 30 miles southeast of Lubbock. The city has a population of approximately 11,000 people and is the county seat of Terry County.
History
The area that is now Brownfield was first settled in the late 19th century by ranchers and farmers. The town was originally known as “Brown’s Field” after a local rancher, John Brown. In 1906, the town was officially incorporated and the name was changed to Brownfield.
In the early 20th century, the town began to grow rapidly due to the discovery of oil in the area. The oil boom brought many new businesses and residents to the area, and the population of Brownfield increased significantly.
In the 1950s, the town began to diversify its economy by becoming a center for cotton production. The town also became a hub for the local agricultural industry, and many new businesses were established in the area.
Geography
Brownfield is located in the South Plains region of Texas, approximately 30 miles southeast of Lubbock. The city is situated at an elevation of 3,000 feet above sea level. The terrain of the area is mostly flat, with some rolling hills.
The climate of Brownfield is semi-arid, with hot summers and mild winters. The average annual temperature is around 68 degrees Fahrenheit, and the average annual precipitation is around 20 inches.
Economy
The economy of Brownfield is largely based on agriculture and oil production. The town is home to several large cotton farms, and the local agricultural industry is a major contributor to the local economy.
The oil industry is also a major part of the economy, and the town is home to several oil and gas companies. The town is also home to several manufacturing companies, including a large food processing plant.
Demographics
As of the 2010 census, the population of Brownfield was 11,000. The racial makeup of the city was 75.3% White, 0.7% African American, 0.7% Native American, 0.3% Asian, 0.1% Pacific Islander, and 22.1% from other races. Hispanic or Latino of any race were 44.3% of the population.
The median household income in Brownfield was $31,945, and the median family income was $37,917. The per capita income was $15,945. About 18.3% of the population was below the poverty line.
Brownfield is a small city with a rich history and a diverse economy. The town is home to many businesses and industries, and the local agricultural industry is a major contributor to the local economy. The town is also home to a diverse population, with a large Hispanic population.
Common Questions
What is Per Capita Income in Brownfield?
Per Capita income in Brownfield is $24,221.
What is the Median Family Income in Brownfield?
Median Family Income in Brownfield is $52,595.
What is the Median Household income in Brownfield?
Median Household Income in Brownfield is $41,228.
What is Income or Wage Gap in Brownfield?
Income or Wage Gap in Brownfield is 38.0%.
Women in Brownfield earn 62.0 cents for every dollar earned by a man.
What is Family Income Deficit in Brownfield?
Family Income Deficit in Brownfield is $13,246.
Families that are below poverty line in Brownfield earn $13,246 less on average than the poverty threshold level.
What is Inequality or Gini Index in Brownfield?
Inequality or Gini Index in Brownfield is 0.47.
What is the Total Population of Brownfield?
Total Population of Brownfield is 8,912.
What is the Total Male Population of Brownfield?
Total Male Population of Brownfield is 5,059.
What is the Total Female Population of Brownfield?
Total Female Population of Brownfield is 3,853.
What is the Ratio of Males per 100 Females in Brownfield?
There are 131.30 Males per 100 Females in Brownfield.
What is the Ratio of Females per 100 Males in Brownfield?
There are 76.16 Females per 100 Males in Brownfield.
What is the Median Population Age in Brownfield?
Median Population Age in Brownfield is 35.7 Years.
What is the Average Family Size in Brownfield
Average Family Size in Brownfield is 3.1 People.
What is the Average Household Size in Brownfield
Average Household Size in Brownfield is 2.4 People.
How Large is the Labor Force in Brownfield?
There are 3,964 People in the Labor Forcein in Brownfield.
What is the Percentage of People in the Labor Force in Brownfield?
57.9% of People are in the Labor Force in Brownfield.
What is the Unemployment Rate in Brownfield?
Unemployment Rate in Brownfield is 5.8%.