Kearney, MO Map & Demographics
Kearney Map
Kearney Overview
$44,596
PER CAPITA INCOME
$117,551
AVG FAMILY INCOME
$99,969
AVG HOUSEHOLD INCOME
40.3%
WAGE / INCOME GAP [ % ]
59.7¢/ $1
WAGE / INCOME GAP [ $ ]
0.38
INEQUALITY / GINI INDEX
10,491
TOTAL POPULATION
4,992
MALE POPULATION
5,499
FEMALE POPULATION
90.78
MALES / 100 FEMALES
110.16
FEMALES / 100 MALES
37.9
MEDIAN AGE
3.1
AVG FAMILY SIZE
2.6
AVG HOUSEHOLD SIZE
6,251
LABOR FORCE [ PEOPLE ]
75.3%
PERCENT IN LABOR FORCE
1.4%
UNEMPLOYMENT RATE
Kearney Zip Codes
Kearney Area Codes
Income in Kearney
Income Overview in Kearney
Per Capita Income in Kearney is $44,596, while median incomes of families and households are $117,551 and $99,969 respectively.
| Characteristic | Number | Measure |
| Per Capita Income | 10,491 | $44,596 |
| Median Family Income | 2,914 | $117,551 |
| Mean Family Income | 2,914 | $135,895 |
| Median Household Income | 3,982 | $99,969 |
| Mean Household Income | 3,982 | $115,388 |
| Income Deficit | 2,914 | $0 |
| Wage / Income Gap (%) | 10,491 | 40.25% |
| Wage / Income Gap ($) | 10,491 | 59.75¢ per $1 |
| Gini / Inequality Index | 10,491 | 0.38 |
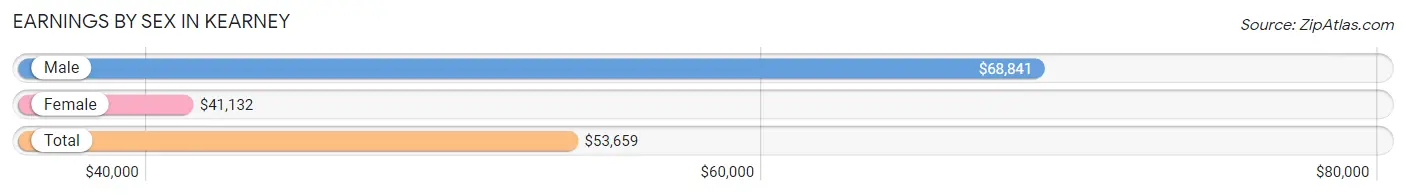
Earnings by Sex in Kearney
Average Earnings in Kearney are $53,659, $68,841 for men and $41,132 for women, a difference of 40.3%.
| Sex | Number | Average Earnings |
| Male | 3,397 (52.0%) | $68,841 |
| Female | 3,129 (47.9%) | $41,132 |
| Total | 6,526 (100.0%) | $53,659 |
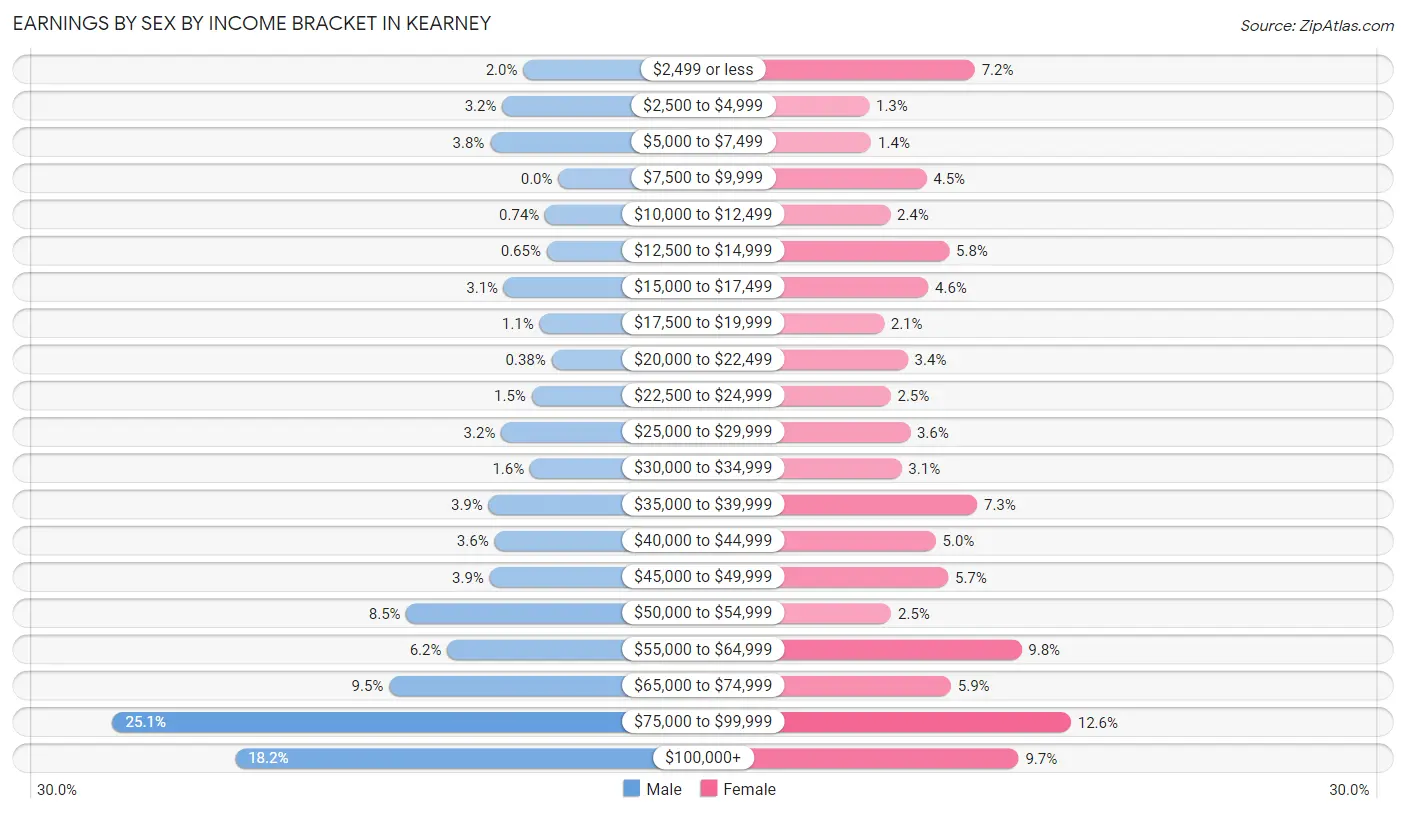
Earnings by Sex by Income Bracket in Kearney
The most common earnings brackets in Kearney are $75,000 to $99,999 for men (851 | 25.1%) and $75,000 to $99,999 for women (394 | 12.6%).
| Income | Male | Female |
| $2,499 or less | 67 (2.0%) | 225 (7.2%) |
| $2,500 to $4,999 | 107 (3.2%) | 39 (1.3%) |
| $5,000 to $7,499 | 130 (3.8%) | 43 (1.4%) |
| $7,500 to $9,999 | 0 (0.0%) | 140 (4.5%) |
| $10,000 to $12,499 | 25 (0.7%) | 76 (2.4%) |
| $12,500 to $14,999 | 22 (0.6%) | 180 (5.8%) |
| $15,000 to $17,499 | 104 (3.1%) | 143 (4.6%) |
| $17,500 to $19,999 | 36 (1.1%) | 65 (2.1%) |
| $20,000 to $22,499 | 13 (0.4%) | 107 (3.4%) |
| $22,500 to $24,999 | 51 (1.5%) | 77 (2.5%) |
| $25,000 to $29,999 | 109 (3.2%) | 111 (3.5%) |
| $30,000 to $34,999 | 54 (1.6%) | 96 (3.1%) |
| $35,000 to $39,999 | 133 (3.9%) | 229 (7.3%) |
| $40,000 to $44,999 | 122 (3.6%) | 156 (5.0%) |
| $45,000 to $49,999 | 131 (3.9%) | 178 (5.7%) |
| $50,000 to $54,999 | 290 (8.5%) | 78 (2.5%) |
| $55,000 to $64,999 | 212 (6.2%) | 307 (9.8%) |
| $65,000 to $74,999 | 323 (9.5%) | 183 (5.9%) |
| $75,000 to $99,999 | 851 (25.1%) | 394 (12.6%) |
| $100,000+ | 617 (18.2%) | 302 (9.7%) |
| Total | 3,397 (100.0%) | 3,129 (100.0%) |
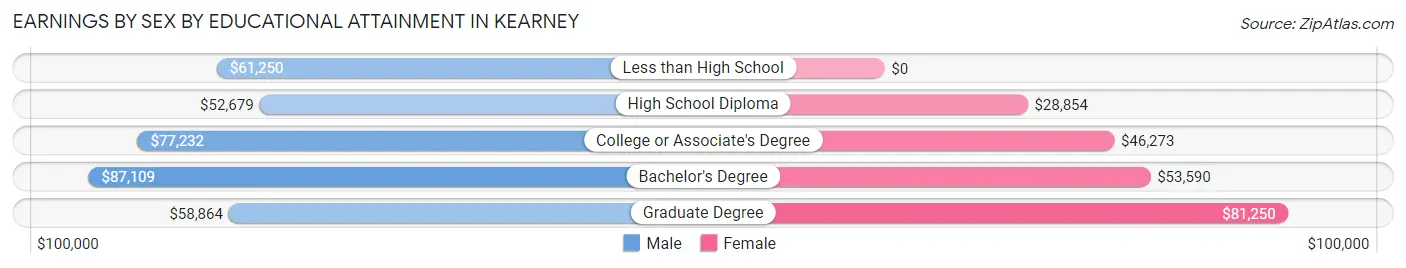
Earnings by Sex by Educational Attainment in Kearney
Average earnings in Kearney are $71,346 for men and $47,179 for women, a difference of 33.9%. Men with an educational attainment of bachelor's degree enjoy the highest average annual earnings of $87,109, while those with high school diploma education earn the least with $52,679. Women with an educational attainment of graduate degree earn the most with the average annual earnings of $81,250, while those with high school diploma education have the smallest earnings of $28,854.
| Educational Attainment | Male Income | Female Income |
| Less than High School | $61,250 | $0 |
| High School Diploma | $52,679 | $28,854 |
| College or Associate's Degree | $77,232 | $46,273 |
| Bachelor's Degree | $87,109 | $53,590 |
| Graduate Degree | $58,864 | $81,250 |
| Total | $71,346 | $47,179 |
Family Income in Kearney
Family Income Brackets in Kearney
According to the Kearney family income data, there are 1,005 families falling into the $100,000 to $149,999 income range, which is the most common income bracket and makes up 34.5% of all families.
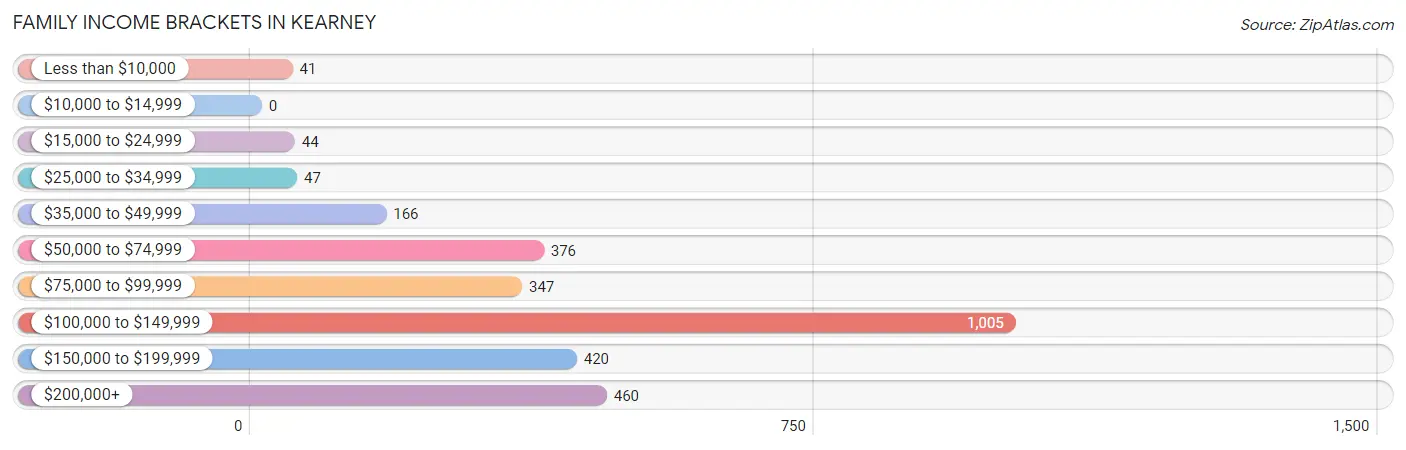
| Income Bracket | # Families | % Families |
| Less than $10,000 | 41 | 1.4% |
| $10,000 to $14,999 | 0 | 0.0% |
| $15,000 to $24,999 | 44 | 1.5% |
| $25,000 to $34,999 | 47 | 1.6% |
| $35,000 to $49,999 | 166 | 5.7% |
| $50,000 to $74,999 | 376 | 12.9% |
| $75,000 to $99,999 | 347 | 11.9% |
| $100,000 to $149,999 | 1,005 | 34.5% |
| $150,000 to $199,999 | 420 | 14.4% |
| $200,000+ | 460 | 15.8% |
Family Income by Famaliy Size in Kearney
5-person families (259 | 8.9%) account for the highest median family income in Kearney with $209,009 per family, while 2-person families (1,259 | 43.2%) have the highest median income of $58,324 per family member.
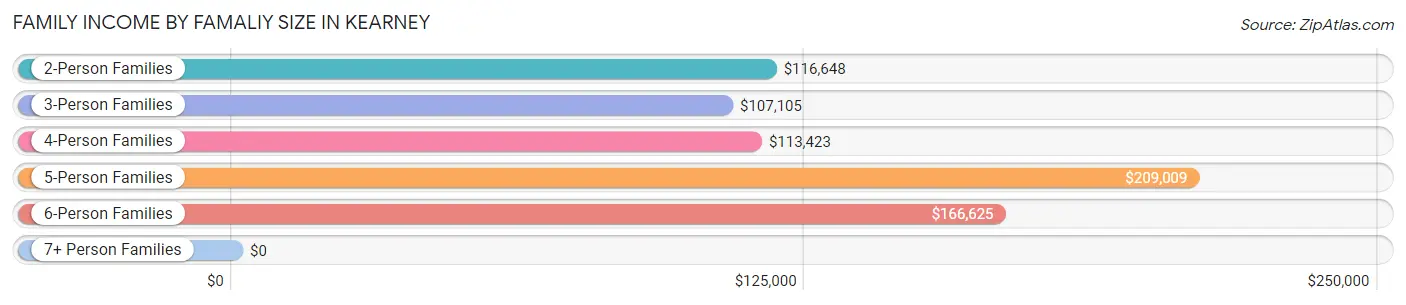
| Income Bracket | # Families | Median Income |
| 2-Person Families | 1,259 (43.2%) | $116,648 |
| 3-Person Families | 540 (18.5%) | $107,105 |
| 4-Person Families | 686 (23.5%) | $113,423 |
| 5-Person Families | 259 (8.9%) | $209,009 |
| 6-Person Families | 166 (5.7%) | $166,625 |
| 7+ Person Families | 4 (0.1%) | $0 |
| Total | 2,914 (100.0%) | $117,551 |
Family Income by Number of Earners in Kearney
The median family income in Kearney is $117,551, with families comprising 3+ earners (590) having the highest median family income of $177,589, while families with 1 earner (620) have the lowest median family income of $57,500, accounting for 20.3% and 21.3% of families, respectively.
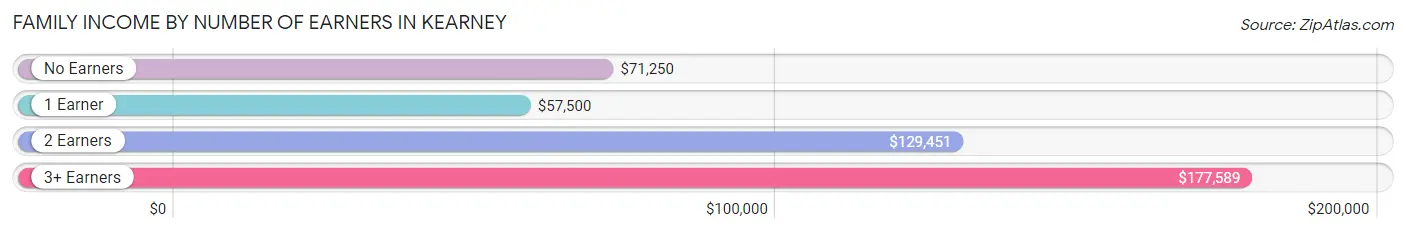
| Number of Earners | # Families | Median Income |
| No Earners | 224 (7.7%) | $71,250 |
| 1 Earner | 620 (21.3%) | $57,500 |
| 2 Earners | 1,480 (50.8%) | $129,451 |
| 3+ Earners | 590 (20.3%) | $177,589 |
| Total | 2,914 (100.0%) | $117,551 |
Household Income in Kearney
Household Income Brackets in Kearney
With 1,031 households falling in the category, the $100,000 to $149,999 income range is the most frequent in Kearney, accounting for 25.9% of all households. In contrast, only 12 households (0.3%) fall into the $10,000 to $14,999 income bracket, making it the least populous group.
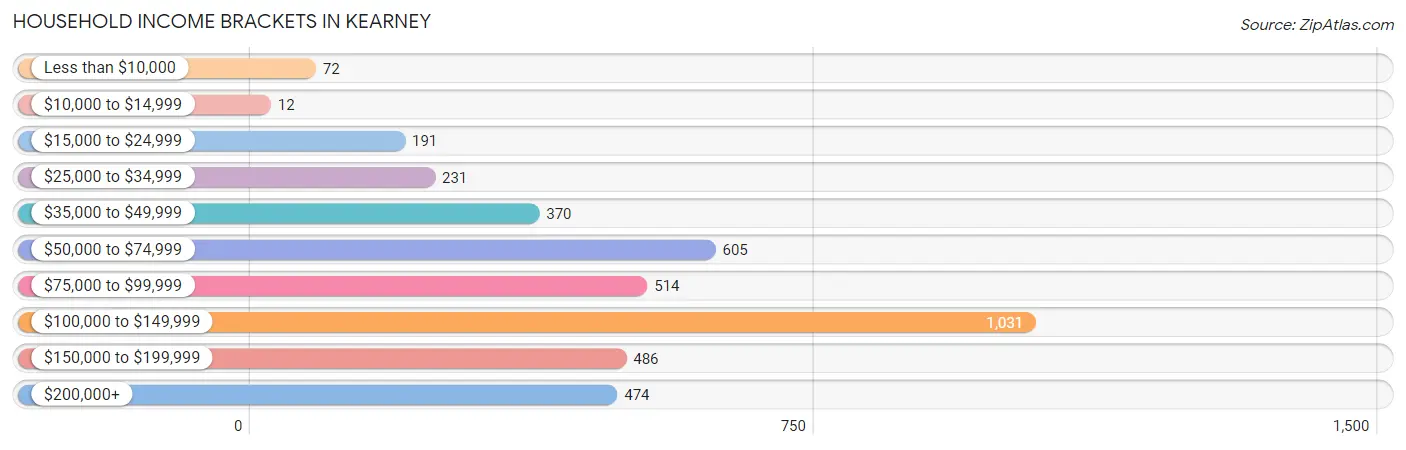
| Income Bracket | # Households | % Households |
| Less than $10,000 | 72 | 1.8% |
| $10,000 to $14,999 | 12 | 0.3% |
| $15,000 to $24,999 | 191 | 4.8% |
| $25,000 to $34,999 | 231 | 5.8% |
| $35,000 to $49,999 | 370 | 9.3% |
| $50,000 to $74,999 | 605 | 15.2% |
| $75,000 to $99,999 | 514 | 12.9% |
| $100,000 to $149,999 | 1,031 | 25.9% |
| $150,000 to $199,999 | 486 | 12.2% |
| $200,000+ | 474 | 11.9% |
Household Income by Householder Age in Kearney
The median household income in Kearney is $99,969, with the highest median household income of $116,397 found in the 45 to 64 years age bracket for the primary householder. A total of 1,466 households (36.8%) fall into this category. Meanwhile, the 65+ years age bracket for the primary householder has the lowest median household income of $51,865, with 963 households (24.2%) in this group.
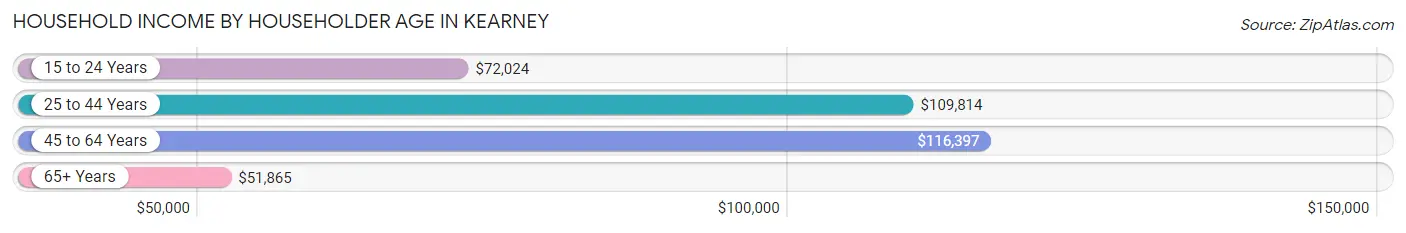
| Income Bracket | # Households | Median Income |
| 15 to 24 Years | 68 (1.7%) | $72,024 |
| 25 to 44 Years | 1,485 (37.3%) | $109,814 |
| 45 to 64 Years | 1,466 (36.8%) | $116,397 |
| 65+ Years | 963 (24.2%) | $51,865 |
| Total | 3,982 (100.0%) | $99,969 |
Poverty in Kearney
Income Below Poverty by Sex and Age in Kearney
With 2.4% poverty level for males and 2.6% for females among the residents of Kearney, 5 year old males and 75 year old and over females are the most vulnerable to poverty, with 13 males (18.3%) and 22 females (7.0%) in their respective age groups living below the poverty level.
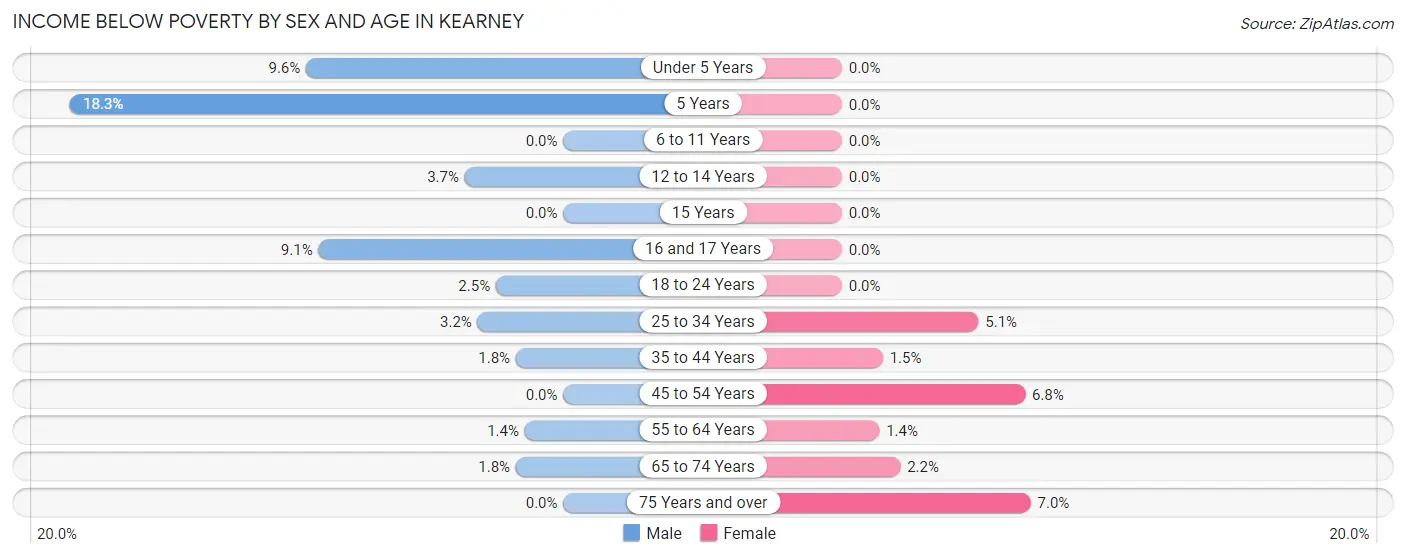
| Age Bracket | Male | Female |
| Under 5 Years | 21 (9.6%) | 0 (0.0%) |
| 5 Years | 13 (18.3%) | 0 (0.0%) |
| 6 to 11 Years | 0 (0.0%) | 0 (0.0%) |
| 12 to 14 Years | 12 (3.7%) | 0 (0.0%) |
| 15 Years | 0 (0.0%) | 0 (0.0%) |
| 16 and 17 Years | 12 (9.1%) | 0 (0.0%) |
| 18 to 24 Years | 9 (2.5%) | 0 (0.0%) |
| 25 to 34 Years | 23 (3.2%) | 41 (5.1%) |
| 35 to 44 Years | 14 (1.8%) | 11 (1.5%) |
| 45 to 54 Years | 0 (0.0%) | 48 (6.8%) |
| 55 to 64 Years | 9 (1.4%) | 8 (1.4%) |
| 65 to 74 Years | 6 (1.8%) | 13 (2.2%) |
| 75 Years and over | 0 (0.0%) | 22 (7.0%) |
| Total | 119 (2.4%) | 143 (2.6%) |
Income Above Poverty by Sex and Age in Kearney
According to the poverty statistics in Kearney, males aged 6 to 11 years and females aged under 5 years are the age groups that are most secure financially, with 100.0% of males and 100.0% of females in these age groups living above the poverty line.
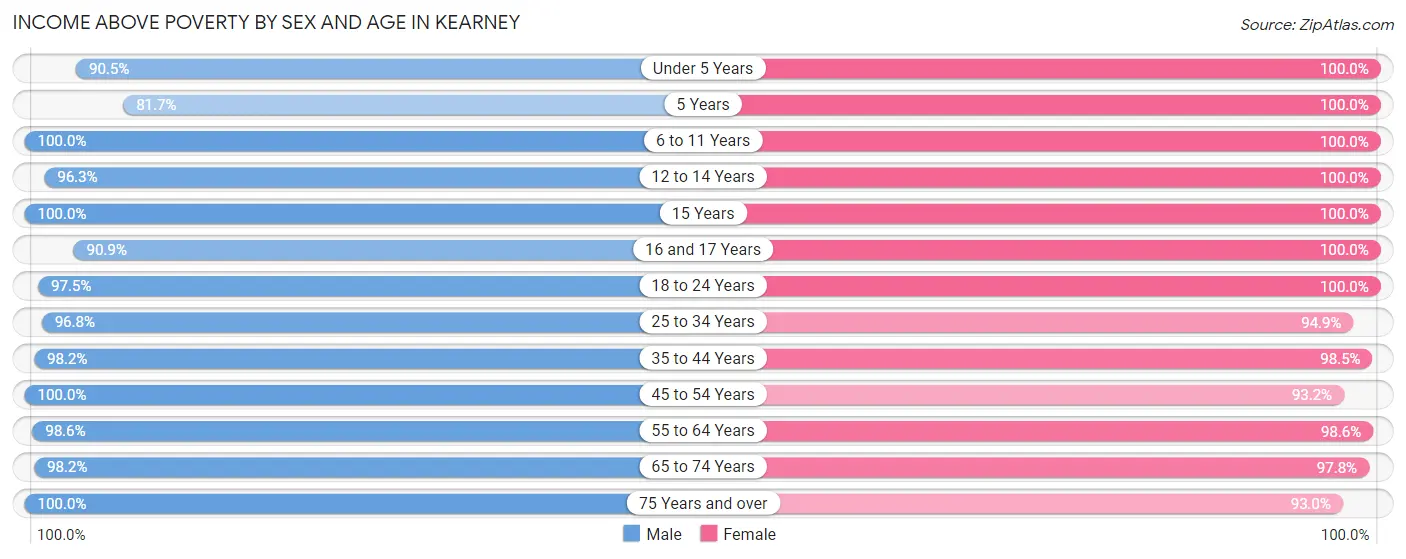
| Age Bracket | Male | Female |
| Under 5 Years | 199 (90.4%) | 383 (100.0%) |
| 5 Years | 58 (81.7%) | 33 (100.0%) |
| 6 to 11 Years | 311 (100.0%) | 246 (100.0%) |
| 12 to 14 Years | 316 (96.3%) | 348 (100.0%) |
| 15 Years | 82 (100.0%) | 140 (100.0%) |
| 16 and 17 Years | 120 (90.9%) | 289 (100.0%) |
| 18 to 24 Years | 351 (97.5%) | 300 (100.0%) |
| 25 to 34 Years | 700 (96.8%) | 767 (94.9%) |
| 35 to 44 Years | 782 (98.2%) | 714 (98.5%) |
| 45 to 54 Years | 779 (100.0%) | 658 (93.2%) |
| 55 to 64 Years | 622 (98.6%) | 568 (98.6%) |
| 65 to 74 Years | 334 (98.2%) | 587 (97.8%) |
| 75 Years and over | 210 (100.0%) | 292 (93.0%) |
| Total | 4,864 (97.6%) | 5,325 (97.4%) |
Income Below Poverty Among Married-Couple Families in Kearney
The poverty statistics for married-couple families in Kearney show that 2.1% or 50 of the total 2,443 families live below the poverty line. Families with 1 or 2 children have the highest poverty rate of 4.3%, comprising of 42 families. On the other hand, families with 3 or 4 children have the lowest poverty rate of 0.0%, which includes 0 families.
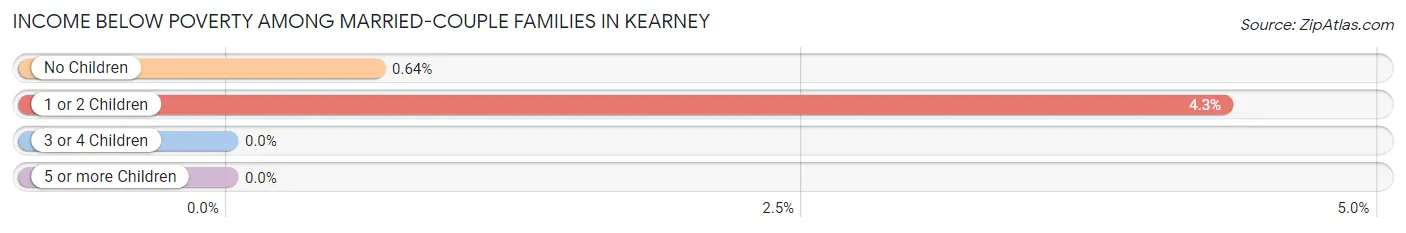
| Children | Above Poverty | Below Poverty |
| No Children | 1,243 (99.4%) | 8 (0.6%) |
| 1 or 2 Children | 928 (95.7%) | 42 (4.3%) |
| 3 or 4 Children | 222 (100.0%) | 0 (0.0%) |
| 5 or more Children | 0 (0.0%) | 0 (0.0%) |
| Total | 2,393 (98.0%) | 50 (2.1%) |
Income Below Poverty Among Single-Parent Households in Kearney
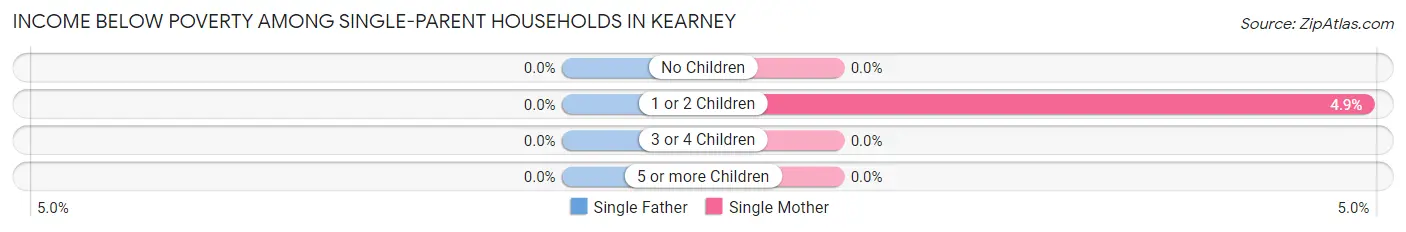
| Children | Single Father | Single Mother |
| No Children | 0 (0.0%) | 0 (0.0%) |
| 1 or 2 Children | 0 (0.0%) | 12 (4.9%) |
| 3 or 4 Children | 0 (0.0%) | 0 (0.0%) |
| 5 or more Children | 0 (0.0%) | 0 (0.0%) |
| Total | 0 (0.0%) | 12 (3.1%) |
Income Below Poverty Among Married-Couple vs Single-Parent Households in Kearney
The poverty data for Kearney shows that 50 of the married-couple family households (2.1%) and 12 of the single-parent households (2.5%) are living below the poverty level. Within the married-couple family households, those with 1 or 2 children have the highest poverty rate, with 42 households (4.3%) falling below the poverty line. Among the single-parent households, those with 1 or 2 children have the highest poverty rate, with 12 household (4.2%) living below poverty.
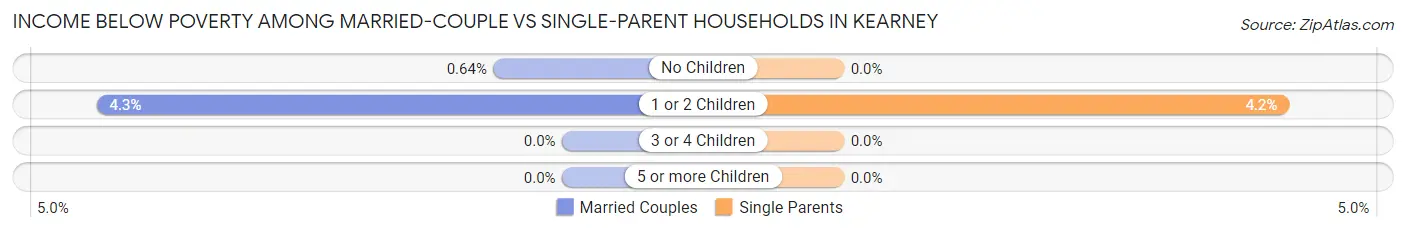
| Children | Married-Couple Families | Single-Parent Households |
| No Children | 8 (0.6%) | 0 (0.0%) |
| 1 or 2 Children | 42 (4.3%) | 12 (4.2%) |
| 3 or 4 Children | 0 (0.0%) | 0 (0.0%) |
| 5 or more Children | 0 (0.0%) | 0 (0.0%) |
| Total | 50 (2.1%) | 12 (2.5%) |
Race in Kearney
The most populous races in Kearney are White / Caucasian (9,650 | 92.0%), Two or more Races (621 | 5.9%), and Hispanic or Latino (444 | 4.2%).
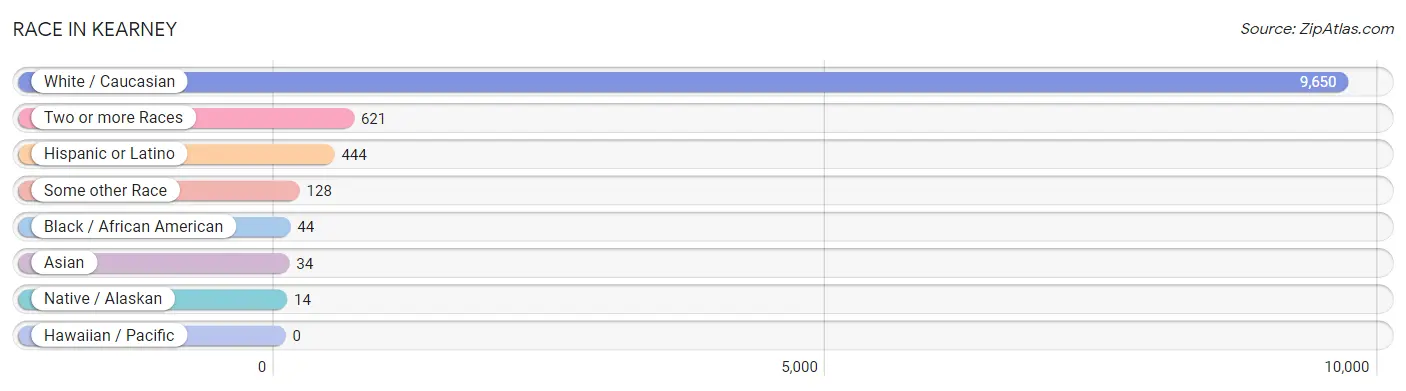
| Race | # Population | % Population |
| Asian | 34 | 0.3% |
| Black / African American | 44 | 0.4% |
| Hawaiian / Pacific | 0 | 0.0% |
| Hispanic or Latino | 444 | 4.2% |
| Native / Alaskan | 14 | 0.1% |
| White / Caucasian | 9,650 | 92.0% |
| Two or more Races | 621 | 5.9% |
| Some other Race | 128 | 1.2% |
| Total | 10,491 | 100.0% |
Ancestry in Kearney
The most populous ancestries reported in Kearney are German (2,702 | 25.8%), Irish (1,715 | 16.4%), English (945 | 9.0%), American (941 | 9.0%), and Italian (573 | 5.5%), together accounting for 65.5% of all Kearney residents.
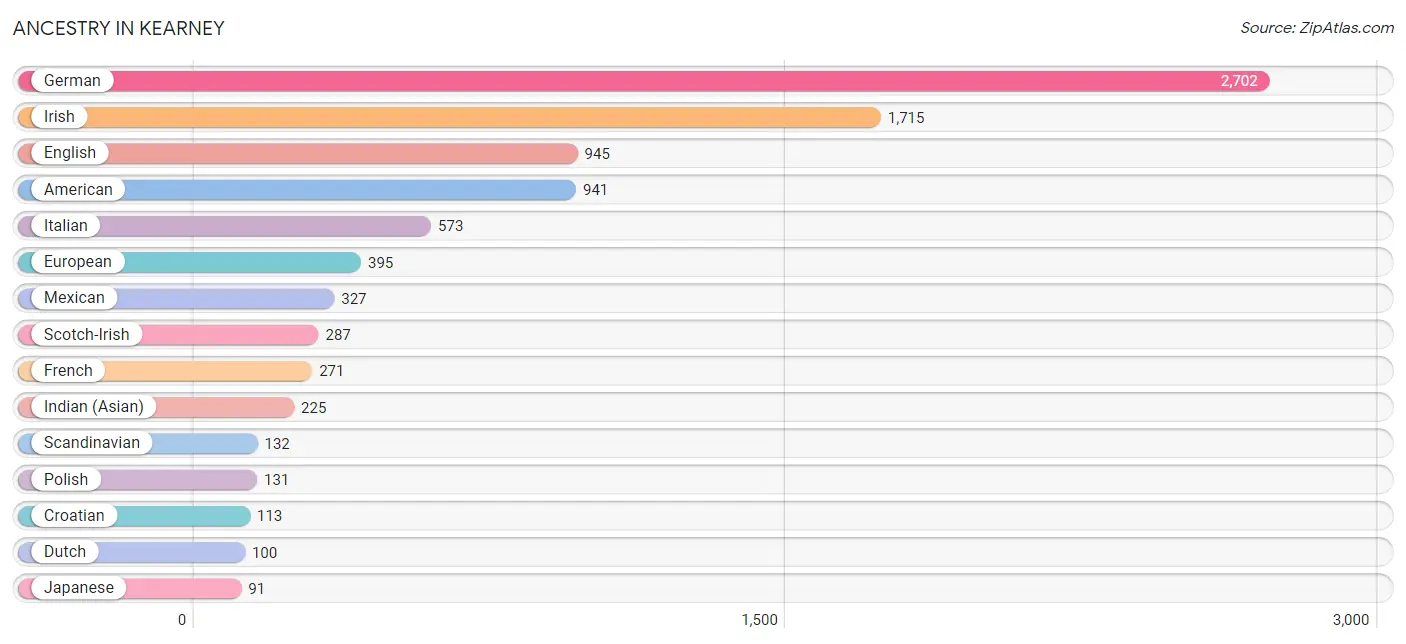
| Ancestry | # Population | % Population |
| American | 941 | 9.0% |
| Armenian | 11 | 0.1% |
| Belgian | 18 | 0.2% |
| Bhutanese | 15 | 0.1% |
| British | 14 | 0.1% |
| Cherokee | 77 | 0.7% |
| Choctaw | 80 | 0.8% |
| Croatian | 113 | 1.1% |
| Czech | 23 | 0.2% |
| Czechoslovakian | 58 | 0.5% |
| Danish | 70 | 0.7% |
| Dutch | 100 | 0.9% |
| Ecuadorian | 13 | 0.1% |
| English | 945 | 9.0% |
| European | 395 | 3.8% |
| Finnish | 37 | 0.4% |
| French | 271 | 2.6% |
| German | 2,702 | 25.8% |
| Greek | 12 | 0.1% |
| Indian (Asian) | 225 | 2.1% |
| Irish | 1,715 | 16.4% |
| Italian | 573 | 5.5% |
| Japanese | 91 | 0.9% |
| Korean | 20 | 0.2% |
| Mexican | 327 | 3.1% |
| Northern European | 43 | 0.4% |
| Norwegian | 17 | 0.2% |
| Polish | 131 | 1.3% |
| Puerto Rican | 17 | 0.2% |
| Scandinavian | 132 | 1.3% |
| Scotch-Irish | 287 | 2.7% |
| Scottish | 68 | 0.6% |
| South American | 13 | 0.1% |
| Spanish | 87 | 0.8% |
| Swedish | 53 | 0.5% |
| Welsh | 87 | 0.8% | View All 36 Rows |
Immigrants in Kearney
The most numerous immigrant groups reported in Kearney came from Central America (90 | 0.9%), Latin America (90 | 0.9%), Mexico (90 | 0.9%), Asia (34 | 0.3%), and South Eastern Asia (34 | 0.3%), together accounting for 3.2% of all Kearney residents.
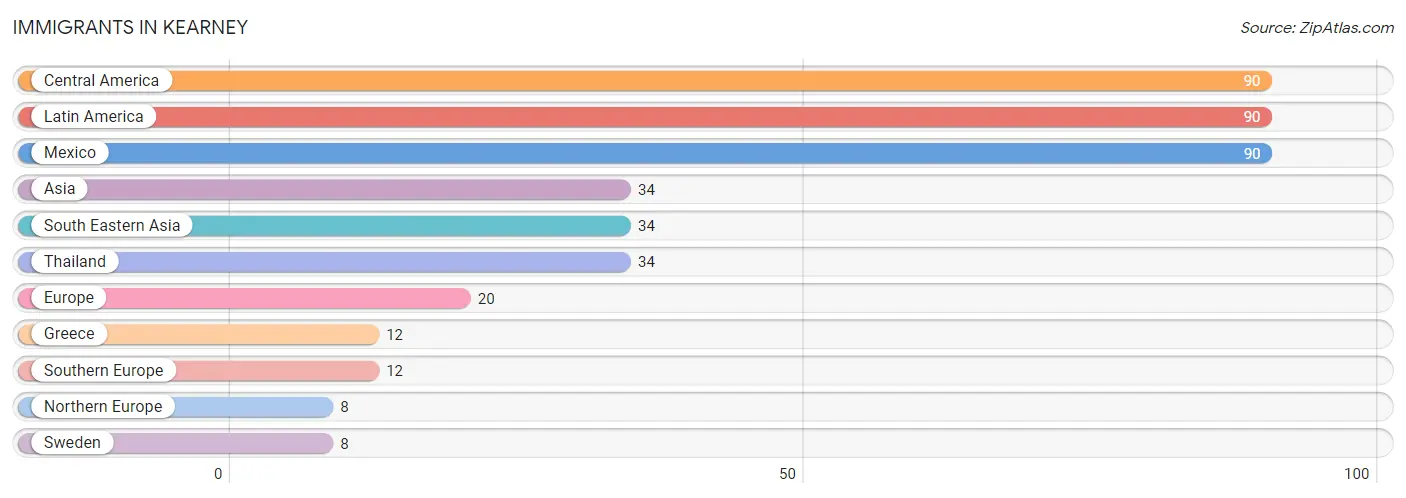
| Immigration Origin | # Population | % Population |
| Asia | 34 | 0.3% |
| Central America | 90 | 0.9% |
| Europe | 20 | 0.2% |
| Greece | 12 | 0.1% |
| Latin America | 90 | 0.9% |
| Mexico | 90 | 0.9% |
| Northern Europe | 8 | 0.1% |
| South Eastern Asia | 34 | 0.3% |
| Southern Europe | 12 | 0.1% |
| Sweden | 8 | 0.1% |
| Thailand | 34 | 0.3% | View All 11 Rows |
Sex and Age in Kearney
Sex and Age in Kearney
The most populous age groups in Kearney are 45 to 49 Years (510 | 10.2%) for men and 15 to 19 Years (589 | 10.7%) for women.
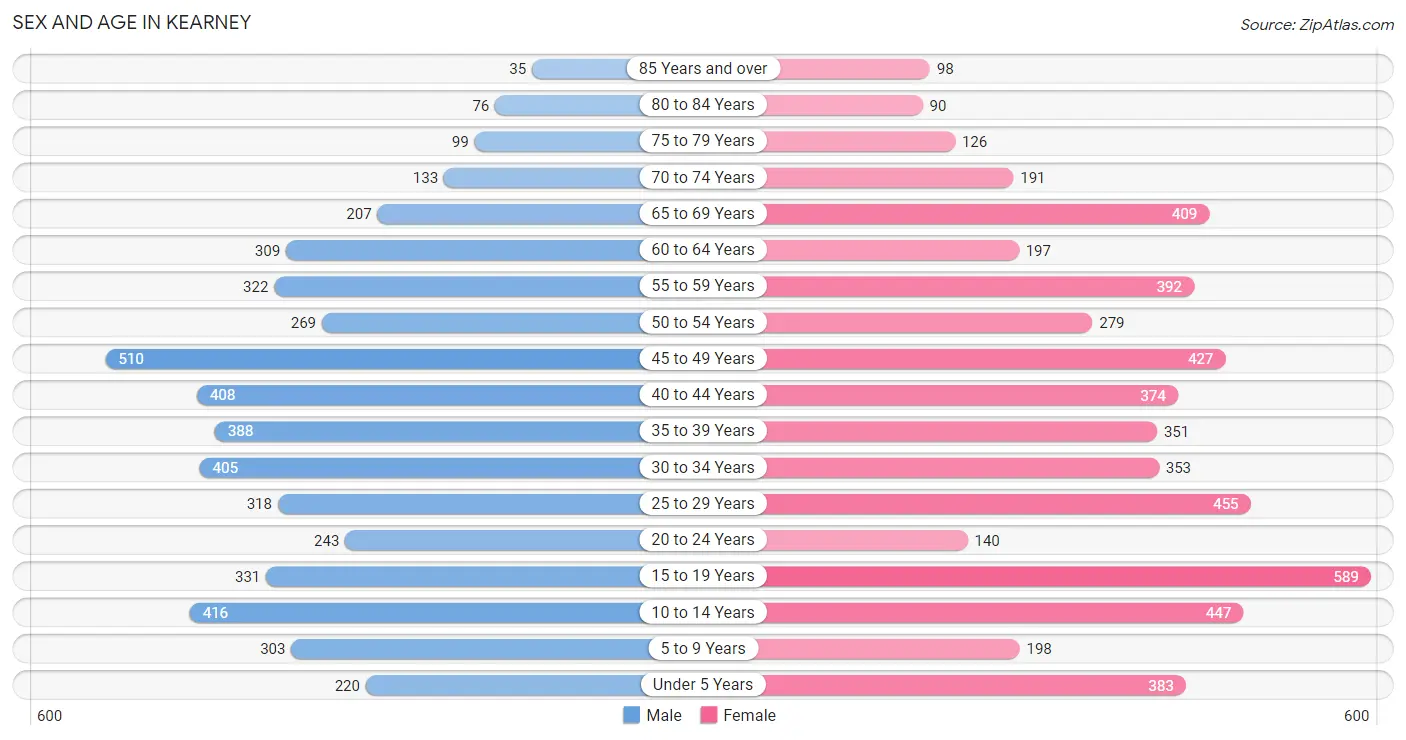
| Age Bracket | Male | Female |
| Under 5 Years | 220 (4.4%) | 383 (7.0%) |
| 5 to 9 Years | 303 (6.1%) | 198 (3.6%) |
| 10 to 14 Years | 416 (8.3%) | 447 (8.1%) |
| 15 to 19 Years | 331 (6.6%) | 589 (10.7%) |
| 20 to 24 Years | 243 (4.9%) | 140 (2.5%) |
| 25 to 29 Years | 318 (6.4%) | 455 (8.3%) |
| 30 to 34 Years | 405 (8.1%) | 353 (6.4%) |
| 35 to 39 Years | 388 (7.8%) | 351 (6.4%) |
| 40 to 44 Years | 408 (8.2%) | 374 (6.8%) |
| 45 to 49 Years | 510 (10.2%) | 427 (7.8%) |
| 50 to 54 Years | 269 (5.4%) | 279 (5.1%) |
| 55 to 59 Years | 322 (6.5%) | 392 (7.1%) |
| 60 to 64 Years | 309 (6.2%) | 197 (3.6%) |
| 65 to 69 Years | 207 (4.2%) | 409 (7.4%) |
| 70 to 74 Years | 133 (2.7%) | 191 (3.5%) |
| 75 to 79 Years | 99 (2.0%) | 126 (2.3%) |
| 80 to 84 Years | 76 (1.5%) | 90 (1.6%) |
| 85 Years and over | 35 (0.7%) | 98 (1.8%) |
| Total | 4,992 (100.0%) | 5,499 (100.0%) |
Families and Households in Kearney
Median Family Size in Kearney
The median family size in Kearney is 3.10 persons per family, with married-couple families (2,443 | 83.8%) accounting for the largest median family size of 3.16 persons per family. On the other hand, single male/father families (82 | 2.8%) represent the smallest median family size with 2.73 persons per family.
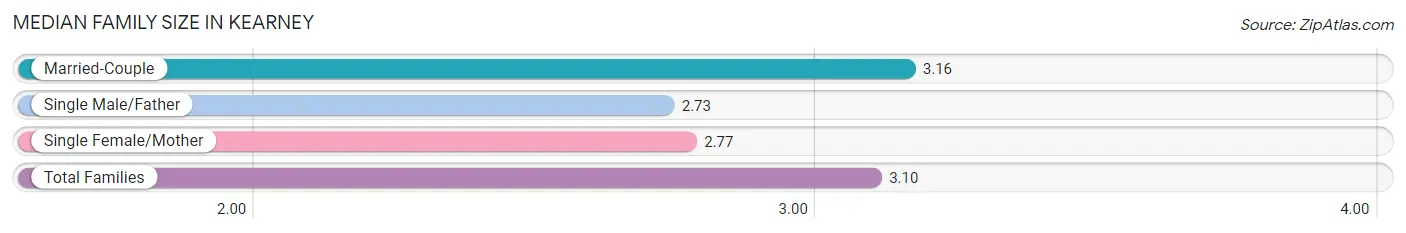
| Family Type | # Families | Family Size |
| Married-Couple | 2,443 (83.8%) | 3.16 |
| Single Male/Father | 82 (2.8%) | 2.73 |
| Single Female/Mother | 389 (13.4%) | 2.77 |
| Total Families | 2,914 (100.0%) | 3.10 |
Median Household Size in Kearney
The median household size in Kearney is 2.63 persons per household, with married-couple households (2,443 | 61.4%) accounting for the largest median household size of 3.16 persons per household. non-family households (1,068 | 26.8%) represent the smallest median household size with 1.29 persons per household.
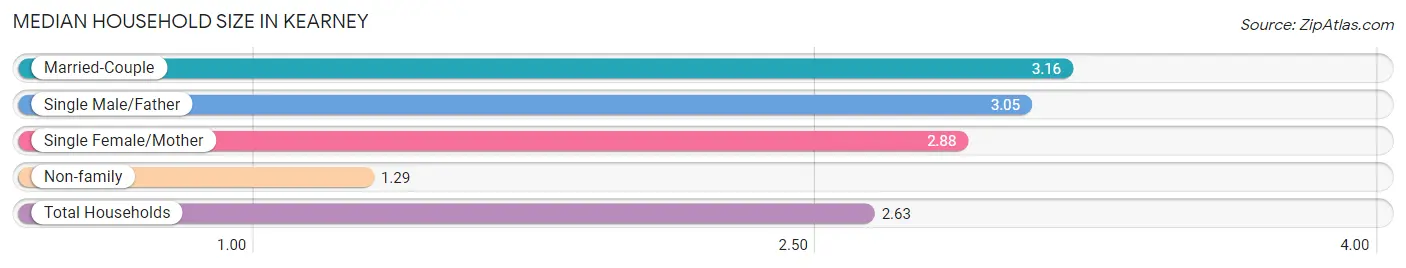
| Household Type | # Households | Household Size |
| Married-Couple | 2,443 (61.4%) | 3.16 |
| Single Male/Father | 82 (2.1%) | 3.05 |
| Single Female/Mother | 389 (9.8%) | 2.88 |
| Non-family | 1,068 (26.8%) | 1.29 |
| Total Households | 3,982 (100.0%) | 2.63 |
Household Size by Marriage Status in Kearney
Out of a total of 3,982 households in Kearney, 2,914 (73.2%) are family households, while 1,068 (26.8%) are nonfamily households. The most numerous type of family households are 2-person households, comprising 1,230, and the most common type of nonfamily households are 1-person households, comprising 848.
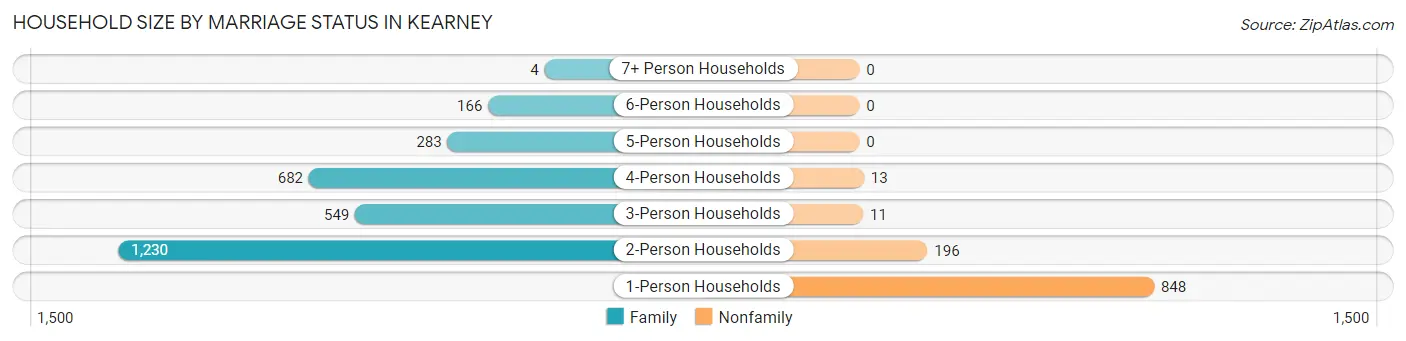
| Household Size | Family Households | Nonfamily Households |
| 1-Person Households | - | 848 (21.3%) |
| 2-Person Households | 1,230 (30.9%) | 196 (4.9%) |
| 3-Person Households | 549 (13.8%) | 11 (0.3%) |
| 4-Person Households | 682 (17.1%) | 13 (0.3%) |
| 5-Person Households | 283 (7.1%) | 0 (0.0%) |
| 6-Person Households | 166 (4.2%) | 0 (0.0%) |
| 7+ Person Households | 4 (0.1%) | 0 (0.0%) |
| Total | 2,914 (73.2%) | 1,068 (26.8%) |
Female Fertility in Kearney
Fertility by Age in Kearney
Average fertility rate in Kearney is 38.0 births per 1,000 women. Women in the age bracket of 20 to 34 years have the highest fertility rate with 79.0 births per 1,000 women. Women in the age bracket of 20 to 34 years acount for 70.8% of all women with births.
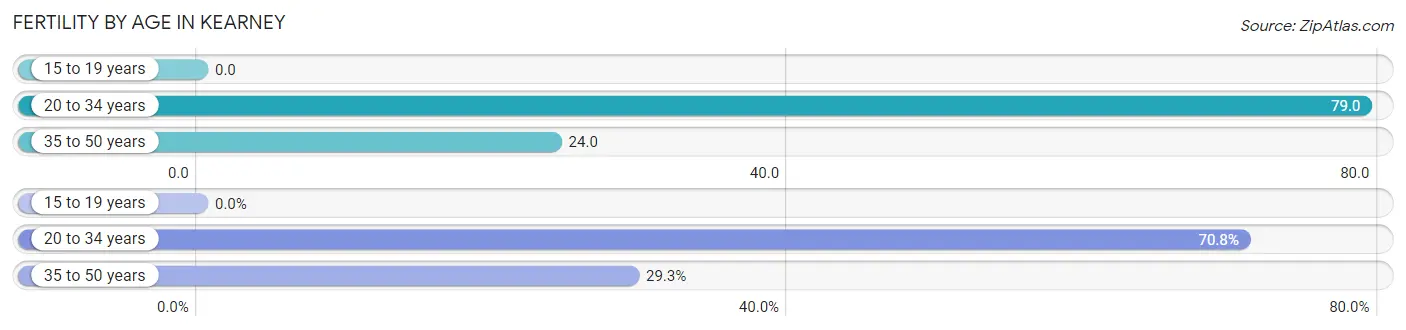
| Age Bracket | Women with Births | Births / 1,000 Women |
| 15 to 19 years | 0 (0.0%) | 0.0 |
| 20 to 34 years | 75 (70.8%) | 79.0 |
| 35 to 50 years | 31 (29.2%) | 24.0 |
| Total | 106 (100.0%) | 38.0 |
Fertility by Age by Marriage Status in Kearney
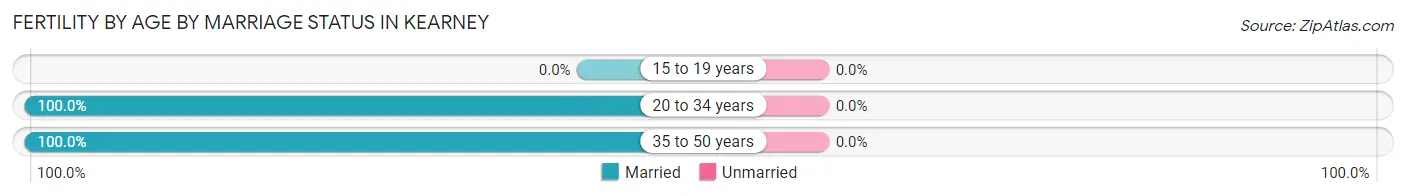
| Age Bracket | Married | Unmarried |
| 15 to 19 years | 0 (0.0%) | 0 (0.0%) |
| 20 to 34 years | 75 (100.0%) | 0 (0.0%) |
| 35 to 50 years | 31 (100.0%) | 0 (0.0%) |
| Total | 106 (100.0%) | 0 (0.0%) |
Fertility by Education in Kearney
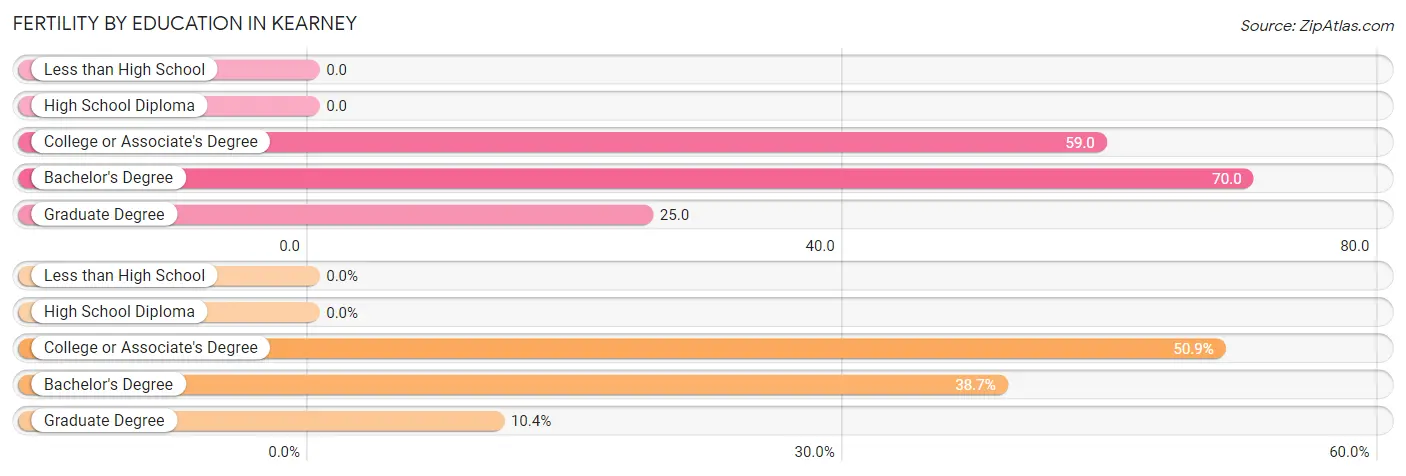
| Educational Attainment | Women with Births | Births / 1,000 Women |
| Less than High School | 0 (0.0%) | 0.0 |
| High School Diploma | 0 (0.0%) | 0.0 |
| College or Associate's Degree | 54 (50.9%) | 59.0 |
| Bachelor's Degree | 41 (38.7%) | 70.0 |
| Graduate Degree | 11 (10.4%) | 25.0 |
| Total | 106 (100.0%) | 38.0 |
Fertility by Education by Marriage Status in Kearney
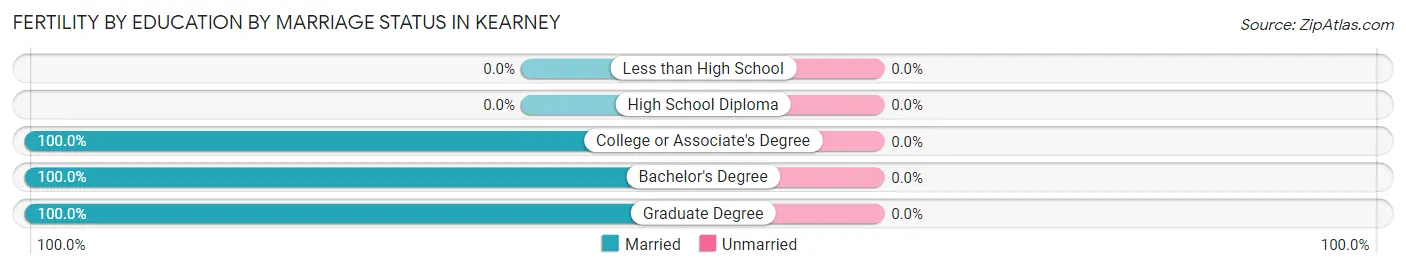
| Educational Attainment | Married | Unmarried |
| Less than High School | 0 (0.0%) | 0 (0.0%) |
| High School Diploma | 0 (0.0%) | 0 (0.0%) |
| College or Associate's Degree | 54 (100.0%) | 0 (0.0%) |
| Bachelor's Degree | 41 (100.0%) | 0 (0.0%) |
| Graduate Degree | 11 (100.0%) | 0 (0.0%) |
| Total | 106 (100.0%) | 0 (0.0%) |
Employment Characteristics in Kearney
Employment by Class of Employer in Kearney
Among the 5,953 employed individuals in Kearney, private company employees (3,954 | 66.4%), local government employees (592 | 9.9%), and not-for-profit organizations (565 | 9.5%) make up the most common classes of employment.
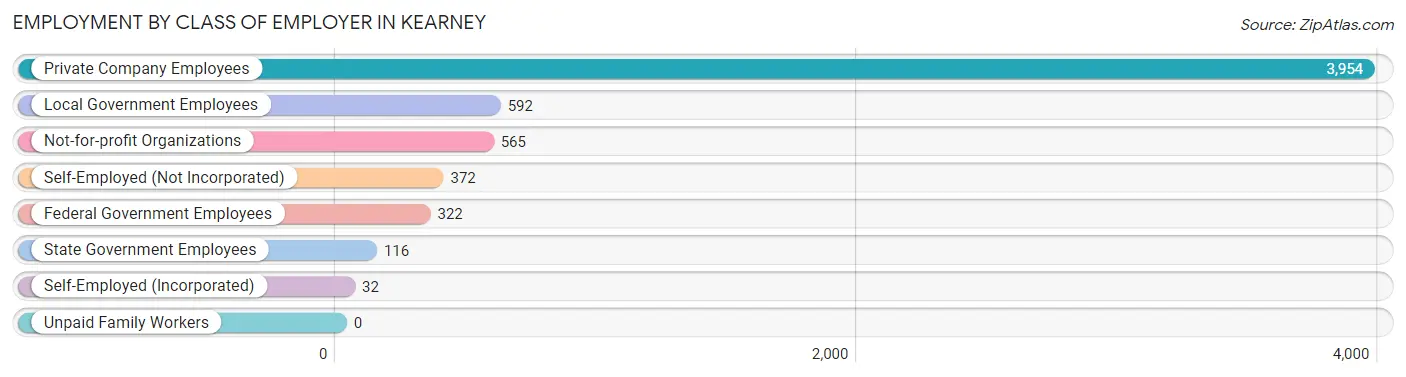
| Employer Class | # Employees | % Employees |
| Private Company Employees | 3,954 | 66.4% |
| Self-Employed (Incorporated) | 32 | 0.5% |
| Self-Employed (Not Incorporated) | 372 | 6.2% |
| Not-for-profit Organizations | 565 | 9.5% |
| Local Government Employees | 592 | 9.9% |
| State Government Employees | 116 | 1.9% |
| Federal Government Employees | 322 | 5.4% |
| Unpaid Family Workers | 0 | 0.0% |
| Total | 5,953 | 100.0% |
Employment Status by Age in Kearney
According to the labor force statistics for Kearney, out of the total population over 16 years of age (8,302), 75.3% or 6,251 individuals are in the labor force, with 1.4% or 88 of them unemployed. The age group with the highest labor force participation rate is 20 to 24 years, with 100.0% or 383 individuals in the labor force. Within the labor force, the 25 to 29 years age range has the highest percentage of unemployed individuals, with 6.5% or 42 of them being unemployed.
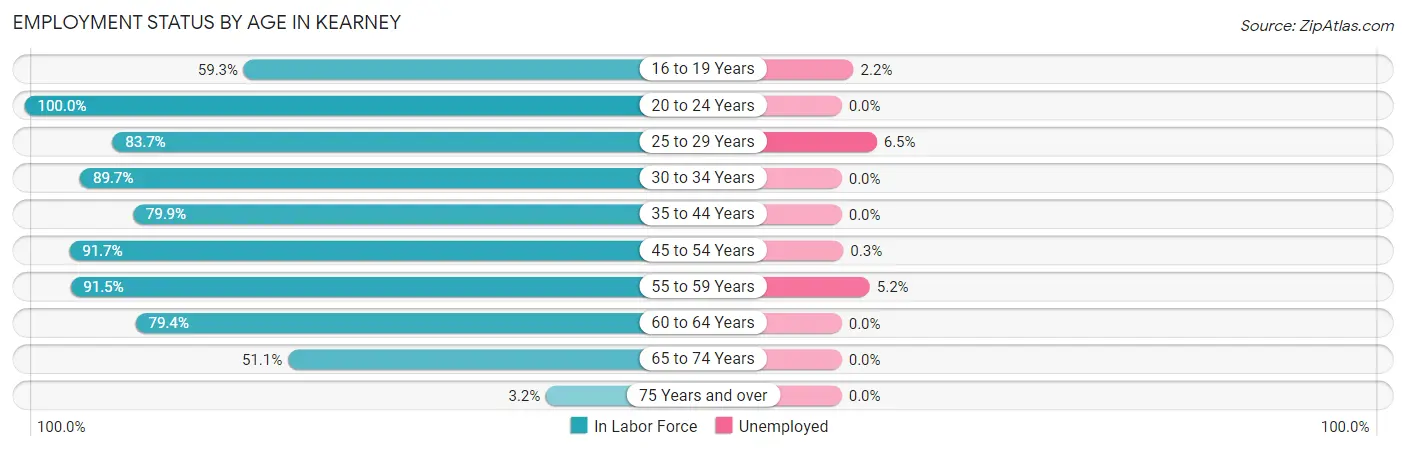
| Age Bracket | In Labor Force | Unemployed |
| 16 to 19 Years | 414 (59.3%) | 9 (2.2%) |
| 20 to 24 Years | 383 (100.0%) | 0 (0.0%) |
| 25 to 29 Years | 647 (83.7%) | 42 (6.5%) |
| 30 to 34 Years | 680 (89.7%) | 0 (0.0%) |
| 35 to 44 Years | 1,215 (79.9%) | 0 (0.0%) |
| 45 to 54 Years | 1,362 (91.7%) | 4 (0.3%) |
| 55 to 59 Years | 653 (91.5%) | 34 (5.2%) |
| 60 to 64 Years | 402 (79.4%) | 0 (0.0%) |
| 65 to 74 Years | 480 (51.1%) | 0 (0.0%) |
| 75 Years and over | 17 (3.2%) | 0 (0.0%) |
| Total | 6,251 (75.3%) | 88 (1.4%) |
Employment Status by Educational Attainment in Kearney
According to labor force statistics for Kearney, 86.1% of individuals (4,957) out of the total population between 25 and 64 years of age (5,757) are in the labor force, with 1.6% or 79 of them being unemployed. The group with the highest labor force participation rate are those with the educational attainment of bachelor's degree or higher, with 92.7% or 2,064 individuals in the labor force. Within the labor force, individuals with high school diploma education have the highest percentage of unemployment, with 4.1% or 42 of them being unemployed.
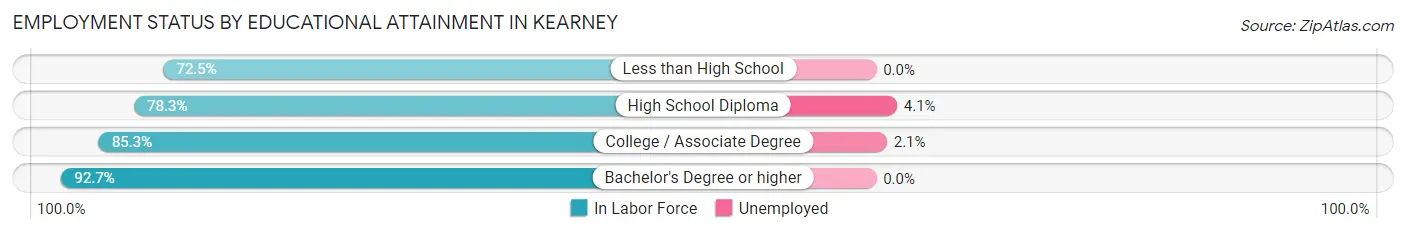
| Educational Attainment | In Labor Force | Unemployed |
| Less than High School | 132 (72.5%) | 0 (0.0%) |
| High School Diploma | 1,034 (78.3%) | 54 (4.1%) |
| College / Associate Degree | 1,730 (85.3%) | 43 (2.1%) |
| Bachelor's Degree or higher | 2,064 (92.7%) | 0 (0.0%) |
| Total | 4,957 (86.1%) | 92 (1.6%) |
Employment Occupations by Sex in Kearney
Management, Business, Science and Arts Occupations
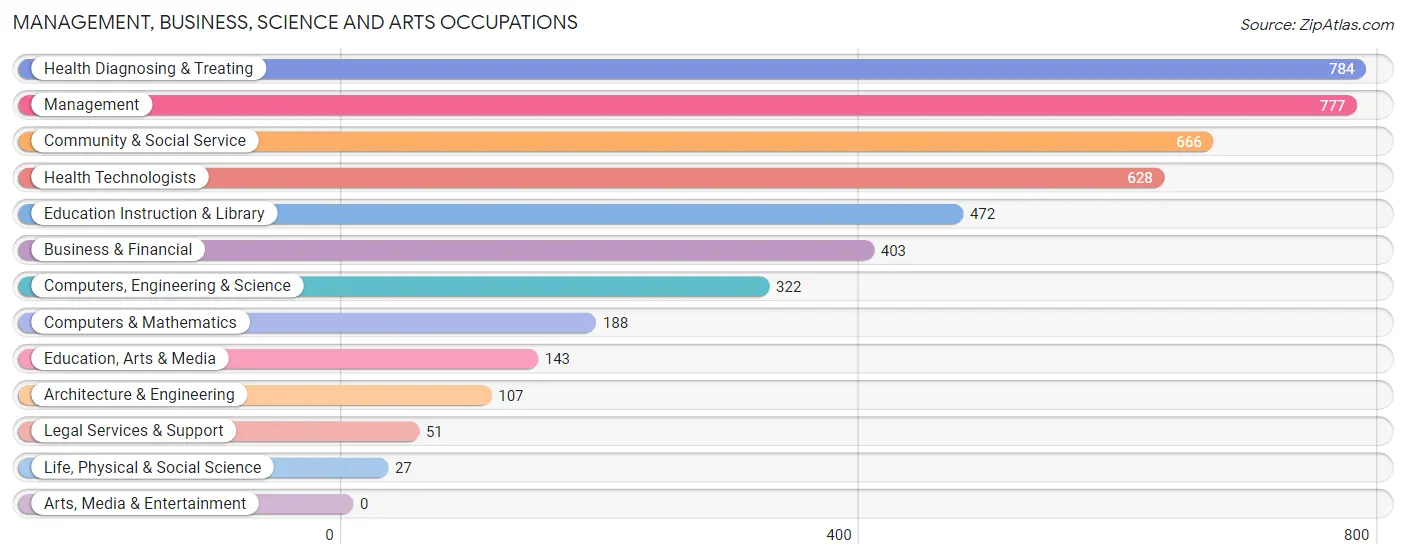
The most common Management, Business, Science and Arts occupations in Kearney are Health Diagnosing & Treating (784 | 12.9%), Management (777 | 12.8%), Community & Social Service (666 | 10.9%), Health Technologists (628 | 10.3%), and Education Instruction & Library (472 | 7.7%).
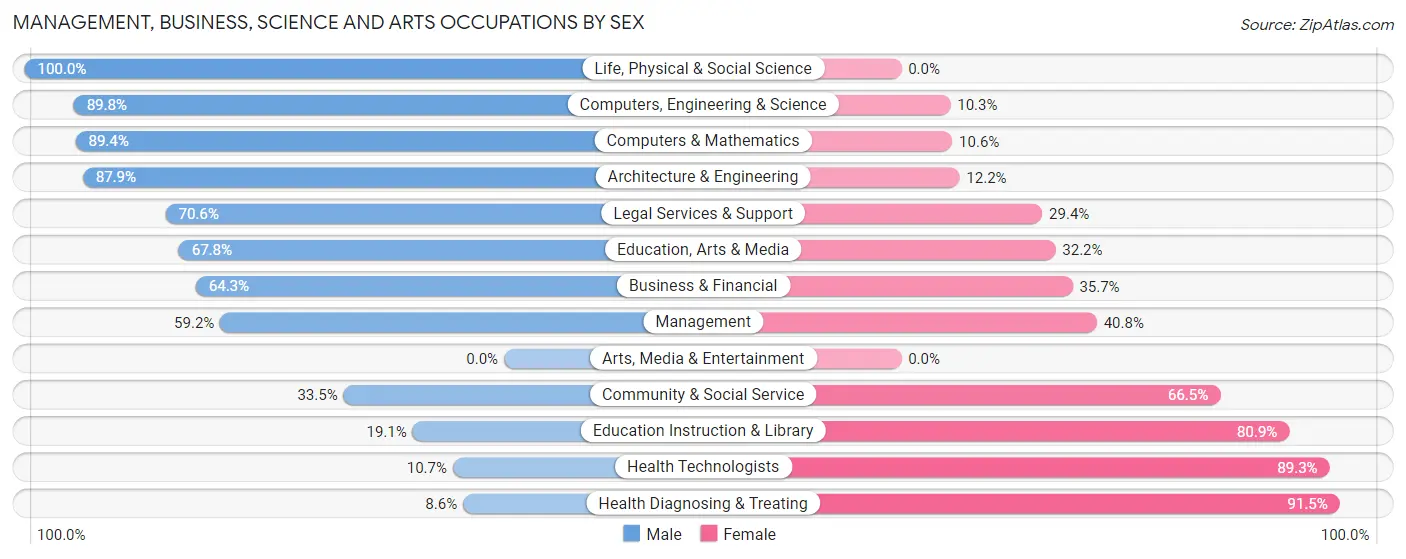
Management, Business, Science and Arts Occupations by Sex
Within the Management, Business, Science and Arts occupations in Kearney, the most male-oriented occupations are Life, Physical & Social Science (100.0%), Computers, Engineering & Science (89.7%), and Computers & Mathematics (89.4%), while the most female-oriented occupations are Health Diagnosing & Treating (91.4%), Health Technologists (89.3%), and Education Instruction & Library (80.9%).
| Occupation | Male | Female |
| Management | 460 (59.2%) | 317 (40.8%) |
| Business & Financial | 259 (64.3%) | 144 (35.7%) |
| Computers, Engineering & Science | 289 (89.7%) | 33 (10.2%) |
| Computers & Mathematics | 168 (89.4%) | 20 (10.6%) |
| Architecture & Engineering | 94 (87.8%) | 13 (12.1%) |
| Life, Physical & Social Science | 27 (100.0%) | 0 (0.0%) |
| Community & Social Service | 223 (33.5%) | 443 (66.5%) |
| Education, Arts & Media | 97 (67.8%) | 46 (32.2%) |
| Legal Services & Support | 36 (70.6%) | 15 (29.4%) |
| Education Instruction & Library | 90 (19.1%) | 382 (80.9%) |
| Arts, Media & Entertainment | 0 (0.0%) | 0 (0.0%) |
| Health Diagnosing & Treating | 67 (8.6%) | 717 (91.4%) |
| Health Technologists | 67 (10.7%) | 561 (89.3%) |
| Total (Category) | 1,298 (44.0%) | 1,654 (56.0%) |
| Total (Overall) | 3,293 (54.0%) | 2,800 (46.0%) |
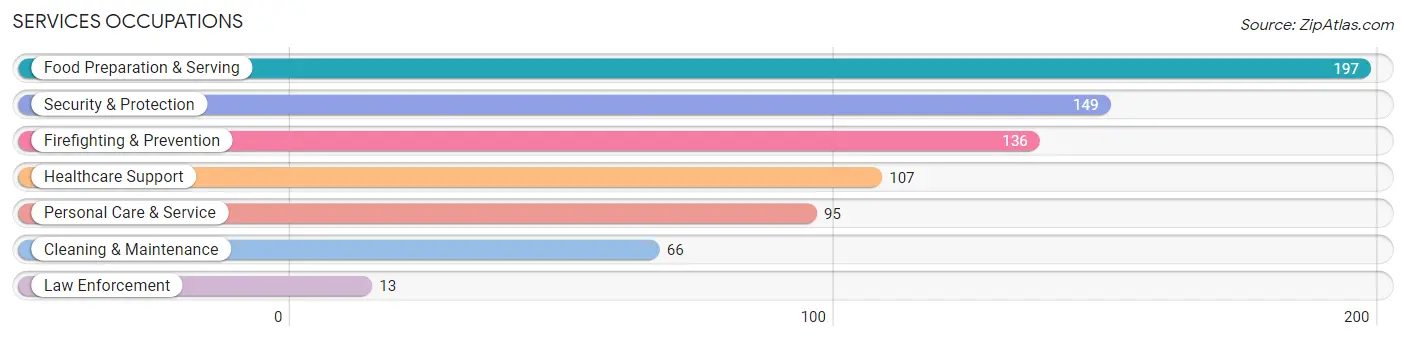
Services Occupations
The most common Services occupations in Kearney are Food Preparation & Serving (197 | 3.2%), Security & Protection (149 | 2.5%), Firefighting & Prevention (136 | 2.2%), Healthcare Support (107 | 1.8%), and Personal Care & Service (95 | 1.6%).
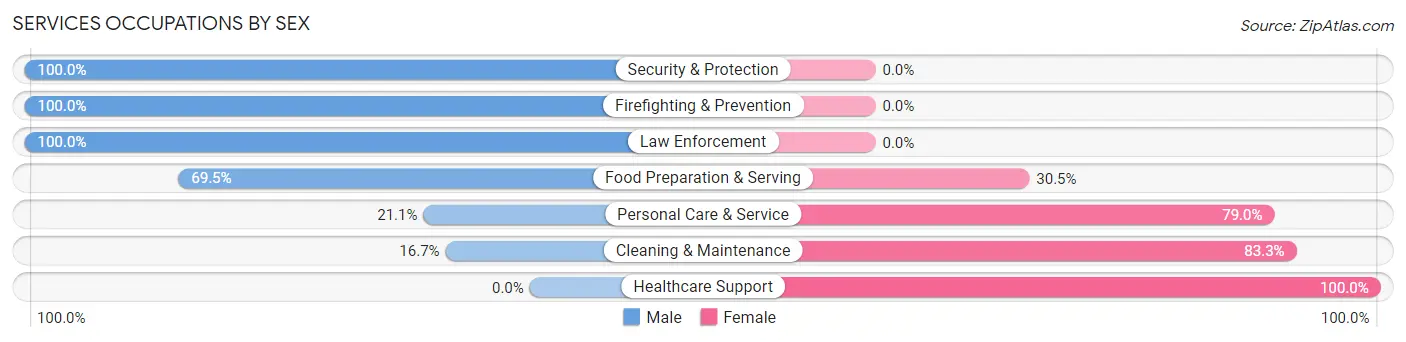
Services Occupations by Sex
Within the Services occupations in Kearney, the most male-oriented occupations are Security & Protection (100.0%), Firefighting & Prevention (100.0%), and Law Enforcement (100.0%), while the most female-oriented occupations are Healthcare Support (100.0%), Cleaning & Maintenance (83.3%), and Personal Care & Service (78.9%).
| Occupation | Male | Female |
| Healthcare Support | 0 (0.0%) | 107 (100.0%) |
| Security & Protection | 149 (100.0%) | 0 (0.0%) |
| Firefighting & Prevention | 136 (100.0%) | 0 (0.0%) |
| Law Enforcement | 13 (100.0%) | 0 (0.0%) |
| Food Preparation & Serving | 137 (69.5%) | 60 (30.5%) |
| Cleaning & Maintenance | 11 (16.7%) | 55 (83.3%) |
| Personal Care & Service | 20 (21.0%) | 75 (78.9%) |
| Total (Category) | 317 (51.6%) | 297 (48.4%) |
| Total (Overall) | 3,293 (54.0%) | 2,800 (46.0%) |
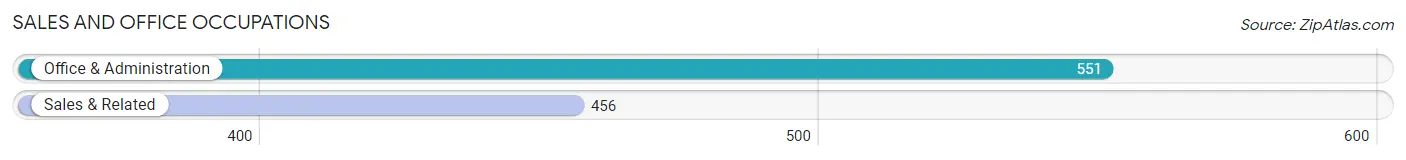
Sales and Office Occupations
The most common Sales and Office occupations in Kearney are Office & Administration (551 | 9.0%), and Sales & Related (456 | 7.5%).
Sales and Office Occupations by Sex
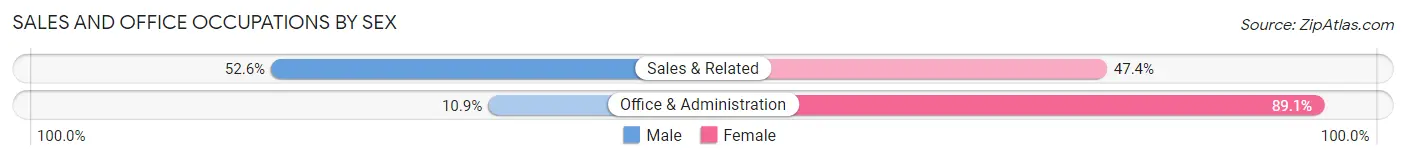
| Occupation | Male | Female |
| Sales & Related | 240 (52.6%) | 216 (47.4%) |
| Office & Administration | 60 (10.9%) | 491 (89.1%) |
| Total (Category) | 300 (29.8%) | 707 (70.2%) |
| Total (Overall) | 3,293 (54.0%) | 2,800 (46.0%) |
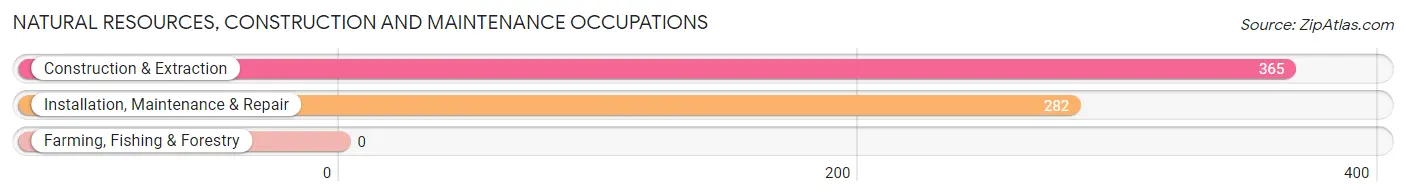
Natural Resources, Construction and Maintenance Occupations
The most common Natural Resources, Construction and Maintenance occupations in Kearney are Construction & Extraction (365 | 6.0%), and Installation, Maintenance & Repair (282 | 4.6%).
Natural Resources, Construction and Maintenance Occupations by Sex
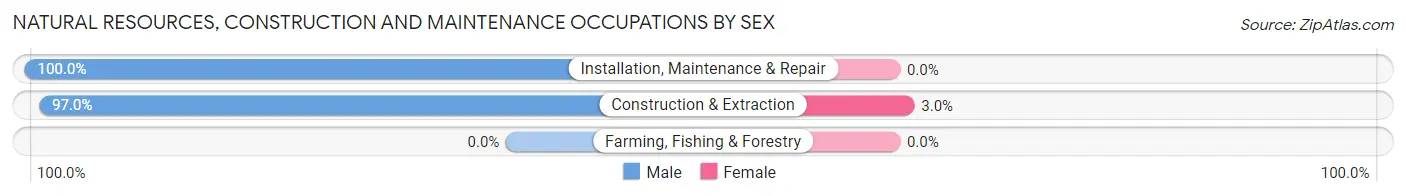
| Occupation | Male | Female |
| Farming, Fishing & Forestry | 0 (0.0%) | 0 (0.0%) |
| Construction & Extraction | 354 (97.0%) | 11 (3.0%) |
| Installation, Maintenance & Repair | 282 (100.0%) | 0 (0.0%) |
| Total (Category) | 636 (98.3%) | 11 (1.7%) |
| Total (Overall) | 3,293 (54.0%) | 2,800 (46.0%) |
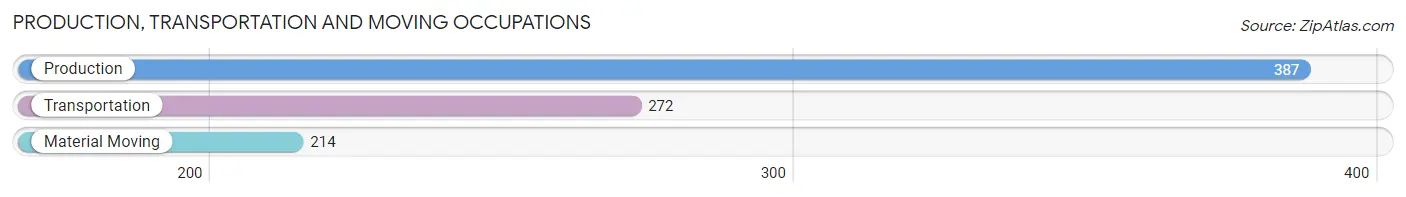
Production, Transportation and Moving Occupations
The most common Production, Transportation and Moving occupations in Kearney are Production (387 | 6.4%), Transportation (272 | 4.5%), and Material Moving (214 | 3.5%).
Production, Transportation and Moving Occupations by Sex
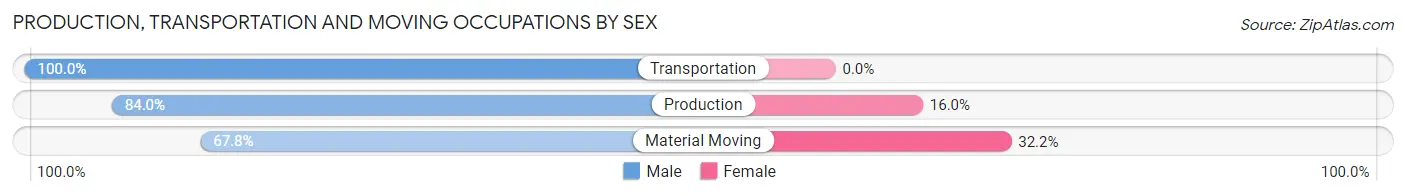
| Occupation | Male | Female |
| Production | 325 (84.0%) | 62 (16.0%) |
| Transportation | 272 (100.0%) | 0 (0.0%) |
| Material Moving | 145 (67.8%) | 69 (32.2%) |
| Total (Category) | 742 (85.0%) | 131 (15.0%) |
| Total (Overall) | 3,293 (54.0%) | 2,800 (46.0%) |
Employment Industries by Sex in Kearney
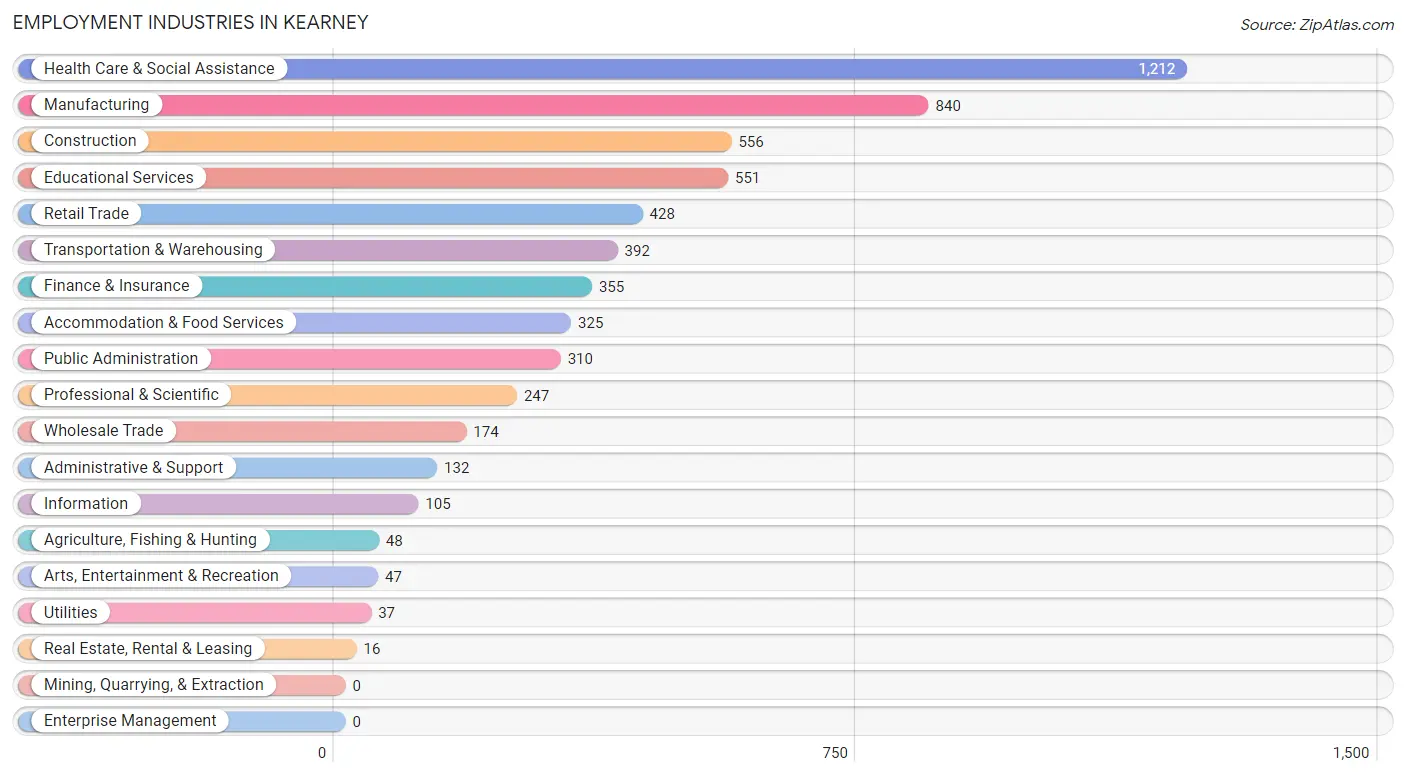
Employment Industries in Kearney
The major employment industries in Kearney include Health Care & Social Assistance (1,212 | 19.9%), Manufacturing (840 | 13.8%), Construction (556 | 9.1%), Educational Services (551 | 9.0%), and Retail Trade (428 | 7.0%).
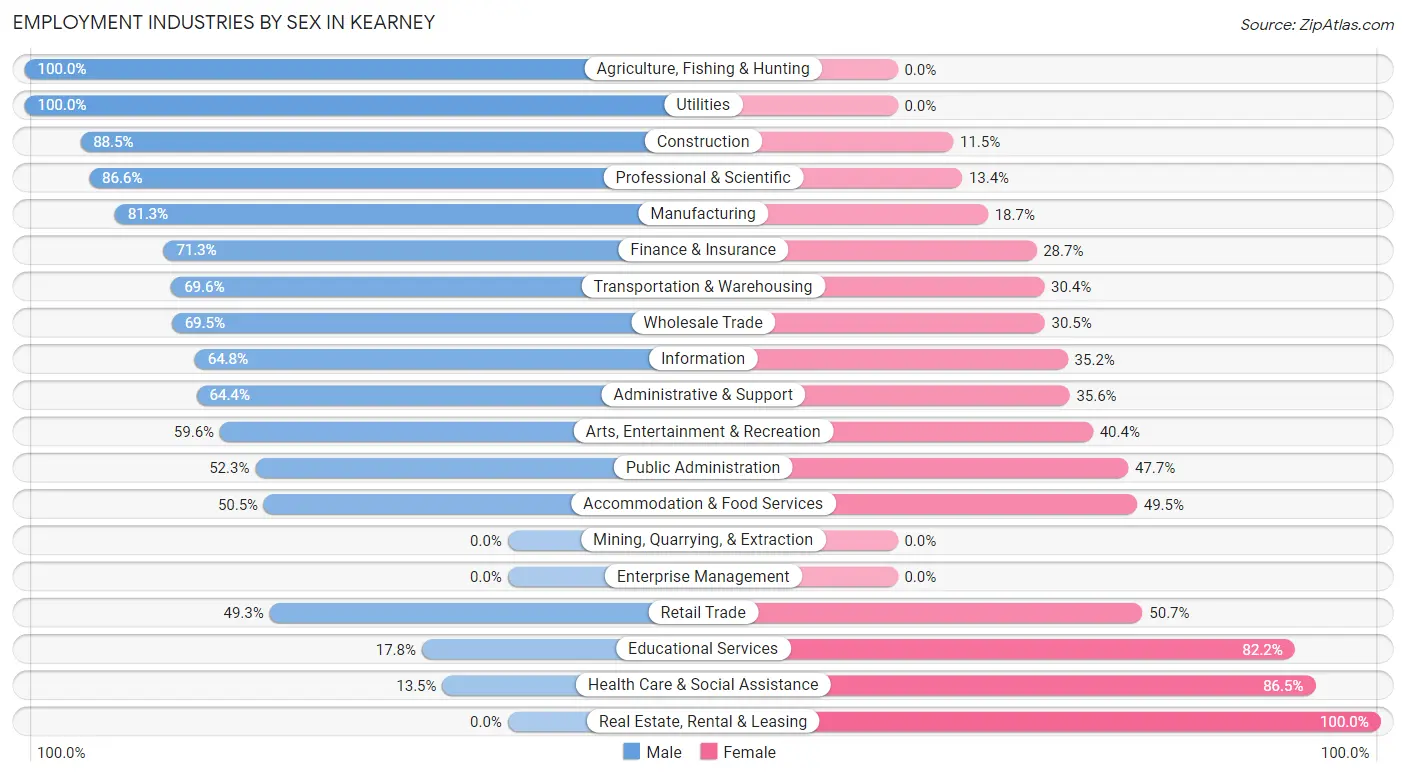
Employment Industries by Sex in Kearney
The Kearney industries that see more men than women are Agriculture, Fishing & Hunting (100.0%), Utilities (100.0%), and Construction (88.5%), whereas the industries that tend to have a higher number of women are Real Estate, Rental & Leasing (100.0%), Health Care & Social Assistance (86.5%), and Educational Services (82.2%).
| Industry | Male | Female |
| Agriculture, Fishing & Hunting | 48 (100.0%) | 0 (0.0%) |
| Mining, Quarrying, & Extraction | 0 (0.0%) | 0 (0.0%) |
| Construction | 492 (88.5%) | 64 (11.5%) |
| Manufacturing | 683 (81.3%) | 157 (18.7%) |
| Wholesale Trade | 121 (69.5%) | 53 (30.5%) |
| Retail Trade | 211 (49.3%) | 217 (50.7%) |
| Transportation & Warehousing | 273 (69.6%) | 119 (30.4%) |
| Utilities | 37 (100.0%) | 0 (0.0%) |
| Information | 68 (64.8%) | 37 (35.2%) |
| Finance & Insurance | 253 (71.3%) | 102 (28.7%) |
| Real Estate, Rental & Leasing | 0 (0.0%) | 16 (100.0%) |
| Professional & Scientific | 214 (86.6%) | 33 (13.4%) |
| Enterprise Management | 0 (0.0%) | 0 (0.0%) |
| Administrative & Support | 85 (64.4%) | 47 (35.6%) |
| Educational Services | 98 (17.8%) | 453 (82.2%) |
| Health Care & Social Assistance | 164 (13.5%) | 1,048 (86.5%) |
| Arts, Entertainment & Recreation | 28 (59.6%) | 19 (40.4%) |
| Accommodation & Food Services | 164 (50.5%) | 161 (49.5%) |
| Public Administration | 162 (52.3%) | 148 (47.7%) |
| Total | 3,293 (54.0%) | 2,800 (46.0%) |
Education in Kearney
School Enrollment in Kearney
The most common levels of schooling among the 2,612 students in Kearney are middle school (786 | 30.1%), high school (773 | 29.6%), and elementary school (349 | 13.4%).
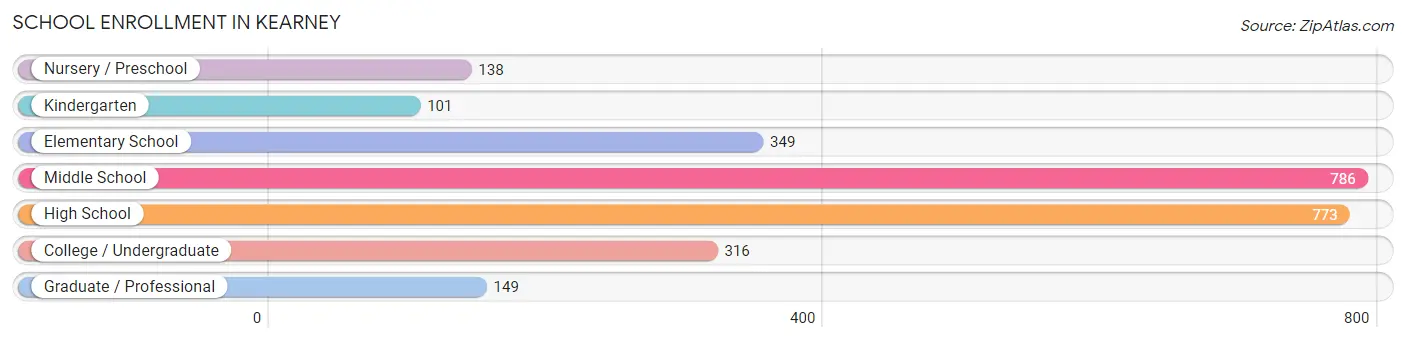
| School Level | # Students | % Students |
| Nursery / Preschool | 138 | 5.3% |
| Kindergarten | 101 | 3.9% |
| Elementary School | 349 | 13.4% |
| Middle School | 786 | 30.1% |
| High School | 773 | 29.6% |
| College / Undergraduate | 316 | 12.1% |
| Graduate / Professional | 149 | 5.7% |
| Total | 2,612 | 100.0% |
School Enrollment by Age by Funding Source in Kearney
Out of a total of 2,612 students who are enrolled in schools in Kearney, 407 (15.6%) attend a private institution, while the remaining 2,205 (84.4%) are enrolled in public schools. The age group of 20 to 24 year olds has the highest likelihood of being enrolled in private schools, with 96 (88.1% in the age bracket) enrolled. Conversely, the age group of 15 to 17 year olds has the lowest likelihood of being enrolled in a private school, with 574 (100.0% in the age bracket) attending a public institution.
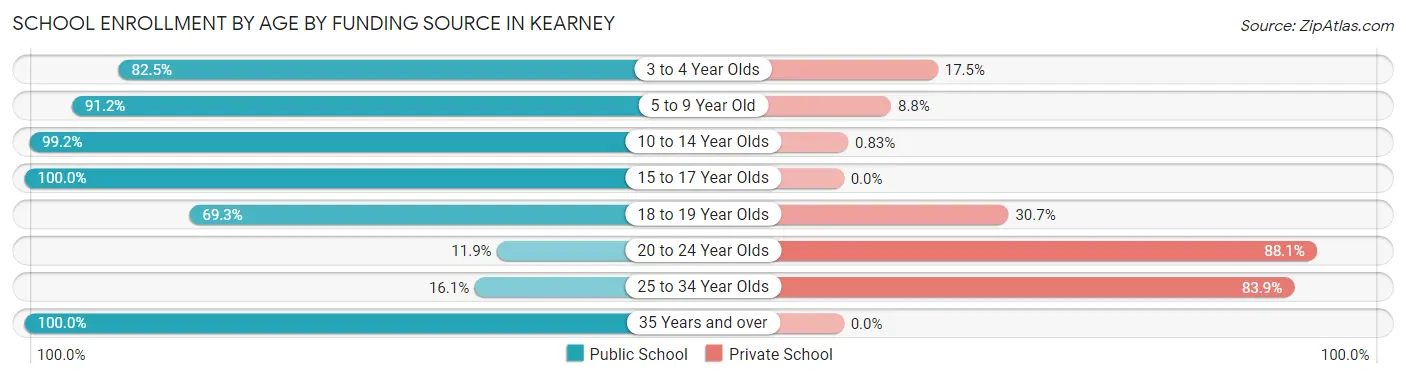
| Age Bracket | Public School | Private School |
| 3 to 4 Year Olds | 80 (82.5%) | 17 (17.5%) |
| 5 to 9 Year Old | 424 (91.2%) | 41 (8.8%) |
| 10 to 14 Year Olds | 836 (99.2%) | 7 (0.8%) |
| 15 to 17 Year Olds | 574 (100.0%) | 0 (0.0%) |
| 18 to 19 Year Olds | 158 (69.3%) | 70 (30.7%) |
| 20 to 24 Year Olds | 13 (11.9%) | 96 (88.1%) |
| 25 to 34 Year Olds | 34 (16.1%) | 177 (83.9%) |
| 35 Years and over | 85 (100.0%) | 0 (0.0%) |
| Total | 2,205 (84.4%) | 407 (15.6%) |
Educational Attainment by Field of Study in Kearney
Science & technology (637 | 22.6%), business (472 | 16.8%), education (383 | 13.6%), arts & humanities (303 | 10.8%), and social sciences (188 | 6.7%) are the most common fields of study among 2,816 individuals in Kearney who have obtained a bachelor's degree or higher.
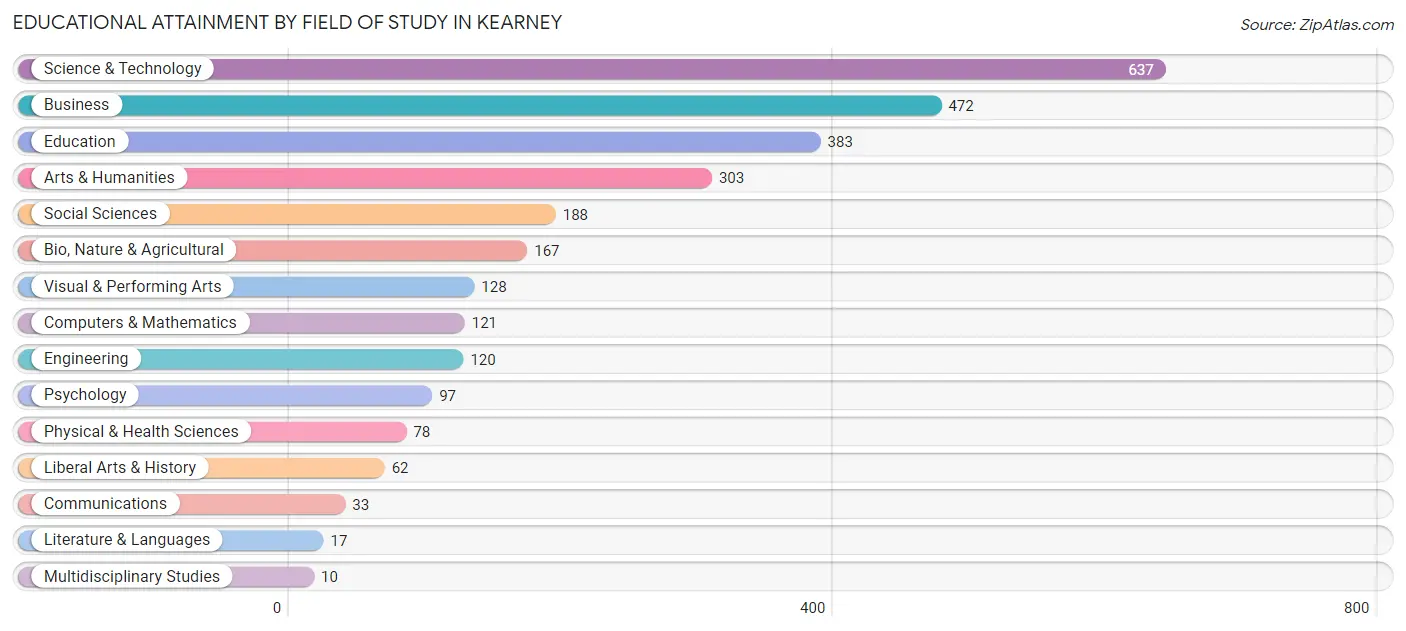
| Field of Study | # Graduates | % Graduates |
| Computers & Mathematics | 121 | 4.3% |
| Bio, Nature & Agricultural | 167 | 5.9% |
| Physical & Health Sciences | 78 | 2.8% |
| Psychology | 97 | 3.4% |
| Social Sciences | 188 | 6.7% |
| Engineering | 120 | 4.3% |
| Multidisciplinary Studies | 10 | 0.4% |
| Science & Technology | 637 | 22.6% |
| Business | 472 | 16.8% |
| Education | 383 | 13.6% |
| Literature & Languages | 17 | 0.6% |
| Liberal Arts & History | 62 | 2.2% |
| Visual & Performing Arts | 128 | 4.5% |
| Communications | 33 | 1.2% |
| Arts & Humanities | 303 | 10.8% |
| Total | 2,816 | 100.0% |
Transportation & Commute in Kearney
Vehicle Availability by Sex in Kearney
The most prevalent vehicle ownership categories in Kearney are males with 2 vehicles (1,106, accounting for 34.6%) and females with 2 vehicles (915, making up 40.1%).
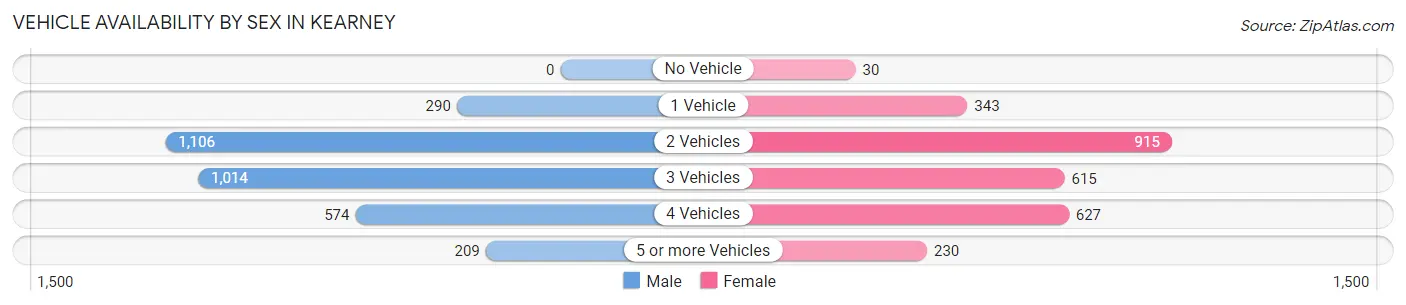
| Vehicles Available | Male | Female |
| No Vehicle | 0 (0.0%) | 30 (1.1%) |
| 1 Vehicle | 290 (9.1%) | 343 (12.4%) |
| 2 Vehicles | 1,106 (34.6%) | 915 (33.2%) |
| 3 Vehicles | 1,014 (31.8%) | 615 (22.3%) |
| 4 Vehicles | 574 (18.0%) | 627 (22.7%) |
| 5 or more Vehicles | 209 (6.6%) | 230 (8.3%) |
| Total | 3,193 (100.0%) | 2,760 (100.0%) |
Commute Time in Kearney
The most frequently occuring commute durations in Kearney are 30 to 34 minutes (872 commuters, 16.6%), 5 to 9 minutes (676 commuters, 12.9%), and 10 to 14 minutes (640 commuters, 12.2%).
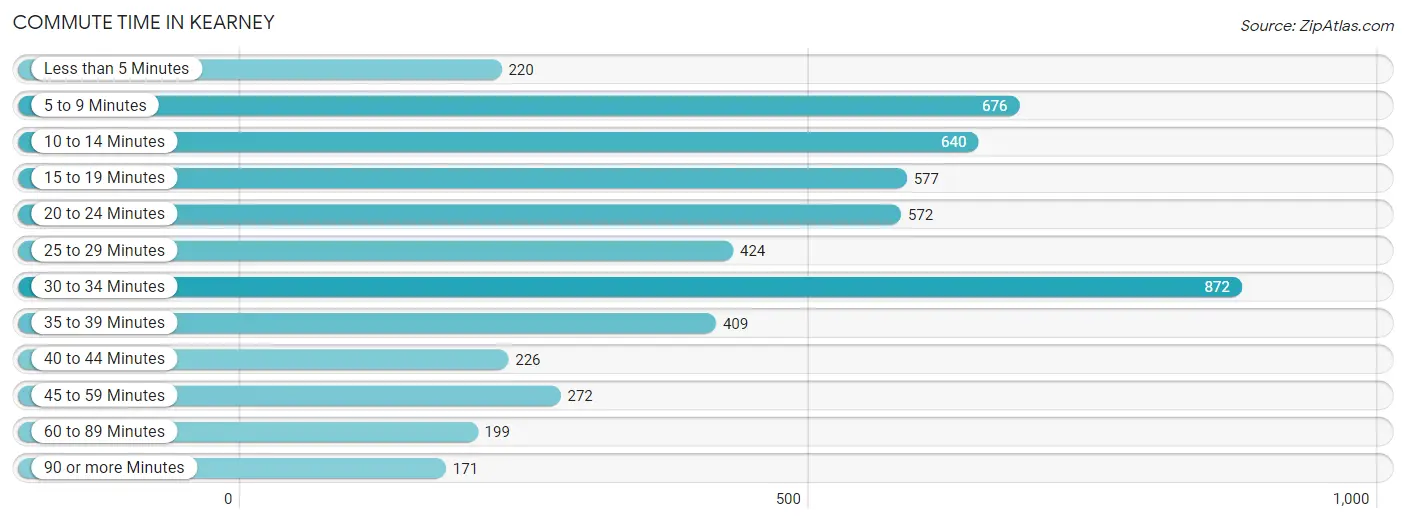
| Commute Time | # Commuters | % Commuters |
| Less than 5 Minutes | 220 | 4.2% |
| 5 to 9 Minutes | 676 | 12.9% |
| 10 to 14 Minutes | 640 | 12.2% |
| 15 to 19 Minutes | 577 | 11.0% |
| 20 to 24 Minutes | 572 | 10.9% |
| 25 to 29 Minutes | 424 | 8.1% |
| 30 to 34 Minutes | 872 | 16.6% |
| 35 to 39 Minutes | 409 | 7.8% |
| 40 to 44 Minutes | 226 | 4.3% |
| 45 to 59 Minutes | 272 | 5.2% |
| 60 to 89 Minutes | 199 | 3.8% |
| 90 or more Minutes | 171 | 3.3% |
Commute Time by Sex in Kearney
The most common commute times in Kearney are 30 to 34 minutes (567 commuters, 21.3%) for males and 10 to 14 minutes (468 commuters, 18.0%) for females.
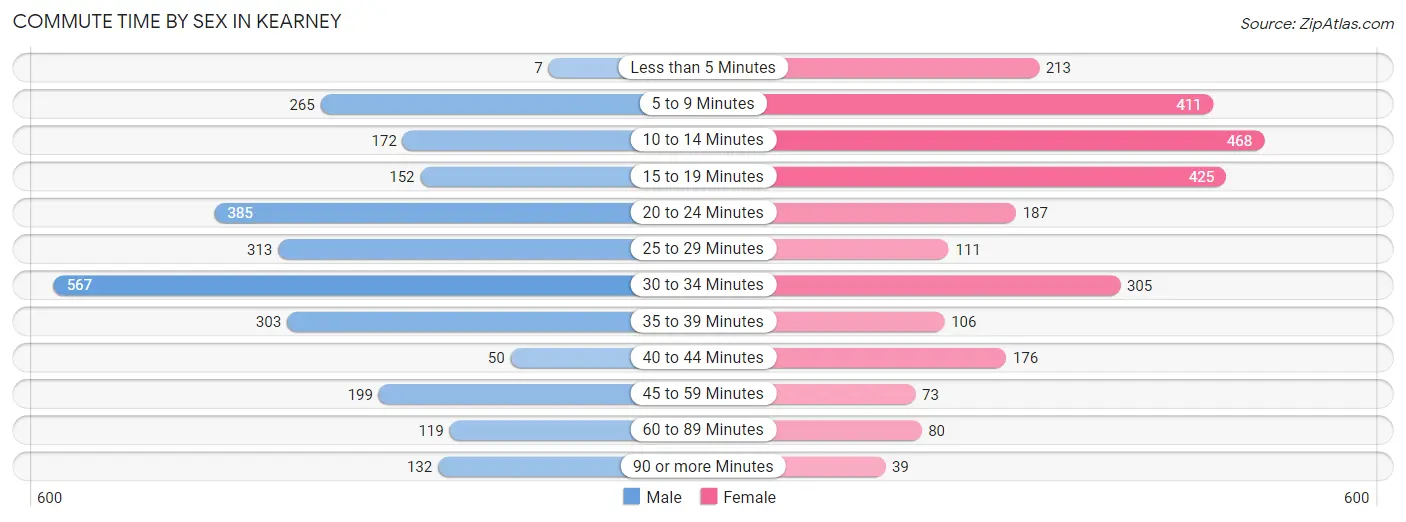
| Commute Time | Male | Female |
| Less than 5 Minutes | 7 (0.3%) | 213 (8.2%) |
| 5 to 9 Minutes | 265 (10.0%) | 411 (15.8%) |
| 10 to 14 Minutes | 172 (6.5%) | 468 (18.0%) |
| 15 to 19 Minutes | 152 (5.7%) | 425 (16.4%) |
| 20 to 24 Minutes | 385 (14.4%) | 187 (7.2%) |
| 25 to 29 Minutes | 313 (11.7%) | 111 (4.3%) |
| 30 to 34 Minutes | 567 (21.3%) | 305 (11.8%) |
| 35 to 39 Minutes | 303 (11.4%) | 106 (4.1%) |
| 40 to 44 Minutes | 50 (1.9%) | 176 (6.8%) |
| 45 to 59 Minutes | 199 (7.5%) | 73 (2.8%) |
| 60 to 89 Minutes | 119 (4.5%) | 80 (3.1%) |
| 90 or more Minutes | 132 (5.0%) | 39 (1.5%) |
Time of Departure to Work by Sex in Kearney
The most frequent times of departure to work in Kearney are 7:00 AM to 7:29 AM (504, 18.9%) for males and 7:00 AM to 7:29 AM (573, 22.1%) for females.
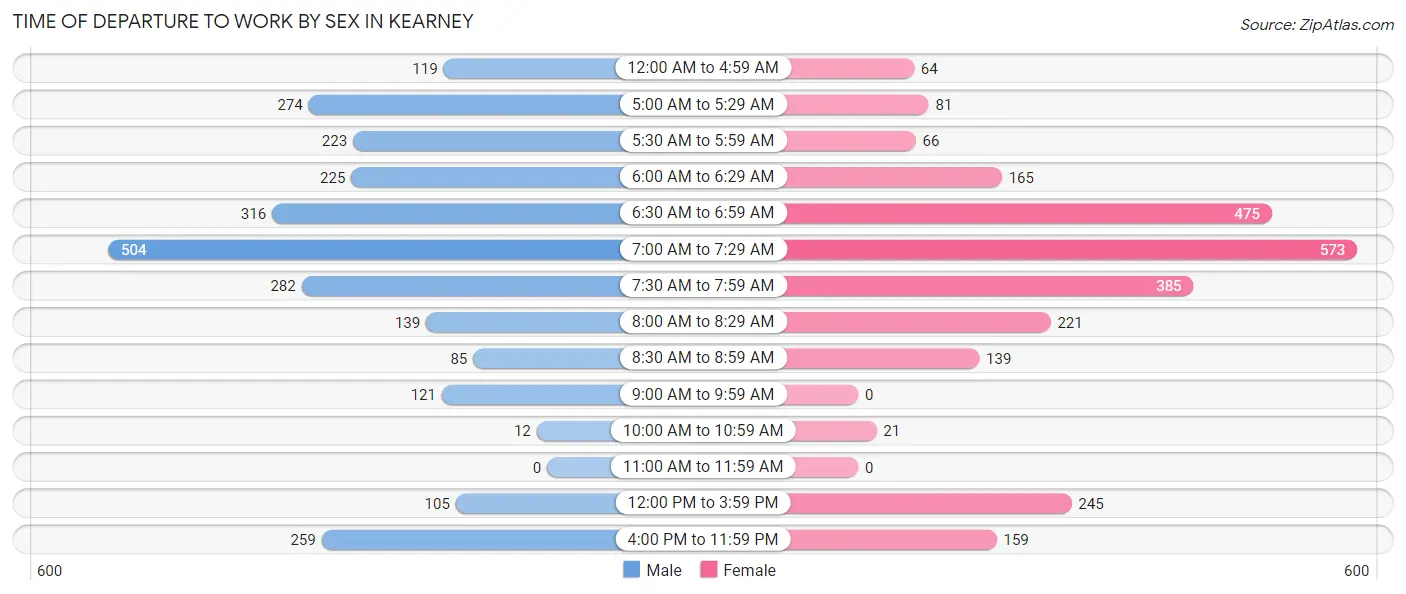
| Time of Departure | Male | Female |
| 12:00 AM to 4:59 AM | 119 (4.5%) | 64 (2.5%) |
| 5:00 AM to 5:29 AM | 274 (10.3%) | 81 (3.1%) |
| 5:30 AM to 5:59 AM | 223 (8.4%) | 66 (2.5%) |
| 6:00 AM to 6:29 AM | 225 (8.5%) | 165 (6.4%) |
| 6:30 AM to 6:59 AM | 316 (11.9%) | 475 (18.3%) |
| 7:00 AM to 7:29 AM | 504 (18.9%) | 573 (22.1%) |
| 7:30 AM to 7:59 AM | 282 (10.6%) | 385 (14.8%) |
| 8:00 AM to 8:29 AM | 139 (5.2%) | 221 (8.5%) |
| 8:30 AM to 8:59 AM | 85 (3.2%) | 139 (5.4%) |
| 9:00 AM to 9:59 AM | 121 (4.5%) | 0 (0.0%) |
| 10:00 AM to 10:59 AM | 12 (0.4%) | 21 (0.8%) |
| 11:00 AM to 11:59 AM | 0 (0.0%) | 0 (0.0%) |
| 12:00 PM to 3:59 PM | 105 (3.9%) | 245 (9.4%) |
| 4:00 PM to 11:59 PM | 259 (9.7%) | 159 (6.1%) |
| Total | 2,664 (100.0%) | 2,594 (100.0%) |
Housing Occupancy in Kearney
Occupancy by Ownership in Kearney
Of the total 3,982 dwellings in Kearney, owner-occupied units account for 3,102 (77.9%), while renter-occupied units make up 880 (22.1%).
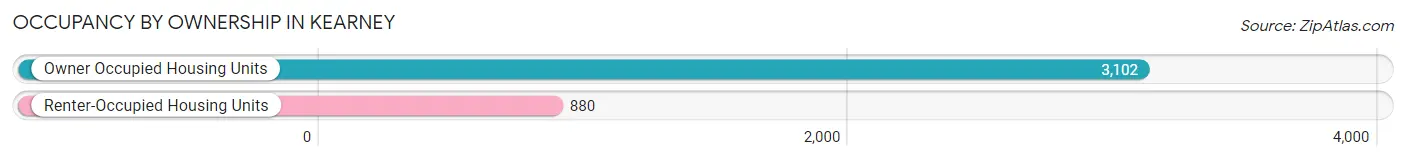
| Occupancy | # Housing Units | % Housing Units |
| Owner Occupied Housing Units | 3,102 | 77.9% |
| Renter-Occupied Housing Units | 880 | 22.1% |
| Total Occupied Housing Units | 3,982 | 100.0% |
Occupancy by Household Size in Kearney
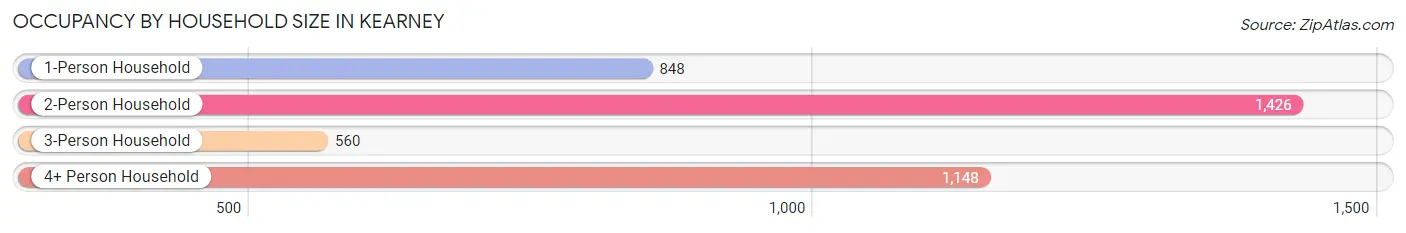
| Household Size | # Housing Units | % Housing Units |
| 1-Person Household | 848 | 21.3% |
| 2-Person Household | 1,426 | 35.8% |
| 3-Person Household | 560 | 14.1% |
| 4+ Person Household | 1,148 | 28.8% |
| Total Housing Units | 3,982 | 100.0% |
Occupancy by Ownership by Household Size in Kearney
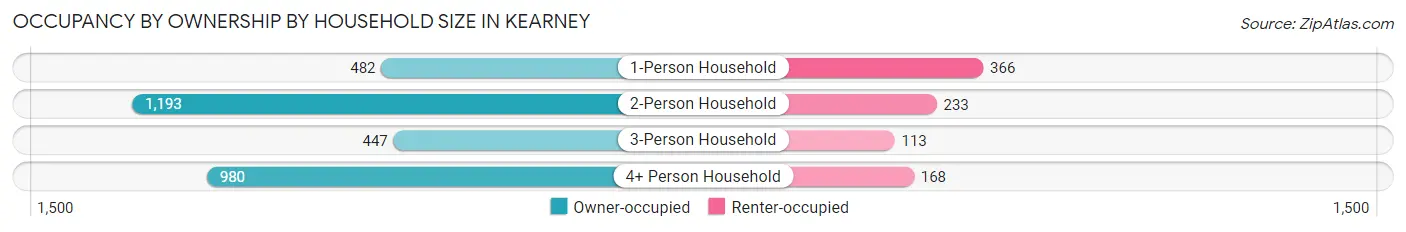
| Household Size | Owner-occupied | Renter-occupied |
| 1-Person Household | 482 (56.8%) | 366 (43.2%) |
| 2-Person Household | 1,193 (83.7%) | 233 (16.3%) |
| 3-Person Household | 447 (79.8%) | 113 (20.2%) |
| 4+ Person Household | 980 (85.4%) | 168 (14.6%) |
| Total Housing Units | 3,102 (77.9%) | 880 (22.1%) |
Occupancy by Educational Attainment in Kearney
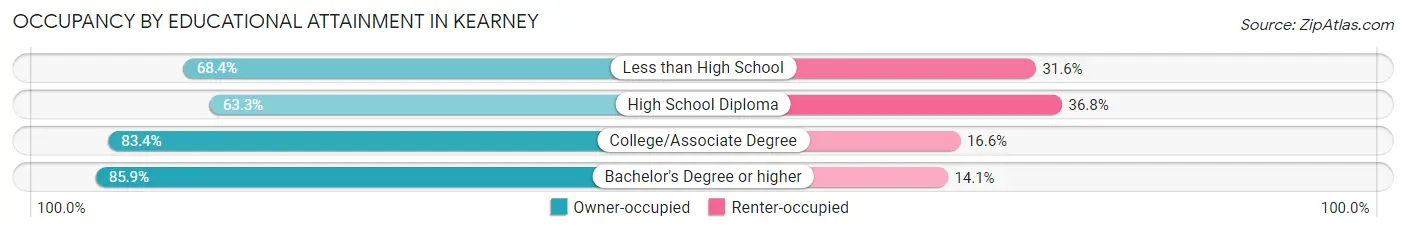
| Household Size | Owner-occupied | Renter-occupied |
| Less than High School | 91 (68.4%) | 42 (31.6%) |
| High School Diploma | 740 (63.2%) | 430 (36.7%) |
| College/Associate Degree | 989 (83.4%) | 197 (16.6%) |
| Bachelor's Degree or higher | 1,282 (85.9%) | 211 (14.1%) |
Occupancy by Age of Householder in Kearney
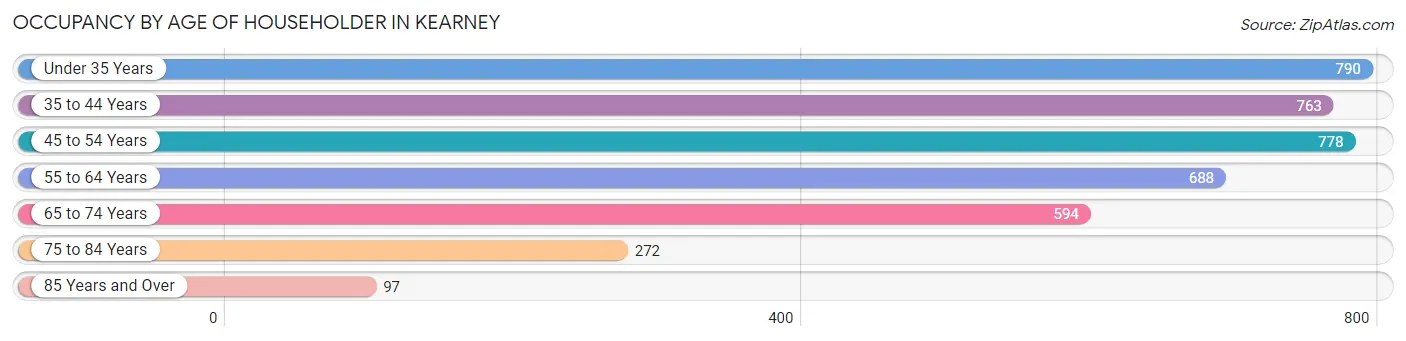
| Age Bracket | # Households | % Households |
| Under 35 Years | 790 | 19.8% |
| 35 to 44 Years | 763 | 19.2% |
| 45 to 54 Years | 778 | 19.5% |
| 55 to 64 Years | 688 | 17.3% |
| 65 to 74 Years | 594 | 14.9% |
| 75 to 84 Years | 272 | 6.8% |
| 85 Years and Over | 97 | 2.4% |
| Total | 3,982 | 100.0% |
Housing Finances in Kearney
Median Income by Occupancy in Kearney
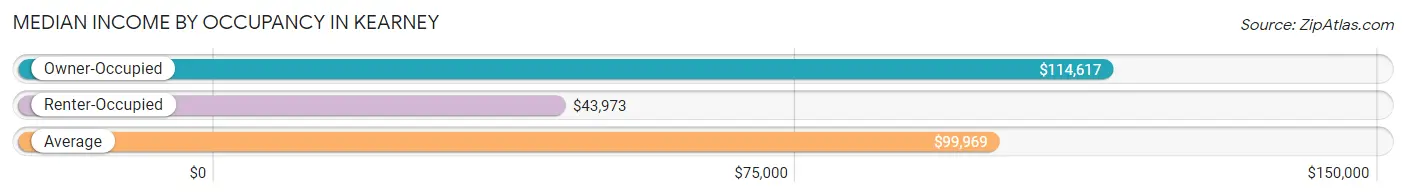
| Occupancy Type | # Households | Median Income |
| Owner-Occupied | 3,102 (77.9%) | $114,617 |
| Renter-Occupied | 880 (22.1%) | $43,973 |
| Average | 3,982 (100.0%) | $99,969 |
Occupancy by Householder Income Bracket in Kearney
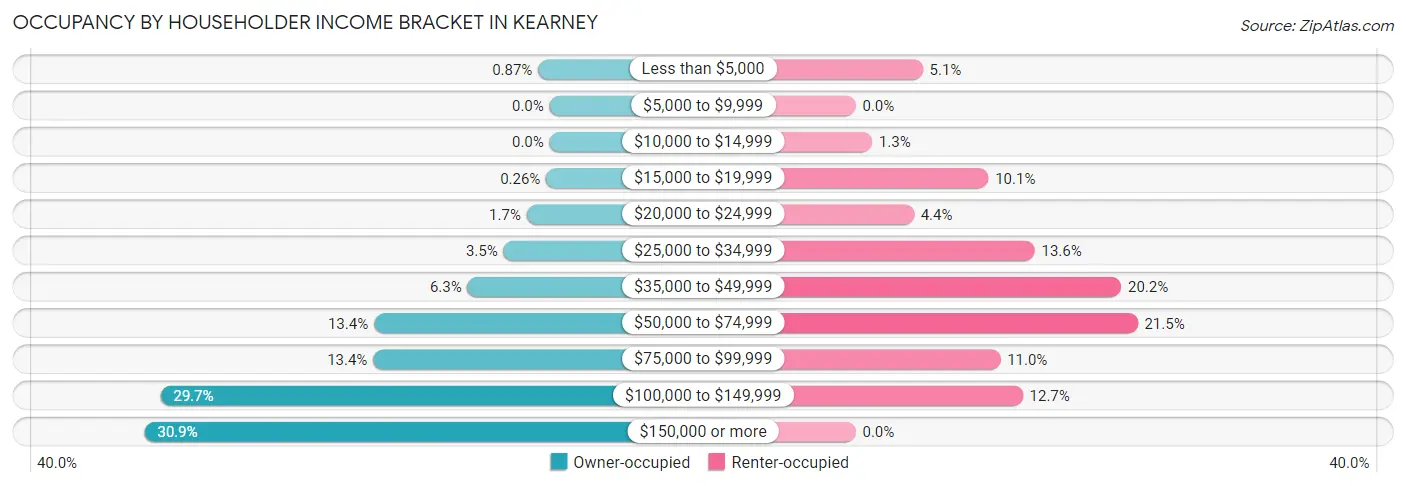
| Income Bracket | Owner-occupied | Renter-occupied |
| Less than $5,000 | 27 (0.9%) | 45 (5.1%) |
| $5,000 to $9,999 | 0 (0.0%) | 0 (0.0%) |
| $10,000 to $14,999 | 0 (0.0%) | 11 (1.3%) |
| $15,000 to $19,999 | 8 (0.3%) | 89 (10.1%) |
| $20,000 to $24,999 | 54 (1.7%) | 39 (4.4%) |
| $25,000 to $34,999 | 109 (3.5%) | 120 (13.6%) |
| $35,000 to $49,999 | 194 (6.2%) | 178 (20.2%) |
| $50,000 to $74,999 | 415 (13.4%) | 189 (21.5%) |
| $75,000 to $99,999 | 417 (13.4%) | 97 (11.0%) |
| $100,000 to $149,999 | 920 (29.7%) | 112 (12.7%) |
| $150,000 or more | 958 (30.9%) | 0 (0.0%) |
| Total | 3,102 (100.0%) | 880 (100.0%) |
Monthly Housing Cost Tiers in Kearney
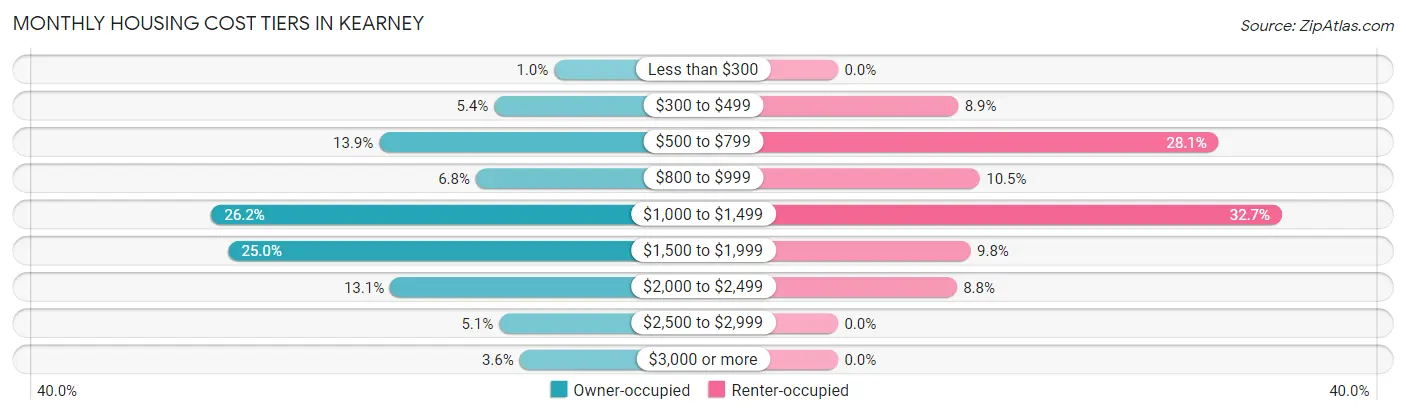
| Monthly Cost | Owner-occupied | Renter-occupied |
| Less than $300 | 31 (1.0%) | 0 (0.0%) |
| $300 to $499 | 168 (5.4%) | 78 (8.9%) |
| $500 to $799 | 431 (13.9%) | 247 (28.1%) |
| $800 to $999 | 210 (6.8%) | 92 (10.4%) |
| $1,000 to $1,499 | 814 (26.2%) | 288 (32.7%) |
| $1,500 to $1,999 | 775 (25.0%) | 86 (9.8%) |
| $2,000 to $2,499 | 406 (13.1%) | 77 (8.7%) |
| $2,500 to $2,999 | 157 (5.1%) | 0 (0.0%) |
| $3,000 or more | 110 (3.5%) | 0 (0.0%) |
| Total | 3,102 (100.0%) | 880 (100.0%) |
Physical Housing Characteristics in Kearney
Housing Structures in Kearney
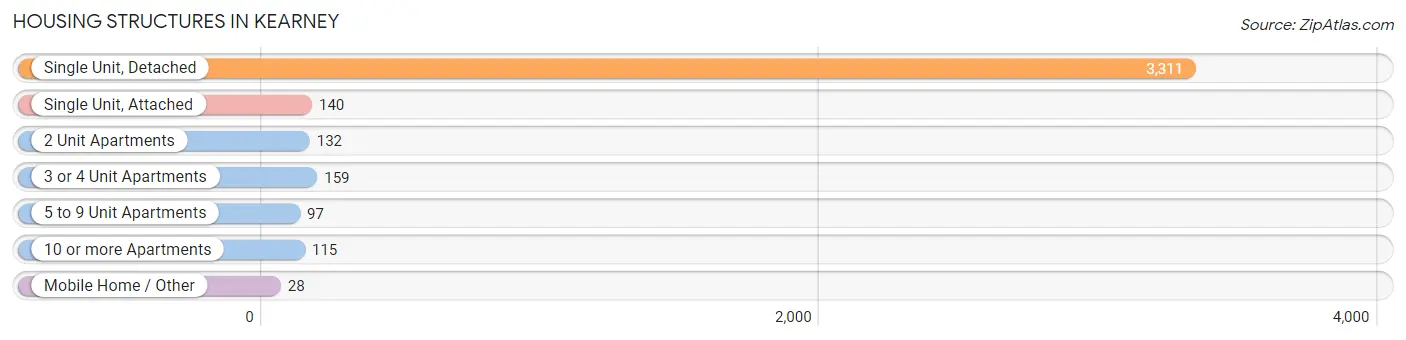
| Structure Type | # Housing Units | % Housing Units |
| Single Unit, Detached | 3,311 | 83.2% |
| Single Unit, Attached | 140 | 3.5% |
| 2 Unit Apartments | 132 | 3.3% |
| 3 or 4 Unit Apartments | 159 | 4.0% |
| 5 to 9 Unit Apartments | 97 | 2.4% |
| 10 or more Apartments | 115 | 2.9% |
| Mobile Home / Other | 28 | 0.7% |
| Total | 3,982 | 100.0% |
Housing Structures by Occupancy in Kearney
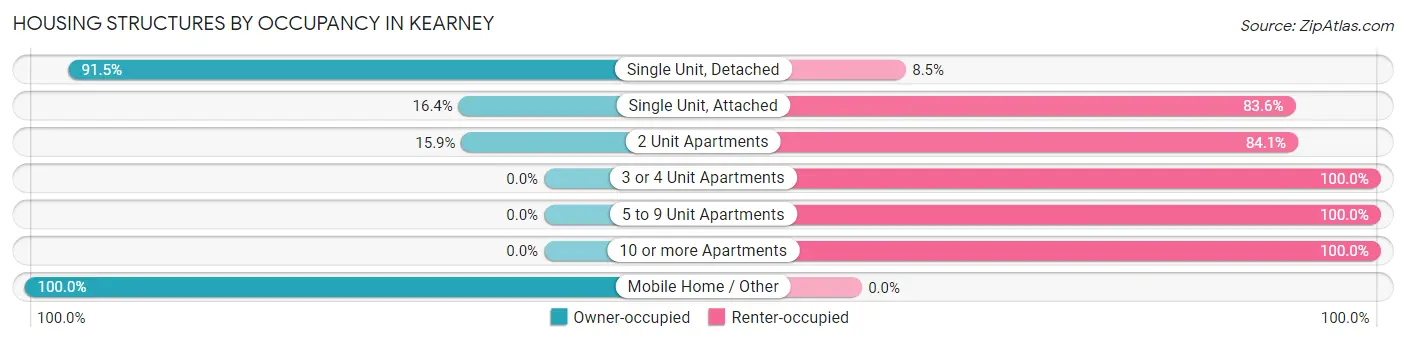
| Structure Type | Owner-occupied | Renter-occupied |
| Single Unit, Detached | 3,030 (91.5%) | 281 (8.5%) |
| Single Unit, Attached | 23 (16.4%) | 117 (83.6%) |
| 2 Unit Apartments | 21 (15.9%) | 111 (84.1%) |
| 3 or 4 Unit Apartments | 0 (0.0%) | 159 (100.0%) |
| 5 to 9 Unit Apartments | 0 (0.0%) | 97 (100.0%) |
| 10 or more Apartments | 0 (0.0%) | 115 (100.0%) |
| Mobile Home / Other | 28 (100.0%) | 0 (0.0%) |
| Total | 3,102 (77.9%) | 880 (22.1%) |
Housing Structures by Number of Rooms in Kearney
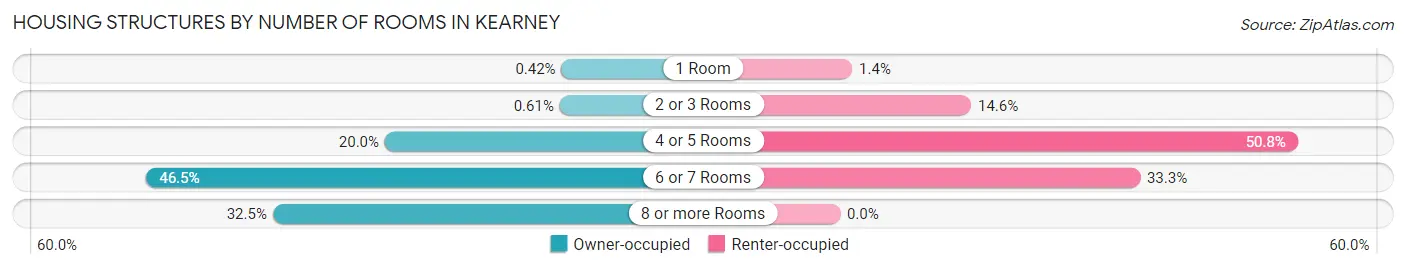
| Number of Rooms | Owner-occupied | Renter-occupied |
| 1 Room | 13 (0.4%) | 12 (1.4%) |
| 2 or 3 Rooms | 19 (0.6%) | 128 (14.5%) |
| 4 or 5 Rooms | 621 (20.0%) | 447 (50.8%) |
| 6 or 7 Rooms | 1,442 (46.5%) | 293 (33.3%) |
| 8 or more Rooms | 1,007 (32.5%) | 0 (0.0%) |
| Total | 3,102 (100.0%) | 880 (100.0%) |
Housing Structure by Heating Type in Kearney
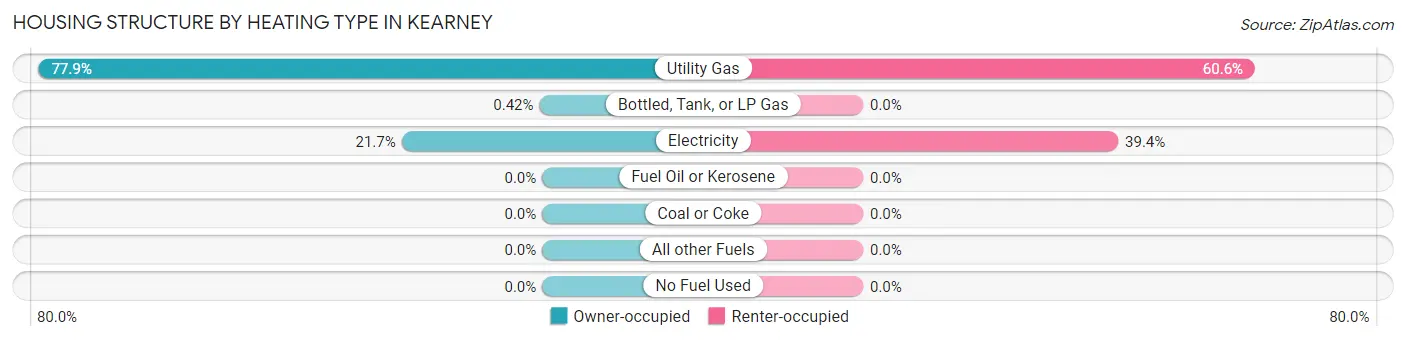
| Heating Type | Owner-occupied | Renter-occupied |
| Utility Gas | 2,415 (77.8%) | 533 (60.6%) |
| Bottled, Tank, or LP Gas | 13 (0.4%) | 0 (0.0%) |
| Electricity | 674 (21.7%) | 347 (39.4%) |
| Fuel Oil or Kerosene | 0 (0.0%) | 0 (0.0%) |
| Coal or Coke | 0 (0.0%) | 0 (0.0%) |
| All other Fuels | 0 (0.0%) | 0 (0.0%) |
| No Fuel Used | 0 (0.0%) | 0 (0.0%) |
| Total | 3,102 (100.0%) | 880 (100.0%) |
Household Vehicle Usage in Kearney
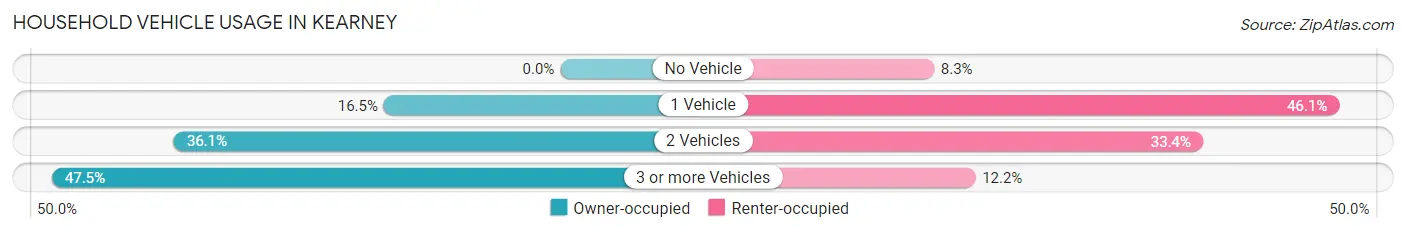
| Vehicles per Household | Owner-occupied | Renter-occupied |
| No Vehicle | 0 (0.0%) | 73 (8.3%) |
| 1 Vehicle | 511 (16.5%) | 406 (46.1%) |
| 2 Vehicles | 1,119 (36.1%) | 294 (33.4%) |
| 3 or more Vehicles | 1,472 (47.4%) | 107 (12.2%) |
| Total | 3,102 (100.0%) | 880 (100.0%) |
Real Estate & Mortgages in Kearney
Real Estate and Mortgage Overview in Kearney
| Characteristic | Without Mortgage | With Mortgage |
| Housing Units | 688 | 2,414 |
| Median Property Value | $256,600 | $268,900 |
| Median Household Income | $70,625 | $855 |
| Monthly Housing Costs | $597 | $110 |
| Real Estate Taxes | $2,667 | $34 |
Property Value by Mortgage Status in Kearney
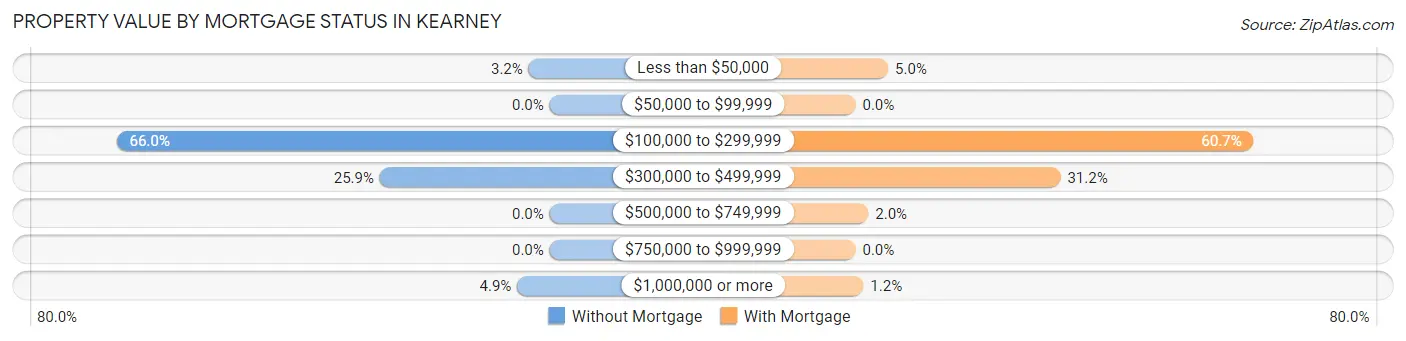
| Property Value | Without Mortgage | With Mortgage |
| Less than $50,000 | 22 (3.2%) | 120 (5.0%) |
| $50,000 to $99,999 | 0 (0.0%) | 0 (0.0%) |
| $100,000 to $299,999 | 454 (66.0%) | 1,464 (60.7%) |
| $300,000 to $499,999 | 178 (25.9%) | 754 (31.2%) |
| $500,000 to $749,999 | 0 (0.0%) | 47 (1.9%) |
| $750,000 to $999,999 | 0 (0.0%) | 0 (0.0%) |
| $1,000,000 or more | 34 (4.9%) | 29 (1.2%) |
| Total | 688 (100.0%) | 2,414 (100.0%) |
Household Income by Mortgage Status in Kearney
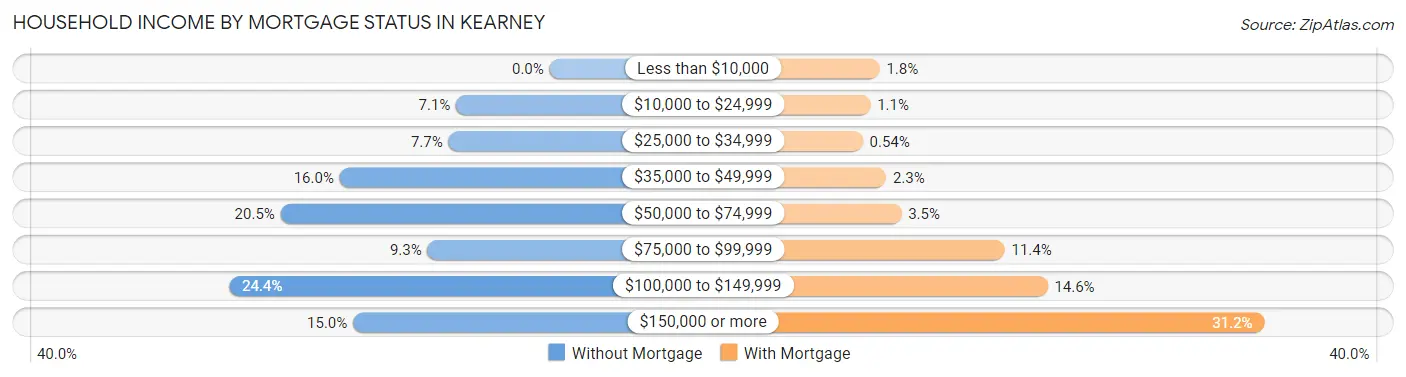
| Household Income | Without Mortgage | With Mortgage |
| Less than $10,000 | 0 (0.0%) | 44 (1.8%) |
| $10,000 to $24,999 | 49 (7.1%) | 27 (1.1%) |
| $25,000 to $34,999 | 53 (7.7%) | 13 (0.5%) |
| $35,000 to $49,999 | 110 (16.0%) | 56 (2.3%) |
| $50,000 to $74,999 | 141 (20.5%) | 84 (3.5%) |
| $75,000 to $99,999 | 64 (9.3%) | 274 (11.4%) |
| $100,000 to $149,999 | 168 (24.4%) | 353 (14.6%) |
| $150,000 or more | 103 (15.0%) | 752 (31.1%) |
| Total | 688 (100.0%) | 2,414 (100.0%) |
Property Value to Household Income Ratio in Kearney
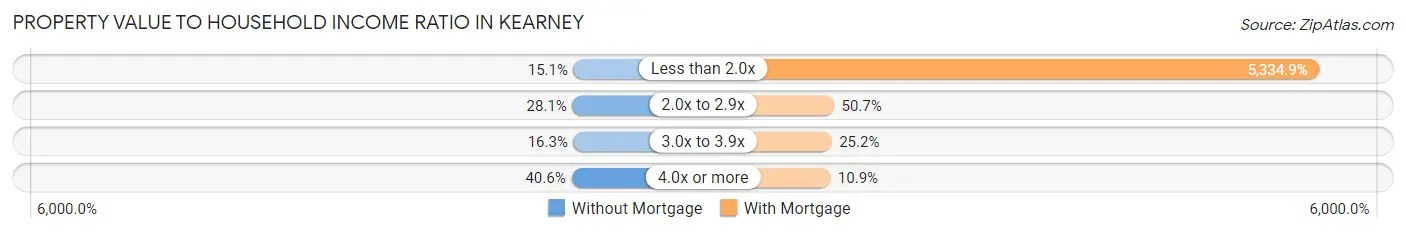
| Value-to-Income Ratio | Without Mortgage | With Mortgage |
| Less than 2.0x | 104 (15.1%) | 128,784 (5,334.9%) |
| 2.0x to 2.9x | 193 (28.1%) | 1,224 (50.7%) |
| 3.0x to 3.9x | 112 (16.3%) | 609 (25.2%) |
| 4.0x or more | 279 (40.6%) | 264 (10.9%) |
| Total | 688 (100.0%) | 2,414 (100.0%) |
Real Estate Taxes by Mortgage Status in Kearney
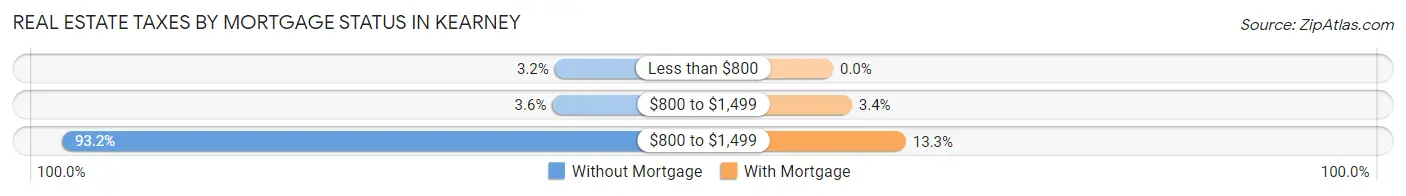
| Property Taxes | Without Mortgage | With Mortgage |
| Less than $800 | 22 (3.2%) | 0 (0.0%) |
| $800 to $1,499 | 25 (3.6%) | 83 (3.4%) |
| $800 to $1,499 | 641 (93.2%) | 321 (13.3%) |
| Total | 688 (100.0%) | 2,414 (100.0%) |
Health & Disability in Kearney
Health Insurance Coverage by Age in Kearney
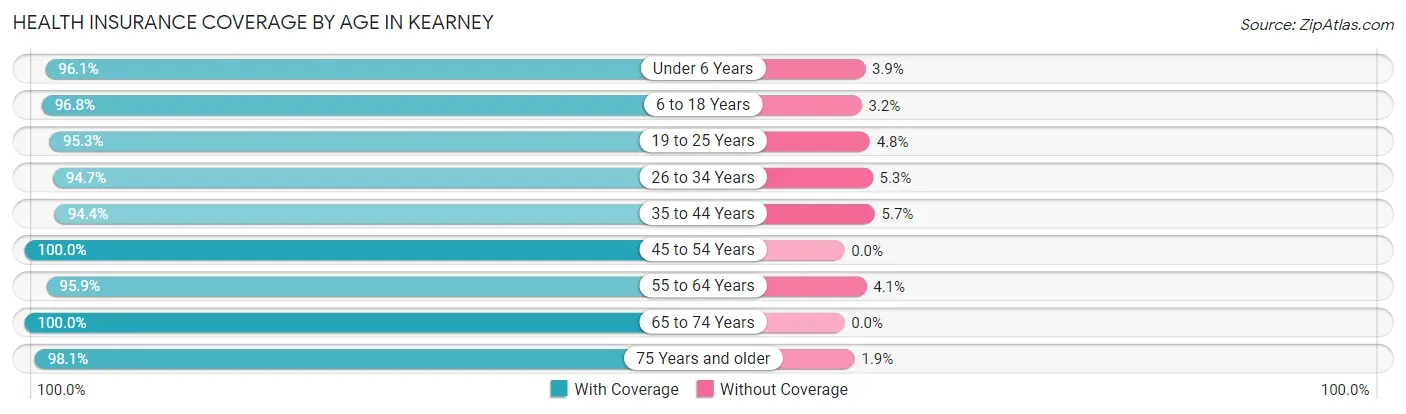
| Age Bracket | With Coverage | Without Coverage |
| Under 6 Years | 697 (96.1%) | 28 (3.9%) |
| 6 to 18 Years | 1,994 (96.8%) | 66 (3.2%) |
| 19 to 25 Years | 602 (95.3%) | 30 (4.8%) |
| 26 to 34 Years | 1,311 (94.7%) | 73 (5.3%) |
| 35 to 44 Years | 1,435 (94.4%) | 86 (5.7%) |
| 45 to 54 Years | 1,426 (100.0%) | 0 (0.0%) |
| 55 to 64 Years | 1,145 (95.9%) | 49 (4.1%) |
| 65 to 74 Years | 940 (100.0%) | 0 (0.0%) |
| 75 Years and older | 514 (98.1%) | 10 (1.9%) |
| Total | 10,064 (96.7%) | 342 (3.3%) |
Health Insurance Coverage by Citizenship Status in Kearney
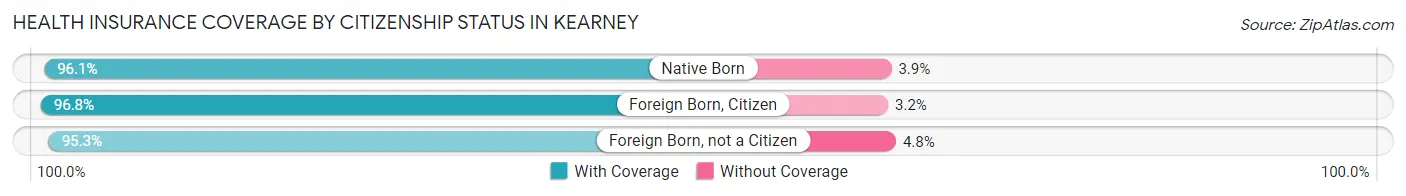
| Citizenship Status | With Coverage | Without Coverage |
| Native Born | 697 (96.1%) | 28 (3.9%) |
| Foreign Born, Citizen | 1,994 (96.8%) | 66 (3.2%) |
| Foreign Born, not a Citizen | 602 (95.3%) | 30 (4.8%) |
Health Insurance Coverage by Household Income in Kearney
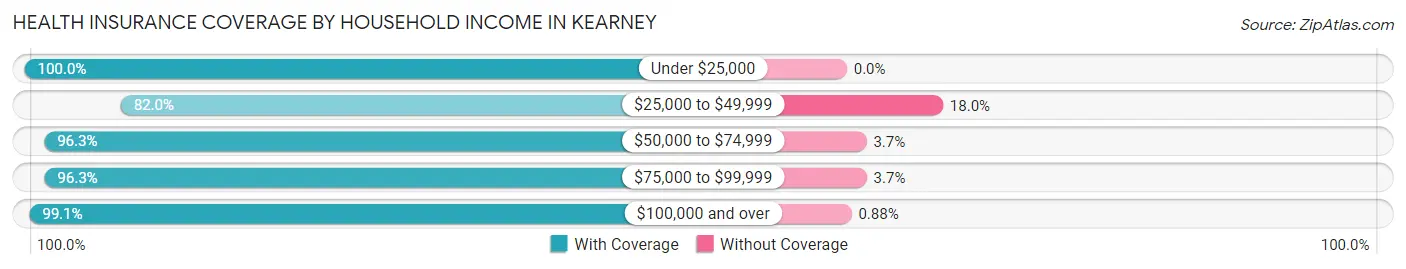
| Household Income | With Coverage | Without Coverage |
| Under $25,000 | 400 (100.0%) | 0 (0.0%) |
| $25,000 to $49,999 | 865 (82.0%) | 190 (18.0%) |
| $50,000 to $74,999 | 1,413 (96.3%) | 54 (3.7%) |
| $75,000 to $99,999 | 1,086 (96.3%) | 42 (3.7%) |
| $100,000 and over | 6,300 (99.1%) | 56 (0.9%) |
Public vs Private Health Insurance Coverage by Age in Kearney
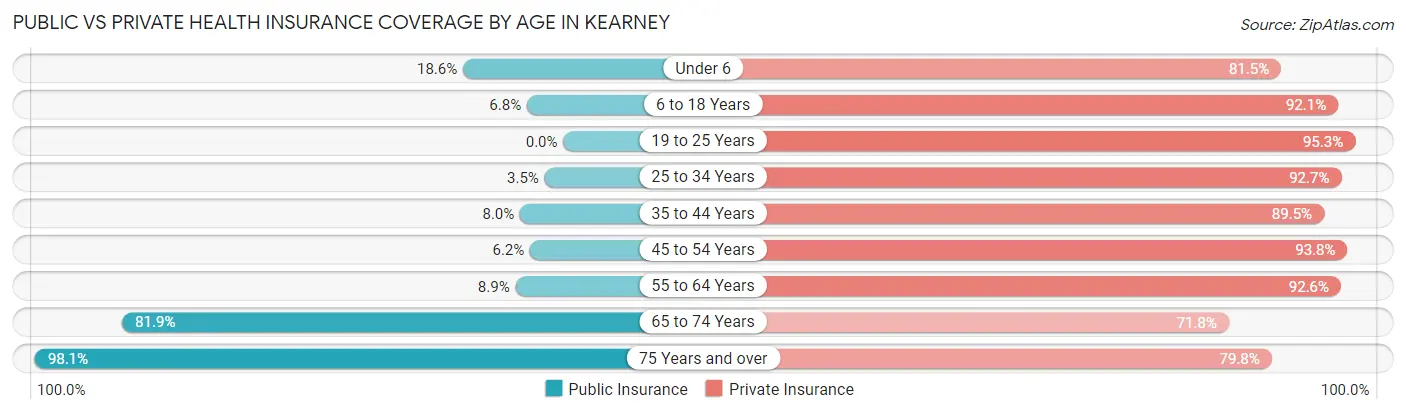
| Age Bracket | Public Insurance | Private Insurance |
| Under 6 | 135 (18.6%) | 591 (81.5%) |
| 6 to 18 Years | 139 (6.8%) | 1,897 (92.1%) |
| 19 to 25 Years | 0 (0.0%) | 602 (95.3%) |
| 25 to 34 Years | 48 (3.5%) | 1,283 (92.7%) |
| 35 to 44 Years | 122 (8.0%) | 1,361 (89.5%) |
| 45 to 54 Years | 88 (6.2%) | 1,338 (93.8%) |
| 55 to 64 Years | 106 (8.9%) | 1,106 (92.6%) |
| 65 to 74 Years | 770 (81.9%) | 675 (71.8%) |
| 75 Years and over | 514 (98.1%) | 418 (79.8%) |
| Total | 1,922 (18.5%) | 9,271 (89.1%) |
Disability Status by Sex by Age in Kearney
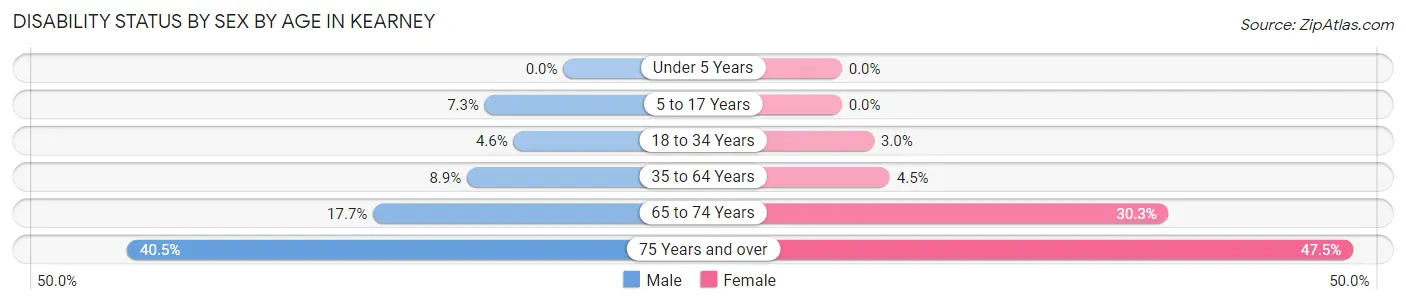
| Age Bracket | Male | Female |
| Under 5 Years | 0 (0.0%) | 0 (0.0%) |
| 5 to 17 Years | 68 (7.3%) | 0 (0.0%) |
| 18 to 34 Years | 50 (4.6%) | 33 (3.0%) |
| 35 to 64 Years | 192 (8.9%) | 89 (4.5%) |
| 65 to 74 Years | 60 (17.6%) | 182 (30.3%) |
| 75 Years and over | 85 (40.5%) | 149 (47.4%) |
Disability Class by Sex by Age in Kearney
Disability Class: Hearing Difficulty
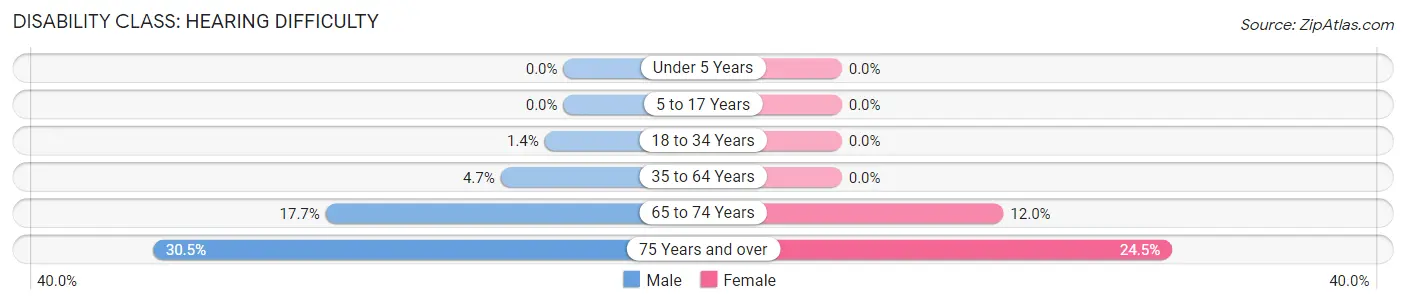
| Age Bracket | Male | Female |
| Under 5 Years | 0 (0.0%) | 0 (0.0%) |
| 5 to 17 Years | 0 (0.0%) | 0 (0.0%) |
| 18 to 34 Years | 15 (1.4%) | 0 (0.0%) |
| 35 to 64 Years | 100 (4.7%) | 0 (0.0%) |
| 65 to 74 Years | 60 (17.6%) | 72 (12.0%) |
| 75 Years and over | 64 (30.5%) | 77 (24.5%) |
Disability Class: Vision Difficulty
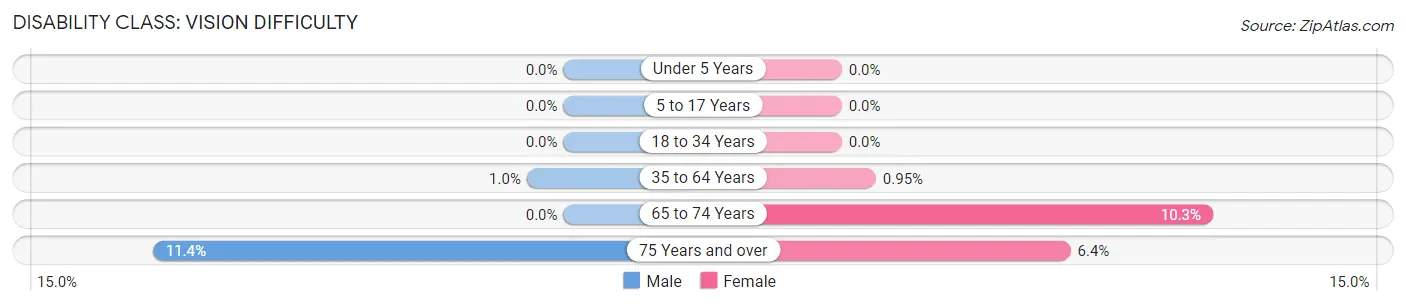
| Age Bracket | Male | Female |
| Under 5 Years | 0 (0.0%) | 0 (0.0%) |
| 5 to 17 Years | 0 (0.0%) | 0 (0.0%) |
| 18 to 34 Years | 0 (0.0%) | 0 (0.0%) |
| 35 to 64 Years | 22 (1.0%) | 19 (0.9%) |
| 65 to 74 Years | 0 (0.0%) | 62 (10.3%) |
| 75 Years and over | 24 (11.4%) | 20 (6.4%) |
Disability Class: Cognitive Difficulty
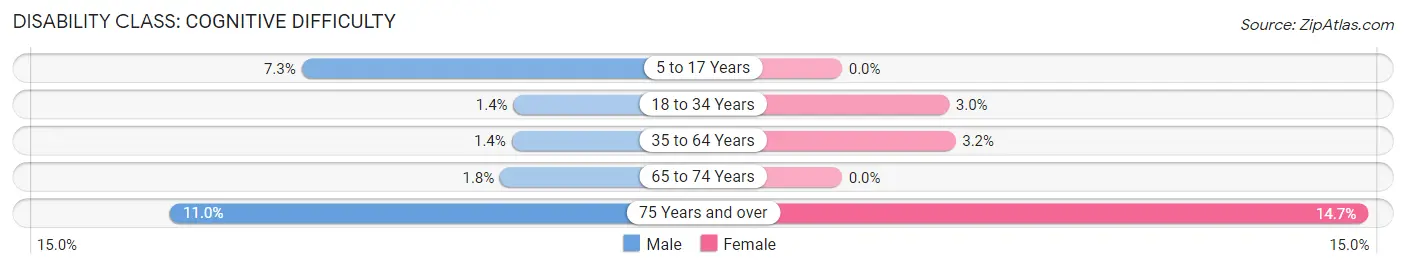
| Age Bracket | Male | Female |
| 5 to 17 Years | 68 (7.3%) | 0 (0.0%) |
| 18 to 34 Years | 15 (1.4%) | 33 (3.0%) |
| 35 to 64 Years | 31 (1.4%) | 63 (3.2%) |
| 65 to 74 Years | 6 (1.8%) | 0 (0.0%) |
| 75 Years and over | 23 (11.0%) | 46 (14.6%) |
Disability Class: Ambulatory Difficulty
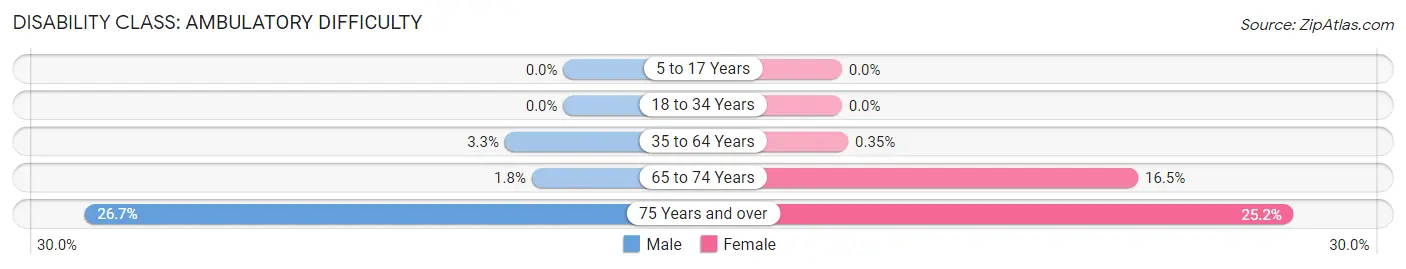
| Age Bracket | Male | Female |
| 5 to 17 Years | 0 (0.0%) | 0 (0.0%) |
| 18 to 34 Years | 0 (0.0%) | 0 (0.0%) |
| 35 to 64 Years | 70 (3.3%) | 7 (0.4%) |
| 65 to 74 Years | 6 (1.8%) | 99 (16.5%) |
| 75 Years and over | 56 (26.7%) | 79 (25.2%) |
Disability Class: Self-Care Difficulty
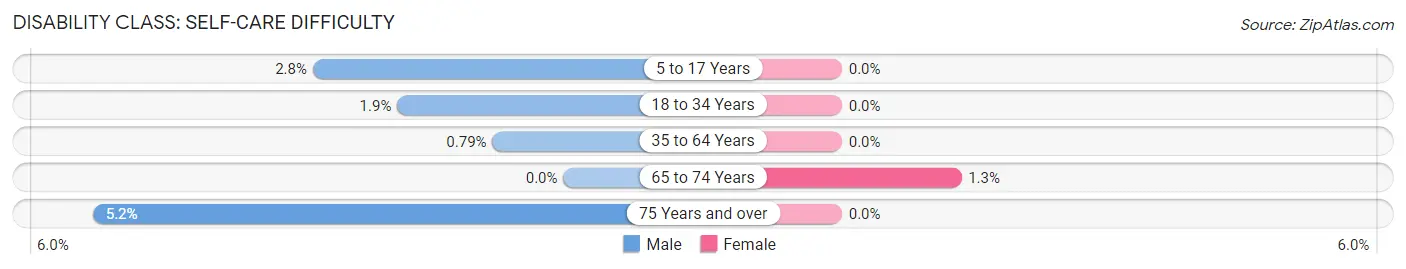
| Age Bracket | Male | Female |
| 5 to 17 Years | 26 (2.8%) | 0 (0.0%) |
| 18 to 34 Years | 20 (1.8%) | 0 (0.0%) |
| 35 to 64 Years | 17 (0.8%) | 0 (0.0%) |
| 65 to 74 Years | 0 (0.0%) | 8 (1.3%) |
| 75 Years and over | 11 (5.2%) | 0 (0.0%) |
Technology Access in Kearney
Computing Device Access in Kearney
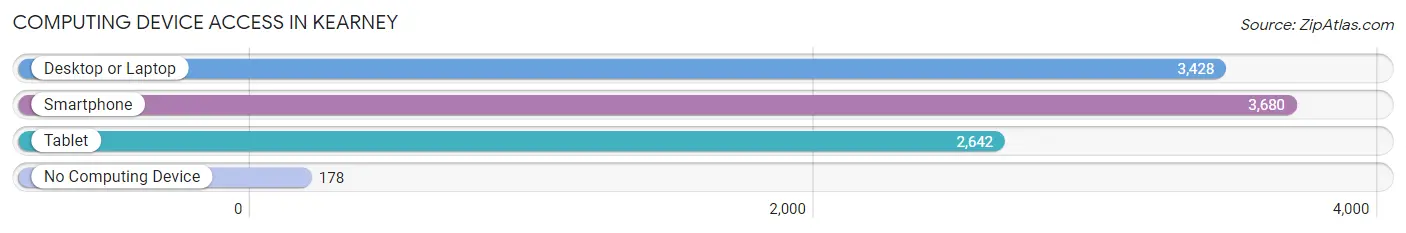
| Device Type | # Households | % Households |
| Desktop or Laptop | 3,428 | 86.1% |
| Smartphone | 3,680 | 92.4% |
| Tablet | 2,642 | 66.3% |
| No Computing Device | 178 | 4.5% |
| Total | 3,982 | 100.0% |
Internet Access in Kearney
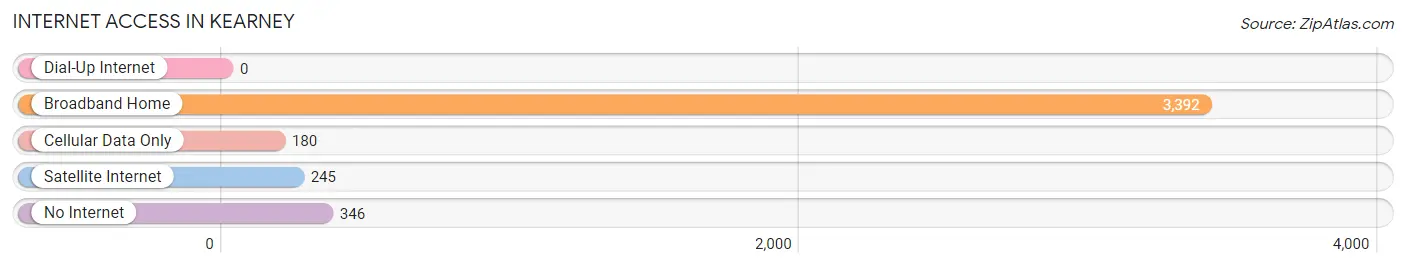
| Internet Type | # Households | % Households |
| Dial-Up Internet | 0 | 0.0% |
| Broadband Home | 3,392 | 85.2% |
| Cellular Data Only | 180 | 4.5% |
| Satellite Internet | 245 | 6.1% |
| No Internet | 346 | 8.7% |
| Total | 3,982 | 100.0% |
Kearney Summary
Kearney, Missouri is a small city located in Clay County, Missouri, United States. It is situated on the Missouri River, approximately 25 miles north of Kansas City. The city was founded in 1855 and was named after Stephen Watts Kearney, a general in the Mexican-American War. As of the 2010 census, the population of Kearney was 4,769.
Geography
Kearney is located at 39°25'25" North, 94°20'45" West (39.423, -94.346). According to the United States Census Bureau, the city has a total area of 4.2 square miles, all of it land.
Kearney is located in the Missouri River Valley, which is part of the Central Lowland physiographic region. The city is situated on the Missouri River, which is the longest river in North America. The Missouri River is a major tributary of the Mississippi River, and is the primary source of water for the city.
Climate
Kearney has a humid continental climate, with hot, humid summers and cold, dry winters. The average annual temperature is 54°F, with an average high of 79°F in July and an average low of 28°F in January. The average annual precipitation is 40.3 inches, with an average of 4.3 inches of snowfall per year.
Demographics
As of the 2010 census, there were 4,769 people, 1,845 households, and 1,269 families residing in the city. The population density was 1,139.2 people per square mile. The racial makeup of the city was 94.2% White, 1.3% African American, 0.3% Native American, 0.7% Asian, 0.1% Pacific Islander, 1.3% from other races, and 2.3% from two or more races. Hispanic or Latino of any race were 3.3% of the population.
Economy
Kearney is a small city with a diverse economy. The city is home to several manufacturing companies, including a plastics manufacturer, a metal fabrication company, and a food processing plant. The city also has a number of retail stores, restaurants, and other businesses.
The city is also home to several educational institutions, including the University of Missouri-Kansas City, Park University, and the University of Central Missouri.
The city is served by the Kansas City International Airport, which is located approximately 25 miles south of Kearney. The airport provides air service to destinations throughout the United States and the world.
Conclusion
Kearney, Missouri is a small city located in Clay County, Missouri, United States. It is situated on the Missouri River, approximately 25 miles north of Kansas City. The city was founded in 1855 and was named after Stephen Watts Kearney, a general in the Mexican-American War. As of the 2010 census, the population of Kearney was 4,769. The city has a humid continental climate, with hot, humid summers and cold, dry winters. The population is 94.2% White, 1.3% African American, 0.3% Native American, 0.7% Asian, 0.1% Pacific Islander, 1.3% from other races, and 2.3% from two or more races. Hispanic or Latino of any race were 3.3% of the population. The city has a diverse economy, with several manufacturing companies, retail stores, restaurants, and educational institutions. The city is served by the Kansas City International Airport, which provides air service to destinations throughout the United States and the world.
Common Questions
What is Per Capita Income in Kearney?
Per Capita income in Kearney is $44,596.
What is the Median Family Income in Kearney?
Median Family Income in Kearney is $117,551.
What is the Median Household income in Kearney?
Median Household Income in Kearney is $99,969.
What is Income or Wage Gap in Kearney?
Income or Wage Gap in Kearney is 40.3%.
Women in Kearney earn 59.7 cents for every dollar earned by a man.
What is Inequality or Gini Index in Kearney?
Inequality or Gini Index in Kearney is 0.38.
What is the Total Population of Kearney?
Total Population of Kearney is 10,491.
What is the Total Male Population of Kearney?
Total Male Population of Kearney is 4,992.
What is the Total Female Population of Kearney?
Total Female Population of Kearney is 5,499.
What is the Ratio of Males per 100 Females in Kearney?
There are 90.78 Males per 100 Females in Kearney.
What is the Ratio of Females per 100 Males in Kearney?
There are 110.16 Females per 100 Males in Kearney.
What is the Median Population Age in Kearney?
Median Population Age in Kearney is 37.9 Years.
What is the Average Family Size in Kearney
Average Family Size in Kearney is 3.1 People.
What is the Average Household Size in Kearney
Average Household Size in Kearney is 2.6 People.
How Large is the Labor Force in Kearney?
There are 6,251 People in the Labor Forcein in Kearney.
What is the Percentage of People in the Labor Force in Kearney?
75.3% of People are in the Labor Force in Kearney.
What is the Unemployment Rate in Kearney?
Unemployment Rate in Kearney is 1.4%.