Hope, ID Map & Demographics
Hope Map
Hope Overview
$50,848
PER CAPITA INCOME
$145,909
AVG FAMILY INCOME
$63,125
AVG HOUSEHOLD INCOME
0.48
INEQUALITY / GINI INDEX
96
TOTAL POPULATION
51
MALE POPULATION
45
FEMALE POPULATION
113.33
MALES / 100 FEMALES
88.24
FEMALES / 100 MALES
65.2
MEDIAN AGE
3.0
AVG FAMILY SIZE
2.0
AVG HOUSEHOLD SIZE
36
LABOR FORCE [ PEOPLE ]
40.9%
PERCENT IN LABOR FORCE
19.4%
UNEMPLOYMENT RATE
Hope Zip Codes
Hope Area Codes
Income in Hope
Income Overview in Hope
Per Capita Income in Hope is $50,848, while median incomes of families and households are $145,909 and $63,125 respectively.
| Characteristic | Number | Measure |
| Per Capita Income | 96 | $50,848 |
| Median Family Income | 22 | $145,909 |
| Mean Family Income | 22 | $134,686 |
| Median Household Income | 49 | $63,125 |
| Mean Household Income | 49 | $94,955 |
| Income Deficit | 22 | $0 |
| Wage / Income Gap (%) | 96 | 0.00% |
| Wage / Income Gap ($) | 96 | 100.00¢ per $1 |
| Gini / Inequality Index | 96 | 0.48 |
Earnings by Sex in Hope
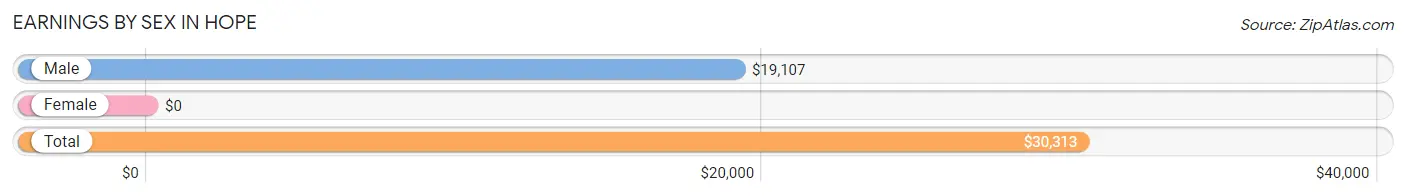
| Sex | Number | Average Earnings |
| Male | 27 (60.0%) | $19,107 |
| Female | 18 (40.0%) | $0 |
| Total | 45 (100.0%) | $30,313 |
Earnings by Sex by Income Bracket in Hope
The most common earnings brackets in Hope are $17,500 to $19,999 for men (7 | 25.9%) and $75,000 to $99,999 for women (8 | 44.4%).
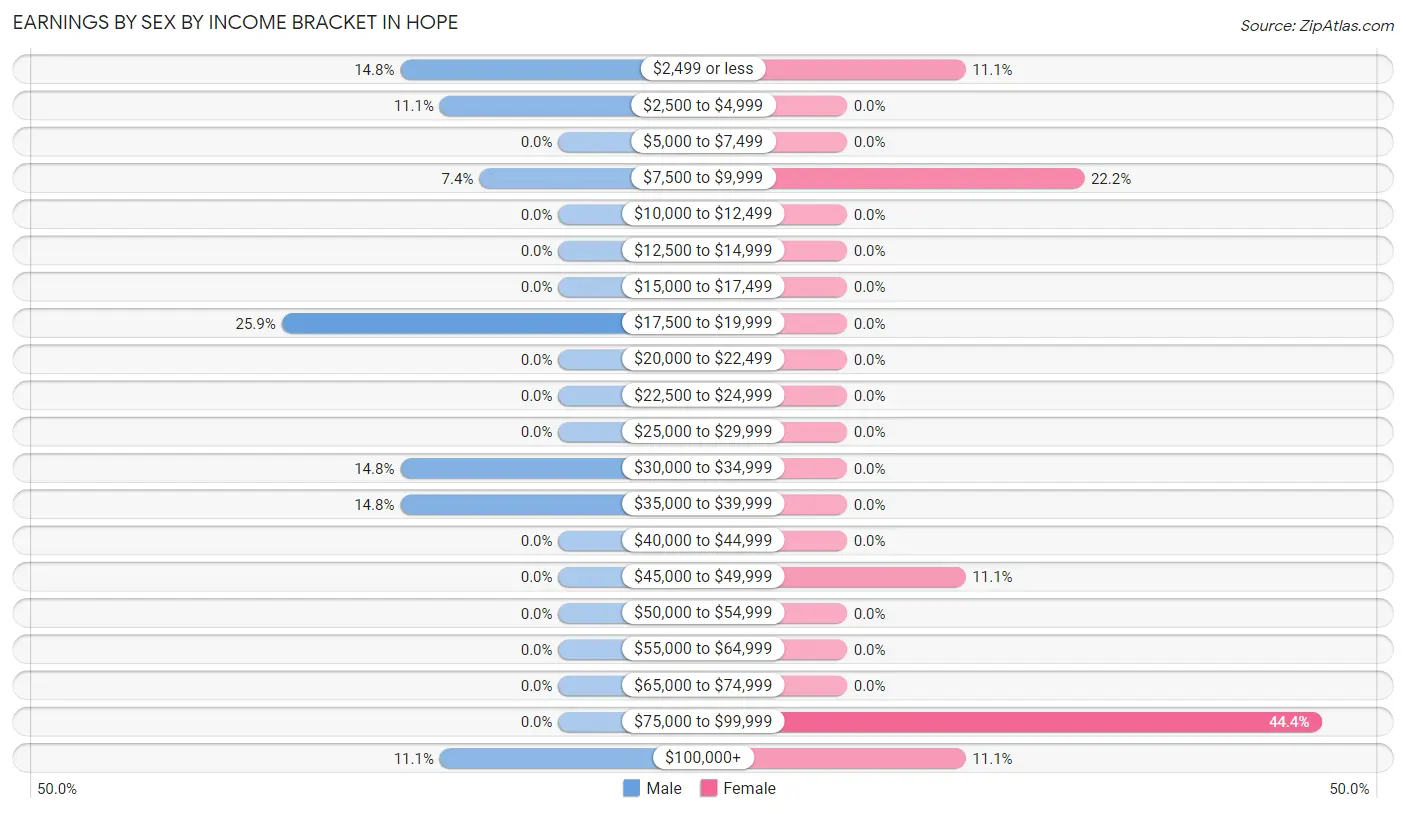
| Income | Male | Female |
| $2,499 or less | 4 (14.8%) | 2 (11.1%) |
| $2,500 to $4,999 | 3 (11.1%) | 0 (0.0%) |
| $5,000 to $7,499 | 0 (0.0%) | 0 (0.0%) |
| $7,500 to $9,999 | 2 (7.4%) | 4 (22.2%) |
| $10,000 to $12,499 | 0 (0.0%) | 0 (0.0%) |
| $12,500 to $14,999 | 0 (0.0%) | 0 (0.0%) |
| $15,000 to $17,499 | 0 (0.0%) | 0 (0.0%) |
| $17,500 to $19,999 | 7 (25.9%) | 0 (0.0%) |
| $20,000 to $22,499 | 0 (0.0%) | 0 (0.0%) |
| $22,500 to $24,999 | 0 (0.0%) | 0 (0.0%) |
| $25,000 to $29,999 | 0 (0.0%) | 0 (0.0%) |
| $30,000 to $34,999 | 4 (14.8%) | 0 (0.0%) |
| $35,000 to $39,999 | 4 (14.8%) | 0 (0.0%) |
| $40,000 to $44,999 | 0 (0.0%) | 0 (0.0%) |
| $45,000 to $49,999 | 0 (0.0%) | 2 (11.1%) |
| $50,000 to $54,999 | 0 (0.0%) | 0 (0.0%) |
| $55,000 to $64,999 | 0 (0.0%) | 0 (0.0%) |
| $65,000 to $74,999 | 0 (0.0%) | 0 (0.0%) |
| $75,000 to $99,999 | 0 (0.0%) | 8 (44.4%) |
| $100,000+ | 3 (11.1%) | 2 (11.1%) |
| Total | 27 (100.0%) | 18 (100.0%) |
Earnings by Sex by Educational Attainment in Hope
| Educational Attainment | Male Income | Female Income |
| Less than High School | - | - |
| High School Diploma | - | - |
| College or Associate's Degree | - | - |
| Bachelor's Degree | - | - |
| Graduate Degree | - | - |
| Total | - | - |
Family Income in Hope
Family Income Brackets in Hope
According to the Hope family income data, there are 12 families falling into the $100,000 to $149,999 income range, which is the most common income bracket and makes up 54.5% of all families.
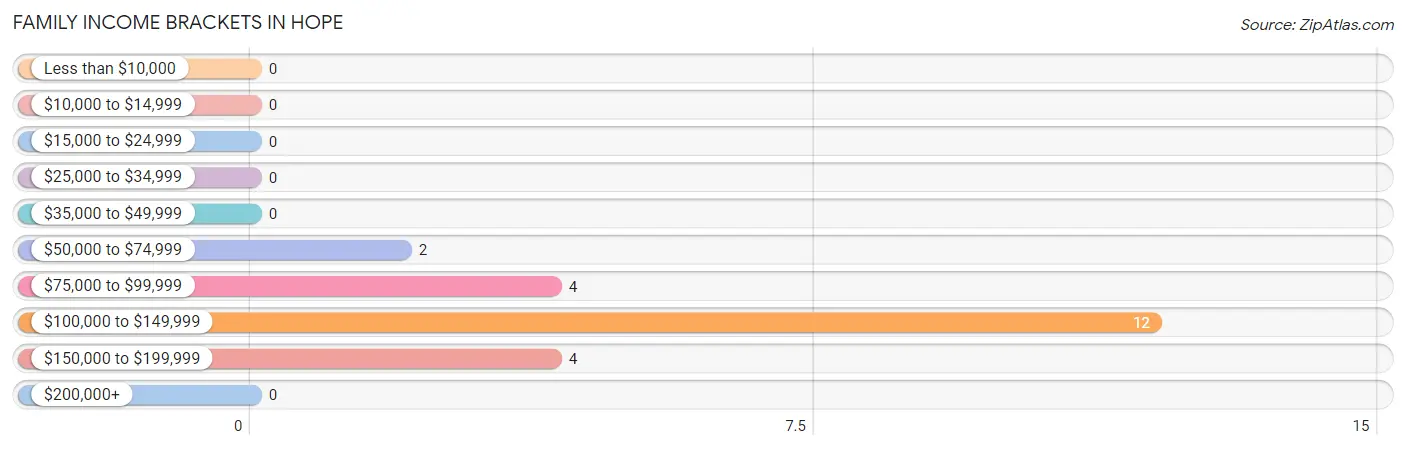
| Income Bracket | # Families | % Families |
| Less than $10,000 | 0 | 0.0% |
| $10,000 to $14,999 | 0 | 0.0% |
| $15,000 to $24,999 | 0 | 0.0% |
| $25,000 to $34,999 | 0 | 0.0% |
| $35,000 to $49,999 | 0 | 0.0% |
| $50,000 to $74,999 | 2 | 9.1% |
| $75,000 to $99,999 | 4 | 18.2% |
| $100,000 to $149,999 | 12 | 54.5% |
| $150,000 to $199,999 | 4 | 18.2% |
| $200,000+ | 0 | 0.0% |
Family Income by Famaliy Size in Hope
2-person families (16 | 72.7%) account for the highest median family income in Hope with $145,278 per family, while 2-person families (16 | 72.7%) have the highest median income of $72,639 per family member.
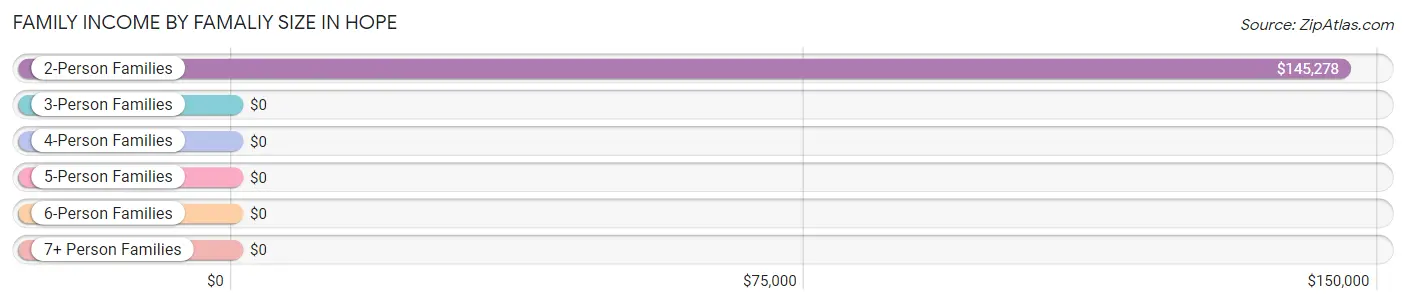
| Income Bracket | # Families | Median Income |
| 2-Person Families | 16 (72.7%) | $145,278 |
| 3-Person Families | 2 (9.1%) | $0 |
| 4-Person Families | 0 (0.0%) | $0 |
| 5-Person Families | 0 (0.0%) | $0 |
| 6-Person Families | 4 (18.2%) | $0 |
| 7+ Person Families | 0 (0.0%) | $0 |
| Total | 22 (100.0%) | $145,909 |
Family Income by Number of Earners in Hope
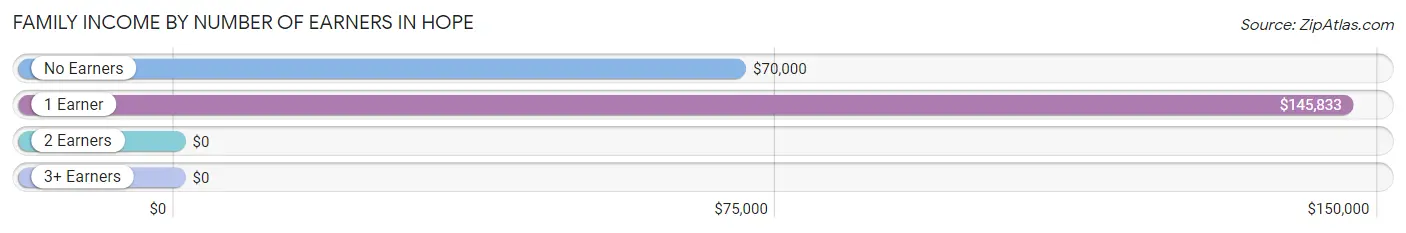
| Number of Earners | # Families | Median Income |
| No Earners | 4 (18.2%) | $70,000 |
| 1 Earner | 12 (54.5%) | $145,833 |
| 2 Earners | 2 (9.1%) | $0 |
| 3+ Earners | 4 (18.2%) | $0 |
| Total | 22 (100.0%) | $145,909 |
Household Income in Hope
Household Income Brackets in Hope
With 12 households falling in the category, the $100,000 to $149,999 income range is the most frequent in Hope, accounting for 24.5% of all households.
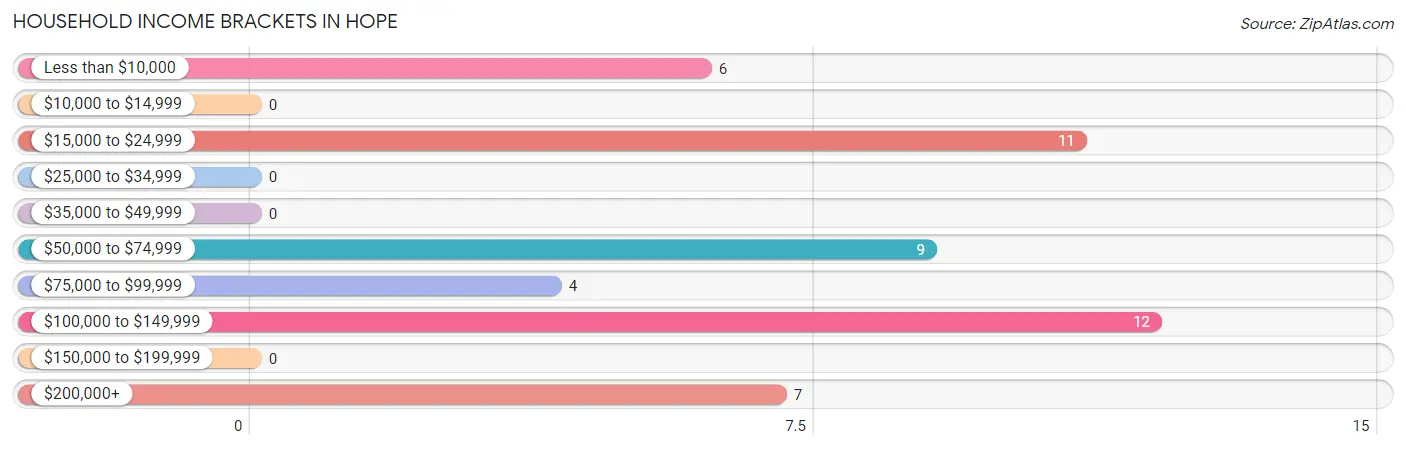
| Income Bracket | # Households | % Households |
| Less than $10,000 | 6 | 12.2% |
| $10,000 to $14,999 | 0 | 0.0% |
| $15,000 to $24,999 | 11 | 22.4% |
| $25,000 to $34,999 | 0 | 0.0% |
| $35,000 to $49,999 | 0 | 0.0% |
| $50,000 to $74,999 | 9 | 18.4% |
| $75,000 to $99,999 | 4 | 8.2% |
| $100,000 to $149,999 | 12 | 24.5% |
| $150,000 to $199,999 | 0 | 0.0% |
| $200,000+ | 7 | 14.3% |
Household Income by Householder Age in Hope
| Income Bracket | # Households | Median Income |
| 15 to 24 Years | 0 (0.0%) | $0 |
| 25 to 44 Years | 7 (14.3%) | $0 |
| 45 to 64 Years | 9 (18.4%) | $0 |
| 65+ Years | 33 (67.3%) | $0 |
| Total | 49 (100.0%) | $63,125 |
Poverty in Hope
Income Below Poverty by Sex and Age in Hope
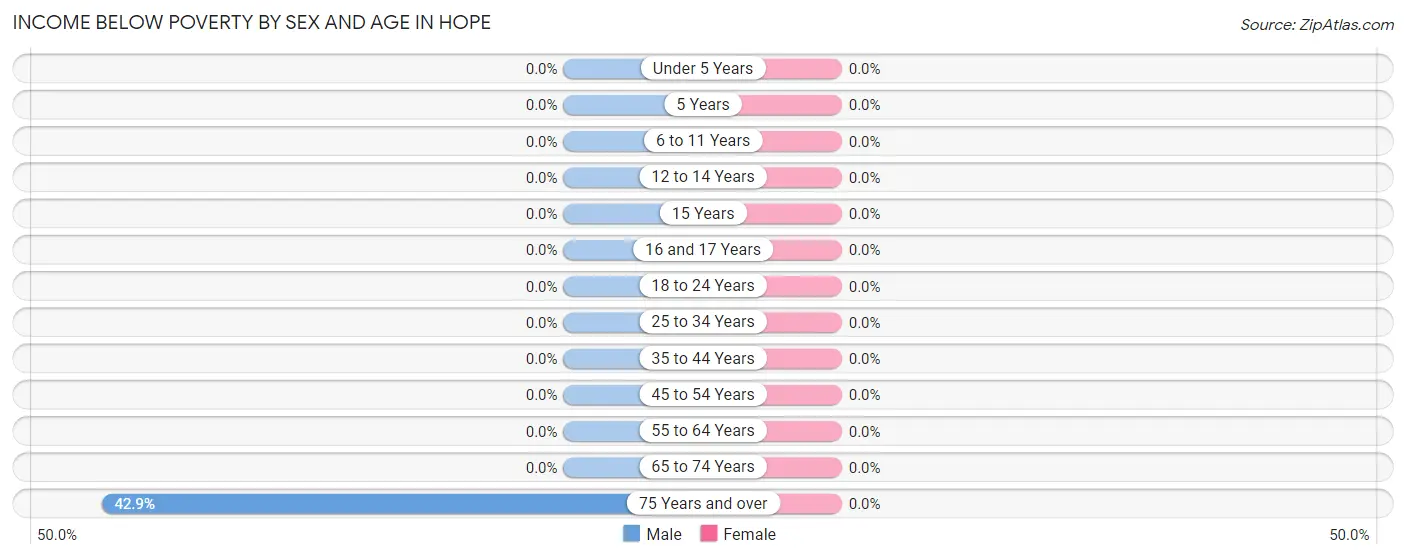
| Age Bracket | Male | Female |
| Under 5 Years | 0 (0.0%) | 0 (0.0%) |
| 5 Years | 0 (0.0%) | 0 (0.0%) |
| 6 to 11 Years | 0 (0.0%) | 0 (0.0%) |
| 12 to 14 Years | 0 (0.0%) | 0 (0.0%) |
| 15 Years | 0 (0.0%) | 0 (0.0%) |
| 16 and 17 Years | 0 (0.0%) | 0 (0.0%) |
| 18 to 24 Years | 0 (0.0%) | 0 (0.0%) |
| 25 to 34 Years | 0 (0.0%) | 0 (0.0%) |
| 35 to 44 Years | 0 (0.0%) | 0 (0.0%) |
| 45 to 54 Years | 0 (0.0%) | 0 (0.0%) |
| 55 to 64 Years | 0 (0.0%) | 0 (0.0%) |
| 65 to 74 Years | 0 (0.0%) | 0 (0.0%) |
| 75 Years and over | 6 (42.9%) | 0 (0.0%) |
| Total | 6 (11.8%) | 0 (0.0%) |
Income Above Poverty by Sex and Age in Hope
According to the poverty statistics in Hope, males aged 12 to 14 years and females aged 6 to 11 years are the age groups that are most secure financially, with 100.0% of males and 100.0% of females in these age groups living above the poverty line.
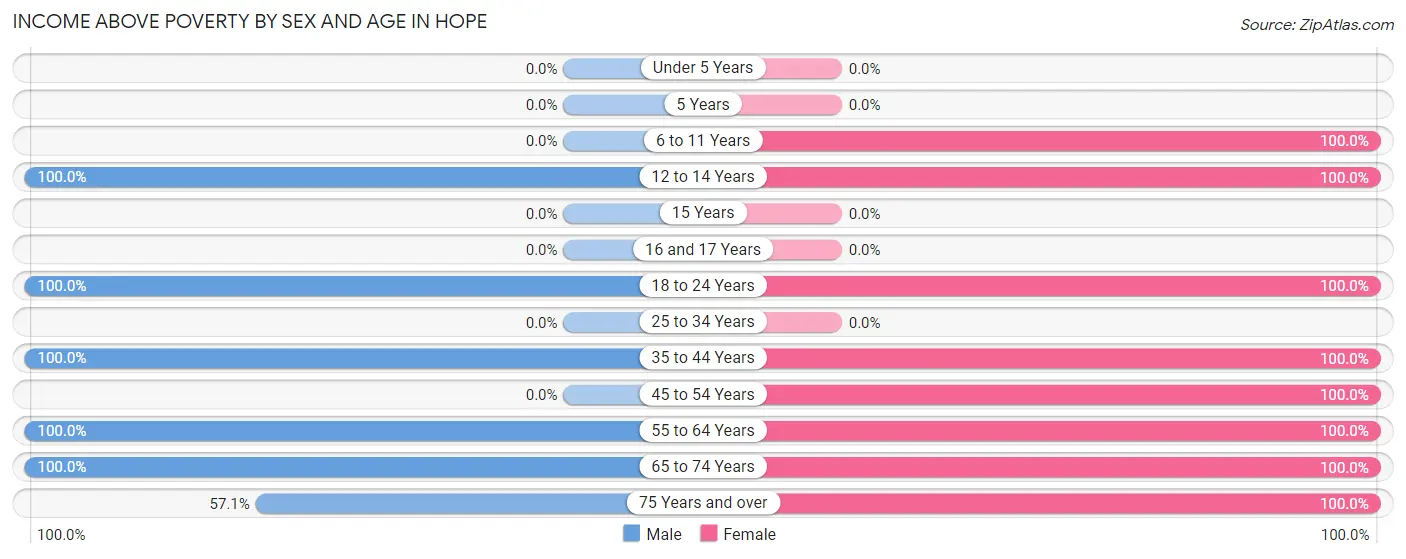
| Age Bracket | Male | Female |
| Under 5 Years | 0 (0.0%) | 0 (0.0%) |
| 5 Years | 0 (0.0%) | 0 (0.0%) |
| 6 to 11 Years | 0 (0.0%) | 5 (100.0%) |
| 12 to 14 Years | 1 (100.0%) | 2 (100.0%) |
| 15 Years | 0 (0.0%) | 0 (0.0%) |
| 16 and 17 Years | 0 (0.0%) | 0 (0.0%) |
| 18 to 24 Years | 7 (100.0%) | 4 (100.0%) |
| 25 to 34 Years | 0 (0.0%) | 0 (0.0%) |
| 35 to 44 Years | 7 (100.0%) | 4 (100.0%) |
| 45 to 54 Years | 0 (0.0%) | 4 (100.0%) |
| 55 to 64 Years | 7 (100.0%) | 6 (100.0%) |
| 65 to 74 Years | 15 (100.0%) | 18 (100.0%) |
| 75 Years and over | 8 (57.1%) | 2 (100.0%) |
| Total | 45 (88.2%) | 45 (100.0%) |
Income Below Poverty Among Married-Couple Families in Hope
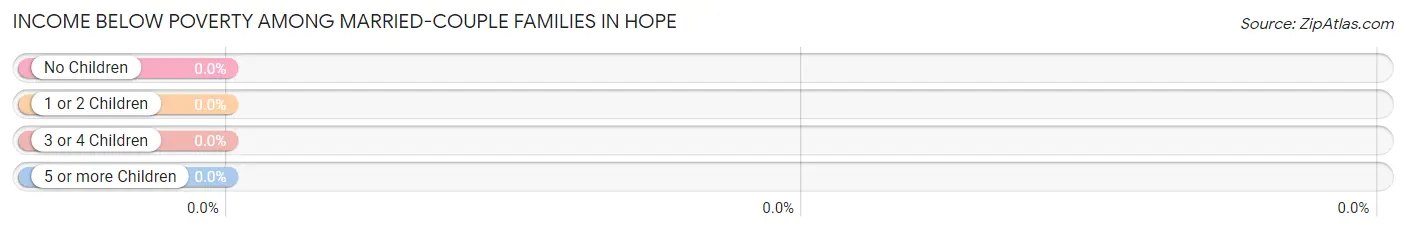
| Children | Above Poverty | Below Poverty |
| No Children | 14 (100.0%) | 0 (0.0%) |
| 1 or 2 Children | 6 (100.0%) | 0 (0.0%) |
| 3 or 4 Children | 0 (0.0%) | 0 (0.0%) |
| 5 or more Children | 0 (0.0%) | 0 (0.0%) |
| Total | 20 (100.0%) | 0 (0.0%) |
Income Below Poverty Among Single-Parent Households in Hope
| Children | Single Father | Single Mother |
| No Children | 0 (0.0%) | 0 (0.0%) |
| 1 or 2 Children | 0 (0.0%) | 0 (0.0%) |
| 3 or 4 Children | 0 (0.0%) | 0 (0.0%) |
| 5 or more Children | 0 (0.0%) | 0 (0.0%) |
| Total | 0 (0.0%) | 0 (0.0%) |
Income Below Poverty Among Married-Couple vs Single-Parent Households in Hope
| Children | Married-Couple Families | Single-Parent Households |
| No Children | 0 (0.0%) | 0 (0.0%) |
| 1 or 2 Children | 0 (0.0%) | 0 (0.0%) |
| 3 or 4 Children | 0 (0.0%) | 0 (0.0%) |
| 5 or more Children | 0 (0.0%) | 0 (0.0%) |
| Total | 0 (0.0%) | 0 (0.0%) |
Race in Hope
The most populous races in Hope are , and White / Caucasian (96 | 100.0%).
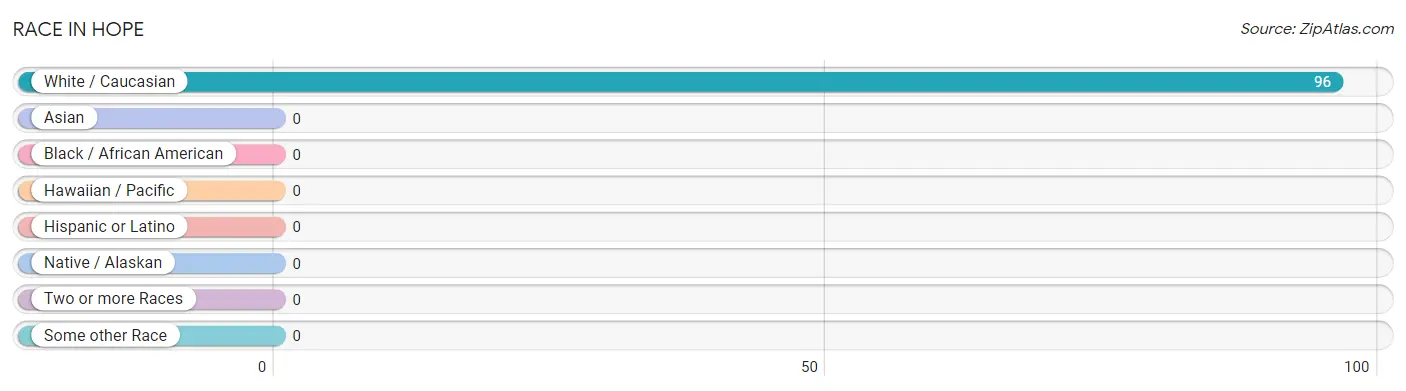
| Race | # Population | % Population |
| Asian | 0 | 0.0% |
| Black / African American | 0 | 0.0% |
| Hawaiian / Pacific | 0 | 0.0% |
| Hispanic or Latino | 0 | 0.0% |
| Native / Alaskan | 0 | 0.0% |
| White / Caucasian | 96 | 100.0% |
| Two or more Races | 0 | 0.0% |
| Some other Race | 0 | 0.0% |
| Total | 96 | 100.0% |
Ancestry in Hope
The most populous ancestries reported in Hope are English (25 | 26.0%), German (21 | 21.9%), Dutch (14 | 14.6%), Welsh (14 | 14.6%), and Irish (13 | 13.5%), together accounting for 90.6% of all Hope residents.
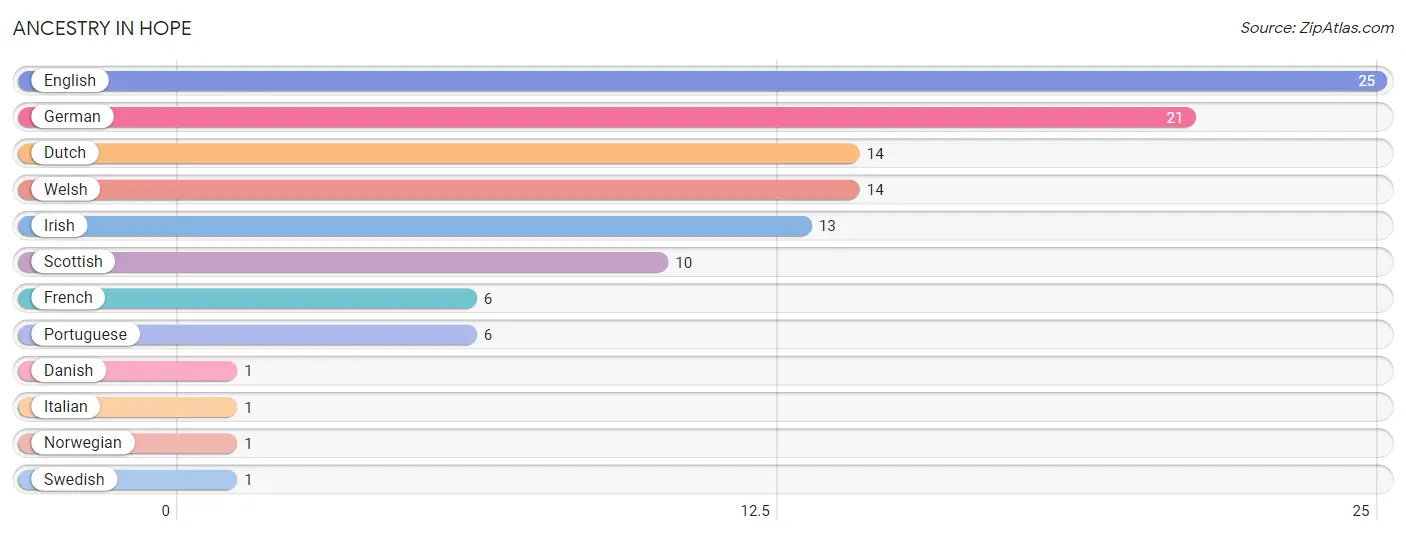
| Ancestry | # Population | % Population |
| Danish | 1 | 1.0% |
| Dutch | 14 | 14.6% |
| English | 25 | 26.0% |
| French | 6 | 6.2% |
| German | 21 | 21.9% |
| Irish | 13 | 13.5% |
| Italian | 1 | 1.0% |
| Norwegian | 1 | 1.0% |
| Portuguese | 6 | 6.2% |
| Scottish | 10 | 10.4% |
| Swedish | 1 | 1.0% |
| Welsh | 14 | 14.6% | View All 12 Rows |
Immigrants in Hope

| Immigration Origin | # Population | % Population | View All 0 Rows |
Sex and Age in Hope
Sex and Age in Hope
The most populous age groups in Hope are 75 to 79 Years (13 | 25.5%) for men and 70 to 74 Years (12 | 26.7%) for women.
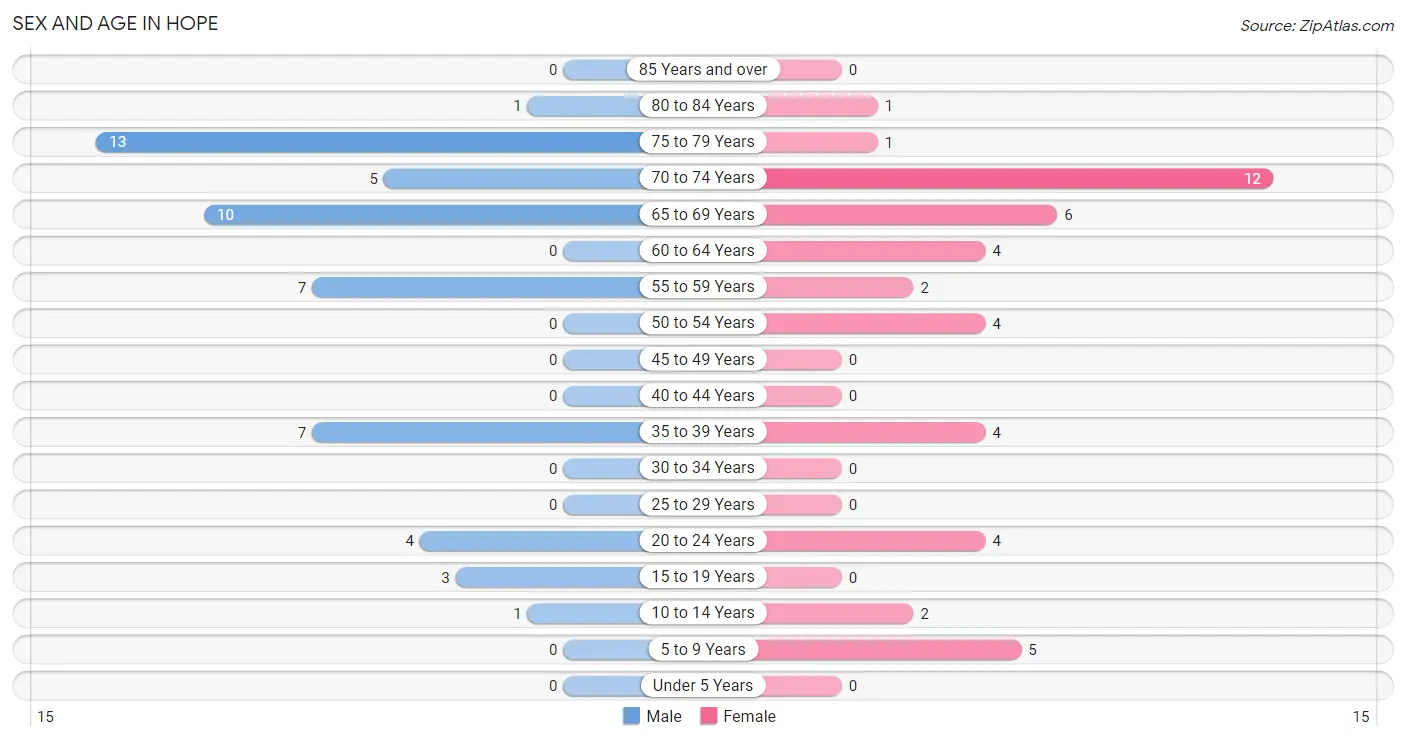
| Age Bracket | Male | Female |
| Under 5 Years | 0 (0.0%) | 0 (0.0%) |
| 5 to 9 Years | 0 (0.0%) | 5 (11.1%) |
| 10 to 14 Years | 1 (2.0%) | 2 (4.4%) |
| 15 to 19 Years | 3 (5.9%) | 0 (0.0%) |
| 20 to 24 Years | 4 (7.8%) | 4 (8.9%) |
| 25 to 29 Years | 0 (0.0%) | 0 (0.0%) |
| 30 to 34 Years | 0 (0.0%) | 0 (0.0%) |
| 35 to 39 Years | 7 (13.7%) | 4 (8.9%) |
| 40 to 44 Years | 0 (0.0%) | 0 (0.0%) |
| 45 to 49 Years | 0 (0.0%) | 0 (0.0%) |
| 50 to 54 Years | 0 (0.0%) | 4 (8.9%) |
| 55 to 59 Years | 7 (13.7%) | 2 (4.4%) |
| 60 to 64 Years | 0 (0.0%) | 4 (8.9%) |
| 65 to 69 Years | 10 (19.6%) | 6 (13.3%) |
| 70 to 74 Years | 5 (9.8%) | 12 (26.7%) |
| 75 to 79 Years | 13 (25.5%) | 1 (2.2%) |
| 80 to 84 Years | 1 (2.0%) | 1 (2.2%) |
| 85 Years and over | 0 (0.0%) | 0 (0.0%) |
| Total | 51 (100.0%) | 45 (100.0%) |
Families and Households in Hope
Median Family Size in Hope
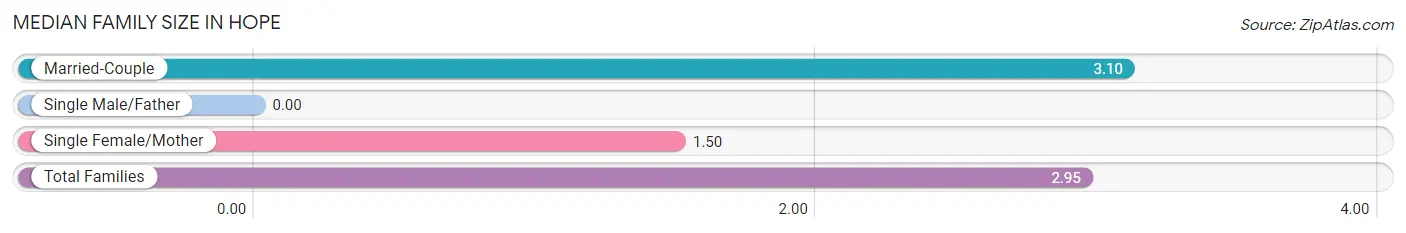
| Family Type | # Families | Family Size |
| Married-Couple | 20 (90.9%) | 3.10 |
| Single Male/Father | 0 (0.0%) | - |
| Single Female/Mother | 2 (9.1%) | 1.50 |
| Total Families | 22 (100.0%) | 2.95 |
Median Household Size in Hope
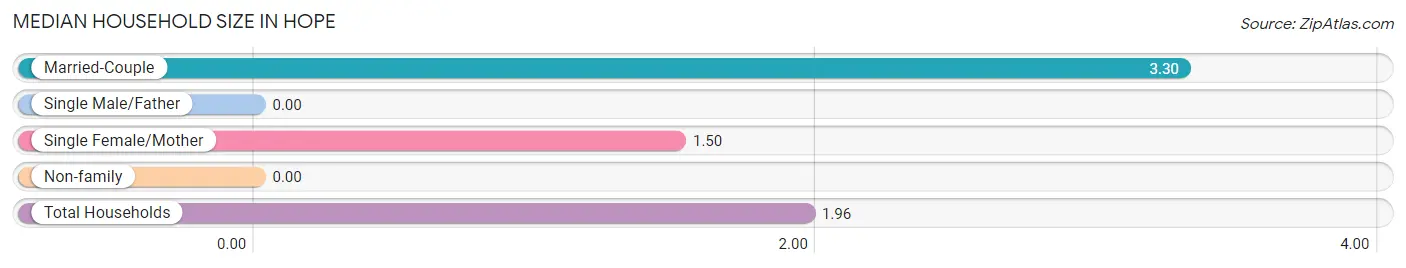
| Household Type | # Households | Household Size |
| Married-Couple | 20 (40.8%) | 3.30 |
| Single Male/Father | 0 (0.0%) | - |
| Single Female/Mother | 2 (4.1%) | 1.50 |
| Non-family | 27 (55.1%) | - |
| Total Households | 49 (100.0%) | 1.96 |
Household Size by Marriage Status in Hope
Out of a total of 49 households in Hope, 22 (44.9%) are family households, while 27 (55.1%) are nonfamily households. The most numerous type of family households are 2-person households, comprising 16, and the most common type of nonfamily households are 1-person households, comprising 27.
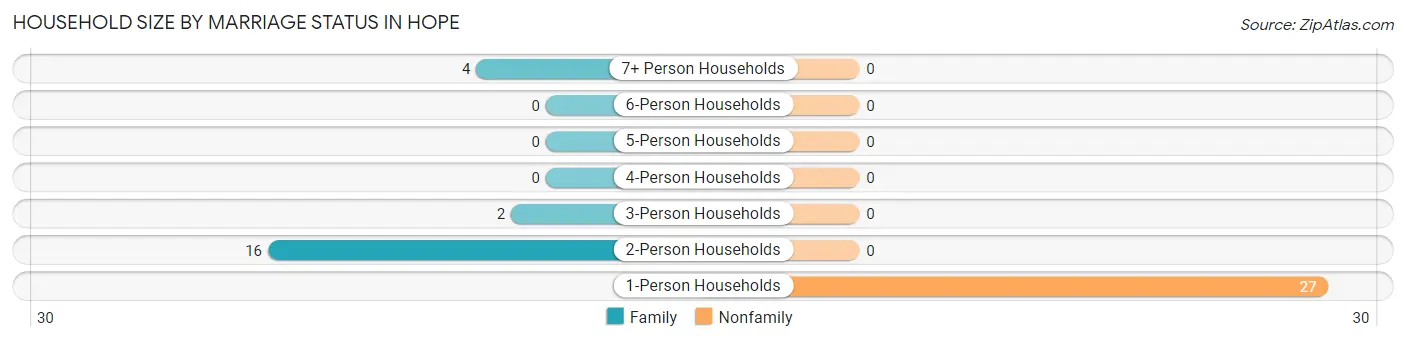
| Household Size | Family Households | Nonfamily Households |
| 1-Person Households | - | 27 (55.1%) |
| 2-Person Households | 16 (32.7%) | 0 (0.0%) |
| 3-Person Households | 2 (4.1%) | 0 (0.0%) |
| 4-Person Households | 0 (0.0%) | 0 (0.0%) |
| 5-Person Households | 0 (0.0%) | 0 (0.0%) |
| 6-Person Households | 0 (0.0%) | 0 (0.0%) |
| 7+ Person Households | 4 (8.2%) | 0 (0.0%) |
| Total | 22 (44.9%) | 27 (55.1%) |
Female Fertility in Hope
Fertility by Age in Hope
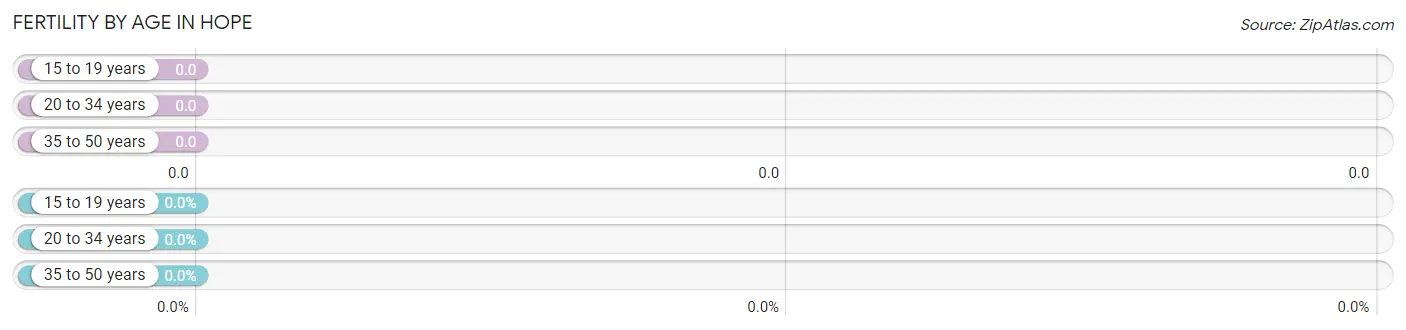
| Age Bracket | Women with Births | Births / 1,000 Women |
| 15 to 19 years | 0 (0.0%) | 0.0 |
| 20 to 34 years | 0 (0.0%) | 0.0 |
| 35 to 50 years | 0 (0.0%) | 0.0 |
| Total | 0 (0.0%) | 0.0 |
Fertility by Age by Marriage Status in Hope
| Age Bracket | Married | Unmarried |
| 15 to 19 years | 0 (0.0%) | 0 (0.0%) |
| 20 to 34 years | 0 (0.0%) | 0 (0.0%) |
| 35 to 50 years | 0 (0.0%) | 0 (0.0%) |
| Total | 0 (0.0%) | 0 (0.0%) |
Fertility by Education in Hope
| Educational Attainment | Women with Births | Births / 1,000 Women |
| Less than High School | 0 (0.0%) | 0.0 |
| High School Diploma | 0 (0.0%) | 0.0 |
| College or Associate's Degree | 0 (0.0%) | 0.0 |
| Bachelor's Degree | 0 (0.0%) | 0.0 |
| Graduate Degree | 0 (0.0%) | 0.0 |
| Total | 0 (0.0%) | 0.0 |
Fertility by Education by Marriage Status in Hope
| Educational Attainment | Married | Unmarried |
| Less than High School | 0 (0.0%) | 0 (0.0%) |
| High School Diploma | 0 (0.0%) | 0 (0.0%) |
| College or Associate's Degree | 0 (0.0%) | 0 (0.0%) |
| Bachelor's Degree | 0 (0.0%) | 0 (0.0%) |
| Graduate Degree | 0 (0.0%) | 0 (0.0%) |
| Total | 0 (0.0%) | 0 (0.0%) |
Employment Characteristics in Hope
Employment by Class of Employer in Hope
Among the 29 employed individuals in Hope, private company employees (24 | 82.8%), self-employed (not incorporated) (3 | 10.3%), and not-for-profit organizations (2 | 6.9%) make up the most common classes of employment.
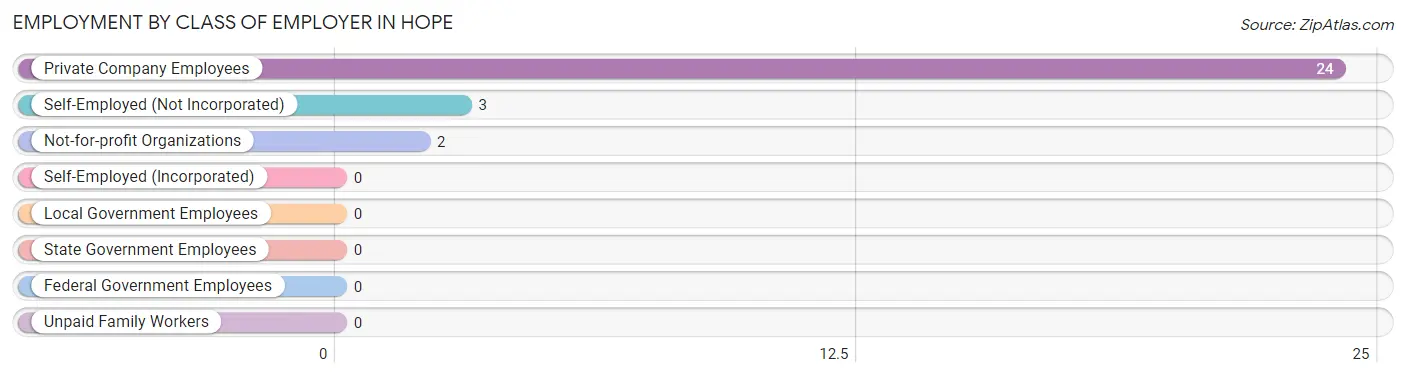
| Employer Class | # Employees | % Employees |
| Private Company Employees | 24 | 82.8% |
| Self-Employed (Incorporated) | 0 | 0.0% |
| Self-Employed (Not Incorporated) | 3 | 10.3% |
| Not-for-profit Organizations | 2 | 6.9% |
| Local Government Employees | 0 | 0.0% |
| State Government Employees | 0 | 0.0% |
| Federal Government Employees | 0 | 0.0% |
| Unpaid Family Workers | 0 | 0.0% |
| Total | 29 | 100.0% |
Employment Status by Age in Hope
According to the labor force statistics for Hope, out of the total population over 16 years of age (88), 40.9% or 36 individuals are in the labor force, with 19.4% or 7 of them unemployed. The age group with the highest labor force participation rate is 20 to 24 years, with 100.0% or 8 individuals in the labor force. Within the labor force, the 55 to 59 years age range has the highest percentage of unemployed individuals, with 77.8% or 7 of them being unemployed.
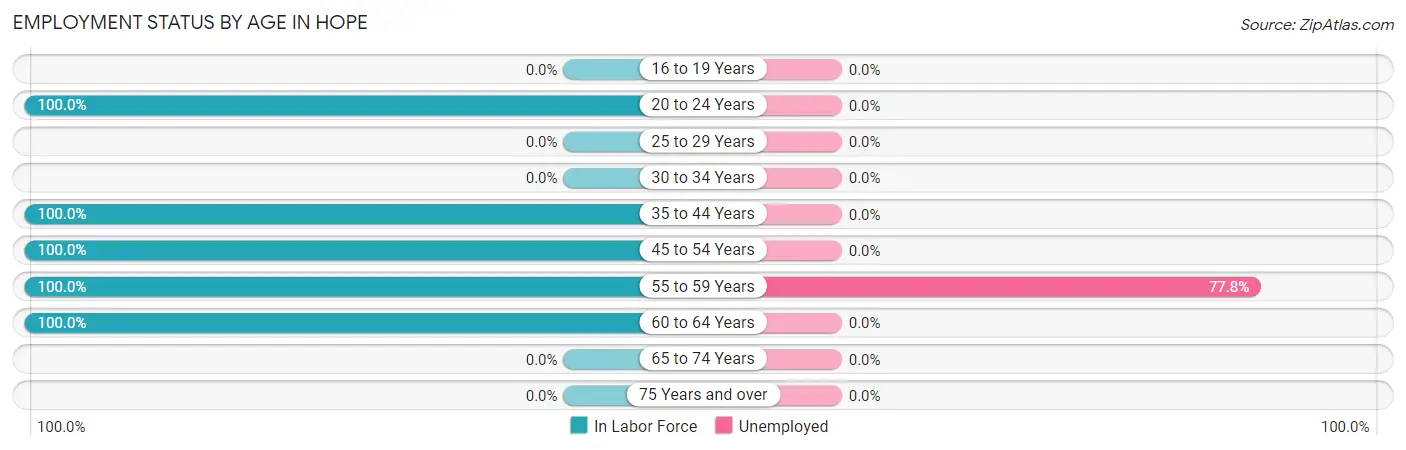
| Age Bracket | In Labor Force | Unemployed |
| 16 to 19 Years | 0 (0.0%) | 0 (0.0%) |
| 20 to 24 Years | 8 (100.0%) | 0 (0.0%) |
| 25 to 29 Years | 0 (0.0%) | 0 (0.0%) |
| 30 to 34 Years | 0 (0.0%) | 0 (0.0%) |
| 35 to 44 Years | 11 (100.0%) | 0 (0.0%) |
| 45 to 54 Years | 4 (100.0%) | 0 (0.0%) |
| 55 to 59 Years | 9 (100.0%) | 7 (77.8%) |
| 60 to 64 Years | 4 (100.0%) | 0 (0.0%) |
| 65 to 74 Years | 0 (0.0%) | 0 (0.0%) |
| 75 Years and over | 0 (0.0%) | 0 (0.0%) |
| Total | 36 (40.9%) | 7 (19.4%) |
Employment Status by Educational Attainment in Hope
According to labor force statistics for Hope, 100.0% of individuals (28) out of the total population between 25 and 64 years of age (28) are in the labor force, with 25.0% or 7 of them being unemployed. The group with the highest labor force participation rate are those with the educational attainment of high school diploma, with 100.0% or 22 individuals in the labor force. Within the labor force, individuals with high school diploma education have the highest percentage of unemployment, with 31.8% or 7 of them being unemployed.
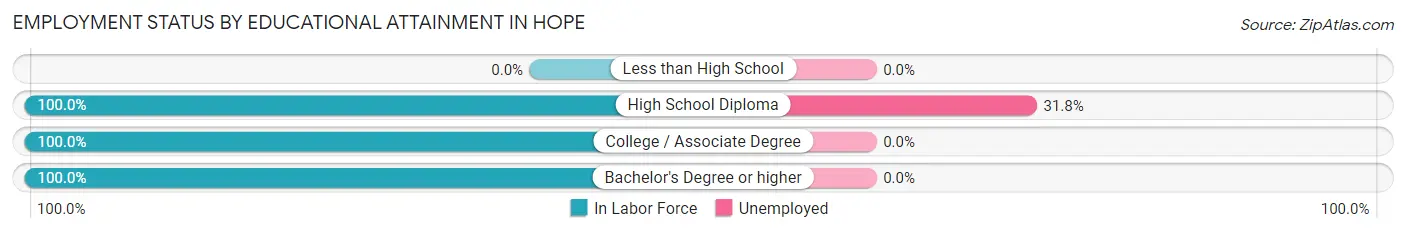
| Educational Attainment | In Labor Force | Unemployed |
| Less than High School | 0 (0.0%) | 0 (0.0%) |
| High School Diploma | 22 (100.0%) | 7 (31.8%) |
| College / Associate Degree | 2 (100.0%) | 0 (0.0%) |
| Bachelor's Degree or higher | 4 (100.0%) | 0 (0.0%) |
| Total | 28 (100.0%) | 7 (25.0%) |
Employment Occupations by Sex in Hope
Management, Business, Science and Arts Occupations
The most common Management, Business, Science and Arts occupations in Hope are Computers, Engineering & Science (4 | 13.8%), Computers & Mathematics (4 | 13.8%), Community & Social Service (4 | 13.8%), Management (2 | 6.9%), and Education, Arts & Media (2 | 6.9%).
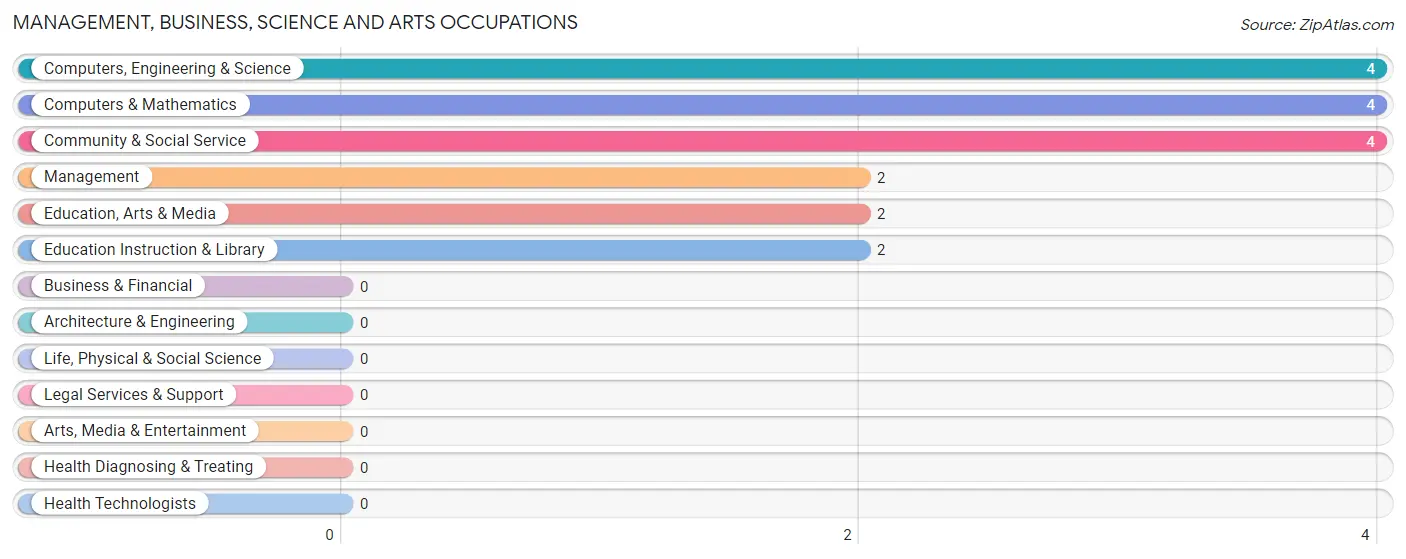
Management, Business, Science and Arts Occupations by Sex
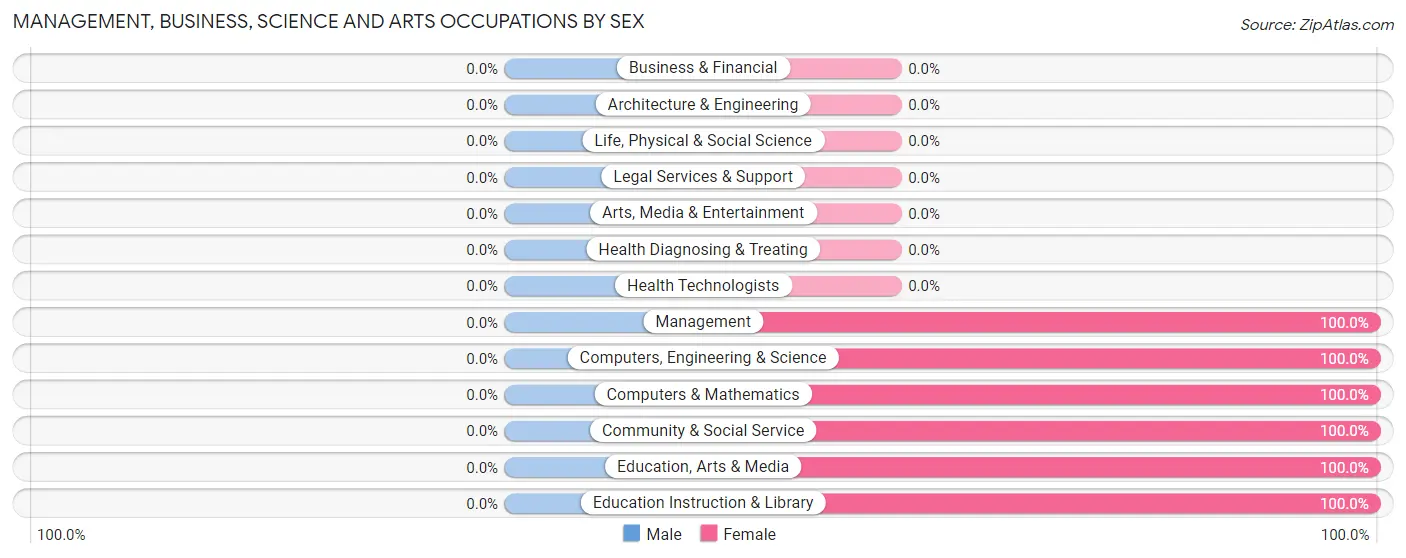
| Occupation | Male | Female |
| Management | 0 (0.0%) | 2 (100.0%) |
| Business & Financial | 0 (0.0%) | 0 (0.0%) |
| Computers, Engineering & Science | 0 (0.0%) | 4 (100.0%) |
| Computers & Mathematics | 0 (0.0%) | 4 (100.0%) |
| Architecture & Engineering | 0 (0.0%) | 0 (0.0%) |
| Life, Physical & Social Science | 0 (0.0%) | 0 (0.0%) |
| Community & Social Service | 0 (0.0%) | 4 (100.0%) |
| Education, Arts & Media | 0 (0.0%) | 2 (100.0%) |
| Legal Services & Support | 0 (0.0%) | 0 (0.0%) |
| Education Instruction & Library | 0 (0.0%) | 2 (100.0%) |
| Arts, Media & Entertainment | 0 (0.0%) | 0 (0.0%) |
| Health Diagnosing & Treating | 0 (0.0%) | 0 (0.0%) |
| Health Technologists | 0 (0.0%) | 0 (0.0%) |
| Total (Category) | 0 (0.0%) | 10 (100.0%) |
| Total (Overall) | 11 (37.9%) | 18 (62.1%) |
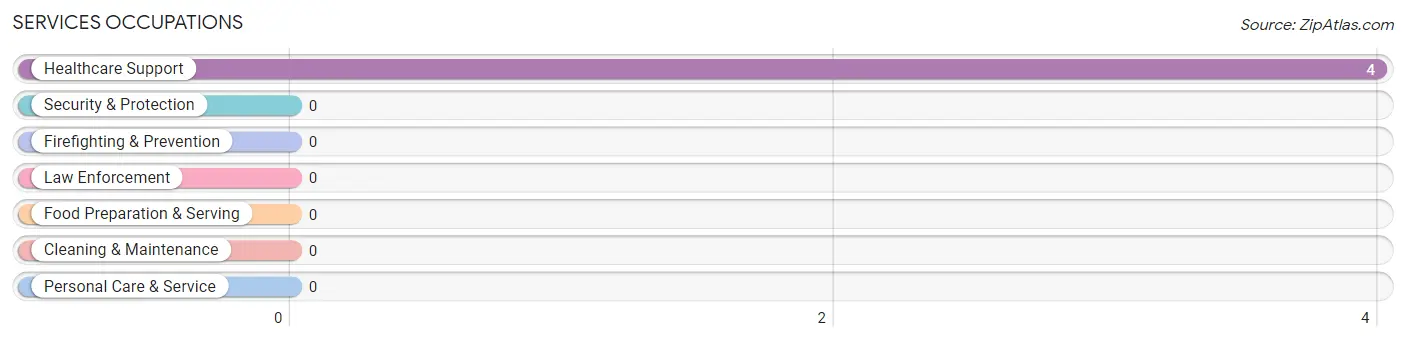
Services Occupations
The most common Services occupations in Hope are , and Healthcare Support (4 | 13.8%).
Services Occupations by Sex
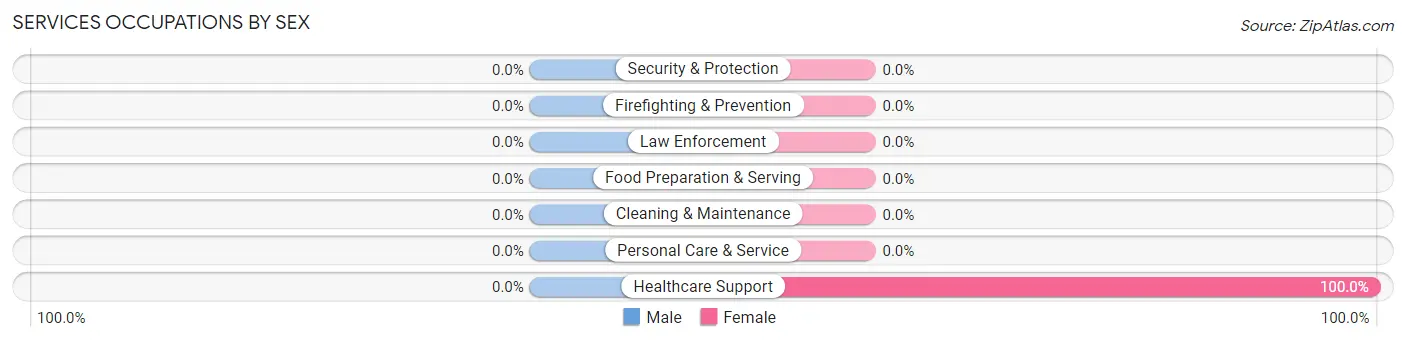
| Occupation | Male | Female |
| Healthcare Support | 0 (0.0%) | 4 (100.0%) |
| Security & Protection | 0 (0.0%) | 0 (0.0%) |
| Firefighting & Prevention | 0 (0.0%) | 0 (0.0%) |
| Law Enforcement | 0 (0.0%) | 0 (0.0%) |
| Food Preparation & Serving | 0 (0.0%) | 0 (0.0%) |
| Cleaning & Maintenance | 0 (0.0%) | 0 (0.0%) |
| Personal Care & Service | 0 (0.0%) | 0 (0.0%) |
| Total (Category) | 0 (0.0%) | 4 (100.0%) |
| Total (Overall) | 11 (37.9%) | 18 (62.1%) |
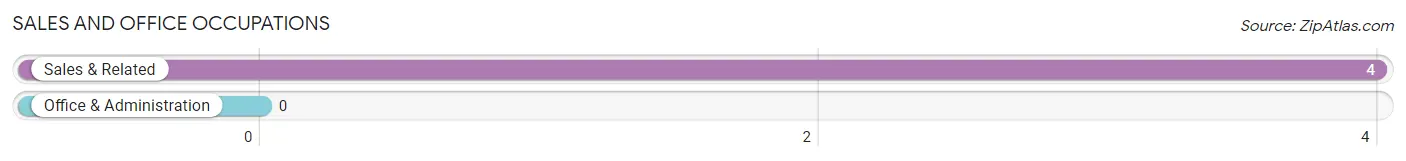
Sales and Office Occupations
The most common Sales and Office occupations in Hope are , and Sales & Related (4 | 13.8%).
Sales and Office Occupations by Sex
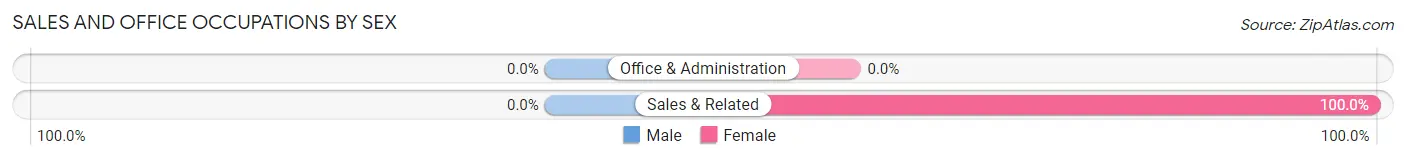
| Occupation | Male | Female |
| Sales & Related | 0 (0.0%) | 4 (100.0%) |
| Office & Administration | 0 (0.0%) | 0 (0.0%) |
| Total (Category) | 0 (0.0%) | 4 (100.0%) |
| Total (Overall) | 11 (37.9%) | 18 (62.1%) |
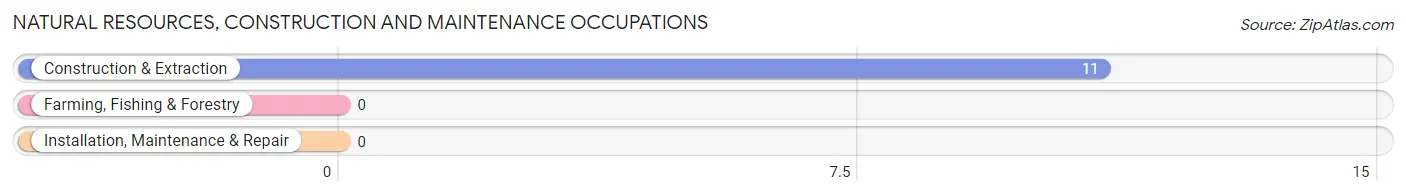
Natural Resources, Construction and Maintenance Occupations
The most common Natural Resources, Construction and Maintenance occupations in Hope are , and Construction & Extraction (11 | 37.9%).
Natural Resources, Construction and Maintenance Occupations by Sex
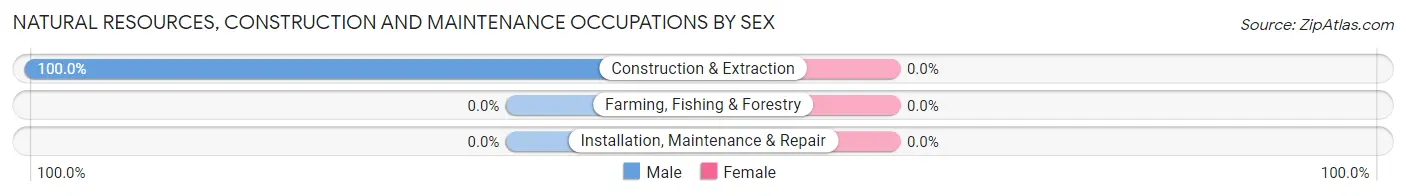
| Occupation | Male | Female |
| Farming, Fishing & Forestry | 0 (0.0%) | 0 (0.0%) |
| Construction & Extraction | 11 (100.0%) | 0 (0.0%) |
| Installation, Maintenance & Repair | 0 (0.0%) | 0 (0.0%) |
| Total (Category) | 11 (100.0%) | 0 (0.0%) |
| Total (Overall) | 11 (37.9%) | 18 (62.1%) |
Production, Transportation and Moving Occupations
Production, Transportation and Moving Occupations by Sex
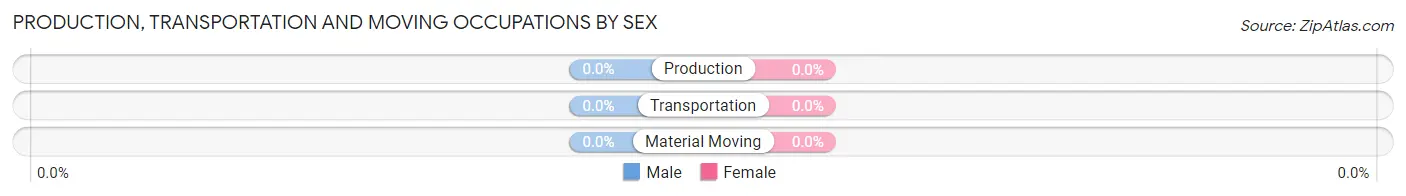
| Occupation | Male | Female |
| Production | 0 (0.0%) | 0 (0.0%) |
| Transportation | 0 (0.0%) | 0 (0.0%) |
| Material Moving | 0 (0.0%) | 0 (0.0%) |
| Total (Category) | 0 (0.0%) | 0 (0.0%) |
| Total (Overall) | 11 (37.9%) | 18 (62.1%) |
Employment Industries by Sex in Hope
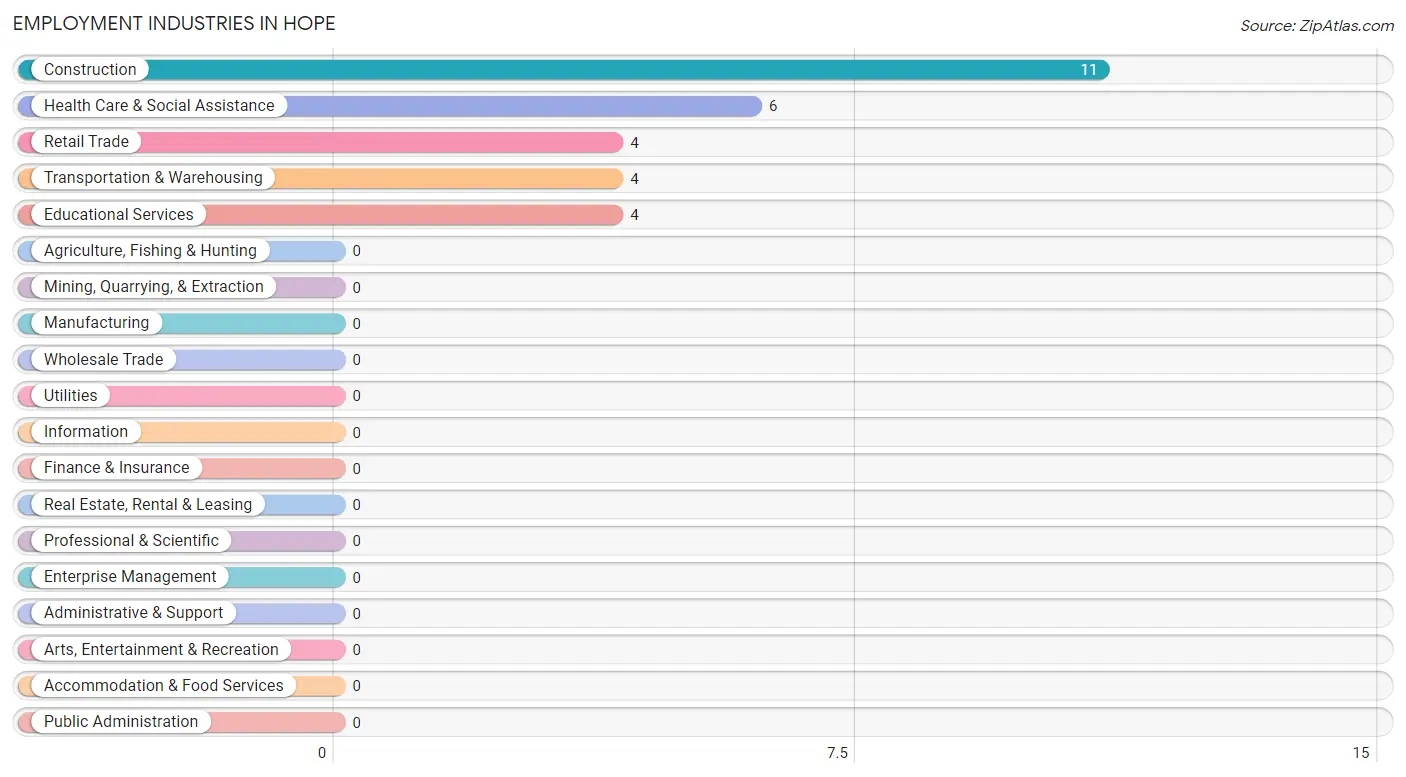
Employment Industries in Hope
The major employment industries in Hope include Construction (11 | 37.9%), Health Care & Social Assistance (6 | 20.7%), Retail Trade (4 | 13.8%), Transportation & Warehousing (4 | 13.8%), and Educational Services (4 | 13.8%).
Employment Industries by Sex in Hope
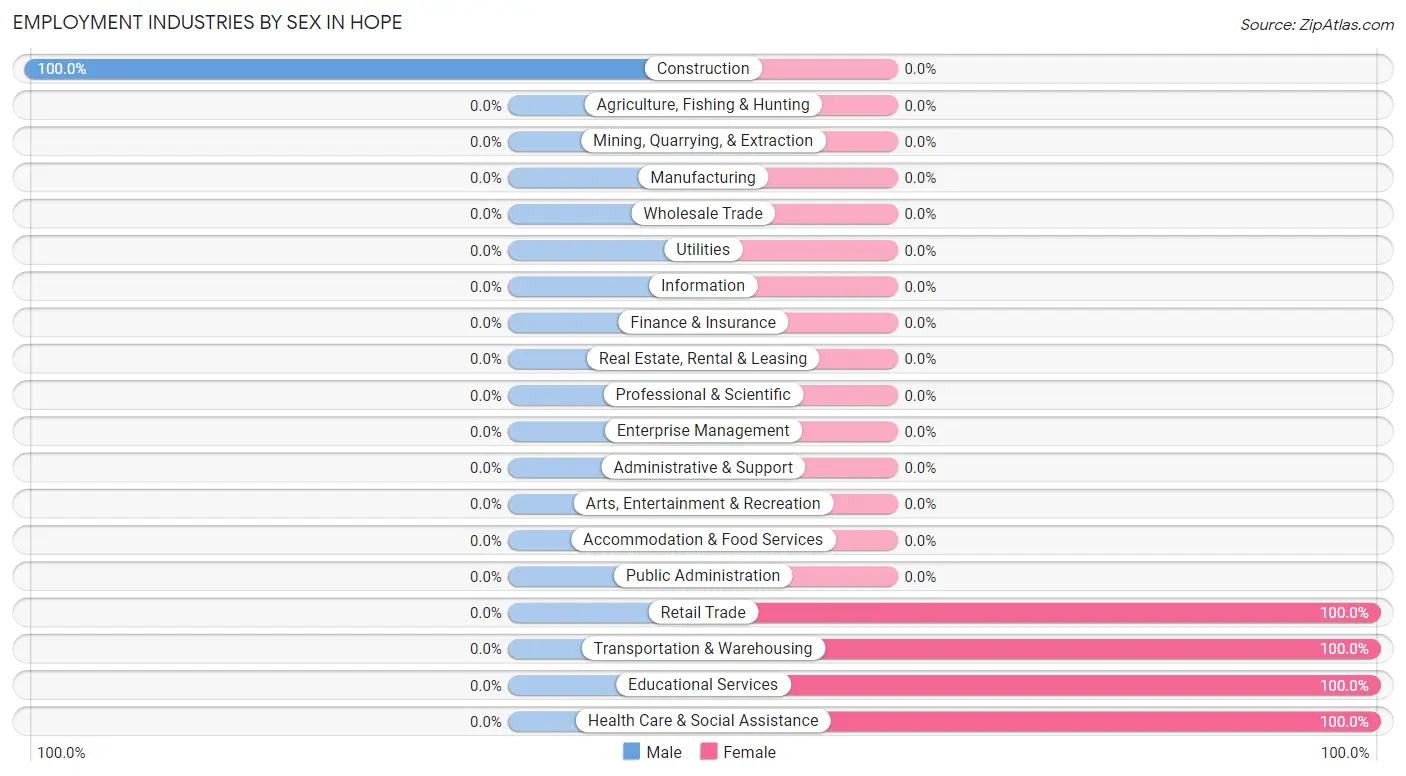
| Industry | Male | Female |
| Agriculture, Fishing & Hunting | 0 (0.0%) | 0 (0.0%) |
| Mining, Quarrying, & Extraction | 0 (0.0%) | 0 (0.0%) |
| Construction | 11 (100.0%) | 0 (0.0%) |
| Manufacturing | 0 (0.0%) | 0 (0.0%) |
| Wholesale Trade | 0 (0.0%) | 0 (0.0%) |
| Retail Trade | 0 (0.0%) | 4 (100.0%) |
| Transportation & Warehousing | 0 (0.0%) | 4 (100.0%) |
| Utilities | 0 (0.0%) | 0 (0.0%) |
| Information | 0 (0.0%) | 0 (0.0%) |
| Finance & Insurance | 0 (0.0%) | 0 (0.0%) |
| Real Estate, Rental & Leasing | 0 (0.0%) | 0 (0.0%) |
| Professional & Scientific | 0 (0.0%) | 0 (0.0%) |
| Enterprise Management | 0 (0.0%) | 0 (0.0%) |
| Administrative & Support | 0 (0.0%) | 0 (0.0%) |
| Educational Services | 0 (0.0%) | 4 (100.0%) |
| Health Care & Social Assistance | 0 (0.0%) | 6 (100.0%) |
| Arts, Entertainment & Recreation | 0 (0.0%) | 0 (0.0%) |
| Accommodation & Food Services | 0 (0.0%) | 0 (0.0%) |
| Public Administration | 0 (0.0%) | 0 (0.0%) |
| Total | 11 (37.9%) | 18 (62.1%) |
Education in Hope
School Enrollment in Hope
The most common levels of schooling among the 8 students in Hope are kindergarten (5 | 62.5%), and middle school (3 | 37.5%).
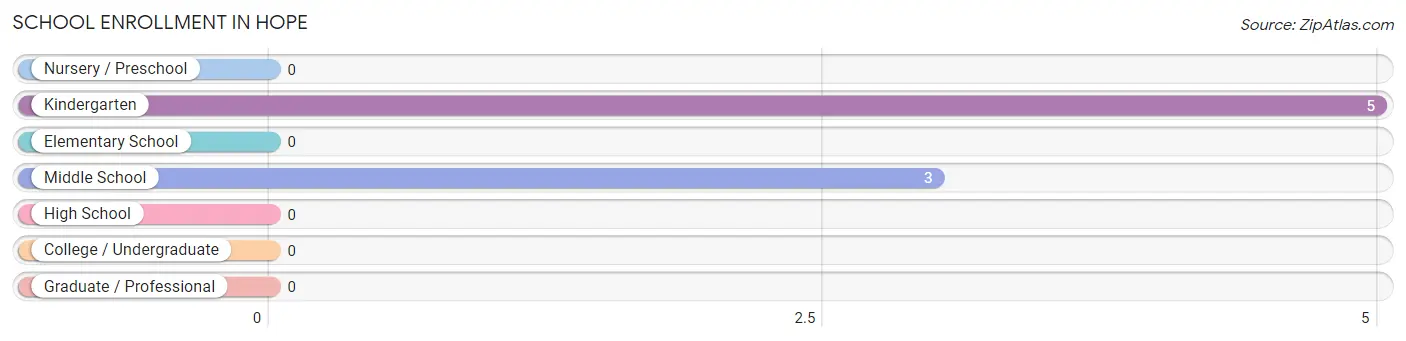
| School Level | # Students | % Students |
| Nursery / Preschool | 0 | 0.0% |
| Kindergarten | 5 | 62.5% |
| Elementary School | 0 | 0.0% |
| Middle School | 3 | 37.5% |
| High School | 0 | 0.0% |
| College / Undergraduate | 0 | 0.0% |
| Graduate / Professional | 0 | 0.0% |
| Total | 8 | 100.0% |
School Enrollment by Age by Funding Source in Hope
Out of a total of 8 students who are enrolled in schools in Hope, 1 (12.5%) attend a private institution, while the remaining 7 (87.5%) are enrolled in public schools. The age group of 10 to 14 year olds has the highest likelihood of being enrolled in private schools, with 1 (33.3% in the age bracket) enrolled. Conversely, the age group of 5 to 9 year old has the lowest likelihood of being enrolled in a private school, with 5 (100.0% in the age bracket) attending a public institution.
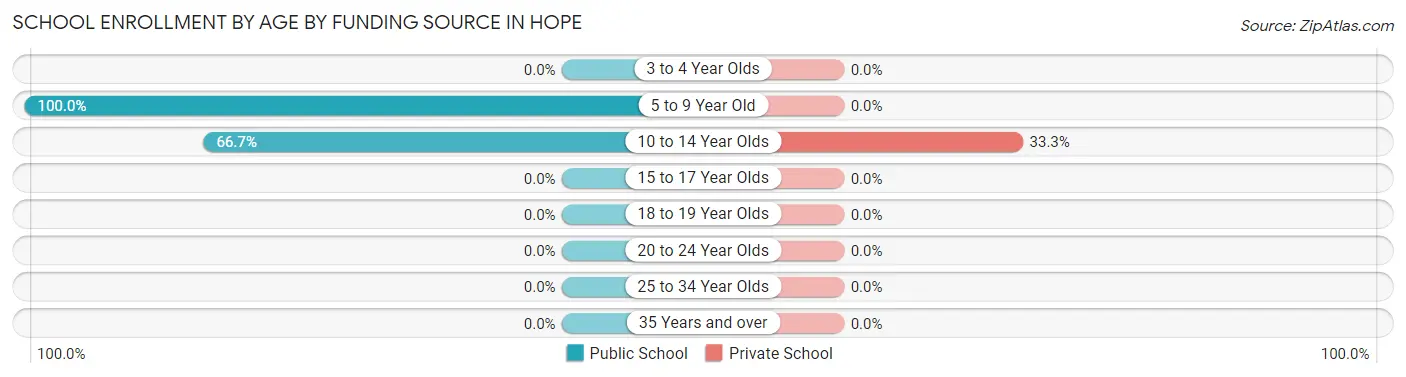
| Age Bracket | Public School | Private School |
| 3 to 4 Year Olds | 0 (0.0%) | 0 (0.0%) |
| 5 to 9 Year Old | 5 (100.0%) | 0 (0.0%) |
| 10 to 14 Year Olds | 2 (66.7%) | 1 (33.3%) |
| 15 to 17 Year Olds | 0 (0.0%) | 0 (0.0%) |
| 18 to 19 Year Olds | 0 (0.0%) | 0 (0.0%) |
| 20 to 24 Year Olds | 0 (0.0%) | 0 (0.0%) |
| 25 to 34 Year Olds | 0 (0.0%) | 0 (0.0%) |
| 35 Years and over | 0 (0.0%) | 0 (0.0%) |
| Total | 7 (87.5%) | 1 (12.5%) |
Educational Attainment by Field of Study in Hope
Education (16 | 40.0%), physical & health sciences (6 | 15.0%), science & technology (6 | 15.0%), social sciences (5 | 12.5%), and psychology (2 | 5.0%) are the most common fields of study among 40 individuals in Hope who have obtained a bachelor's degree or higher.
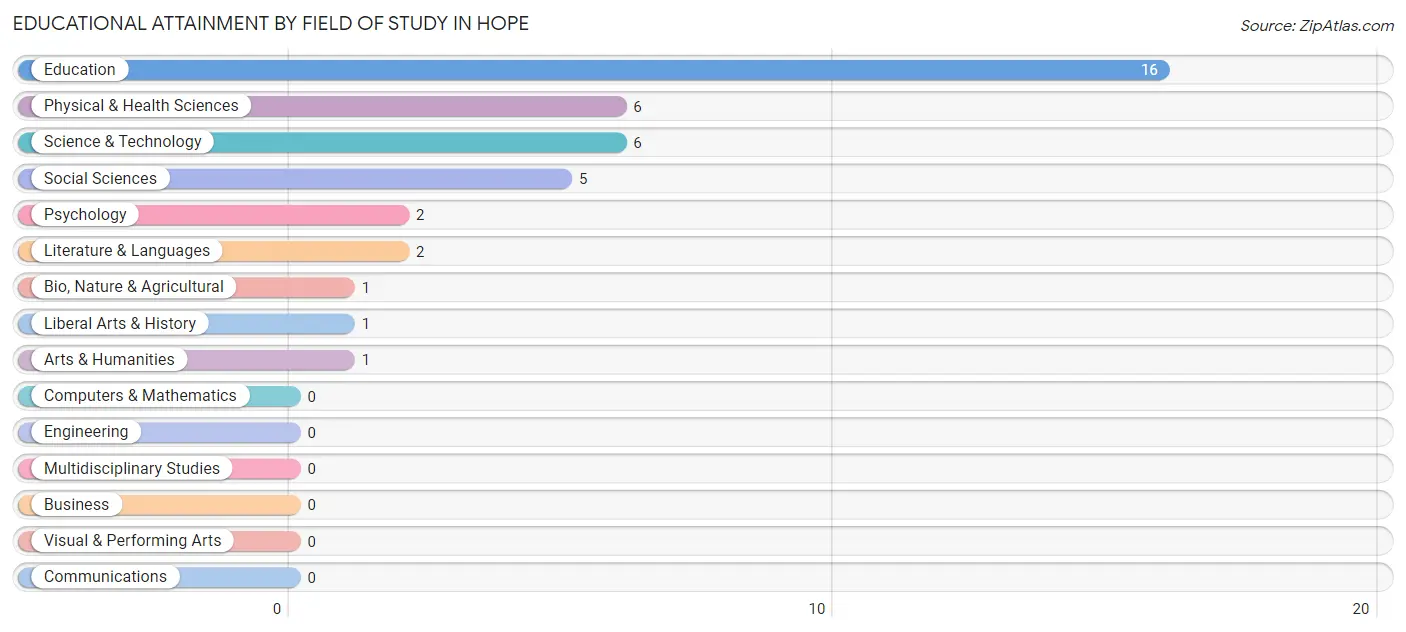
| Field of Study | # Graduates | % Graduates |
| Computers & Mathematics | 0 | 0.0% |
| Bio, Nature & Agricultural | 1 | 2.5% |
| Physical & Health Sciences | 6 | 15.0% |
| Psychology | 2 | 5.0% |
| Social Sciences | 5 | 12.5% |
| Engineering | 0 | 0.0% |
| Multidisciplinary Studies | 0 | 0.0% |
| Science & Technology | 6 | 15.0% |
| Business | 0 | 0.0% |
| Education | 16 | 40.0% |
| Literature & Languages | 2 | 5.0% |
| Liberal Arts & History | 1 | 2.5% |
| Visual & Performing Arts | 0 | 0.0% |
| Communications | 0 | 0.0% |
| Arts & Humanities | 1 | 2.5% |
| Total | 40 | 100.0% |
Transportation & Commute in Hope
Vehicle Availability by Sex in Hope
The most prevalent vehicle ownership categories in Hope are males with 3 vehicles (11, accounting for 100.0%) and females with 3 vehicles (10, making up 61.1%).
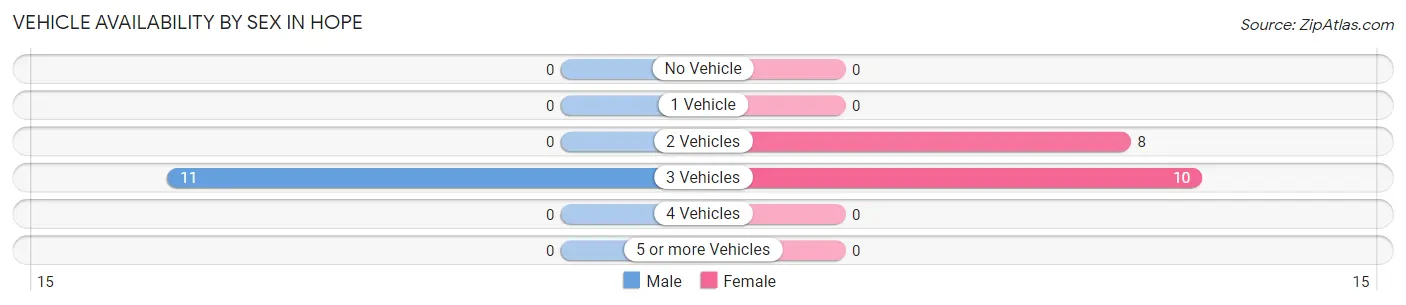
| Vehicles Available | Male | Female |
| No Vehicle | 0 (0.0%) | 0 (0.0%) |
| 1 Vehicle | 0 (0.0%) | 0 (0.0%) |
| 2 Vehicles | 0 (0.0%) | 8 (44.4%) |
| 3 Vehicles | 11 (100.0%) | 10 (55.6%) |
| 4 Vehicles | 0 (0.0%) | 0 (0.0%) |
| 5 or more Vehicles | 0 (0.0%) | 0 (0.0%) |
| Total | 11 (100.0%) | 18 (100.0%) |
Commute Time in Hope
The most frequently occuring commute durations in Hope are 15 to 19 minutes (8 commuters, 34.8%), 60 to 89 minutes (5 commuters, 21.7%), and less than 5 minutes (4 commuters, 17.4%).
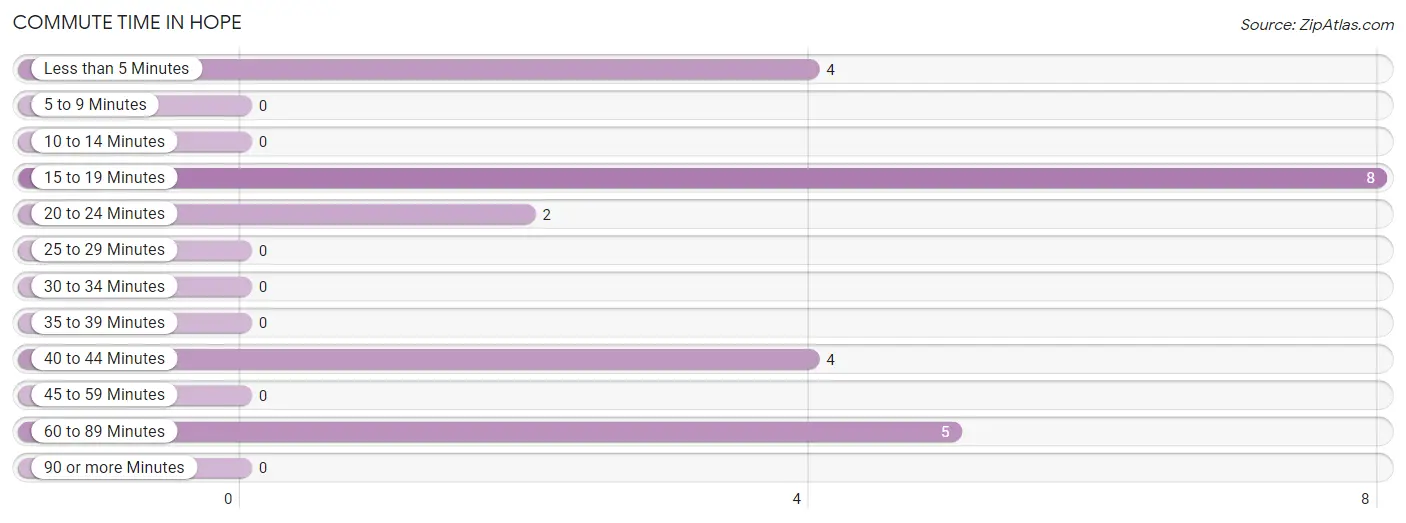
| Commute Time | # Commuters | % Commuters |
| Less than 5 Minutes | 4 | 17.4% |
| 5 to 9 Minutes | 0 | 0.0% |
| 10 to 14 Minutes | 0 | 0.0% |
| 15 to 19 Minutes | 8 | 34.8% |
| 20 to 24 Minutes | 2 | 8.7% |
| 25 to 29 Minutes | 0 | 0.0% |
| 30 to 34 Minutes | 0 | 0.0% |
| 35 to 39 Minutes | 0 | 0.0% |
| 40 to 44 Minutes | 4 | 17.4% |
| 45 to 59 Minutes | 0 | 0.0% |
| 60 to 89 Minutes | 5 | 21.7% |
| 90 or more Minutes | 0 | 0.0% |
Commute Time by Sex in Hope
The most common commute times in Hope are 15 to 19 minutes (4 commuters, 36.4%) for males and less than 5 minutes (4 commuters, 33.3%) for females.
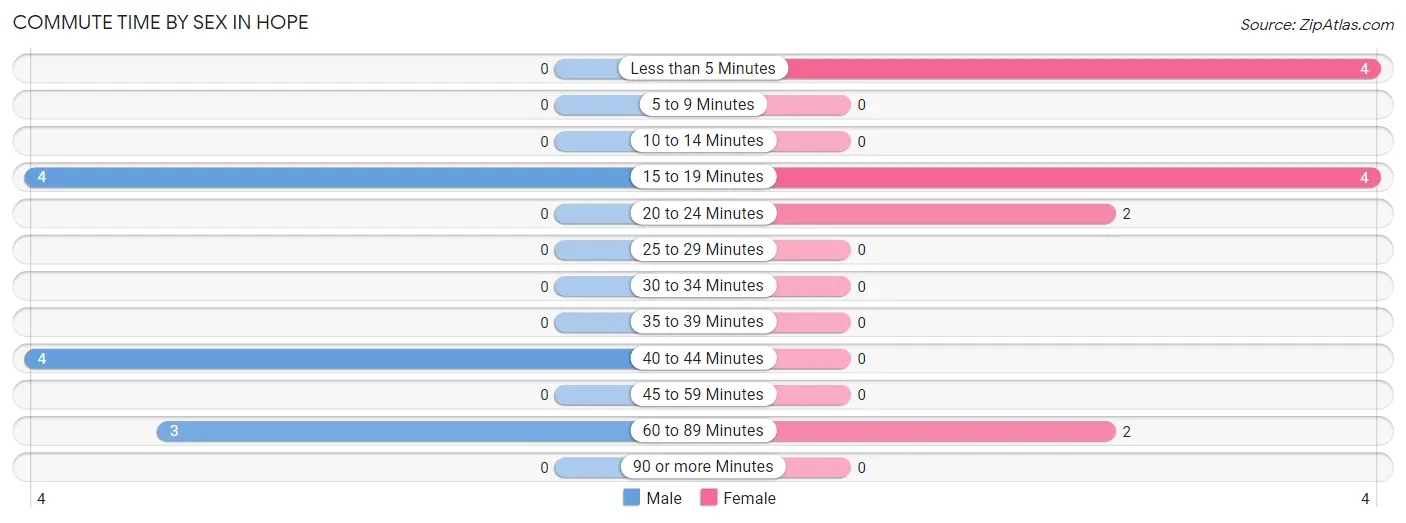
| Commute Time | Male | Female |
| Less than 5 Minutes | 0 (0.0%) | 4 (33.3%) |
| 5 to 9 Minutes | 0 (0.0%) | 0 (0.0%) |
| 10 to 14 Minutes | 0 (0.0%) | 0 (0.0%) |
| 15 to 19 Minutes | 4 (36.4%) | 4 (33.3%) |
| 20 to 24 Minutes | 0 (0.0%) | 2 (16.7%) |
| 25 to 29 Minutes | 0 (0.0%) | 0 (0.0%) |
| 30 to 34 Minutes | 0 (0.0%) | 0 (0.0%) |
| 35 to 39 Minutes | 0 (0.0%) | 0 (0.0%) |
| 40 to 44 Minutes | 4 (36.4%) | 0 (0.0%) |
| 45 to 59 Minutes | 0 (0.0%) | 0 (0.0%) |
| 60 to 89 Minutes | 3 (27.3%) | 2 (16.7%) |
| 90 or more Minutes | 0 (0.0%) | 0 (0.0%) |
Time of Departure to Work by Sex in Hope
The most frequent times of departure to work in Hope are 5:30 AM to 5:59 AM (4, 36.4%) for males and 7:00 AM to 7:29 AM (6, 50.0%) for females.
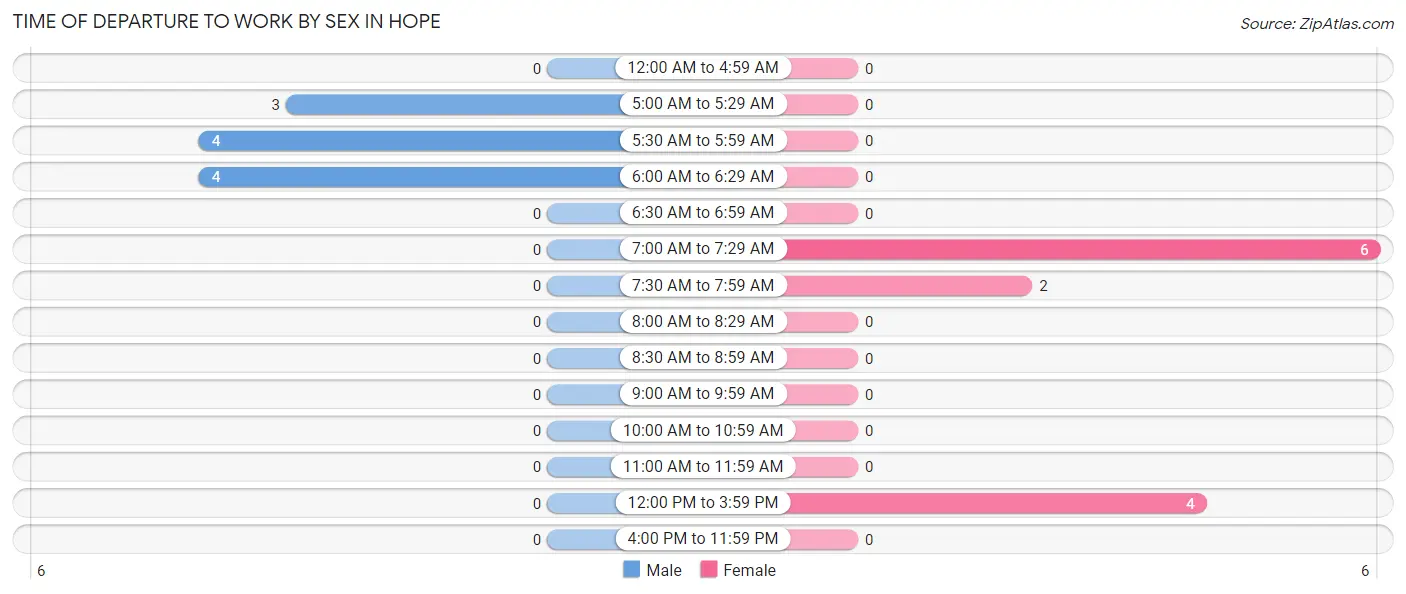
| Time of Departure | Male | Female |
| 12:00 AM to 4:59 AM | 0 (0.0%) | 0 (0.0%) |
| 5:00 AM to 5:29 AM | 3 (27.3%) | 0 (0.0%) |
| 5:30 AM to 5:59 AM | 4 (36.4%) | 0 (0.0%) |
| 6:00 AM to 6:29 AM | 4 (36.4%) | 0 (0.0%) |
| 6:30 AM to 6:59 AM | 0 (0.0%) | 0 (0.0%) |
| 7:00 AM to 7:29 AM | 0 (0.0%) | 6 (50.0%) |
| 7:30 AM to 7:59 AM | 0 (0.0%) | 2 (16.7%) |
| 8:00 AM to 8:29 AM | 0 (0.0%) | 0 (0.0%) |
| 8:30 AM to 8:59 AM | 0 (0.0%) | 0 (0.0%) |
| 9:00 AM to 9:59 AM | 0 (0.0%) | 0 (0.0%) |
| 10:00 AM to 10:59 AM | 0 (0.0%) | 0 (0.0%) |
| 11:00 AM to 11:59 AM | 0 (0.0%) | 0 (0.0%) |
| 12:00 PM to 3:59 PM | 0 (0.0%) | 4 (33.3%) |
| 4:00 PM to 11:59 PM | 0 (0.0%) | 0 (0.0%) |
| Total | 11 (100.0%) | 12 (100.0%) |
Housing Occupancy in Hope
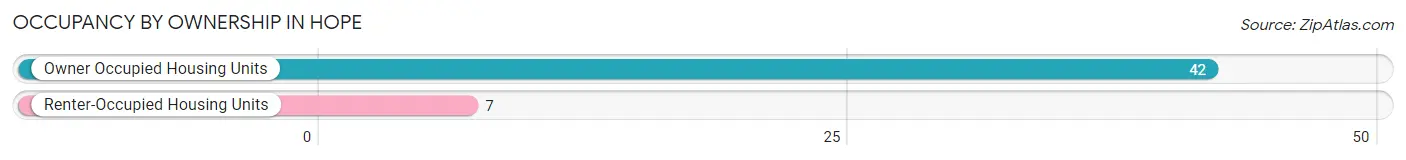
Occupancy by Ownership in Hope
Of the total 49 dwellings in Hope, owner-occupied units account for 42 (85.7%), while renter-occupied units make up 7 (14.3%).
| Occupancy | # Housing Units | % Housing Units |
| Owner Occupied Housing Units | 42 | 85.7% |
| Renter-Occupied Housing Units | 7 | 14.3% |
| Total Occupied Housing Units | 49 | 100.0% |
Occupancy by Household Size in Hope
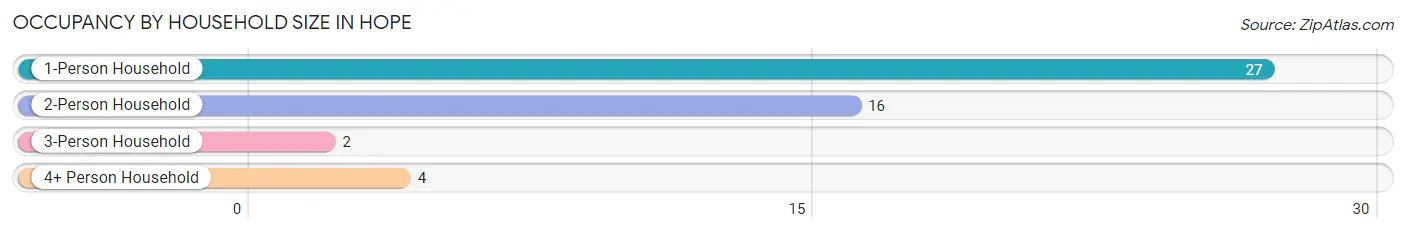
| Household Size | # Housing Units | % Housing Units |
| 1-Person Household | 27 | 55.1% |
| 2-Person Household | 16 | 32.7% |
| 3-Person Household | 2 | 4.1% |
| 4+ Person Household | 4 | 8.2% |
| Total Housing Units | 49 | 100.0% |
Occupancy by Ownership by Household Size in Hope
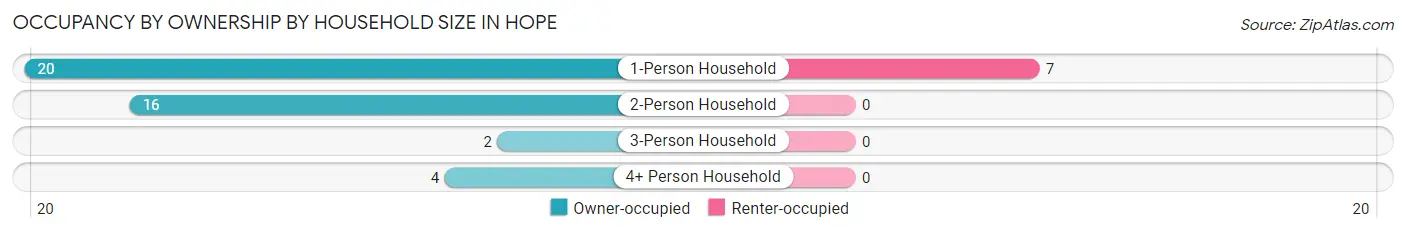
| Household Size | Owner-occupied | Renter-occupied |
| 1-Person Household | 20 (74.1%) | 7 (25.9%) |
| 2-Person Household | 16 (100.0%) | 0 (0.0%) |
| 3-Person Household | 2 (100.0%) | 0 (0.0%) |
| 4+ Person Household | 4 (100.0%) | 0 (0.0%) |
| Total Housing Units | 42 (85.7%) | 7 (14.3%) |
Occupancy by Educational Attainment in Hope
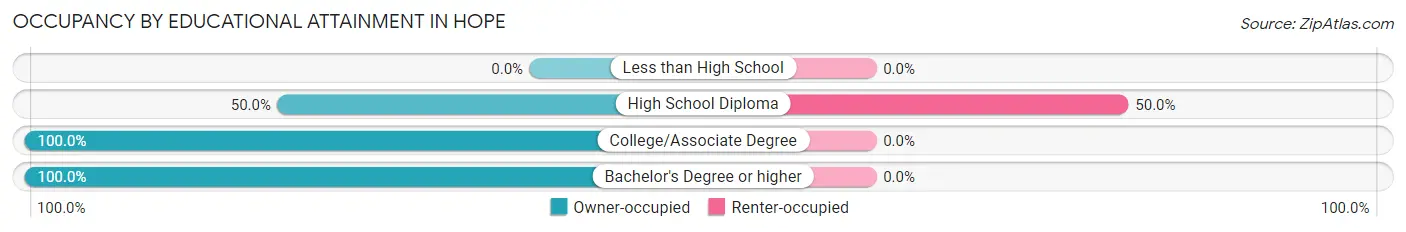
| Household Size | Owner-occupied | Renter-occupied |
| Less than High School | 0 (0.0%) | 0 (0.0%) |
| High School Diploma | 7 (50.0%) | 7 (50.0%) |
| College/Associate Degree | 14 (100.0%) | 0 (0.0%) |
| Bachelor's Degree or higher | 21 (100.0%) | 0 (0.0%) |
Occupancy by Age of Householder in Hope
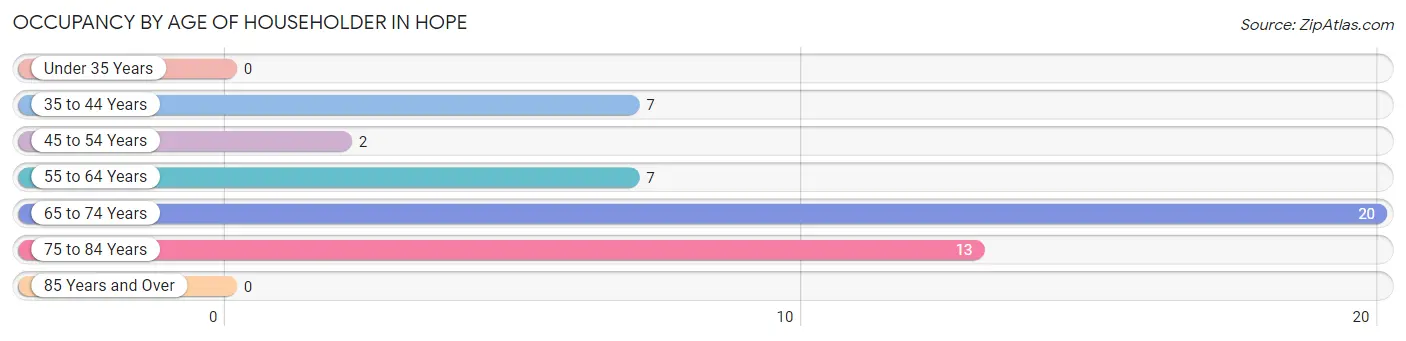
| Age Bracket | # Households | % Households |
| Under 35 Years | 0 | 0.0% |
| 35 to 44 Years | 7 | 14.3% |
| 45 to 54 Years | 2 | 4.1% |
| 55 to 64 Years | 7 | 14.3% |
| 65 to 74 Years | 20 | 40.8% |
| 75 to 84 Years | 13 | 26.5% |
| 85 Years and Over | 0 | 0.0% |
| Total | 49 | 100.0% |
Housing Finances in Hope
Median Income by Occupancy in Hope
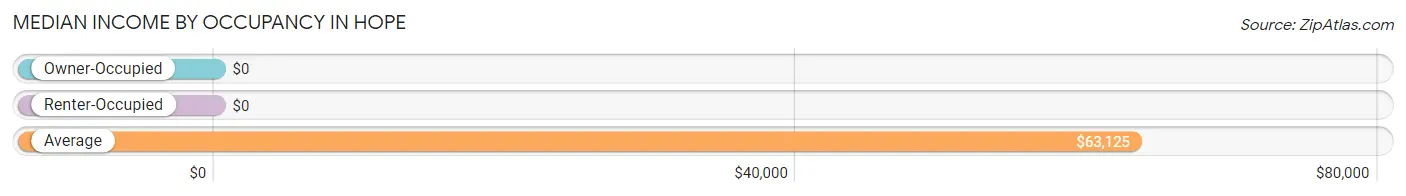
| Occupancy Type | # Households | Median Income |
| Owner-Occupied | 42 (85.7%) | $0 |
| Renter-Occupied | 7 (14.3%) | $0 |
| Average | 49 (100.0%) | $63,125 |
Occupancy by Householder Income Bracket in Hope
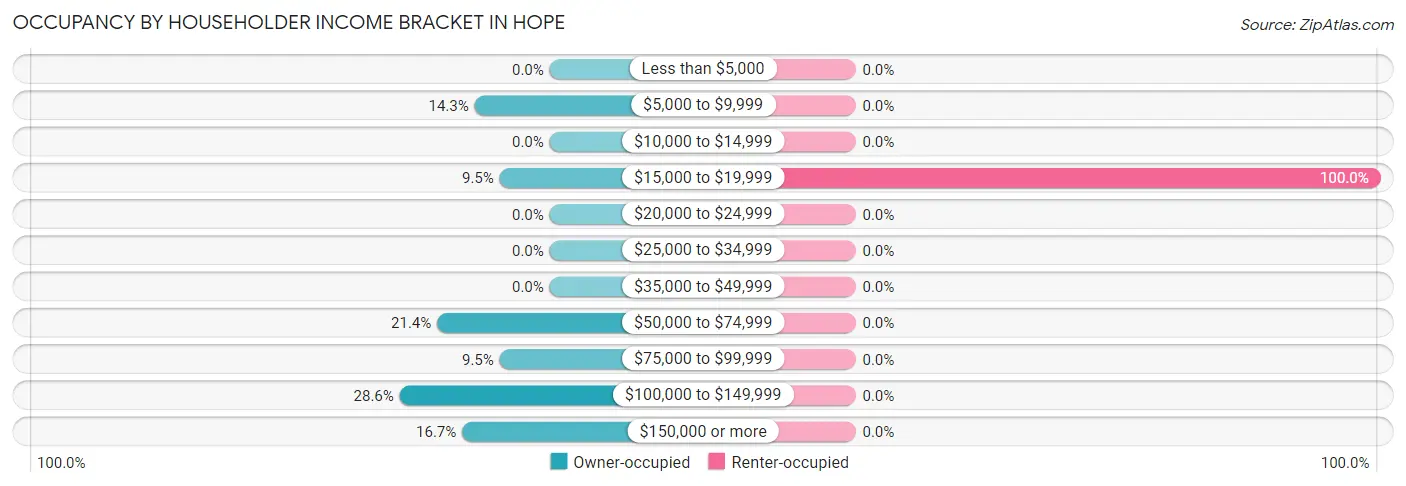
| Income Bracket | Owner-occupied | Renter-occupied |
| Less than $5,000 | 0 (0.0%) | 0 (0.0%) |
| $5,000 to $9,999 | 6 (14.3%) | 0 (0.0%) |
| $10,000 to $14,999 | 0 (0.0%) | 0 (0.0%) |
| $15,000 to $19,999 | 4 (9.5%) | 7 (100.0%) |
| $20,000 to $24,999 | 0 (0.0%) | 0 (0.0%) |
| $25,000 to $34,999 | 0 (0.0%) | 0 (0.0%) |
| $35,000 to $49,999 | 0 (0.0%) | 0 (0.0%) |
| $50,000 to $74,999 | 9 (21.4%) | 0 (0.0%) |
| $75,000 to $99,999 | 4 (9.5%) | 0 (0.0%) |
| $100,000 to $149,999 | 12 (28.6%) | 0 (0.0%) |
| $150,000 or more | 7 (16.7%) | 0 (0.0%) |
| Total | 42 (100.0%) | 7 (100.0%) |
Monthly Housing Cost Tiers in Hope
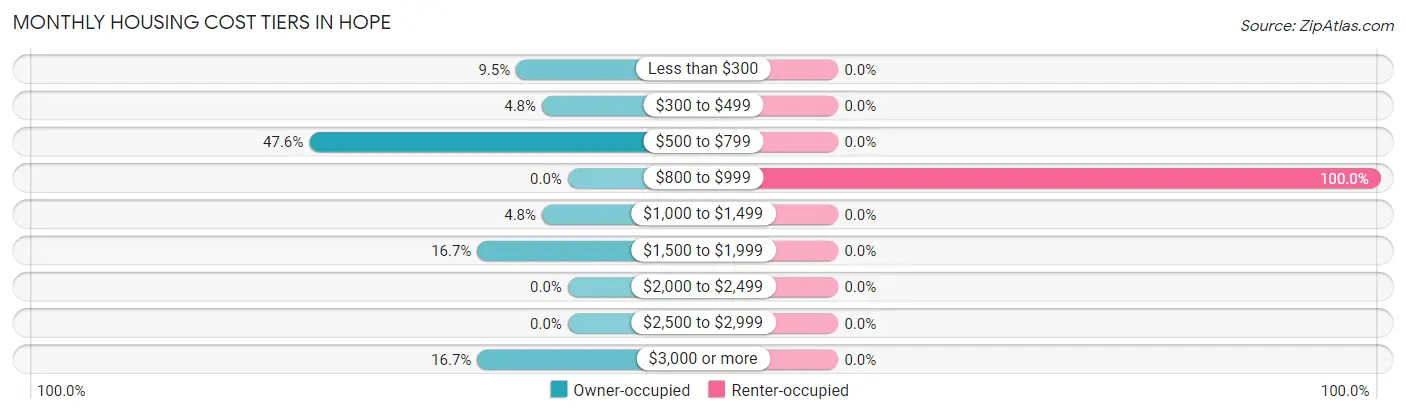
| Monthly Cost | Owner-occupied | Renter-occupied |
| Less than $300 | 4 (9.5%) | 0 (0.0%) |
| $300 to $499 | 2 (4.8%) | 0 (0.0%) |
| $500 to $799 | 20 (47.6%) | 0 (0.0%) |
| $800 to $999 | 0 (0.0%) | 7 (100.0%) |
| $1,000 to $1,499 | 2 (4.8%) | 0 (0.0%) |
| $1,500 to $1,999 | 7 (16.7%) | 0 (0.0%) |
| $2,000 to $2,499 | 0 (0.0%) | 0 (0.0%) |
| $2,500 to $2,999 | 0 (0.0%) | 0 (0.0%) |
| $3,000 or more | 7 (16.7%) | 0 (0.0%) |
| Total | 42 (100.0%) | 7 (100.0%) |
Physical Housing Characteristics in Hope
Housing Structures in Hope
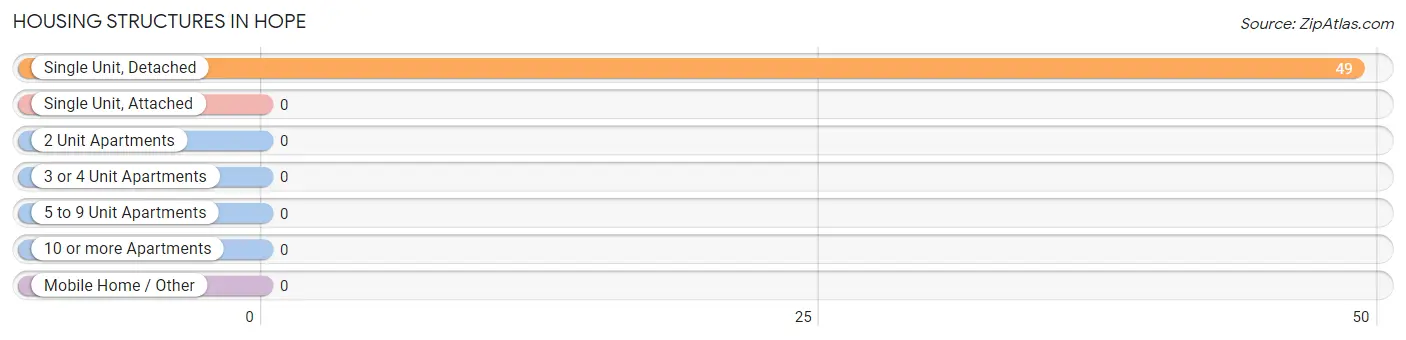
| Structure Type | # Housing Units | % Housing Units |
| Single Unit, Detached | 49 | 100.0% |
| Single Unit, Attached | 0 | 0.0% |
| 2 Unit Apartments | 0 | 0.0% |
| 3 or 4 Unit Apartments | 0 | 0.0% |
| 5 to 9 Unit Apartments | 0 | 0.0% |
| 10 or more Apartments | 0 | 0.0% |
| Mobile Home / Other | 0 | 0.0% |
| Total | 49 | 100.0% |
Housing Structures by Occupancy in Hope
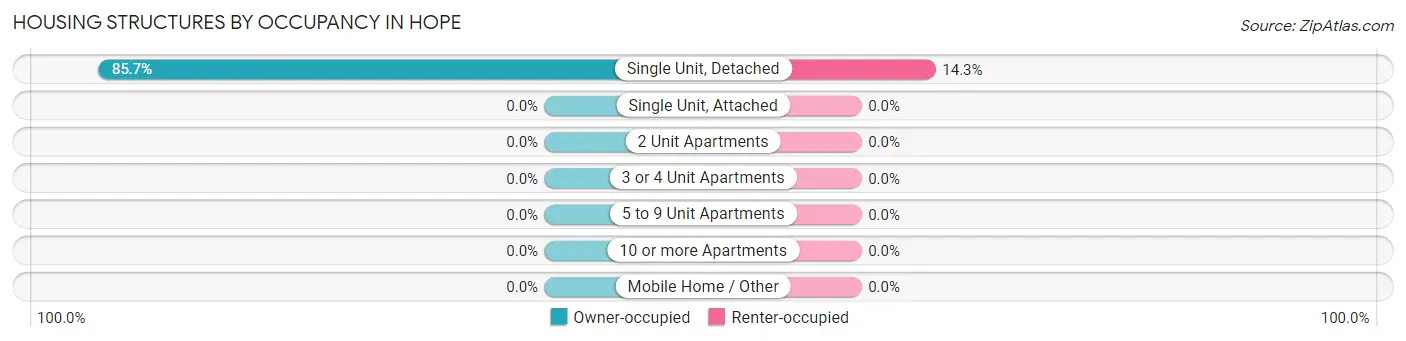
| Structure Type | Owner-occupied | Renter-occupied |
| Single Unit, Detached | 42 (85.7%) | 7 (14.3%) |
| Single Unit, Attached | 0 (0.0%) | 0 (0.0%) |
| 2 Unit Apartments | 0 (0.0%) | 0 (0.0%) |
| 3 or 4 Unit Apartments | 0 (0.0%) | 0 (0.0%) |
| 5 to 9 Unit Apartments | 0 (0.0%) | 0 (0.0%) |
| 10 or more Apartments | 0 (0.0%) | 0 (0.0%) |
| Mobile Home / Other | 0 (0.0%) | 0 (0.0%) |
| Total | 42 (85.7%) | 7 (14.3%) |
Housing Structures by Number of Rooms in Hope
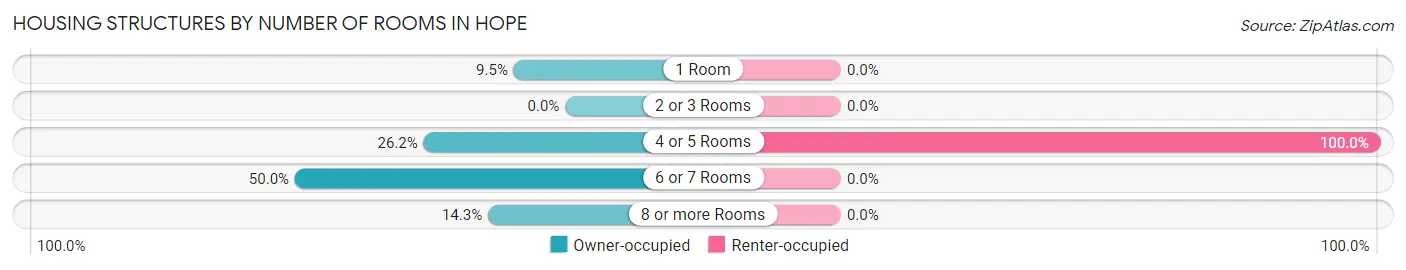
| Number of Rooms | Owner-occupied | Renter-occupied |
| 1 Room | 4 (9.5%) | 0 (0.0%) |
| 2 or 3 Rooms | 0 (0.0%) | 0 (0.0%) |
| 4 or 5 Rooms | 11 (26.2%) | 7 (100.0%) |
| 6 or 7 Rooms | 21 (50.0%) | 0 (0.0%) |
| 8 or more Rooms | 6 (14.3%) | 0 (0.0%) |
| Total | 42 (100.0%) | 7 (100.0%) |
Housing Structure by Heating Type in Hope
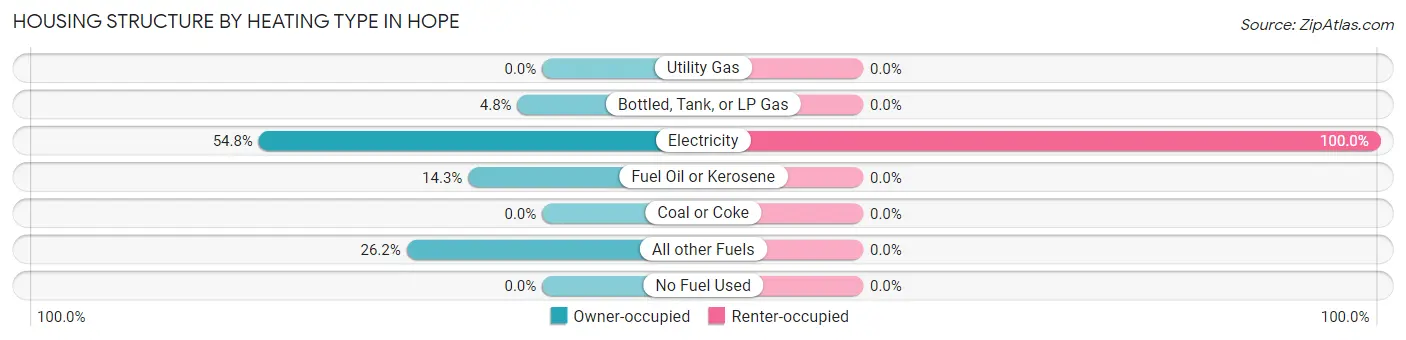
| Heating Type | Owner-occupied | Renter-occupied |
| Utility Gas | 0 (0.0%) | 0 (0.0%) |
| Bottled, Tank, or LP Gas | 2 (4.8%) | 0 (0.0%) |
| Electricity | 23 (54.8%) | 7 (100.0%) |
| Fuel Oil or Kerosene | 6 (14.3%) | 0 (0.0%) |
| Coal or Coke | 0 (0.0%) | 0 (0.0%) |
| All other Fuels | 11 (26.2%) | 0 (0.0%) |
| No Fuel Used | 0 (0.0%) | 0 (0.0%) |
| Total | 42 (100.0%) | 7 (100.0%) |
Household Vehicle Usage in Hope
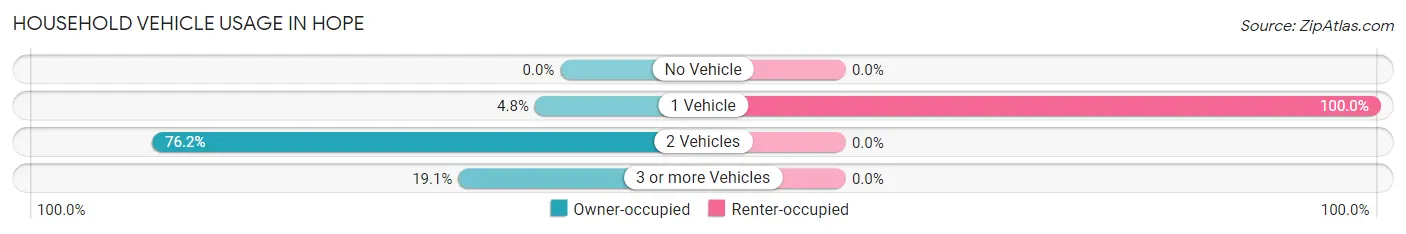
| Vehicles per Household | Owner-occupied | Renter-occupied |
| No Vehicle | 0 (0.0%) | 0 (0.0%) |
| 1 Vehicle | 2 (4.8%) | 7 (100.0%) |
| 2 Vehicles | 32 (76.2%) | 0 (0.0%) |
| 3 or more Vehicles | 8 (19.1%) | 0 (0.0%) |
| Total | 42 (100.0%) | 7 (100.0%) |
Real Estate & Mortgages in Hope
Real Estate and Mortgage Overview in Hope
| Characteristic | Without Mortgage | With Mortgage |
| Housing Units | 30 | 12 |
| Median Property Value | - | - |
| Median Household Income | $59,583 | $7 |
| Monthly Housing Costs | $575 | $2 |
| Real Estate Taxes | $2,308 | $0 |
Property Value by Mortgage Status in Hope
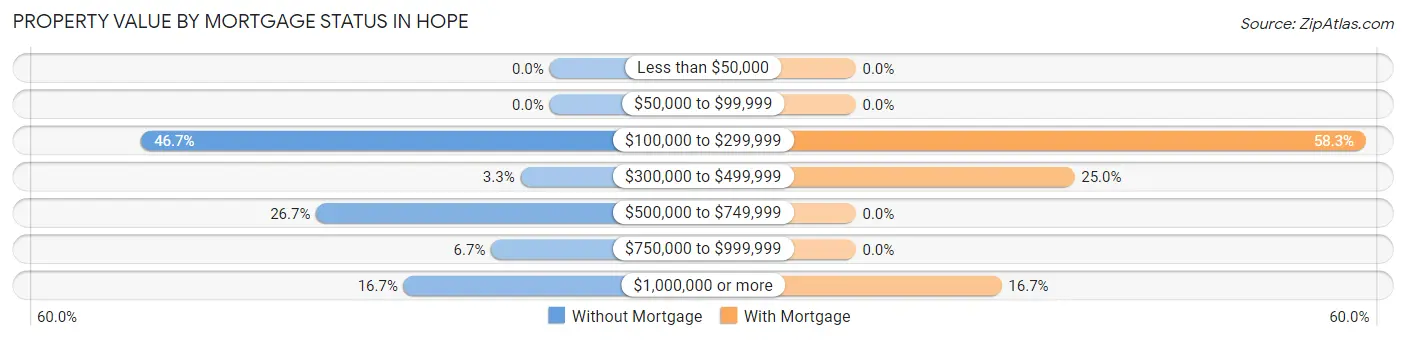
| Property Value | Without Mortgage | With Mortgage |
| Less than $50,000 | 0 (0.0%) | 0 (0.0%) |
| $50,000 to $99,999 | 0 (0.0%) | 0 (0.0%) |
| $100,000 to $299,999 | 14 (46.7%) | 7 (58.3%) |
| $300,000 to $499,999 | 1 (3.3%) | 3 (25.0%) |
| $500,000 to $749,999 | 8 (26.7%) | 0 (0.0%) |
| $750,000 to $999,999 | 2 (6.7%) | 0 (0.0%) |
| $1,000,000 or more | 5 (16.7%) | 2 (16.7%) |
| Total | 30 (100.0%) | 12 (100.0%) |
Household Income by Mortgage Status in Hope
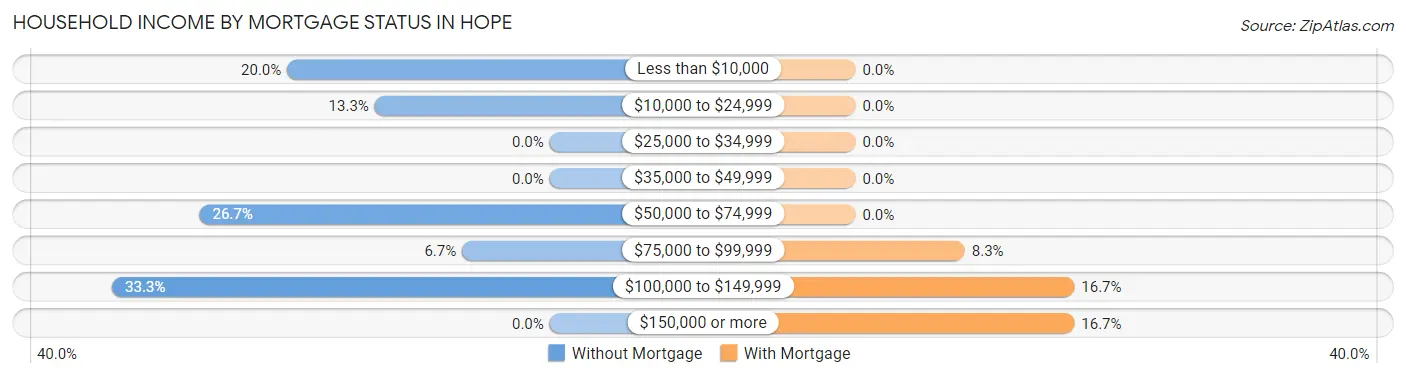
| Household Income | Without Mortgage | With Mortgage |
| Less than $10,000 | 6 (20.0%) | 0 (0.0%) |
| $10,000 to $24,999 | 4 (13.3%) | 0 (0.0%) |
| $25,000 to $34,999 | 0 (0.0%) | 0 (0.0%) |
| $35,000 to $49,999 | 0 (0.0%) | 0 (0.0%) |
| $50,000 to $74,999 | 8 (26.7%) | 0 (0.0%) |
| $75,000 to $99,999 | 2 (6.7%) | 1 (8.3%) |
| $100,000 to $149,999 | 10 (33.3%) | 2 (16.7%) |
| $150,000 or more | 0 (0.0%) | 2 (16.7%) |
| Total | 30 (100.0%) | 12 (100.0%) |
Property Value to Household Income Ratio in Hope
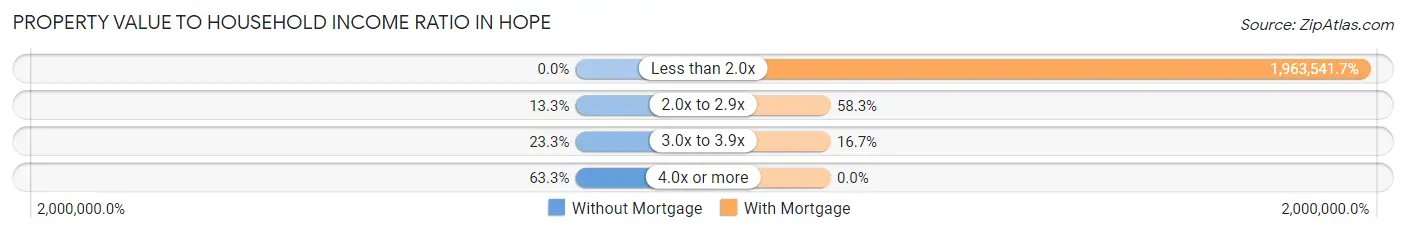
| Value-to-Income Ratio | Without Mortgage | With Mortgage |
| Less than 2.0x | 0 (0.0%) | 235,625 (1,963,541.7%) |
| 2.0x to 2.9x | 4 (13.3%) | 7 (58.3%) |
| 3.0x to 3.9x | 7 (23.3%) | 2 (16.7%) |
| 4.0x or more | 19 (63.3%) | 0 (0.0%) |
| Total | 30 (100.0%) | 12 (100.0%) |
Real Estate Taxes by Mortgage Status in Hope
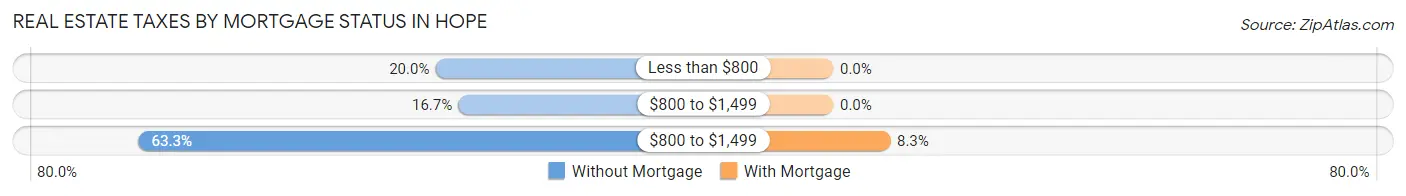
| Property Taxes | Without Mortgage | With Mortgage |
| Less than $800 | 6 (20.0%) | 0 (0.0%) |
| $800 to $1,499 | 5 (16.7%) | 0 (0.0%) |
| $800 to $1,499 | 19 (63.3%) | 1 (8.3%) |
| Total | 30 (100.0%) | 12 (100.0%) |
Health & Disability in Hope
Health Insurance Coverage by Age in Hope
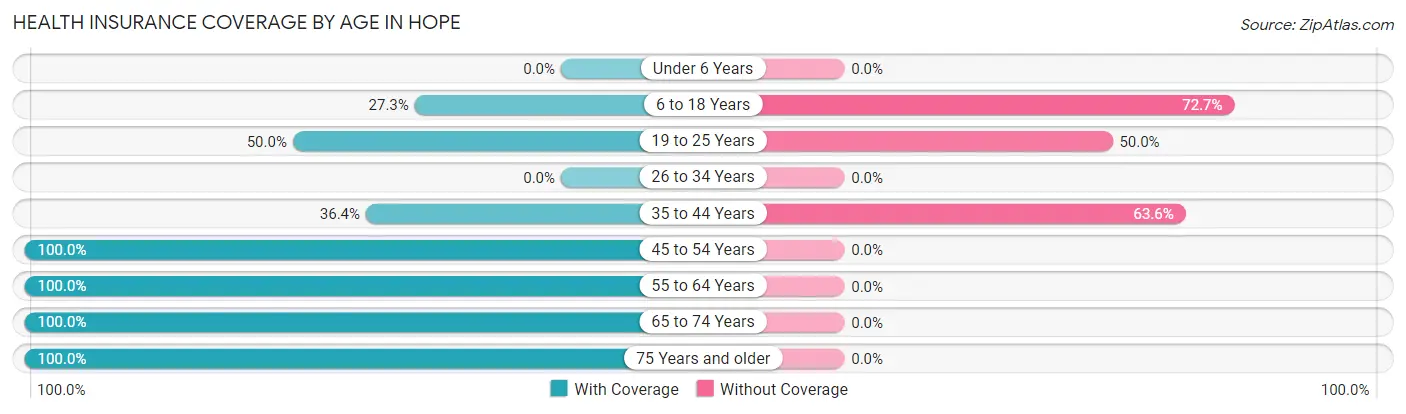
| Age Bracket | With Coverage | Without Coverage |
| Under 6 Years | 0 (0.0%) | 0 (0.0%) |
| 6 to 18 Years | 3 (27.3%) | 8 (72.7%) |
| 19 to 25 Years | 4 (50.0%) | 4 (50.0%) |
| 26 to 34 Years | 0 (0.0%) | 0 (0.0%) |
| 35 to 44 Years | 4 (36.4%) | 7 (63.6%) |
| 45 to 54 Years | 4 (100.0%) | 0 (0.0%) |
| 55 to 64 Years | 13 (100.0%) | 0 (0.0%) |
| 65 to 74 Years | 33 (100.0%) | 0 (0.0%) |
| 75 Years and older | 16 (100.0%) | 0 (0.0%) |
| Total | 77 (80.2%) | 19 (19.8%) |
Health Insurance Coverage by Citizenship Status in Hope
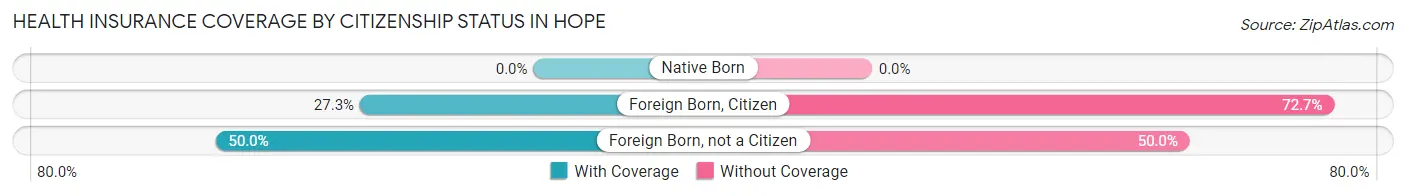
| Citizenship Status | With Coverage | Without Coverage |
| Native Born | 0 (0.0%) | 0 (0.0%) |
| Foreign Born, Citizen | 3 (27.3%) | 8 (72.7%) |
| Foreign Born, not a Citizen | 4 (50.0%) | 4 (50.0%) |
Health Insurance Coverage by Household Income in Hope
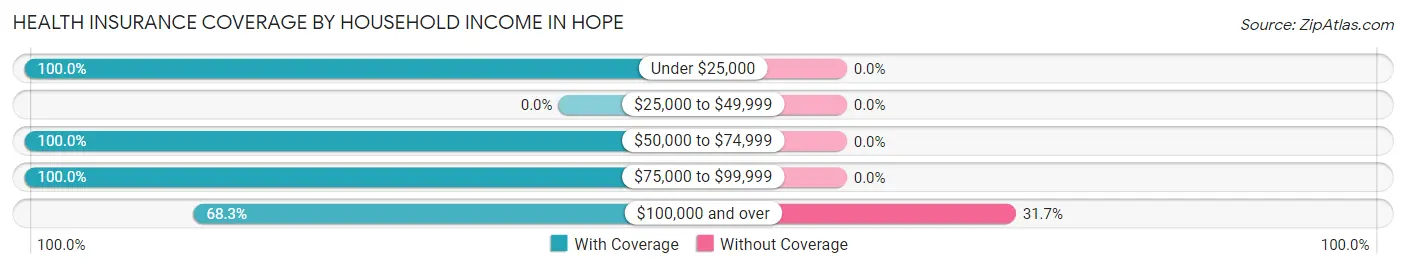
| Household Income | With Coverage | Without Coverage |
| Under $25,000 | 17 (100.0%) | 0 (0.0%) |
| $25,000 to $49,999 | 0 (0.0%) | 0 (0.0%) |
| $50,000 to $74,999 | 11 (100.0%) | 0 (0.0%) |
| $75,000 to $99,999 | 8 (100.0%) | 0 (0.0%) |
| $100,000 and over | 41 (68.3%) | 19 (31.7%) |
Public vs Private Health Insurance Coverage by Age in Hope
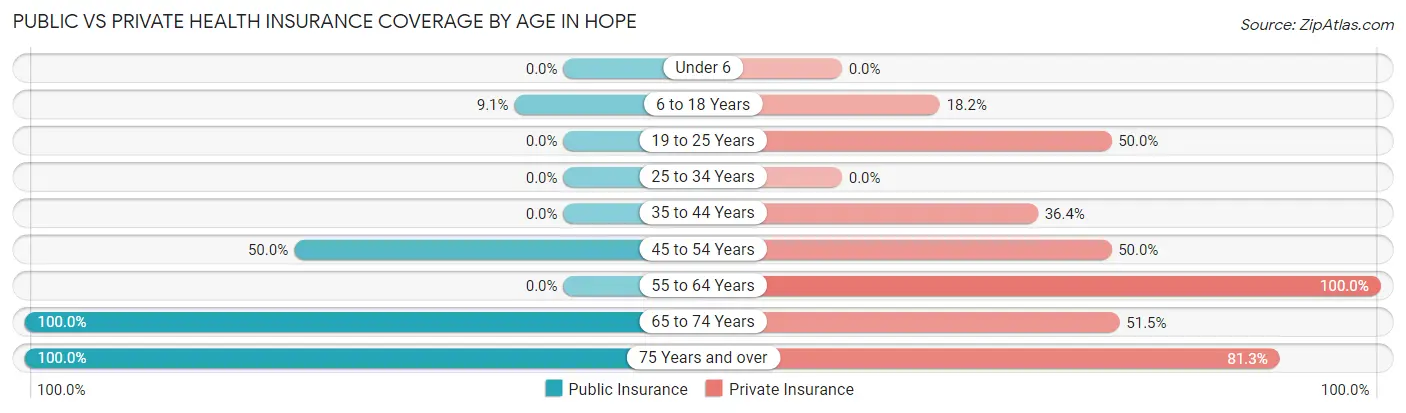
| Age Bracket | Public Insurance | Private Insurance |
| Under 6 | 0 (0.0%) | 0 (0.0%) |
| 6 to 18 Years | 1 (9.1%) | 2 (18.2%) |
| 19 to 25 Years | 0 (0.0%) | 4 (50.0%) |
| 25 to 34 Years | 0 (0.0%) | 0 (0.0%) |
| 35 to 44 Years | 0 (0.0%) | 4 (36.4%) |
| 45 to 54 Years | 2 (50.0%) | 2 (50.0%) |
| 55 to 64 Years | 0 (0.0%) | 13 (100.0%) |
| 65 to 74 Years | 33 (100.0%) | 17 (51.5%) |
| 75 Years and over | 16 (100.0%) | 13 (81.2%) |
| Total | 52 (54.2%) | 55 (57.3%) |
Disability Status by Sex by Age in Hope
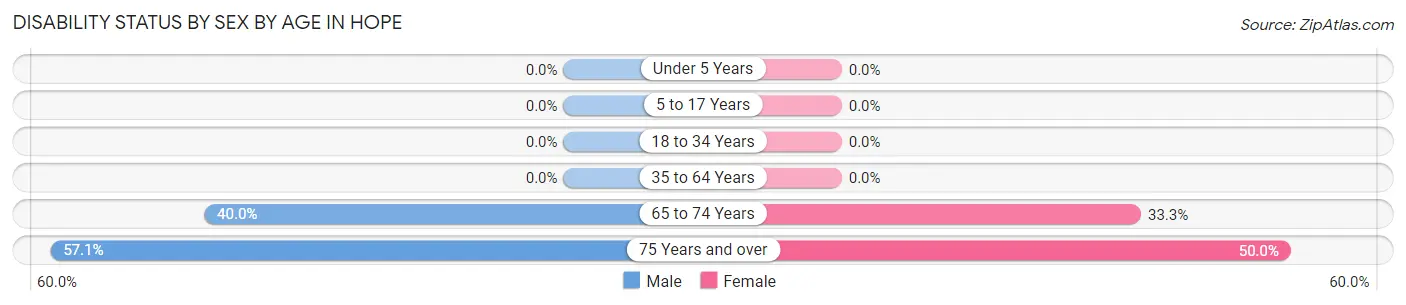
| Age Bracket | Male | Female |
| Under 5 Years | 0 (0.0%) | 0 (0.0%) |
| 5 to 17 Years | 0 (0.0%) | 0 (0.0%) |
| 18 to 34 Years | 0 (0.0%) | 0 (0.0%) |
| 35 to 64 Years | 0 (0.0%) | 0 (0.0%) |
| 65 to 74 Years | 6 (40.0%) | 6 (33.3%) |
| 75 Years and over | 8 (57.1%) | 1 (50.0%) |
Disability Class by Sex by Age in Hope
Disability Class: Hearing Difficulty
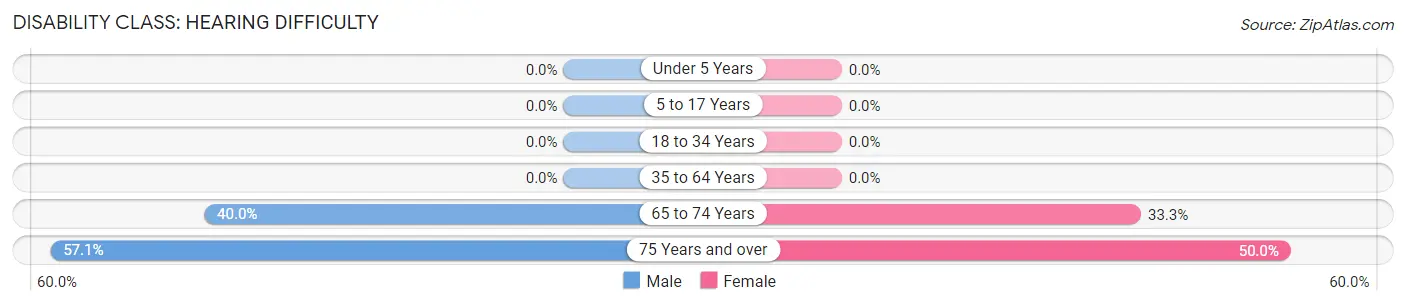
| Age Bracket | Male | Female |
| Under 5 Years | 0 (0.0%) | 0 (0.0%) |
| 5 to 17 Years | 0 (0.0%) | 0 (0.0%) |
| 18 to 34 Years | 0 (0.0%) | 0 (0.0%) |
| 35 to 64 Years | 0 (0.0%) | 0 (0.0%) |
| 65 to 74 Years | 6 (40.0%) | 6 (33.3%) |
| 75 Years and over | 8 (57.1%) | 1 (50.0%) |
Disability Class: Vision Difficulty
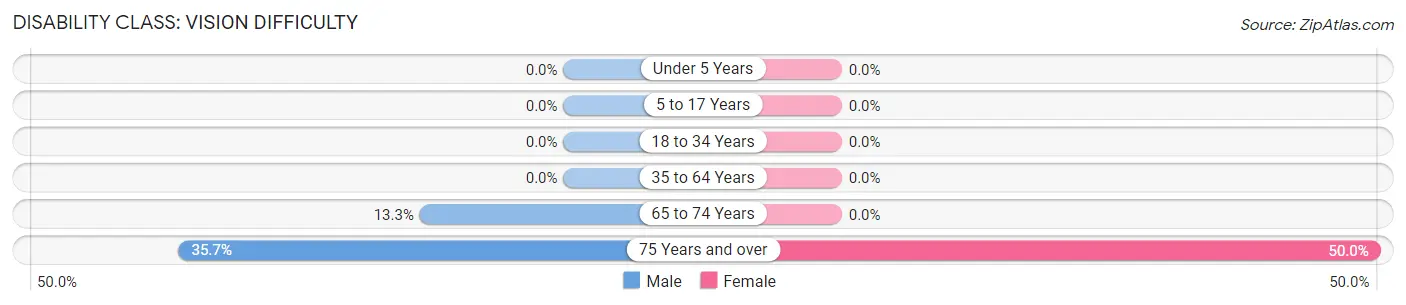
| Age Bracket | Male | Female |
| Under 5 Years | 0 (0.0%) | 0 (0.0%) |
| 5 to 17 Years | 0 (0.0%) | 0 (0.0%) |
| 18 to 34 Years | 0 (0.0%) | 0 (0.0%) |
| 35 to 64 Years | 0 (0.0%) | 0 (0.0%) |
| 65 to 74 Years | 2 (13.3%) | 0 (0.0%) |
| 75 Years and over | 5 (35.7%) | 1 (50.0%) |
Disability Class: Cognitive Difficulty
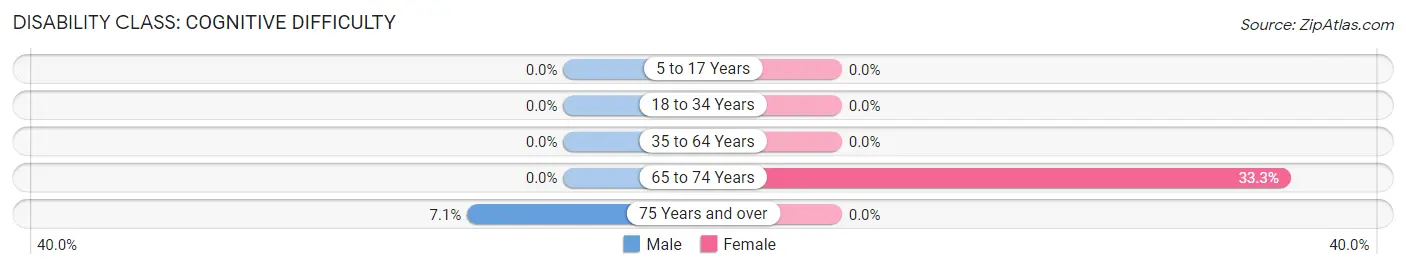
| Age Bracket | Male | Female |
| 5 to 17 Years | 0 (0.0%) | 0 (0.0%) |
| 18 to 34 Years | 0 (0.0%) | 0 (0.0%) |
| 35 to 64 Years | 0 (0.0%) | 0 (0.0%) |
| 65 to 74 Years | 0 (0.0%) | 6 (33.3%) |
| 75 Years and over | 1 (7.1%) | 0 (0.0%) |
Disability Class: Ambulatory Difficulty
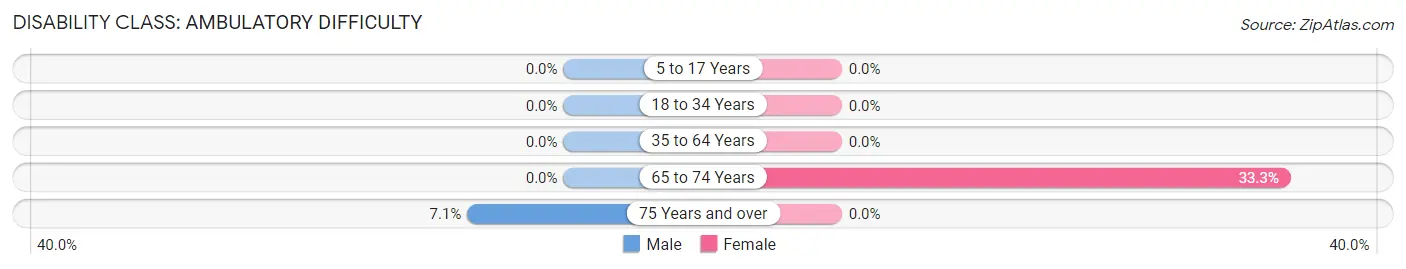
| Age Bracket | Male | Female |
| 5 to 17 Years | 0 (0.0%) | 0 (0.0%) |
| 18 to 34 Years | 0 (0.0%) | 0 (0.0%) |
| 35 to 64 Years | 0 (0.0%) | 0 (0.0%) |
| 65 to 74 Years | 0 (0.0%) | 6 (33.3%) |
| 75 Years and over | 1 (7.1%) | 0 (0.0%) |
Disability Class: Self-Care Difficulty
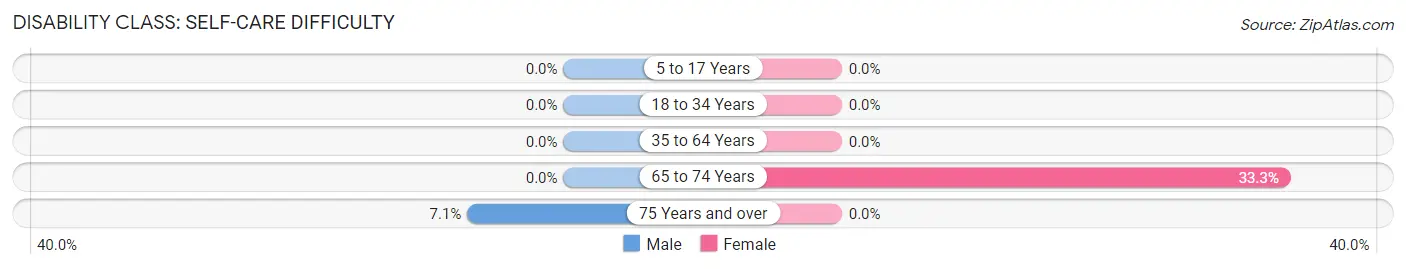
| Age Bracket | Male | Female |
| 5 to 17 Years | 0 (0.0%) | 0 (0.0%) |
| 18 to 34 Years | 0 (0.0%) | 0 (0.0%) |
| 35 to 64 Years | 0 (0.0%) | 0 (0.0%) |
| 65 to 74 Years | 0 (0.0%) | 6 (33.3%) |
| 75 Years and over | 1 (7.1%) | 0 (0.0%) |
Technology Access in Hope
Computing Device Access in Hope
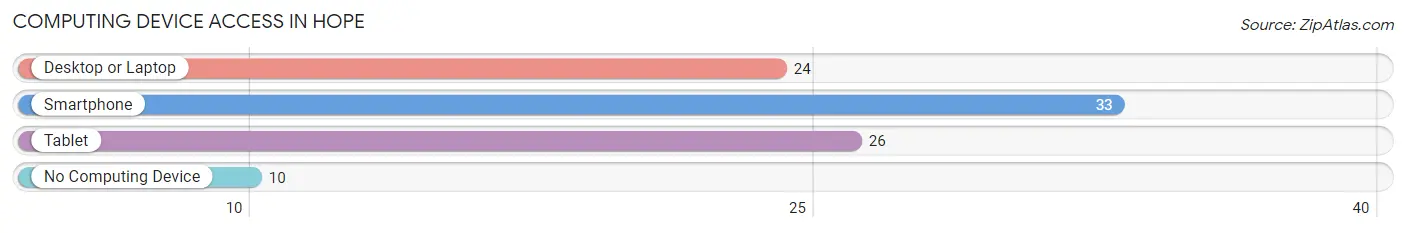
| Device Type | # Households | % Households |
| Desktop or Laptop | 24 | 49.0% |
| Smartphone | 33 | 67.3% |
| Tablet | 26 | 53.1% |
| No Computing Device | 10 | 20.4% |
| Total | 49 | 100.0% |
Internet Access in Hope
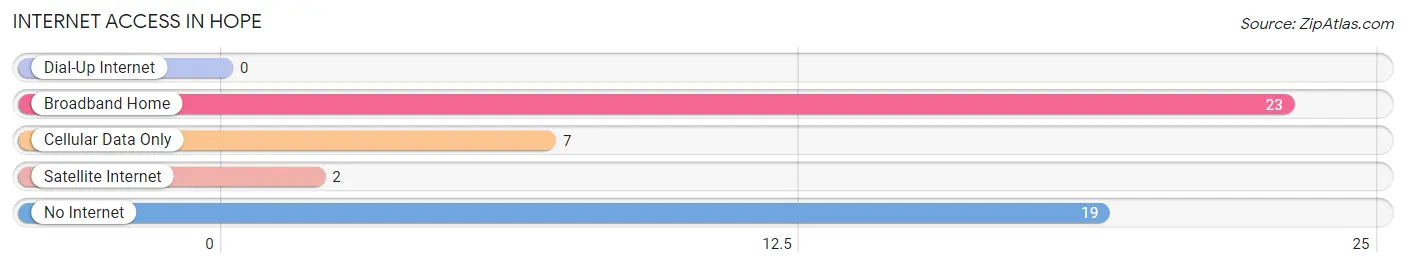
| Internet Type | # Households | % Households |
| Dial-Up Internet | 0 | 0.0% |
| Broadband Home | 23 | 46.9% |
| Cellular Data Only | 7 | 14.3% |
| Satellite Internet | 2 | 4.1% |
| No Internet | 19 | 38.8% |
| Total | 49 | 100.0% |
Hope Summary
Hope, Idaho is a small city located in the northern part of the state, in the county of Bonner. It is situated on the shores of Lake Pend Oreille, and is surrounded by the Cabinet Mountains and the Selkirk Mountains. The city has a population of 1,945 people, according to the 2010 census.
History
Hope was first settled in the late 1800s by miners and loggers who were drawn to the area by the abundance of natural resources. The city was officially incorporated in 1909, and was named after the nearby Hope Creek. The city was originally a logging and mining town, and the economy was largely based on these industries. In the early 1900s, the city was home to several sawmills, and the timber industry was a major source of employment.
In the 1950s, the city began to diversify its economy, and tourism became an important part of the local economy. The city is now home to several resorts, restaurants, and other tourist attractions.
Geography
Hope is located in the northern part of Idaho, in the county of Bonner. It is situated on the shores of Lake Pend Oreille, and is surrounded by the Cabinet Mountains and the Selkirk Mountains. The city has a total area of 1.3 square miles, all of which is land.
The climate in Hope is generally mild, with warm summers and cold winters. The average temperature in the summer is around 70 degrees Fahrenheit, and the average temperature in the winter is around 30 degrees Fahrenheit.
Economy
The economy of Hope is largely based on tourism, as the city is home to several resorts, restaurants, and other tourist attractions. The city is also home to several small businesses, including a grocery store, a hardware store, and a few restaurants.
The city is also home to several manufacturing companies, including a furniture manufacturer, a woodworking company, and a metal fabrication company. The city is also home to a few technology companies, including a software development company and a web design company.
Demographics
According to the 2010 census, the population of Hope was 1,945 people. The racial makeup of the city was 95.3% White, 0.7% Native American, 0.3% Asian, 0.2% African American, 0.1% Pacific Islander, and 2.4% from other races. The median household income was $37,917, and the median family income was $45,917.
Conclusion
Hope, Idaho is a small city located in the northern part of the state, in the county of Bonner. It is situated on the shores of Lake Pend Oreille, and is surrounded by the Cabinet Mountains and the Selkirk Mountains. The city has a population of 1,945 people, according to the 2010 census. The economy of Hope is largely based on tourism, as the city is home to several resorts, restaurants, and other tourist attractions. The city is also home to several small businesses, manufacturing companies, and technology companies. The racial makeup of the city was 95.3% White, 0.7% Native American, 0.3% Asian, 0.2% African American, 0.1% Pacific Islander, and 2.4% from other races. The median household income was $37,917, and the median family income was $45,917.
Common Questions
What is Per Capita Income in Hope?
Per Capita income in Hope is $50,848.
What is the Median Family Income in Hope?
Median Family Income in Hope is $145,909.
What is the Median Household income in Hope?
Median Household Income in Hope is $63,125.
What is Inequality or Gini Index in Hope?
Inequality or Gini Index in Hope is 0.48.
What is the Total Population of Hope?
Total Population of Hope is 96.
What is the Total Male Population of Hope?
Total Male Population of Hope is 51.
What is the Total Female Population of Hope?
Total Female Population of Hope is 45.
What is the Ratio of Males per 100 Females in Hope?
There are 113.33 Males per 100 Females in Hope.
What is the Ratio of Females per 100 Males in Hope?
There are 88.24 Females per 100 Males in Hope.
What is the Median Population Age in Hope?
Median Population Age in Hope is 65.2 Years.
What is the Average Family Size in Hope
Average Family Size in Hope is 3.0 People.
What is the Average Household Size in Hope
Average Household Size in Hope is 2.0 People.
How Large is the Labor Force in Hope?
There are 36 People in the Labor Forcein in Hope.
What is the Percentage of People in the Labor Force in Hope?
40.9% of People are in the Labor Force in Hope.
What is the Unemployment Rate in Hope?
Unemployment Rate in Hope is 19.4%.