Hartrandt, WY Map & Demographics
Hartrandt Map
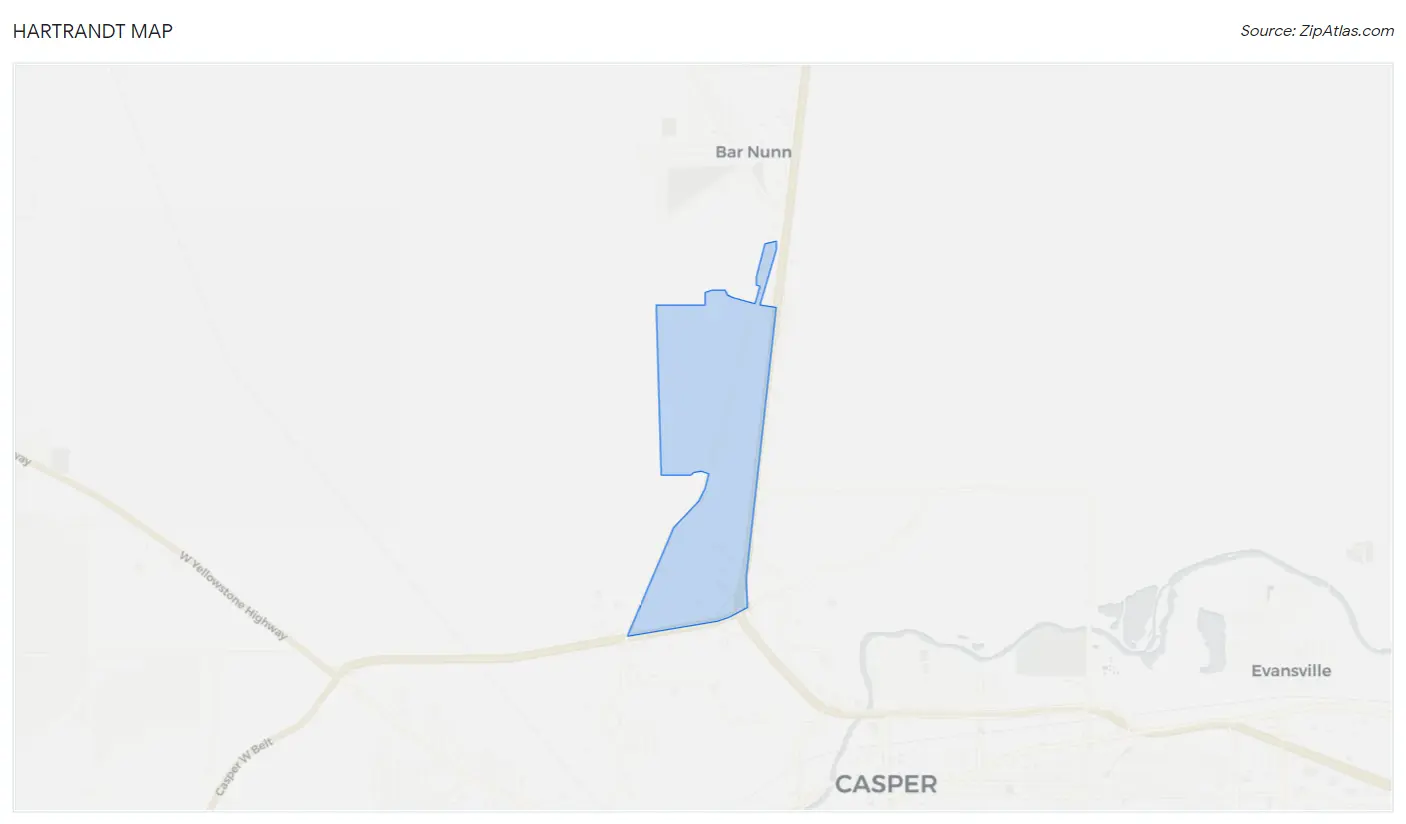
Hartrandt Overview
$42,898
PER CAPITA INCOME
$80,906
AVG FAMILY INCOME
$64,091
AVG HOUSEHOLD INCOME
77.1%
WAGE / INCOME GAP [ % ]
22.9¢/ $1
WAGE / INCOME GAP [ $ ]
0.29
INEQUALITY / GINI INDEX
903
TOTAL POPULATION
573
MALE POPULATION
330
FEMALE POPULATION
173.64
MALES / 100 FEMALES
57.59
FEMALES / 100 MALES
58.2
MEDIAN AGE
2.9
AVG FAMILY SIZE
2.5
AVG HOUSEHOLD SIZE
656
LABOR FORCE [ PEOPLE ]
75.1%
PERCENT IN LABOR FORCE
13.1%
UNEMPLOYMENT RATE
Income in Hartrandt
Income Overview in Hartrandt
Per Capita Income in Hartrandt is $42,898, while median incomes of families and households are $80,906 and $64,091 respectively.
| Characteristic | Number | Measure |
| Per Capita Income | 903 | $42,898 |
| Median Family Income | 277 | $80,906 |
| Mean Family Income | 277 | $79,700 |
| Median Household Income | 364 | $64,091 |
| Mean Household Income | 364 | $68,103 |
| Income Deficit | 277 | $0 |
| Wage / Income Gap (%) | 903 | 77.06% |
| Wage / Income Gap ($) | 903 | 22.94¢ per $1 |
| Gini / Inequality Index | 903 | 0.29 |
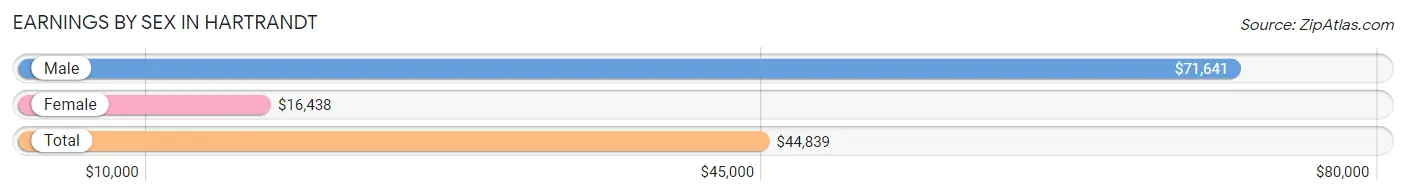
Earnings by Sex in Hartrandt
Average Earnings in Hartrandt are $44,839, $71,641 for men and $16,438 for women, a difference of 77.1%.
| Sex | Number | Average Earnings |
| Male | 487 (70.8%) | $71,641 |
| Female | 201 (29.2%) | $16,438 |
| Total | 688 (100.0%) | $44,839 |
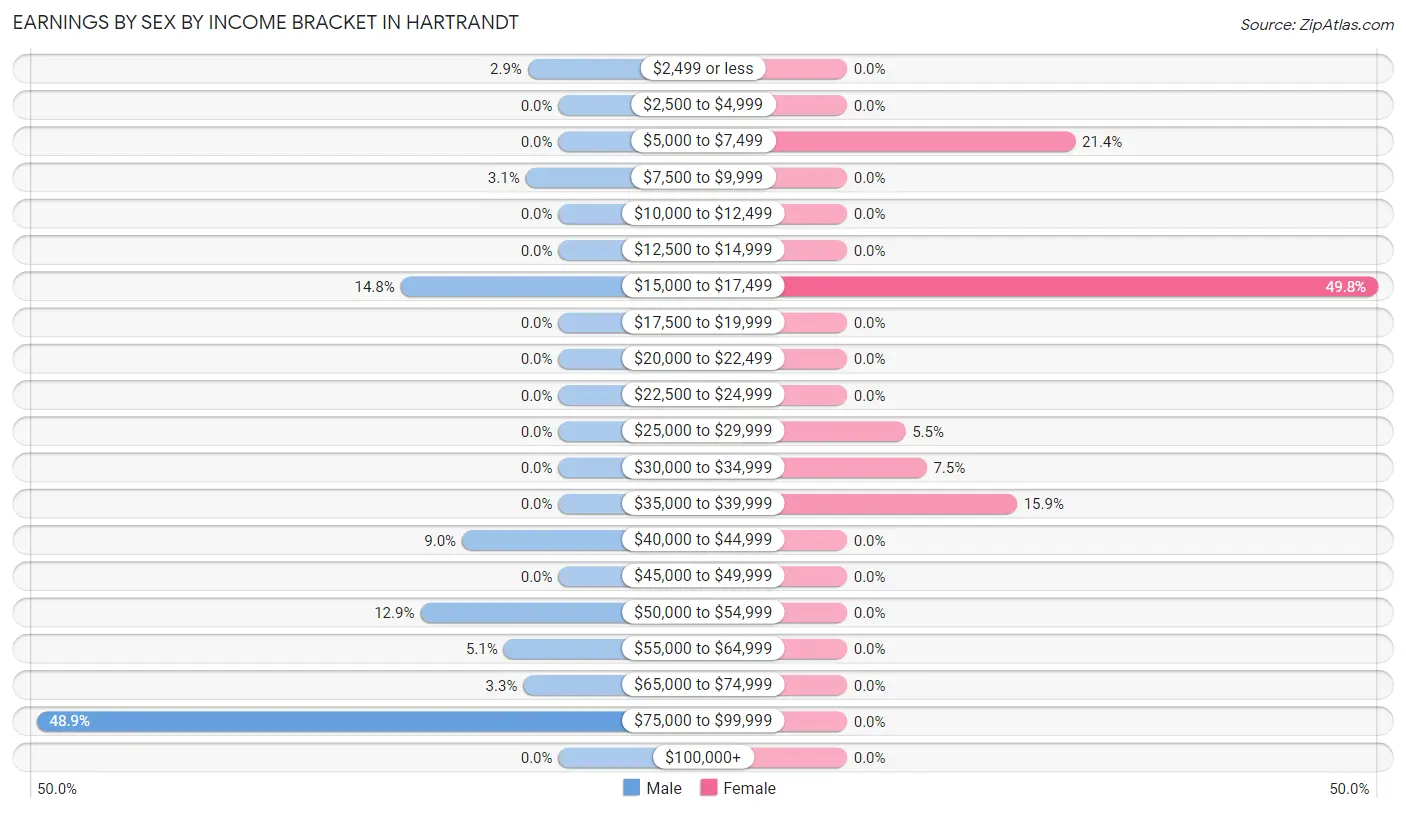
Earnings by Sex by Income Bracket in Hartrandt
The most common earnings brackets in Hartrandt are $75,000 to $99,999 for men (238 | 48.9%) and $15,000 to $17,499 for women (100 | 49.7%).
| Income | Male | Female |
| $2,499 or less | 14 (2.9%) | 0 (0.0%) |
| $2,500 to $4,999 | 0 (0.0%) | 0 (0.0%) |
| $5,000 to $7,499 | 0 (0.0%) | 43 (21.4%) |
| $7,500 to $9,999 | 15 (3.1%) | 0 (0.0%) |
| $10,000 to $12,499 | 0 (0.0%) | 0 (0.0%) |
| $12,500 to $14,999 | 0 (0.0%) | 0 (0.0%) |
| $15,000 to $17,499 | 72 (14.8%) | 100 (49.7%) |
| $17,500 to $19,999 | 0 (0.0%) | 0 (0.0%) |
| $20,000 to $22,499 | 0 (0.0%) | 0 (0.0%) |
| $22,500 to $24,999 | 0 (0.0%) | 0 (0.0%) |
| $25,000 to $29,999 | 0 (0.0%) | 11 (5.5%) |
| $30,000 to $34,999 | 0 (0.0%) | 15 (7.5%) |
| $35,000 to $39,999 | 0 (0.0%) | 32 (15.9%) |
| $40,000 to $44,999 | 44 (9.0%) | 0 (0.0%) |
| $45,000 to $49,999 | 0 (0.0%) | 0 (0.0%) |
| $50,000 to $54,999 | 63 (12.9%) | 0 (0.0%) |
| $55,000 to $64,999 | 25 (5.1%) | 0 (0.0%) |
| $65,000 to $74,999 | 16 (3.3%) | 0 (0.0%) |
| $75,000 to $99,999 | 238 (48.9%) | 0 (0.0%) |
| $100,000+ | 0 (0.0%) | 0 (0.0%) |
| Total | 487 (100.0%) | 201 (100.0%) |
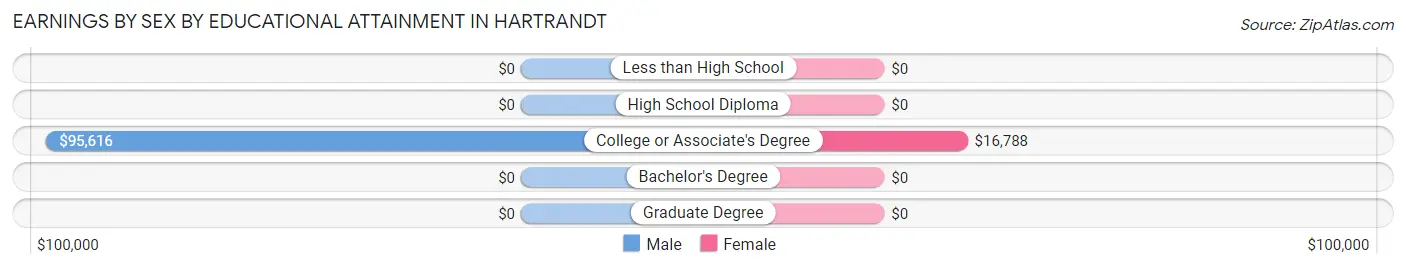
Earnings by Sex by Educational Attainment in Hartrandt
Average earnings in Hartrandt are $71,641 for men and $16,438 for women, a difference of 77.1%. Men with an educational attainment of college or associate's degree enjoy the highest average annual earnings of $95,616, while those with college or associate's degree education earn the least with $95,616. Women with an educational attainment of college or associate's degree earn the most with the average annual earnings of $16,788, while those with college or associate's degree education have the smallest earnings of $16,788.
| Educational Attainment | Male Income | Female Income |
| Less than High School | - | - |
| High School Diploma | - | - |
| College or Associate's Degree | $95,616 | $16,788 |
| Bachelor's Degree | - | - |
| Graduate Degree | - | - |
| Total | $71,641 | $16,438 |
Family Income in Hartrandt
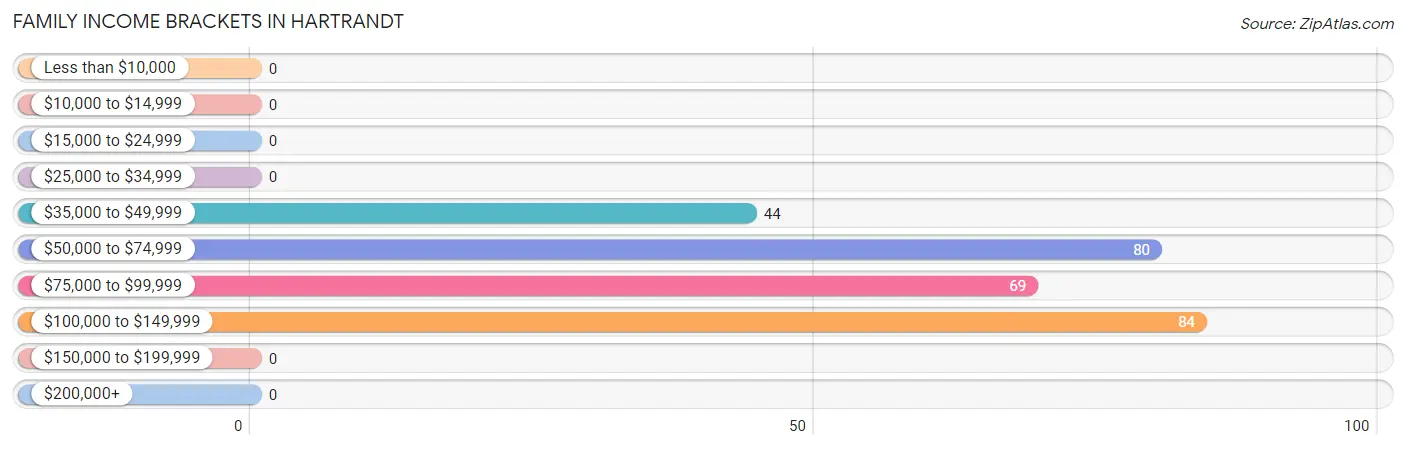
Family Income Brackets in Hartrandt
According to the Hartrandt family income data, there are 84 families falling into the $100,000 to $149,999 income range, which is the most common income bracket and makes up 30.3% of all families.
| Income Bracket | # Families | % Families |
| Less than $10,000 | 0 | 0.0% |
| $10,000 to $14,999 | 0 | 0.0% |
| $15,000 to $24,999 | 0 | 0.0% |
| $25,000 to $34,999 | 0 | 0.0% |
| $35,000 to $49,999 | 44 | 15.9% |
| $50,000 to $74,999 | 80 | 28.9% |
| $75,000 to $99,999 | 69 | 24.9% |
| $100,000 to $149,999 | 84 | 30.3% |
| $150,000 to $199,999 | 0 | 0.0% |
| $200,000+ | 0 | 0.0% |
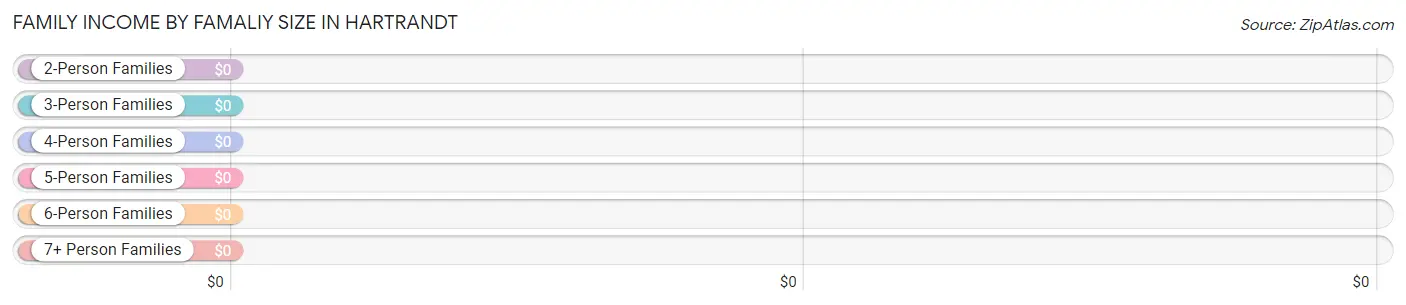
Family Income by Famaliy Size in Hartrandt
| Income Bracket | # Families | Median Income |
| 2-Person Families | 237 (85.6%) | $0 |
| 3-Person Families | 0 (0.0%) | $0 |
| 4-Person Families | 32 (11.6%) | $0 |
| 5-Person Families | 8 (2.9%) | $0 |
| 6-Person Families | 0 (0.0%) | $0 |
| 7+ Person Families | 0 (0.0%) | $0 |
| Total | 277 (100.0%) | $80,906 |
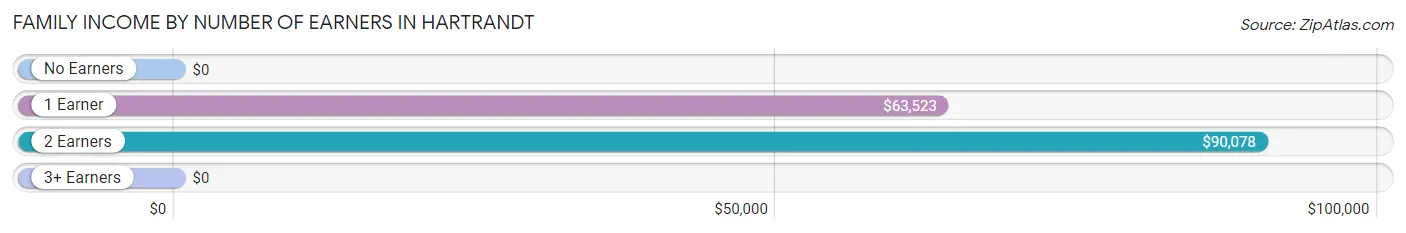
Family Income by Number of Earners in Hartrandt
| Number of Earners | # Families | Median Income |
| No Earners | 0 (0.0%) | $0 |
| 1 Earner | 78 (28.2%) | $63,523 |
| 2 Earners | 199 (71.8%) | $90,078 |
| 3+ Earners | 0 (0.0%) | $0 |
| Total | 277 (100.0%) | $80,906 |
Household Income in Hartrandt
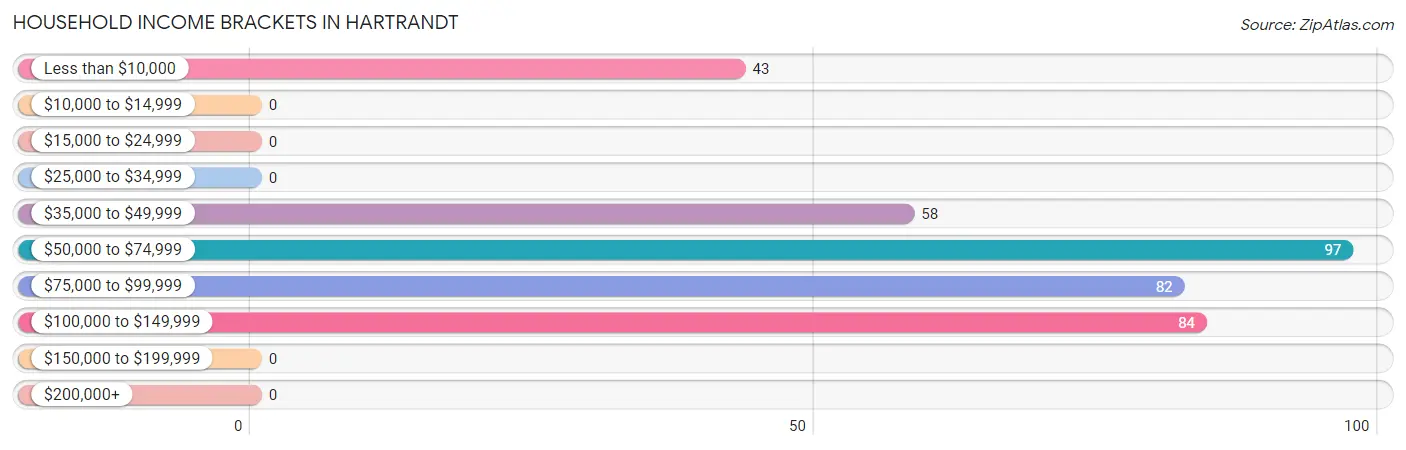
Household Income Brackets in Hartrandt
With 97 households falling in the category, the $50,000 to $74,999 income range is the most frequent in Hartrandt, accounting for 26.7% of all households.
| Income Bracket | # Households | % Households |
| Less than $10,000 | 43 | 11.8% |
| $10,000 to $14,999 | 0 | 0.0% |
| $15,000 to $24,999 | 0 | 0.0% |
| $25,000 to $34,999 | 0 | 0.0% |
| $35,000 to $49,999 | 58 | 15.9% |
| $50,000 to $74,999 | 97 | 26.6% |
| $75,000 to $99,999 | 82 | 22.5% |
| $100,000 to $149,999 | 84 | 23.1% |
| $150,000 to $199,999 | 0 | 0.0% |
| $200,000+ | 0 | 0.0% |
Household Income by Householder Age in Hartrandt
The median household income in Hartrandt is $64,091, with the highest median household income of $90,078 found in the 45 to 64 years age bracket for the primary householder. A total of 225 households (61.8%) fall into this category.
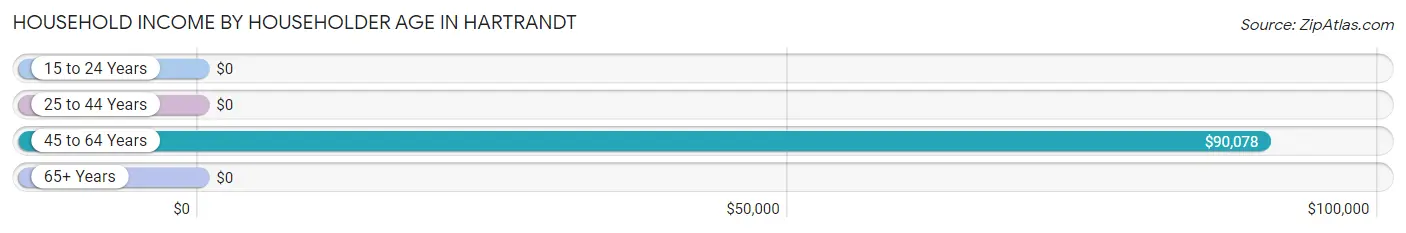
| Income Bracket | # Households | Median Income |
| 15 to 24 Years | 0 (0.0%) | $0 |
| 25 to 44 Years | 25 (6.9%) | $0 |
| 45 to 64 Years | 225 (61.8%) | $90,078 |
| 65+ Years | 114 (31.3%) | $0 |
| Total | 364 (100.0%) | $64,091 |
Poverty in Hartrandt
Income Below Poverty by Sex and Age in Hartrandt
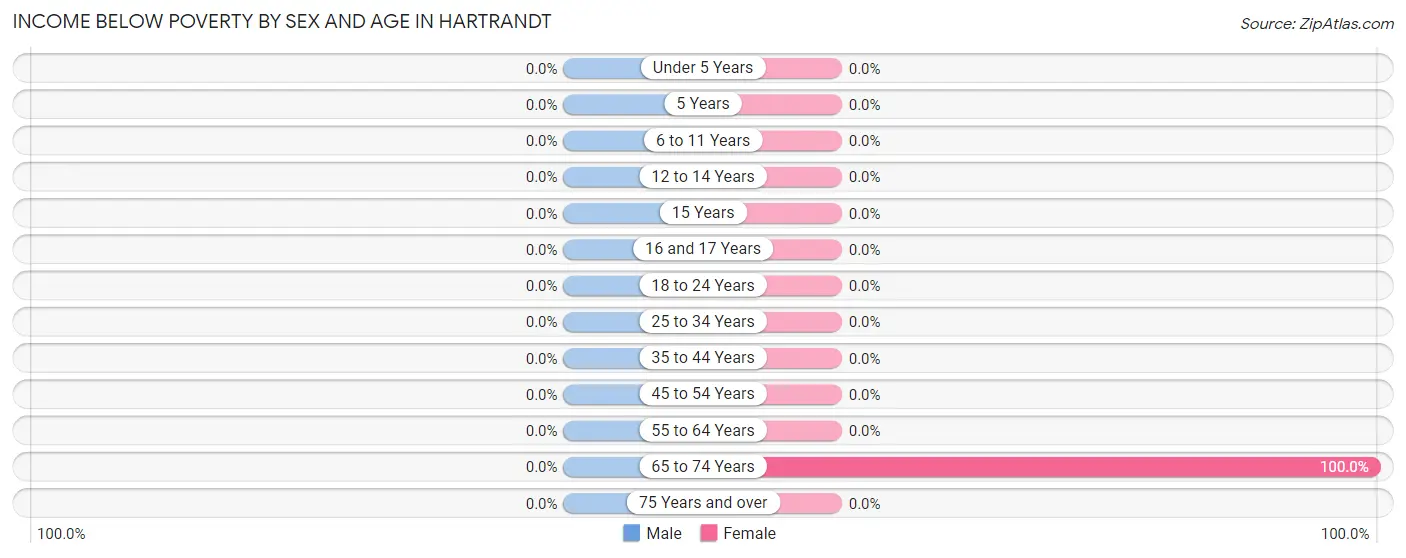
| Age Bracket | Male | Female |
| Under 5 Years | 0 (0.0%) | 0 (0.0%) |
| 5 Years | 0 (0.0%) | 0 (0.0%) |
| 6 to 11 Years | 0 (0.0%) | 0 (0.0%) |
| 12 to 14 Years | 0 (0.0%) | 0 (0.0%) |
| 15 Years | 0 (0.0%) | 0 (0.0%) |
| 16 and 17 Years | 0 (0.0%) | 0 (0.0%) |
| 18 to 24 Years | 0 (0.0%) | 0 (0.0%) |
| 25 to 34 Years | 0 (0.0%) | 0 (0.0%) |
| 35 to 44 Years | 0 (0.0%) | 0 (0.0%) |
| 45 to 54 Years | 0 (0.0%) | 0 (0.0%) |
| 55 to 64 Years | 0 (0.0%) | 0 (0.0%) |
| 65 to 74 Years | 0 (0.0%) | 43 (100.0%) |
| 75 Years and over | 0 (0.0%) | 0 (0.0%) |
| Total | 0 (0.0%) | 43 (13.0%) |
Income Above Poverty by Sex and Age in Hartrandt
According to the poverty statistics in Hartrandt, males aged 6 to 11 years and females aged 6 to 11 years are the age groups that are most secure financially, with 100.0% of males and 100.0% of females in these age groups living above the poverty line.
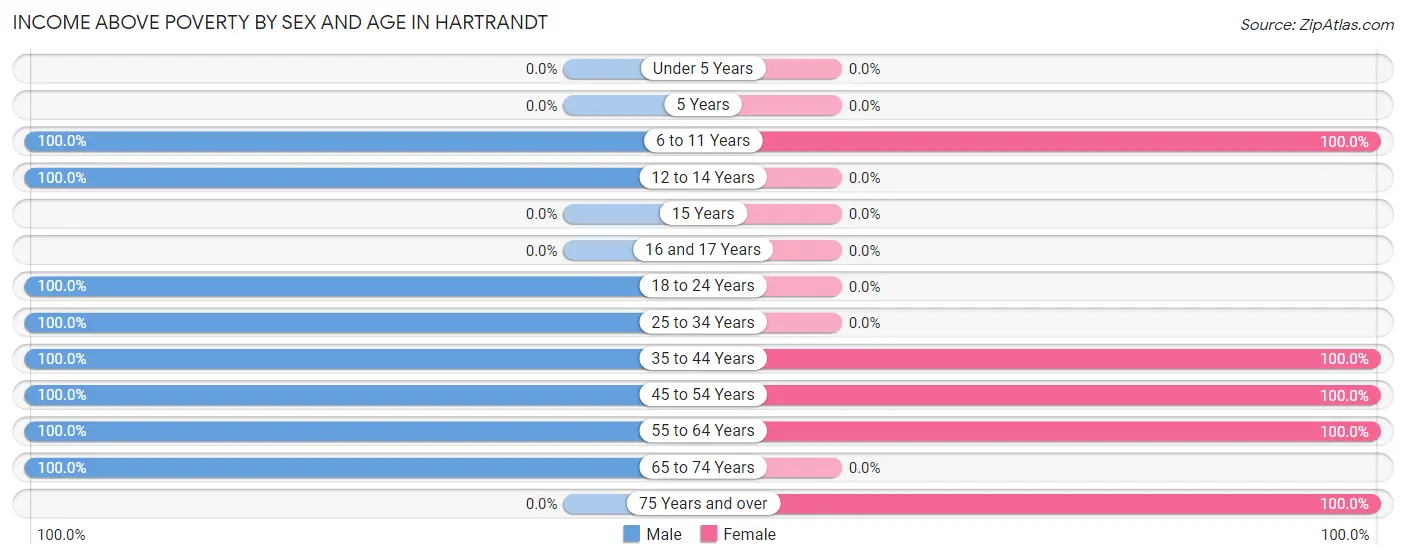
| Age Bracket | Male | Female |
| Under 5 Years | 0 (0.0%) | 0 (0.0%) |
| 5 Years | 0 (0.0%) | 0 (0.0%) |
| 6 to 11 Years | 11 (100.0%) | 8 (100.0%) |
| 12 to 14 Years | 11 (100.0%) | 0 (0.0%) |
| 15 Years | 0 (0.0%) | 0 (0.0%) |
| 16 and 17 Years | 0 (0.0%) | 0 (0.0%) |
| 18 to 24 Years | 32 (100.0%) | 0 (0.0%) |
| 25 to 34 Years | 28 (100.0%) | 0 (0.0%) |
| 35 to 44 Years | 75 (100.0%) | 11 (100.0%) |
| 45 to 54 Years | 13 (100.0%) | 43 (100.0%) |
| 55 to 64 Years | 201 (100.0%) | 212 (100.0%) |
| 65 to 74 Years | 202 (100.0%) | 0 (0.0%) |
| 75 Years and over | 0 (0.0%) | 13 (100.0%) |
| Total | 573 (100.0%) | 287 (87.0%) |
Income Below Poverty Among Married-Couple Families in Hartrandt
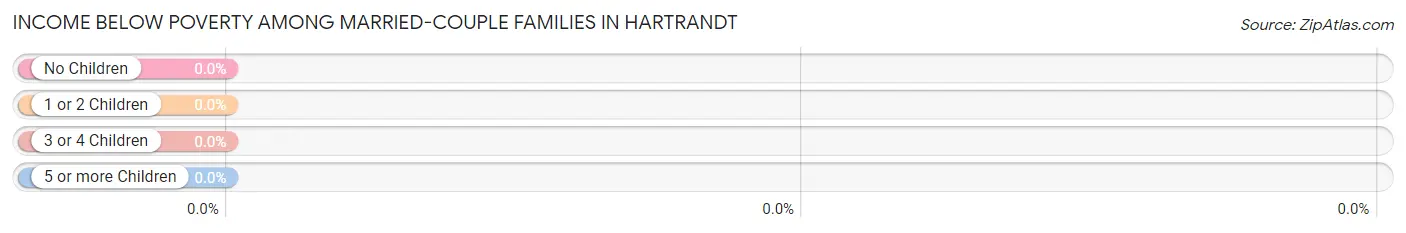
| Children | Above Poverty | Below Poverty |
| No Children | 191 (100.0%) | 0 (0.0%) |
| 1 or 2 Children | 0 (0.0%) | 0 (0.0%) |
| 3 or 4 Children | 8 (100.0%) | 0 (0.0%) |
| 5 or more Children | 0 (0.0%) | 0 (0.0%) |
| Total | 199 (100.0%) | 0 (0.0%) |
Income Below Poverty Among Single-Parent Households in Hartrandt
| Children | Single Father | Single Mother |
| No Children | 0 (0.0%) | 0 (0.0%) |
| 1 or 2 Children | 0 (0.0%) | 0 (0.0%) |
| 3 or 4 Children | 0 (0.0%) | 0 (0.0%) |
| 5 or more Children | 0 (0.0%) | 0 (0.0%) |
| Total | 0 (0.0%) | 0 (0.0%) |
Income Below Poverty Among Married-Couple vs Single-Parent Households in Hartrandt
| Children | Married-Couple Families | Single-Parent Households |
| No Children | 0 (0.0%) | 0 (0.0%) |
| 1 or 2 Children | 0 (0.0%) | 0 (0.0%) |
| 3 or 4 Children | 0 (0.0%) | 0 (0.0%) |
| 5 or more Children | 0 (0.0%) | 0 (0.0%) |
| Total | 0 (0.0%) | 0 (0.0%) |
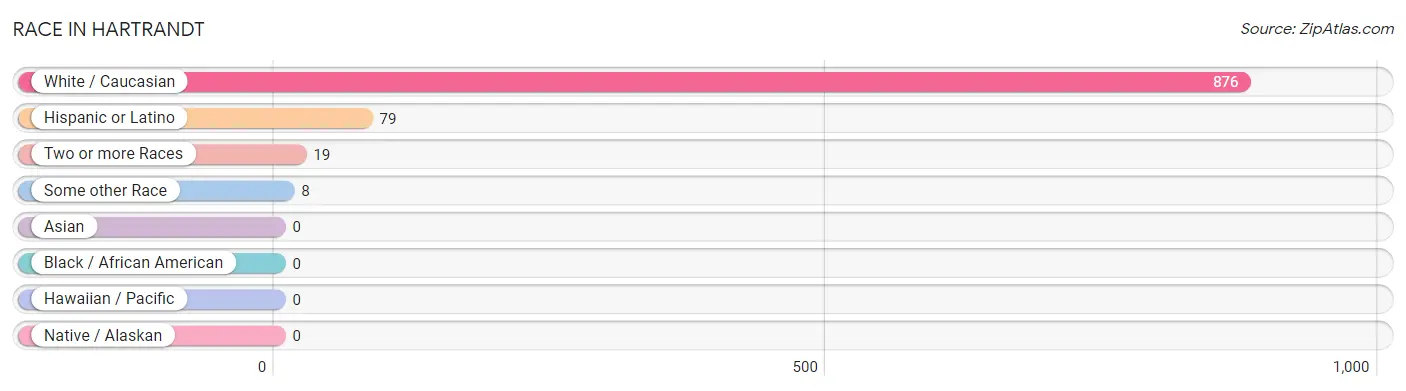
Race in Hartrandt
The most populous races in Hartrandt are White / Caucasian (876 | 97.0%), Hispanic or Latino (79 | 8.7%), and Two or more Races (19 | 2.1%).
| Race | # Population | % Population |
| Asian | 0 | 0.0% |
| Black / African American | 0 | 0.0% |
| Hawaiian / Pacific | 0 | 0.0% |
| Hispanic or Latino | 79 | 8.7% |
| Native / Alaskan | 0 | 0.0% |
| White / Caucasian | 876 | 97.0% |
| Two or more Races | 19 | 2.1% |
| Some other Race | 8 | 0.9% |
| Total | 903 | 100.0% |
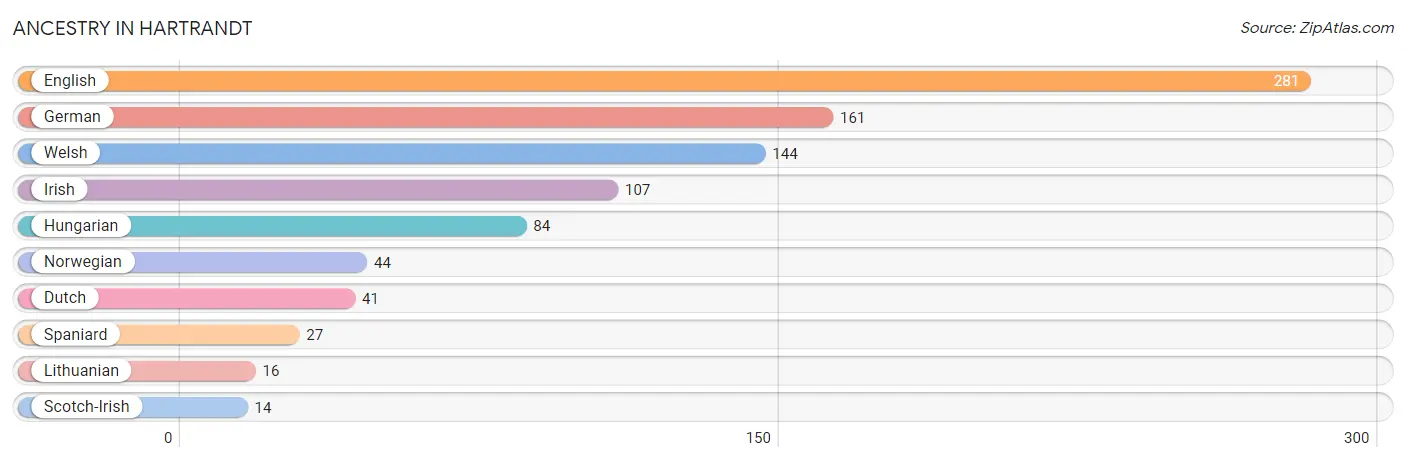
Ancestry in Hartrandt
The most populous ancestries reported in Hartrandt are English (281 | 31.1%), German (161 | 17.8%), Welsh (144 | 16.0%), Irish (107 | 11.8%), and Hungarian (84 | 9.3%), together accounting for 86.0% of all Hartrandt residents.
| Ancestry | # Population | % Population |
| Dutch | 41 | 4.5% |
| English | 281 | 31.1% |
| German | 161 | 17.8% |
| Hungarian | 84 | 9.3% |
| Irish | 107 | 11.8% |
| Lithuanian | 16 | 1.8% |
| Norwegian | 44 | 4.9% |
| Scotch-Irish | 14 | 1.5% |
| Spaniard | 27 | 3.0% |
| Welsh | 144 | 16.0% | View All 10 Rows |
Immigrants in Hartrandt

| Immigration Origin | # Population | % Population | View All 0 Rows |
Sex and Age in Hartrandt
Sex and Age in Hartrandt
The most populous age groups in Hartrandt are 55 to 59 Years (170 | 29.7%) for men and 55 to 59 Years (197 | 59.7%) for women.
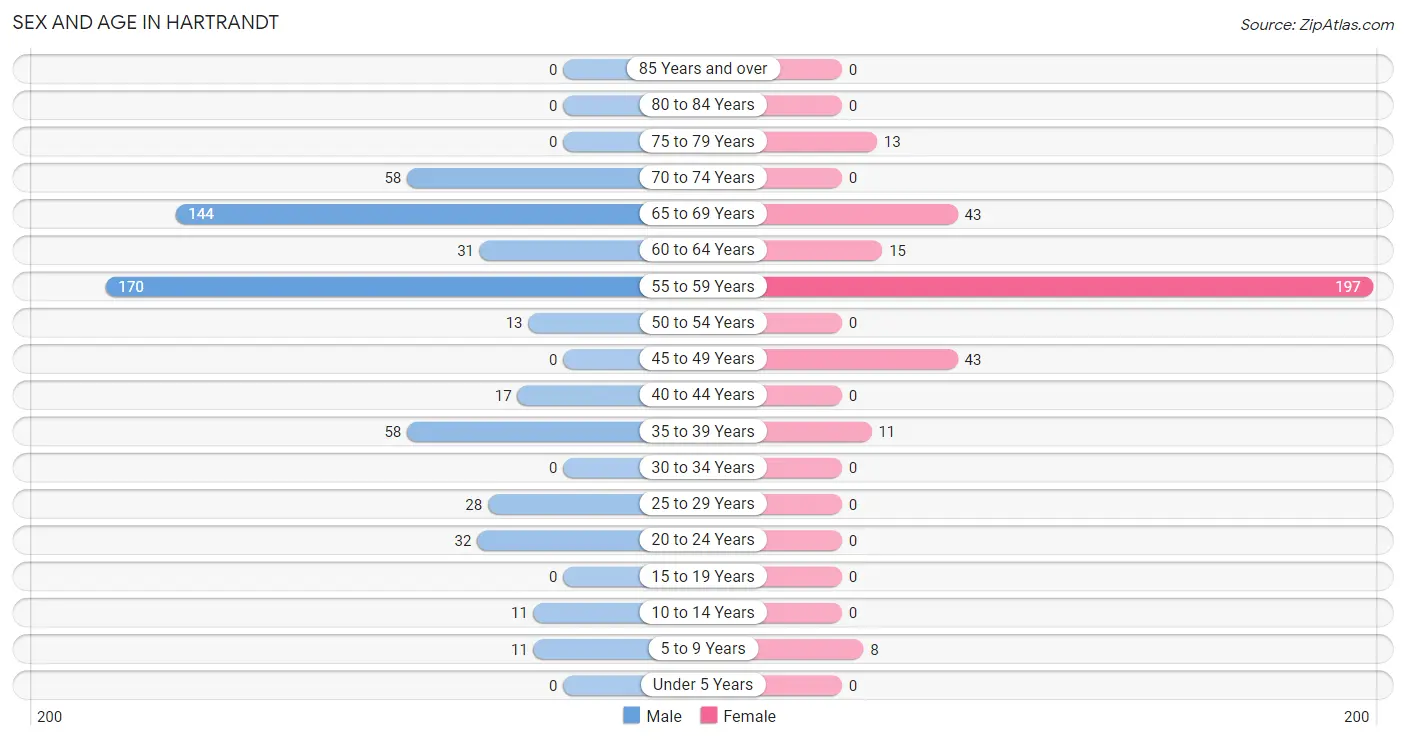
| Age Bracket | Male | Female |
| Under 5 Years | 0 (0.0%) | 0 (0.0%) |
| 5 to 9 Years | 11 (1.9%) | 8 (2.4%) |
| 10 to 14 Years | 11 (1.9%) | 0 (0.0%) |
| 15 to 19 Years | 0 (0.0%) | 0 (0.0%) |
| 20 to 24 Years | 32 (5.6%) | 0 (0.0%) |
| 25 to 29 Years | 28 (4.9%) | 0 (0.0%) |
| 30 to 34 Years | 0 (0.0%) | 0 (0.0%) |
| 35 to 39 Years | 58 (10.1%) | 11 (3.3%) |
| 40 to 44 Years | 17 (3.0%) | 0 (0.0%) |
| 45 to 49 Years | 0 (0.0%) | 43 (13.0%) |
| 50 to 54 Years | 13 (2.3%) | 0 (0.0%) |
| 55 to 59 Years | 170 (29.7%) | 197 (59.7%) |
| 60 to 64 Years | 31 (5.4%) | 15 (4.5%) |
| 65 to 69 Years | 144 (25.1%) | 43 (13.0%) |
| 70 to 74 Years | 58 (10.1%) | 0 (0.0%) |
| 75 to 79 Years | 0 (0.0%) | 13 (3.9%) |
| 80 to 84 Years | 0 (0.0%) | 0 (0.0%) |
| 85 Years and over | 0 (0.0%) | 0 (0.0%) |
| Total | 573 (100.0%) | 330 (100.0%) |
Families and Households in Hartrandt
Median Family Size in Hartrandt
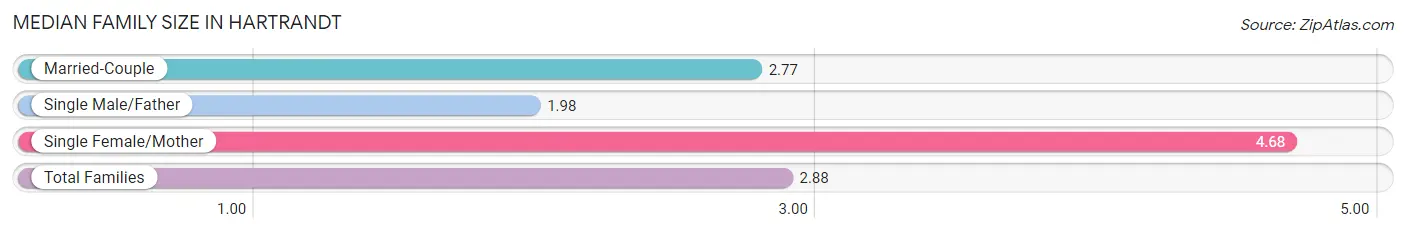
The median family size in Hartrandt is 2.88 persons per family, with single female/mother families (34 | 12.3%) accounting for the largest median family size of 4.68 persons per family. On the other hand, single male/father families (44 | 15.9%) represent the smallest median family size with 1.98 persons per family.
| Family Type | # Families | Family Size |
| Married-Couple | 199 (71.8%) | 2.77 |
| Single Male/Father | 44 (15.9%) | 1.98 |
| Single Female/Mother | 34 (12.3%) | 4.68 |
| Total Families | 277 (100.0%) | 2.88 |
Median Household Size in Hartrandt
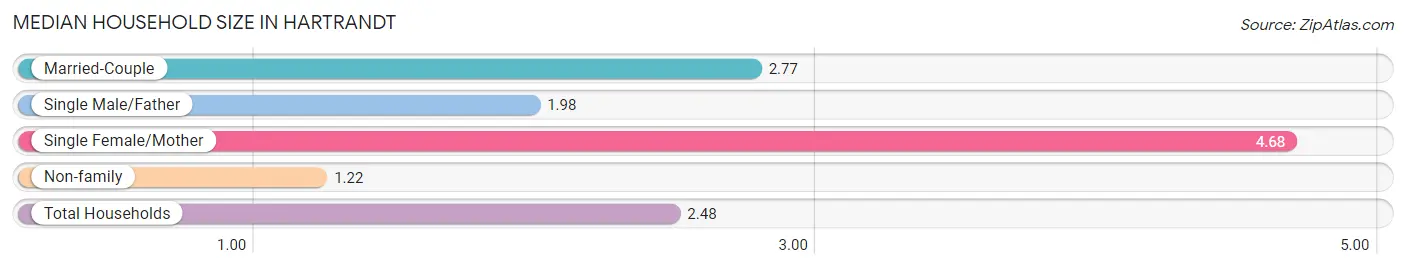
The median household size in Hartrandt is 2.48 persons per household, with single female/mother households (34 | 9.3%) accounting for the largest median household size of 4.68 persons per household. non-family households (87 | 23.9%) represent the smallest median household size with 1.22 persons per household.
| Household Type | # Households | Household Size |
| Married-Couple | 199 (54.7%) | 2.77 |
| Single Male/Father | 44 (12.1%) | 1.98 |
| Single Female/Mother | 34 (9.3%) | 4.68 |
| Non-family | 87 (23.9%) | 1.22 |
| Total Households | 364 (100.0%) | 2.48 |
Household Size by Marriage Status in Hartrandt
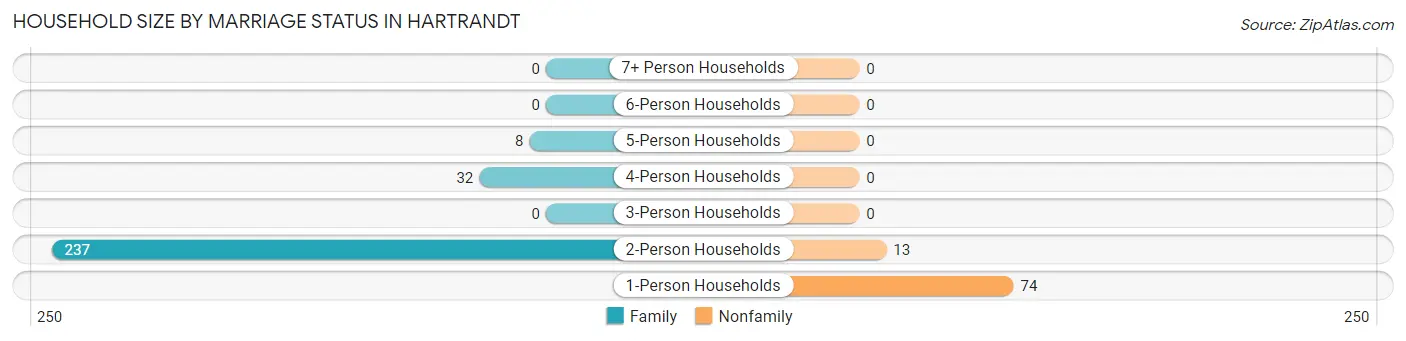
Out of a total of 364 households in Hartrandt, 277 (76.1%) are family households, while 87 (23.9%) are nonfamily households. The most numerous type of family households are 2-person households, comprising 237, and the most common type of nonfamily households are 1-person households, comprising 74.
| Household Size | Family Households | Nonfamily Households |
| 1-Person Households | - | 74 (20.3%) |
| 2-Person Households | 237 (65.1%) | 13 (3.6%) |
| 3-Person Households | 0 (0.0%) | 0 (0.0%) |
| 4-Person Households | 32 (8.8%) | 0 (0.0%) |
| 5-Person Households | 8 (2.2%) | 0 (0.0%) |
| 6-Person Households | 0 (0.0%) | 0 (0.0%) |
| 7+ Person Households | 0 (0.0%) | 0 (0.0%) |
| Total | 277 (76.1%) | 87 (23.9%) |
Female Fertility in Hartrandt
Fertility by Age in Hartrandt
| Age Bracket | Women with Births | Births / 1,000 Women |
| 15 to 19 years | 0 (0.0%) | 0.0 |
| 20 to 34 years | 0 (0.0%) | 0.0 |
| 35 to 50 years | 0 (0.0%) | 0.0 |
| Total | 0 (0.0%) | 0.0 |
Fertility by Age by Marriage Status in Hartrandt
| Age Bracket | Married | Unmarried |
| 15 to 19 years | 0 (0.0%) | 0 (0.0%) |
| 20 to 34 years | 0 (0.0%) | 0 (0.0%) |
| 35 to 50 years | 0 (0.0%) | 0 (0.0%) |
| Total | 0 (0.0%) | 0 (0.0%) |
Fertility by Education in Hartrandt
| Educational Attainment | Women with Births | Births / 1,000 Women |
| Less than High School | 0 (0.0%) | 0.0 |
| High School Diploma | 0 (0.0%) | 0.0 |
| College or Associate's Degree | 0 (0.0%) | 0.0 |
| Bachelor's Degree | 0 (0.0%) | 0.0 |
| Graduate Degree | 0 (0.0%) | 0.0 |
| Total | 0 (0.0%) | 0.0 |
Fertility by Education by Marriage Status in Hartrandt
| Educational Attainment | Married | Unmarried |
| Less than High School | 0 (0.0%) | 0 (0.0%) |
| High School Diploma | 0 (0.0%) | 0 (0.0%) |
| College or Associate's Degree | 0 (0.0%) | 0 (0.0%) |
| Bachelor's Degree | 0 (0.0%) | 0 (0.0%) |
| Graduate Degree | 0 (0.0%) | 0 (0.0%) |
| Total | 0 (0.0%) | 0 (0.0%) |
Employment Characteristics in Hartrandt
Employment by Class of Employer in Hartrandt
Among the 570 employed individuals in Hartrandt, private company employees (439 | 77.0%), self-employed (not incorporated) (98 | 17.2%), and local government employees (17 | 3.0%) make up the most common classes of employment.
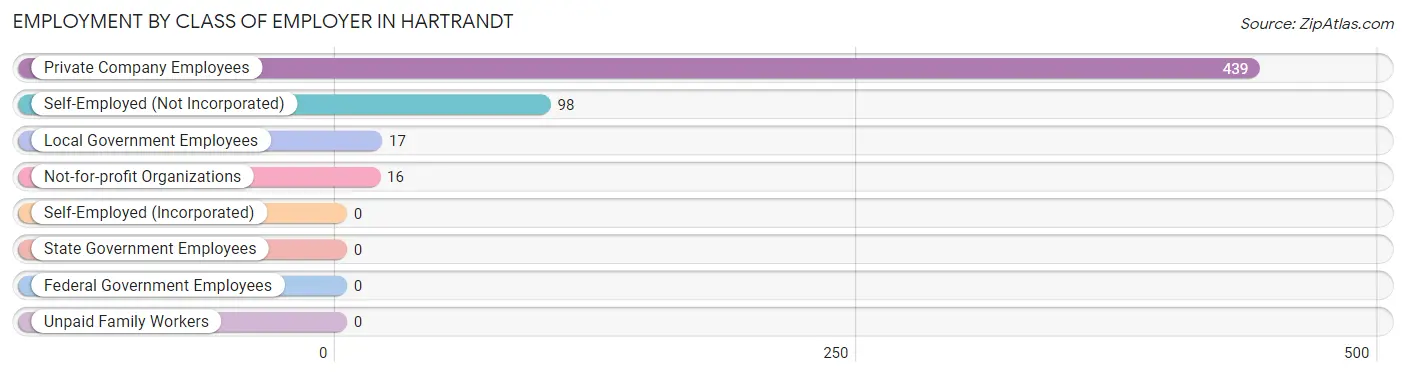
| Employer Class | # Employees | % Employees |
| Private Company Employees | 439 | 77.0% |
| Self-Employed (Incorporated) | 0 | 0.0% |
| Self-Employed (Not Incorporated) | 98 | 17.2% |
| Not-for-profit Organizations | 16 | 2.8% |
| Local Government Employees | 17 | 3.0% |
| State Government Employees | 0 | 0.0% |
| Federal Government Employees | 0 | 0.0% |
| Unpaid Family Workers | 0 | 0.0% |
| Total | 570 | 100.0% |
Employment Status by Age in Hartrandt
According to the labor force statistics for Hartrandt, out of the total population over 16 years of age (873), 75.1% or 656 individuals are in the labor force, with 13.1% or 86 of them unemployed. The age group with the highest labor force participation rate is 25 to 29 years, with 100.0% or 28 individuals in the labor force. Within the labor force, the 25 to 29 years age range has the highest percentage of unemployed individuals, with 100.0% or 28 of them being unemployed.
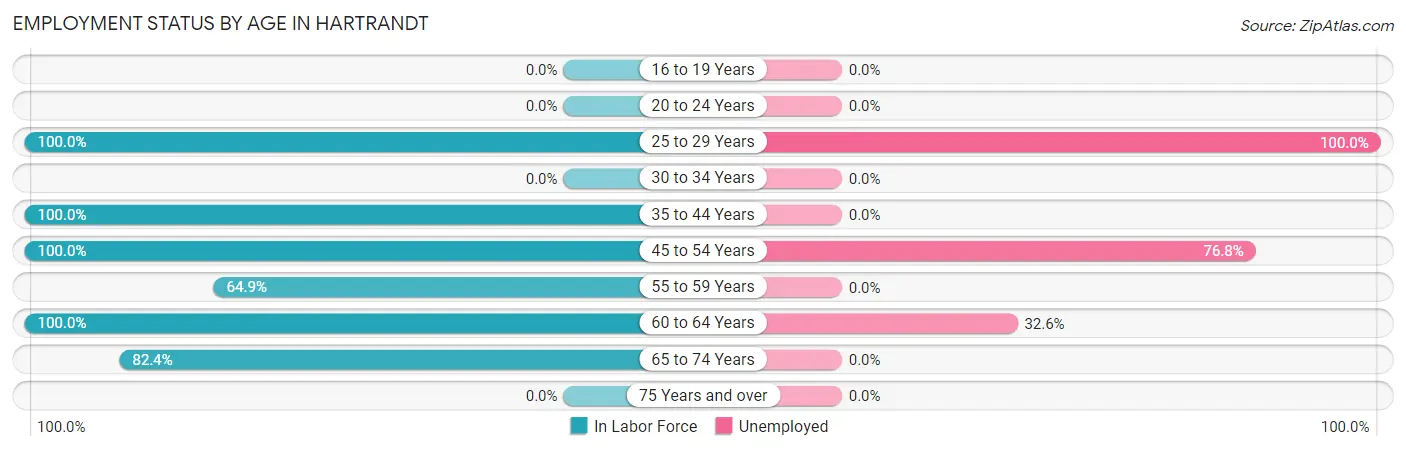
| Age Bracket | In Labor Force | Unemployed |
| 16 to 19 Years | 0 (0.0%) | 0 (0.0%) |
| 20 to 24 Years | 0 (0.0%) | 0 (0.0%) |
| 25 to 29 Years | 28 (100.0%) | 28 (100.0%) |
| 30 to 34 Years | 0 (0.0%) | 0 (0.0%) |
| 35 to 44 Years | 86 (100.0%) | 0 (0.0%) |
| 45 to 54 Years | 56 (100.0%) | 43 (76.8%) |
| 55 to 59 Years | 238 (64.9%) | 0 (0.0%) |
| 60 to 64 Years | 46 (100.0%) | 15 (32.6%) |
| 65 to 74 Years | 202 (82.4%) | 0 (0.0%) |
| 75 Years and over | 0 (0.0%) | 0 (0.0%) |
| Total | 656 (75.1%) | 86 (13.1%) |
Employment Status by Educational Attainment in Hartrandt
According to labor force statistics for Hartrandt, 77.9% of individuals (454) out of the total population between 25 and 64 years of age (583) are in the labor force, with 18.9% or 86 of them being unemployed. The group with the highest labor force participation rate are those with the educational attainment of bachelor's degree or higher, with 100.0% or 16 individuals in the labor force. Within the labor force, individuals with high school diploma education have the highest percentage of unemployment, with 30.0% or 71 of them being unemployed.
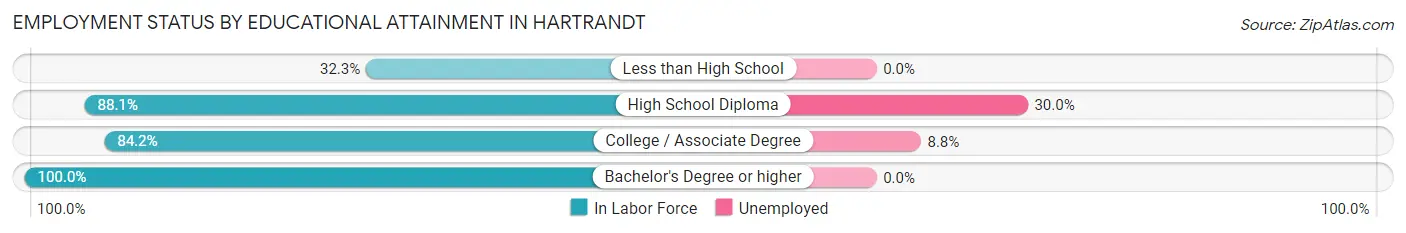
| Educational Attainment | In Labor Force | Unemployed |
| Less than High School | 31 (32.3%) | 0 (0.0%) |
| High School Diploma | 237 (88.1%) | 81 (30.0%) |
| College / Associate Degree | 170 (84.2%) | 18 (8.8%) |
| Bachelor's Degree or higher | 16 (100.0%) | 0 (0.0%) |
| Total | 454 (77.9%) | 110 (18.9%) |
Employment Occupations by Sex in Hartrandt
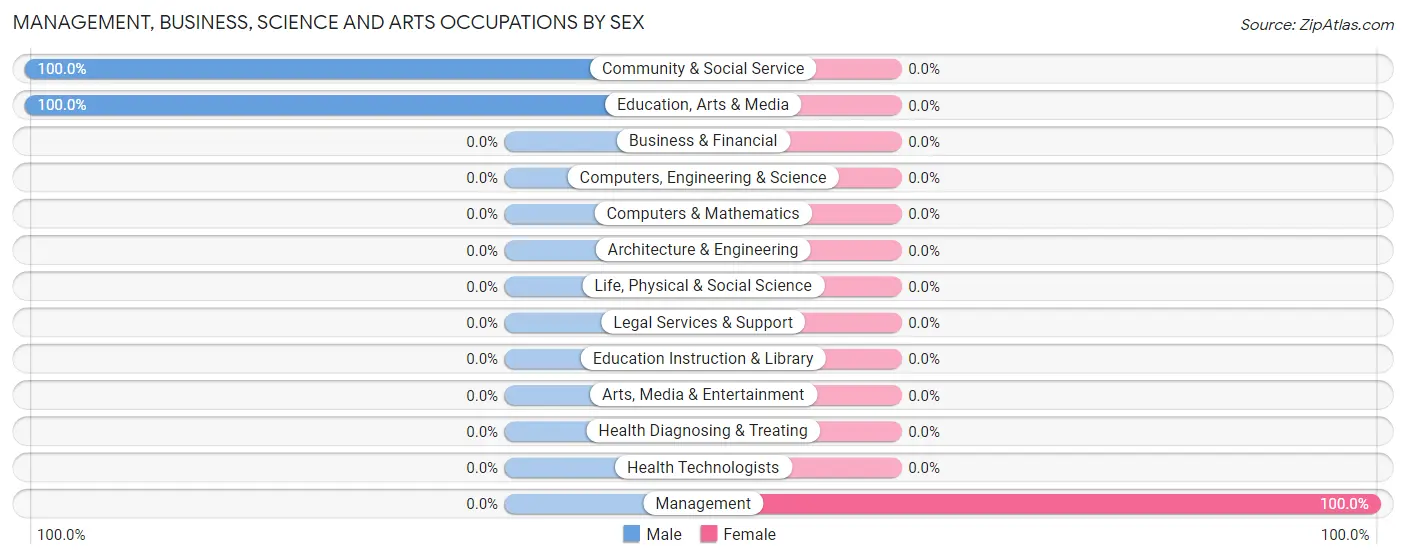
Management, Business, Science and Arts Occupations
The most common Management, Business, Science and Arts occupations in Hartrandt are Management (84 | 14.7%), Community & Social Service (16 | 2.8%), and Education, Arts & Media (16 | 2.8%).
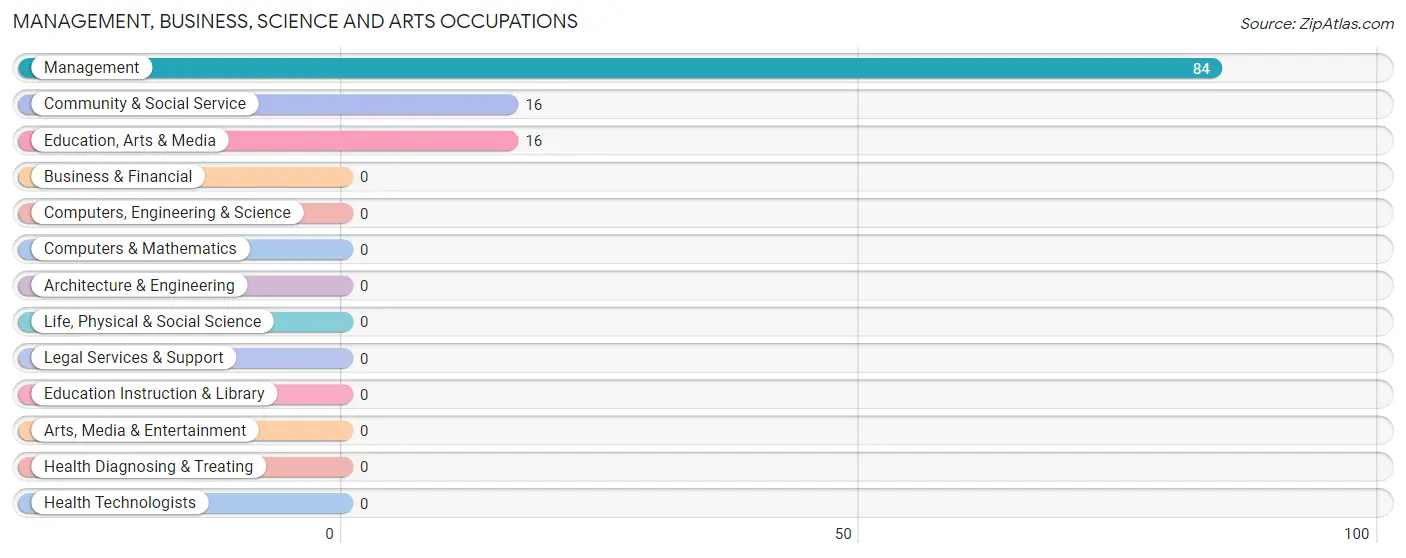
Management, Business, Science and Arts Occupations by Sex
| Occupation | Male | Female |
| Management | 0 (0.0%) | 84 (100.0%) |
| Business & Financial | 0 (0.0%) | 0 (0.0%) |
| Computers, Engineering & Science | 0 (0.0%) | 0 (0.0%) |
| Computers & Mathematics | 0 (0.0%) | 0 (0.0%) |
| Architecture & Engineering | 0 (0.0%) | 0 (0.0%) |
| Life, Physical & Social Science | 0 (0.0%) | 0 (0.0%) |
| Community & Social Service | 16 (100.0%) | 0 (0.0%) |
| Education, Arts & Media | 16 (100.0%) | 0 (0.0%) |
| Legal Services & Support | 0 (0.0%) | 0 (0.0%) |
| Education Instruction & Library | 0 (0.0%) | 0 (0.0%) |
| Arts, Media & Entertainment | 0 (0.0%) | 0 (0.0%) |
| Health Diagnosing & Treating | 0 (0.0%) | 0 (0.0%) |
| Health Technologists | 0 (0.0%) | 0 (0.0%) |
| Total (Category) | 16 (16.0%) | 84 (84.0%) |
| Total (Overall) | 444 (77.9%) | 126 (22.1%) |
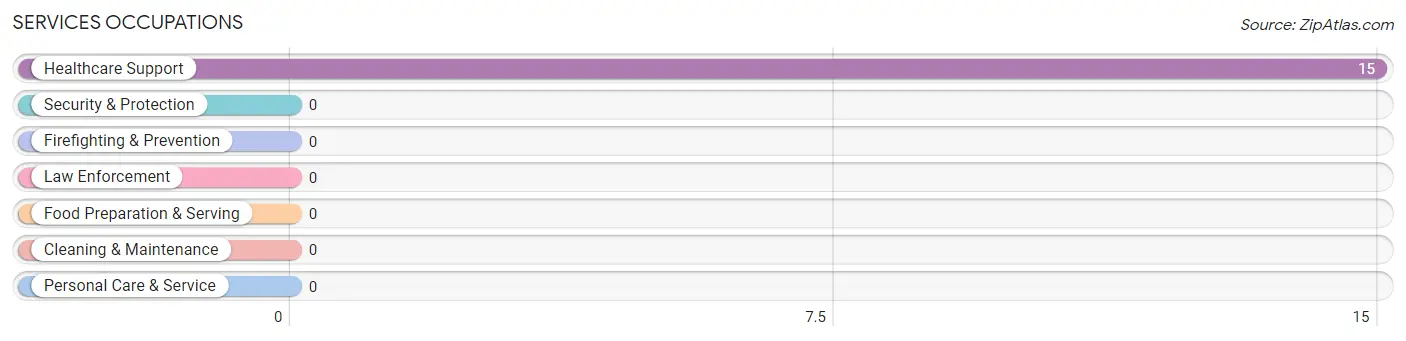
Services Occupations
The most common Services occupations in Hartrandt are , and Healthcare Support (15 | 2.6%).
Services Occupations by Sex
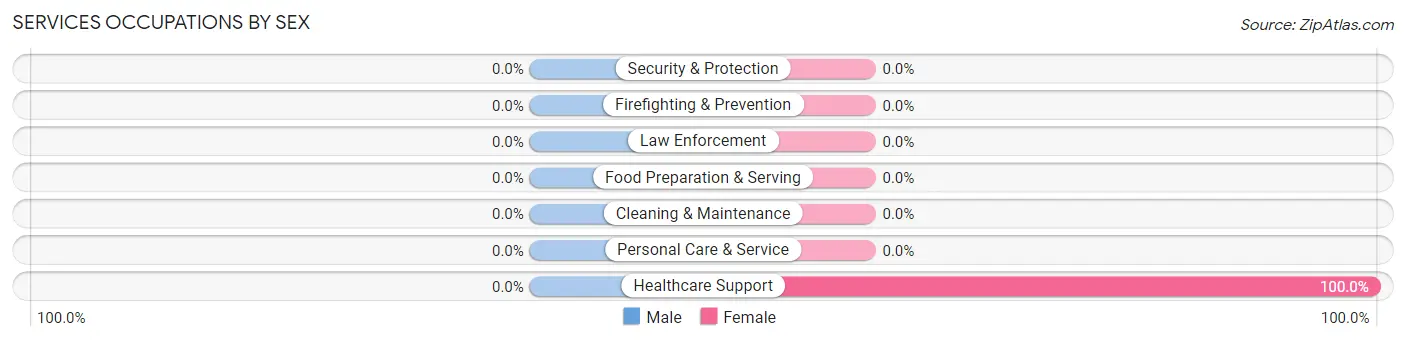
| Occupation | Male | Female |
| Healthcare Support | 0 (0.0%) | 15 (100.0%) |
| Security & Protection | 0 (0.0%) | 0 (0.0%) |
| Firefighting & Prevention | 0 (0.0%) | 0 (0.0%) |
| Law Enforcement | 0 (0.0%) | 0 (0.0%) |
| Food Preparation & Serving | 0 (0.0%) | 0 (0.0%) |
| Cleaning & Maintenance | 0 (0.0%) | 0 (0.0%) |
| Personal Care & Service | 0 (0.0%) | 0 (0.0%) |
| Total (Category) | 0 (0.0%) | 15 (100.0%) |
| Total (Overall) | 444 (77.9%) | 126 (22.1%) |
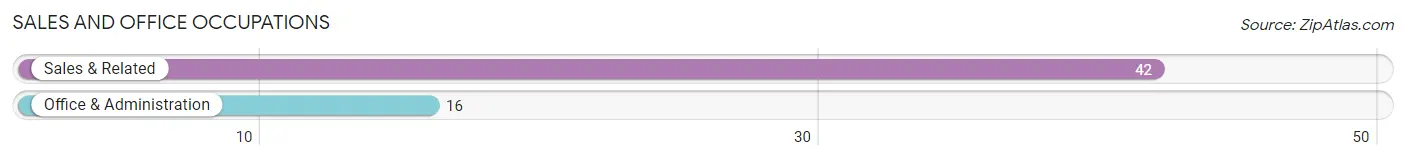
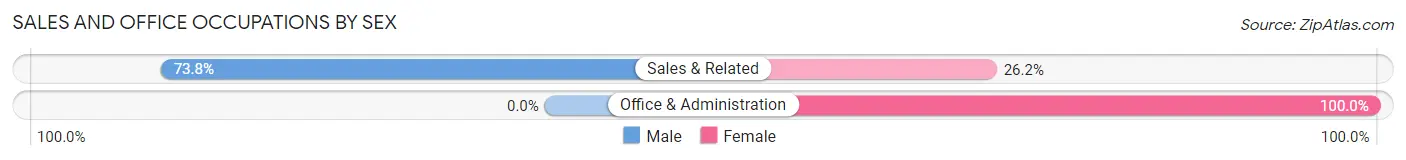
Sales and Office Occupations
The most common Sales and Office occupations in Hartrandt are Sales & Related (42 | 7.4%), and Office & Administration (16 | 2.8%).
Sales and Office Occupations by Sex
| Occupation | Male | Female |
| Sales & Related | 31 (73.8%) | 11 (26.2%) |
| Office & Administration | 0 (0.0%) | 16 (100.0%) |
| Total (Category) | 31 (53.4%) | 27 (46.6%) |
| Total (Overall) | 444 (77.9%) | 126 (22.1%) |
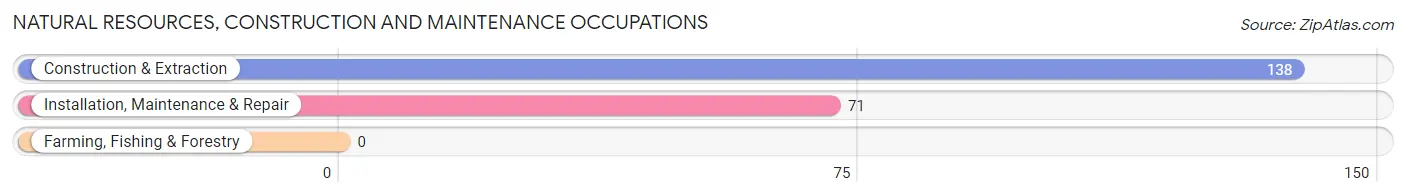
Natural Resources, Construction and Maintenance Occupations
The most common Natural Resources, Construction and Maintenance occupations in Hartrandt are Construction & Extraction (138 | 24.2%), and Installation, Maintenance & Repair (71 | 12.5%).
Natural Resources, Construction and Maintenance Occupations by Sex
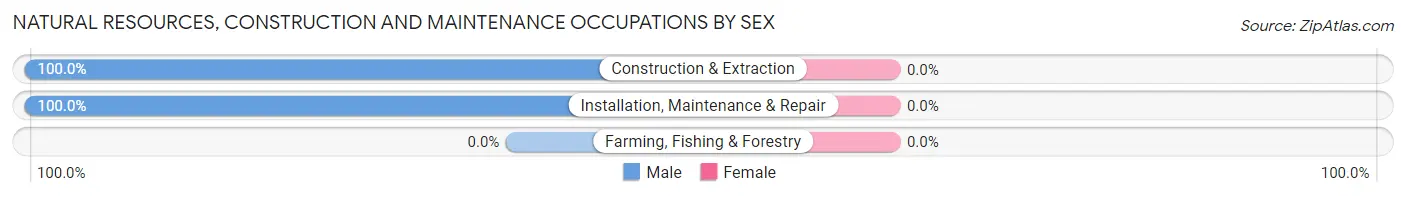
| Occupation | Male | Female |
| Farming, Fishing & Forestry | 0 (0.0%) | 0 (0.0%) |
| Construction & Extraction | 138 (100.0%) | 0 (0.0%) |
| Installation, Maintenance & Repair | 71 (100.0%) | 0 (0.0%) |
| Total (Category) | 209 (100.0%) | 0 (0.0%) |
| Total (Overall) | 444 (77.9%) | 126 (22.1%) |
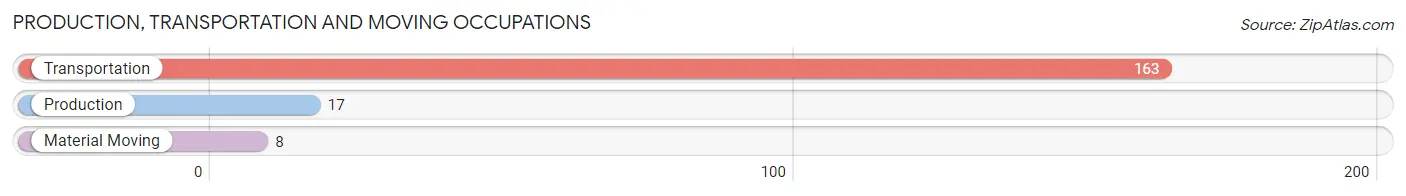
Production, Transportation and Moving Occupations
The most common Production, Transportation and Moving occupations in Hartrandt are Transportation (163 | 28.6%), Production (17 | 3.0%), and Material Moving (8 | 1.4%).
Production, Transportation and Moving Occupations by Sex
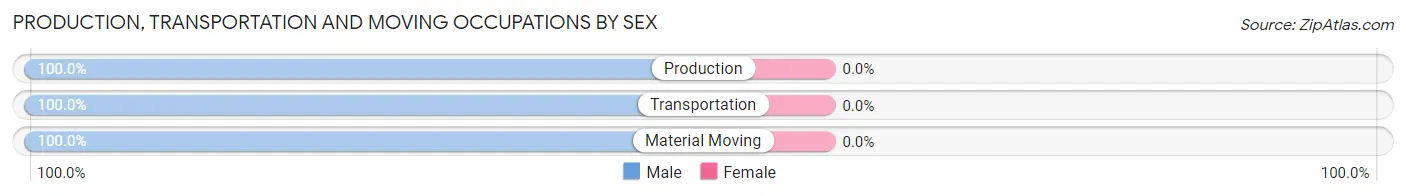
| Occupation | Male | Female |
| Production | 17 (100.0%) | 0 (0.0%) |
| Transportation | 163 (100.0%) | 0 (0.0%) |
| Material Moving | 8 (100.0%) | 0 (0.0%) |
| Total (Category) | 188 (100.0%) | 0 (0.0%) |
| Total (Overall) | 444 (77.9%) | 126 (22.1%) |
Employment Industries by Sex in Hartrandt
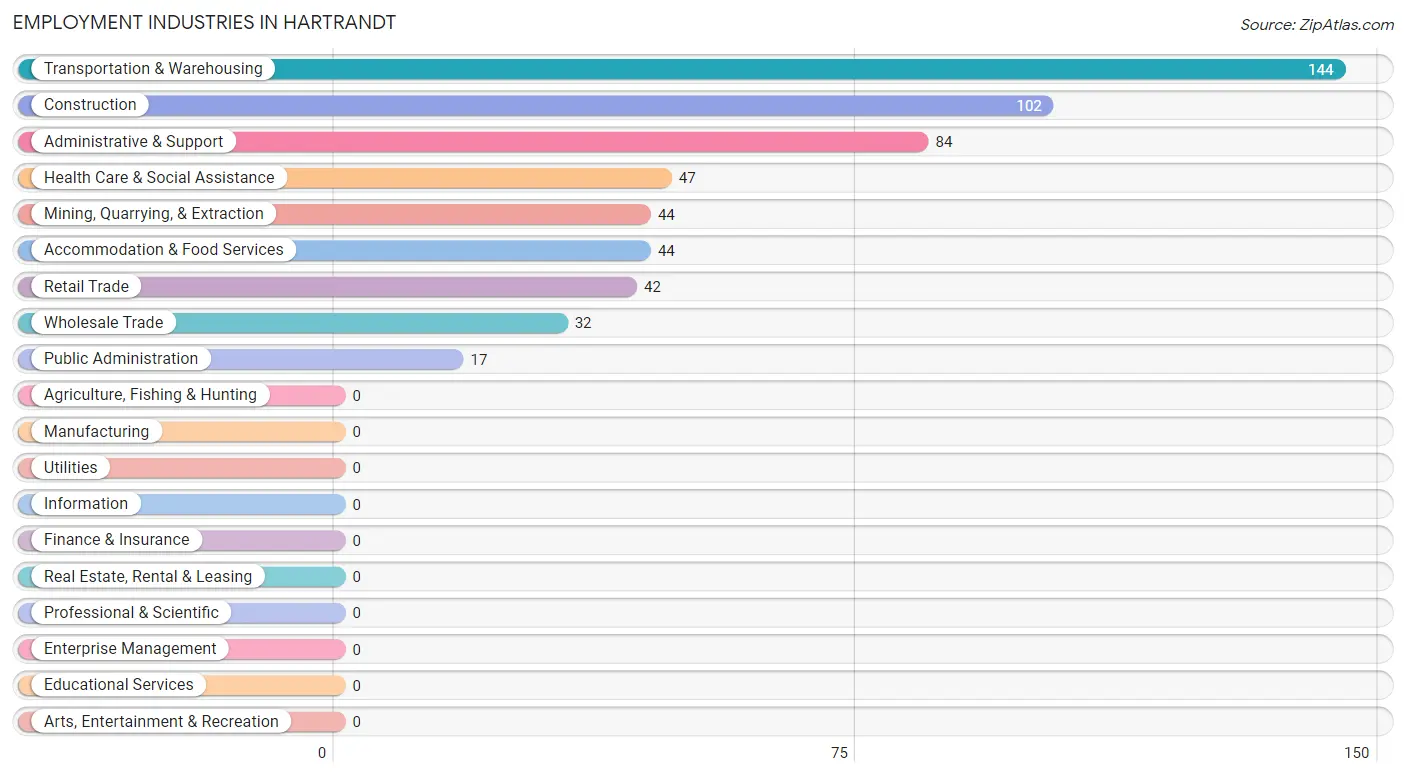
Employment Industries in Hartrandt
The major employment industries in Hartrandt include Transportation & Warehousing (144 | 25.3%), Construction (102 | 17.9%), Administrative & Support (84 | 14.7%), Health Care & Social Assistance (47 | 8.3%), and Mining, Quarrying, & Extraction (44 | 7.7%).
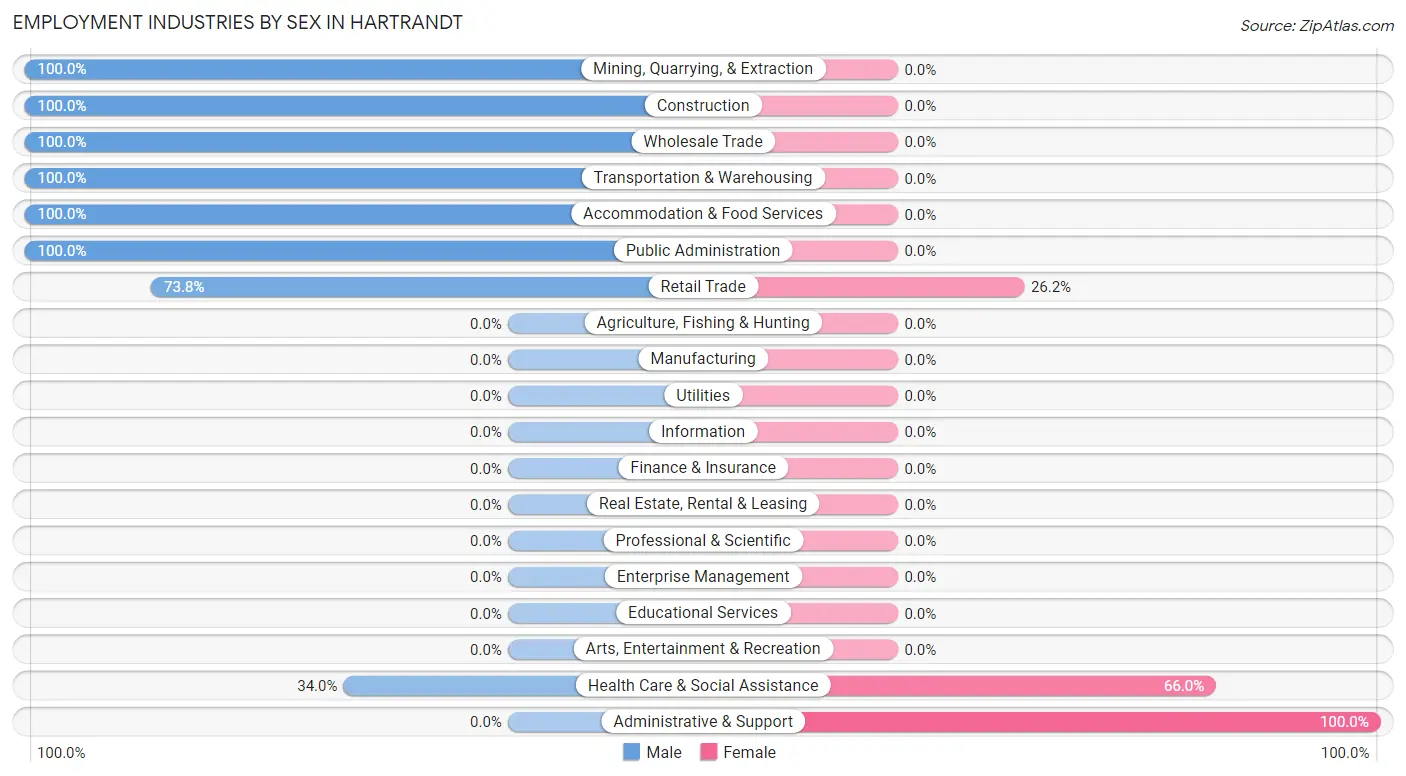
Employment Industries by Sex in Hartrandt
The Hartrandt industries that see more men than women are Mining, Quarrying, & Extraction (100.0%), Construction (100.0%), and Wholesale Trade (100.0%), whereas the industries that tend to have a higher number of women are Administrative & Support (100.0%), Health Care & Social Assistance (66.0%), and Retail Trade (26.2%).
| Industry | Male | Female |
| Agriculture, Fishing & Hunting | 0 (0.0%) | 0 (0.0%) |
| Mining, Quarrying, & Extraction | 44 (100.0%) | 0 (0.0%) |
| Construction | 102 (100.0%) | 0 (0.0%) |
| Manufacturing | 0 (0.0%) | 0 (0.0%) |
| Wholesale Trade | 32 (100.0%) | 0 (0.0%) |
| Retail Trade | 31 (73.8%) | 11 (26.2%) |
| Transportation & Warehousing | 144 (100.0%) | 0 (0.0%) |
| Utilities | 0 (0.0%) | 0 (0.0%) |
| Information | 0 (0.0%) | 0 (0.0%) |
| Finance & Insurance | 0 (0.0%) | 0 (0.0%) |
| Real Estate, Rental & Leasing | 0 (0.0%) | 0 (0.0%) |
| Professional & Scientific | 0 (0.0%) | 0 (0.0%) |
| Enterprise Management | 0 (0.0%) | 0 (0.0%) |
| Administrative & Support | 0 (0.0%) | 84 (100.0%) |
| Educational Services | 0 (0.0%) | 0 (0.0%) |
| Health Care & Social Assistance | 16 (34.0%) | 31 (66.0%) |
| Arts, Entertainment & Recreation | 0 (0.0%) | 0 (0.0%) |
| Accommodation & Food Services | 44 (100.0%) | 0 (0.0%) |
| Public Administration | 17 (100.0%) | 0 (0.0%) |
| Total | 444 (77.9%) | 126 (22.1%) |
Education in Hartrandt
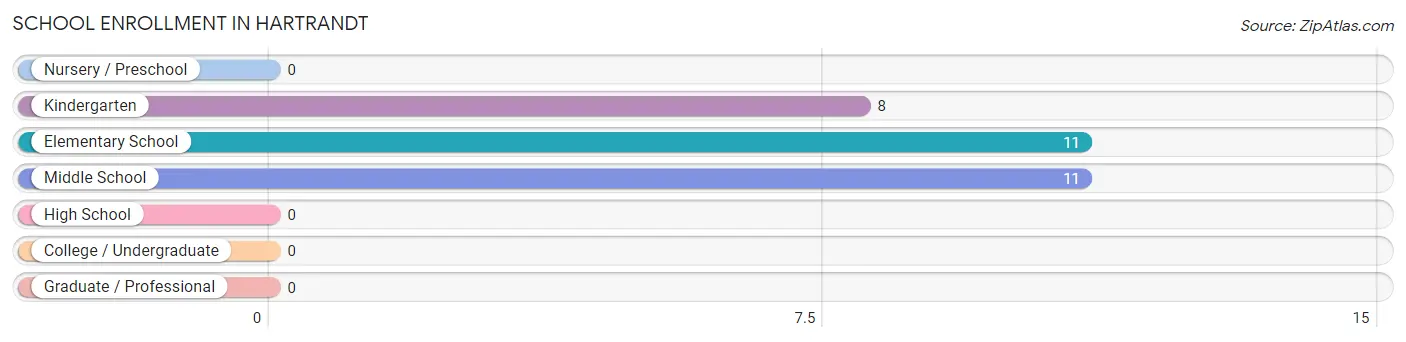
School Enrollment in Hartrandt
The most common levels of schooling among the 30 students in Hartrandt are elementary school (11 | 36.7%), middle school (11 | 36.7%), and kindergarten (8 | 26.7%).
| School Level | # Students | % Students |
| Nursery / Preschool | 0 | 0.0% |
| Kindergarten | 8 | 26.7% |
| Elementary School | 11 | 36.7% |
| Middle School | 11 | 36.7% |
| High School | 0 | 0.0% |
| College / Undergraduate | 0 | 0.0% |
| Graduate / Professional | 0 | 0.0% |
| Total | 30 | 100.0% |
School Enrollment by Age by Funding Source in Hartrandt
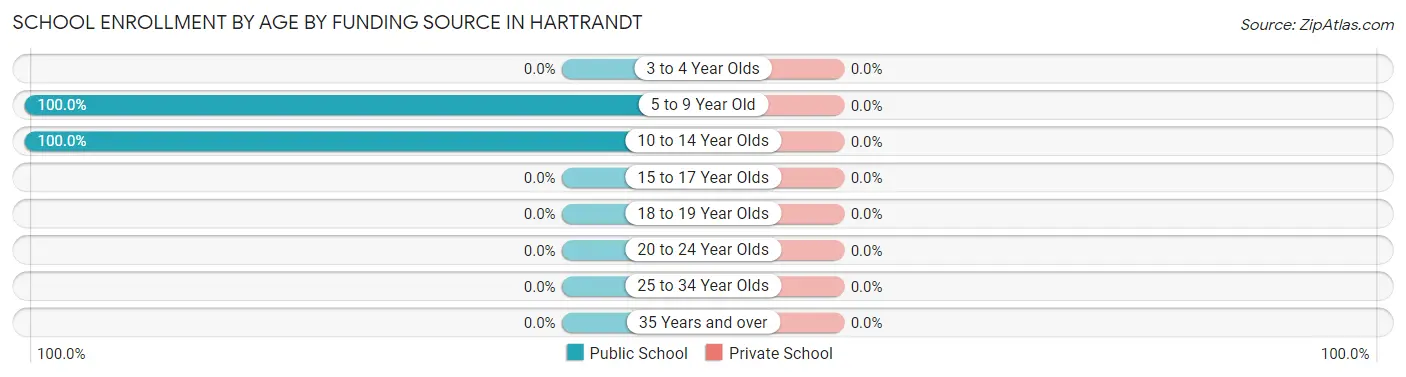
| Age Bracket | Public School | Private School |
| 3 to 4 Year Olds | 0 (0.0%) | 0 (0.0%) |
| 5 to 9 Year Old | 19 (100.0%) | 0 (0.0%) |
| 10 to 14 Year Olds | 11 (100.0%) | 0 (0.0%) |
| 15 to 17 Year Olds | 0 (0.0%) | 0 (0.0%) |
| 18 to 19 Year Olds | 0 (0.0%) | 0 (0.0%) |
| 20 to 24 Year Olds | 0 (0.0%) | 0 (0.0%) |
| 25 to 34 Year Olds | 0 (0.0%) | 0 (0.0%) |
| 35 Years and over | 0 (0.0%) | 0 (0.0%) |
| Total | 30 (100.0%) | 0 (0.0%) |
Educational Attainment by Field of Study in Hartrandt
, and arts & humanities (16 | 100.0%) are the most common fields of study among 16 individuals in Hartrandt who have obtained a bachelor's degree or higher.
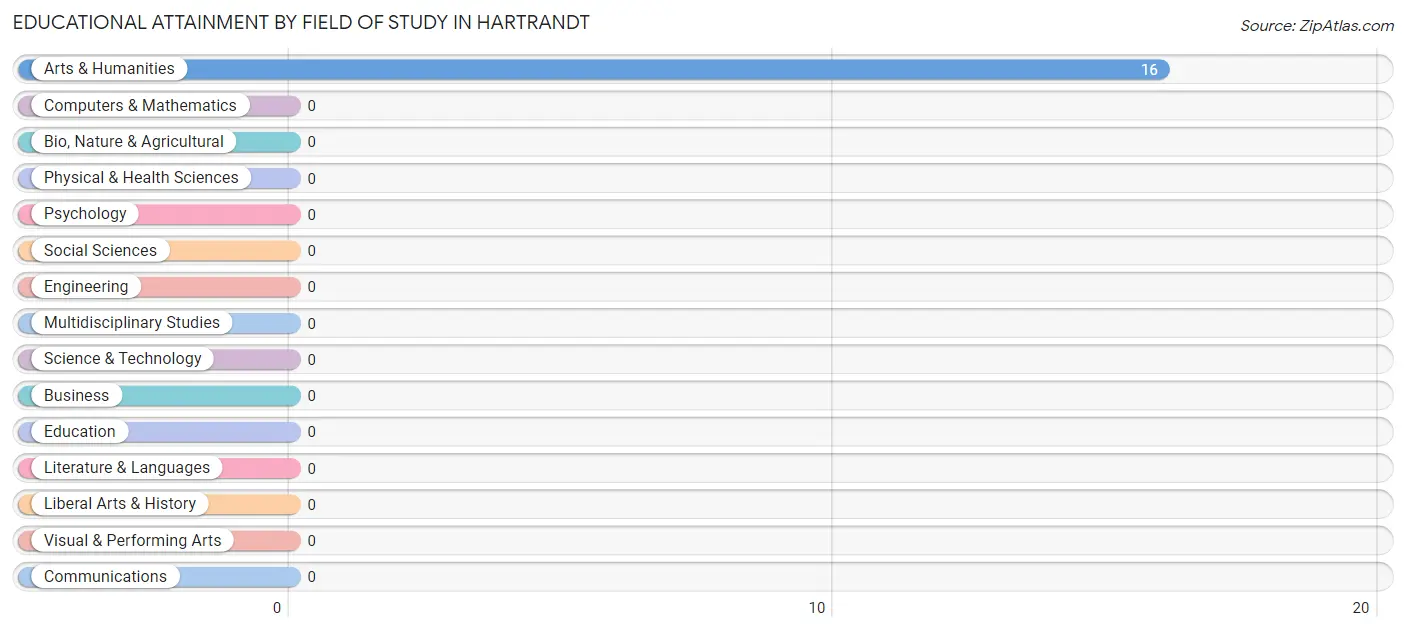
| Field of Study | # Graduates | % Graduates |
| Computers & Mathematics | 0 | 0.0% |
| Bio, Nature & Agricultural | 0 | 0.0% |
| Physical & Health Sciences | 0 | 0.0% |
| Psychology | 0 | 0.0% |
| Social Sciences | 0 | 0.0% |
| Engineering | 0 | 0.0% |
| Multidisciplinary Studies | 0 | 0.0% |
| Science & Technology | 0 | 0.0% |
| Business | 0 | 0.0% |
| Education | 0 | 0.0% |
| Literature & Languages | 0 | 0.0% |
| Liberal Arts & History | 0 | 0.0% |
| Visual & Performing Arts | 0 | 0.0% |
| Communications | 0 | 0.0% |
| Arts & Humanities | 16 | 100.0% |
| Total | 16 | 100.0% |
Transportation & Commute in Hartrandt
Vehicle Availability by Sex in Hartrandt
The most prevalent vehicle ownership categories in Hartrandt are males with 3 vehicles (238, accounting for 53.6%) and females with 3 vehicles (99, making up 188.9%).
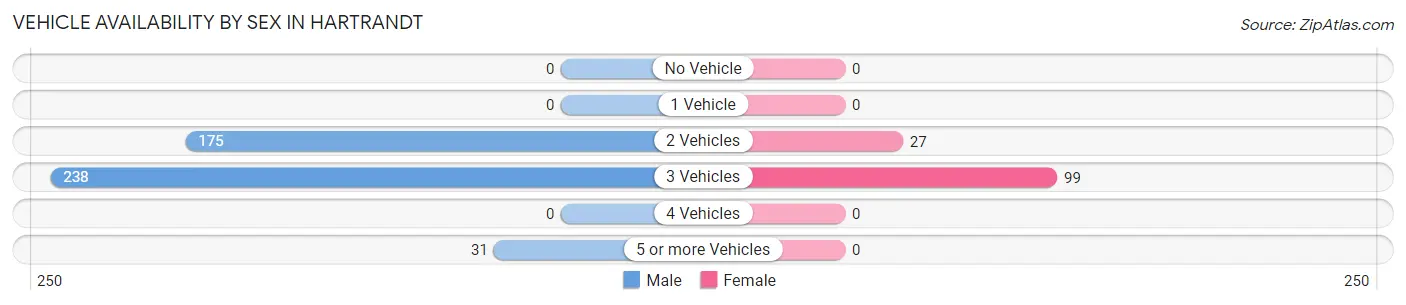
| Vehicles Available | Male | Female |
| No Vehicle | 0 (0.0%) | 0 (0.0%) |
| 1 Vehicle | 0 (0.0%) | 0 (0.0%) |
| 2 Vehicles | 175 (39.4%) | 27 (21.4%) |
| 3 Vehicles | 238 (53.6%) | 99 (78.6%) |
| 4 Vehicles | 0 (0.0%) | 0 (0.0%) |
| 5 or more Vehicles | 31 (7.0%) | 0 (0.0%) |
| Total | 444 (100.0%) | 126 (100.0%) |
Commute Time in Hartrandt
The most frequently occuring commute durations in Hartrandt are 15 to 19 minutes (200 commuters, 43.6%), 20 to 24 minutes (152 commuters, 33.1%), and 5 to 9 minutes (63 commuters, 13.7%).
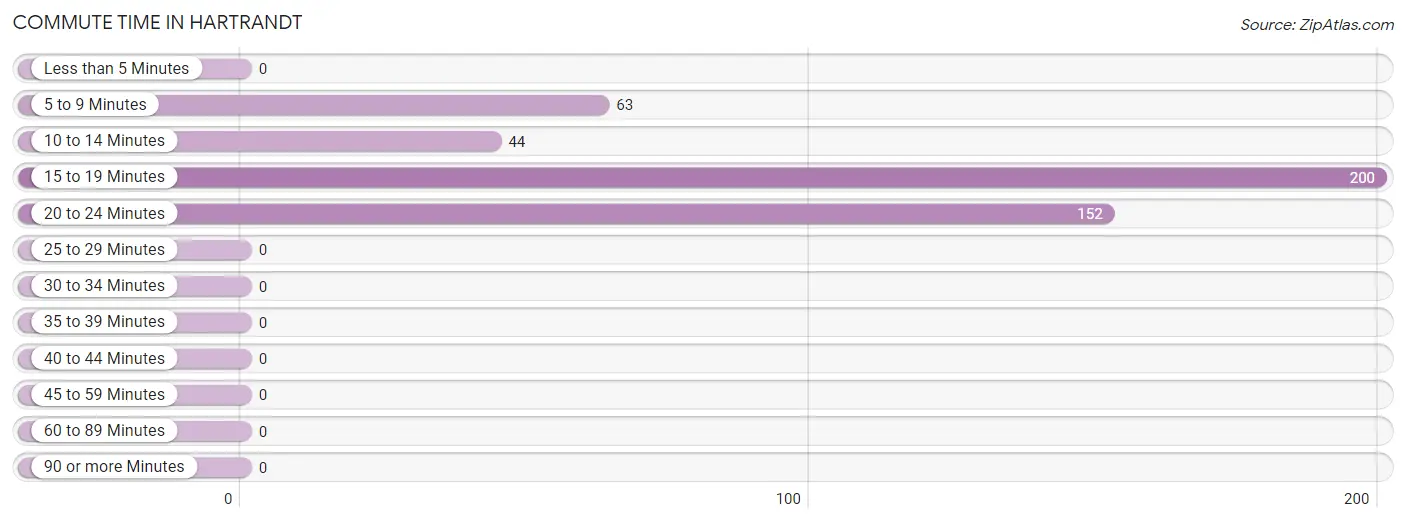
| Commute Time | # Commuters | % Commuters |
| Less than 5 Minutes | 0 | 0.0% |
| 5 to 9 Minutes | 63 | 13.7% |
| 10 to 14 Minutes | 44 | 9.6% |
| 15 to 19 Minutes | 200 | 43.6% |
| 20 to 24 Minutes | 152 | 33.1% |
| 25 to 29 Minutes | 0 | 0.0% |
| 30 to 34 Minutes | 0 | 0.0% |
| 35 to 39 Minutes | 0 | 0.0% |
| 40 to 44 Minutes | 0 | 0.0% |
| 45 to 59 Minutes | 0 | 0.0% |
| 60 to 89 Minutes | 0 | 0.0% |
| 90 or more Minutes | 0 | 0.0% |
Commute Time by Sex in Hartrandt
The most common commute times in Hartrandt are 15 to 19 minutes (158 commuters, 37.9%) for males and 15 to 19 minutes (42 commuters, 100.0%) for females.
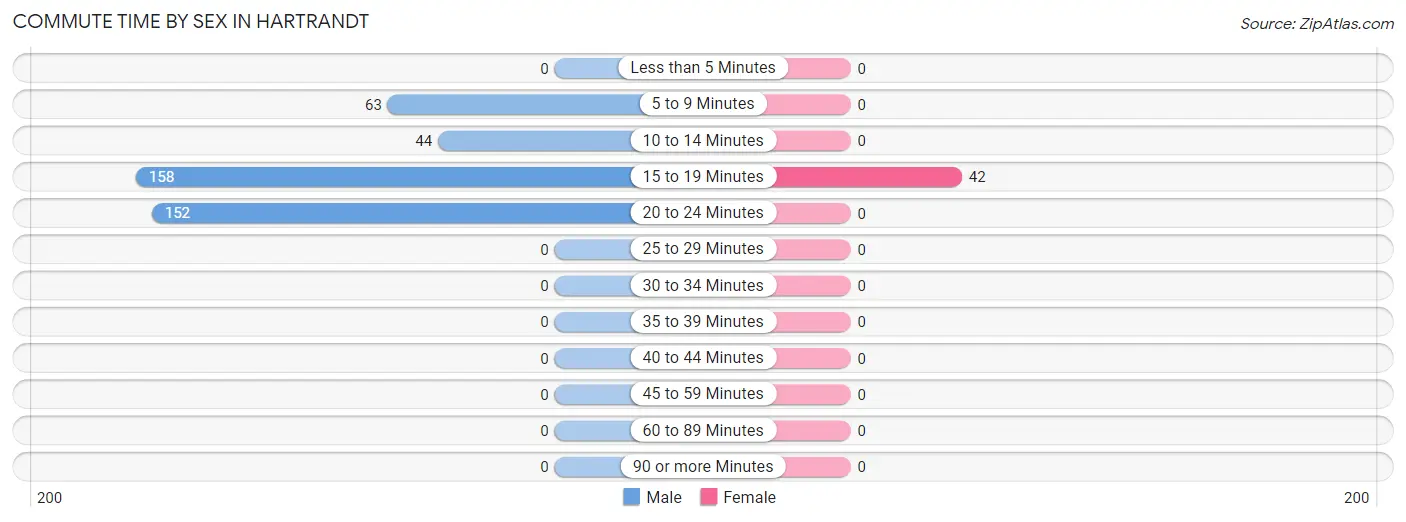
| Commute Time | Male | Female |
| Less than 5 Minutes | 0 (0.0%) | 0 (0.0%) |
| 5 to 9 Minutes | 63 (15.1%) | 0 (0.0%) |
| 10 to 14 Minutes | 44 (10.5%) | 0 (0.0%) |
| 15 to 19 Minutes | 158 (37.9%) | 42 (100.0%) |
| 20 to 24 Minutes | 152 (36.4%) | 0 (0.0%) |
| 25 to 29 Minutes | 0 (0.0%) | 0 (0.0%) |
| 30 to 34 Minutes | 0 (0.0%) | 0 (0.0%) |
| 35 to 39 Minutes | 0 (0.0%) | 0 (0.0%) |
| 40 to 44 Minutes | 0 (0.0%) | 0 (0.0%) |
| 45 to 59 Minutes | 0 (0.0%) | 0 (0.0%) |
| 60 to 89 Minutes | 0 (0.0%) | 0 (0.0%) |
| 90 or more Minutes | 0 (0.0%) | 0 (0.0%) |
Time of Departure to Work by Sex in Hartrandt
The most frequent times of departure to work in Hartrandt are 7:00 AM to 7:29 AM (201, 48.2%) for males and 8:30 AM to 8:59 AM (16, 38.1%) for females.
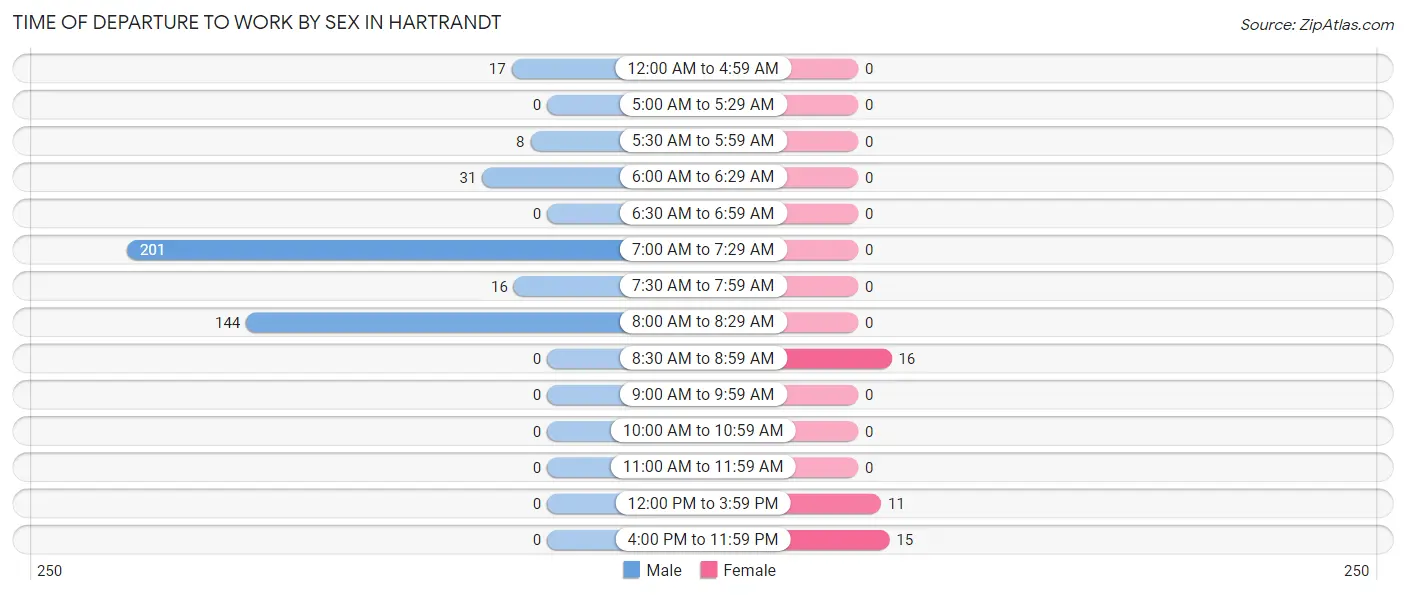
| Time of Departure | Male | Female |
| 12:00 AM to 4:59 AM | 17 (4.1%) | 0 (0.0%) |
| 5:00 AM to 5:29 AM | 0 (0.0%) | 0 (0.0%) |
| 5:30 AM to 5:59 AM | 8 (1.9%) | 0 (0.0%) |
| 6:00 AM to 6:29 AM | 31 (7.4%) | 0 (0.0%) |
| 6:30 AM to 6:59 AM | 0 (0.0%) | 0 (0.0%) |
| 7:00 AM to 7:29 AM | 201 (48.2%) | 0 (0.0%) |
| 7:30 AM to 7:59 AM | 16 (3.8%) | 0 (0.0%) |
| 8:00 AM to 8:29 AM | 144 (34.5%) | 0 (0.0%) |
| 8:30 AM to 8:59 AM | 0 (0.0%) | 16 (38.1%) |
| 9:00 AM to 9:59 AM | 0 (0.0%) | 0 (0.0%) |
| 10:00 AM to 10:59 AM | 0 (0.0%) | 0 (0.0%) |
| 11:00 AM to 11:59 AM | 0 (0.0%) | 0 (0.0%) |
| 12:00 PM to 3:59 PM | 0 (0.0%) | 11 (26.2%) |
| 4:00 PM to 11:59 PM | 0 (0.0%) | 15 (35.7%) |
| Total | 417 (100.0%) | 42 (100.0%) |
Housing Occupancy in Hartrandt
Occupancy by Ownership in Hartrandt
Of the total 364 dwellings in Hartrandt, owner-occupied units account for 300 (82.4%), while renter-occupied units make up 64 (17.6%).
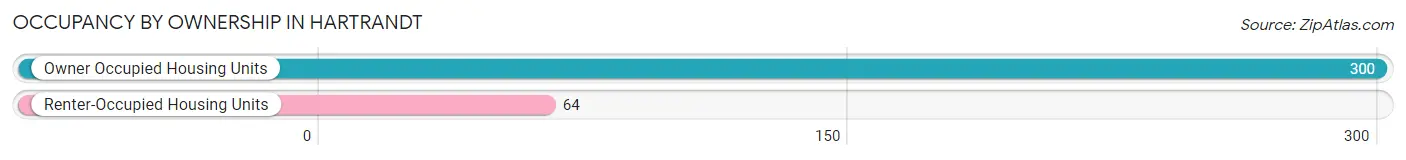
| Occupancy | # Housing Units | % Housing Units |
| Owner Occupied Housing Units | 300 | 82.4% |
| Renter-Occupied Housing Units | 64 | 17.6% |
| Total Occupied Housing Units | 364 | 100.0% |
Occupancy by Household Size in Hartrandt
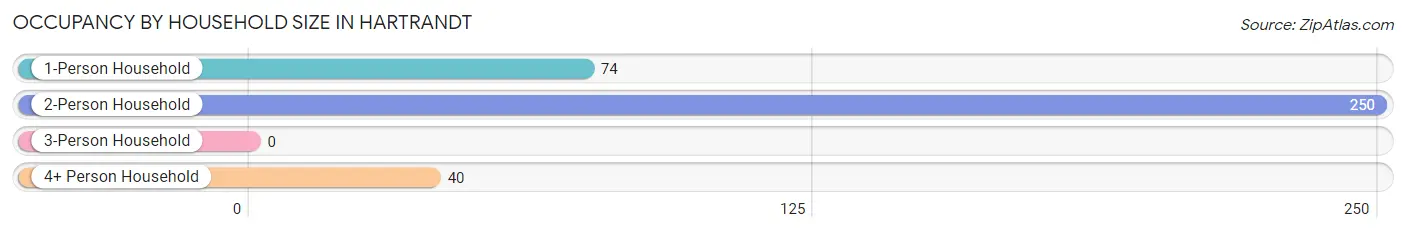
| Household Size | # Housing Units | % Housing Units |
| 1-Person Household | 74 | 20.3% |
| 2-Person Household | 250 | 68.7% |
| 3-Person Household | 0 | 0.0% |
| 4+ Person Household | 40 | 11.0% |
| Total Housing Units | 364 | 100.0% |
Occupancy by Ownership by Household Size in Hartrandt
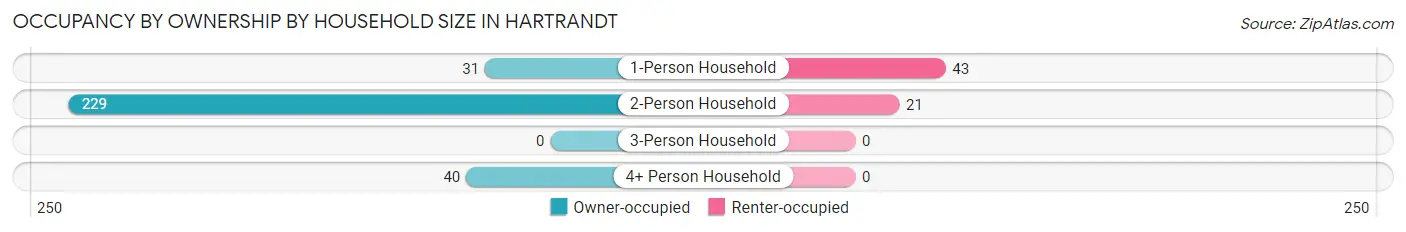
| Household Size | Owner-occupied | Renter-occupied |
| 1-Person Household | 31 (41.9%) | 43 (58.1%) |
| 2-Person Household | 229 (91.6%) | 21 (8.4%) |
| 3-Person Household | 0 (0.0%) | 0 (0.0%) |
| 4+ Person Household | 40 (100.0%) | 0 (0.0%) |
| Total Housing Units | 300 (82.4%) | 64 (17.6%) |
Occupancy by Educational Attainment in Hartrandt
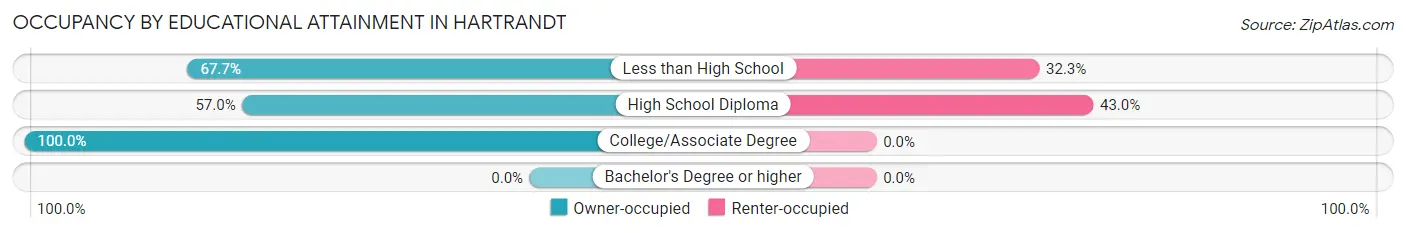
| Household Size | Owner-occupied | Renter-occupied |
| Less than High School | 44 (67.7%) | 21 (32.3%) |
| High School Diploma | 57 (57.0%) | 43 (43.0%) |
| College/Associate Degree | 199 (100.0%) | 0 (0.0%) |
| Bachelor's Degree or higher | 0 (0.0%) | 0 (0.0%) |
Occupancy by Age of Householder in Hartrandt
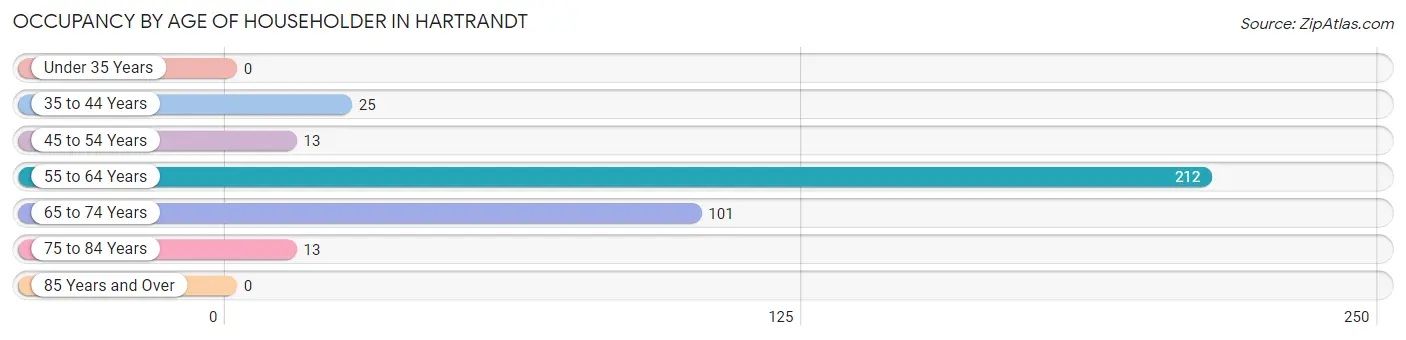
| Age Bracket | # Households | % Households |
| Under 35 Years | 0 | 0.0% |
| 35 to 44 Years | 25 | 6.9% |
| 45 to 54 Years | 13 | 3.6% |
| 55 to 64 Years | 212 | 58.2% |
| 65 to 74 Years | 101 | 27.8% |
| 75 to 84 Years | 13 | 3.6% |
| 85 Years and Over | 0 | 0.0% |
| Total | 364 | 100.0% |
Housing Finances in Hartrandt
Median Income by Occupancy in Hartrandt
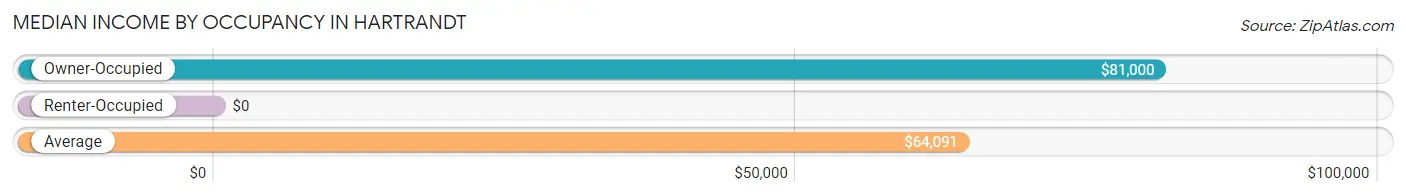
| Occupancy Type | # Households | Median Income |
| Owner-Occupied | 300 (82.4%) | $81,000 |
| Renter-Occupied | 64 (17.6%) | $0 |
| Average | 364 (100.0%) | $64,091 |
Occupancy by Householder Income Bracket in Hartrandt
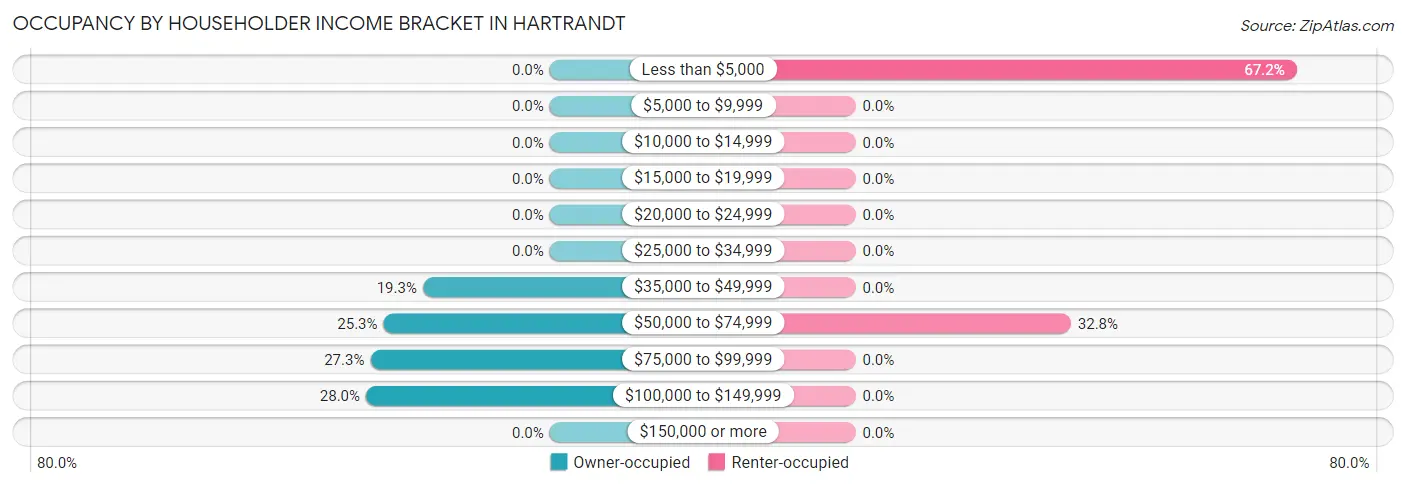
| Income Bracket | Owner-occupied | Renter-occupied |
| Less than $5,000 | 0 (0.0%) | 43 (67.2%) |
| $5,000 to $9,999 | 0 (0.0%) | 0 (0.0%) |
| $10,000 to $14,999 | 0 (0.0%) | 0 (0.0%) |
| $15,000 to $19,999 | 0 (0.0%) | 0 (0.0%) |
| $20,000 to $24,999 | 0 (0.0%) | 0 (0.0%) |
| $25,000 to $34,999 | 0 (0.0%) | 0 (0.0%) |
| $35,000 to $49,999 | 58 (19.3%) | 0 (0.0%) |
| $50,000 to $74,999 | 76 (25.3%) | 21 (32.8%) |
| $75,000 to $99,999 | 82 (27.3%) | 0 (0.0%) |
| $100,000 to $149,999 | 84 (28.0%) | 0 (0.0%) |
| $150,000 or more | 0 (0.0%) | 0 (0.0%) |
| Total | 300 (100.0%) | 64 (100.0%) |
Monthly Housing Cost Tiers in Hartrandt
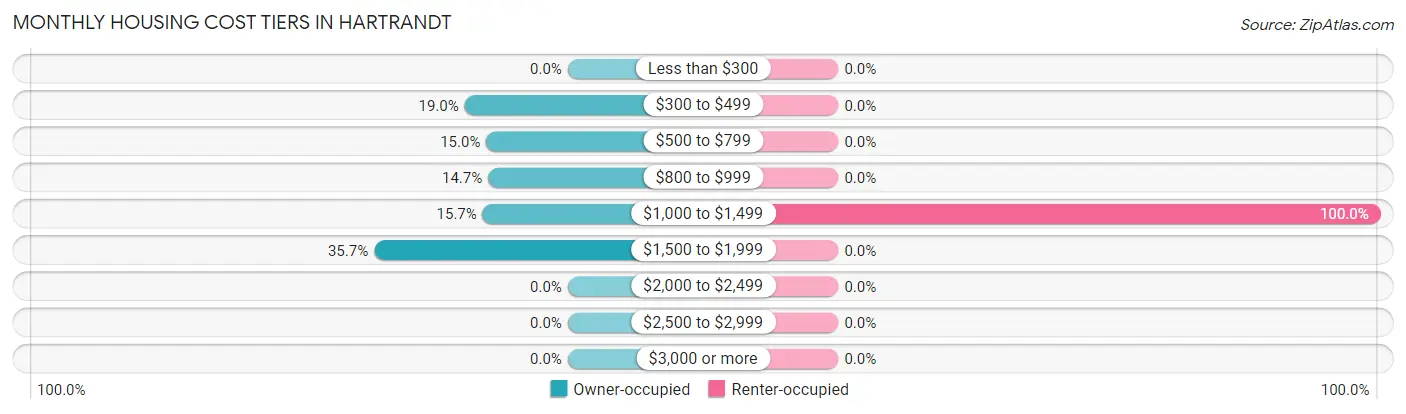
| Monthly Cost | Owner-occupied | Renter-occupied |
| Less than $300 | 0 (0.0%) | 0 (0.0%) |
| $300 to $499 | 57 (19.0%) | 0 (0.0%) |
| $500 to $799 | 45 (15.0%) | 0 (0.0%) |
| $800 to $999 | 44 (14.7%) | 0 (0.0%) |
| $1,000 to $1,499 | 47 (15.7%) | 64 (100.0%) |
| $1,500 to $1,999 | 107 (35.7%) | 0 (0.0%) |
| $2,000 to $2,499 | 0 (0.0%) | 0 (0.0%) |
| $2,500 to $2,999 | 0 (0.0%) | 0 (0.0%) |
| $3,000 or more | 0 (0.0%) | 0 (0.0%) |
| Total | 300 (100.0%) | 64 (100.0%) |
Physical Housing Characteristics in Hartrandt
Housing Structures in Hartrandt
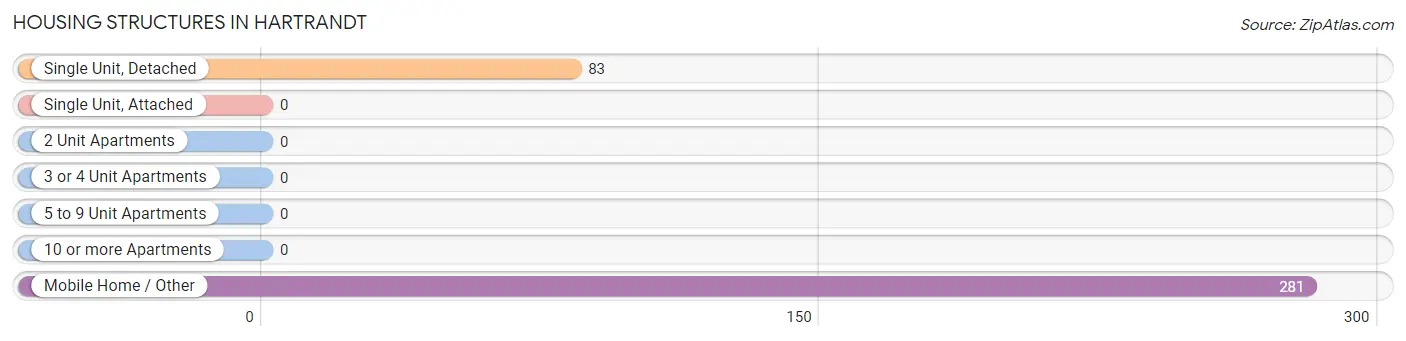
| Structure Type | # Housing Units | % Housing Units |
| Single Unit, Detached | 83 | 22.8% |
| Single Unit, Attached | 0 | 0.0% |
| 2 Unit Apartments | 0 | 0.0% |
| 3 or 4 Unit Apartments | 0 | 0.0% |
| 5 to 9 Unit Apartments | 0 | 0.0% |
| 10 or more Apartments | 0 | 0.0% |
| Mobile Home / Other | 281 | 77.2% |
| Total | 364 | 100.0% |
Housing Structures by Occupancy in Hartrandt
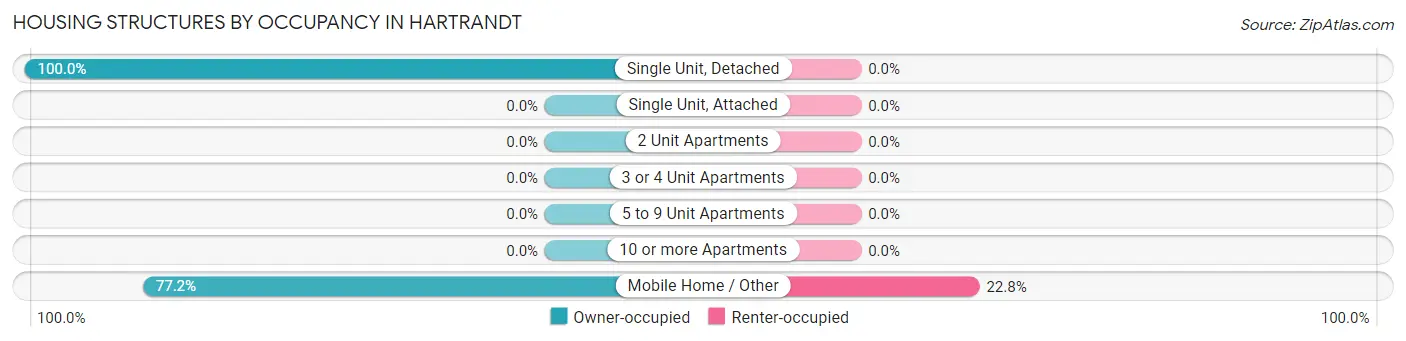
| Structure Type | Owner-occupied | Renter-occupied |
| Single Unit, Detached | 83 (100.0%) | 0 (0.0%) |
| Single Unit, Attached | 0 (0.0%) | 0 (0.0%) |
| 2 Unit Apartments | 0 (0.0%) | 0 (0.0%) |
| 3 or 4 Unit Apartments | 0 (0.0%) | 0 (0.0%) |
| 5 to 9 Unit Apartments | 0 (0.0%) | 0 (0.0%) |
| 10 or more Apartments | 0 (0.0%) | 0 (0.0%) |
| Mobile Home / Other | 217 (77.2%) | 64 (22.8%) |
| Total | 300 (82.4%) | 64 (17.6%) |
Housing Structures by Number of Rooms in Hartrandt
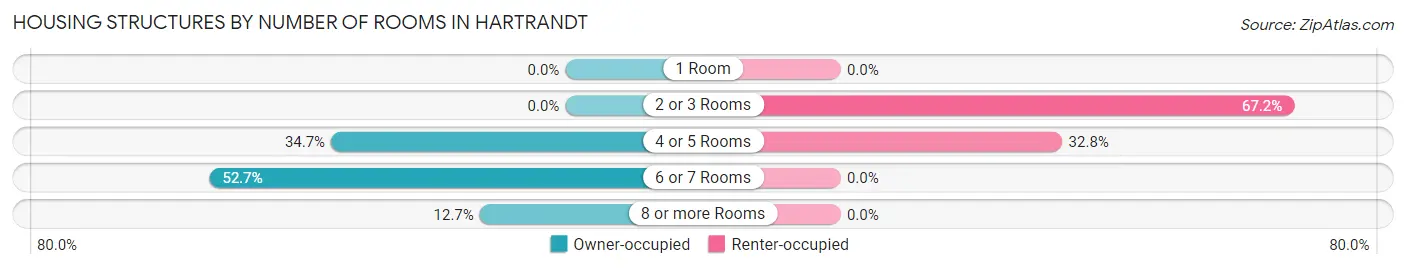
| Number of Rooms | Owner-occupied | Renter-occupied |
| 1 Room | 0 (0.0%) | 0 (0.0%) |
| 2 or 3 Rooms | 0 (0.0%) | 43 (67.2%) |
| 4 or 5 Rooms | 104 (34.7%) | 21 (32.8%) |
| 6 or 7 Rooms | 158 (52.7%) | 0 (0.0%) |
| 8 or more Rooms | 38 (12.7%) | 0 (0.0%) |
| Total | 300 (100.0%) | 64 (100.0%) |
Housing Structure by Heating Type in Hartrandt
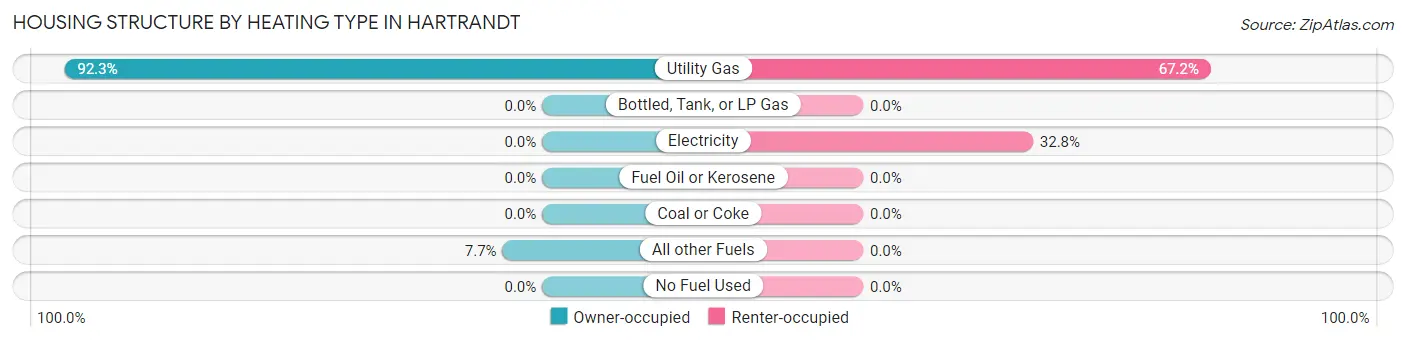
| Heating Type | Owner-occupied | Renter-occupied |
| Utility Gas | 277 (92.3%) | 43 (67.2%) |
| Bottled, Tank, or LP Gas | 0 (0.0%) | 0 (0.0%) |
| Electricity | 0 (0.0%) | 21 (32.8%) |
| Fuel Oil or Kerosene | 0 (0.0%) | 0 (0.0%) |
| Coal or Coke | 0 (0.0%) | 0 (0.0%) |
| All other Fuels | 23 (7.7%) | 0 (0.0%) |
| No Fuel Used | 0 (0.0%) | 0 (0.0%) |
| Total | 300 (100.0%) | 64 (100.0%) |
Household Vehicle Usage in Hartrandt
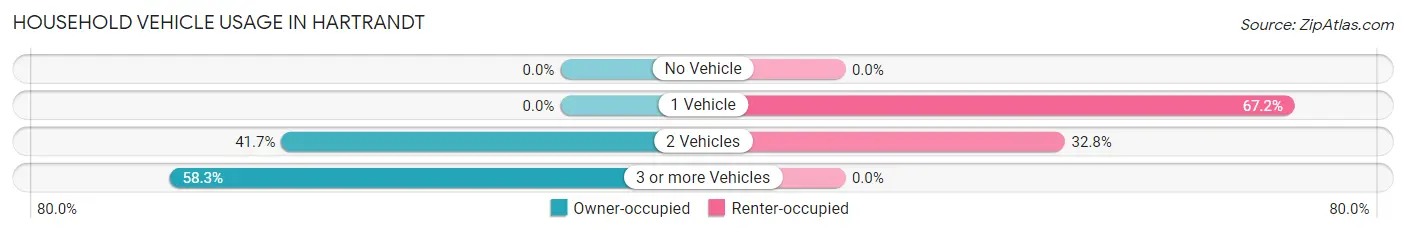
| Vehicles per Household | Owner-occupied | Renter-occupied |
| No Vehicle | 0 (0.0%) | 0 (0.0%) |
| 1 Vehicle | 0 (0.0%) | 43 (67.2%) |
| 2 Vehicles | 125 (41.7%) | 21 (32.8%) |
| 3 or more Vehicles | 175 (58.3%) | 0 (0.0%) |
| Total | 300 (100.0%) | 64 (100.0%) |
Real Estate & Mortgages in Hartrandt
Real Estate and Mortgage Overview in Hartrandt
| Characteristic | Without Mortgage | With Mortgage |
| Housing Units | 89 | 211 |
| Median Property Value | $82,200 | $255,100 |
| Median Household Income | $80,039 | $0 |
| Monthly Housing Costs | $339 | $0 |
| Real Estate Taxes | $199 | $13 |
Property Value by Mortgage Status in Hartrandt
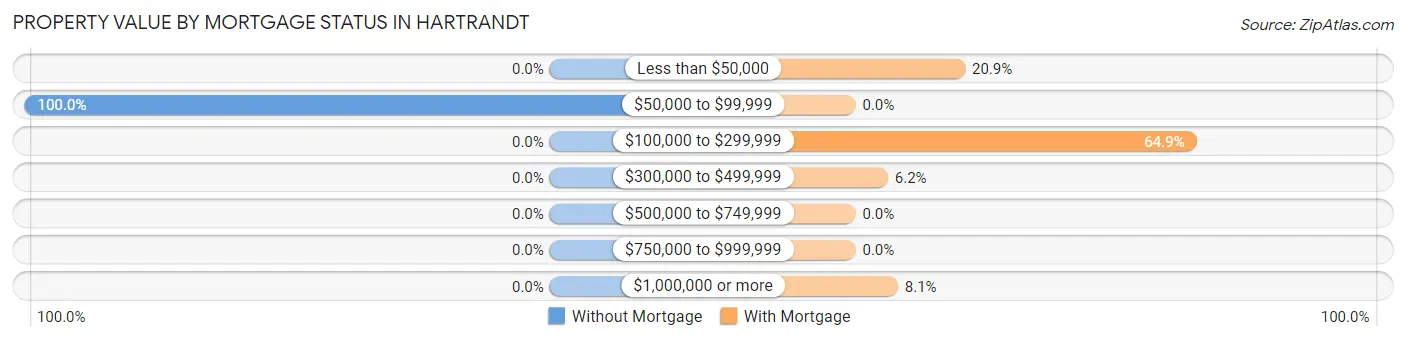
| Property Value | Without Mortgage | With Mortgage |
| Less than $50,000 | 0 (0.0%) | 44 (20.8%) |
| $50,000 to $99,999 | 89 (100.0%) | 0 (0.0%) |
| $100,000 to $299,999 | 0 (0.0%) | 137 (64.9%) |
| $300,000 to $499,999 | 0 (0.0%) | 13 (6.2%) |
| $500,000 to $749,999 | 0 (0.0%) | 0 (0.0%) |
| $750,000 to $999,999 | 0 (0.0%) | 0 (0.0%) |
| $1,000,000 or more | 0 (0.0%) | 17 (8.1%) |
| Total | 89 (100.0%) | 211 (100.0%) |
Household Income by Mortgage Status in Hartrandt
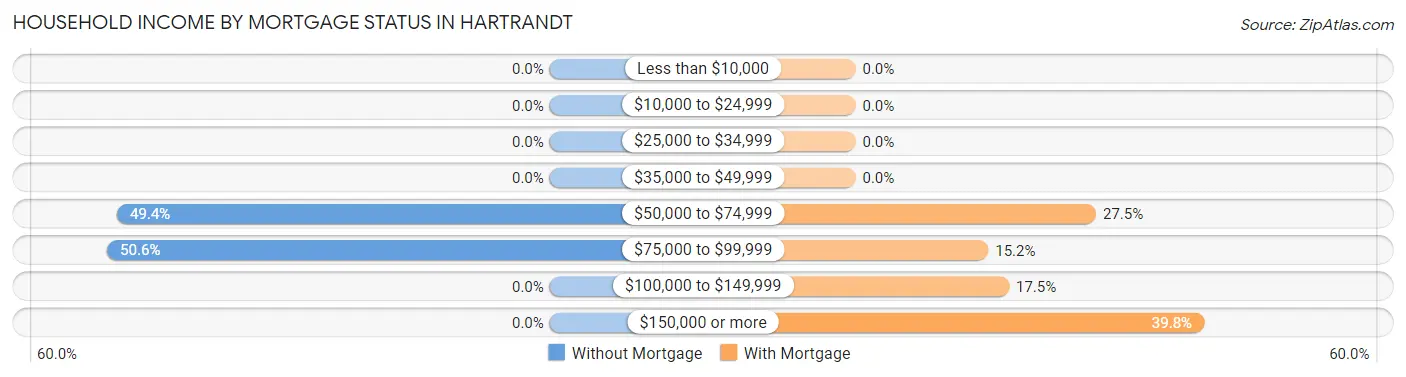
| Household Income | Without Mortgage | With Mortgage |
| Less than $10,000 | 0 (0.0%) | 0 (0.0%) |
| $10,000 to $24,999 | 0 (0.0%) | 0 (0.0%) |
| $25,000 to $34,999 | 0 (0.0%) | 0 (0.0%) |
| $35,000 to $49,999 | 0 (0.0%) | 0 (0.0%) |
| $50,000 to $74,999 | 44 (49.4%) | 58 (27.5%) |
| $75,000 to $99,999 | 45 (50.6%) | 32 (15.2%) |
| $100,000 to $149,999 | 0 (0.0%) | 37 (17.5%) |
| $150,000 or more | 0 (0.0%) | 84 (39.8%) |
| Total | 89 (100.0%) | 211 (100.0%) |
Property Value to Household Income Ratio in Hartrandt
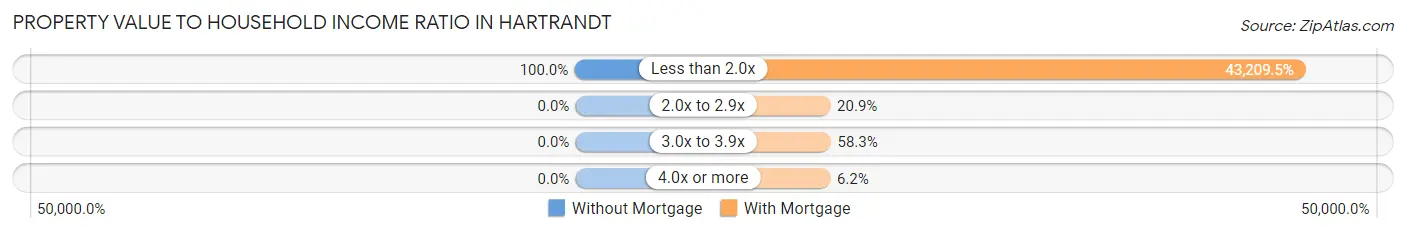
| Value-to-Income Ratio | Without Mortgage | With Mortgage |
| Less than 2.0x | 89 (100.0%) | 91,172 (43,209.5%) |
| 2.0x to 2.9x | 0 (0.0%) | 44 (20.8%) |
| 3.0x to 3.9x | 0 (0.0%) | 123 (58.3%) |
| 4.0x or more | 0 (0.0%) | 13 (6.2%) |
| Total | 89 (100.0%) | 211 (100.0%) |
Real Estate Taxes by Mortgage Status in Hartrandt
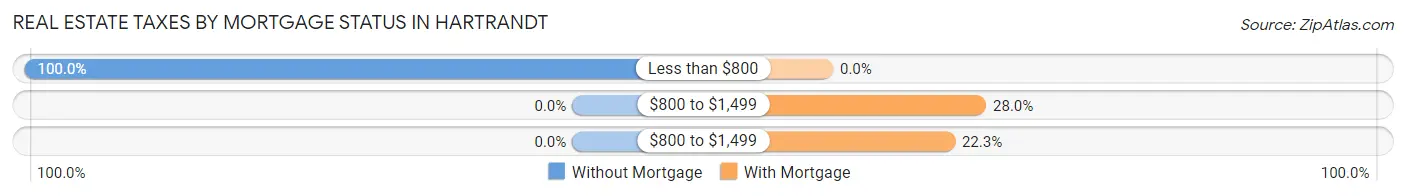
| Property Taxes | Without Mortgage | With Mortgage |
| Less than $800 | 89 (100.0%) | 0 (0.0%) |
| $800 to $1,499 | 0 (0.0%) | 59 (28.0%) |
| $800 to $1,499 | 0 (0.0%) | 47 (22.3%) |
| Total | 89 (100.0%) | 211 (100.0%) |
Health & Disability in Hartrandt
Health Insurance Coverage by Age in Hartrandt
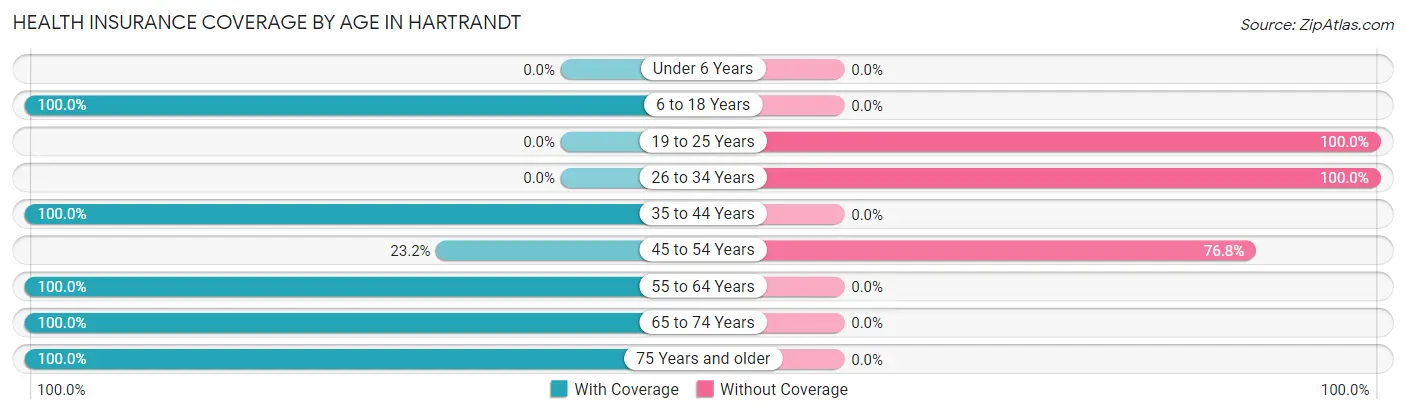
| Age Bracket | With Coverage | Without Coverage |
| Under 6 Years | 0 (0.0%) | 0 (0.0%) |
| 6 to 18 Years | 30 (100.0%) | 0 (0.0%) |
| 19 to 25 Years | 0 (0.0%) | 32 (100.0%) |
| 26 to 34 Years | 0 (0.0%) | 28 (100.0%) |
| 35 to 44 Years | 86 (100.0%) | 0 (0.0%) |
| 45 to 54 Years | 13 (23.2%) | 43 (76.8%) |
| 55 to 64 Years | 413 (100.0%) | 0 (0.0%) |
| 65 to 74 Years | 245 (100.0%) | 0 (0.0%) |
| 75 Years and older | 13 (100.0%) | 0 (0.0%) |
| Total | 800 (88.6%) | 103 (11.4%) |
Health Insurance Coverage by Citizenship Status in Hartrandt
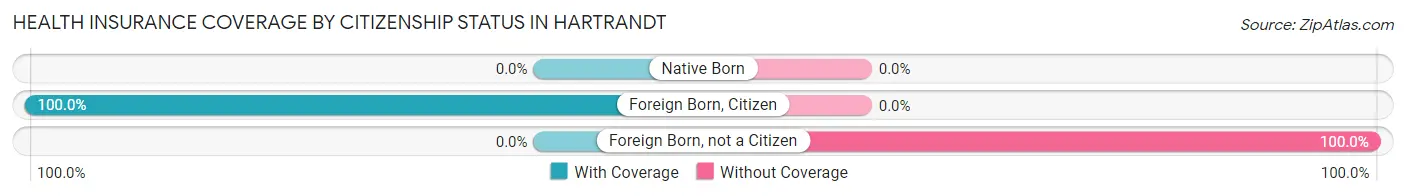
| Citizenship Status | With Coverage | Without Coverage |
| Native Born | 0 (0.0%) | 0 (0.0%) |
| Foreign Born, Citizen | 30 (100.0%) | 0 (0.0%) |
| Foreign Born, not a Citizen | 0 (0.0%) | 32 (100.0%) |
Health Insurance Coverage by Household Income in Hartrandt
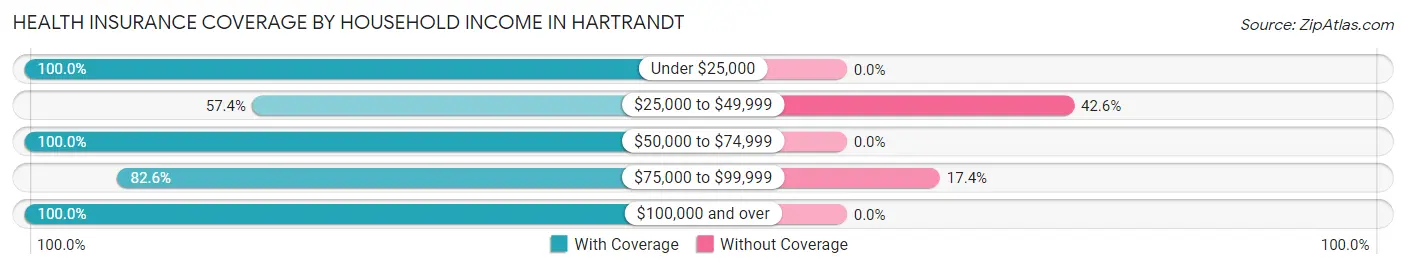
| Household Income | With Coverage | Without Coverage |
| Under $25,000 | 43 (100.0%) | 0 (0.0%) |
| $25,000 to $49,999 | 58 (57.4%) | 43 (42.6%) |
| $50,000 to $74,999 | 187 (100.0%) | 0 (0.0%) |
| $75,000 to $99,999 | 284 (82.6%) | 60 (17.4%) |
| $100,000 and over | 228 (100.0%) | 0 (0.0%) |
Public vs Private Health Insurance Coverage by Age in Hartrandt
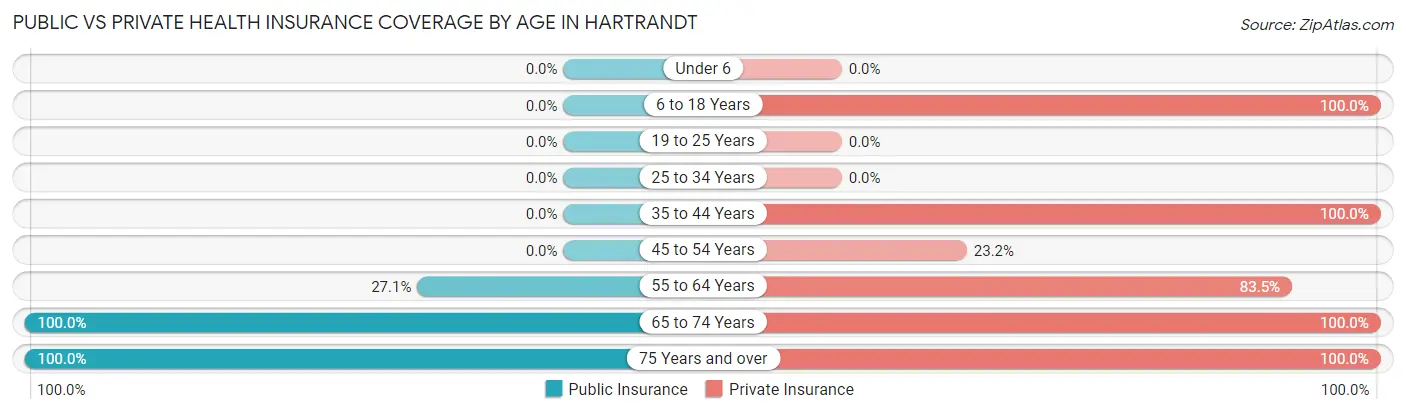
| Age Bracket | Public Insurance | Private Insurance |
| Under 6 | 0 (0.0%) | 0 (0.0%) |
| 6 to 18 Years | 0 (0.0%) | 30 (100.0%) |
| 19 to 25 Years | 0 (0.0%) | 0 (0.0%) |
| 25 to 34 Years | 0 (0.0%) | 0 (0.0%) |
| 35 to 44 Years | 0 (0.0%) | 86 (100.0%) |
| 45 to 54 Years | 0 (0.0%) | 13 (23.2%) |
| 55 to 64 Years | 112 (27.1%) | 345 (83.5%) |
| 65 to 74 Years | 245 (100.0%) | 245 (100.0%) |
| 75 Years and over | 13 (100.0%) | 13 (100.0%) |
| Total | 370 (41.0%) | 732 (81.1%) |
Disability Status by Sex by Age in Hartrandt
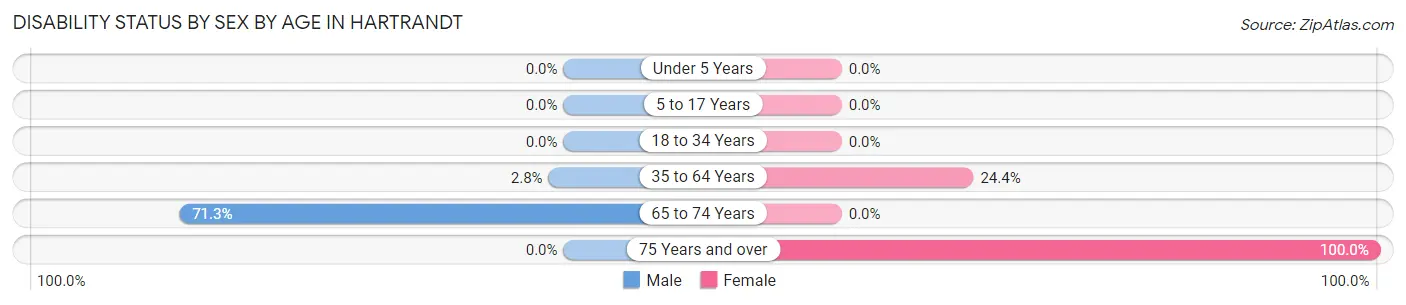
| Age Bracket | Male | Female |
| Under 5 Years | 0 (0.0%) | 0 (0.0%) |
| 5 to 17 Years | 0 (0.0%) | 0 (0.0%) |
| 18 to 34 Years | 0 (0.0%) | 0 (0.0%) |
| 35 to 64 Years | 8 (2.8%) | 65 (24.4%) |
| 65 to 74 Years | 144 (71.3%) | 0 (0.0%) |
| 75 Years and over | 0 (0.0%) | 13 (100.0%) |
Disability Class by Sex by Age in Hartrandt
Disability Class: Hearing Difficulty
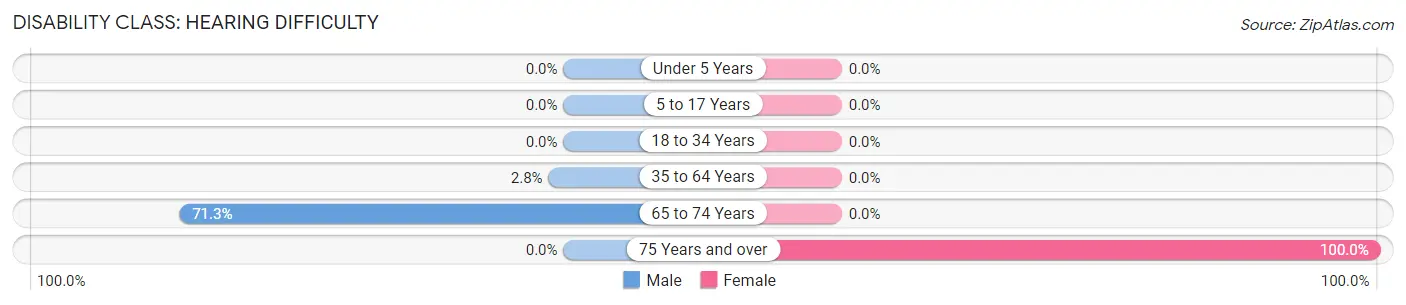
| Age Bracket | Male | Female |
| Under 5 Years | 0 (0.0%) | 0 (0.0%) |
| 5 to 17 Years | 0 (0.0%) | 0 (0.0%) |
| 18 to 34 Years | 0 (0.0%) | 0 (0.0%) |
| 35 to 64 Years | 8 (2.8%) | 0 (0.0%) |
| 65 to 74 Years | 144 (71.3%) | 0 (0.0%) |
| 75 Years and over | 0 (0.0%) | 13 (100.0%) |
Disability Class: Vision Difficulty
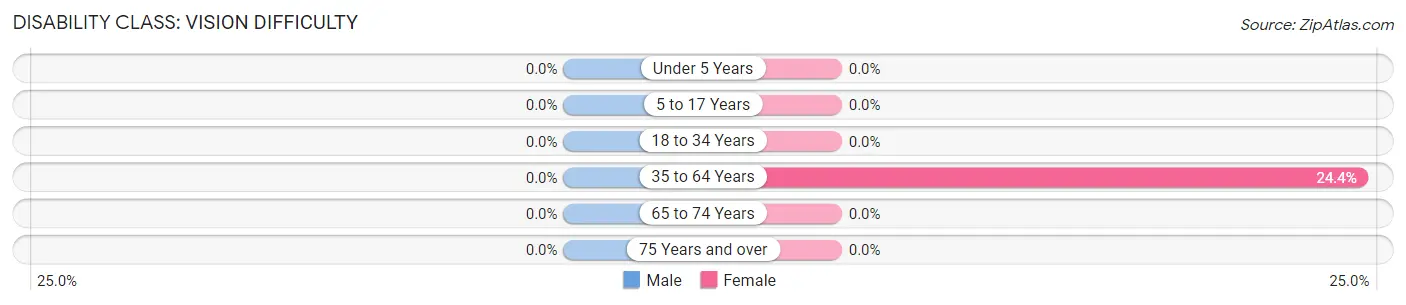
| Age Bracket | Male | Female |
| Under 5 Years | 0 (0.0%) | 0 (0.0%) |
| 5 to 17 Years | 0 (0.0%) | 0 (0.0%) |
| 18 to 34 Years | 0 (0.0%) | 0 (0.0%) |
| 35 to 64 Years | 0 (0.0%) | 65 (24.4%) |
| 65 to 74 Years | 0 (0.0%) | 0 (0.0%) |
| 75 Years and over | 0 (0.0%) | 0 (0.0%) |
Disability Class: Cognitive Difficulty
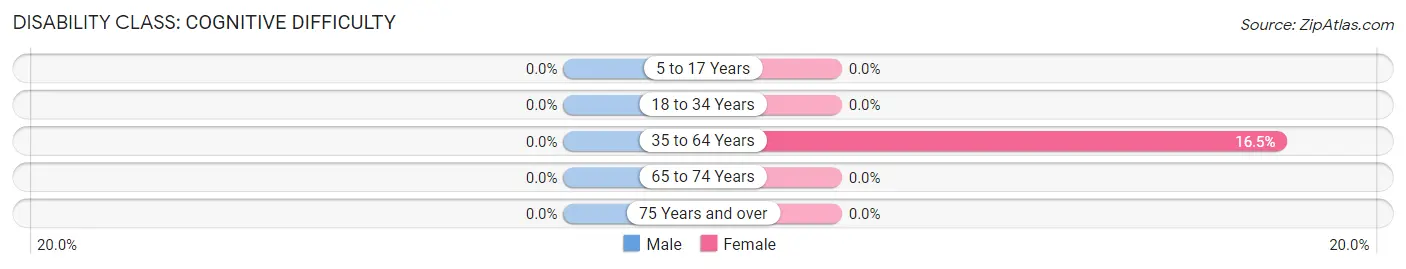
| Age Bracket | Male | Female |
| 5 to 17 Years | 0 (0.0%) | 0 (0.0%) |
| 18 to 34 Years | 0 (0.0%) | 0 (0.0%) |
| 35 to 64 Years | 0 (0.0%) | 44 (16.5%) |
| 65 to 74 Years | 0 (0.0%) | 0 (0.0%) |
| 75 Years and over | 0 (0.0%) | 0 (0.0%) |
Disability Class: Ambulatory Difficulty
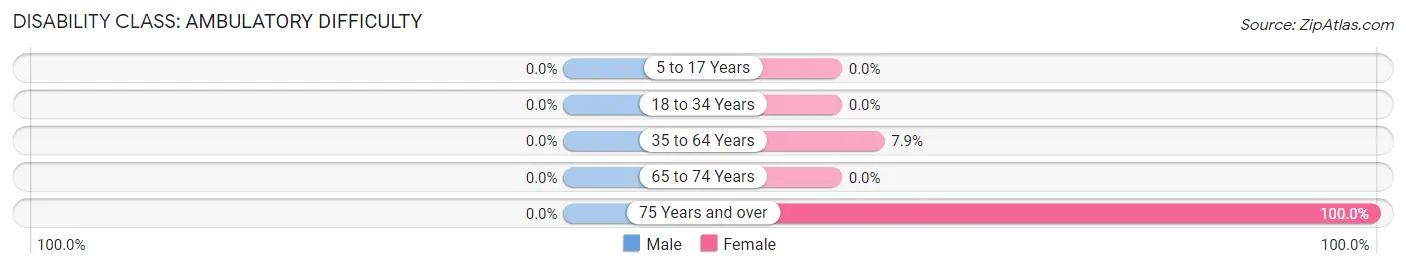
| Age Bracket | Male | Female |
| 5 to 17 Years | 0 (0.0%) | 0 (0.0%) |
| 18 to 34 Years | 0 (0.0%) | 0 (0.0%) |
| 35 to 64 Years | 0 (0.0%) | 21 (7.9%) |
| 65 to 74 Years | 0 (0.0%) | 0 (0.0%) |
| 75 Years and over | 0 (0.0%) | 13 (100.0%) |
Disability Class: Self-Care Difficulty
| Age Bracket | Male | Female |
| 5 to 17 Years | 0 (0.0%) | 0 (0.0%) |
| 18 to 34 Years | 0 (0.0%) | 0 (0.0%) |
| 35 to 64 Years | 0 (0.0%) | 0 (0.0%) |
| 65 to 74 Years | 0 (0.0%) | 0 (0.0%) |
| 75 Years and over | 0 (0.0%) | 0 (0.0%) |
Technology Access in Hartrandt
Computing Device Access in Hartrandt
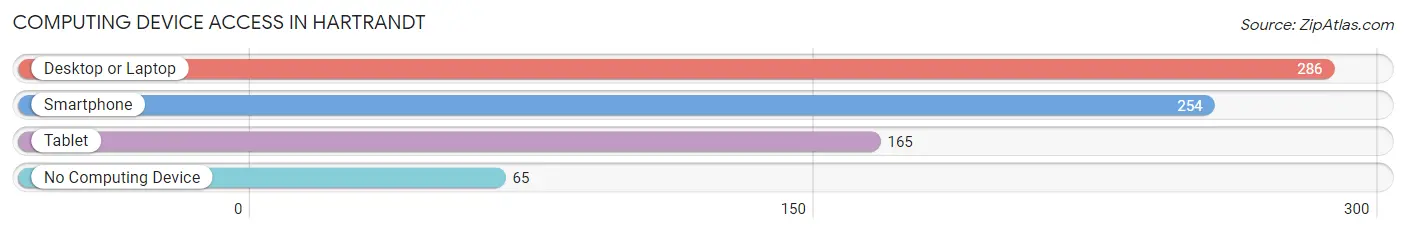
| Device Type | # Households | % Households |
| Desktop or Laptop | 286 | 78.6% |
| Smartphone | 254 | 69.8% |
| Tablet | 165 | 45.3% |
| No Computing Device | 65 | 17.9% |
| Total | 364 | 100.0% |
Internet Access in Hartrandt
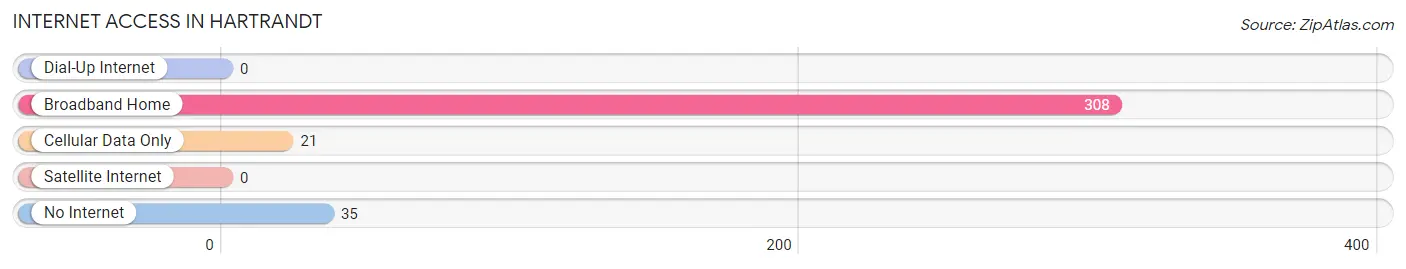
| Internet Type | # Households | % Households |
| Dial-Up Internet | 0 | 0.0% |
| Broadband Home | 308 | 84.6% |
| Cellular Data Only | 21 | 5.8% |
| Satellite Internet | 0 | 0.0% |
| No Internet | 35 | 9.6% |
| Total | 364 | 100.0% |
Hartrandt Summary
Wyoming is a state located in the western United States, bordered by Montana to the north, South Dakota and Nebraska to the east, Colorado to the south, and Utah to the west. It is the tenth largest state in the United States, with an area of 97,814 square miles, and the least populous state in the country, with a population of 582,658 as of the 2020 census. Wyoming is known for its wide open spaces, rugged terrain, and abundant wildlife.
History
The area that is now Wyoming was first inhabited by Native American tribes, including the Arapaho, Cheyenne, Crow, Shoshone, and Ute. The first Europeans to explore the area were French fur trappers in the late 1700s. In 1803, the United States acquired the area as part of the Louisiana Purchase.
In 1868, the Wyoming Territory was created, and in 1890, Wyoming became the 44th state in the Union. The state was named after the Wyoming Valley in Pennsylvania, which was named after the Munsee word for "large prairie meadow."
Geography
Wyoming is located in the western United States, bordered by Montana to the north, South Dakota and Nebraska to the east, Colorado to the south, and Utah to the west. It is the tenth largest state in the United States, with an area of 97,814 square miles.
The landscape of Wyoming is varied, with mountains, plains, and deserts. The Rocky Mountains run through the western part of the state, while the Great Plains cover the eastern part. The highest point in Wyoming is Gannett Peak, at 13,809 feet. The lowest point is the Belle Fourche River, at 3,099 feet.
The climate of Wyoming is semi-arid, with cold winters and hot summers. The average annual temperature is 45°F, and the average annual precipitation is 16 inches.
Economy
Wyoming's economy is largely based on the extraction of natural resources, such as oil, natural gas, coal, and uranium. The state is also a major producer of beef, sheep, and wool. Tourism is also an important part of the economy, with visitors drawn to the state's wide open spaces, rugged terrain, and abundant wildlife.
Demographics
As of the 2020 census, Wyoming had a population of 582,658, making it the least populous state in the United States. The population is spread out across the state, with the largest cities being Cheyenne, Casper, and Laramie.
The racial makeup of Wyoming is 87.3% White, 2.2% Black, 1.2% Native American, 0.7% Asian, 0.1% Pacific Islander, and 8.5% from other races. The median household income is $58,837, and the median age is 38.7 years.
The largest religious group in Wyoming is Christianity, with the majority of the population identifying as Protestant. Other religious groups include Judaism, Islam, Buddhism, and Hinduism.
Common Questions
What is Per Capita Income in Hartrandt?
Per Capita income in Hartrandt is $42,898.
What is the Median Family Income in Hartrandt?
Median Family Income in Hartrandt is $80,906.
What is the Median Household income in Hartrandt?
Median Household Income in Hartrandt is $64,091.
What is Income or Wage Gap in Hartrandt?
Income or Wage Gap in Hartrandt is 77.1%.
Women in Hartrandt earn 22.9 cents for every dollar earned by a man.
What is Inequality or Gini Index in Hartrandt?
Inequality or Gini Index in Hartrandt is 0.29.
What is the Total Population of Hartrandt?
Total Population of Hartrandt is 903.
What is the Total Male Population of Hartrandt?
Total Male Population of Hartrandt is 573.
What is the Total Female Population of Hartrandt?
Total Female Population of Hartrandt is 330.
What is the Ratio of Males per 100 Females in Hartrandt?
There are 173.64 Males per 100 Females in Hartrandt.
What is the Ratio of Females per 100 Males in Hartrandt?
There are 57.59 Females per 100 Males in Hartrandt.
What is the Median Population Age in Hartrandt?
Median Population Age in Hartrandt is 58.2 Years.
What is the Average Family Size in Hartrandt
Average Family Size in Hartrandt is 2.9 People.
What is the Average Household Size in Hartrandt
Average Household Size in Hartrandt is 2.5 People.
How Large is the Labor Force in Hartrandt?
There are 656 People in the Labor Forcein in Hartrandt.
What is the Percentage of People in the Labor Force in Hartrandt?
75.1% of People are in the Labor Force in Hartrandt.
What is the Unemployment Rate in Hartrandt?
Unemployment Rate in Hartrandt is 13.1%.