Burdette, AR Map & Demographics
Burdette Map
Burdette Overview
$41,125
PER CAPITA INCOME
$100,833
AVG FAMILY INCOME
$94,375
AVG HOUSEHOLD INCOME
75.4%
WAGE / INCOME GAP [ % ]
24.6¢/ $1
WAGE / INCOME GAP [ $ ]
0.24
INEQUALITY / GINI INDEX
173
TOTAL POPULATION
88
MALE POPULATION
85
FEMALE POPULATION
103.53
MALES / 100 FEMALES
96.59
FEMALES / 100 MALES
38.1
MEDIAN AGE
3.0
AVG FAMILY SIZE
2.4
AVG HOUSEHOLD SIZE
70
LABOR FORCE [ PEOPLE ]
54.7%
PERCENT IN LABOR FORCE
4.3%
UNEMPLOYMENT RATE
Burdette Area Codes
Income in Burdette
Income Overview in Burdette
Per Capita Income in Burdette is $41,125, while median incomes of families and households are $100,833 and $94,375 respectively.
| Characteristic | Number | Measure |
| Per Capita Income | 173 | $41,125 |
| Median Family Income | 48 | $100,833 |
| Mean Family Income | 48 | $104,569 |
| Median Household Income | 73 | $94,375 |
| Mean Household Income | 73 | $98,579 |
| Income Deficit | 48 | $0 |
| Wage / Income Gap (%) | 173 | 75.45% |
| Wage / Income Gap ($) | 173 | 24.55¢ per $1 |
| Gini / Inequality Index | 173 | 0.24 |
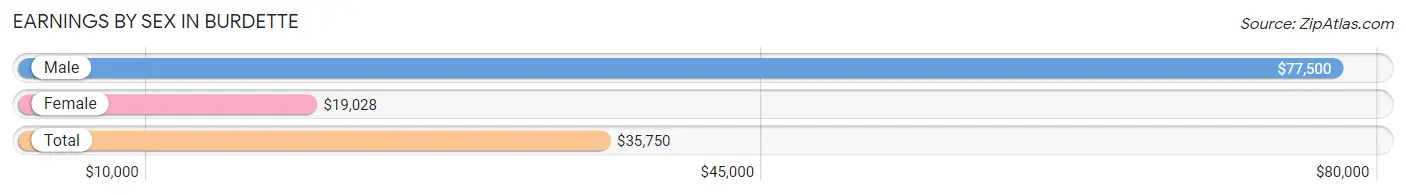
Earnings by Sex in Burdette
Average Earnings in Burdette are $35,750, $77,500 for men and $19,028 for women, a difference of 75.4%.
| Sex | Number | Average Earnings |
| Male | 54 (58.1%) | $77,500 |
| Female | 39 (41.9%) | $19,028 |
| Total | 93 (100.0%) | $35,750 |
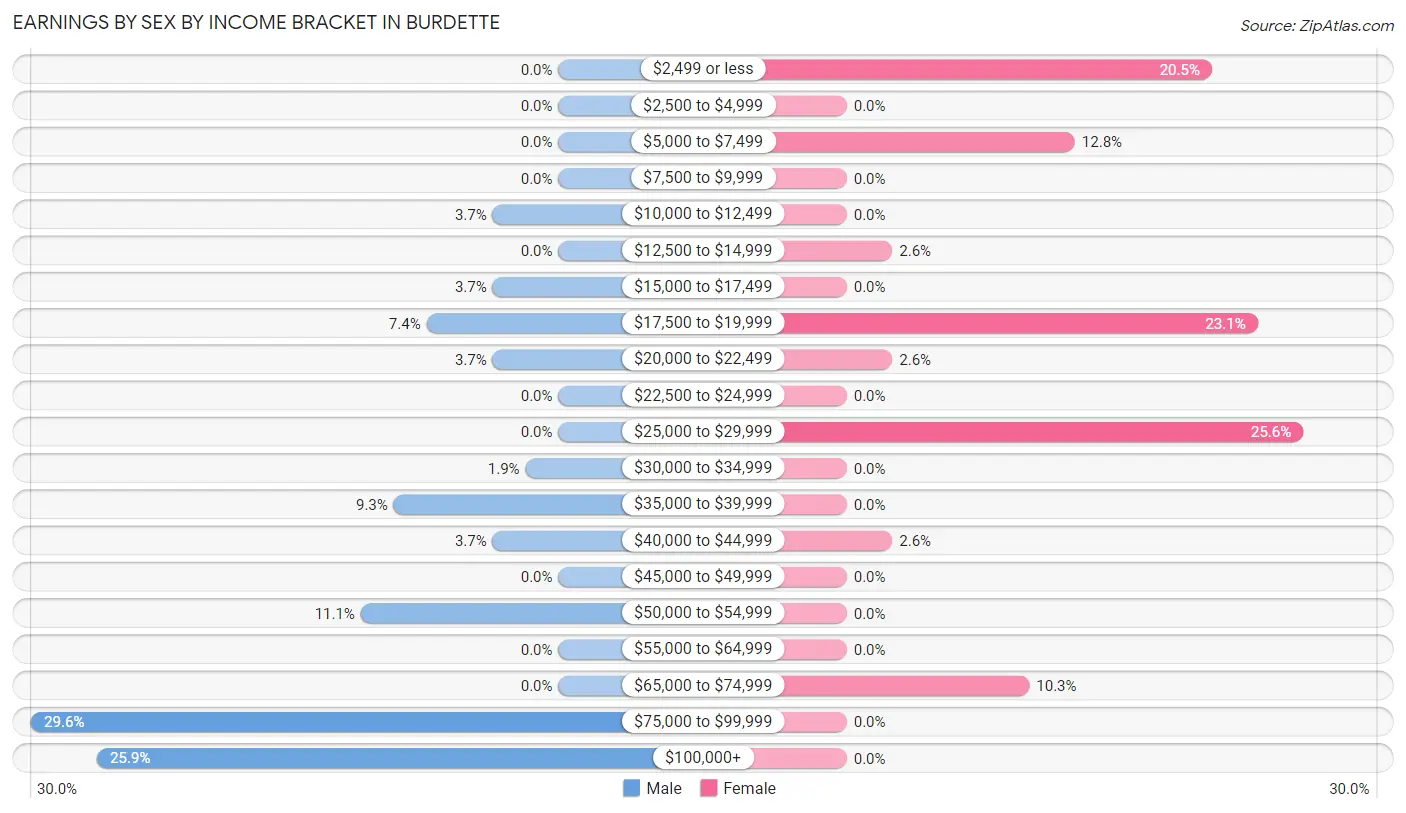
Earnings by Sex by Income Bracket in Burdette
The most common earnings brackets in Burdette are $75,000 to $99,999 for men (16 | 29.6%) and $25,000 to $29,999 for women (10 | 25.6%).
| Income | Male | Female |
| $2,499 or less | 0 (0.0%) | 8 (20.5%) |
| $2,500 to $4,999 | 0 (0.0%) | 0 (0.0%) |
| $5,000 to $7,499 | 0 (0.0%) | 5 (12.8%) |
| $7,500 to $9,999 | 0 (0.0%) | 0 (0.0%) |
| $10,000 to $12,499 | 2 (3.7%) | 0 (0.0%) |
| $12,500 to $14,999 | 0 (0.0%) | 1 (2.6%) |
| $15,000 to $17,499 | 2 (3.7%) | 0 (0.0%) |
| $17,500 to $19,999 | 4 (7.4%) | 9 (23.1%) |
| $20,000 to $22,499 | 2 (3.7%) | 1 (2.6%) |
| $22,500 to $24,999 | 0 (0.0%) | 0 (0.0%) |
| $25,000 to $29,999 | 0 (0.0%) | 10 (25.6%) |
| $30,000 to $34,999 | 1 (1.8%) | 0 (0.0%) |
| $35,000 to $39,999 | 5 (9.3%) | 0 (0.0%) |
| $40,000 to $44,999 | 2 (3.7%) | 1 (2.6%) |
| $45,000 to $49,999 | 0 (0.0%) | 0 (0.0%) |
| $50,000 to $54,999 | 6 (11.1%) | 0 (0.0%) |
| $55,000 to $64,999 | 0 (0.0%) | 0 (0.0%) |
| $65,000 to $74,999 | 0 (0.0%) | 4 (10.3%) |
| $75,000 to $99,999 | 16 (29.6%) | 0 (0.0%) |
| $100,000+ | 14 (25.9%) | 0 (0.0%) |
| Total | 54 (100.0%) | 39 (100.0%) |
Earnings by Sex by Educational Attainment in Burdette
| Educational Attainment | Male Income | Female Income |
| Less than High School | - | - |
| High School Diploma | - | - |
| College or Associate's Degree | - | - |
| Bachelor's Degree | - | - |
| Graduate Degree | - | - |
| Total | $81,250 | $19,583 |
Family Income in Burdette
Family Income Brackets in Burdette
According to the Burdette family income data, there are 14 families falling into the $50,000 to $74,999 income range, which is the most common income bracket and makes up 29.2% of all families.
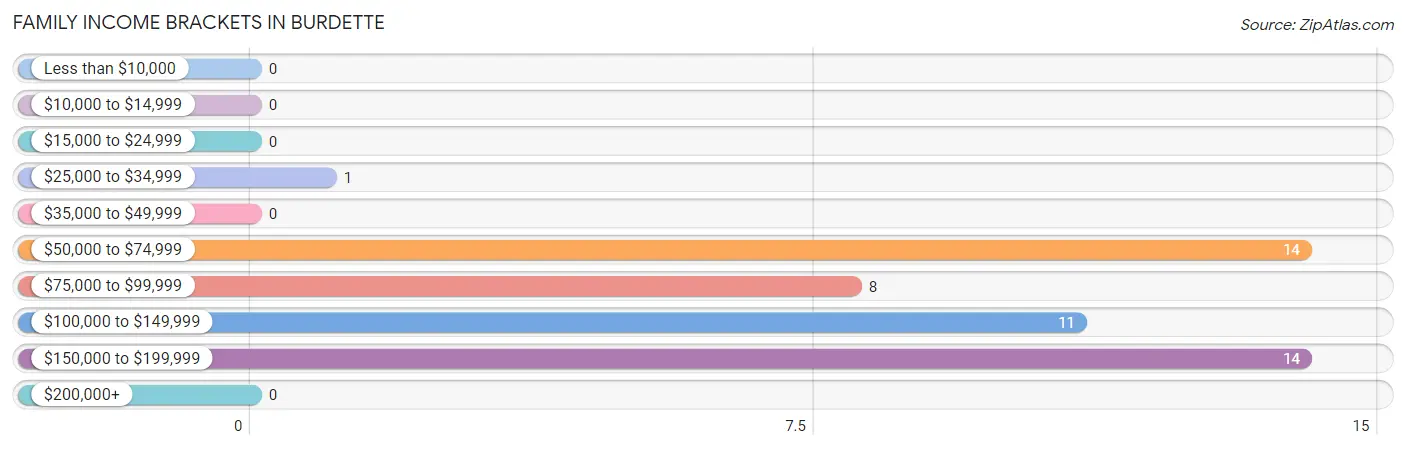
| Income Bracket | # Families | % Families |
| Less than $10,000 | 0 | 0.0% |
| $10,000 to $14,999 | 0 | 0.0% |
| $15,000 to $24,999 | 0 | 0.0% |
| $25,000 to $34,999 | 1 | 2.1% |
| $35,000 to $49,999 | 0 | 0.0% |
| $50,000 to $74,999 | 14 | 29.2% |
| $75,000 to $99,999 | 8 | 16.7% |
| $100,000 to $149,999 | 11 | 22.9% |
| $150,000 to $199,999 | 14 | 29.2% |
| $200,000+ | 0 | 0.0% |
Family Income by Famaliy Size in Burdette
3-person families (9 | 18.8%) account for the highest median family income in Burdette with $93,125 per family, while 2-person families (20 | 41.7%) have the highest median income of $34,062 per family member.
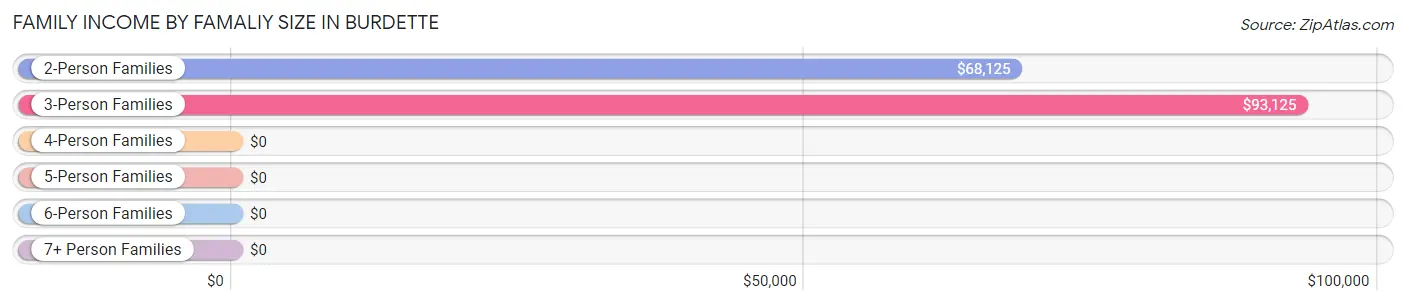
| Income Bracket | # Families | Median Income |
| 2-Person Families | 20 (41.7%) | $68,125 |
| 3-Person Families | 9 (18.8%) | $93,125 |
| 4-Person Families | 4 (8.3%) | $0 |
| 5-Person Families | 14 (29.2%) | $0 |
| 6-Person Families | 0 (0.0%) | $0 |
| 7+ Person Families | 1 (2.1%) | $0 |
| Total | 48 (100.0%) | $100,833 |
Family Income by Number of Earners in Burdette
| Number of Earners | # Families | Median Income |
| No Earners | 0 (0.0%) | $0 |
| 1 Earner | 16 (33.3%) | $0 |
| 2 Earners | 31 (64.6%) | $0 |
| 3+ Earners | 1 (2.1%) | $0 |
| Total | 48 (100.0%) | $100,833 |
Household Income in Burdette
Household Income Brackets in Burdette
With 21 households falling in the category, the $100,000 to $149,999 income range is the most frequent in Burdette, accounting for 28.8% of all households.
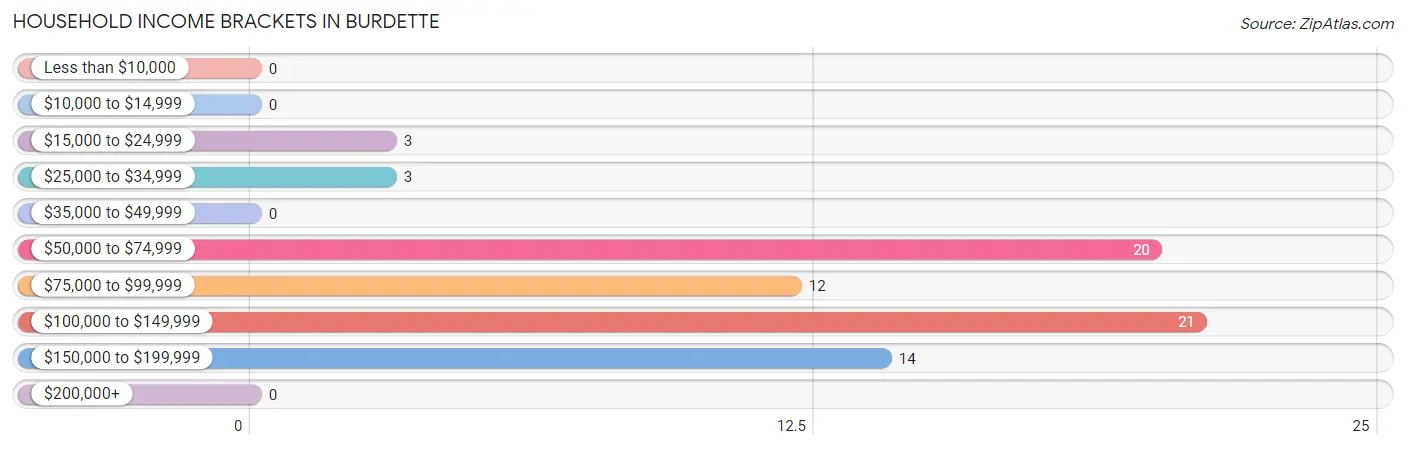
| Income Bracket | # Households | % Households |
| Less than $10,000 | 0 | 0.0% |
| $10,000 to $14,999 | 0 | 0.0% |
| $15,000 to $24,999 | 3 | 4.1% |
| $25,000 to $34,999 | 3 | 4.1% |
| $35,000 to $49,999 | 0 | 0.0% |
| $50,000 to $74,999 | 20 | 27.4% |
| $75,000 to $99,999 | 12 | 16.4% |
| $100,000 to $149,999 | 21 | 28.8% |
| $150,000 to $199,999 | 14 | 19.2% |
| $200,000+ | 0 | 0.0% |
Household Income by Householder Age in Burdette
The median household income in Burdette is $94,375, with the highest median household income of $135,750 found in the 45 to 64 years age bracket for the primary householder. A total of 42 households (57.5%) fall into this category. Meanwhile, the 15 to 24 years age bracket for the primary householder has the lowest median household income of $0, with 1 households (1.4%) in this group.
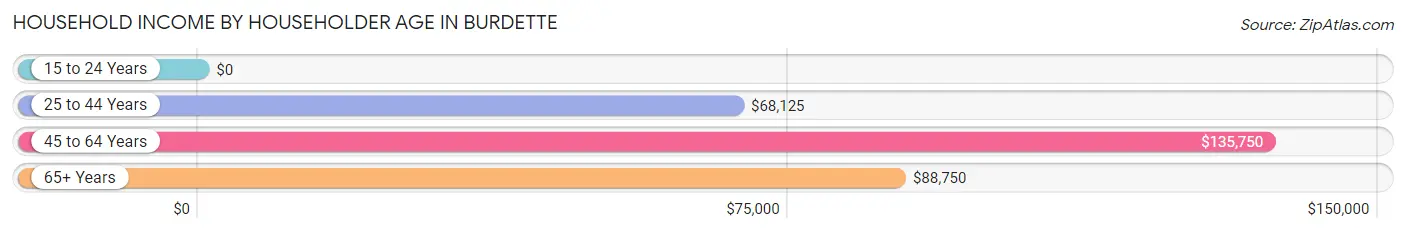
| Income Bracket | # Households | Median Income |
| 15 to 24 Years | 1 (1.4%) | $0 |
| 25 to 44 Years | 12 (16.4%) | $68,125 |
| 45 to 64 Years | 42 (57.5%) | $135,750 |
| 65+ Years | 18 (24.7%) | $88,750 |
| Total | 73 (100.0%) | $94,375 |
Poverty in Burdette
Income Below Poverty by Sex and Age in Burdette
With 1.1% poverty level for males and 1.2% for females among the residents of Burdette, 45 to 54 year old males and 45 to 54 year old females are the most vulnerable to poverty, with 1 males (4.3%) and 1 females (10.0%) in their respective age groups living below the poverty level.
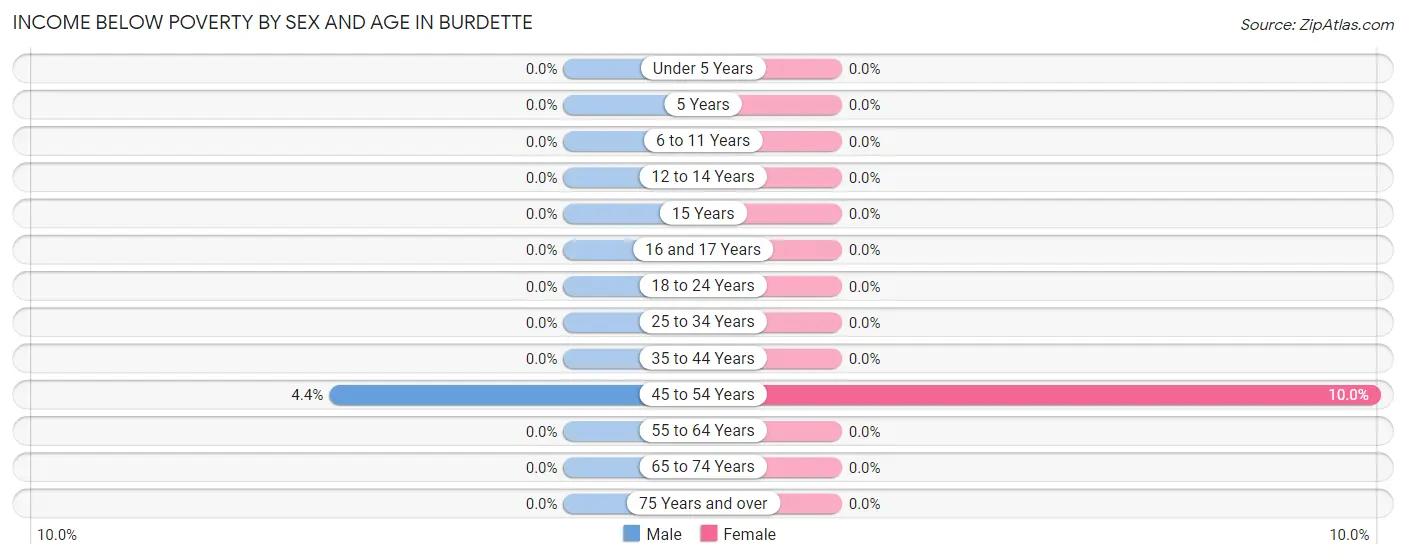
| Age Bracket | Male | Female |
| Under 5 Years | 0 (0.0%) | 0 (0.0%) |
| 5 Years | 0 (0.0%) | 0 (0.0%) |
| 6 to 11 Years | 0 (0.0%) | 0 (0.0%) |
| 12 to 14 Years | 0 (0.0%) | 0 (0.0%) |
| 15 Years | 0 (0.0%) | 0 (0.0%) |
| 16 and 17 Years | 0 (0.0%) | 0 (0.0%) |
| 18 to 24 Years | 0 (0.0%) | 0 (0.0%) |
| 25 to 34 Years | 0 (0.0%) | 0 (0.0%) |
| 35 to 44 Years | 0 (0.0%) | 0 (0.0%) |
| 45 to 54 Years | 1 (4.3%) | 1 (10.0%) |
| 55 to 64 Years | 0 (0.0%) | 0 (0.0%) |
| 65 to 74 Years | 0 (0.0%) | 0 (0.0%) |
| 75 Years and over | 0 (0.0%) | 0 (0.0%) |
| Total | 1 (1.1%) | 1 (1.2%) |
Income Above Poverty by Sex and Age in Burdette
According to the poverty statistics in Burdette, males aged under 5 years and females aged 6 to 11 years are the age groups that are most secure financially, with 100.0% of males and 100.0% of females in these age groups living above the poverty line.
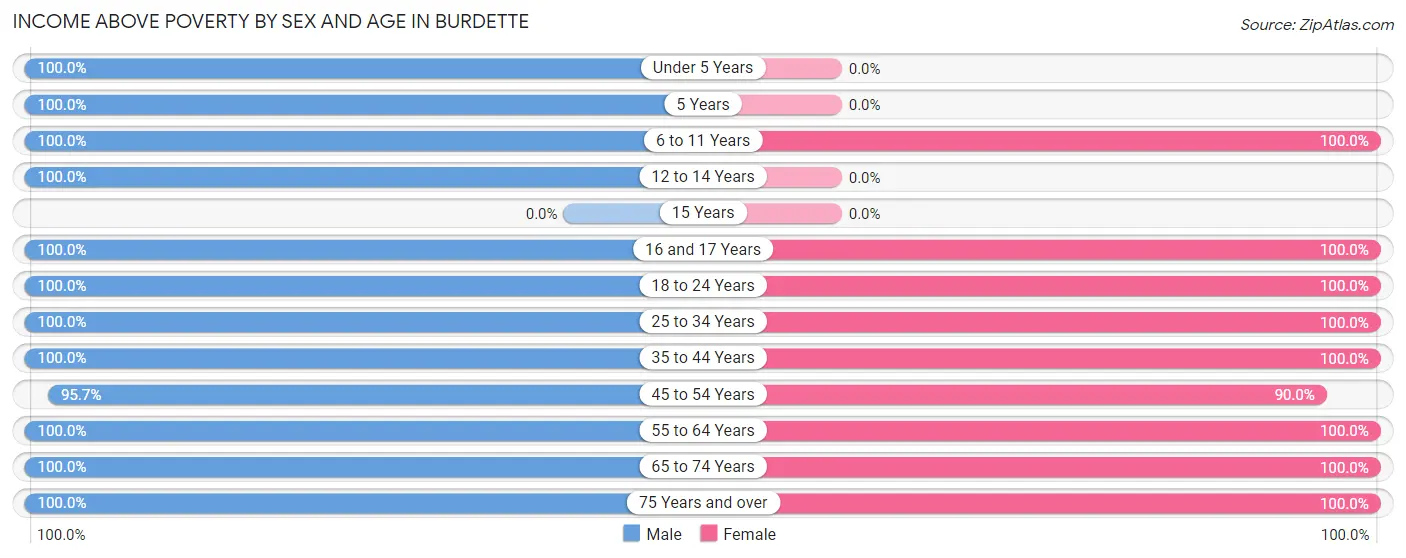
| Age Bracket | Male | Female |
| Under 5 Years | 6 (100.0%) | 0 (0.0%) |
| 5 Years | 9 (100.0%) | 0 (0.0%) |
| 6 to 11 Years | 6 (100.0%) | 20 (100.0%) |
| 12 to 14 Years | 4 (100.0%) | 0 (0.0%) |
| 15 Years | 0 (0.0%) | 0 (0.0%) |
| 16 and 17 Years | 2 (100.0%) | 6 (100.0%) |
| 18 to 24 Years | 13 (100.0%) | 1 (100.0%) |
| 25 to 34 Years | 3 (100.0%) | 16 (100.0%) |
| 35 to 44 Years | 3 (100.0%) | 4 (100.0%) |
| 45 to 54 Years | 22 (95.7%) | 9 (90.0%) |
| 55 to 64 Years | 8 (100.0%) | 16 (100.0%) |
| 65 to 74 Years | 7 (100.0%) | 4 (100.0%) |
| 75 Years and over | 4 (100.0%) | 8 (100.0%) |
| Total | 87 (98.9%) | 84 (98.8%) |
Income Below Poverty Among Married-Couple Families in Burdette
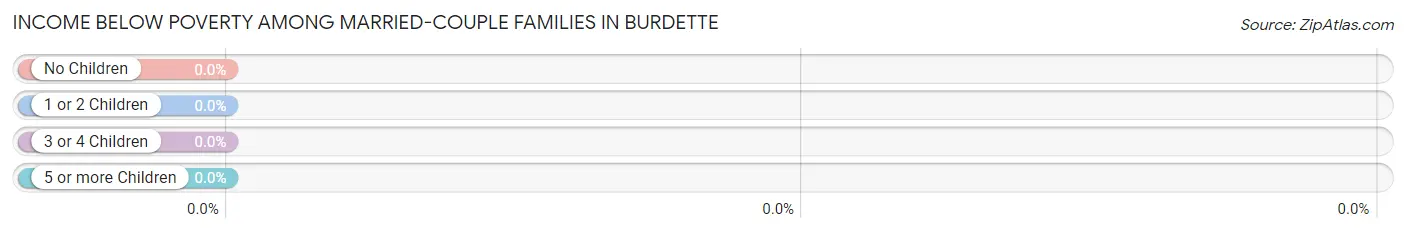
| Children | Above Poverty | Below Poverty |
| No Children | 16 (100.0%) | 0 (0.0%) |
| 1 or 2 Children | 12 (100.0%) | 0 (0.0%) |
| 3 or 4 Children | 14 (100.0%) | 0 (0.0%) |
| 5 or more Children | 0 (0.0%) | 0 (0.0%) |
| Total | 42 (100.0%) | 0 (0.0%) |
Income Below Poverty Among Single-Parent Households in Burdette
| Children | Single Father | Single Mother |
| No Children | 0 (0.0%) | 0 (0.0%) |
| 1 or 2 Children | 0 (0.0%) | 0 (0.0%) |
| 3 or 4 Children | 0 (0.0%) | 0 (0.0%) |
| 5 or more Children | 0 (0.0%) | 0 (0.0%) |
| Total | 0 (0.0%) | 0 (0.0%) |
Income Below Poverty Among Married-Couple vs Single-Parent Households in Burdette
| Children | Married-Couple Families | Single-Parent Households |
| No Children | 0 (0.0%) | 0 (0.0%) |
| 1 or 2 Children | 0 (0.0%) | 0 (0.0%) |
| 3 or 4 Children | 0 (0.0%) | 0 (0.0%) |
| 5 or more Children | 0 (0.0%) | 0 (0.0%) |
| Total | 0 (0.0%) | 0 (0.0%) |
Race in Burdette
The most populous races in Burdette are White / Caucasian (150 | 86.7%), Black / African American (16 | 9.2%), and Hispanic or Latino (4 | 2.3%).
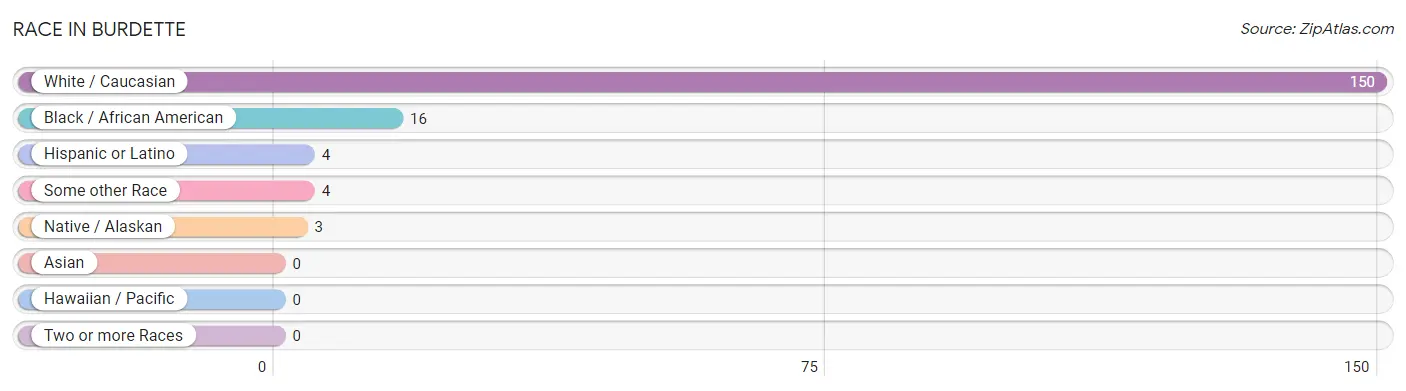
| Race | # Population | % Population |
| Asian | 0 | 0.0% |
| Black / African American | 16 | 9.2% |
| Hawaiian / Pacific | 0 | 0.0% |
| Hispanic or Latino | 4 | 2.3% |
| Native / Alaskan | 3 | 1.7% |
| White / Caucasian | 150 | 86.7% |
| Two or more Races | 0 | 0.0% |
| Some other Race | 4 | 2.3% |
| Total | 173 | 100.0% |
Ancestry in Burdette
The most populous ancestries reported in Burdette are German (46 | 26.6%), Irish (40 | 23.1%), Welsh (31 | 17.9%), American (27 | 15.6%), and English (10 | 5.8%), together accounting for 89.0% of all Burdette residents.
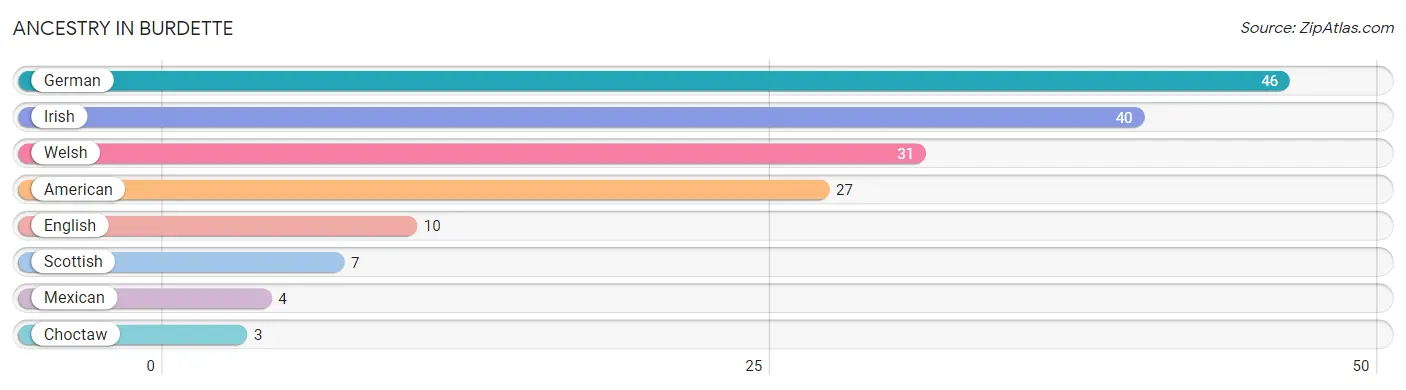
| Ancestry | # Population | % Population |
| American | 27 | 15.6% |
| Choctaw | 3 | 1.7% |
| English | 10 | 5.8% |
| German | 46 | 26.6% |
| Irish | 40 | 23.1% |
| Mexican | 4 | 2.3% |
| Scottish | 7 | 4.1% |
| Welsh | 31 | 17.9% | View All 8 Rows |
Immigrants in Burdette

| Immigration Origin | # Population | % Population | View All 0 Rows |
Sex and Age in Burdette
Sex and Age in Burdette
The most populous age groups in Burdette are 45 to 49 Years (21 | 23.9%) for men and 60 to 64 Years (16 | 18.8%) for women.
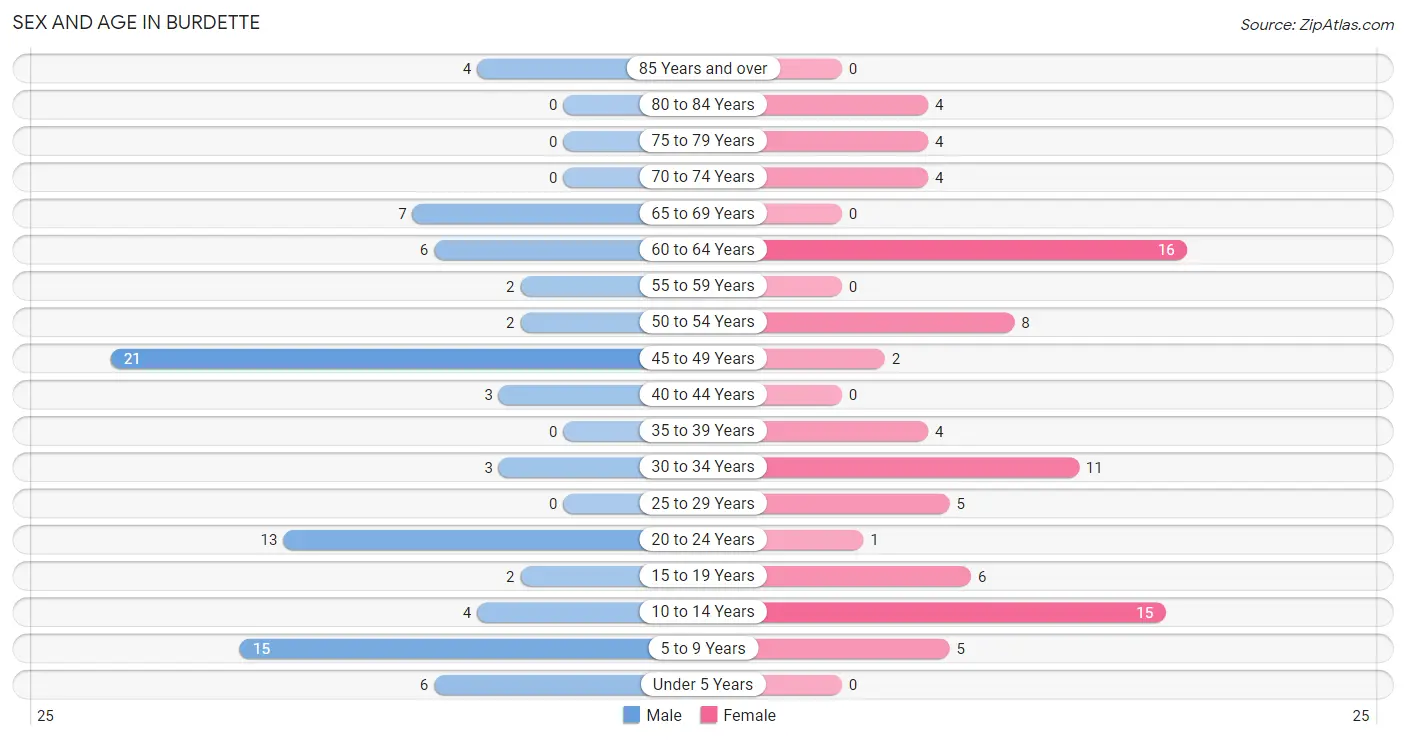
| Age Bracket | Male | Female |
| Under 5 Years | 6 (6.8%) | 0 (0.0%) |
| 5 to 9 Years | 15 (17.1%) | 5 (5.9%) |
| 10 to 14 Years | 4 (4.5%) | 15 (17.6%) |
| 15 to 19 Years | 2 (2.3%) | 6 (7.1%) |
| 20 to 24 Years | 13 (14.8%) | 1 (1.2%) |
| 25 to 29 Years | 0 (0.0%) | 5 (5.9%) |
| 30 to 34 Years | 3 (3.4%) | 11 (12.9%) |
| 35 to 39 Years | 0 (0.0%) | 4 (4.7%) |
| 40 to 44 Years | 3 (3.4%) | 0 (0.0%) |
| 45 to 49 Years | 21 (23.9%) | 2 (2.4%) |
| 50 to 54 Years | 2 (2.3%) | 8 (9.4%) |
| 55 to 59 Years | 2 (2.3%) | 0 (0.0%) |
| 60 to 64 Years | 6 (6.8%) | 16 (18.8%) |
| 65 to 69 Years | 7 (8.0%) | 0 (0.0%) |
| 70 to 74 Years | 0 (0.0%) | 4 (4.7%) |
| 75 to 79 Years | 0 (0.0%) | 4 (4.7%) |
| 80 to 84 Years | 0 (0.0%) | 4 (4.7%) |
| 85 Years and over | 4 (4.5%) | 0 (0.0%) |
| Total | 88 (100.0%) | 85 (100.0%) |
Families and Households in Burdette
Median Family Size in Burdette
The median family size in Burdette is 3.04 persons per family, with single male/father families (1 | 2.1%) accounting for the largest median family size of 4 persons per family. On the other hand, married-couple families (42 | 87.5%) represent the smallest median family size with 3.00 persons per family.
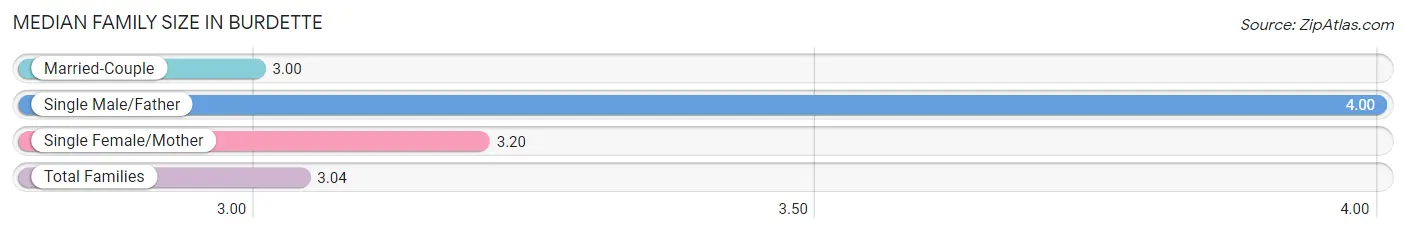
| Family Type | # Families | Family Size |
| Married-Couple | 42 (87.5%) | 3.00 |
| Single Male/Father | 1 (2.1%) | 4.00 |
| Single Female/Mother | 5 (10.4%) | 3.20 |
| Total Families | 48 (100.0%) | 3.04 |
Median Household Size in Burdette
The median household size in Burdette is 2.37 persons per household, with single male/father households (1 | 1.4%) accounting for the largest median household size of 4 persons per household. non-family households (25 | 34.3%) represent the smallest median household size with 1.04 persons per household.
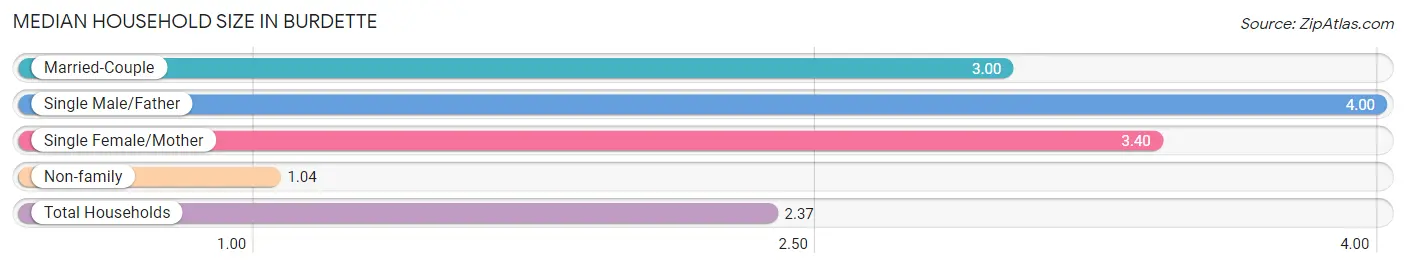
| Household Type | # Households | Household Size |
| Married-Couple | 42 (57.5%) | 3.00 |
| Single Male/Father | 1 (1.4%) | 4.00 |
| Single Female/Mother | 5 (6.9%) | 3.40 |
| Non-family | 25 (34.3%) | 1.04 |
| Total Households | 73 (100.0%) | 2.37 |
Household Size by Marriage Status in Burdette
Out of a total of 73 households in Burdette, 48 (65.7%) are family households, while 25 (34.3%) are nonfamily households. The most numerous type of family households are 2-person households, comprising 20, and the most common type of nonfamily households are 1-person households, comprising 23.
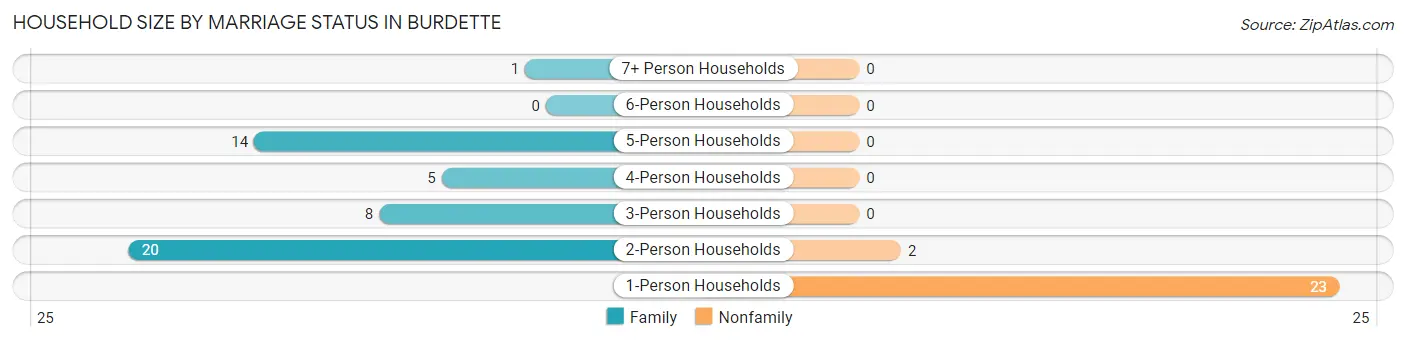
| Household Size | Family Households | Nonfamily Households |
| 1-Person Households | - | 23 (31.5%) |
| 2-Person Households | 20 (27.4%) | 2 (2.7%) |
| 3-Person Households | 8 (11.0%) | 0 (0.0%) |
| 4-Person Households | 5 (6.9%) | 0 (0.0%) |
| 5-Person Households | 14 (19.2%) | 0 (0.0%) |
| 6-Person Households | 0 (0.0%) | 0 (0.0%) |
| 7+ Person Households | 1 (1.4%) | 0 (0.0%) |
| Total | 48 (65.7%) | 25 (34.3%) |
Female Fertility in Burdette
Fertility by Age in Burdette
| Age Bracket | Women with Births | Births / 1,000 Women |
| 15 to 19 years | 0 (0.0%) | 0.0 |
| 20 to 34 years | 0 (0.0%) | 0.0 |
| 35 to 50 years | 0 (0.0%) | 0.0 |
| Total | 0 (0.0%) | 0.0 |
Fertility by Age by Marriage Status in Burdette
| Age Bracket | Married | Unmarried |
| 15 to 19 years | 0 (0.0%) | 0 (0.0%) |
| 20 to 34 years | 0 (0.0%) | 0 (0.0%) |
| 35 to 50 years | 0 (0.0%) | 0 (0.0%) |
| Total | 0 (0.0%) | 0 (0.0%) |
Fertility by Education in Burdette
| Educational Attainment | Women with Births | Births / 1,000 Women |
| Less than High School | 0 (0.0%) | 0.0 |
| High School Diploma | 0 (0.0%) | 0.0 |
| College or Associate's Degree | 0 (0.0%) | 0.0 |
| Bachelor's Degree | 0 (0.0%) | 0.0 |
| Graduate Degree | 0 (0.0%) | 0.0 |
| Total | 0 (0.0%) | 0.0 |
Fertility by Education by Marriage Status in Burdette
| Educational Attainment | Married | Unmarried |
| Less than High School | 0 (0.0%) | 0 (0.0%) |
| High School Diploma | 0 (0.0%) | 0 (0.0%) |
| College or Associate's Degree | 0 (0.0%) | 0 (0.0%) |
| Bachelor's Degree | 0 (0.0%) | 0 (0.0%) |
| Graduate Degree | 0 (0.0%) | 0 (0.0%) |
| Total | 0 (0.0%) | 0 (0.0%) |
Employment Characteristics in Burdette
Employment by Class of Employer in Burdette
Among the 62 employed individuals in Burdette, private company employees (53 | 85.5%), local government employees (6 | 9.7%), and self-employed (not incorporated) (3 | 4.8%) make up the most common classes of employment.
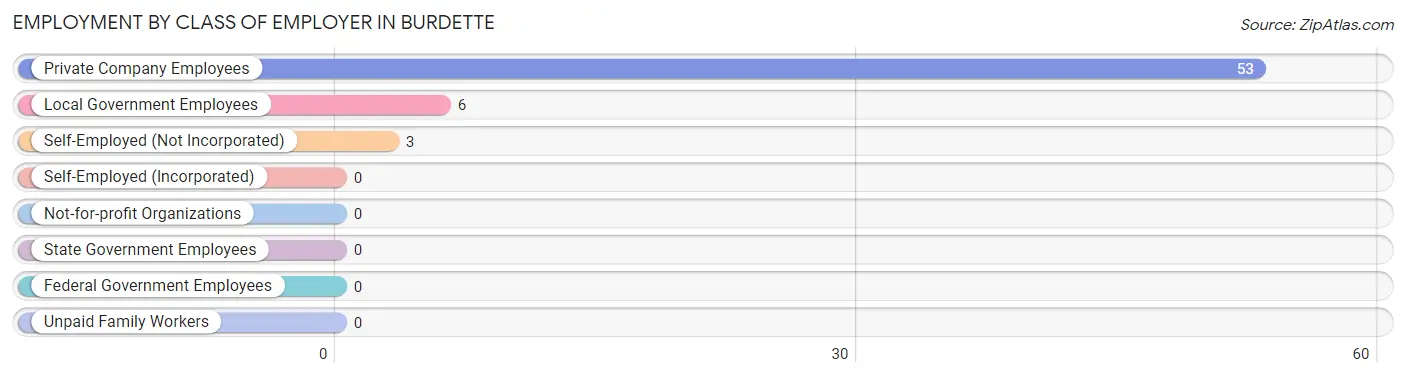
| Employer Class | # Employees | % Employees |
| Private Company Employees | 53 | 85.5% |
| Self-Employed (Incorporated) | 0 | 0.0% |
| Self-Employed (Not Incorporated) | 3 | 4.8% |
| Not-for-profit Organizations | 0 | 0.0% |
| Local Government Employees | 6 | 9.7% |
| State Government Employees | 0 | 0.0% |
| Federal Government Employees | 0 | 0.0% |
| Unpaid Family Workers | 0 | 0.0% |
| Total | 62 | 100.0% |
Employment Status by Age in Burdette
According to the labor force statistics for Burdette, out of the total population over 16 years of age (128), 54.7% or 70 individuals are in the labor force, with 4.3% or 3 of them unemployed. The age group with the highest labor force participation rate is 25 to 29 years, with 100.0% or 5 individuals in the labor force. Within the labor force, the 35 to 44 years age range has the highest percentage of unemployed individuals, with 33.3% or 2 of them being unemployed.
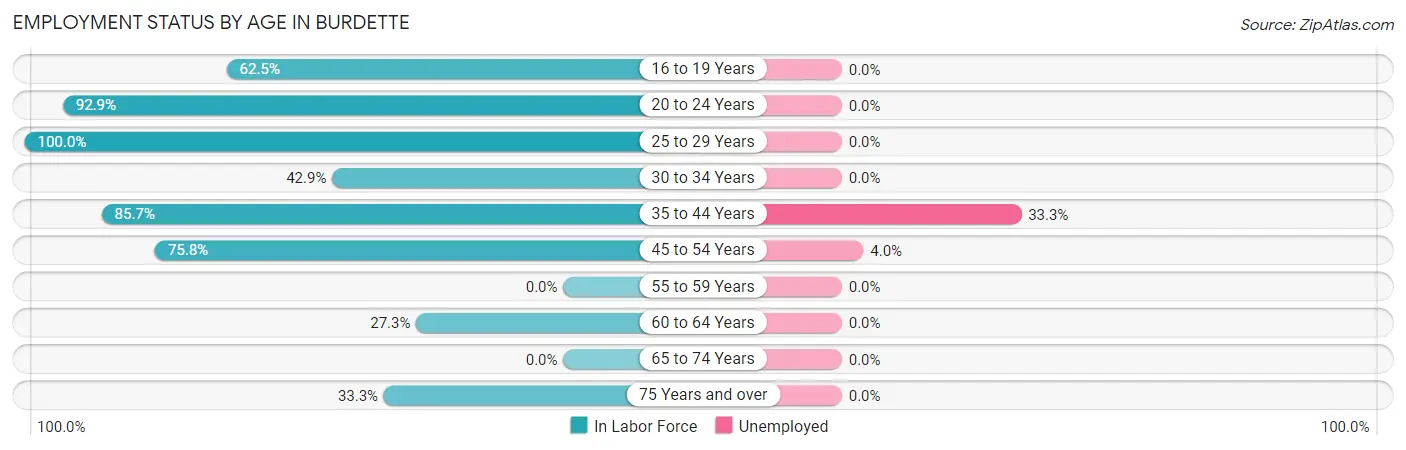
| Age Bracket | In Labor Force | Unemployed |
| 16 to 19 Years | 5 (62.5%) | 0 (0.0%) |
| 20 to 24 Years | 13 (92.9%) | 0 (0.0%) |
| 25 to 29 Years | 5 (100.0%) | 0 (0.0%) |
| 30 to 34 Years | 6 (42.9%) | 0 (0.0%) |
| 35 to 44 Years | 6 (85.7%) | 2 (33.3%) |
| 45 to 54 Years | 25 (75.8%) | 1 (4.0%) |
| 55 to 59 Years | 0 (0.0%) | 0 (0.0%) |
| 60 to 64 Years | 6 (27.3%) | 0 (0.0%) |
| 65 to 74 Years | 0 (0.0%) | 0 (0.0%) |
| 75 Years and over | 4 (33.3%) | 0 (0.0%) |
| Total | 70 (54.7%) | 3 (4.3%) |
Employment Status by Educational Attainment in Burdette
According to labor force statistics for Burdette, 57.8% of individuals (48) out of the total population between 25 and 64 years of age (83) are in the labor force, with 6.3% or 3 of them being unemployed. The group with the highest labor force participation rate are those with the educational attainment of less than high school, with 100.0% or 20 individuals in the labor force. Within the labor force, individuals with high school diploma education have the highest percentage of unemployment, with 16.7% or 2 of them being unemployed.
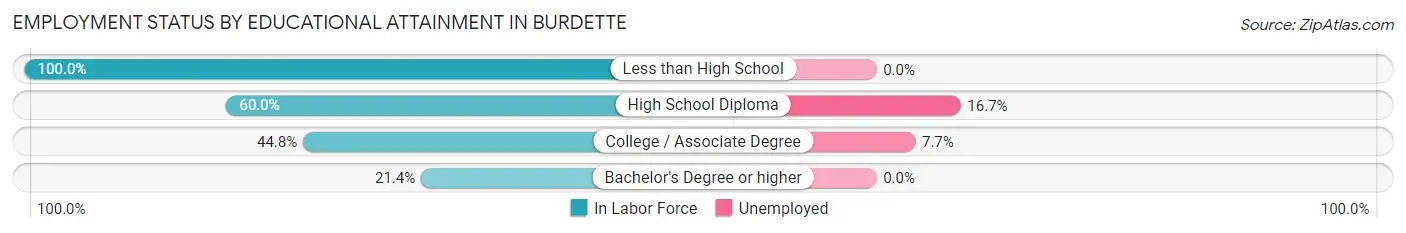
| Educational Attainment | In Labor Force | Unemployed |
| Less than High School | 20 (100.0%) | 0 (0.0%) |
| High School Diploma | 12 (60.0%) | 3 (16.7%) |
| College / Associate Degree | 13 (44.8%) | 2 (7.7%) |
| Bachelor's Degree or higher | 3 (21.4%) | 0 (0.0%) |
| Total | 48 (57.8%) | 5 (6.3%) |
Employment Occupations by Sex in Burdette
Management, Business, Science and Arts Occupations
The most common Management, Business, Science and Arts occupations in Burdette are Health Diagnosing & Treating (5 | 7.5%), Computers, Engineering & Science (4 | 6.0%), Architecture & Engineering (4 | 6.0%), and Management (3 | 4.5%).
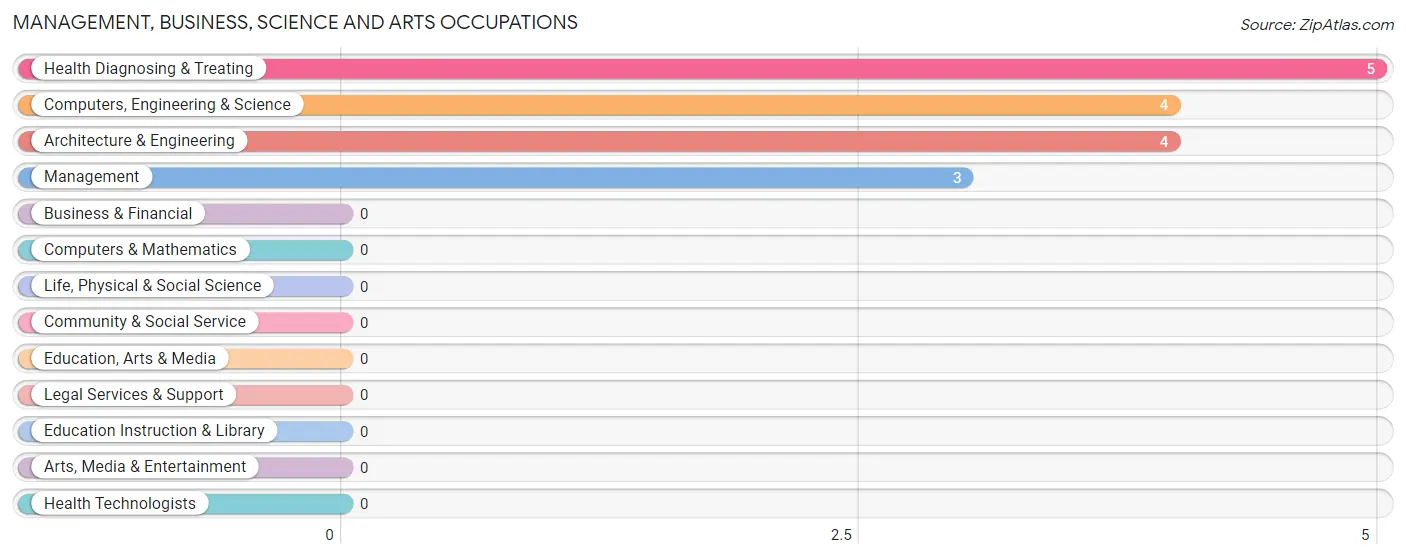
Management, Business, Science and Arts Occupations by Sex
Within the Management, Business, Science and Arts occupations in Burdette, the most male-oriented occupations are Computers, Engineering & Science (100.0%), Architecture & Engineering (100.0%), and Management (66.7%), while the most female-oriented occupations are Health Diagnosing & Treating (100.0%), and Management (33.3%).
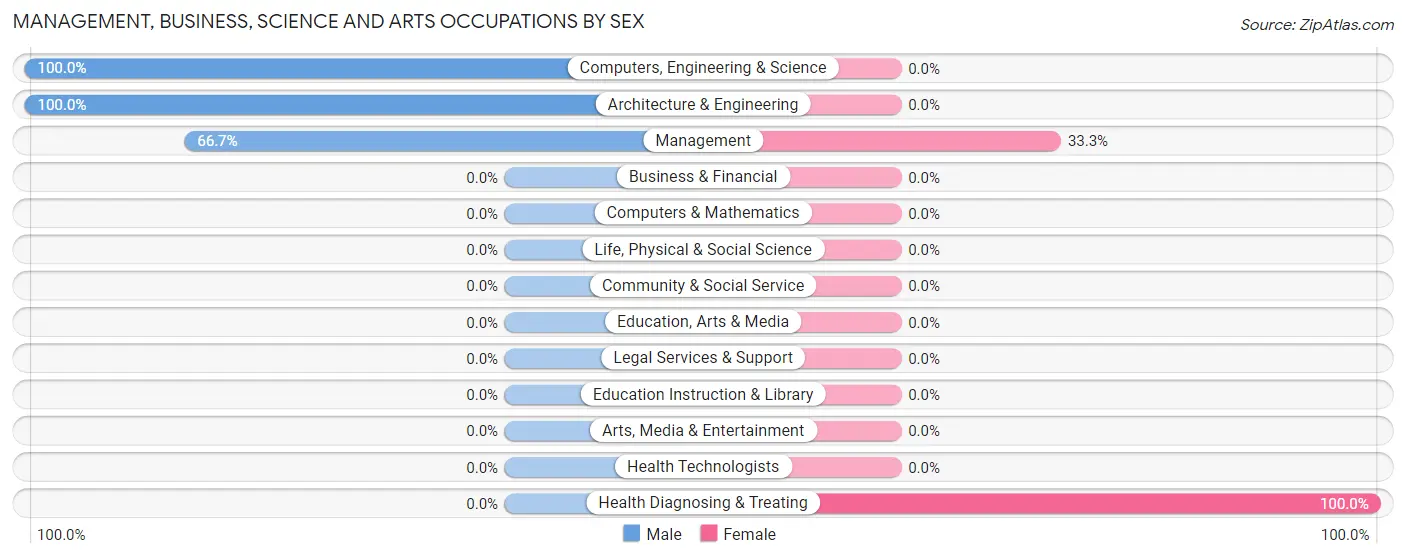
| Occupation | Male | Female |
| Management | 2 (66.7%) | 1 (33.3%) |
| Business & Financial | 0 (0.0%) | 0 (0.0%) |
| Computers, Engineering & Science | 4 (100.0%) | 0 (0.0%) |
| Computers & Mathematics | 0 (0.0%) | 0 (0.0%) |
| Architecture & Engineering | 4 (100.0%) | 0 (0.0%) |
| Life, Physical & Social Science | 0 (0.0%) | 0 (0.0%) |
| Community & Social Service | 0 (0.0%) | 0 (0.0%) |
| Education, Arts & Media | 0 (0.0%) | 0 (0.0%) |
| Legal Services & Support | 0 (0.0%) | 0 (0.0%) |
| Education Instruction & Library | 0 (0.0%) | 0 (0.0%) |
| Arts, Media & Entertainment | 0 (0.0%) | 0 (0.0%) |
| Health Diagnosing & Treating | 0 (0.0%) | 5 (100.0%) |
| Health Technologists | 0 (0.0%) | 0 (0.0%) |
| Total (Category) | 6 (50.0%) | 6 (50.0%) |
| Total (Overall) | 47 (70.2%) | 20 (29.8%) |
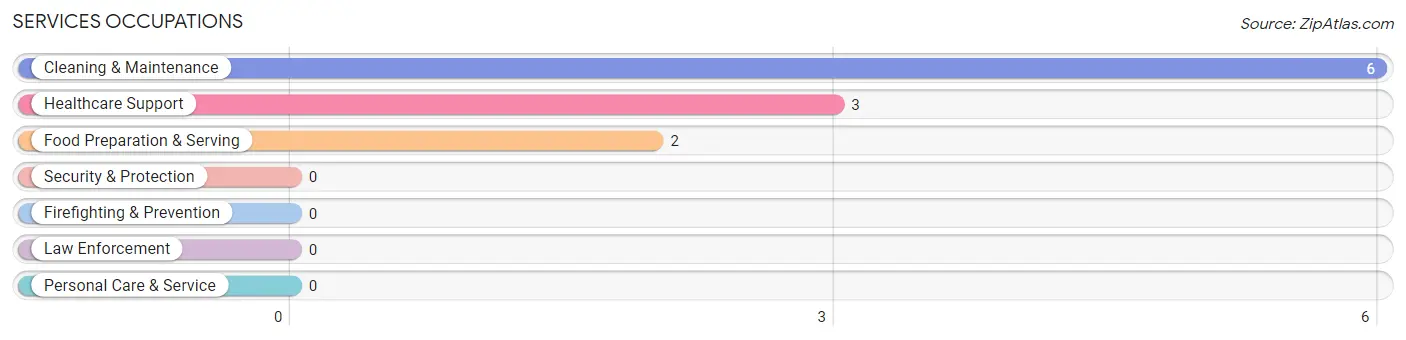
Services Occupations
The most common Services occupations in Burdette are Cleaning & Maintenance (6 | 9.0%), Healthcare Support (3 | 4.5%), and Food Preparation & Serving (2 | 3.0%).
Services Occupations by Sex
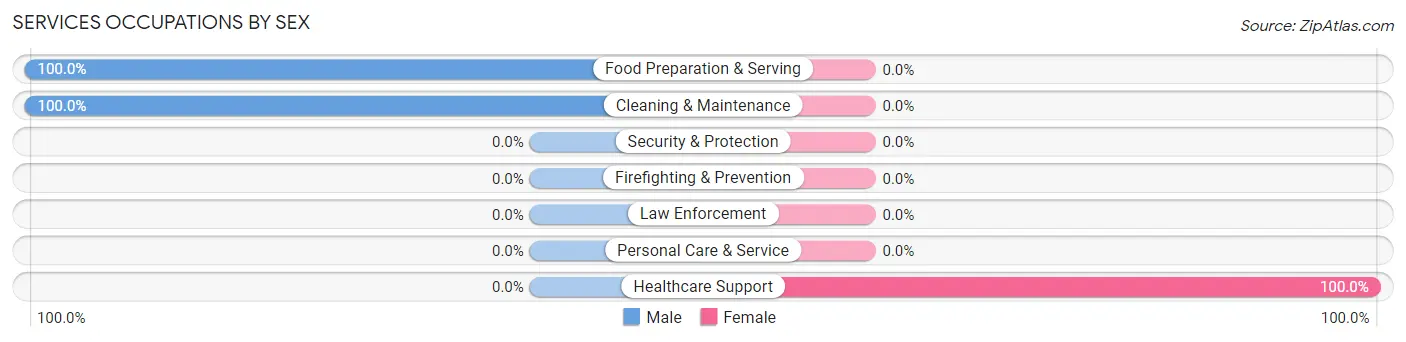
| Occupation | Male | Female |
| Healthcare Support | 0 (0.0%) | 3 (100.0%) |
| Security & Protection | 0 (0.0%) | 0 (0.0%) |
| Firefighting & Prevention | 0 (0.0%) | 0 (0.0%) |
| Law Enforcement | 0 (0.0%) | 0 (0.0%) |
| Food Preparation & Serving | 2 (100.0%) | 0 (0.0%) |
| Cleaning & Maintenance | 6 (100.0%) | 0 (0.0%) |
| Personal Care & Service | 0 (0.0%) | 0 (0.0%) |
| Total (Category) | 8 (72.7%) | 3 (27.3%) |
| Total (Overall) | 47 (70.2%) | 20 (29.8%) |
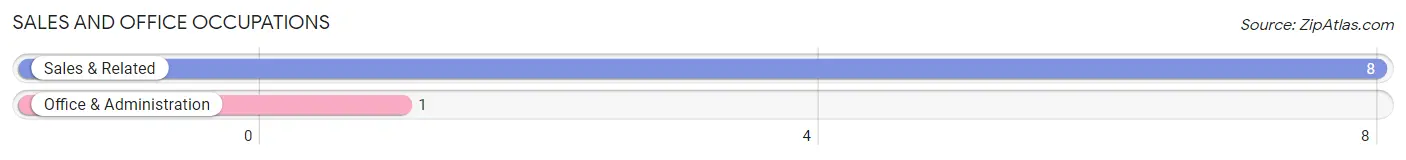
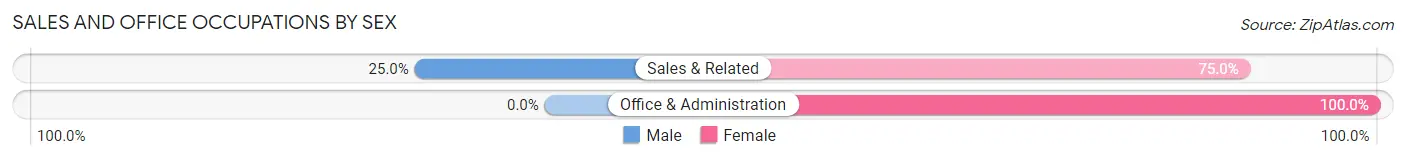
Sales and Office Occupations
The most common Sales and Office occupations in Burdette are Sales & Related (8 | 11.9%), and Office & Administration (1 | 1.5%).
Sales and Office Occupations by Sex
| Occupation | Male | Female |
| Sales & Related | 2 (25.0%) | 6 (75.0%) |
| Office & Administration | 0 (0.0%) | 1 (100.0%) |
| Total (Category) | 2 (22.2%) | 7 (77.8%) |
| Total (Overall) | 47 (70.2%) | 20 (29.8%) |
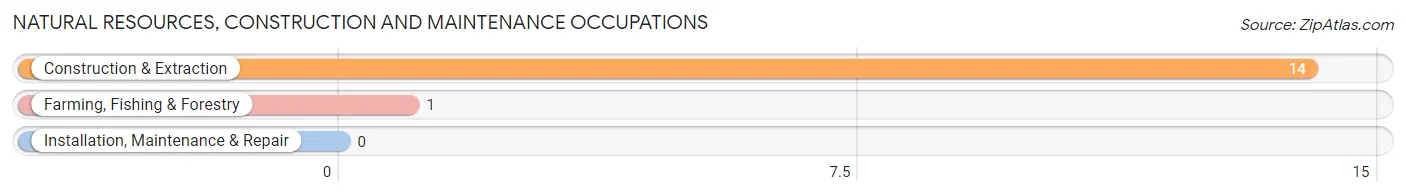
Natural Resources, Construction and Maintenance Occupations
The most common Natural Resources, Construction and Maintenance occupations in Burdette are Construction & Extraction (14 | 20.9%), and Farming, Fishing & Forestry (1 | 1.5%).
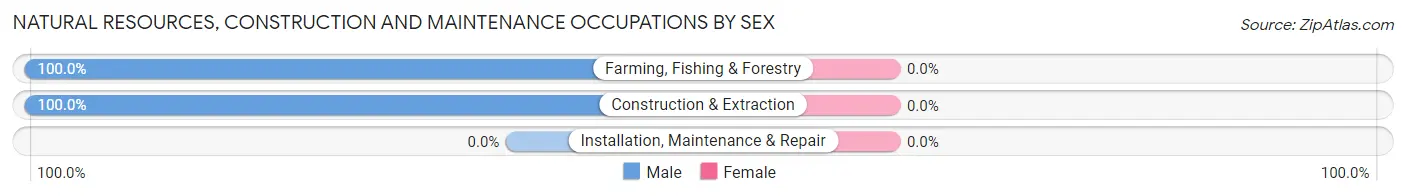
Natural Resources, Construction and Maintenance Occupations by Sex
| Occupation | Male | Female |
| Farming, Fishing & Forestry | 1 (100.0%) | 0 (0.0%) |
| Construction & Extraction | 14 (100.0%) | 0 (0.0%) |
| Installation, Maintenance & Repair | 0 (0.0%) | 0 (0.0%) |
| Total (Category) | 15 (100.0%) | 0 (0.0%) |
| Total (Overall) | 47 (70.2%) | 20 (29.8%) |
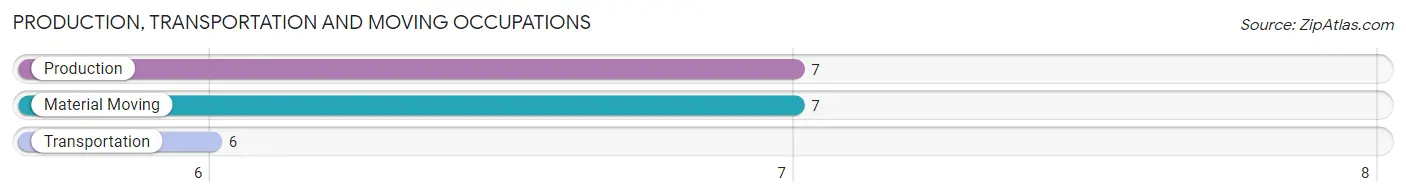
Production, Transportation and Moving Occupations
The most common Production, Transportation and Moving occupations in Burdette are Production (7 | 10.4%), Material Moving (7 | 10.4%), and Transportation (6 | 9.0%).
Production, Transportation and Moving Occupations by Sex
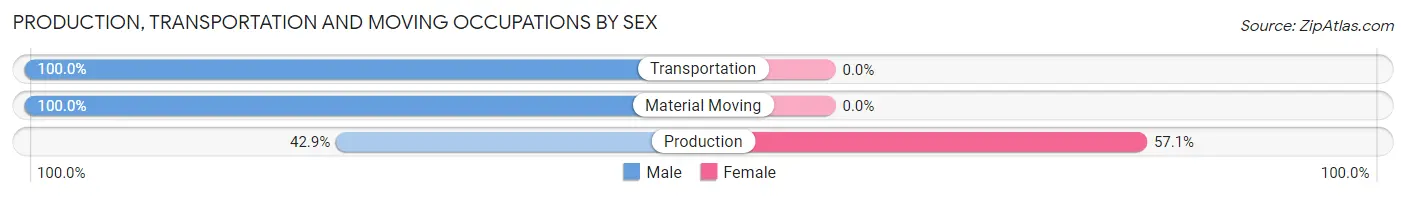
| Occupation | Male | Female |
| Production | 3 (42.9%) | 4 (57.1%) |
| Transportation | 6 (100.0%) | 0 (0.0%) |
| Material Moving | 7 (100.0%) | 0 (0.0%) |
| Total (Category) | 16 (80.0%) | 4 (20.0%) |
| Total (Overall) | 47 (70.2%) | 20 (29.8%) |
Employment Industries by Sex in Burdette
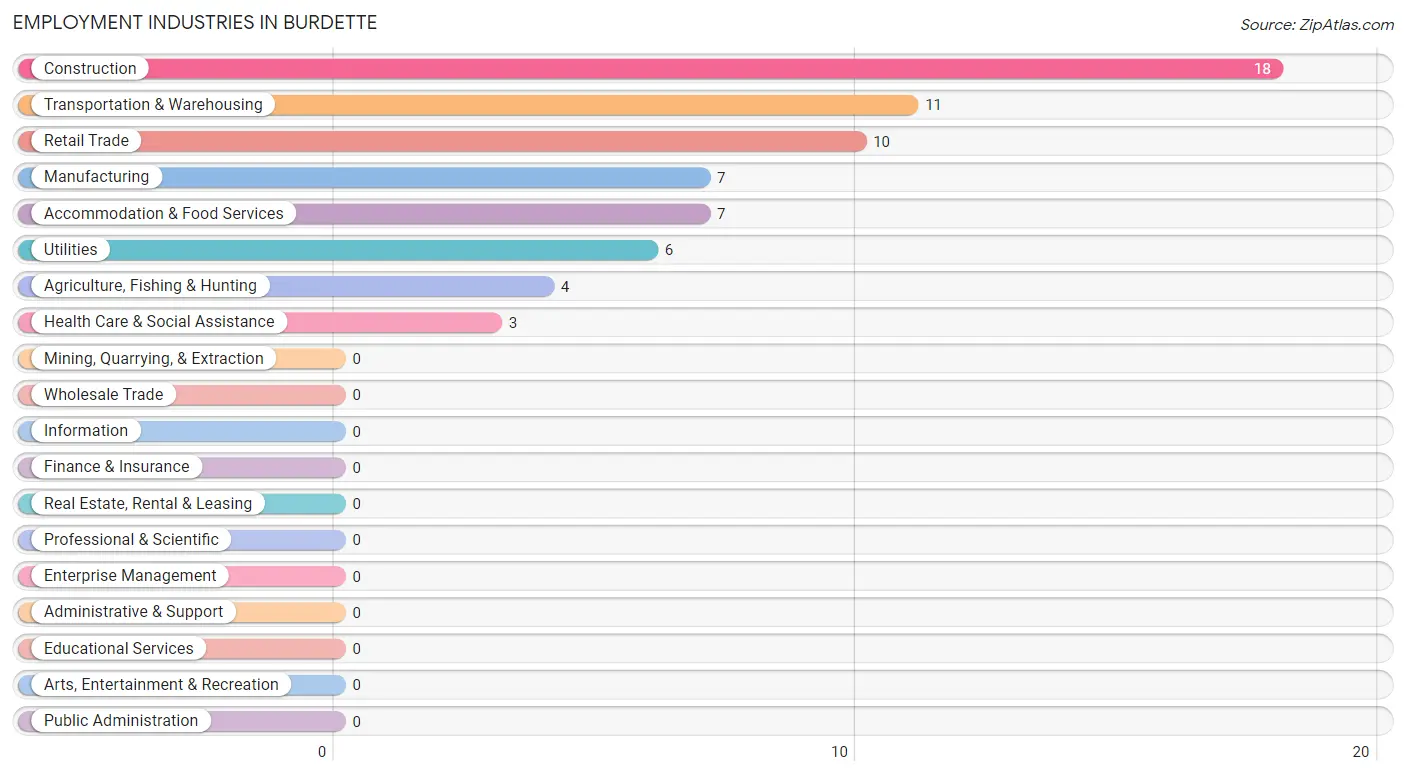
Employment Industries in Burdette
The major employment industries in Burdette include Construction (18 | 26.9%), Transportation & Warehousing (11 | 16.4%), Retail Trade (10 | 14.9%), Manufacturing (7 | 10.4%), and Accommodation & Food Services (7 | 10.4%).
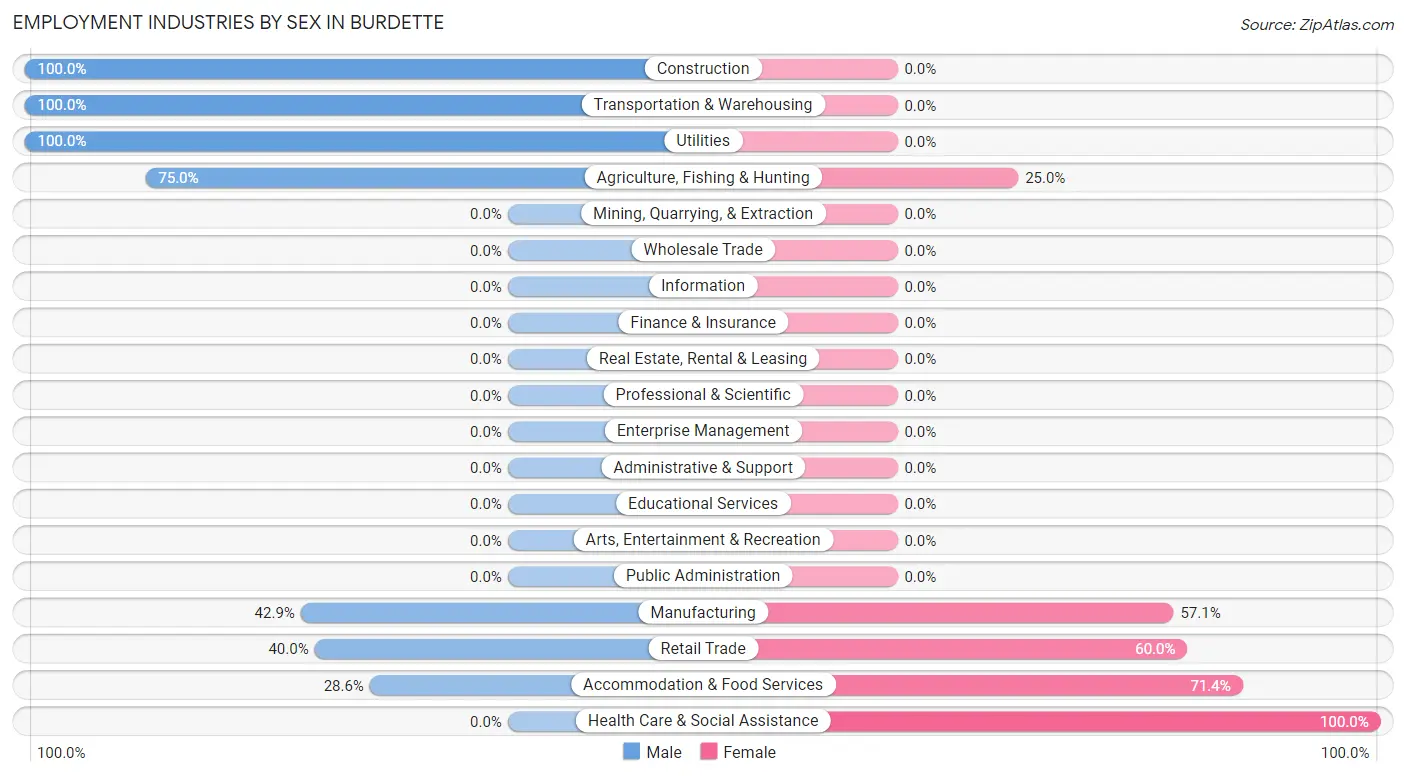
Employment Industries by Sex in Burdette
The Burdette industries that see more men than women are Construction (100.0%), Transportation & Warehousing (100.0%), and Utilities (100.0%), whereas the industries that tend to have a higher number of women are Health Care & Social Assistance (100.0%), Accommodation & Food Services (71.4%), and Retail Trade (60.0%).
| Industry | Male | Female |
| Agriculture, Fishing & Hunting | 3 (75.0%) | 1 (25.0%) |
| Mining, Quarrying, & Extraction | 0 (0.0%) | 0 (0.0%) |
| Construction | 18 (100.0%) | 0 (0.0%) |
| Manufacturing | 3 (42.9%) | 4 (57.1%) |
| Wholesale Trade | 0 (0.0%) | 0 (0.0%) |
| Retail Trade | 4 (40.0%) | 6 (60.0%) |
| Transportation & Warehousing | 11 (100.0%) | 0 (0.0%) |
| Utilities | 6 (100.0%) | 0 (0.0%) |
| Information | 0 (0.0%) | 0 (0.0%) |
| Finance & Insurance | 0 (0.0%) | 0 (0.0%) |
| Real Estate, Rental & Leasing | 0 (0.0%) | 0 (0.0%) |
| Professional & Scientific | 0 (0.0%) | 0 (0.0%) |
| Enterprise Management | 0 (0.0%) | 0 (0.0%) |
| Administrative & Support | 0 (0.0%) | 0 (0.0%) |
| Educational Services | 0 (0.0%) | 0 (0.0%) |
| Health Care & Social Assistance | 0 (0.0%) | 3 (100.0%) |
| Arts, Entertainment & Recreation | 0 (0.0%) | 0 (0.0%) |
| Accommodation & Food Services | 2 (28.6%) | 5 (71.4%) |
| Public Administration | 0 (0.0%) | 0 (0.0%) |
| Total | 47 (70.2%) | 20 (29.8%) |
Education in Burdette
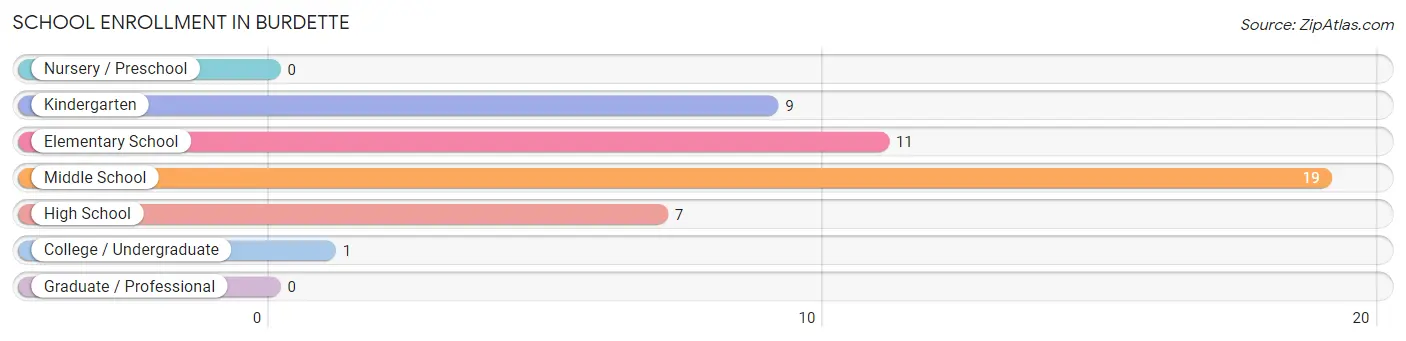
School Enrollment in Burdette
The most common levels of schooling among the 47 students in Burdette are middle school (19 | 40.4%), elementary school (11 | 23.4%), and kindergarten (9 | 19.2%).
| School Level | # Students | % Students |
| Nursery / Preschool | 0 | 0.0% |
| Kindergarten | 9 | 19.2% |
| Elementary School | 11 | 23.4% |
| Middle School | 19 | 40.4% |
| High School | 7 | 14.9% |
| College / Undergraduate | 1 | 2.1% |
| Graduate / Professional | 0 | 0.0% |
| Total | 47 | 100.0% |
School Enrollment by Age by Funding Source in Burdette
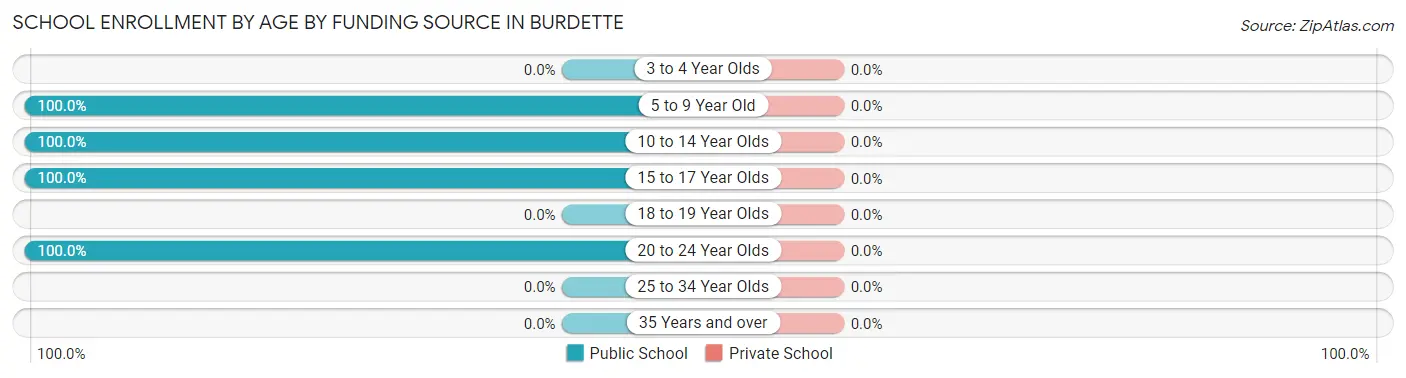
| Age Bracket | Public School | Private School |
| 3 to 4 Year Olds | 0 (0.0%) | 0 (0.0%) |
| 5 to 9 Year Old | 20 (100.0%) | 0 (0.0%) |
| 10 to 14 Year Olds | 19 (100.0%) | 0 (0.0%) |
| 15 to 17 Year Olds | 7 (100.0%) | 0 (0.0%) |
| 18 to 19 Year Olds | 0 (0.0%) | 0 (0.0%) |
| 20 to 24 Year Olds | 1 (100.0%) | 0 (0.0%) |
| 25 to 34 Year Olds | 0 (0.0%) | 0 (0.0%) |
| 35 Years and over | 0 (0.0%) | 0 (0.0%) |
| Total | 47 (100.0%) | 0 (0.0%) |
Educational Attainment by Field of Study in Burdette
Bio, nature & agricultural (13 | 61.9%), science & technology (7 | 33.3%), and business (1 | 4.8%) are the most common fields of study among 21 individuals in Burdette who have obtained a bachelor's degree or higher.
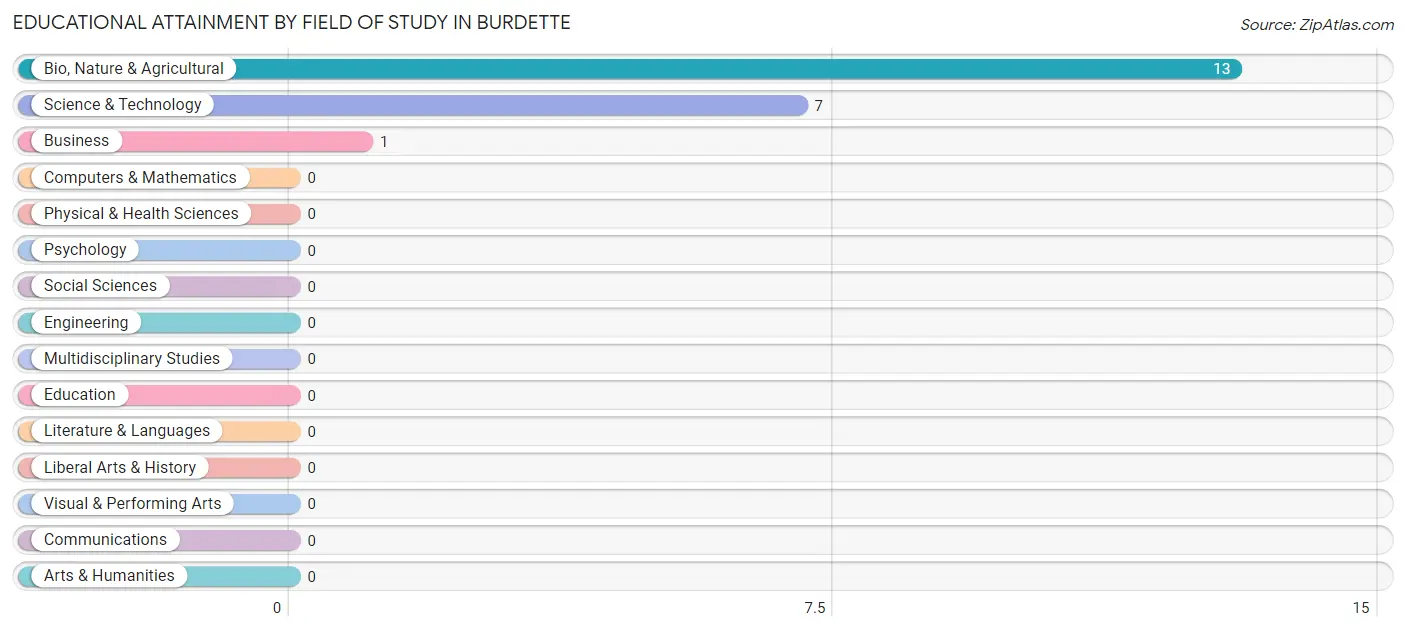
| Field of Study | # Graduates | % Graduates |
| Computers & Mathematics | 0 | 0.0% |
| Bio, Nature & Agricultural | 13 | 61.9% |
| Physical & Health Sciences | 0 | 0.0% |
| Psychology | 0 | 0.0% |
| Social Sciences | 0 | 0.0% |
| Engineering | 0 | 0.0% |
| Multidisciplinary Studies | 0 | 0.0% |
| Science & Technology | 7 | 33.3% |
| Business | 1 | 4.8% |
| Education | 0 | 0.0% |
| Literature & Languages | 0 | 0.0% |
| Liberal Arts & History | 0 | 0.0% |
| Visual & Performing Arts | 0 | 0.0% |
| Communications | 0 | 0.0% |
| Arts & Humanities | 0 | 0.0% |
| Total | 21 | 100.0% |
Transportation & Commute in Burdette
Vehicle Availability by Sex in Burdette
The most prevalent vehicle ownership categories in Burdette are males with 2 vehicles (28, accounting for 59.6%) and females with 2 vehicles (3, making up 186.7%).
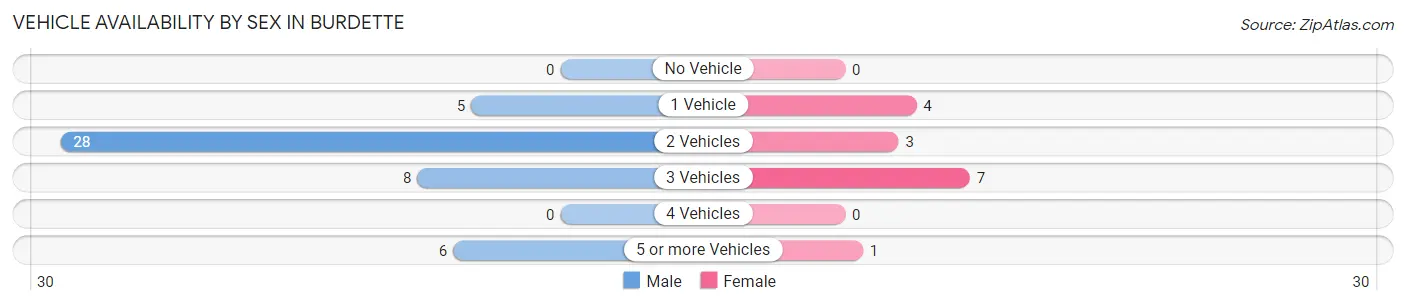
| Vehicles Available | Male | Female |
| No Vehicle | 0 (0.0%) | 0 (0.0%) |
| 1 Vehicle | 5 (10.6%) | 4 (26.7%) |
| 2 Vehicles | 28 (59.6%) | 3 (20.0%) |
| 3 Vehicles | 8 (17.0%) | 7 (46.7%) |
| 4 Vehicles | 0 (0.0%) | 0 (0.0%) |
| 5 or more Vehicles | 6 (12.8%) | 1 (6.7%) |
| Total | 47 (100.0%) | 15 (100.0%) |
Commute Time in Burdette
The most frequently occuring commute durations in Burdette are 20 to 24 minutes (22 commuters, 35.5%), less than 5 minutes (9 commuters, 14.5%), and 30 to 34 minutes (7 commuters, 11.3%).
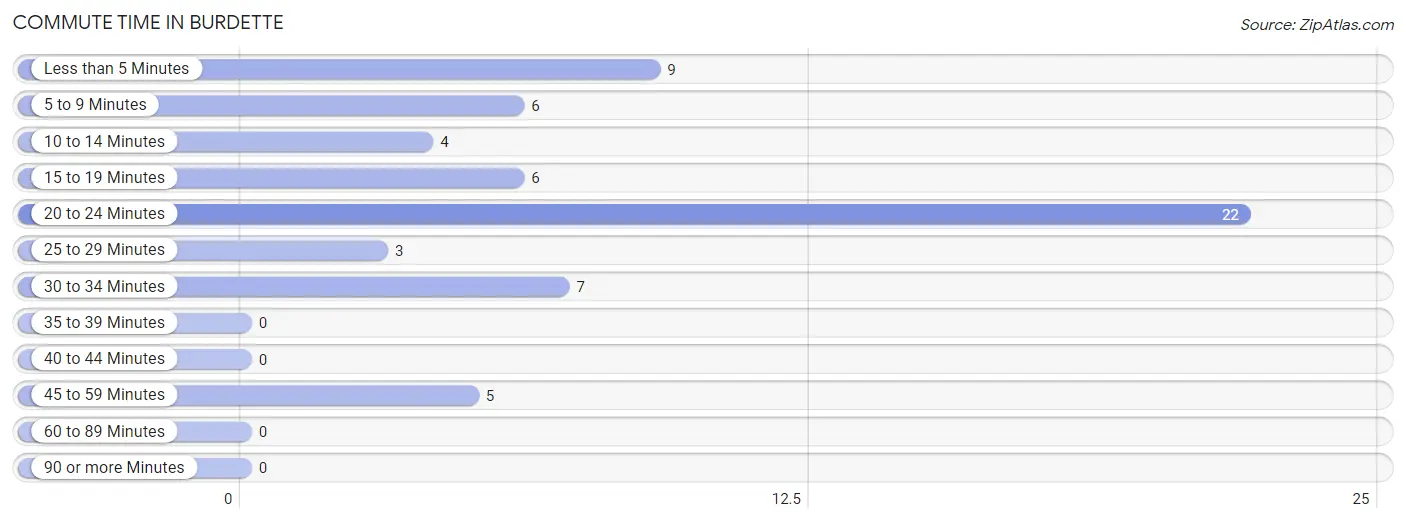
| Commute Time | # Commuters | % Commuters |
| Less than 5 Minutes | 9 | 14.5% |
| 5 to 9 Minutes | 6 | 9.7% |
| 10 to 14 Minutes | 4 | 6.5% |
| 15 to 19 Minutes | 6 | 9.7% |
| 20 to 24 Minutes | 22 | 35.5% |
| 25 to 29 Minutes | 3 | 4.8% |
| 30 to 34 Minutes | 7 | 11.3% |
| 35 to 39 Minutes | 0 | 0.0% |
| 40 to 44 Minutes | 0 | 0.0% |
| 45 to 59 Minutes | 5 | 8.1% |
| 60 to 89 Minutes | 0 | 0.0% |
| 90 or more Minutes | 0 | 0.0% |
Commute Time by Sex in Burdette
The most common commute times in Burdette are 20 to 24 minutes (18 commuters, 38.3%) for males and 5 to 9 minutes (5 commuters, 33.3%) for females.
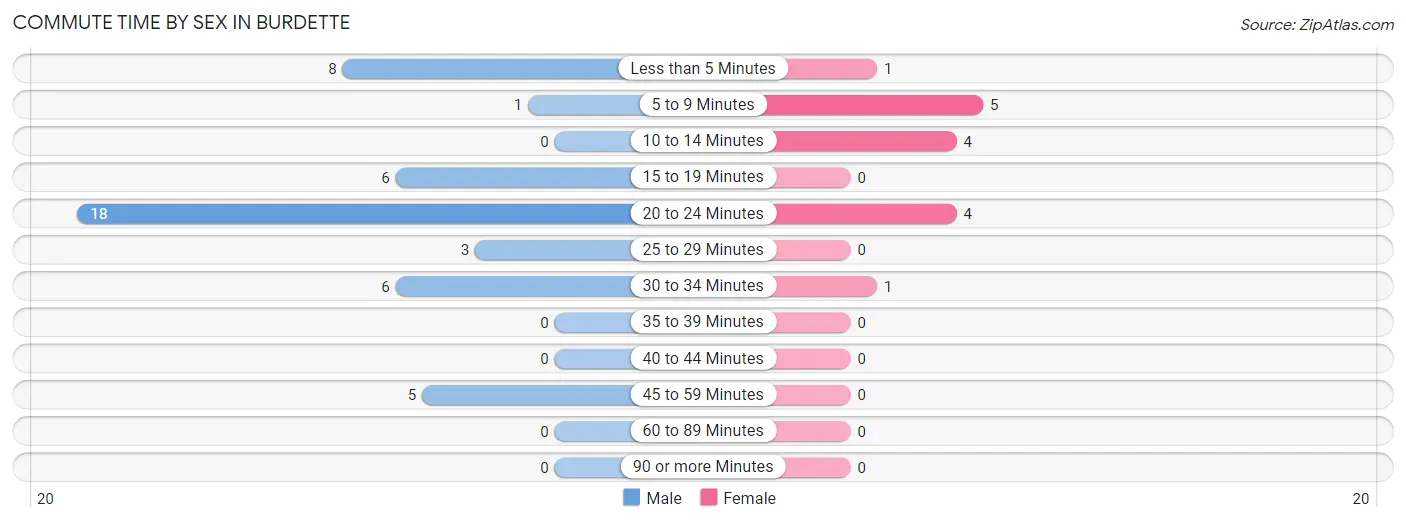
| Commute Time | Male | Female |
| Less than 5 Minutes | 8 (17.0%) | 1 (6.7%) |
| 5 to 9 Minutes | 1 (2.1%) | 5 (33.3%) |
| 10 to 14 Minutes | 0 (0.0%) | 4 (26.7%) |
| 15 to 19 Minutes | 6 (12.8%) | 0 (0.0%) |
| 20 to 24 Minutes | 18 (38.3%) | 4 (26.7%) |
| 25 to 29 Minutes | 3 (6.4%) | 0 (0.0%) |
| 30 to 34 Minutes | 6 (12.8%) | 1 (6.7%) |
| 35 to 39 Minutes | 0 (0.0%) | 0 (0.0%) |
| 40 to 44 Minutes | 0 (0.0%) | 0 (0.0%) |
| 45 to 59 Minutes | 5 (10.6%) | 0 (0.0%) |
| 60 to 89 Minutes | 0 (0.0%) | 0 (0.0%) |
| 90 or more Minutes | 0 (0.0%) | 0 (0.0%) |
Time of Departure to Work by Sex in Burdette
The most frequent times of departure to work in Burdette are 6:00 AM to 6:29 AM (15, 31.9%) for males and 4:00 PM to 11:59 PM (5, 33.3%) for females.
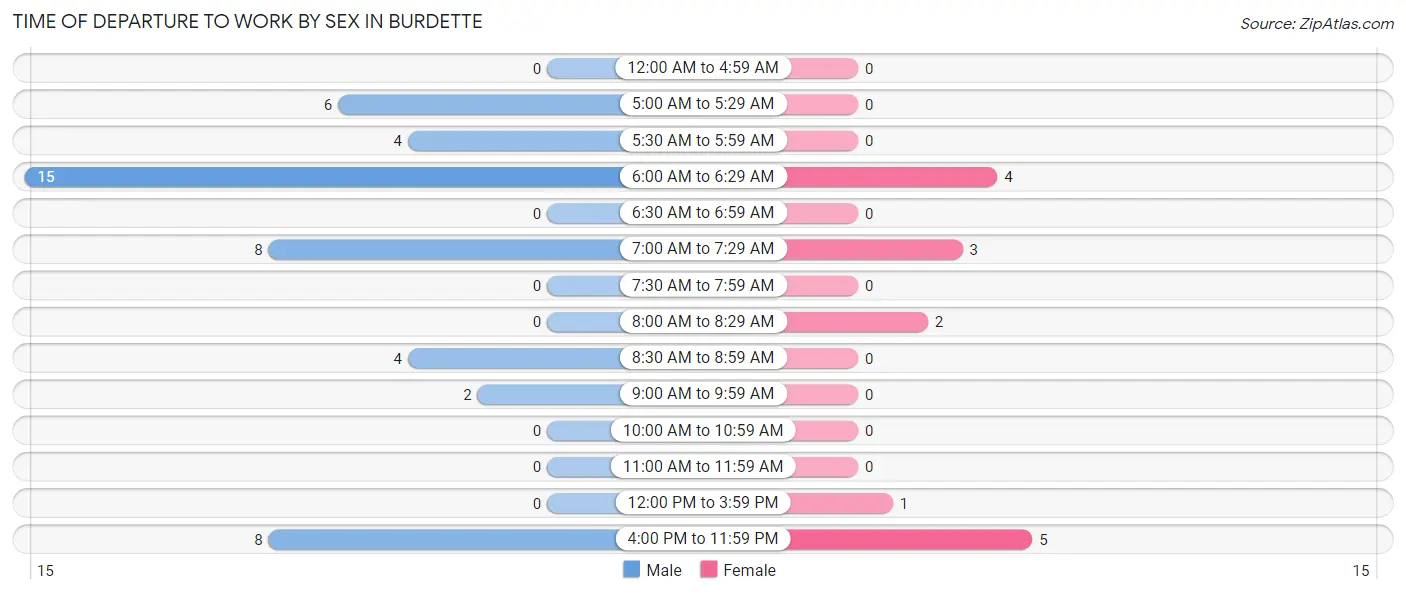
| Time of Departure | Male | Female |
| 12:00 AM to 4:59 AM | 0 (0.0%) | 0 (0.0%) |
| 5:00 AM to 5:29 AM | 6 (12.8%) | 0 (0.0%) |
| 5:30 AM to 5:59 AM | 4 (8.5%) | 0 (0.0%) |
| 6:00 AM to 6:29 AM | 15 (31.9%) | 4 (26.7%) |
| 6:30 AM to 6:59 AM | 0 (0.0%) | 0 (0.0%) |
| 7:00 AM to 7:29 AM | 8 (17.0%) | 3 (20.0%) |
| 7:30 AM to 7:59 AM | 0 (0.0%) | 0 (0.0%) |
| 8:00 AM to 8:29 AM | 0 (0.0%) | 2 (13.3%) |
| 8:30 AM to 8:59 AM | 4 (8.5%) | 0 (0.0%) |
| 9:00 AM to 9:59 AM | 2 (4.3%) | 0 (0.0%) |
| 10:00 AM to 10:59 AM | 0 (0.0%) | 0 (0.0%) |
| 11:00 AM to 11:59 AM | 0 (0.0%) | 0 (0.0%) |
| 12:00 PM to 3:59 PM | 0 (0.0%) | 1 (6.7%) |
| 4:00 PM to 11:59 PM | 8 (17.0%) | 5 (33.3%) |
| Total | 47 (100.0%) | 15 (100.0%) |
Housing Occupancy in Burdette
Occupancy by Ownership in Burdette
Of the total 73 dwellings in Burdette, owner-occupied units account for 49 (67.1%), while renter-occupied units make up 24 (32.9%).
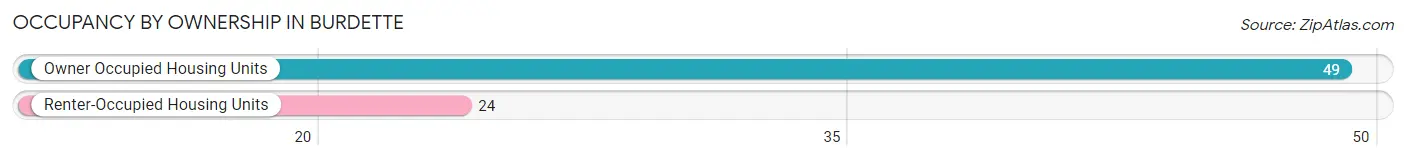
| Occupancy | # Housing Units | % Housing Units |
| Owner Occupied Housing Units | 49 | 67.1% |
| Renter-Occupied Housing Units | 24 | 32.9% |
| Total Occupied Housing Units | 73 | 100.0% |
Occupancy by Household Size in Burdette
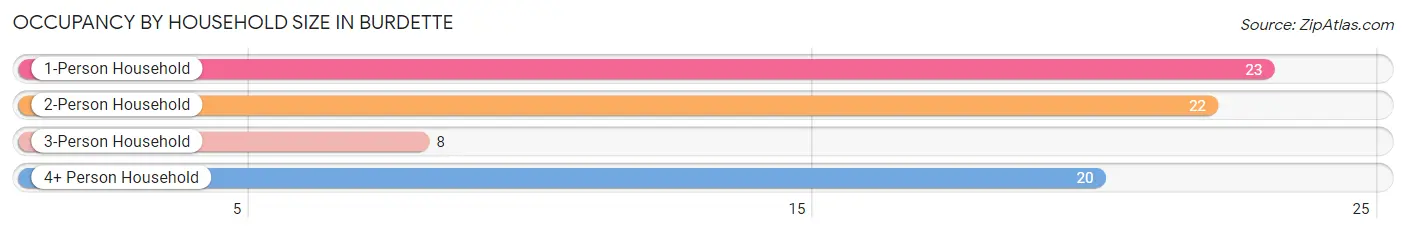
| Household Size | # Housing Units | % Housing Units |
| 1-Person Household | 23 | 31.5% |
| 2-Person Household | 22 | 30.1% |
| 3-Person Household | 8 | 11.0% |
| 4+ Person Household | 20 | 27.4% |
| Total Housing Units | 73 | 100.0% |
Occupancy by Ownership by Household Size in Burdette
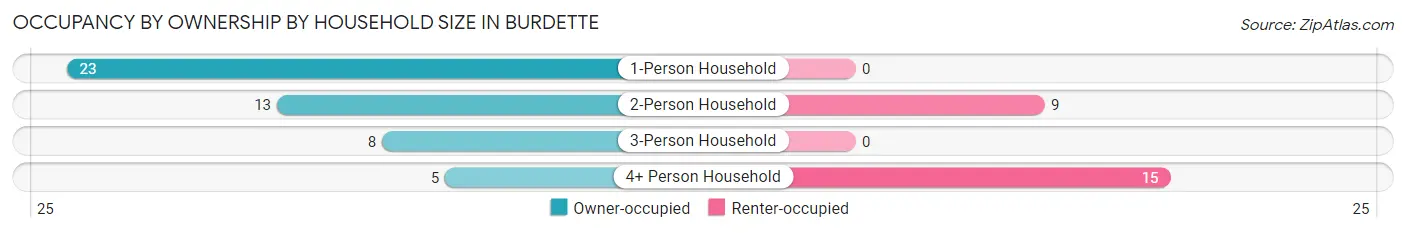
| Household Size | Owner-occupied | Renter-occupied |
| 1-Person Household | 23 (100.0%) | 0 (0.0%) |
| 2-Person Household | 13 (59.1%) | 9 (40.9%) |
| 3-Person Household | 8 (100.0%) | 0 (0.0%) |
| 4+ Person Household | 5 (25.0%) | 15 (75.0%) |
| Total Housing Units | 49 (67.1%) | 24 (32.9%) |
Occupancy by Educational Attainment in Burdette
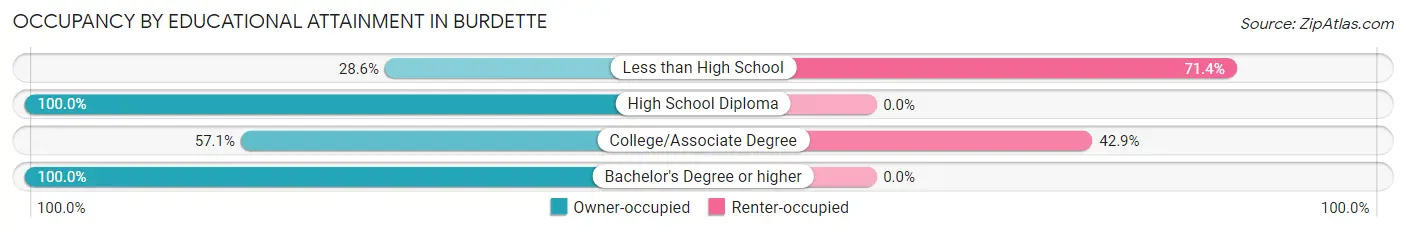
| Household Size | Owner-occupied | Renter-occupied |
| Less than High School | 6 (28.6%) | 15 (71.4%) |
| High School Diploma | 12 (100.0%) | 0 (0.0%) |
| College/Associate Degree | 12 (57.1%) | 9 (42.9%) |
| Bachelor's Degree or higher | 19 (100.0%) | 0 (0.0%) |
Occupancy by Age of Householder in Burdette
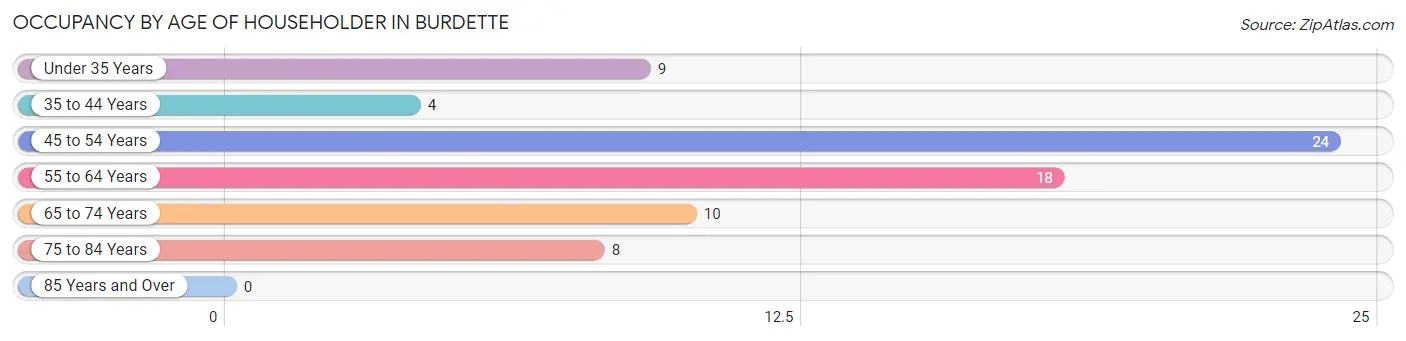
| Age Bracket | # Households | % Households |
| Under 35 Years | 9 | 12.3% |
| 35 to 44 Years | 4 | 5.5% |
| 45 to 54 Years | 24 | 32.9% |
| 55 to 64 Years | 18 | 24.7% |
| 65 to 74 Years | 10 | 13.7% |
| 75 to 84 Years | 8 | 11.0% |
| 85 Years and Over | 0 | 0.0% |
| Total | 73 | 100.0% |
Housing Finances in Burdette
Median Income by Occupancy in Burdette
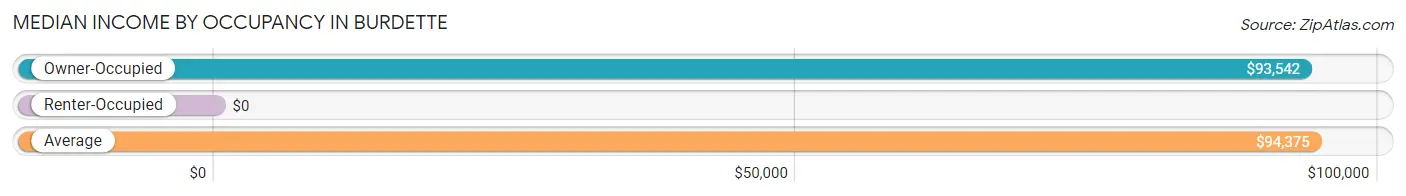
| Occupancy Type | # Households | Median Income |
| Owner-Occupied | 49 (67.1%) | $93,542 |
| Renter-Occupied | 24 (32.9%) | $0 |
| Average | 73 (100.0%) | $94,375 |
Occupancy by Householder Income Bracket in Burdette
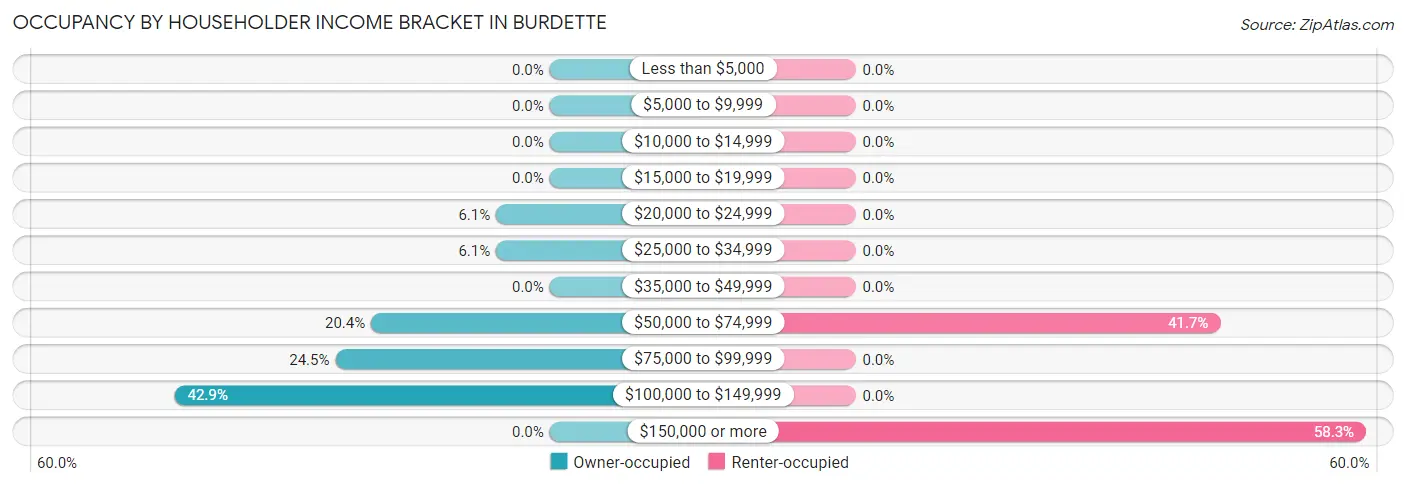
| Income Bracket | Owner-occupied | Renter-occupied |
| Less than $5,000 | 0 (0.0%) | 0 (0.0%) |
| $5,000 to $9,999 | 0 (0.0%) | 0 (0.0%) |
| $10,000 to $14,999 | 0 (0.0%) | 0 (0.0%) |
| $15,000 to $19,999 | 0 (0.0%) | 0 (0.0%) |
| $20,000 to $24,999 | 3 (6.1%) | 0 (0.0%) |
| $25,000 to $34,999 | 3 (6.1%) | 0 (0.0%) |
| $35,000 to $49,999 | 0 (0.0%) | 0 (0.0%) |
| $50,000 to $74,999 | 10 (20.4%) | 10 (41.7%) |
| $75,000 to $99,999 | 12 (24.5%) | 0 (0.0%) |
| $100,000 to $149,999 | 21 (42.9%) | 0 (0.0%) |
| $150,000 or more | 0 (0.0%) | 14 (58.3%) |
| Total | 49 (100.0%) | 24 (100.0%) |
Monthly Housing Cost Tiers in Burdette
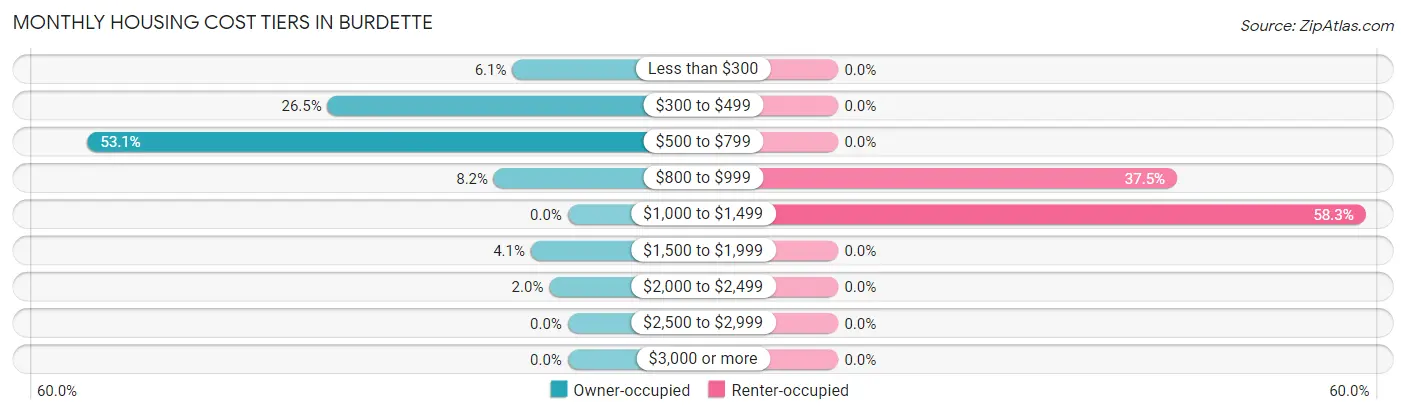
| Monthly Cost | Owner-occupied | Renter-occupied |
| Less than $300 | 3 (6.1%) | 0 (0.0%) |
| $300 to $499 | 13 (26.5%) | 0 (0.0%) |
| $500 to $799 | 26 (53.1%) | 0 (0.0%) |
| $800 to $999 | 4 (8.2%) | 9 (37.5%) |
| $1,000 to $1,499 | 0 (0.0%) | 14 (58.3%) |
| $1,500 to $1,999 | 2 (4.1%) | 0 (0.0%) |
| $2,000 to $2,499 | 1 (2.0%) | 0 (0.0%) |
| $2,500 to $2,999 | 0 (0.0%) | 0 (0.0%) |
| $3,000 or more | 0 (0.0%) | 0 (0.0%) |
| Total | 49 (100.0%) | 24 (100.0%) |
Physical Housing Characteristics in Burdette
Housing Structures in Burdette
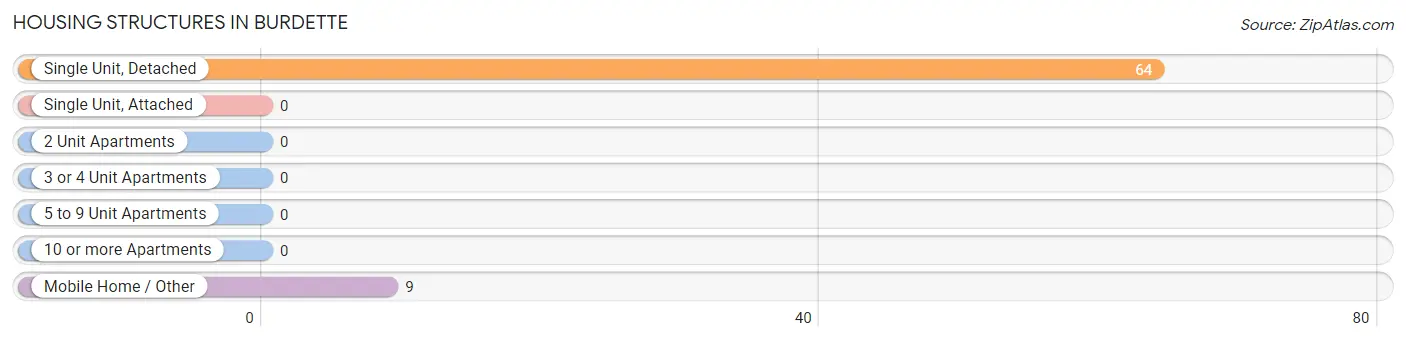
| Structure Type | # Housing Units | % Housing Units |
| Single Unit, Detached | 64 | 87.7% |
| Single Unit, Attached | 0 | 0.0% |
| 2 Unit Apartments | 0 | 0.0% |
| 3 or 4 Unit Apartments | 0 | 0.0% |
| 5 to 9 Unit Apartments | 0 | 0.0% |
| 10 or more Apartments | 0 | 0.0% |
| Mobile Home / Other | 9 | 12.3% |
| Total | 73 | 100.0% |
Housing Structures by Occupancy in Burdette
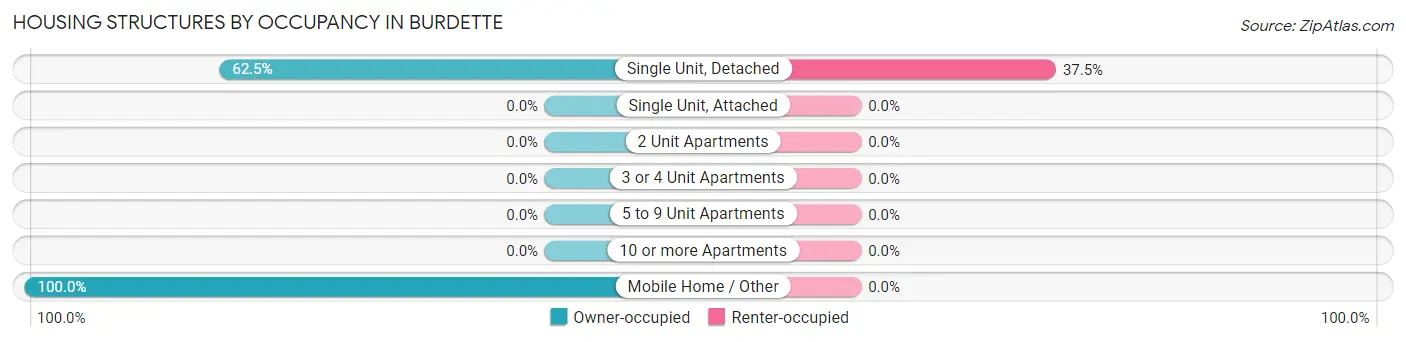
| Structure Type | Owner-occupied | Renter-occupied |
| Single Unit, Detached | 40 (62.5%) | 24 (37.5%) |
| Single Unit, Attached | 0 (0.0%) | 0 (0.0%) |
| 2 Unit Apartments | 0 (0.0%) | 0 (0.0%) |
| 3 or 4 Unit Apartments | 0 (0.0%) | 0 (0.0%) |
| 5 to 9 Unit Apartments | 0 (0.0%) | 0 (0.0%) |
| 10 or more Apartments | 0 (0.0%) | 0 (0.0%) |
| Mobile Home / Other | 9 (100.0%) | 0 (0.0%) |
| Total | 49 (67.1%) | 24 (32.9%) |
Housing Structures by Number of Rooms in Burdette
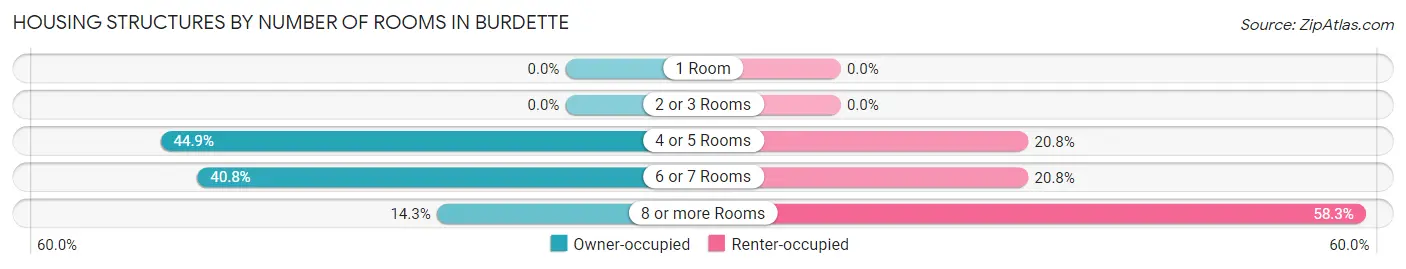
| Number of Rooms | Owner-occupied | Renter-occupied |
| 1 Room | 0 (0.0%) | 0 (0.0%) |
| 2 or 3 Rooms | 0 (0.0%) | 0 (0.0%) |
| 4 or 5 Rooms | 22 (44.9%) | 5 (20.8%) |
| 6 or 7 Rooms | 20 (40.8%) | 5 (20.8%) |
| 8 or more Rooms | 7 (14.3%) | 14 (58.3%) |
| Total | 49 (100.0%) | 24 (100.0%) |
Housing Structure by Heating Type in Burdette
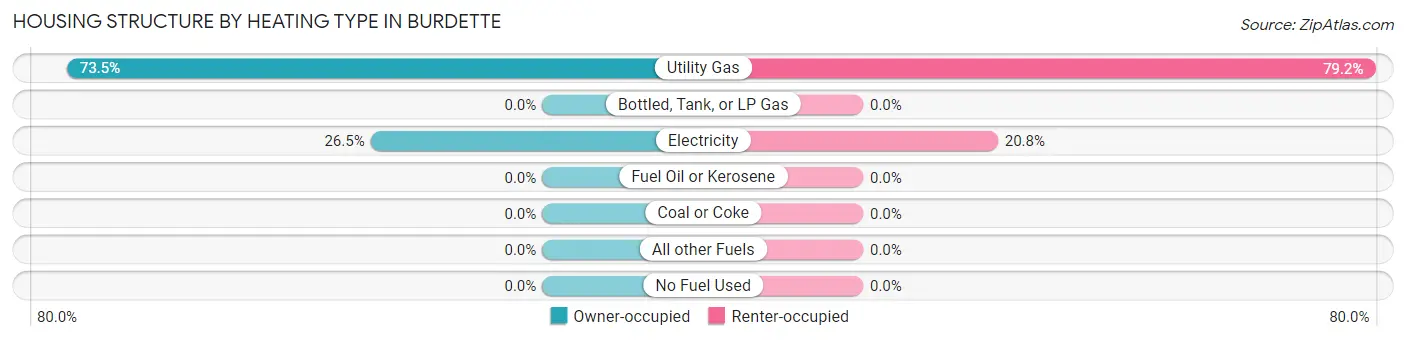
| Heating Type | Owner-occupied | Renter-occupied |
| Utility Gas | 36 (73.5%) | 19 (79.2%) |
| Bottled, Tank, or LP Gas | 0 (0.0%) | 0 (0.0%) |
| Electricity | 13 (26.5%) | 5 (20.8%) |
| Fuel Oil or Kerosene | 0 (0.0%) | 0 (0.0%) |
| Coal or Coke | 0 (0.0%) | 0 (0.0%) |
| All other Fuels | 0 (0.0%) | 0 (0.0%) |
| No Fuel Used | 0 (0.0%) | 0 (0.0%) |
| Total | 49 (100.0%) | 24 (100.0%) |
Household Vehicle Usage in Burdette
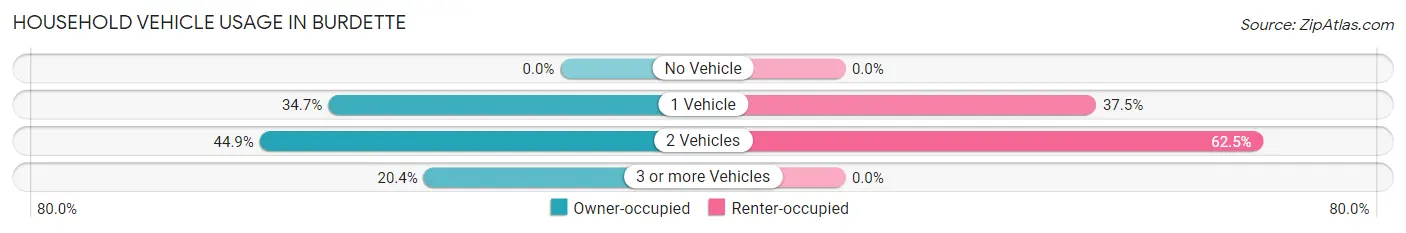
| Vehicles per Household | Owner-occupied | Renter-occupied |
| No Vehicle | 0 (0.0%) | 0 (0.0%) |
| 1 Vehicle | 17 (34.7%) | 9 (37.5%) |
| 2 Vehicles | 22 (44.9%) | 15 (62.5%) |
| 3 or more Vehicles | 10 (20.4%) | 0 (0.0%) |
| Total | 49 (100.0%) | 24 (100.0%) |
Real Estate & Mortgages in Burdette
Real Estate and Mortgage Overview in Burdette
| Characteristic | Without Mortgage | With Mortgage |
| Housing Units | 29 | 20 |
| Median Property Value | - | - |
| Median Household Income | - | - |
| Monthly Housing Costs | $488 | $0 |
| Real Estate Taxes | - | - |
Property Value by Mortgage Status in Burdette
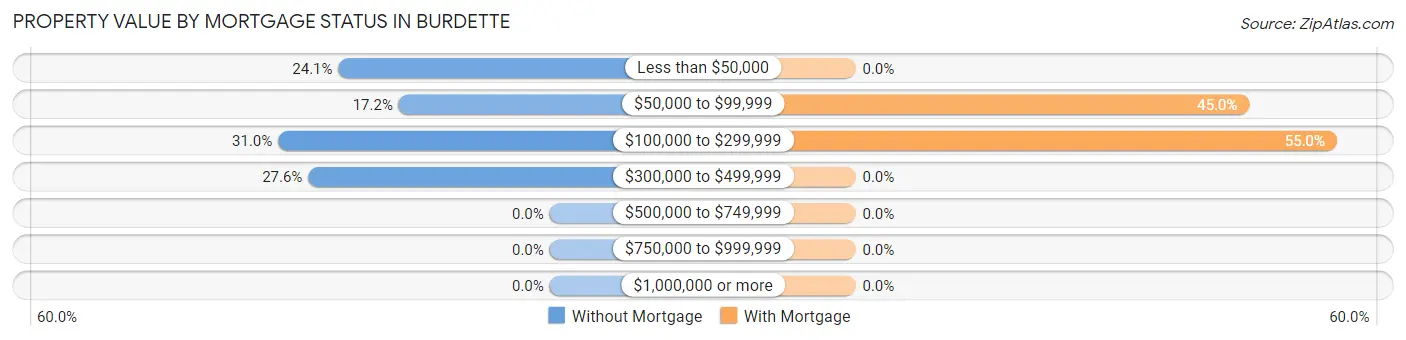
| Property Value | Without Mortgage | With Mortgage |
| Less than $50,000 | 7 (24.1%) | 0 (0.0%) |
| $50,000 to $99,999 | 5 (17.2%) | 9 (45.0%) |
| $100,000 to $299,999 | 9 (31.0%) | 11 (55.0%) |
| $300,000 to $499,999 | 8 (27.6%) | 0 (0.0%) |
| $500,000 to $749,999 | 0 (0.0%) | 0 (0.0%) |
| $750,000 to $999,999 | 0 (0.0%) | 0 (0.0%) |
| $1,000,000 or more | 0 (0.0%) | 0 (0.0%) |
| Total | 29 (100.0%) | 20 (100.0%) |
Household Income by Mortgage Status in Burdette
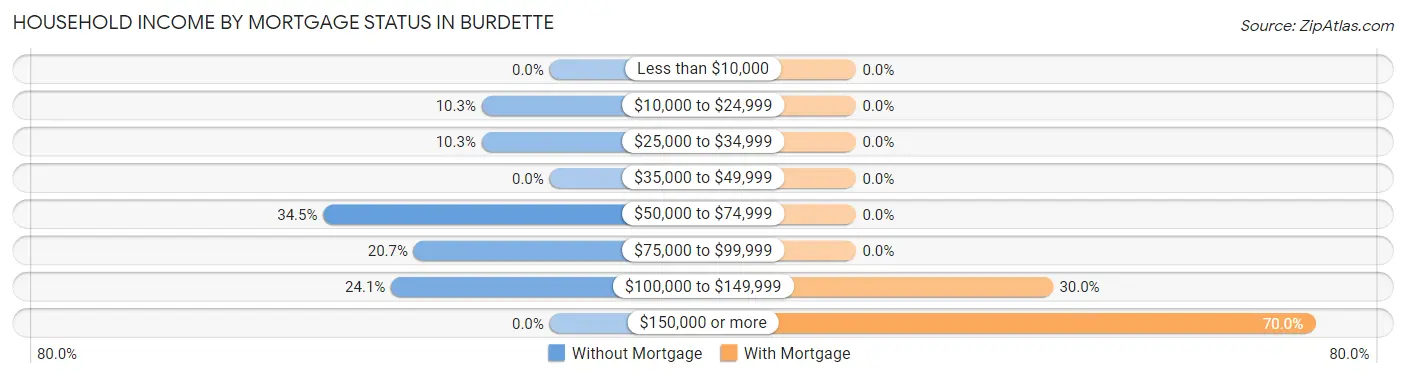
| Household Income | Without Mortgage | With Mortgage |
| Less than $10,000 | 0 (0.0%) | 0 (0.0%) |
| $10,000 to $24,999 | 3 (10.3%) | 0 (0.0%) |
| $25,000 to $34,999 | 3 (10.3%) | 0 (0.0%) |
| $35,000 to $49,999 | 0 (0.0%) | 0 (0.0%) |
| $50,000 to $74,999 | 10 (34.5%) | 0 (0.0%) |
| $75,000 to $99,999 | 6 (20.7%) | 0 (0.0%) |
| $100,000 to $149,999 | 7 (24.1%) | 6 (30.0%) |
| $150,000 or more | 0 (0.0%) | 14 (70.0%) |
| Total | 29 (100.0%) | 20 (100.0%) |
Property Value to Household Income Ratio in Burdette

| Value-to-Income Ratio | Without Mortgage | With Mortgage |
| Less than 2.0x | 14 (48.3%) | 135,000 (675,000.0%) |
| 2.0x to 2.9x | 0 (0.0%) | 20 (100.0%) |
| 3.0x to 3.9x | 8 (27.6%) | 0 (0.0%) |
| 4.0x or more | 7 (24.1%) | 0 (0.0%) |
| Total | 29 (100.0%) | 20 (100.0%) |
Real Estate Taxes by Mortgage Status in Burdette
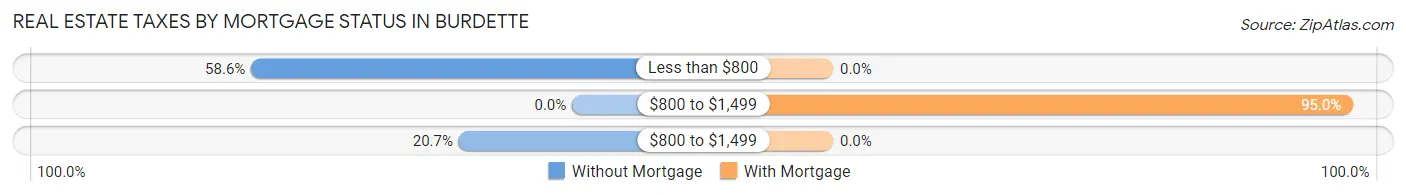
| Property Taxes | Without Mortgage | With Mortgage |
| Less than $800 | 17 (58.6%) | 0 (0.0%) |
| $800 to $1,499 | 0 (0.0%) | 19 (95.0%) |
| $800 to $1,499 | 6 (20.7%) | 0 (0.0%) |
| Total | 29 (100.0%) | 20 (100.0%) |
Health & Disability in Burdette
Health Insurance Coverage by Age in Burdette
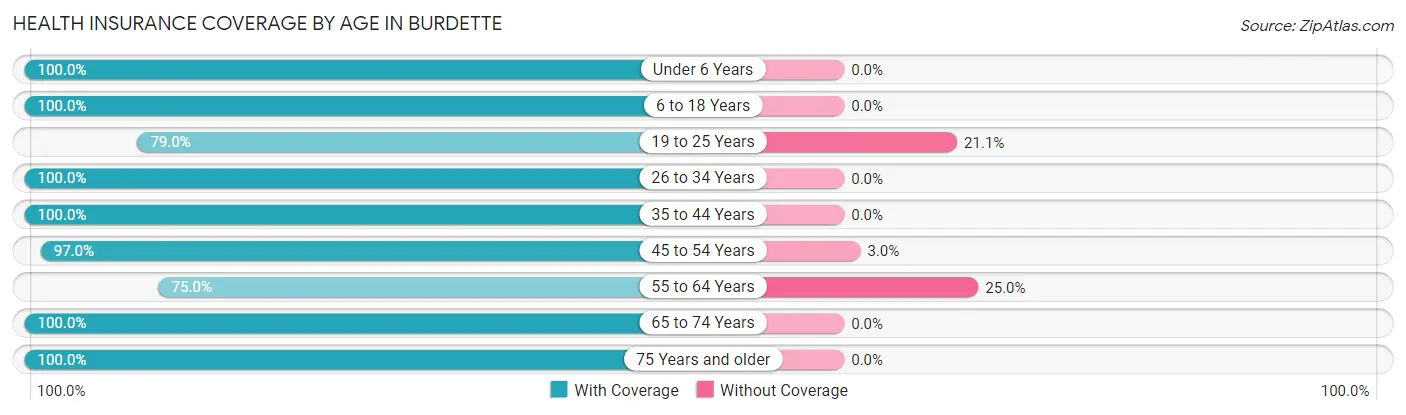
| Age Bracket | With Coverage | Without Coverage |
| Under 6 Years | 15 (100.0%) | 0 (0.0%) |
| 6 to 18 Years | 38 (100.0%) | 0 (0.0%) |
| 19 to 25 Years | 15 (78.9%) | 4 (21.0%) |
| 26 to 34 Years | 14 (100.0%) | 0 (0.0%) |
| 35 to 44 Years | 7 (100.0%) | 0 (0.0%) |
| 45 to 54 Years | 32 (97.0%) | 1 (3.0%) |
| 55 to 64 Years | 18 (75.0%) | 6 (25.0%) |
| 65 to 74 Years | 11 (100.0%) | 0 (0.0%) |
| 75 Years and older | 12 (100.0%) | 0 (0.0%) |
| Total | 162 (93.6%) | 11 (6.4%) |
Health Insurance Coverage by Citizenship Status in Burdette
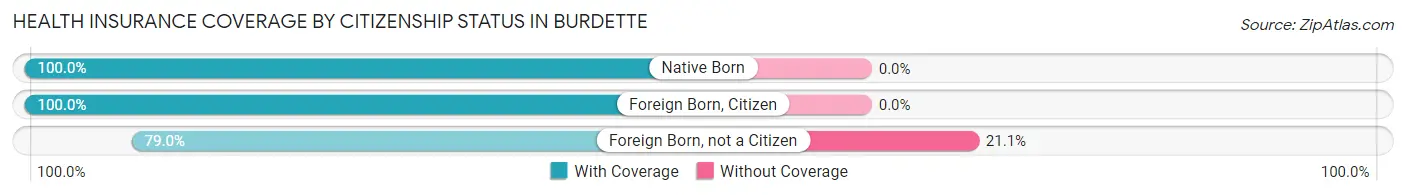
| Citizenship Status | With Coverage | Without Coverage |
| Native Born | 15 (100.0%) | 0 (0.0%) |
| Foreign Born, Citizen | 38 (100.0%) | 0 (0.0%) |
| Foreign Born, not a Citizen | 15 (78.9%) | 4 (21.0%) |
Health Insurance Coverage by Household Income in Burdette
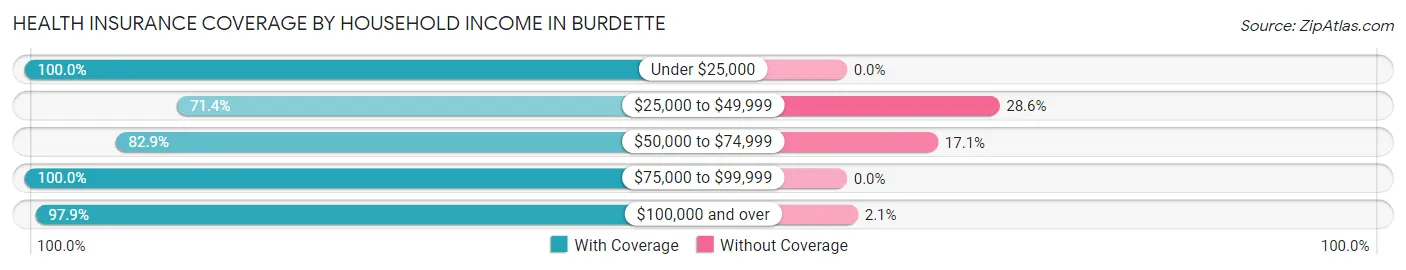
| Household Income | With Coverage | Without Coverage |
| Under $25,000 | 3 (100.0%) | 0 (0.0%) |
| $25,000 to $49,999 | 5 (71.4%) | 2 (28.6%) |
| $50,000 to $74,999 | 34 (82.9%) | 7 (17.1%) |
| $75,000 to $99,999 | 25 (100.0%) | 0 (0.0%) |
| $100,000 and over | 95 (97.9%) | 2 (2.1%) |
Public vs Private Health Insurance Coverage by Age in Burdette
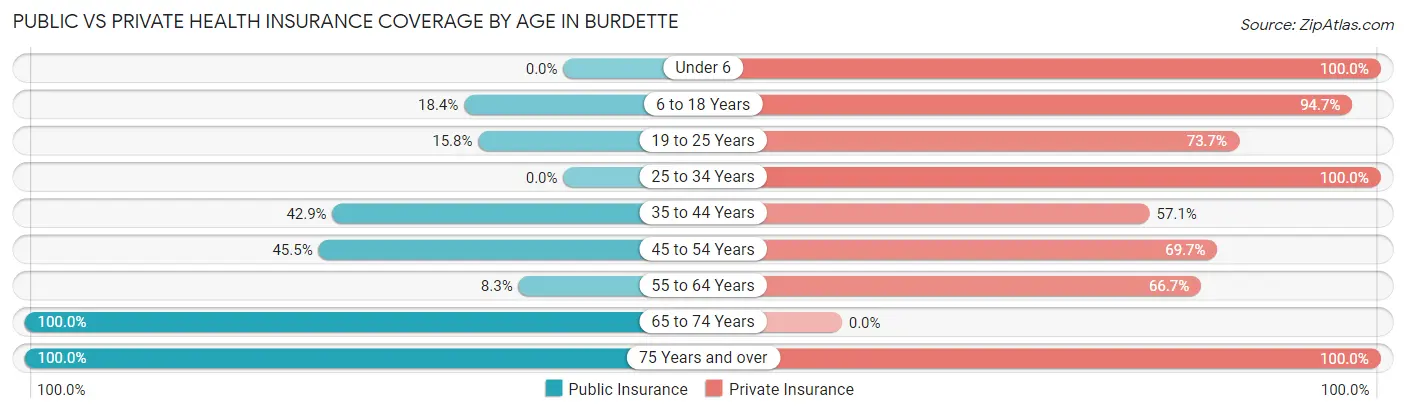
| Age Bracket | Public Insurance | Private Insurance |
| Under 6 | 0 (0.0%) | 15 (100.0%) |
| 6 to 18 Years | 7 (18.4%) | 36 (94.7%) |
| 19 to 25 Years | 3 (15.8%) | 14 (73.7%) |
| 25 to 34 Years | 0 (0.0%) | 14 (100.0%) |
| 35 to 44 Years | 3 (42.9%) | 4 (57.1%) |
| 45 to 54 Years | 15 (45.5%) | 23 (69.7%) |
| 55 to 64 Years | 2 (8.3%) | 16 (66.7%) |
| 65 to 74 Years | 11 (100.0%) | 0 (0.0%) |
| 75 Years and over | 12 (100.0%) | 12 (100.0%) |
| Total | 53 (30.6%) | 134 (77.5%) |
Disability Status by Sex by Age in Burdette
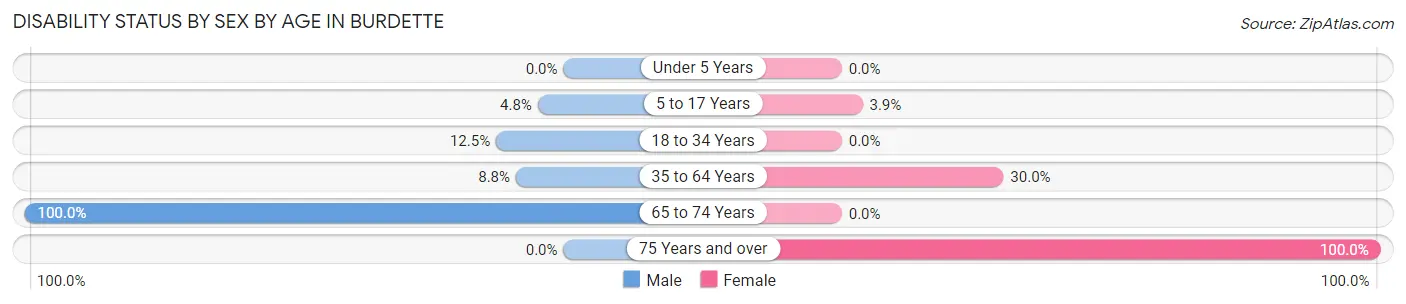
| Age Bracket | Male | Female |
| Under 5 Years | 0 (0.0%) | 0 (0.0%) |
| 5 to 17 Years | 1 (4.8%) | 1 (3.8%) |
| 18 to 34 Years | 2 (12.5%) | 0 (0.0%) |
| 35 to 64 Years | 3 (8.8%) | 9 (30.0%) |
| 65 to 74 Years | 7 (100.0%) | 0 (0.0%) |
| 75 Years and over | 0 (0.0%) | 8 (100.0%) |
Disability Class by Sex by Age in Burdette
Disability Class: Hearing Difficulty
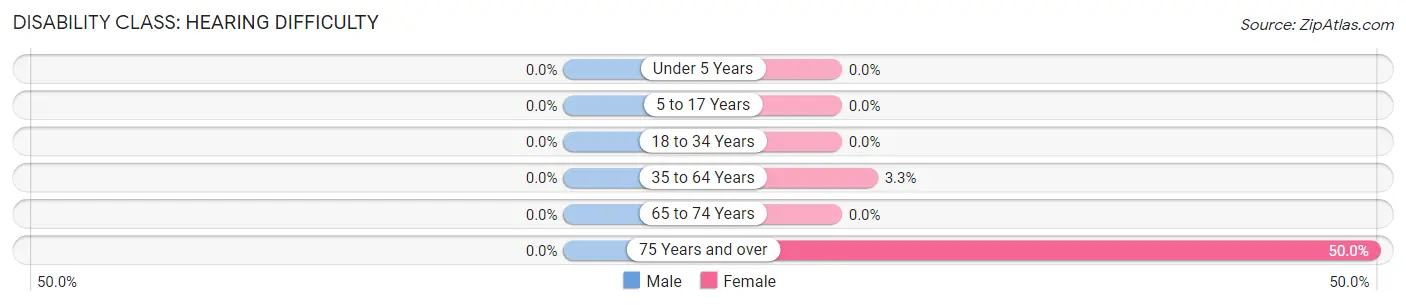
| Age Bracket | Male | Female |
| Under 5 Years | 0 (0.0%) | 0 (0.0%) |
| 5 to 17 Years | 0 (0.0%) | 0 (0.0%) |
| 18 to 34 Years | 0 (0.0%) | 0 (0.0%) |
| 35 to 64 Years | 0 (0.0%) | 1 (3.3%) |
| 65 to 74 Years | 0 (0.0%) | 0 (0.0%) |
| 75 Years and over | 0 (0.0%) | 4 (50.0%) |
Disability Class: Vision Difficulty
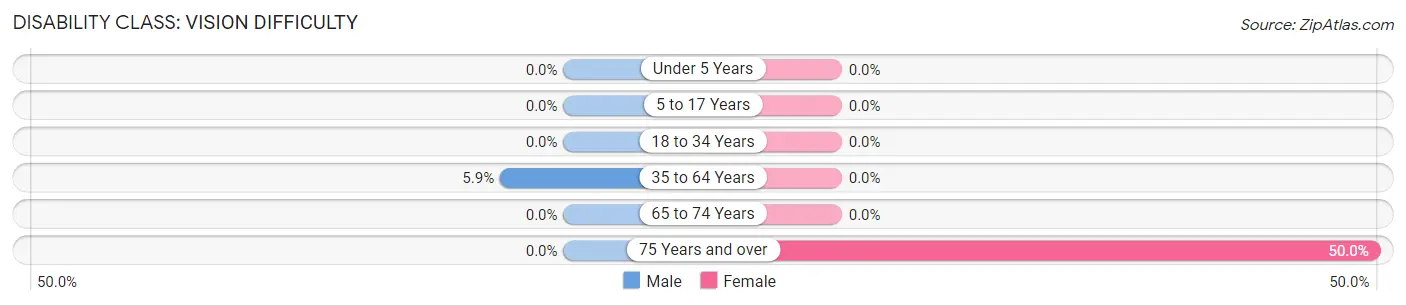
| Age Bracket | Male | Female |
| Under 5 Years | 0 (0.0%) | 0 (0.0%) |
| 5 to 17 Years | 0 (0.0%) | 0 (0.0%) |
| 18 to 34 Years | 0 (0.0%) | 0 (0.0%) |
| 35 to 64 Years | 2 (5.9%) | 0 (0.0%) |
| 65 to 74 Years | 0 (0.0%) | 0 (0.0%) |
| 75 Years and over | 0 (0.0%) | 4 (50.0%) |
Disability Class: Cognitive Difficulty
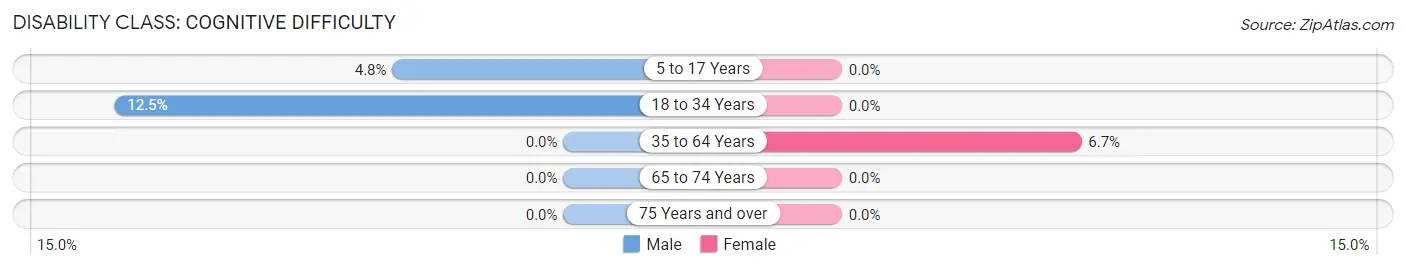
| Age Bracket | Male | Female |
| 5 to 17 Years | 1 (4.8%) | 0 (0.0%) |
| 18 to 34 Years | 2 (12.5%) | 0 (0.0%) |
| 35 to 64 Years | 0 (0.0%) | 2 (6.7%) |
| 65 to 74 Years | 0 (0.0%) | 0 (0.0%) |
| 75 Years and over | 0 (0.0%) | 0 (0.0%) |
Disability Class: Ambulatory Difficulty
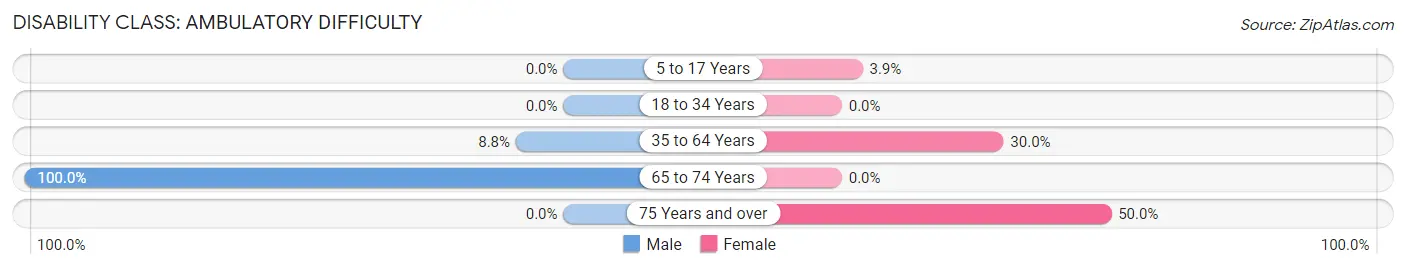
| Age Bracket | Male | Female |
| 5 to 17 Years | 0 (0.0%) | 1 (3.8%) |
| 18 to 34 Years | 0 (0.0%) | 0 (0.0%) |
| 35 to 64 Years | 3 (8.8%) | 9 (30.0%) |
| 65 to 74 Years | 7 (100.0%) | 0 (0.0%) |
| 75 Years and over | 0 (0.0%) | 4 (50.0%) |
Disability Class: Self-Care Difficulty
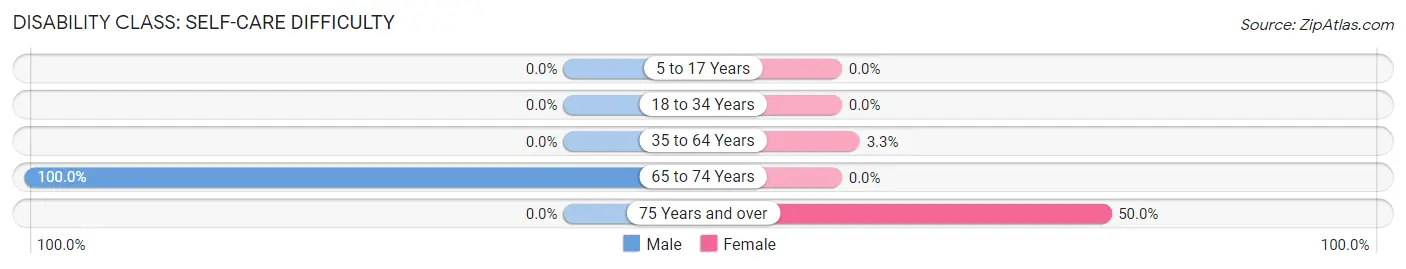
| Age Bracket | Male | Female |
| 5 to 17 Years | 0 (0.0%) | 0 (0.0%) |
| 18 to 34 Years | 0 (0.0%) | 0 (0.0%) |
| 35 to 64 Years | 0 (0.0%) | 1 (3.3%) |
| 65 to 74 Years | 7 (100.0%) | 0 (0.0%) |
| 75 Years and over | 0 (0.0%) | 4 (50.0%) |
Technology Access in Burdette
Computing Device Access in Burdette
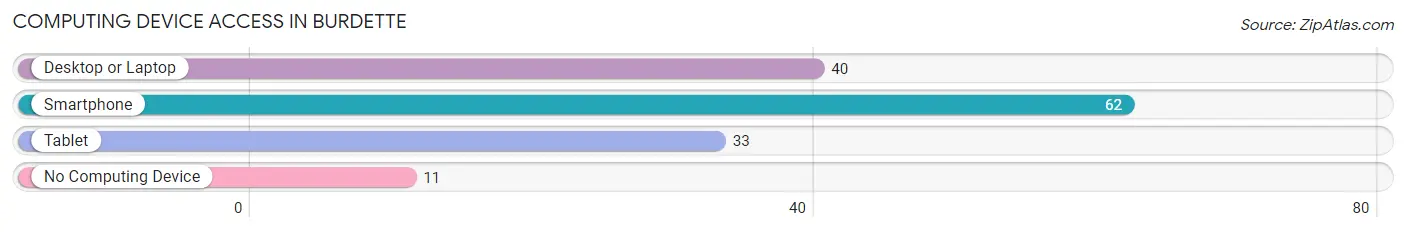
| Device Type | # Households | % Households |
| Desktop or Laptop | 40 | 54.8% |
| Smartphone | 62 | 84.9% |
| Tablet | 33 | 45.2% |
| No Computing Device | 11 | 15.1% |
| Total | 73 | 100.0% |
Internet Access in Burdette
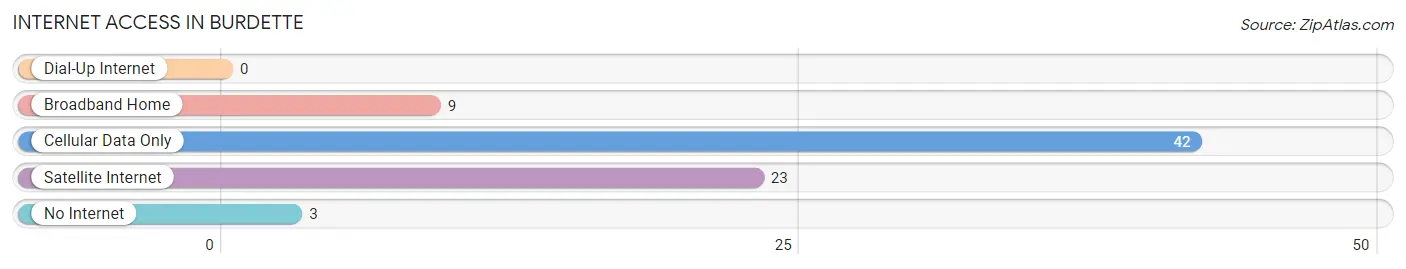
| Internet Type | # Households | % Households |
| Dial-Up Internet | 0 | 0.0% |
| Broadband Home | 9 | 12.3% |
| Cellular Data Only | 42 | 57.5% |
| Satellite Internet | 23 | 31.5% |
| No Internet | 3 | 4.1% |
| Total | 73 | 100.0% |
Burdette Summary
Burdette is a small town located in Mississippi County, Arkansas. It is situated on the banks of the Mississippi River, just south of the city of Osceola. The town was founded in 1883 and named after the Burdette family, who were early settlers in the area. The population of Burdette was estimated to be 545 in 2020.
History
The area that is now Burdette was first settled in the early 1800s by the Burdette family. The family was originally from Tennessee and moved to the area in search of better opportunities. The town was officially founded in 1883 and named after the Burdette family.
In the early 1900s, Burdette was a thriving agricultural community. Cotton was the main crop grown in the area, and the town was home to several cotton gins. The town also had a sawmill, a gristmill, and a blacksmith shop.
In the 1920s, the town began to decline as the cotton industry declined. The Great Depression further exacerbated the town’s economic woes. In the 1940s, the town began to experience a resurgence as the economy improved and new businesses opened.
Geography
Burdette is located in the Mississippi Delta region of Arkansas. The town is situated on the banks of the Mississippi River, just south of the city of Osceola. The town is surrounded by farmland and is located near the St. Francis National Forest.
The climate in Burdette is humid subtropical, with hot, humid summers and mild winters. The average annual temperature is around 64°F (18°C). The average annual precipitation is around 48 inches (122 cm).
Economy
The economy of Burdette is largely based on agriculture. Cotton is still the main crop grown in the area, although other crops such as soybeans, corn, and wheat are also grown. The town is also home to several small businesses, including a grocery store, a hardware store, and a restaurant.
Demographics
The population of Burdette was estimated to be 545 in 2020. The town is predominantly white, with a small African American population. The median household income is around $30,000, and the median home value is around $90,000.
The town is served by the Burdette School District, which includes an elementary school, a middle school, and a high school. The town is also home to a branch of the Mississippi County Library System.
Conclusion
Burdette is a small town located in Mississippi County, Arkansas. It was founded in 1883 and named after the Burdette family, who were early settlers in the area. The town is situated on the banks of the Mississippi River, just south of the city of Osceola. The economy of Burdette is largely based on agriculture, and the town is home to several small businesses. The population of Burdette was estimated to be 545 in 2020.
Common Questions
What is Per Capita Income in Burdette?
Per Capita income in Burdette is $41,125.
What is the Median Family Income in Burdette?
Median Family Income in Burdette is $100,833.
What is the Median Household income in Burdette?
Median Household Income in Burdette is $94,375.
What is Income or Wage Gap in Burdette?
Income or Wage Gap in Burdette is 75.4%.
Women in Burdette earn 24.6 cents for every dollar earned by a man.
What is Inequality or Gini Index in Burdette?
Inequality or Gini Index in Burdette is 0.24.
What is the Total Population of Burdette?
Total Population of Burdette is 173.
What is the Total Male Population of Burdette?
Total Male Population of Burdette is 88.
What is the Total Female Population of Burdette?
Total Female Population of Burdette is 85.
What is the Ratio of Males per 100 Females in Burdette?
There are 103.53 Males per 100 Females in Burdette.
What is the Ratio of Females per 100 Males in Burdette?
There are 96.59 Females per 100 Males in Burdette.
What is the Median Population Age in Burdette?
Median Population Age in Burdette is 38.1 Years.
What is the Average Family Size in Burdette
Average Family Size in Burdette is 3.0 People.
What is the Average Household Size in Burdette
Average Household Size in Burdette is 2.4 People.
How Large is the Labor Force in Burdette?
There are 70 People in the Labor Forcein in Burdette.
What is the Percentage of People in the Labor Force in Burdette?
54.7% of People are in the Labor Force in Burdette.
What is the Unemployment Rate in Burdette?
Unemployment Rate in Burdette is 4.3%.