Montezuma, CO Map & Demographics
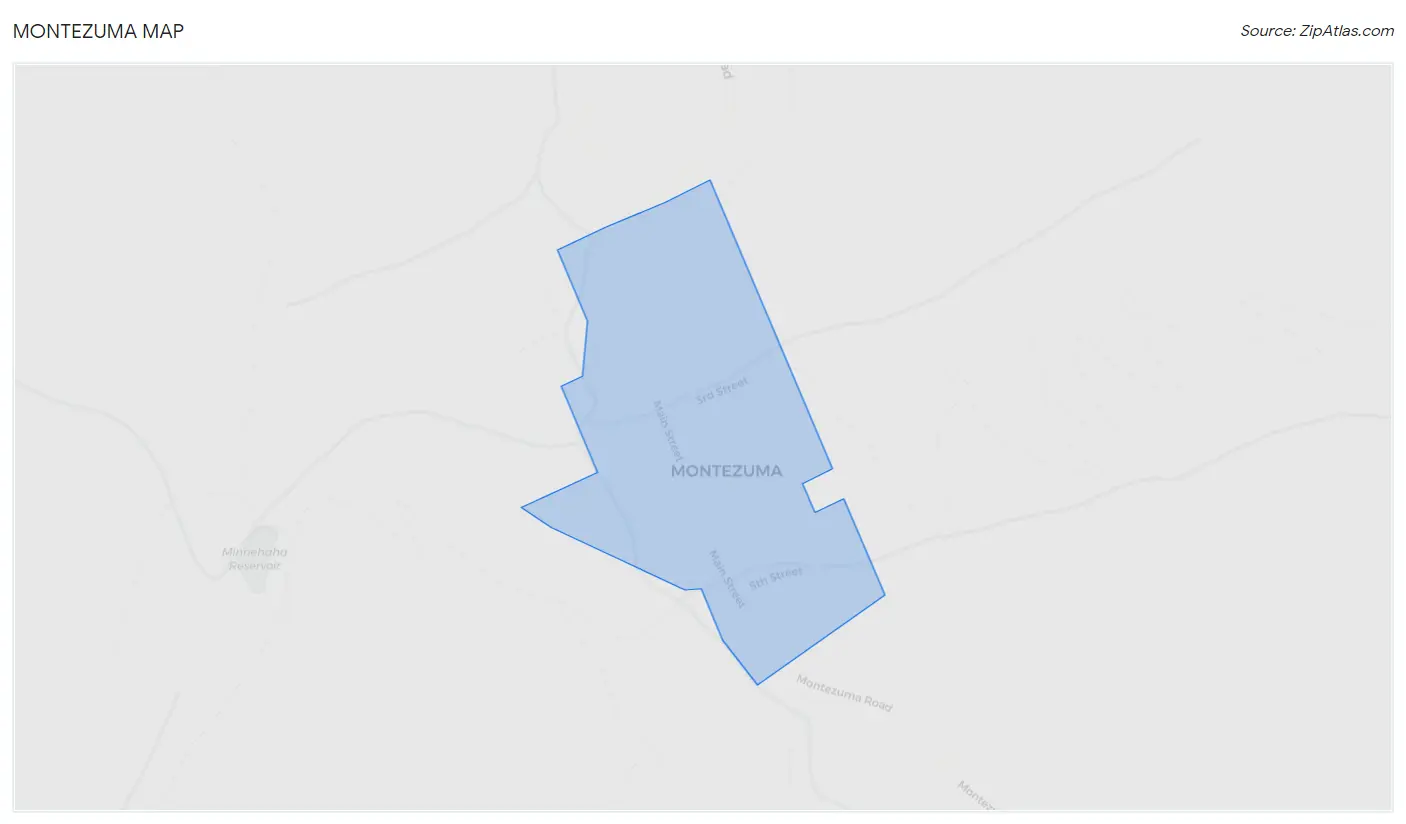
Montezuma Map
Montezuma Overview
$40,883
PER CAPITA INCOME
$147,727
AVG FAMILY INCOME
0.46
INEQUALITY / GINI INDEX
118
TOTAL POPULATION
91
MALE POPULATION
27
FEMALE POPULATION
337.04
MALES / 100 FEMALES
29.67
FEMALES / 100 MALES
35.9
MEDIAN AGE
3.2
AVG FAMILY SIZE
2.6
AVG HOUSEHOLD SIZE
75
LABOR FORCE [ PEOPLE ]
79.8%
PERCENT IN LABOR FORCE
21.3%
UNEMPLOYMENT RATE
Montezuma Area Codes
Income in Montezuma
Income Overview in Montezuma
| Characteristic | Number | Measure |
| Per Capita Income | 118 | $40,883 |
| Median Family Income | 24 | $147,727 |
| Mean Family Income | 24 | $125,813 |
| Median Household Income | 45 | $0 |
| Mean Household Income | 45 | $93,584 |
| Income Deficit | 24 | $0 |
| Wage / Income Gap (%) | 118 | 0.00% |
| Wage / Income Gap ($) | 118 | 100.00¢ per $1 |
| Gini / Inequality Index | 118 | 0.46 |
Earnings by Sex in Montezuma
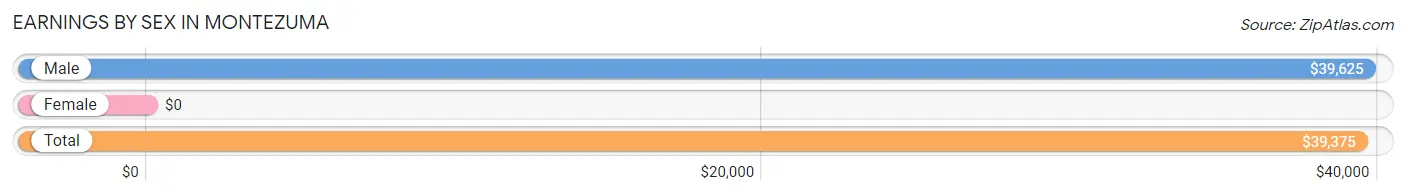
| Sex | Number | Average Earnings |
| Male | 67 (73.6%) | $39,625 |
| Female | 24 (26.4%) | $0 |
| Total | 91 (100.0%) | $39,375 |
Earnings by Sex by Income Bracket in Montezuma
The most common earnings brackets in Montezuma are $65,000 to $74,999 for men (14 | 20.9%) and $75,000 to $99,999 for women (11 | 45.8%).
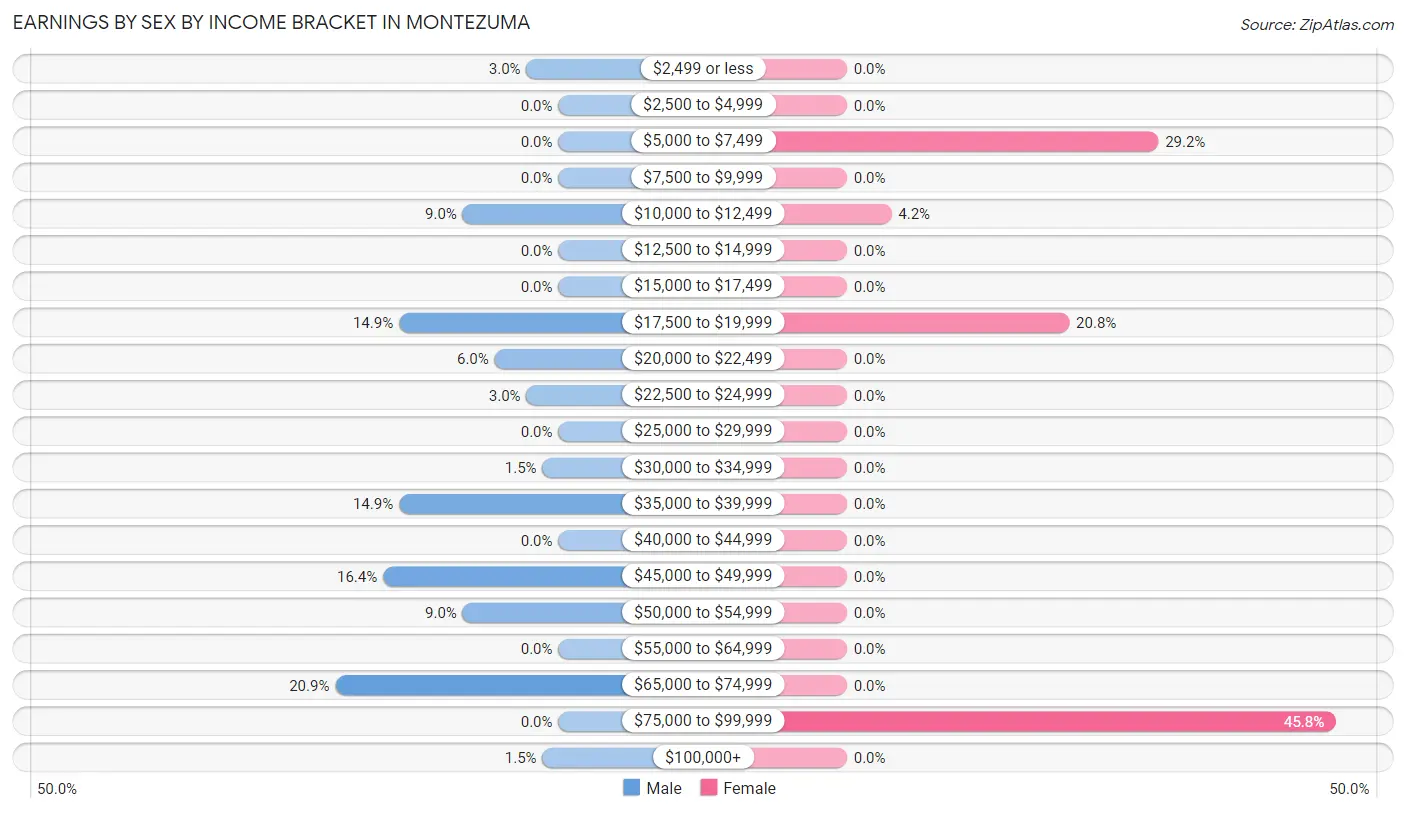
| Income | Male | Female |
| $2,499 or less | 2 (3.0%) | 0 (0.0%) |
| $2,500 to $4,999 | 0 (0.0%) | 0 (0.0%) |
| $5,000 to $7,499 | 0 (0.0%) | 7 (29.2%) |
| $7,500 to $9,999 | 0 (0.0%) | 0 (0.0%) |
| $10,000 to $12,499 | 6 (9.0%) | 1 (4.2%) |
| $12,500 to $14,999 | 0 (0.0%) | 0 (0.0%) |
| $15,000 to $17,499 | 0 (0.0%) | 0 (0.0%) |
| $17,500 to $19,999 | 10 (14.9%) | 5 (20.8%) |
| $20,000 to $22,499 | 4 (6.0%) | 0 (0.0%) |
| $22,500 to $24,999 | 2 (3.0%) | 0 (0.0%) |
| $25,000 to $29,999 | 0 (0.0%) | 0 (0.0%) |
| $30,000 to $34,999 | 1 (1.5%) | 0 (0.0%) |
| $35,000 to $39,999 | 10 (14.9%) | 0 (0.0%) |
| $40,000 to $44,999 | 0 (0.0%) | 0 (0.0%) |
| $45,000 to $49,999 | 11 (16.4%) | 0 (0.0%) |
| $50,000 to $54,999 | 6 (9.0%) | 0 (0.0%) |
| $55,000 to $64,999 | 0 (0.0%) | 0 (0.0%) |
| $65,000 to $74,999 | 14 (20.9%) | 0 (0.0%) |
| $75,000 to $99,999 | 0 (0.0%) | 11 (45.8%) |
| $100,000+ | 1 (1.5%) | 0 (0.0%) |
| Total | 67 (100.0%) | 24 (100.0%) |
Earnings by Sex by Educational Attainment in Montezuma
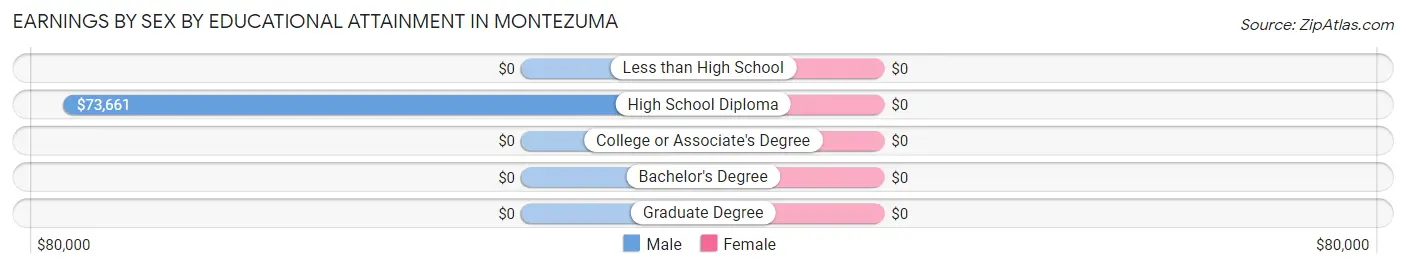
| Educational Attainment | Male Income | Female Income |
| Less than High School | - | - |
| High School Diploma | $73,661 | $0 |
| College or Associate's Degree | - | - |
| Bachelor's Degree | - | - |
| Graduate Degree | - | - |
| Total | $39,500 | $0 |
Family Income in Montezuma
Family Income Brackets in Montezuma
According to the Montezuma family income data, there are 11 families falling into the $100,000 to $149,999 income range, which is the most common income bracket and makes up 45.8% of all families.
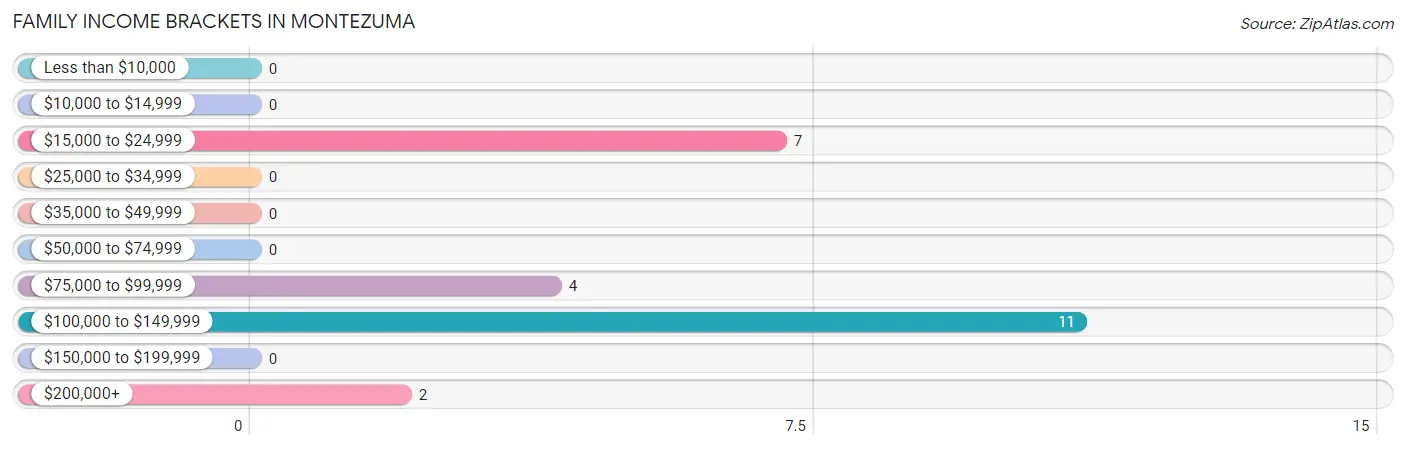
| Income Bracket | # Families | % Families |
| Less than $10,000 | 0 | 0.0% |
| $10,000 to $14,999 | 0 | 0.0% |
| $15,000 to $24,999 | 7 | 29.2% |
| $25,000 to $34,999 | 0 | 0.0% |
| $35,000 to $49,999 | 0 | 0.0% |
| $50,000 to $74,999 | 0 | 0.0% |
| $75,000 to $99,999 | 4 | 16.7% |
| $100,000 to $149,999 | 11 | 45.8% |
| $150,000 to $199,999 | 0 | 0.0% |
| $200,000+ | 2 | 8.3% |
Family Income by Famaliy Size in Montezuma
| Income Bracket | # Families | Median Income |
| 2-Person Families | 5 (20.8%) | $0 |
| 3-Person Families | 11 (45.8%) | $0 |
| 4-Person Families | 8 (33.3%) | $0 |
| 5-Person Families | 0 (0.0%) | $0 |
| 6-Person Families | 0 (0.0%) | $0 |
| 7+ Person Families | 0 (0.0%) | $0 |
| Total | 24 (100.0%) | $147,727 |
Family Income by Number of Earners in Montezuma
| Number of Earners | # Families | Median Income |
| No Earners | 1 (4.2%) | $0 |
| 1 Earner | 0 (0.0%) | $0 |
| 2 Earners | 23 (95.8%) | $0 |
| 3+ Earners | 0 (0.0%) | $0 |
| Total | 24 (100.0%) | $147,727 |
Household Income in Montezuma
Household Income Brackets in Montezuma
With 17 households falling in the category, the $100,000 to $149,999 income range is the most frequent in Montezuma, accounting for 37.8% of all households.
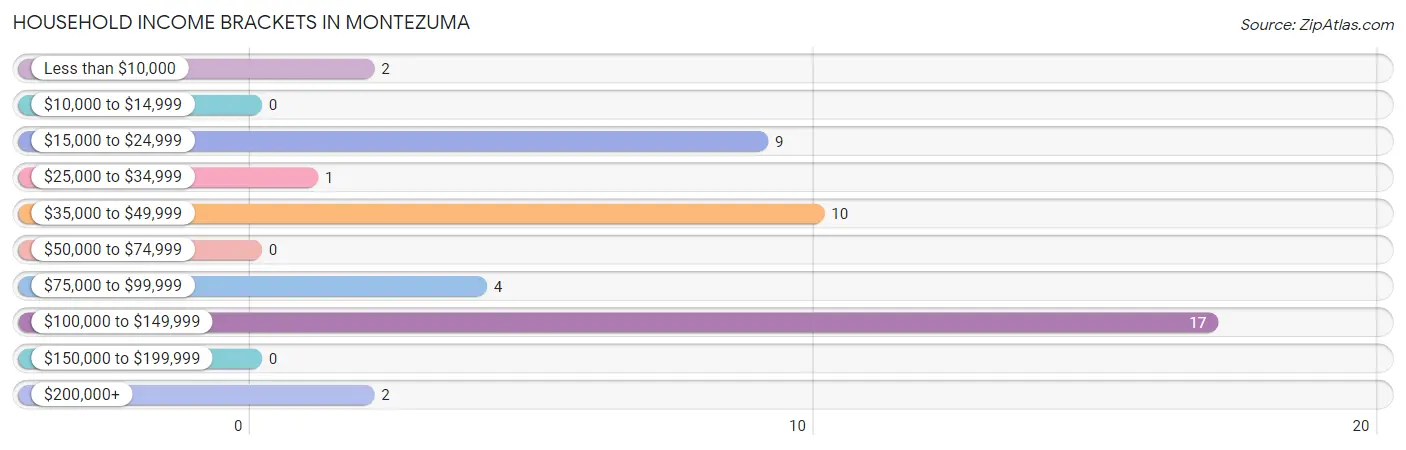
| Income Bracket | # Households | % Households |
| Less than $10,000 | 2 | 4.4% |
| $10,000 to $14,999 | 0 | 0.0% |
| $15,000 to $24,999 | 9 | 20.0% |
| $25,000 to $34,999 | 1 | 2.2% |
| $35,000 to $49,999 | 10 | 22.2% |
| $50,000 to $74,999 | 0 | 0.0% |
| $75,000 to $99,999 | 4 | 8.9% |
| $100,000 to $149,999 | 17 | 37.8% |
| $150,000 to $199,999 | 0 | 0.0% |
| $200,000+ | 2 | 4.4% |
Household Income by Householder Age in Montezuma
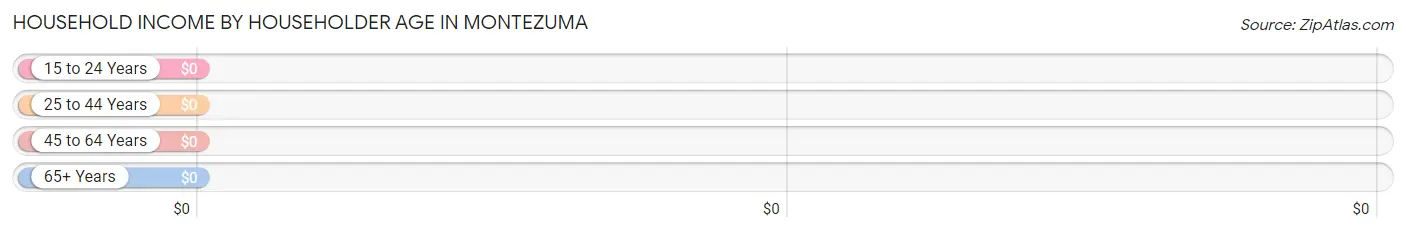
| Income Bracket | # Households | Median Income |
| 15 to 24 Years | 0 (0.0%) | $0 |
| 25 to 44 Years | 26 (57.8%) | $0 |
| 45 to 64 Years | 18 (40.0%) | $0 |
| 65+ Years | 1 (2.2%) | $0 |
| Total | 45 (100.0%) | $0 |
Poverty in Montezuma
Income Below Poverty by Sex and Age in Montezuma
With 24.2% poverty level for males and 25.9% for females among the residents of Montezuma, 6 to 11 year old males and 35 to 44 year old females are the most vulnerable to poverty, with 7 males (100.0%) and 7 females (38.9%) in their respective age groups living below the poverty level.
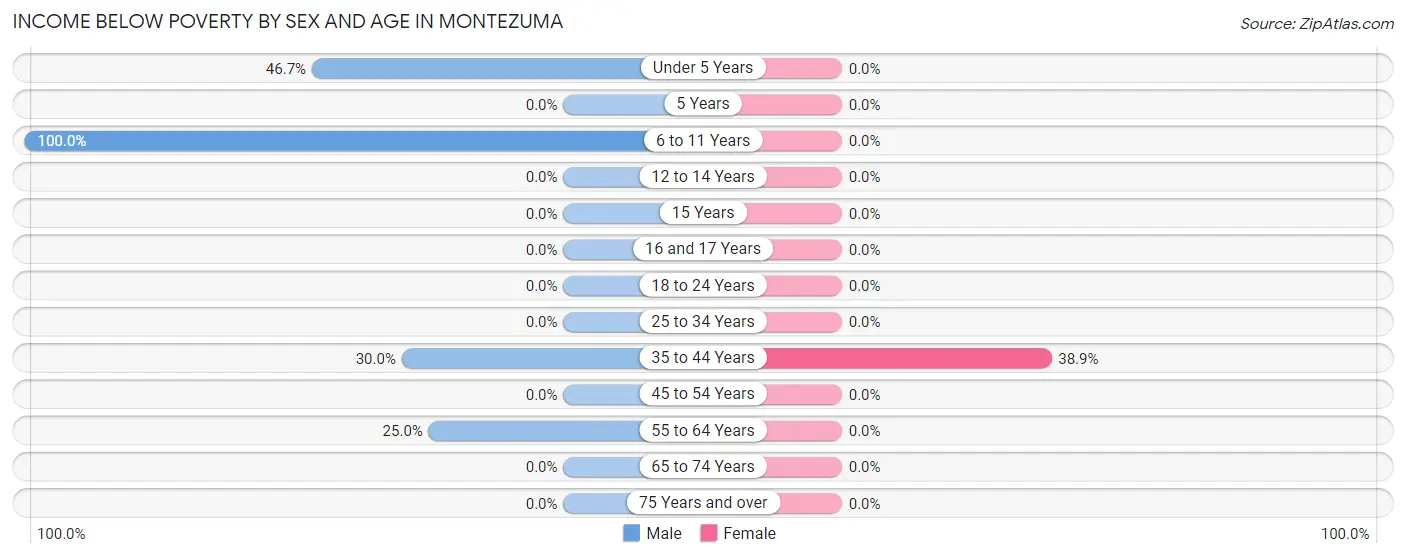
| Age Bracket | Male | Female |
| Under 5 Years | 7 (46.7%) | 0 (0.0%) |
| 5 Years | 0 (0.0%) | 0 (0.0%) |
| 6 to 11 Years | 7 (100.0%) | 0 (0.0%) |
| 12 to 14 Years | 0 (0.0%) | 0 (0.0%) |
| 15 Years | 0 (0.0%) | 0 (0.0%) |
| 16 and 17 Years | 0 (0.0%) | 0 (0.0%) |
| 18 to 24 Years | 0 (0.0%) | 0 (0.0%) |
| 25 to 34 Years | 0 (0.0%) | 0 (0.0%) |
| 35 to 44 Years | 6 (30.0%) | 7 (38.9%) |
| 45 to 54 Years | 0 (0.0%) | 0 (0.0%) |
| 55 to 64 Years | 2 (25.0%) | 0 (0.0%) |
| 65 to 74 Years | 0 (0.0%) | 0 (0.0%) |
| 75 Years and over | 0 (0.0%) | 0 (0.0%) |
| Total | 22 (24.2%) | 7 (25.9%) |
Income Above Poverty by Sex and Age in Montezuma
According to the poverty statistics in Montezuma, males aged 12 to 14 years and females aged 6 to 11 years are the age groups that are most secure financially, with 100.0% of males and 100.0% of females in these age groups living above the poverty line.
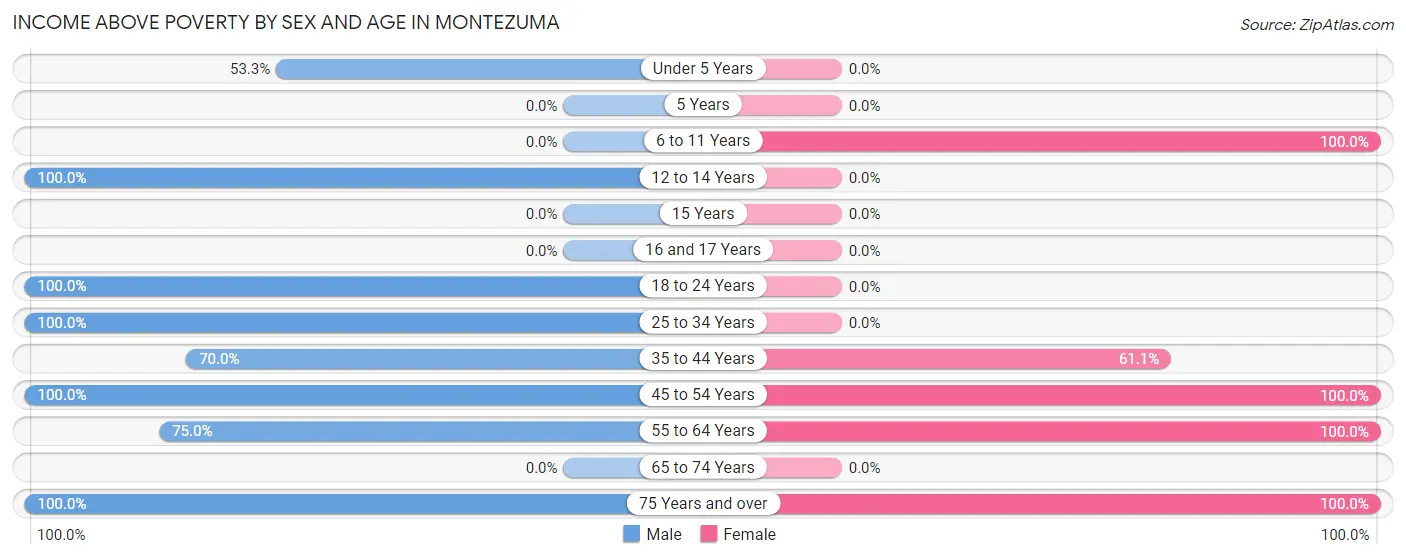
| Age Bracket | Male | Female |
| Under 5 Years | 8 (53.3%) | 0 (0.0%) |
| 5 Years | 0 (0.0%) | 0 (0.0%) |
| 6 to 11 Years | 0 (0.0%) | 1 (100.0%) |
| 12 to 14 Years | 1 (100.0%) | 0 (0.0%) |
| 15 Years | 0 (0.0%) | 0 (0.0%) |
| 16 and 17 Years | 0 (0.0%) | 0 (0.0%) |
| 18 to 24 Years | 21 (100.0%) | 0 (0.0%) |
| 25 to 34 Years | 8 (100.0%) | 0 (0.0%) |
| 35 to 44 Years | 14 (70.0%) | 11 (61.1%) |
| 45 to 54 Years | 10 (100.0%) | 1 (100.0%) |
| 55 to 64 Years | 6 (75.0%) | 5 (100.0%) |
| 65 to 74 Years | 0 (0.0%) | 0 (0.0%) |
| 75 Years and over | 1 (100.0%) | 2 (100.0%) |
| Total | 69 (75.8%) | 20 (74.1%) |
Income Below Poverty Among Married-Couple Families in Montezuma
The poverty statistics for married-couple families in Montezuma show that 29.2% or 7 of the total 24 families live below the poverty line. Families with 1 or 2 children have the highest poverty rate of 36.8%, comprising of 7 families. On the other hand, families with no children have the lowest poverty rate of 0.0%, which includes 0 families.
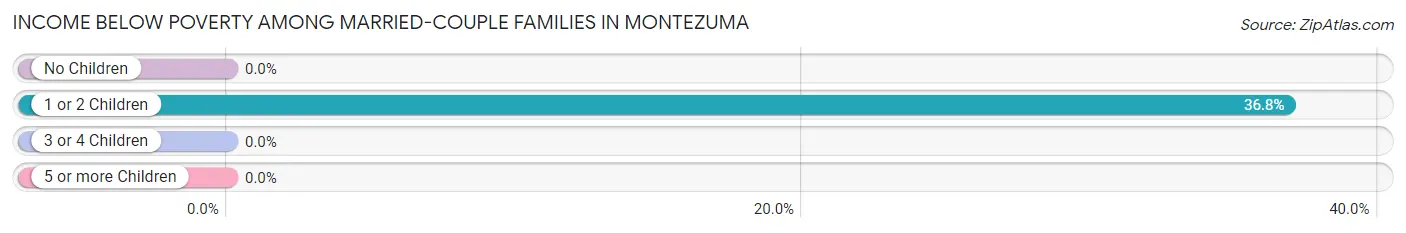
| Children | Above Poverty | Below Poverty |
| No Children | 5 (100.0%) | 0 (0.0%) |
| 1 or 2 Children | 12 (63.2%) | 7 (36.8%) |
| 3 or 4 Children | 0 (0.0%) | 0 (0.0%) |
| 5 or more Children | 0 (0.0%) | 0 (0.0%) |
| Total | 17 (70.8%) | 7 (29.2%) |
Income Below Poverty Among Single-Parent Households in Montezuma
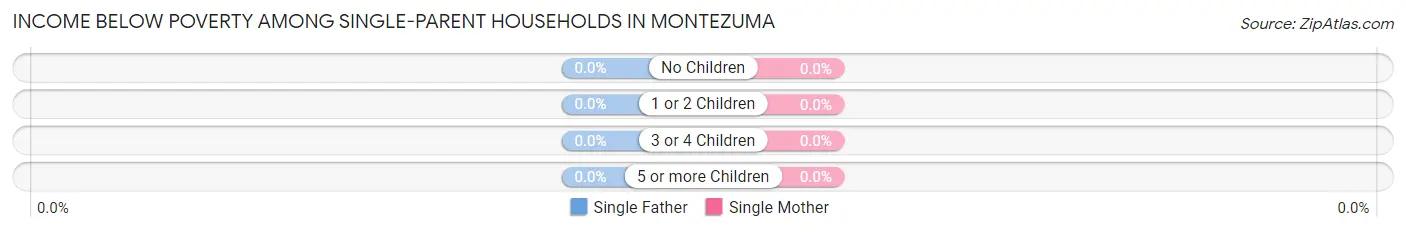
| Children | Single Father | Single Mother |
| No Children | 0 (0.0%) | 0 (0.0%) |
| 1 or 2 Children | 0 (0.0%) | 0 (0.0%) |
| 3 or 4 Children | 0 (0.0%) | 0 (0.0%) |
| 5 or more Children | 0 (0.0%) | 0 (0.0%) |
| Total | 0 (0.0%) | 0 (0.0%) |
Income Below Poverty Among Married-Couple vs Single-Parent Households in Montezuma
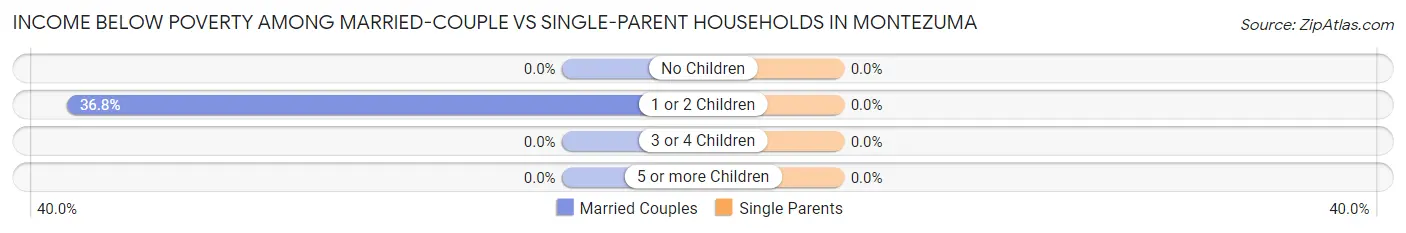
| Children | Married-Couple Families | Single-Parent Households |
| No Children | 0 (0.0%) | 0 (0.0%) |
| 1 or 2 Children | 7 (36.8%) | 0 (0.0%) |
| 3 or 4 Children | 0 (0.0%) | 0 (0.0%) |
| 5 or more Children | 0 (0.0%) | 0 (0.0%) |
| Total | 7 (29.2%) | 0 (0.0%) |
Race in Montezuma
The most populous races in Montezuma are , and White / Caucasian (118 | 100.0%).
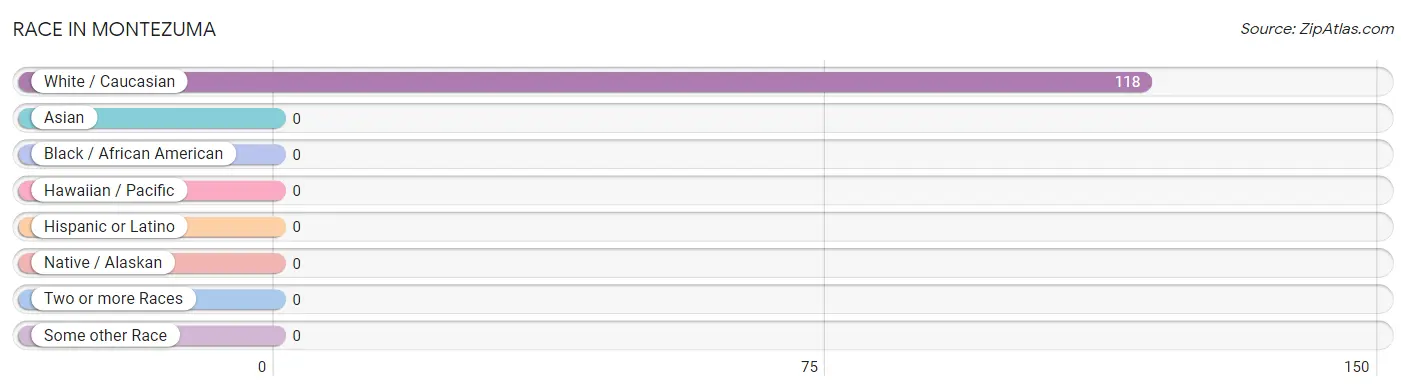
| Race | # Population | % Population |
| Asian | 0 | 0.0% |
| Black / African American | 0 | 0.0% |
| Hawaiian / Pacific | 0 | 0.0% |
| Hispanic or Latino | 0 | 0.0% |
| Native / Alaskan | 0 | 0.0% |
| White / Caucasian | 118 | 100.0% |
| Two or more Races | 0 | 0.0% |
| Some other Race | 0 | 0.0% |
| Total | 118 | 100.0% |
Ancestry in Montezuma
The most populous ancestries reported in Montezuma are American (27 | 22.9%), English (18 | 15.2%), German (16 | 13.6%), Welsh (15 | 12.7%), and Norwegian (10 | 8.5%), together accounting for 72.9% of all Montezuma residents.
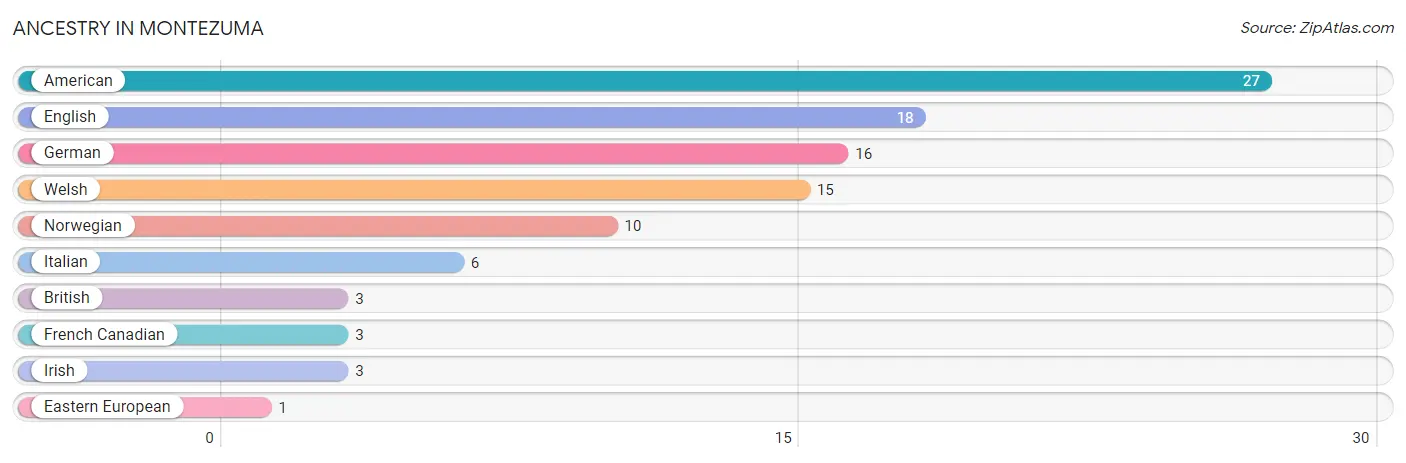
| Ancestry | # Population | % Population |
| American | 27 | 22.9% |
| British | 3 | 2.5% |
| Eastern European | 1 | 0.9% |
| English | 18 | 15.2% |
| French Canadian | 3 | 2.5% |
| German | 16 | 13.6% |
| Irish | 3 | 2.5% |
| Italian | 6 | 5.1% |
| Norwegian | 10 | 8.5% |
| Welsh | 15 | 12.7% | View All 10 Rows |
Immigrants in Montezuma

| Immigration Origin | # Population | % Population | View All 0 Rows |
Sex and Age in Montezuma
Sex and Age in Montezuma
The most populous age groups in Montezuma are 20 to 24 Years (21 | 23.1%) for men and 40 to 44 Years (11 | 40.7%) for women.
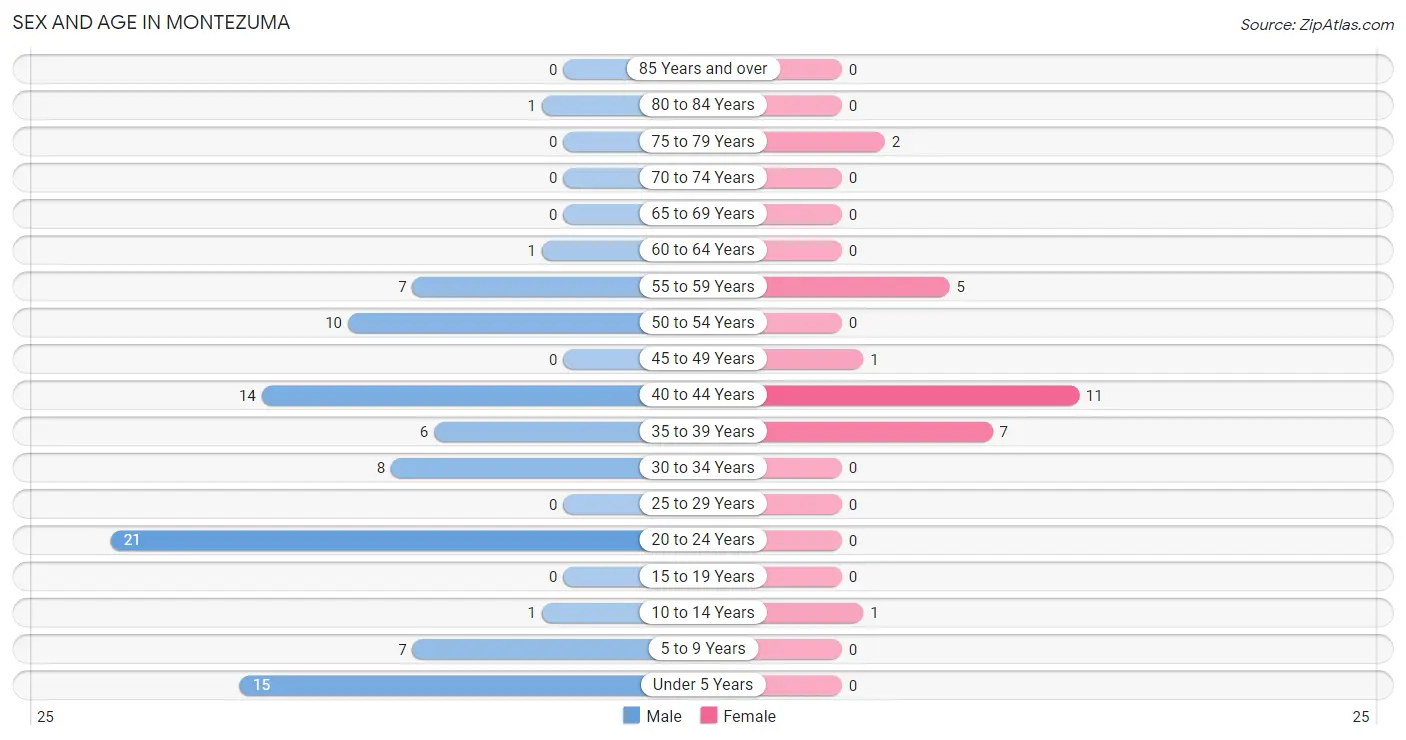
| Age Bracket | Male | Female |
| Under 5 Years | 15 (16.5%) | 0 (0.0%) |
| 5 to 9 Years | 7 (7.7%) | 0 (0.0%) |
| 10 to 14 Years | 1 (1.1%) | 1 (3.7%) |
| 15 to 19 Years | 0 (0.0%) | 0 (0.0%) |
| 20 to 24 Years | 21 (23.1%) | 0 (0.0%) |
| 25 to 29 Years | 0 (0.0%) | 0 (0.0%) |
| 30 to 34 Years | 8 (8.8%) | 0 (0.0%) |
| 35 to 39 Years | 6 (6.6%) | 7 (25.9%) |
| 40 to 44 Years | 14 (15.4%) | 11 (40.7%) |
| 45 to 49 Years | 0 (0.0%) | 1 (3.7%) |
| 50 to 54 Years | 10 (11.0%) | 0 (0.0%) |
| 55 to 59 Years | 7 (7.7%) | 5 (18.5%) |
| 60 to 64 Years | 1 (1.1%) | 0 (0.0%) |
| 65 to 69 Years | 0 (0.0%) | 0 (0.0%) |
| 70 to 74 Years | 0 (0.0%) | 0 (0.0%) |
| 75 to 79 Years | 0 (0.0%) | 2 (7.4%) |
| 80 to 84 Years | 1 (1.1%) | 0 (0.0%) |
| 85 Years and over | 0 (0.0%) | 0 (0.0%) |
| Total | 91 (100.0%) | 27 (100.0%) |
Families and Households in Montezuma
Median Family Size in Montezuma
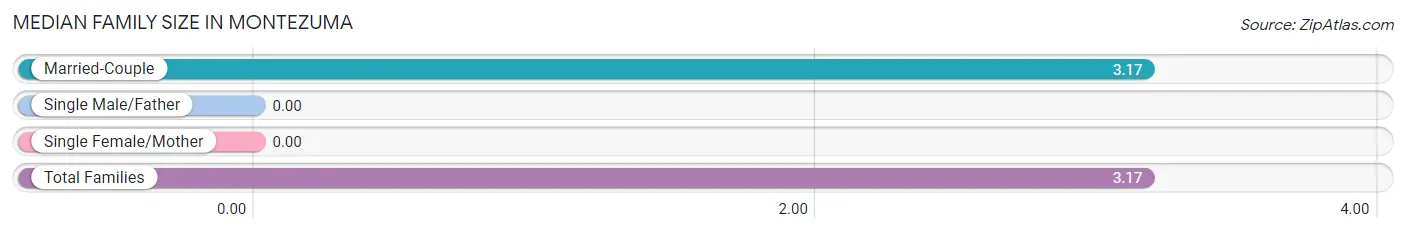
| Family Type | # Families | Family Size |
| Married-Couple | 24 (100.0%) | 3.17 |
| Single Male/Father | 0 (0.0%) | - |
| Single Female/Mother | 0 (0.0%) | - |
| Total Families | 24 (100.0%) | 3.17 |
Median Household Size in Montezuma
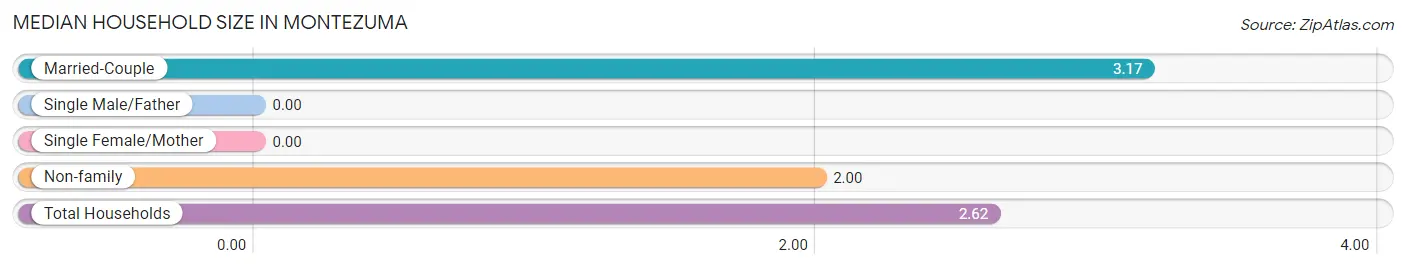
| Household Type | # Households | Household Size |
| Married-Couple | 24 (53.3%) | 3.17 |
| Single Male/Father | 0 (0.0%) | - |
| Single Female/Mother | 0 (0.0%) | - |
| Non-family | 21 (46.7%) | 2.00 |
| Total Households | 45 (100.0%) | 2.62 |
Household Size by Marriage Status in Montezuma
Out of a total of 45 households in Montezuma, 24 (53.3%) are family households, while 21 (46.7%) are nonfamily households. The most numerous type of family households are 3-person households, comprising 11, and the most common type of nonfamily households are 1-person households, comprising 15.
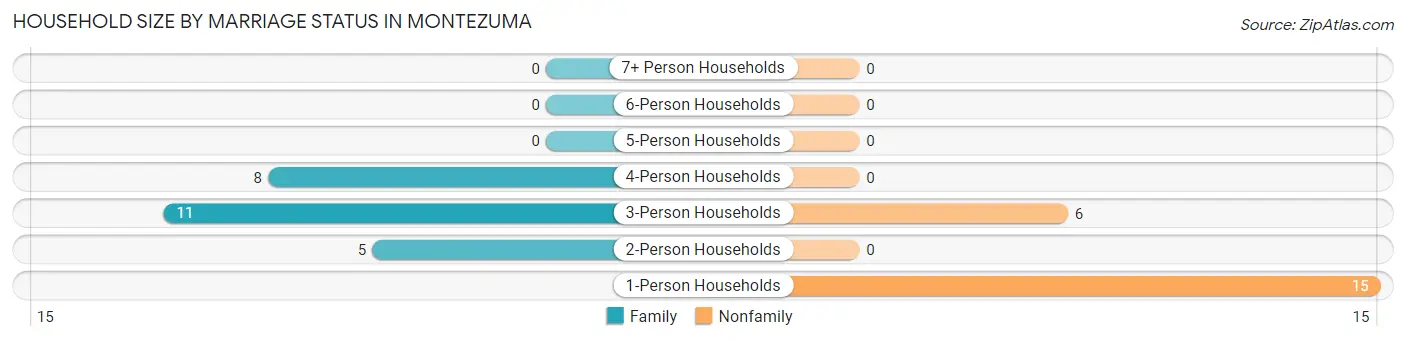
| Household Size | Family Households | Nonfamily Households |
| 1-Person Households | - | 15 (33.3%) |
| 2-Person Households | 5 (11.1%) | 0 (0.0%) |
| 3-Person Households | 11 (24.4%) | 6 (13.3%) |
| 4-Person Households | 8 (17.8%) | 0 (0.0%) |
| 5-Person Households | 0 (0.0%) | 0 (0.0%) |
| 6-Person Households | 0 (0.0%) | 0 (0.0%) |
| 7+ Person Households | 0 (0.0%) | 0 (0.0%) |
| Total | 24 (53.3%) | 21 (46.7%) |
Female Fertility in Montezuma
Fertility by Age in Montezuma
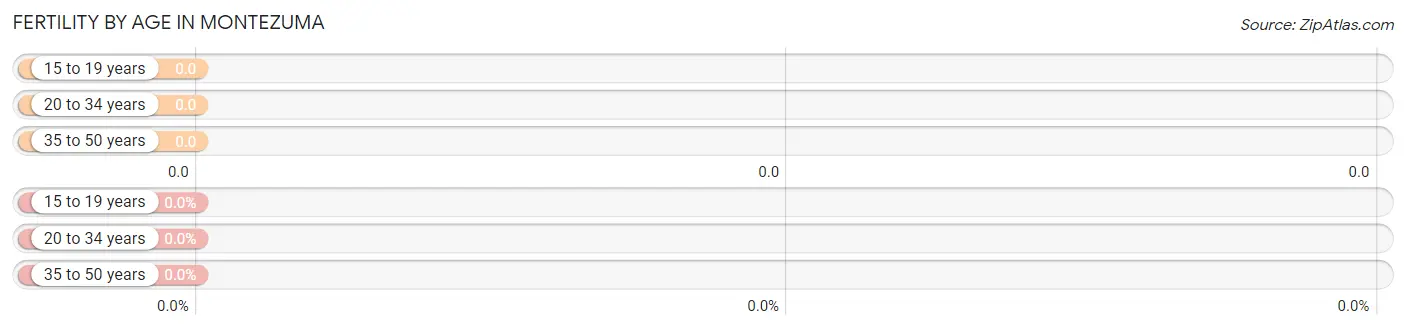
| Age Bracket | Women with Births | Births / 1,000 Women |
| 15 to 19 years | 0 (0.0%) | 0.0 |
| 20 to 34 years | 0 (0.0%) | 0.0 |
| 35 to 50 years | 0 (0.0%) | 0.0 |
| Total | 0 (0.0%) | 0.0 |
Fertility by Age by Marriage Status in Montezuma
| Age Bracket | Married | Unmarried |
| 15 to 19 years | 0 (0.0%) | 0 (0.0%) |
| 20 to 34 years | 0 (0.0%) | 0 (0.0%) |
| 35 to 50 years | 0 (0.0%) | 0 (0.0%) |
| Total | 0 (0.0%) | 0 (0.0%) |
Fertility by Education in Montezuma
| Educational Attainment | Women with Births | Births / 1,000 Women |
| Less than High School | 0 (0.0%) | 0.0 |
| High School Diploma | 0 (0.0%) | 0.0 |
| College or Associate's Degree | 0 (0.0%) | 0.0 |
| Bachelor's Degree | 0 (0.0%) | 0.0 |
| Graduate Degree | 0 (0.0%) | 0.0 |
| Total | 0 (0.0%) | 0.0 |
Fertility by Education by Marriage Status in Montezuma
| Educational Attainment | Married | Unmarried |
| Less than High School | 0 (0.0%) | 0 (0.0%) |
| High School Diploma | 0 (0.0%) | 0 (0.0%) |
| College or Associate's Degree | 0 (0.0%) | 0 (0.0%) |
| Bachelor's Degree | 0 (0.0%) | 0 (0.0%) |
| Graduate Degree | 0 (0.0%) | 0 (0.0%) |
| Total | 0 (0.0%) | 0 (0.0%) |
Employment Characteristics in Montezuma
Employment by Class of Employer in Montezuma
Among the 59 employed individuals in Montezuma, private company employees (33 | 55.9%), local government employees (14 | 23.7%), and not-for-profit organizations (11 | 18.6%) make up the most common classes of employment.
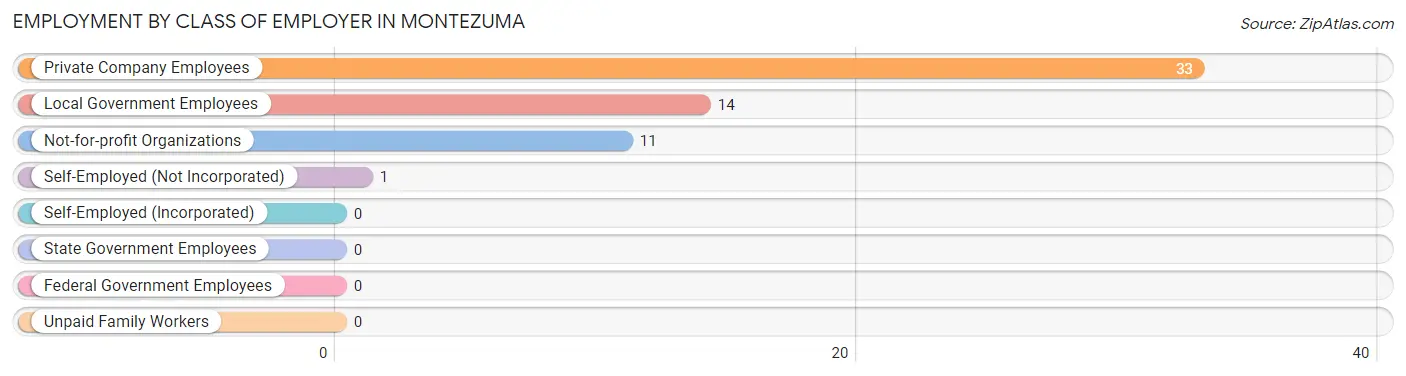
| Employer Class | # Employees | % Employees |
| Private Company Employees | 33 | 55.9% |
| Self-Employed (Incorporated) | 0 | 0.0% |
| Self-Employed (Not Incorporated) | 1 | 1.7% |
| Not-for-profit Organizations | 11 | 18.6% |
| Local Government Employees | 14 | 23.7% |
| State Government Employees | 0 | 0.0% |
| Federal Government Employees | 0 | 0.0% |
| Unpaid Family Workers | 0 | 0.0% |
| Total | 59 | 100.0% |
Employment Status by Age in Montezuma
According to the labor force statistics for Montezuma, out of the total population over 16 years of age (94), 79.8% or 75 individuals are in the labor force, with 21.3% or 16 of them unemployed. The age group with the highest labor force participation rate is 20 to 24 years, with 100.0% or 21 individuals in the labor force. Within the labor force, the 30 to 34 years age range has the highest percentage of unemployed individuals, with 75.0% or 6 of them being unemployed.
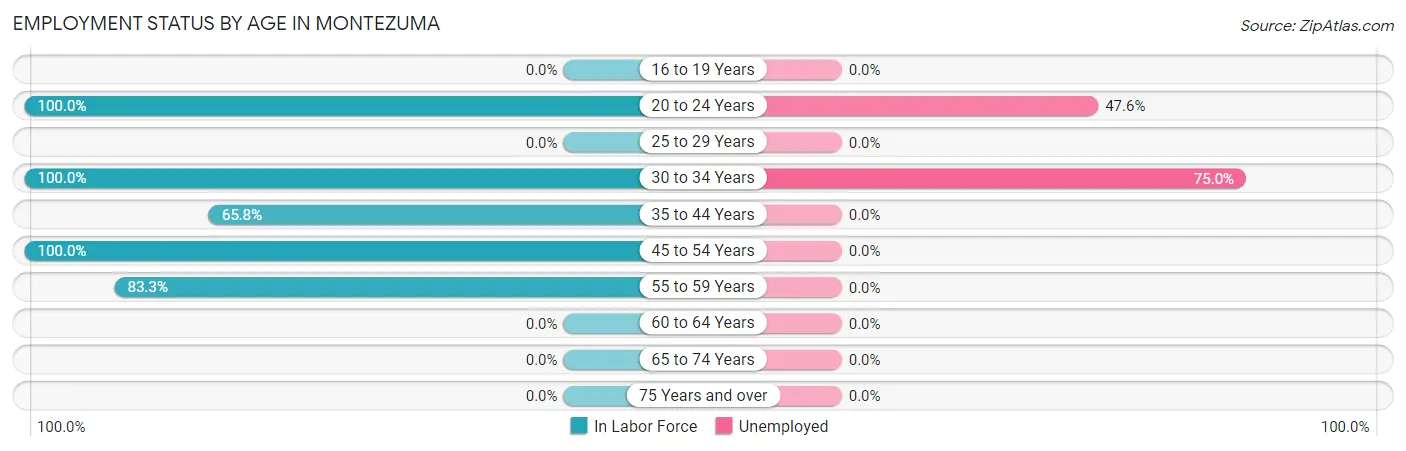
| Age Bracket | In Labor Force | Unemployed |
| 16 to 19 Years | 0 (0.0%) | 0 (0.0%) |
| 20 to 24 Years | 21 (100.0%) | 10 (47.6%) |
| 25 to 29 Years | 0 (0.0%) | 0 (0.0%) |
| 30 to 34 Years | 8 (100.0%) | 6 (75.0%) |
| 35 to 44 Years | 25 (65.8%) | 0 (0.0%) |
| 45 to 54 Years | 11 (100.0%) | 0 (0.0%) |
| 55 to 59 Years | 10 (83.3%) | 0 (0.0%) |
| 60 to 64 Years | 0 (0.0%) | 0 (0.0%) |
| 65 to 74 Years | 0 (0.0%) | 0 (0.0%) |
| 75 Years and over | 0 (0.0%) | 0 (0.0%) |
| Total | 75 (79.8%) | 16 (21.3%) |
Employment Status by Educational Attainment in Montezuma
According to labor force statistics for Montezuma, 77.1% of individuals (54) out of the total population between 25 and 64 years of age (70) are in the labor force, with 11.1% or 6 of them being unemployed. The group with the highest labor force participation rate are those with the educational attainment of less than high school, with 100.0% or 10 individuals in the labor force. Within the labor force, individuals with college / associate degree education have the highest percentage of unemployment, with 50.0% or 6 of them being unemployed.
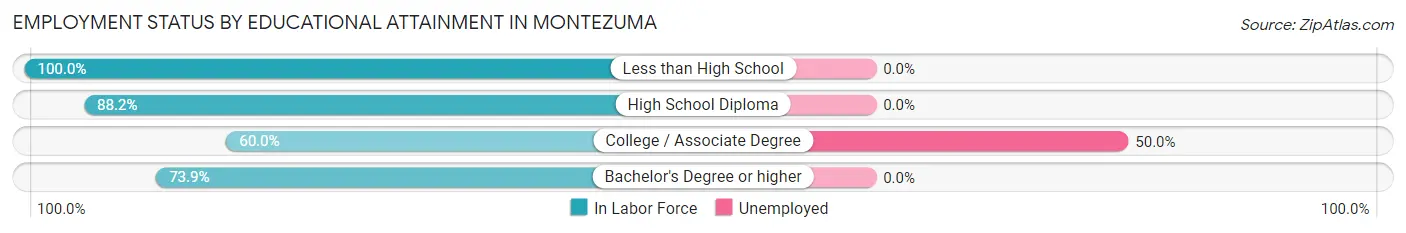
| Educational Attainment | In Labor Force | Unemployed |
| Less than High School | 10 (100.0%) | 0 (0.0%) |
| High School Diploma | 15 (88.2%) | 0 (0.0%) |
| College / Associate Degree | 12 (60.0%) | 10 (50.0%) |
| Bachelor's Degree or higher | 17 (73.9%) | 0 (0.0%) |
| Total | 54 (77.1%) | 8 (11.1%) |
Employment Occupations by Sex in Montezuma
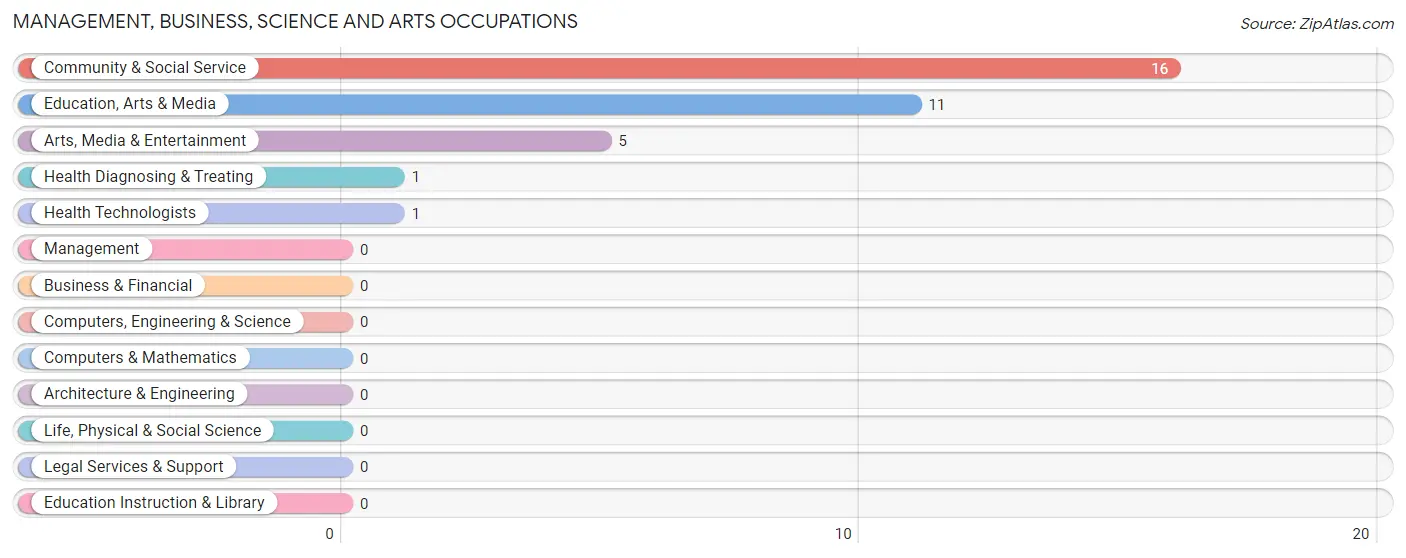
Management, Business, Science and Arts Occupations
The most common Management, Business, Science and Arts occupations in Montezuma are Community & Social Service (16 | 27.1%), Education, Arts & Media (11 | 18.6%), Arts, Media & Entertainment (5 | 8.5%), Health Diagnosing & Treating (1 | 1.7%), and Health Technologists (1 | 1.7%).
Management, Business, Science and Arts Occupations by Sex
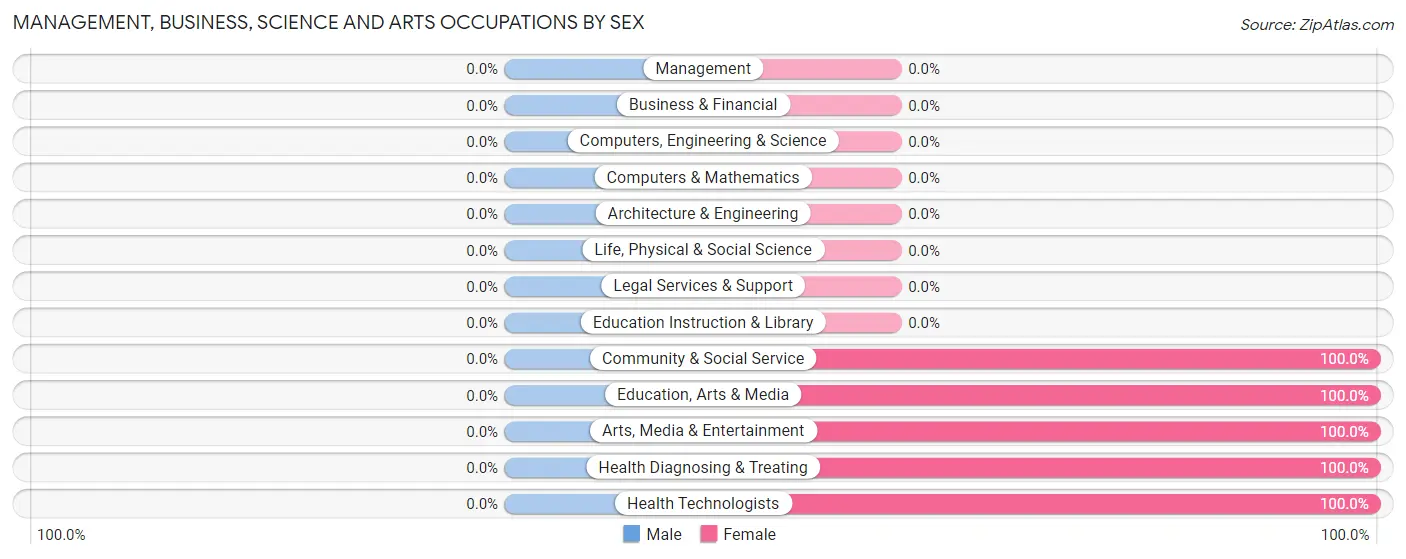
| Occupation | Male | Female |
| Management | 0 (0.0%) | 0 (0.0%) |
| Business & Financial | 0 (0.0%) | 0 (0.0%) |
| Computers, Engineering & Science | 0 (0.0%) | 0 (0.0%) |
| Computers & Mathematics | 0 (0.0%) | 0 (0.0%) |
| Architecture & Engineering | 0 (0.0%) | 0 (0.0%) |
| Life, Physical & Social Science | 0 (0.0%) | 0 (0.0%) |
| Community & Social Service | 0 (0.0%) | 16 (100.0%) |
| Education, Arts & Media | 0 (0.0%) | 11 (100.0%) |
| Legal Services & Support | 0 (0.0%) | 0 (0.0%) |
| Education Instruction & Library | 0 (0.0%) | 0 (0.0%) |
| Arts, Media & Entertainment | 0 (0.0%) | 5 (100.0%) |
| Health Diagnosing & Treating | 0 (0.0%) | 1 (100.0%) |
| Health Technologists | 0 (0.0%) | 1 (100.0%) |
| Total (Category) | 0 (0.0%) | 17 (100.0%) |
| Total (Overall) | 42 (71.2%) | 17 (28.8%) |
Services Occupations
The most common Services occupations in Montezuma are Security & Protection (11 | 18.6%), and Firefighting & Prevention (11 | 18.6%).
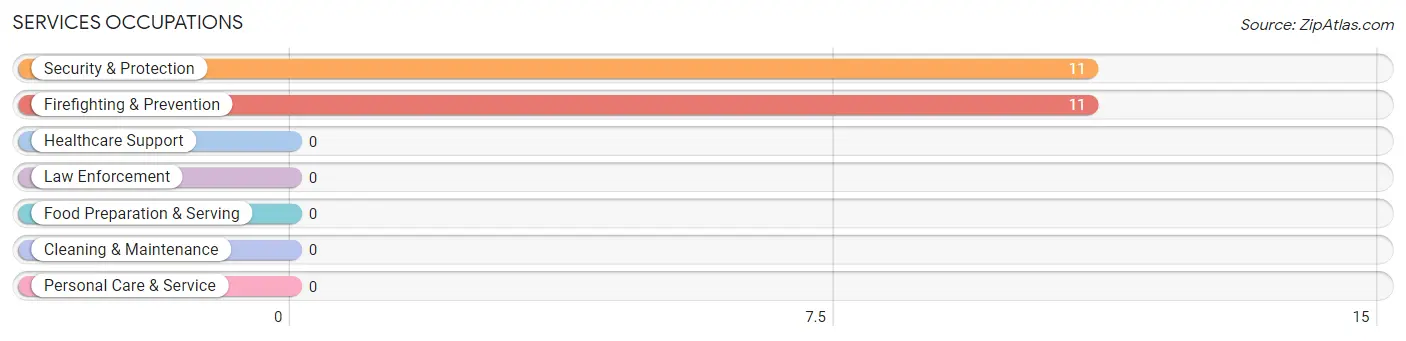
Services Occupations by Sex
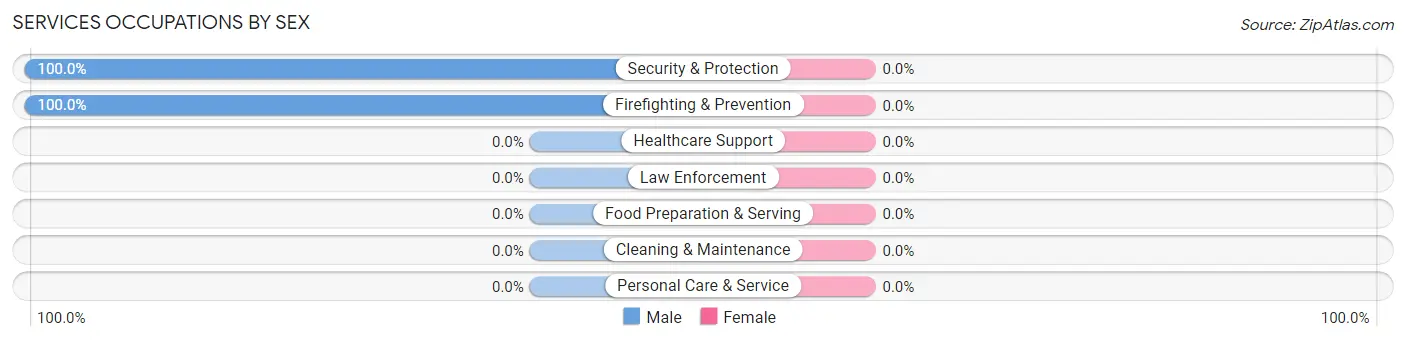
| Occupation | Male | Female |
| Healthcare Support | 0 (0.0%) | 0 (0.0%) |
| Security & Protection | 11 (100.0%) | 0 (0.0%) |
| Firefighting & Prevention | 11 (100.0%) | 0 (0.0%) |
| Law Enforcement | 0 (0.0%) | 0 (0.0%) |
| Food Preparation & Serving | 0 (0.0%) | 0 (0.0%) |
| Cleaning & Maintenance | 0 (0.0%) | 0 (0.0%) |
| Personal Care & Service | 0 (0.0%) | 0 (0.0%) |
| Total (Category) | 11 (100.0%) | 0 (0.0%) |
| Total (Overall) | 42 (71.2%) | 17 (28.8%) |
Sales and Office Occupations
The most common Sales and Office occupations in Montezuma are Office & Administration (10 | 17.0%), and Sales & Related (4 | 6.8%).
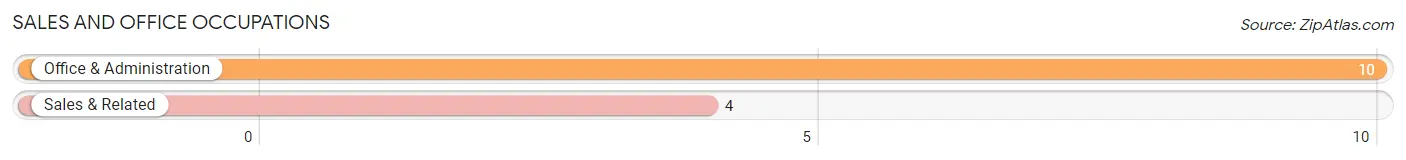
Sales and Office Occupations by Sex
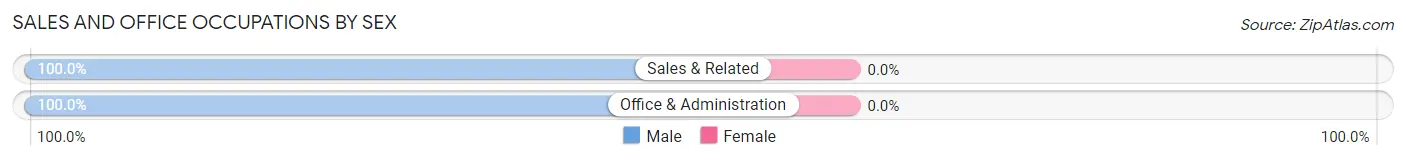
| Occupation | Male | Female |
| Sales & Related | 4 (100.0%) | 0 (0.0%) |
| Office & Administration | 10 (100.0%) | 0 (0.0%) |
| Total (Category) | 14 (100.0%) | 0 (0.0%) |
| Total (Overall) | 42 (71.2%) | 17 (28.8%) |
Natural Resources, Construction and Maintenance Occupations
The most common Natural Resources, Construction and Maintenance occupations in Montezuma are Installation, Maintenance & Repair (14 | 23.7%), Farming, Fishing & Forestry (2 | 3.4%), and Construction & Extraction (1 | 1.7%).
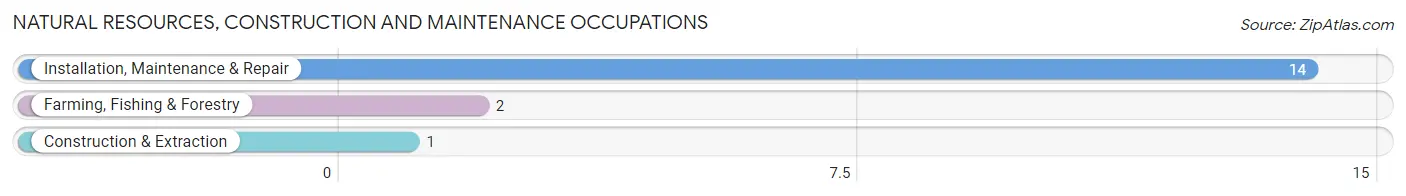
Natural Resources, Construction and Maintenance Occupations by Sex
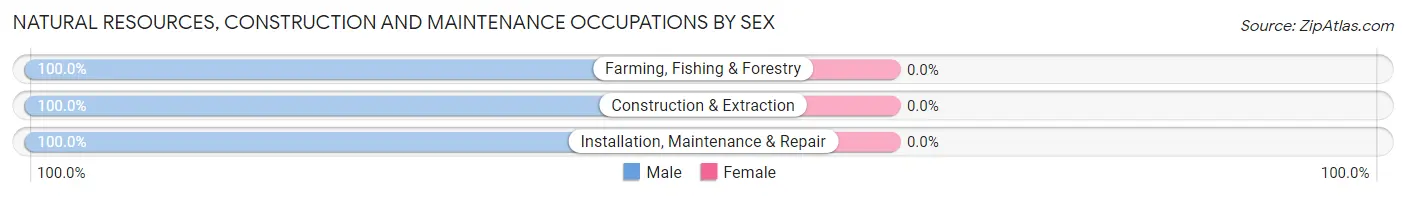
| Occupation | Male | Female |
| Farming, Fishing & Forestry | 2 (100.0%) | 0 (0.0%) |
| Construction & Extraction | 1 (100.0%) | 0 (0.0%) |
| Installation, Maintenance & Repair | 14 (100.0%) | 0 (0.0%) |
| Total (Category) | 17 (100.0%) | 0 (0.0%) |
| Total (Overall) | 42 (71.2%) | 17 (28.8%) |
Production, Transportation and Moving Occupations
Production, Transportation and Moving Occupations by Sex
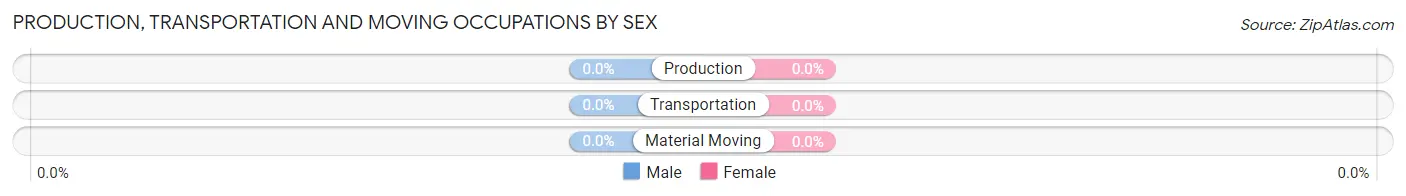
| Occupation | Male | Female |
| Production | 0 (0.0%) | 0 (0.0%) |
| Transportation | 0 (0.0%) | 0 (0.0%) |
| Material Moving | 0 (0.0%) | 0 (0.0%) |
| Total (Category) | 0 (0.0%) | 0 (0.0%) |
| Total (Overall) | 42 (71.2%) | 17 (28.8%) |
Employment Industries by Sex in Montezuma
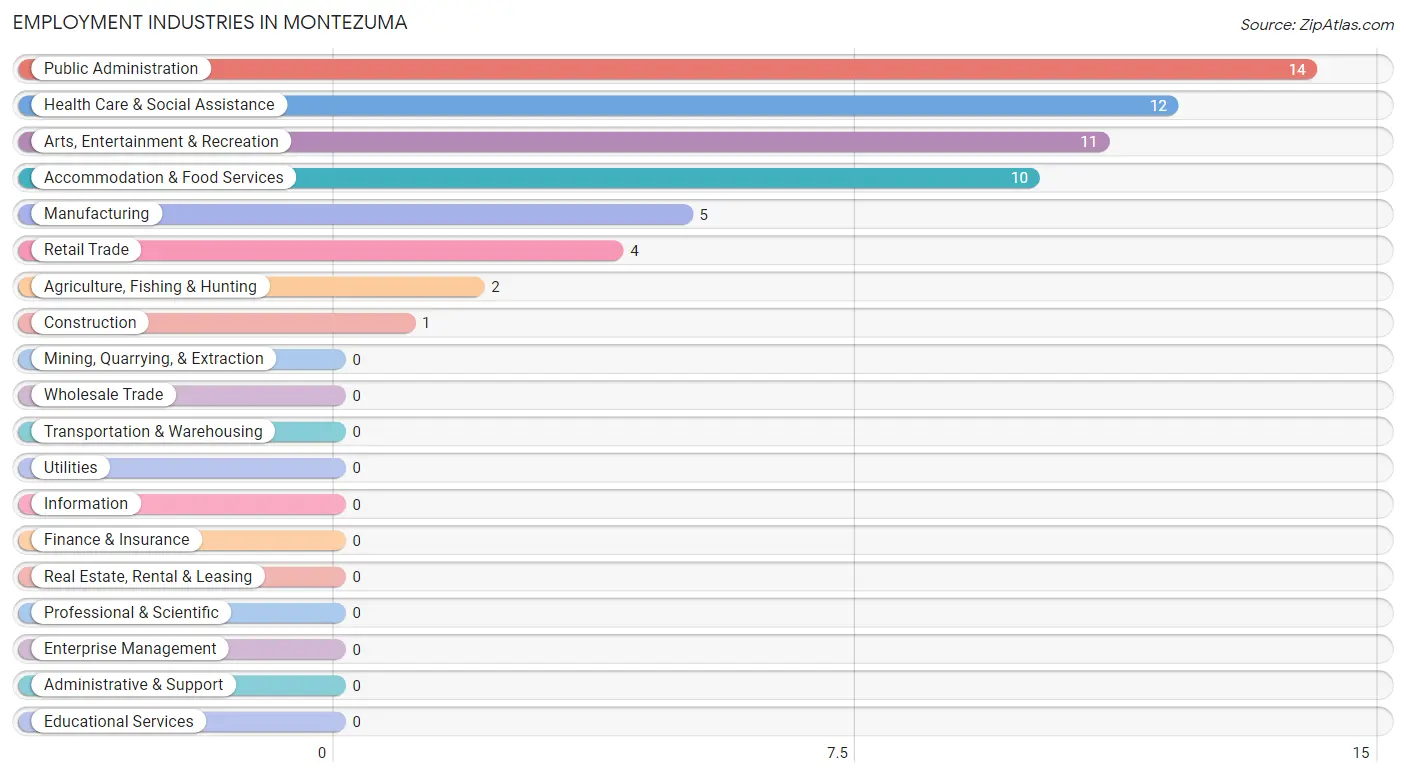
Employment Industries in Montezuma
The major employment industries in Montezuma include Public Administration (14 | 23.7%), Health Care & Social Assistance (12 | 20.3%), Arts, Entertainment & Recreation (11 | 18.6%), Accommodation & Food Services (10 | 17.0%), and Manufacturing (5 | 8.5%).
Employment Industries by Sex in Montezuma
The Montezuma industries that see more men than women are Agriculture, Fishing & Hunting (100.0%), Construction (100.0%), and Retail Trade (100.0%), whereas the industries that tend to have a higher number of women are Manufacturing (100.0%), and Health Care & Social Assistance (100.0%).
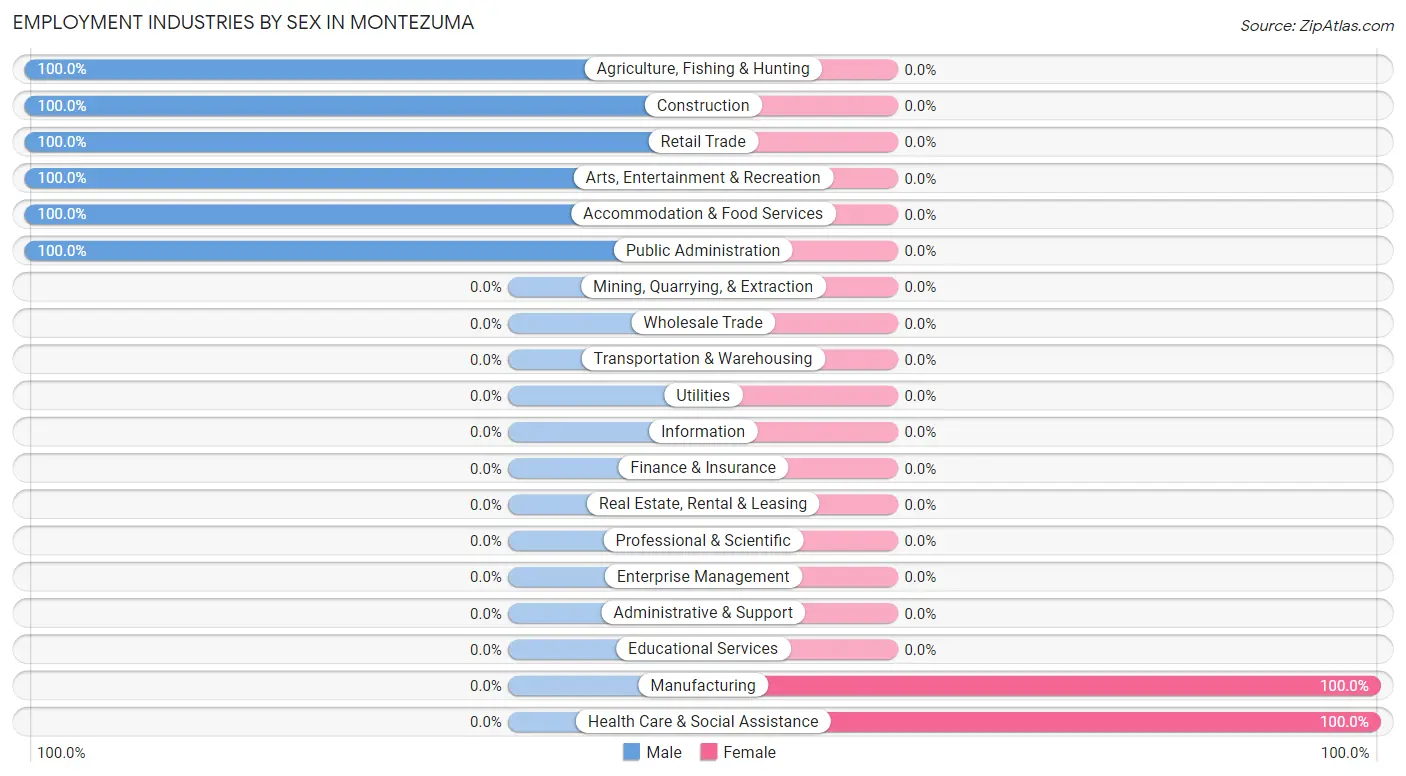
| Industry | Male | Female |
| Agriculture, Fishing & Hunting | 2 (100.0%) | 0 (0.0%) |
| Mining, Quarrying, & Extraction | 0 (0.0%) | 0 (0.0%) |
| Construction | 1 (100.0%) | 0 (0.0%) |
| Manufacturing | 0 (0.0%) | 5 (100.0%) |
| Wholesale Trade | 0 (0.0%) | 0 (0.0%) |
| Retail Trade | 4 (100.0%) | 0 (0.0%) |
| Transportation & Warehousing | 0 (0.0%) | 0 (0.0%) |
| Utilities | 0 (0.0%) | 0 (0.0%) |
| Information | 0 (0.0%) | 0 (0.0%) |
| Finance & Insurance | 0 (0.0%) | 0 (0.0%) |
| Real Estate, Rental & Leasing | 0 (0.0%) | 0 (0.0%) |
| Professional & Scientific | 0 (0.0%) | 0 (0.0%) |
| Enterprise Management | 0 (0.0%) | 0 (0.0%) |
| Administrative & Support | 0 (0.0%) | 0 (0.0%) |
| Educational Services | 0 (0.0%) | 0 (0.0%) |
| Health Care & Social Assistance | 0 (0.0%) | 12 (100.0%) |
| Arts, Entertainment & Recreation | 11 (100.0%) | 0 (0.0%) |
| Accommodation & Food Services | 10 (100.0%) | 0 (0.0%) |
| Public Administration | 14 (100.0%) | 0 (0.0%) |
| Total | 42 (71.2%) | 17 (28.8%) |
Education in Montezuma
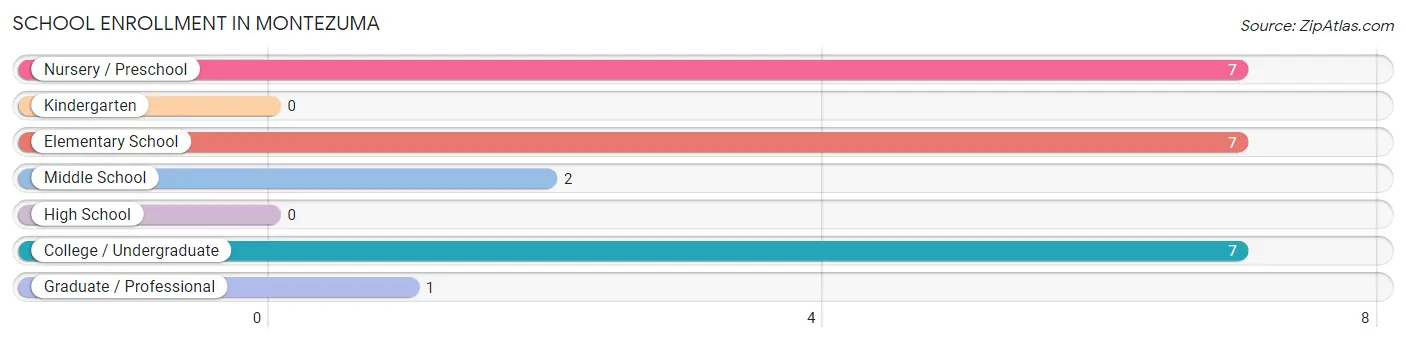
School Enrollment in Montezuma
The most common levels of schooling among the 24 students in Montezuma are nursery / preschool (7 | 29.2%), elementary school (7 | 29.2%), and college / undergraduate (7 | 29.2%).
| School Level | # Students | % Students |
| Nursery / Preschool | 7 | 29.2% |
| Kindergarten | 0 | 0.0% |
| Elementary School | 7 | 29.2% |
| Middle School | 2 | 8.3% |
| High School | 0 | 0.0% |
| College / Undergraduate | 7 | 29.2% |
| Graduate / Professional | 1 | 4.2% |
| Total | 24 | 100.0% |
School Enrollment by Age by Funding Source in Montezuma
Out of a total of 24 students who are enrolled in schools in Montezuma, 7 (29.2%) attend a private institution, while the remaining 17 (70.8%) are enrolled in public schools. The age group of 3 to 4 year olds has the highest likelihood of being enrolled in private schools, with 7 (100.0% in the age bracket) enrolled. Conversely, the age group of 5 to 9 year old has the lowest likelihood of being enrolled in a private school, with 7 (100.0% in the age bracket) attending a public institution.
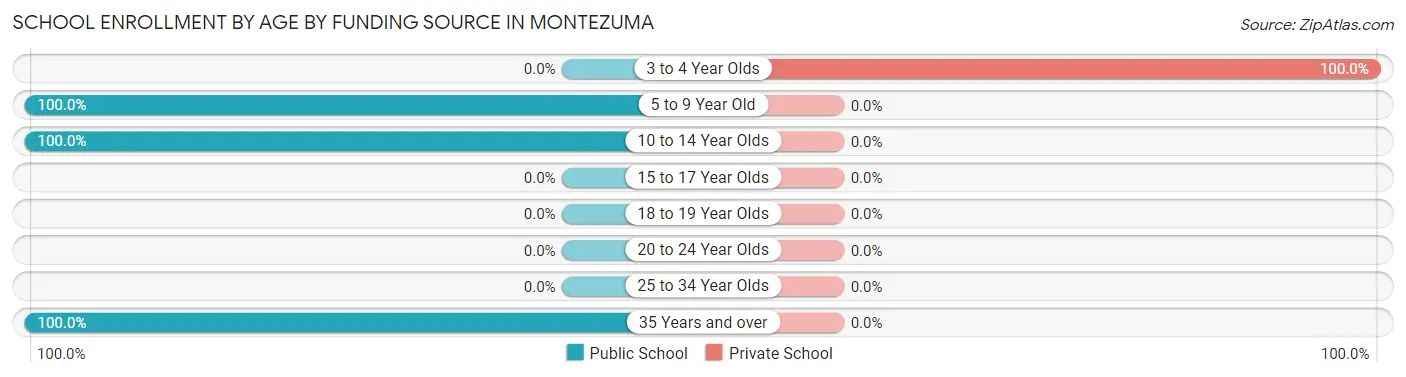
| Age Bracket | Public School | Private School |
| 3 to 4 Year Olds | 0 (0.0%) | 7 (100.0%) |
| 5 to 9 Year Old | 7 (100.0%) | 0 (0.0%) |
| 10 to 14 Year Olds | 2 (100.0%) | 0 (0.0%) |
| 15 to 17 Year Olds | 0 (0.0%) | 0 (0.0%) |
| 18 to 19 Year Olds | 0 (0.0%) | 0 (0.0%) |
| 20 to 24 Year Olds | 0 (0.0%) | 0 (0.0%) |
| 25 to 34 Year Olds | 0 (0.0%) | 0 (0.0%) |
| 35 Years and over | 8 (100.0%) | 0 (0.0%) |
| Total | 17 (70.8%) | 7 (29.2%) |
Educational Attainment by Field of Study in Montezuma
Psychology (11 | 27.5%), literature & languages (11 | 27.5%), communications (6 | 15.0%), business (5 | 12.5%), and visual & performing arts (5 | 12.5%) are the most common fields of study among 40 individuals in Montezuma who have obtained a bachelor's degree or higher.
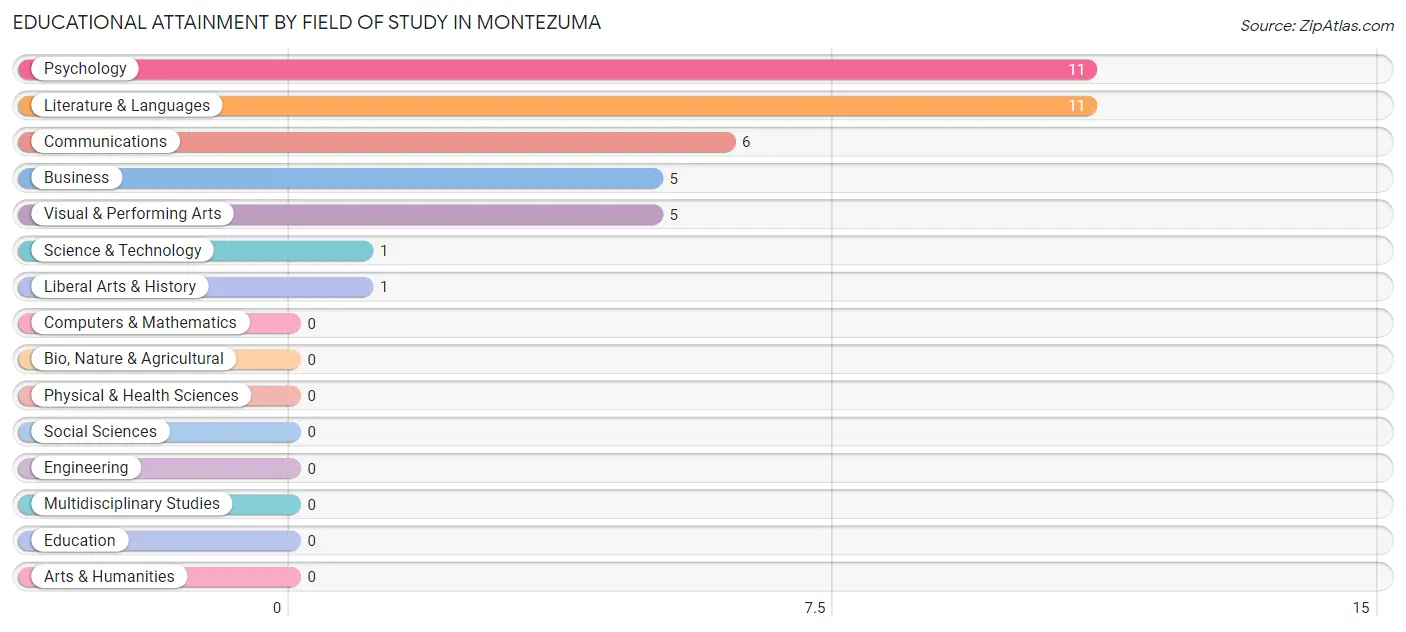
| Field of Study | # Graduates | % Graduates |
| Computers & Mathematics | 0 | 0.0% |
| Bio, Nature & Agricultural | 0 | 0.0% |
| Physical & Health Sciences | 0 | 0.0% |
| Psychology | 11 | 27.5% |
| Social Sciences | 0 | 0.0% |
| Engineering | 0 | 0.0% |
| Multidisciplinary Studies | 0 | 0.0% |
| Science & Technology | 1 | 2.5% |
| Business | 5 | 12.5% |
| Education | 0 | 0.0% |
| Literature & Languages | 11 | 27.5% |
| Liberal Arts & History | 1 | 2.5% |
| Visual & Performing Arts | 5 | 12.5% |
| Communications | 6 | 15.0% |
| Arts & Humanities | 0 | 0.0% |
| Total | 40 | 100.0% |
Transportation & Commute in Montezuma
Vehicle Availability by Sex in Montezuma
The most prevalent vehicle ownership categories in Montezuma are males with 2 vehicles (24, accounting for 57.1%) and females with 2 vehicles (11, making up 141.2%).
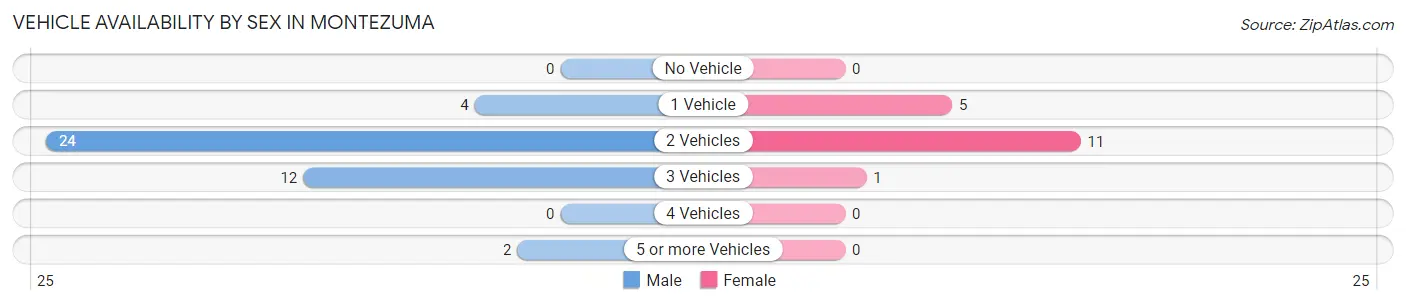
| Vehicles Available | Male | Female |
| No Vehicle | 0 (0.0%) | 0 (0.0%) |
| 1 Vehicle | 4 (9.5%) | 5 (29.4%) |
| 2 Vehicles | 24 (57.1%) | 11 (64.7%) |
| 3 Vehicles | 12 (28.6%) | 1 (5.9%) |
| 4 Vehicles | 0 (0.0%) | 0 (0.0%) |
| 5 or more Vehicles | 2 (4.8%) | 0 (0.0%) |
| Total | 42 (100.0%) | 17 (100.0%) |
Commute Time in Montezuma
The most frequently occuring commute durations in Montezuma are 30 to 34 minutes (29 commuters, 53.7%), 20 to 24 minutes (15 commuters, 27.8%), and 15 to 19 minutes (10 commuters, 18.5%).
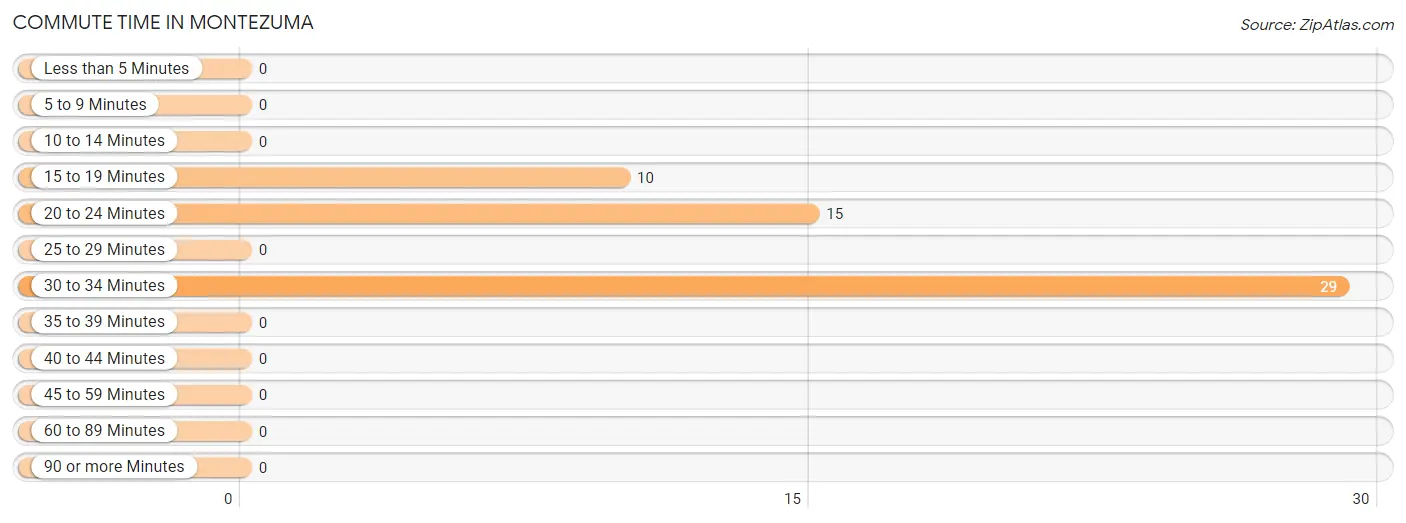
| Commute Time | # Commuters | % Commuters |
| Less than 5 Minutes | 0 | 0.0% |
| 5 to 9 Minutes | 0 | 0.0% |
| 10 to 14 Minutes | 0 | 0.0% |
| 15 to 19 Minutes | 10 | 18.5% |
| 20 to 24 Minutes | 15 | 27.8% |
| 25 to 29 Minutes | 0 | 0.0% |
| 30 to 34 Minutes | 29 | 53.7% |
| 35 to 39 Minutes | 0 | 0.0% |
| 40 to 44 Minutes | 0 | 0.0% |
| 45 to 59 Minutes | 0 | 0.0% |
| 60 to 89 Minutes | 0 | 0.0% |
| 90 or more Minutes | 0 | 0.0% |
Commute Time by Sex in Montezuma
The most common commute times in Montezuma are 30 to 34 minutes (17 commuters, 40.5%) for males and 30 to 34 minutes (12 commuters, 100.0%) for females.
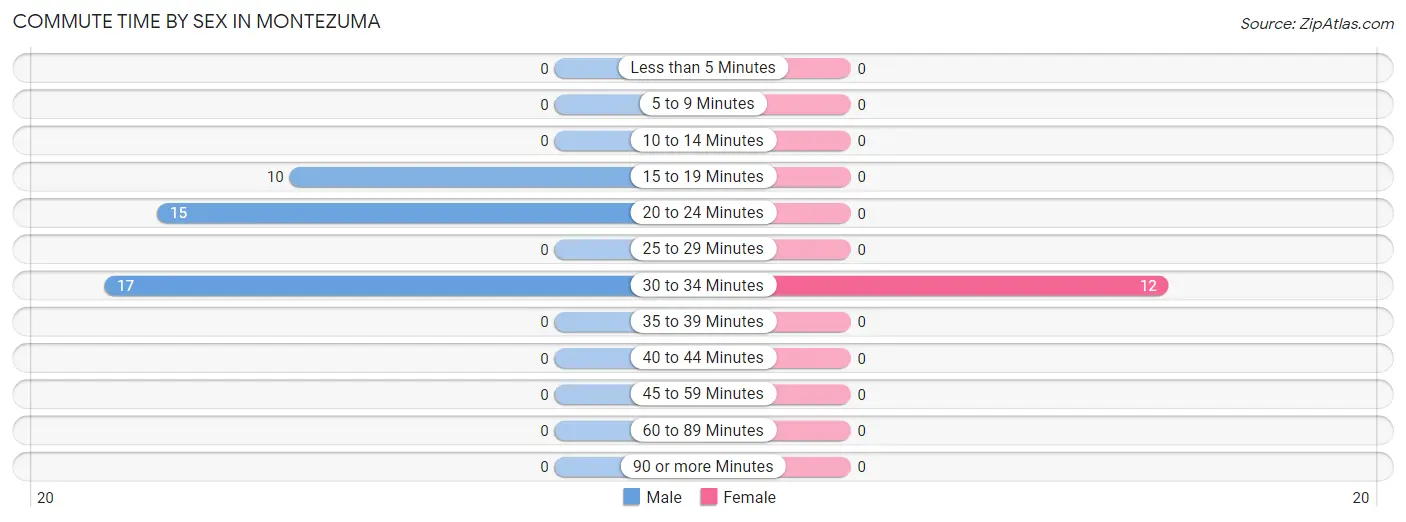
| Commute Time | Male | Female |
| Less than 5 Minutes | 0 (0.0%) | 0 (0.0%) |
| 5 to 9 Minutes | 0 (0.0%) | 0 (0.0%) |
| 10 to 14 Minutes | 0 (0.0%) | 0 (0.0%) |
| 15 to 19 Minutes | 10 (23.8%) | 0 (0.0%) |
| 20 to 24 Minutes | 15 (35.7%) | 0 (0.0%) |
| 25 to 29 Minutes | 0 (0.0%) | 0 (0.0%) |
| 30 to 34 Minutes | 17 (40.5%) | 12 (100.0%) |
| 35 to 39 Minutes | 0 (0.0%) | 0 (0.0%) |
| 40 to 44 Minutes | 0 (0.0%) | 0 (0.0%) |
| 45 to 59 Minutes | 0 (0.0%) | 0 (0.0%) |
| 60 to 89 Minutes | 0 (0.0%) | 0 (0.0%) |
| 90 or more Minutes | 0 (0.0%) | 0 (0.0%) |
Time of Departure to Work by Sex in Montezuma
The most frequent times of departure to work in Montezuma are 6:30 AM to 6:59 AM (25, 59.5%) for males and 8:00 AM to 8:29 AM (11, 91.7%) for females.
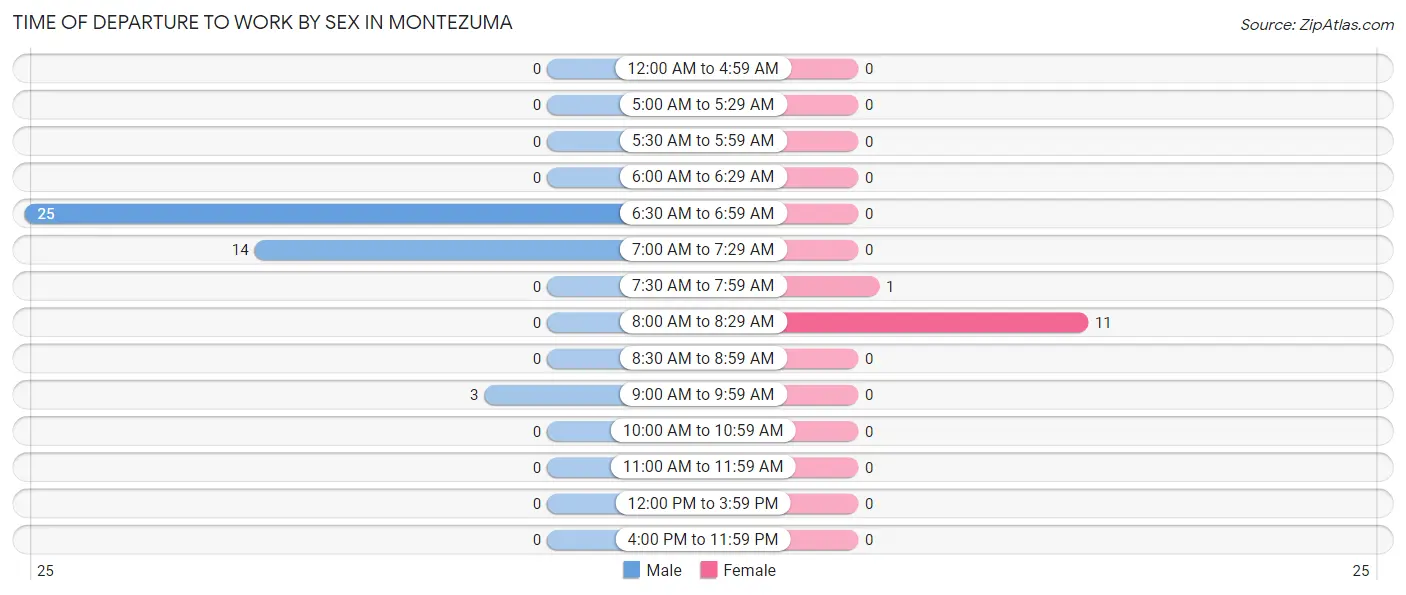
| Time of Departure | Male | Female |
| 12:00 AM to 4:59 AM | 0 (0.0%) | 0 (0.0%) |
| 5:00 AM to 5:29 AM | 0 (0.0%) | 0 (0.0%) |
| 5:30 AM to 5:59 AM | 0 (0.0%) | 0 (0.0%) |
| 6:00 AM to 6:29 AM | 0 (0.0%) | 0 (0.0%) |
| 6:30 AM to 6:59 AM | 25 (59.5%) | 0 (0.0%) |
| 7:00 AM to 7:29 AM | 14 (33.3%) | 0 (0.0%) |
| 7:30 AM to 7:59 AM | 0 (0.0%) | 1 (8.3%) |
| 8:00 AM to 8:29 AM | 0 (0.0%) | 11 (91.7%) |
| 8:30 AM to 8:59 AM | 0 (0.0%) | 0 (0.0%) |
| 9:00 AM to 9:59 AM | 3 (7.1%) | 0 (0.0%) |
| 10:00 AM to 10:59 AM | 0 (0.0%) | 0 (0.0%) |
| 11:00 AM to 11:59 AM | 0 (0.0%) | 0 (0.0%) |
| 12:00 PM to 3:59 PM | 0 (0.0%) | 0 (0.0%) |
| 4:00 PM to 11:59 PM | 0 (0.0%) | 0 (0.0%) |
| Total | 42 (100.0%) | 12 (100.0%) |
Housing Occupancy in Montezuma
Occupancy by Ownership in Montezuma
Of the total 45 dwellings in Montezuma, owner-occupied units account for 25 (55.6%), while renter-occupied units make up 20 (44.4%).
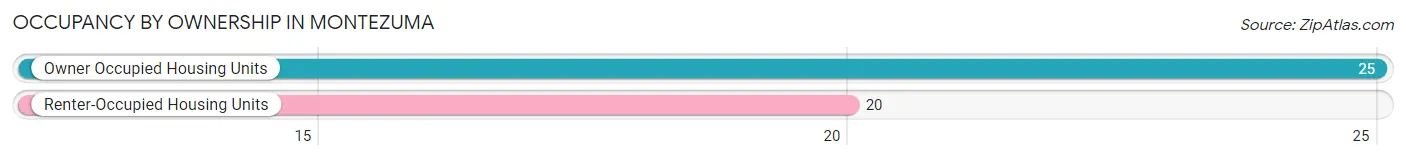
| Occupancy | # Housing Units | % Housing Units |
| Owner Occupied Housing Units | 25 | 55.6% |
| Renter-Occupied Housing Units | 20 | 44.4% |
| Total Occupied Housing Units | 45 | 100.0% |
Occupancy by Household Size in Montezuma
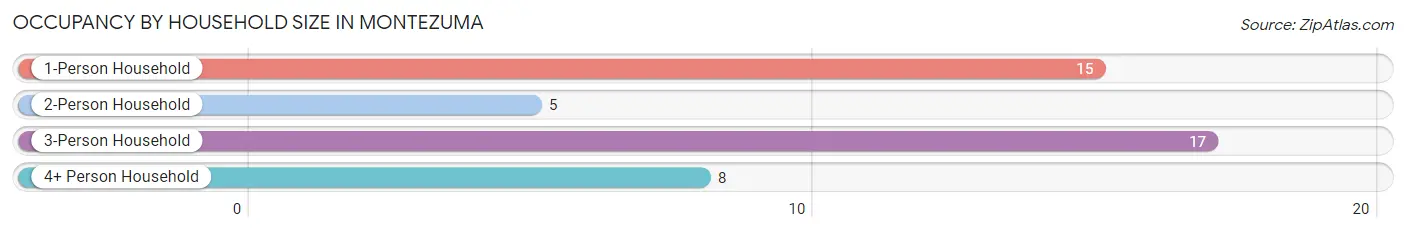
| Household Size | # Housing Units | % Housing Units |
| 1-Person Household | 15 | 33.3% |
| 2-Person Household | 5 | 11.1% |
| 3-Person Household | 17 | 37.8% |
| 4+ Person Household | 8 | 17.8% |
| Total Housing Units | 45 | 100.0% |
Occupancy by Ownership by Household Size in Montezuma
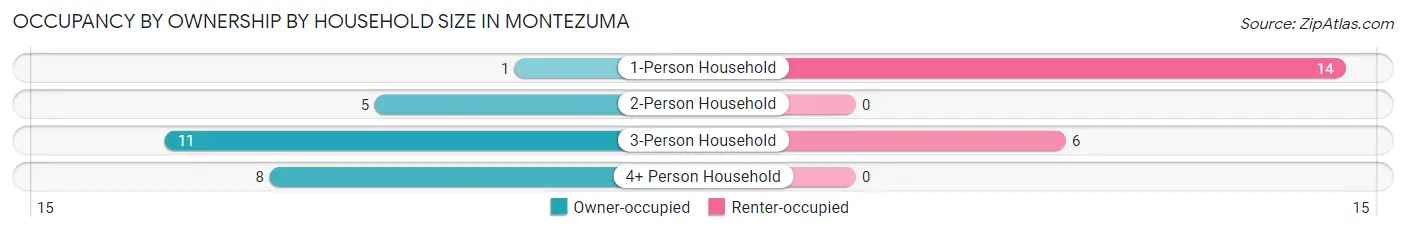
| Household Size | Owner-occupied | Renter-occupied |
| 1-Person Household | 1 (6.7%) | 14 (93.3%) |
| 2-Person Household | 5 (100.0%) | 0 (0.0%) |
| 3-Person Household | 11 (64.7%) | 6 (35.3%) |
| 4+ Person Household | 8 (100.0%) | 0 (0.0%) |
| Total Housing Units | 25 (55.6%) | 20 (44.4%) |
Occupancy by Educational Attainment in Montezuma
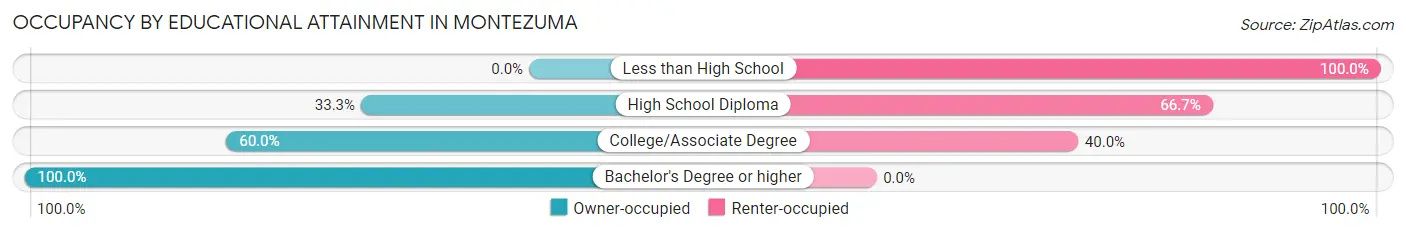
| Household Size | Owner-occupied | Renter-occupied |
| Less than High School | 0 (0.0%) | 10 (100.0%) |
| High School Diploma | 1 (33.3%) | 2 (66.7%) |
| College/Associate Degree | 12 (60.0%) | 8 (40.0%) |
| Bachelor's Degree or higher | 12 (100.0%) | 0 (0.0%) |
Occupancy by Age of Householder in Montezuma
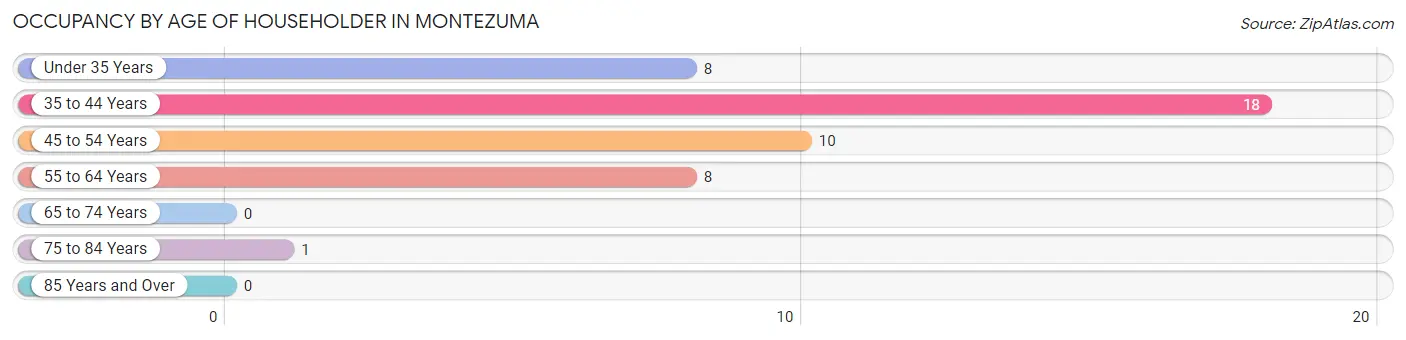
| Age Bracket | # Households | % Households |
| Under 35 Years | 8 | 17.8% |
| 35 to 44 Years | 18 | 40.0% |
| 45 to 54 Years | 10 | 22.2% |
| 55 to 64 Years | 8 | 17.8% |
| 65 to 74 Years | 0 | 0.0% |
| 75 to 84 Years | 1 | 2.2% |
| 85 Years and Over | 0 | 0.0% |
| Total | 45 | 100.0% |
Housing Finances in Montezuma
Median Income by Occupancy in Montezuma
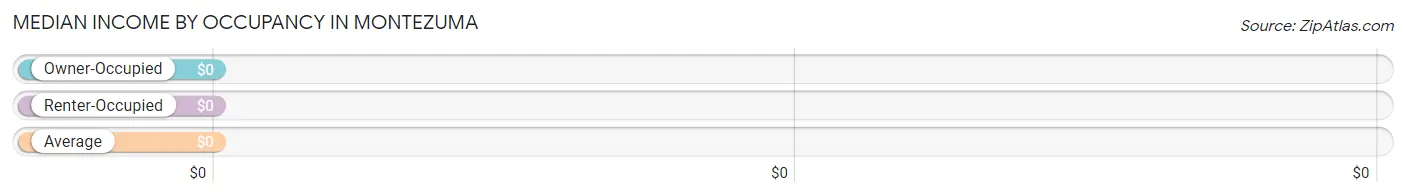
| Occupancy Type | # Households | Median Income |
| Owner-Occupied | 25 (55.6%) | $0 |
| Renter-Occupied | 20 (44.4%) | $0 |
| Average | 45 (100.0%) | $0 |
Occupancy by Householder Income Bracket in Montezuma
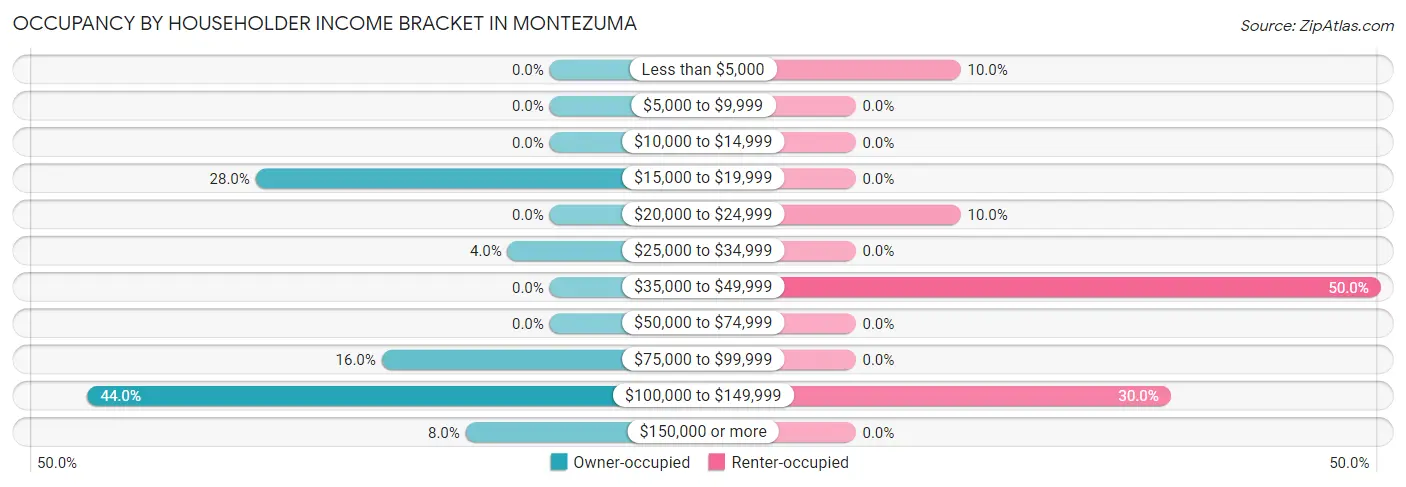
| Income Bracket | Owner-occupied | Renter-occupied |
| Less than $5,000 | 0 (0.0%) | 2 (10.0%) |
| $5,000 to $9,999 | 0 (0.0%) | 0 (0.0%) |
| $10,000 to $14,999 | 0 (0.0%) | 0 (0.0%) |
| $15,000 to $19,999 | 7 (28.0%) | 0 (0.0%) |
| $20,000 to $24,999 | 0 (0.0%) | 2 (10.0%) |
| $25,000 to $34,999 | 1 (4.0%) | 0 (0.0%) |
| $35,000 to $49,999 | 0 (0.0%) | 10 (50.0%) |
| $50,000 to $74,999 | 0 (0.0%) | 0 (0.0%) |
| $75,000 to $99,999 | 4 (16.0%) | 0 (0.0%) |
| $100,000 to $149,999 | 11 (44.0%) | 6 (30.0%) |
| $150,000 or more | 2 (8.0%) | 0 (0.0%) |
| Total | 25 (100.0%) | 20 (100.0%) |
Monthly Housing Cost Tiers in Montezuma
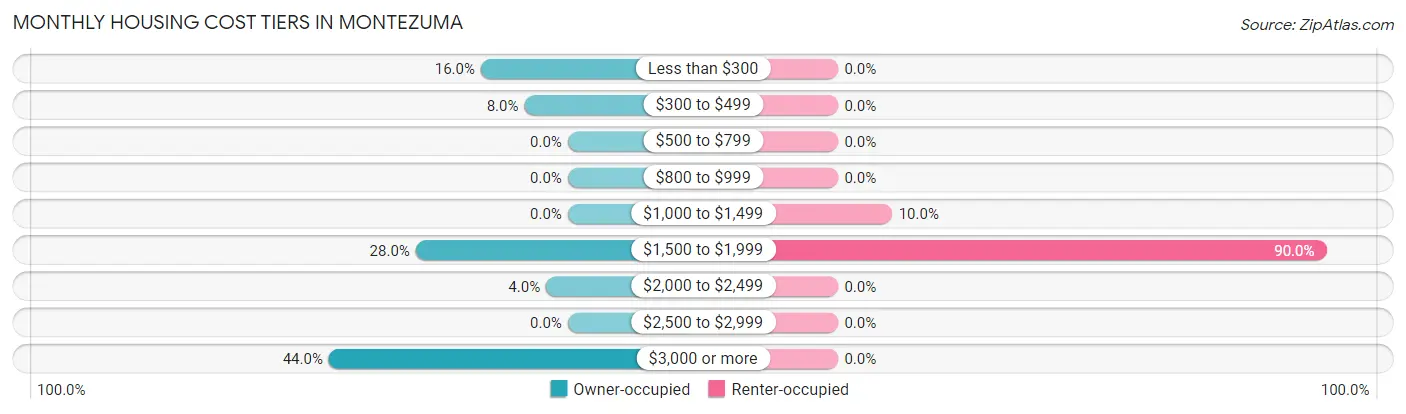
| Monthly Cost | Owner-occupied | Renter-occupied |
| Less than $300 | 4 (16.0%) | 0 (0.0%) |
| $300 to $499 | 2 (8.0%) | 0 (0.0%) |
| $500 to $799 | 0 (0.0%) | 0 (0.0%) |
| $800 to $999 | 0 (0.0%) | 0 (0.0%) |
| $1,000 to $1,499 | 0 (0.0%) | 2 (10.0%) |
| $1,500 to $1,999 | 7 (28.0%) | 18 (90.0%) |
| $2,000 to $2,499 | 1 (4.0%) | 0 (0.0%) |
| $2,500 to $2,999 | 0 (0.0%) | 0 (0.0%) |
| $3,000 or more | 11 (44.0%) | 0 (0.0%) |
| Total | 25 (100.0%) | 20 (100.0%) |
Physical Housing Characteristics in Montezuma
Housing Structures in Montezuma
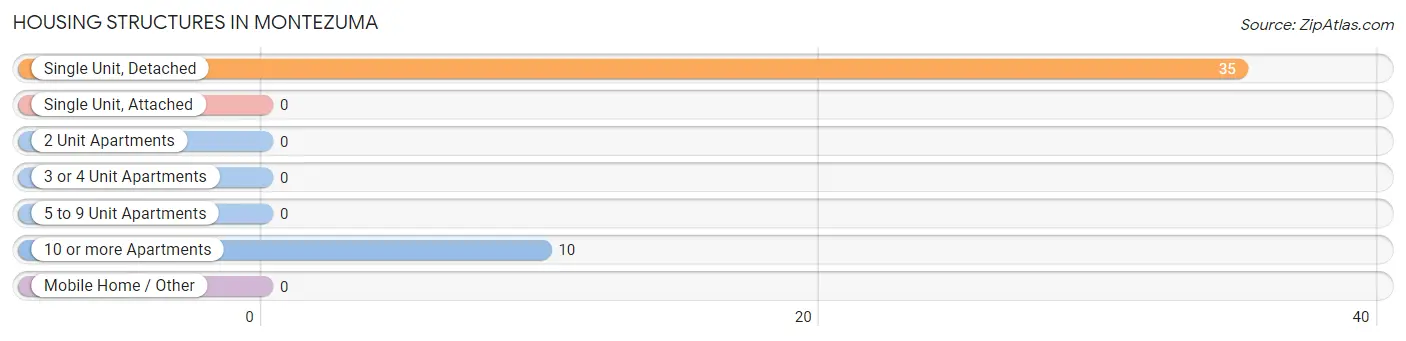
| Structure Type | # Housing Units | % Housing Units |
| Single Unit, Detached | 35 | 77.8% |
| Single Unit, Attached | 0 | 0.0% |
| 2 Unit Apartments | 0 | 0.0% |
| 3 or 4 Unit Apartments | 0 | 0.0% |
| 5 to 9 Unit Apartments | 0 | 0.0% |
| 10 or more Apartments | 10 | 22.2% |
| Mobile Home / Other | 0 | 0.0% |
| Total | 45 | 100.0% |
Housing Structures by Occupancy in Montezuma
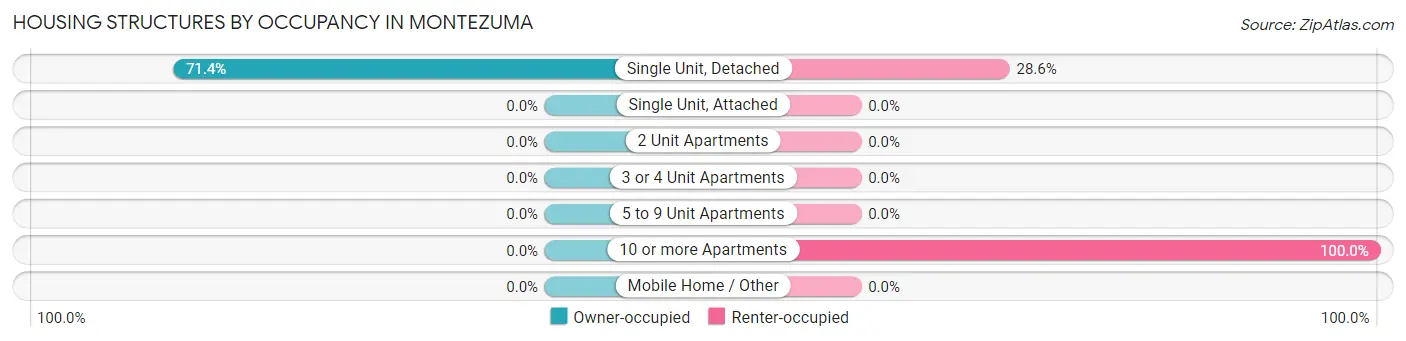
| Structure Type | Owner-occupied | Renter-occupied |
| Single Unit, Detached | 25 (71.4%) | 10 (28.6%) |
| Single Unit, Attached | 0 (0.0%) | 0 (0.0%) |
| 2 Unit Apartments | 0 (0.0%) | 0 (0.0%) |
| 3 or 4 Unit Apartments | 0 (0.0%) | 0 (0.0%) |
| 5 to 9 Unit Apartments | 0 (0.0%) | 0 (0.0%) |
| 10 or more Apartments | 0 (0.0%) | 10 (100.0%) |
| Mobile Home / Other | 0 (0.0%) | 0 (0.0%) |
| Total | 25 (55.6%) | 20 (44.4%) |
Housing Structures by Number of Rooms in Montezuma
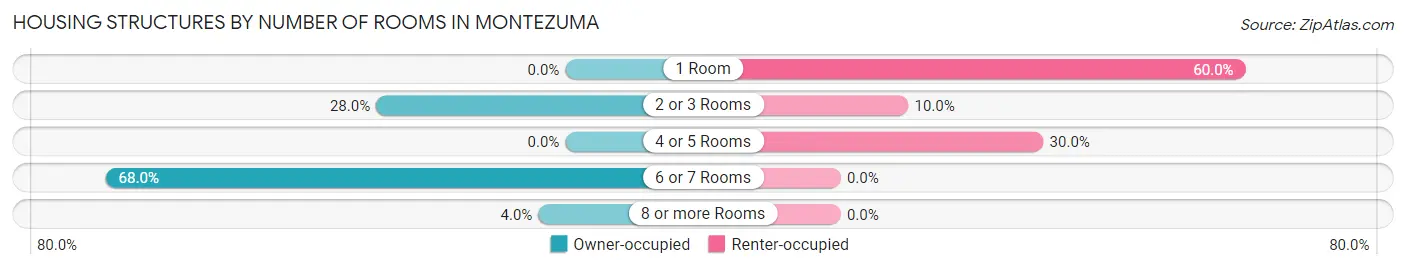
| Number of Rooms | Owner-occupied | Renter-occupied |
| 1 Room | 0 (0.0%) | 12 (60.0%) |
| 2 or 3 Rooms | 7 (28.0%) | 2 (10.0%) |
| 4 or 5 Rooms | 0 (0.0%) | 6 (30.0%) |
| 6 or 7 Rooms | 17 (68.0%) | 0 (0.0%) |
| 8 or more Rooms | 1 (4.0%) | 0 (0.0%) |
| Total | 25 (100.0%) | 20 (100.0%) |
Housing Structure by Heating Type in Montezuma
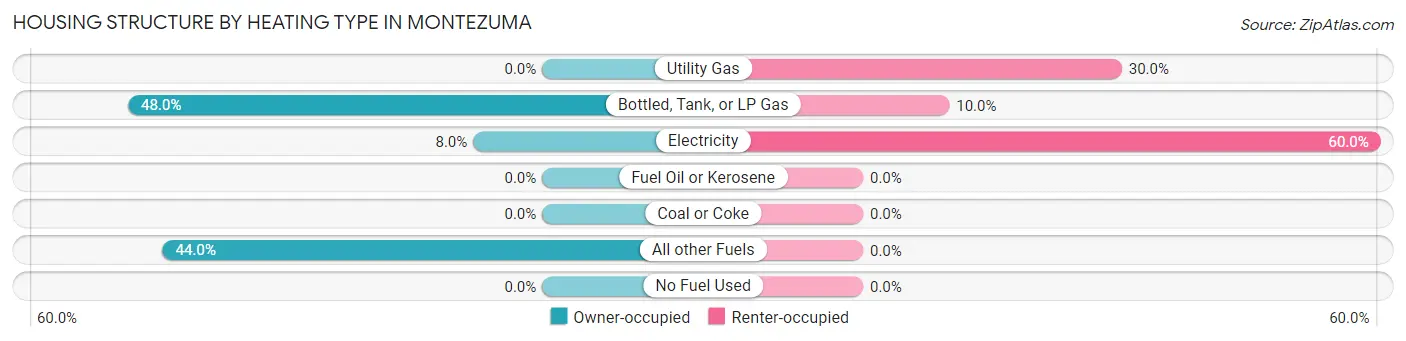
| Heating Type | Owner-occupied | Renter-occupied |
| Utility Gas | 0 (0.0%) | 6 (30.0%) |
| Bottled, Tank, or LP Gas | 12 (48.0%) | 2 (10.0%) |
| Electricity | 2 (8.0%) | 12 (60.0%) |
| Fuel Oil or Kerosene | 0 (0.0%) | 0 (0.0%) |
| Coal or Coke | 0 (0.0%) | 0 (0.0%) |
| All other Fuels | 11 (44.0%) | 0 (0.0%) |
| No Fuel Used | 0 (0.0%) | 0 (0.0%) |
| Total | 25 (100.0%) | 20 (100.0%) |
Household Vehicle Usage in Montezuma
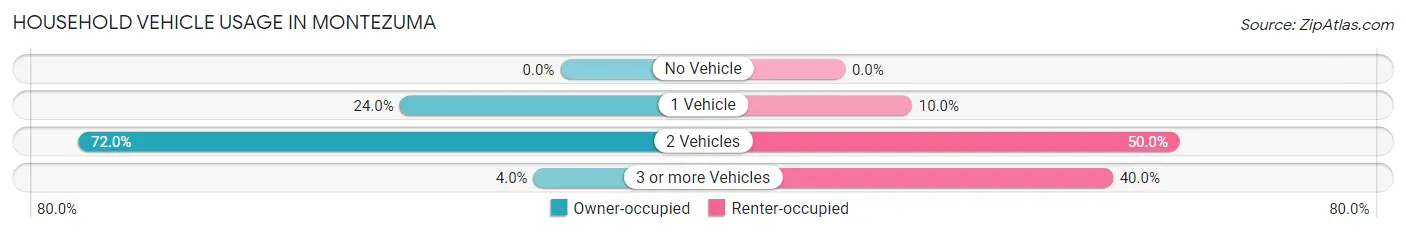
| Vehicles per Household | Owner-occupied | Renter-occupied |
| No Vehicle | 0 (0.0%) | 0 (0.0%) |
| 1 Vehicle | 6 (24.0%) | 2 (10.0%) |
| 2 Vehicles | 18 (72.0%) | 10 (50.0%) |
| 3 or more Vehicles | 1 (4.0%) | 8 (40.0%) |
| Total | 25 (100.0%) | 20 (100.0%) |
Real Estate & Mortgages in Montezuma
Real Estate and Mortgage Overview in Montezuma
| Characteristic | Without Mortgage | With Mortgage |
| Housing Units | 6 | 19 |
| Median Property Value | $562,500 | $552,100 |
| Median Household Income | - | - |
| Monthly Housing Costs | $288 | $11 |
| Real Estate Taxes | $2,250 | $0 |
Property Value by Mortgage Status in Montezuma
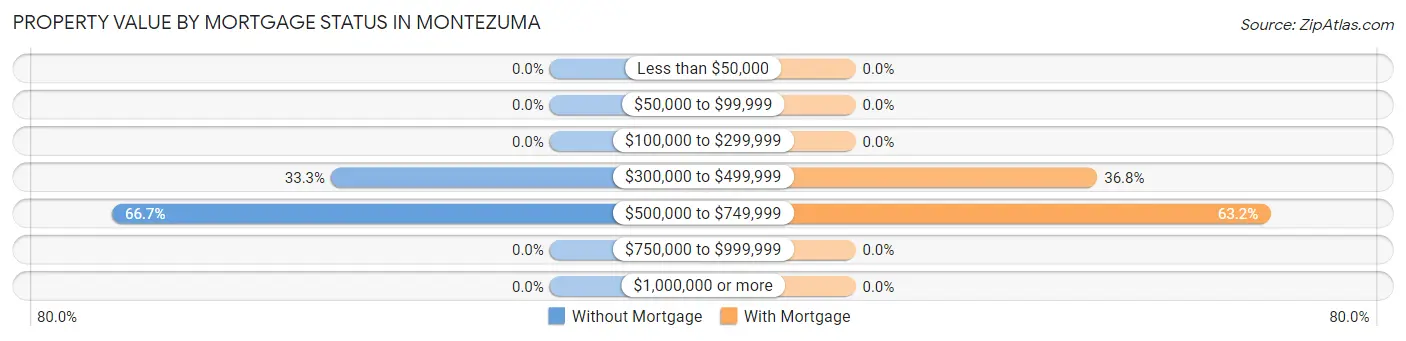
| Property Value | Without Mortgage | With Mortgage |
| Less than $50,000 | 0 (0.0%) | 0 (0.0%) |
| $50,000 to $99,999 | 0 (0.0%) | 0 (0.0%) |
| $100,000 to $299,999 | 0 (0.0%) | 0 (0.0%) |
| $300,000 to $499,999 | 2 (33.3%) | 7 (36.8%) |
| $500,000 to $749,999 | 4 (66.7%) | 12 (63.2%) |
| $750,000 to $999,999 | 0 (0.0%) | 0 (0.0%) |
| $1,000,000 or more | 0 (0.0%) | 0 (0.0%) |
| Total | 6 (100.0%) | 19 (100.0%) |
Household Income by Mortgage Status in Montezuma
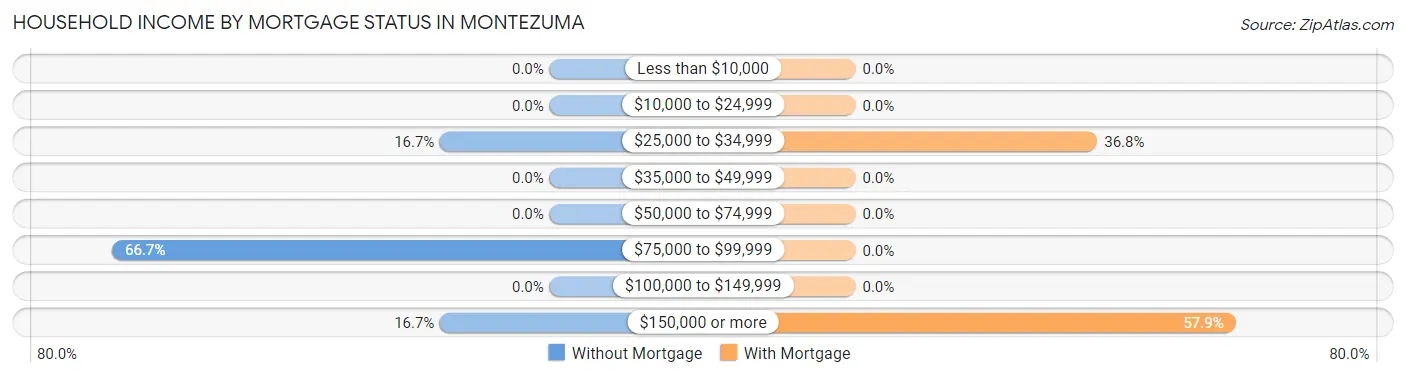
| Household Income | Without Mortgage | With Mortgage |
| Less than $10,000 | 0 (0.0%) | 0 (0.0%) |
| $10,000 to $24,999 | 0 (0.0%) | 0 (0.0%) |
| $25,000 to $34,999 | 1 (16.7%) | 7 (36.8%) |
| $35,000 to $49,999 | 0 (0.0%) | 0 (0.0%) |
| $50,000 to $74,999 | 0 (0.0%) | 0 (0.0%) |
| $75,000 to $99,999 | 4 (66.7%) | 0 (0.0%) |
| $100,000 to $149,999 | 0 (0.0%) | 0 (0.0%) |
| $150,000 or more | 1 (16.7%) | 11 (57.9%) |
| Total | 6 (100.0%) | 19 (100.0%) |
Property Value to Household Income Ratio in Montezuma
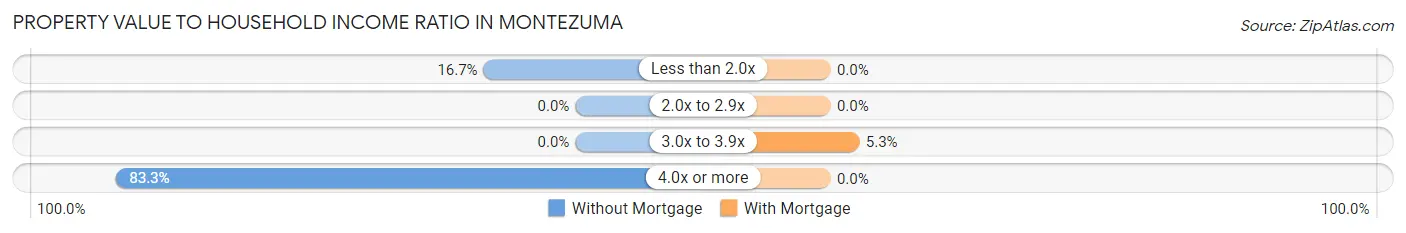
| Value-to-Income Ratio | Without Mortgage | With Mortgage |
| Less than 2.0x | 1 (16.7%) | 0 (0.0%) |
| 2.0x to 2.9x | 0 (0.0%) | 0 (0.0%) |
| 3.0x to 3.9x | 0 (0.0%) | 1 (5.3%) |
| 4.0x or more | 5 (83.3%) | 0 (0.0%) |
| Total | 6 (100.0%) | 19 (100.0%) |
Real Estate Taxes by Mortgage Status in Montezuma
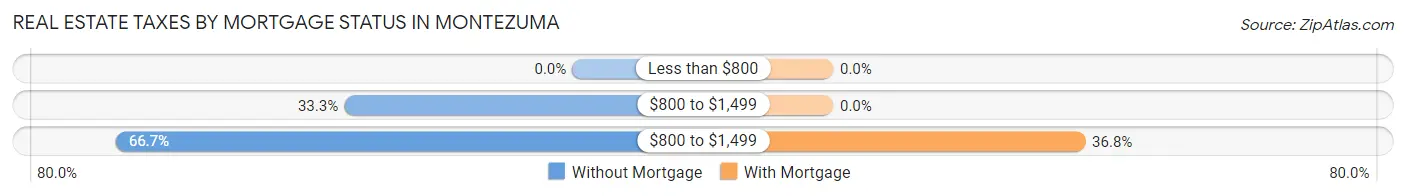
| Property Taxes | Without Mortgage | With Mortgage |
| Less than $800 | 0 (0.0%) | 0 (0.0%) |
| $800 to $1,499 | 2 (33.3%) | 0 (0.0%) |
| $800 to $1,499 | 4 (66.7%) | 7 (36.8%) |
| Total | 6 (100.0%) | 19 (100.0%) |
Health & Disability in Montezuma
Health Insurance Coverage by Age in Montezuma
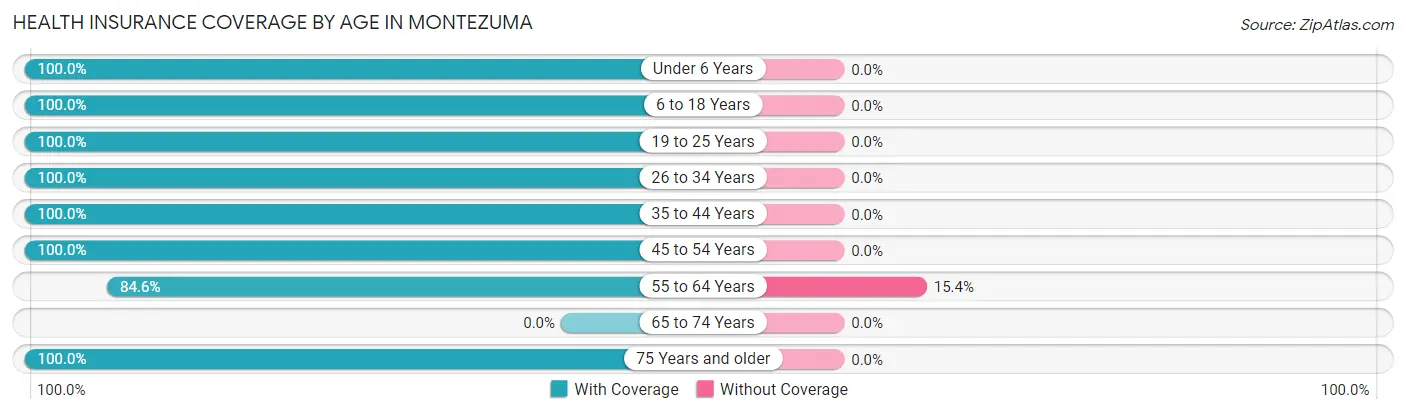
| Age Bracket | With Coverage | Without Coverage |
| Under 6 Years | 15 (100.0%) | 0 (0.0%) |
| 6 to 18 Years | 9 (100.0%) | 0 (0.0%) |
| 19 to 25 Years | 21 (100.0%) | 0 (0.0%) |
| 26 to 34 Years | 8 (100.0%) | 0 (0.0%) |
| 35 to 44 Years | 38 (100.0%) | 0 (0.0%) |
| 45 to 54 Years | 11 (100.0%) | 0 (0.0%) |
| 55 to 64 Years | 11 (84.6%) | 2 (15.4%) |
| 65 to 74 Years | 0 (0.0%) | 0 (0.0%) |
| 75 Years and older | 3 (100.0%) | 0 (0.0%) |
| Total | 116 (98.3%) | 2 (1.7%) |
Health Insurance Coverage by Citizenship Status in Montezuma
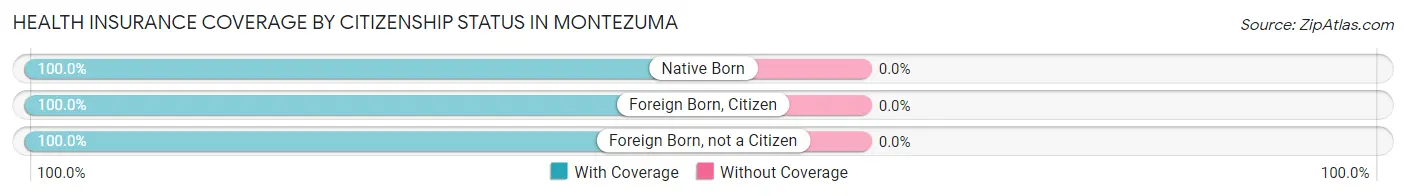
| Citizenship Status | With Coverage | Without Coverage |
| Native Born | 15 (100.0%) | 0 (0.0%) |
| Foreign Born, Citizen | 9 (100.0%) | 0 (0.0%) |
| Foreign Born, not a Citizen | 21 (100.0%) | 0 (0.0%) |
Health Insurance Coverage by Household Income in Montezuma
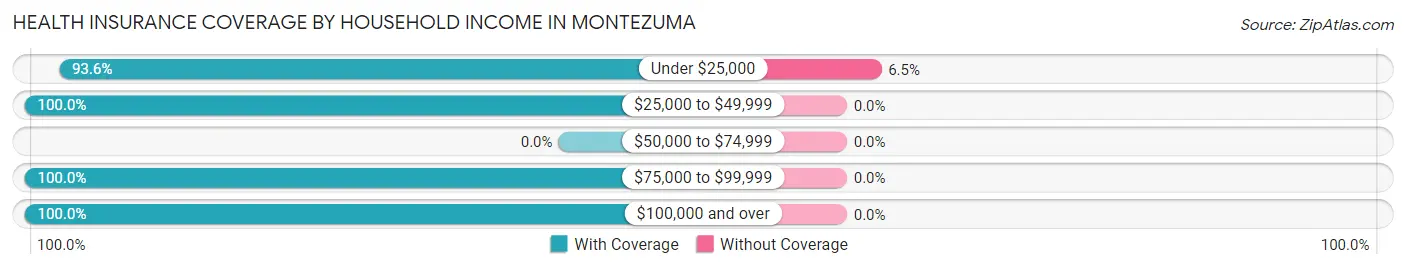
| Household Income | With Coverage | Without Coverage |
| Under $25,000 | 29 (93.5%) | 2 (6.5%) |
| $25,000 to $49,999 | 11 (100.0%) | 0 (0.0%) |
| $50,000 to $74,999 | 0 (0.0%) | 0 (0.0%) |
| $75,000 to $99,999 | 9 (100.0%) | 0 (0.0%) |
| $100,000 and over | 67 (100.0%) | 0 (0.0%) |
Public vs Private Health Insurance Coverage by Age in Montezuma
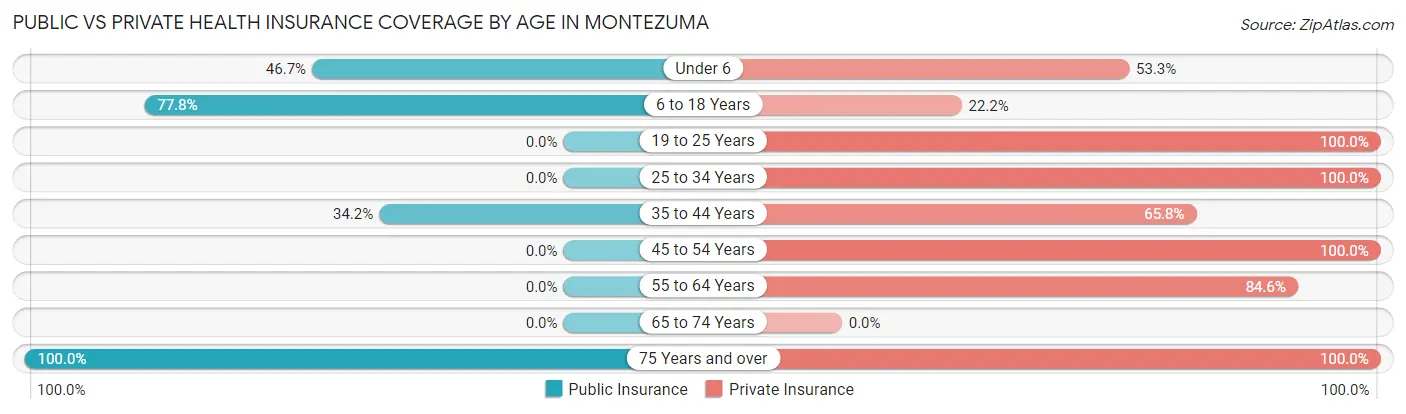
| Age Bracket | Public Insurance | Private Insurance |
| Under 6 | 7 (46.7%) | 8 (53.3%) |
| 6 to 18 Years | 7 (77.8%) | 2 (22.2%) |
| 19 to 25 Years | 0 (0.0%) | 21 (100.0%) |
| 25 to 34 Years | 0 (0.0%) | 8 (100.0%) |
| 35 to 44 Years | 13 (34.2%) | 25 (65.8%) |
| 45 to 54 Years | 0 (0.0%) | 11 (100.0%) |
| 55 to 64 Years | 0 (0.0%) | 11 (84.6%) |
| 65 to 74 Years | 0 (0.0%) | 0 (0.0%) |
| 75 Years and over | 3 (100.0%) | 3 (100.0%) |
| Total | 30 (25.4%) | 89 (75.4%) |
Disability Status by Sex by Age in Montezuma
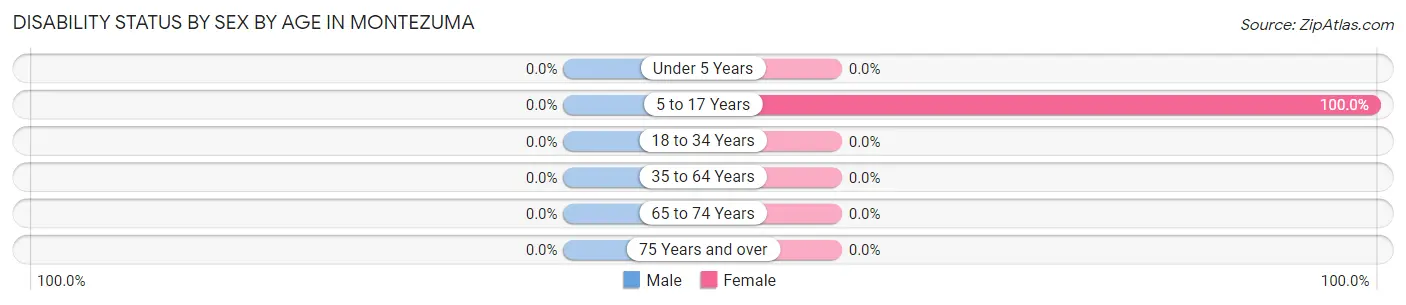
| Age Bracket | Male | Female |
| Under 5 Years | 0 (0.0%) | 0 (0.0%) |
| 5 to 17 Years | 0 (0.0%) | 1 (100.0%) |
| 18 to 34 Years | 0 (0.0%) | 0 (0.0%) |
| 35 to 64 Years | 0 (0.0%) | 0 (0.0%) |
| 65 to 74 Years | 0 (0.0%) | 0 (0.0%) |
| 75 Years and over | 0 (0.0%) | 0 (0.0%) |
Disability Class by Sex by Age in Montezuma
Disability Class: Hearing Difficulty
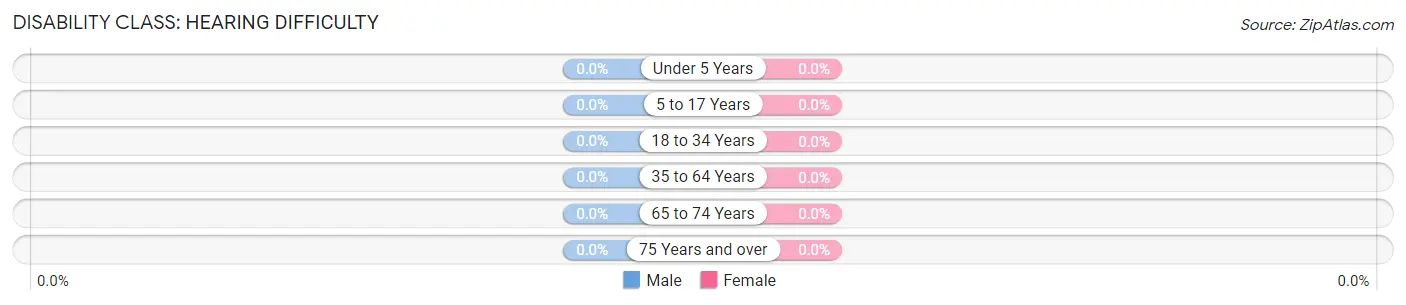
| Age Bracket | Male | Female |
| Under 5 Years | 0 (0.0%) | 0 (0.0%) |
| 5 to 17 Years | 0 (0.0%) | 0 (0.0%) |
| 18 to 34 Years | 0 (0.0%) | 0 (0.0%) |
| 35 to 64 Years | 0 (0.0%) | 0 (0.0%) |
| 65 to 74 Years | 0 (0.0%) | 0 (0.0%) |
| 75 Years and over | 0 (0.0%) | 0 (0.0%) |
Disability Class: Vision Difficulty
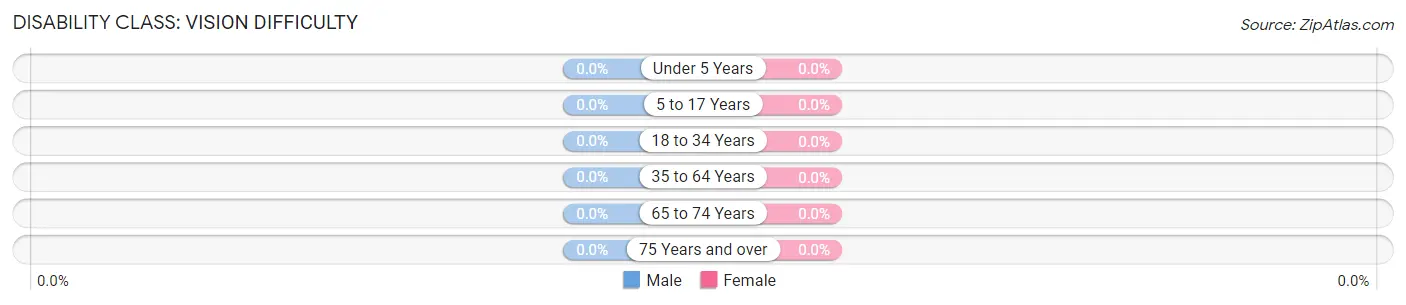
| Age Bracket | Male | Female |
| Under 5 Years | 0 (0.0%) | 0 (0.0%) |
| 5 to 17 Years | 0 (0.0%) | 0 (0.0%) |
| 18 to 34 Years | 0 (0.0%) | 0 (0.0%) |
| 35 to 64 Years | 0 (0.0%) | 0 (0.0%) |
| 65 to 74 Years | 0 (0.0%) | 0 (0.0%) |
| 75 Years and over | 0 (0.0%) | 0 (0.0%) |
Disability Class: Cognitive Difficulty
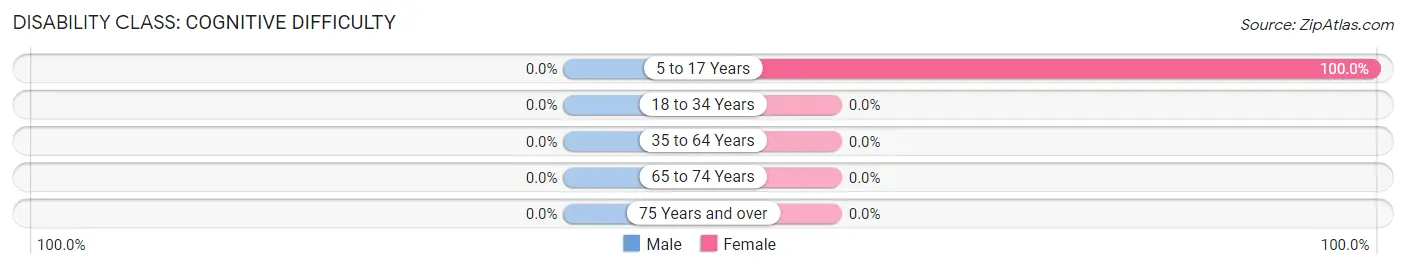
| Age Bracket | Male | Female |
| 5 to 17 Years | 0 (0.0%) | 1 (100.0%) |
| 18 to 34 Years | 0 (0.0%) | 0 (0.0%) |
| 35 to 64 Years | 0 (0.0%) | 0 (0.0%) |
| 65 to 74 Years | 0 (0.0%) | 0 (0.0%) |
| 75 Years and over | 0 (0.0%) | 0 (0.0%) |
Disability Class: Ambulatory Difficulty
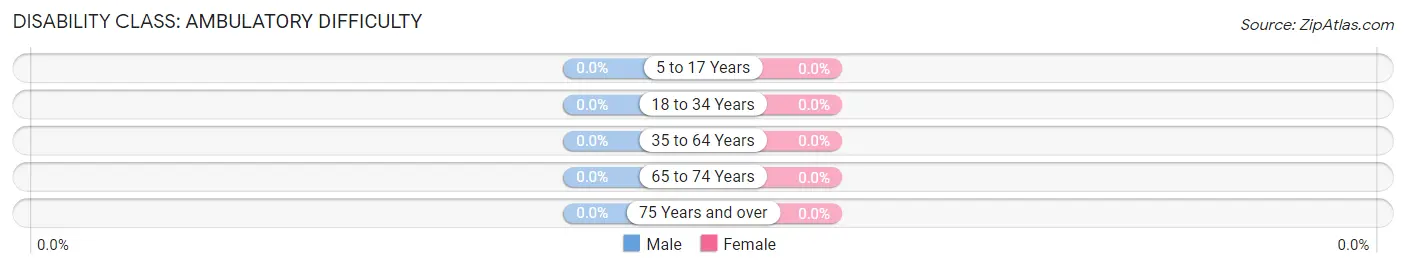
| Age Bracket | Male | Female |
| 5 to 17 Years | 0 (0.0%) | 0 (0.0%) |
| 18 to 34 Years | 0 (0.0%) | 0 (0.0%) |
| 35 to 64 Years | 0 (0.0%) | 0 (0.0%) |
| 65 to 74 Years | 0 (0.0%) | 0 (0.0%) |
| 75 Years and over | 0 (0.0%) | 0 (0.0%) |
Disability Class: Self-Care Difficulty
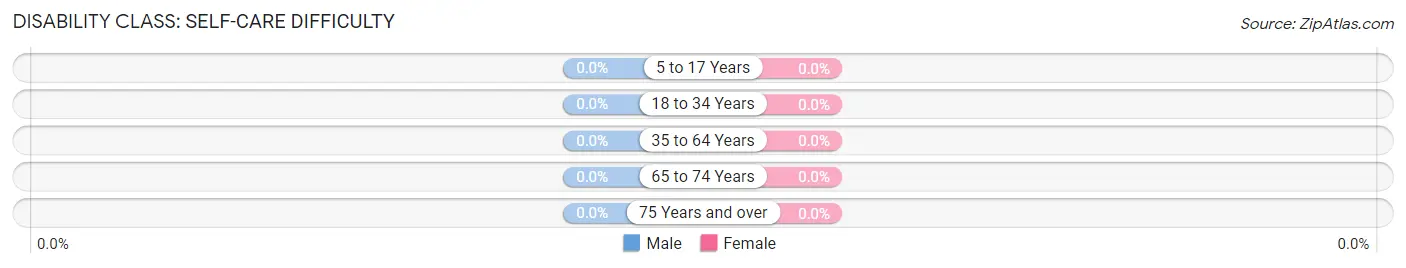
| Age Bracket | Male | Female |
| 5 to 17 Years | 0 (0.0%) | 0 (0.0%) |
| 18 to 34 Years | 0 (0.0%) | 0 (0.0%) |
| 35 to 64 Years | 0 (0.0%) | 0 (0.0%) |
| 65 to 74 Years | 0 (0.0%) | 0 (0.0%) |
| 75 Years and over | 0 (0.0%) | 0 (0.0%) |
Technology Access in Montezuma
Computing Device Access in Montezuma
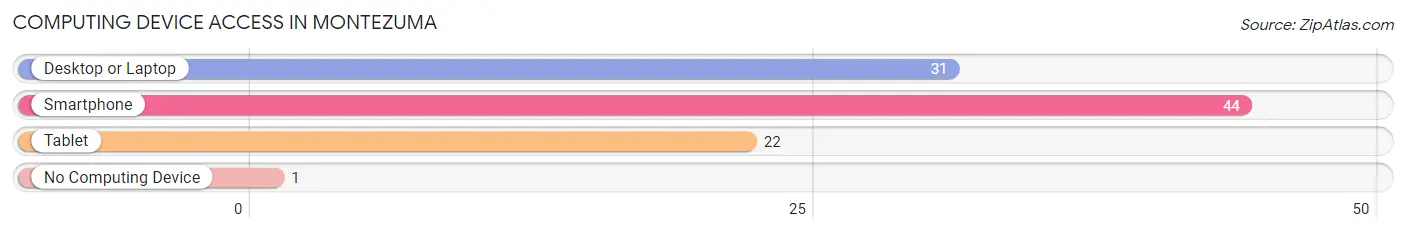
| Device Type | # Households | % Households |
| Desktop or Laptop | 31 | 68.9% |
| Smartphone | 44 | 97.8% |
| Tablet | 22 | 48.9% |
| No Computing Device | 1 | 2.2% |
| Total | 45 | 100.0% |
Internet Access in Montezuma
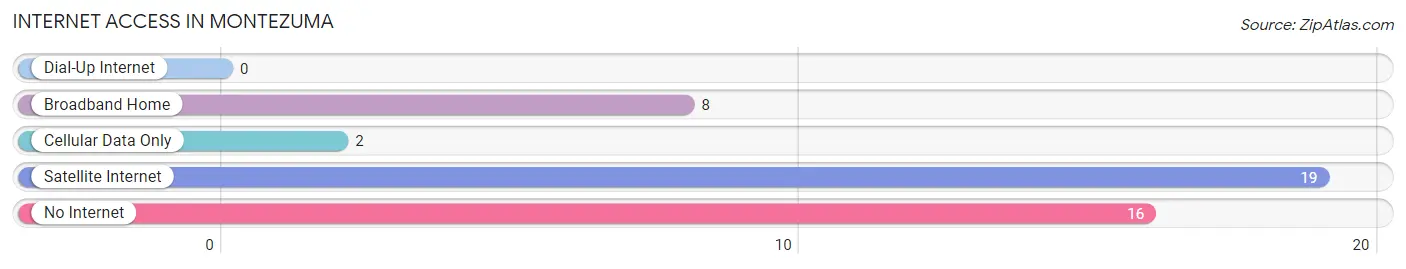
| Internet Type | # Households | % Households |
| Dial-Up Internet | 0 | 0.0% |
| Broadband Home | 8 | 17.8% |
| Cellular Data Only | 2 | 4.4% |
| Satellite Internet | 19 | 42.2% |
| No Internet | 16 | 35.6% |
| Total | 45 | 100.0% |
Montezuma Summary
Montezuma, Colorado is a small town located in the southwestern corner of the state, near the border of Utah and New Mexico. It is situated in Montezuma County, which is the second-least populous county in the state. The town is located in the Montezuma Valley, which is surrounded by the San Juan Mountains to the east and the La Plata Mountains to the west. The town is situated at an elevation of 6,890 feet and has a population of approximately 1,000 people.
Geography
Montezuma is located in the Montezuma Valley, which is surrounded by the San Juan Mountains to the east and the La Plata Mountains to the west. The town is situated at an elevation of 6,890 feet and has a population of approximately 1,000 people. The town is located in the southwestern corner of the state, near the border of Utah and New Mexico. The town is situated in a semi-arid climate, with hot summers and cold winters. The average annual precipitation is approximately 12 inches.
History
Montezuma was founded in 1876 by a group of settlers from the nearby town of Cortez. The town was named after the Aztec emperor Montezuma II, who was believed to have been born in the area. The town was originally a mining town, with the first mine opening in 1877. The town quickly grew and by 1880, it had a population of over 500 people. The town was incorporated in 1882 and by 1890, it had a population of over 1,000 people.
The town experienced a period of decline in the early 20th century, as the mining industry began to decline. The population of the town decreased to just over 500 people by 1930. The town experienced a resurgence in the 1950s, as the uranium mining industry began to boom in the area. The population of the town increased to over 1,000 people by 1960.
Economy
Montezuma’s economy is largely based on tourism and agriculture. The town is home to several tourist attractions, including the Montezuma Castle National Monument, the Montezuma Valley Historical Museum, and the Montezuma Hot Springs. The town is also home to several wineries and breweries, as well as a number of restaurants and shops.
Agriculture is also an important part of the local economy. The town is home to several farms, which produce a variety of crops, including corn, wheat, hay, and alfalfa. The town is also home to several cattle ranches, which produce beef and dairy products.
Demographics
As of the 2010 census, the population of Montezuma was 1,039. The racial makeup of the town was 94.3% White, 0.7% African American, 0.7% Native American, 0.3% Asian, 0.1% Pacific Islander, 1.7% from other races, and 2.1% from two or more races. Hispanic or Latino of any race were 4.7% of the population.
The median household income in Montezuma was $37,500, and the median family income was $41,250. The per capita income for the town was $17,845. About 11.3% of families and 14.2% of the population were below the poverty line, including 18.2% of those under age 18 and 8.3% of those age 65 or over.
Montezuma is a small town with a rich history and a vibrant economy. The town is home to a variety of attractions, including the Montezuma Castle National Monument, the Montezuma Valley Historical Museum, and the Montezuma Hot Springs. The town is also home to several wineries and breweries, as well as a number of restaurants and shops. The town is also home to several farms and cattle ranches, which produce a variety of crops and beef and dairy products. The population of the town is approximately 1,000 people, with a median household income of $37,500.
Common Questions
What is Per Capita Income in Montezuma?
Per Capita income in Montezuma is $40,883.
What is the Median Family Income in Montezuma?
Median Family Income in Montezuma is $147,727.
What is Inequality or Gini Index in Montezuma?
Inequality or Gini Index in Montezuma is 0.46.
What is the Total Population of Montezuma?
Total Population of Montezuma is 118.
What is the Total Male Population of Montezuma?
Total Male Population of Montezuma is 91.
What is the Total Female Population of Montezuma?
Total Female Population of Montezuma is 27.
What is the Ratio of Males per 100 Females in Montezuma?
There are 337.04 Males per 100 Females in Montezuma.
What is the Ratio of Females per 100 Males in Montezuma?
There are 29.67 Females per 100 Males in Montezuma.
What is the Median Population Age in Montezuma?
Median Population Age in Montezuma is 35.9 Years.
What is the Average Family Size in Montezuma
Average Family Size in Montezuma is 3.2 People.
What is the Average Household Size in Montezuma
Average Household Size in Montezuma is 2.6 People.
How Large is the Labor Force in Montezuma?
There are 75 People in the Labor Forcein in Montezuma.
What is the Percentage of People in the Labor Force in Montezuma?
79.8% of People are in the Labor Force in Montezuma.
What is the Unemployment Rate in Montezuma?
Unemployment Rate in Montezuma is 21.3%.