Alpine Northeast, WY Map & Demographics
Alpine Northeast Map
Alpine Northeast Overview
$68,782
PER CAPITA INCOME
$185,074
AVG HOUSEHOLD INCOME
0.26
INEQUALITY / GINI INDEX
303
TOTAL POPULATION
218
MALE POPULATION
85
FEMALE POPULATION
256.47
MALES / 100 FEMALES
38.99
FEMALES / 100 MALES
44.1
MEDIAN AGE
3.7
AVG FAMILY SIZE
2.2
AVG HOUSEHOLD SIZE
164
LABOR FORCE [ PEOPLE ]
54.1%
PERCENT IN LABOR FORCE
Income in Alpine Northeast
Income Overview in Alpine Northeast
| Characteristic | Number | Measure |
| Per Capita Income | 303 | $68,782 |
| Median Family Income | 61 | $0 |
| Mean Family Income | 61 | $0 |
| Median Household Income | 138 | $185,074 |
| Mean Household Income | 138 | $151,454 |
| Income Deficit | 61 | $0 |
| Wage / Income Gap (%) | 303 | 0.00% |
| Wage / Income Gap ($) | 303 | 100.00¢ per $1 |
| Gini / Inequality Index | 303 | 0.26 |
Earnings by Sex in Alpine Northeast
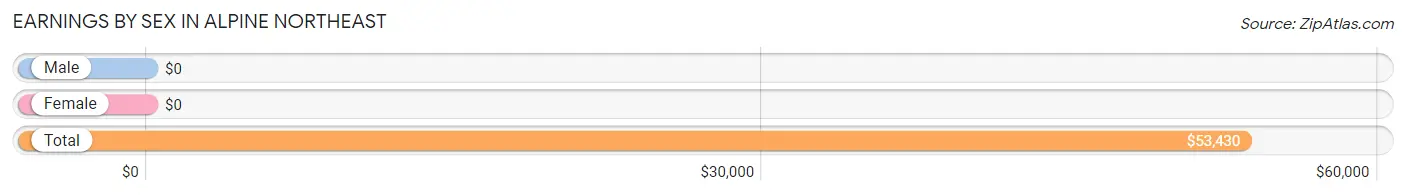
| Sex | Number | Average Earnings |
| Male | 184 (75.4%) | $0 |
| Female | 60 (24.6%) | $0 |
| Total | 244 (100.0%) | $53,430 |
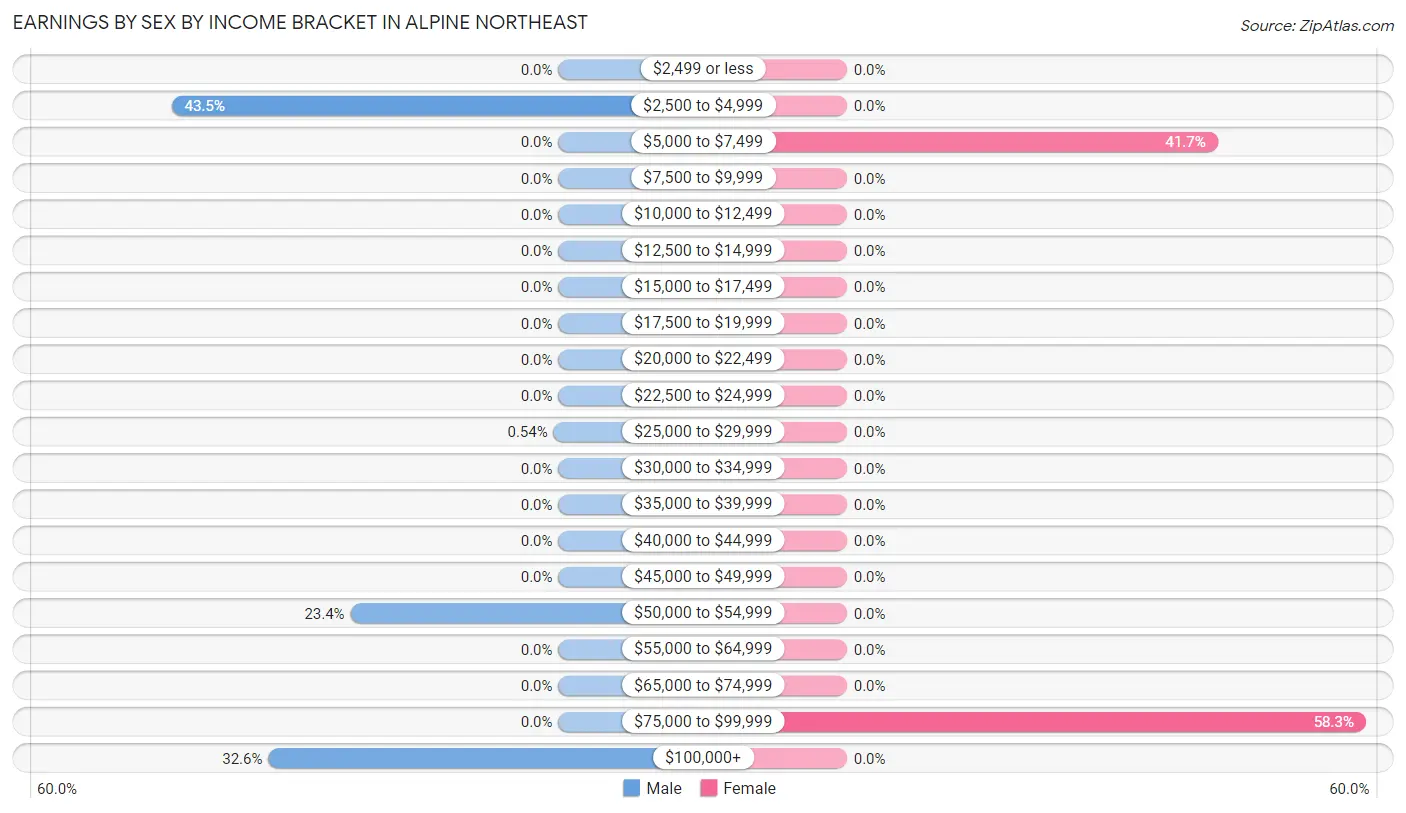
Earnings by Sex by Income Bracket in Alpine Northeast
The most common earnings brackets in Alpine Northeast are $2,500 to $4,999 for men (80 | 43.5%) and $75,000 to $99,999 for women (35 | 58.3%).
| Income | Male | Female |
| $2,499 or less | 0 (0.0%) | 0 (0.0%) |
| $2,500 to $4,999 | 80 (43.5%) | 0 (0.0%) |
| $5,000 to $7,499 | 0 (0.0%) | 25 (41.7%) |
| $7,500 to $9,999 | 0 (0.0%) | 0 (0.0%) |
| $10,000 to $12,499 | 0 (0.0%) | 0 (0.0%) |
| $12,500 to $14,999 | 0 (0.0%) | 0 (0.0%) |
| $15,000 to $17,499 | 0 (0.0%) | 0 (0.0%) |
| $17,500 to $19,999 | 0 (0.0%) | 0 (0.0%) |
| $20,000 to $22,499 | 0 (0.0%) | 0 (0.0%) |
| $22,500 to $24,999 | 0 (0.0%) | 0 (0.0%) |
| $25,000 to $29,999 | 1 (0.5%) | 0 (0.0%) |
| $30,000 to $34,999 | 0 (0.0%) | 0 (0.0%) |
| $35,000 to $39,999 | 0 (0.0%) | 0 (0.0%) |
| $40,000 to $44,999 | 0 (0.0%) | 0 (0.0%) |
| $45,000 to $49,999 | 0 (0.0%) | 0 (0.0%) |
| $50,000 to $54,999 | 43 (23.4%) | 0 (0.0%) |
| $55,000 to $64,999 | 0 (0.0%) | 0 (0.0%) |
| $65,000 to $74,999 | 0 (0.0%) | 0 (0.0%) |
| $75,000 to $99,999 | 0 (0.0%) | 35 (58.3%) |
| $100,000+ | 60 (32.6%) | 0 (0.0%) |
| Total | 184 (100.0%) | 60 (100.0%) |
Earnings by Sex by Educational Attainment in Alpine Northeast
| Educational Attainment | Male Income | Female Income |
| Less than High School | - | - |
| High School Diploma | - | - |
| College or Associate's Degree | - | - |
| Bachelor's Degree | - | - |
| Graduate Degree | - | - |
| Total | - | - |
Family Income in Alpine Northeast
Family Income Brackets in Alpine Northeast
According to the Alpine Northeast family income data, there are 36 families falling into the $200,000+ income range, which is the most common income bracket and makes up 59.0% of all families.
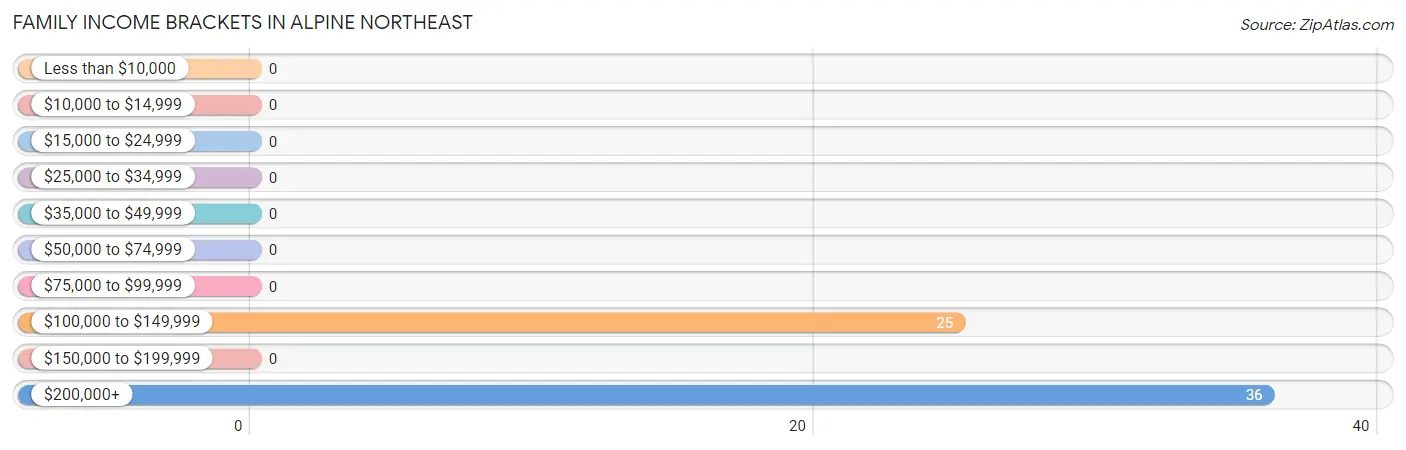
| Income Bracket | # Families | % Families |
| Less than $10,000 | 0 | 0.0% |
| $10,000 to $14,999 | 0 | 0.0% |
| $15,000 to $24,999 | 0 | 0.0% |
| $25,000 to $34,999 | 0 | 0.0% |
| $35,000 to $49,999 | 0 | 0.0% |
| $50,000 to $74,999 | 0 | 0.0% |
| $75,000 to $99,999 | 0 | 0.0% |
| $100,000 to $149,999 | 25 | 41.0% |
| $150,000 to $199,999 | 0 | 0.0% |
| $200,000+ | 36 | 59.0% |
Family Income by Famaliy Size in Alpine Northeast
| Income Bracket | # Families | Median Income |
| 2-Person Families | 0 (0.0%) | $0 |
| 3-Person Families | 61 (100.0%) | $0 |
| 4-Person Families | 0 (0.0%) | $0 |
| 5-Person Families | 0 (0.0%) | $0 |
| 6-Person Families | 0 (0.0%) | $0 |
| 7+ Person Families | 0 (0.0%) | $0 |
| Total | 61 (100.0%) | $0 |
Family Income by Number of Earners in Alpine Northeast
| Number of Earners | # Families | Median Income |
| No Earners | 0 (0.0%) | $0 |
| 1 Earner | 0 (0.0%) | $0 |
| 2 Earners | 25 (41.0%) | $0 |
| 3+ Earners | 36 (59.0%) | $0 |
| Total | 61 (100.0%) | $0 |
Household Income in Alpine Northeast
Household Income Brackets in Alpine Northeast
With 43 households falling in the category, the $50,000 to $74,999 income range is the most frequent in Alpine Northeast, accounting for 31.2% of all households.
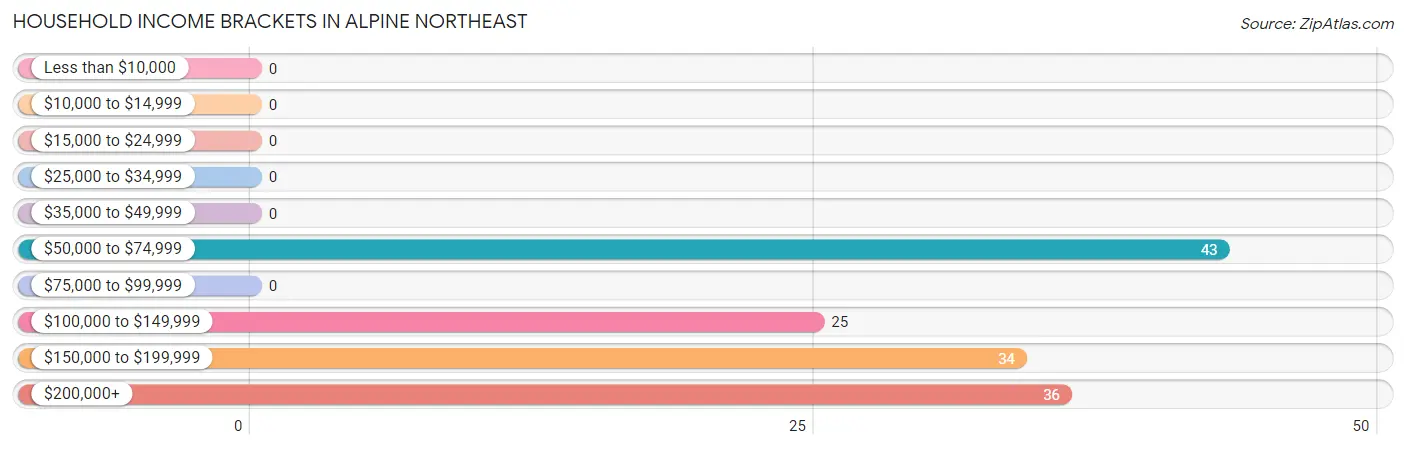
| Income Bracket | # Households | % Households |
| Less than $10,000 | 0 | 0.0% |
| $10,000 to $14,999 | 0 | 0.0% |
| $15,000 to $24,999 | 0 | 0.0% |
| $25,000 to $34,999 | 0 | 0.0% |
| $35,000 to $49,999 | 0 | 0.0% |
| $50,000 to $74,999 | 43 | 31.2% |
| $75,000 to $99,999 | 0 | 0.0% |
| $100,000 to $149,999 | 25 | 18.1% |
| $150,000 to $199,999 | 34 | 24.6% |
| $200,000+ | 36 | 26.1% |
Household Income by Householder Age in Alpine Northeast
| Income Bracket | # Households | Median Income |
| 15 to 24 Years | 0 (0.0%) | $0 |
| 25 to 44 Years | 68 (49.3%) | $0 |
| 45 to 64 Years | 36 (26.1%) | $0 |
| 65+ Years | 34 (24.6%) | $0 |
| Total | 138 (100.0%) | $185,074 |
Poverty in Alpine Northeast
Income Below Poverty by Sex and Age in Alpine Northeast
| Age Bracket | Male | Female |
| Under 5 Years | 0 (0.0%) | 0 (0.0%) |
| 5 Years | 0 (0.0%) | 0 (0.0%) |
| 6 to 11 Years | 0 (0.0%) | 0 (0.0%) |
| 12 to 14 Years | 0 (0.0%) | 0 (0.0%) |
| 15 Years | 0 (0.0%) | 0 (0.0%) |
| 16 and 17 Years | 0 (0.0%) | 0 (0.0%) |
| 18 to 24 Years | 0 (0.0%) | 0 (0.0%) |
| 25 to 34 Years | 0 (0.0%) | 0 (0.0%) |
| 35 to 44 Years | 0 (0.0%) | 0 (0.0%) |
| 45 to 54 Years | 0 (0.0%) | 0 (0.0%) |
| 55 to 64 Years | 0 (0.0%) | 0 (0.0%) |
| 65 to 74 Years | 0 (0.0%) | 0 (0.0%) |
| 75 Years and over | 0 (0.0%) | 0 (0.0%) |
| Total | 0 (0.0%) | 0 (0.0%) |
Income Above Poverty by Sex and Age in Alpine Northeast
According to the poverty statistics in Alpine Northeast, males aged 18 to 24 years and females aged 16 and 17 years are the age groups that are most secure financially, with 100.0% of males and 100.0% of females in these age groups living above the poverty line.
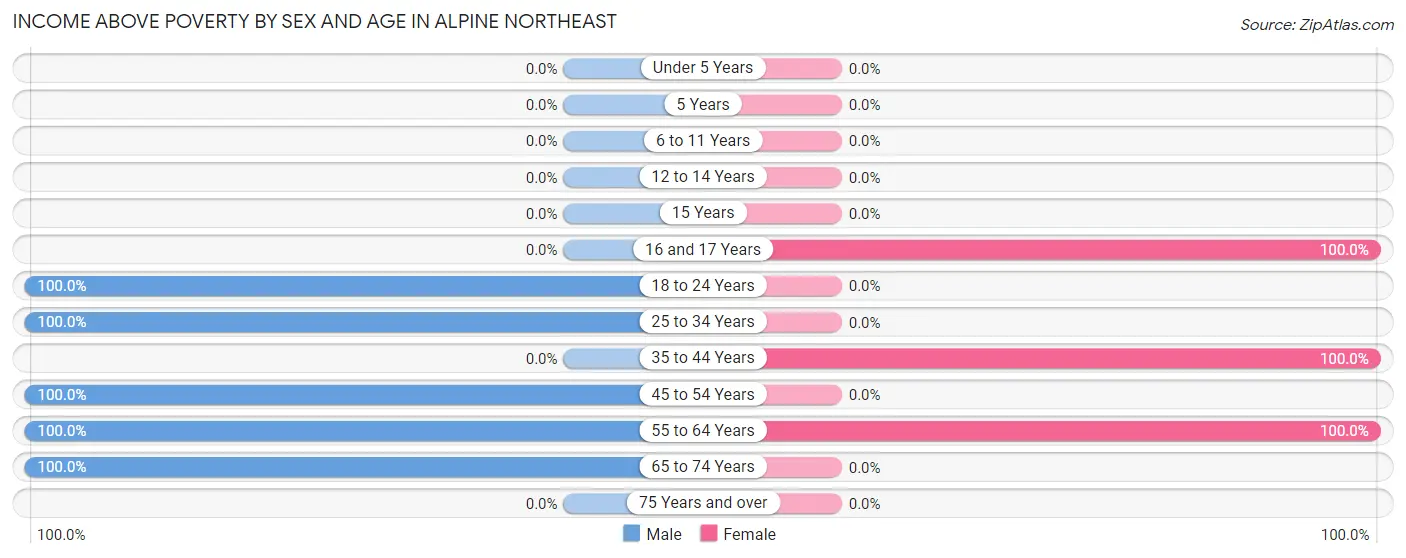
| Age Bracket | Male | Female |
| Under 5 Years | 0 (0.0%) | 0 (0.0%) |
| 5 Years | 0 (0.0%) | 0 (0.0%) |
| 6 to 11 Years | 0 (0.0%) | 0 (0.0%) |
| 12 to 14 Years | 0 (0.0%) | 0 (0.0%) |
| 15 Years | 0 (0.0%) | 0 (0.0%) |
| 16 and 17 Years | 0 (0.0%) | 25 (100.0%) |
| 18 to 24 Years | 81 (100.0%) | 0 (0.0%) |
| 25 to 34 Years | 43 (100.0%) | 0 (0.0%) |
| 35 to 44 Years | 0 (0.0%) | 25 (100.0%) |
| 45 to 54 Years | 24 (100.0%) | 0 (0.0%) |
| 55 to 64 Years | 36 (100.0%) | 35 (100.0%) |
| 65 to 74 Years | 34 (100.0%) | 0 (0.0%) |
| 75 Years and over | 0 (0.0%) | 0 (0.0%) |
| Total | 218 (100.0%) | 85 (100.0%) |
Income Below Poverty Among Married-Couple Families in Alpine Northeast
| Children | Above Poverty | Below Poverty |
| No Children | 36 (100.0%) | 0 (0.0%) |
| 1 or 2 Children | 25 (100.0%) | 0 (0.0%) |
| 3 or 4 Children | 0 (0.0%) | 0 (0.0%) |
| 5 or more Children | 0 (0.0%) | 0 (0.0%) |
| Total | 61 (100.0%) | 0 (0.0%) |
Income Below Poverty Among Single-Parent Households in Alpine Northeast
| Children | Single Father | Single Mother |
| No Children | 0 (0.0%) | 0 (0.0%) |
| 1 or 2 Children | 0 (0.0%) | 0 (0.0%) |
| 3 or 4 Children | 0 (0.0%) | 0 (0.0%) |
| 5 or more Children | 0 (0.0%) | 0 (0.0%) |
| Total | 0 (0.0%) | 0 (0.0%) |
Income Below Poverty Among Married-Couple vs Single-Parent Households in Alpine Northeast
| Children | Married-Couple Families | Single-Parent Households |
| No Children | 0 (0.0%) | 0 (0.0%) |
| 1 or 2 Children | 0 (0.0%) | 0 (0.0%) |
| 3 or 4 Children | 0 (0.0%) | 0 (0.0%) |
| 5 or more Children | 0 (0.0%) | 0 (0.0%) |
| Total | 0 (0.0%) | 0 (0.0%) |
Race in Alpine Northeast
The most populous races in Alpine Northeast are White / Caucasian (302 | 99.7%), and Some other Race (1 | 0.3%).
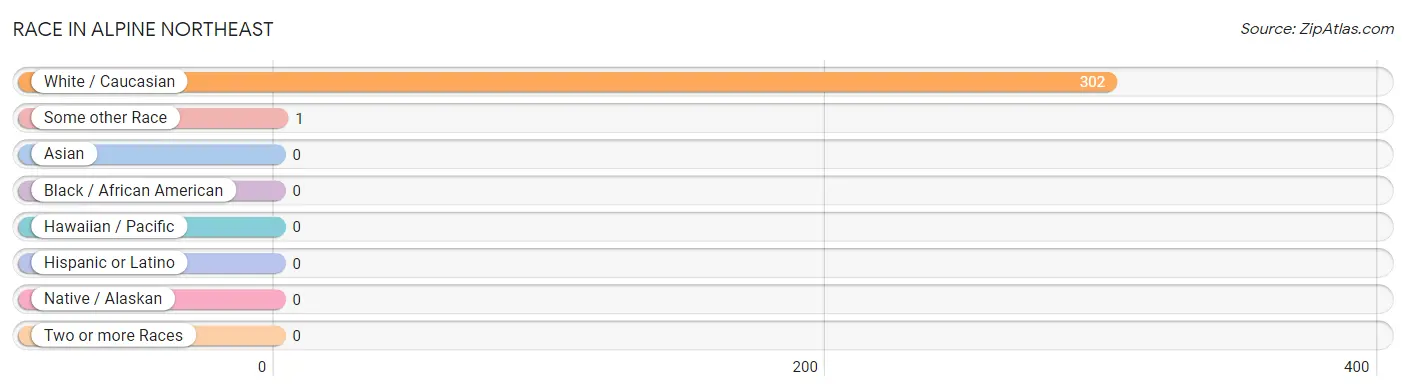
| Race | # Population | % Population |
| Asian | 0 | 0.0% |
| Black / African American | 0 | 0.0% |
| Hawaiian / Pacific | 0 | 0.0% |
| Hispanic or Latino | 0 | 0.0% |
| Native / Alaskan | 0 | 0.0% |
| White / Caucasian | 302 | 99.7% |
| Two or more Races | 0 | 0.0% |
| Some other Race | 1 | 0.3% |
| Total | 303 | 100.0% |
Ancestry in Alpine Northeast
The most populous ancestries reported in Alpine Northeast are English (151 | 49.8%), European (49 | 16.2%), Scottish (43 | 14.2%), Welsh (43 | 14.2%), and German (34 | 11.2%), together accounting for 105.6% of all Alpine Northeast residents.
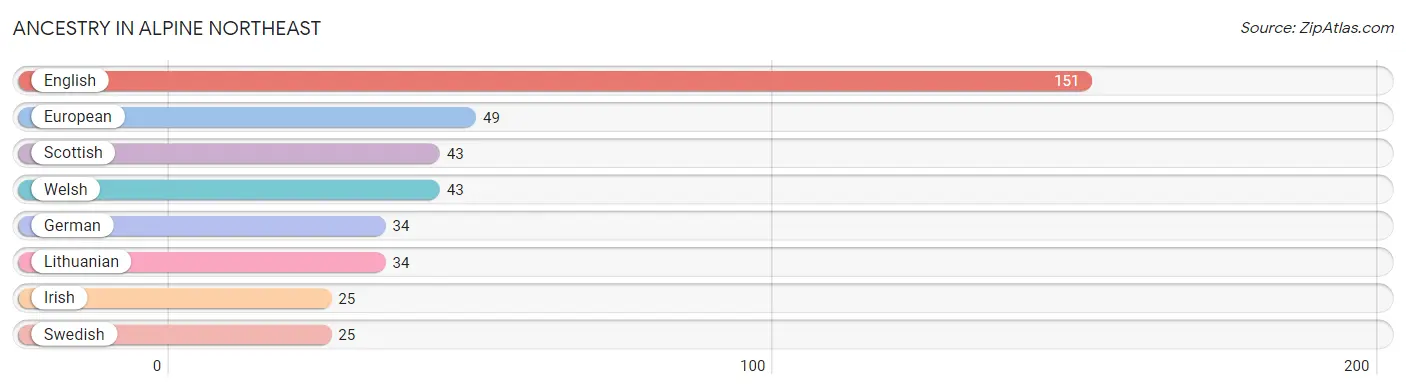
| Ancestry | # Population | % Population |
| English | 151 | 49.8% |
| European | 49 | 16.2% |
| German | 34 | 11.2% |
| Irish | 25 | 8.3% |
| Lithuanian | 34 | 11.2% |
| Scottish | 43 | 14.2% |
| Swedish | 25 | 8.3% |
| Welsh | 43 | 14.2% | View All 8 Rows |
Immigrants in Alpine Northeast
The most numerous immigrant groups reported in Alpine Northeast came from , and Oceania (24 | 7.9%), together accounting for 7.9% of all Alpine Northeast residents.

| Immigration Origin | # Population | % Population |
| Oceania | 24 | 7.9% | View All 1 Rows |
Sex and Age in Alpine Northeast
Sex and Age in Alpine Northeast
The most populous age groups in Alpine Northeast are 20 to 24 Years (81 | 37.2%) for men and 60 to 64 Years (35 | 41.2%) for women.
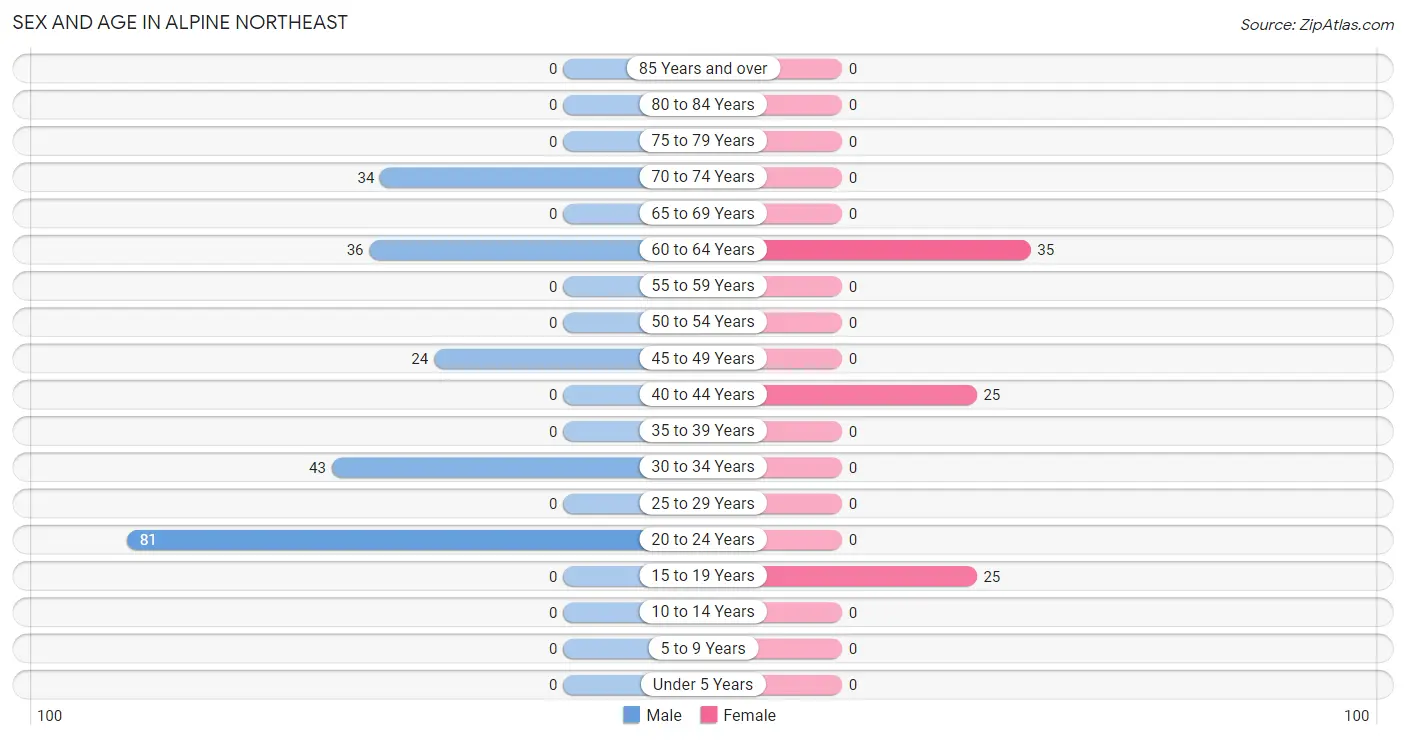
| Age Bracket | Male | Female |
| Under 5 Years | 0 (0.0%) | 0 (0.0%) |
| 5 to 9 Years | 0 (0.0%) | 0 (0.0%) |
| 10 to 14 Years | 0 (0.0%) | 0 (0.0%) |
| 15 to 19 Years | 0 (0.0%) | 25 (29.4%) |
| 20 to 24 Years | 81 (37.2%) | 0 (0.0%) |
| 25 to 29 Years | 0 (0.0%) | 0 (0.0%) |
| 30 to 34 Years | 43 (19.7%) | 0 (0.0%) |
| 35 to 39 Years | 0 (0.0%) | 0 (0.0%) |
| 40 to 44 Years | 0 (0.0%) | 25 (29.4%) |
| 45 to 49 Years | 24 (11.0%) | 0 (0.0%) |
| 50 to 54 Years | 0 (0.0%) | 0 (0.0%) |
| 55 to 59 Years | 0 (0.0%) | 0 (0.0%) |
| 60 to 64 Years | 36 (16.5%) | 35 (41.2%) |
| 65 to 69 Years | 0 (0.0%) | 0 (0.0%) |
| 70 to 74 Years | 34 (15.6%) | 0 (0.0%) |
| 75 to 79 Years | 0 (0.0%) | 0 (0.0%) |
| 80 to 84 Years | 0 (0.0%) | 0 (0.0%) |
| 85 Years and over | 0 (0.0%) | 0 (0.0%) |
| Total | 218 (100.0%) | 85 (100.0%) |
Families and Households in Alpine Northeast
Median Family Size in Alpine Northeast
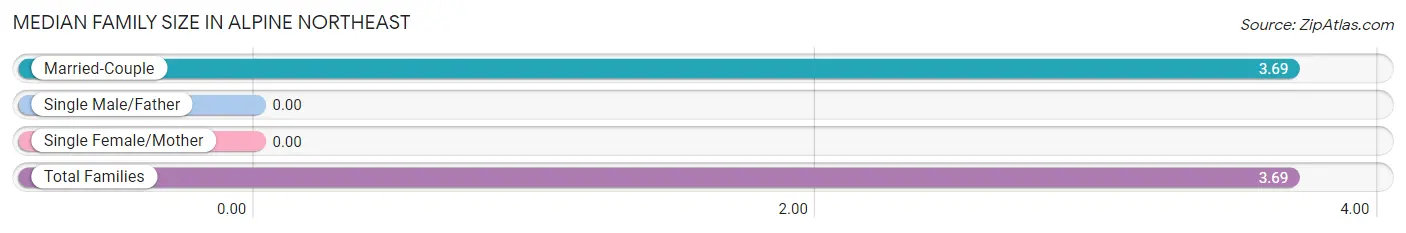
| Family Type | # Families | Family Size |
| Married-Couple | 61 (100.0%) | 3.69 |
| Single Male/Father | 0 (0.0%) | - |
| Single Female/Mother | 0 (0.0%) | - |
| Total Families | 61 (100.0%) | 3.69 |
Median Household Size in Alpine Northeast
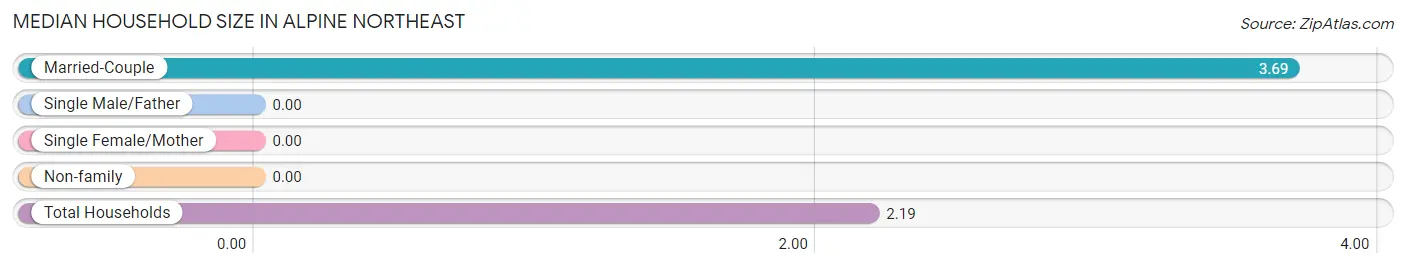
| Household Type | # Households | Household Size |
| Married-Couple | 61 (44.2%) | 3.69 |
| Single Male/Father | 0 (0.0%) | - |
| Single Female/Mother | 0 (0.0%) | - |
| Non-family | 77 (55.8%) | - |
| Total Households | 138 (100.0%) | 2.19 |
Household Size by Marriage Status in Alpine Northeast
Out of a total of 138 households in Alpine Northeast, 61 (44.2%) are family households, while 77 (55.8%) are nonfamily households. The most numerous type of family households are 3-person households, comprising 61, and the most common type of nonfamily households are 1-person households, comprising 77.
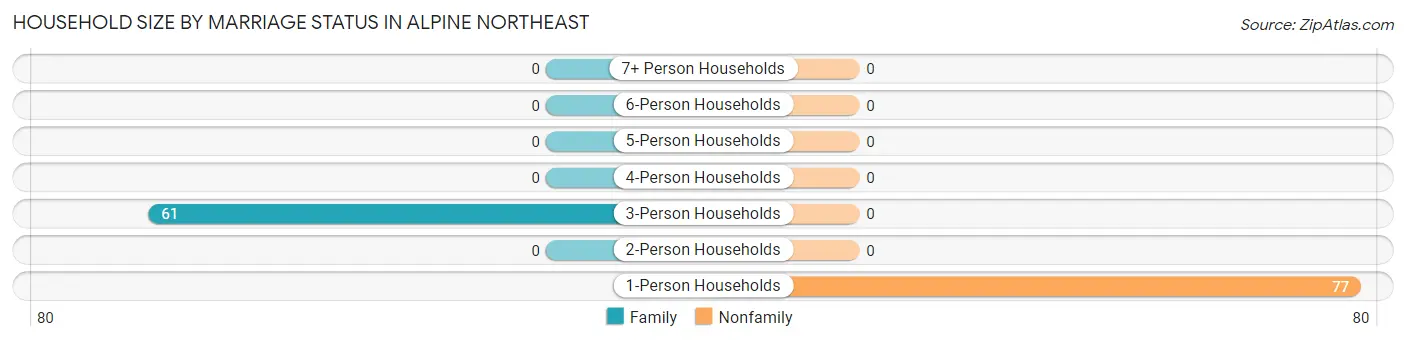
| Household Size | Family Households | Nonfamily Households |
| 1-Person Households | - | 77 (55.8%) |
| 2-Person Households | 0 (0.0%) | 0 (0.0%) |
| 3-Person Households | 61 (44.2%) | 0 (0.0%) |
| 4-Person Households | 0 (0.0%) | 0 (0.0%) |
| 5-Person Households | 0 (0.0%) | 0 (0.0%) |
| 6-Person Households | 0 (0.0%) | 0 (0.0%) |
| 7+ Person Households | 0 (0.0%) | 0 (0.0%) |
| Total | 61 (44.2%) | 77 (55.8%) |
Female Fertility in Alpine Northeast
Fertility by Age in Alpine Northeast
| Age Bracket | Women with Births | Births / 1,000 Women |
| 15 to 19 years | 0 (0.0%) | 0.0 |
| 20 to 34 years | 0 (0.0%) | 0.0 |
| 35 to 50 years | 0 (0.0%) | 0.0 |
| Total | 0 (0.0%) | 0.0 |
Fertility by Age by Marriage Status in Alpine Northeast
| Age Bracket | Married | Unmarried |
| 15 to 19 years | 0 (0.0%) | 0 (0.0%) |
| 20 to 34 years | 0 (0.0%) | 0 (0.0%) |
| 35 to 50 years | 0 (0.0%) | 0 (0.0%) |
| Total | 0 (0.0%) | 0 (0.0%) |
Fertility by Education in Alpine Northeast
| Educational Attainment | Women with Births | Births / 1,000 Women |
| Less than High School | 0 (0.0%) | 0.0 |
| High School Diploma | 0 (0.0%) | 0.0 |
| College or Associate's Degree | 0 (0.0%) | 0.0 |
| Bachelor's Degree | 0 (0.0%) | 0.0 |
| Graduate Degree | 0 (0.0%) | 0.0 |
| Total | 0 (0.0%) | 0.0 |
Fertility by Education by Marriage Status in Alpine Northeast
| Educational Attainment | Married | Unmarried |
| Less than High School | 0 (0.0%) | 0 (0.0%) |
| High School Diploma | 0 (0.0%) | 0 (0.0%) |
| College or Associate's Degree | 0 (0.0%) | 0 (0.0%) |
| Bachelor's Degree | 0 (0.0%) | 0 (0.0%) |
| Graduate Degree | 0 (0.0%) | 0 (0.0%) |
| Total | 0 (0.0%) | 0 (0.0%) |
Employment Characteristics in Alpine Northeast
Employment by Class of Employer in Alpine Northeast
Among the 164 employed individuals in Alpine Northeast, private company employees (79 | 48.2%), not-for-profit organizations (49 | 29.9%), and self-employed (incorporated) (36 | 22.0%) make up the most common classes of employment.
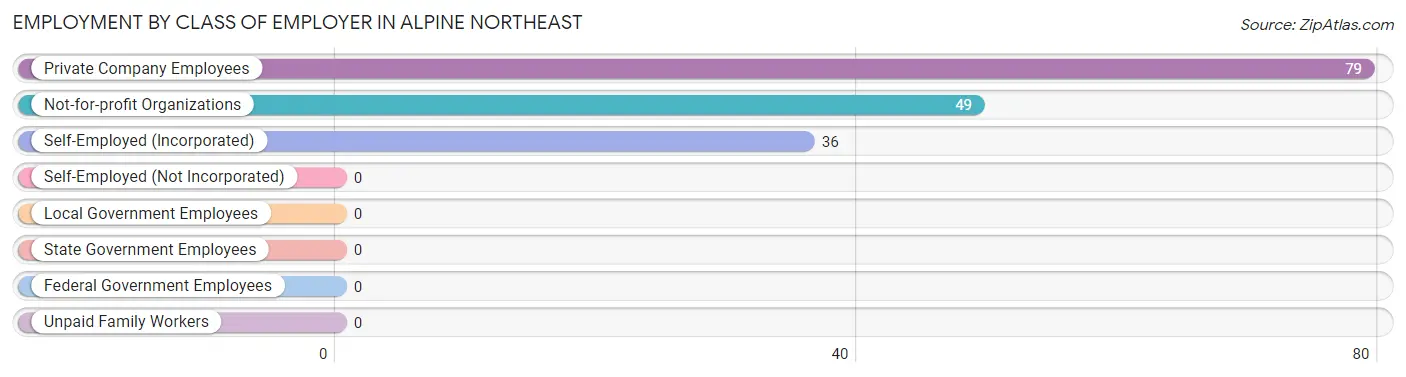
| Employer Class | # Employees | % Employees |
| Private Company Employees | 79 | 48.2% |
| Self-Employed (Incorporated) | 36 | 22.0% |
| Self-Employed (Not Incorporated) | 0 | 0.0% |
| Not-for-profit Organizations | 49 | 29.9% |
| Local Government Employees | 0 | 0.0% |
| State Government Employees | 0 | 0.0% |
| Federal Government Employees | 0 | 0.0% |
| Unpaid Family Workers | 0 | 0.0% |
| Total | 164 | 100.0% |
Employment Status by Age in Alpine Northeast
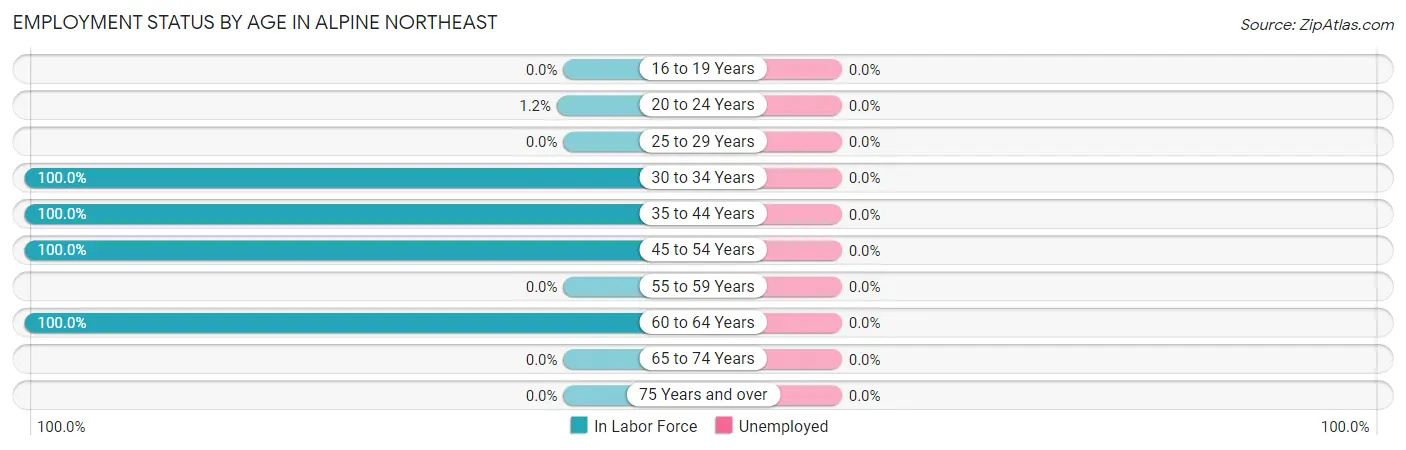
| Age Bracket | In Labor Force | Unemployed |
| 16 to 19 Years | 0 (0.0%) | 0 (0.0%) |
| 20 to 24 Years | 1 (1.2%) | 0 (0.0%) |
| 25 to 29 Years | 0 (0.0%) | 0 (0.0%) |
| 30 to 34 Years | 43 (100.0%) | 0 (0.0%) |
| 35 to 44 Years | 25 (100.0%) | 0 (0.0%) |
| 45 to 54 Years | 24 (100.0%) | 0 (0.0%) |
| 55 to 59 Years | 0 (0.0%) | 0 (0.0%) |
| 60 to 64 Years | 71 (100.0%) | 0 (0.0%) |
| 65 to 74 Years | 0 (0.0%) | 0 (0.0%) |
| 75 Years and over | 0 (0.0%) | 0 (0.0%) |
| Total | 164 (54.1%) | 0 (0.0%) |
Employment Status by Educational Attainment in Alpine Northeast
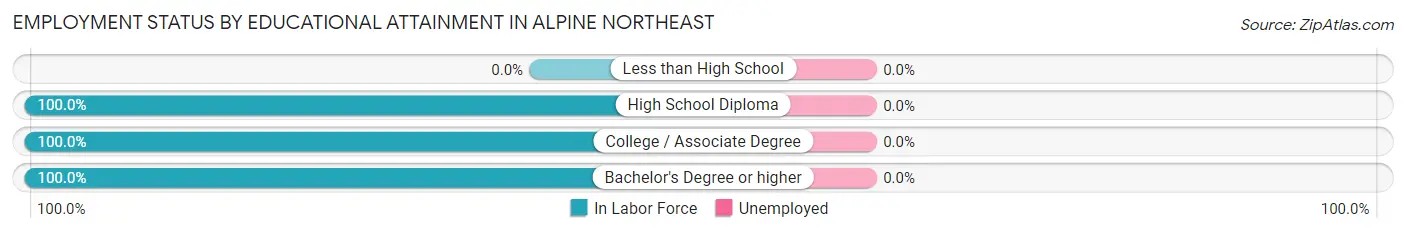
| Educational Attainment | In Labor Force | Unemployed |
| Less than High School | 0 (0.0%) | 0 (0.0%) |
| High School Diploma | 36 (100.0%) | 0 (0.0%) |
| College / Associate Degree | 78 (100.0%) | 0 (0.0%) |
| Bachelor's Degree or higher | 49 (100.0%) | 0 (0.0%) |
| Total | 163 (100.0%) | 0 (0.0%) |
Employment Occupations by Sex in Alpine Northeast
Management, Business, Science and Arts Occupations
The most common Management, Business, Science and Arts occupations in Alpine Northeast are Management (103 | 62.8%), Health Diagnosing & Treating (35 | 21.3%), Health Technologists (35 | 21.3%), Community & Social Service (25 | 15.2%), and Education Instruction & Library (25 | 15.2%).
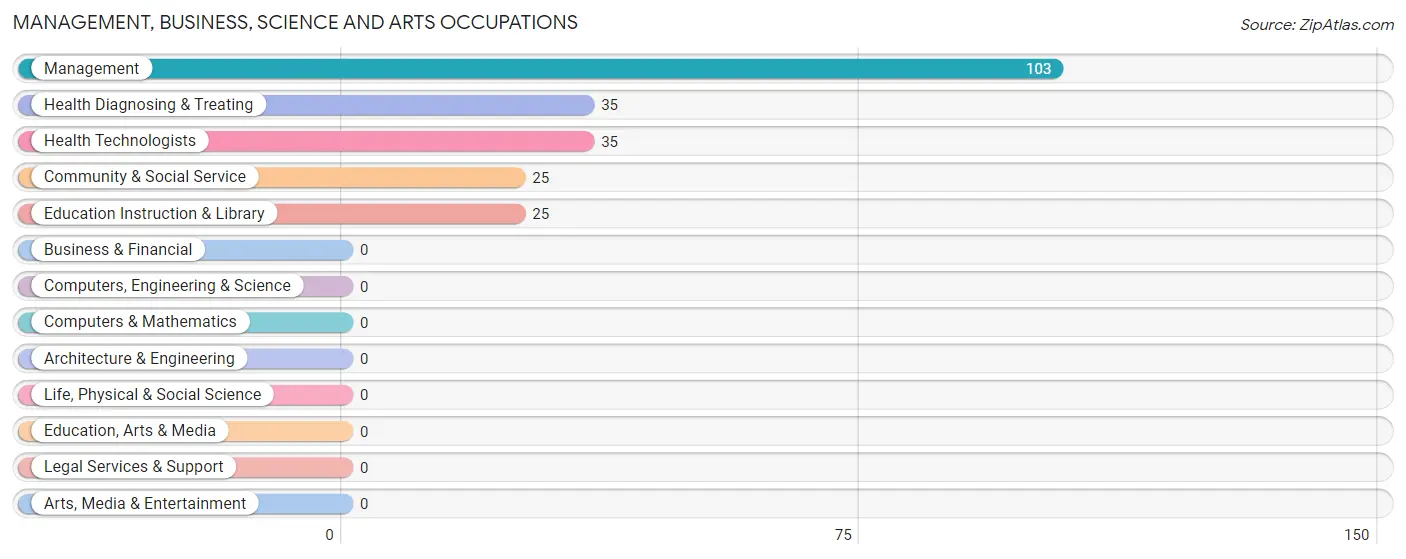
Management, Business, Science and Arts Occupations by Sex
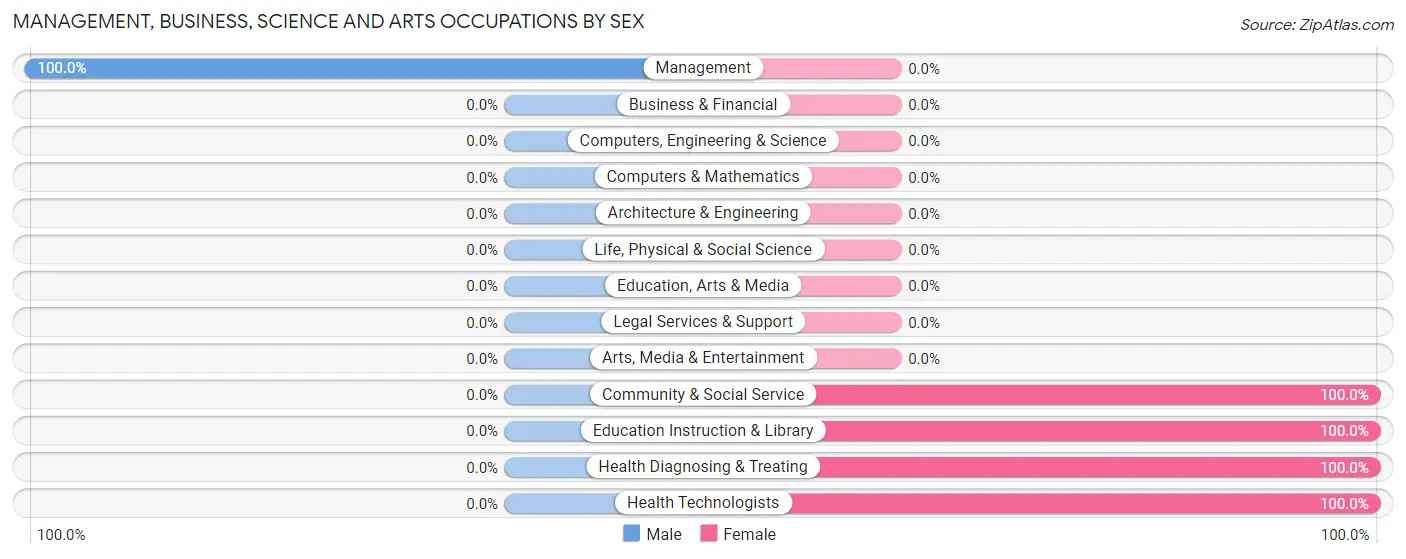
| Occupation | Male | Female |
| Management | 103 (100.0%) | 0 (0.0%) |
| Business & Financial | 0 (0.0%) | 0 (0.0%) |
| Computers, Engineering & Science | 0 (0.0%) | 0 (0.0%) |
| Computers & Mathematics | 0 (0.0%) | 0 (0.0%) |
| Architecture & Engineering | 0 (0.0%) | 0 (0.0%) |
| Life, Physical & Social Science | 0 (0.0%) | 0 (0.0%) |
| Community & Social Service | 0 (0.0%) | 25 (100.0%) |
| Education, Arts & Media | 0 (0.0%) | 0 (0.0%) |
| Legal Services & Support | 0 (0.0%) | 0 (0.0%) |
| Education Instruction & Library | 0 (0.0%) | 25 (100.0%) |
| Arts, Media & Entertainment | 0 (0.0%) | 0 (0.0%) |
| Health Diagnosing & Treating | 0 (0.0%) | 35 (100.0%) |
| Health Technologists | 0 (0.0%) | 35 (100.0%) |
| Total (Category) | 103 (63.2%) | 60 (36.8%) |
| Total (Overall) | 104 (63.4%) | 60 (36.6%) |
Services Occupations
Services Occupations by Sex
| Occupation | Male | Female |
| Healthcare Support | 0 (0.0%) | 0 (0.0%) |
| Security & Protection | 0 (0.0%) | 0 (0.0%) |
| Firefighting & Prevention | 0 (0.0%) | 0 (0.0%) |
| Law Enforcement | 0 (0.0%) | 0 (0.0%) |
| Food Preparation & Serving | 0 (0.0%) | 0 (0.0%) |
| Cleaning & Maintenance | 0 (0.0%) | 0 (0.0%) |
| Personal Care & Service | 0 (0.0%) | 0 (0.0%) |
| Total (Category) | 0 (0.0%) | 0 (0.0%) |
| Total (Overall) | 104 (63.4%) | 60 (36.6%) |
Sales and Office Occupations
Sales and Office Occupations by Sex
| Occupation | Male | Female |
| Sales & Related | 0 (0.0%) | 0 (0.0%) |
| Office & Administration | 0 (0.0%) | 0 (0.0%) |
| Total (Category) | 0 (0.0%) | 0 (0.0%) |
| Total (Overall) | 104 (63.4%) | 60 (36.6%) |
Natural Resources, Construction and Maintenance Occupations
The most common Natural Resources, Construction and Maintenance occupations in Alpine Northeast are , and Farming, Fishing & Forestry (1 | 0.6%).
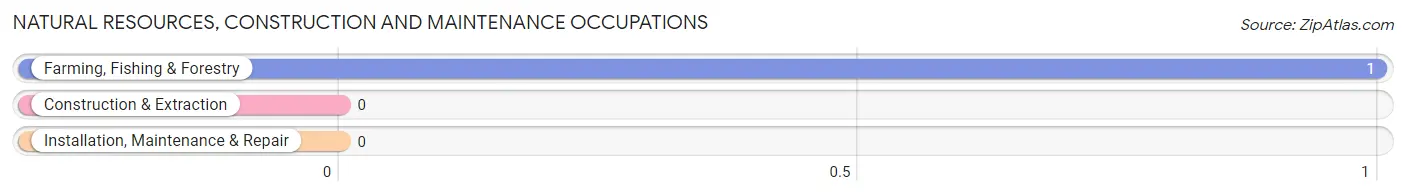
Natural Resources, Construction and Maintenance Occupations by Sex
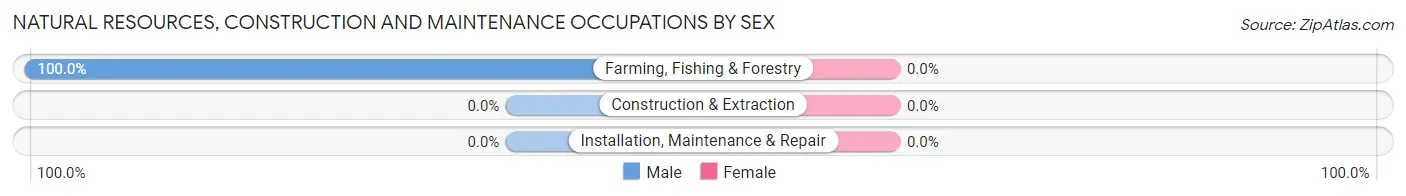
| Occupation | Male | Female |
| Farming, Fishing & Forestry | 1 (100.0%) | 0 (0.0%) |
| Construction & Extraction | 0 (0.0%) | 0 (0.0%) |
| Installation, Maintenance & Repair | 0 (0.0%) | 0 (0.0%) |
| Total (Category) | 1 (100.0%) | 0 (0.0%) |
| Total (Overall) | 104 (63.4%) | 60 (36.6%) |
Production, Transportation and Moving Occupations
Production, Transportation and Moving Occupations by Sex
| Occupation | Male | Female |
| Production | 0 (0.0%) | 0 (0.0%) |
| Transportation | 0 (0.0%) | 0 (0.0%) |
| Material Moving | 0 (0.0%) | 0 (0.0%) |
| Total (Category) | 0 (0.0%) | 0 (0.0%) |
| Total (Overall) | 104 (63.4%) | 60 (36.6%) |
Employment Industries by Sex in Alpine Northeast
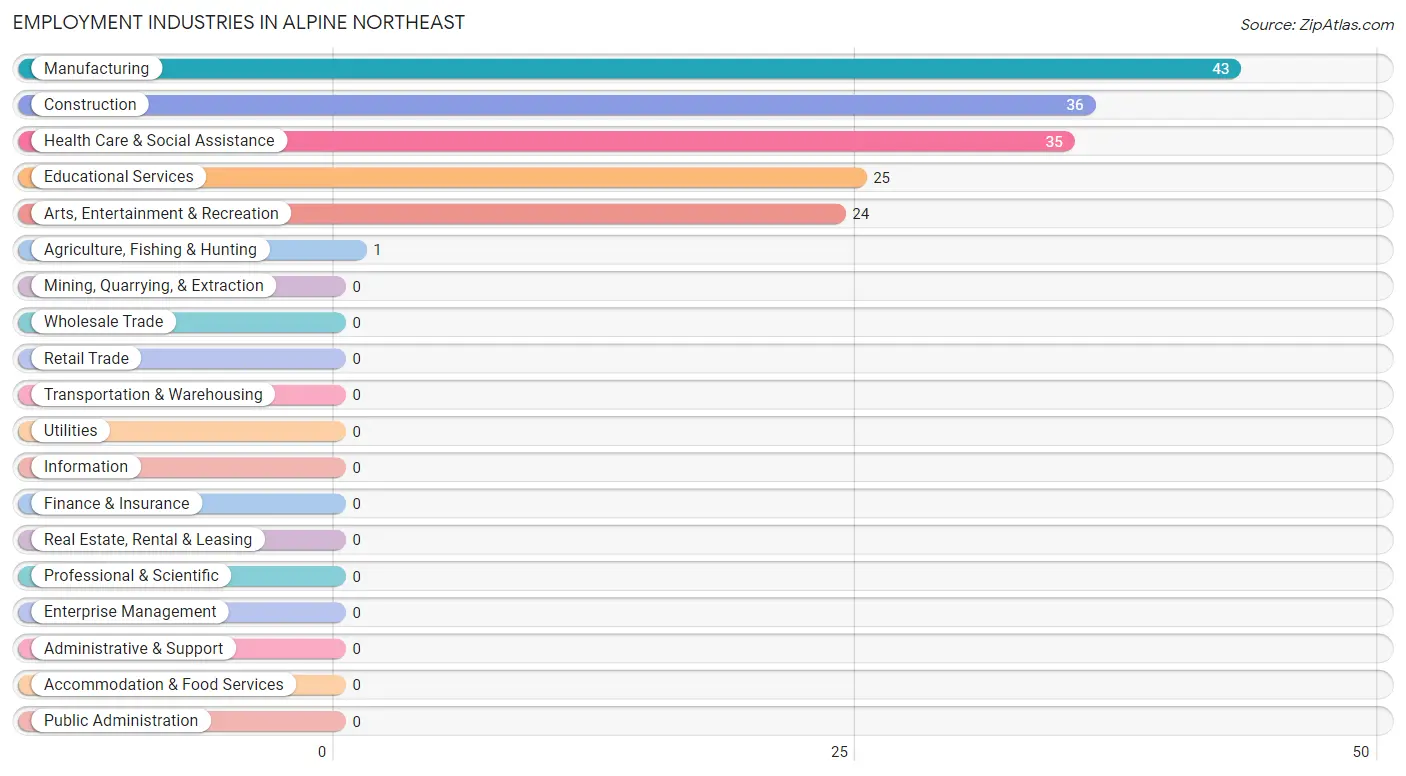
Employment Industries in Alpine Northeast
The major employment industries in Alpine Northeast include Manufacturing (43 | 26.2%), Construction (36 | 22.0%), Health Care & Social Assistance (35 | 21.3%), Educational Services (25 | 15.2%), and Arts, Entertainment & Recreation (24 | 14.6%).
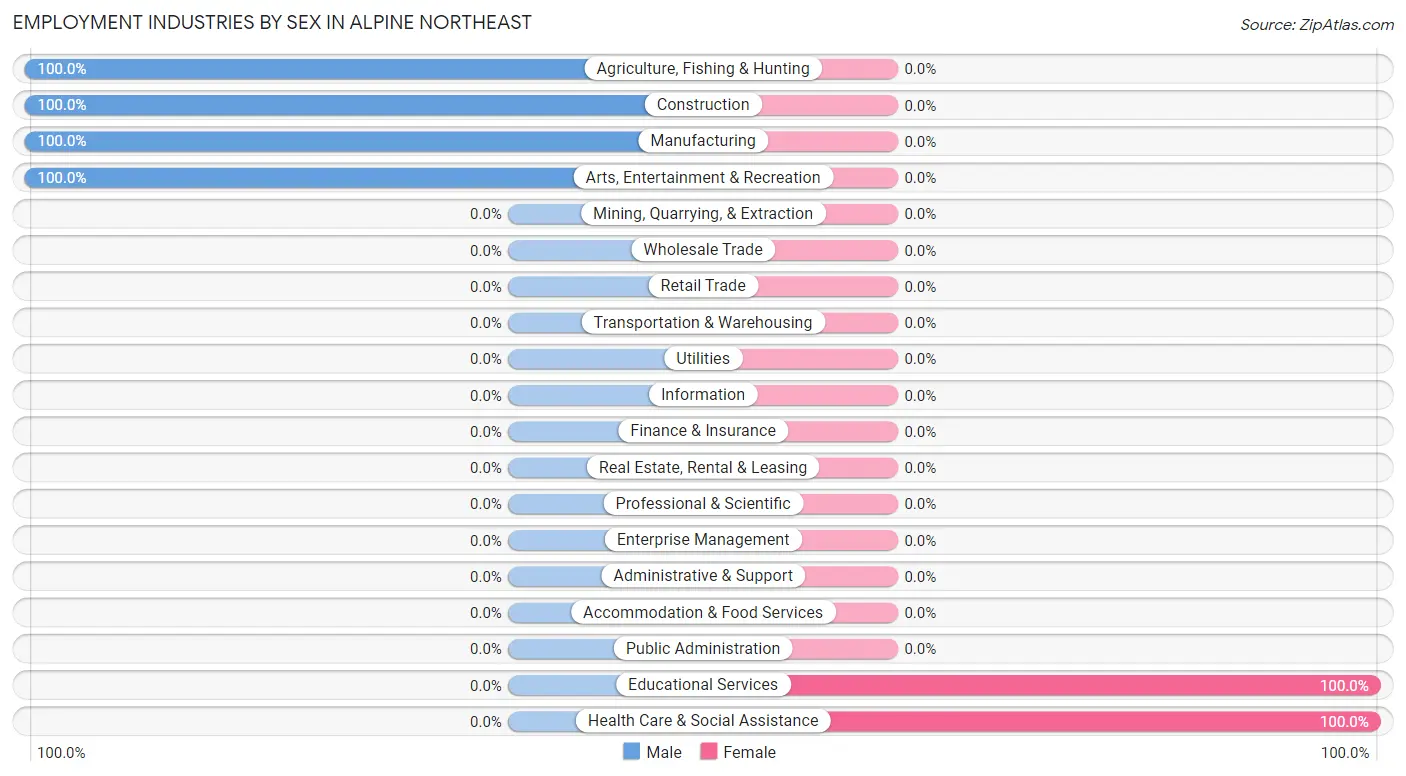
Employment Industries by Sex in Alpine Northeast
The Alpine Northeast industries that see more men than women are Agriculture, Fishing & Hunting (100.0%), Construction (100.0%), and Manufacturing (100.0%), whereas the industries that tend to have a higher number of women are Educational Services (100.0%), and Health Care & Social Assistance (100.0%).
| Industry | Male | Female |
| Agriculture, Fishing & Hunting | 1 (100.0%) | 0 (0.0%) |
| Mining, Quarrying, & Extraction | 0 (0.0%) | 0 (0.0%) |
| Construction | 36 (100.0%) | 0 (0.0%) |
| Manufacturing | 43 (100.0%) | 0 (0.0%) |
| Wholesale Trade | 0 (0.0%) | 0 (0.0%) |
| Retail Trade | 0 (0.0%) | 0 (0.0%) |
| Transportation & Warehousing | 0 (0.0%) | 0 (0.0%) |
| Utilities | 0 (0.0%) | 0 (0.0%) |
| Information | 0 (0.0%) | 0 (0.0%) |
| Finance & Insurance | 0 (0.0%) | 0 (0.0%) |
| Real Estate, Rental & Leasing | 0 (0.0%) | 0 (0.0%) |
| Professional & Scientific | 0 (0.0%) | 0 (0.0%) |
| Enterprise Management | 0 (0.0%) | 0 (0.0%) |
| Administrative & Support | 0 (0.0%) | 0 (0.0%) |
| Educational Services | 0 (0.0%) | 25 (100.0%) |
| Health Care & Social Assistance | 0 (0.0%) | 35 (100.0%) |
| Arts, Entertainment & Recreation | 24 (100.0%) | 0 (0.0%) |
| Accommodation & Food Services | 0 (0.0%) | 0 (0.0%) |
| Public Administration | 0 (0.0%) | 0 (0.0%) |
| Total | 104 (63.4%) | 60 (36.6%) |
Education in Alpine Northeast
School Enrollment in Alpine Northeast
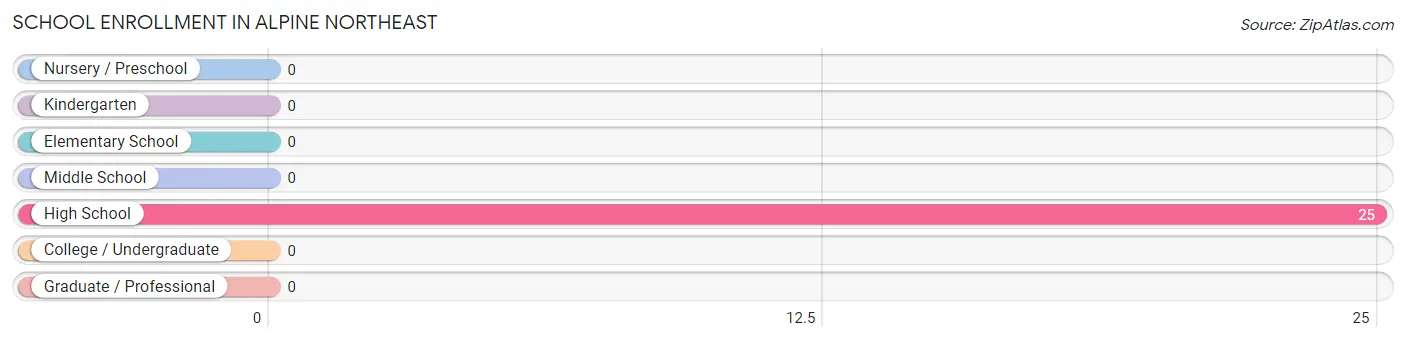
| School Level | # Students | % Students |
| Nursery / Preschool | 0 | 0.0% |
| Kindergarten | 0 | 0.0% |
| Elementary School | 0 | 0.0% |
| Middle School | 0 | 0.0% |
| High School | 25 | 100.0% |
| College / Undergraduate | 0 | 0.0% |
| Graduate / Professional | 0 | 0.0% |
| Total | 25 | 100.0% |
School Enrollment by Age by Funding Source in Alpine Northeast
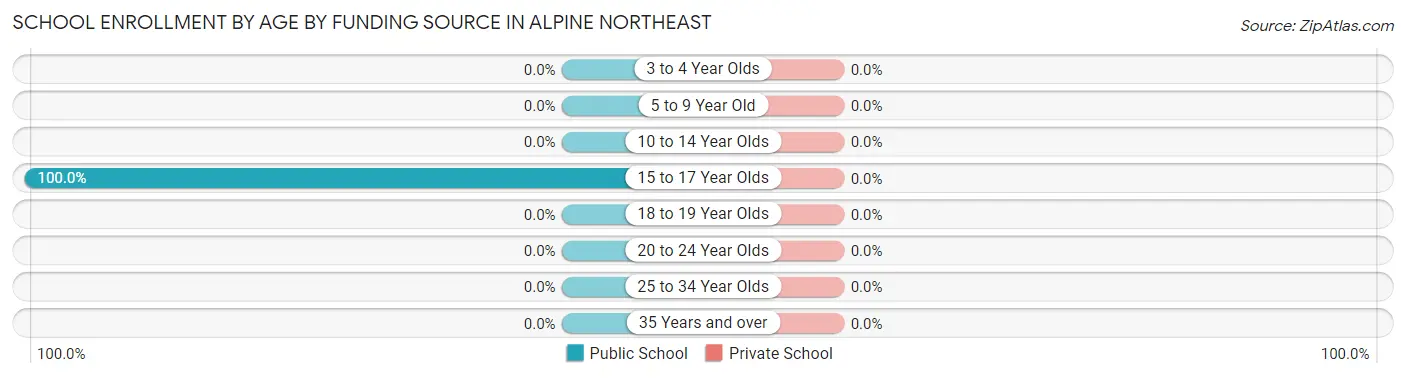
| Age Bracket | Public School | Private School |
| 3 to 4 Year Olds | 0 (0.0%) | 0 (0.0%) |
| 5 to 9 Year Old | 0 (0.0%) | 0 (0.0%) |
| 10 to 14 Year Olds | 0 (0.0%) | 0 (0.0%) |
| 15 to 17 Year Olds | 25 (100.0%) | 0 (0.0%) |
| 18 to 19 Year Olds | 0 (0.0%) | 0 (0.0%) |
| 20 to 24 Year Olds | 0 (0.0%) | 0 (0.0%) |
| 25 to 34 Year Olds | 0 (0.0%) | 0 (0.0%) |
| 35 Years and over | 0 (0.0%) | 0 (0.0%) |
| Total | 25 (100.0%) | 0 (0.0%) |
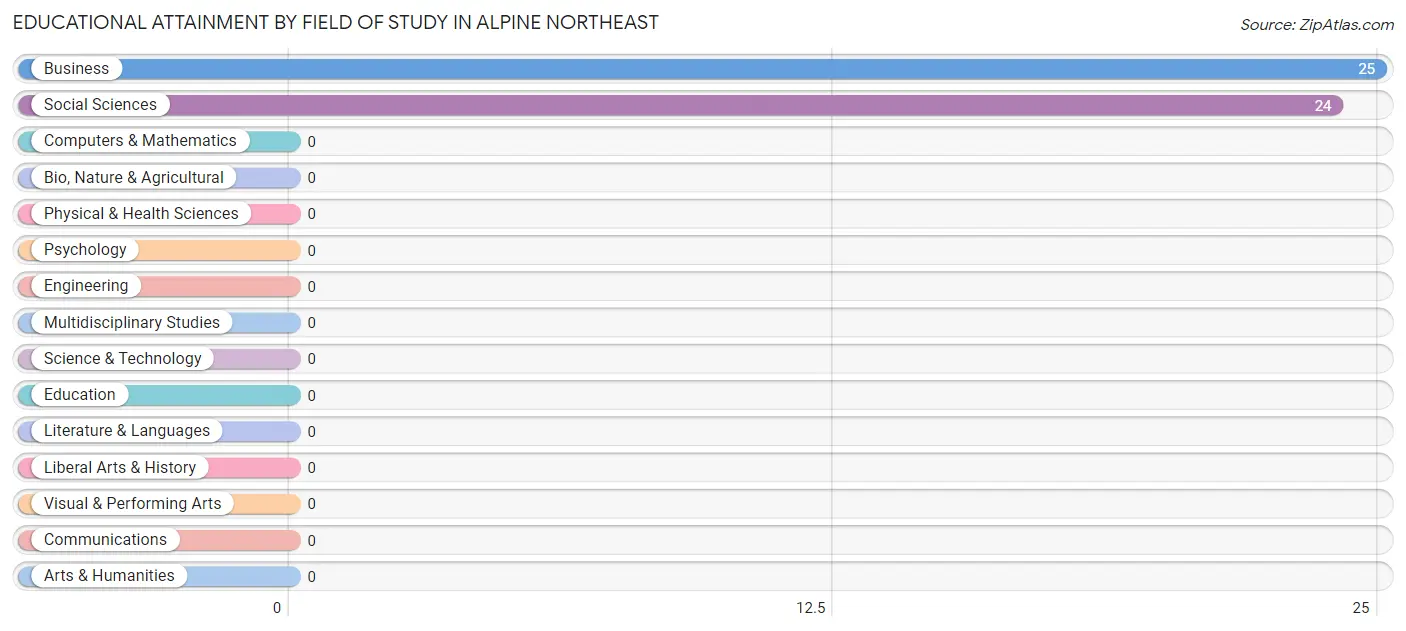
Educational Attainment by Field of Study in Alpine Northeast
Business (25 | 51.0%), and social sciences (24 | 49.0%) are the most common fields of study among 49 individuals in Alpine Northeast who have obtained a bachelor's degree or higher.
| Field of Study | # Graduates | % Graduates |
| Computers & Mathematics | 0 | 0.0% |
| Bio, Nature & Agricultural | 0 | 0.0% |
| Physical & Health Sciences | 0 | 0.0% |
| Psychology | 0 | 0.0% |
| Social Sciences | 24 | 49.0% |
| Engineering | 0 | 0.0% |
| Multidisciplinary Studies | 0 | 0.0% |
| Science & Technology | 0 | 0.0% |
| Business | 25 | 51.0% |
| Education | 0 | 0.0% |
| Literature & Languages | 0 | 0.0% |
| Liberal Arts & History | 0 | 0.0% |
| Visual & Performing Arts | 0 | 0.0% |
| Communications | 0 | 0.0% |
| Arts & Humanities | 0 | 0.0% |
| Total | 49 | 100.0% |
Transportation & Commute in Alpine Northeast
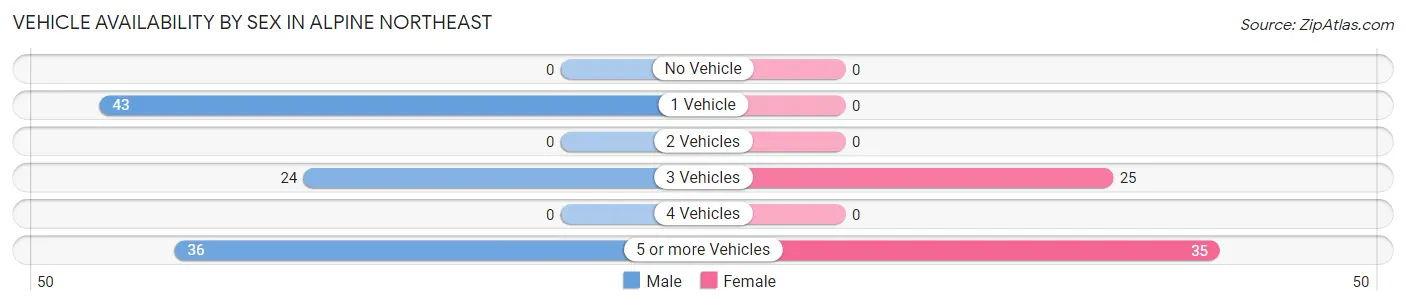
Vehicle Availability by Sex in Alpine Northeast
The most prevalent vehicle ownership categories in Alpine Northeast are males with 1 vehicle (43, accounting for 41.7%) and females with 1 vehicle (0, making up 71.7%).
| Vehicles Available | Male | Female |
| No Vehicle | 0 (0.0%) | 0 (0.0%) |
| 1 Vehicle | 43 (41.7%) | 0 (0.0%) |
| 2 Vehicles | 0 (0.0%) | 0 (0.0%) |
| 3 Vehicles | 24 (23.3%) | 25 (41.7%) |
| 4 Vehicles | 0 (0.0%) | 0 (0.0%) |
| 5 or more Vehicles | 36 (34.9%) | 35 (58.3%) |
| Total | 103 (100.0%) | 60 (100.0%) |
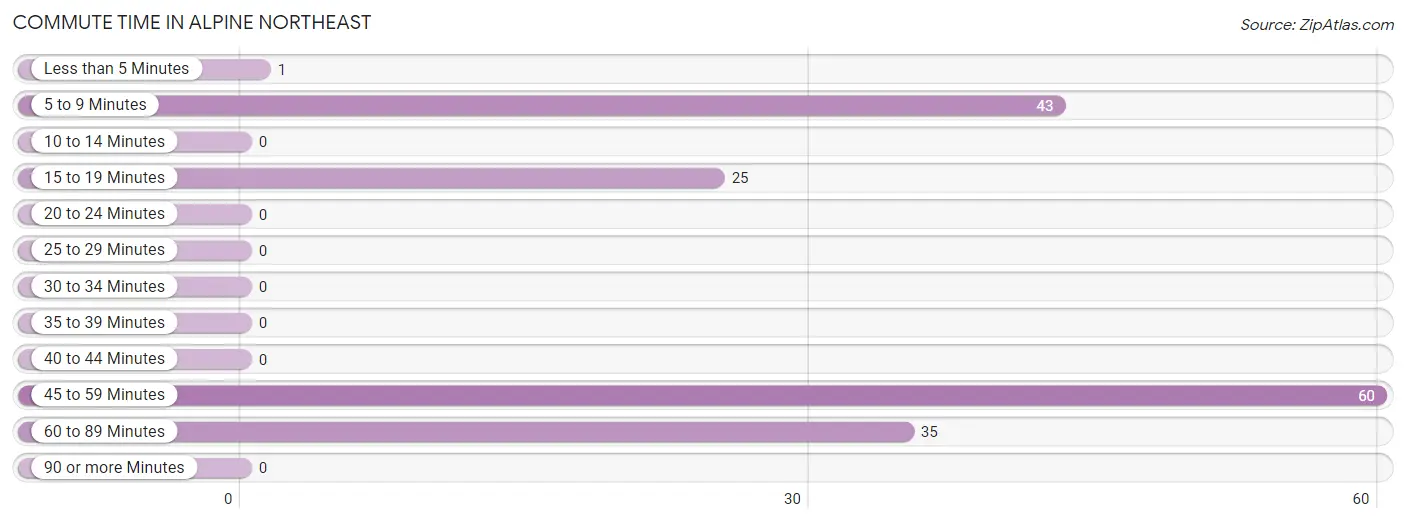
Commute Time in Alpine Northeast
The most frequently occuring commute durations in Alpine Northeast are 45 to 59 minutes (60 commuters, 36.6%), 5 to 9 minutes (43 commuters, 26.2%), and 60 to 89 minutes (35 commuters, 21.3%).
| Commute Time | # Commuters | % Commuters |
| Less than 5 Minutes | 1 | 0.6% |
| 5 to 9 Minutes | 43 | 26.2% |
| 10 to 14 Minutes | 0 | 0.0% |
| 15 to 19 Minutes | 25 | 15.2% |
| 20 to 24 Minutes | 0 | 0.0% |
| 25 to 29 Minutes | 0 | 0.0% |
| 30 to 34 Minutes | 0 | 0.0% |
| 35 to 39 Minutes | 0 | 0.0% |
| 40 to 44 Minutes | 0 | 0.0% |
| 45 to 59 Minutes | 60 | 36.6% |
| 60 to 89 Minutes | 35 | 21.3% |
| 90 or more Minutes | 0 | 0.0% |
Commute Time by Sex in Alpine Northeast
The most common commute times in Alpine Northeast are 45 to 59 minutes (60 commuters, 57.7%) for males and 60 to 89 minutes (35 commuters, 58.3%) for females.
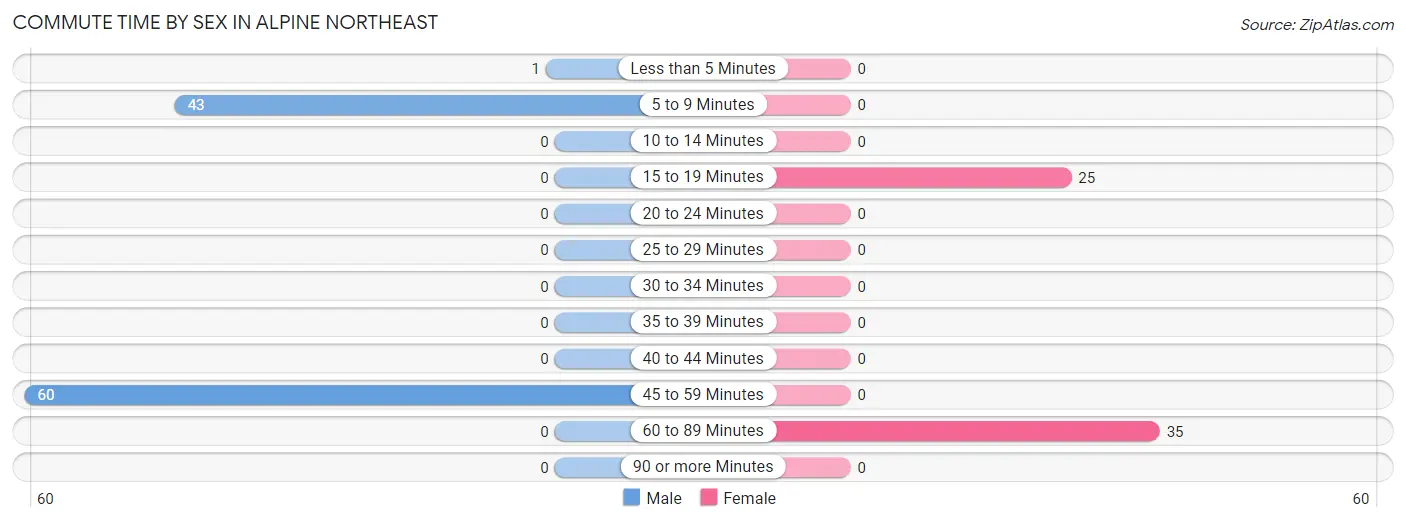
| Commute Time | Male | Female |
| Less than 5 Minutes | 1 (1.0%) | 0 (0.0%) |
| 5 to 9 Minutes | 43 (41.3%) | 0 (0.0%) |
| 10 to 14 Minutes | 0 (0.0%) | 0 (0.0%) |
| 15 to 19 Minutes | 0 (0.0%) | 25 (41.7%) |
| 20 to 24 Minutes | 0 (0.0%) | 0 (0.0%) |
| 25 to 29 Minutes | 0 (0.0%) | 0 (0.0%) |
| 30 to 34 Minutes | 0 (0.0%) | 0 (0.0%) |
| 35 to 39 Minutes | 0 (0.0%) | 0 (0.0%) |
| 40 to 44 Minutes | 0 (0.0%) | 0 (0.0%) |
| 45 to 59 Minutes | 60 (57.7%) | 0 (0.0%) |
| 60 to 89 Minutes | 0 (0.0%) | 35 (58.3%) |
| 90 or more Minutes | 0 (0.0%) | 0 (0.0%) |
Time of Departure to Work by Sex in Alpine Northeast
The most frequent times of departure to work in Alpine Northeast are 8:30 AM to 8:59 AM (43, 41.3%) for males and 8:00 AM to 8:29 AM (35, 58.3%) for females.
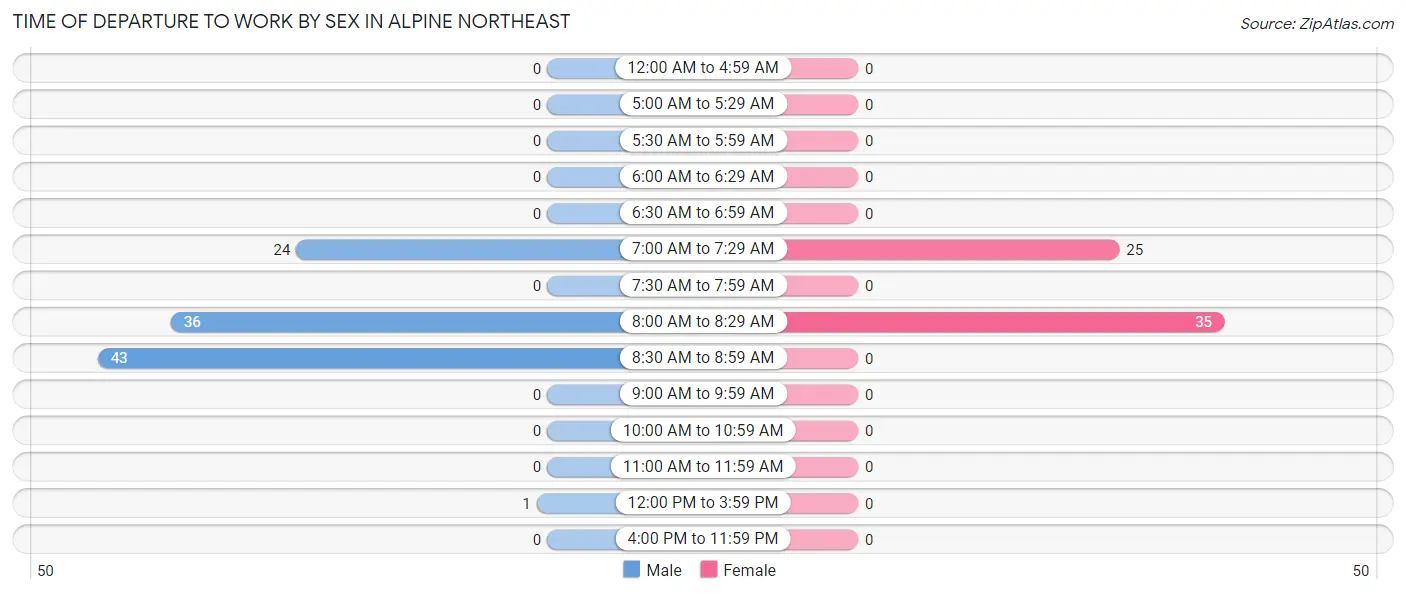
| Time of Departure | Male | Female |
| 12:00 AM to 4:59 AM | 0 (0.0%) | 0 (0.0%) |
| 5:00 AM to 5:29 AM | 0 (0.0%) | 0 (0.0%) |
| 5:30 AM to 5:59 AM | 0 (0.0%) | 0 (0.0%) |
| 6:00 AM to 6:29 AM | 0 (0.0%) | 0 (0.0%) |
| 6:30 AM to 6:59 AM | 0 (0.0%) | 0 (0.0%) |
| 7:00 AM to 7:29 AM | 24 (23.1%) | 25 (41.7%) |
| 7:30 AM to 7:59 AM | 0 (0.0%) | 0 (0.0%) |
| 8:00 AM to 8:29 AM | 36 (34.6%) | 35 (58.3%) |
| 8:30 AM to 8:59 AM | 43 (41.3%) | 0 (0.0%) |
| 9:00 AM to 9:59 AM | 0 (0.0%) | 0 (0.0%) |
| 10:00 AM to 10:59 AM | 0 (0.0%) | 0 (0.0%) |
| 11:00 AM to 11:59 AM | 0 (0.0%) | 0 (0.0%) |
| 12:00 PM to 3:59 PM | 1 (1.0%) | 0 (0.0%) |
| 4:00 PM to 11:59 PM | 0 (0.0%) | 0 (0.0%) |
| Total | 104 (100.0%) | 60 (100.0%) |
Housing Occupancy in Alpine Northeast
Occupancy by Ownership in Alpine Northeast
Of the total 138 dwellings in Alpine Northeast, owner-occupied units account for 138 (100.0%), while renter-occupied units make up 0 (0.0%).
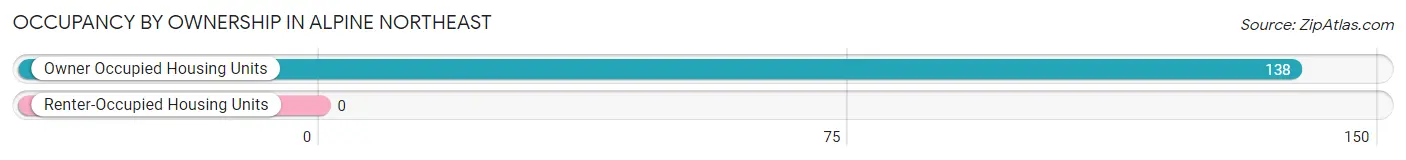
| Occupancy | # Housing Units | % Housing Units |
| Owner Occupied Housing Units | 138 | 100.0% |
| Renter-Occupied Housing Units | 0 | 0.0% |
| Total Occupied Housing Units | 138 | 100.0% |
Occupancy by Household Size in Alpine Northeast
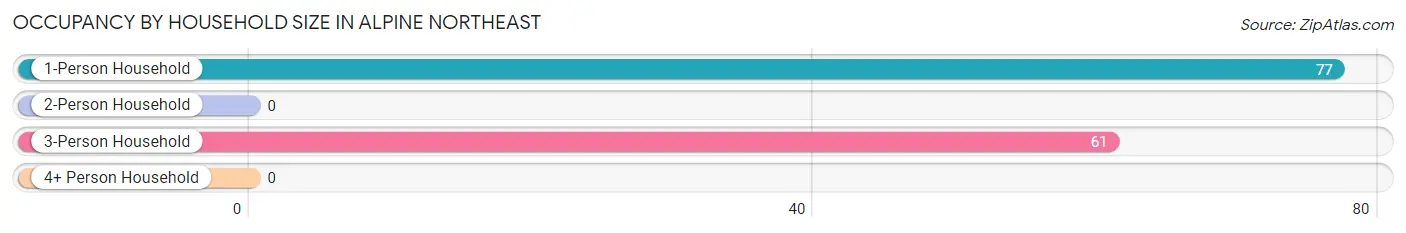
| Household Size | # Housing Units | % Housing Units |
| 1-Person Household | 77 | 55.8% |
| 2-Person Household | 0 | 0.0% |
| 3-Person Household | 61 | 44.2% |
| 4+ Person Household | 0 | 0.0% |
| Total Housing Units | 138 | 100.0% |
Occupancy by Ownership by Household Size in Alpine Northeast
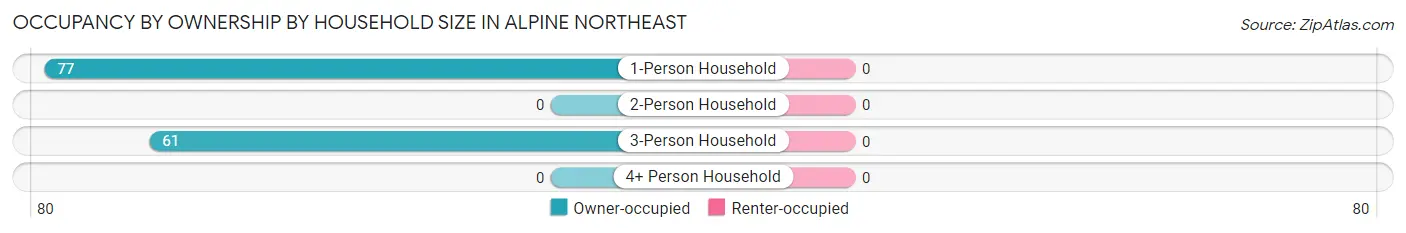
| Household Size | Owner-occupied | Renter-occupied |
| 1-Person Household | 77 (100.0%) | 0 (0.0%) |
| 2-Person Household | 0 (0.0%) | 0 (0.0%) |
| 3-Person Household | 61 (100.0%) | 0 (0.0%) |
| 4+ Person Household | 0 (0.0%) | 0 (0.0%) |
| Total Housing Units | 138 (100.0%) | 0 (0.0%) |
Occupancy by Educational Attainment in Alpine Northeast
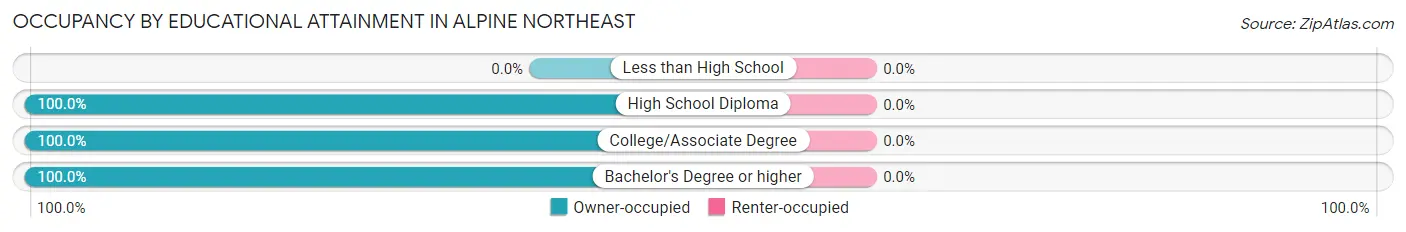
| Household Size | Owner-occupied | Renter-occupied |
| Less than High School | 0 (0.0%) | 0 (0.0%) |
| High School Diploma | 36 (100.0%) | 0 (0.0%) |
| College/Associate Degree | 77 (100.0%) | 0 (0.0%) |
| Bachelor's Degree or higher | 25 (100.0%) | 0 (0.0%) |
Occupancy by Age of Householder in Alpine Northeast
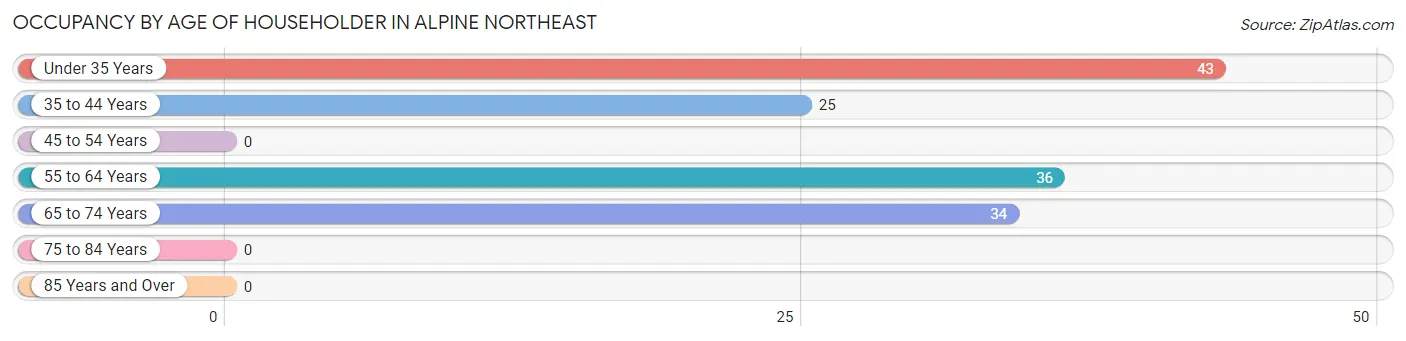
| Age Bracket | # Households | % Households |
| Under 35 Years | 43 | 31.2% |
| 35 to 44 Years | 25 | 18.1% |
| 45 to 54 Years | 0 | 0.0% |
| 55 to 64 Years | 36 | 26.1% |
| 65 to 74 Years | 34 | 24.6% |
| 75 to 84 Years | 0 | 0.0% |
| 85 Years and Over | 0 | 0.0% |
| Total | 138 | 100.0% |
Housing Finances in Alpine Northeast
Median Income by Occupancy in Alpine Northeast
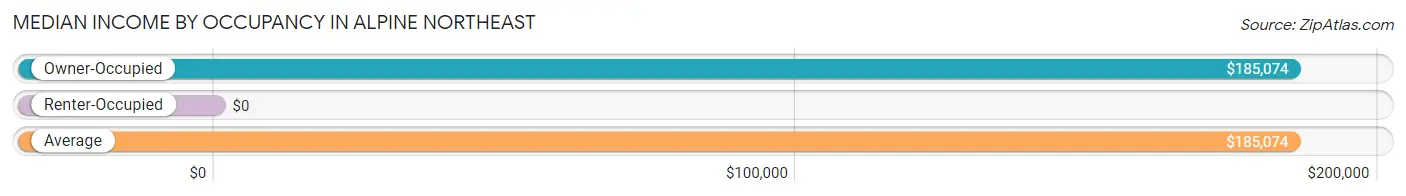
| Occupancy Type | # Households | Median Income |
| Owner-Occupied | 138 (100.0%) | $185,074 |
| Renter-Occupied | 0 (0.0%) | $0 |
| Average | 138 (100.0%) | $185,074 |
Occupancy by Householder Income Bracket in Alpine Northeast
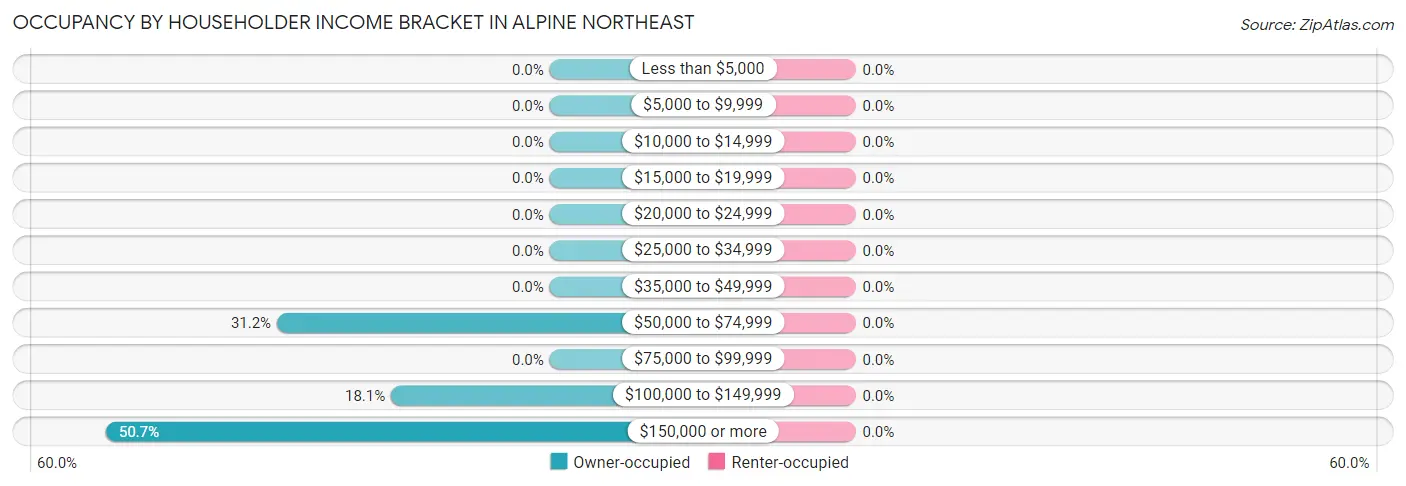
| Income Bracket | Owner-occupied | Renter-occupied |
| Less than $5,000 | 0 (0.0%) | 0 (0.0%) |
| $5,000 to $9,999 | 0 (0.0%) | 0 (0.0%) |
| $10,000 to $14,999 | 0 (0.0%) | 0 (0.0%) |
| $15,000 to $19,999 | 0 (0.0%) | 0 (0.0%) |
| $20,000 to $24,999 | 0 (0.0%) | 0 (0.0%) |
| $25,000 to $34,999 | 0 (0.0%) | 0 (0.0%) |
| $35,000 to $49,999 | 0 (0.0%) | 0 (0.0%) |
| $50,000 to $74,999 | 43 (31.2%) | 0 (0.0%) |
| $75,000 to $99,999 | 0 (0.0%) | 0 (0.0%) |
| $100,000 to $149,999 | 25 (18.1%) | 0 (0.0%) |
| $150,000 or more | 70 (50.7%) | 0 (0.0%) |
| Total | 138 (100.0%) | 0 (0.0%) |
Monthly Housing Cost Tiers in Alpine Northeast
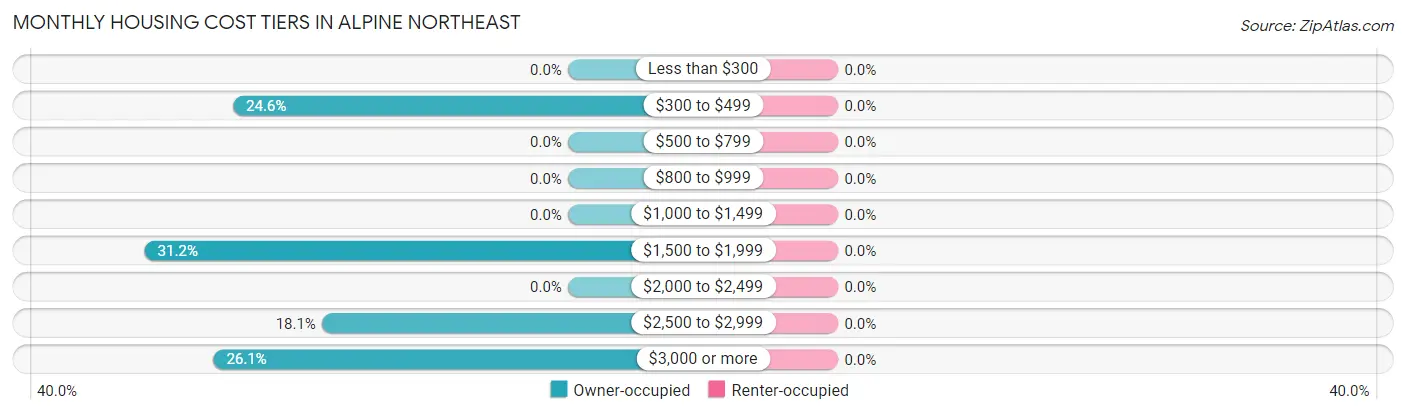
| Monthly Cost | Owner-occupied | Renter-occupied |
| Less than $300 | 0 (0.0%) | 0 (0.0%) |
| $300 to $499 | 34 (24.6%) | 0 (0.0%) |
| $500 to $799 | 0 (0.0%) | 0 (0.0%) |
| $800 to $999 | 0 (0.0%) | 0 (0.0%) |
| $1,000 to $1,499 | 0 (0.0%) | 0 (0.0%) |
| $1,500 to $1,999 | 43 (31.2%) | 0 (0.0%) |
| $2,000 to $2,499 | 0 (0.0%) | 0 (0.0%) |
| $2,500 to $2,999 | 25 (18.1%) | 0 (0.0%) |
| $3,000 or more | 36 (26.1%) | 0 (0.0%) |
| Total | 138 (100.0%) | 0 (0.0%) |
Physical Housing Characteristics in Alpine Northeast
Housing Structures in Alpine Northeast
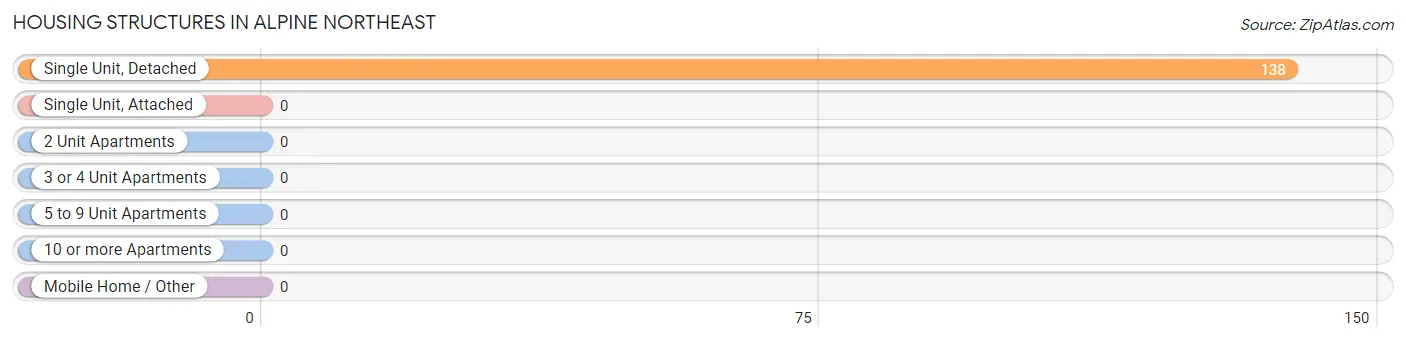
| Structure Type | # Housing Units | % Housing Units |
| Single Unit, Detached | 138 | 100.0% |
| Single Unit, Attached | 0 | 0.0% |
| 2 Unit Apartments | 0 | 0.0% |
| 3 or 4 Unit Apartments | 0 | 0.0% |
| 5 to 9 Unit Apartments | 0 | 0.0% |
| 10 or more Apartments | 0 | 0.0% |
| Mobile Home / Other | 0 | 0.0% |
| Total | 138 | 100.0% |
Housing Structures by Occupancy in Alpine Northeast
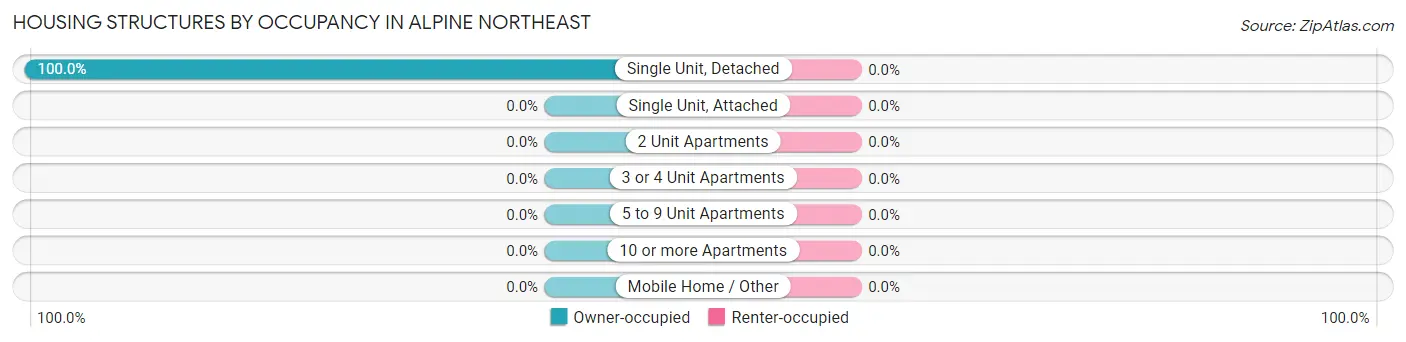
| Structure Type | Owner-occupied | Renter-occupied |
| Single Unit, Detached | 138 (100.0%) | 0 (0.0%) |
| Single Unit, Attached | 0 (0.0%) | 0 (0.0%) |
| 2 Unit Apartments | 0 (0.0%) | 0 (0.0%) |
| 3 or 4 Unit Apartments | 0 (0.0%) | 0 (0.0%) |
| 5 to 9 Unit Apartments | 0 (0.0%) | 0 (0.0%) |
| 10 or more Apartments | 0 (0.0%) | 0 (0.0%) |
| Mobile Home / Other | 0 (0.0%) | 0 (0.0%) |
| Total | 138 (100.0%) | 0 (0.0%) |
Housing Structures by Number of Rooms in Alpine Northeast
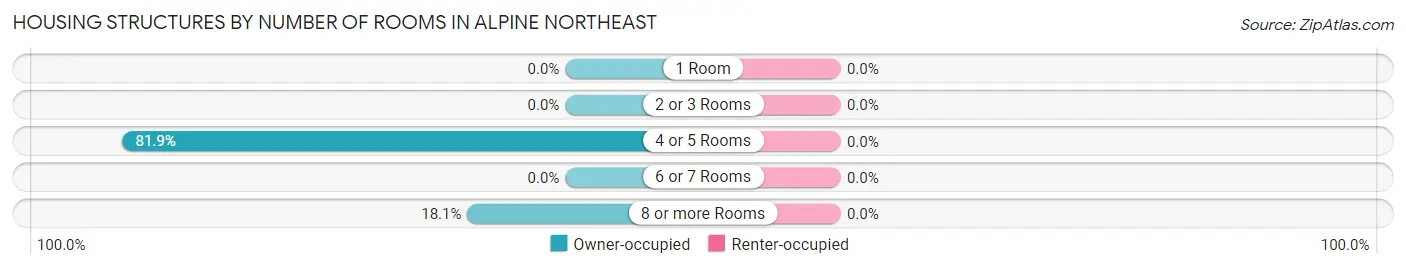
| Number of Rooms | Owner-occupied | Renter-occupied |
| 1 Room | 0 (0.0%) | 0 (0.0%) |
| 2 or 3 Rooms | 0 (0.0%) | 0 (0.0%) |
| 4 or 5 Rooms | 113 (81.9%) | 0 (0.0%) |
| 6 or 7 Rooms | 0 (0.0%) | 0 (0.0%) |
| 8 or more Rooms | 25 (18.1%) | 0 (0.0%) |
| Total | 138 (100.0%) | 0 (0.0%) |
Housing Structure by Heating Type in Alpine Northeast
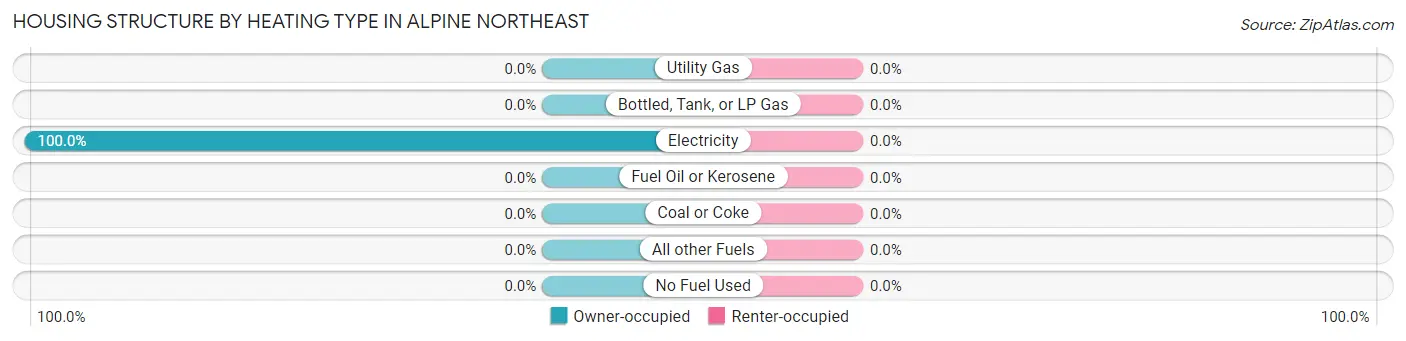
| Heating Type | Owner-occupied | Renter-occupied |
| Utility Gas | 0 (0.0%) | 0 (0.0%) |
| Bottled, Tank, or LP Gas | 0 (0.0%) | 0 (0.0%) |
| Electricity | 138 (100.0%) | 0 (0.0%) |
| Fuel Oil or Kerosene | 0 (0.0%) | 0 (0.0%) |
| Coal or Coke | 0 (0.0%) | 0 (0.0%) |
| All other Fuels | 0 (0.0%) | 0 (0.0%) |
| No Fuel Used | 0 (0.0%) | 0 (0.0%) |
| Total | 138 (100.0%) | 0 (0.0%) |
Household Vehicle Usage in Alpine Northeast
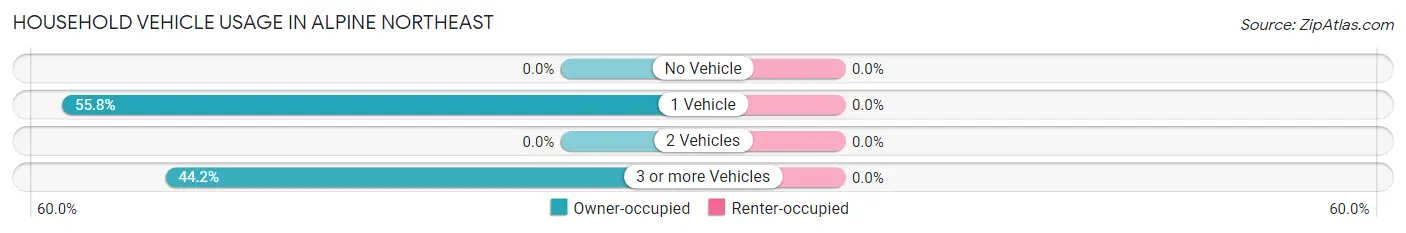
| Vehicles per Household | Owner-occupied | Renter-occupied |
| No Vehicle | 0 (0.0%) | 0 (0.0%) |
| 1 Vehicle | 77 (55.8%) | 0 (0.0%) |
| 2 Vehicles | 0 (0.0%) | 0 (0.0%) |
| 3 or more Vehicles | 61 (44.2%) | 0 (0.0%) |
| Total | 138 (100.0%) | 0 (0.0%) |
Real Estate & Mortgages in Alpine Northeast
Real Estate and Mortgage Overview in Alpine Northeast
| Characteristic | Without Mortgage | With Mortgage |
| Housing Units | 34 | 104 |
| Median Property Value | - | - |
| Median Household Income | - | - |
| Monthly Housing Costs | - | - |
| Real Estate Taxes | - | - |
Property Value by Mortgage Status in Alpine Northeast
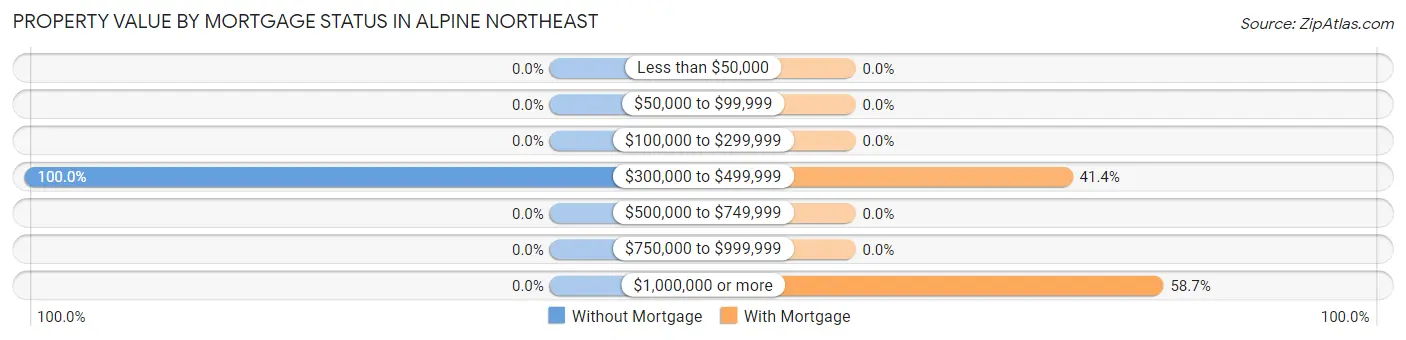
| Property Value | Without Mortgage | With Mortgage |
| Less than $50,000 | 0 (0.0%) | 0 (0.0%) |
| $50,000 to $99,999 | 0 (0.0%) | 0 (0.0%) |
| $100,000 to $299,999 | 0 (0.0%) | 0 (0.0%) |
| $300,000 to $499,999 | 34 (100.0%) | 43 (41.3%) |
| $500,000 to $749,999 | 0 (0.0%) | 0 (0.0%) |
| $750,000 to $999,999 | 0 (0.0%) | 0 (0.0%) |
| $1,000,000 or more | 0 (0.0%) | 61 (58.7%) |
| Total | 34 (100.0%) | 104 (100.0%) |
Household Income by Mortgage Status in Alpine Northeast
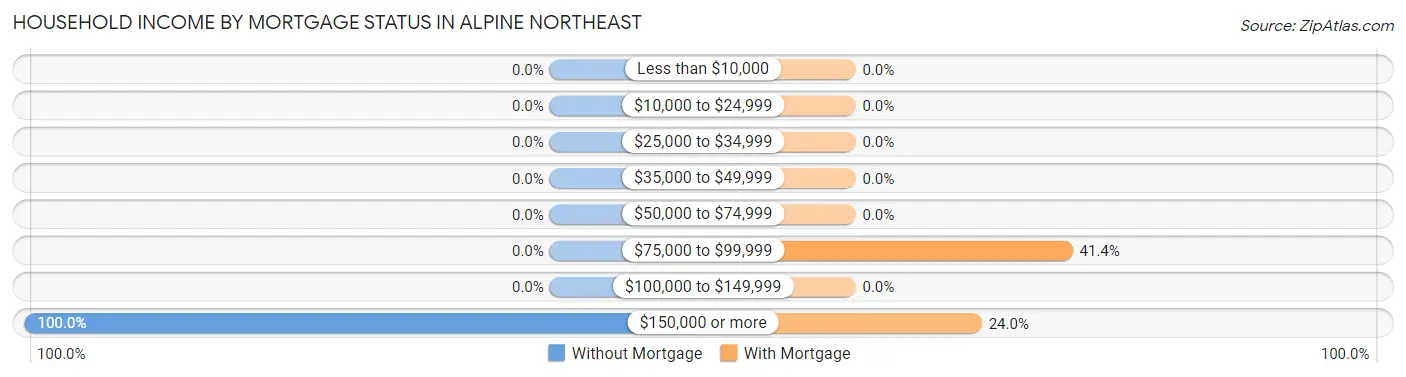
| Household Income | Without Mortgage | With Mortgage |
| Less than $10,000 | 0 (0.0%) | 0 (0.0%) |
| $10,000 to $24,999 | 0 (0.0%) | 0 (0.0%) |
| $25,000 to $34,999 | 0 (0.0%) | 0 (0.0%) |
| $35,000 to $49,999 | 0 (0.0%) | 0 (0.0%) |
| $50,000 to $74,999 | 0 (0.0%) | 0 (0.0%) |
| $75,000 to $99,999 | 0 (0.0%) | 43 (41.3%) |
| $100,000 to $149,999 | 0 (0.0%) | 0 (0.0%) |
| $150,000 or more | 34 (100.0%) | 25 (24.0%) |
| Total | 34 (100.0%) | 104 (100.0%) |
Property Value to Household Income Ratio in Alpine Northeast
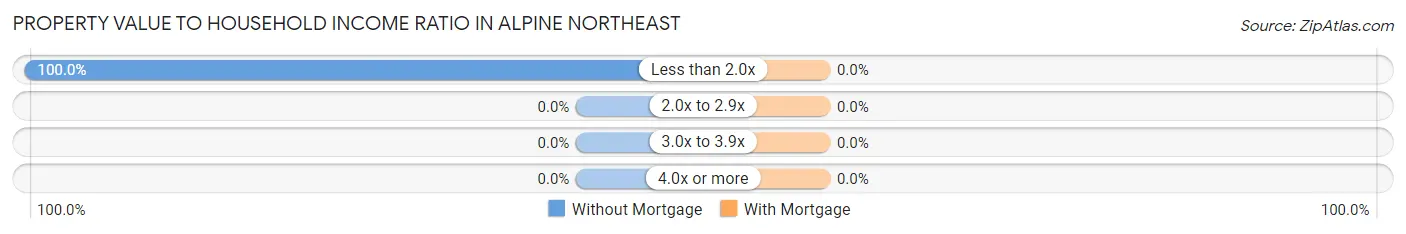
| Value-to-Income Ratio | Without Mortgage | With Mortgage |
| Less than 2.0x | 34 (100.0%) | 0 (0.0%) |
| 2.0x to 2.9x | 0 (0.0%) | 0 (0.0%) |
| 3.0x to 3.9x | 0 (0.0%) | 0 (0.0%) |
| 4.0x or more | 0 (0.0%) | 0 (0.0%) |
| Total | 34 (100.0%) | 104 (100.0%) |
Real Estate Taxes by Mortgage Status in Alpine Northeast
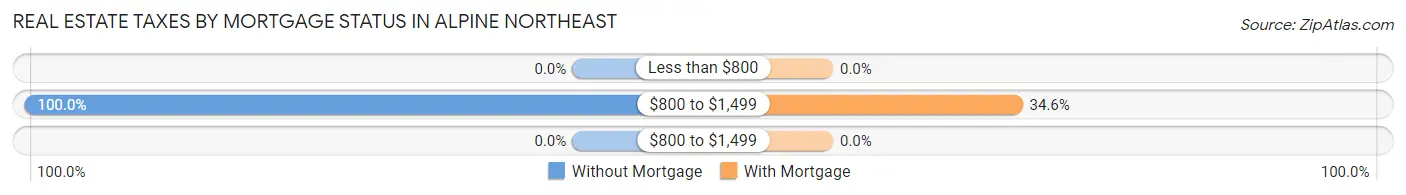
| Property Taxes | Without Mortgage | With Mortgage |
| Less than $800 | 0 (0.0%) | 0 (0.0%) |
| $800 to $1,499 | 34 (100.0%) | 36 (34.6%) |
| $800 to $1,499 | 0 (0.0%) | 0 (0.0%) |
| Total | 34 (100.0%) | 104 (100.0%) |
Health & Disability in Alpine Northeast
Health Insurance Coverage by Age in Alpine Northeast
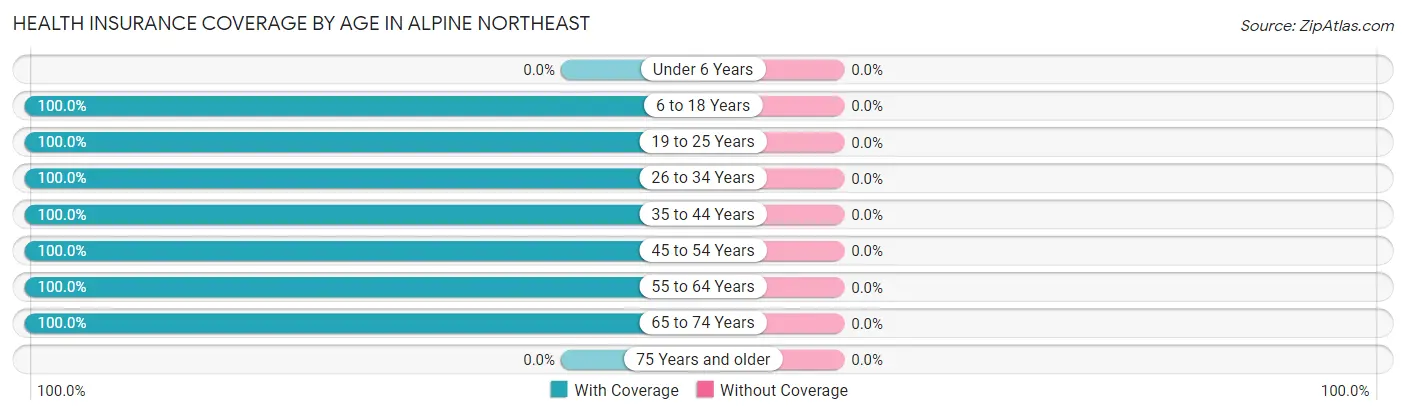
| Age Bracket | With Coverage | Without Coverage |
| Under 6 Years | 0 (0.0%) | 0 (0.0%) |
| 6 to 18 Years | 25 (100.0%) | 0 (0.0%) |
| 19 to 25 Years | 81 (100.0%) | 0 (0.0%) |
| 26 to 34 Years | 43 (100.0%) | 0 (0.0%) |
| 35 to 44 Years | 25 (100.0%) | 0 (0.0%) |
| 45 to 54 Years | 24 (100.0%) | 0 (0.0%) |
| 55 to 64 Years | 71 (100.0%) | 0 (0.0%) |
| 65 to 74 Years | 34 (100.0%) | 0 (0.0%) |
| 75 Years and older | 0 (0.0%) | 0 (0.0%) |
| Total | 303 (100.0%) | 0 (0.0%) |
Health Insurance Coverage by Citizenship Status in Alpine Northeast
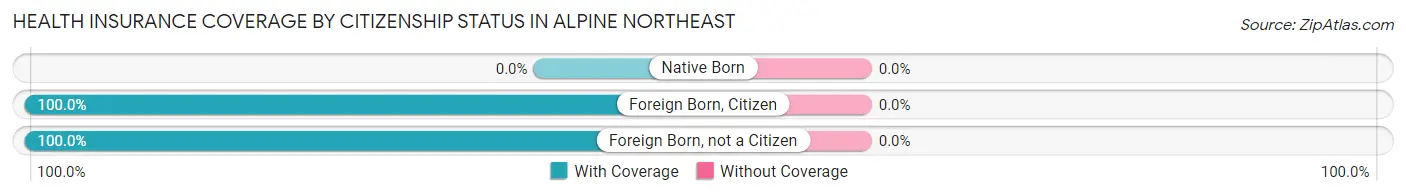
| Citizenship Status | With Coverage | Without Coverage |
| Native Born | 0 (0.0%) | 0 (0.0%) |
| Foreign Born, Citizen | 25 (100.0%) | 0 (0.0%) |
| Foreign Born, not a Citizen | 81 (100.0%) | 0 (0.0%) |
Health Insurance Coverage by Household Income in Alpine Northeast
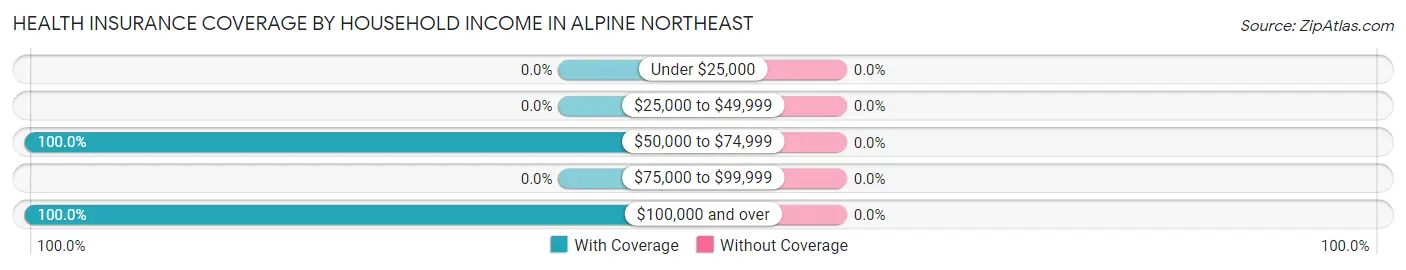
| Household Income | With Coverage | Without Coverage |
| Under $25,000 | 0 (0.0%) | 0 (0.0%) |
| $25,000 to $49,999 | 0 (0.0%) | 0 (0.0%) |
| $50,000 to $74,999 | 43 (100.0%) | 0 (0.0%) |
| $75,000 to $99,999 | 0 (0.0%) | 0 (0.0%) |
| $100,000 and over | 259 (100.0%) | 0 (0.0%) |
Public vs Private Health Insurance Coverage by Age in Alpine Northeast
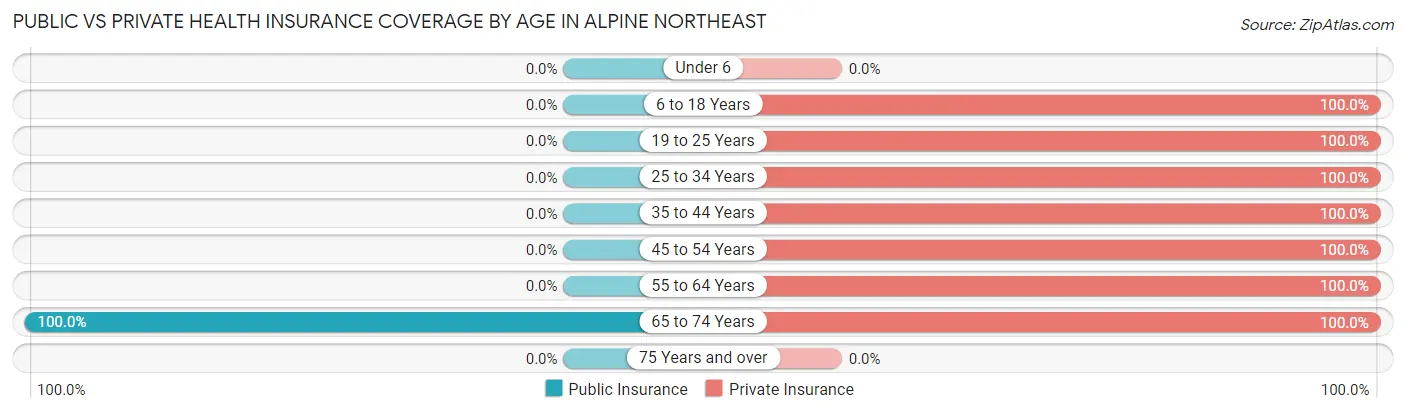
| Age Bracket | Public Insurance | Private Insurance |
| Under 6 | 0 (0.0%) | 0 (0.0%) |
| 6 to 18 Years | 0 (0.0%) | 25 (100.0%) |
| 19 to 25 Years | 0 (0.0%) | 81 (100.0%) |
| 25 to 34 Years | 0 (0.0%) | 43 (100.0%) |
| 35 to 44 Years | 0 (0.0%) | 25 (100.0%) |
| 45 to 54 Years | 0 (0.0%) | 24 (100.0%) |
| 55 to 64 Years | 0 (0.0%) | 71 (100.0%) |
| 65 to 74 Years | 34 (100.0%) | 34 (100.0%) |
| 75 Years and over | 0 (0.0%) | 0 (0.0%) |
| Total | 34 (11.2%) | 303 (100.0%) |
Disability Status by Sex by Age in Alpine Northeast
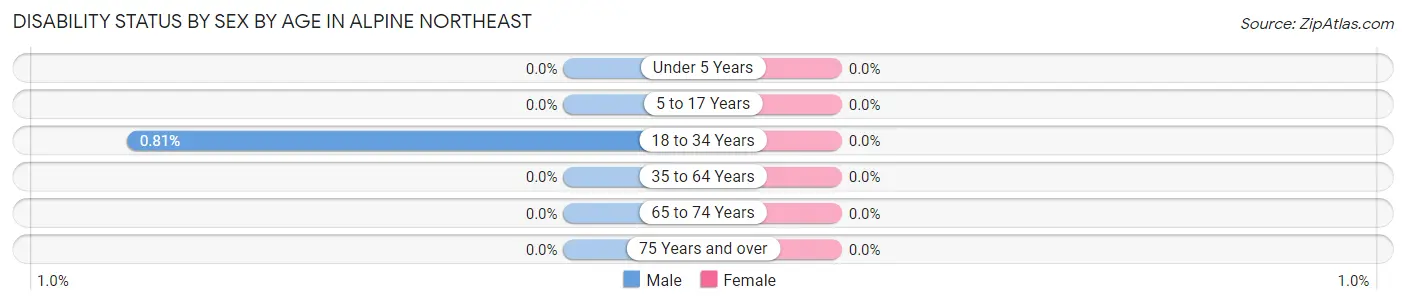
| Age Bracket | Male | Female |
| Under 5 Years | 0 (0.0%) | 0 (0.0%) |
| 5 to 17 Years | 0 (0.0%) | 0 (0.0%) |
| 18 to 34 Years | 1 (0.8%) | 0 (0.0%) |
| 35 to 64 Years | 0 (0.0%) | 0 (0.0%) |
| 65 to 74 Years | 0 (0.0%) | 0 (0.0%) |
| 75 Years and over | 0 (0.0%) | 0 (0.0%) |
Disability Class by Sex by Age in Alpine Northeast
Disability Class: Hearing Difficulty
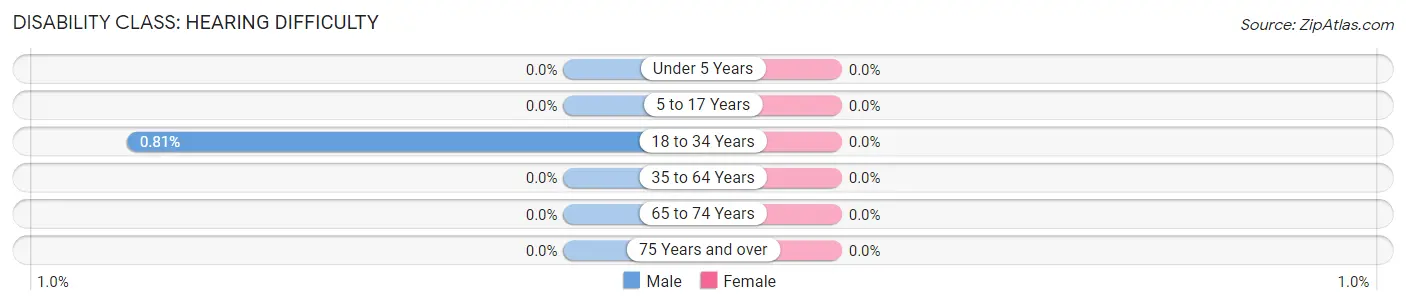
| Age Bracket | Male | Female |
| Under 5 Years | 0 (0.0%) | 0 (0.0%) |
| 5 to 17 Years | 0 (0.0%) | 0 (0.0%) |
| 18 to 34 Years | 1 (0.8%) | 0 (0.0%) |
| 35 to 64 Years | 0 (0.0%) | 0 (0.0%) |
| 65 to 74 Years | 0 (0.0%) | 0 (0.0%) |
| 75 Years and over | 0 (0.0%) | 0 (0.0%) |
Disability Class: Vision Difficulty
| Age Bracket | Male | Female |
| Under 5 Years | 0 (0.0%) | 0 (0.0%) |
| 5 to 17 Years | 0 (0.0%) | 0 (0.0%) |
| 18 to 34 Years | 0 (0.0%) | 0 (0.0%) |
| 35 to 64 Years | 0 (0.0%) | 0 (0.0%) |
| 65 to 74 Years | 0 (0.0%) | 0 (0.0%) |
| 75 Years and over | 0 (0.0%) | 0 (0.0%) |
Disability Class: Cognitive Difficulty
| Age Bracket | Male | Female |
| 5 to 17 Years | 0 (0.0%) | 0 (0.0%) |
| 18 to 34 Years | 0 (0.0%) | 0 (0.0%) |
| 35 to 64 Years | 0 (0.0%) | 0 (0.0%) |
| 65 to 74 Years | 0 (0.0%) | 0 (0.0%) |
| 75 Years and over | 0 (0.0%) | 0 (0.0%) |
Disability Class: Ambulatory Difficulty
| Age Bracket | Male | Female |
| 5 to 17 Years | 0 (0.0%) | 0 (0.0%) |
| 18 to 34 Years | 0 (0.0%) | 0 (0.0%) |
| 35 to 64 Years | 0 (0.0%) | 0 (0.0%) |
| 65 to 74 Years | 0 (0.0%) | 0 (0.0%) |
| 75 Years and over | 0 (0.0%) | 0 (0.0%) |
Disability Class: Self-Care Difficulty
| Age Bracket | Male | Female |
| 5 to 17 Years | 0 (0.0%) | 0 (0.0%) |
| 18 to 34 Years | 0 (0.0%) | 0 (0.0%) |
| 35 to 64 Years | 0 (0.0%) | 0 (0.0%) |
| 65 to 74 Years | 0 (0.0%) | 0 (0.0%) |
| 75 Years and over | 0 (0.0%) | 0 (0.0%) |
Technology Access in Alpine Northeast
Computing Device Access in Alpine Northeast
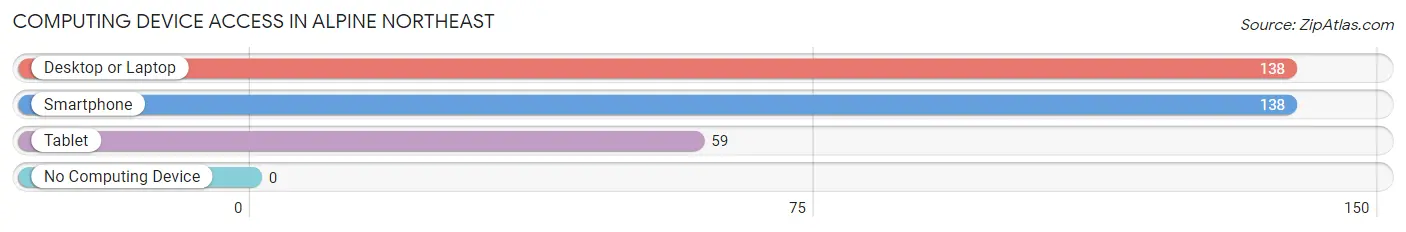
| Device Type | # Households | % Households |
| Desktop or Laptop | 138 | 100.0% |
| Smartphone | 138 | 100.0% |
| Tablet | 59 | 42.7% |
| No Computing Device | 0 | 0.0% |
| Total | 138 | 100.0% |
Internet Access in Alpine Northeast
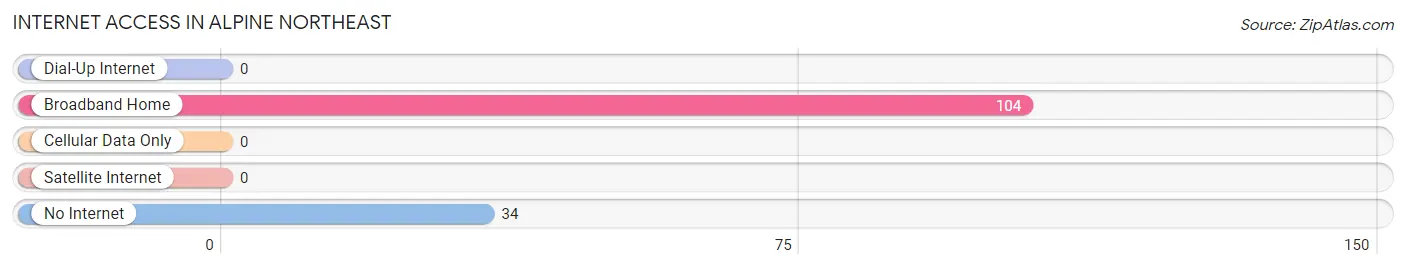
| Internet Type | # Households | % Households |
| Dial-Up Internet | 0 | 0.0% |
| Broadband Home | 104 | 75.4% |
| Cellular Data Only | 0 | 0.0% |
| Satellite Internet | 0 | 0.0% |
| No Internet | 34 | 24.6% |
| Total | 138 | 100.0% |
Alpine Northeast Summary
Alpine Northeast is a small town located in the northeast corner of Wyoming, near the border of Montana and South Dakota. It is a rural community with a population of just over 500 people. The town is situated in the foothills of the Big Horn Mountains and is surrounded by rolling hills and grasslands. The town is known for its scenic beauty and outdoor recreation opportunities.
History
Alpine Northeast was founded in 1882 by a group of homesteaders who were looking for a place to settle and start a new life. The town was originally called “Alpine” after the nearby mountain range. The name was changed to “Alpine Northeast” in the early 1900s to distinguish it from other towns in the area.
The town grew slowly over the years, but it was not until the 1950s that it began to experience significant growth. This was due to the discovery of oil and gas in the area, which led to an influx of new residents and businesses. The town also benefited from the construction of the nearby Interstate 90, which made it easier for people to travel to and from the area.
Geography
Alpine Northeast is located in the northeast corner of Wyoming, near the border of Montana and South Dakota. It is situated in the foothills of the Big Horn Mountains and is surrounded by rolling hills and grasslands. The town is located at an elevation of 4,500 feet and has a total area of 1.2 square miles.
The climate in Alpine Northeast is semi-arid, with hot summers and cold winters. The average annual temperature is around 50 degrees Fahrenheit, with temperatures ranging from the low 20s in the winter to the high 80s in the summer. The town receives an average of 16 inches of precipitation per year, with most of it falling in the form of snow.
Economy
The economy of Alpine Northeast is largely based on agriculture and tourism. The town is home to several farms and ranches, which produce a variety of crops and livestock. Tourism is also an important part of the local economy, as the town is a popular destination for outdoor recreation.
The town also has a few small businesses, including a grocery store, a hardware store, and a few restaurants. There is also a small airport located nearby, which serves as a hub for private and commercial flights.
Demographics
As of the 2010 census, the population of Alpine Northeast was 514 people. The racial makeup of the town was 97.3% White, 0.6% Native American, 0.2% Asian, 0.2% from other races, and 1.7% from two or more races. The median age of the population was 44.7 years, with 24.3% of the population under the age of 18 and 11.3% over the age of 65.
The median household income in Alpine Northeast was $41,250, and the median family income was $45,625. The per capita income was $20,945. The town had a poverty rate of 11.3%, with 17.3% of the population living below the poverty line.
Conclusion
Alpine Northeast is a small town located in the northeast corner of Wyoming, near the border of Montana and South Dakota. It is a rural community with a population of just over 500 people. The town is known for its scenic beauty and outdoor recreation opportunities. The economy of Alpine Northeast is largely based on agriculture and tourism, and the town has a few small businesses. The population of the town is mostly White, with a median age of 44.7 years and a median household income of $41,250.
Common Questions
What is Per Capita Income in Alpine Northeast?
Per Capita income in Alpine Northeast is $68,782.
What is the Median Household income in Alpine Northeast?
Median Household Income in Alpine Northeast is $185,074.
What is Inequality or Gini Index in Alpine Northeast?
Inequality or Gini Index in Alpine Northeast is 0.26.
What is the Total Population of Alpine Northeast?
Total Population of Alpine Northeast is 303.
What is the Total Male Population of Alpine Northeast?
Total Male Population of Alpine Northeast is 218.
What is the Total Female Population of Alpine Northeast?
Total Female Population of Alpine Northeast is 85.
What is the Ratio of Males per 100 Females in Alpine Northeast?
There are 256.47 Males per 100 Females in Alpine Northeast.
What is the Ratio of Females per 100 Males in Alpine Northeast?
There are 38.99 Females per 100 Males in Alpine Northeast.
What is the Median Population Age in Alpine Northeast?
Median Population Age in Alpine Northeast is 44.1 Years.
What is the Average Family Size in Alpine Northeast
Average Family Size in Alpine Northeast is 3.7 People.
What is the Average Household Size in Alpine Northeast
Average Household Size in Alpine Northeast is 2.2 People.
How Large is the Labor Force in Alpine Northeast?
There are 164 People in the Labor Forcein in Alpine Northeast.
What is the Percentage of People in the Labor Force in Alpine Northeast?
54.1% of People are in the Labor Force in Alpine Northeast.