La Barge, WY Map & Demographics
La Barge Map
La Barge Overview
$29,604
PER CAPITA INCOME
$100,250
AVG FAMILY INCOME
$56,458
AVG HOUSEHOLD INCOME
0.40
INEQUALITY / GINI INDEX
259
TOTAL POPULATION
135
MALE POPULATION
124
FEMALE POPULATION
108.87
MALES / 100 FEMALES
91.85
FEMALES / 100 MALES
42.9
MEDIAN AGE
3.1
AVG FAMILY SIZE
2.4
AVG HOUSEHOLD SIZE
143
LABOR FORCE [ PEOPLE ]
66.5%
PERCENT IN LABOR FORCE
22.4%
UNEMPLOYMENT RATE
La Barge Zip Codes
La Barge Area Codes
Income in La Barge
Income Overview in La Barge
Per Capita Income in La Barge is $29,604, while median incomes of families and households are $100,250 and $56,458 respectively.
| Characteristic | Number | Measure |
| Per Capita Income | 259 | $29,604 |
| Median Family Income | 64 | $100,250 |
| Mean Family Income | 64 | $95,873 |
| Median Household Income | 109 | $56,458 |
| Mean Household Income | 109 | $70,974 |
| Income Deficit | 64 | $0 |
| Wage / Income Gap (%) | 259 | 0.00% |
| Wage / Income Gap ($) | 259 | 100.00¢ per $1 |
| Gini / Inequality Index | 259 | 0.40 |
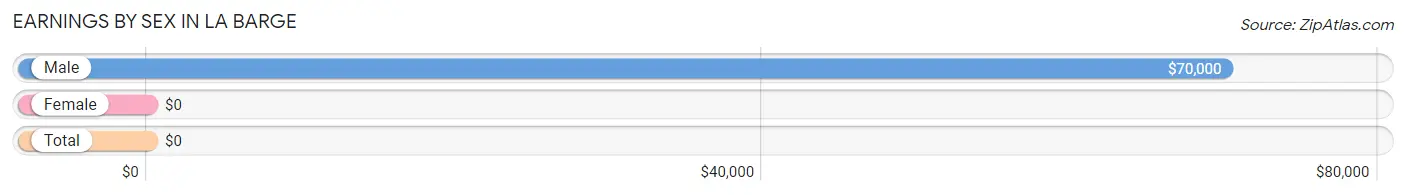
Earnings by Sex in La Barge
| Sex | Number | Average Earnings |
| Male | 82 (54.7%) | $70,000 |
| Female | 68 (45.3%) | $0 |
| Total | 150 (100.0%) | $0 |
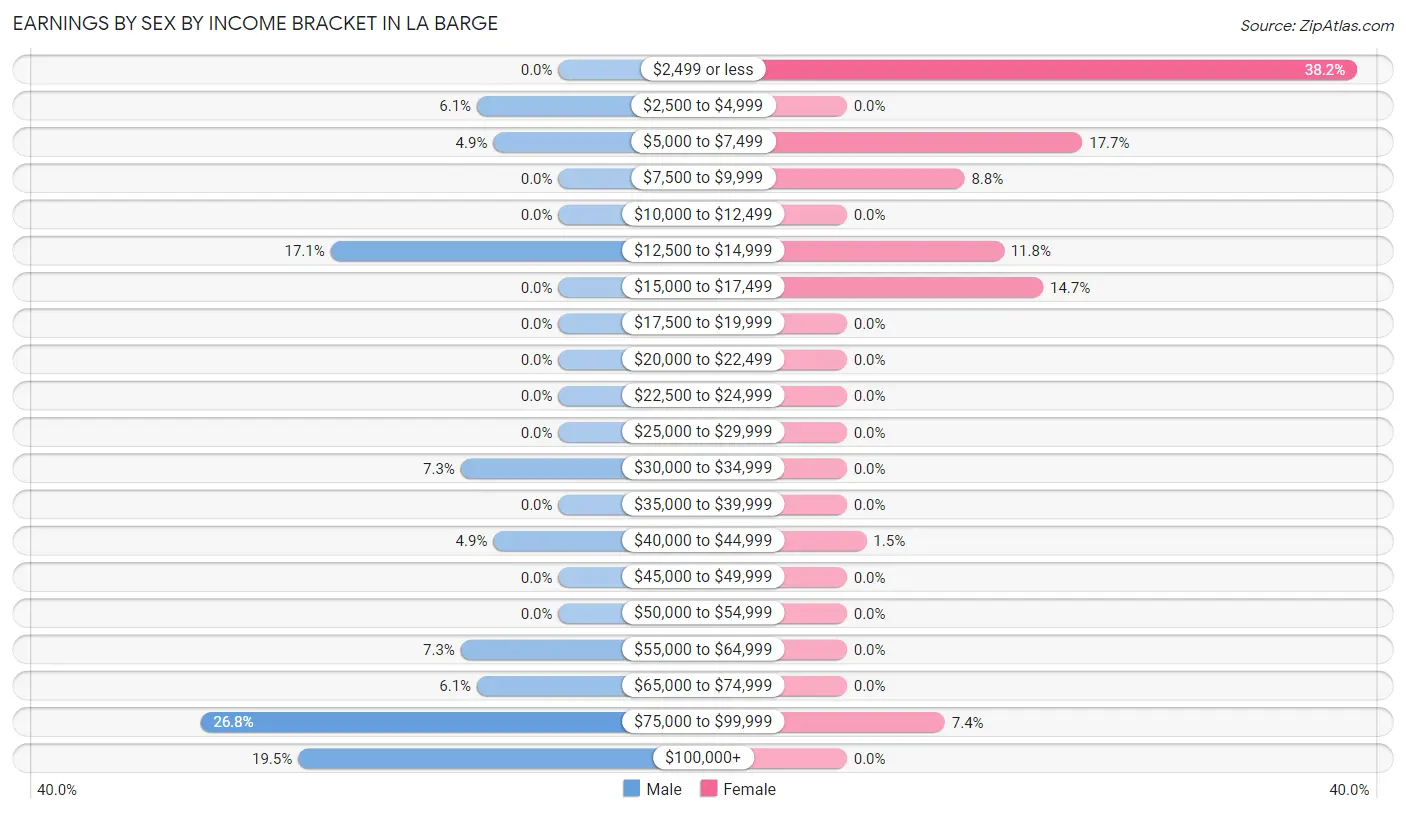
Earnings by Sex by Income Bracket in La Barge
The most common earnings brackets in La Barge are $75,000 to $99,999 for men (22 | 26.8%) and $2,499 or less for women (26 | 38.2%).
| Income | Male | Female |
| $2,499 or less | 0 (0.0%) | 26 (38.2%) |
| $2,500 to $4,999 | 5 (6.1%) | 0 (0.0%) |
| $5,000 to $7,499 | 4 (4.9%) | 12 (17.6%) |
| $7,500 to $9,999 | 0 (0.0%) | 6 (8.8%) |
| $10,000 to $12,499 | 0 (0.0%) | 0 (0.0%) |
| $12,500 to $14,999 | 14 (17.1%) | 8 (11.8%) |
| $15,000 to $17,499 | 0 (0.0%) | 10 (14.7%) |
| $17,500 to $19,999 | 0 (0.0%) | 0 (0.0%) |
| $20,000 to $22,499 | 0 (0.0%) | 0 (0.0%) |
| $22,500 to $24,999 | 0 (0.0%) | 0 (0.0%) |
| $25,000 to $29,999 | 0 (0.0%) | 0 (0.0%) |
| $30,000 to $34,999 | 6 (7.3%) | 0 (0.0%) |
| $35,000 to $39,999 | 0 (0.0%) | 0 (0.0%) |
| $40,000 to $44,999 | 4 (4.9%) | 1 (1.5%) |
| $45,000 to $49,999 | 0 (0.0%) | 0 (0.0%) |
| $50,000 to $54,999 | 0 (0.0%) | 0 (0.0%) |
| $55,000 to $64,999 | 6 (7.3%) | 0 (0.0%) |
| $65,000 to $74,999 | 5 (6.1%) | 0 (0.0%) |
| $75,000 to $99,999 | 22 (26.8%) | 5 (7.3%) |
| $100,000+ | 16 (19.5%) | 0 (0.0%) |
| Total | 82 (100.0%) | 68 (100.0%) |
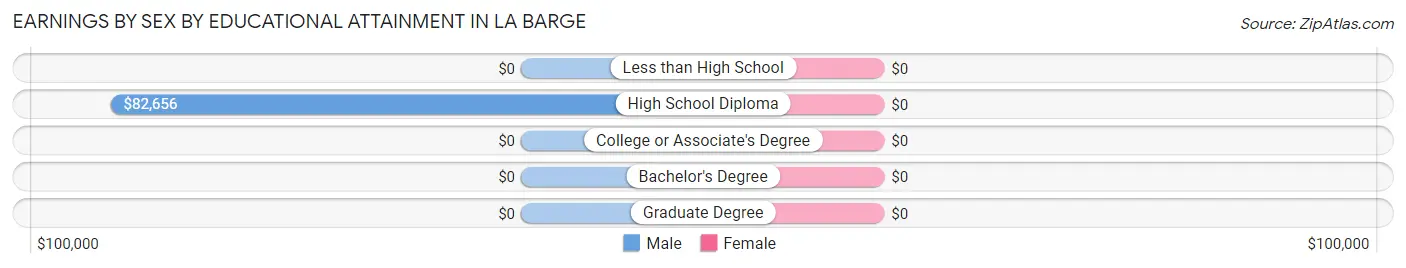
Earnings by Sex by Educational Attainment in La Barge
| Educational Attainment | Male Income | Female Income |
| Less than High School | - | - |
| High School Diploma | $82,656 | $0 |
| College or Associate's Degree | - | - |
| Bachelor's Degree | - | - |
| Graduate Degree | - | - |
| Total | $77,500 | $13,906 |
Family Income in La Barge
Family Income Brackets in La Barge
According to the La Barge family income data, there are 27 families falling into the $100,000 to $149,999 income range, which is the most common income bracket and makes up 42.2% of all families.
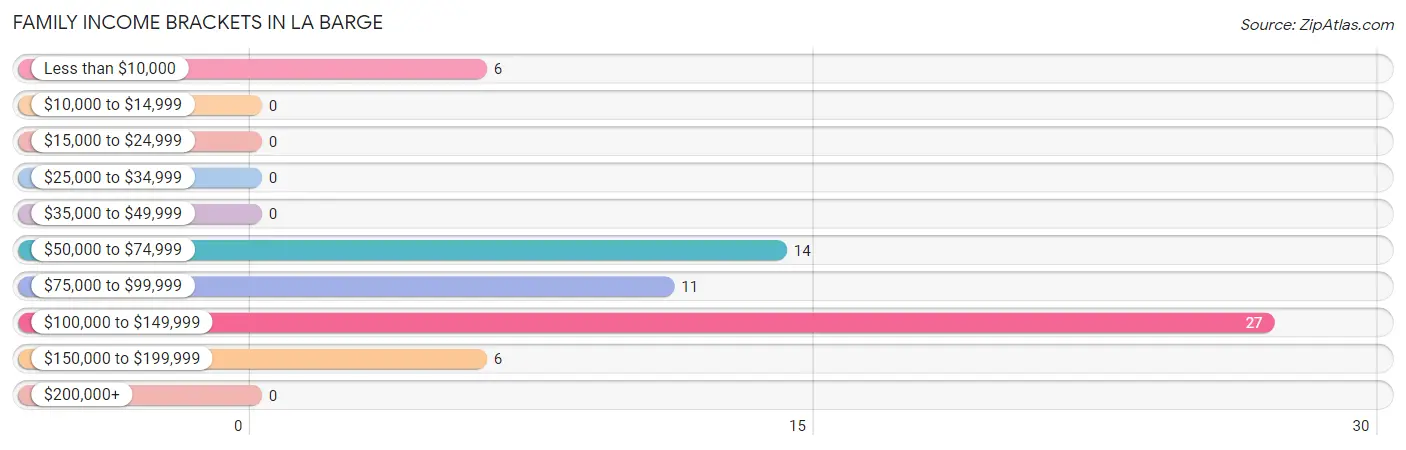
| Income Bracket | # Families | % Families |
| Less than $10,000 | 6 | 9.4% |
| $10,000 to $14,999 | 0 | 0.0% |
| $15,000 to $24,999 | 0 | 0.0% |
| $25,000 to $34,999 | 0 | 0.0% |
| $35,000 to $49,999 | 0 | 0.0% |
| $50,000 to $74,999 | 14 | 21.9% |
| $75,000 to $99,999 | 11 | 17.2% |
| $100,000 to $149,999 | 27 | 42.2% |
| $150,000 to $199,999 | 6 | 9.4% |
| $200,000+ | 0 | 0.0% |
Family Income by Famaliy Size in La Barge
4-person families (11 | 17.2%) account for the highest median family income in La Barge with $182,708 per family, while 2-person families (37 | 57.8%) have the highest median income of $50,062 per family member.
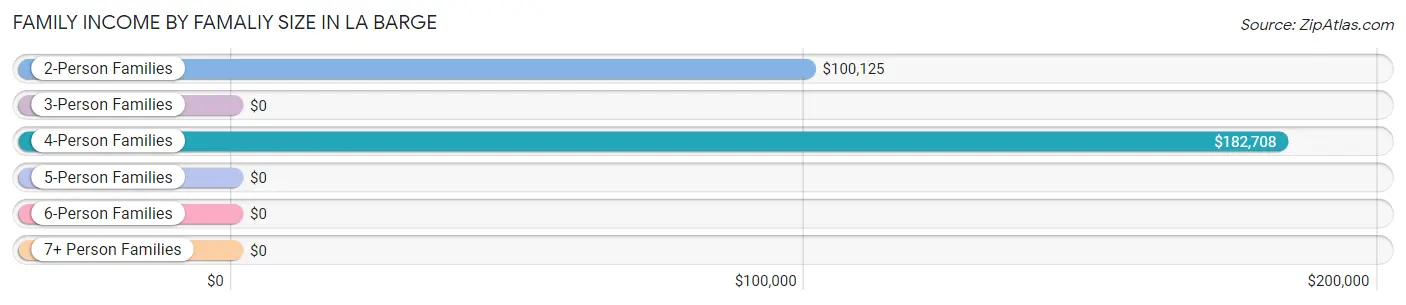
| Income Bracket | # Families | Median Income |
| 2-Person Families | 37 (57.8%) | $100,125 |
| 3-Person Families | 10 (15.6%) | $0 |
| 4-Person Families | 11 (17.2%) | $182,708 |
| 5-Person Families | 0 (0.0%) | $0 |
| 6-Person Families | 6 (9.4%) | $0 |
| 7+ Person Families | 0 (0.0%) | $0 |
| Total | 64 (100.0%) | $100,250 |
Family Income by Number of Earners in La Barge
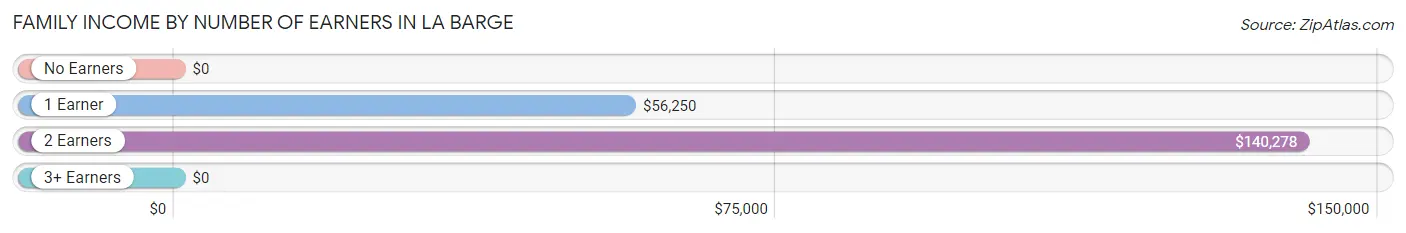
| Number of Earners | # Families | Median Income |
| No Earners | 0 (0.0%) | $0 |
| 1 Earner | 34 (53.1%) | $56,250 |
| 2 Earners | 28 (43.8%) | $140,278 |
| 3+ Earners | 2 (3.1%) | $0 |
| Total | 64 (100.0%) | $100,250 |
Household Income in La Barge
Household Income Brackets in La Barge
With 27 households falling in the category, the $100,000 to $149,999 income range is the most frequent in La Barge, accounting for 24.8% of all households.
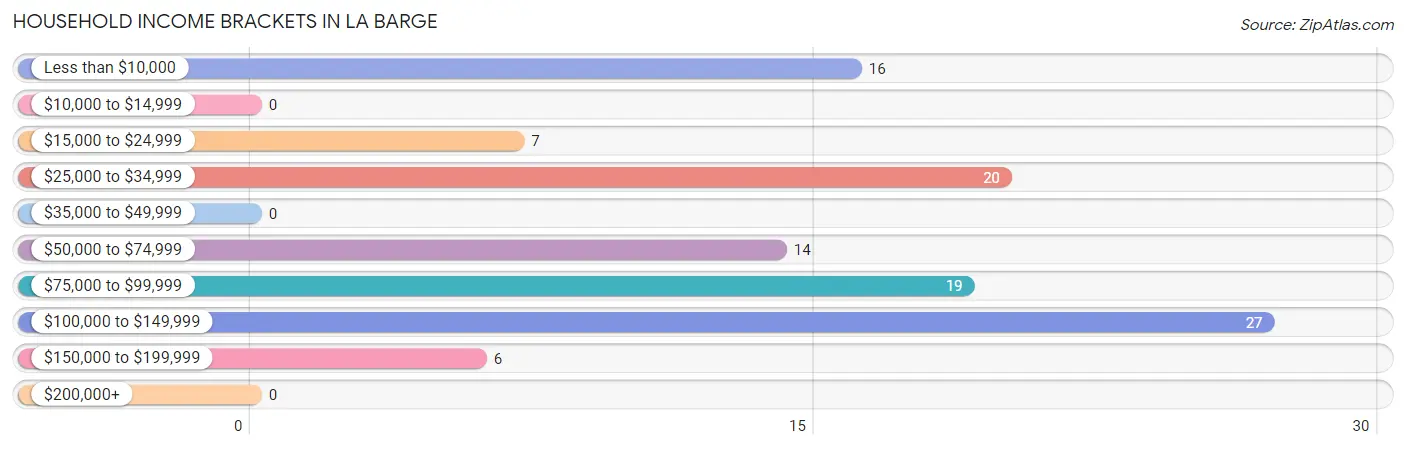
| Income Bracket | # Households | % Households |
| Less than $10,000 | 16 | 14.7% |
| $10,000 to $14,999 | 0 | 0.0% |
| $15,000 to $24,999 | 7 | 6.4% |
| $25,000 to $34,999 | 20 | 18.3% |
| $35,000 to $49,999 | 0 | 0.0% |
| $50,000 to $74,999 | 14 | 12.8% |
| $75,000 to $99,999 | 19 | 17.4% |
| $100,000 to $149,999 | 27 | 24.8% |
| $150,000 to $199,999 | 6 | 5.5% |
| $200,000+ | 0 | 0.0% |
Household Income by Householder Age in La Barge
The median household income in La Barge is $56,458, with the highest median household income of $84,167 found in the 45 to 64 years age bracket for the primary householder. A total of 52 households (47.7%) fall into this category. Meanwhile, the 15 to 24 years age bracket for the primary householder has the lowest median household income of $0, with 6 households (5.5%) in this group.
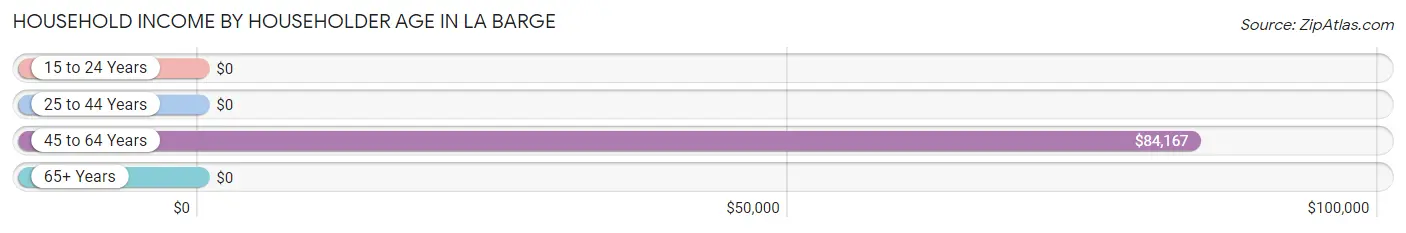
| Income Bracket | # Households | Median Income |
| 15 to 24 Years | 6 (5.5%) | $0 |
| 25 to 44 Years | 28 (25.7%) | $0 |
| 45 to 64 Years | 52 (47.7%) | $84,167 |
| 65+ Years | 23 (21.1%) | $0 |
| Total | 109 (100.0%) | $56,458 |
Poverty in La Barge
Income Below Poverty by Sex and Age in La Barge
With 15.6% poverty level for males and 18.5% for females among the residents of La Barge, 45 to 54 year old males and 6 to 11 year old females are the most vulnerable to poverty, with 12 males (63.2%) and 5 females (100.0%) in their respective age groups living below the poverty level.
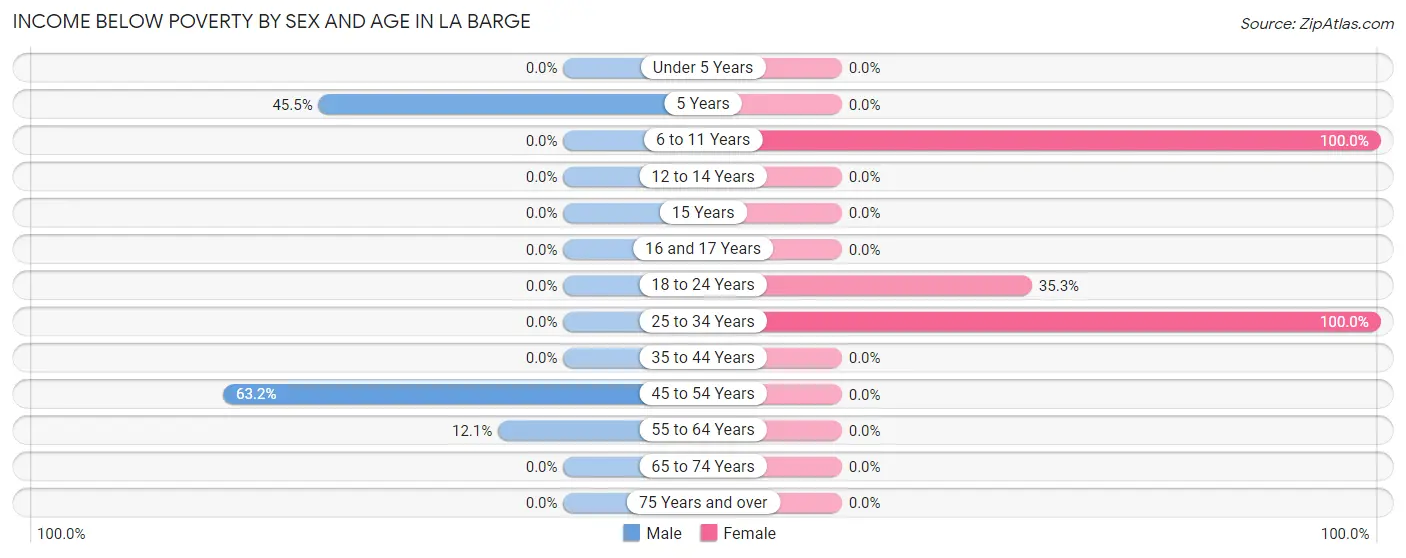
| Age Bracket | Male | Female |
| Under 5 Years | 0 (0.0%) | 0 (0.0%) |
| 5 Years | 5 (45.5%) | 0 (0.0%) |
| 6 to 11 Years | 0 (0.0%) | 5 (100.0%) |
| 12 to 14 Years | 0 (0.0%) | 0 (0.0%) |
| 15 Years | 0 (0.0%) | 0 (0.0%) |
| 16 and 17 Years | 0 (0.0%) | 0 (0.0%) |
| 18 to 24 Years | 0 (0.0%) | 12 (35.3%) |
| 25 to 34 Years | 0 (0.0%) | 6 (100.0%) |
| 35 to 44 Years | 0 (0.0%) | 0 (0.0%) |
| 45 to 54 Years | 12 (63.2%) | 0 (0.0%) |
| 55 to 64 Years | 4 (12.1%) | 0 (0.0%) |
| 65 to 74 Years | 0 (0.0%) | 0 (0.0%) |
| 75 Years and over | 0 (0.0%) | 0 (0.0%) |
| Total | 21 (15.6%) | 23 (18.5%) |
Income Above Poverty by Sex and Age in La Barge
According to the poverty statistics in La Barge, males aged under 5 years and females aged 12 to 14 years are the age groups that are most secure financially, with 100.0% of males and 100.0% of females in these age groups living above the poverty line.
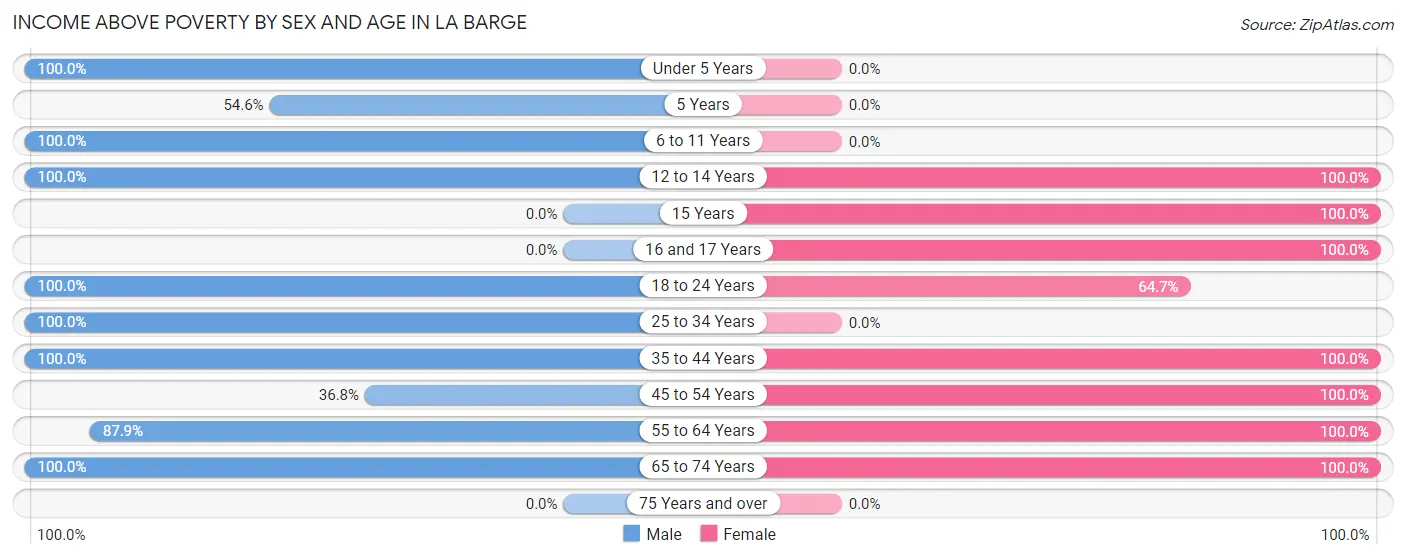
| Age Bracket | Male | Female |
| Under 5 Years | 8 (100.0%) | 0 (0.0%) |
| 5 Years | 6 (54.5%) | 0 (0.0%) |
| 6 to 11 Years | 12 (100.0%) | 0 (0.0%) |
| 12 to 14 Years | 2 (100.0%) | 3 (100.0%) |
| 15 Years | 0 (0.0%) | 3 (100.0%) |
| 16 and 17 Years | 0 (0.0%) | 8 (100.0%) |
| 18 to 24 Years | 6 (100.0%) | 22 (64.7%) |
| 25 to 34 Years | 14 (100.0%) | 0 (0.0%) |
| 35 to 44 Years | 9 (100.0%) | 12 (100.0%) |
| 45 to 54 Years | 7 (36.8%) | 29 (100.0%) |
| 55 to 64 Years | 29 (87.9%) | 9 (100.0%) |
| 65 to 74 Years | 21 (100.0%) | 15 (100.0%) |
| 75 Years and over | 0 (0.0%) | 0 (0.0%) |
| Total | 114 (84.4%) | 101 (81.5%) |
Income Below Poverty Among Married-Couple Families in La Barge
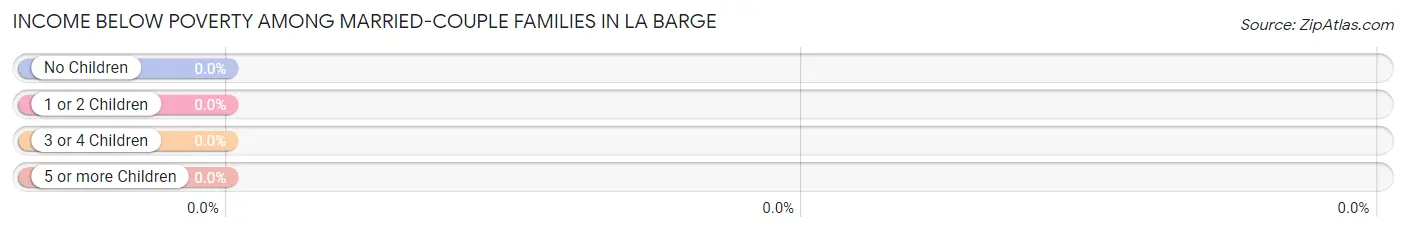
| Children | Above Poverty | Below Poverty |
| No Children | 41 (100.0%) | 0 (0.0%) |
| 1 or 2 Children | 11 (100.0%) | 0 (0.0%) |
| 3 or 4 Children | 6 (100.0%) | 0 (0.0%) |
| 5 or more Children | 0 (0.0%) | 0 (0.0%) |
| Total | 58 (100.0%) | 0 (0.0%) |
Income Below Poverty Among Single-Parent Households in La Barge
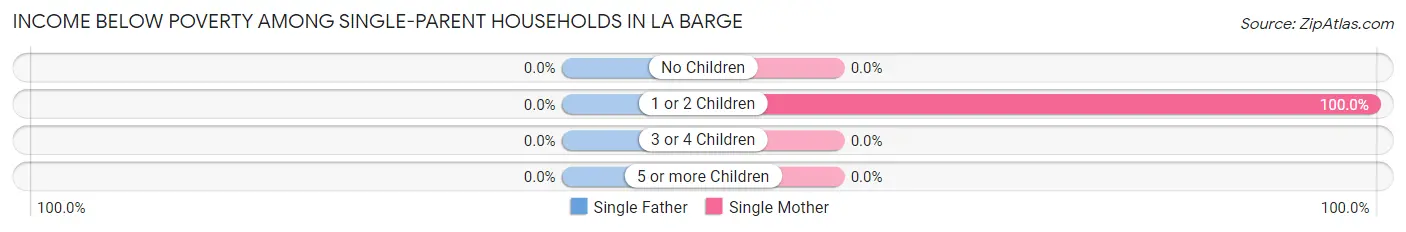
| Children | Single Father | Single Mother |
| No Children | 0 (0.0%) | 0 (0.0%) |
| 1 or 2 Children | 0 (0.0%) | 6 (100.0%) |
| 3 or 4 Children | 0 (0.0%) | 0 (0.0%) |
| 5 or more Children | 0 (0.0%) | 0 (0.0%) |
| Total | 0 (0.0%) | 6 (100.0%) |
Income Below Poverty Among Married-Couple vs Single-Parent Households in La Barge
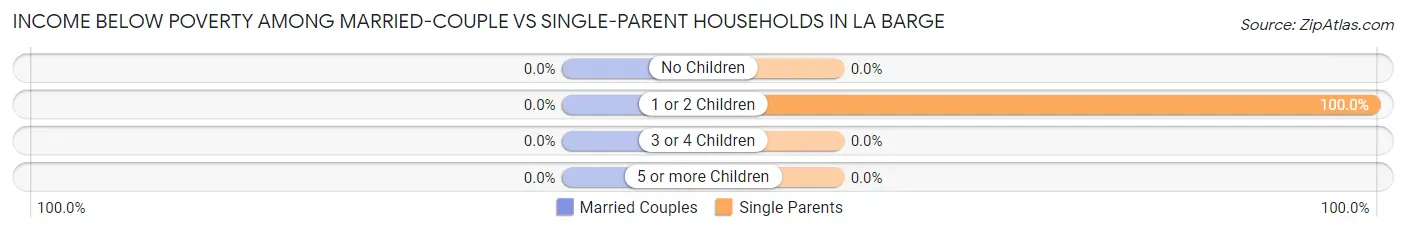
| Children | Married-Couple Families | Single-Parent Households |
| No Children | 0 (0.0%) | 0 (0.0%) |
| 1 or 2 Children | 0 (0.0%) | 6 (100.0%) |
| 3 or 4 Children | 0 (0.0%) | 0 (0.0%) |
| 5 or more Children | 0 (0.0%) | 0 (0.0%) |
| Total | 0 (0.0%) | 6 (100.0%) |
Race in La Barge
The most populous races in La Barge are White / Caucasian (237 | 91.5%), Two or more Races (16 | 6.2%), and Asian (6 | 2.3%).
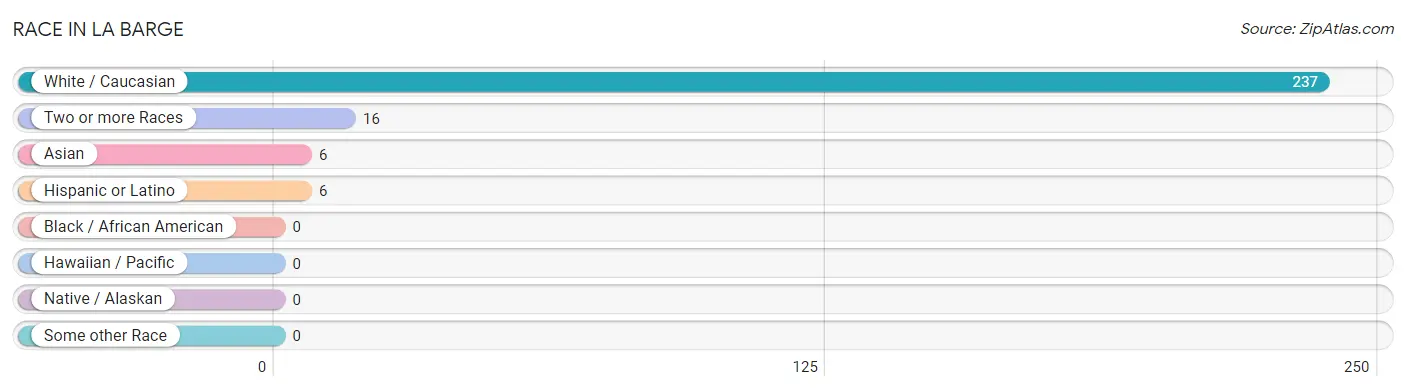
| Race | # Population | % Population |
| Asian | 6 | 2.3% |
| Black / African American | 0 | 0.0% |
| Hawaiian / Pacific | 0 | 0.0% |
| Hispanic or Latino | 6 | 2.3% |
| Native / Alaskan | 0 | 0.0% |
| White / Caucasian | 237 | 91.5% |
| Two or more Races | 16 | 6.2% |
| Some other Race | 0 | 0.0% |
| Total | 259 | 100.0% |
Ancestry in La Barge
The most populous ancestries reported in La Barge are German (74 | 28.6%), Irish (57 | 22.0%), Danish (41 | 15.8%), Welsh (32 | 12.4%), and American (29 | 11.2%), together accounting for 90.0% of all La Barge residents.
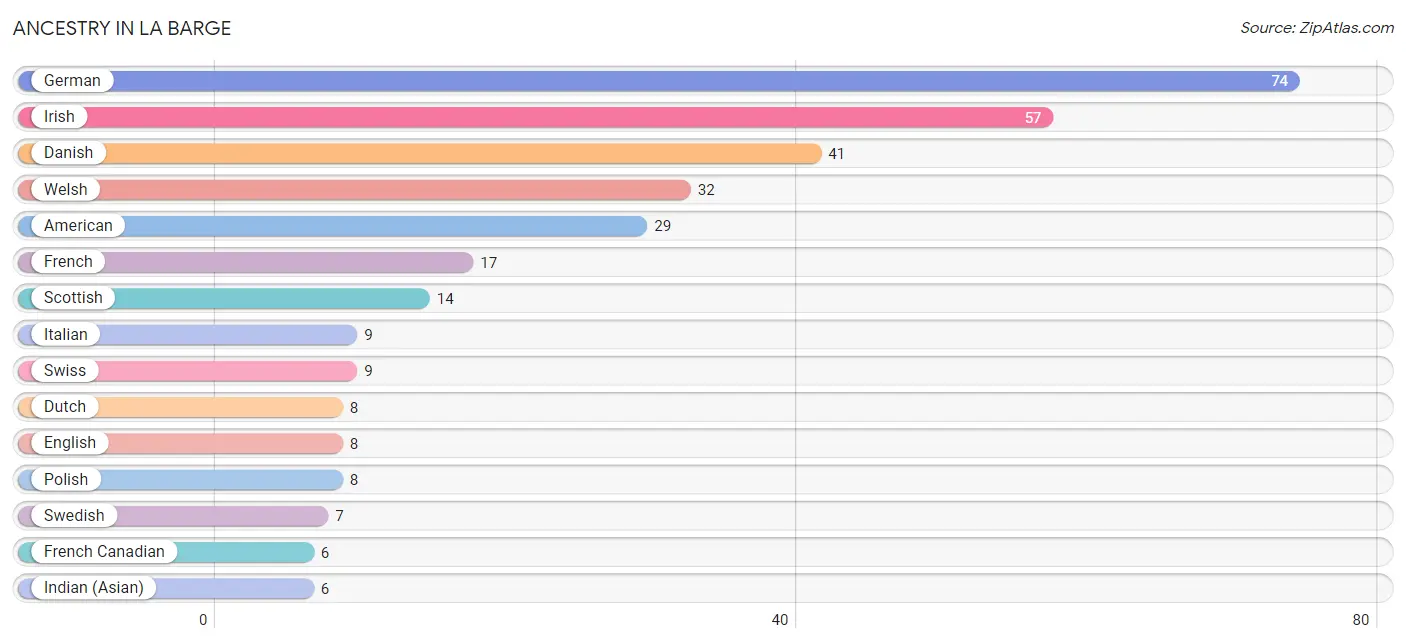
| Ancestry | # Population | % Population |
| American | 29 | 11.2% |
| Danish | 41 | 15.8% |
| Dutch | 8 | 3.1% |
| English | 8 | 3.1% |
| French | 17 | 6.6% |
| French Canadian | 6 | 2.3% |
| German | 74 | 28.6% |
| Indian (Asian) | 6 | 2.3% |
| Irish | 57 | 22.0% |
| Italian | 9 | 3.5% |
| Mexican | 6 | 2.3% |
| Polish | 8 | 3.1% |
| Scottish | 14 | 5.4% |
| Swedish | 7 | 2.7% |
| Swiss | 9 | 3.5% |
| Welsh | 32 | 12.4% | View All 16 Rows |
Immigrants in La Barge
The most numerous immigrant groups reported in La Barge came from Asia (6 | 2.3%), China (6 | 2.3%), and Eastern Asia (6 | 2.3%), together accounting for 7.0% of all La Barge residents.
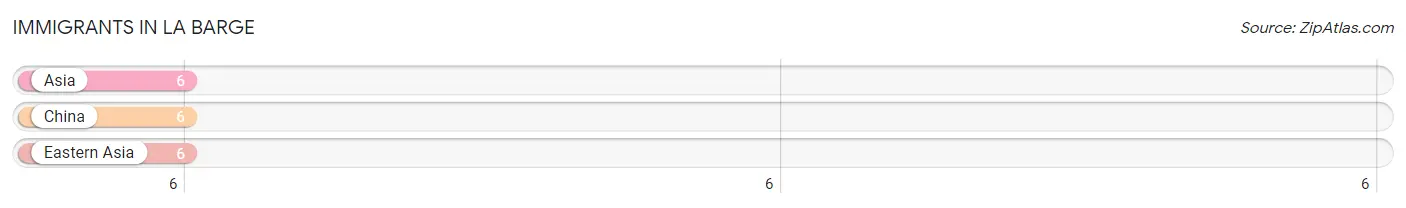
| Immigration Origin | # Population | % Population |
| Asia | 6 | 2.3% |
| China | 6 | 2.3% |
| Eastern Asia | 6 | 2.3% | View All 3 Rows |
Sex and Age in La Barge
Sex and Age in La Barge
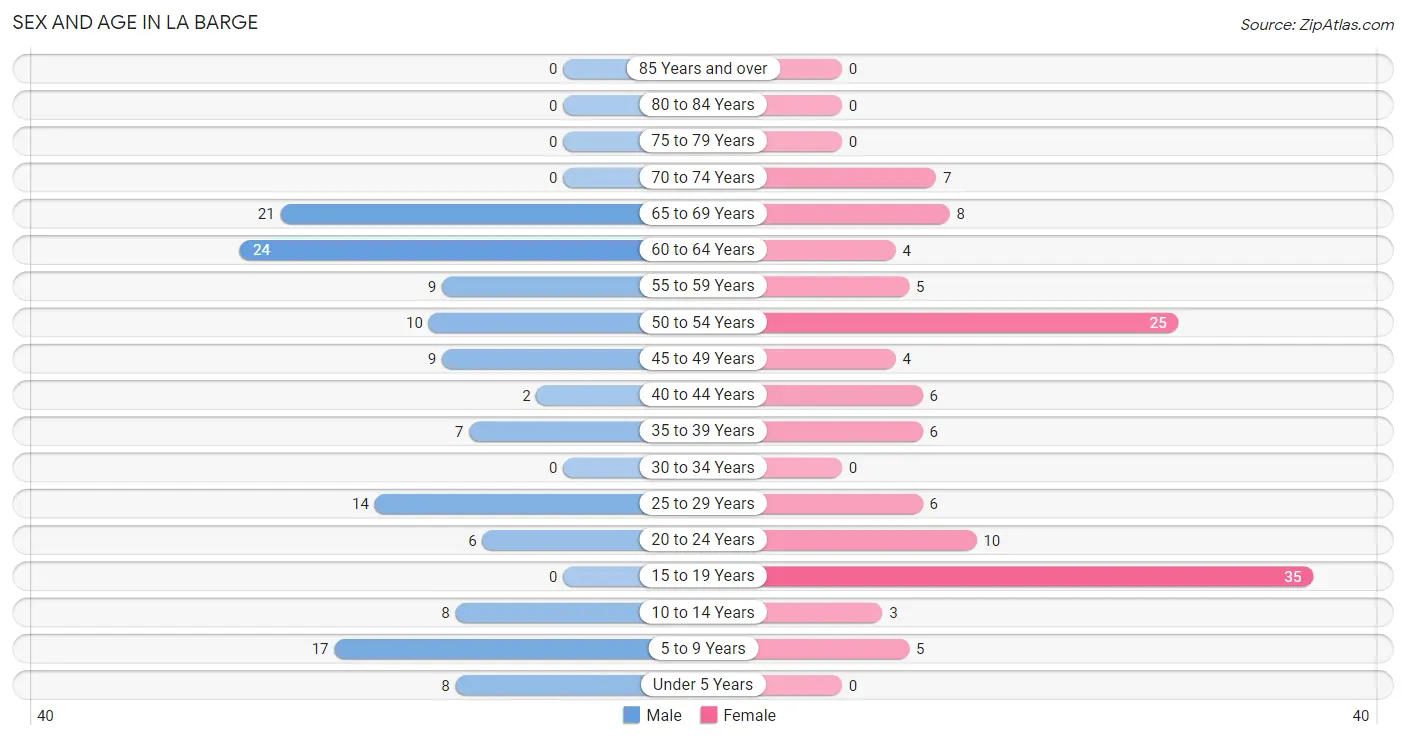
The most populous age groups in La Barge are 60 to 64 Years (24 | 17.8%) for men and 15 to 19 Years (35 | 28.2%) for women.
| Age Bracket | Male | Female |
| Under 5 Years | 8 (5.9%) | 0 (0.0%) |
| 5 to 9 Years | 17 (12.6%) | 5 (4.0%) |
| 10 to 14 Years | 8 (5.9%) | 3 (2.4%) |
| 15 to 19 Years | 0 (0.0%) | 35 (28.2%) |
| 20 to 24 Years | 6 (4.4%) | 10 (8.1%) |
| 25 to 29 Years | 14 (10.4%) | 6 (4.8%) |
| 30 to 34 Years | 0 (0.0%) | 0 (0.0%) |
| 35 to 39 Years | 7 (5.2%) | 6 (4.8%) |
| 40 to 44 Years | 2 (1.5%) | 6 (4.8%) |
| 45 to 49 Years | 9 (6.7%) | 4 (3.2%) |
| 50 to 54 Years | 10 (7.4%) | 25 (20.2%) |
| 55 to 59 Years | 9 (6.7%) | 5 (4.0%) |
| 60 to 64 Years | 24 (17.8%) | 4 (3.2%) |
| 65 to 69 Years | 21 (15.6%) | 8 (6.5%) |
| 70 to 74 Years | 0 (0.0%) | 7 (5.7%) |
| 75 to 79 Years | 0 (0.0%) | 0 (0.0%) |
| 80 to 84 Years | 0 (0.0%) | 0 (0.0%) |
| 85 Years and over | 0 (0.0%) | 0 (0.0%) |
| Total | 135 (100.0%) | 124 (100.0%) |
Families and Households in La Barge
Median Family Size in La Barge
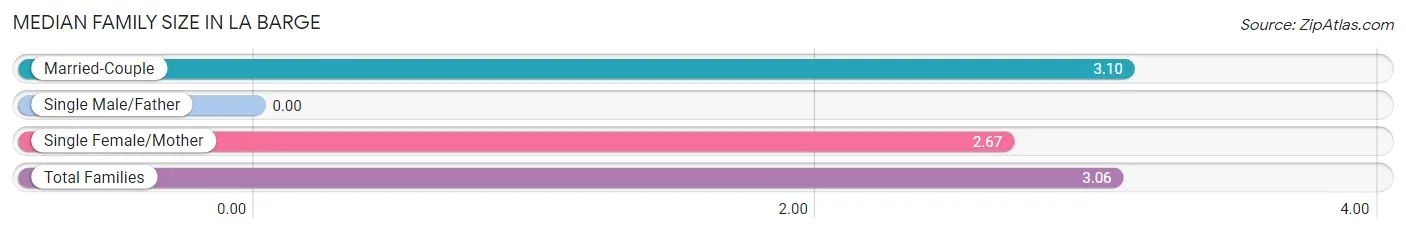
| Family Type | # Families | Family Size |
| Married-Couple | 58 (90.6%) | 3.10 |
| Single Male/Father | 0 (0.0%) | - |
| Single Female/Mother | 6 (9.4%) | 2.67 |
| Total Families | 64 (100.0%) | 3.06 |
Median Household Size in La Barge
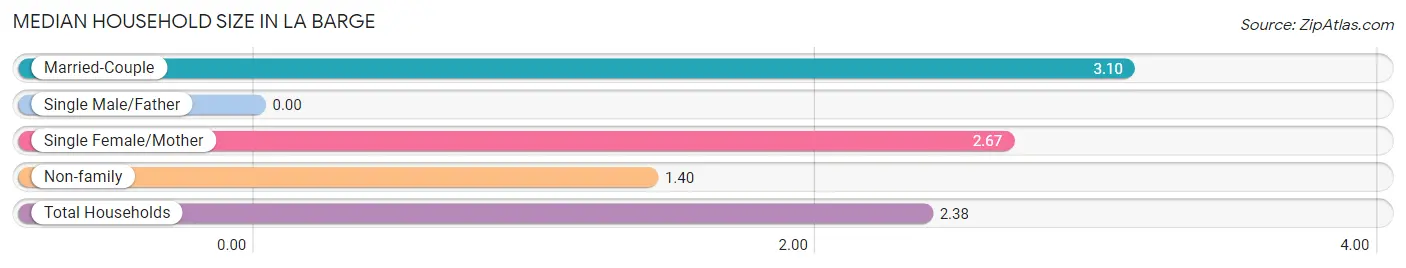
| Household Type | # Households | Household Size |
| Married-Couple | 58 (53.2%) | 3.10 |
| Single Male/Father | 0 (0.0%) | - |
| Single Female/Mother | 6 (5.5%) | 2.67 |
| Non-family | 45 (41.3%) | 1.40 |
| Total Households | 109 (100.0%) | 2.38 |
Household Size by Marriage Status in La Barge
Out of a total of 109 households in La Barge, 64 (58.7%) are family households, while 45 (41.3%) are nonfamily households. The most numerous type of family households are 2-person households, comprising 37, and the most common type of nonfamily households are 1-person households, comprising 24.
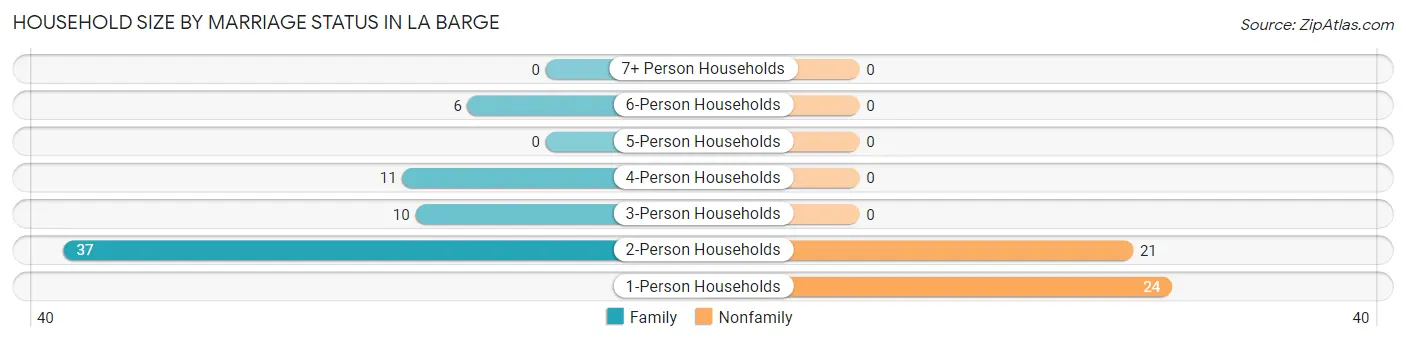
| Household Size | Family Households | Nonfamily Households |
| 1-Person Households | - | 24 (22.0%) |
| 2-Person Households | 37 (33.9%) | 21 (19.3%) |
| 3-Person Households | 10 (9.2%) | 0 (0.0%) |
| 4-Person Households | 11 (10.1%) | 0 (0.0%) |
| 5-Person Households | 0 (0.0%) | 0 (0.0%) |
| 6-Person Households | 6 (5.5%) | 0 (0.0%) |
| 7+ Person Households | 0 (0.0%) | 0 (0.0%) |
| Total | 64 (58.7%) | 45 (41.3%) |
Female Fertility in La Barge
Fertility by Age in La Barge
| Age Bracket | Women with Births | Births / 1,000 Women |
| 15 to 19 years | 0 (0.0%) | 0.0 |
| 20 to 34 years | 0 (0.0%) | 0.0 |
| 35 to 50 years | 0 (0.0%) | 0.0 |
| Total | 0 (0.0%) | 0.0 |
Fertility by Age by Marriage Status in La Barge
| Age Bracket | Married | Unmarried |
| 15 to 19 years | 0 (0.0%) | 0 (0.0%) |
| 20 to 34 years | 0 (0.0%) | 0 (0.0%) |
| 35 to 50 years | 0 (0.0%) | 0 (0.0%) |
| Total | 0 (0.0%) | 0 (0.0%) |
Fertility by Education in La Barge
| Educational Attainment | Women with Births | Births / 1,000 Women |
| Less than High School | 0 (0.0%) | 0.0 |
| High School Diploma | 0 (0.0%) | 0.0 |
| College or Associate's Degree | 0 (0.0%) | 0.0 |
| Bachelor's Degree | 0 (0.0%) | 0.0 |
| Graduate Degree | 0 (0.0%) | 0.0 |
| Total | 0 (0.0%) | 0.0 |
Fertility by Education by Marriage Status in La Barge
| Educational Attainment | Married | Unmarried |
| Less than High School | 0 (0.0%) | 0 (0.0%) |
| High School Diploma | 0 (0.0%) | 0 (0.0%) |
| College or Associate's Degree | 0 (0.0%) | 0 (0.0%) |
| Bachelor's Degree | 0 (0.0%) | 0 (0.0%) |
| Graduate Degree | 0 (0.0%) | 0 (0.0%) |
| Total | 0 (0.0%) | 0 (0.0%) |
Employment Characteristics in La Barge
Employment by Class of Employer in La Barge
Among the 111 employed individuals in La Barge, private company employees (76 | 68.5%), local government employees (15 | 13.5%), and self-employed (incorporated) (8 | 7.2%) make up the most common classes of employment.
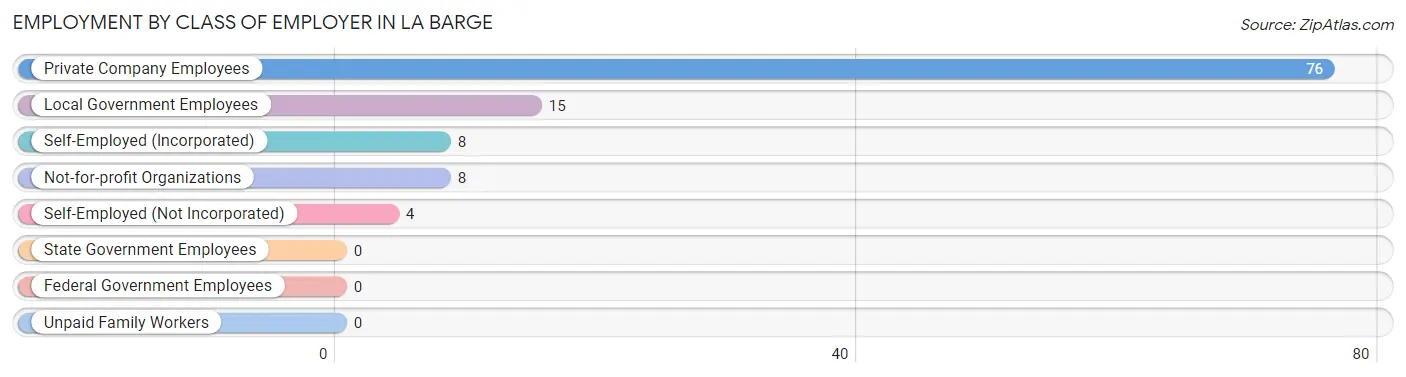
| Employer Class | # Employees | % Employees |
| Private Company Employees | 76 | 68.5% |
| Self-Employed (Incorporated) | 8 | 7.2% |
| Self-Employed (Not Incorporated) | 4 | 3.6% |
| Not-for-profit Organizations | 8 | 7.2% |
| Local Government Employees | 15 | 13.5% |
| State Government Employees | 0 | 0.0% |
| Federal Government Employees | 0 | 0.0% |
| Unpaid Family Workers | 0 | 0.0% |
| Total | 111 | 100.0% |
Employment Status by Age in La Barge
According to the labor force statistics for La Barge, out of the total population over 16 years of age (215), 66.5% or 143 individuals are in the labor force, with 22.4% or 32 of them unemployed. The age group with the highest labor force participation rate is 25 to 29 years, with 100.0% or 20 individuals in the labor force. Within the labor force, the 45 to 54 years age range has the highest percentage of unemployed individuals, with 62.5% or 20 of them being unemployed.
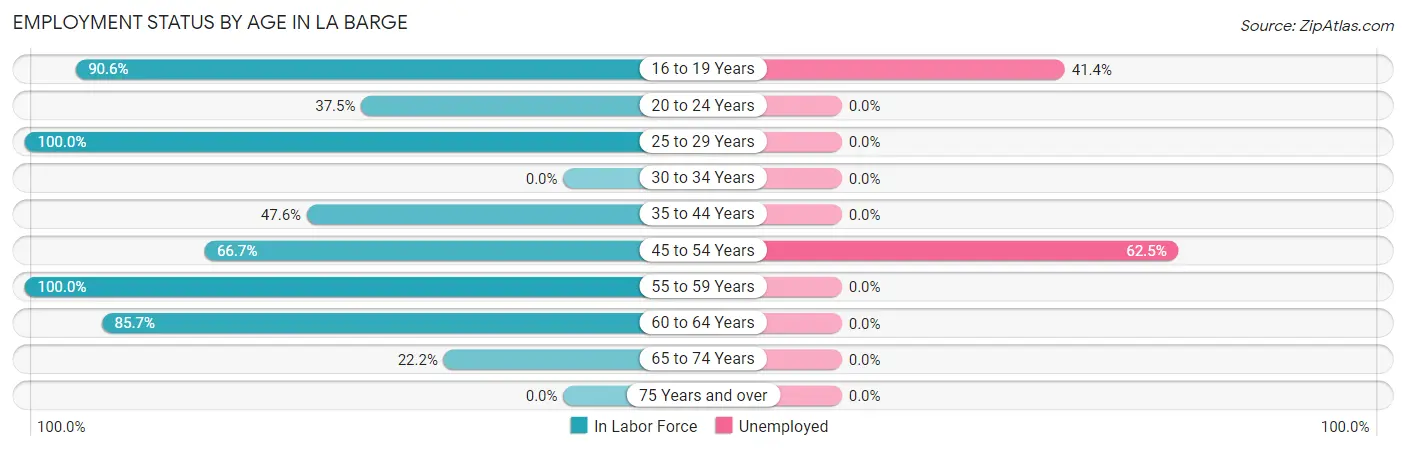
| Age Bracket | In Labor Force | Unemployed |
| 16 to 19 Years | 29 (90.6%) | 12 (41.4%) |
| 20 to 24 Years | 6 (37.5%) | 0 (0.0%) |
| 25 to 29 Years | 20 (100.0%) | 0 (0.0%) |
| 30 to 34 Years | 0 (0.0%) | 0 (0.0%) |
| 35 to 44 Years | 10 (47.6%) | 0 (0.0%) |
| 45 to 54 Years | 32 (66.7%) | 20 (62.5%) |
| 55 to 59 Years | 14 (100.0%) | 0 (0.0%) |
| 60 to 64 Years | 24 (85.7%) | 0 (0.0%) |
| 65 to 74 Years | 8 (22.2%) | 0 (0.0%) |
| 75 Years and over | 0 (0.0%) | 0 (0.0%) |
| Total | 143 (66.5%) | 32 (22.4%) |
Employment Status by Educational Attainment in La Barge
According to labor force statistics for La Barge, 76.3% of individuals (100) out of the total population between 25 and 64 years of age (131) are in the labor force, with 20.0% or 20 of them being unemployed. The group with the highest labor force participation rate are those with the educational attainment of college / associate degree, with 85.7% or 60 individuals in the labor force. Within the labor force, individuals with bachelor's degree or higher education have the highest percentage of unemployment, with 62.5% or 10 of them being unemployed.
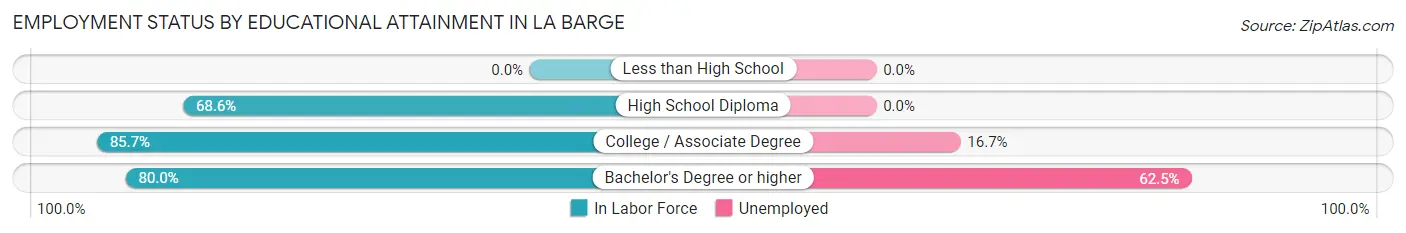
| Educational Attainment | In Labor Force | Unemployed |
| Less than High School | 0 (0.0%) | 0 (0.0%) |
| High School Diploma | 24 (68.6%) | 0 (0.0%) |
| College / Associate Degree | 60 (85.7%) | 12 (16.7%) |
| Bachelor's Degree or higher | 16 (80.0%) | 12 (62.5%) |
| Total | 100 (76.3%) | 26 (20.0%) |
Employment Occupations by Sex in La Barge
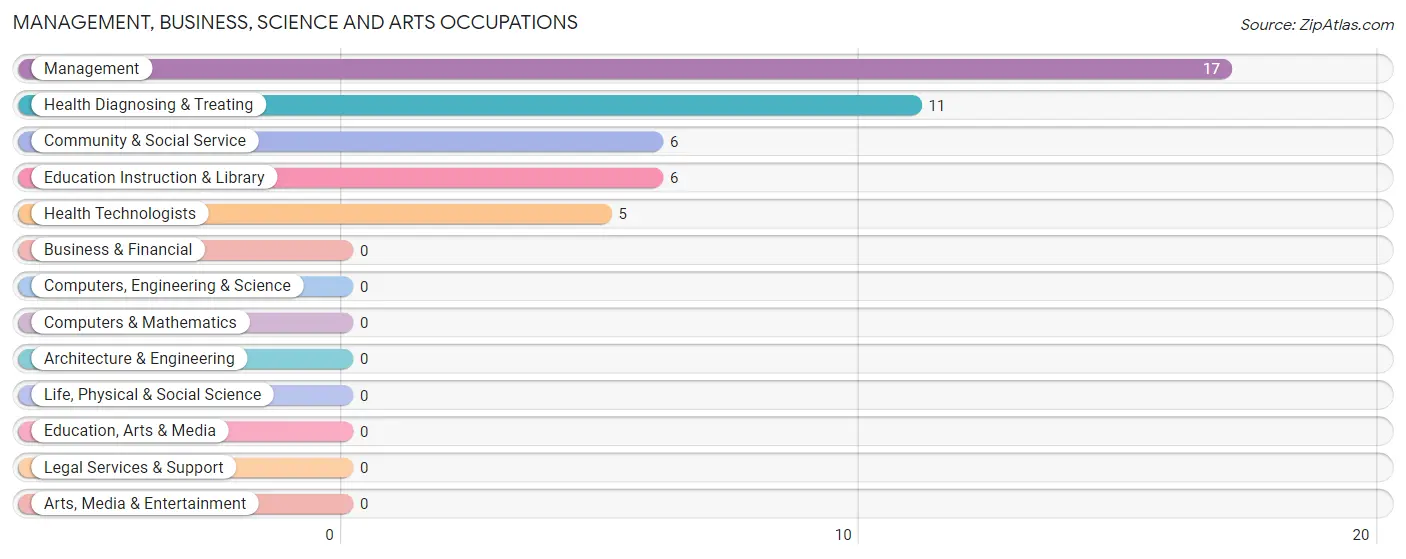
Management, Business, Science and Arts Occupations
The most common Management, Business, Science and Arts occupations in La Barge are Management (17 | 15.3%), Health Diagnosing & Treating (11 | 9.9%), Community & Social Service (6 | 5.4%), Education Instruction & Library (6 | 5.4%), and Health Technologists (5 | 4.5%).
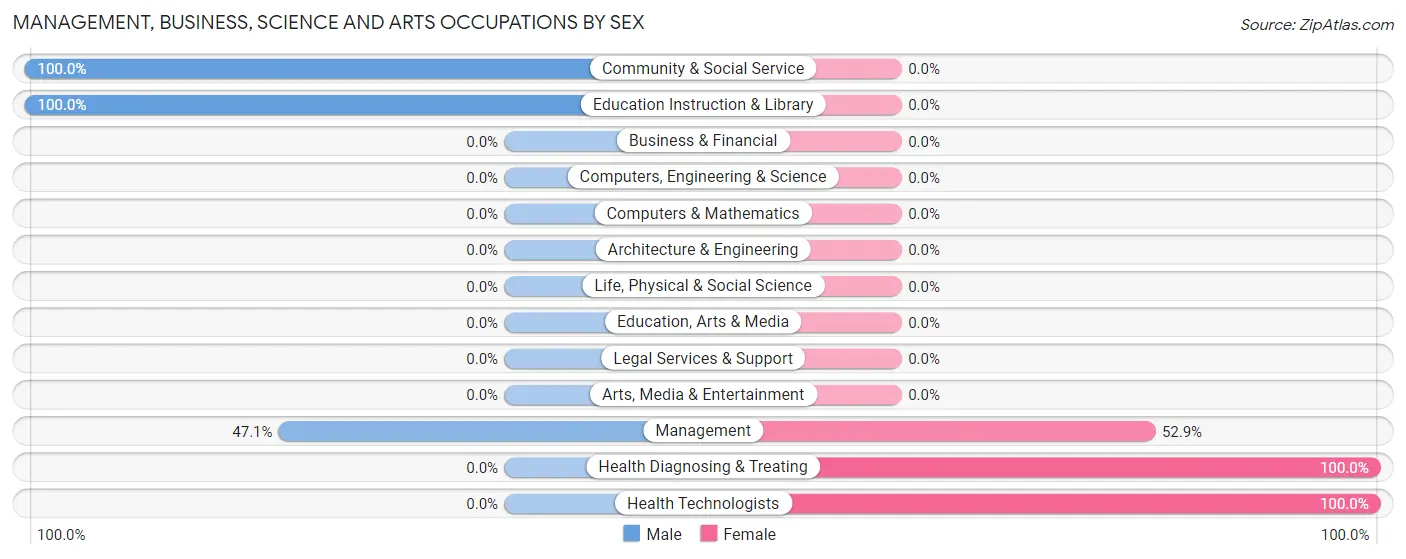
Management, Business, Science and Arts Occupations by Sex
Within the Management, Business, Science and Arts occupations in La Barge, the most male-oriented occupations are Community & Social Service (100.0%), Education Instruction & Library (100.0%), and Management (47.1%), while the most female-oriented occupations are Health Diagnosing & Treating (100.0%), Health Technologists (100.0%), and Management (52.9%).
| Occupation | Male | Female |
| Management | 8 (47.1%) | 9 (52.9%) |
| Business & Financial | 0 (0.0%) | 0 (0.0%) |
| Computers, Engineering & Science | 0 (0.0%) | 0 (0.0%) |
| Computers & Mathematics | 0 (0.0%) | 0 (0.0%) |
| Architecture & Engineering | 0 (0.0%) | 0 (0.0%) |
| Life, Physical & Social Science | 0 (0.0%) | 0 (0.0%) |
| Community & Social Service | 6 (100.0%) | 0 (0.0%) |
| Education, Arts & Media | 0 (0.0%) | 0 (0.0%) |
| Legal Services & Support | 0 (0.0%) | 0 (0.0%) |
| Education Instruction & Library | 6 (100.0%) | 0 (0.0%) |
| Arts, Media & Entertainment | 0 (0.0%) | 0 (0.0%) |
| Health Diagnosing & Treating | 0 (0.0%) | 11 (100.0%) |
| Health Technologists | 0 (0.0%) | 5 (100.0%) |
| Total (Category) | 14 (41.2%) | 20 (58.8%) |
| Total (Overall) | 65 (58.6%) | 46 (41.4%) |
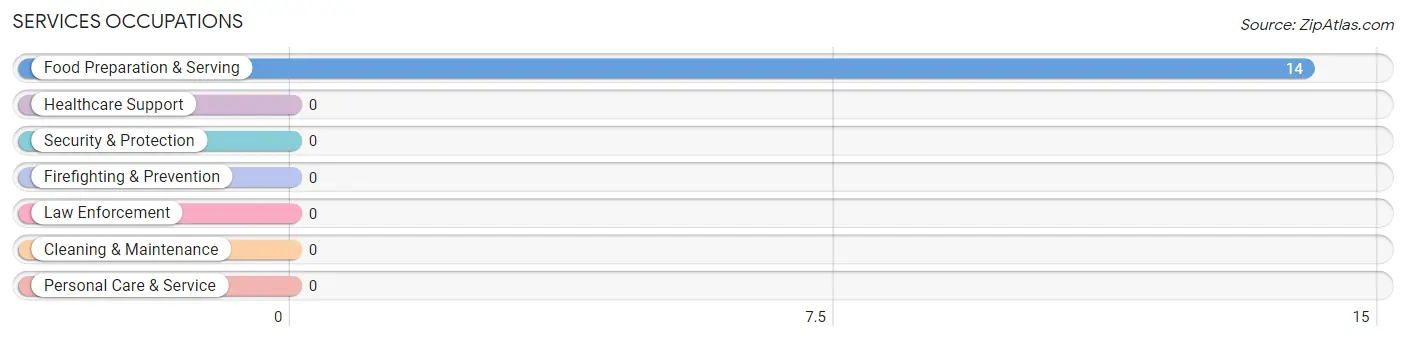
Services Occupations
The most common Services occupations in La Barge are , and Food Preparation & Serving (14 | 12.6%).
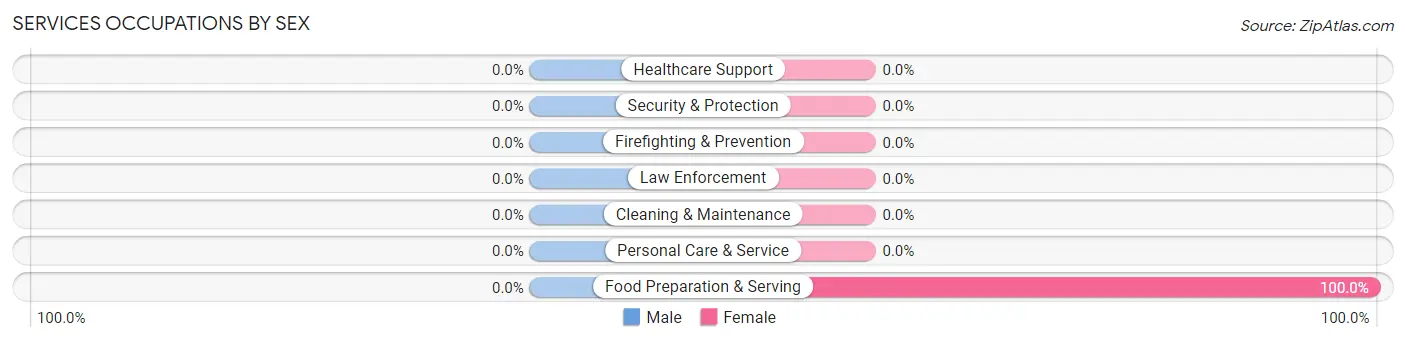
Services Occupations by Sex
| Occupation | Male | Female |
| Healthcare Support | 0 (0.0%) | 0 (0.0%) |
| Security & Protection | 0 (0.0%) | 0 (0.0%) |
| Firefighting & Prevention | 0 (0.0%) | 0 (0.0%) |
| Law Enforcement | 0 (0.0%) | 0 (0.0%) |
| Food Preparation & Serving | 0 (0.0%) | 14 (100.0%) |
| Cleaning & Maintenance | 0 (0.0%) | 0 (0.0%) |
| Personal Care & Service | 0 (0.0%) | 0 (0.0%) |
| Total (Category) | 0 (0.0%) | 14 (100.0%) |
| Total (Overall) | 65 (58.6%) | 46 (41.4%) |
Sales and Office Occupations
The most common Sales and Office occupations in La Barge are , and Office & Administration (12 | 10.8%).

Sales and Office Occupations by Sex

| Occupation | Male | Female |
| Sales & Related | 0 (0.0%) | 0 (0.0%) |
| Office & Administration | 0 (0.0%) | 12 (100.0%) |
| Total (Category) | 0 (0.0%) | 12 (100.0%) |
| Total (Overall) | 65 (58.6%) | 46 (41.4%) |
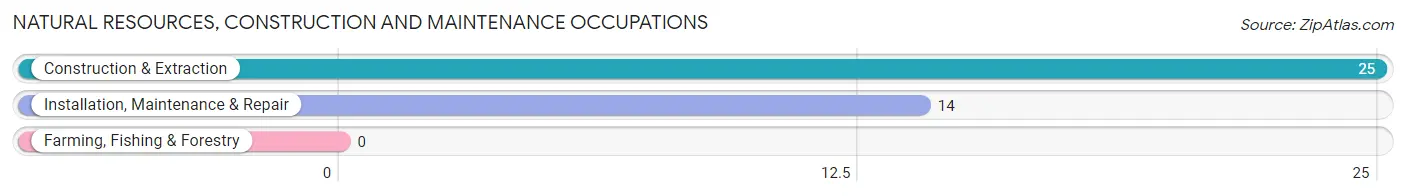
Natural Resources, Construction and Maintenance Occupations
The most common Natural Resources, Construction and Maintenance occupations in La Barge are Construction & Extraction (25 | 22.5%), and Installation, Maintenance & Repair (14 | 12.6%).
Natural Resources, Construction and Maintenance Occupations by Sex
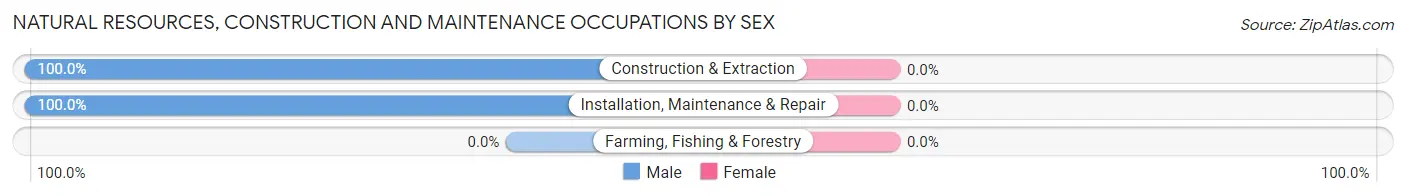
| Occupation | Male | Female |
| Farming, Fishing & Forestry | 0 (0.0%) | 0 (0.0%) |
| Construction & Extraction | 25 (100.0%) | 0 (0.0%) |
| Installation, Maintenance & Repair | 14 (100.0%) | 0 (0.0%) |
| Total (Category) | 39 (100.0%) | 0 (0.0%) |
| Total (Overall) | 65 (58.6%) | 46 (41.4%) |
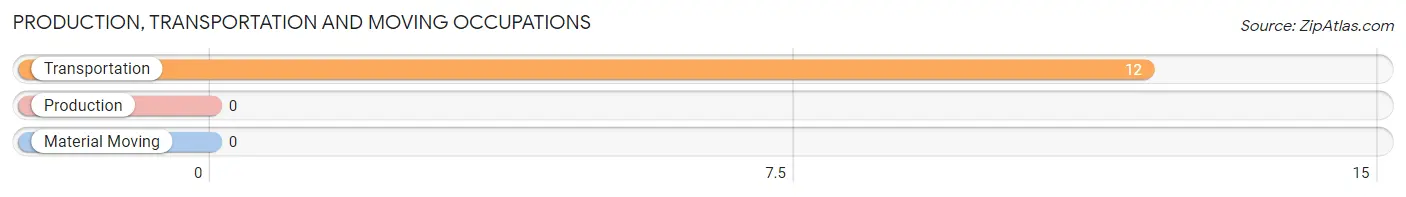
Production, Transportation and Moving Occupations
The most common Production, Transportation and Moving occupations in La Barge are , and Transportation (12 | 10.8%).
Production, Transportation and Moving Occupations by Sex
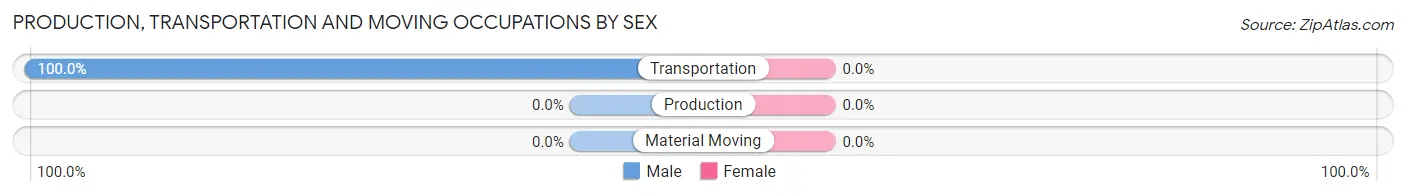
| Occupation | Male | Female |
| Production | 0 (0.0%) | 0 (0.0%) |
| Transportation | 12 (100.0%) | 0 (0.0%) |
| Material Moving | 0 (0.0%) | 0 (0.0%) |
| Total (Category) | 12 (100.0%) | 0 (0.0%) |
| Total (Overall) | 65 (58.6%) | 46 (41.4%) |
Employment Industries by Sex in La Barge
Employment Industries in La Barge
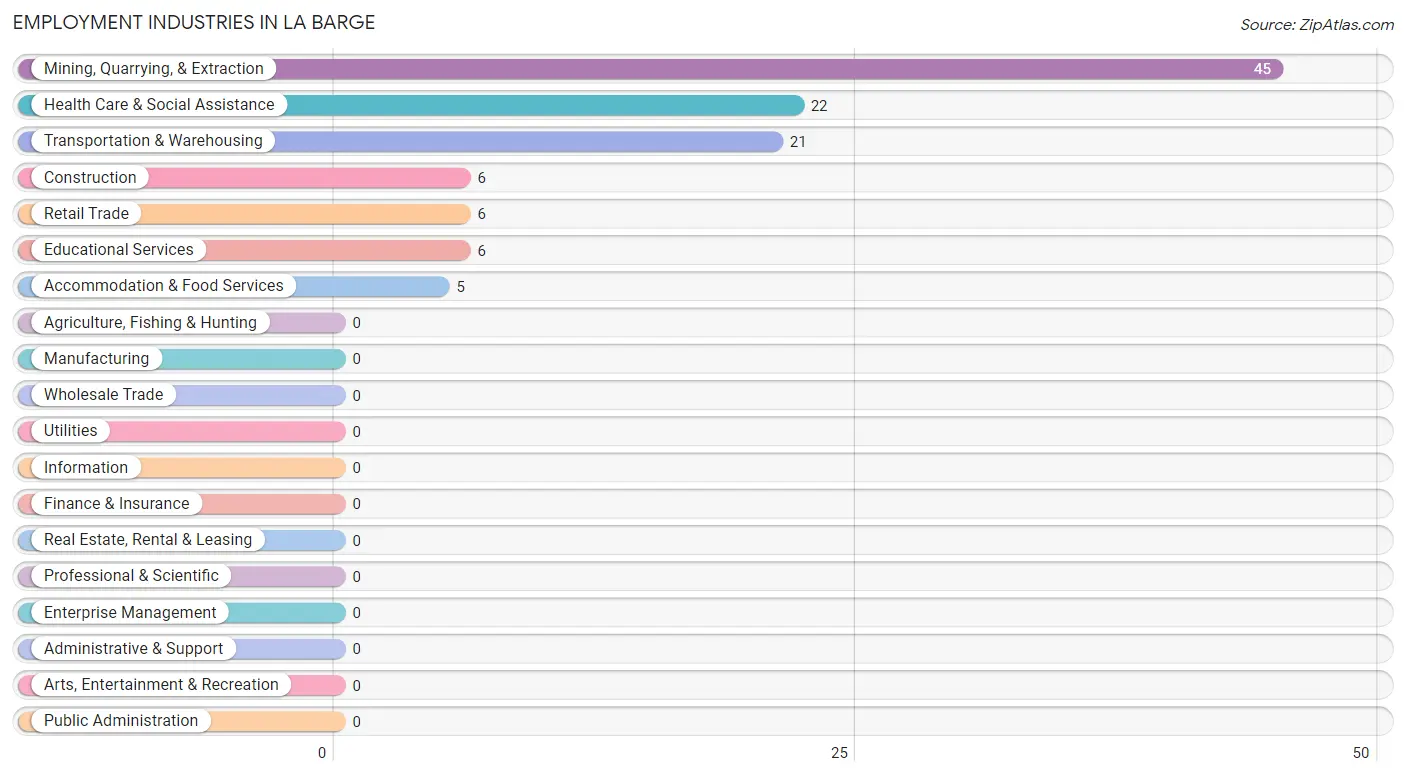
The major employment industries in La Barge include Mining, Quarrying, & Extraction (45 | 40.5%), Health Care & Social Assistance (22 | 19.8%), Transportation & Warehousing (21 | 18.9%), Construction (6 | 5.4%), and Retail Trade (6 | 5.4%).
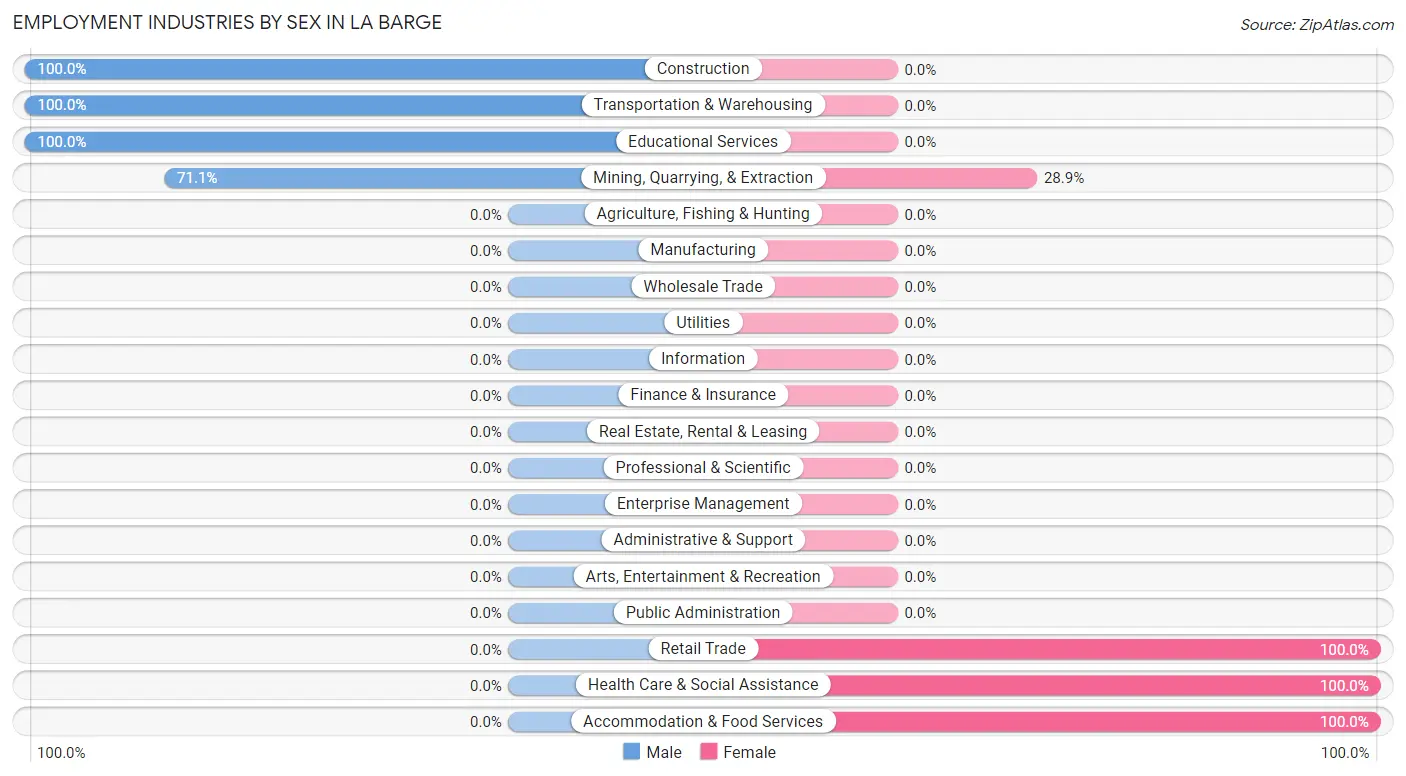
Employment Industries by Sex in La Barge
The La Barge industries that see more men than women are Construction (100.0%), Transportation & Warehousing (100.0%), and Educational Services (100.0%), whereas the industries that tend to have a higher number of women are Retail Trade (100.0%), Health Care & Social Assistance (100.0%), and Accommodation & Food Services (100.0%).
| Industry | Male | Female |
| Agriculture, Fishing & Hunting | 0 (0.0%) | 0 (0.0%) |
| Mining, Quarrying, & Extraction | 32 (71.1%) | 13 (28.9%) |
| Construction | 6 (100.0%) | 0 (0.0%) |
| Manufacturing | 0 (0.0%) | 0 (0.0%) |
| Wholesale Trade | 0 (0.0%) | 0 (0.0%) |
| Retail Trade | 0 (0.0%) | 6 (100.0%) |
| Transportation & Warehousing | 21 (100.0%) | 0 (0.0%) |
| Utilities | 0 (0.0%) | 0 (0.0%) |
| Information | 0 (0.0%) | 0 (0.0%) |
| Finance & Insurance | 0 (0.0%) | 0 (0.0%) |
| Real Estate, Rental & Leasing | 0 (0.0%) | 0 (0.0%) |
| Professional & Scientific | 0 (0.0%) | 0 (0.0%) |
| Enterprise Management | 0 (0.0%) | 0 (0.0%) |
| Administrative & Support | 0 (0.0%) | 0 (0.0%) |
| Educational Services | 6 (100.0%) | 0 (0.0%) |
| Health Care & Social Assistance | 0 (0.0%) | 22 (100.0%) |
| Arts, Entertainment & Recreation | 0 (0.0%) | 0 (0.0%) |
| Accommodation & Food Services | 0 (0.0%) | 5 (100.0%) |
| Public Administration | 0 (0.0%) | 0 (0.0%) |
| Total | 65 (58.6%) | 46 (41.4%) |
Education in La Barge
School Enrollment in La Barge
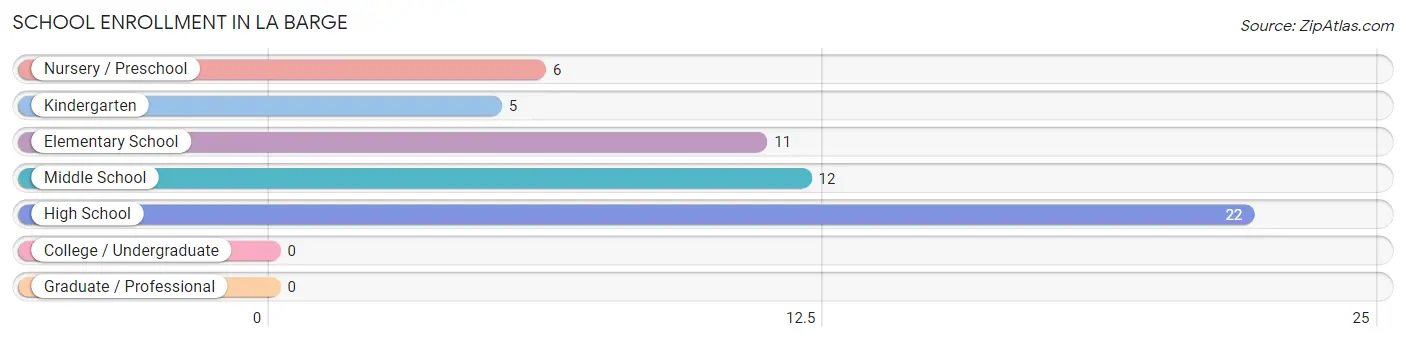
The most common levels of schooling among the 56 students in La Barge are high school (22 | 39.3%), middle school (12 | 21.4%), and elementary school (11 | 19.6%).
| School Level | # Students | % Students |
| Nursery / Preschool | 6 | 10.7% |
| Kindergarten | 5 | 8.9% |
| Elementary School | 11 | 19.6% |
| Middle School | 12 | 21.4% |
| High School | 22 | 39.3% |
| College / Undergraduate | 0 | 0.0% |
| Graduate / Professional | 0 | 0.0% |
| Total | 56 | 100.0% |
School Enrollment by Age by Funding Source in La Barge
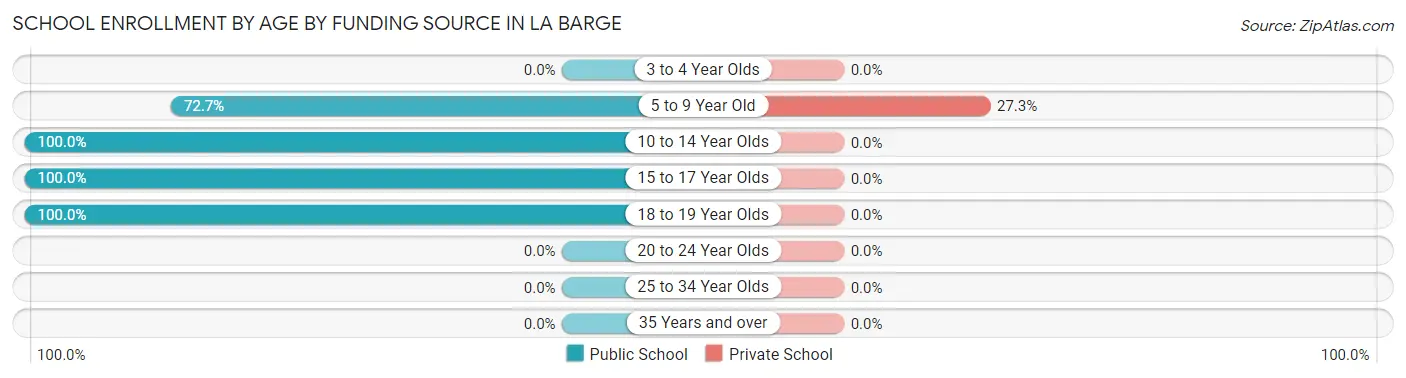
Out of a total of 56 students who are enrolled in schools in La Barge, 6 (10.7%) attend a private institution, while the remaining 50 (89.3%) are enrolled in public schools. The age group of 5 to 9 year old has the highest likelihood of being enrolled in private schools, with 6 (27.3% in the age bracket) enrolled. Conversely, the age group of 10 to 14 year olds has the lowest likelihood of being enrolled in a private school, with 11 (100.0% in the age bracket) attending a public institution.
| Age Bracket | Public School | Private School |
| 3 to 4 Year Olds | 0 (0.0%) | 0 (0.0%) |
| 5 to 9 Year Old | 16 (72.7%) | 6 (27.3%) |
| 10 to 14 Year Olds | 11 (100.0%) | 0 (0.0%) |
| 15 to 17 Year Olds | 11 (100.0%) | 0 (0.0%) |
| 18 to 19 Year Olds | 12 (100.0%) | 0 (0.0%) |
| 20 to 24 Year Olds | 0 (0.0%) | 0 (0.0%) |
| 25 to 34 Year Olds | 0 (0.0%) | 0 (0.0%) |
| 35 Years and over | 0 (0.0%) | 0 (0.0%) |
| Total | 50 (89.3%) | 6 (10.7%) |
Educational Attainment by Field of Study in La Barge
Education (10 | 27.8%), engineering (8 | 22.2%), liberal arts & history (8 | 22.2%), visual & performing arts (6 | 16.7%), and business (4 | 11.1%) are the most common fields of study among 36 individuals in La Barge who have obtained a bachelor's degree or higher.
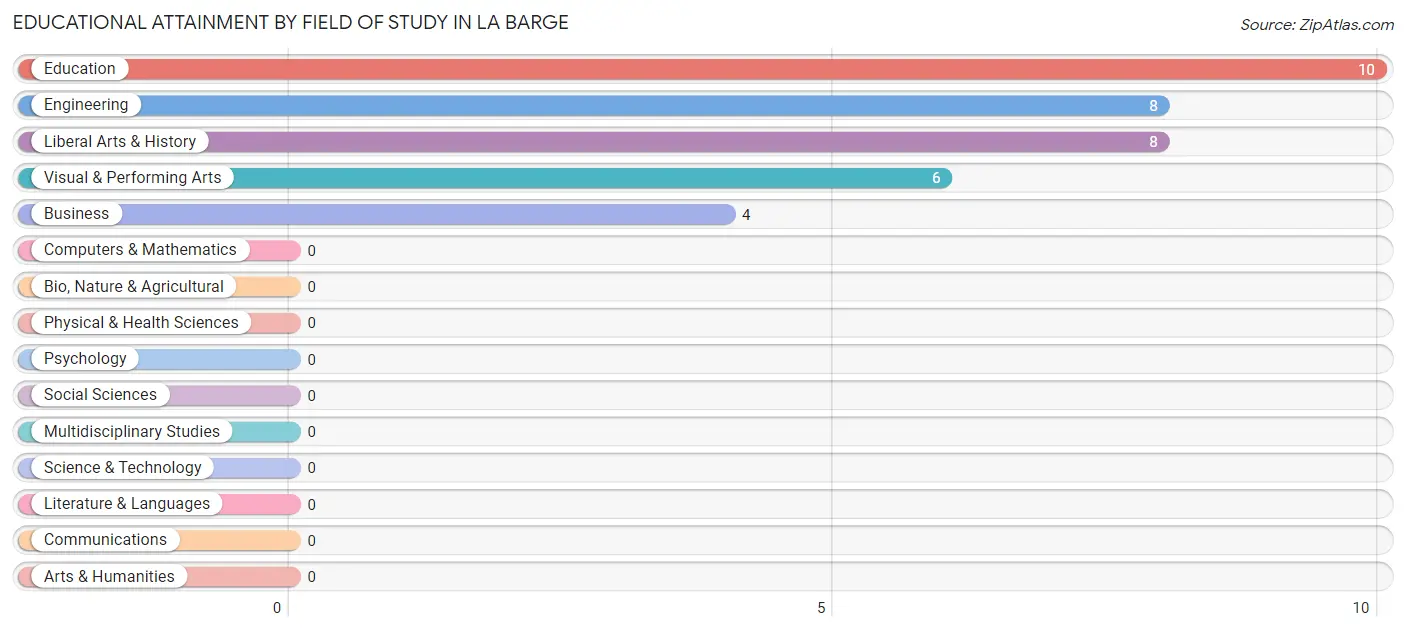
| Field of Study | # Graduates | % Graduates |
| Computers & Mathematics | 0 | 0.0% |
| Bio, Nature & Agricultural | 0 | 0.0% |
| Physical & Health Sciences | 0 | 0.0% |
| Psychology | 0 | 0.0% |
| Social Sciences | 0 | 0.0% |
| Engineering | 8 | 22.2% |
| Multidisciplinary Studies | 0 | 0.0% |
| Science & Technology | 0 | 0.0% |
| Business | 4 | 11.1% |
| Education | 10 | 27.8% |
| Literature & Languages | 0 | 0.0% |
| Liberal Arts & History | 8 | 22.2% |
| Visual & Performing Arts | 6 | 16.7% |
| Communications | 0 | 0.0% |
| Arts & Humanities | 0 | 0.0% |
| Total | 36 | 100.0% |
Transportation & Commute in La Barge
Vehicle Availability by Sex in La Barge
The most prevalent vehicle ownership categories in La Barge are males with 3 vehicles (23, accounting for 35.4%) and females with 3 vehicles (10, making up 50.0%).
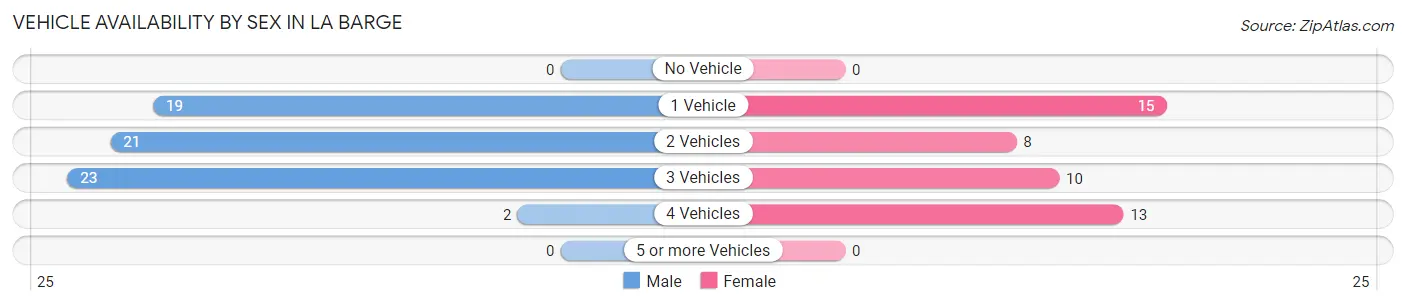
| Vehicles Available | Male | Female |
| No Vehicle | 0 (0.0%) | 0 (0.0%) |
| 1 Vehicle | 19 (29.2%) | 15 (32.6%) |
| 2 Vehicles | 21 (32.3%) | 8 (17.4%) |
| 3 Vehicles | 23 (35.4%) | 10 (21.7%) |
| 4 Vehicles | 2 (3.1%) | 13 (28.3%) |
| 5 or more Vehicles | 0 (0.0%) | 0 (0.0%) |
| Total | 65 (100.0%) | 46 (100.0%) |
Commute Time in La Barge
The most frequently occuring commute durations in La Barge are less than 5 minutes (40 commuters, 40.4%), 5 to 9 minutes (15 commuters, 15.1%), and 20 to 24 minutes (15 commuters, 15.1%).
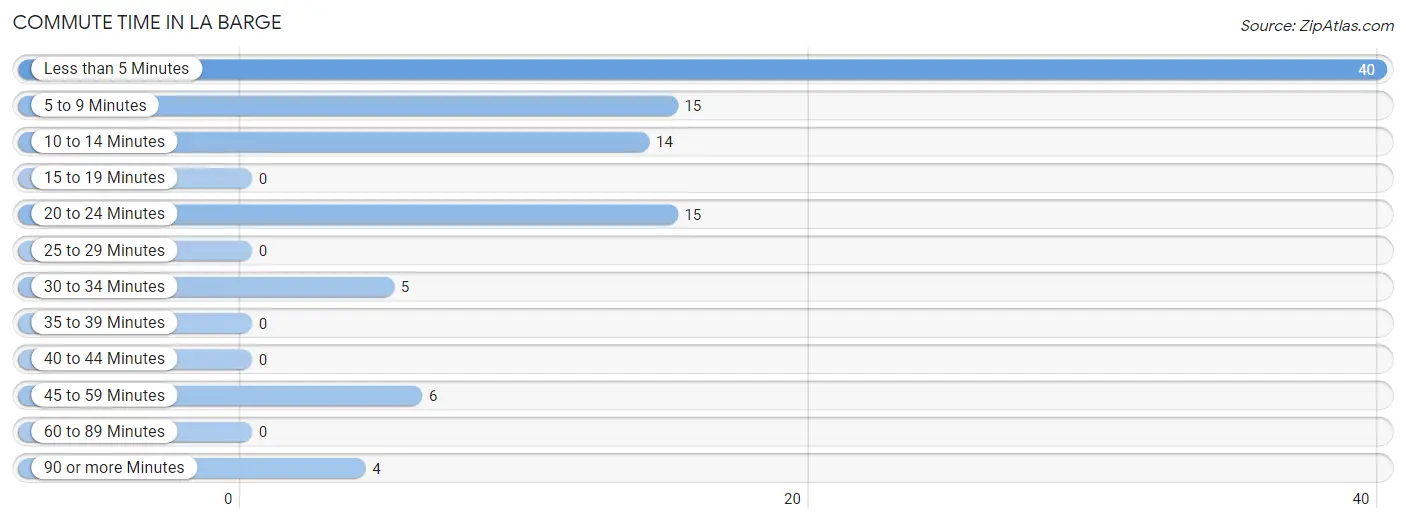
| Commute Time | # Commuters | % Commuters |
| Less than 5 Minutes | 40 | 40.4% |
| 5 to 9 Minutes | 15 | 15.1% |
| 10 to 14 Minutes | 14 | 14.1% |
| 15 to 19 Minutes | 0 | 0.0% |
| 20 to 24 Minutes | 15 | 15.1% |
| 25 to 29 Minutes | 0 | 0.0% |
| 30 to 34 Minutes | 5 | 5.1% |
| 35 to 39 Minutes | 0 | 0.0% |
| 40 to 44 Minutes | 0 | 0.0% |
| 45 to 59 Minutes | 6 | 6.1% |
| 60 to 89 Minutes | 0 | 0.0% |
| 90 or more Minutes | 4 | 4.0% |
Commute Time by Sex in La Barge
The most common commute times in La Barge are less than 5 minutes (26 commuters, 40.0%) for males and less than 5 minutes (14 commuters, 41.2%) for females.
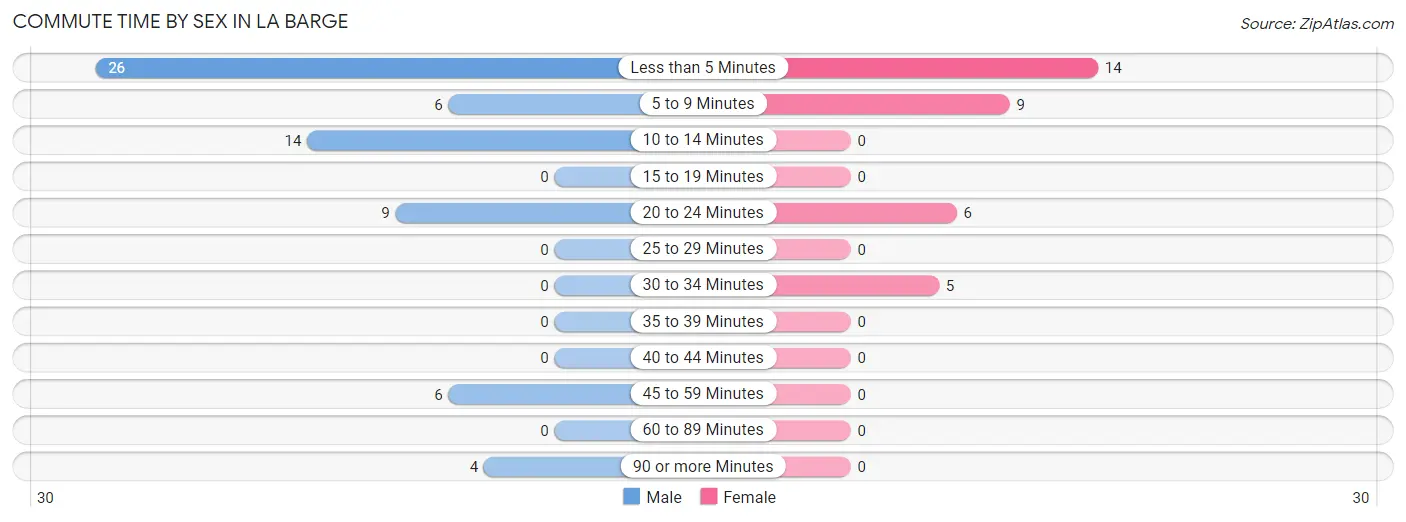
| Commute Time | Male | Female |
| Less than 5 Minutes | 26 (40.0%) | 14 (41.2%) |
| 5 to 9 Minutes | 6 (9.2%) | 9 (26.5%) |
| 10 to 14 Minutes | 14 (21.5%) | 0 (0.0%) |
| 15 to 19 Minutes | 0 (0.0%) | 0 (0.0%) |
| 20 to 24 Minutes | 9 (13.9%) | 6 (17.6%) |
| 25 to 29 Minutes | 0 (0.0%) | 0 (0.0%) |
| 30 to 34 Minutes | 0 (0.0%) | 5 (14.7%) |
| 35 to 39 Minutes | 0 (0.0%) | 0 (0.0%) |
| 40 to 44 Minutes | 0 (0.0%) | 0 (0.0%) |
| 45 to 59 Minutes | 6 (9.2%) | 0 (0.0%) |
| 60 to 89 Minutes | 0 (0.0%) | 0 (0.0%) |
| 90 or more Minutes | 4 (6.1%) | 0 (0.0%) |
Time of Departure to Work by Sex in La Barge
The most frequent times of departure to work in La Barge are 6:30 AM to 6:59 AM (28, 43.1%) for males and 9:00 AM to 9:59 AM (9, 26.5%) for females.
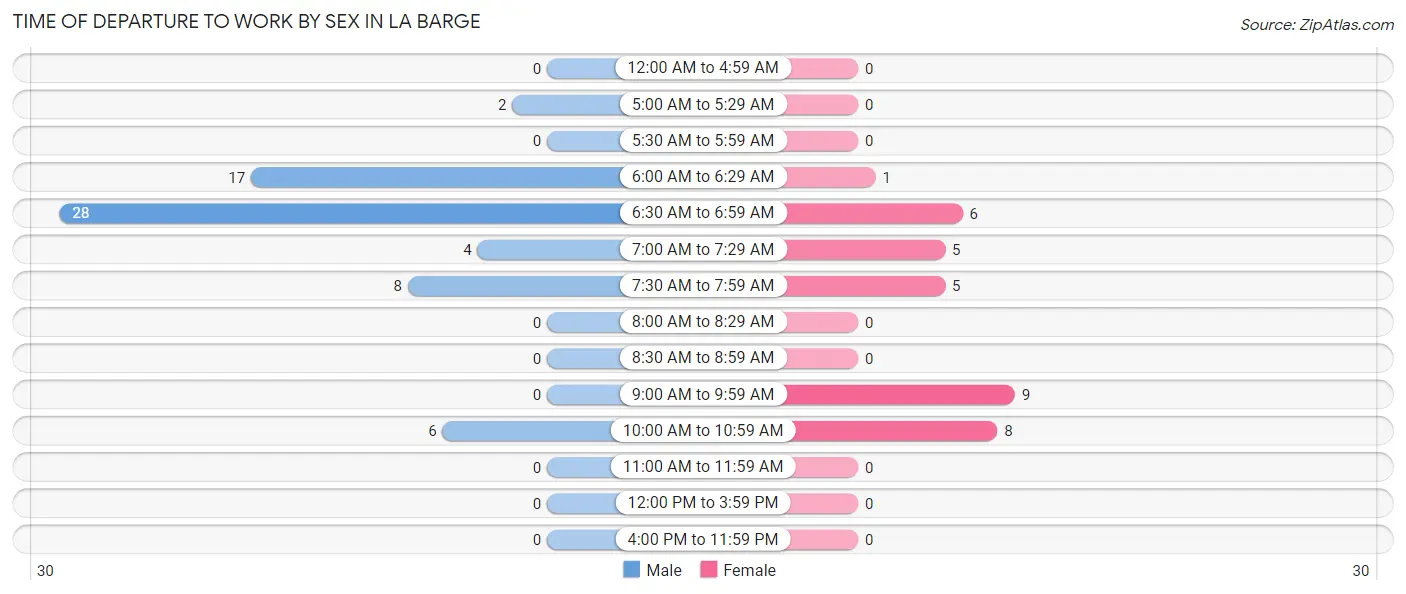
| Time of Departure | Male | Female |
| 12:00 AM to 4:59 AM | 0 (0.0%) | 0 (0.0%) |
| 5:00 AM to 5:29 AM | 2 (3.1%) | 0 (0.0%) |
| 5:30 AM to 5:59 AM | 0 (0.0%) | 0 (0.0%) |
| 6:00 AM to 6:29 AM | 17 (26.2%) | 1 (2.9%) |
| 6:30 AM to 6:59 AM | 28 (43.1%) | 6 (17.6%) |
| 7:00 AM to 7:29 AM | 4 (6.1%) | 5 (14.7%) |
| 7:30 AM to 7:59 AM | 8 (12.3%) | 5 (14.7%) |
| 8:00 AM to 8:29 AM | 0 (0.0%) | 0 (0.0%) |
| 8:30 AM to 8:59 AM | 0 (0.0%) | 0 (0.0%) |
| 9:00 AM to 9:59 AM | 0 (0.0%) | 9 (26.5%) |
| 10:00 AM to 10:59 AM | 6 (9.2%) | 8 (23.5%) |
| 11:00 AM to 11:59 AM | 0 (0.0%) | 0 (0.0%) |
| 12:00 PM to 3:59 PM | 0 (0.0%) | 0 (0.0%) |
| 4:00 PM to 11:59 PM | 0 (0.0%) | 0 (0.0%) |
| Total | 65 (100.0%) | 34 (100.0%) |
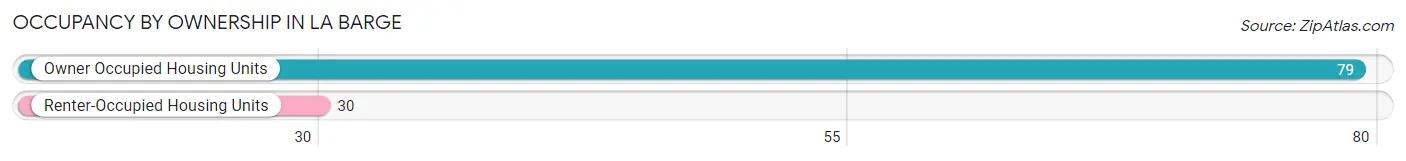
Housing Occupancy in La Barge
Occupancy by Ownership in La Barge
Of the total 109 dwellings in La Barge, owner-occupied units account for 79 (72.5%), while renter-occupied units make up 30 (27.5%).
| Occupancy | # Housing Units | % Housing Units |
| Owner Occupied Housing Units | 79 | 72.5% |
| Renter-Occupied Housing Units | 30 | 27.5% |
| Total Occupied Housing Units | 109 | 100.0% |
Occupancy by Household Size in La Barge
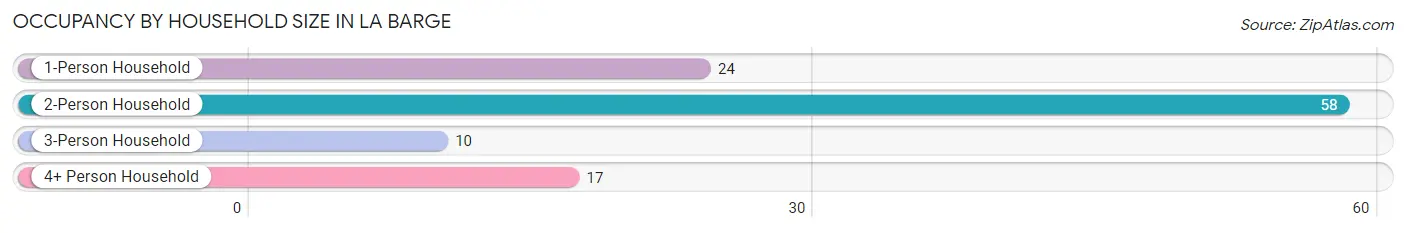
| Household Size | # Housing Units | % Housing Units |
| 1-Person Household | 24 | 22.0% |
| 2-Person Household | 58 | 53.2% |
| 3-Person Household | 10 | 9.2% |
| 4+ Person Household | 17 | 15.6% |
| Total Housing Units | 109 | 100.0% |
Occupancy by Ownership by Household Size in La Barge
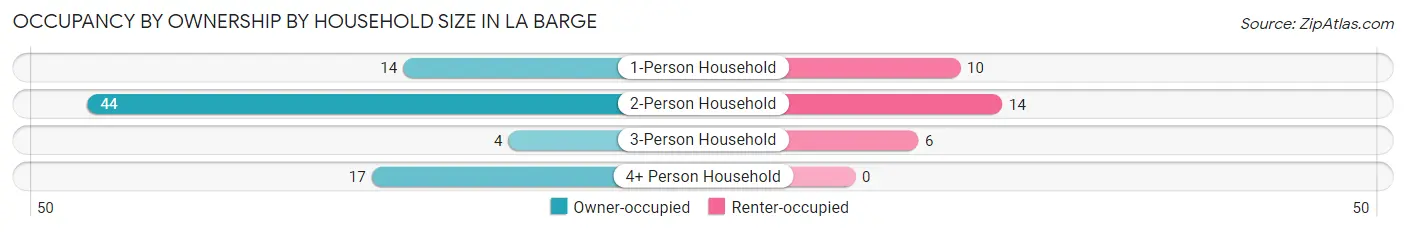
| Household Size | Owner-occupied | Renter-occupied |
| 1-Person Household | 14 (58.3%) | 10 (41.7%) |
| 2-Person Household | 44 (75.9%) | 14 (24.1%) |
| 3-Person Household | 4 (40.0%) | 6 (60.0%) |
| 4+ Person Household | 17 (100.0%) | 0 (0.0%) |
| Total Housing Units | 79 (72.5%) | 30 (27.5%) |
Occupancy by Educational Attainment in La Barge
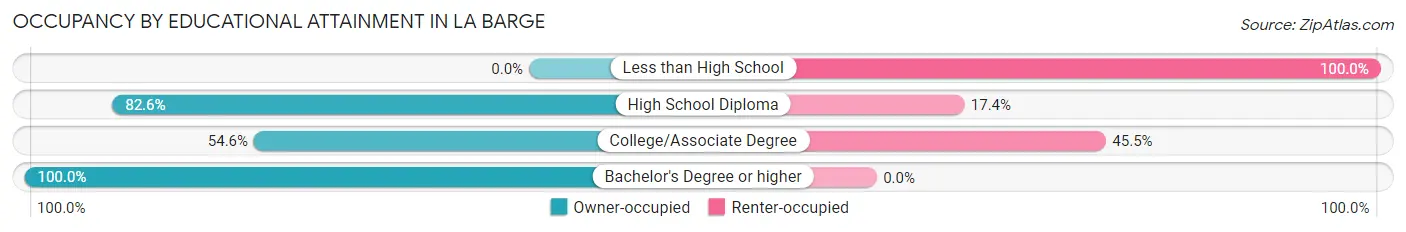
| Household Size | Owner-occupied | Renter-occupied |
| Less than High School | 0 (0.0%) | 6 (100.0%) |
| High School Diploma | 19 (82.6%) | 4 (17.4%) |
| College/Associate Degree | 24 (54.5%) | 20 (45.5%) |
| Bachelor's Degree or higher | 36 (100.0%) | 0 (0.0%) |
Occupancy by Age of Householder in La Barge
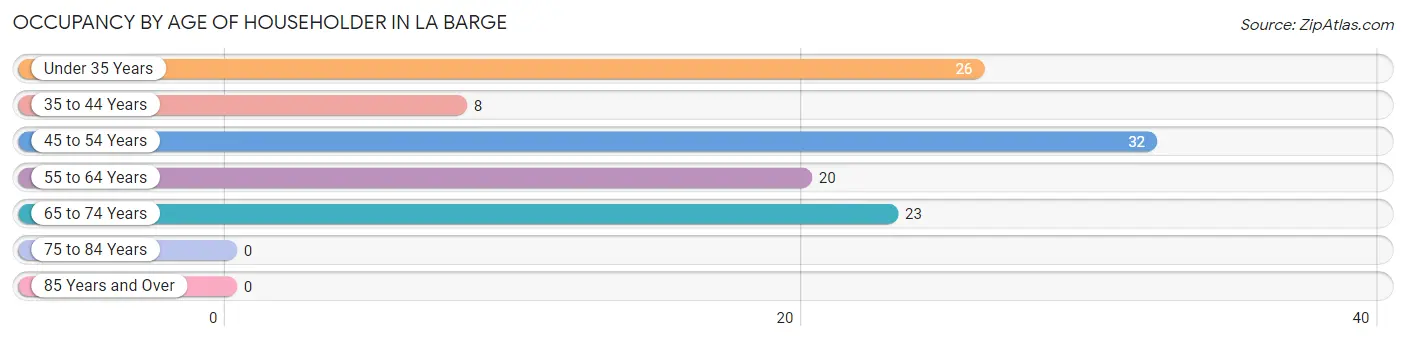
| Age Bracket | # Households | % Households |
| Under 35 Years | 26 | 23.8% |
| 35 to 44 Years | 8 | 7.3% |
| 45 to 54 Years | 32 | 29.4% |
| 55 to 64 Years | 20 | 18.3% |
| 65 to 74 Years | 23 | 21.1% |
| 75 to 84 Years | 0 | 0.0% |
| 85 Years and Over | 0 | 0.0% |
| Total | 109 | 100.0% |
Housing Finances in La Barge
Median Income by Occupancy in La Barge
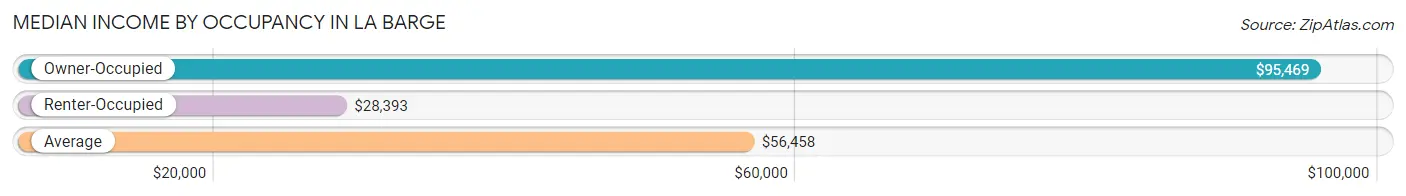
| Occupancy Type | # Households | Median Income |
| Owner-Occupied | 79 (72.5%) | $95,469 |
| Renter-Occupied | 30 (27.5%) | $28,393 |
| Average | 109 (100.0%) | $56,458 |
Occupancy by Householder Income Bracket in La Barge
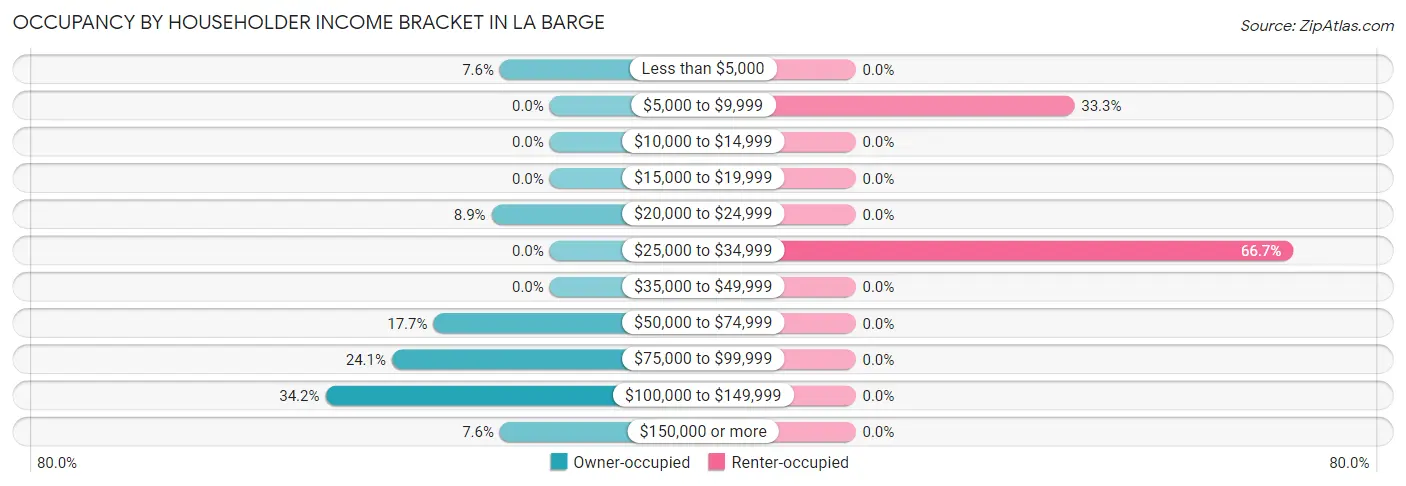
| Income Bracket | Owner-occupied | Renter-occupied |
| Less than $5,000 | 6 (7.6%) | 0 (0.0%) |
| $5,000 to $9,999 | 0 (0.0%) | 10 (33.3%) |
| $10,000 to $14,999 | 0 (0.0%) | 0 (0.0%) |
| $15,000 to $19,999 | 0 (0.0%) | 0 (0.0%) |
| $20,000 to $24,999 | 7 (8.9%) | 0 (0.0%) |
| $25,000 to $34,999 | 0 (0.0%) | 20 (66.7%) |
| $35,000 to $49,999 | 0 (0.0%) | 0 (0.0%) |
| $50,000 to $74,999 | 14 (17.7%) | 0 (0.0%) |
| $75,000 to $99,999 | 19 (24.0%) | 0 (0.0%) |
| $100,000 to $149,999 | 27 (34.2%) | 0 (0.0%) |
| $150,000 or more | 6 (7.6%) | 0 (0.0%) |
| Total | 79 (100.0%) | 30 (100.0%) |
Monthly Housing Cost Tiers in La Barge
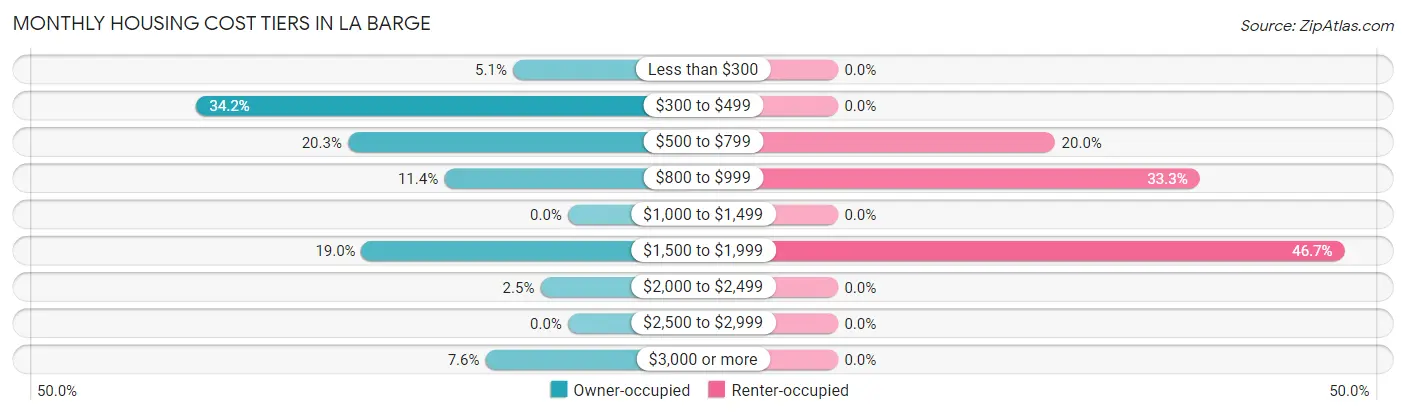
| Monthly Cost | Owner-occupied | Renter-occupied |
| Less than $300 | 4 (5.1%) | 0 (0.0%) |
| $300 to $499 | 27 (34.2%) | 0 (0.0%) |
| $500 to $799 | 16 (20.3%) | 6 (20.0%) |
| $800 to $999 | 9 (11.4%) | 10 (33.3%) |
| $1,000 to $1,499 | 0 (0.0%) | 0 (0.0%) |
| $1,500 to $1,999 | 15 (19.0%) | 14 (46.7%) |
| $2,000 to $2,499 | 2 (2.5%) | 0 (0.0%) |
| $2,500 to $2,999 | 0 (0.0%) | 0 (0.0%) |
| $3,000 or more | 6 (7.6%) | 0 (0.0%) |
| Total | 79 (100.0%) | 30 (100.0%) |
Physical Housing Characteristics in La Barge
Housing Structures in La Barge
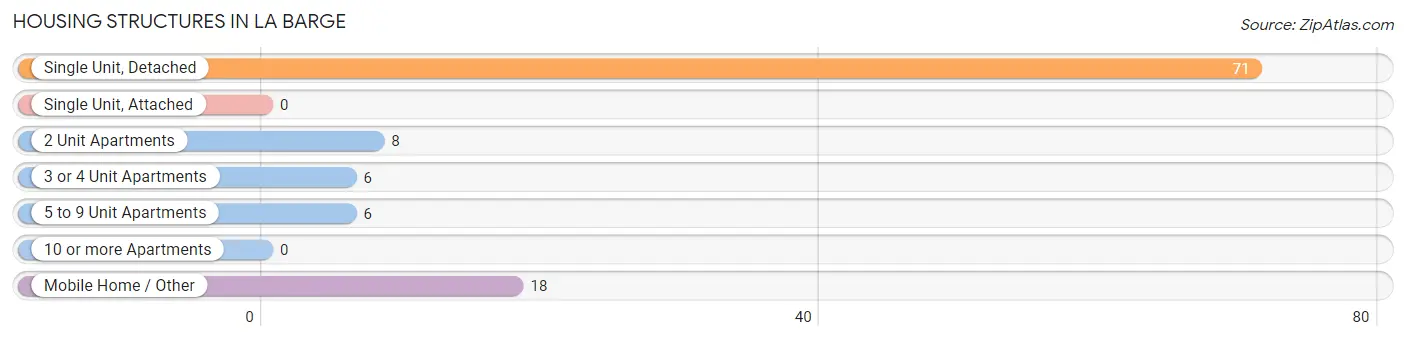
| Structure Type | # Housing Units | % Housing Units |
| Single Unit, Detached | 71 | 65.1% |
| Single Unit, Attached | 0 | 0.0% |
| 2 Unit Apartments | 8 | 7.3% |
| 3 or 4 Unit Apartments | 6 | 5.5% |
| 5 to 9 Unit Apartments | 6 | 5.5% |
| 10 or more Apartments | 0 | 0.0% |
| Mobile Home / Other | 18 | 16.5% |
| Total | 109 | 100.0% |
Housing Structures by Occupancy in La Barge
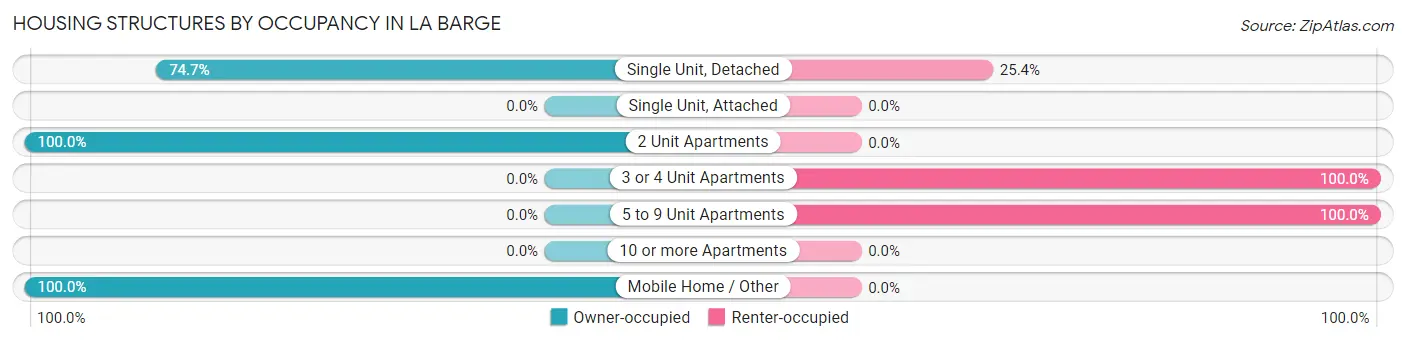
| Structure Type | Owner-occupied | Renter-occupied |
| Single Unit, Detached | 53 (74.7%) | 18 (25.4%) |
| Single Unit, Attached | 0 (0.0%) | 0 (0.0%) |
| 2 Unit Apartments | 8 (100.0%) | 0 (0.0%) |
| 3 or 4 Unit Apartments | 0 (0.0%) | 6 (100.0%) |
| 5 to 9 Unit Apartments | 0 (0.0%) | 6 (100.0%) |
| 10 or more Apartments | 0 (0.0%) | 0 (0.0%) |
| Mobile Home / Other | 18 (100.0%) | 0 (0.0%) |
| Total | 79 (72.5%) | 30 (27.5%) |
Housing Structures by Number of Rooms in La Barge
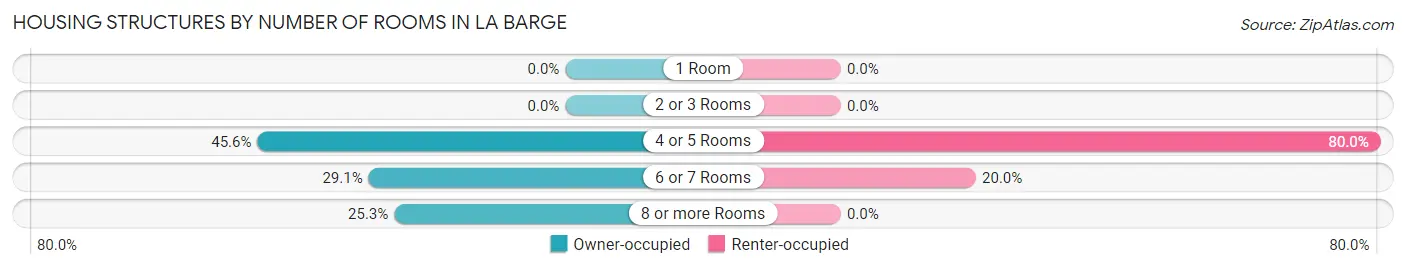
| Number of Rooms | Owner-occupied | Renter-occupied |
| 1 Room | 0 (0.0%) | 0 (0.0%) |
| 2 or 3 Rooms | 0 (0.0%) | 0 (0.0%) |
| 4 or 5 Rooms | 36 (45.6%) | 24 (80.0%) |
| 6 or 7 Rooms | 23 (29.1%) | 6 (20.0%) |
| 8 or more Rooms | 20 (25.3%) | 0 (0.0%) |
| Total | 79 (100.0%) | 30 (100.0%) |
Housing Structure by Heating Type in La Barge
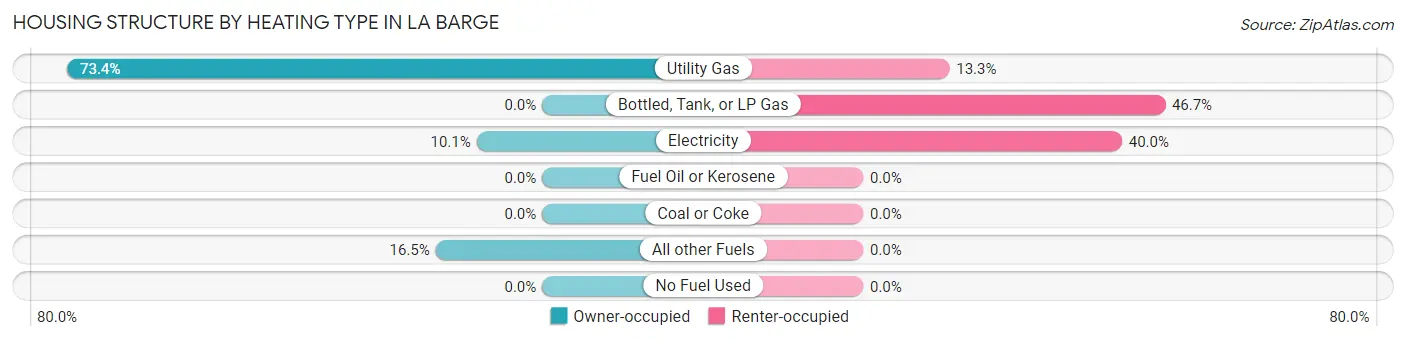
| Heating Type | Owner-occupied | Renter-occupied |
| Utility Gas | 58 (73.4%) | 4 (13.3%) |
| Bottled, Tank, or LP Gas | 0 (0.0%) | 14 (46.7%) |
| Electricity | 8 (10.1%) | 12 (40.0%) |
| Fuel Oil or Kerosene | 0 (0.0%) | 0 (0.0%) |
| Coal or Coke | 0 (0.0%) | 0 (0.0%) |
| All other Fuels | 13 (16.5%) | 0 (0.0%) |
| No Fuel Used | 0 (0.0%) | 0 (0.0%) |
| Total | 79 (100.0%) | 30 (100.0%) |
Household Vehicle Usage in La Barge
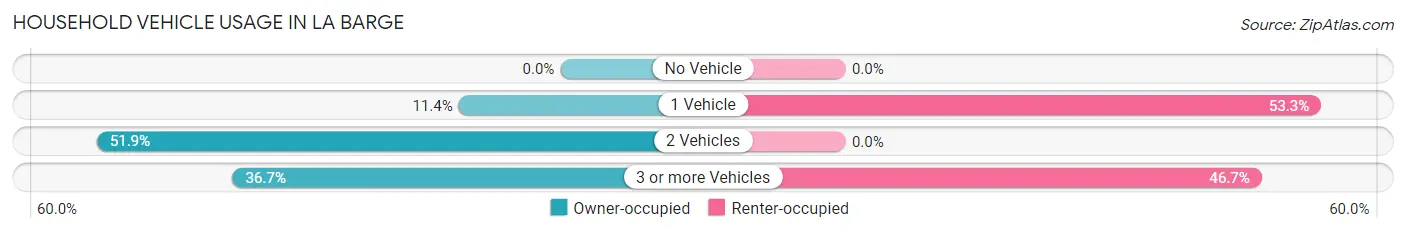
| Vehicles per Household | Owner-occupied | Renter-occupied |
| No Vehicle | 0 (0.0%) | 0 (0.0%) |
| 1 Vehicle | 9 (11.4%) | 16 (53.3%) |
| 2 Vehicles | 41 (51.9%) | 0 (0.0%) |
| 3 or more Vehicles | 29 (36.7%) | 14 (46.7%) |
| Total | 79 (100.0%) | 30 (100.0%) |
Real Estate & Mortgages in La Barge
Real Estate and Mortgage Overview in La Barge
| Characteristic | Without Mortgage | With Mortgage |
| Housing Units | 47 | 32 |
| Median Property Value | $212,500 | $0 |
| Median Household Income | $75,781 | $6 |
| Monthly Housing Costs | $398 | $6 |
| Real Estate Taxes | $1,530 | $0 |
Property Value by Mortgage Status in La Barge
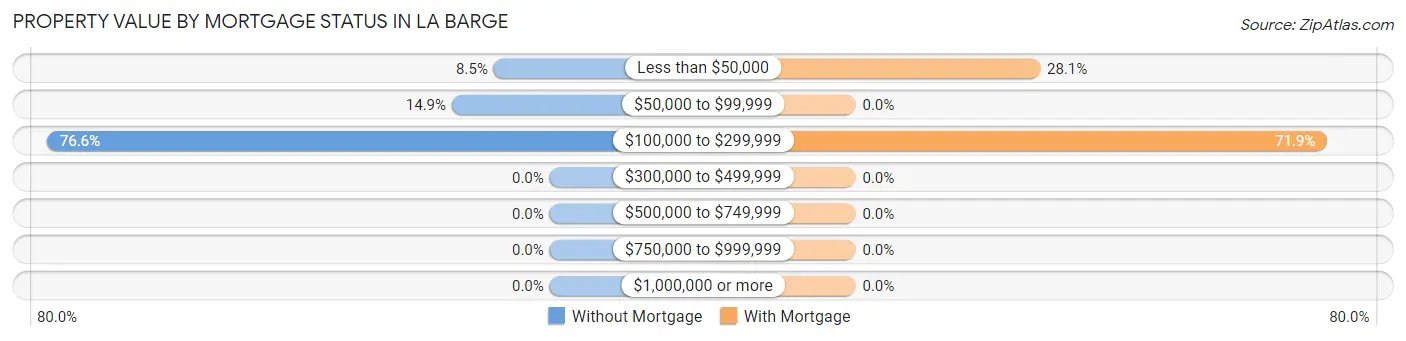
| Property Value | Without Mortgage | With Mortgage |
| Less than $50,000 | 4 (8.5%) | 9 (28.1%) |
| $50,000 to $99,999 | 7 (14.9%) | 0 (0.0%) |
| $100,000 to $299,999 | 36 (76.6%) | 23 (71.9%) |
| $300,000 to $499,999 | 0 (0.0%) | 0 (0.0%) |
| $500,000 to $749,999 | 0 (0.0%) | 0 (0.0%) |
| $750,000 to $999,999 | 0 (0.0%) | 0 (0.0%) |
| $1,000,000 or more | 0 (0.0%) | 0 (0.0%) |
| Total | 47 (100.0%) | 32 (100.0%) |
Household Income by Mortgage Status in La Barge
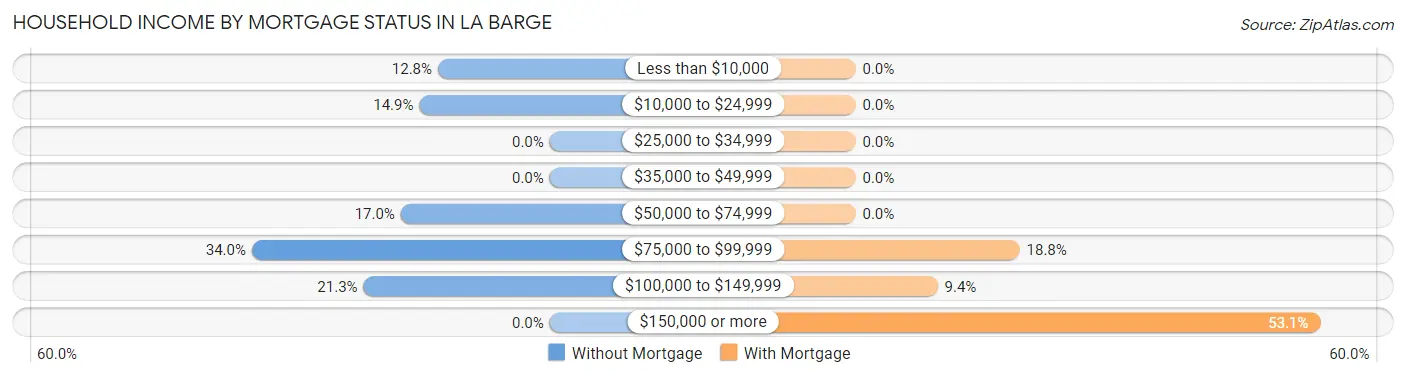
| Household Income | Without Mortgage | With Mortgage |
| Less than $10,000 | 6 (12.8%) | 0 (0.0%) |
| $10,000 to $24,999 | 7 (14.9%) | 0 (0.0%) |
| $25,000 to $34,999 | 0 (0.0%) | 0 (0.0%) |
| $35,000 to $49,999 | 0 (0.0%) | 0 (0.0%) |
| $50,000 to $74,999 | 8 (17.0%) | 0 (0.0%) |
| $75,000 to $99,999 | 16 (34.0%) | 6 (18.8%) |
| $100,000 to $149,999 | 10 (21.3%) | 3 (9.4%) |
| $150,000 or more | 0 (0.0%) | 17 (53.1%) |
| Total | 47 (100.0%) | 32 (100.0%) |
Property Value to Household Income Ratio in La Barge
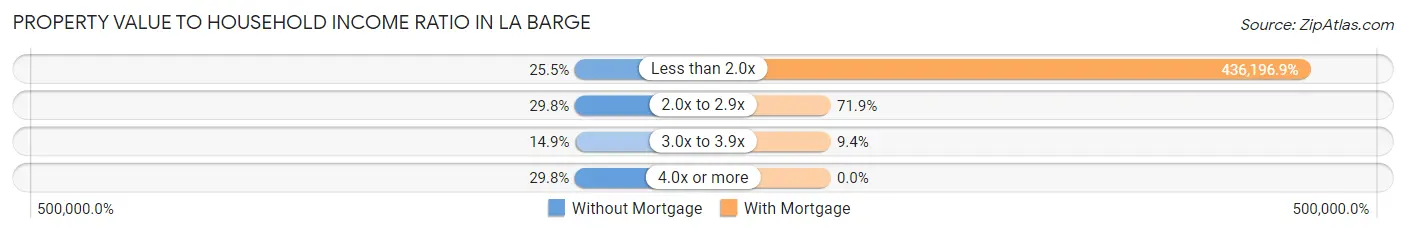
| Value-to-Income Ratio | Without Mortgage | With Mortgage |
| Less than 2.0x | 12 (25.5%) | 139,583 (436,196.9%) |
| 2.0x to 2.9x | 14 (29.8%) | 23 (71.9%) |
| 3.0x to 3.9x | 7 (14.9%) | 3 (9.4%) |
| 4.0x or more | 14 (29.8%) | 0 (0.0%) |
| Total | 47 (100.0%) | 32 (100.0%) |
Real Estate Taxes by Mortgage Status in La Barge
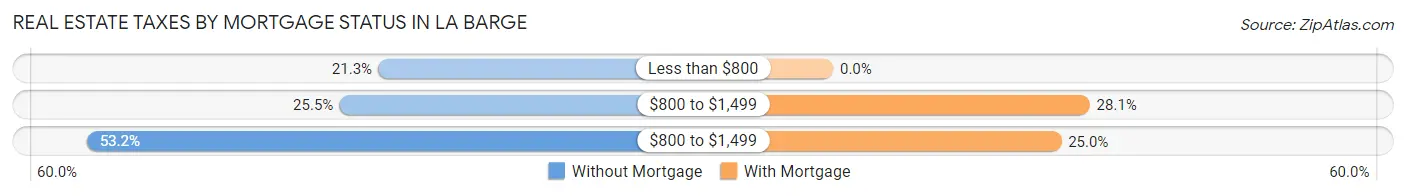
| Property Taxes | Without Mortgage | With Mortgage |
| Less than $800 | 10 (21.3%) | 0 (0.0%) |
| $800 to $1,499 | 12 (25.5%) | 9 (28.1%) |
| $800 to $1,499 | 25 (53.2%) | 8 (25.0%) |
| Total | 47 (100.0%) | 32 (100.0%) |
Health & Disability in La Barge
Health Insurance Coverage by Age in La Barge
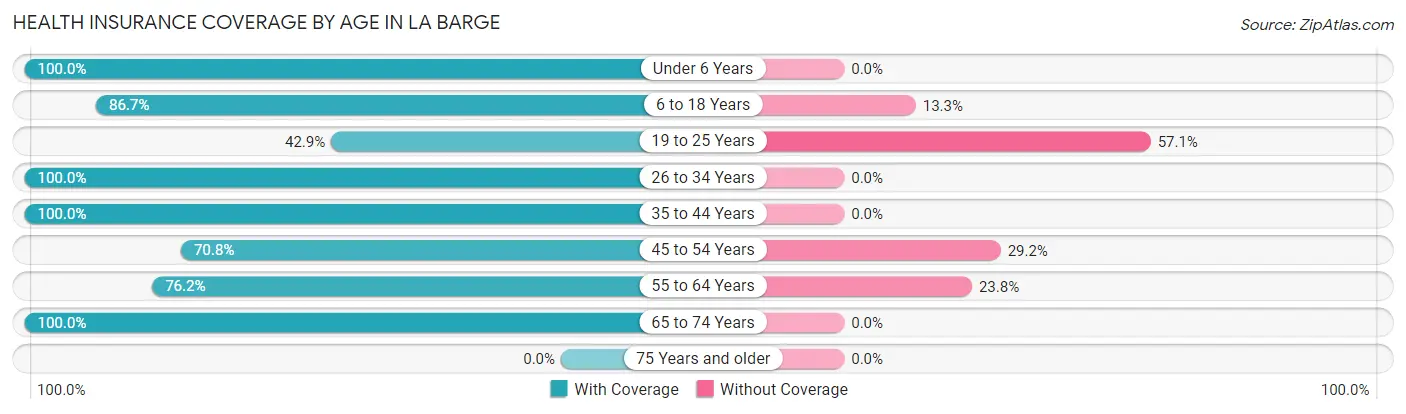
| Age Bracket | With Coverage | Without Coverage |
| Under 6 Years | 19 (100.0%) | 0 (0.0%) |
| 6 to 18 Years | 39 (86.7%) | 6 (13.3%) |
| 19 to 25 Years | 18 (42.9%) | 24 (57.1%) |
| 26 to 34 Years | 6 (100.0%) | 0 (0.0%) |
| 35 to 44 Years | 21 (100.0%) | 0 (0.0%) |
| 45 to 54 Years | 34 (70.8%) | 14 (29.2%) |
| 55 to 64 Years | 32 (76.2%) | 10 (23.8%) |
| 65 to 74 Years | 36 (100.0%) | 0 (0.0%) |
| 75 Years and older | 0 (0.0%) | 0 (0.0%) |
| Total | 205 (79.1%) | 54 (20.8%) |
Health Insurance Coverage by Citizenship Status in La Barge

| Citizenship Status | With Coverage | Without Coverage |
| Native Born | 19 (100.0%) | 0 (0.0%) |
| Foreign Born, Citizen | 39 (86.7%) | 6 (13.3%) |
| Foreign Born, not a Citizen | 18 (42.9%) | 24 (57.1%) |
Health Insurance Coverage by Household Income in La Barge
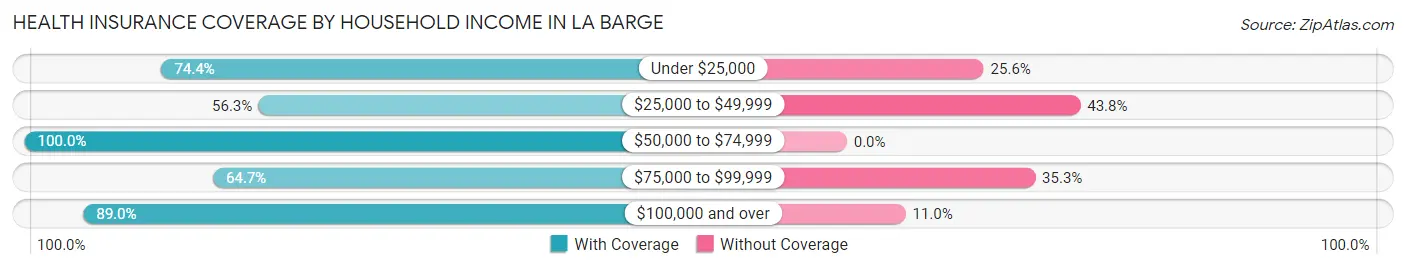
| Household Income | With Coverage | Without Coverage |
| Under $25,000 | 29 (74.4%) | 10 (25.6%) |
| $25,000 to $49,999 | 18 (56.2%) | 14 (43.8%) |
| $50,000 to $74,999 | 28 (100.0%) | 0 (0.0%) |
| $75,000 to $99,999 | 33 (64.7%) | 18 (35.3%) |
| $100,000 and over | 97 (89.0%) | 12 (11.0%) |
Public vs Private Health Insurance Coverage by Age in La Barge
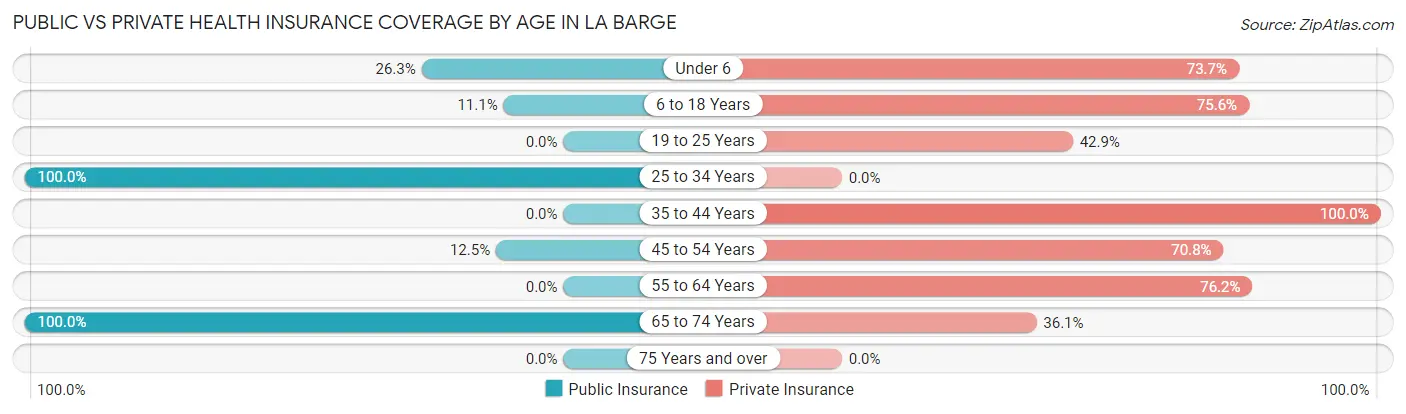
| Age Bracket | Public Insurance | Private Insurance |
| Under 6 | 5 (26.3%) | 14 (73.7%) |
| 6 to 18 Years | 5 (11.1%) | 34 (75.6%) |
| 19 to 25 Years | 0 (0.0%) | 18 (42.9%) |
| 25 to 34 Years | 6 (100.0%) | 0 (0.0%) |
| 35 to 44 Years | 0 (0.0%) | 21 (100.0%) |
| 45 to 54 Years | 6 (12.5%) | 34 (70.8%) |
| 55 to 64 Years | 0 (0.0%) | 32 (76.2%) |
| 65 to 74 Years | 36 (100.0%) | 13 (36.1%) |
| 75 Years and over | 0 (0.0%) | 0 (0.0%) |
| Total | 58 (22.4%) | 166 (64.1%) |
Disability Status by Sex by Age in La Barge
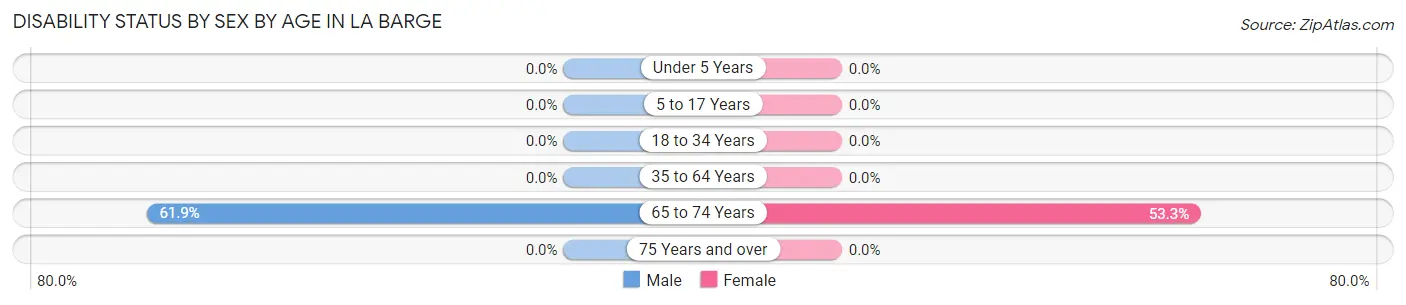
| Age Bracket | Male | Female |
| Under 5 Years | 0 (0.0%) | 0 (0.0%) |
| 5 to 17 Years | 0 (0.0%) | 0 (0.0%) |
| 18 to 34 Years | 0 (0.0%) | 0 (0.0%) |
| 35 to 64 Years | 0 (0.0%) | 0 (0.0%) |
| 65 to 74 Years | 13 (61.9%) | 8 (53.3%) |
| 75 Years and over | 0 (0.0%) | 0 (0.0%) |
Disability Class by Sex by Age in La Barge
Disability Class: Hearing Difficulty
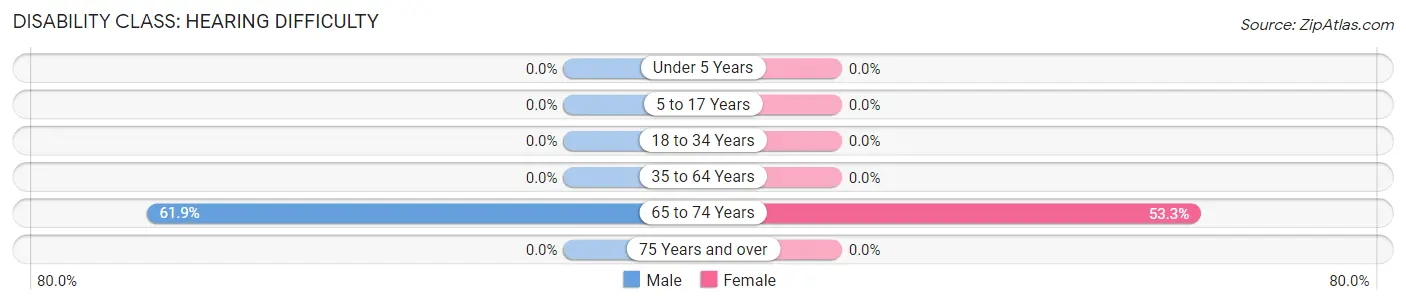
| Age Bracket | Male | Female |
| Under 5 Years | 0 (0.0%) | 0 (0.0%) |
| 5 to 17 Years | 0 (0.0%) | 0 (0.0%) |
| 18 to 34 Years | 0 (0.0%) | 0 (0.0%) |
| 35 to 64 Years | 0 (0.0%) | 0 (0.0%) |
| 65 to 74 Years | 13 (61.9%) | 8 (53.3%) |
| 75 Years and over | 0 (0.0%) | 0 (0.0%) |
Disability Class: Vision Difficulty
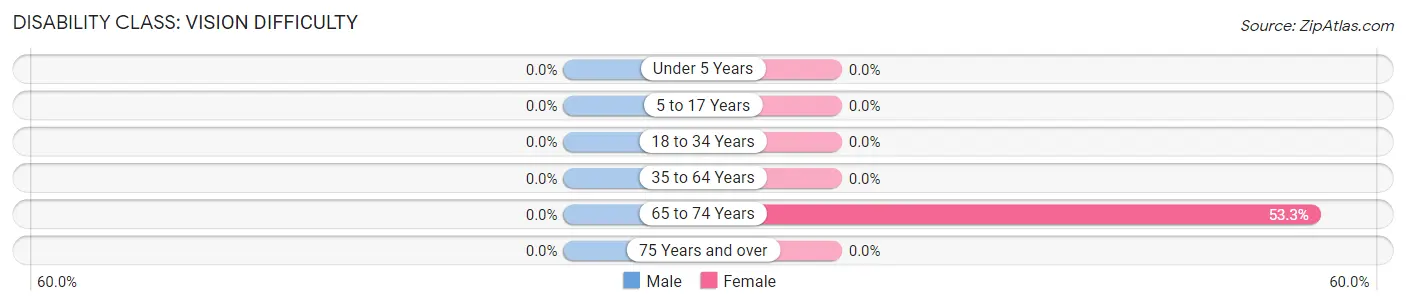
| Age Bracket | Male | Female |
| Under 5 Years | 0 (0.0%) | 0 (0.0%) |
| 5 to 17 Years | 0 (0.0%) | 0 (0.0%) |
| 18 to 34 Years | 0 (0.0%) | 0 (0.0%) |
| 35 to 64 Years | 0 (0.0%) | 0 (0.0%) |
| 65 to 74 Years | 0 (0.0%) | 8 (53.3%) |
| 75 Years and over | 0 (0.0%) | 0 (0.0%) |
Disability Class: Cognitive Difficulty
| Age Bracket | Male | Female |
| 5 to 17 Years | 0 (0.0%) | 0 (0.0%) |
| 18 to 34 Years | 0 (0.0%) | 0 (0.0%) |
| 35 to 64 Years | 0 (0.0%) | 0 (0.0%) |
| 65 to 74 Years | 0 (0.0%) | 0 (0.0%) |
| 75 Years and over | 0 (0.0%) | 0 (0.0%) |
Disability Class: Ambulatory Difficulty
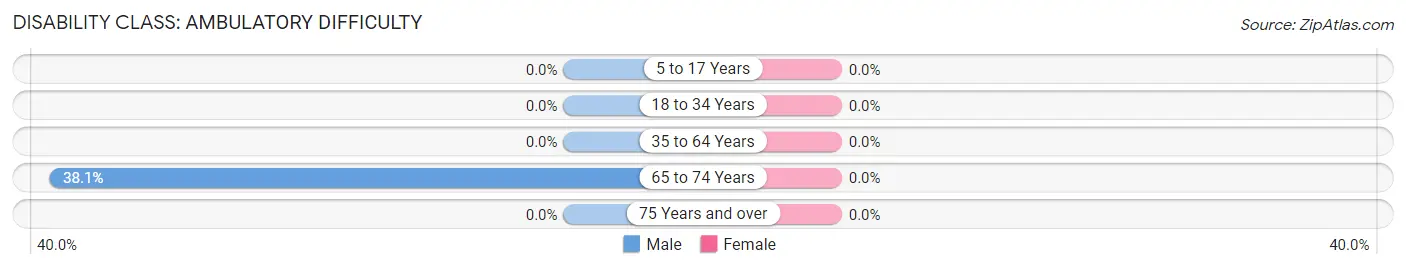
| Age Bracket | Male | Female |
| 5 to 17 Years | 0 (0.0%) | 0 (0.0%) |
| 18 to 34 Years | 0 (0.0%) | 0 (0.0%) |
| 35 to 64 Years | 0 (0.0%) | 0 (0.0%) |
| 65 to 74 Years | 8 (38.1%) | 0 (0.0%) |
| 75 Years and over | 0 (0.0%) | 0 (0.0%) |
Disability Class: Self-Care Difficulty
| Age Bracket | Male | Female |
| 5 to 17 Years | 0 (0.0%) | 0 (0.0%) |
| 18 to 34 Years | 0 (0.0%) | 0 (0.0%) |
| 35 to 64 Years | 0 (0.0%) | 0 (0.0%) |
| 65 to 74 Years | 0 (0.0%) | 0 (0.0%) |
| 75 Years and over | 0 (0.0%) | 0 (0.0%) |
Technology Access in La Barge
Computing Device Access in La Barge
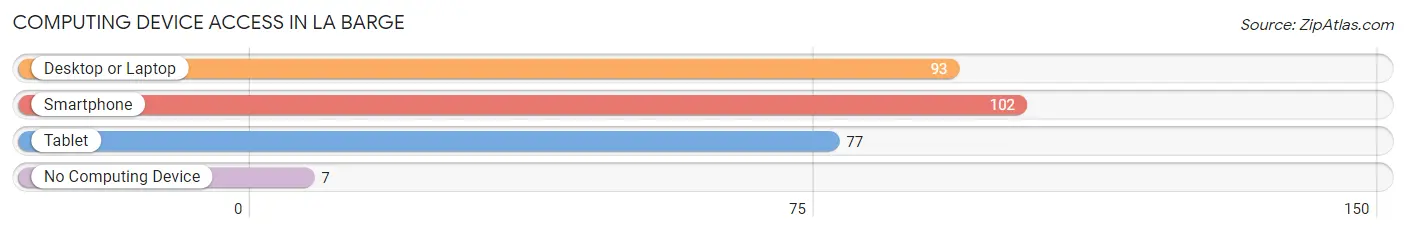
| Device Type | # Households | % Households |
| Desktop or Laptop | 93 | 85.3% |
| Smartphone | 102 | 93.6% |
| Tablet | 77 | 70.6% |
| No Computing Device | 7 | 6.4% |
| Total | 109 | 100.0% |
Internet Access in La Barge
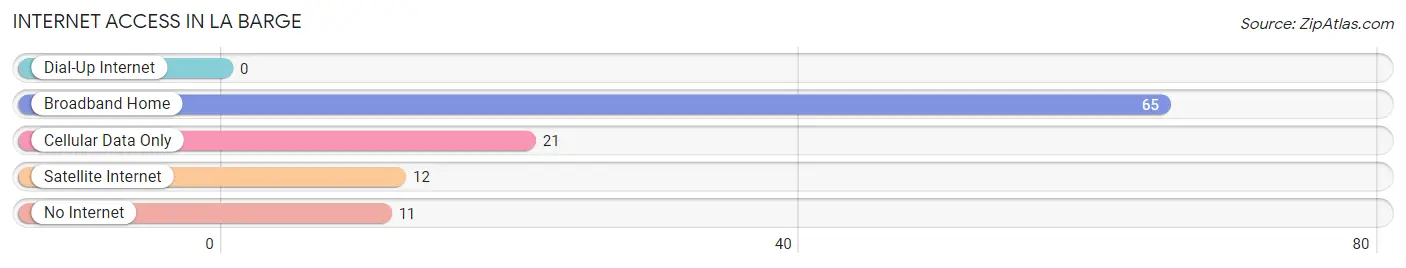
| Internet Type | # Households | % Households |
| Dial-Up Internet | 0 | 0.0% |
| Broadband Home | 65 | 59.6% |
| Cellular Data Only | 21 | 19.3% |
| Satellite Internet | 12 | 11.0% |
| No Internet | 11 | 10.1% |
| Total | 109 | 100.0% |
La Barge Summary
La Barge is a small town located in western Wyoming, in the United States. It is situated in the Upper Green River Valley, near the Wyoming-Idaho border. The town was founded in 1884 and is named after the nearby La Barge Creek. La Barge is the county seat of Lincoln County and is home to a population of approximately 500 people.
History
The area around La Barge was first inhabited by the Shoshone and Ute Native American tribes. The first European settlers arrived in the area in the late 1800s, and the town of La Barge was officially founded in 1884. The town was named after the nearby La Barge Creek, which was named after a French-Canadian trapper named La Barge.
The town quickly grew and became an important hub for the surrounding area. It was a popular stop for travelers and traders, and the town soon became a center for commerce and trade. In the early 1900s, the town was home to several businesses, including a hotel, a general store, a saloon, and a blacksmith shop.
In the early 1900s, the town also became a center for the local ranching industry. The area was home to several large ranches, and the town was a popular stop for cowboys and ranchers. The town also became a popular destination for tourists, who came to enjoy the area’s natural beauty and outdoor activities.
Geography
La Barge is located in western Wyoming, in the Upper Green River Valley. The town is situated at an elevation of 6,000 feet, and is surrounded by the Wind River Mountains to the east and the Wyoming Range to the west. The town is located near the Wyoming-Idaho border, and is approximately 50 miles south of Jackson Hole.
The town is located in a semi-arid climate, with hot summers and cold winters. The average annual temperature is approximately 45 degrees Fahrenheit, and the average annual precipitation is approximately 12 inches.
Economy
The economy of La Barge is largely based on tourism and ranching. The town is a popular destination for tourists, who come to enjoy the area’s natural beauty and outdoor activities. The town is also home to several large ranches, which provide employment for many of the town’s residents.
The town is also home to several small businesses, including restaurants, shops, and hotels. The town is also home to a small airport, which provides air service to the surrounding area.
Demographics
As of the 2010 census, the population of La Barge was approximately 500 people. The town is predominantly white, with approximately 95% of the population identifying as white. The town is also home to a small Hispanic population, with approximately 4% of the population identifying as Hispanic or Latino. The median household income in La Barge is approximately $45,000, and the median home value is approximately $150,000.
Common Questions
What is Per Capita Income in La Barge?
Per Capita income in La Barge is $29,604.
What is the Median Family Income in La Barge?
Median Family Income in La Barge is $100,250.
What is the Median Household income in La Barge?
Median Household Income in La Barge is $56,458.
What is Inequality or Gini Index in La Barge?
Inequality or Gini Index in La Barge is 0.40.
What is the Total Population of La Barge?
Total Population of La Barge is 259.
What is the Total Male Population of La Barge?
Total Male Population of La Barge is 135.
What is the Total Female Population of La Barge?
Total Female Population of La Barge is 124.
What is the Ratio of Males per 100 Females in La Barge?
There are 108.87 Males per 100 Females in La Barge.
What is the Ratio of Females per 100 Males in La Barge?
There are 91.85 Females per 100 Males in La Barge.
What is the Median Population Age in La Barge?
Median Population Age in La Barge is 42.9 Years.
What is the Average Family Size in La Barge
Average Family Size in La Barge is 3.1 People.
What is the Average Household Size in La Barge
Average Household Size in La Barge is 2.4 People.
How Large is the Labor Force in La Barge?
There are 143 People in the Labor Forcein in La Barge.
What is the Percentage of People in the Labor Force in La Barge?
66.5% of People are in the Labor Force in La Barge.
What is the Unemployment Rate in La Barge?
Unemployment Rate in La Barge is 22.4%.