Petros, TN Map & Demographics
Petros Map
Petros Overview
$109,591
PER CAPITA INCOME
$27,361
AVG HOUSEHOLD INCOME
0.74
INEQUALITY / GINI INDEX
502
TOTAL POPULATION
205
MALE POPULATION
297
FEMALE POPULATION
69.02
MALES / 100 FEMALES
144.88
FEMALES / 100 MALES
49.0
MEDIAN AGE
3.3
AVG FAMILY SIZE
2.8
AVG HOUSEHOLD SIZE
63
LABOR FORCE [ PEOPLE ]
18.6%
PERCENT IN LABOR FORCE
Petros Zip Codes
Petros Area Codes
Income in Petros
Income Overview in Petros
| Characteristic | Number | Measure |
| Per Capita Income | 502 | $109,591 |
| Median Family Income | 116 | $0 |
| Mean Family Income | 116 | $326,120 |
| Median Household Income | 181 | $27,361 |
| Mean Household Income | 181 | $215,129 |
| Income Deficit | 116 | $0 |
| Wage / Income Gap (%) | 502 | 0.00% |
| Wage / Income Gap ($) | 502 | 100.00¢ per $1 |
| Gini / Inequality Index | 502 | 0.74 |
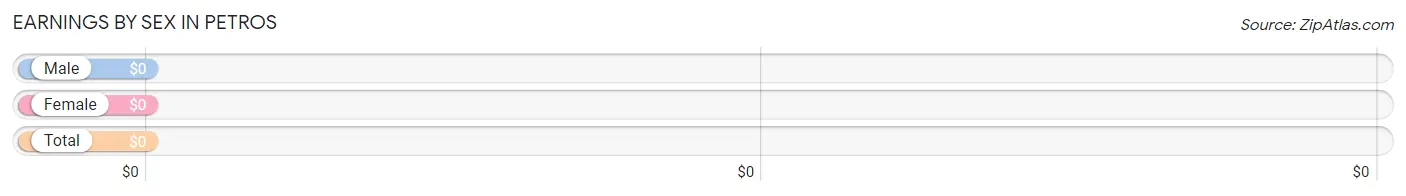
Earnings by Sex in Petros
| Sex | Number | Average Earnings |
| Male | 63 (100.0%) | $0 |
| Female | 0 (0.0%) | $0 |
| Total | 63 (100.0%) | $0 |
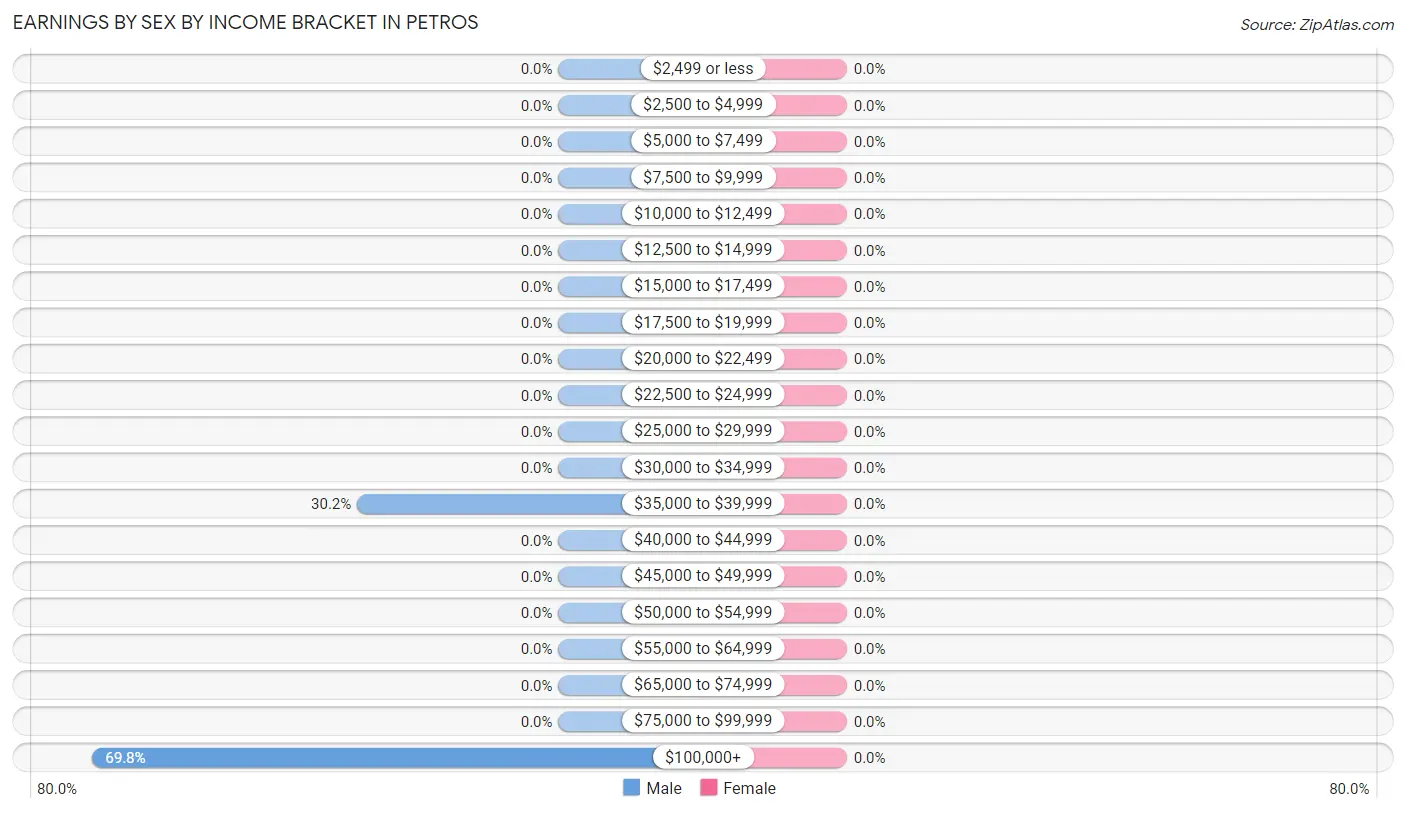
Earnings by Sex by Income Bracket in Petros
| Income | Male | Female |
| $2,499 or less | 0 (0.0%) | 0 (0.0%) |
| $2,500 to $4,999 | 0 (0.0%) | 0 (0.0%) |
| $5,000 to $7,499 | 0 (0.0%) | 0 (0.0%) |
| $7,500 to $9,999 | 0 (0.0%) | 0 (0.0%) |
| $10,000 to $12,499 | 0 (0.0%) | 0 (0.0%) |
| $12,500 to $14,999 | 0 (0.0%) | 0 (0.0%) |
| $15,000 to $17,499 | 0 (0.0%) | 0 (0.0%) |
| $17,500 to $19,999 | 0 (0.0%) | 0 (0.0%) |
| $20,000 to $22,499 | 0 (0.0%) | 0 (0.0%) |
| $22,500 to $24,999 | 0 (0.0%) | 0 (0.0%) |
| $25,000 to $29,999 | 0 (0.0%) | 0 (0.0%) |
| $30,000 to $34,999 | 0 (0.0%) | 0 (0.0%) |
| $35,000 to $39,999 | 19 (30.2%) | 0 (0.0%) |
| $40,000 to $44,999 | 0 (0.0%) | 0 (0.0%) |
| $45,000 to $49,999 | 0 (0.0%) | 0 (0.0%) |
| $50,000 to $54,999 | 0 (0.0%) | 0 (0.0%) |
| $55,000 to $64,999 | 0 (0.0%) | 0 (0.0%) |
| $65,000 to $74,999 | 0 (0.0%) | 0 (0.0%) |
| $75,000 to $99,999 | 0 (0.0%) | 0 (0.0%) |
| $100,000+ | 44 (69.8%) | 0 (0.0%) |
| Total | 63 (100.0%) | 0 (0.0%) |
Earnings by Sex by Educational Attainment in Petros
| Educational Attainment | Male Income | Female Income |
| Less than High School | - | - |
| High School Diploma | - | - |
| College or Associate's Degree | - | - |
| Bachelor's Degree | - | - |
| Graduate Degree | - | - |
| Total | - | - |
Family Income in Petros
Family Income Brackets in Petros
According to the Petros family income data, there are 44 families falling into the $25,000 to $34,999 income range, which is the most common income bracket and makes up 37.9% of all families.
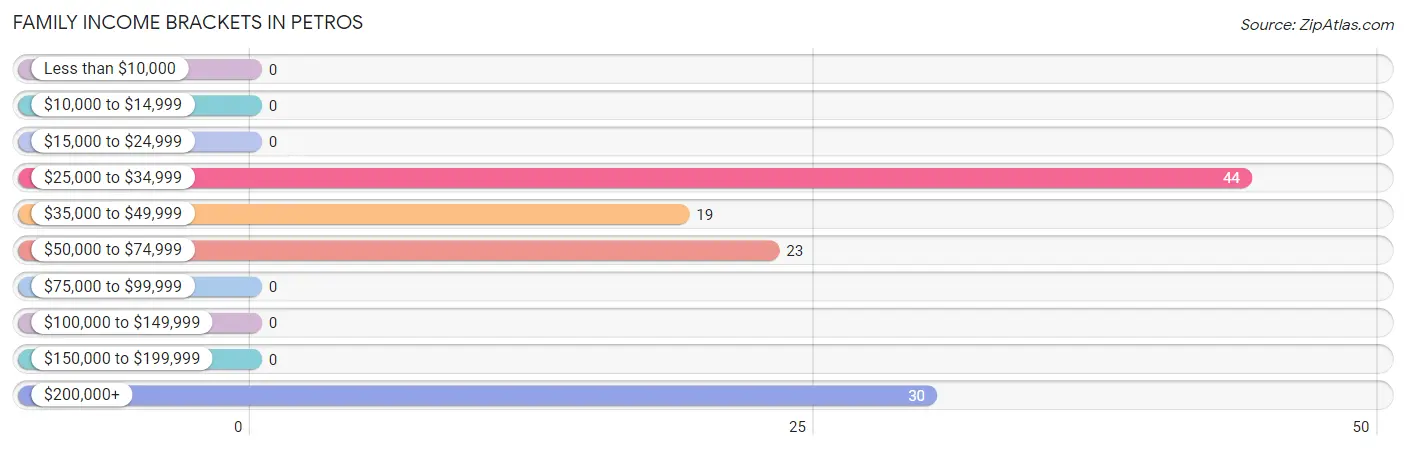
| Income Bracket | # Families | % Families |
| Less than $10,000 | 0 | 0.0% |
| $10,000 to $14,999 | 0 | 0.0% |
| $15,000 to $24,999 | 0 | 0.0% |
| $25,000 to $34,999 | 44 | 37.9% |
| $35,000 to $49,999 | 19 | 16.4% |
| $50,000 to $74,999 | 23 | 19.8% |
| $75,000 to $99,999 | 0 | 0.0% |
| $100,000 to $149,999 | 0 | 0.0% |
| $150,000 to $199,999 | 0 | 0.0% |
| $200,000+ | 30 | 25.9% |
Family Income by Famaliy Size in Petros
| Income Bracket | # Families | Median Income |
| 2-Person Families | 80 (69.0%) | $0 |
| 3-Person Families | 0 (0.0%) | $0 |
| 4-Person Families | 0 (0.0%) | $0 |
| 5-Person Families | 19 (16.4%) | $0 |
| 6-Person Families | 17 (14.7%) | $0 |
| 7+ Person Families | 0 (0.0%) | $0 |
| Total | 116 (100.0%) | $0 |
Family Income by Number of Earners in Petros
| Number of Earners | # Families | Median Income |
| No Earners | 67 (57.8%) | $0 |
| 1 Earner | 49 (42.2%) | $0 |
| 2 Earners | 0 (0.0%) | $0 |
| 3+ Earners | 0 (0.0%) | $0 |
| Total | 116 (100.0%) | $0 |
Household Income in Petros
Household Income Brackets in Petros
With 65 households falling in the category, the $15,000 to $24,999 income range is the most frequent in Petros, accounting for 35.9% of all households.
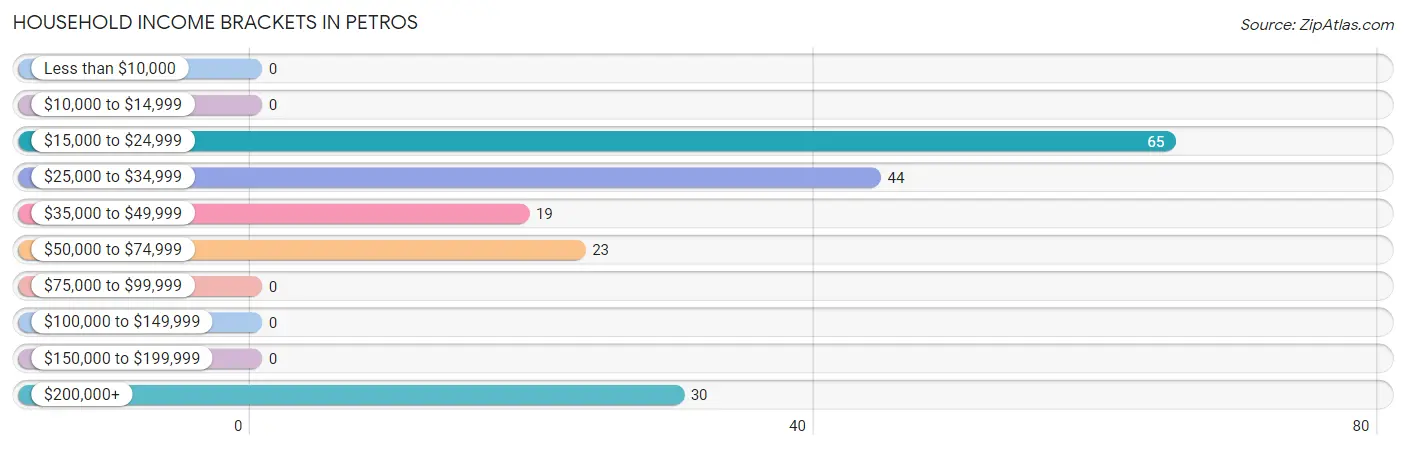
| Income Bracket | # Households | % Households |
| Less than $10,000 | 0 | 0.0% |
| $10,000 to $14,999 | 0 | 0.0% |
| $15,000 to $24,999 | 65 | 35.9% |
| $25,000 to $34,999 | 44 | 24.3% |
| $35,000 to $49,999 | 19 | 10.5% |
| $50,000 to $74,999 | 23 | 12.7% |
| $75,000 to $99,999 | 0 | 0.0% |
| $100,000 to $149,999 | 0 | 0.0% |
| $150,000 to $199,999 | 0 | 0.0% |
| $200,000+ | 30 | 16.6% |
Household Income by Householder Age in Petros
The median household income in Petros is $27,361, with the highest median household income of $19,395 found in the 65+ years age bracket for the primary householder. A total of 115 households (63.5%) fall into this category.
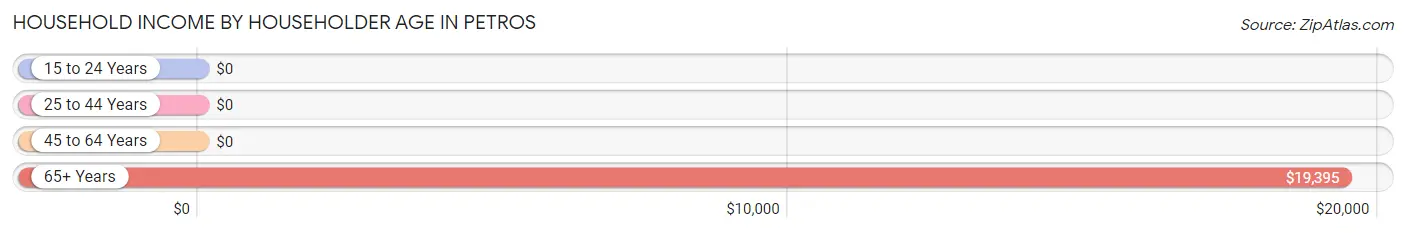
| Income Bracket | # Households | Median Income |
| 15 to 24 Years | 0 (0.0%) | $0 |
| 25 to 44 Years | 0 (0.0%) | $0 |
| 45 to 64 Years | 66 (36.5%) | $0 |
| 65+ Years | 115 (63.5%) | $19,395 |
| Total | 181 (100.0%) | $27,361 |
Poverty in Petros
Income Below Poverty by Sex and Age in Petros
With 21.4% poverty level for males and 34.3% for females among the residents of Petros, 6 to 11 year old males and 12 to 14 year old females are the most vulnerable to poverty, with 16 males (100.0%) and 49 females (100.0%) in their respective age groups living below the poverty level.
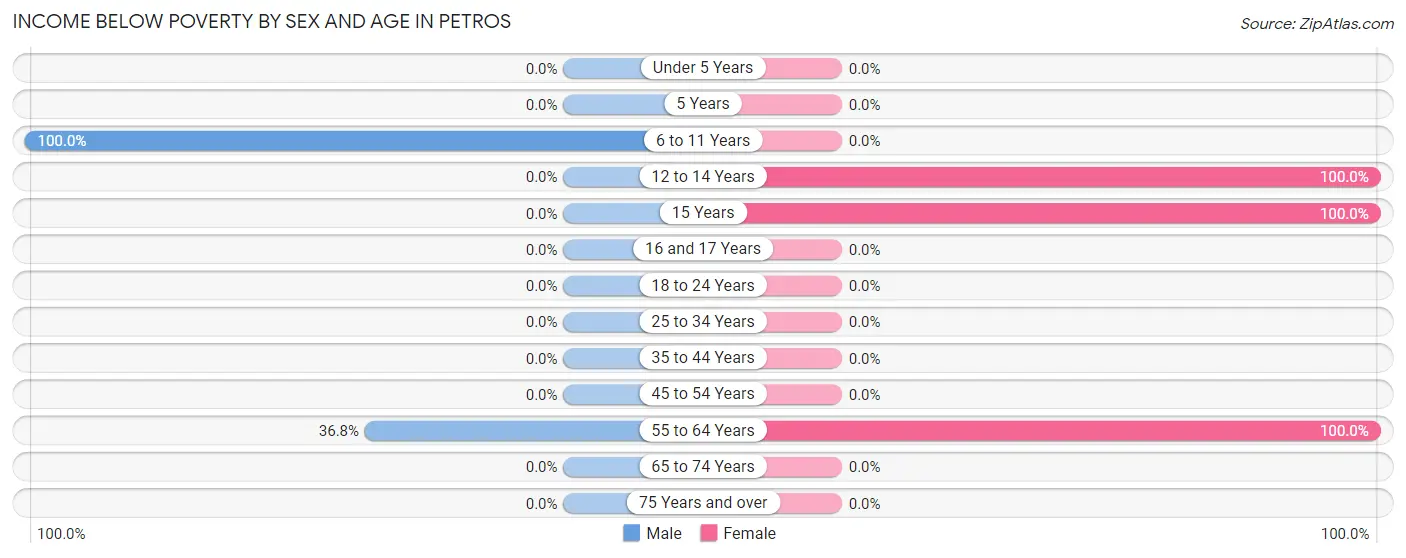
| Age Bracket | Male | Female |
| Under 5 Years | 0 (0.0%) | 0 (0.0%) |
| 5 Years | 0 (0.0%) | 0 (0.0%) |
| 6 to 11 Years | 16 (100.0%) | 0 (0.0%) |
| 12 to 14 Years | 0 (0.0%) | 49 (100.0%) |
| 15 Years | 0 (0.0%) | 36 (100.0%) |
| 16 and 17 Years | 0 (0.0%) | 0 (0.0%) |
| 18 to 24 Years | 0 (0.0%) | 0 (0.0%) |
| 25 to 34 Years | 0 (0.0%) | 0 (0.0%) |
| 35 to 44 Years | 0 (0.0%) | 0 (0.0%) |
| 45 to 54 Years | 0 (0.0%) | 0 (0.0%) |
| 55 to 64 Years | 21 (36.8%) | 17 (100.0%) |
| 65 to 74 Years | 0 (0.0%) | 0 (0.0%) |
| 75 Years and over | 0 (0.0%) | 0 (0.0%) |
| Total | 37 (21.4%) | 102 (34.3%) |
Income Above Poverty by Sex and Age in Petros
According to the poverty statistics in Petros, males aged under 5 years and females aged under 5 years are the age groups that are most secure financially, with 100.0% of males and 100.0% of females in these age groups living above the poverty line.
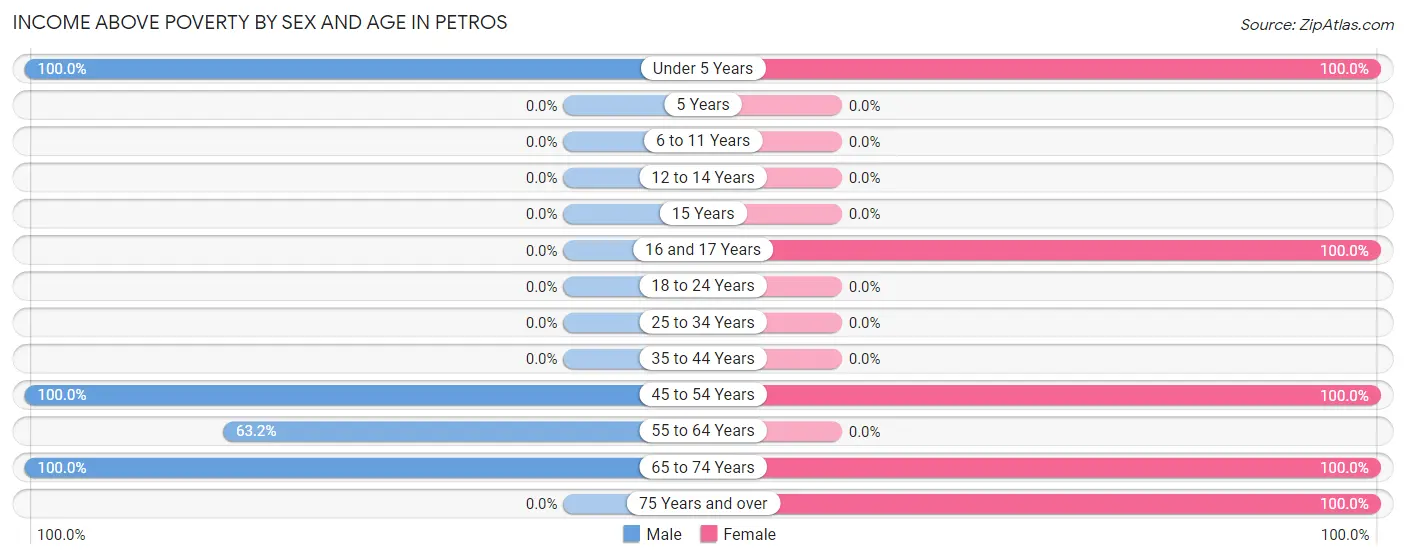
| Age Bracket | Male | Female |
| Under 5 Years | 14 (100.0%) | 16 (100.0%) |
| 5 Years | 0 (0.0%) | 0 (0.0%) |
| 6 to 11 Years | 0 (0.0%) | 0 (0.0%) |
| 12 to 14 Years | 0 (0.0%) | 0 (0.0%) |
| 15 Years | 0 (0.0%) | 0 (0.0%) |
| 16 and 17 Years | 0 (0.0%) | 14 (100.0%) |
| 18 to 24 Years | 0 (0.0%) | 0 (0.0%) |
| 25 to 34 Years | 0 (0.0%) | 0 (0.0%) |
| 35 to 44 Years | 0 (0.0%) | 0 (0.0%) |
| 45 to 54 Years | 63 (100.0%) | 43 (100.0%) |
| 55 to 64 Years | 36 (63.2%) | 0 (0.0%) |
| 65 to 74 Years | 23 (100.0%) | 57 (100.0%) |
| 75 Years and over | 0 (0.0%) | 65 (100.0%) |
| Total | 136 (78.6%) | 195 (65.7%) |
Income Below Poverty Among Married-Couple Families in Petros
The poverty statistics for married-couple families in Petros show that 14.7% or 17 of the total 116 families live below the poverty line. Families with 3 or 4 children have the highest poverty rate of 47.2%, comprising of 17 families. On the other hand, families with no children have the lowest poverty rate of 0.0%, which includes 0 families.
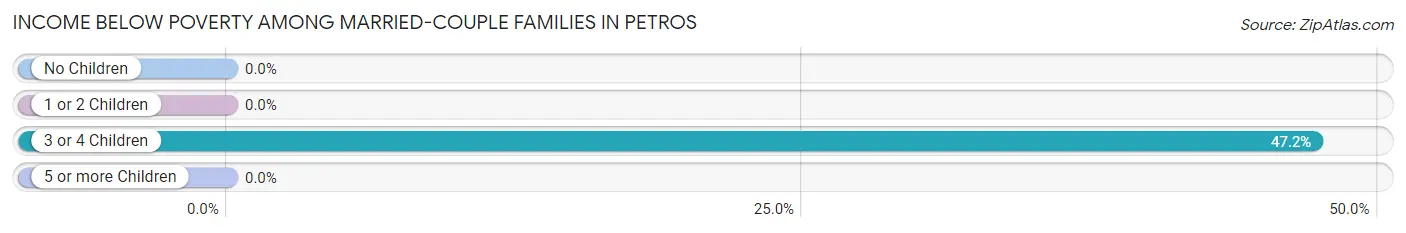
| Children | Above Poverty | Below Poverty |
| No Children | 80 (100.0%) | 0 (0.0%) |
| 1 or 2 Children | 0 (0.0%) | 0 (0.0%) |
| 3 or 4 Children | 19 (52.8%) | 17 (47.2%) |
| 5 or more Children | 0 (0.0%) | 0 (0.0%) |
| Total | 99 (85.3%) | 17 (14.7%) |
Income Below Poverty Among Single-Parent Households in Petros
| Children | Single Father | Single Mother |
| No Children | 0 (0.0%) | 0 (0.0%) |
| 1 or 2 Children | 0 (0.0%) | 0 (0.0%) |
| 3 or 4 Children | 0 (0.0%) | 0 (0.0%) |
| 5 or more Children | 0 (0.0%) | 0 (0.0%) |
| Total | 0 (0.0%) | 0 (0.0%) |
Income Below Poverty Among Married-Couple vs Single-Parent Households in Petros
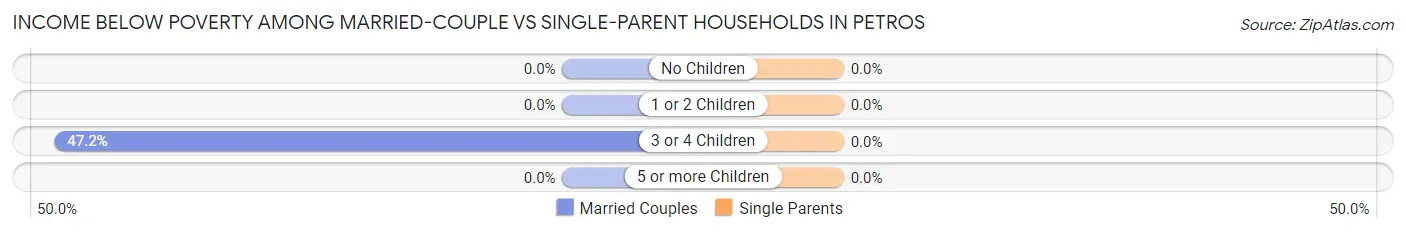
| Children | Married-Couple Families | Single-Parent Households |
| No Children | 0 (0.0%) | 0 (0.0%) |
| 1 or 2 Children | 0 (0.0%) | 0 (0.0%) |
| 3 or 4 Children | 17 (47.2%) | 0 (0.0%) |
| 5 or more Children | 0 (0.0%) | 0 (0.0%) |
| Total | 17 (14.7%) | 0 (0.0%) |
Race in Petros
The most populous races in Petros are White / Caucasian (479 | 95.4%), and Two or more Races (23 | 4.6%).
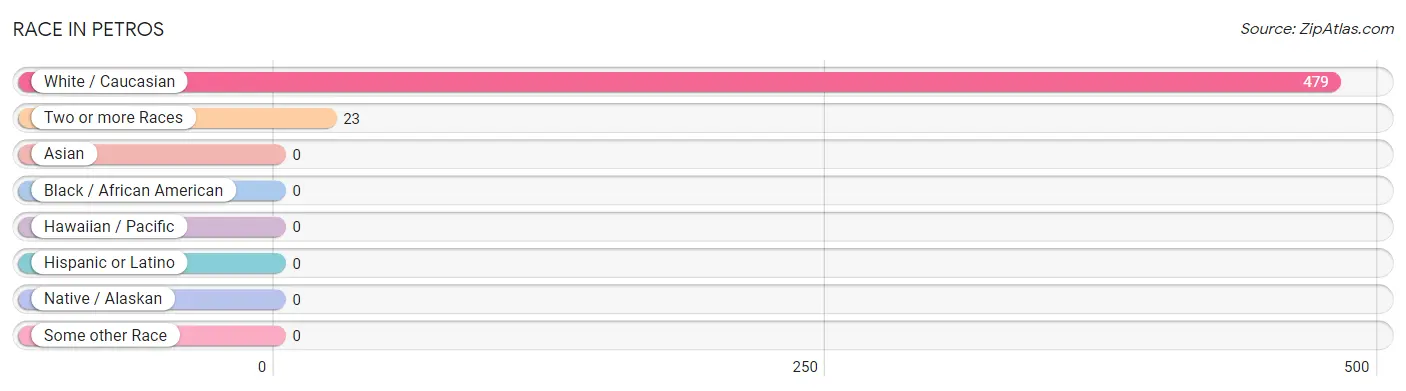
| Race | # Population | % Population |
| Asian | 0 | 0.0% |
| Black / African American | 0 | 0.0% |
| Hawaiian / Pacific | 0 | 0.0% |
| Hispanic or Latino | 0 | 0.0% |
| Native / Alaskan | 0 | 0.0% |
| White / Caucasian | 479 | 95.4% |
| Two or more Races | 23 | 4.6% |
| Some other Race | 0 | 0.0% |
| Total | 502 | 100.0% |
Ancestry in Petros
The most populous ancestries reported in Petros are Irish (279 | 55.6%), Welsh (78 | 15.5%), German (54 | 10.8%), American (30 | 6.0%), and English (30 | 6.0%), together accounting for 93.8% of all Petros residents.
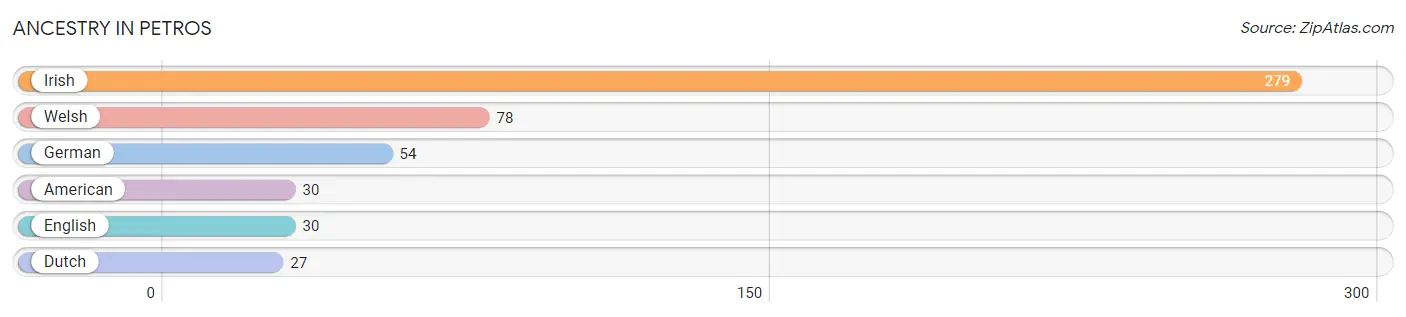
| Ancestry | # Population | % Population |
| American | 30 | 6.0% |
| Dutch | 27 | 5.4% |
| English | 30 | 6.0% |
| German | 54 | 10.8% |
| Irish | 279 | 55.6% |
| Welsh | 78 | 15.5% | View All 6 Rows |
Immigrants in Petros

| Immigration Origin | # Population | % Population | View All 0 Rows |
Sex and Age in Petros
Sex and Age in Petros
The most populous age groups in Petros are 45 to 49 Years (63 | 30.7%) for men and 80 to 84 Years (65 | 21.9%) for women.
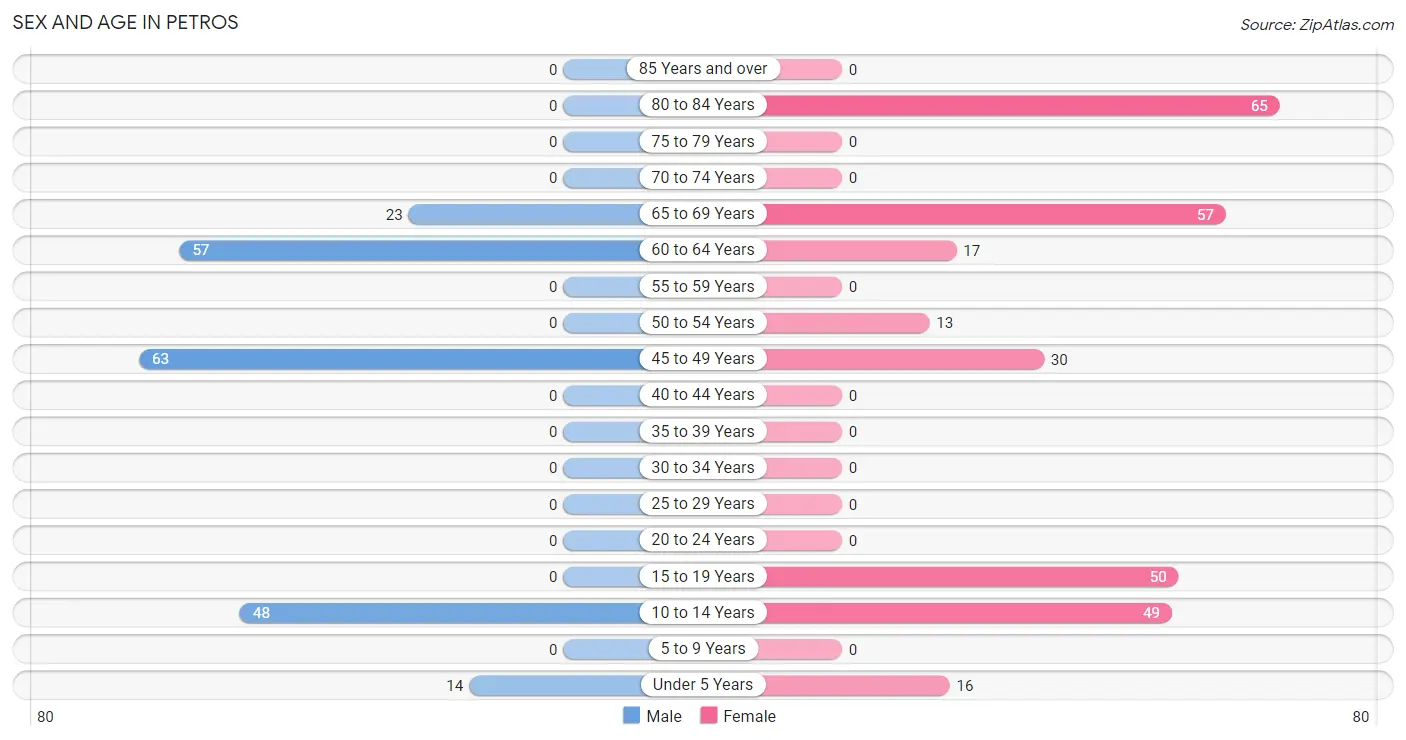
| Age Bracket | Male | Female |
| Under 5 Years | 14 (6.8%) | 16 (5.4%) |
| 5 to 9 Years | 0 (0.0%) | 0 (0.0%) |
| 10 to 14 Years | 48 (23.4%) | 49 (16.5%) |
| 15 to 19 Years | 0 (0.0%) | 50 (16.8%) |
| 20 to 24 Years | 0 (0.0%) | 0 (0.0%) |
| 25 to 29 Years | 0 (0.0%) | 0 (0.0%) |
| 30 to 34 Years | 0 (0.0%) | 0 (0.0%) |
| 35 to 39 Years | 0 (0.0%) | 0 (0.0%) |
| 40 to 44 Years | 0 (0.0%) | 0 (0.0%) |
| 45 to 49 Years | 63 (30.7%) | 30 (10.1%) |
| 50 to 54 Years | 0 (0.0%) | 13 (4.4%) |
| 55 to 59 Years | 0 (0.0%) | 0 (0.0%) |
| 60 to 64 Years | 57 (27.8%) | 17 (5.7%) |
| 65 to 69 Years | 23 (11.2%) | 57 (19.2%) |
| 70 to 74 Years | 0 (0.0%) | 0 (0.0%) |
| 75 to 79 Years | 0 (0.0%) | 0 (0.0%) |
| 80 to 84 Years | 0 (0.0%) | 65 (21.9%) |
| 85 Years and over | 0 (0.0%) | 0 (0.0%) |
| Total | 205 (100.0%) | 297 (100.0%) |
Families and Households in Petros
Median Family Size in Petros
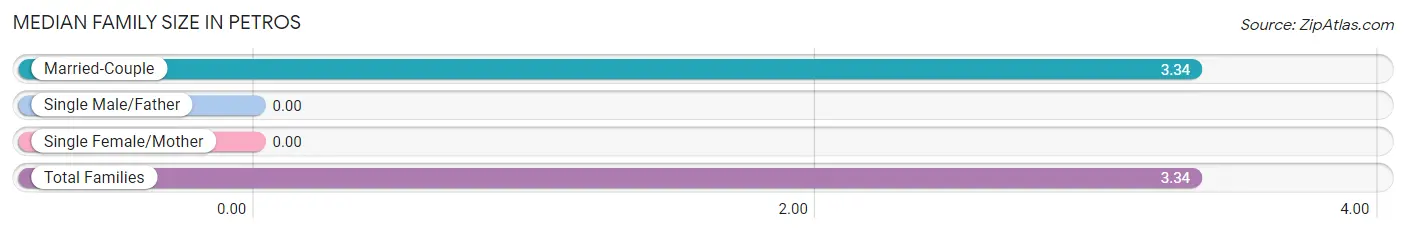
| Family Type | # Families | Family Size |
| Married-Couple | 116 (100.0%) | 3.34 |
| Single Male/Father | 0 (0.0%) | - |
| Single Female/Mother | 0 (0.0%) | - |
| Total Families | 116 (100.0%) | 3.34 |
Median Household Size in Petros
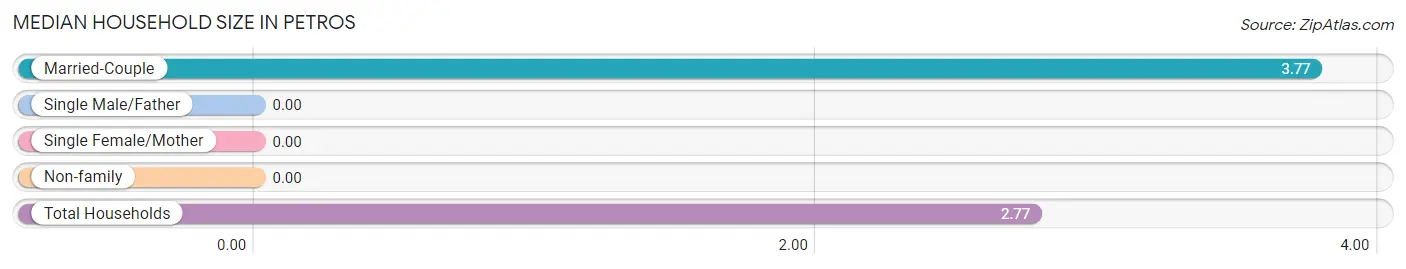
| Household Type | # Households | Household Size |
| Married-Couple | 116 (64.1%) | 3.77 |
| Single Male/Father | 0 (0.0%) | - |
| Single Female/Mother | 0 (0.0%) | - |
| Non-family | 65 (35.9%) | - |
| Total Households | 181 (100.0%) | 2.77 |
Household Size by Marriage Status in Petros
Out of a total of 181 households in Petros, 116 (64.1%) are family households, while 65 (35.9%) are nonfamily households. The most numerous type of family households are 2-person households, comprising 80, and the most common type of nonfamily households are 1-person households, comprising 65.
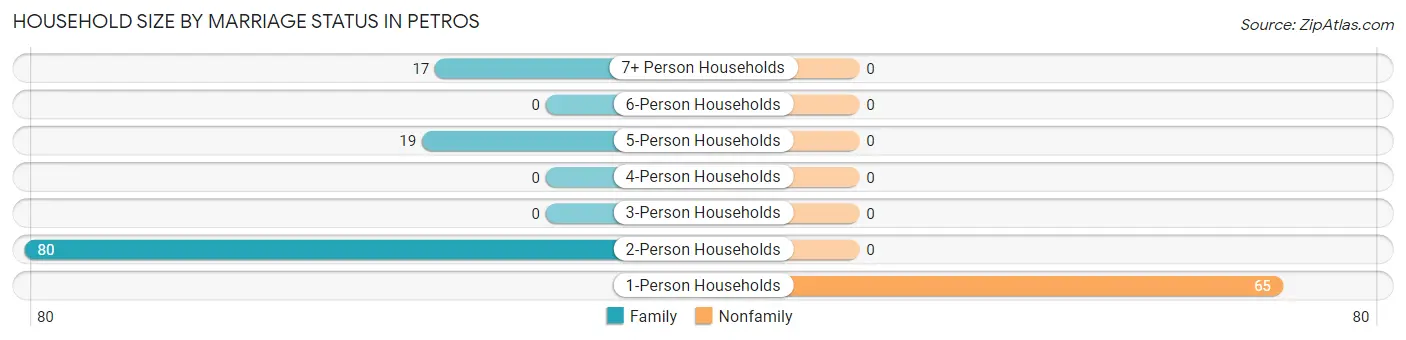
| Household Size | Family Households | Nonfamily Households |
| 1-Person Households | - | 65 (35.9%) |
| 2-Person Households | 80 (44.2%) | 0 (0.0%) |
| 3-Person Households | 0 (0.0%) | 0 (0.0%) |
| 4-Person Households | 0 (0.0%) | 0 (0.0%) |
| 5-Person Households | 19 (10.5%) | 0 (0.0%) |
| 6-Person Households | 0 (0.0%) | 0 (0.0%) |
| 7+ Person Households | 17 (9.4%) | 0 (0.0%) |
| Total | 116 (64.1%) | 65 (35.9%) |
Female Fertility in Petros
Fertility by Age in Petros
| Age Bracket | Women with Births | Births / 1,000 Women |
| 15 to 19 years | 0 (0.0%) | 0.0 |
| 20 to 34 years | 0 (0.0%) | 0.0 |
| 35 to 50 years | 0 (0.0%) | 0.0 |
| Total | 0 (0.0%) | 0.0 |
Fertility by Age by Marriage Status in Petros
| Age Bracket | Married | Unmarried |
| 15 to 19 years | 0 (0.0%) | 0 (0.0%) |
| 20 to 34 years | 0 (0.0%) | 0 (0.0%) |
| 35 to 50 years | 0 (0.0%) | 0 (0.0%) |
| Total | 0 (0.0%) | 0 (0.0%) |
Fertility by Education in Petros
| Educational Attainment | Women with Births | Births / 1,000 Women |
| Less than High School | 0 (0.0%) | 0.0 |
| High School Diploma | 0 (0.0%) | 0.0 |
| College or Associate's Degree | 0 (0.0%) | 0.0 |
| Bachelor's Degree | 0 (0.0%) | 0.0 |
| Graduate Degree | 0 (0.0%) | 0.0 |
| Total | 0 (0.0%) | 0.0 |
Fertility by Education by Marriage Status in Petros
| Educational Attainment | Married | Unmarried |
| Less than High School | 0 (0.0%) | 0 (0.0%) |
| High School Diploma | 0 (0.0%) | 0 (0.0%) |
| College or Associate's Degree | 0 (0.0%) | 0 (0.0%) |
| Bachelor's Degree | 0 (0.0%) | 0 (0.0%) |
| Graduate Degree | 0 (0.0%) | 0 (0.0%) |
| Total | 0 (0.0%) | 0 (0.0%) |
Employment Characteristics in Petros
Employment by Class of Employer in Petros
Among the 63 employed individuals in Petros, private company employees (44 | 69.8%), and self-employed (not incorporated) (19 | 30.2%) make up the most common classes of employment.
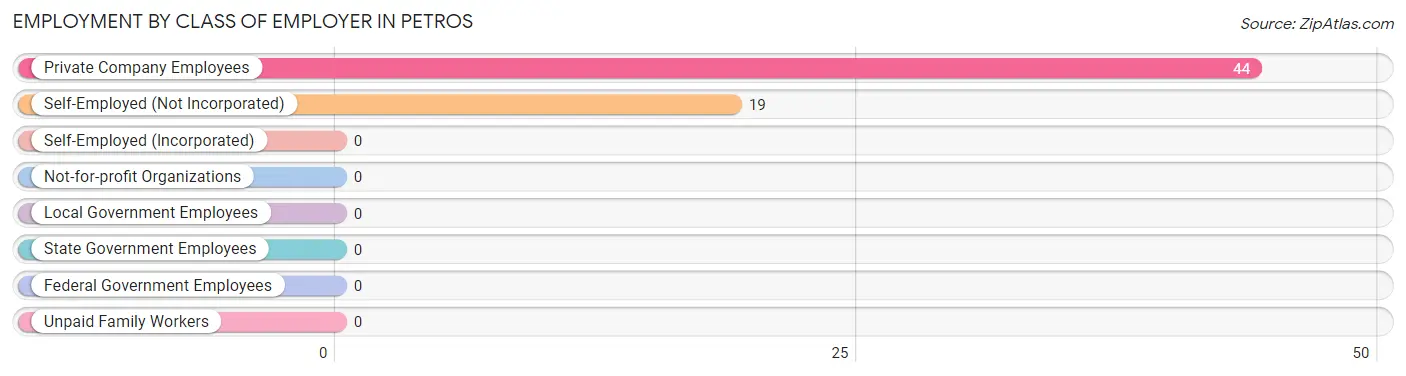
| Employer Class | # Employees | % Employees |
| Private Company Employees | 44 | 69.8% |
| Self-Employed (Incorporated) | 0 | 0.0% |
| Self-Employed (Not Incorporated) | 19 | 30.2% |
| Not-for-profit Organizations | 0 | 0.0% |
| Local Government Employees | 0 | 0.0% |
| State Government Employees | 0 | 0.0% |
| Federal Government Employees | 0 | 0.0% |
| Unpaid Family Workers | 0 | 0.0% |
| Total | 63 | 100.0% |
Employment Status by Age in Petros
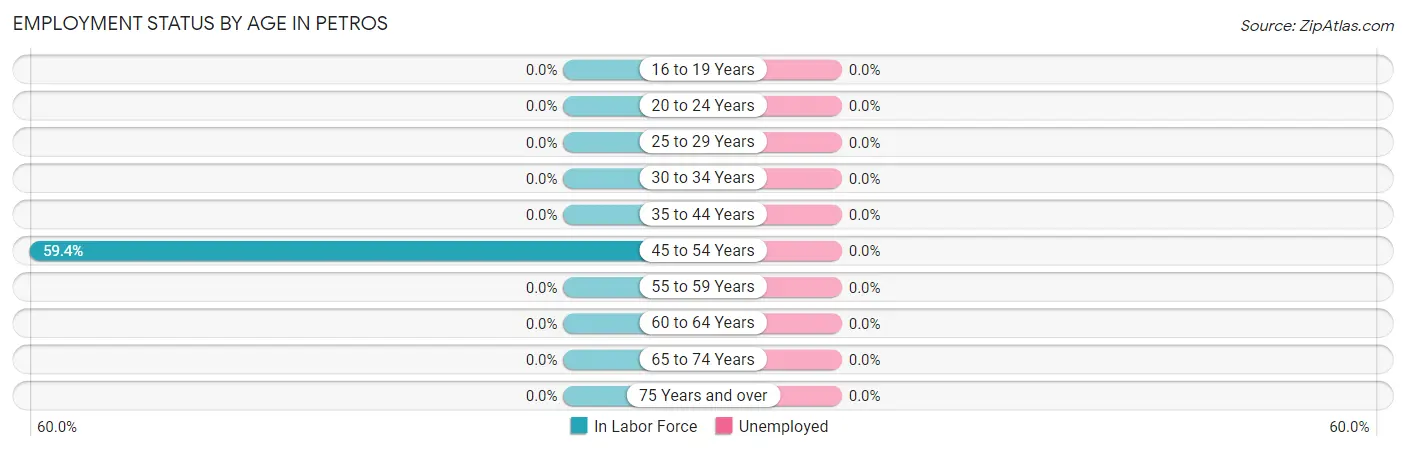
| Age Bracket | In Labor Force | Unemployed |
| 16 to 19 Years | 0 (0.0%) | 0 (0.0%) |
| 20 to 24 Years | 0 (0.0%) | 0 (0.0%) |
| 25 to 29 Years | 0 (0.0%) | 0 (0.0%) |
| 30 to 34 Years | 0 (0.0%) | 0 (0.0%) |
| 35 to 44 Years | 0 (0.0%) | 0 (0.0%) |
| 45 to 54 Years | 63 (59.4%) | 0 (0.0%) |
| 55 to 59 Years | 0 (0.0%) | 0 (0.0%) |
| 60 to 64 Years | 0 (0.0%) | 0 (0.0%) |
| 65 to 74 Years | 0 (0.0%) | 0 (0.0%) |
| 75 Years and over | 0 (0.0%) | 0 (0.0%) |
| Total | 63 (18.6%) | 0 (0.0%) |
Employment Status by Educational Attainment in Petros
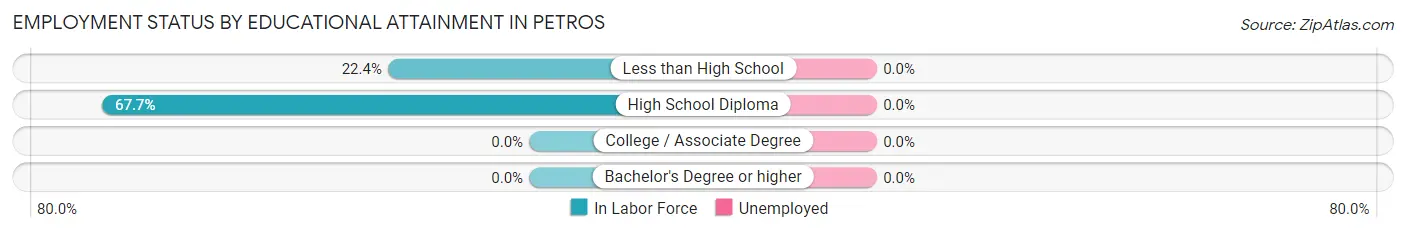
| Educational Attainment | In Labor Force | Unemployed |
| Less than High School | 19 (22.4%) | 0 (0.0%) |
| High School Diploma | 44 (67.7%) | 0 (0.0%) |
| College / Associate Degree | 0 (0.0%) | 0 (0.0%) |
| Bachelor's Degree or higher | 0 (0.0%) | 0 (0.0%) |
| Total | 63 (35.0%) | 0 (0.0%) |
Employment Occupations by Sex in Petros
Management, Business, Science and Arts Occupations
Management, Business, Science and Arts Occupations by Sex
| Occupation | Male | Female |
| Management | 0 (0.0%) | 0 (0.0%) |
| Business & Financial | 0 (0.0%) | 0 (0.0%) |
| Computers, Engineering & Science | 0 (0.0%) | 0 (0.0%) |
| Computers & Mathematics | 0 (0.0%) | 0 (0.0%) |
| Architecture & Engineering | 0 (0.0%) | 0 (0.0%) |
| Life, Physical & Social Science | 0 (0.0%) | 0 (0.0%) |
| Community & Social Service | 0 (0.0%) | 0 (0.0%) |
| Education, Arts & Media | 0 (0.0%) | 0 (0.0%) |
| Legal Services & Support | 0 (0.0%) | 0 (0.0%) |
| Education Instruction & Library | 0 (0.0%) | 0 (0.0%) |
| Arts, Media & Entertainment | 0 (0.0%) | 0 (0.0%) |
| Health Diagnosing & Treating | 0 (0.0%) | 0 (0.0%) |
| Health Technologists | 0 (0.0%) | 0 (0.0%) |
| Total (Category) | 0 (0.0%) | 0 (0.0%) |
| Total (Overall) | 63 (100.0%) | 0 (0.0%) |
Services Occupations
Services Occupations by Sex
| Occupation | Male | Female |
| Healthcare Support | 0 (0.0%) | 0 (0.0%) |
| Security & Protection | 0 (0.0%) | 0 (0.0%) |
| Firefighting & Prevention | 0 (0.0%) | 0 (0.0%) |
| Law Enforcement | 0 (0.0%) | 0 (0.0%) |
| Food Preparation & Serving | 0 (0.0%) | 0 (0.0%) |
| Cleaning & Maintenance | 0 (0.0%) | 0 (0.0%) |
| Personal Care & Service | 0 (0.0%) | 0 (0.0%) |
| Total (Category) | 0 (0.0%) | 0 (0.0%) |
| Total (Overall) | 63 (100.0%) | 0 (0.0%) |
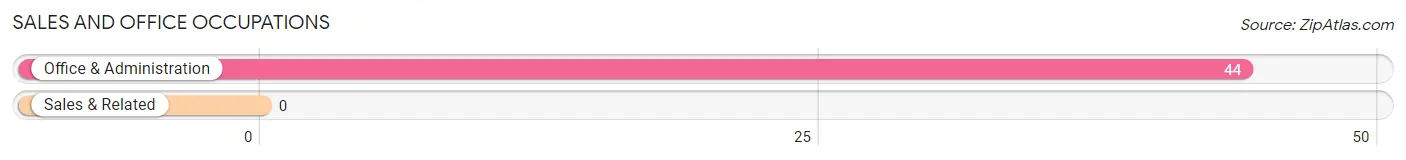
Sales and Office Occupations
The most common Sales and Office occupations in Petros are , and Office & Administration (44 | 69.8%).
Sales and Office Occupations by Sex

| Occupation | Male | Female |
| Sales & Related | 0 (0.0%) | 0 (0.0%) |
| Office & Administration | 44 (100.0%) | 0 (0.0%) |
| Total (Category) | 44 (100.0%) | 0 (0.0%) |
| Total (Overall) | 63 (100.0%) | 0 (0.0%) |
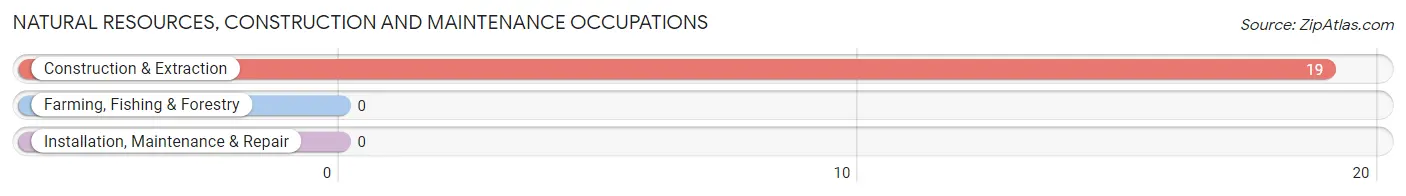
Natural Resources, Construction and Maintenance Occupations
The most common Natural Resources, Construction and Maintenance occupations in Petros are , and Construction & Extraction (19 | 30.2%).
Natural Resources, Construction and Maintenance Occupations by Sex
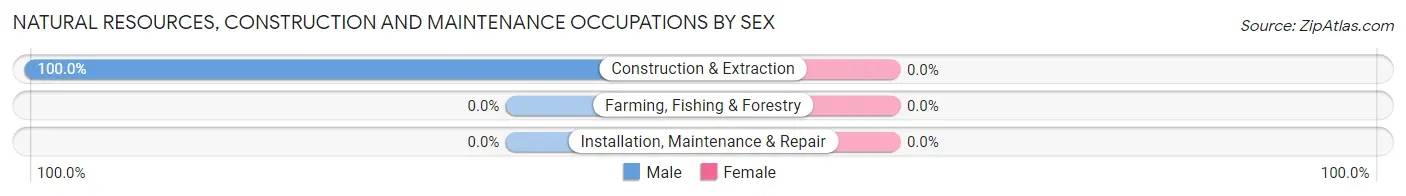
| Occupation | Male | Female |
| Farming, Fishing & Forestry | 0 (0.0%) | 0 (0.0%) |
| Construction & Extraction | 19 (100.0%) | 0 (0.0%) |
| Installation, Maintenance & Repair | 0 (0.0%) | 0 (0.0%) |
| Total (Category) | 19 (100.0%) | 0 (0.0%) |
| Total (Overall) | 63 (100.0%) | 0 (0.0%) |
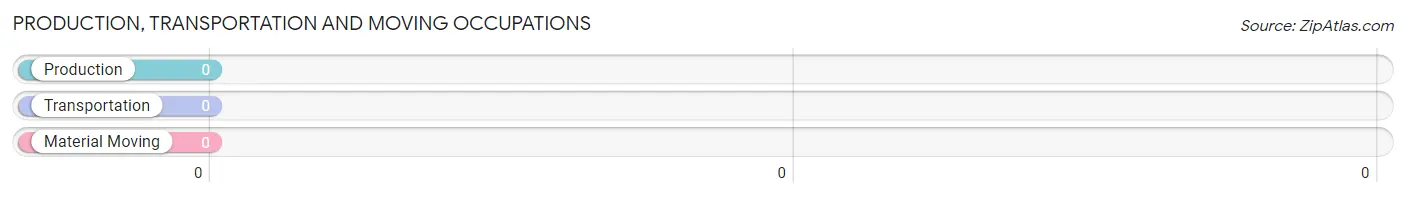
Production, Transportation and Moving Occupations
Production, Transportation and Moving Occupations by Sex
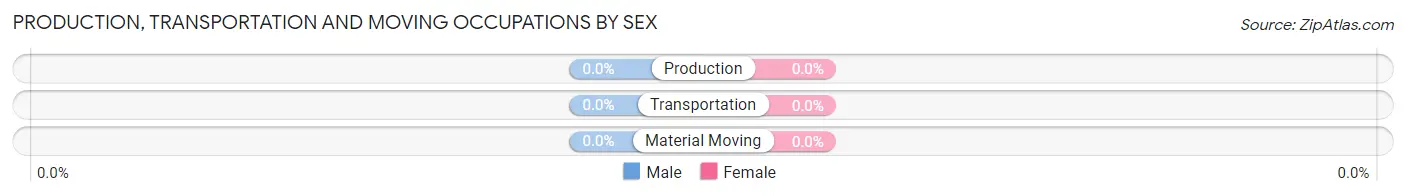
| Occupation | Male | Female |
| Production | 0 (0.0%) | 0 (0.0%) |
| Transportation | 0 (0.0%) | 0 (0.0%) |
| Material Moving | 0 (0.0%) | 0 (0.0%) |
| Total (Category) | 0 (0.0%) | 0 (0.0%) |
| Total (Overall) | 63 (100.0%) | 0 (0.0%) |
Employment Industries by Sex in Petros
Employment Industries in Petros
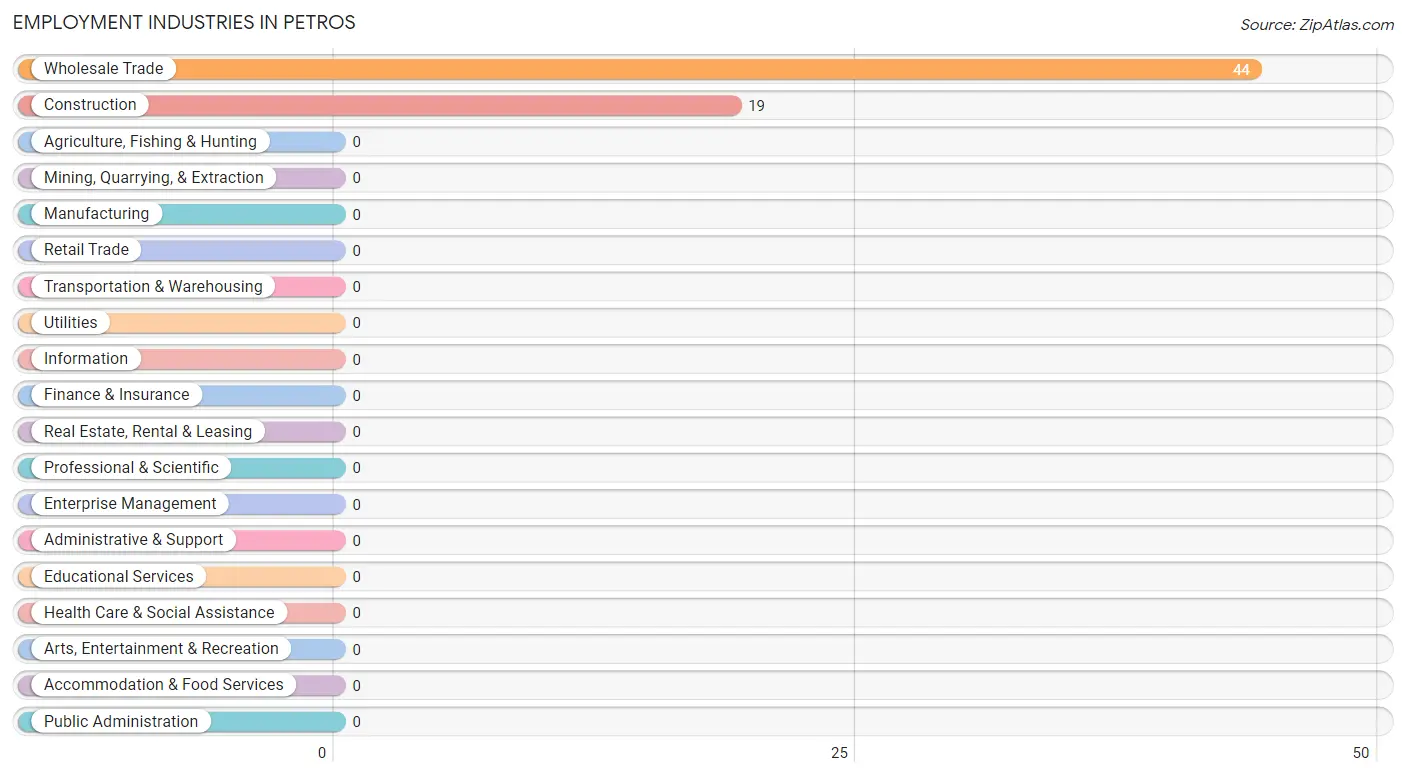
The major employment industries in Petros include Wholesale Trade (44 | 69.8%), and Construction (19 | 30.2%).
Employment Industries by Sex in Petros
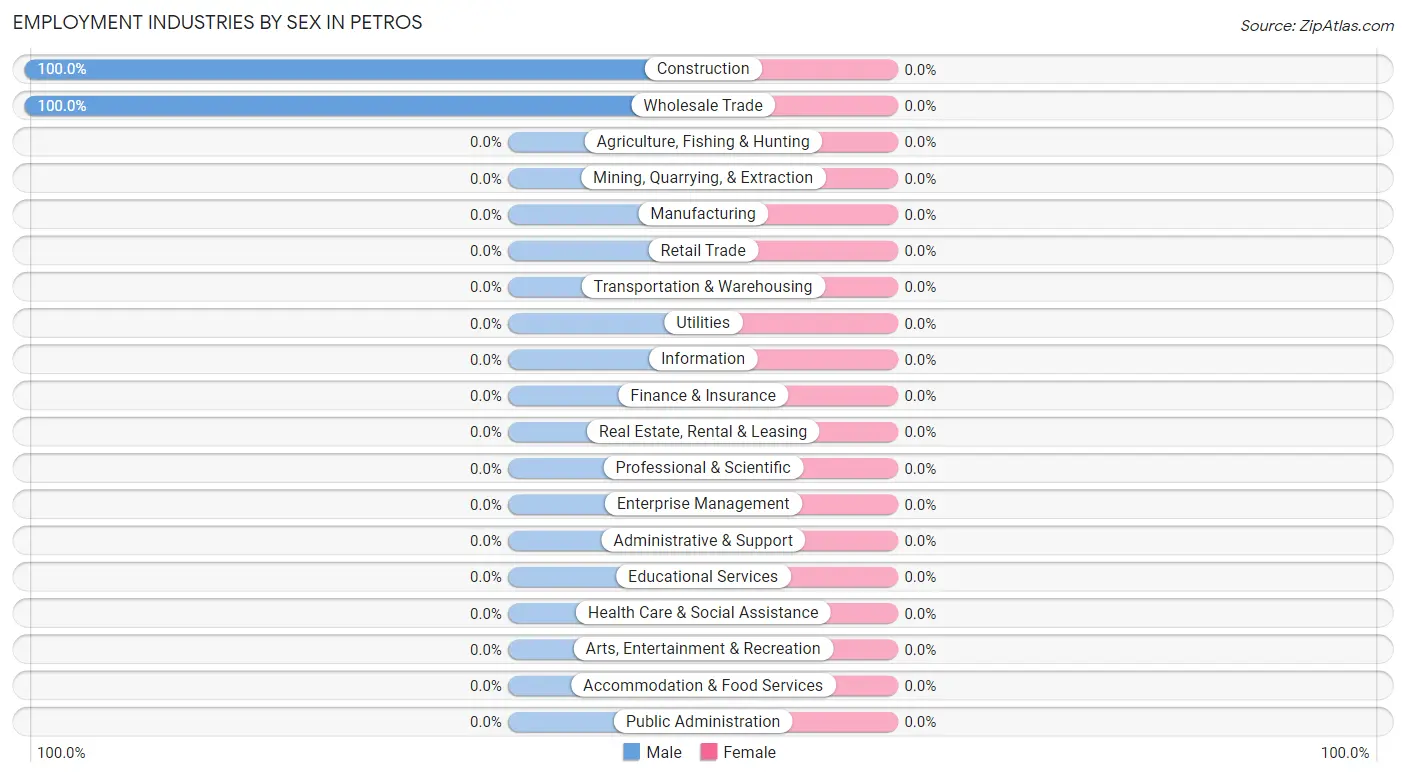
| Industry | Male | Female |
| Agriculture, Fishing & Hunting | 0 (0.0%) | 0 (0.0%) |
| Mining, Quarrying, & Extraction | 0 (0.0%) | 0 (0.0%) |
| Construction | 19 (100.0%) | 0 (0.0%) |
| Manufacturing | 0 (0.0%) | 0 (0.0%) |
| Wholesale Trade | 44 (100.0%) | 0 (0.0%) |
| Retail Trade | 0 (0.0%) | 0 (0.0%) |
| Transportation & Warehousing | 0 (0.0%) | 0 (0.0%) |
| Utilities | 0 (0.0%) | 0 (0.0%) |
| Information | 0 (0.0%) | 0 (0.0%) |
| Finance & Insurance | 0 (0.0%) | 0 (0.0%) |
| Real Estate, Rental & Leasing | 0 (0.0%) | 0 (0.0%) |
| Professional & Scientific | 0 (0.0%) | 0 (0.0%) |
| Enterprise Management | 0 (0.0%) | 0 (0.0%) |
| Administrative & Support | 0 (0.0%) | 0 (0.0%) |
| Educational Services | 0 (0.0%) | 0 (0.0%) |
| Health Care & Social Assistance | 0 (0.0%) | 0 (0.0%) |
| Arts, Entertainment & Recreation | 0 (0.0%) | 0 (0.0%) |
| Accommodation & Food Services | 0 (0.0%) | 0 (0.0%) |
| Public Administration | 0 (0.0%) | 0 (0.0%) |
| Total | 63 (100.0%) | 0 (0.0%) |
Education in Petros
School Enrollment in Petros
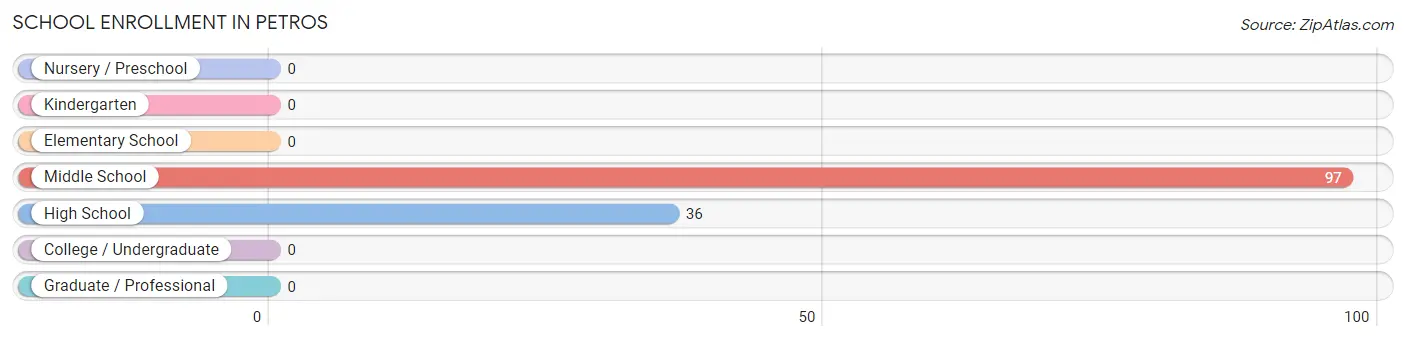
The most common levels of schooling among the 133 students in Petros are middle school (97 | 72.9%), and high school (36 | 27.1%).
| School Level | # Students | % Students |
| Nursery / Preschool | 0 | 0.0% |
| Kindergarten | 0 | 0.0% |
| Elementary School | 0 | 0.0% |
| Middle School | 97 | 72.9% |
| High School | 36 | 27.1% |
| College / Undergraduate | 0 | 0.0% |
| Graduate / Professional | 0 | 0.0% |
| Total | 133 | 100.0% |
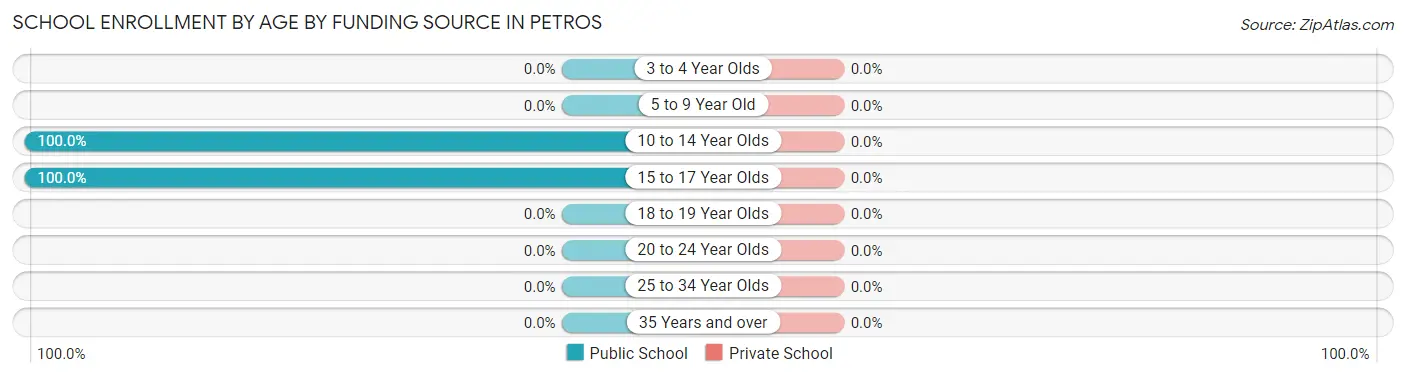
School Enrollment by Age by Funding Source in Petros
| Age Bracket | Public School | Private School |
| 3 to 4 Year Olds | 0 (0.0%) | 0 (0.0%) |
| 5 to 9 Year Old | 0 (0.0%) | 0 (0.0%) |
| 10 to 14 Year Olds | 97 (100.0%) | 0 (0.0%) |
| 15 to 17 Year Olds | 36 (100.0%) | 0 (0.0%) |
| 18 to 19 Year Olds | 0 (0.0%) | 0 (0.0%) |
| 20 to 24 Year Olds | 0 (0.0%) | 0 (0.0%) |
| 25 to 34 Year Olds | 0 (0.0%) | 0 (0.0%) |
| 35 Years and over | 0 (0.0%) | 0 (0.0%) |
| Total | 133 (100.0%) | 0 (0.0%) |
Educational Attainment by Field of Study in Petros
| Field of Study | # Graduates | % Graduates |
| Computers & Mathematics | 0 | 0.0% |
| Bio, Nature & Agricultural | 0 | 0.0% |
| Physical & Health Sciences | 0 | 0.0% |
| Psychology | 0 | 0.0% |
| Social Sciences | 0 | 0.0% |
| Engineering | 0 | 0.0% |
| Multidisciplinary Studies | 0 | 0.0% |
| Science & Technology | 0 | 0.0% |
| Business | 0 | 0.0% |
| Education | 0 | 0.0% |
| Literature & Languages | 0 | 0.0% |
| Liberal Arts & History | 0 | 0.0% |
| Visual & Performing Arts | 0 | 0.0% |
| Communications | 0 | 0.0% |
| Arts & Humanities | 0 | 0.0% |
| Total | 0 | 0.0% |
Transportation & Commute in Petros
Vehicle Availability by Sex in Petros
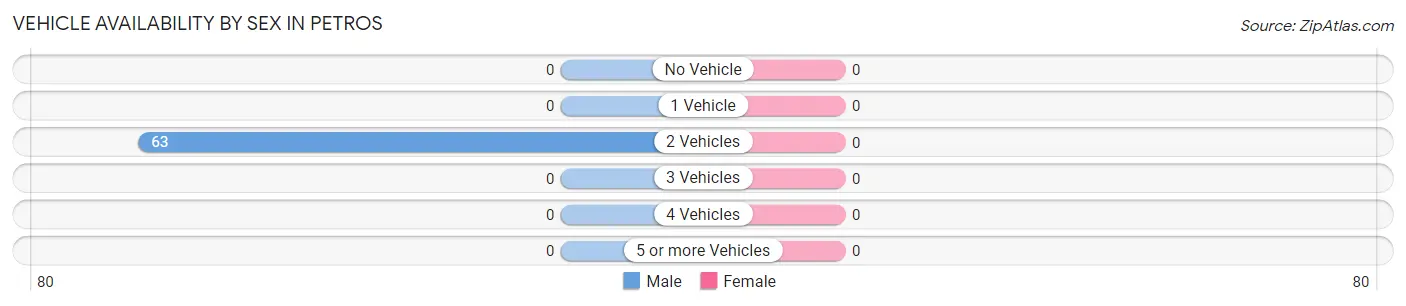
| Vehicles Available | Male | Female |
| No Vehicle | 0 (0.0%) | 0 (0.0%) |
| 1 Vehicle | 0 (0.0%) | 0 (0.0%) |
| 2 Vehicles | 63 (100.0%) | 0 (0.0%) |
| 3 Vehicles | 0 (0.0%) | 0 (0.0%) |
| 4 Vehicles | 0 (0.0%) | 0 (0.0%) |
| 5 or more Vehicles | 0 (0.0%) | 0 (0.0%) |
| Total | 63 (100.0%) | 0 (0.0%) |
Commute Time in Petros
The most frequently occuring commute durations in Petros are 60 to 89 minutes (44 commuters, 69.8%), 45 to 59 minutes (19 commuters, 30.2%), and less than 5 minutes (0 commuters, 0.0%).
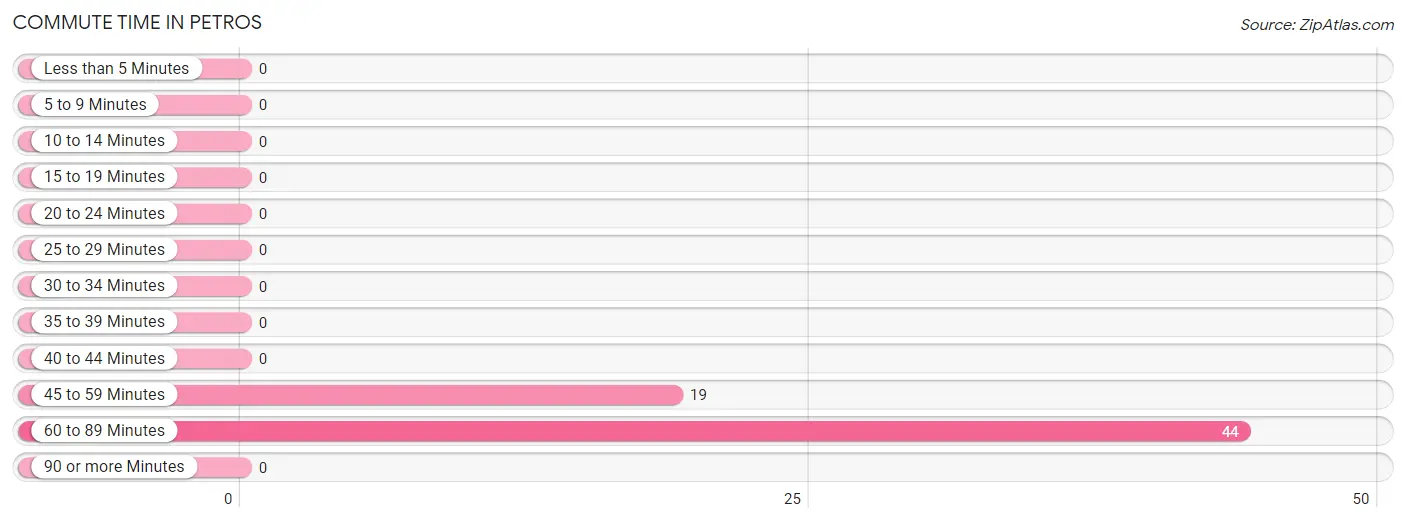
| Commute Time | # Commuters | % Commuters |
| Less than 5 Minutes | 0 | 0.0% |
| 5 to 9 Minutes | 0 | 0.0% |
| 10 to 14 Minutes | 0 | 0.0% |
| 15 to 19 Minutes | 0 | 0.0% |
| 20 to 24 Minutes | 0 | 0.0% |
| 25 to 29 Minutes | 0 | 0.0% |
| 30 to 34 Minutes | 0 | 0.0% |
| 35 to 39 Minutes | 0 | 0.0% |
| 40 to 44 Minutes | 0 | 0.0% |
| 45 to 59 Minutes | 19 | 30.2% |
| 60 to 89 Minutes | 44 | 69.8% |
| 90 or more Minutes | 0 | 0.0% |
Commute Time by Sex in Petros
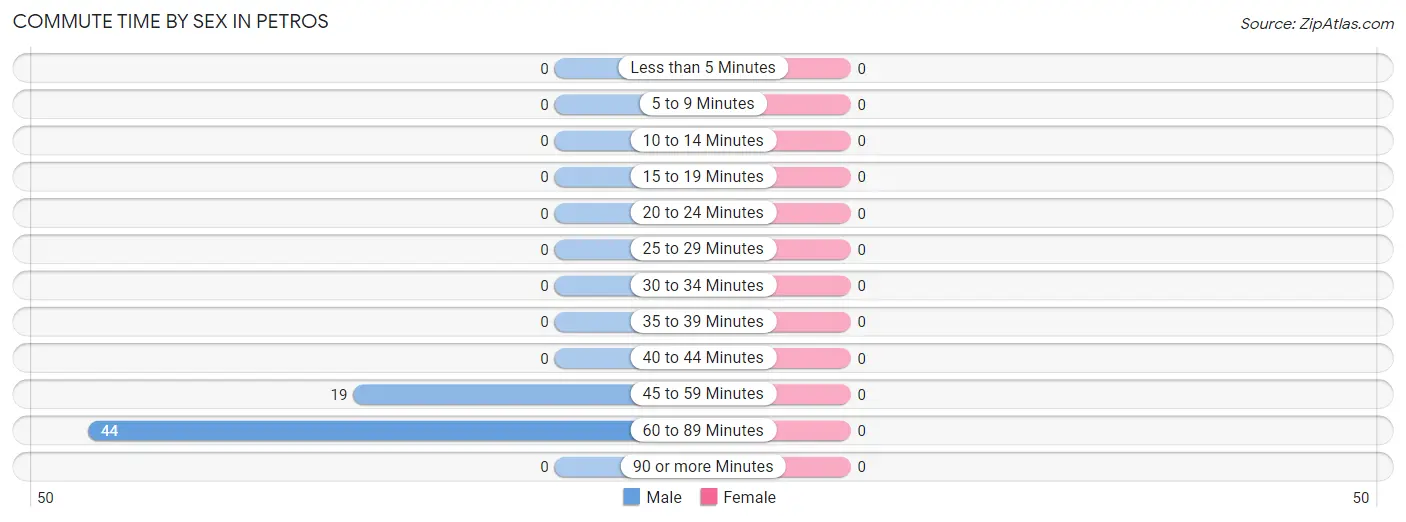
| Commute Time | Male | Female |
| Less than 5 Minutes | 0 (0.0%) | 0 (0.0%) |
| 5 to 9 Minutes | 0 (0.0%) | 0 (0.0%) |
| 10 to 14 Minutes | 0 (0.0%) | 0 (0.0%) |
| 15 to 19 Minutes | 0 (0.0%) | 0 (0.0%) |
| 20 to 24 Minutes | 0 (0.0%) | 0 (0.0%) |
| 25 to 29 Minutes | 0 (0.0%) | 0 (0.0%) |
| 30 to 34 Minutes | 0 (0.0%) | 0 (0.0%) |
| 35 to 39 Minutes | 0 (0.0%) | 0 (0.0%) |
| 40 to 44 Minutes | 0 (0.0%) | 0 (0.0%) |
| 45 to 59 Minutes | 19 (30.2%) | 0 (0.0%) |
| 60 to 89 Minutes | 44 (69.8%) | 0 (0.0%) |
| 90 or more Minutes | 0 (0.0%) | 0 (0.0%) |
Time of Departure to Work by Sex in Petros
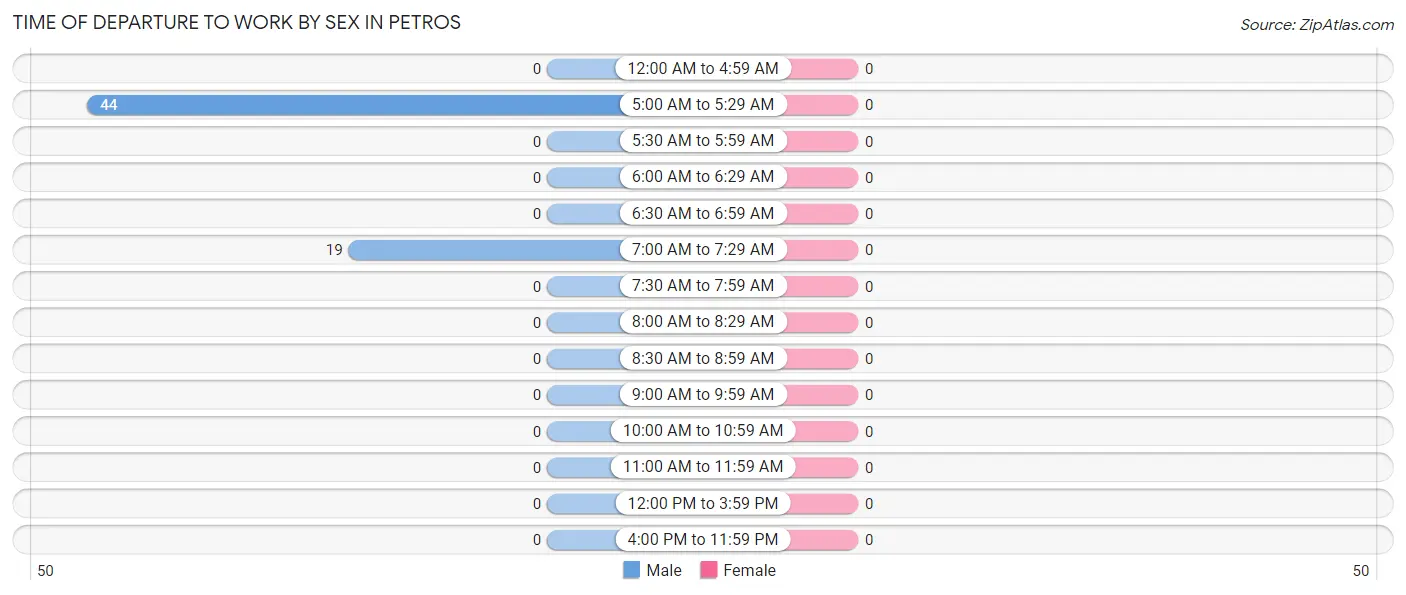
| Time of Departure | Male | Female |
| 12:00 AM to 4:59 AM | 0 (0.0%) | 0 (0.0%) |
| 5:00 AM to 5:29 AM | 44 (69.8%) | 0 (0.0%) |
| 5:30 AM to 5:59 AM | 0 (0.0%) | 0 (0.0%) |
| 6:00 AM to 6:29 AM | 0 (0.0%) | 0 (0.0%) |
| 6:30 AM to 6:59 AM | 0 (0.0%) | 0 (0.0%) |
| 7:00 AM to 7:29 AM | 19 (30.2%) | 0 (0.0%) |
| 7:30 AM to 7:59 AM | 0 (0.0%) | 0 (0.0%) |
| 8:00 AM to 8:29 AM | 0 (0.0%) | 0 (0.0%) |
| 8:30 AM to 8:59 AM | 0 (0.0%) | 0 (0.0%) |
| 9:00 AM to 9:59 AM | 0 (0.0%) | 0 (0.0%) |
| 10:00 AM to 10:59 AM | 0 (0.0%) | 0 (0.0%) |
| 11:00 AM to 11:59 AM | 0 (0.0%) | 0 (0.0%) |
| 12:00 PM to 3:59 PM | 0 (0.0%) | 0 (0.0%) |
| 4:00 PM to 11:59 PM | 0 (0.0%) | 0 (0.0%) |
| Total | 63 (100.0%) | 0 (0.0%) |
Housing Occupancy in Petros
Occupancy by Ownership in Petros
Of the total 181 dwellings in Petros, owner-occupied units account for 145 (80.1%), while renter-occupied units make up 36 (19.9%).
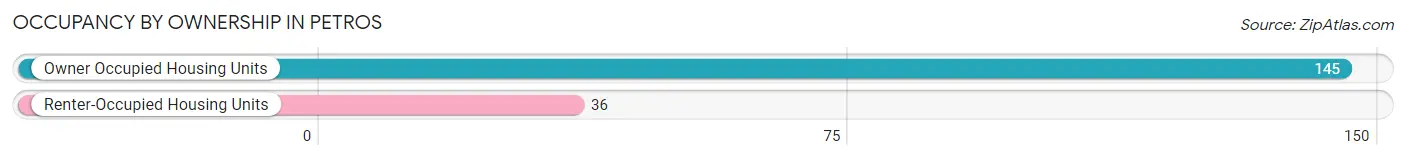
| Occupancy | # Housing Units | % Housing Units |
| Owner Occupied Housing Units | 145 | 80.1% |
| Renter-Occupied Housing Units | 36 | 19.9% |
| Total Occupied Housing Units | 181 | 100.0% |
Occupancy by Household Size in Petros
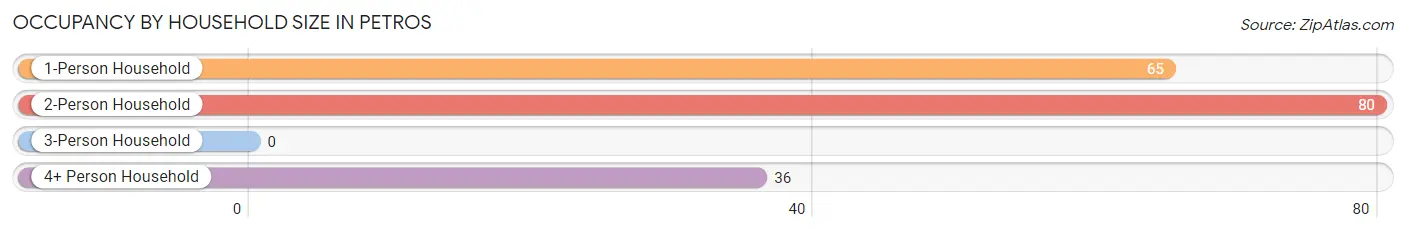
| Household Size | # Housing Units | % Housing Units |
| 1-Person Household | 65 | 35.9% |
| 2-Person Household | 80 | 44.2% |
| 3-Person Household | 0 | 0.0% |
| 4+ Person Household | 36 | 19.9% |
| Total Housing Units | 181 | 100.0% |
Occupancy by Ownership by Household Size in Petros
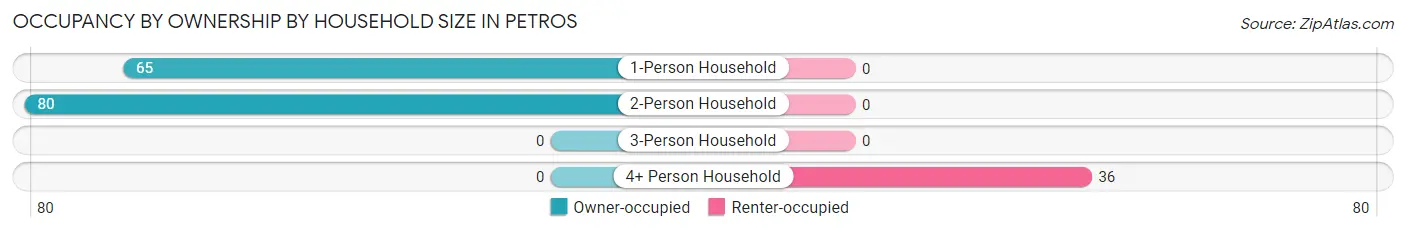
| Household Size | Owner-occupied | Renter-occupied |
| 1-Person Household | 65 (100.0%) | 0 (0.0%) |
| 2-Person Household | 80 (100.0%) | 0 (0.0%) |
| 3-Person Household | 0 (0.0%) | 0 (0.0%) |
| 4+ Person Household | 0 (0.0%) | 36 (100.0%) |
| Total Housing Units | 145 (80.1%) | 36 (19.9%) |
Occupancy by Educational Attainment in Petros
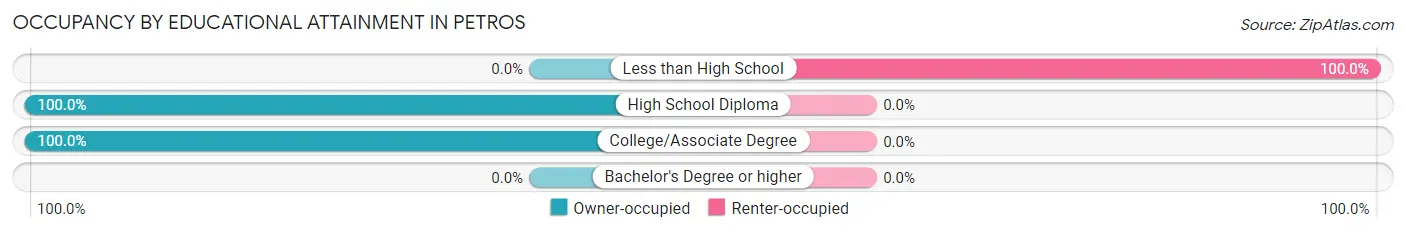
| Household Size | Owner-occupied | Renter-occupied |
| Less than High School | 0 (0.0%) | 36 (100.0%) |
| High School Diploma | 58 (100.0%) | 0 (0.0%) |
| College/Associate Degree | 87 (100.0%) | 0 (0.0%) |
| Bachelor's Degree or higher | 0 (0.0%) | 0 (0.0%) |
Occupancy by Age of Householder in Petros
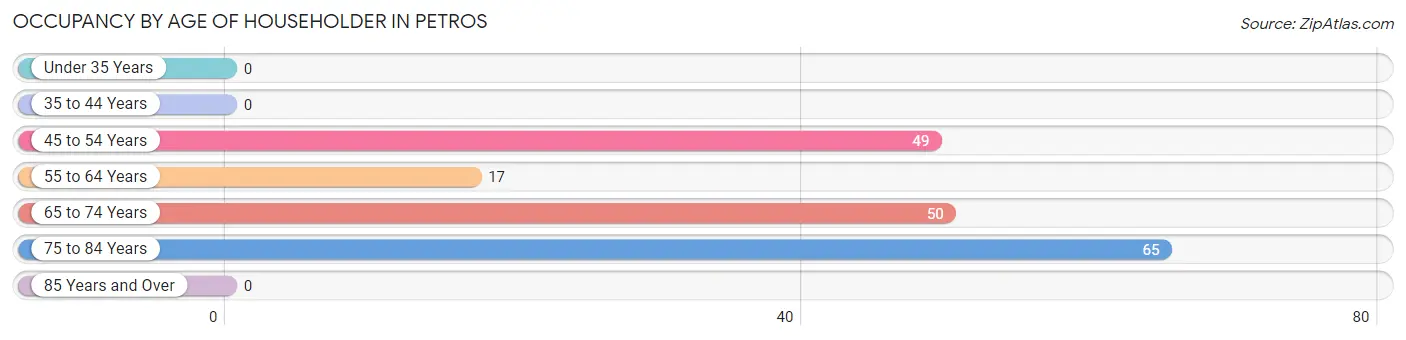
| Age Bracket | # Households | % Households |
| Under 35 Years | 0 | 0.0% |
| 35 to 44 Years | 0 | 0.0% |
| 45 to 54 Years | 49 | 27.1% |
| 55 to 64 Years | 17 | 9.4% |
| 65 to 74 Years | 50 | 27.6% |
| 75 to 84 Years | 65 | 35.9% |
| 85 Years and Over | 0 | 0.0% |
| Total | 181 | 100.0% |
Housing Finances in Petros
Median Income by Occupancy in Petros
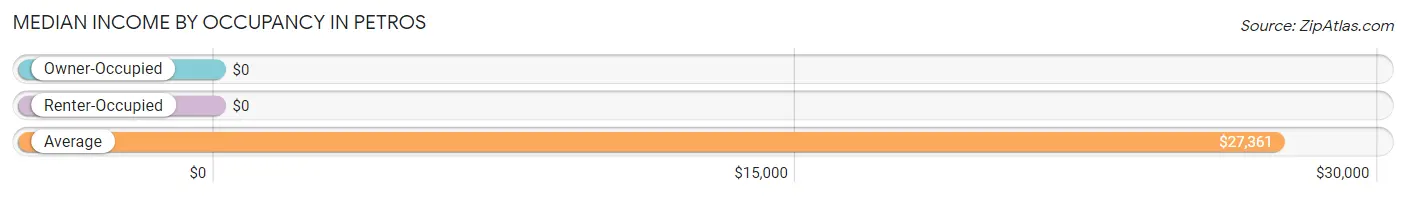
| Occupancy Type | # Households | Median Income |
| Owner-Occupied | 145 (80.1%) | $0 |
| Renter-Occupied | 36 (19.9%) | $0 |
| Average | 181 (100.0%) | $27,361 |
Occupancy by Householder Income Bracket in Petros
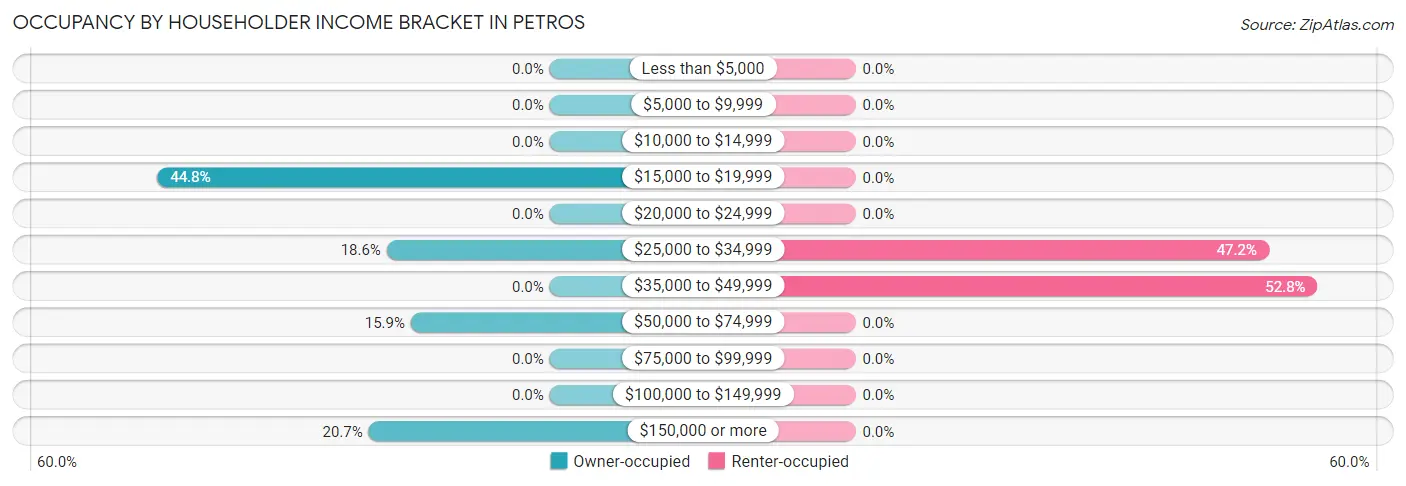
| Income Bracket | Owner-occupied | Renter-occupied |
| Less than $5,000 | 0 (0.0%) | 0 (0.0%) |
| $5,000 to $9,999 | 0 (0.0%) | 0 (0.0%) |
| $10,000 to $14,999 | 0 (0.0%) | 0 (0.0%) |
| $15,000 to $19,999 | 65 (44.8%) | 0 (0.0%) |
| $20,000 to $24,999 | 0 (0.0%) | 0 (0.0%) |
| $25,000 to $34,999 | 27 (18.6%) | 17 (47.2%) |
| $35,000 to $49,999 | 0 (0.0%) | 19 (52.8%) |
| $50,000 to $74,999 | 23 (15.9%) | 0 (0.0%) |
| $75,000 to $99,999 | 0 (0.0%) | 0 (0.0%) |
| $100,000 to $149,999 | 0 (0.0%) | 0 (0.0%) |
| $150,000 or more | 30 (20.7%) | 0 (0.0%) |
| Total | 145 (100.0%) | 36 (100.0%) |
Monthly Housing Cost Tiers in Petros
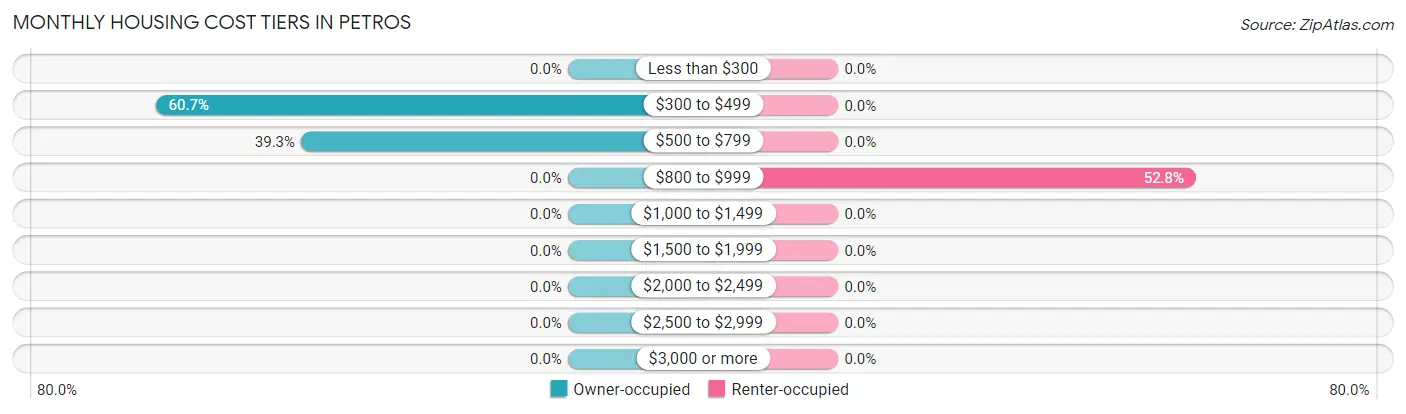
| Monthly Cost | Owner-occupied | Renter-occupied |
| Less than $300 | 0 (0.0%) | 0 (0.0%) |
| $300 to $499 | 88 (60.7%) | 0 (0.0%) |
| $500 to $799 | 57 (39.3%) | 0 (0.0%) |
| $800 to $999 | 0 (0.0%) | 19 (52.8%) |
| $1,000 to $1,499 | 0 (0.0%) | 0 (0.0%) |
| $1,500 to $1,999 | 0 (0.0%) | 0 (0.0%) |
| $2,000 to $2,499 | 0 (0.0%) | 0 (0.0%) |
| $2,500 to $2,999 | 0 (0.0%) | 0 (0.0%) |
| $3,000 or more | 0 (0.0%) | 0 (0.0%) |
| Total | 145 (100.0%) | 36 (100.0%) |
Physical Housing Characteristics in Petros
Housing Structures in Petros
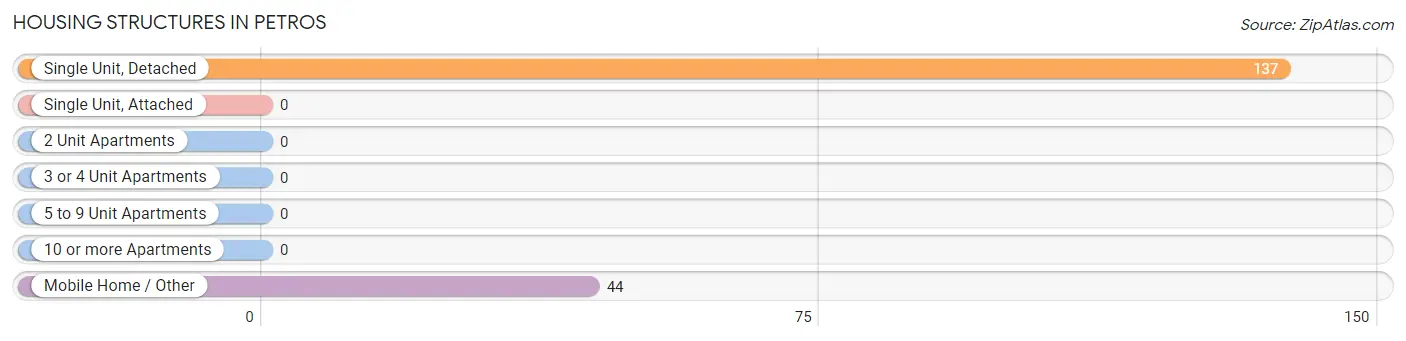
| Structure Type | # Housing Units | % Housing Units |
| Single Unit, Detached | 137 | 75.7% |
| Single Unit, Attached | 0 | 0.0% |
| 2 Unit Apartments | 0 | 0.0% |
| 3 or 4 Unit Apartments | 0 | 0.0% |
| 5 to 9 Unit Apartments | 0 | 0.0% |
| 10 or more Apartments | 0 | 0.0% |
| Mobile Home / Other | 44 | 24.3% |
| Total | 181 | 100.0% |
Housing Structures by Occupancy in Petros
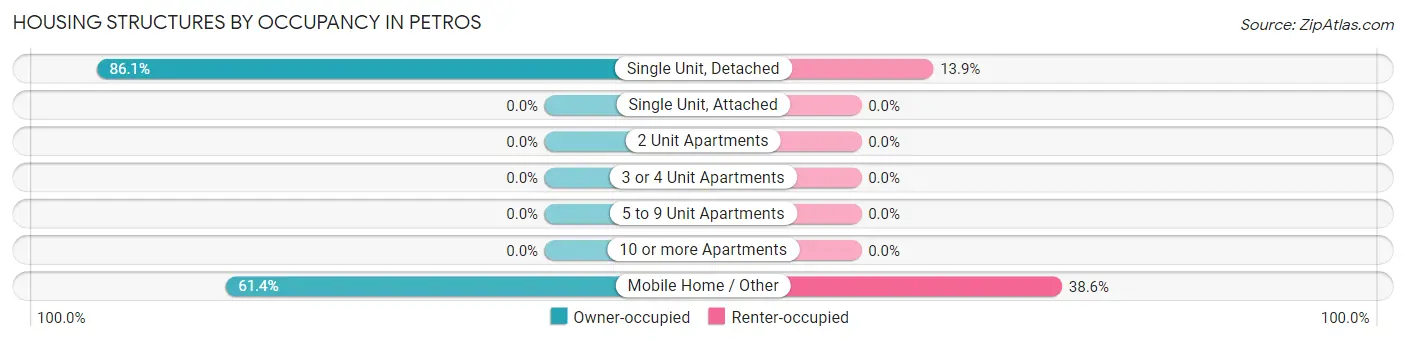
| Structure Type | Owner-occupied | Renter-occupied |
| Single Unit, Detached | 118 (86.1%) | 19 (13.9%) |
| Single Unit, Attached | 0 (0.0%) | 0 (0.0%) |
| 2 Unit Apartments | 0 (0.0%) | 0 (0.0%) |
| 3 or 4 Unit Apartments | 0 (0.0%) | 0 (0.0%) |
| 5 to 9 Unit Apartments | 0 (0.0%) | 0 (0.0%) |
| 10 or more Apartments | 0 (0.0%) | 0 (0.0%) |
| Mobile Home / Other | 27 (61.4%) | 17 (38.6%) |
| Total | 145 (80.1%) | 36 (19.9%) |
Housing Structures by Number of Rooms in Petros
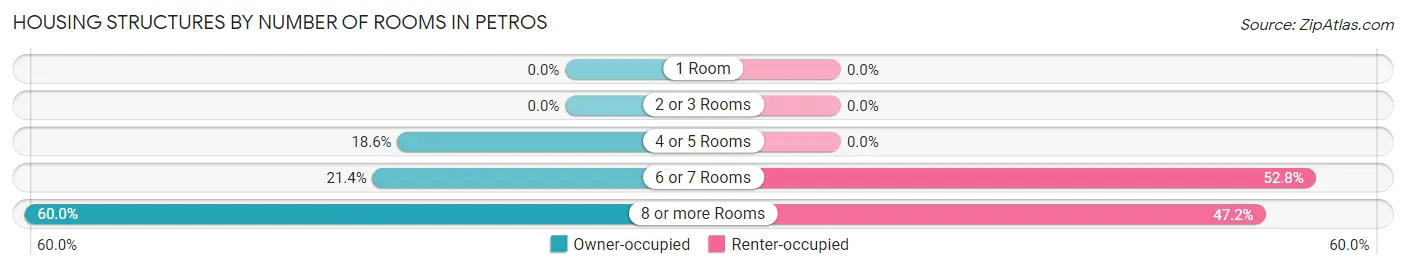
| Number of Rooms | Owner-occupied | Renter-occupied |
| 1 Room | 0 (0.0%) | 0 (0.0%) |
| 2 or 3 Rooms | 0 (0.0%) | 0 (0.0%) |
| 4 or 5 Rooms | 27 (18.6%) | 0 (0.0%) |
| 6 or 7 Rooms | 31 (21.4%) | 19 (52.8%) |
| 8 or more Rooms | 87 (60.0%) | 17 (47.2%) |
| Total | 145 (100.0%) | 36 (100.0%) |
Housing Structure by Heating Type in Petros
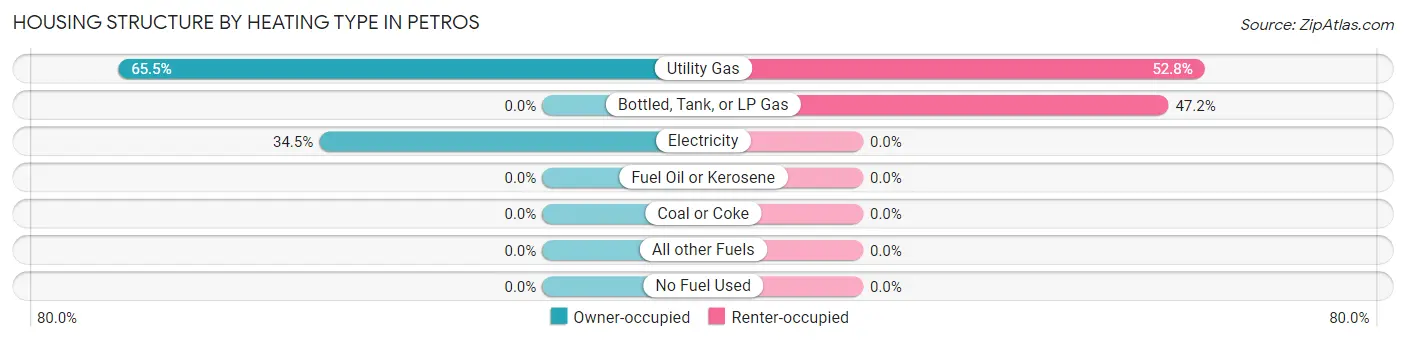
| Heating Type | Owner-occupied | Renter-occupied |
| Utility Gas | 95 (65.5%) | 19 (52.8%) |
| Bottled, Tank, or LP Gas | 0 (0.0%) | 17 (47.2%) |
| Electricity | 50 (34.5%) | 0 (0.0%) |
| Fuel Oil or Kerosene | 0 (0.0%) | 0 (0.0%) |
| Coal or Coke | 0 (0.0%) | 0 (0.0%) |
| All other Fuels | 0 (0.0%) | 0 (0.0%) |
| No Fuel Used | 0 (0.0%) | 0 (0.0%) |
| Total | 145 (100.0%) | 36 (100.0%) |
Household Vehicle Usage in Petros
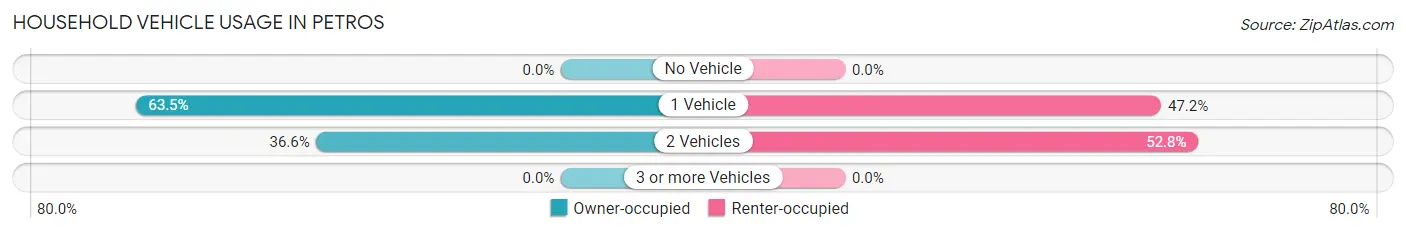
| Vehicles per Household | Owner-occupied | Renter-occupied |
| No Vehicle | 0 (0.0%) | 0 (0.0%) |
| 1 Vehicle | 92 (63.4%) | 17 (47.2%) |
| 2 Vehicles | 53 (36.5%) | 19 (52.8%) |
| 3 or more Vehicles | 0 (0.0%) | 0 (0.0%) |
| Total | 145 (100.0%) | 36 (100.0%) |
Real Estate & Mortgages in Petros
Real Estate and Mortgage Overview in Petros
| Characteristic | Without Mortgage | With Mortgage |
| Housing Units | 118 | 27 |
| Median Property Value | $173,300 | $0 |
| Median Household Income | - | - |
| Monthly Housing Costs | $345 | $0 |
| Real Estate Taxes | $534 | $0 |
Property Value by Mortgage Status in Petros
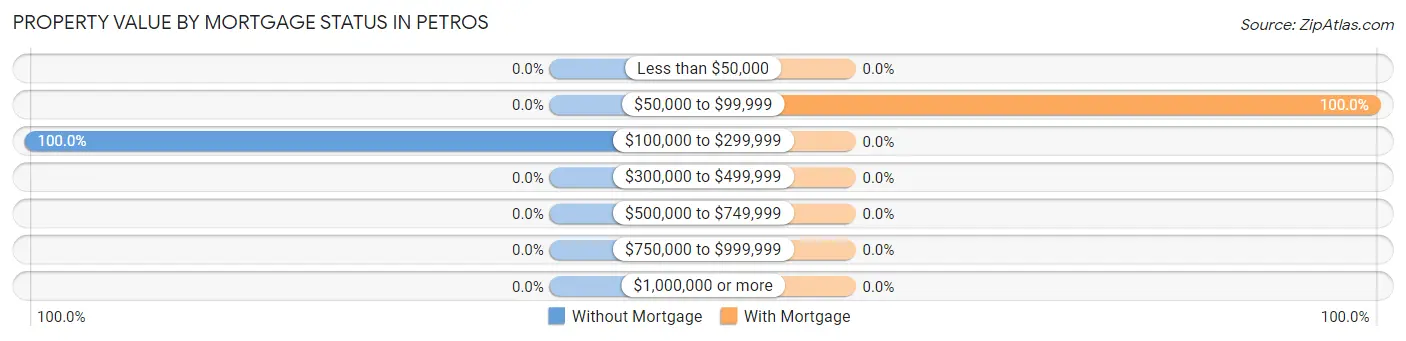
| Property Value | Without Mortgage | With Mortgage |
| Less than $50,000 | 0 (0.0%) | 0 (0.0%) |
| $50,000 to $99,999 | 0 (0.0%) | 27 (100.0%) |
| $100,000 to $299,999 | 118 (100.0%) | 0 (0.0%) |
| $300,000 to $499,999 | 0 (0.0%) | 0 (0.0%) |
| $500,000 to $749,999 | 0 (0.0%) | 0 (0.0%) |
| $750,000 to $999,999 | 0 (0.0%) | 0 (0.0%) |
| $1,000,000 or more | 0 (0.0%) | 0 (0.0%) |
| Total | 118 (100.0%) | 27 (100.0%) |
Household Income by Mortgage Status in Petros
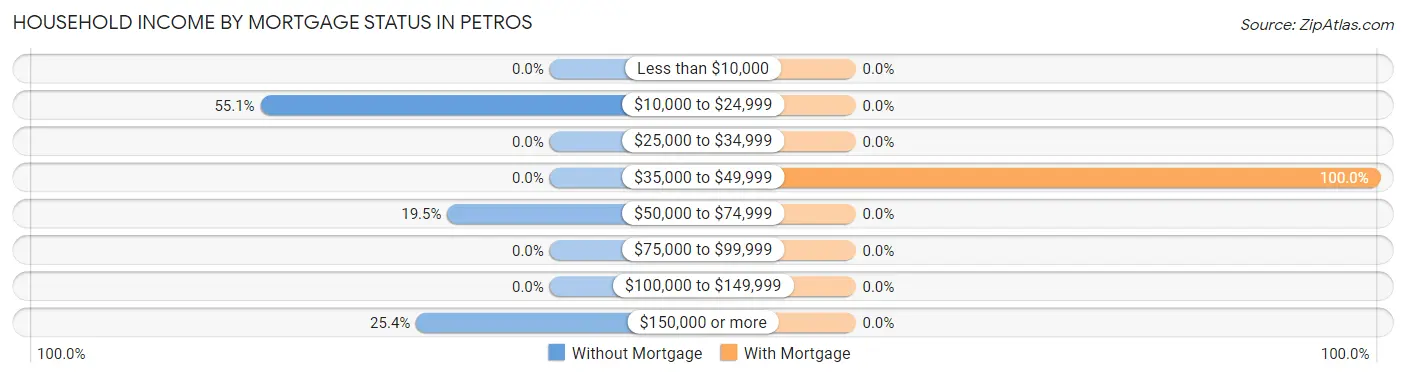
| Household Income | Without Mortgage | With Mortgage |
| Less than $10,000 | 0 (0.0%) | 0 (0.0%) |
| $10,000 to $24,999 | 65 (55.1%) | 0 (0.0%) |
| $25,000 to $34,999 | 0 (0.0%) | 0 (0.0%) |
| $35,000 to $49,999 | 0 (0.0%) | 27 (100.0%) |
| $50,000 to $74,999 | 23 (19.5%) | 0 (0.0%) |
| $75,000 to $99,999 | 0 (0.0%) | 0 (0.0%) |
| $100,000 to $149,999 | 0 (0.0%) | 0 (0.0%) |
| $150,000 or more | 30 (25.4%) | 0 (0.0%) |
| Total | 118 (100.0%) | 27 (100.0%) |
Property Value to Household Income Ratio in Petros
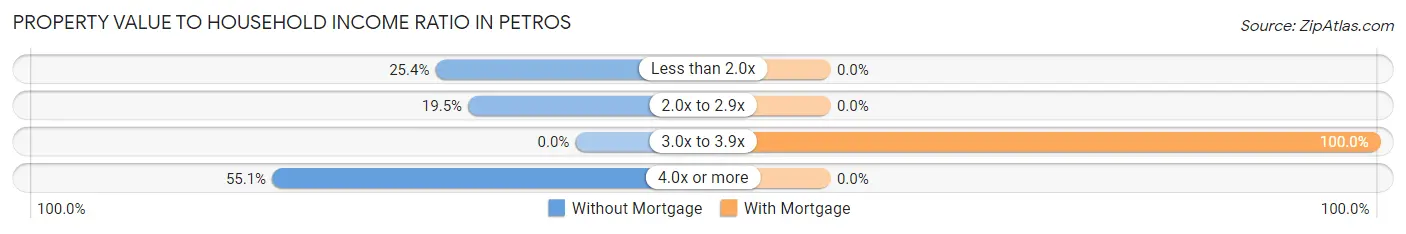
| Value-to-Income Ratio | Without Mortgage | With Mortgage |
| Less than 2.0x | 30 (25.4%) | 0 (0.0%) |
| 2.0x to 2.9x | 23 (19.5%) | 0 (0.0%) |
| 3.0x to 3.9x | 0 (0.0%) | 27 (100.0%) |
| 4.0x or more | 65 (55.1%) | 0 (0.0%) |
| Total | 118 (100.0%) | 27 (100.0%) |
Real Estate Taxes by Mortgage Status in Petros
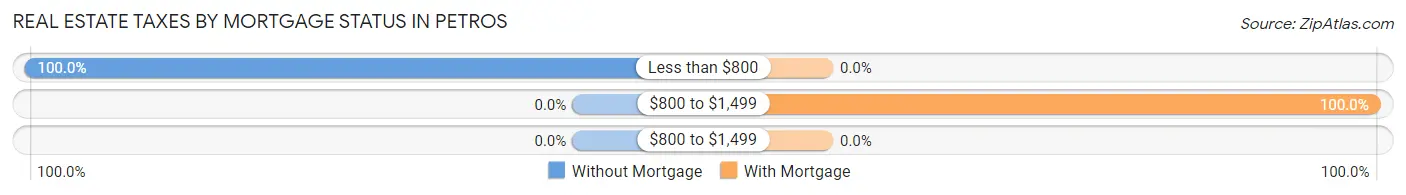
| Property Taxes | Without Mortgage | With Mortgage |
| Less than $800 | 118 (100.0%) | 0 (0.0%) |
| $800 to $1,499 | 0 (0.0%) | 27 (100.0%) |
| $800 to $1,499 | 0 (0.0%) | 0 (0.0%) |
| Total | 118 (100.0%) | 27 (100.0%) |
Health & Disability in Petros
Health Insurance Coverage by Age in Petros
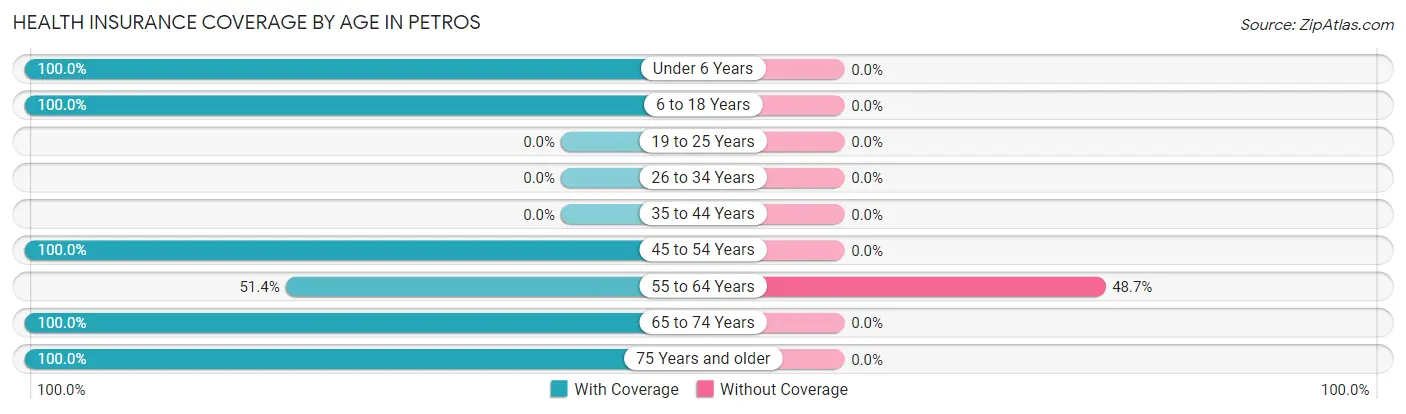
| Age Bracket | With Coverage | Without Coverage |
| Under 6 Years | 30 (100.0%) | 0 (0.0%) |
| 6 to 18 Years | 147 (100.0%) | 0 (0.0%) |
| 19 to 25 Years | 0 (0.0%) | 0 (0.0%) |
| 26 to 34 Years | 0 (0.0%) | 0 (0.0%) |
| 35 to 44 Years | 0 (0.0%) | 0 (0.0%) |
| 45 to 54 Years | 106 (100.0%) | 0 (0.0%) |
| 55 to 64 Years | 38 (51.3%) | 36 (48.6%) |
| 65 to 74 Years | 80 (100.0%) | 0 (0.0%) |
| 75 Years and older | 65 (100.0%) | 0 (0.0%) |
| Total | 466 (92.8%) | 36 (7.2%) |
Health Insurance Coverage by Citizenship Status in Petros

| Citizenship Status | With Coverage | Without Coverage |
| Native Born | 30 (100.0%) | 0 (0.0%) |
| Foreign Born, Citizen | 147 (100.0%) | 0 (0.0%) |
| Foreign Born, not a Citizen | 0 (0.0%) | 0 (0.0%) |
Health Insurance Coverage by Household Income in Petros
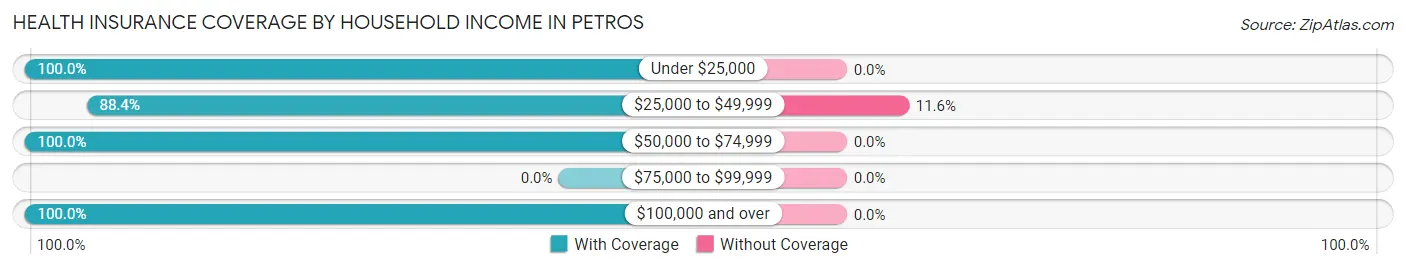
| Household Income | With Coverage | Without Coverage |
| Under $25,000 | 65 (100.0%) | 0 (0.0%) |
| $25,000 to $49,999 | 274 (88.4%) | 36 (11.6%) |
| $50,000 to $74,999 | 53 (100.0%) | 0 (0.0%) |
| $75,000 to $99,999 | 0 (0.0%) | 0 (0.0%) |
| $100,000 and over | 74 (100.0%) | 0 (0.0%) |
Public vs Private Health Insurance Coverage by Age in Petros
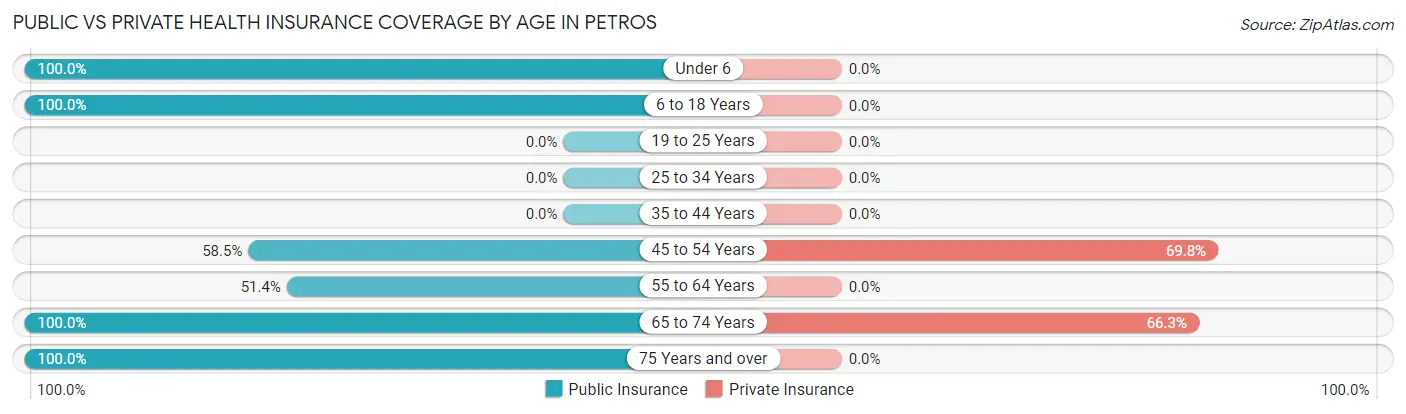
| Age Bracket | Public Insurance | Private Insurance |
| Under 6 | 30 (100.0%) | 0 (0.0%) |
| 6 to 18 Years | 147 (100.0%) | 0 (0.0%) |
| 19 to 25 Years | 0 (0.0%) | 0 (0.0%) |
| 25 to 34 Years | 0 (0.0%) | 0 (0.0%) |
| 35 to 44 Years | 0 (0.0%) | 0 (0.0%) |
| 45 to 54 Years | 62 (58.5%) | 74 (69.8%) |
| 55 to 64 Years | 38 (51.3%) | 0 (0.0%) |
| 65 to 74 Years | 80 (100.0%) | 53 (66.2%) |
| 75 Years and over | 65 (100.0%) | 0 (0.0%) |
| Total | 422 (84.1%) | 127 (25.3%) |
Disability Status by Sex by Age in Petros
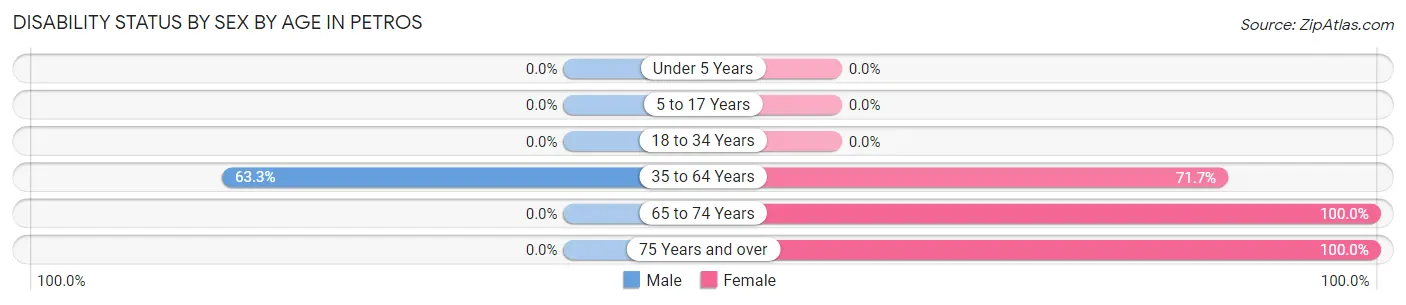
| Age Bracket | Male | Female |
| Under 5 Years | 0 (0.0%) | 0 (0.0%) |
| 5 to 17 Years | 0 (0.0%) | 0 (0.0%) |
| 18 to 34 Years | 0 (0.0%) | 0 (0.0%) |
| 35 to 64 Years | 76 (63.3%) | 43 (71.7%) |
| 65 to 74 Years | 0 (0.0%) | 57 (100.0%) |
| 75 Years and over | 0 (0.0%) | 65 (100.0%) |
Disability Class by Sex by Age in Petros
Disability Class: Hearing Difficulty
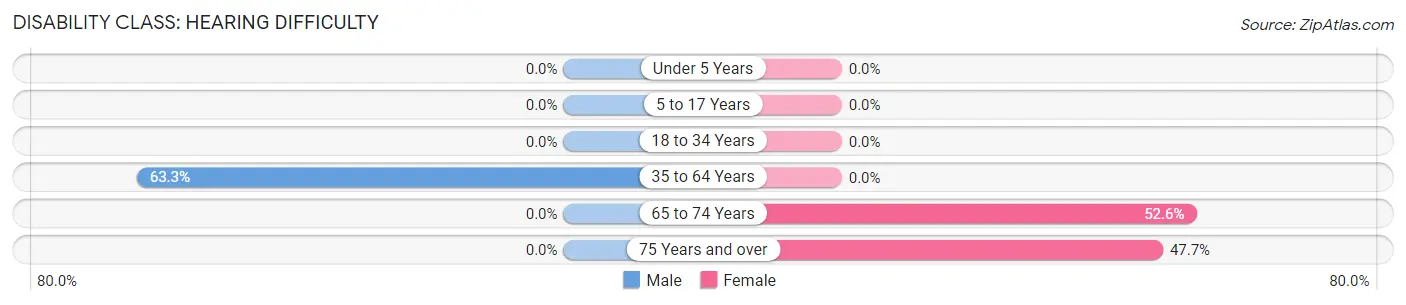
| Age Bracket | Male | Female |
| Under 5 Years | 0 (0.0%) | 0 (0.0%) |
| 5 to 17 Years | 0 (0.0%) | 0 (0.0%) |
| 18 to 34 Years | 0 (0.0%) | 0 (0.0%) |
| 35 to 64 Years | 76 (63.3%) | 0 (0.0%) |
| 65 to 74 Years | 0 (0.0%) | 30 (52.6%) |
| 75 Years and over | 0 (0.0%) | 31 (47.7%) |
Disability Class: Vision Difficulty
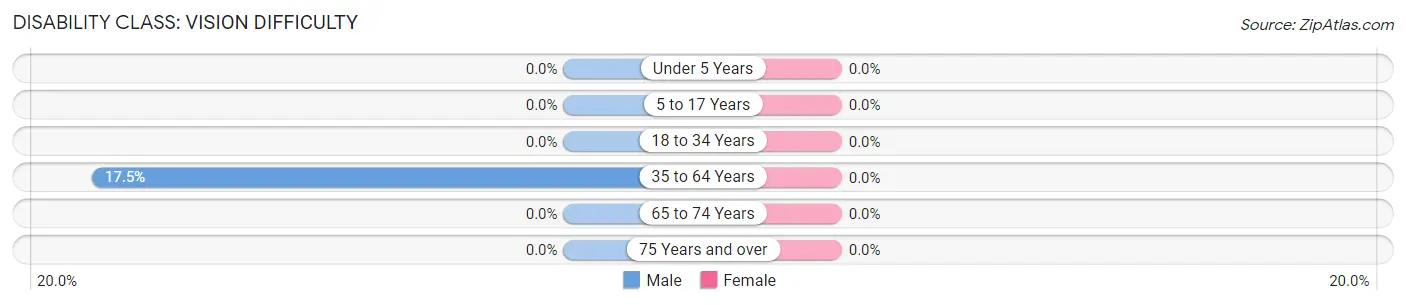
| Age Bracket | Male | Female |
| Under 5 Years | 0 (0.0%) | 0 (0.0%) |
| 5 to 17 Years | 0 (0.0%) | 0 (0.0%) |
| 18 to 34 Years | 0 (0.0%) | 0 (0.0%) |
| 35 to 64 Years | 21 (17.5%) | 0 (0.0%) |
| 65 to 74 Years | 0 (0.0%) | 0 (0.0%) |
| 75 Years and over | 0 (0.0%) | 0 (0.0%) |
Disability Class: Cognitive Difficulty
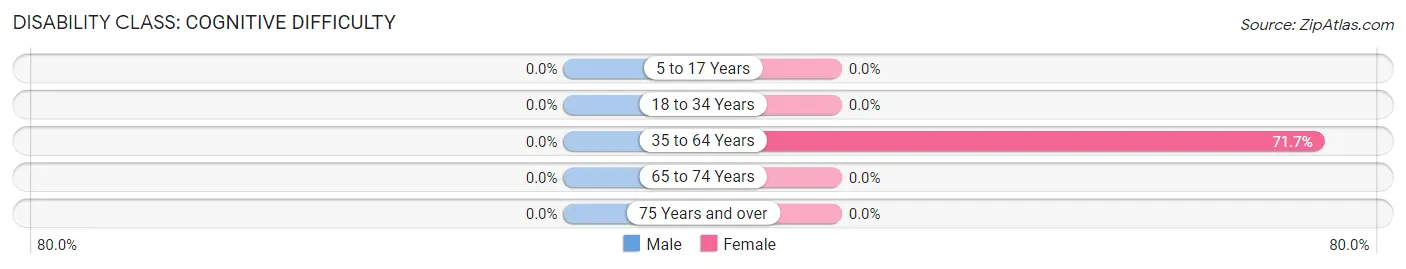
| Age Bracket | Male | Female |
| 5 to 17 Years | 0 (0.0%) | 0 (0.0%) |
| 18 to 34 Years | 0 (0.0%) | 0 (0.0%) |
| 35 to 64 Years | 0 (0.0%) | 43 (71.7%) |
| 65 to 74 Years | 0 (0.0%) | 0 (0.0%) |
| 75 Years and over | 0 (0.0%) | 0 (0.0%) |
Disability Class: Ambulatory Difficulty
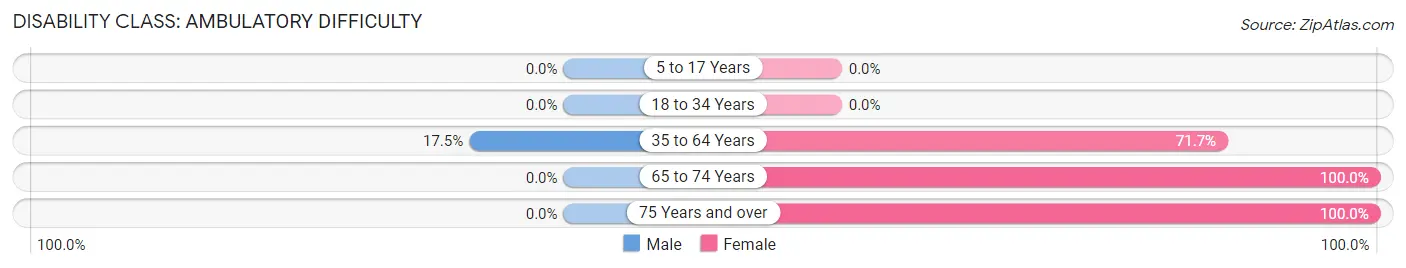
| Age Bracket | Male | Female |
| 5 to 17 Years | 0 (0.0%) | 0 (0.0%) |
| 18 to 34 Years | 0 (0.0%) | 0 (0.0%) |
| 35 to 64 Years | 21 (17.5%) | 43 (71.7%) |
| 65 to 74 Years | 0 (0.0%) | 57 (100.0%) |
| 75 Years and over | 0 (0.0%) | 65 (100.0%) |
Disability Class: Self-Care Difficulty
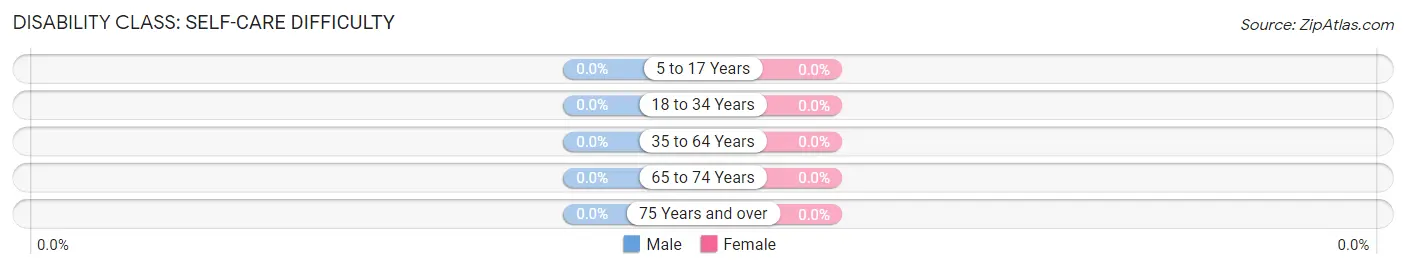
| Age Bracket | Male | Female |
| 5 to 17 Years | 0 (0.0%) | 0 (0.0%) |
| 18 to 34 Years | 0 (0.0%) | 0 (0.0%) |
| 35 to 64 Years | 0 (0.0%) | 0 (0.0%) |
| 65 to 74 Years | 0 (0.0%) | 0 (0.0%) |
| 75 Years and over | 0 (0.0%) | 0 (0.0%) |
Technology Access in Petros
Computing Device Access in Petros
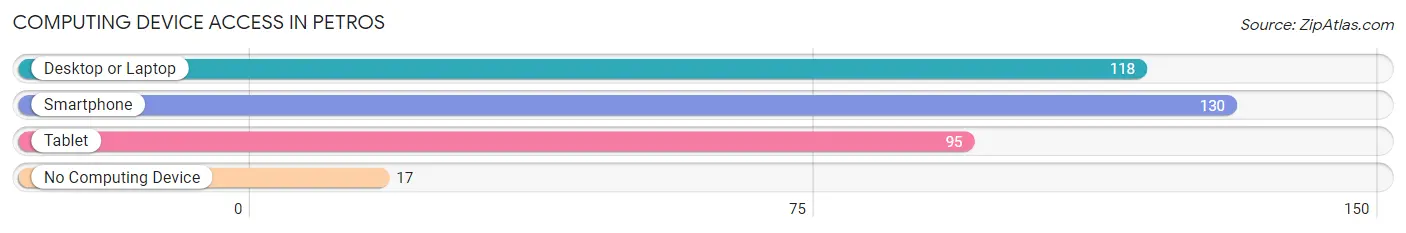
| Device Type | # Households | % Households |
| Desktop or Laptop | 118 | 65.2% |
| Smartphone | 130 | 71.8% |
| Tablet | 95 | 52.5% |
| No Computing Device | 17 | 9.4% |
| Total | 181 | 100.0% |
Internet Access in Petros
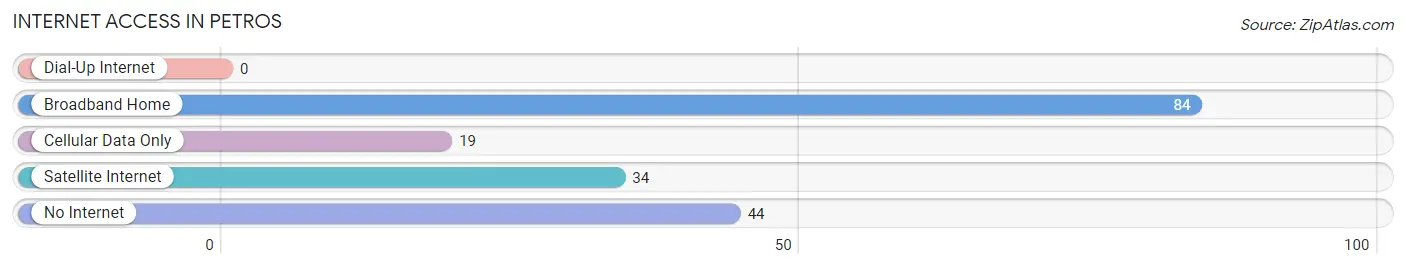
| Internet Type | # Households | % Households |
| Dial-Up Internet | 0 | 0.0% |
| Broadband Home | 84 | 46.4% |
| Cellular Data Only | 19 | 10.5% |
| Satellite Internet | 34 | 18.8% |
| No Internet | 44 | 24.3% |
| Total | 181 | 100.0% |
Petros Summary
TN History
Tennessee is a state located in the southeastern United States. It was admitted to the Union as the 16th state on June 1, 1796. Tennessee is known as the “Volunteer State” due to the large number of volunteers who fought in the War of 1812. Tennessee was the last state to secede from the Union during the Civil War, and it was the first state to be readmitted to the Union after the war.
The first inhabitants of Tennessee were Native Americans, including the Cherokee, Chickasaw, and Shawnee. The first Europeans to explore the area were Spanish explorers in the 16th century. The first permanent European settlement in Tennessee was established in 1756 by James Robertson and John Donelson.
Tennessee was part of the Southwest Territory, which was created in 1790. The Southwest Territory was divided into the states of Tennessee, Kentucky, and Mississippi in 1796. Tennessee was the first state to be admitted to the Union from the Southwest Territory.
Tennessee was an important state during the Civil War. It was the last state to secede from the Union in 1861 and the first state to be readmitted to the Union in 1866. During the war, Tennessee was the site of several major battles, including the Battle of Shiloh and the Battle of Chattanooga.
Tennessee has played an important role in the development of American music. It is the birthplace of country music, and it is home to the famous Grand Ole Opry in Nashville. Tennessee is also home to the Memphis-based Stax Records, which was an important label in the development of soul music.
TN Geography
Tennessee is located in the southeastern United States. It is bordered by eight states: Kentucky to the north, Virginia to the northeast, North Carolina to the east, Georgia, Alabama, and Mississippi to the south, and Arkansas and Missouri to the west.
Tennessee is divided into three distinct geographic regions: the Appalachian Mountains in the east, the Central Basin in the middle, and the Gulf Coastal Plain in the west. The Appalachian Mountains are the oldest mountains in the United States and are home to the Great Smoky Mountains National Park. The Central Basin is a low-lying area that is home to the state capital, Nashville. The Gulf Coastal Plain is a flat area that is home to the Mississippi River.
Tennessee is home to many rivers, including the Tennessee River, the Cumberland River, and the Mississippi River. The Tennessee River is the longest river in the state and is a major source of hydroelectric power. The Cumberland River is a major tributary of the Ohio River and is an important source of water for the state. The Mississippi River forms the western border of the state.
TN Economy
Tennessee has a diverse economy that is driven by agriculture, manufacturing, and tourism. Agriculture is the state’s largest industry, with soybeans, cotton, and tobacco being the main crops. Manufacturing is also an important part of the economy, with automotive, chemical, and food processing being the main industries. Tourism is also a major contributor to the economy, with visitors coming to the state to visit its many attractions, including the Great Smoky Mountains National Park and Graceland.
Tennessee is home to several major companies, including FedEx, AutoZone, and International Paper. The state is also home to several major universities, including the University of Tennessee, Vanderbilt University, and the University of Memphis.
TN Demographics
As of 2019, the population of Tennessee was 6.8 million. The state is predominantly white, with African Americans making up 17.2% of the population and Hispanics making up 5.2%. The median household income in the state is $50,564, and the median age is 38.
Tennessee is a predominantly Christian state, with Baptists making up the largest religious group. Other major religious groups include Methodists, Presbyterians, and Catholics.
Conclusion
Tennessee is a state located in the southeastern United States. It was admitted to the Union as the 16th state on June 1, 1796. Tennessee is known as the “Volunteer State” due to the large number of volunteers who fought in the War of 1812. Tennessee is divided into three distinct geographic regions: the Appalachian Mountains in the east, the Central Basin in the middle, and the Gulf Coastal Plain in the west. The state’s economy is driven by agriculture, manufacturing, and tourism. The population of Tennessee is predominantly white, with African Americans making up 17.2% of the population and Hispanics making up 5.2%. Tennessee is a predominantly Christian state, with Baptists making up the largest religious group.
Common Questions
What is Per Capita Income in Petros?
Per Capita income in Petros is $109,591.
What is the Median Household income in Petros?
Median Household Income in Petros is $27,361.
What is Inequality or Gini Index in Petros?
Inequality or Gini Index in Petros is 0.74.
What is the Total Population of Petros?
Total Population of Petros is 502.
What is the Total Male Population of Petros?
Total Male Population of Petros is 205.
What is the Total Female Population of Petros?
Total Female Population of Petros is 297.
What is the Ratio of Males per 100 Females in Petros?
There are 69.02 Males per 100 Females in Petros.
What is the Ratio of Females per 100 Males in Petros?
There are 144.88 Females per 100 Males in Petros.
What is the Median Population Age in Petros?
Median Population Age in Petros is 49.0 Years.
What is the Average Family Size in Petros
Average Family Size in Petros is 3.3 People.
What is the Average Household Size in Petros
Average Household Size in Petros is 2.8 People.
How Large is the Labor Force in Petros?
There are 63 People in the Labor Forcein in Petros.
What is the Percentage of People in the Labor Force in Petros?
18.6% of People are in the Labor Force in Petros.