Tiawah, OK Map & Demographics
Tiawah Map
Tiawah Overview
$36,652
PER CAPITA INCOME
$78,250
AVG FAMILY INCOME
$69,514
AVG HOUSEHOLD INCOME
0.34
INEQUALITY / GINI INDEX
159
TOTAL POPULATION
105
MALE POPULATION
54
FEMALE POPULATION
194.44
MALES / 100 FEMALES
51.43
FEMALES / 100 MALES
51.9
MEDIAN AGE
2.5
AVG FAMILY SIZE
2.5
AVG HOUSEHOLD SIZE
92
LABOR FORCE [ PEOPLE ]
57.9%
PERCENT IN LABOR FORCE
Income in Tiawah
Income Overview in Tiawah
Per Capita Income in Tiawah is $36,652, while median incomes of families and households are $78,250 and $69,514 respectively.
| Characteristic | Number | Measure |
| Per Capita Income | 159 | $36,652 |
| Median Family Income | 52 | $78,250 |
| Mean Family Income | 52 | $96,612 |
| Median Household Income | 65 | $69,514 |
| Mean Household Income | 65 | $87,803 |
| Income Deficit | 52 | $0 |
| Wage / Income Gap (%) | 159 | 0.00% |
| Wage / Income Gap ($) | 159 | 100.00¢ per $1 |
| Gini / Inequality Index | 159 | 0.34 |
Earnings by Sex in Tiawah
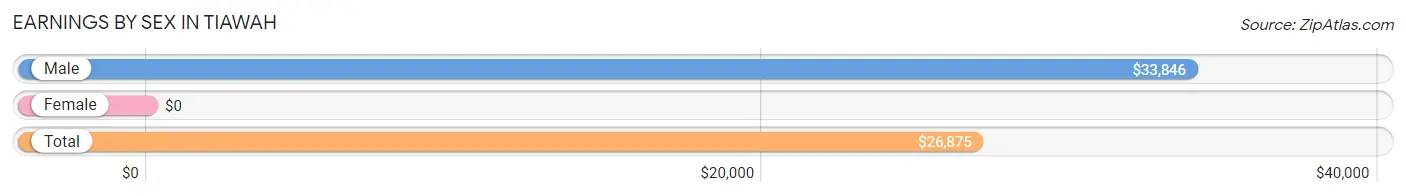
| Sex | Number | Average Earnings |
| Male | 72 (68.6%) | $33,846 |
| Female | 33 (31.4%) | $0 |
| Total | 105 (100.0%) | $26,875 |
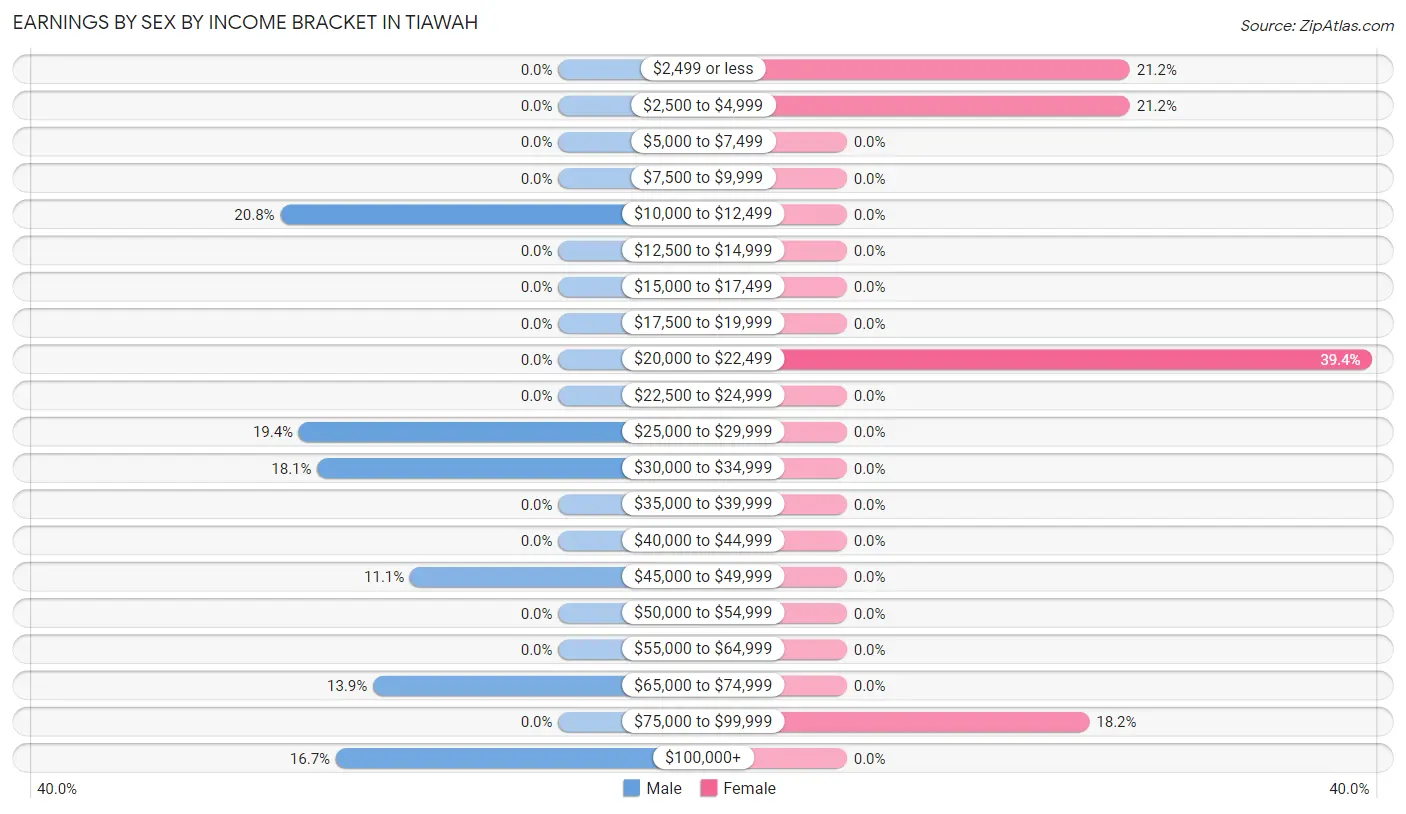
Earnings by Sex by Income Bracket in Tiawah
The most common earnings brackets in Tiawah are $10,000 to $12,499 for men (15 | 20.8%) and $20,000 to $22,499 for women (13 | 39.4%).
| Income | Male | Female |
| $2,499 or less | 0 (0.0%) | 7 (21.2%) |
| $2,500 to $4,999 | 0 (0.0%) | 7 (21.2%) |
| $5,000 to $7,499 | 0 (0.0%) | 0 (0.0%) |
| $7,500 to $9,999 | 0 (0.0%) | 0 (0.0%) |
| $10,000 to $12,499 | 15 (20.8%) | 0 (0.0%) |
| $12,500 to $14,999 | 0 (0.0%) | 0 (0.0%) |
| $15,000 to $17,499 | 0 (0.0%) | 0 (0.0%) |
| $17,500 to $19,999 | 0 (0.0%) | 0 (0.0%) |
| $20,000 to $22,499 | 0 (0.0%) | 13 (39.4%) |
| $22,500 to $24,999 | 0 (0.0%) | 0 (0.0%) |
| $25,000 to $29,999 | 14 (19.4%) | 0 (0.0%) |
| $30,000 to $34,999 | 13 (18.1%) | 0 (0.0%) |
| $35,000 to $39,999 | 0 (0.0%) | 0 (0.0%) |
| $40,000 to $44,999 | 0 (0.0%) | 0 (0.0%) |
| $45,000 to $49,999 | 8 (11.1%) | 0 (0.0%) |
| $50,000 to $54,999 | 0 (0.0%) | 0 (0.0%) |
| $55,000 to $64,999 | 0 (0.0%) | 0 (0.0%) |
| $65,000 to $74,999 | 10 (13.9%) | 0 (0.0%) |
| $75,000 to $99,999 | 0 (0.0%) | 6 (18.2%) |
| $100,000+ | 12 (16.7%) | 0 (0.0%) |
| Total | 72 (100.0%) | 33 (100.0%) |
Earnings by Sex by Educational Attainment in Tiawah
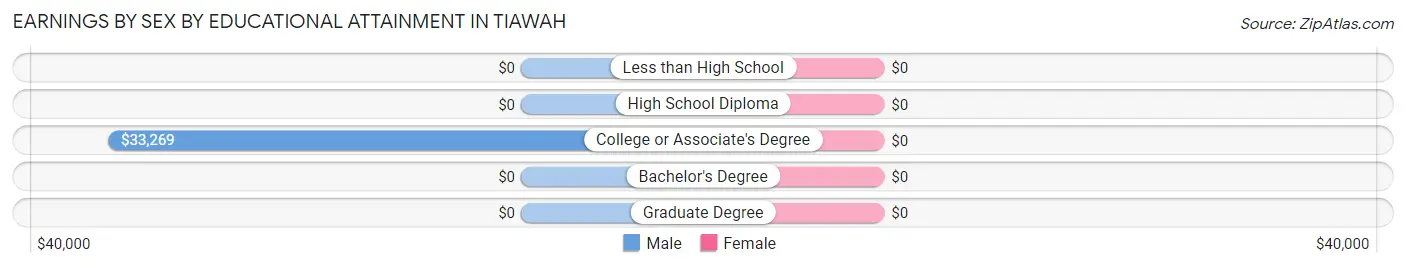
| Educational Attainment | Male Income | Female Income |
| Less than High School | - | - |
| High School Diploma | - | - |
| College or Associate's Degree | $33,269 | $0 |
| Bachelor's Degree | - | - |
| Graduate Degree | - | - |
| Total | $33,846 | $0 |
Family Income in Tiawah
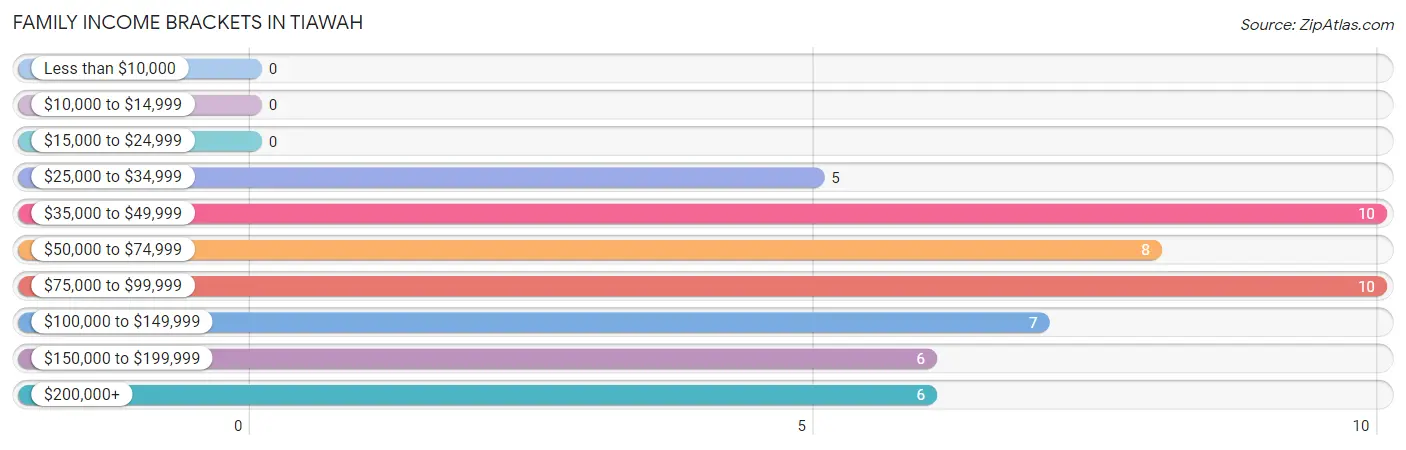
Family Income Brackets in Tiawah
According to the Tiawah family income data, there are 10 families falling into the $35,000 to $49,999 income range, which is the most common income bracket and makes up 19.2% of all families.
| Income Bracket | # Families | % Families |
| Less than $10,000 | 0 | 0.0% |
| $10,000 to $14,999 | 0 | 0.0% |
| $15,000 to $24,999 | 0 | 0.0% |
| $25,000 to $34,999 | 5 | 9.6% |
| $35,000 to $49,999 | 10 | 19.2% |
| $50,000 to $74,999 | 8 | 15.4% |
| $75,000 to $99,999 | 10 | 19.2% |
| $100,000 to $149,999 | 7 | 13.5% |
| $150,000 to $199,999 | 6 | 11.5% |
| $200,000+ | 6 | 11.5% |
Family Income by Famaliy Size in Tiawah
| Income Bracket | # Families | Median Income |
| 2-Person Families | 27 (51.9%) | $0 |
| 3-Person Families | 25 (48.1%) | $0 |
| 4-Person Families | 0 (0.0%) | $0 |
| 5-Person Families | 0 (0.0%) | $0 |
| 6-Person Families | 0 (0.0%) | $0 |
| 7+ Person Families | 0 (0.0%) | $0 |
| Total | 52 (100.0%) | $78,250 |
Family Income by Number of Earners in Tiawah
| Number of Earners | # Families | Median Income |
| No Earners | 0 (0.0%) | $0 |
| 1 Earner | 28 (53.8%) | $0 |
| 2 Earners | 24 (46.2%) | $0 |
| 3+ Earners | 0 (0.0%) | $0 |
| Total | 52 (100.0%) | $78,250 |
Household Income in Tiawah
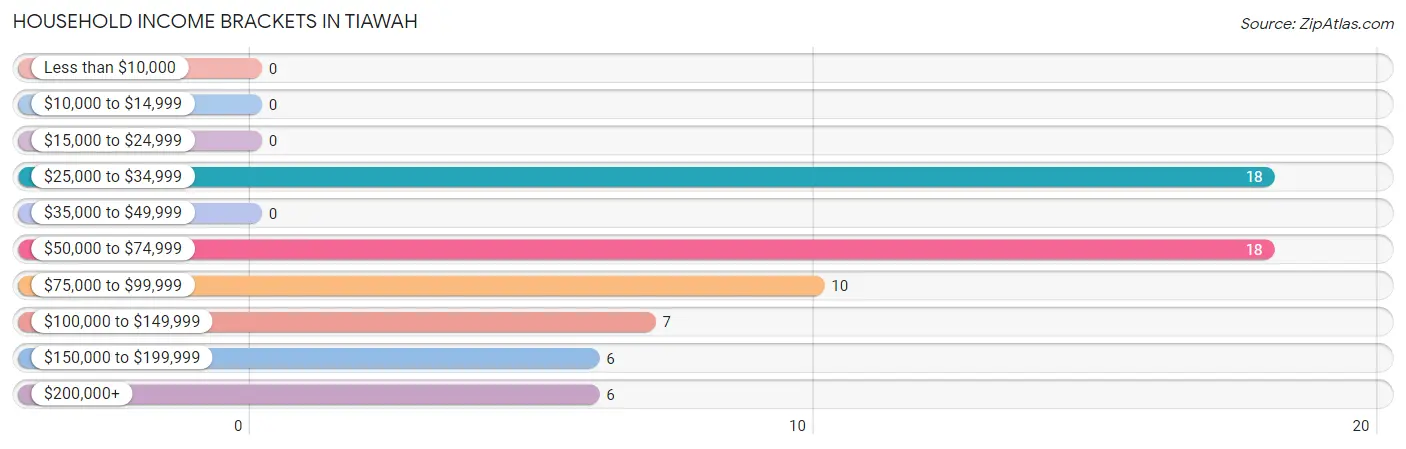
Household Income Brackets in Tiawah
With 18 households falling in the category, the $25,000 to $34,999 income range is the most frequent in Tiawah, accounting for 27.7% of all households.
| Income Bracket | # Households | % Households |
| Less than $10,000 | 0 | 0.0% |
| $10,000 to $14,999 | 0 | 0.0% |
| $15,000 to $24,999 | 0 | 0.0% |
| $25,000 to $34,999 | 18 | 27.7% |
| $35,000 to $49,999 | 0 | 0.0% |
| $50,000 to $74,999 | 18 | 27.7% |
| $75,000 to $99,999 | 10 | 15.4% |
| $100,000 to $149,999 | 7 | 10.8% |
| $150,000 to $199,999 | 6 | 9.2% |
| $200,000+ | 6 | 9.2% |
Household Income by Householder Age in Tiawah
The median household income in Tiawah is $69,514, with the highest median household income of $69,375 found in the 45 to 64 years age bracket for the primary householder. A total of 48 households (73.9%) fall into this category.
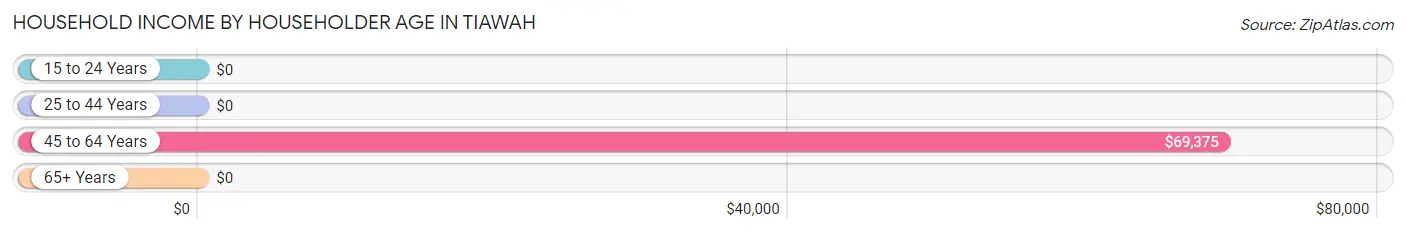
| Income Bracket | # Households | Median Income |
| 15 to 24 Years | 0 (0.0%) | $0 |
| 25 to 44 Years | 10 (15.4%) | $0 |
| 45 to 64 Years | 48 (73.9%) | $69,375 |
| 65+ Years | 7 (10.8%) | $0 |
| Total | 65 (100.0%) | $69,514 |
Poverty in Tiawah
Income Below Poverty by Sex and Age in Tiawah
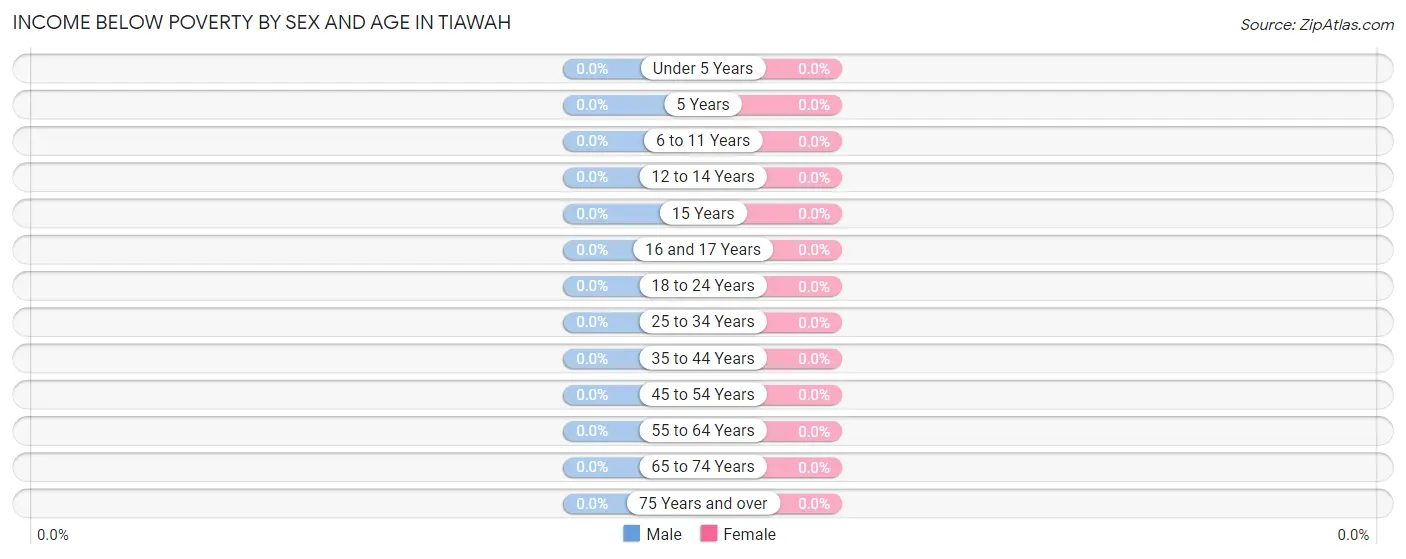
| Age Bracket | Male | Female |
| Under 5 Years | 0 (0.0%) | 0 (0.0%) |
| 5 Years | 0 (0.0%) | 0 (0.0%) |
| 6 to 11 Years | 0 (0.0%) | 0 (0.0%) |
| 12 to 14 Years | 0 (0.0%) | 0 (0.0%) |
| 15 Years | 0 (0.0%) | 0 (0.0%) |
| 16 and 17 Years | 0 (0.0%) | 0 (0.0%) |
| 18 to 24 Years | 0 (0.0%) | 0 (0.0%) |
| 25 to 34 Years | 0 (0.0%) | 0 (0.0%) |
| 35 to 44 Years | 0 (0.0%) | 0 (0.0%) |
| 45 to 54 Years | 0 (0.0%) | 0 (0.0%) |
| 55 to 64 Years | 0 (0.0%) | 0 (0.0%) |
| 65 to 74 Years | 0 (0.0%) | 0 (0.0%) |
| 75 Years and over | 0 (0.0%) | 0 (0.0%) |
| Total | 0 (0.0%) | 0 (0.0%) |
Income Above Poverty by Sex and Age in Tiawah
According to the poverty statistics in Tiawah, males aged 16 and 17 years and females aged 16 and 17 years are the age groups that are most secure financially, with 100.0% of males and 100.0% of females in these age groups living above the poverty line.
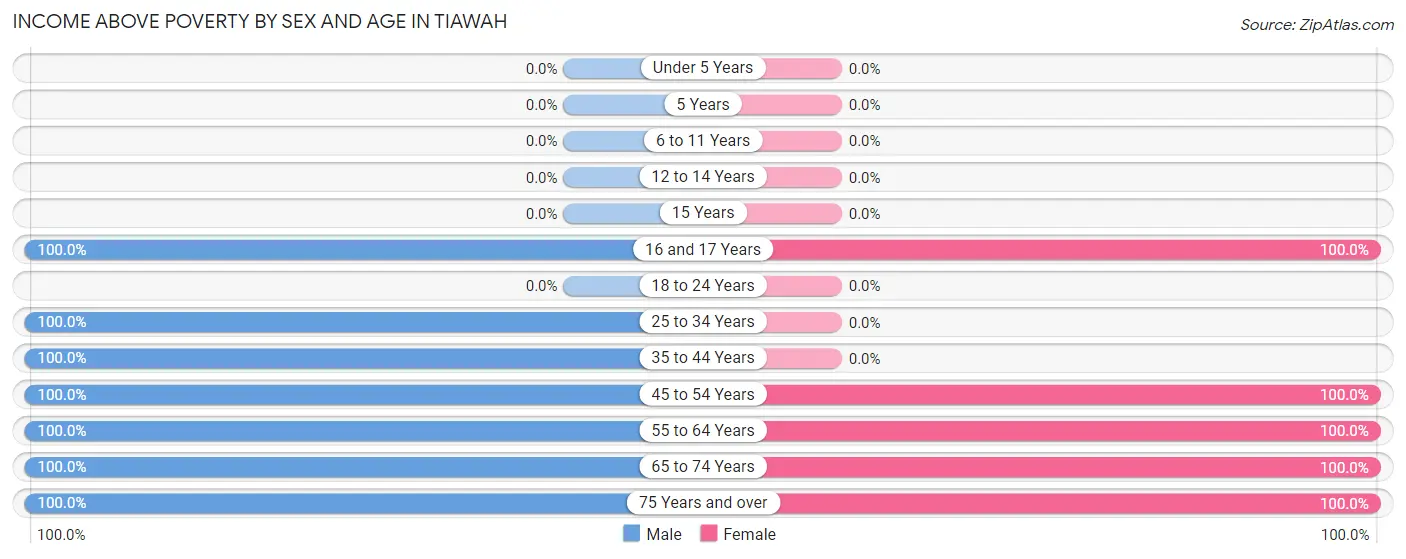
| Age Bracket | Male | Female |
| Under 5 Years | 0 (0.0%) | 0 (0.0%) |
| 5 Years | 0 (0.0%) | 0 (0.0%) |
| 6 to 11 Years | 0 (0.0%) | 0 (0.0%) |
| 12 to 14 Years | 0 (0.0%) | 0 (0.0%) |
| 15 Years | 0 (0.0%) | 0 (0.0%) |
| 16 and 17 Years | 10 (100.0%) | 7 (100.0%) |
| 18 to 24 Years | 0 (0.0%) | 0 (0.0%) |
| 25 to 34 Years | 29 (100.0%) | 0 (0.0%) |
| 35 to 44 Years | 10 (100.0%) | 0 (0.0%) |
| 45 to 54 Years | 10 (100.0%) | 24 (100.0%) |
| 55 to 64 Years | 33 (100.0%) | 11 (100.0%) |
| 65 to 74 Years | 7 (100.0%) | 7 (100.0%) |
| 75 Years and over | 6 (100.0%) | 5 (100.0%) |
| Total | 105 (100.0%) | 54 (100.0%) |
Income Below Poverty Among Married-Couple Families in Tiawah
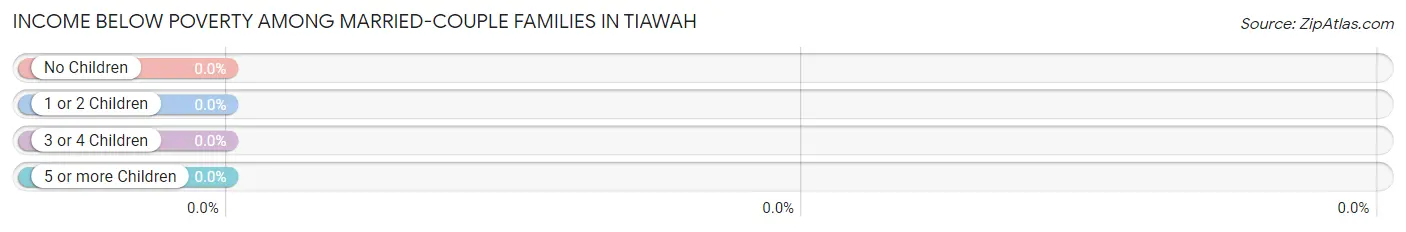
| Children | Above Poverty | Below Poverty |
| No Children | 37 (100.0%) | 0 (0.0%) |
| 1 or 2 Children | 0 (0.0%) | 0 (0.0%) |
| 3 or 4 Children | 0 (0.0%) | 0 (0.0%) |
| 5 or more Children | 0 (0.0%) | 0 (0.0%) |
| Total | 37 (100.0%) | 0 (0.0%) |
Income Below Poverty Among Single-Parent Households in Tiawah
| Children | Single Father | Single Mother |
| No Children | 0 (0.0%) | 0 (0.0%) |
| 1 or 2 Children | 0 (0.0%) | 0 (0.0%) |
| 3 or 4 Children | 0 (0.0%) | 0 (0.0%) |
| 5 or more Children | 0 (0.0%) | 0 (0.0%) |
| Total | 0 (0.0%) | 0 (0.0%) |
Income Below Poverty Among Married-Couple vs Single-Parent Households in Tiawah
| Children | Married-Couple Families | Single-Parent Households |
| No Children | 0 (0.0%) | 0 (0.0%) |
| 1 or 2 Children | 0 (0.0%) | 0 (0.0%) |
| 3 or 4 Children | 0 (0.0%) | 0 (0.0%) |
| 5 or more Children | 0 (0.0%) | 0 (0.0%) |
| Total | 0 (0.0%) | 0 (0.0%) |
Race in Tiawah
The most populous races in Tiawah are White / Caucasian (145 | 91.2%), Hispanic or Latino (14 | 8.8%), and Two or more Races (14 | 8.8%).
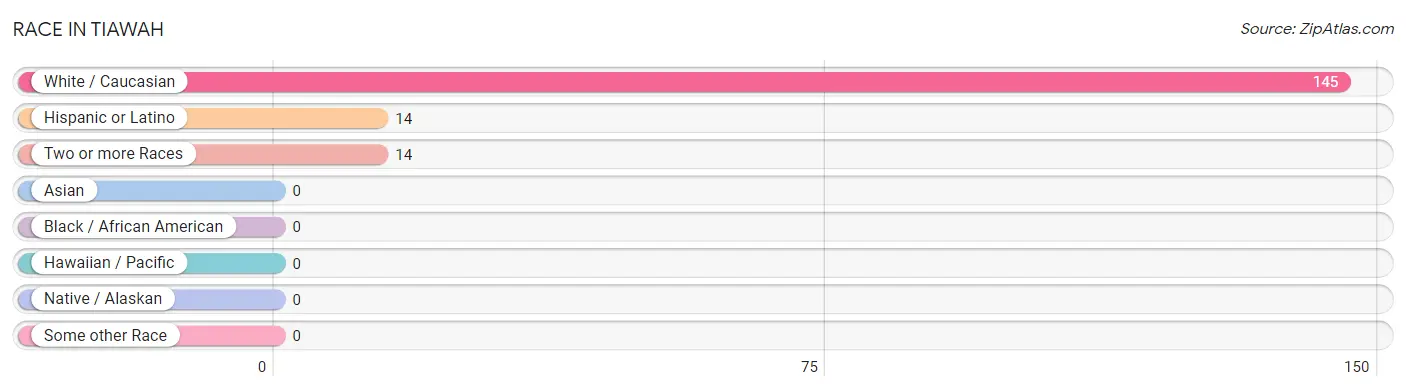
| Race | # Population | % Population |
| Asian | 0 | 0.0% |
| Black / African American | 0 | 0.0% |
| Hawaiian / Pacific | 0 | 0.0% |
| Hispanic or Latino | 14 | 8.8% |
| Native / Alaskan | 0 | 0.0% |
| White / Caucasian | 145 | 91.2% |
| Two or more Races | 14 | 8.8% |
| Some other Race | 0 | 0.0% |
| Total | 159 | 100.0% |
Ancestry in Tiawah
The most populous ancestries reported in Tiawah are German (45 | 28.3%), Irish (42 | 26.4%), Welsh (27 | 17.0%), European (15 | 9.4%), and French (14 | 8.8%), together accounting for 89.9% of all Tiawah residents.
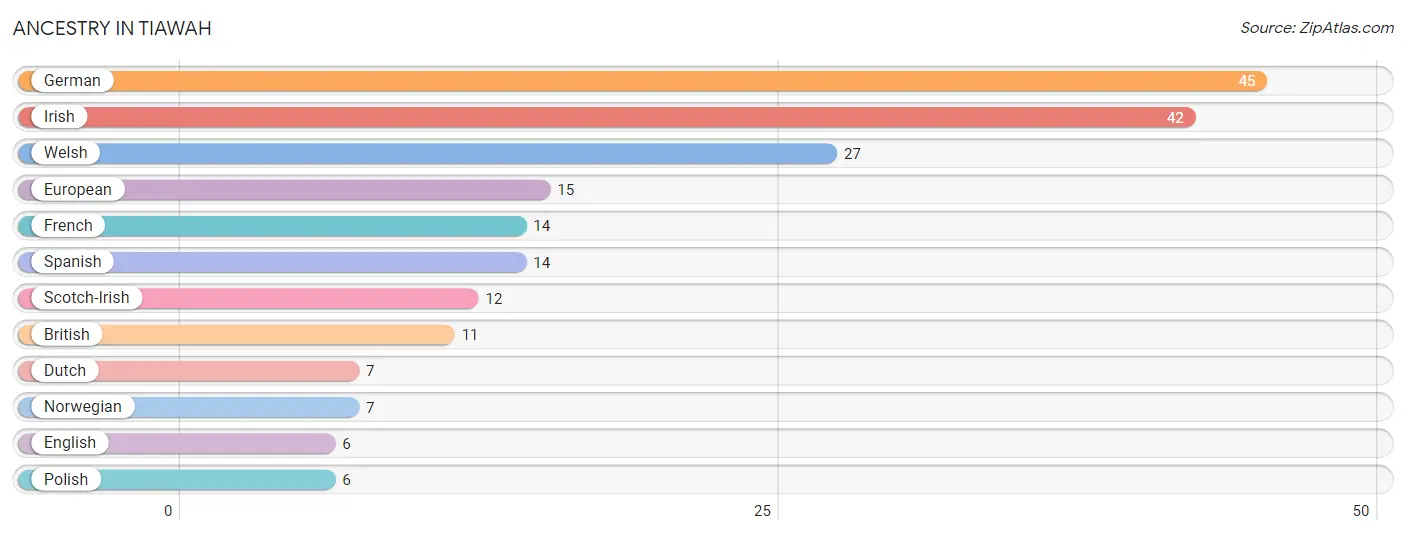
| Ancestry | # Population | % Population |
| British | 11 | 6.9% |
| Dutch | 7 | 4.4% |
| English | 6 | 3.8% |
| European | 15 | 9.4% |
| French | 14 | 8.8% |
| German | 45 | 28.3% |
| Irish | 42 | 26.4% |
| Norwegian | 7 | 4.4% |
| Polish | 6 | 3.8% |
| Scotch-Irish | 12 | 7.5% |
| Spanish | 14 | 8.8% |
| Welsh | 27 | 17.0% | View All 12 Rows |
Immigrants in Tiawah

| Immigration Origin | # Population | % Population | View All 0 Rows |
Sex and Age in Tiawah
Sex and Age in Tiawah
The most populous age groups in Tiawah are 25 to 29 Years (29 | 27.6%) for men and 50 to 54 Years (24 | 44.4%) for women.
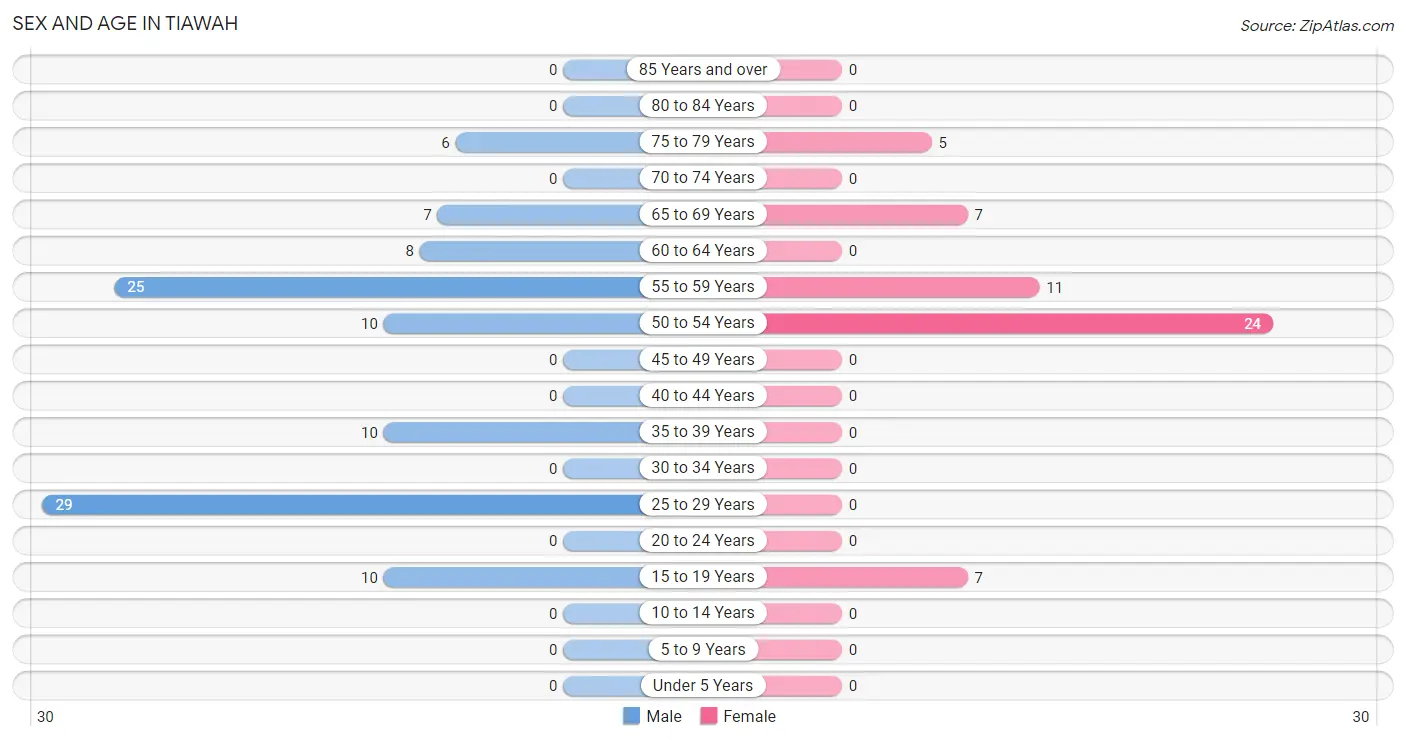
| Age Bracket | Male | Female |
| Under 5 Years | 0 (0.0%) | 0 (0.0%) |
| 5 to 9 Years | 0 (0.0%) | 0 (0.0%) |
| 10 to 14 Years | 0 (0.0%) | 0 (0.0%) |
| 15 to 19 Years | 10 (9.5%) | 7 (13.0%) |
| 20 to 24 Years | 0 (0.0%) | 0 (0.0%) |
| 25 to 29 Years | 29 (27.6%) | 0 (0.0%) |
| 30 to 34 Years | 0 (0.0%) | 0 (0.0%) |
| 35 to 39 Years | 10 (9.5%) | 0 (0.0%) |
| 40 to 44 Years | 0 (0.0%) | 0 (0.0%) |
| 45 to 49 Years | 0 (0.0%) | 0 (0.0%) |
| 50 to 54 Years | 10 (9.5%) | 24 (44.4%) |
| 55 to 59 Years | 25 (23.8%) | 11 (20.4%) |
| 60 to 64 Years | 8 (7.6%) | 0 (0.0%) |
| 65 to 69 Years | 7 (6.7%) | 7 (13.0%) |
| 70 to 74 Years | 0 (0.0%) | 0 (0.0%) |
| 75 to 79 Years | 6 (5.7%) | 5 (9.3%) |
| 80 to 84 Years | 0 (0.0%) | 0 (0.0%) |
| 85 Years and over | 0 (0.0%) | 0 (0.0%) |
| Total | 105 (100.0%) | 54 (100.0%) |
Families and Households in Tiawah
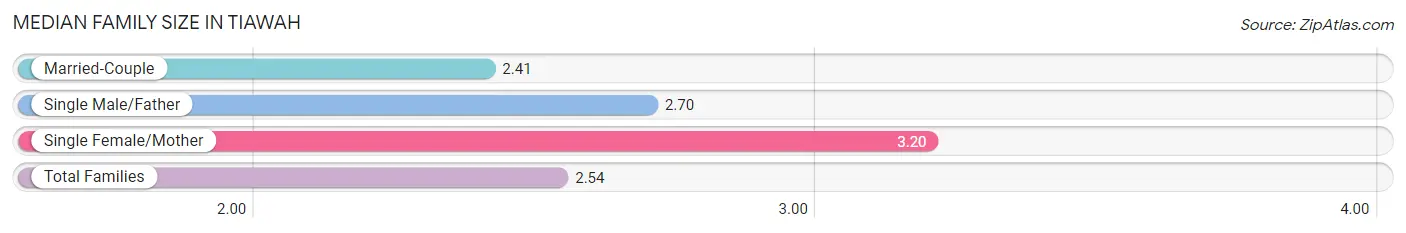
Median Family Size in Tiawah
The median family size in Tiawah is 2.54 persons per family, with single female/mother families (5 | 9.6%) accounting for the largest median family size of 3.2 persons per family. On the other hand, married-couple families (37 | 71.2%) represent the smallest median family size with 2.41 persons per family.
| Family Type | # Families | Family Size |
| Married-Couple | 37 (71.2%) | 2.41 |
| Single Male/Father | 10 (19.2%) | 2.70 |
| Single Female/Mother | 5 (9.6%) | 3.20 |
| Total Families | 52 (100.0%) | 2.54 |
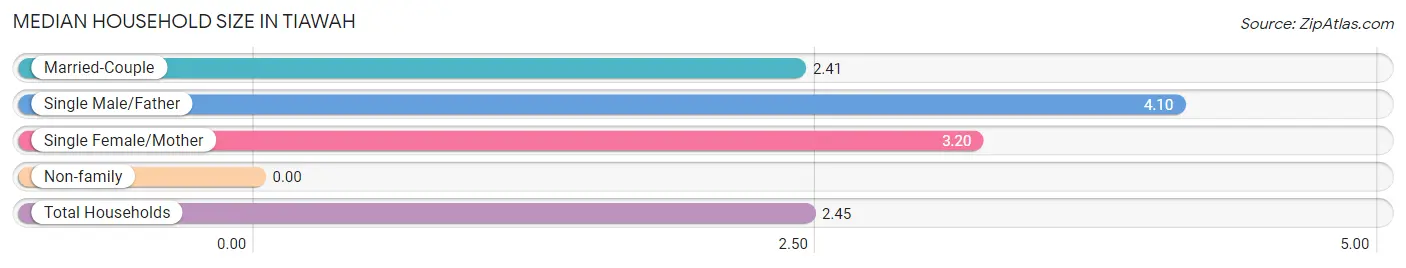
Median Household Size in Tiawah
| Household Type | # Households | Household Size |
| Married-Couple | 37 (56.9%) | 2.41 |
| Single Male/Father | 10 (15.4%) | 4.10 |
| Single Female/Mother | 5 (7.7%) | 3.20 |
| Non-family | 13 (20.0%) | - |
| Total Households | 65 (100.0%) | 2.45 |
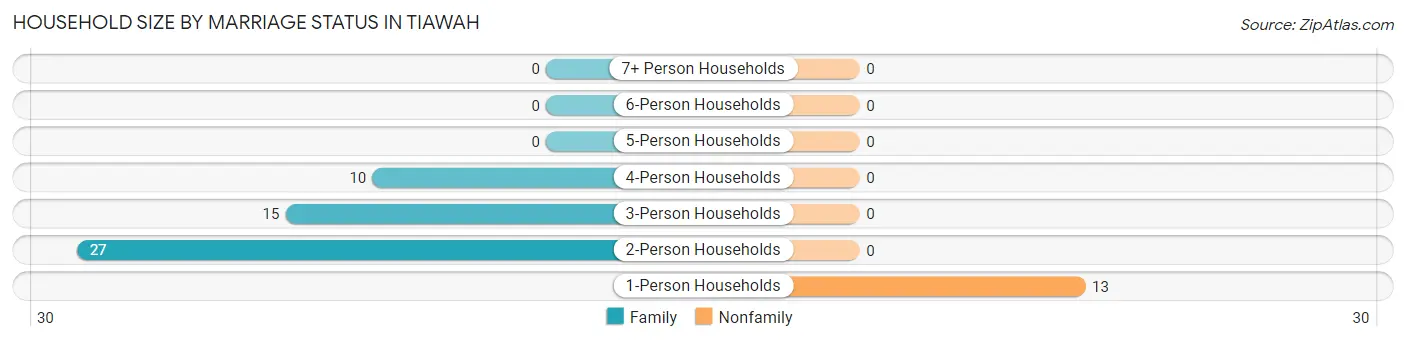
Household Size by Marriage Status in Tiawah
Out of a total of 65 households in Tiawah, 52 (80.0%) are family households, while 13 (20.0%) are nonfamily households. The most numerous type of family households are 2-person households, comprising 27, and the most common type of nonfamily households are 1-person households, comprising 13.
| Household Size | Family Households | Nonfamily Households |
| 1-Person Households | - | 13 (20.0%) |
| 2-Person Households | 27 (41.5%) | 0 (0.0%) |
| 3-Person Households | 15 (23.1%) | 0 (0.0%) |
| 4-Person Households | 10 (15.4%) | 0 (0.0%) |
| 5-Person Households | 0 (0.0%) | 0 (0.0%) |
| 6-Person Households | 0 (0.0%) | 0 (0.0%) |
| 7+ Person Households | 0 (0.0%) | 0 (0.0%) |
| Total | 52 (80.0%) | 13 (20.0%) |
Female Fertility in Tiawah
Fertility by Age in Tiawah
| Age Bracket | Women with Births | Births / 1,000 Women |
| 15 to 19 years | 0 (0.0%) | 0.0 |
| 20 to 34 years | 0 (0.0%) | 0.0 |
| 35 to 50 years | 0 (0.0%) | 0.0 |
| Total | 0 (0.0%) | 0.0 |
Fertility by Age by Marriage Status in Tiawah
| Age Bracket | Married | Unmarried |
| 15 to 19 years | 0 (0.0%) | 0 (0.0%) |
| 20 to 34 years | 0 (0.0%) | 0 (0.0%) |
| 35 to 50 years | 0 (0.0%) | 0 (0.0%) |
| Total | 0 (0.0%) | 0 (0.0%) |
Fertility by Education in Tiawah
| Educational Attainment | Women with Births | Births / 1,000 Women |
| Less than High School | 0 (0.0%) | 0.0 |
| High School Diploma | 0 (0.0%) | 0.0 |
| College or Associate's Degree | 0 (0.0%) | 0.0 |
| Bachelor's Degree | 0 (0.0%) | 0.0 |
| Graduate Degree | 0 (0.0%) | 0.0 |
| Total | 0 (0.0%) | 0.0 |
Fertility by Education by Marriage Status in Tiawah
| Educational Attainment | Married | Unmarried |
| Less than High School | 0 (0.0%) | 0 (0.0%) |
| High School Diploma | 0 (0.0%) | 0 (0.0%) |
| College or Associate's Degree | 0 (0.0%) | 0 (0.0%) |
| Bachelor's Degree | 0 (0.0%) | 0 (0.0%) |
| Graduate Degree | 0 (0.0%) | 0 (0.0%) |
| Total | 0 (0.0%) | 0 (0.0%) |
Employment Characteristics in Tiawah
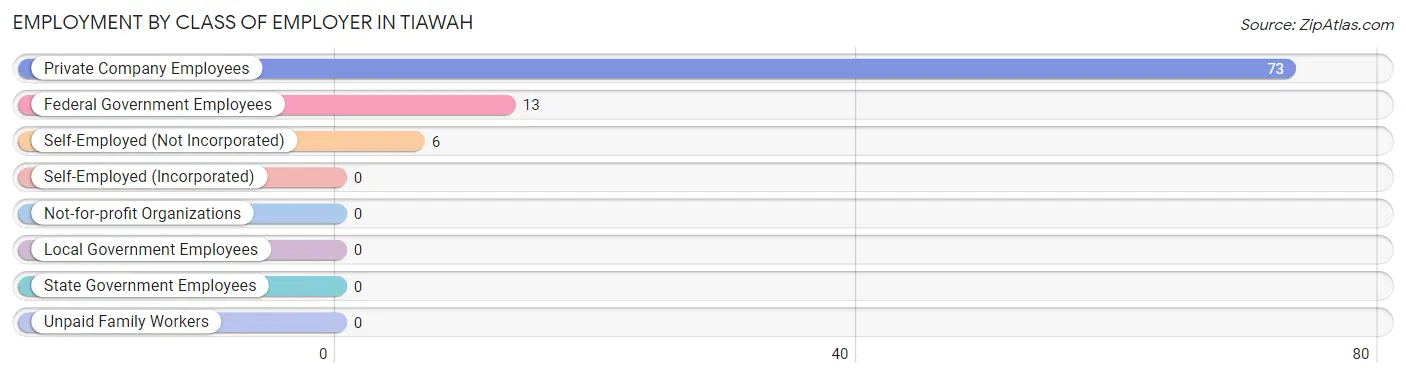
Employment by Class of Employer in Tiawah
Among the 92 employed individuals in Tiawah, private company employees (73 | 79.3%), federal government employees (13 | 14.1%), and self-employed (not incorporated) (6 | 6.5%) make up the most common classes of employment.
| Employer Class | # Employees | % Employees |
| Private Company Employees | 73 | 79.3% |
| Self-Employed (Incorporated) | 0 | 0.0% |
| Self-Employed (Not Incorporated) | 6 | 6.5% |
| Not-for-profit Organizations | 0 | 0.0% |
| Local Government Employees | 0 | 0.0% |
| State Government Employees | 0 | 0.0% |
| Federal Government Employees | 13 | 14.1% |
| Unpaid Family Workers | 0 | 0.0% |
| Total | 92 | 100.0% |
Employment Status by Age in Tiawah
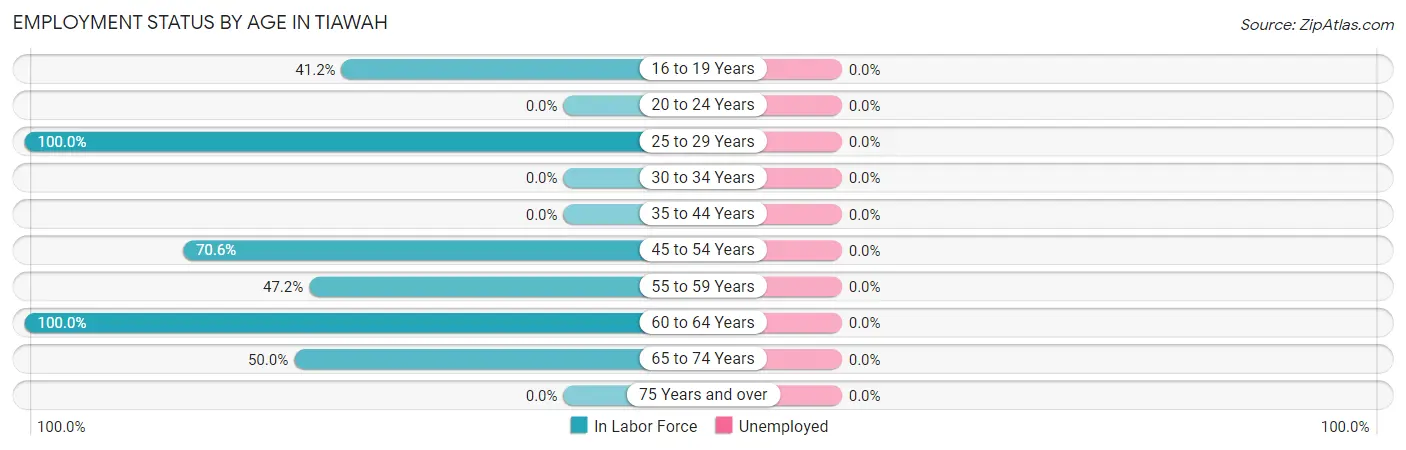
| Age Bracket | In Labor Force | Unemployed |
| 16 to 19 Years | 7 (41.2%) | 0 (0.0%) |
| 20 to 24 Years | 0 (0.0%) | 0 (0.0%) |
| 25 to 29 Years | 29 (100.0%) | 0 (0.0%) |
| 30 to 34 Years | 0 (0.0%) | 0 (0.0%) |
| 35 to 44 Years | 0 (0.0%) | 0 (0.0%) |
| 45 to 54 Years | 24 (70.6%) | 0 (0.0%) |
| 55 to 59 Years | 17 (47.2%) | 0 (0.0%) |
| 60 to 64 Years | 8 (100.0%) | 0 (0.0%) |
| 65 to 74 Years | 7 (50.0%) | 0 (0.0%) |
| 75 Years and over | 0 (0.0%) | 0 (0.0%) |
| Total | 92 (57.9%) | 0 (0.0%) |
Employment Status by Educational Attainment in Tiawah
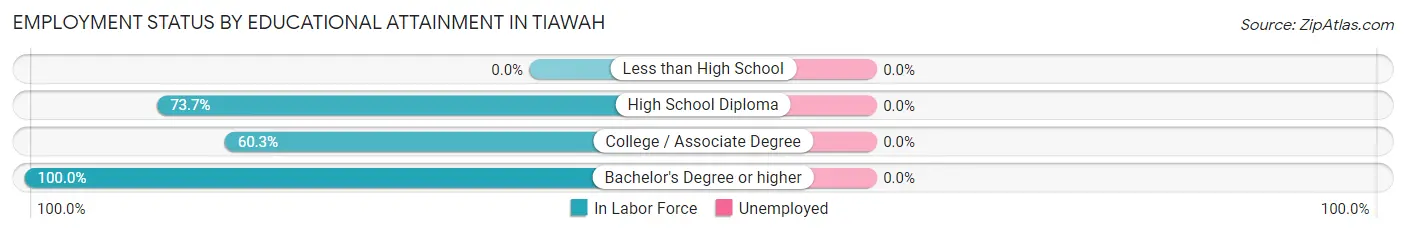
| Educational Attainment | In Labor Force | Unemployed |
| Less than High School | 0 (0.0%) | 0 (0.0%) |
| High School Diploma | 28 (73.7%) | 0 (0.0%) |
| College / Associate Degree | 44 (60.3%) | 0 (0.0%) |
| Bachelor's Degree or higher | 6 (100.0%) | 0 (0.0%) |
| Total | 78 (66.7%) | 0 (0.0%) |
Employment Occupations by Sex in Tiawah
Management, Business, Science and Arts Occupations
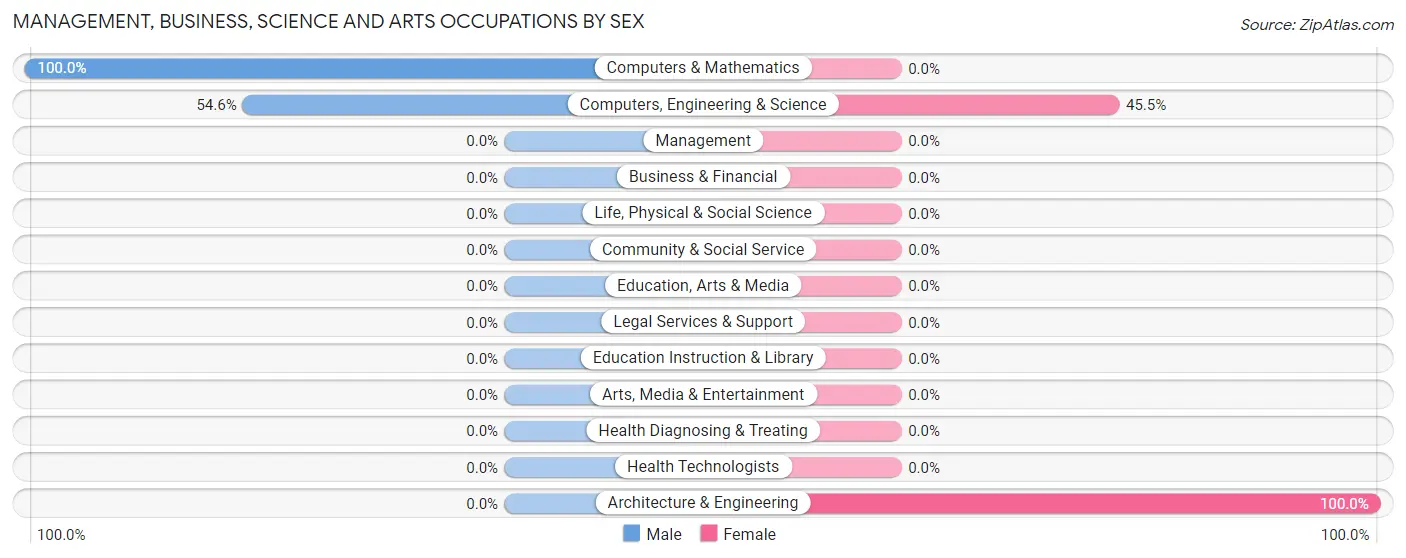
The most common Management, Business, Science and Arts occupations in Tiawah are Computers, Engineering & Science (11 | 12.0%), Computers & Mathematics (6 | 6.5%), and Architecture & Engineering (5 | 5.4%).
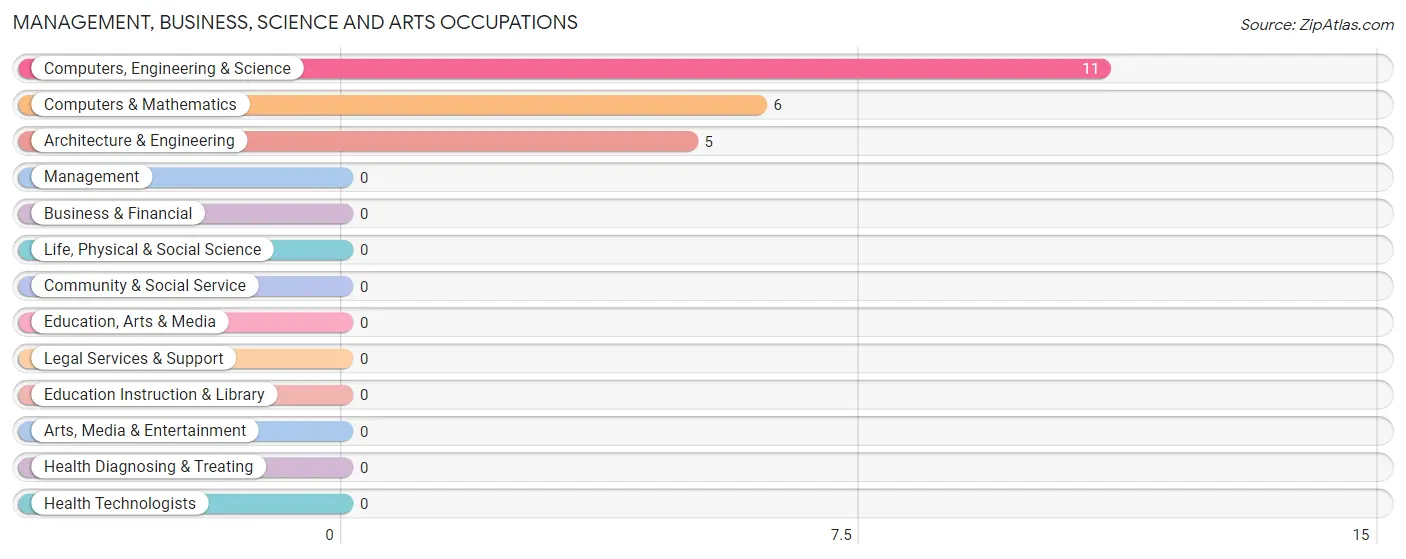
Management, Business, Science and Arts Occupations by Sex
Within the Management, Business, Science and Arts occupations in Tiawah, the most male-oriented occupations are Computers & Mathematics (100.0%), and Computers, Engineering & Science (54.5%), while the most female-oriented occupations are Architecture & Engineering (100.0%), and Computers, Engineering & Science (45.5%).
| Occupation | Male | Female |
| Management | 0 (0.0%) | 0 (0.0%) |
| Business & Financial | 0 (0.0%) | 0 (0.0%) |
| Computers, Engineering & Science | 6 (54.5%) | 5 (45.5%) |
| Computers & Mathematics | 6 (100.0%) | 0 (0.0%) |
| Architecture & Engineering | 0 (0.0%) | 5 (100.0%) |
| Life, Physical & Social Science | 0 (0.0%) | 0 (0.0%) |
| Community & Social Service | 0 (0.0%) | 0 (0.0%) |
| Education, Arts & Media | 0 (0.0%) | 0 (0.0%) |
| Legal Services & Support | 0 (0.0%) | 0 (0.0%) |
| Education Instruction & Library | 0 (0.0%) | 0 (0.0%) |
| Arts, Media & Entertainment | 0 (0.0%) | 0 (0.0%) |
| Health Diagnosing & Treating | 0 (0.0%) | 0 (0.0%) |
| Health Technologists | 0 (0.0%) | 0 (0.0%) |
| Total (Category) | 6 (54.5%) | 5 (45.5%) |
| Total (Overall) | 59 (64.1%) | 33 (35.9%) |
Services Occupations
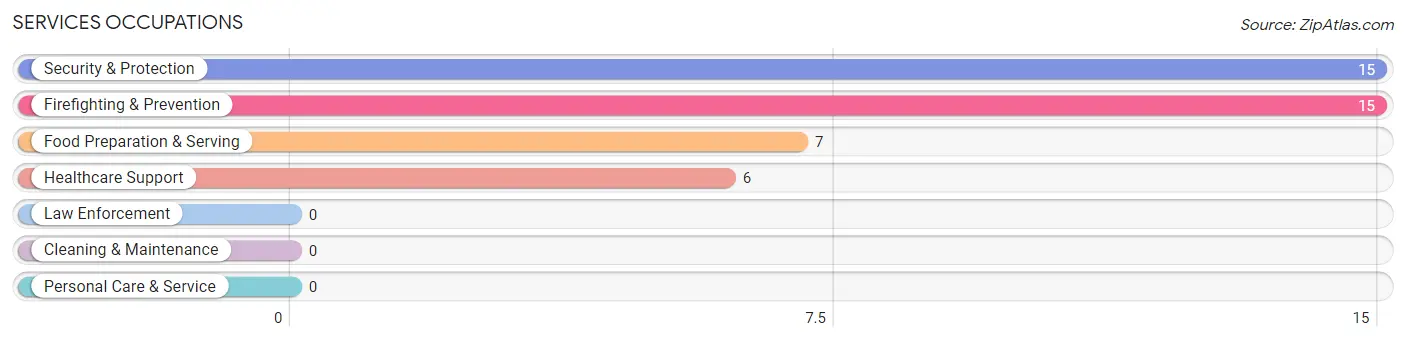
The most common Services occupations in Tiawah are Security & Protection (15 | 16.3%), Firefighting & Prevention (15 | 16.3%), Food Preparation & Serving (7 | 7.6%), and Healthcare Support (6 | 6.5%).
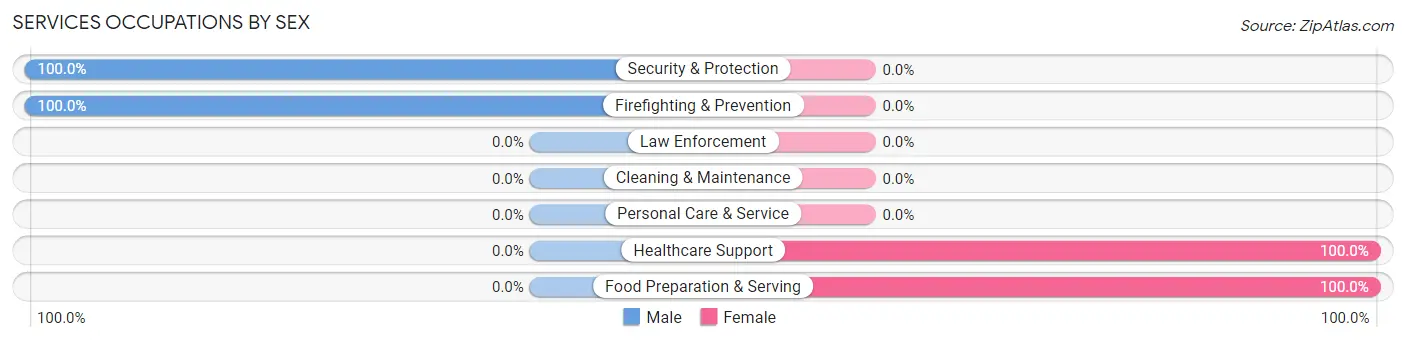
Services Occupations by Sex
Within the Services occupations in Tiawah, the most male-oriented occupations are Security & Protection (100.0%), and Firefighting & Prevention (100.0%), while the most female-oriented occupations are Healthcare Support (100.0%), and Food Preparation & Serving (100.0%).
| Occupation | Male | Female |
| Healthcare Support | 0 (0.0%) | 6 (100.0%) |
| Security & Protection | 15 (100.0%) | 0 (0.0%) |
| Firefighting & Prevention | 15 (100.0%) | 0 (0.0%) |
| Law Enforcement | 0 (0.0%) | 0 (0.0%) |
| Food Preparation & Serving | 0 (0.0%) | 7 (100.0%) |
| Cleaning & Maintenance | 0 (0.0%) | 0 (0.0%) |
| Personal Care & Service | 0 (0.0%) | 0 (0.0%) |
| Total (Category) | 15 (53.6%) | 13 (46.4%) |
| Total (Overall) | 59 (64.1%) | 33 (35.9%) |
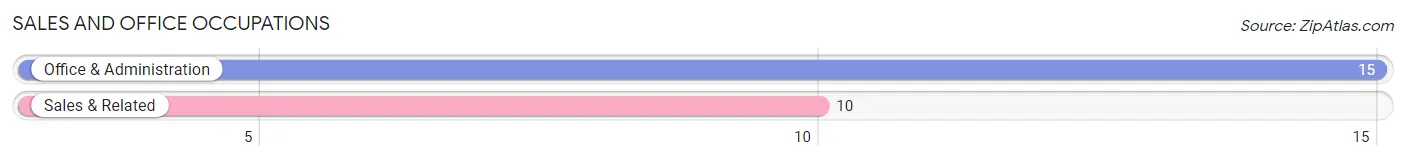
Sales and Office Occupations
The most common Sales and Office occupations in Tiawah are Office & Administration (15 | 16.3%), and Sales & Related (10 | 10.9%).
Sales and Office Occupations by Sex
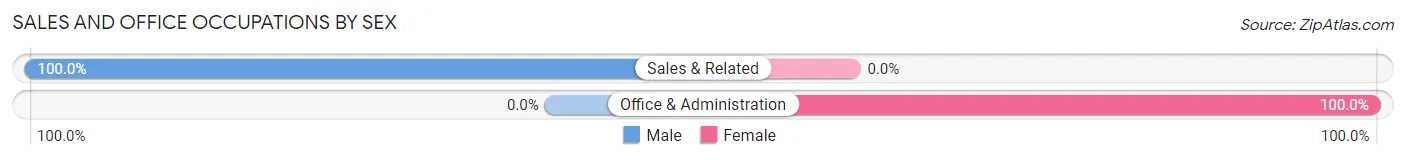
| Occupation | Male | Female |
| Sales & Related | 10 (100.0%) | 0 (0.0%) |
| Office & Administration | 0 (0.0%) | 15 (100.0%) |
| Total (Category) | 10 (40.0%) | 15 (60.0%) |
| Total (Overall) | 59 (64.1%) | 33 (35.9%) |
Natural Resources, Construction and Maintenance Occupations
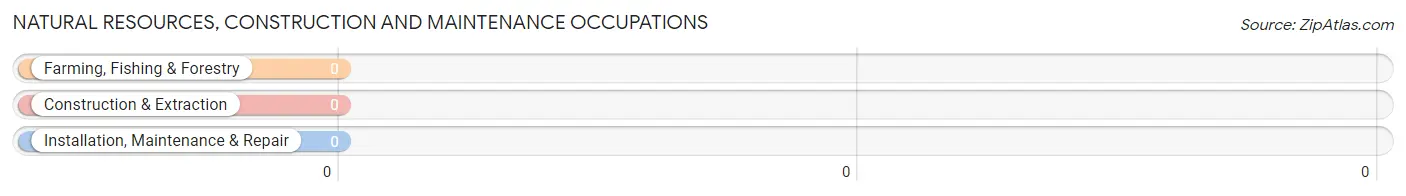
Natural Resources, Construction and Maintenance Occupations by Sex
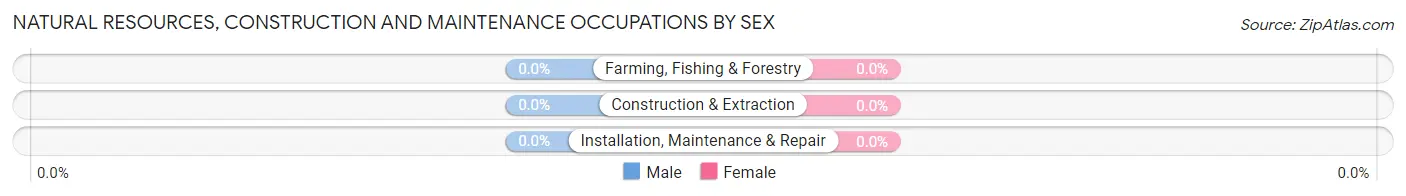
| Occupation | Male | Female |
| Farming, Fishing & Forestry | 0 (0.0%) | 0 (0.0%) |
| Construction & Extraction | 0 (0.0%) | 0 (0.0%) |
| Installation, Maintenance & Repair | 0 (0.0%) | 0 (0.0%) |
| Total (Category) | 0 (0.0%) | 0 (0.0%) |
| Total (Overall) | 59 (64.1%) | 33 (35.9%) |
Production, Transportation and Moving Occupations
The most common Production, Transportation and Moving occupations in Tiawah are Production (14 | 15.2%), and Material Moving (14 | 15.2%).
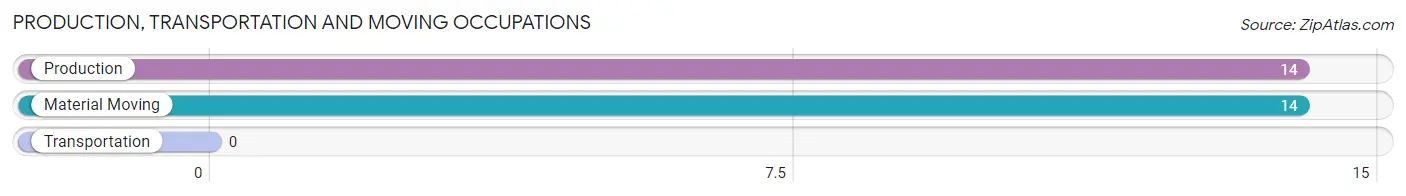
Production, Transportation and Moving Occupations by Sex
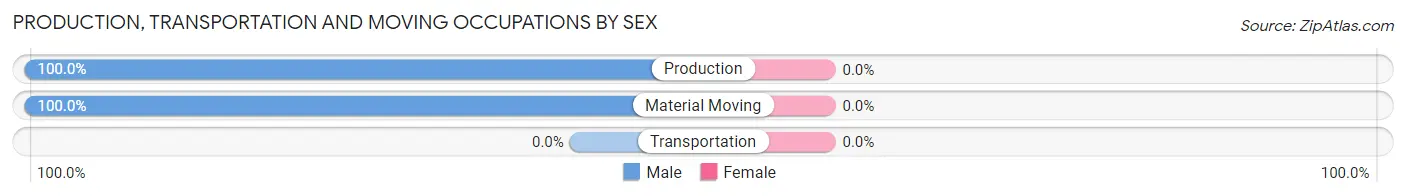
| Occupation | Male | Female |
| Production | 14 (100.0%) | 0 (0.0%) |
| Transportation | 0 (0.0%) | 0 (0.0%) |
| Material Moving | 14 (100.0%) | 0 (0.0%) |
| Total (Category) | 28 (100.0%) | 0 (0.0%) |
| Total (Overall) | 59 (64.1%) | 33 (35.9%) |
Employment Industries by Sex in Tiawah
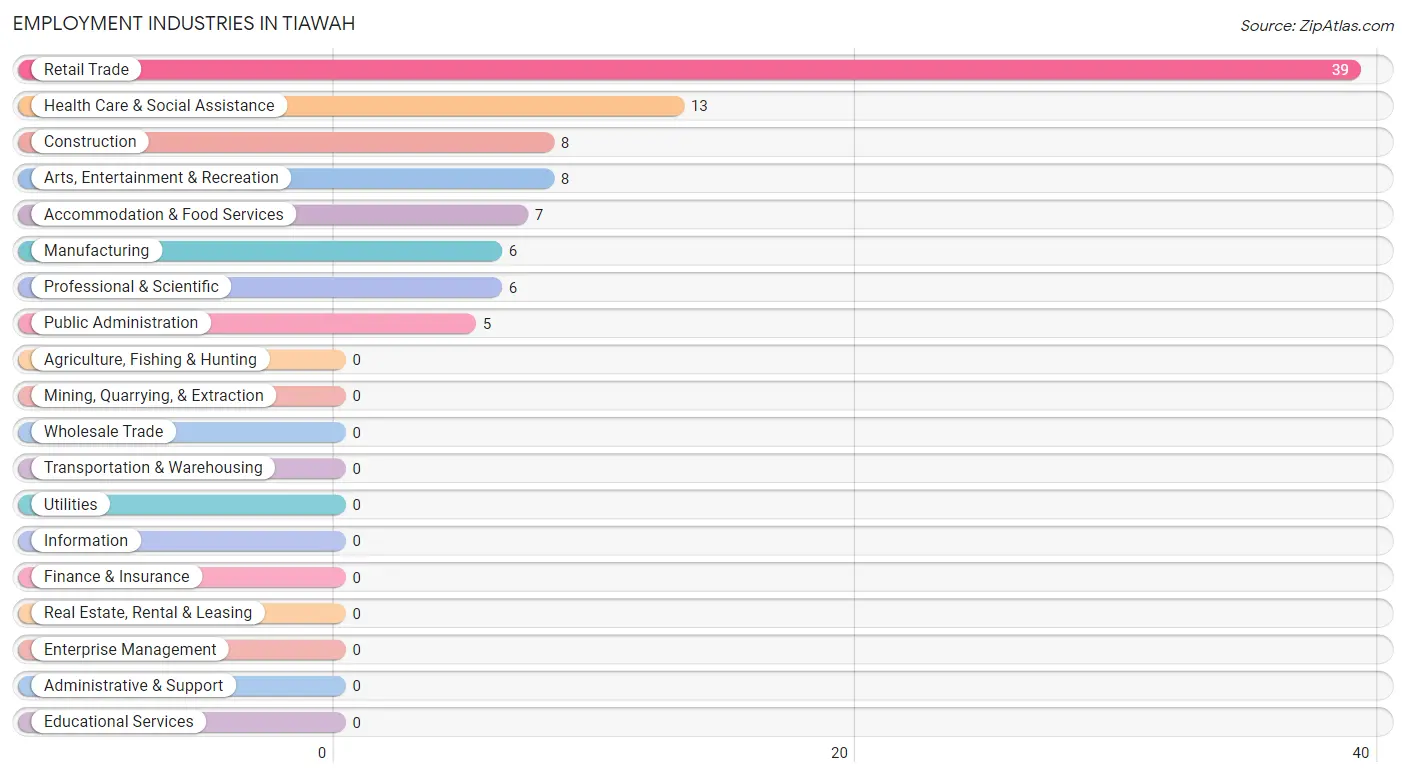
Employment Industries in Tiawah
The major employment industries in Tiawah include Retail Trade (39 | 42.4%), Health Care & Social Assistance (13 | 14.1%), Construction (8 | 8.7%), Arts, Entertainment & Recreation (8 | 8.7%), and Accommodation & Food Services (7 | 7.6%).
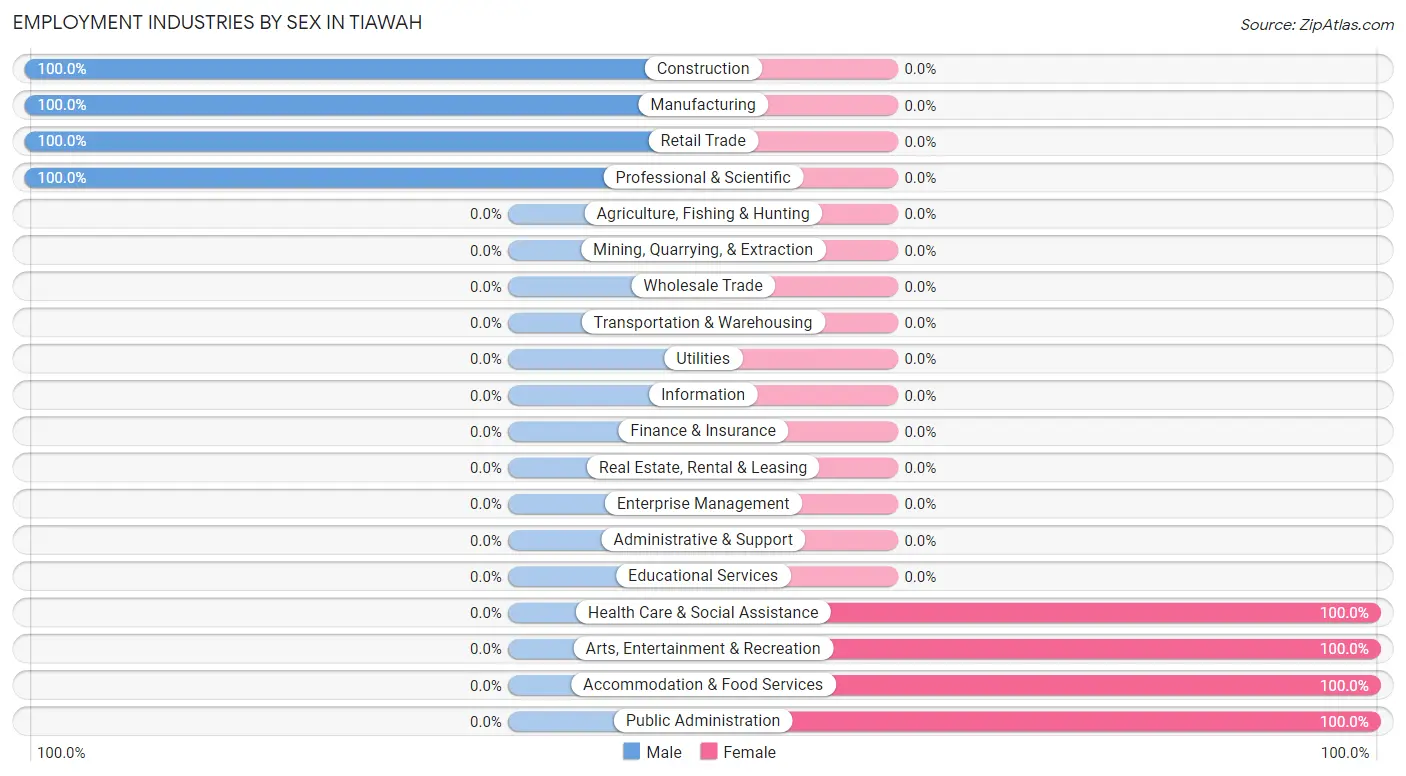
Employment Industries by Sex in Tiawah
The Tiawah industries that see more men than women are Construction (100.0%), Manufacturing (100.0%), and Retail Trade (100.0%), whereas the industries that tend to have a higher number of women are Health Care & Social Assistance (100.0%), Arts, Entertainment & Recreation (100.0%), and Accommodation & Food Services (100.0%).
| Industry | Male | Female |
| Agriculture, Fishing & Hunting | 0 (0.0%) | 0 (0.0%) |
| Mining, Quarrying, & Extraction | 0 (0.0%) | 0 (0.0%) |
| Construction | 8 (100.0%) | 0 (0.0%) |
| Manufacturing | 6 (100.0%) | 0 (0.0%) |
| Wholesale Trade | 0 (0.0%) | 0 (0.0%) |
| Retail Trade | 39 (100.0%) | 0 (0.0%) |
| Transportation & Warehousing | 0 (0.0%) | 0 (0.0%) |
| Utilities | 0 (0.0%) | 0 (0.0%) |
| Information | 0 (0.0%) | 0 (0.0%) |
| Finance & Insurance | 0 (0.0%) | 0 (0.0%) |
| Real Estate, Rental & Leasing | 0 (0.0%) | 0 (0.0%) |
| Professional & Scientific | 6 (100.0%) | 0 (0.0%) |
| Enterprise Management | 0 (0.0%) | 0 (0.0%) |
| Administrative & Support | 0 (0.0%) | 0 (0.0%) |
| Educational Services | 0 (0.0%) | 0 (0.0%) |
| Health Care & Social Assistance | 0 (0.0%) | 13 (100.0%) |
| Arts, Entertainment & Recreation | 0 (0.0%) | 8 (100.0%) |
| Accommodation & Food Services | 0 (0.0%) | 7 (100.0%) |
| Public Administration | 0 (0.0%) | 5 (100.0%) |
| Total | 59 (64.1%) | 33 (35.9%) |
Education in Tiawah
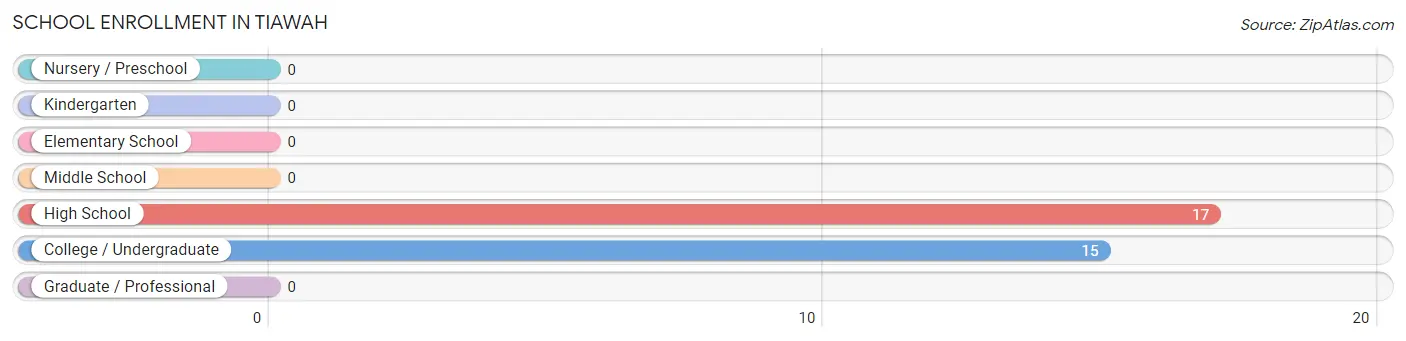
School Enrollment in Tiawah
The most common levels of schooling among the 32 students in Tiawah are high school (17 | 53.1%), and college / undergraduate (15 | 46.9%).
| School Level | # Students | % Students |
| Nursery / Preschool | 0 | 0.0% |
| Kindergarten | 0 | 0.0% |
| Elementary School | 0 | 0.0% |
| Middle School | 0 | 0.0% |
| High School | 17 | 53.1% |
| College / Undergraduate | 15 | 46.9% |
| Graduate / Professional | 0 | 0.0% |
| Total | 32 | 100.0% |
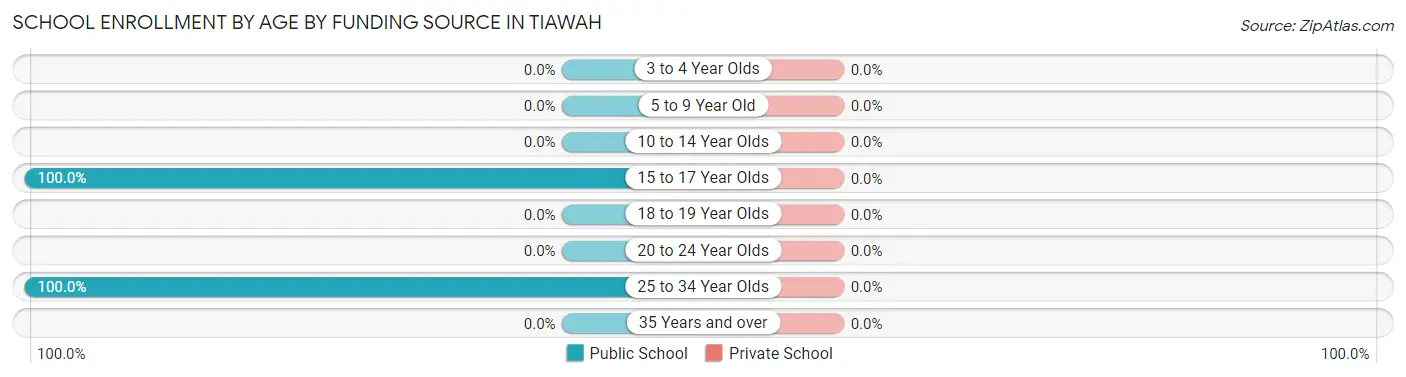
School Enrollment by Age by Funding Source in Tiawah
| Age Bracket | Public School | Private School |
| 3 to 4 Year Olds | 0 (0.0%) | 0 (0.0%) |
| 5 to 9 Year Old | 0 (0.0%) | 0 (0.0%) |
| 10 to 14 Year Olds | 0 (0.0%) | 0 (0.0%) |
| 15 to 17 Year Olds | 17 (100.0%) | 0 (0.0%) |
| 18 to 19 Year Olds | 0 (0.0%) | 0 (0.0%) |
| 20 to 24 Year Olds | 0 (0.0%) | 0 (0.0%) |
| 25 to 34 Year Olds | 15 (100.0%) | 0 (0.0%) |
| 35 Years and over | 0 (0.0%) | 0 (0.0%) |
| Total | 32 (100.0%) | 0 (0.0%) |
Educational Attainment by Field of Study in Tiawah
Bio, nature & agricultural (7 | 53.8%), and science & technology (6 | 46.2%) are the most common fields of study among 13 individuals in Tiawah who have obtained a bachelor's degree or higher.
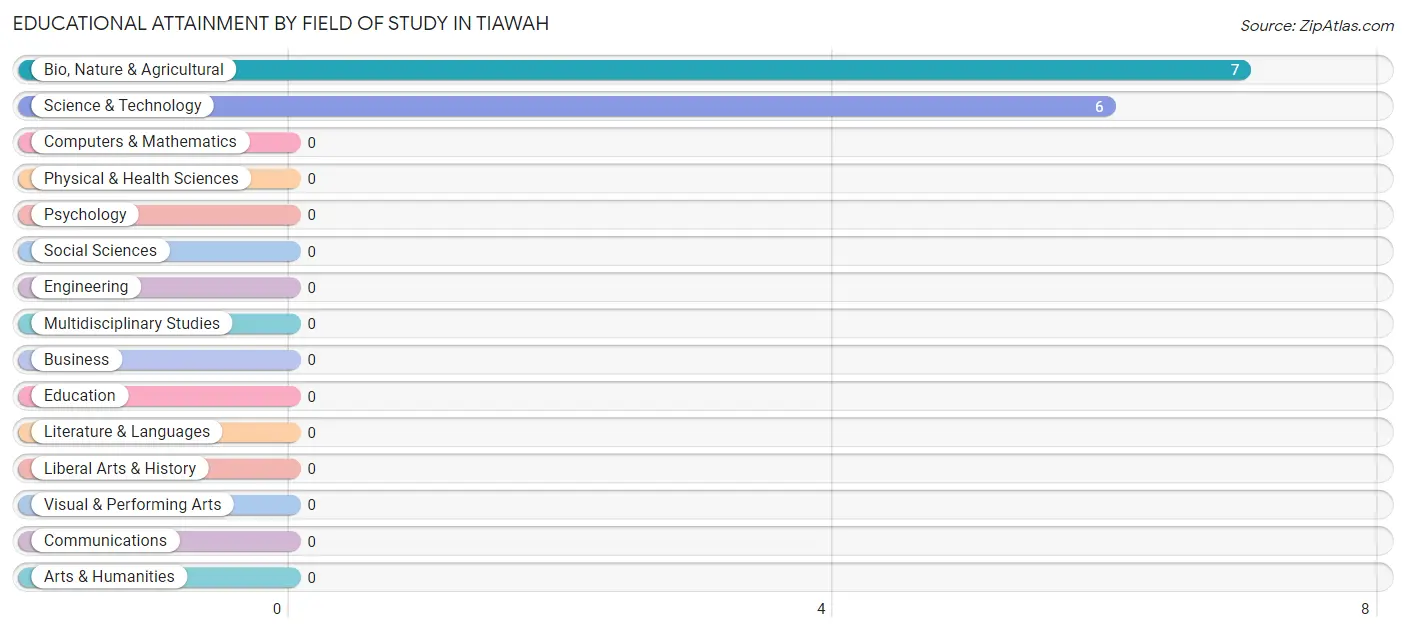
| Field of Study | # Graduates | % Graduates |
| Computers & Mathematics | 0 | 0.0% |
| Bio, Nature & Agricultural | 7 | 53.8% |
| Physical & Health Sciences | 0 | 0.0% |
| Psychology | 0 | 0.0% |
| Social Sciences | 0 | 0.0% |
| Engineering | 0 | 0.0% |
| Multidisciplinary Studies | 0 | 0.0% |
| Science & Technology | 6 | 46.2% |
| Business | 0 | 0.0% |
| Education | 0 | 0.0% |
| Literature & Languages | 0 | 0.0% |
| Liberal Arts & History | 0 | 0.0% |
| Visual & Performing Arts | 0 | 0.0% |
| Communications | 0 | 0.0% |
| Arts & Humanities | 0 | 0.0% |
| Total | 13 | 100.0% |
Transportation & Commute in Tiawah
Vehicle Availability by Sex in Tiawah
The most prevalent vehicle ownership categories in Tiawah are males with 3 vehicles (45, accounting for 76.3%) and females with 3 vehicles (25, making up 136.4%).
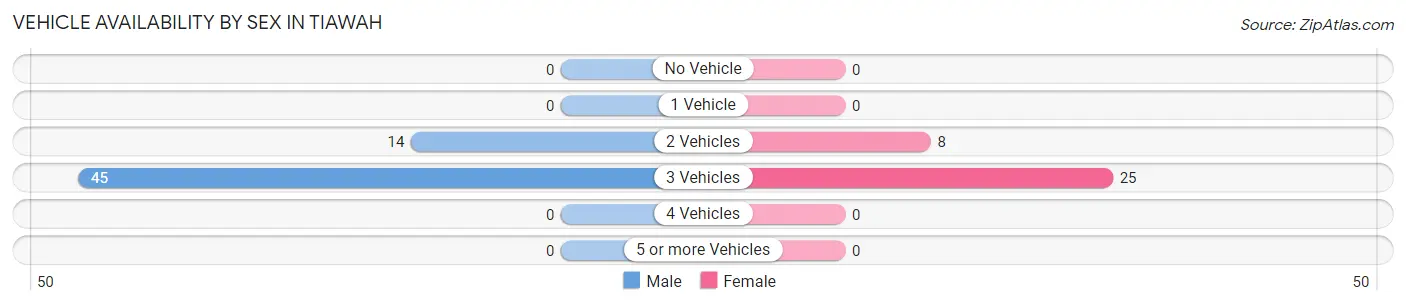
| Vehicles Available | Male | Female |
| No Vehicle | 0 (0.0%) | 0 (0.0%) |
| 1 Vehicle | 0 (0.0%) | 0 (0.0%) |
| 2 Vehicles | 14 (23.7%) | 8 (24.2%) |
| 3 Vehicles | 45 (76.3%) | 25 (75.8%) |
| 4 Vehicles | 0 (0.0%) | 0 (0.0%) |
| 5 or more Vehicles | 0 (0.0%) | 0 (0.0%) |
| Total | 59 (100.0%) | 33 (100.0%) |
Commute Time in Tiawah
The most frequently occuring commute durations in Tiawah are 45 to 59 minutes (28 commuters, 32.6%), 35 to 39 minutes (25 commuters, 29.1%), and 10 to 14 minutes (15 commuters, 17.4%).
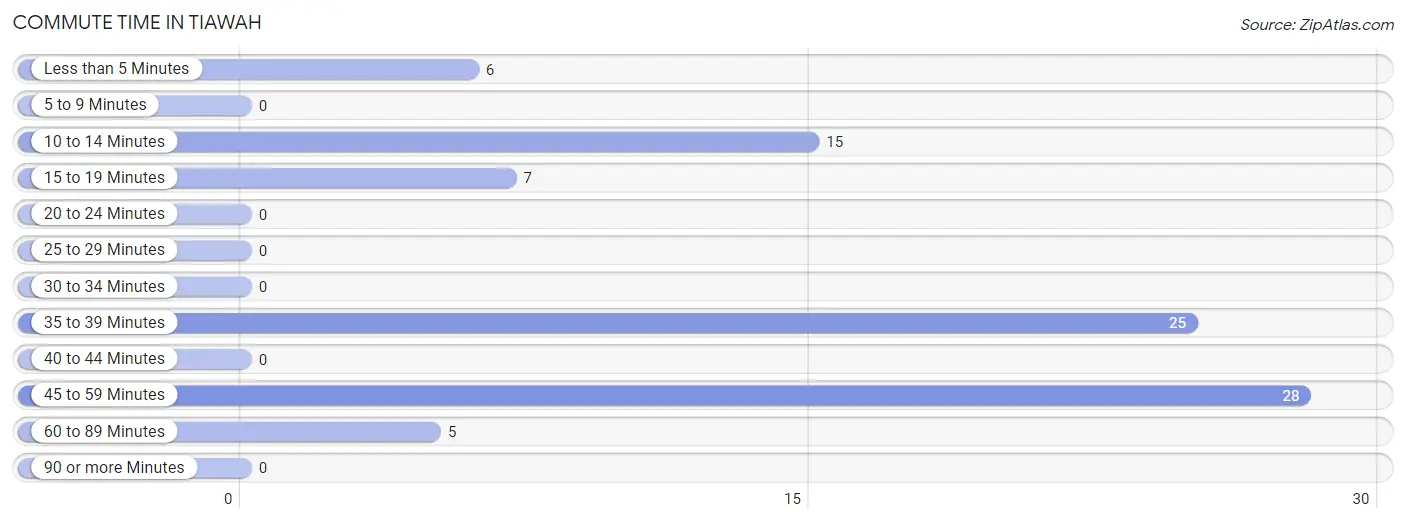
| Commute Time | # Commuters | % Commuters |
| Less than 5 Minutes | 6 | 7.0% |
| 5 to 9 Minutes | 0 | 0.0% |
| 10 to 14 Minutes | 15 | 17.4% |
| 15 to 19 Minutes | 7 | 8.1% |
| 20 to 24 Minutes | 0 | 0.0% |
| 25 to 29 Minutes | 0 | 0.0% |
| 30 to 34 Minutes | 0 | 0.0% |
| 35 to 39 Minutes | 25 | 29.1% |
| 40 to 44 Minutes | 0 | 0.0% |
| 45 to 59 Minutes | 28 | 32.6% |
| 60 to 89 Minutes | 5 | 5.8% |
| 90 or more Minutes | 0 | 0.0% |
Commute Time by Sex in Tiawah
The most common commute times in Tiawah are 35 to 39 minutes (25 commuters, 47.2%) for males and 10 to 14 minutes (15 commuters, 45.5%) for females.
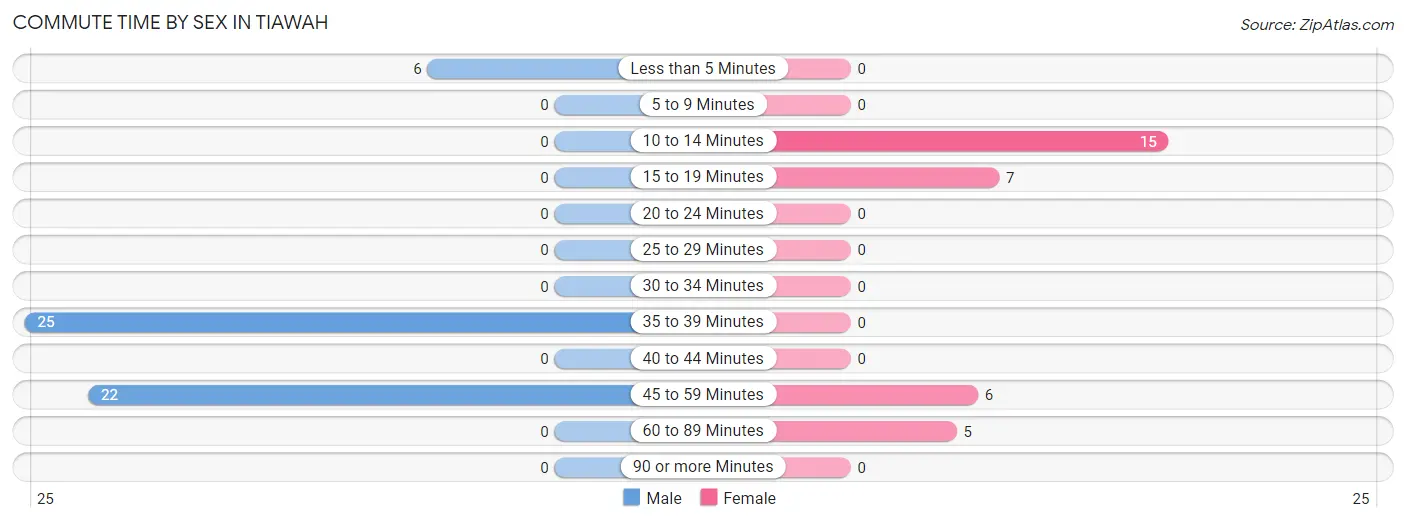
| Commute Time | Male | Female |
| Less than 5 Minutes | 6 (11.3%) | 0 (0.0%) |
| 5 to 9 Minutes | 0 (0.0%) | 0 (0.0%) |
| 10 to 14 Minutes | 0 (0.0%) | 15 (45.5%) |
| 15 to 19 Minutes | 0 (0.0%) | 7 (21.2%) |
| 20 to 24 Minutes | 0 (0.0%) | 0 (0.0%) |
| 25 to 29 Minutes | 0 (0.0%) | 0 (0.0%) |
| 30 to 34 Minutes | 0 (0.0%) | 0 (0.0%) |
| 35 to 39 Minutes | 25 (47.2%) | 0 (0.0%) |
| 40 to 44 Minutes | 0 (0.0%) | 0 (0.0%) |
| 45 to 59 Minutes | 22 (41.5%) | 6 (18.2%) |
| 60 to 89 Minutes | 0 (0.0%) | 5 (15.1%) |
| 90 or more Minutes | 0 (0.0%) | 0 (0.0%) |
Time of Departure to Work by Sex in Tiawah
The most frequent times of departure to work in Tiawah are 7:00 AM to 7:29 AM (21, 39.6%) for males and 7:30 AM to 7:59 AM (13, 39.4%) for females.
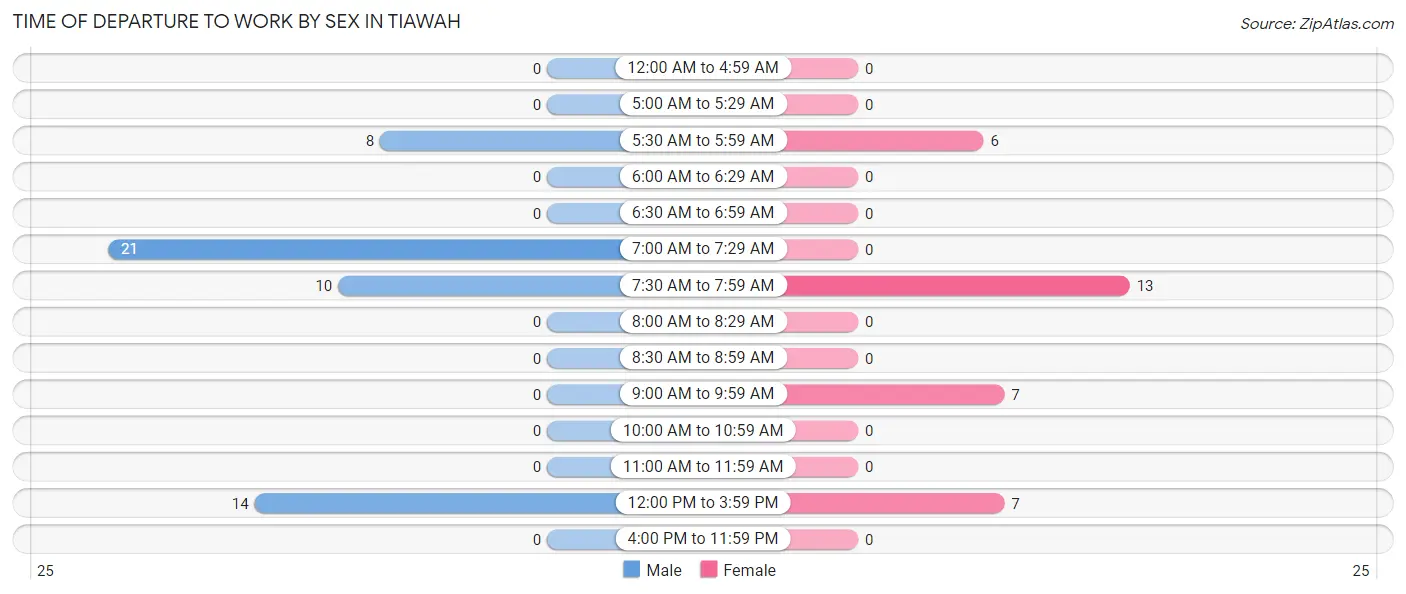
| Time of Departure | Male | Female |
| 12:00 AM to 4:59 AM | 0 (0.0%) | 0 (0.0%) |
| 5:00 AM to 5:29 AM | 0 (0.0%) | 0 (0.0%) |
| 5:30 AM to 5:59 AM | 8 (15.1%) | 6 (18.2%) |
| 6:00 AM to 6:29 AM | 0 (0.0%) | 0 (0.0%) |
| 6:30 AM to 6:59 AM | 0 (0.0%) | 0 (0.0%) |
| 7:00 AM to 7:29 AM | 21 (39.6%) | 0 (0.0%) |
| 7:30 AM to 7:59 AM | 10 (18.9%) | 13 (39.4%) |
| 8:00 AM to 8:29 AM | 0 (0.0%) | 0 (0.0%) |
| 8:30 AM to 8:59 AM | 0 (0.0%) | 0 (0.0%) |
| 9:00 AM to 9:59 AM | 0 (0.0%) | 7 (21.2%) |
| 10:00 AM to 10:59 AM | 0 (0.0%) | 0 (0.0%) |
| 11:00 AM to 11:59 AM | 0 (0.0%) | 0 (0.0%) |
| 12:00 PM to 3:59 PM | 14 (26.4%) | 7 (21.2%) |
| 4:00 PM to 11:59 PM | 0 (0.0%) | 0 (0.0%) |
| Total | 53 (100.0%) | 33 (100.0%) |
Housing Occupancy in Tiawah
Occupancy by Ownership in Tiawah
Of the total 65 dwellings in Tiawah, owner-occupied units account for 55 (84.6%), while renter-occupied units make up 10 (15.4%).
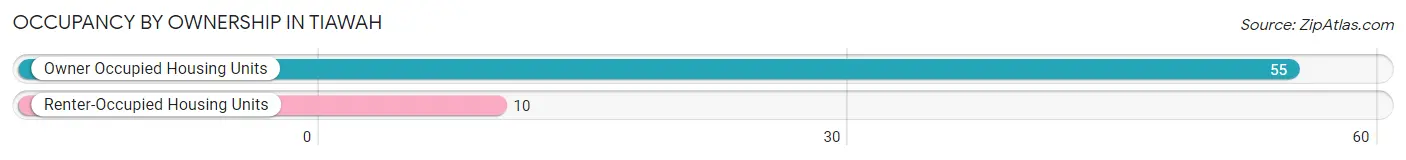
| Occupancy | # Housing Units | % Housing Units |
| Owner Occupied Housing Units | 55 | 84.6% |
| Renter-Occupied Housing Units | 10 | 15.4% |
| Total Occupied Housing Units | 65 | 100.0% |
Occupancy by Household Size in Tiawah
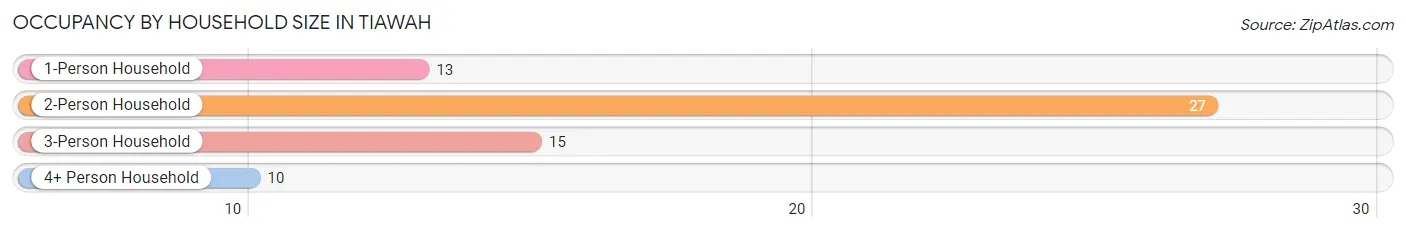
| Household Size | # Housing Units | % Housing Units |
| 1-Person Household | 13 | 20.0% |
| 2-Person Household | 27 | 41.5% |
| 3-Person Household | 15 | 23.1% |
| 4+ Person Household | 10 | 15.4% |
| Total Housing Units | 65 | 100.0% |
Occupancy by Ownership by Household Size in Tiawah
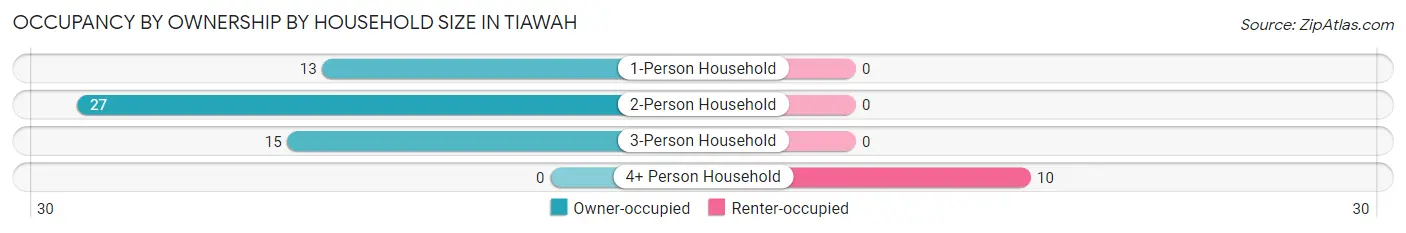
| Household Size | Owner-occupied | Renter-occupied |
| 1-Person Household | 13 (100.0%) | 0 (0.0%) |
| 2-Person Household | 27 (100.0%) | 0 (0.0%) |
| 3-Person Household | 15 (100.0%) | 0 (0.0%) |
| 4+ Person Household | 0 (0.0%) | 10 (100.0%) |
| Total Housing Units | 55 (84.6%) | 10 (15.4%) |
Occupancy by Educational Attainment in Tiawah
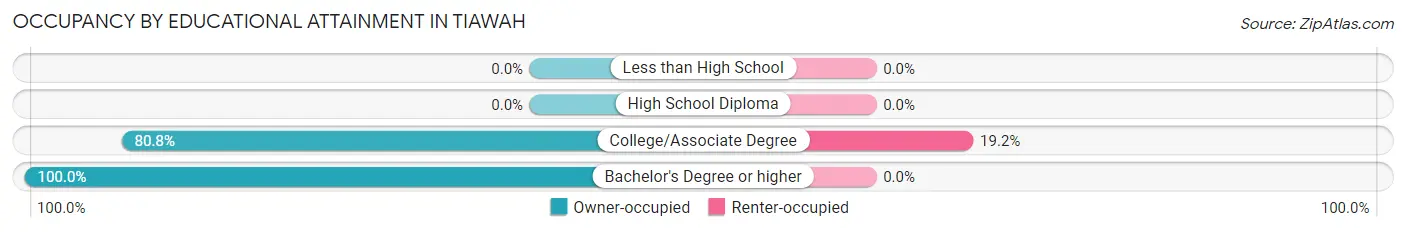
| Household Size | Owner-occupied | Renter-occupied |
| Less than High School | 0 (0.0%) | 0 (0.0%) |
| High School Diploma | 0 (0.0%) | 0 (0.0%) |
| College/Associate Degree | 42 (80.8%) | 10 (19.2%) |
| Bachelor's Degree or higher | 13 (100.0%) | 0 (0.0%) |
Occupancy by Age of Householder in Tiawah
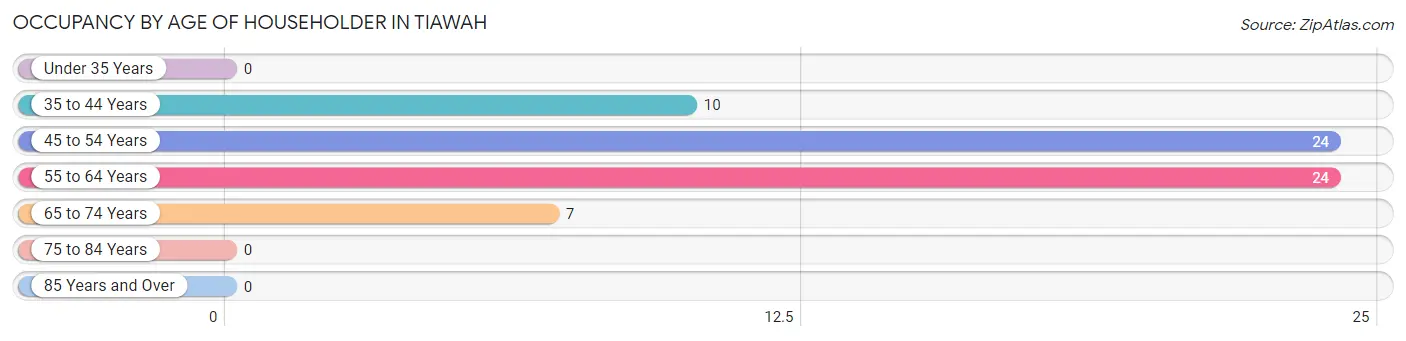
| Age Bracket | # Households | % Households |
| Under 35 Years | 0 | 0.0% |
| 35 to 44 Years | 10 | 15.4% |
| 45 to 54 Years | 24 | 36.9% |
| 55 to 64 Years | 24 | 36.9% |
| 65 to 74 Years | 7 | 10.8% |
| 75 to 84 Years | 0 | 0.0% |
| 85 Years and Over | 0 | 0.0% |
| Total | 65 | 100.0% |
Housing Finances in Tiawah
Median Income by Occupancy in Tiawah
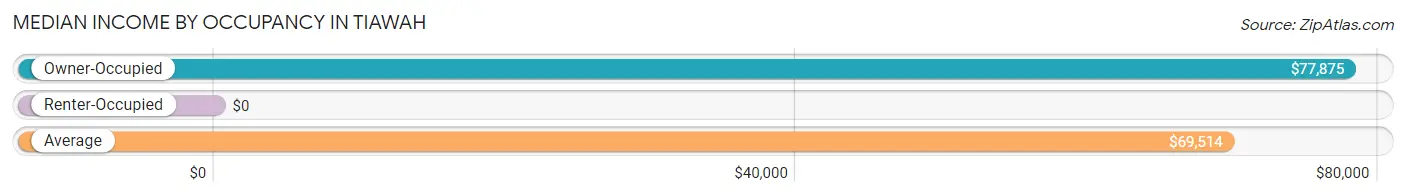
| Occupancy Type | # Households | Median Income |
| Owner-Occupied | 55 (84.6%) | $77,875 |
| Renter-Occupied | 10 (15.4%) | $0 |
| Average | 65 (100.0%) | $69,514 |
Occupancy by Householder Income Bracket in Tiawah
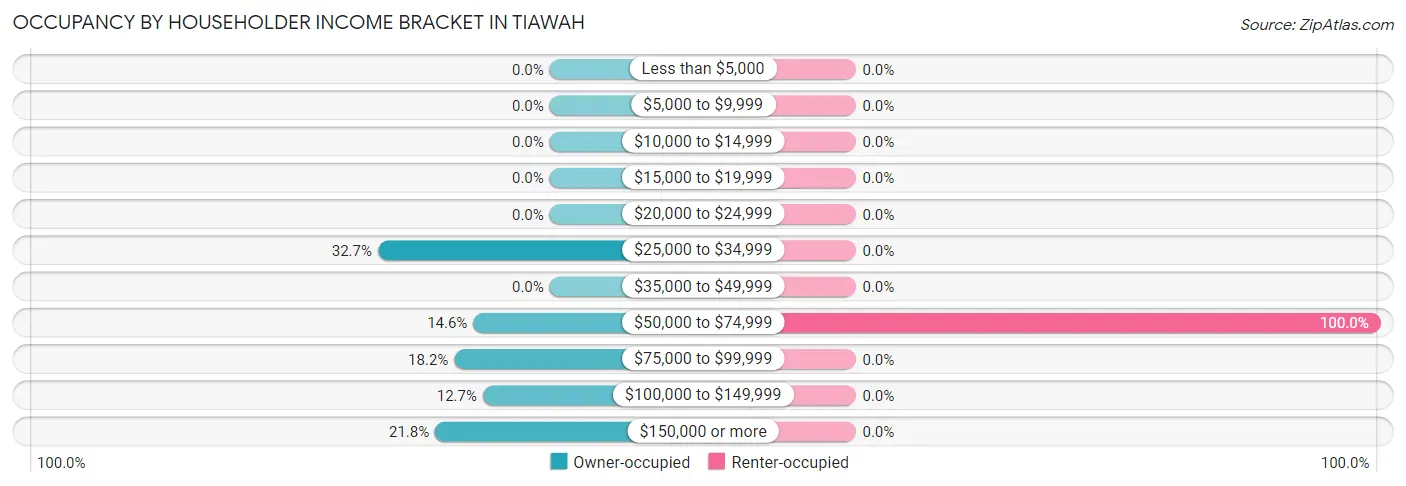
| Income Bracket | Owner-occupied | Renter-occupied |
| Less than $5,000 | 0 (0.0%) | 0 (0.0%) |
| $5,000 to $9,999 | 0 (0.0%) | 0 (0.0%) |
| $10,000 to $14,999 | 0 (0.0%) | 0 (0.0%) |
| $15,000 to $19,999 | 0 (0.0%) | 0 (0.0%) |
| $20,000 to $24,999 | 0 (0.0%) | 0 (0.0%) |
| $25,000 to $34,999 | 18 (32.7%) | 0 (0.0%) |
| $35,000 to $49,999 | 0 (0.0%) | 0 (0.0%) |
| $50,000 to $74,999 | 8 (14.5%) | 10 (100.0%) |
| $75,000 to $99,999 | 10 (18.2%) | 0 (0.0%) |
| $100,000 to $149,999 | 7 (12.7%) | 0 (0.0%) |
| $150,000 or more | 12 (21.8%) | 0 (0.0%) |
| Total | 55 (100.0%) | 10 (100.0%) |
Monthly Housing Cost Tiers in Tiawah
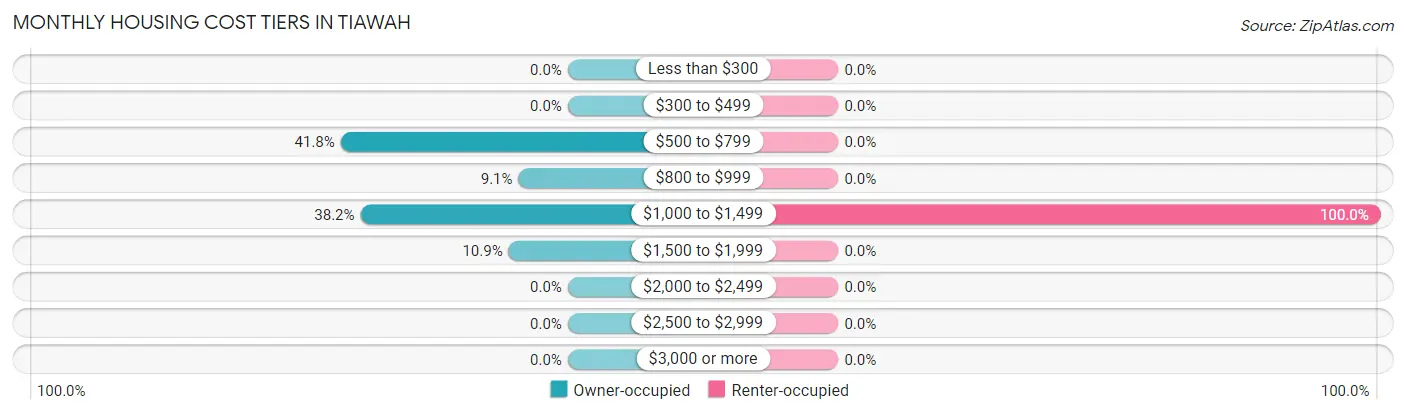
| Monthly Cost | Owner-occupied | Renter-occupied |
| Less than $300 | 0 (0.0%) | 0 (0.0%) |
| $300 to $499 | 0 (0.0%) | 0 (0.0%) |
| $500 to $799 | 23 (41.8%) | 0 (0.0%) |
| $800 to $999 | 5 (9.1%) | 0 (0.0%) |
| $1,000 to $1,499 | 21 (38.2%) | 10 (100.0%) |
| $1,500 to $1,999 | 6 (10.9%) | 0 (0.0%) |
| $2,000 to $2,499 | 0 (0.0%) | 0 (0.0%) |
| $2,500 to $2,999 | 0 (0.0%) | 0 (0.0%) |
| $3,000 or more | 0 (0.0%) | 0 (0.0%) |
| Total | 55 (100.0%) | 10 (100.0%) |
Physical Housing Characteristics in Tiawah
Housing Structures in Tiawah
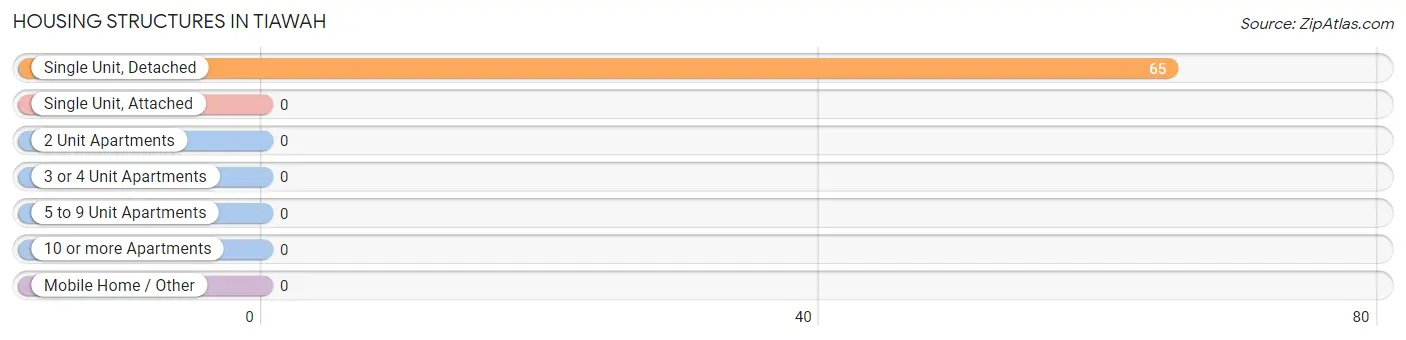
| Structure Type | # Housing Units | % Housing Units |
| Single Unit, Detached | 65 | 100.0% |
| Single Unit, Attached | 0 | 0.0% |
| 2 Unit Apartments | 0 | 0.0% |
| 3 or 4 Unit Apartments | 0 | 0.0% |
| 5 to 9 Unit Apartments | 0 | 0.0% |
| 10 or more Apartments | 0 | 0.0% |
| Mobile Home / Other | 0 | 0.0% |
| Total | 65 | 100.0% |
Housing Structures by Occupancy in Tiawah
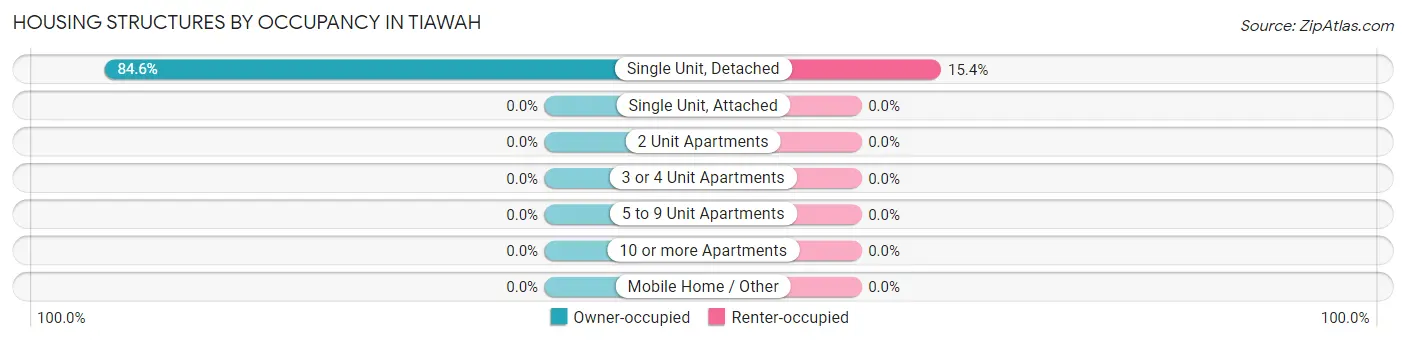
| Structure Type | Owner-occupied | Renter-occupied |
| Single Unit, Detached | 55 (84.6%) | 10 (15.4%) |
| Single Unit, Attached | 0 (0.0%) | 0 (0.0%) |
| 2 Unit Apartments | 0 (0.0%) | 0 (0.0%) |
| 3 or 4 Unit Apartments | 0 (0.0%) | 0 (0.0%) |
| 5 to 9 Unit Apartments | 0 (0.0%) | 0 (0.0%) |
| 10 or more Apartments | 0 (0.0%) | 0 (0.0%) |
| Mobile Home / Other | 0 (0.0%) | 0 (0.0%) |
| Total | 55 (84.6%) | 10 (15.4%) |
Housing Structures by Number of Rooms in Tiawah
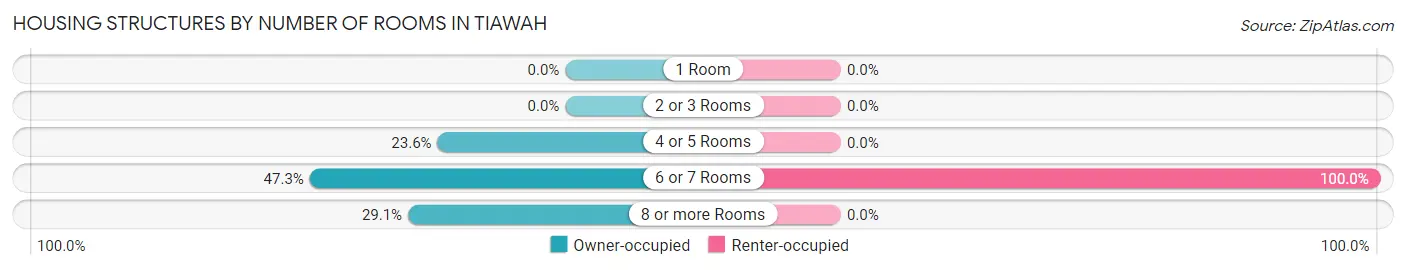
| Number of Rooms | Owner-occupied | Renter-occupied |
| 1 Room | 0 (0.0%) | 0 (0.0%) |
| 2 or 3 Rooms | 0 (0.0%) | 0 (0.0%) |
| 4 or 5 Rooms | 13 (23.6%) | 0 (0.0%) |
| 6 or 7 Rooms | 26 (47.3%) | 10 (100.0%) |
| 8 or more Rooms | 16 (29.1%) | 0 (0.0%) |
| Total | 55 (100.0%) | 10 (100.0%) |
Housing Structure by Heating Type in Tiawah
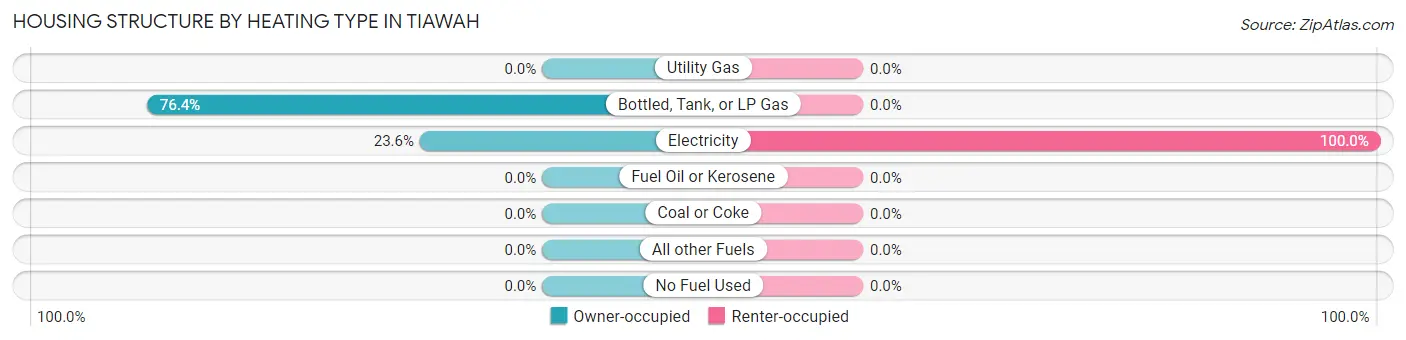
| Heating Type | Owner-occupied | Renter-occupied |
| Utility Gas | 0 (0.0%) | 0 (0.0%) |
| Bottled, Tank, or LP Gas | 42 (76.4%) | 0 (0.0%) |
| Electricity | 13 (23.6%) | 10 (100.0%) |
| Fuel Oil or Kerosene | 0 (0.0%) | 0 (0.0%) |
| Coal or Coke | 0 (0.0%) | 0 (0.0%) |
| All other Fuels | 0 (0.0%) | 0 (0.0%) |
| No Fuel Used | 0 (0.0%) | 0 (0.0%) |
| Total | 55 (100.0%) | 10 (100.0%) |
Household Vehicle Usage in Tiawah
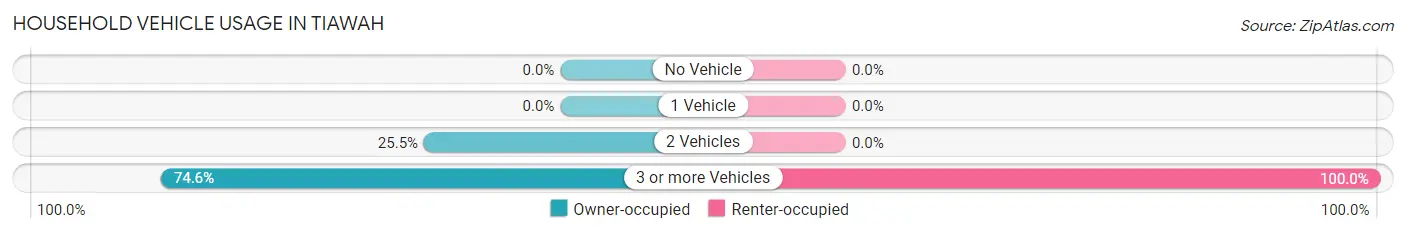
| Vehicles per Household | Owner-occupied | Renter-occupied |
| No Vehicle | 0 (0.0%) | 0 (0.0%) |
| 1 Vehicle | 0 (0.0%) | 0 (0.0%) |
| 2 Vehicles | 14 (25.5%) | 0 (0.0%) |
| 3 or more Vehicles | 41 (74.6%) | 10 (100.0%) |
| Total | 55 (100.0%) | 10 (100.0%) |
Real Estate & Mortgages in Tiawah
Real Estate and Mortgage Overview in Tiawah
| Characteristic | Without Mortgage | With Mortgage |
| Housing Units | 34 | 21 |
| Median Property Value | $247,200 | $217,900 |
| Median Household Income | - | - |
| Monthly Housing Costs | $674 | $0 |
| Real Estate Taxes | - | - |
Property Value by Mortgage Status in Tiawah
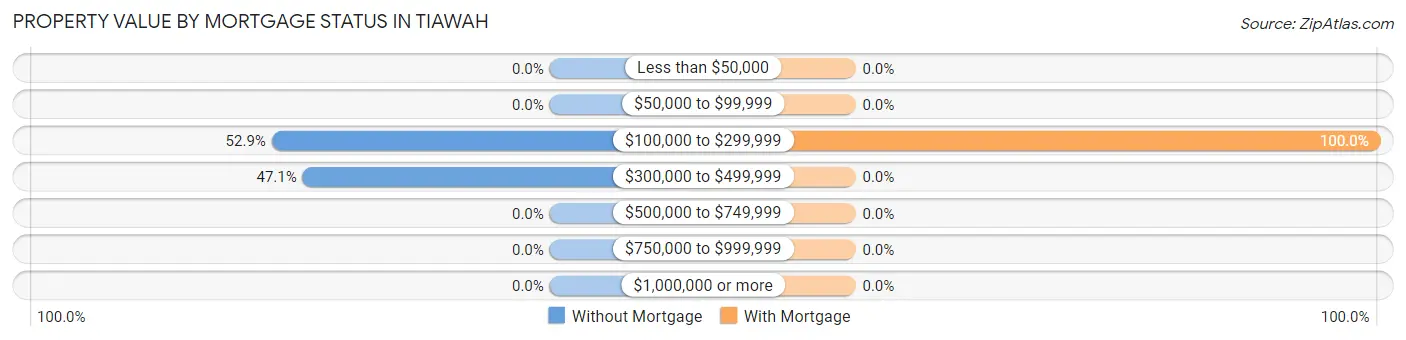
| Property Value | Without Mortgage | With Mortgage |
| Less than $50,000 | 0 (0.0%) | 0 (0.0%) |
| $50,000 to $99,999 | 0 (0.0%) | 0 (0.0%) |
| $100,000 to $299,999 | 18 (52.9%) | 21 (100.0%) |
| $300,000 to $499,999 | 16 (47.1%) | 0 (0.0%) |
| $500,000 to $749,999 | 0 (0.0%) | 0 (0.0%) |
| $750,000 to $999,999 | 0 (0.0%) | 0 (0.0%) |
| $1,000,000 or more | 0 (0.0%) | 0 (0.0%) |
| Total | 34 (100.0%) | 21 (100.0%) |
Household Income by Mortgage Status in Tiawah
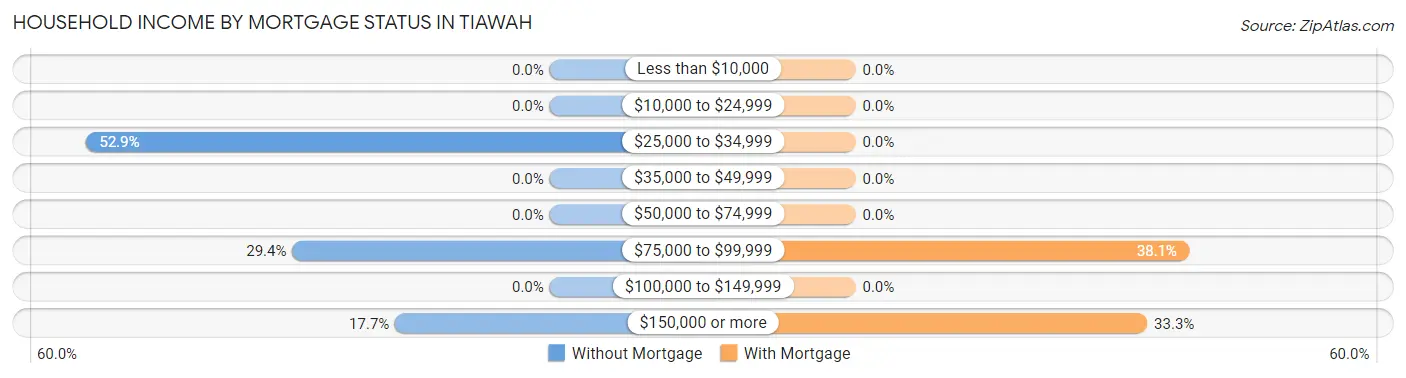
| Household Income | Without Mortgage | With Mortgage |
| Less than $10,000 | 0 (0.0%) | 0 (0.0%) |
| $10,000 to $24,999 | 0 (0.0%) | 0 (0.0%) |
| $25,000 to $34,999 | 18 (52.9%) | 0 (0.0%) |
| $35,000 to $49,999 | 0 (0.0%) | 0 (0.0%) |
| $50,000 to $74,999 | 0 (0.0%) | 0 (0.0%) |
| $75,000 to $99,999 | 10 (29.4%) | 8 (38.1%) |
| $100,000 to $149,999 | 0 (0.0%) | 0 (0.0%) |
| $150,000 or more | 6 (17.6%) | 7 (33.3%) |
| Total | 34 (100.0%) | 21 (100.0%) |
Property Value to Household Income Ratio in Tiawah
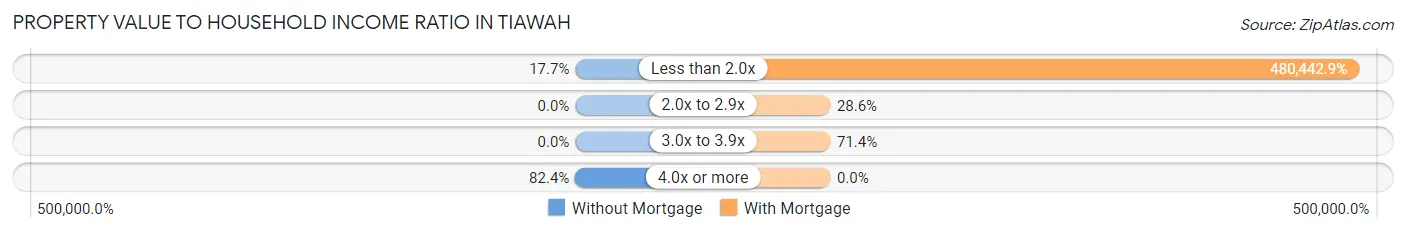
| Value-to-Income Ratio | Without Mortgage | With Mortgage |
| Less than 2.0x | 6 (17.6%) | 100,893 (480,442.9%) |
| 2.0x to 2.9x | 0 (0.0%) | 6 (28.6%) |
| 3.0x to 3.9x | 0 (0.0%) | 15 (71.4%) |
| 4.0x or more | 28 (82.4%) | 0 (0.0%) |
| Total | 34 (100.0%) | 21 (100.0%) |
Real Estate Taxes by Mortgage Status in Tiawah
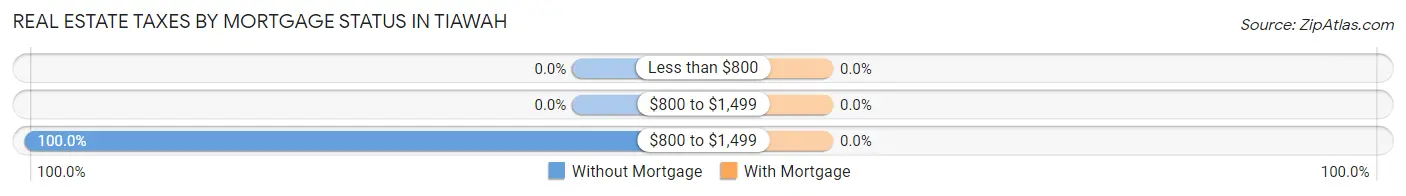
| Property Taxes | Without Mortgage | With Mortgage |
| Less than $800 | 0 (0.0%) | 0 (0.0%) |
| $800 to $1,499 | 0 (0.0%) | 0 (0.0%) |
| $800 to $1,499 | 34 (100.0%) | 0 (0.0%) |
| Total | 34 (100.0%) | 21 (100.0%) |
Health & Disability in Tiawah
Health Insurance Coverage by Age in Tiawah
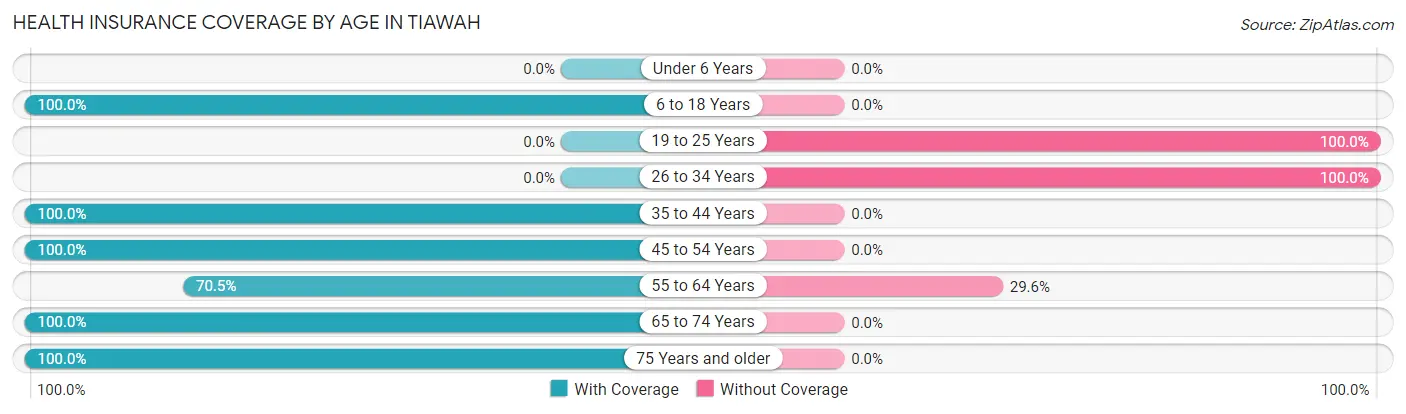
| Age Bracket | With Coverage | Without Coverage |
| Under 6 Years | 0 (0.0%) | 0 (0.0%) |
| 6 to 18 Years | 17 (100.0%) | 0 (0.0%) |
| 19 to 25 Years | 0 (0.0%) | 15 (100.0%) |
| 26 to 34 Years | 0 (0.0%) | 14 (100.0%) |
| 35 to 44 Years | 10 (100.0%) | 0 (0.0%) |
| 45 to 54 Years | 34 (100.0%) | 0 (0.0%) |
| 55 to 64 Years | 31 (70.5%) | 13 (29.5%) |
| 65 to 74 Years | 14 (100.0%) | 0 (0.0%) |
| 75 Years and older | 11 (100.0%) | 0 (0.0%) |
| Total | 117 (73.6%) | 42 (26.4%) |
Health Insurance Coverage by Citizenship Status in Tiawah
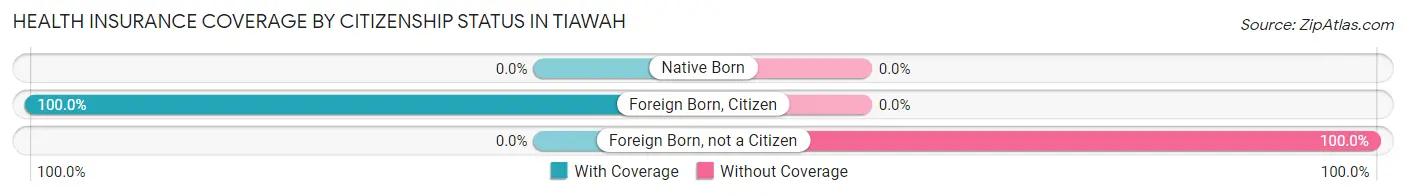
| Citizenship Status | With Coverage | Without Coverage |
| Native Born | 0 (0.0%) | 0 (0.0%) |
| Foreign Born, Citizen | 17 (100.0%) | 0 (0.0%) |
| Foreign Born, not a Citizen | 0 (0.0%) | 15 (100.0%) |
Health Insurance Coverage by Household Income in Tiawah
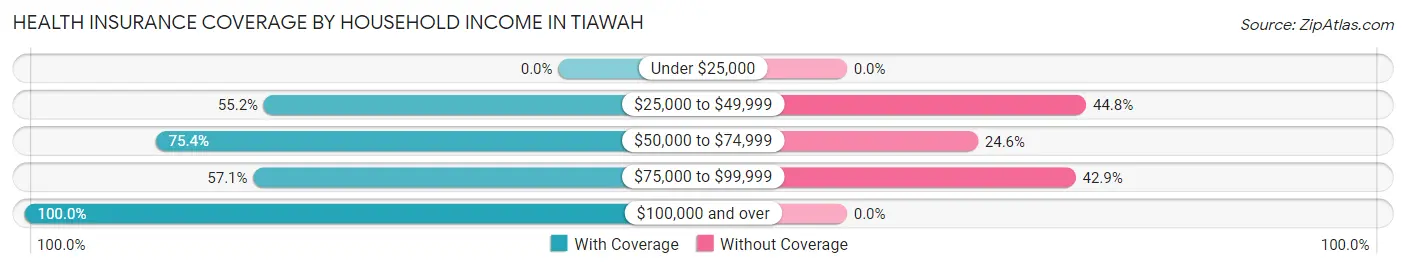
| Household Income | With Coverage | Without Coverage |
| Under $25,000 | 0 (0.0%) | 0 (0.0%) |
| $25,000 to $49,999 | 16 (55.2%) | 13 (44.8%) |
| $50,000 to $74,999 | 43 (75.4%) | 14 (24.6%) |
| $75,000 to $99,999 | 20 (57.1%) | 15 (42.9%) |
| $100,000 and over | 38 (100.0%) | 0 (0.0%) |
Public vs Private Health Insurance Coverage by Age in Tiawah
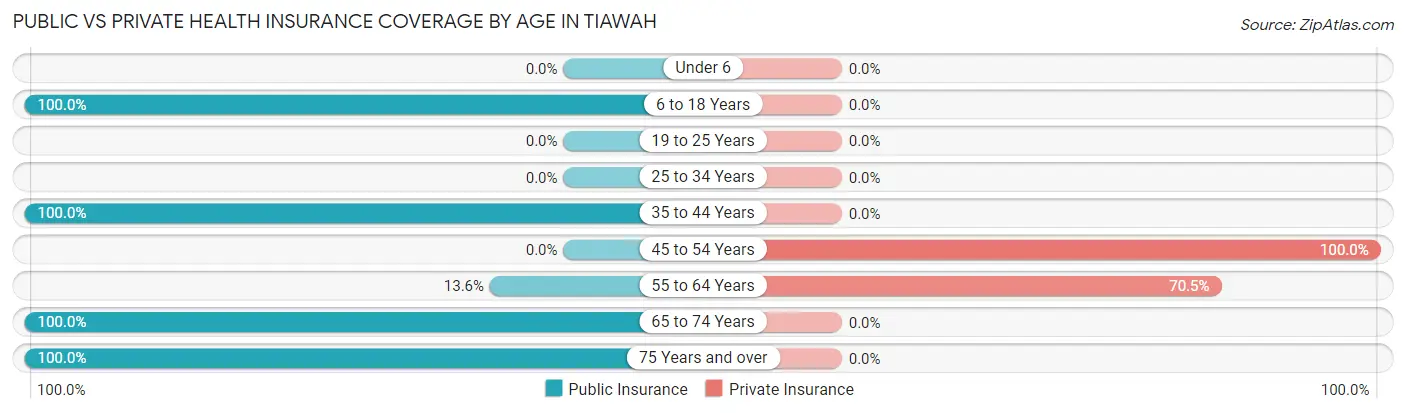
| Age Bracket | Public Insurance | Private Insurance |
| Under 6 | 0 (0.0%) | 0 (0.0%) |
| 6 to 18 Years | 17 (100.0%) | 0 (0.0%) |
| 19 to 25 Years | 0 (0.0%) | 0 (0.0%) |
| 25 to 34 Years | 0 (0.0%) | 0 (0.0%) |
| 35 to 44 Years | 10 (100.0%) | 0 (0.0%) |
| 45 to 54 Years | 0 (0.0%) | 34 (100.0%) |
| 55 to 64 Years | 6 (13.6%) | 31 (70.5%) |
| 65 to 74 Years | 14 (100.0%) | 0 (0.0%) |
| 75 Years and over | 11 (100.0%) | 0 (0.0%) |
| Total | 58 (36.5%) | 65 (40.9%) |
Disability Status by Sex by Age in Tiawah
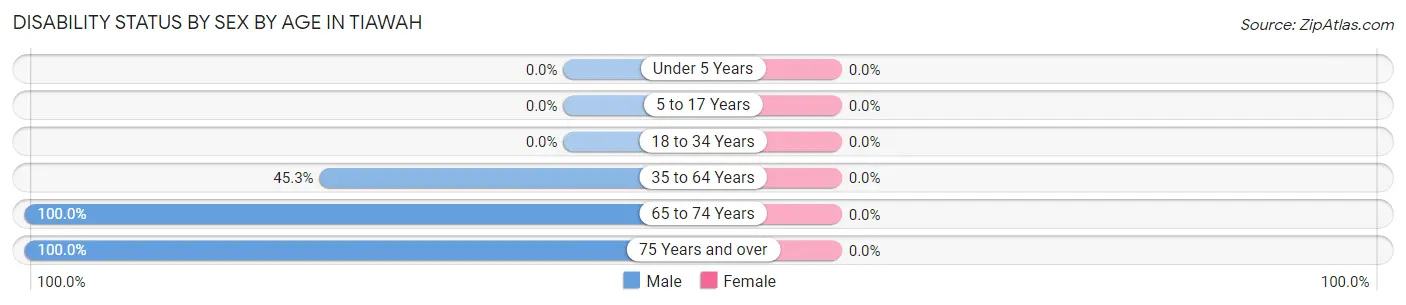
| Age Bracket | Male | Female |
| Under 5 Years | 0 (0.0%) | 0 (0.0%) |
| 5 to 17 Years | 0 (0.0%) | 0 (0.0%) |
| 18 to 34 Years | 0 (0.0%) | 0 (0.0%) |
| 35 to 64 Years | 24 (45.3%) | 0 (0.0%) |
| 65 to 74 Years | 7 (100.0%) | 0 (0.0%) |
| 75 Years and over | 6 (100.0%) | 0 (0.0%) |
Disability Class by Sex by Age in Tiawah
Disability Class: Hearing Difficulty
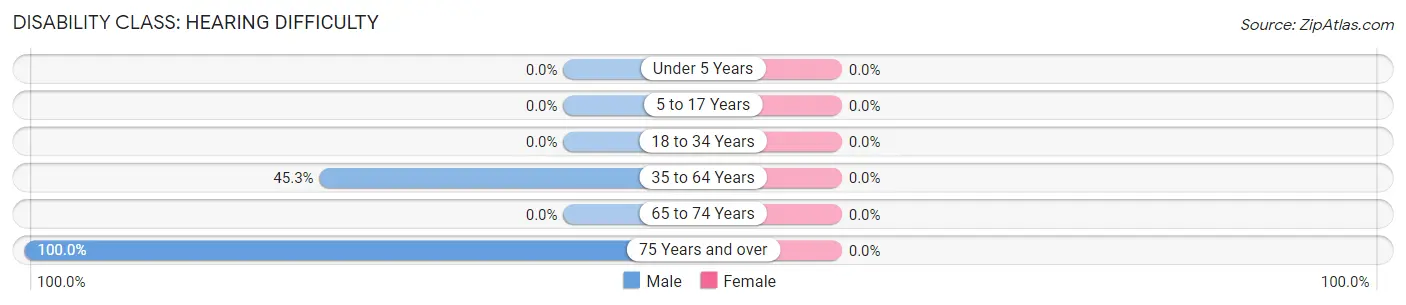
| Age Bracket | Male | Female |
| Under 5 Years | 0 (0.0%) | 0 (0.0%) |
| 5 to 17 Years | 0 (0.0%) | 0 (0.0%) |
| 18 to 34 Years | 0 (0.0%) | 0 (0.0%) |
| 35 to 64 Years | 24 (45.3%) | 0 (0.0%) |
| 65 to 74 Years | 0 (0.0%) | 0 (0.0%) |
| 75 Years and over | 6 (100.0%) | 0 (0.0%) |
Disability Class: Vision Difficulty
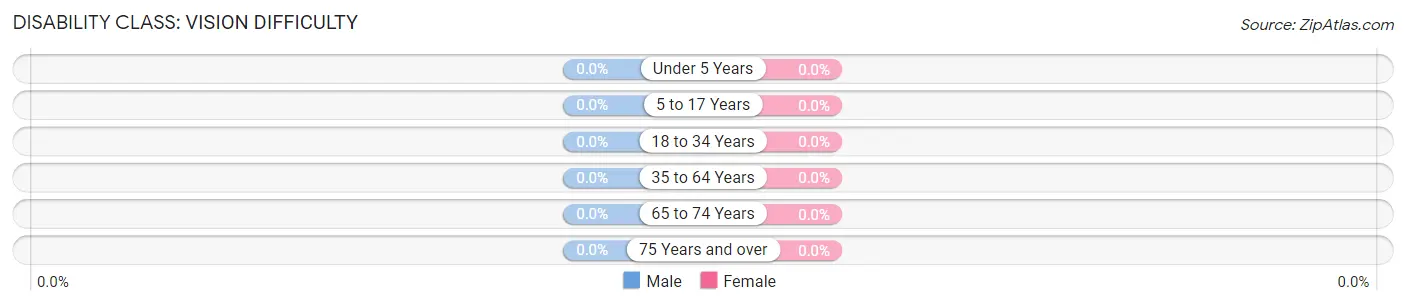
| Age Bracket | Male | Female |
| Under 5 Years | 0 (0.0%) | 0 (0.0%) |
| 5 to 17 Years | 0 (0.0%) | 0 (0.0%) |
| 18 to 34 Years | 0 (0.0%) | 0 (0.0%) |
| 35 to 64 Years | 0 (0.0%) | 0 (0.0%) |
| 65 to 74 Years | 0 (0.0%) | 0 (0.0%) |
| 75 Years and over | 0 (0.0%) | 0 (0.0%) |
Disability Class: Cognitive Difficulty
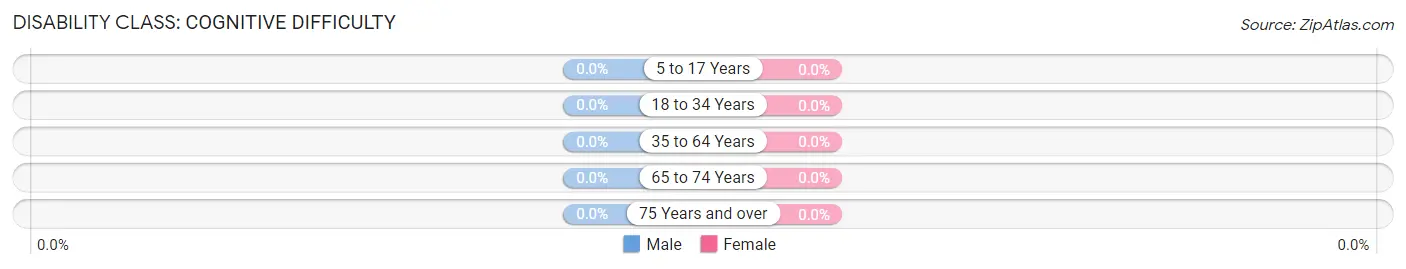
| Age Bracket | Male | Female |
| 5 to 17 Years | 0 (0.0%) | 0 (0.0%) |
| 18 to 34 Years | 0 (0.0%) | 0 (0.0%) |
| 35 to 64 Years | 0 (0.0%) | 0 (0.0%) |
| 65 to 74 Years | 0 (0.0%) | 0 (0.0%) |
| 75 Years and over | 0 (0.0%) | 0 (0.0%) |
Disability Class: Ambulatory Difficulty
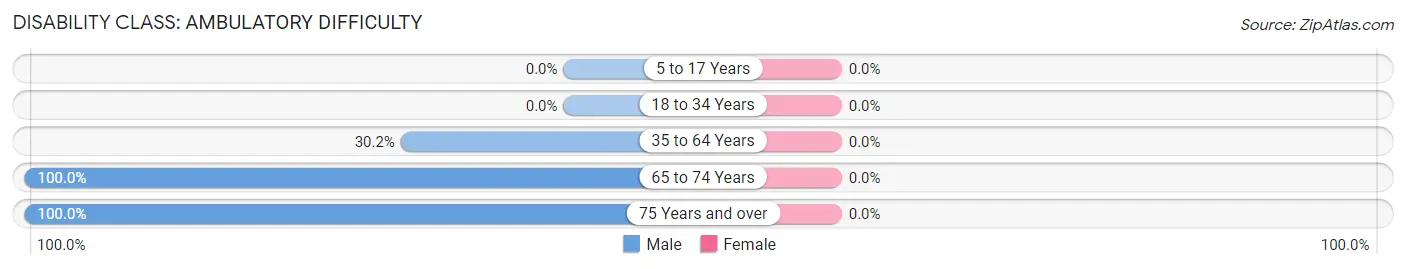
| Age Bracket | Male | Female |
| 5 to 17 Years | 0 (0.0%) | 0 (0.0%) |
| 18 to 34 Years | 0 (0.0%) | 0 (0.0%) |
| 35 to 64 Years | 16 (30.2%) | 0 (0.0%) |
| 65 to 74 Years | 7 (100.0%) | 0 (0.0%) |
| 75 Years and over | 6 (100.0%) | 0 (0.0%) |
Disability Class: Self-Care Difficulty
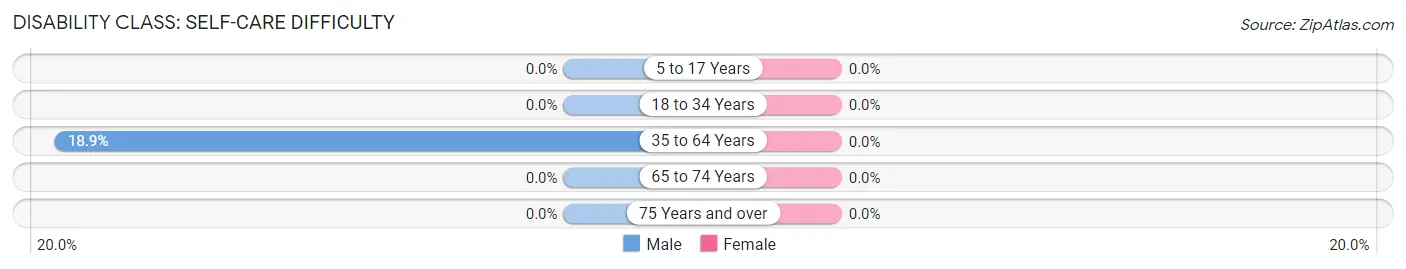
| Age Bracket | Male | Female |
| 5 to 17 Years | 0 (0.0%) | 0 (0.0%) |
| 18 to 34 Years | 0 (0.0%) | 0 (0.0%) |
| 35 to 64 Years | 10 (18.9%) | 0 (0.0%) |
| 65 to 74 Years | 0 (0.0%) | 0 (0.0%) |
| 75 Years and over | 0 (0.0%) | 0 (0.0%) |
Technology Access in Tiawah
Computing Device Access in Tiawah
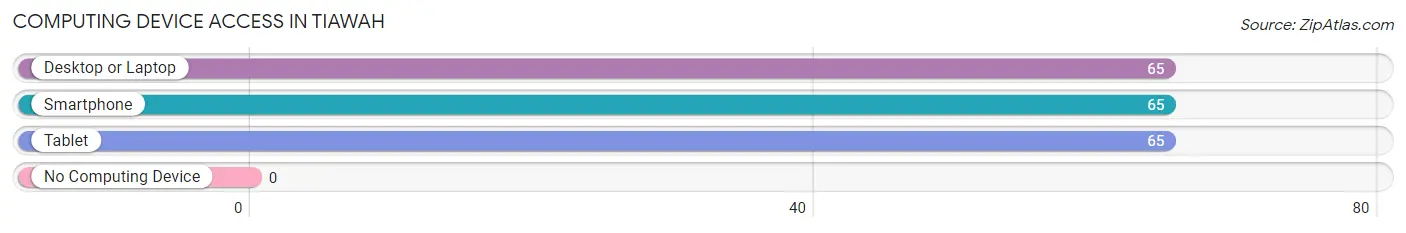
| Device Type | # Households | % Households |
| Desktop or Laptop | 65 | 100.0% |
| Smartphone | 65 | 100.0% |
| Tablet | 65 | 100.0% |
| No Computing Device | 0 | 0.0% |
| Total | 65 | 100.0% |
Internet Access in Tiawah
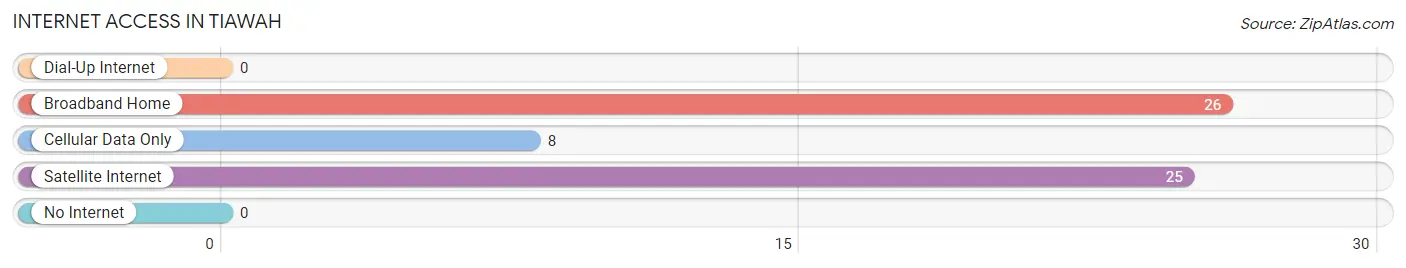
| Internet Type | # Households | % Households |
| Dial-Up Internet | 0 | 0.0% |
| Broadband Home | 26 | 40.0% |
| Cellular Data Only | 8 | 12.3% |
| Satellite Internet | 25 | 38.5% |
| No Internet | 0 | 0.0% |
| Total | 65 | 100.0% |
Tiawah Summary
Tiawah is a small unincorporated community located in Rogers County, Oklahoma. It is situated in the foothills of the Ozark Mountains, approximately 20 miles east of Tulsa. The town was founded in the late 1800s and has a population of approximately 500 people.
History
Tiawah was founded in the late 1800s by a group of Cherokee Indians who had been relocated from their ancestral lands in the southeastern United States. The town was named after a Cherokee chief, Tiawah, who was a leader of the tribe. The town was originally a farming community, but it soon became a trading post for the surrounding area.
In the early 1900s, the town began to grow and develop. The first school was built in 1910 and the first post office was established in 1911. The town also had a general store, a blacksmith shop, and a cotton gin.
In the 1920s, the town began to experience a period of growth and prosperity. The population increased from around 200 people in 1920 to over 500 people in 1930. During this time, the town also saw the construction of a new school, a bank, and a movie theater.
In the 1940s, the town experienced a period of decline. The population decreased to around 300 people and the town began to experience economic hardship. The town was also affected by the Dust Bowl, which caused many of the farmers to leave the area.
In the 1950s, the town began to experience a period of recovery. The population increased to around 500 people and the town began to experience economic growth. The town also saw the construction of a new school and a new post office.
In the 1960s, the town experienced a period of growth and prosperity. The population increased to around 700 people and the town saw the construction of a new library and a new fire station.
In the 1970s, the town experienced a period of decline. The population decreased to around 500 people and the town began to experience economic hardship.
In the 1980s, the town experienced a period of recovery. The population increased to around 600 people and the town saw the construction of a new school and a new post office.
In the 1990s, the town experienced a period of growth and prosperity. The population increased to around 700 people and the town saw the construction of a new library and a new fire station.
Geography
Tiawah is located in the foothills of the Ozark Mountains in Rogers County, Oklahoma. The town is situated on the banks of the Verdigris River and is surrounded by rolling hills and wooded areas. The town is located approximately 20 miles east of Tulsa and is accessible by State Highway 20.
Economy
The economy of Tiawah is largely based on agriculture. The town is home to several farms and ranches that produce a variety of crops, including corn, wheat, soybeans, and hay. The town also has a few small businesses, including a general store, a gas station, and a restaurant.
Demographics
As of the 2010 census, the population of Tiawah was 517 people. The racial makeup of the town was 95.3% White, 0.6% African American, 0.2% Native American, 0.4% Asian, 0.2% from other races, and 3.3% from two or more races. The median household income was $37,500 and the median family income was $41,250. The per capita income was $17,845.
Common Questions
What is Per Capita Income in Tiawah?
Per Capita income in Tiawah is $36,652.
What is the Median Family Income in Tiawah?
Median Family Income in Tiawah is $78,250.
What is the Median Household income in Tiawah?
Median Household Income in Tiawah is $69,514.
What is Inequality or Gini Index in Tiawah?
Inequality or Gini Index in Tiawah is 0.34.
What is the Total Population of Tiawah?
Total Population of Tiawah is 159.
What is the Total Male Population of Tiawah?
Total Male Population of Tiawah is 105.
What is the Total Female Population of Tiawah?
Total Female Population of Tiawah is 54.
What is the Ratio of Males per 100 Females in Tiawah?
There are 194.44 Males per 100 Females in Tiawah.
What is the Ratio of Females per 100 Males in Tiawah?
There are 51.43 Females per 100 Males in Tiawah.
What is the Median Population Age in Tiawah?
Median Population Age in Tiawah is 51.9 Years.
What is the Average Family Size in Tiawah
Average Family Size in Tiawah is 2.5 People.
What is the Average Household Size in Tiawah
Average Household Size in Tiawah is 2.5 People.
How Large is the Labor Force in Tiawah?
There are 92 People in the Labor Forcein in Tiawah.
What is the Percentage of People in the Labor Force in Tiawah?
57.9% of People are in the Labor Force in Tiawah.