Virginia City, NV Map & Demographics
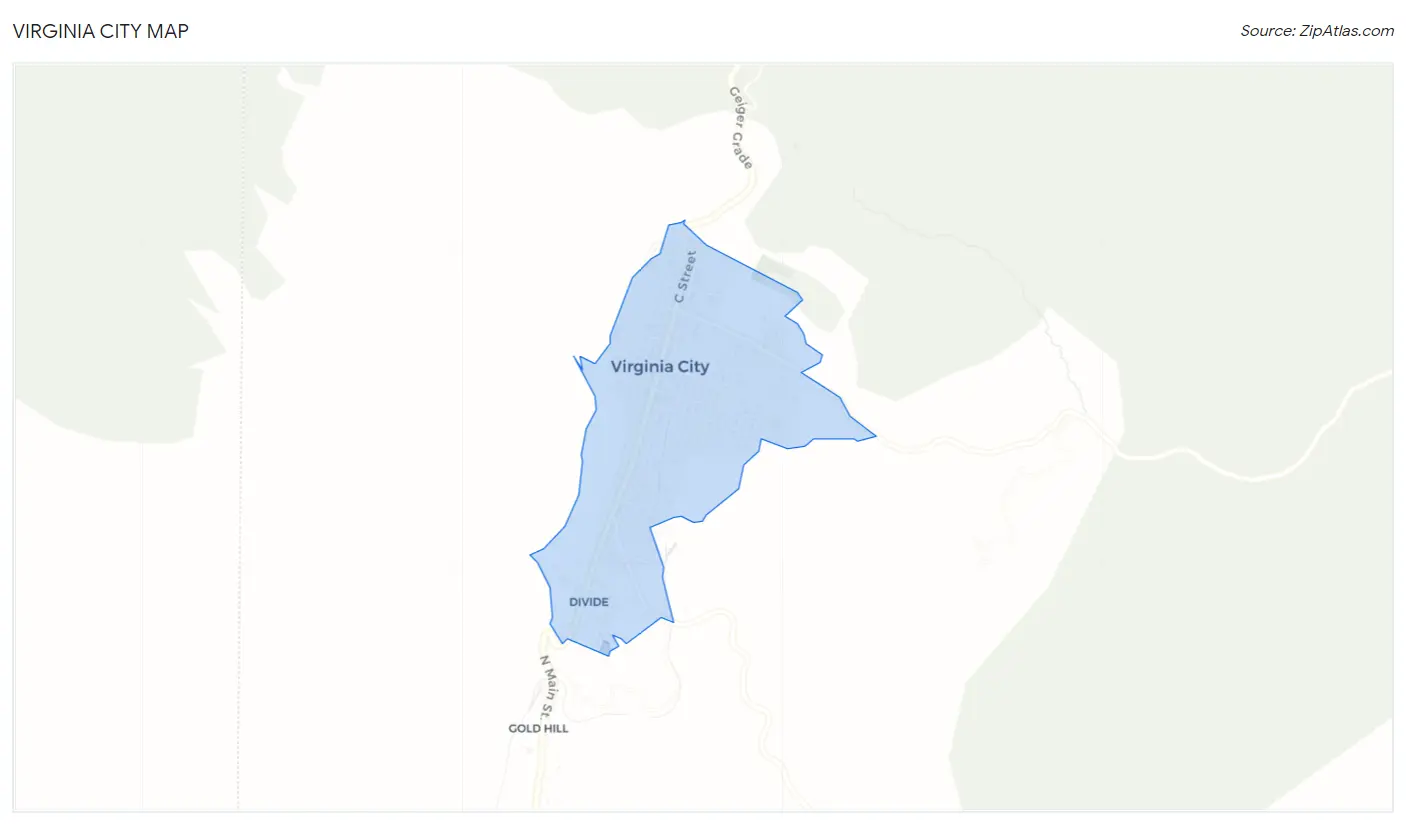
Virginia City Map
Virginia City Overview
$43,427
PER CAPITA INCOME
$127,214
AVG FAMILY INCOME
$106,815
AVG HOUSEHOLD INCOME
0.40
INEQUALITY / GINI INDEX
904
TOTAL POPULATION
589
MALE POPULATION
315
FEMALE POPULATION
186.98
MALES / 100 FEMALES
53.48
FEMALES / 100 MALES
53.6
MEDIAN AGE
3.3
AVG FAMILY SIZE
2.6
AVG HOUSEHOLD SIZE
309
LABOR FORCE [ PEOPLE ]
41.0%
PERCENT IN LABOR FORCE
Virginia City Zip Codes
Income in Virginia City
Income Overview in Virginia City
Per Capita Income in Virginia City is $43,427, while median incomes of families and households are $127,214 and $106,815 respectively.
| Characteristic | Number | Measure |
| Per Capita Income | 904 | $43,427 |
| Median Family Income | 166 | $127,214 |
| Mean Family Income | 166 | $157,584 |
| Median Household Income | 347 | $106,815 |
| Mean Household Income | 347 | $107,176 |
| Income Deficit | 166 | $0 |
| Wage / Income Gap (%) | 904 | 0.00% |
| Wage / Income Gap ($) | 904 | 100.00¢ per $1 |
| Gini / Inequality Index | 904 | 0.40 |
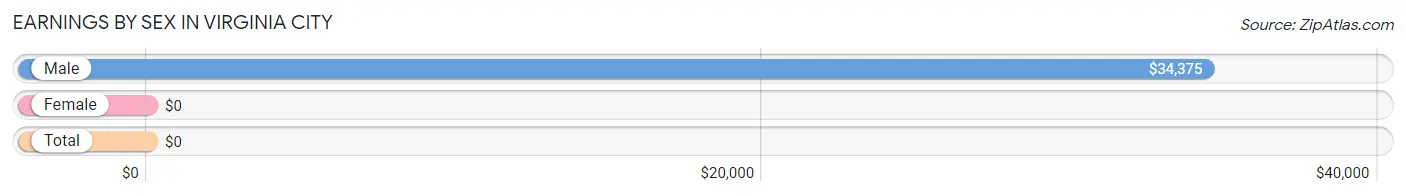
Earnings by Sex in Virginia City
| Sex | Number | Average Earnings |
| Male | 319 (73.2%) | $34,375 |
| Female | 117 (26.8%) | $0 |
| Total | 436 (100.0%) | $0 |
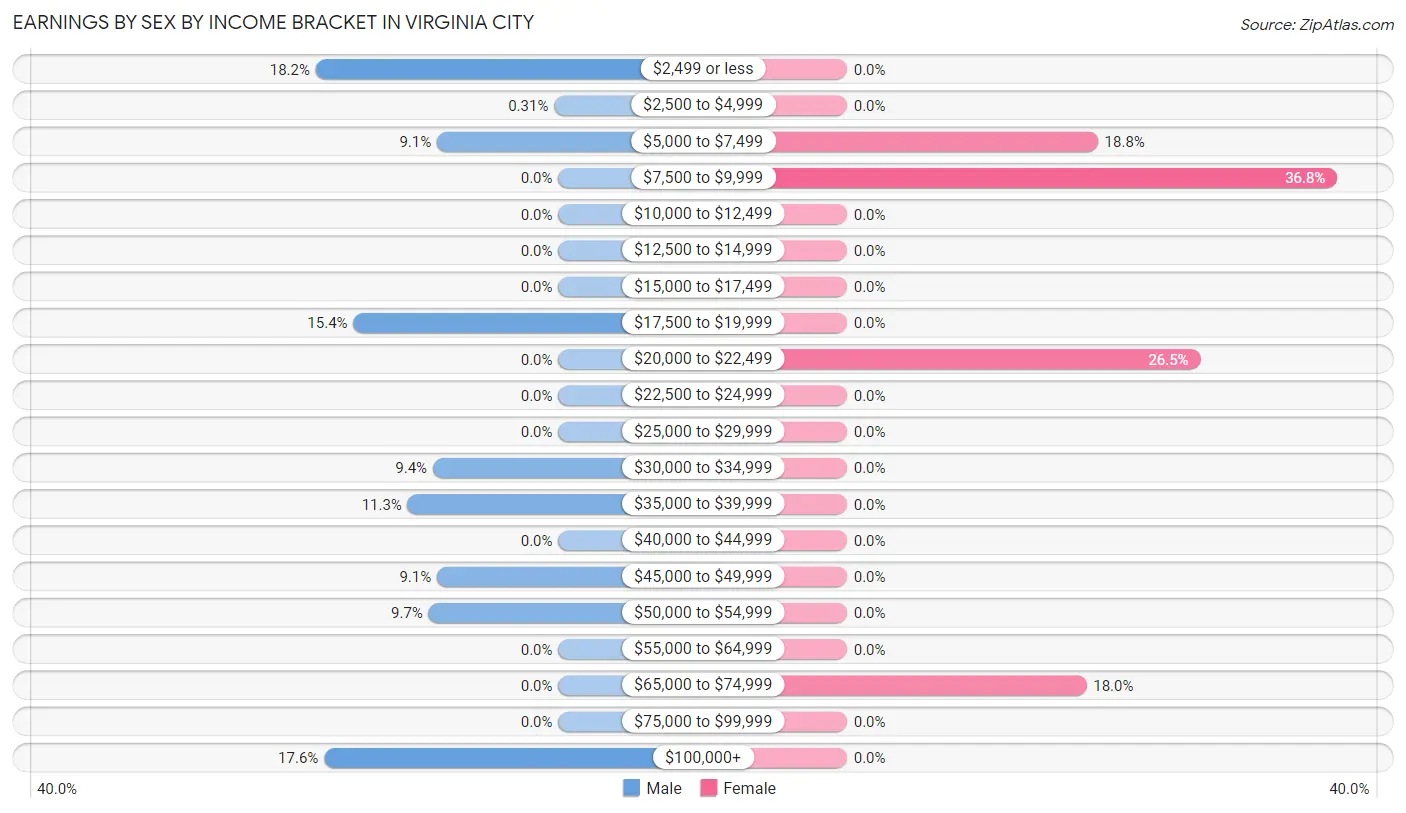
Earnings by Sex by Income Bracket in Virginia City
The most common earnings brackets in Virginia City are $2,499 or less for men (58 | 18.2%) and $7,500 to $9,999 for women (43 | 36.7%).
| Income | Male | Female |
| $2,499 or less | 58 (18.2%) | 0 (0.0%) |
| $2,500 to $4,999 | 1 (0.3%) | 0 (0.0%) |
| $5,000 to $7,499 | 29 (9.1%) | 22 (18.8%) |
| $7,500 to $9,999 | 0 (0.0%) | 43 (36.7%) |
| $10,000 to $12,499 | 0 (0.0%) | 0 (0.0%) |
| $12,500 to $14,999 | 0 (0.0%) | 0 (0.0%) |
| $15,000 to $17,499 | 0 (0.0%) | 0 (0.0%) |
| $17,500 to $19,999 | 49 (15.4%) | 0 (0.0%) |
| $20,000 to $22,499 | 0 (0.0%) | 31 (26.5%) |
| $22,500 to $24,999 | 0 (0.0%) | 0 (0.0%) |
| $25,000 to $29,999 | 0 (0.0%) | 0 (0.0%) |
| $30,000 to $34,999 | 30 (9.4%) | 0 (0.0%) |
| $35,000 to $39,999 | 36 (11.3%) | 0 (0.0%) |
| $40,000 to $44,999 | 0 (0.0%) | 0 (0.0%) |
| $45,000 to $49,999 | 29 (9.1%) | 0 (0.0%) |
| $50,000 to $54,999 | 31 (9.7%) | 0 (0.0%) |
| $55,000 to $64,999 | 0 (0.0%) | 0 (0.0%) |
| $65,000 to $74,999 | 0 (0.0%) | 21 (17.9%) |
| $75,000 to $99,999 | 0 (0.0%) | 0 (0.0%) |
| $100,000+ | 56 (17.5%) | 0 (0.0%) |
| Total | 319 (100.0%) | 117 (100.0%) |
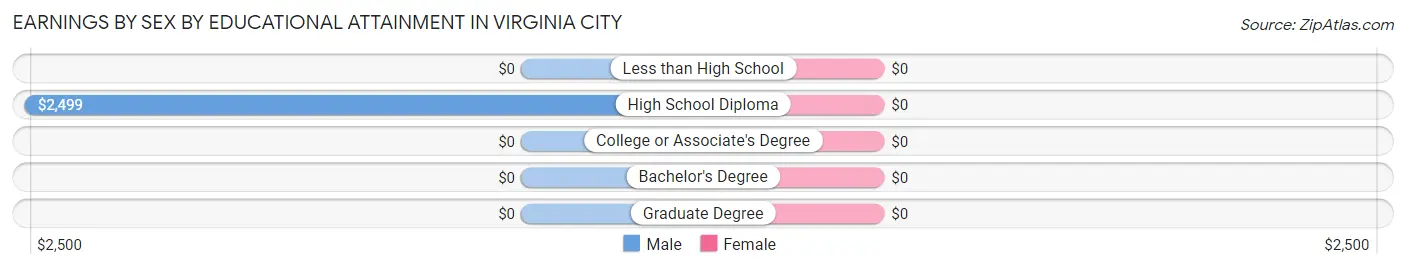
Earnings by Sex by Educational Attainment in Virginia City
| Educational Attainment | Male Income | Female Income |
| Less than High School | - | - |
| High School Diploma | $2,499 | $0 |
| College or Associate's Degree | - | - |
| Bachelor's Degree | - | - |
| Graduate Degree | - | - |
| Total | $38,056 | $0 |
Family Income in Virginia City
Family Income Brackets in Virginia City
According to the Virginia City family income data, there are 90 families falling into the $100,000 to $149,999 income range, which is the most common income bracket and makes up 54.2% of all families.
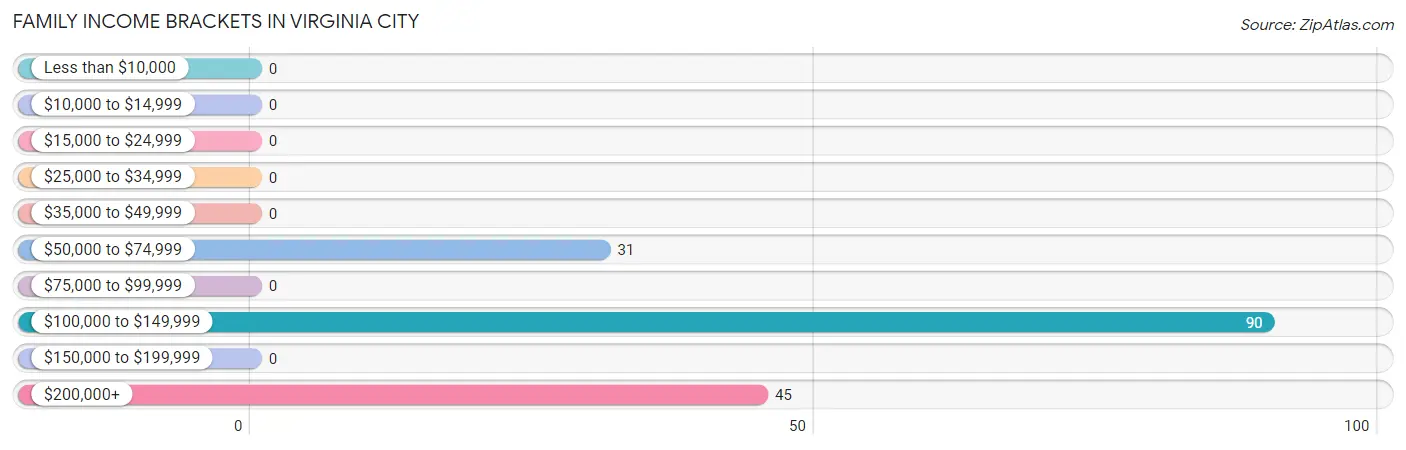
| Income Bracket | # Families | % Families |
| Less than $10,000 | 0 | 0.0% |
| $10,000 to $14,999 | 0 | 0.0% |
| $15,000 to $24,999 | 0 | 0.0% |
| $25,000 to $34,999 | 0 | 0.0% |
| $35,000 to $49,999 | 0 | 0.0% |
| $50,000 to $74,999 | 31 | 18.7% |
| $75,000 to $99,999 | 0 | 0.0% |
| $100,000 to $149,999 | 90 | 54.2% |
| $150,000 to $199,999 | 0 | 0.0% |
| $200,000+ | 45 | 27.1% |
Family Income by Famaliy Size in Virginia City
2-person families (90 | 54.2%) account for the highest median family income in Virginia City with $126,714 per family, while 2-person families (90 | 54.2%) have the highest median income of $63,357 per family member.
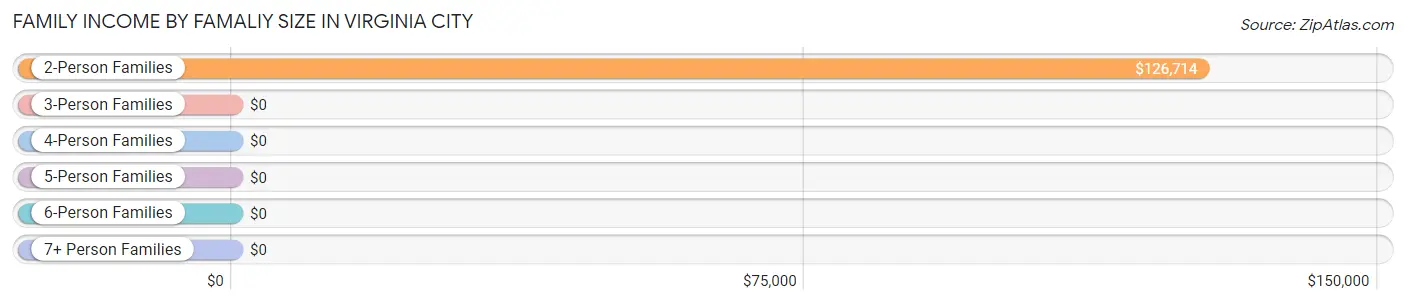
| Income Bracket | # Families | Median Income |
| 2-Person Families | 90 (54.2%) | $126,714 |
| 3-Person Families | 0 (0.0%) | $0 |
| 4-Person Families | 54 (32.5%) | $0 |
| 5-Person Families | 0 (0.0%) | $0 |
| 6-Person Families | 22 (13.3%) | $0 |
| 7+ Person Families | 0 (0.0%) | $0 |
| Total | 166 (100.0%) | $127,214 |
Family Income by Number of Earners in Virginia City
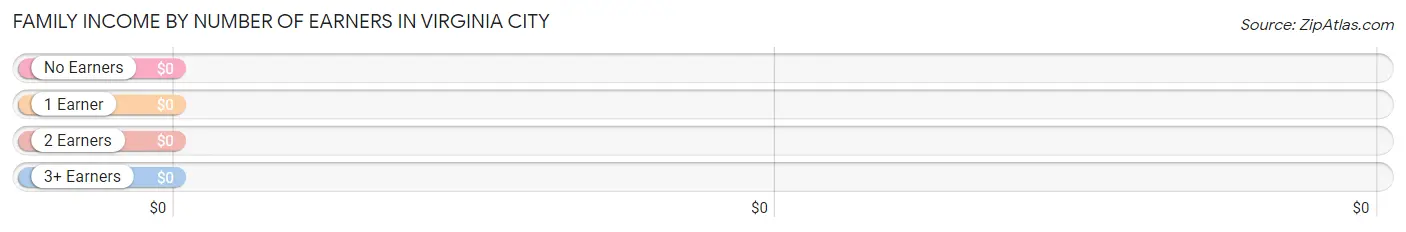
| Number of Earners | # Families | Median Income |
| No Earners | 69 (41.6%) | $0 |
| 1 Earner | 23 (13.9%) | $0 |
| 2 Earners | 43 (25.9%) | $0 |
| 3+ Earners | 31 (18.7%) | $0 |
| Total | 166 (100.0%) | $127,214 |
Household Income in Virginia City
Household Income Brackets in Virginia City
With 130 households falling in the category, the $100,000 to $149,999 income range is the most frequent in Virginia City, accounting for 37.5% of all households.
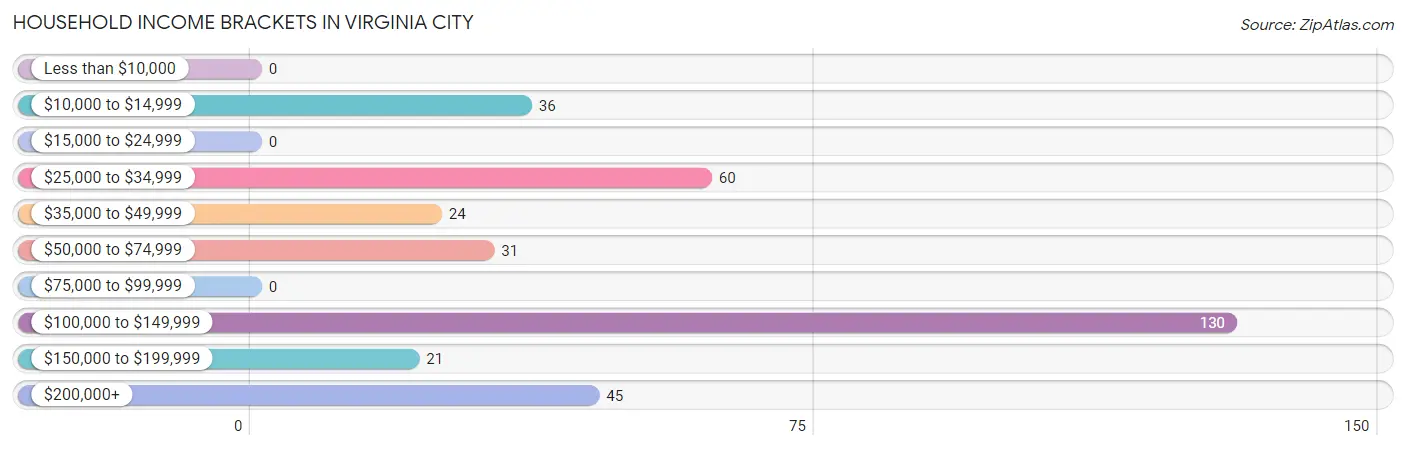
| Income Bracket | # Households | % Households |
| Less than $10,000 | 0 | 0.0% |
| $10,000 to $14,999 | 36 | 10.4% |
| $15,000 to $24,999 | 0 | 0.0% |
| $25,000 to $34,999 | 60 | 17.3% |
| $35,000 to $49,999 | 24 | 6.9% |
| $50,000 to $74,999 | 31 | 8.9% |
| $75,000 to $99,999 | 0 | 0.0% |
| $100,000 to $149,999 | 130 | 37.5% |
| $150,000 to $199,999 | 21 | 6.1% |
| $200,000+ | 45 | 13.0% |
Household Income by Householder Age in Virginia City
| Income Bracket | # Households | Median Income |
| 15 to 24 Years | 0 (0.0%) | $0 |
| 25 to 44 Years | 53 (15.3%) | $0 |
| 45 to 64 Years | 75 (21.6%) | $0 |
| 65+ Years | 219 (63.1%) | $0 |
| Total | 347 (100.0%) | $106,815 |
Poverty in Virginia City
Income Below Poverty by Sex and Age in Virginia City
With 9.6% poverty level for males and 11.4% for females among the residents of Virginia City, 45 to 54 year old males and 75 year old and over females are the most vulnerable to poverty, with 56 males (100.0%) and 36 females (100.0%) in their respective age groups living below the poverty level.
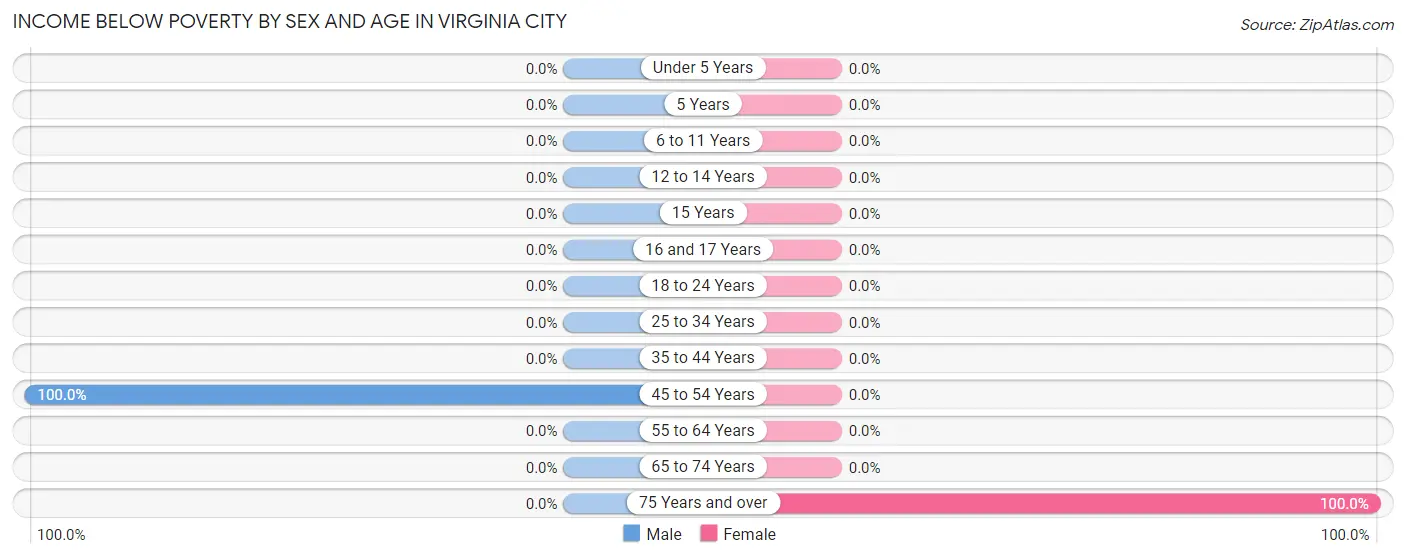
| Age Bracket | Male | Female |
| Under 5 Years | 0 (0.0%) | 0 (0.0%) |
| 5 Years | 0 (0.0%) | 0 (0.0%) |
| 6 to 11 Years | 0 (0.0%) | 0 (0.0%) |
| 12 to 14 Years | 0 (0.0%) | 0 (0.0%) |
| 15 Years | 0 (0.0%) | 0 (0.0%) |
| 16 and 17 Years | 0 (0.0%) | 0 (0.0%) |
| 18 to 24 Years | 0 (0.0%) | 0 (0.0%) |
| 25 to 34 Years | 0 (0.0%) | 0 (0.0%) |
| 35 to 44 Years | 0 (0.0%) | 0 (0.0%) |
| 45 to 54 Years | 56 (100.0%) | 0 (0.0%) |
| 55 to 64 Years | 0 (0.0%) | 0 (0.0%) |
| 65 to 74 Years | 0 (0.0%) | 0 (0.0%) |
| 75 Years and over | 0 (0.0%) | 36 (100.0%) |
| Total | 56 (9.6%) | 36 (11.4%) |
Income Above Poverty by Sex and Age in Virginia City
According to the poverty statistics in Virginia City, males aged 5 years and females aged under 5 years are the age groups that are most secure financially, with 100.0% of males and 100.0% of females in these age groups living above the poverty line.
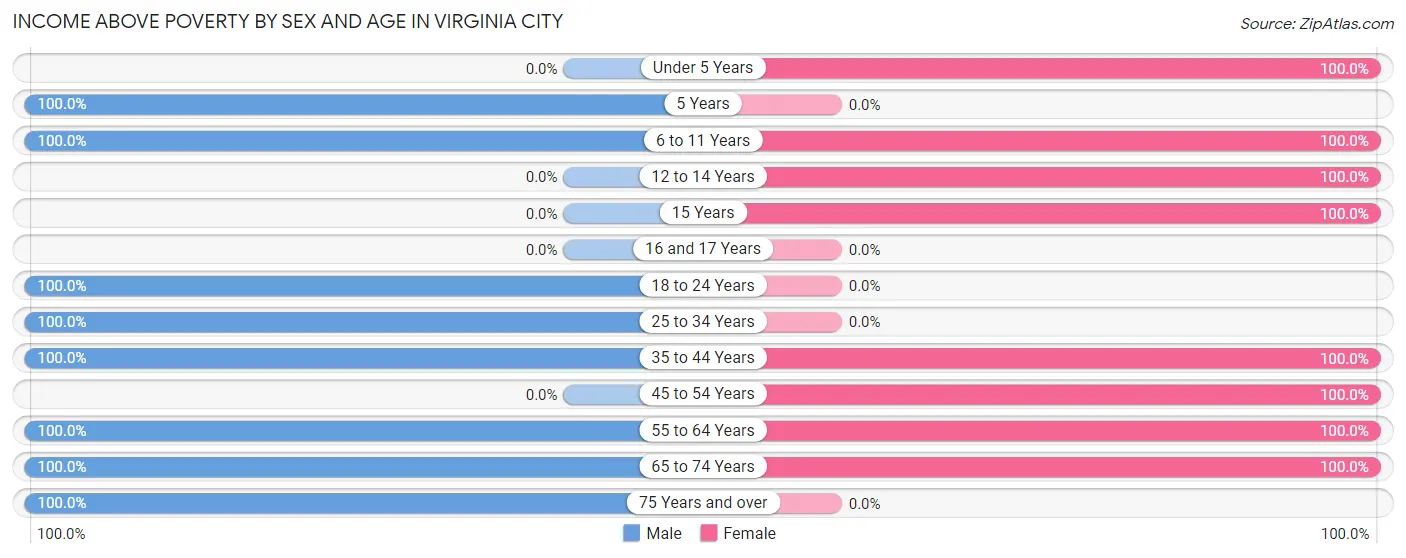
| Age Bracket | Male | Female |
| Under 5 Years | 0 (0.0%) | 20 (100.0%) |
| 5 Years | 30 (100.0%) | 0 (0.0%) |
| 6 to 11 Years | 30 (100.0%) | 25 (100.0%) |
| 12 to 14 Years | 0 (0.0%) | 22 (100.0%) |
| 15 Years | 0 (0.0%) | 23 (100.0%) |
| 16 and 17 Years | 0 (0.0%) | 0 (0.0%) |
| 18 to 24 Years | 29 (100.0%) | 0 (0.0%) |
| 25 to 34 Years | 126 (100.0%) | 0 (0.0%) |
| 35 to 44 Years | 36 (100.0%) | 22 (100.0%) |
| 45 to 54 Years | 0 (0.0%) | 52 (100.0%) |
| 55 to 64 Years | 45 (100.0%) | 90 (100.0%) |
| 65 to 74 Years | 118 (100.0%) | 25 (100.0%) |
| 75 Years and over | 113 (100.0%) | 0 (0.0%) |
| Total | 527 (90.4%) | 279 (88.6%) |
Income Below Poverty Among Married-Couple Families in Virginia City
| Children | Above Poverty | Below Poverty |
| No Children | 100 (100.0%) | 0 (0.0%) |
| 1 or 2 Children | 23 (100.0%) | 0 (0.0%) |
| 3 or 4 Children | 22 (100.0%) | 0 (0.0%) |
| 5 or more Children | 0 (0.0%) | 0 (0.0%) |
| Total | 145 (100.0%) | 0 (0.0%) |
Income Below Poverty Among Single-Parent Households in Virginia City
| Children | Single Father | Single Mother |
| No Children | 0 (0.0%) | 0 (0.0%) |
| 1 or 2 Children | 0 (0.0%) | 0 (0.0%) |
| 3 or 4 Children | 0 (0.0%) | 0 (0.0%) |
| 5 or more Children | 0 (0.0%) | 0 (0.0%) |
| Total | 0 (0.0%) | 0 (0.0%) |
Income Below Poverty Among Married-Couple vs Single-Parent Households in Virginia City
| Children | Married-Couple Families | Single-Parent Households |
| No Children | 0 (0.0%) | 0 (0.0%) |
| 1 or 2 Children | 0 (0.0%) | 0 (0.0%) |
| 3 or 4 Children | 0 (0.0%) | 0 (0.0%) |
| 5 or more Children | 0 (0.0%) | 0 (0.0%) |
| Total | 0 (0.0%) | 0 (0.0%) |
Race in Virginia City
The most populous races in Virginia City are White / Caucasian (848 | 93.8%), Two or more Races (54 | 6.0%), and Hispanic or Latino (32 | 3.5%).
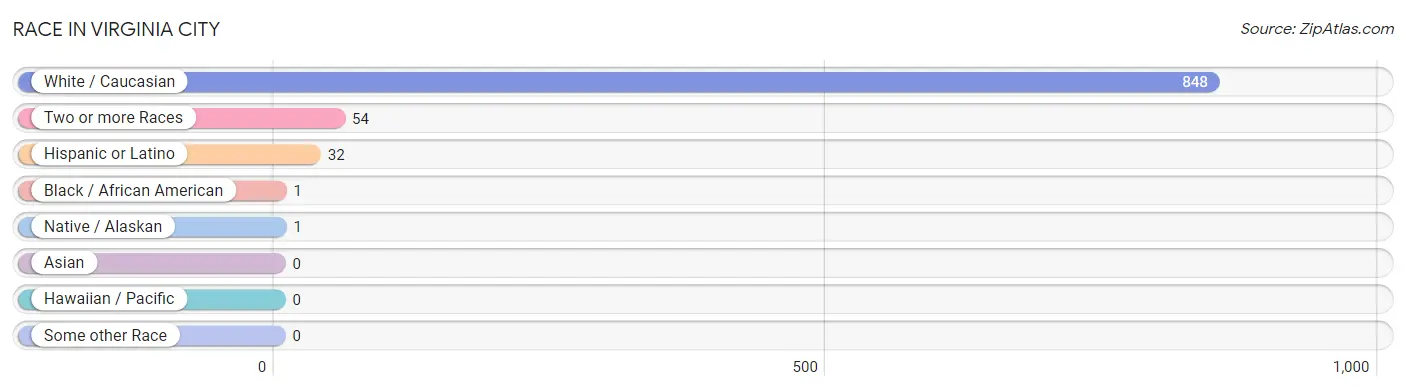
| Race | # Population | % Population |
| Asian | 0 | 0.0% |
| Black / African American | 1 | 0.1% |
| Hawaiian / Pacific | 0 | 0.0% |
| Hispanic or Latino | 32 | 3.5% |
| Native / Alaskan | 1 | 0.1% |
| White / Caucasian | 848 | 93.8% |
| Two or more Races | 54 | 6.0% |
| Some other Race | 0 | 0.0% |
| Total | 904 | 100.0% |
Ancestry in Virginia City
The most populous ancestries reported in Virginia City are English (371 | 41.0%), German (360 | 39.8%), Welsh (153 | 16.9%), Irish (133 | 14.7%), and Scottish (121 | 13.4%), together accounting for 125.9% of all Virginia City residents.
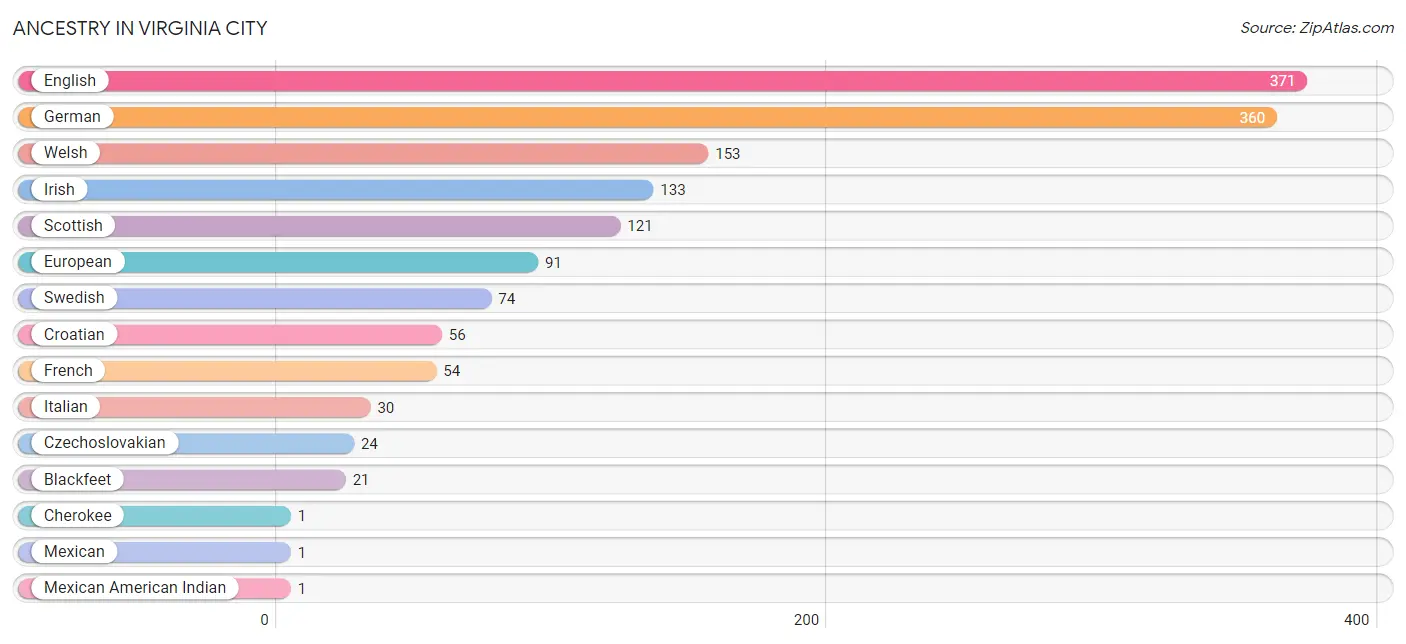
| Ancestry | # Population | % Population |
| Blackfeet | 21 | 2.3% |
| Cherokee | 1 | 0.1% |
| Croatian | 56 | 6.2% |
| Czechoslovakian | 24 | 2.6% |
| English | 371 | 41.0% |
| European | 91 | 10.1% |
| French | 54 | 6.0% |
| German | 360 | 39.8% |
| Irish | 133 | 14.7% |
| Italian | 30 | 3.3% |
| Mexican | 1 | 0.1% |
| Mexican American Indian | 1 | 0.1% |
| Scottish | 121 | 13.4% |
| Swedish | 74 | 8.2% |
| Welsh | 153 | 16.9% | View All 15 Rows |
Immigrants in Virginia City

| Immigration Origin | # Population | % Population | View All 0 Rows |
Sex and Age in Virginia City
Sex and Age in Virginia City
The most populous age groups in Virginia City are 25 to 29 Years (91 | 15.4%) for men and 55 to 59 Years (66 | 20.9%) for women.
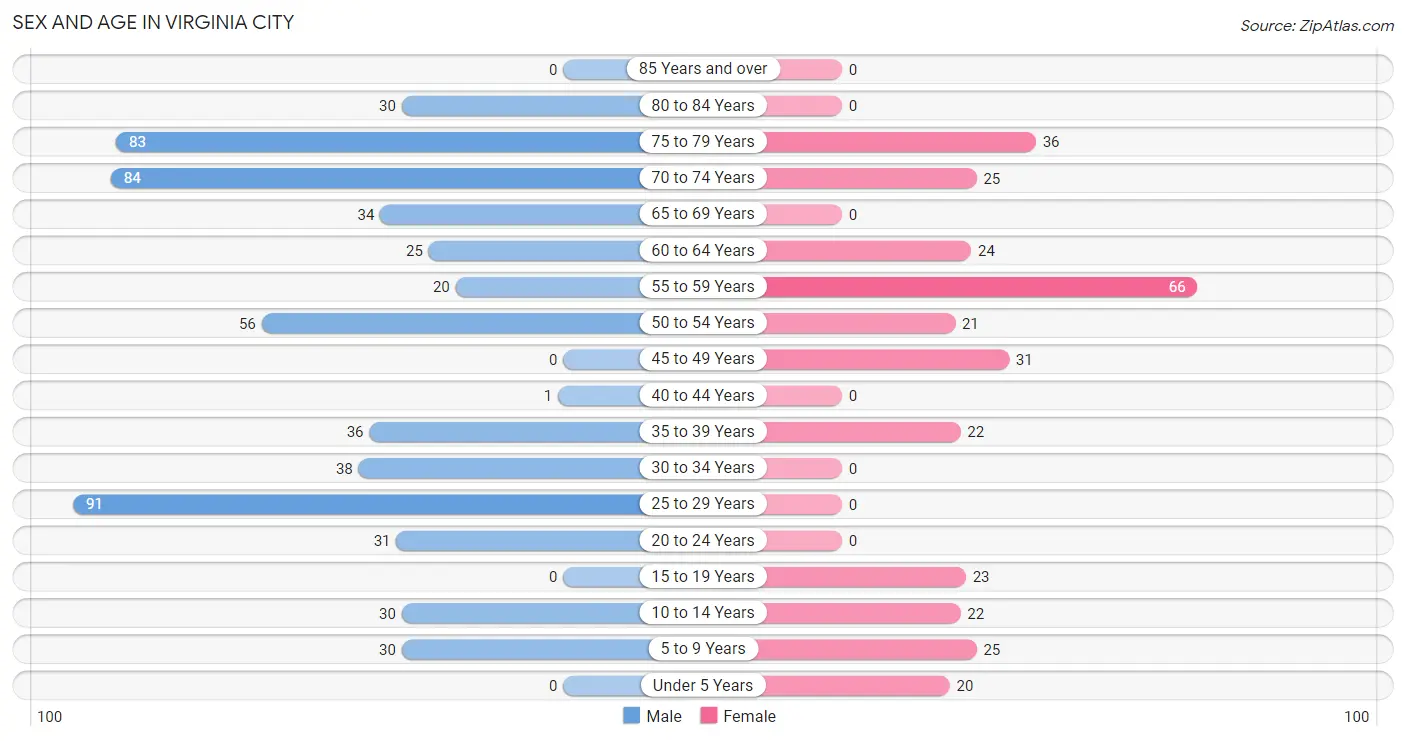
| Age Bracket | Male | Female |
| Under 5 Years | 0 (0.0%) | 20 (6.4%) |
| 5 to 9 Years | 30 (5.1%) | 25 (7.9%) |
| 10 to 14 Years | 30 (5.1%) | 22 (7.0%) |
| 15 to 19 Years | 0 (0.0%) | 23 (7.3%) |
| 20 to 24 Years | 31 (5.3%) | 0 (0.0%) |
| 25 to 29 Years | 91 (15.4%) | 0 (0.0%) |
| 30 to 34 Years | 38 (6.5%) | 0 (0.0%) |
| 35 to 39 Years | 36 (6.1%) | 22 (7.0%) |
| 40 to 44 Years | 1 (0.2%) | 0 (0.0%) |
| 45 to 49 Years | 0 (0.0%) | 31 (9.8%) |
| 50 to 54 Years | 56 (9.5%) | 21 (6.7%) |
| 55 to 59 Years | 20 (3.4%) | 66 (20.9%) |
| 60 to 64 Years | 25 (4.2%) | 24 (7.6%) |
| 65 to 69 Years | 34 (5.8%) | 0 (0.0%) |
| 70 to 74 Years | 84 (14.3%) | 25 (7.9%) |
| 75 to 79 Years | 83 (14.1%) | 36 (11.4%) |
| 80 to 84 Years | 30 (5.1%) | 0 (0.0%) |
| 85 Years and over | 0 (0.0%) | 0 (0.0%) |
| Total | 589 (100.0%) | 315 (100.0%) |
Families and Households in Virginia City
Median Family Size in Virginia City
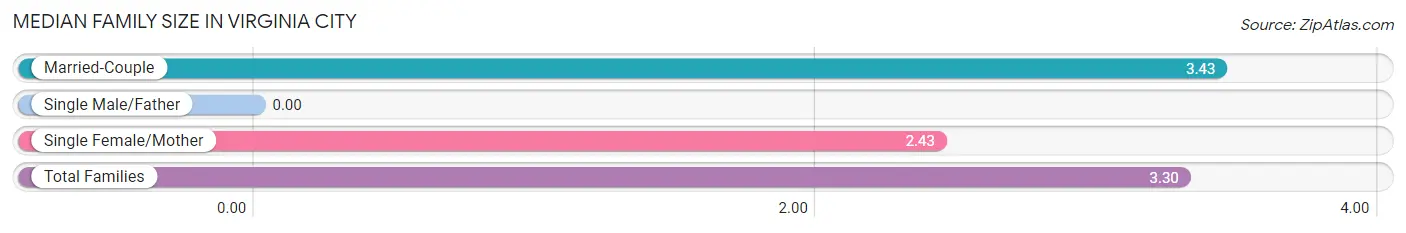
| Family Type | # Families | Family Size |
| Married-Couple | 145 (87.4%) | 3.43 |
| Single Male/Father | 0 (0.0%) | - |
| Single Female/Mother | 21 (12.7%) | 2.43 |
| Total Families | 166 (100.0%) | 3.30 |
Median Household Size in Virginia City
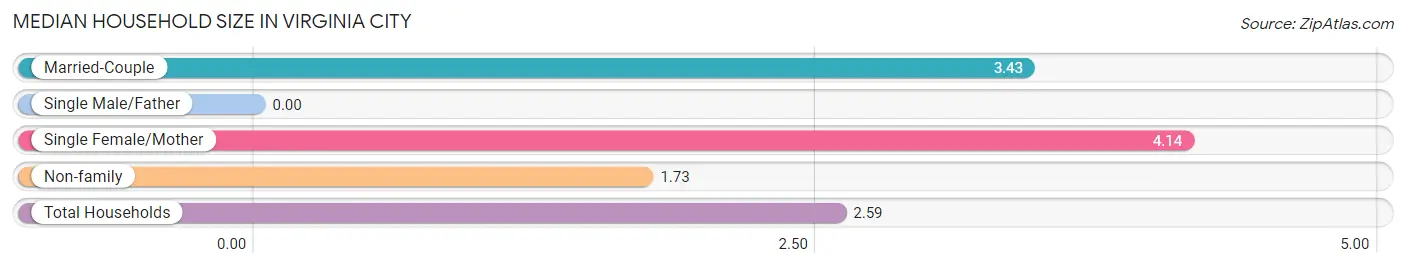
| Household Type | # Households | Household Size |
| Married-Couple | 145 (41.8%) | 3.43 |
| Single Male/Father | 0 (0.0%) | - |
| Single Female/Mother | 21 (6.0%) | 4.14 |
| Non-family | 181 (52.2%) | 1.73 |
| Total Households | 347 (100.0%) | 2.59 |
Household Size by Marriage Status in Virginia City
Out of a total of 347 households in Virginia City, 166 (47.8%) are family households, while 181 (52.2%) are nonfamily households. The most numerous type of family households are 2-person households, comprising 69, and the most common type of nonfamily households are 1-person households, comprising 120.
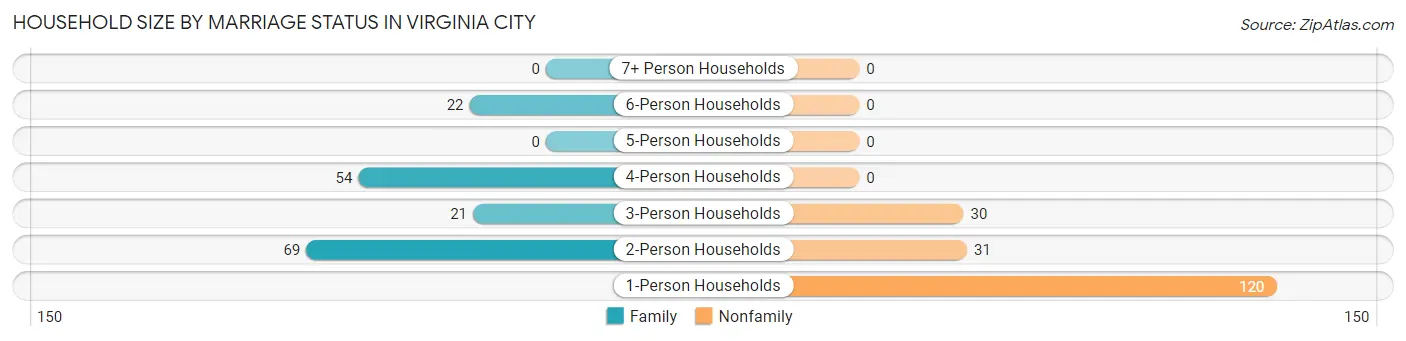
| Household Size | Family Households | Nonfamily Households |
| 1-Person Households | - | 120 (34.6%) |
| 2-Person Households | 69 (19.9%) | 31 (8.9%) |
| 3-Person Households | 21 (6.0%) | 30 (8.6%) |
| 4-Person Households | 54 (15.6%) | 0 (0.0%) |
| 5-Person Households | 0 (0.0%) | 0 (0.0%) |
| 6-Person Households | 22 (6.3%) | 0 (0.0%) |
| 7+ Person Households | 0 (0.0%) | 0 (0.0%) |
| Total | 166 (47.8%) | 181 (52.2%) |
Female Fertility in Virginia City
Fertility by Age in Virginia City
| Age Bracket | Women with Births | Births / 1,000 Women |
| 15 to 19 years | 0 (0.0%) | 0.0 |
| 20 to 34 years | 0 (0.0%) | 0.0 |
| 35 to 50 years | 0 (0.0%) | 0.0 |
| Total | 0 (0.0%) | 0.0 |
Fertility by Age by Marriage Status in Virginia City
| Age Bracket | Married | Unmarried |
| 15 to 19 years | 0 (0.0%) | 0 (0.0%) |
| 20 to 34 years | 0 (0.0%) | 0 (0.0%) |
| 35 to 50 years | 0 (0.0%) | 0 (0.0%) |
| Total | 0 (0.0%) | 0 (0.0%) |
Fertility by Education in Virginia City
| Educational Attainment | Women with Births | Births / 1,000 Women |
| Less than High School | 0 (0.0%) | 0.0 |
| High School Diploma | 0 (0.0%) | 0.0 |
| College or Associate's Degree | 0 (0.0%) | 0.0 |
| Bachelor's Degree | 0 (0.0%) | 0.0 |
| Graduate Degree | 0 (0.0%) | 0.0 |
| Total | 0 (0.0%) | 0.0 |
Fertility by Education by Marriage Status in Virginia City
| Educational Attainment | Married | Unmarried |
| Less than High School | 0 (0.0%) | 0 (0.0%) |
| High School Diploma | 0 (0.0%) | 0 (0.0%) |
| College or Associate's Degree | 0 (0.0%) | 0 (0.0%) |
| Bachelor's Degree | 0 (0.0%) | 0 (0.0%) |
| Graduate Degree | 0 (0.0%) | 0 (0.0%) |
| Total | 0 (0.0%) | 0 (0.0%) |
Employment Characteristics in Virginia City
Employment by Class of Employer in Virginia City
Among the 309 employed individuals in Virginia City, private company employees (246 | 79.6%), self-employed (incorporated) (22 | 7.1%), and local government employees (21 | 6.8%) make up the most common classes of employment.
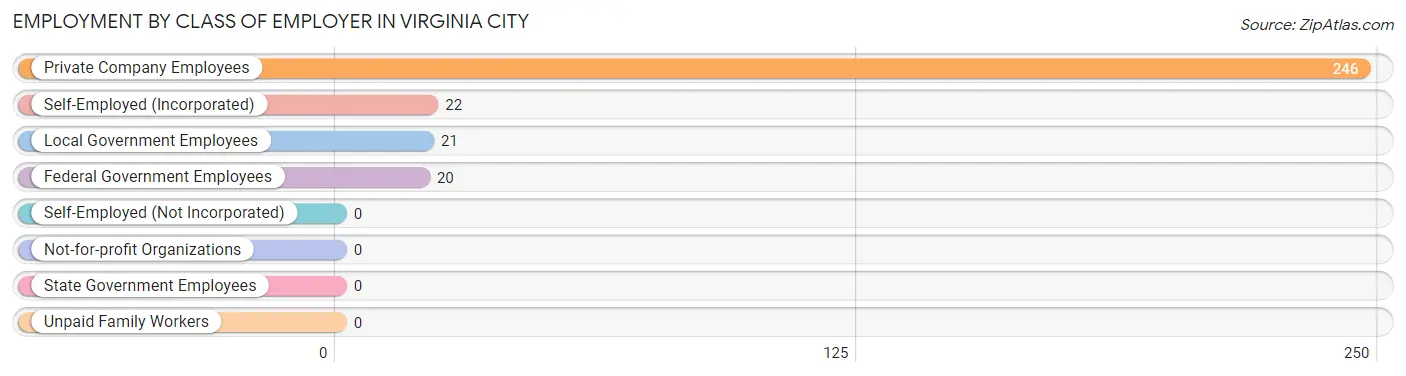
| Employer Class | # Employees | % Employees |
| Private Company Employees | 246 | 79.6% |
| Self-Employed (Incorporated) | 22 | 7.1% |
| Self-Employed (Not Incorporated) | 0 | 0.0% |
| Not-for-profit Organizations | 0 | 0.0% |
| Local Government Employees | 21 | 6.8% |
| State Government Employees | 0 | 0.0% |
| Federal Government Employees | 20 | 6.5% |
| Unpaid Family Workers | 0 | 0.0% |
| Total | 309 | 100.0% |
Employment Status by Age in Virginia City
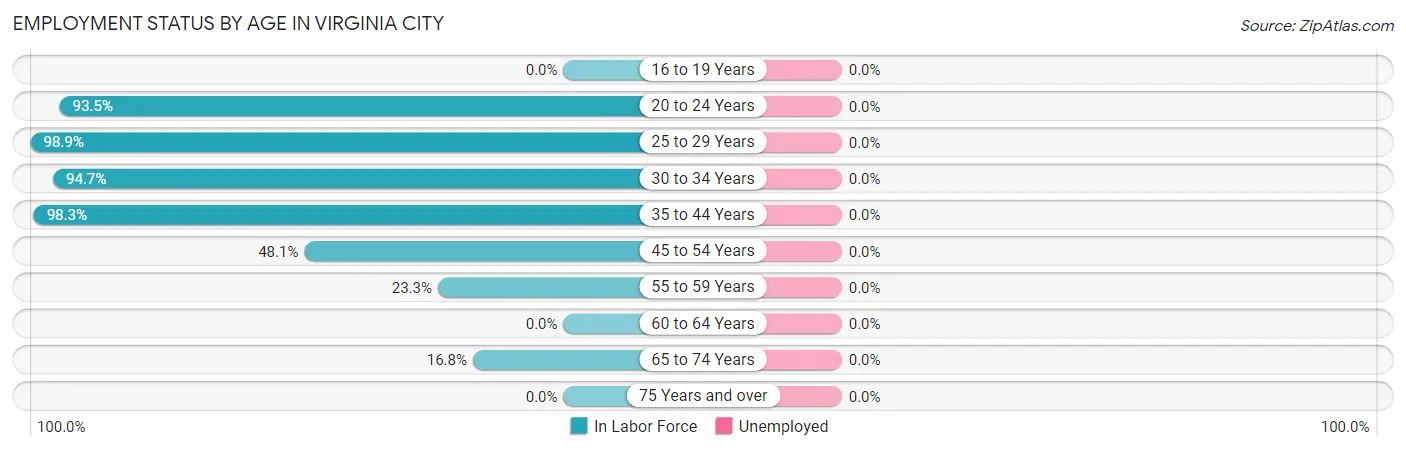
| Age Bracket | In Labor Force | Unemployed |
| 16 to 19 Years | 0 (0.0%) | 0 (0.0%) |
| 20 to 24 Years | 29 (93.5%) | 0 (0.0%) |
| 25 to 29 Years | 90 (98.9%) | 0 (0.0%) |
| 30 to 34 Years | 36 (94.7%) | 0 (0.0%) |
| 35 to 44 Years | 58 (98.3%) | 0 (0.0%) |
| 45 to 54 Years | 52 (48.1%) | 0 (0.0%) |
| 55 to 59 Years | 20 (23.3%) | 0 (0.0%) |
| 60 to 64 Years | 0 (0.0%) | 0 (0.0%) |
| 65 to 74 Years | 24 (16.8%) | 0 (0.0%) |
| 75 Years and over | 0 (0.0%) | 0 (0.0%) |
| Total | 309 (41.0%) | 0 (0.0%) |
Employment Status by Educational Attainment in Virginia City
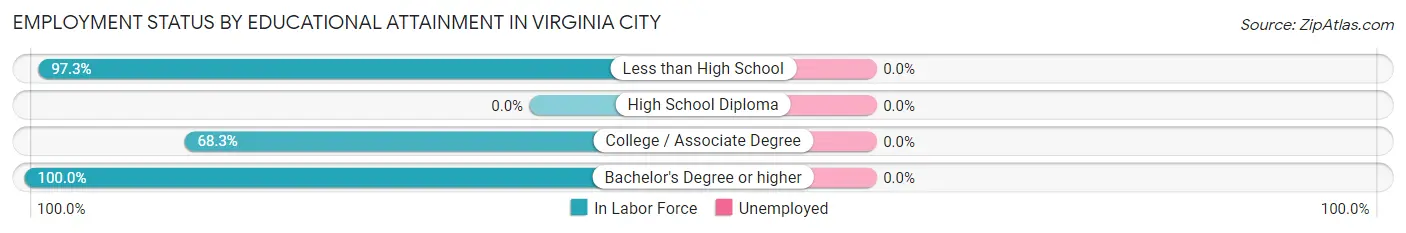
| Educational Attainment | In Labor Force | Unemployed |
| Less than High School | 36 (97.3%) | 0 (0.0%) |
| High School Diploma | 0 (0.0%) | 0 (0.0%) |
| College / Associate Degree | 157 (68.3%) | 0 (0.0%) |
| Bachelor's Degree or higher | 63 (100.0%) | 0 (0.0%) |
| Total | 256 (59.4%) | 0 (0.0%) |
Employment Occupations by Sex in Virginia City
Management, Business, Science and Arts Occupations
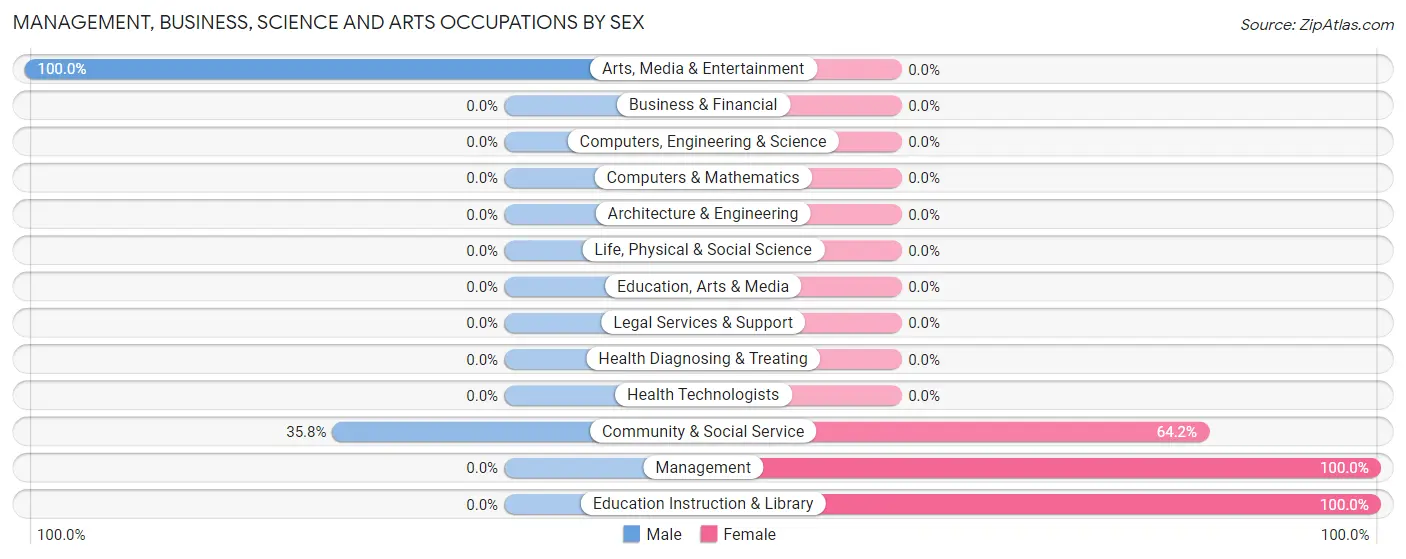
The most common Management, Business, Science and Arts occupations in Virginia City are Community & Social Service (67 | 23.2%), Education Instruction & Library (43 | 14.9%), Management (31 | 10.7%), and Arts, Media & Entertainment (24 | 8.3%).
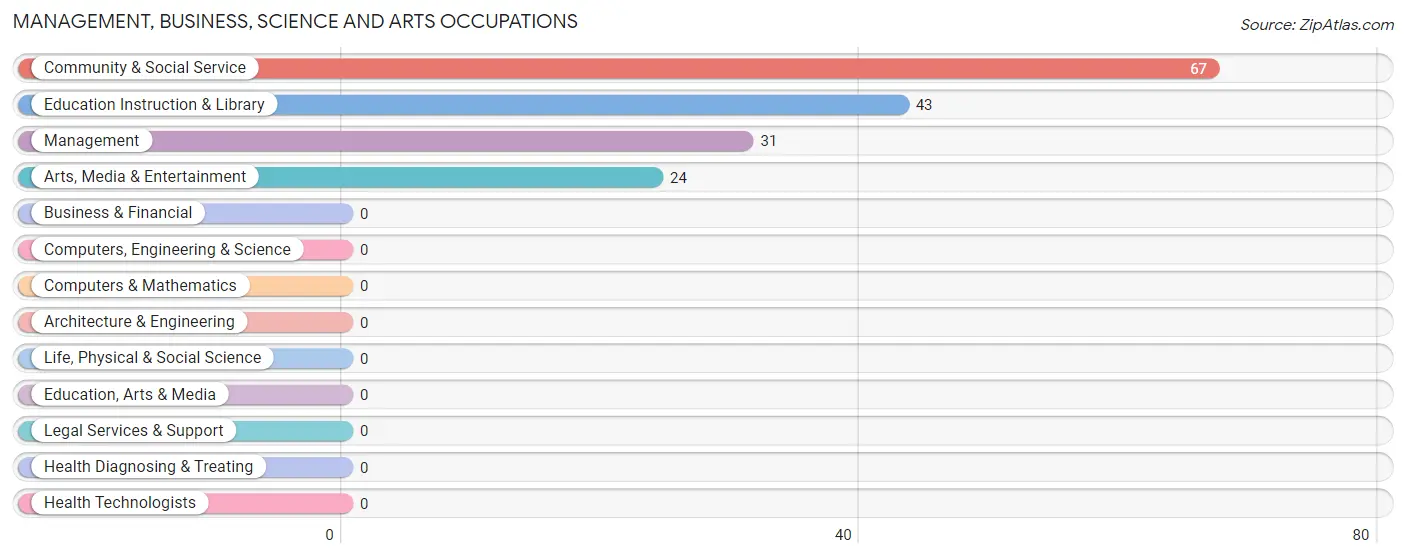
Management, Business, Science and Arts Occupations by Sex
Within the Management, Business, Science and Arts occupations in Virginia City, the most male-oriented occupations are Arts, Media & Entertainment (100.0%), and Community & Social Service (35.8%), while the most female-oriented occupations are Management (100.0%), Education Instruction & Library (100.0%), and Community & Social Service (64.2%).
| Occupation | Male | Female |
| Management | 0 (0.0%) | 31 (100.0%) |
| Business & Financial | 0 (0.0%) | 0 (0.0%) |
| Computers, Engineering & Science | 0 (0.0%) | 0 (0.0%) |
| Computers & Mathematics | 0 (0.0%) | 0 (0.0%) |
| Architecture & Engineering | 0 (0.0%) | 0 (0.0%) |
| Life, Physical & Social Science | 0 (0.0%) | 0 (0.0%) |
| Community & Social Service | 24 (35.8%) | 43 (64.2%) |
| Education, Arts & Media | 0 (0.0%) | 0 (0.0%) |
| Legal Services & Support | 0 (0.0%) | 0 (0.0%) |
| Education Instruction & Library | 0 (0.0%) | 43 (100.0%) |
| Arts, Media & Entertainment | 24 (100.0%) | 0 (0.0%) |
| Health Diagnosing & Treating | 0 (0.0%) | 0 (0.0%) |
| Health Technologists | 0 (0.0%) | 0 (0.0%) |
| Total (Category) | 24 (24.5%) | 74 (75.5%) |
| Total (Overall) | 215 (74.4%) | 74 (25.6%) |
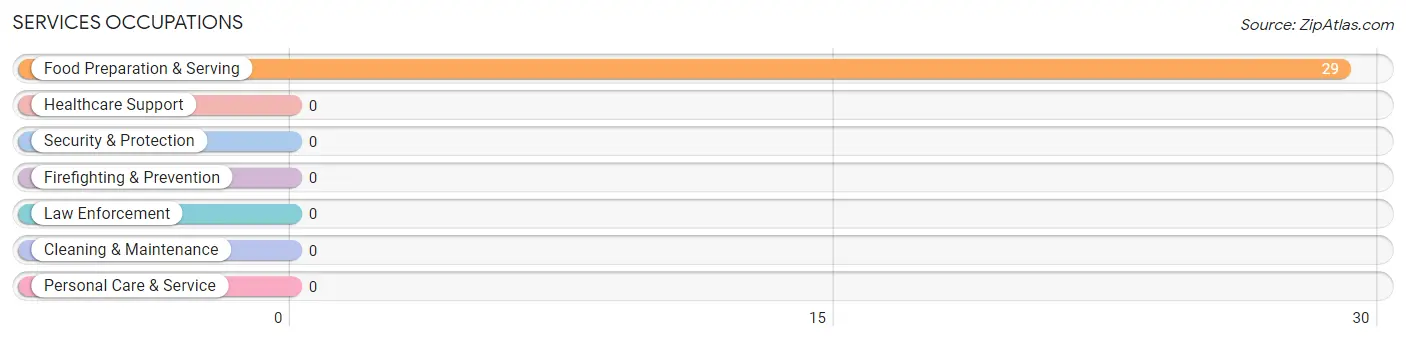
Services Occupations
The most common Services occupations in Virginia City are , and Food Preparation & Serving (29 | 10.0%).
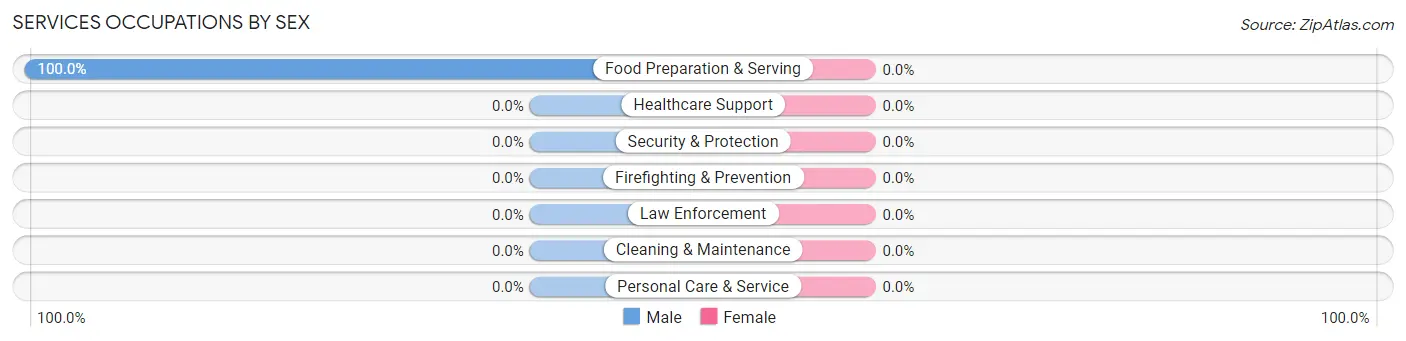
Services Occupations by Sex
| Occupation | Male | Female |
| Healthcare Support | 0 (0.0%) | 0 (0.0%) |
| Security & Protection | 0 (0.0%) | 0 (0.0%) |
| Firefighting & Prevention | 0 (0.0%) | 0 (0.0%) |
| Law Enforcement | 0 (0.0%) | 0 (0.0%) |
| Food Preparation & Serving | 29 (100.0%) | 0 (0.0%) |
| Cleaning & Maintenance | 0 (0.0%) | 0 (0.0%) |
| Personal Care & Service | 0 (0.0%) | 0 (0.0%) |
| Total (Category) | 29 (100.0%) | 0 (0.0%) |
| Total (Overall) | 215 (74.4%) | 74 (25.6%) |
Sales and Office Occupations
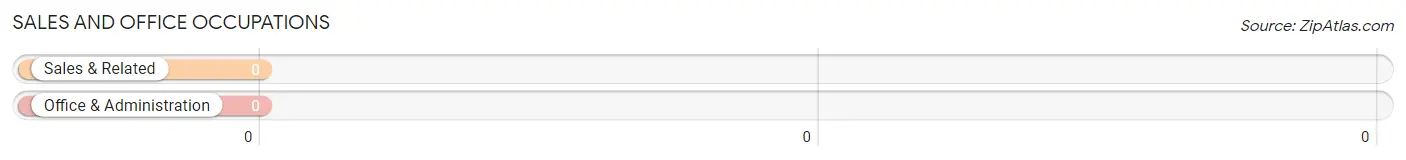
Sales and Office Occupations by Sex
| Occupation | Male | Female |
| Sales & Related | 0 (0.0%) | 0 (0.0%) |
| Office & Administration | 0 (0.0%) | 0 (0.0%) |
| Total (Category) | 0 (0.0%) | 0 (0.0%) |
| Total (Overall) | 215 (74.4%) | 74 (25.6%) |
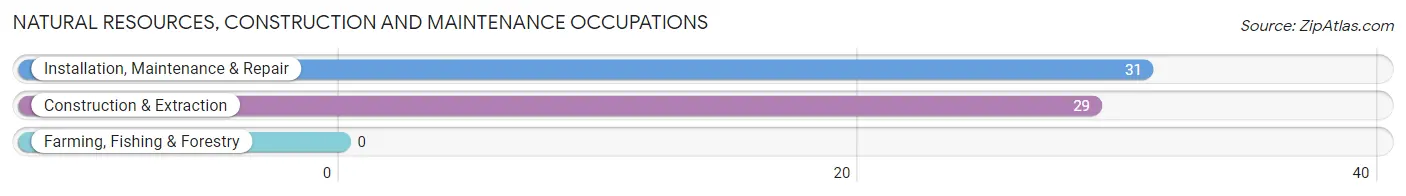
Natural Resources, Construction and Maintenance Occupations
The most common Natural Resources, Construction and Maintenance occupations in Virginia City are Installation, Maintenance & Repair (31 | 10.7%), and Construction & Extraction (29 | 10.0%).
Natural Resources, Construction and Maintenance Occupations by Sex
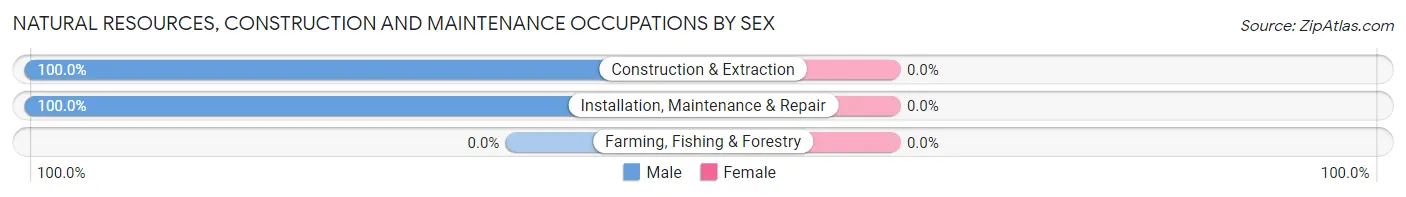
| Occupation | Male | Female |
| Farming, Fishing & Forestry | 0 (0.0%) | 0 (0.0%) |
| Construction & Extraction | 29 (100.0%) | 0 (0.0%) |
| Installation, Maintenance & Repair | 31 (100.0%) | 0 (0.0%) |
| Total (Category) | 60 (100.0%) | 0 (0.0%) |
| Total (Overall) | 215 (74.4%) | 74 (25.6%) |
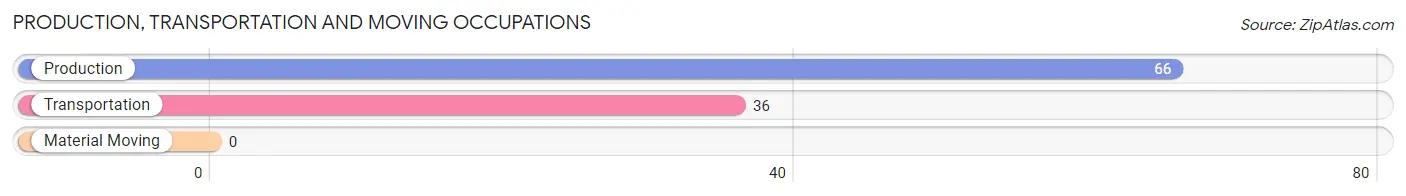
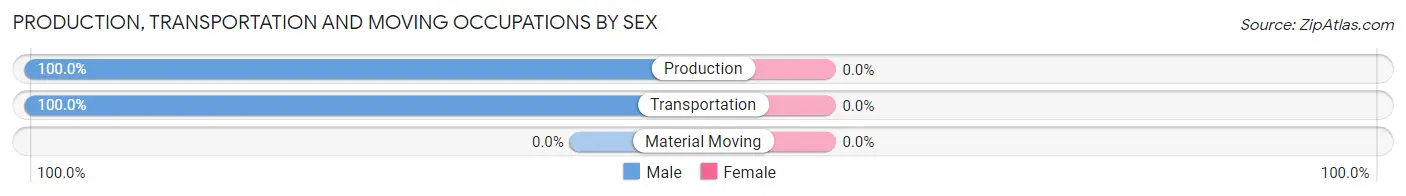
Production, Transportation and Moving Occupations
The most common Production, Transportation and Moving occupations in Virginia City are Production (66 | 22.8%), and Transportation (36 | 12.5%).
Production, Transportation and Moving Occupations by Sex
| Occupation | Male | Female |
| Production | 66 (100.0%) | 0 (0.0%) |
| Transportation | 36 (100.0%) | 0 (0.0%) |
| Material Moving | 0 (0.0%) | 0 (0.0%) |
| Total (Category) | 102 (100.0%) | 0 (0.0%) |
| Total (Overall) | 215 (74.4%) | 74 (25.6%) |
Employment Industries by Sex in Virginia City
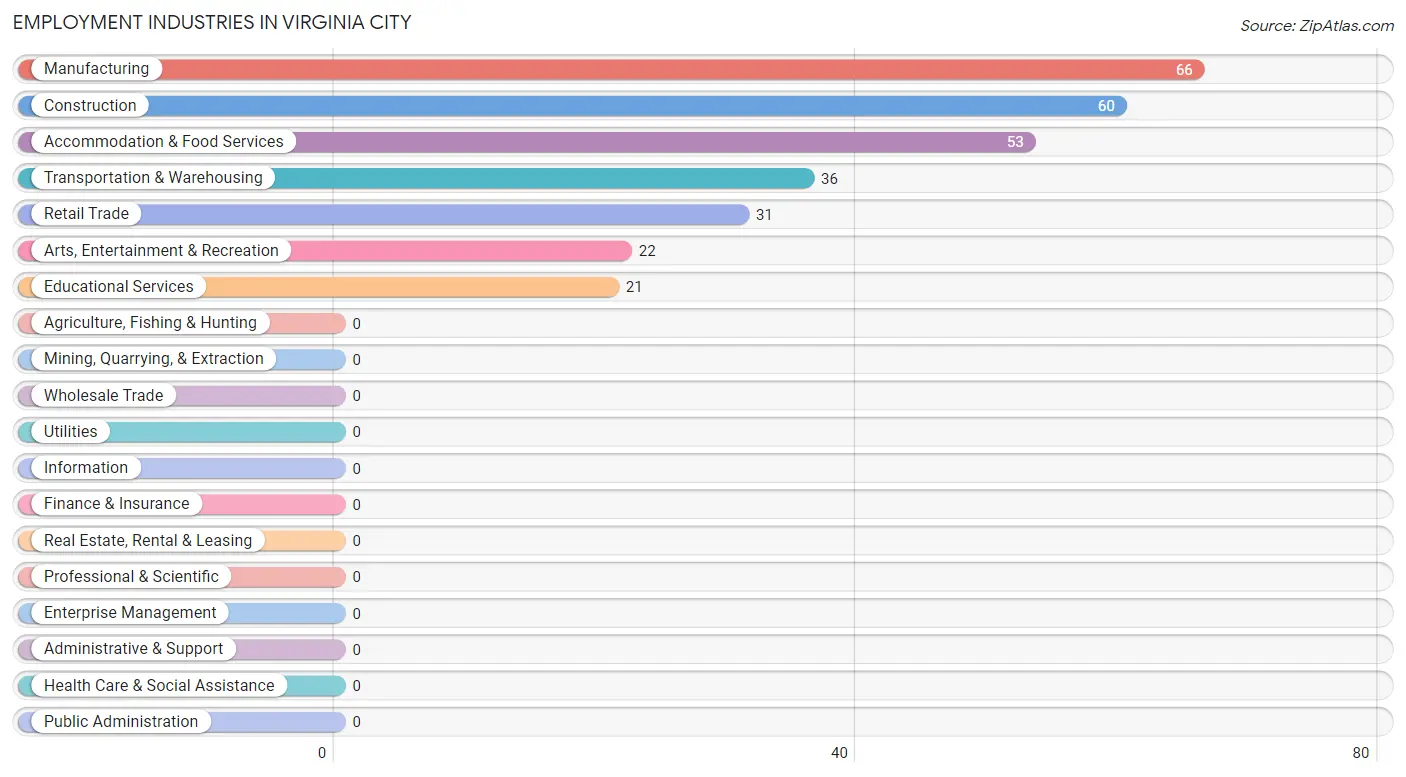
Employment Industries in Virginia City
The major employment industries in Virginia City include Manufacturing (66 | 22.8%), Construction (60 | 20.8%), Accommodation & Food Services (53 | 18.3%), Transportation & Warehousing (36 | 12.5%), and Retail Trade (31 | 10.7%).
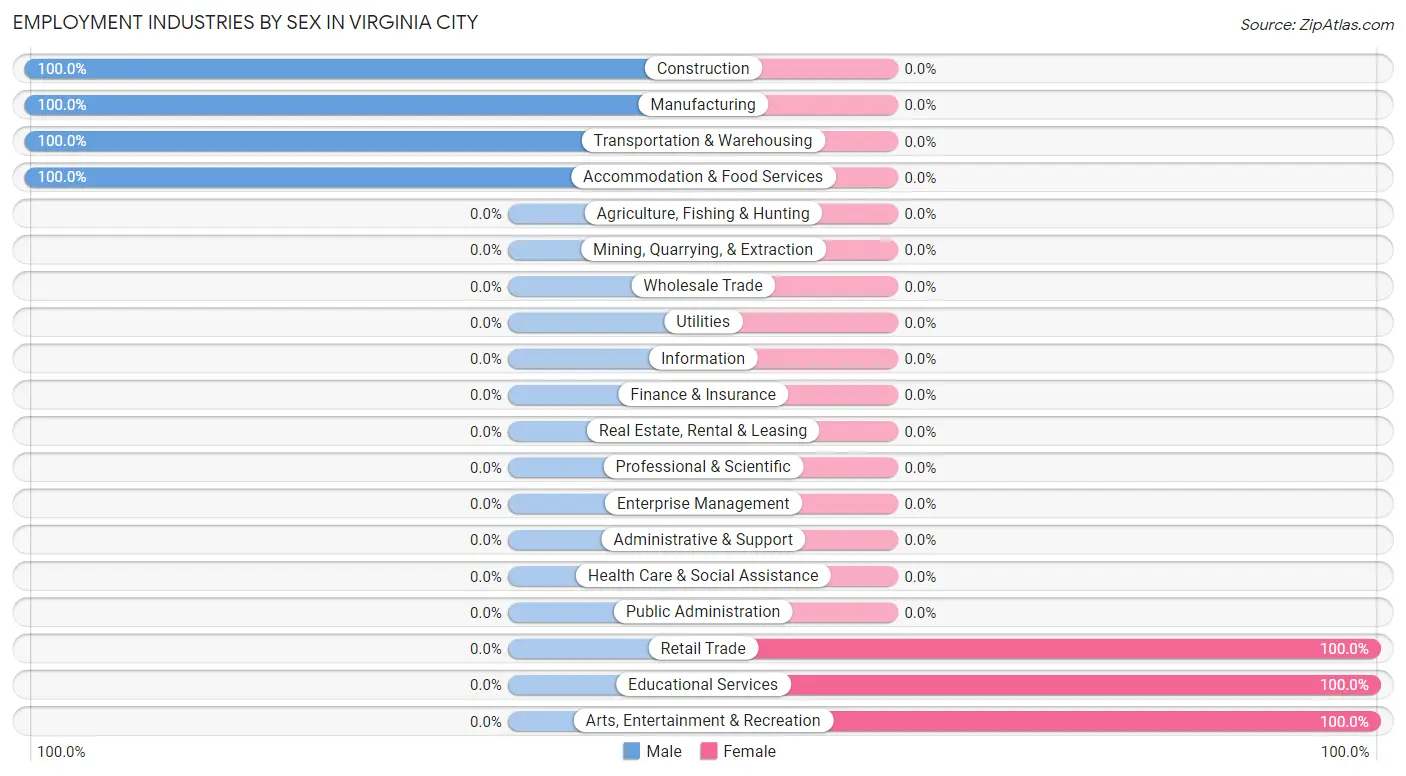
Employment Industries by Sex in Virginia City
The Virginia City industries that see more men than women are Construction (100.0%), Manufacturing (100.0%), and Transportation & Warehousing (100.0%), whereas the industries that tend to have a higher number of women are Retail Trade (100.0%), Educational Services (100.0%), and Arts, Entertainment & Recreation (100.0%).
| Industry | Male | Female |
| Agriculture, Fishing & Hunting | 0 (0.0%) | 0 (0.0%) |
| Mining, Quarrying, & Extraction | 0 (0.0%) | 0 (0.0%) |
| Construction | 60 (100.0%) | 0 (0.0%) |
| Manufacturing | 66 (100.0%) | 0 (0.0%) |
| Wholesale Trade | 0 (0.0%) | 0 (0.0%) |
| Retail Trade | 0 (0.0%) | 31 (100.0%) |
| Transportation & Warehousing | 36 (100.0%) | 0 (0.0%) |
| Utilities | 0 (0.0%) | 0 (0.0%) |
| Information | 0 (0.0%) | 0 (0.0%) |
| Finance & Insurance | 0 (0.0%) | 0 (0.0%) |
| Real Estate, Rental & Leasing | 0 (0.0%) | 0 (0.0%) |
| Professional & Scientific | 0 (0.0%) | 0 (0.0%) |
| Enterprise Management | 0 (0.0%) | 0 (0.0%) |
| Administrative & Support | 0 (0.0%) | 0 (0.0%) |
| Educational Services | 0 (0.0%) | 21 (100.0%) |
| Health Care & Social Assistance | 0 (0.0%) | 0 (0.0%) |
| Arts, Entertainment & Recreation | 0 (0.0%) | 22 (100.0%) |
| Accommodation & Food Services | 53 (100.0%) | 0 (0.0%) |
| Public Administration | 0 (0.0%) | 0 (0.0%) |
| Total | 215 (74.4%) | 74 (25.6%) |
Education in Virginia City
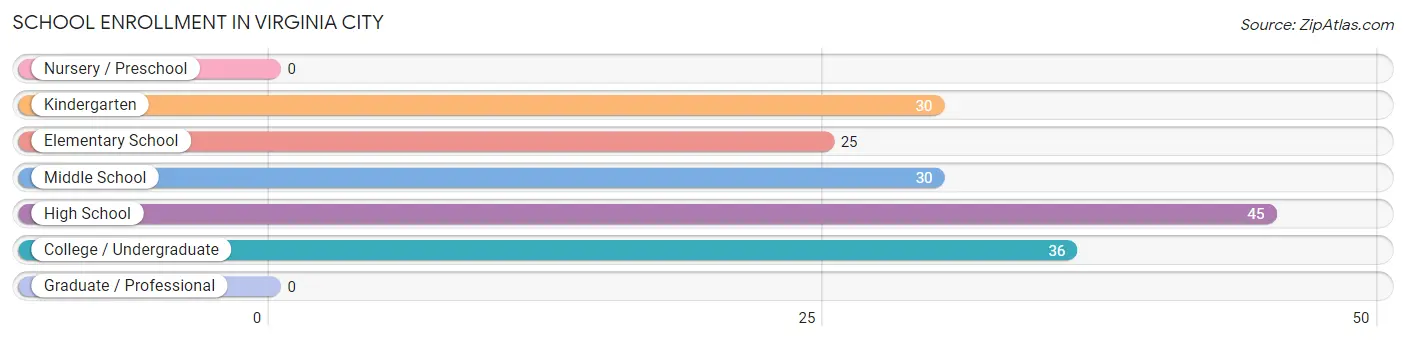
School Enrollment in Virginia City
The most common levels of schooling among the 166 students in Virginia City are high school (45 | 27.1%), college / undergraduate (36 | 21.7%), and kindergarten (30 | 18.1%).
| School Level | # Students | % Students |
| Nursery / Preschool | 0 | 0.0% |
| Kindergarten | 30 | 18.1% |
| Elementary School | 25 | 15.1% |
| Middle School | 30 | 18.1% |
| High School | 45 | 27.1% |
| College / Undergraduate | 36 | 21.7% |
| Graduate / Professional | 0 | 0.0% |
| Total | 166 | 100.0% |
School Enrollment by Age by Funding Source in Virginia City
Out of a total of 166 students who are enrolled in schools in Virginia City, 91 (54.8%) attend a private institution, while the remaining 75 (45.2%) are enrolled in public schools. The age group of 5 to 9 year old has the highest likelihood of being enrolled in private schools, with 55 (100.0% in the age bracket) enrolled. Conversely, the age group of 10 to 14 year olds has the lowest likelihood of being enrolled in a private school, with 52 (100.0% in the age bracket) attending a public institution.
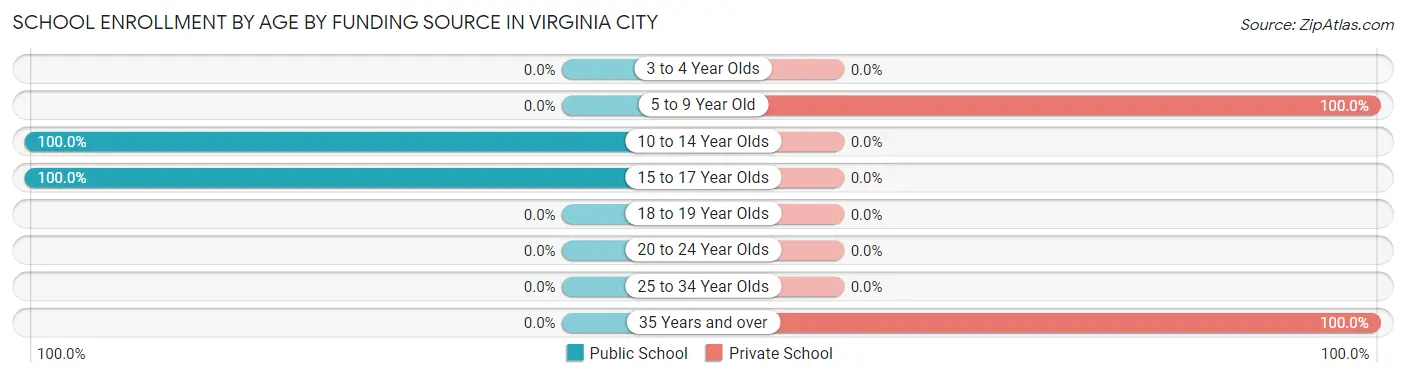
| Age Bracket | Public School | Private School |
| 3 to 4 Year Olds | 0 (0.0%) | 0 (0.0%) |
| 5 to 9 Year Old | 0 (0.0%) | 55 (100.0%) |
| 10 to 14 Year Olds | 52 (100.0%) | 0 (0.0%) |
| 15 to 17 Year Olds | 23 (100.0%) | 0 (0.0%) |
| 18 to 19 Year Olds | 0 (0.0%) | 0 (0.0%) |
| 20 to 24 Year Olds | 0 (0.0%) | 0 (0.0%) |
| 25 to 34 Year Olds | 0 (0.0%) | 0 (0.0%) |
| 35 Years and over | 0 (0.0%) | 36 (100.0%) |
| Total | 75 (45.2%) | 91 (54.8%) |
Educational Attainment by Field of Study in Virginia City
Physical & health sciences (85 | 28.8%), science & technology (69 | 23.4%), computers & mathematics (48 | 16.3%), psychology (30 | 10.2%), and bio, nature & agricultural (22 | 7.5%) are the most common fields of study among 295 individuals in Virginia City who have obtained a bachelor's degree or higher.
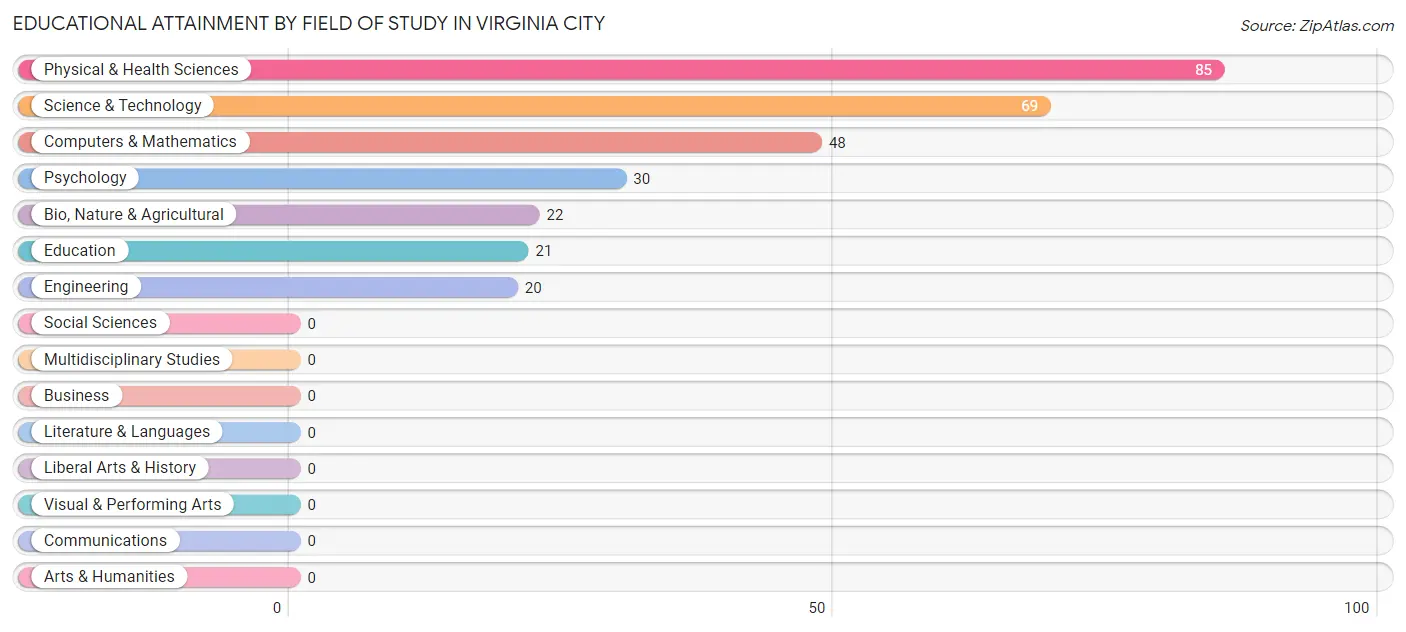
| Field of Study | # Graduates | % Graduates |
| Computers & Mathematics | 48 | 16.3% |
| Bio, Nature & Agricultural | 22 | 7.5% |
| Physical & Health Sciences | 85 | 28.8% |
| Psychology | 30 | 10.2% |
| Social Sciences | 0 | 0.0% |
| Engineering | 20 | 6.8% |
| Multidisciplinary Studies | 0 | 0.0% |
| Science & Technology | 69 | 23.4% |
| Business | 0 | 0.0% |
| Education | 21 | 7.1% |
| Literature & Languages | 0 | 0.0% |
| Liberal Arts & History | 0 | 0.0% |
| Visual & Performing Arts | 0 | 0.0% |
| Communications | 0 | 0.0% |
| Arts & Humanities | 0 | 0.0% |
| Total | 295 | 100.0% |
Transportation & Commute in Virginia City
Vehicle Availability by Sex in Virginia City
The most prevalent vehicle ownership categories in Virginia City are males with 3 vehicles (109, accounting for 46.4%) and females with 3 vehicles (31, making up 147.3%).
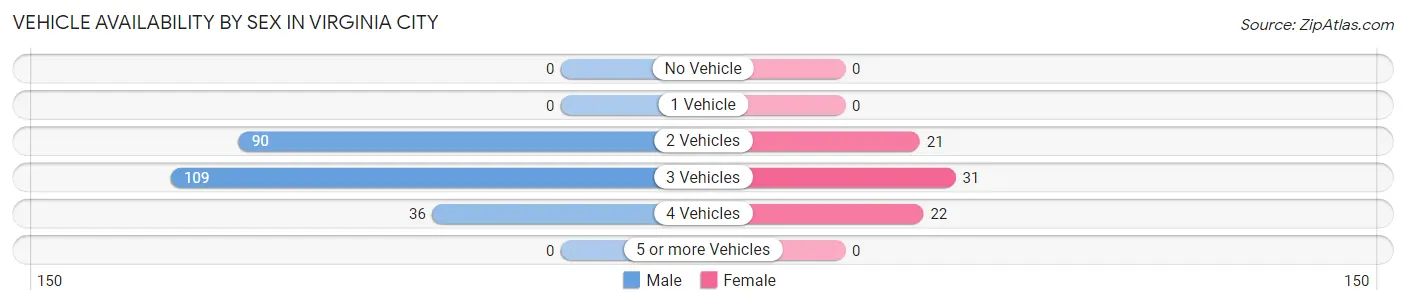
| Vehicles Available | Male | Female |
| No Vehicle | 0 (0.0%) | 0 (0.0%) |
| 1 Vehicle | 0 (0.0%) | 0 (0.0%) |
| 2 Vehicles | 90 (38.3%) | 21 (28.4%) |
| 3 Vehicles | 109 (46.4%) | 31 (41.9%) |
| 4 Vehicles | 36 (15.3%) | 22 (29.7%) |
| 5 or more Vehicles | 0 (0.0%) | 0 (0.0%) |
| Total | 235 (100.0%) | 74 (100.0%) |
Commute Time in Virginia City
The most frequently occuring commute durations in Virginia City are 45 to 59 minutes (88 commuters, 30.4%), less than 5 minutes (60 commuters, 20.8%), and 35 to 39 minutes (60 commuters, 20.8%).
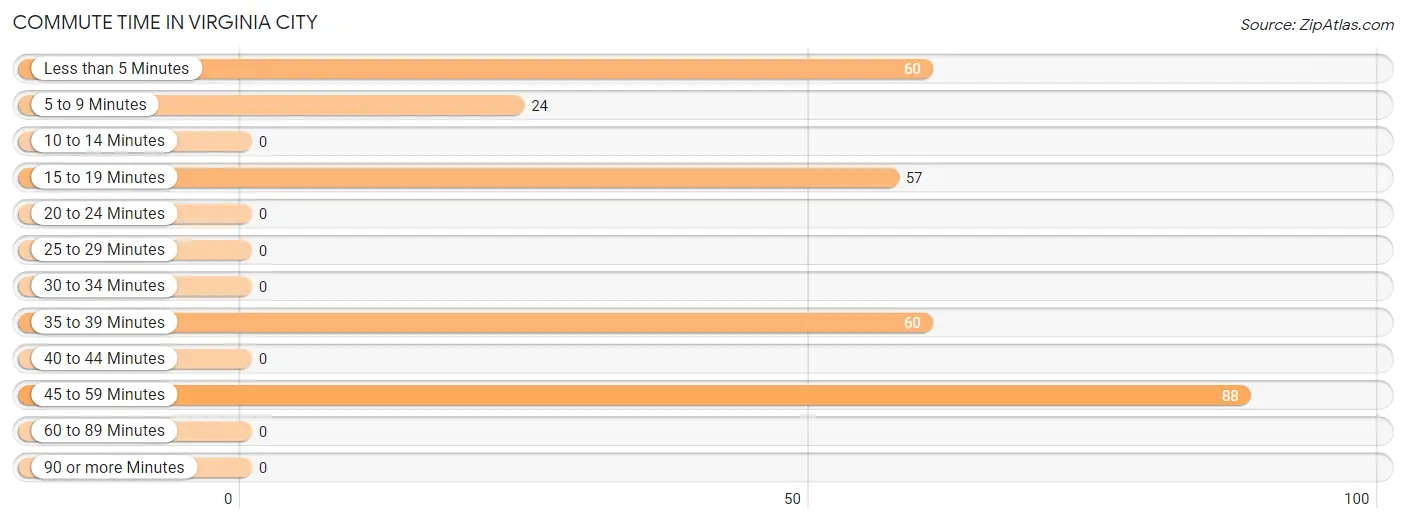
| Commute Time | # Commuters | % Commuters |
| Less than 5 Minutes | 60 | 20.8% |
| 5 to 9 Minutes | 24 | 8.3% |
| 10 to 14 Minutes | 0 | 0.0% |
| 15 to 19 Minutes | 57 | 19.7% |
| 20 to 24 Minutes | 0 | 0.0% |
| 25 to 29 Minutes | 0 | 0.0% |
| 30 to 34 Minutes | 0 | 0.0% |
| 35 to 39 Minutes | 60 | 20.8% |
| 40 to 44 Minutes | 0 | 0.0% |
| 45 to 59 Minutes | 88 | 30.4% |
| 60 to 89 Minutes | 0 | 0.0% |
| 90 or more Minutes | 0 | 0.0% |
Commute Time by Sex in Virginia City
The most common commute times in Virginia City are 45 to 59 minutes (66 commuters, 30.7%) for males and less than 5 minutes (31 commuters, 41.9%) for females.
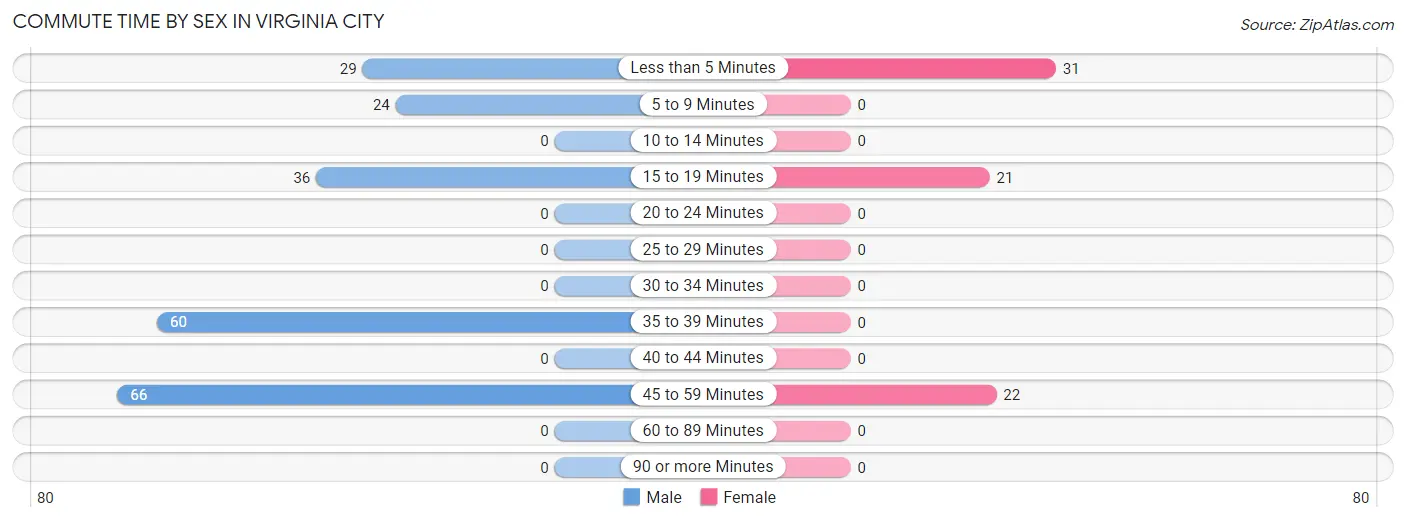
| Commute Time | Male | Female |
| Less than 5 Minutes | 29 (13.5%) | 31 (41.9%) |
| 5 to 9 Minutes | 24 (11.2%) | 0 (0.0%) |
| 10 to 14 Minutes | 0 (0.0%) | 0 (0.0%) |
| 15 to 19 Minutes | 36 (16.7%) | 21 (28.4%) |
| 20 to 24 Minutes | 0 (0.0%) | 0 (0.0%) |
| 25 to 29 Minutes | 0 (0.0%) | 0 (0.0%) |
| 30 to 34 Minutes | 0 (0.0%) | 0 (0.0%) |
| 35 to 39 Minutes | 60 (27.9%) | 0 (0.0%) |
| 40 to 44 Minutes | 0 (0.0%) | 0 (0.0%) |
| 45 to 59 Minutes | 66 (30.7%) | 22 (29.7%) |
| 60 to 89 Minutes | 0 (0.0%) | 0 (0.0%) |
| 90 or more Minutes | 0 (0.0%) | 0 (0.0%) |
Time of Departure to Work by Sex in Virginia City
The most frequent times of departure to work in Virginia City are 4:00 PM to 11:59 PM (102, 47.4%) for males and 8:00 AM to 8:29 AM (31, 41.9%) for females.
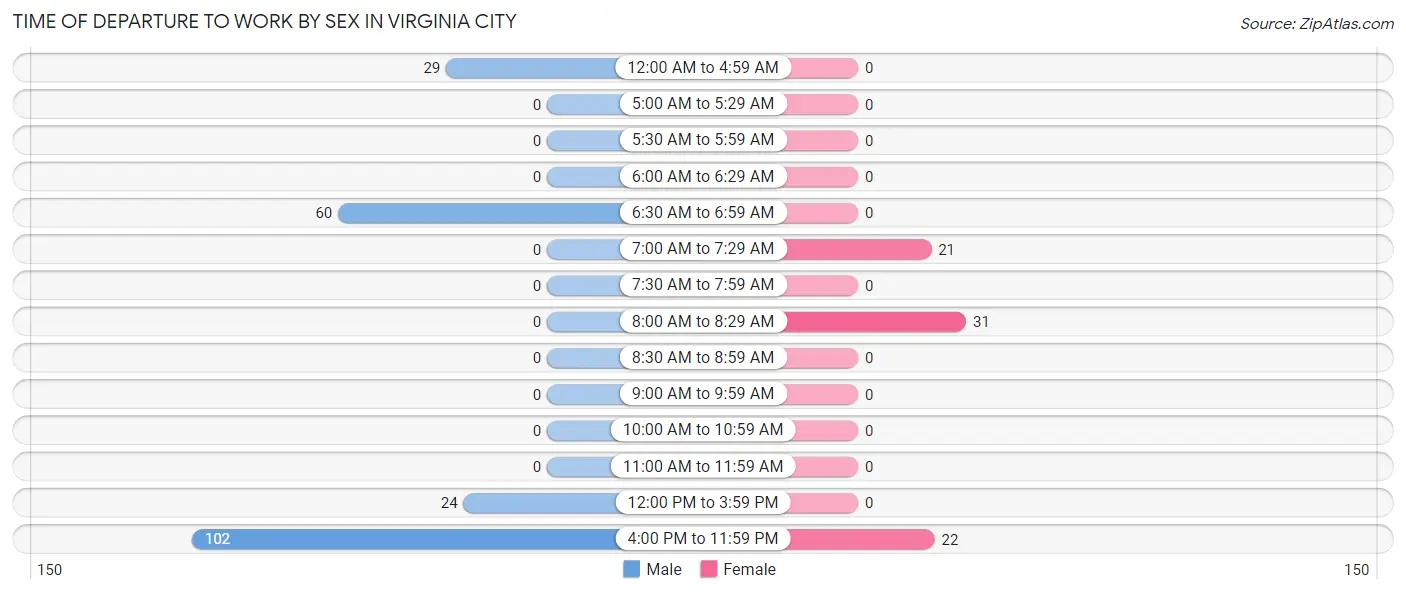
| Time of Departure | Male | Female |
| 12:00 AM to 4:59 AM | 29 (13.5%) | 0 (0.0%) |
| 5:00 AM to 5:29 AM | 0 (0.0%) | 0 (0.0%) |
| 5:30 AM to 5:59 AM | 0 (0.0%) | 0 (0.0%) |
| 6:00 AM to 6:29 AM | 0 (0.0%) | 0 (0.0%) |
| 6:30 AM to 6:59 AM | 60 (27.9%) | 0 (0.0%) |
| 7:00 AM to 7:29 AM | 0 (0.0%) | 21 (28.4%) |
| 7:30 AM to 7:59 AM | 0 (0.0%) | 0 (0.0%) |
| 8:00 AM to 8:29 AM | 0 (0.0%) | 31 (41.9%) |
| 8:30 AM to 8:59 AM | 0 (0.0%) | 0 (0.0%) |
| 9:00 AM to 9:59 AM | 0 (0.0%) | 0 (0.0%) |
| 10:00 AM to 10:59 AM | 0 (0.0%) | 0 (0.0%) |
| 11:00 AM to 11:59 AM | 0 (0.0%) | 0 (0.0%) |
| 12:00 PM to 3:59 PM | 24 (11.2%) | 0 (0.0%) |
| 4:00 PM to 11:59 PM | 102 (47.4%) | 22 (29.7%) |
| Total | 215 (100.0%) | 74 (100.0%) |
Housing Occupancy in Virginia City
Occupancy by Ownership in Virginia City
Of the total 347 dwellings in Virginia City, owner-occupied units account for 347 (100.0%), while renter-occupied units make up 0 (0.0%).
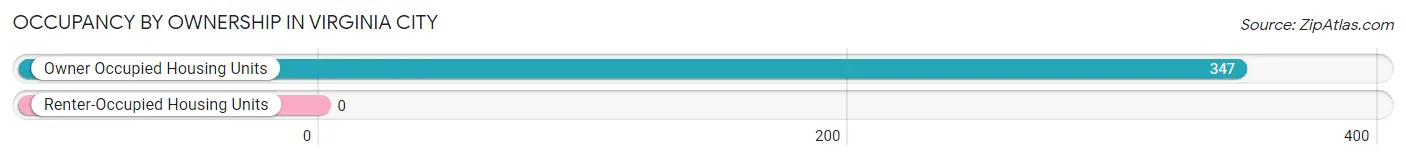
| Occupancy | # Housing Units | % Housing Units |
| Owner Occupied Housing Units | 347 | 100.0% |
| Renter-Occupied Housing Units | 0 | 0.0% |
| Total Occupied Housing Units | 347 | 100.0% |
Occupancy by Household Size in Virginia City
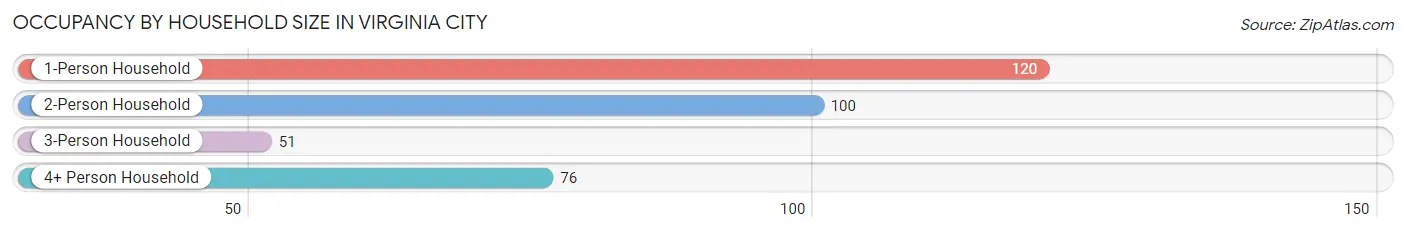
| Household Size | # Housing Units | % Housing Units |
| 1-Person Household | 120 | 34.6% |
| 2-Person Household | 100 | 28.8% |
| 3-Person Household | 51 | 14.7% |
| 4+ Person Household | 76 | 21.9% |
| Total Housing Units | 347 | 100.0% |
Occupancy by Ownership by Household Size in Virginia City
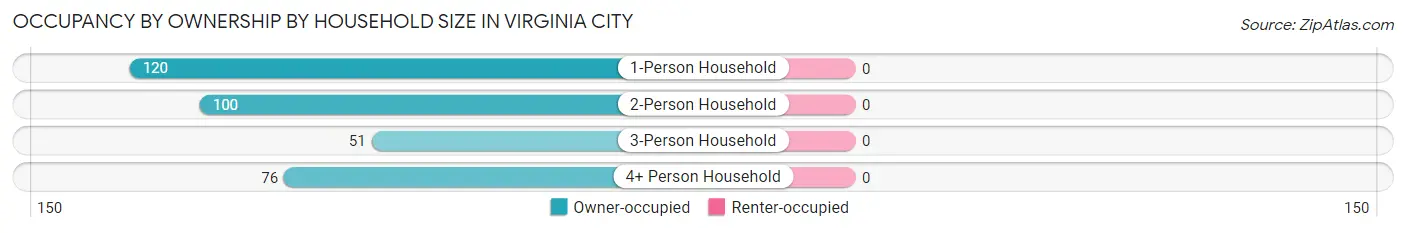
| Household Size | Owner-occupied | Renter-occupied |
| 1-Person Household | 120 (100.0%) | 0 (0.0%) |
| 2-Person Household | 100 (100.0%) | 0 (0.0%) |
| 3-Person Household | 51 (100.0%) | 0 (0.0%) |
| 4+ Person Household | 76 (100.0%) | 0 (0.0%) |
| Total Housing Units | 347 (100.0%) | 0 (0.0%) |
Occupancy by Educational Attainment in Virginia City
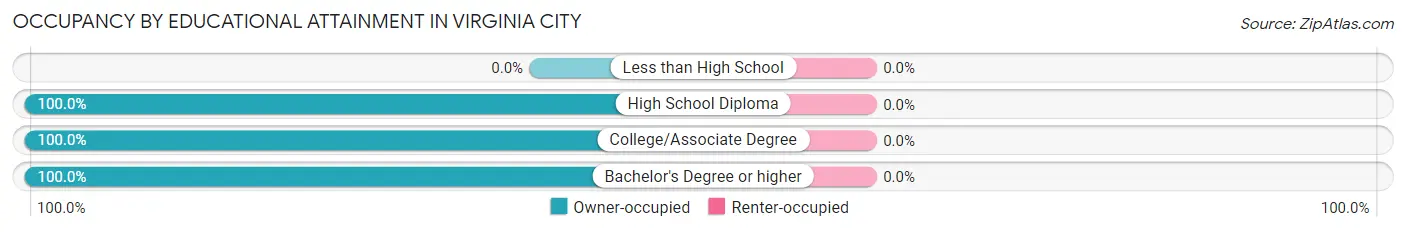
| Household Size | Owner-occupied | Renter-occupied |
| Less than High School | 0 (0.0%) | 0 (0.0%) |
| High School Diploma | 24 (100.0%) | 0 (0.0%) |
| College/Associate Degree | 121 (100.0%) | 0 (0.0%) |
| Bachelor's Degree or higher | 202 (100.0%) | 0 (0.0%) |
Occupancy by Age of Householder in Virginia City
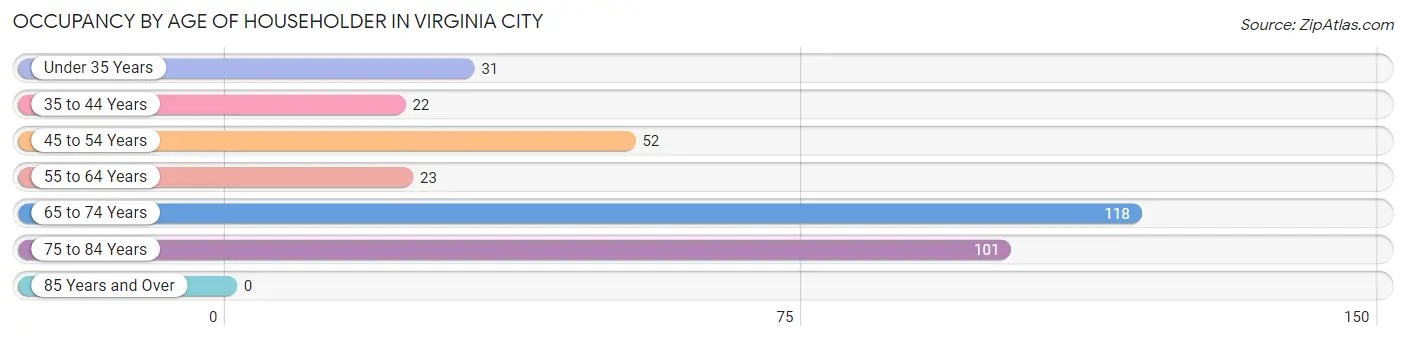
| Age Bracket | # Households | % Households |
| Under 35 Years | 31 | 8.9% |
| 35 to 44 Years | 22 | 6.3% |
| 45 to 54 Years | 52 | 15.0% |
| 55 to 64 Years | 23 | 6.6% |
| 65 to 74 Years | 118 | 34.0% |
| 75 to 84 Years | 101 | 29.1% |
| 85 Years and Over | 0 | 0.0% |
| Total | 347 | 100.0% |
Housing Finances in Virginia City
Median Income by Occupancy in Virginia City
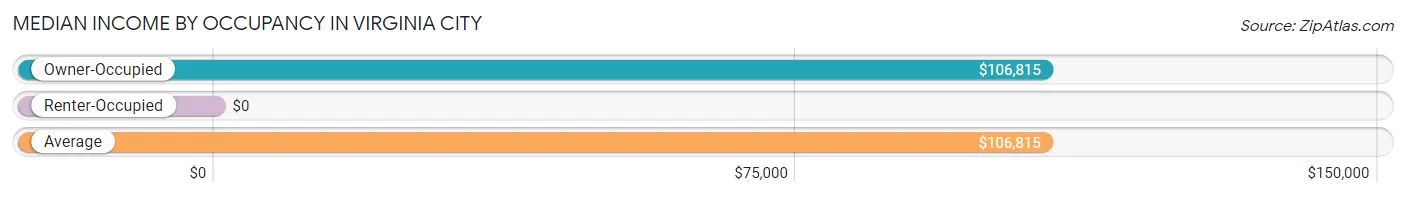
| Occupancy Type | # Households | Median Income |
| Owner-Occupied | 347 (100.0%) | $106,815 |
| Renter-Occupied | 0 (0.0%) | $0 |
| Average | 347 (100.0%) | $106,815 |
Occupancy by Householder Income Bracket in Virginia City
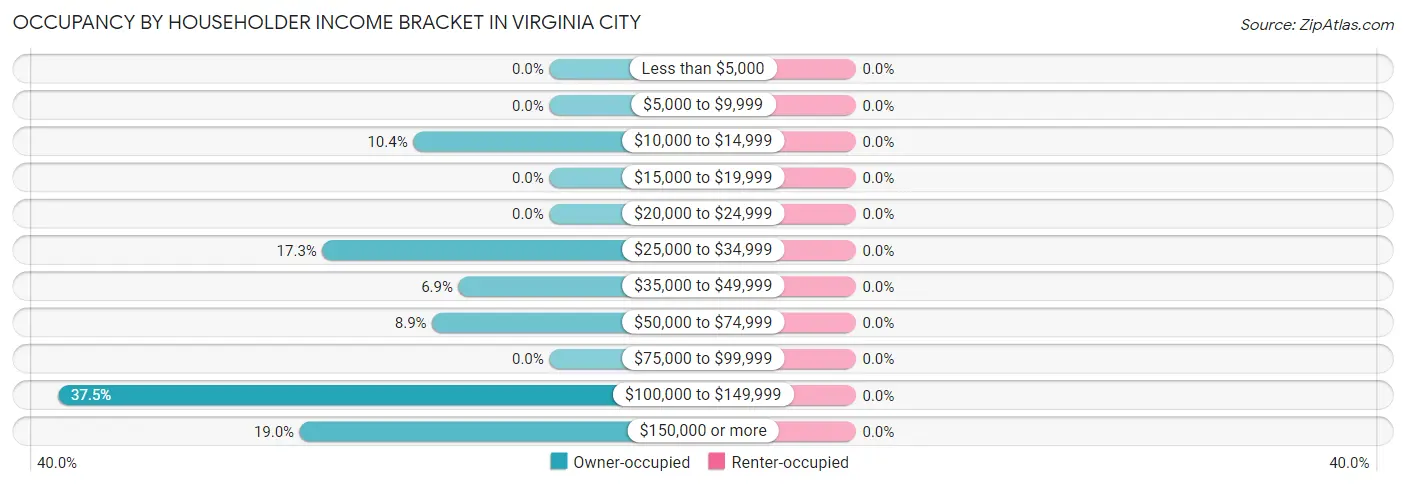
| Income Bracket | Owner-occupied | Renter-occupied |
| Less than $5,000 | 0 (0.0%) | 0 (0.0%) |
| $5,000 to $9,999 | 0 (0.0%) | 0 (0.0%) |
| $10,000 to $14,999 | 36 (10.4%) | 0 (0.0%) |
| $15,000 to $19,999 | 0 (0.0%) | 0 (0.0%) |
| $20,000 to $24,999 | 0 (0.0%) | 0 (0.0%) |
| $25,000 to $34,999 | 60 (17.3%) | 0 (0.0%) |
| $35,000 to $49,999 | 24 (6.9%) | 0 (0.0%) |
| $50,000 to $74,999 | 31 (8.9%) | 0 (0.0%) |
| $75,000 to $99,999 | 0 (0.0%) | 0 (0.0%) |
| $100,000 to $149,999 | 130 (37.5%) | 0 (0.0%) |
| $150,000 or more | 66 (19.0%) | 0 (0.0%) |
| Total | 347 (100.0%) | 0 (0.0%) |
Monthly Housing Cost Tiers in Virginia City
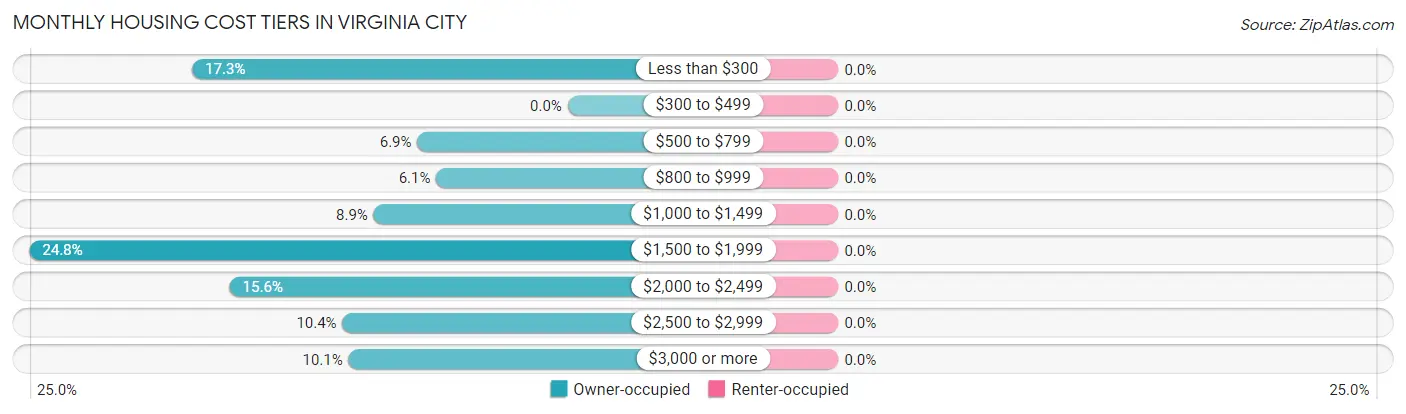
| Monthly Cost | Owner-occupied | Renter-occupied |
| Less than $300 | 60 (17.3%) | 0 (0.0%) |
| $300 to $499 | 0 (0.0%) | 0 (0.0%) |
| $500 to $799 | 24 (6.9%) | 0 (0.0%) |
| $800 to $999 | 21 (6.0%) | 0 (0.0%) |
| $1,000 to $1,499 | 31 (8.9%) | 0 (0.0%) |
| $1,500 to $1,999 | 86 (24.8%) | 0 (0.0%) |
| $2,000 to $2,499 | 54 (15.6%) | 0 (0.0%) |
| $2,500 to $2,999 | 36 (10.4%) | 0 (0.0%) |
| $3,000 or more | 35 (10.1%) | 0 (0.0%) |
| Total | 347 (100.0%) | 0 (0.0%) |
Physical Housing Characteristics in Virginia City
Housing Structures in Virginia City
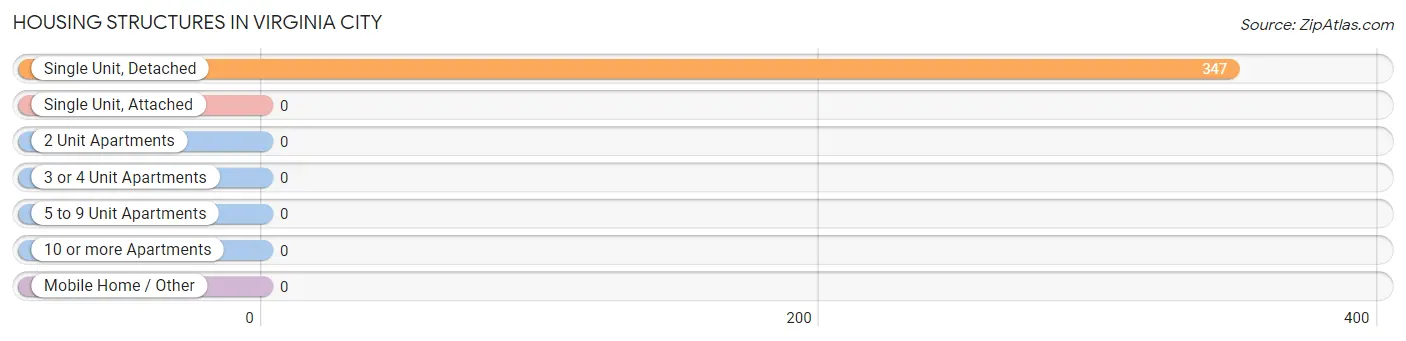
| Structure Type | # Housing Units | % Housing Units |
| Single Unit, Detached | 347 | 100.0% |
| Single Unit, Attached | 0 | 0.0% |
| 2 Unit Apartments | 0 | 0.0% |
| 3 or 4 Unit Apartments | 0 | 0.0% |
| 5 to 9 Unit Apartments | 0 | 0.0% |
| 10 or more Apartments | 0 | 0.0% |
| Mobile Home / Other | 0 | 0.0% |
| Total | 347 | 100.0% |
Housing Structures by Occupancy in Virginia City
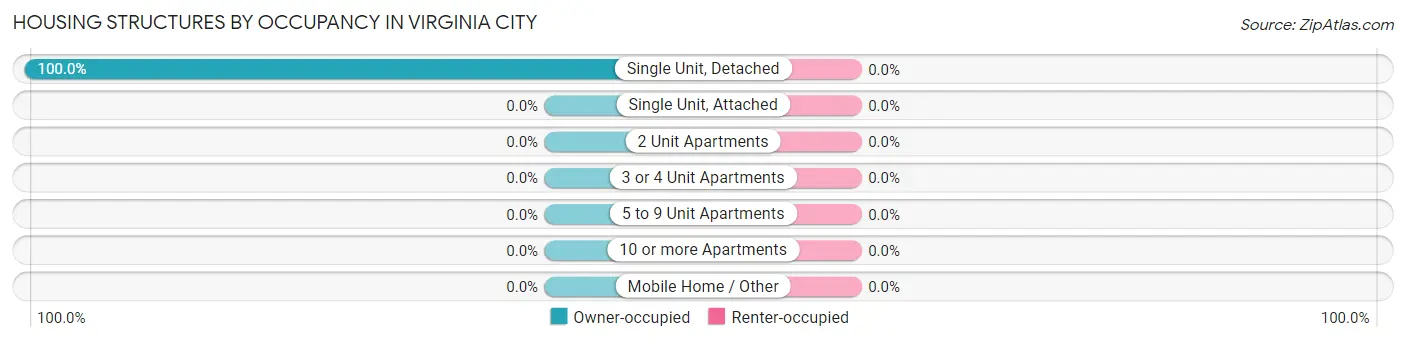
| Structure Type | Owner-occupied | Renter-occupied |
| Single Unit, Detached | 347 (100.0%) | 0 (0.0%) |
| Single Unit, Attached | 0 (0.0%) | 0 (0.0%) |
| 2 Unit Apartments | 0 (0.0%) | 0 (0.0%) |
| 3 or 4 Unit Apartments | 0 (0.0%) | 0 (0.0%) |
| 5 to 9 Unit Apartments | 0 (0.0%) | 0 (0.0%) |
| 10 or more Apartments | 0 (0.0%) | 0 (0.0%) |
| Mobile Home / Other | 0 (0.0%) | 0 (0.0%) |
| Total | 347 (100.0%) | 0 (0.0%) |
Housing Structures by Number of Rooms in Virginia City
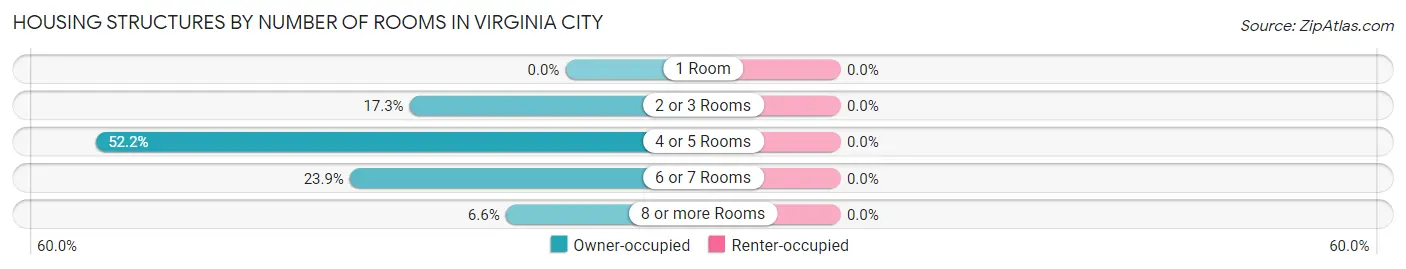
| Number of Rooms | Owner-occupied | Renter-occupied |
| 1 Room | 0 (0.0%) | 0 (0.0%) |
| 2 or 3 Rooms | 60 (17.3%) | 0 (0.0%) |
| 4 or 5 Rooms | 181 (52.2%) | 0 (0.0%) |
| 6 or 7 Rooms | 83 (23.9%) | 0 (0.0%) |
| 8 or more Rooms | 23 (6.6%) | 0 (0.0%) |
| Total | 347 (100.0%) | 0 (0.0%) |
Housing Structure by Heating Type in Virginia City
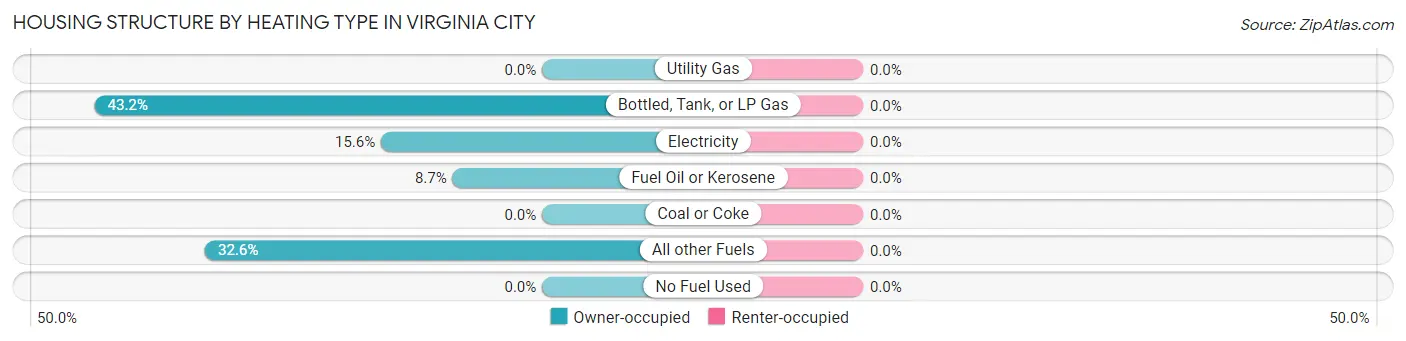
| Heating Type | Owner-occupied | Renter-occupied |
| Utility Gas | 0 (0.0%) | 0 (0.0%) |
| Bottled, Tank, or LP Gas | 150 (43.2%) | 0 (0.0%) |
| Electricity | 54 (15.6%) | 0 (0.0%) |
| Fuel Oil or Kerosene | 30 (8.6%) | 0 (0.0%) |
| Coal or Coke | 0 (0.0%) | 0 (0.0%) |
| All other Fuels | 113 (32.6%) | 0 (0.0%) |
| No Fuel Used | 0 (0.0%) | 0 (0.0%) |
| Total | 347 (100.0%) | 0 (0.0%) |
Household Vehicle Usage in Virginia City
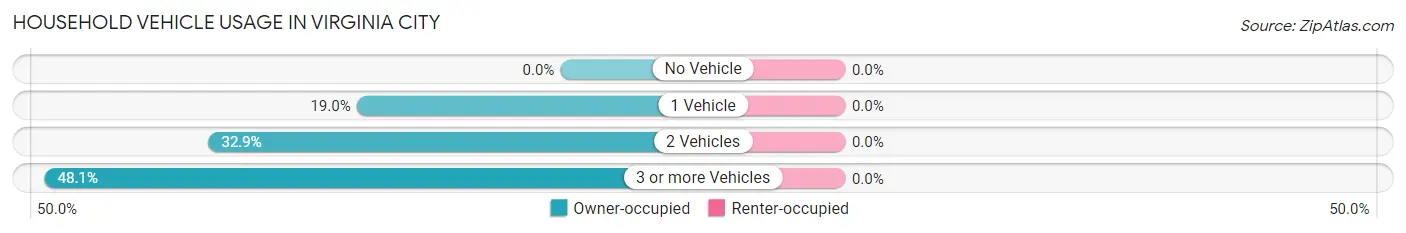
| Vehicles per Household | Owner-occupied | Renter-occupied |
| No Vehicle | 0 (0.0%) | 0 (0.0%) |
| 1 Vehicle | 66 (19.0%) | 0 (0.0%) |
| 2 Vehicles | 114 (32.9%) | 0 (0.0%) |
| 3 or more Vehicles | 167 (48.1%) | 0 (0.0%) |
| Total | 347 (100.0%) | 0 (0.0%) |
Real Estate & Mortgages in Virginia City
Real Estate and Mortgage Overview in Virginia City
| Characteristic | Without Mortgage | With Mortgage |
| Housing Units | 84 | 263 |
| Median Property Value | - | - |
| Median Household Income | - | - |
| Monthly Housing Costs | - | - |
| Real Estate Taxes | - | - |
Property Value by Mortgage Status in Virginia City
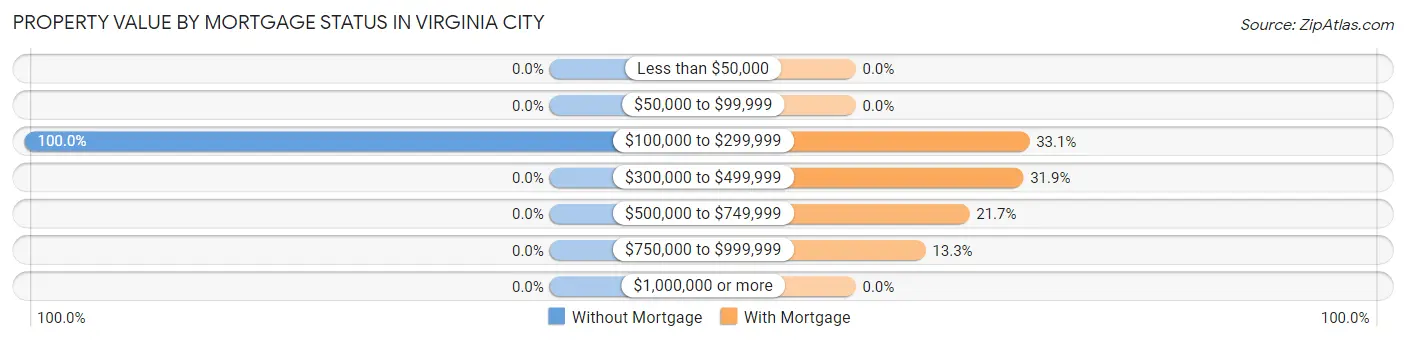
| Property Value | Without Mortgage | With Mortgage |
| Less than $50,000 | 0 (0.0%) | 0 (0.0%) |
| $50,000 to $99,999 | 0 (0.0%) | 0 (0.0%) |
| $100,000 to $299,999 | 84 (100.0%) | 87 (33.1%) |
| $300,000 to $499,999 | 0 (0.0%) | 84 (31.9%) |
| $500,000 to $749,999 | 0 (0.0%) | 57 (21.7%) |
| $750,000 to $999,999 | 0 (0.0%) | 35 (13.3%) |
| $1,000,000 or more | 0 (0.0%) | 0 (0.0%) |
| Total | 84 (100.0%) | 263 (100.0%) |
Household Income by Mortgage Status in Virginia City
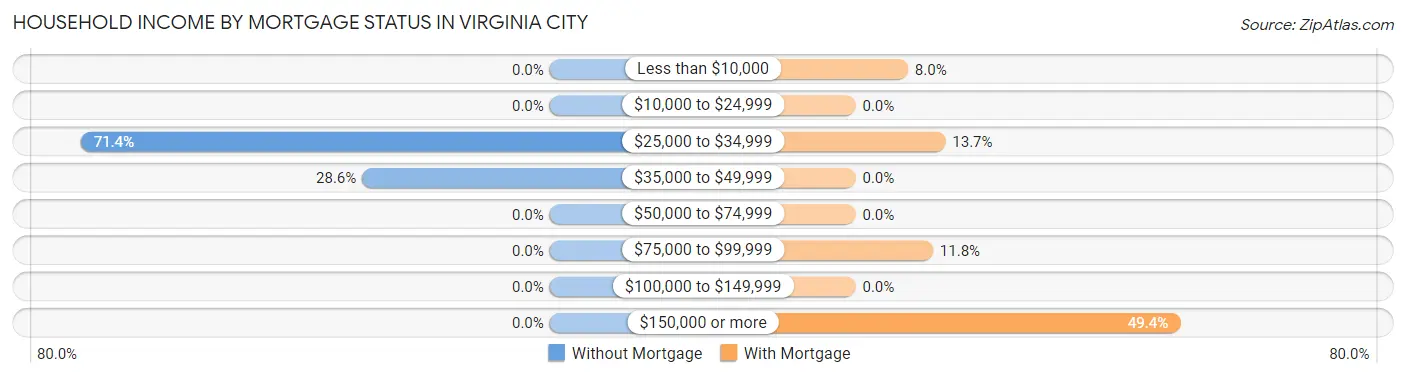
| Household Income | Without Mortgage | With Mortgage |
| Less than $10,000 | 0 (0.0%) | 21 (8.0%) |
| $10,000 to $24,999 | 0 (0.0%) | 0 (0.0%) |
| $25,000 to $34,999 | 60 (71.4%) | 36 (13.7%) |
| $35,000 to $49,999 | 24 (28.6%) | 0 (0.0%) |
| $50,000 to $74,999 | 0 (0.0%) | 0 (0.0%) |
| $75,000 to $99,999 | 0 (0.0%) | 31 (11.8%) |
| $100,000 to $149,999 | 0 (0.0%) | 0 (0.0%) |
| $150,000 or more | 0 (0.0%) | 130 (49.4%) |
| Total | 84 (100.0%) | 263 (100.0%) |
Property Value to Household Income Ratio in Virginia City
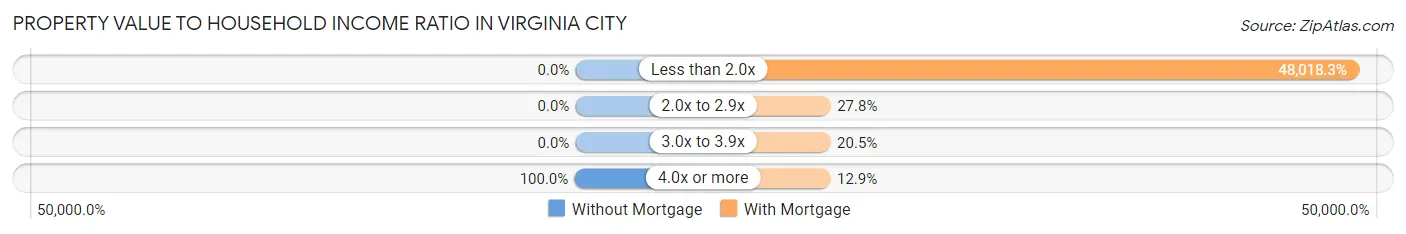
| Value-to-Income Ratio | Without Mortgage | With Mortgage |
| Less than 2.0x | 0 (0.0%) | 126,288 (48,018.3%) |
| 2.0x to 2.9x | 0 (0.0%) | 73 (27.8%) |
| 3.0x to 3.9x | 0 (0.0%) | 54 (20.5%) |
| 4.0x or more | 84 (100.0%) | 34 (12.9%) |
| Total | 84 (100.0%) | 263 (100.0%) |
Real Estate Taxes by Mortgage Status in Virginia City
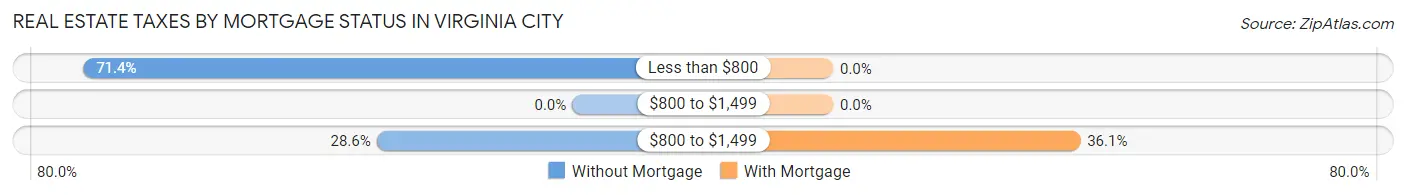
| Property Taxes | Without Mortgage | With Mortgage |
| Less than $800 | 60 (71.4%) | 0 (0.0%) |
| $800 to $1,499 | 0 (0.0%) | 0 (0.0%) |
| $800 to $1,499 | 24 (28.6%) | 95 (36.1%) |
| Total | 84 (100.0%) | 263 (100.0%) |
Health & Disability in Virginia City
Health Insurance Coverage by Age in Virginia City
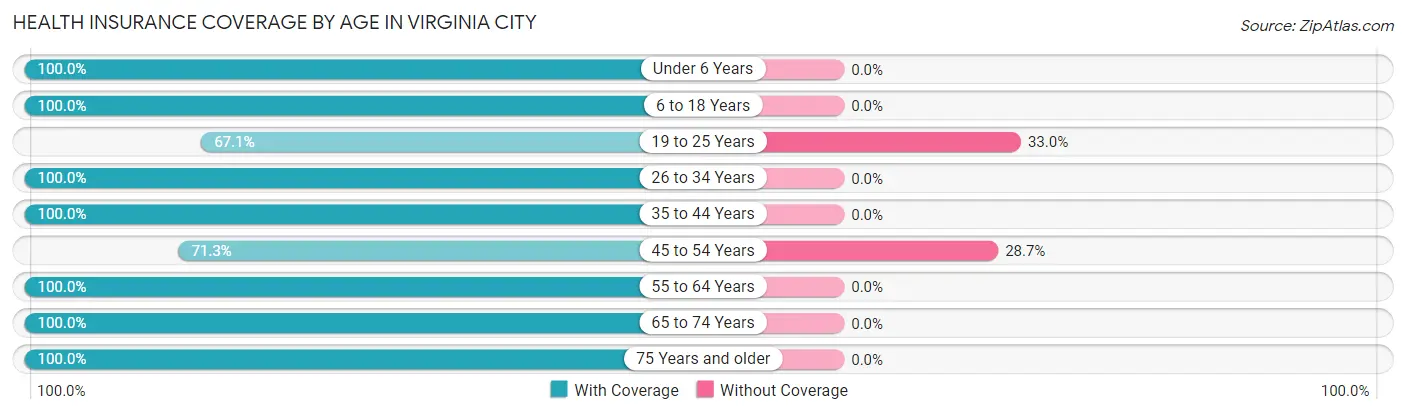
| Age Bracket | With Coverage | Without Coverage |
| Under 6 Years | 50 (100.0%) | 0 (0.0%) |
| 6 to 18 Years | 100 (100.0%) | 0 (0.0%) |
| 19 to 25 Years | 59 (67.0%) | 29 (33.0%) |
| 26 to 34 Years | 67 (100.0%) | 0 (0.0%) |
| 35 to 44 Years | 58 (100.0%) | 0 (0.0%) |
| 45 to 54 Years | 77 (71.3%) | 31 (28.7%) |
| 55 to 64 Years | 115 (100.0%) | 0 (0.0%) |
| 65 to 74 Years | 143 (100.0%) | 0 (0.0%) |
| 75 Years and older | 149 (100.0%) | 0 (0.0%) |
| Total | 818 (93.2%) | 60 (6.8%) |
Health Insurance Coverage by Citizenship Status in Virginia City
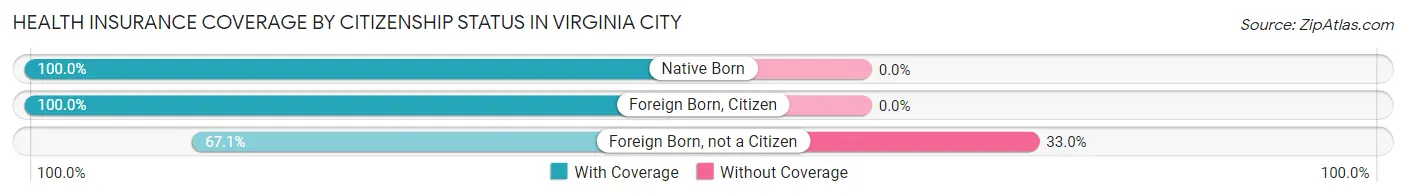
| Citizenship Status | With Coverage | Without Coverage |
| Native Born | 50 (100.0%) | 0 (0.0%) |
| Foreign Born, Citizen | 100 (100.0%) | 0 (0.0%) |
| Foreign Born, not a Citizen | 59 (67.0%) | 29 (33.0%) |
Health Insurance Coverage by Household Income in Virginia City
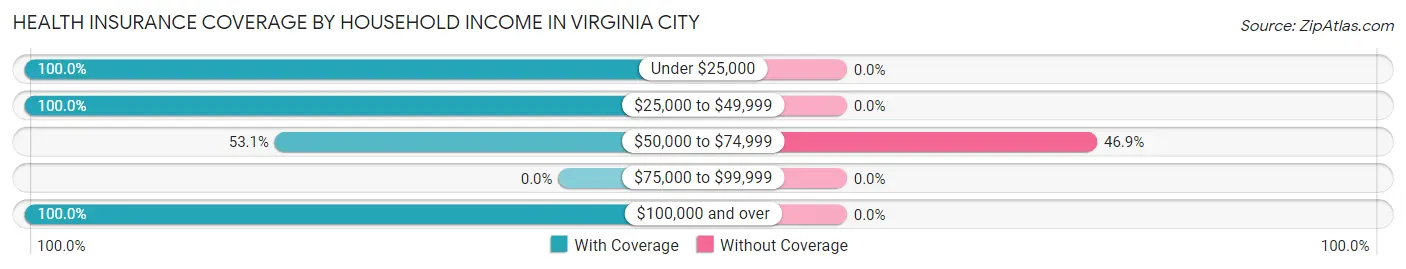
| Household Income | With Coverage | Without Coverage |
| Under $25,000 | 36 (100.0%) | 0 (0.0%) |
| $25,000 to $49,999 | 84 (100.0%) | 0 (0.0%) |
| $50,000 to $74,999 | 68 (53.1%) | 60 (46.9%) |
| $75,000 to $99,999 | 0 (0.0%) | 0 (0.0%) |
| $100,000 and over | 630 (100.0%) | 0 (0.0%) |
Public vs Private Health Insurance Coverage by Age in Virginia City
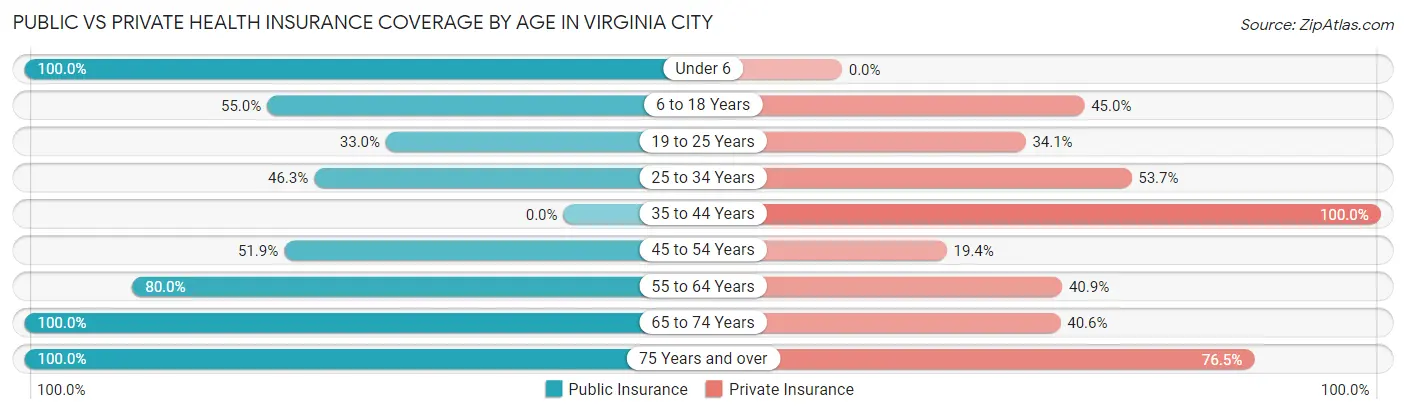
| Age Bracket | Public Insurance | Private Insurance |
| Under 6 | 50 (100.0%) | 0 (0.0%) |
| 6 to 18 Years | 55 (55.0%) | 45 (45.0%) |
| 19 to 25 Years | 29 (33.0%) | 30 (34.1%) |
| 25 to 34 Years | 31 (46.3%) | 36 (53.7%) |
| 35 to 44 Years | 0 (0.0%) | 58 (100.0%) |
| 45 to 54 Years | 56 (51.8%) | 21 (19.4%) |
| 55 to 64 Years | 92 (80.0%) | 47 (40.9%) |
| 65 to 74 Years | 143 (100.0%) | 58 (40.6%) |
| 75 Years and over | 149 (100.0%) | 114 (76.5%) |
| Total | 605 (68.9%) | 409 (46.6%) |
Disability Status by Sex by Age in Virginia City
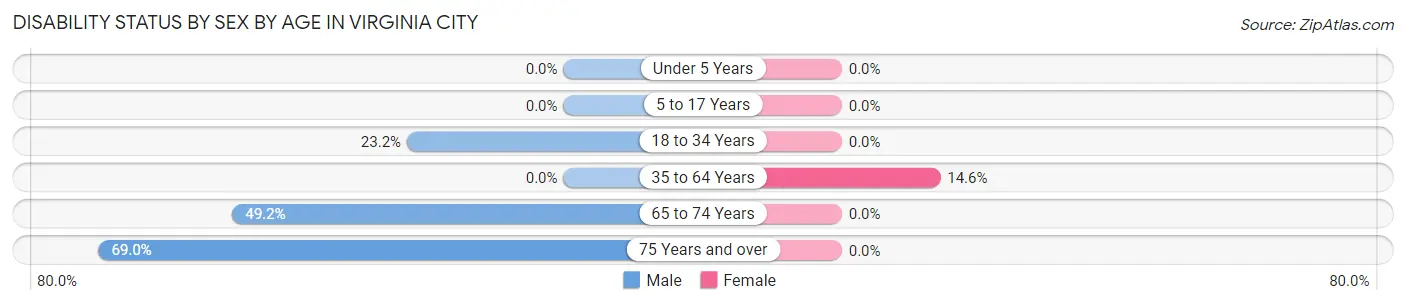
| Age Bracket | Male | Female |
| Under 5 Years | 0 (0.0%) | 0 (0.0%) |
| 5 to 17 Years | 0 (0.0%) | 0 (0.0%) |
| 18 to 34 Years | 36 (23.2%) | 0 (0.0%) |
| 35 to 64 Years | 0 (0.0%) | 24 (14.6%) |
| 65 to 74 Years | 58 (49.1%) | 0 (0.0%) |
| 75 Years and over | 78 (69.0%) | 0 (0.0%) |
Disability Class by Sex by Age in Virginia City
Disability Class: Hearing Difficulty
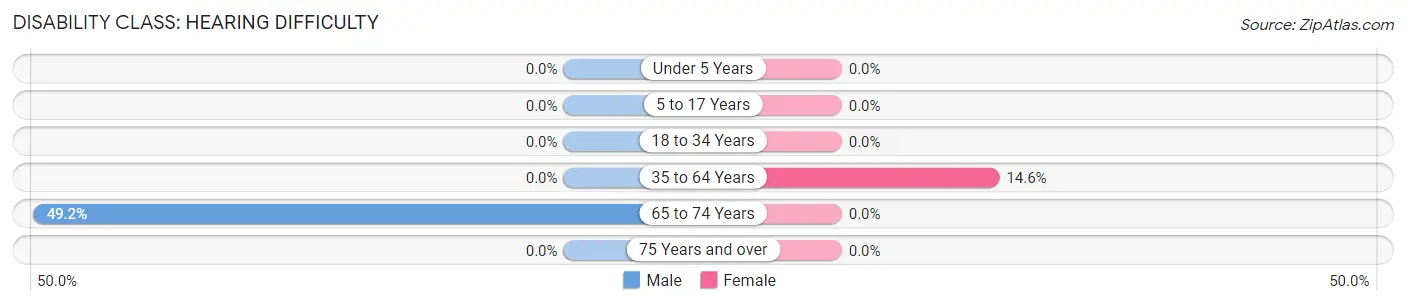
| Age Bracket | Male | Female |
| Under 5 Years | 0 (0.0%) | 0 (0.0%) |
| 5 to 17 Years | 0 (0.0%) | 0 (0.0%) |
| 18 to 34 Years | 0 (0.0%) | 0 (0.0%) |
| 35 to 64 Years | 0 (0.0%) | 24 (14.6%) |
| 65 to 74 Years | 58 (49.1%) | 0 (0.0%) |
| 75 Years and over | 0 (0.0%) | 0 (0.0%) |
Disability Class: Vision Difficulty
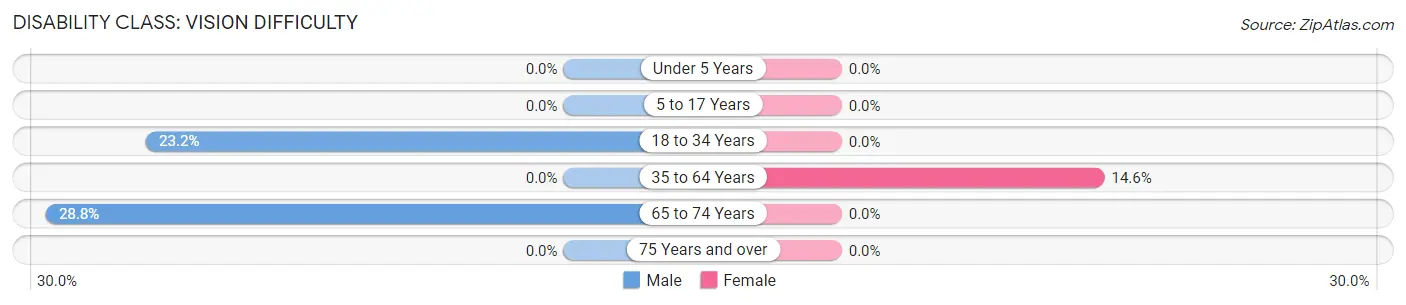
| Age Bracket | Male | Female |
| Under 5 Years | 0 (0.0%) | 0 (0.0%) |
| 5 to 17 Years | 0 (0.0%) | 0 (0.0%) |
| 18 to 34 Years | 36 (23.2%) | 0 (0.0%) |
| 35 to 64 Years | 0 (0.0%) | 24 (14.6%) |
| 65 to 74 Years | 34 (28.8%) | 0 (0.0%) |
| 75 Years and over | 0 (0.0%) | 0 (0.0%) |
Disability Class: Cognitive Difficulty
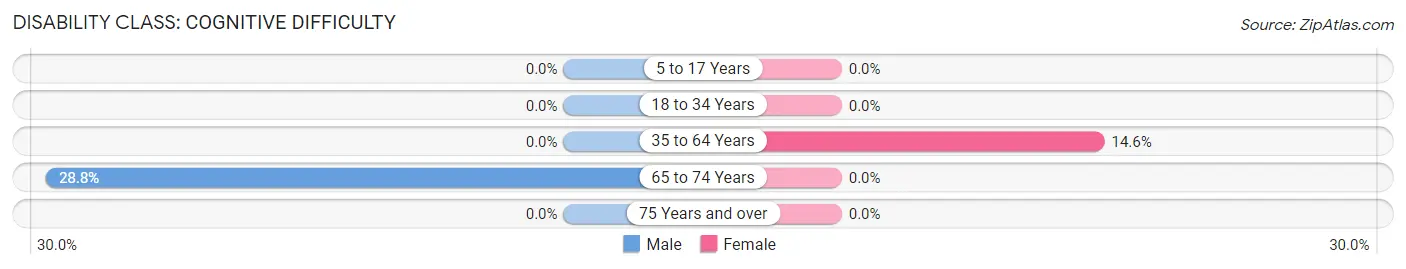
| Age Bracket | Male | Female |
| 5 to 17 Years | 0 (0.0%) | 0 (0.0%) |
| 18 to 34 Years | 0 (0.0%) | 0 (0.0%) |
| 35 to 64 Years | 0 (0.0%) | 24 (14.6%) |
| 65 to 74 Years | 34 (28.8%) | 0 (0.0%) |
| 75 Years and over | 0 (0.0%) | 0 (0.0%) |
Disability Class: Ambulatory Difficulty
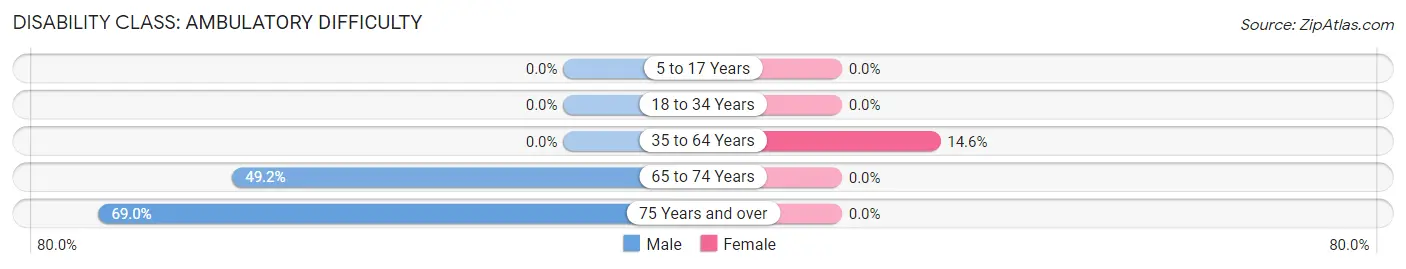
| Age Bracket | Male | Female |
| 5 to 17 Years | 0 (0.0%) | 0 (0.0%) |
| 18 to 34 Years | 0 (0.0%) | 0 (0.0%) |
| 35 to 64 Years | 0 (0.0%) | 24 (14.6%) |
| 65 to 74 Years | 58 (49.1%) | 0 (0.0%) |
| 75 Years and over | 78 (69.0%) | 0 (0.0%) |
Disability Class: Self-Care Difficulty
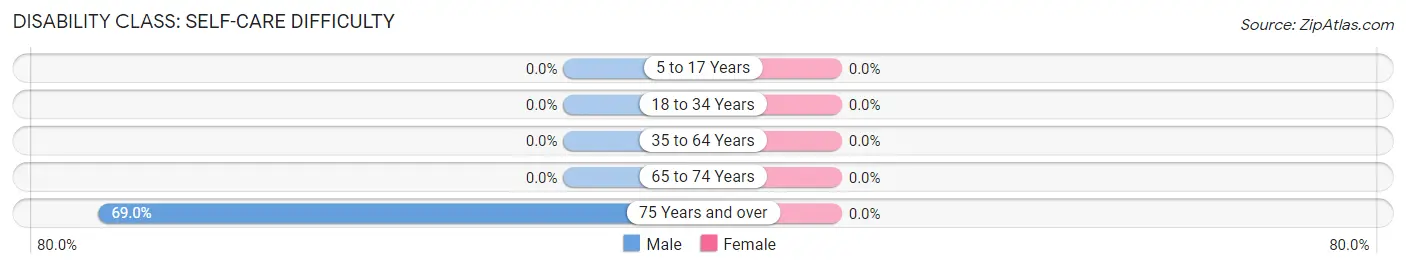
| Age Bracket | Male | Female |
| 5 to 17 Years | 0 (0.0%) | 0 (0.0%) |
| 18 to 34 Years | 0 (0.0%) | 0 (0.0%) |
| 35 to 64 Years | 0 (0.0%) | 0 (0.0%) |
| 65 to 74 Years | 0 (0.0%) | 0 (0.0%) |
| 75 Years and over | 78 (69.0%) | 0 (0.0%) |
Technology Access in Virginia City
Computing Device Access in Virginia City
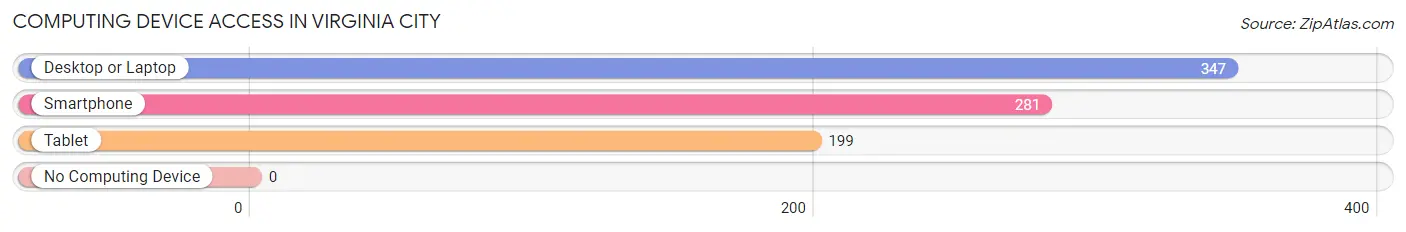
| Device Type | # Households | % Households |
| Desktop or Laptop | 347 | 100.0% |
| Smartphone | 281 | 81.0% |
| Tablet | 199 | 57.4% |
| No Computing Device | 0 | 0.0% |
| Total | 347 | 100.0% |
Internet Access in Virginia City
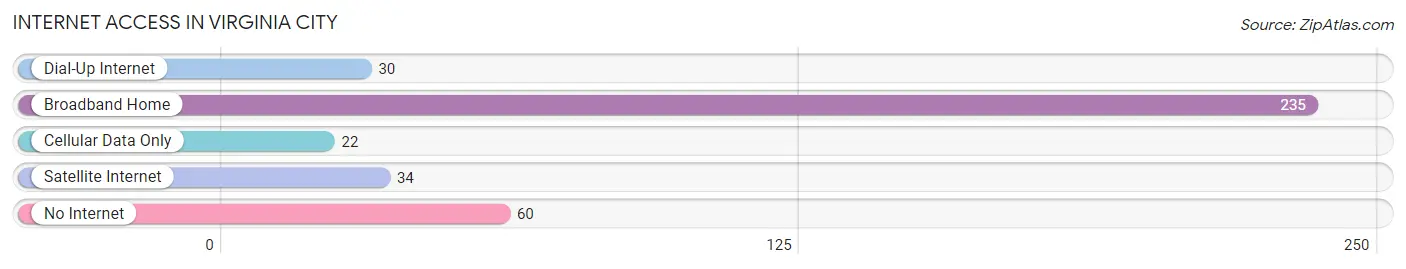
| Internet Type | # Households | % Households |
| Dial-Up Internet | 30 | 8.6% |
| Broadband Home | 235 | 67.7% |
| Cellular Data Only | 22 | 6.3% |
| Satellite Internet | 34 | 9.8% |
| No Internet | 60 | 17.3% |
| Total | 347 | 100.0% |
Virginia City Summary
Introduction
Virginia City is a small town located in Storey County, Nevada, United States. It is situated in the foothills of the Sierra Nevada Mountains, about 20 miles southeast of Reno. It is best known as a historic mining town, and is one of the most well-preserved ghost towns in the United States. It is also home to the Virginia and Truckee Railroad, which is a popular tourist attraction.
History
Virginia City was founded in 1859, when the Comstock Lode, a major silver deposit, was discovered in the area. The discovery of the Comstock Lode sparked a silver rush, and thousands of people flocked to the area in search of wealth. The town quickly grew, and by the late 1860s, it was the largest city in Nevada, with a population of over 25,000.
The town was home to many famous figures, including Mark Twain, who wrote about his experiences in the town in his book Roughing It. It was also the site of the famous Virginia City Fire of 1875, which destroyed much of the town.
The town’s population began to decline in the late 19th century, as the silver mines began to run dry. By the early 20th century, the population had dropped to just a few hundred people. The town was declared a National Historic Landmark in 1961, and today it is a popular tourist destination.
Geography
Virginia City is located in Storey County, Nevada, in the foothills of the Sierra Nevada Mountains. It is situated about 20 miles southeast of Reno, and is accessible via US Route 50. The town is located at an elevation of 5,845 feet, and has a total area of 1.2 square miles.
The town is surrounded by mountains, and is located in a semi-arid climate. The average annual temperature is around 50 degrees Fahrenheit, and the average annual precipitation is around 10 inches.
Economy
Virginia City’s economy is largely based on tourism. The town is home to many historic sites, including the Virginia and Truckee Railroad, which is a popular tourist attraction. The town also has several museums, including the Mark Twain Museum and the Comstock History Center.
The town is also home to several casinos, which attract visitors from all over the world. The casinos provide jobs for many of the town’s residents, and are a major source of revenue for the town.
Demographics
As of the 2010 census, Virginia City had a population of 855 people. The racial makeup of the town was 94.3% White, 0.7% African American, 0.7% Native American, 0.7% Asian, 0.1% Pacific Islander, and 3.5% from other races. The median household income was $37,500, and the median family income was $45,000.
Conclusion
Virginia City is a small town located in Storey County, Nevada, United States. It is best known as a historic mining town, and is one of the most well-preserved ghost towns in the United States. The town’s economy is largely based on tourism, and it is home to many historic sites, museums, and casinos. As of the 2010 census, Virginia City had a population of 855 people.
Common Questions
What is Per Capita Income in Virginia City?
Per Capita income in Virginia City is $43,427.
What is the Median Family Income in Virginia City?
Median Family Income in Virginia City is $127,214.
What is the Median Household income in Virginia City?
Median Household Income in Virginia City is $106,815.
What is Inequality or Gini Index in Virginia City?
Inequality or Gini Index in Virginia City is 0.40.
What is the Total Population of Virginia City?
Total Population of Virginia City is 904.
What is the Total Male Population of Virginia City?
Total Male Population of Virginia City is 589.
What is the Total Female Population of Virginia City?
Total Female Population of Virginia City is 315.
What is the Ratio of Males per 100 Females in Virginia City?
There are 186.98 Males per 100 Females in Virginia City.
What is the Ratio of Females per 100 Males in Virginia City?
There are 53.48 Females per 100 Males in Virginia City.
What is the Median Population Age in Virginia City?
Median Population Age in Virginia City is 53.6 Years.
What is the Average Family Size in Virginia City
Average Family Size in Virginia City is 3.3 People.
What is the Average Household Size in Virginia City
Average Household Size in Virginia City is 2.6 People.
How Large is the Labor Force in Virginia City?
There are 309 People in the Labor Forcein in Virginia City.
What is the Percentage of People in the Labor Force in Virginia City?
41.0% of People are in the Labor Force in Virginia City.