Indian Springs, TX Map & Demographics
Indian Springs Map
Indian Springs Overview
$24,688
PER CAPITA INCOME
$58,816
AVG FAMILY INCOME
$65,292
AVG HOUSEHOLD INCOME
29.2%
WAGE / INCOME GAP [ % ]
70.8¢/ $1
WAGE / INCOME GAP [ $ ]
0.27
INEQUALITY / GINI INDEX
869
TOTAL POPULATION
519
MALE POPULATION
350
FEMALE POPULATION
148.29
MALES / 100 FEMALES
67.44
FEMALES / 100 MALES
59.7
MEDIAN AGE
3.0
AVG FAMILY SIZE
2.8
AVG HOUSEHOLD SIZE
351
LABOR FORCE [ PEOPLE ]
41.5%
PERCENT IN LABOR FORCE
0.3%
UNEMPLOYMENT RATE
Income in Indian Springs
Income Overview in Indian Springs
Per Capita Income in Indian Springs is $24,688, while median incomes of families and households are $58,816 and $65,292 respectively.
| Characteristic | Number | Measure |
| Per Capita Income | 869 | $24,688 |
| Median Family Income | 244 | $58,816 |
| Mean Family Income | 244 | $61,993 |
| Median Household Income | 310 | $65,292 |
| Mean Household Income | 310 | $58,172 |
| Income Deficit | 244 | $0 |
| Wage / Income Gap (%) | 869 | 29.20% |
| Wage / Income Gap ($) | 869 | 70.80¢ per $1 |
| Gini / Inequality Index | 869 | 0.27 |
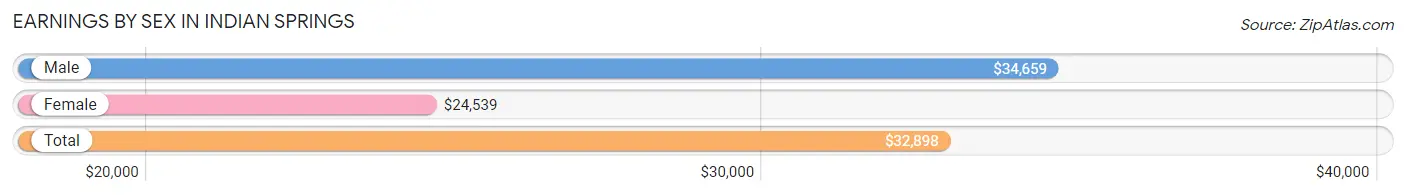
Earnings by Sex in Indian Springs
Average Earnings in Indian Springs are $32,898, $34,659 for men and $24,539 for women, a difference of 29.2%.
| Sex | Number | Average Earnings |
| Male | 330 (90.9%) | $34,659 |
| Female | 33 (9.1%) | $24,539 |
| Total | 363 (100.0%) | $32,898 |
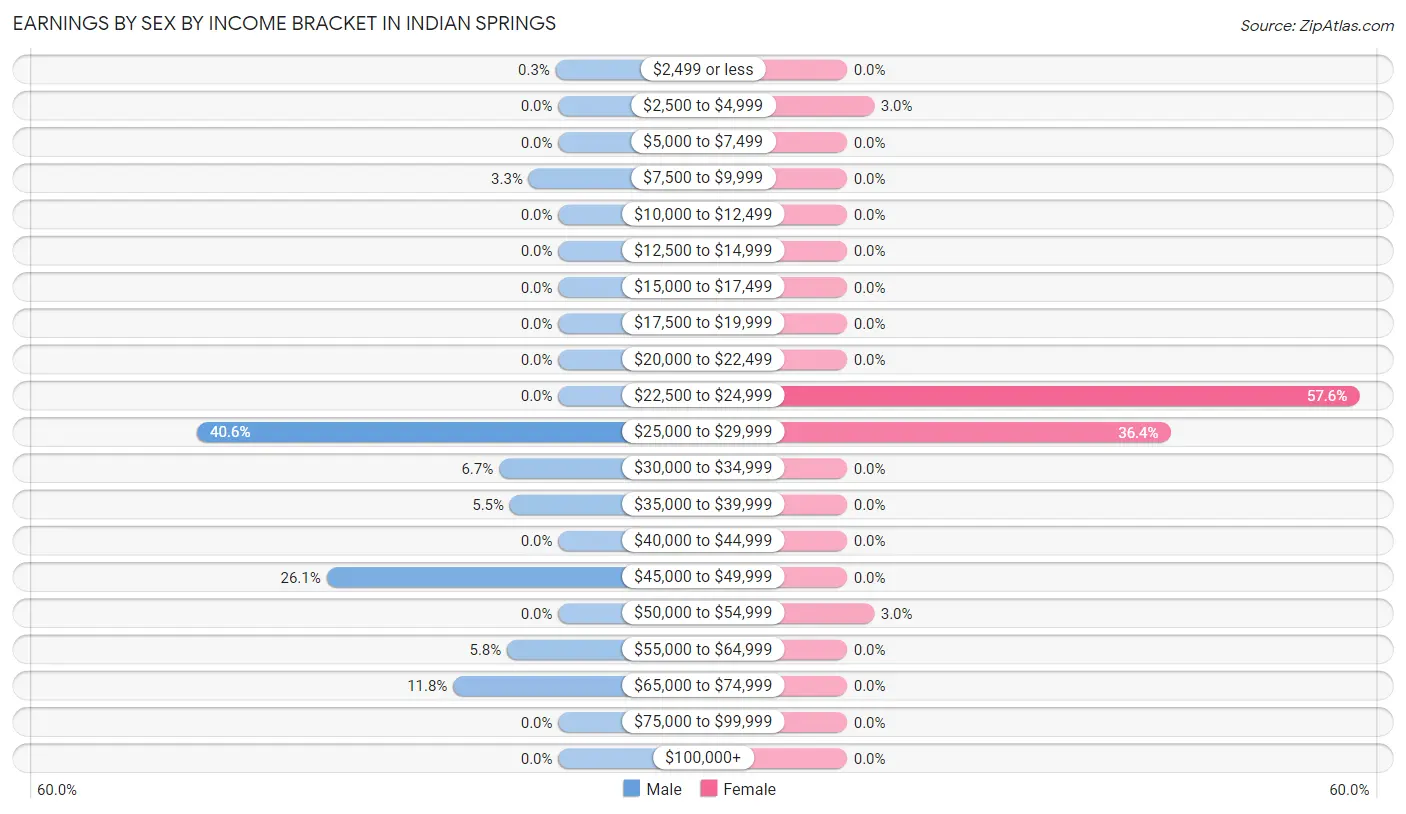
Earnings by Sex by Income Bracket in Indian Springs
The most common earnings brackets in Indian Springs are $25,000 to $29,999 for men (134 | 40.6%) and $22,500 to $24,999 for women (19 | 57.6%).
| Income | Male | Female |
| $2,499 or less | 1 (0.3%) | 0 (0.0%) |
| $2,500 to $4,999 | 0 (0.0%) | 1 (3.0%) |
| $5,000 to $7,499 | 0 (0.0%) | 0 (0.0%) |
| $7,500 to $9,999 | 11 (3.3%) | 0 (0.0%) |
| $10,000 to $12,499 | 0 (0.0%) | 0 (0.0%) |
| $12,500 to $14,999 | 0 (0.0%) | 0 (0.0%) |
| $15,000 to $17,499 | 0 (0.0%) | 0 (0.0%) |
| $17,500 to $19,999 | 0 (0.0%) | 0 (0.0%) |
| $20,000 to $22,499 | 0 (0.0%) | 0 (0.0%) |
| $22,500 to $24,999 | 0 (0.0%) | 19 (57.6%) |
| $25,000 to $29,999 | 134 (40.6%) | 12 (36.4%) |
| $30,000 to $34,999 | 22 (6.7%) | 0 (0.0%) |
| $35,000 to $39,999 | 18 (5.4%) | 0 (0.0%) |
| $40,000 to $44,999 | 0 (0.0%) | 0 (0.0%) |
| $45,000 to $49,999 | 86 (26.1%) | 0 (0.0%) |
| $50,000 to $54,999 | 0 (0.0%) | 1 (3.0%) |
| $55,000 to $64,999 | 19 (5.8%) | 0 (0.0%) |
| $65,000 to $74,999 | 39 (11.8%) | 0 (0.0%) |
| $75,000 to $99,999 | 0 (0.0%) | 0 (0.0%) |
| $100,000+ | 0 (0.0%) | 0 (0.0%) |
| Total | 330 (100.0%) | 33 (100.0%) |
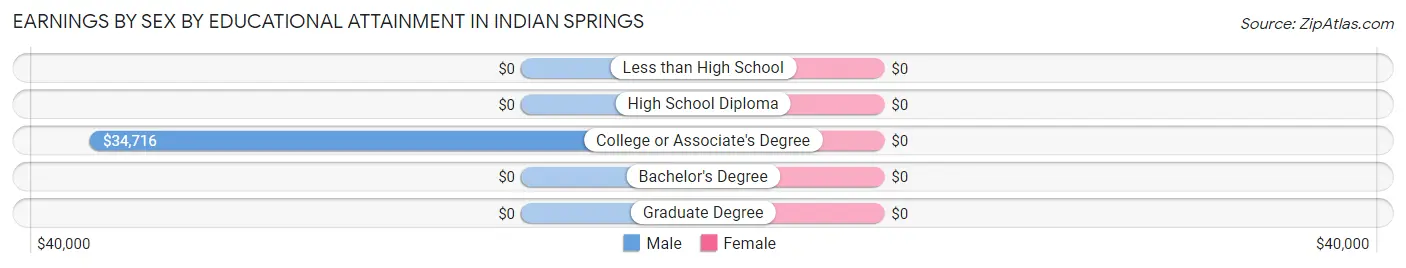
Earnings by Sex by Educational Attainment in Indian Springs
| Educational Attainment | Male Income | Female Income |
| Less than High School | - | - |
| High School Diploma | - | - |
| College or Associate's Degree | $34,716 | $0 |
| Bachelor's Degree | - | - |
| Graduate Degree | - | - |
| Total | $34,659 | $24,605 |
Family Income in Indian Springs
Family Income Brackets in Indian Springs
According to the Indian Springs family income data, there are 99 families falling into the $35,000 to $49,999 income range, which is the most common income bracket and makes up 40.6% of all families.
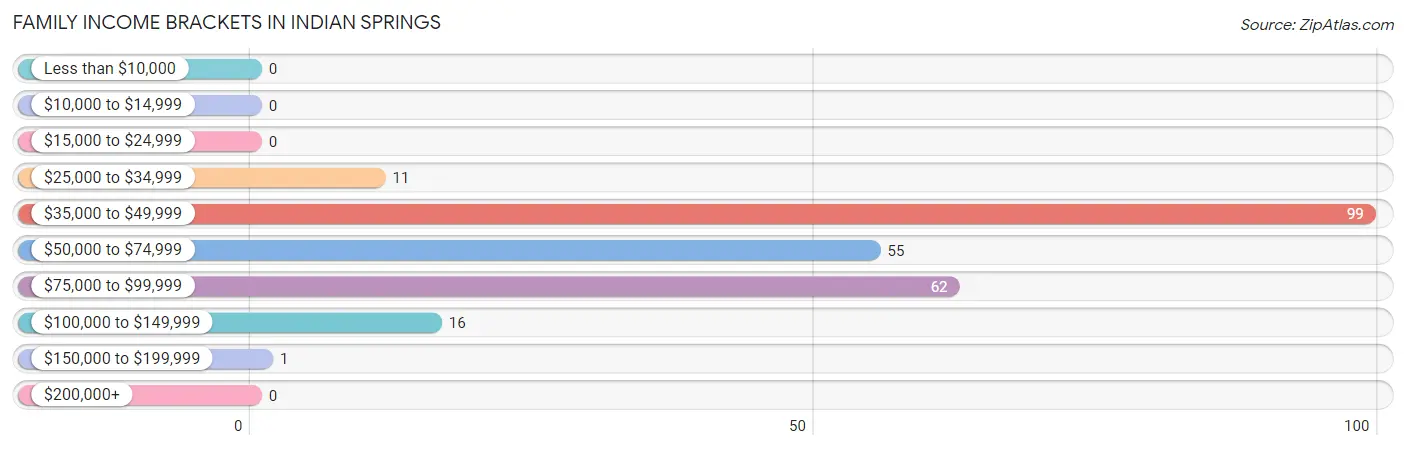
| Income Bracket | # Families | % Families |
| Less than $10,000 | 0 | 0.0% |
| $10,000 to $14,999 | 0 | 0.0% |
| $15,000 to $24,999 | 0 | 0.0% |
| $25,000 to $34,999 | 11 | 4.5% |
| $35,000 to $49,999 | 99 | 40.6% |
| $50,000 to $74,999 | 55 | 22.5% |
| $75,000 to $99,999 | 62 | 25.4% |
| $100,000 to $149,999 | 16 | 6.6% |
| $150,000 to $199,999 | 1 | 0.4% |
| $200,000+ | 0 | 0.0% |
Family Income by Famaliy Size in Indian Springs
3-person families (129 | 52.9%) account for the highest median family income in Indian Springs with $74,219 per family, while 2-person families (112 | 45.9%) have the highest median income of $29,079 per family member.
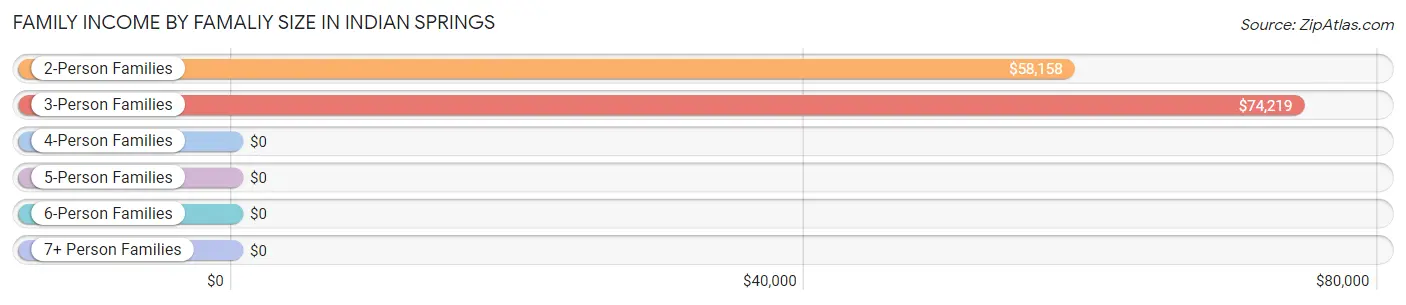
| Income Bracket | # Families | Median Income |
| 2-Person Families | 112 (45.9%) | $58,158 |
| 3-Person Families | 129 (52.9%) | $74,219 |
| 4-Person Families | 0 (0.0%) | $0 |
| 5-Person Families | 0 (0.0%) | $0 |
| 6-Person Families | 0 (0.0%) | $0 |
| 7+ Person Families | 3 (1.2%) | $0 |
| Total | 244 (100.0%) | $58,816 |
Family Income by Number of Earners in Indian Springs
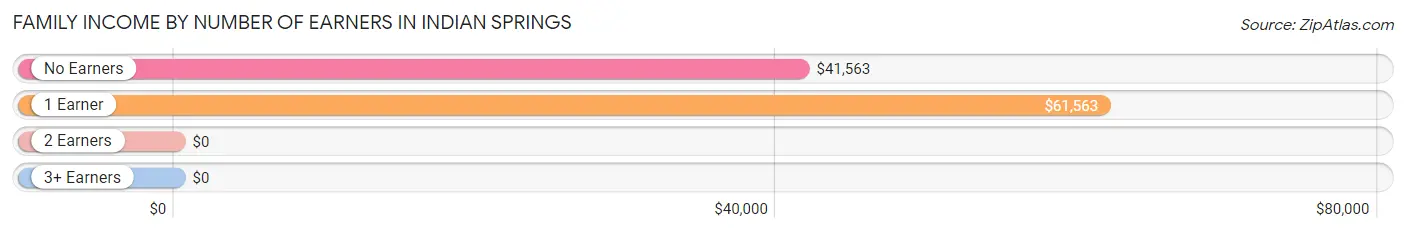
| Number of Earners | # Families | Median Income |
| No Earners | 50 (20.5%) | $41,563 |
| 1 Earner | 166 (68.0%) | $61,563 |
| 2 Earners | 27 (11.1%) | $0 |
| 3+ Earners | 1 (0.4%) | $0 |
| Total | 244 (100.0%) | $58,816 |
Household Income in Indian Springs
Household Income Brackets in Indian Springs
With 114 households falling in the category, the $50,000 to $74,999 income range is the most frequent in Indian Springs, accounting for 36.8% of all households.
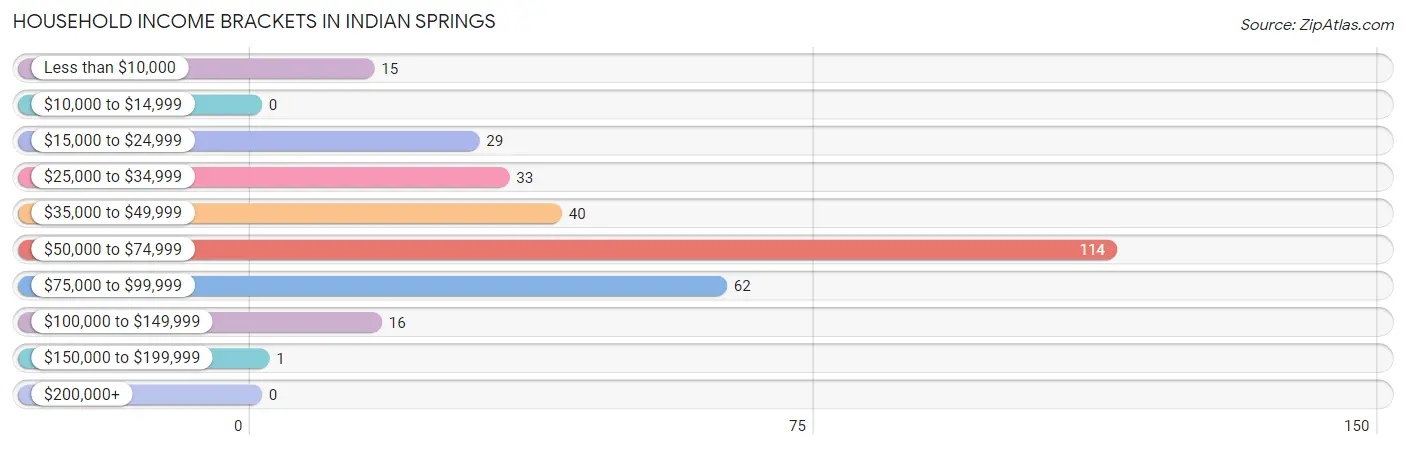
| Income Bracket | # Households | % Households |
| Less than $10,000 | 15 | 4.8% |
| $10,000 to $14,999 | 0 | 0.0% |
| $15,000 to $24,999 | 29 | 9.4% |
| $25,000 to $34,999 | 33 | 10.6% |
| $35,000 to $49,999 | 40 | 12.9% |
| $50,000 to $74,999 | 114 | 36.8% |
| $75,000 to $99,999 | 62 | 20.0% |
| $100,000 to $149,999 | 16 | 5.2% |
| $150,000 to $199,999 | 1 | 0.3% |
| $200,000+ | 0 | 0.0% |
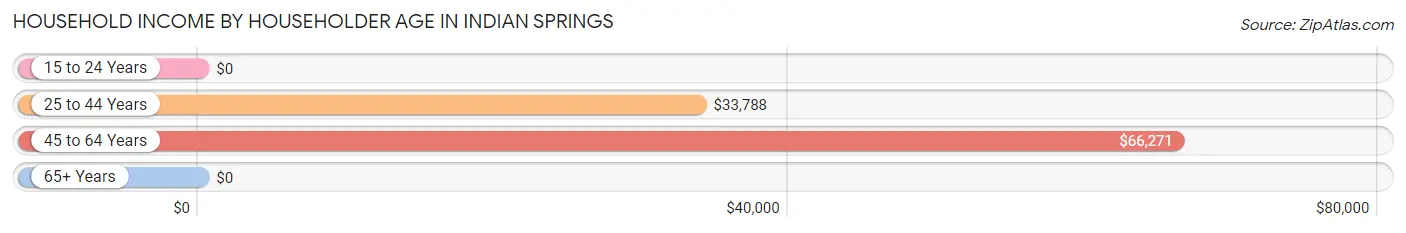
Household Income by Householder Age in Indian Springs
The median household income in Indian Springs is $65,292, with the highest median household income of $66,271 found in the 45 to 64 years age bracket for the primary householder. A total of 182 households (58.7%) fall into this category.
| Income Bracket | # Households | Median Income |
| 15 to 24 Years | 0 (0.0%) | $0 |
| 25 to 44 Years | 34 (11.0%) | $33,788 |
| 45 to 64 Years | 182 (58.7%) | $66,271 |
| 65+ Years | 94 (30.3%) | $0 |
| Total | 310 (100.0%) | $65,292 |
Poverty in Indian Springs
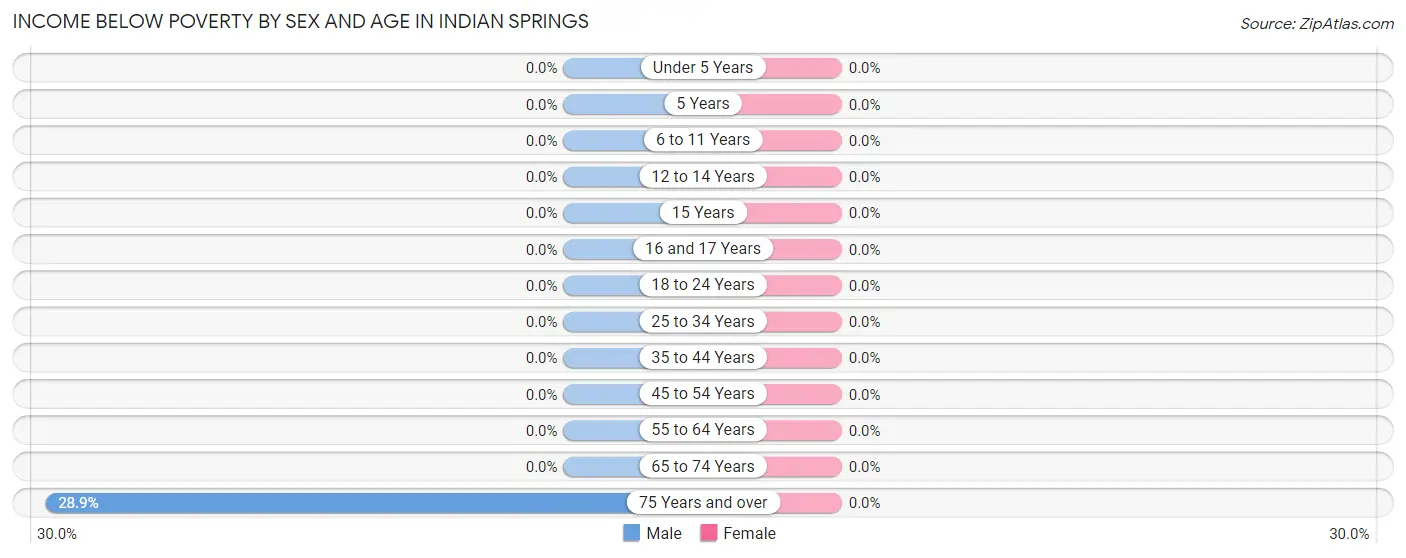
Income Below Poverty by Sex and Age in Indian Springs
| Age Bracket | Male | Female |
| Under 5 Years | 0 (0.0%) | 0 (0.0%) |
| 5 Years | 0 (0.0%) | 0 (0.0%) |
| 6 to 11 Years | 0 (0.0%) | 0 (0.0%) |
| 12 to 14 Years | 0 (0.0%) | 0 (0.0%) |
| 15 Years | 0 (0.0%) | 0 (0.0%) |
| 16 and 17 Years | 0 (0.0%) | 0 (0.0%) |
| 18 to 24 Years | 0 (0.0%) | 0 (0.0%) |
| 25 to 34 Years | 0 (0.0%) | 0 (0.0%) |
| 35 to 44 Years | 0 (0.0%) | 0 (0.0%) |
| 45 to 54 Years | 0 (0.0%) | 0 (0.0%) |
| 55 to 64 Years | 0 (0.0%) | 0 (0.0%) |
| 65 to 74 Years | 0 (0.0%) | 0 (0.0%) |
| 75 Years and over | 15 (28.8%) | 0 (0.0%) |
| Total | 15 (2.9%) | 0 (0.0%) |
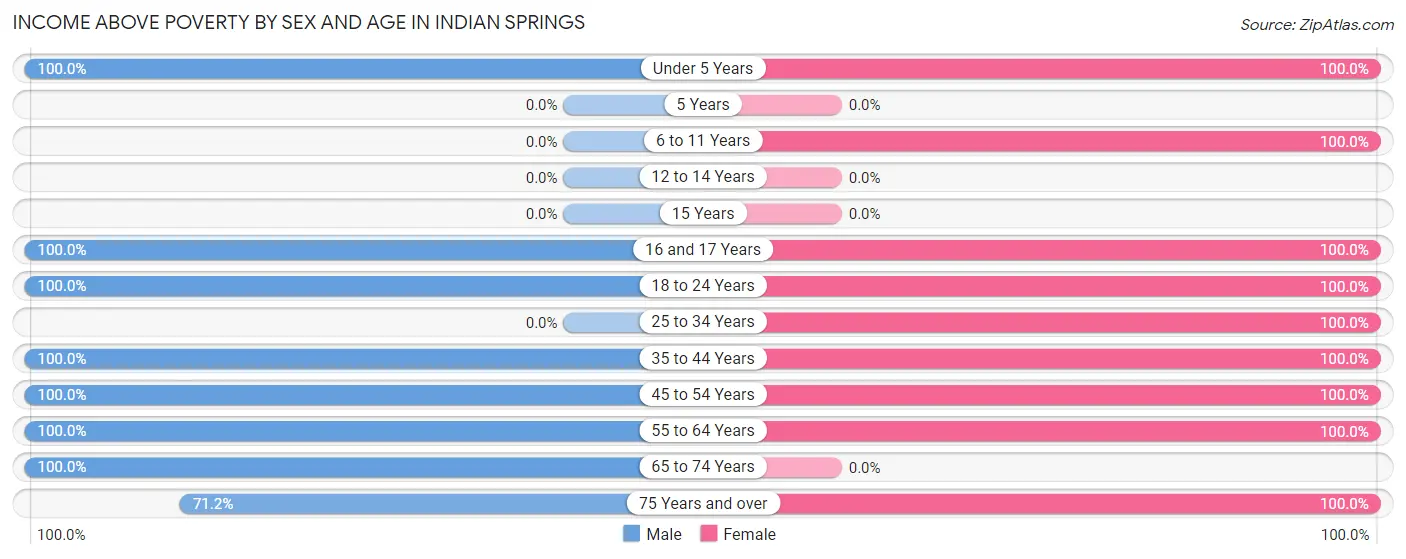
Income Above Poverty by Sex and Age in Indian Springs
According to the poverty statistics in Indian Springs, males aged under 5 years and females aged under 5 years are the age groups that are most secure financially, with 100.0% of males and 100.0% of females in these age groups living above the poverty line.
| Age Bracket | Male | Female |
| Under 5 Years | 1 (100.0%) | 12 (100.0%) |
| 5 Years | 0 (0.0%) | 0 (0.0%) |
| 6 to 11 Years | 0 (0.0%) | 10 (100.0%) |
| 12 to 14 Years | 0 (0.0%) | 0 (0.0%) |
| 15 Years | 0 (0.0%) | 0 (0.0%) |
| 16 and 17 Years | 1 (100.0%) | 11 (100.0%) |
| 18 to 24 Years | 6 (100.0%) | 17 (100.0%) |
| 25 to 34 Years | 0 (0.0%) | 68 (100.0%) |
| 35 to 44 Years | 108 (100.0%) | 1 (100.0%) |
| 45 to 54 Years | 40 (100.0%) | 2 (100.0%) |
| 55 to 64 Years | 171 (100.0%) | 214 (100.0%) |
| 65 to 74 Years | 140 (100.0%) | 0 (0.0%) |
| 75 Years and over | 37 (71.2%) | 15 (100.0%) |
| Total | 504 (97.1%) | 350 (100.0%) |
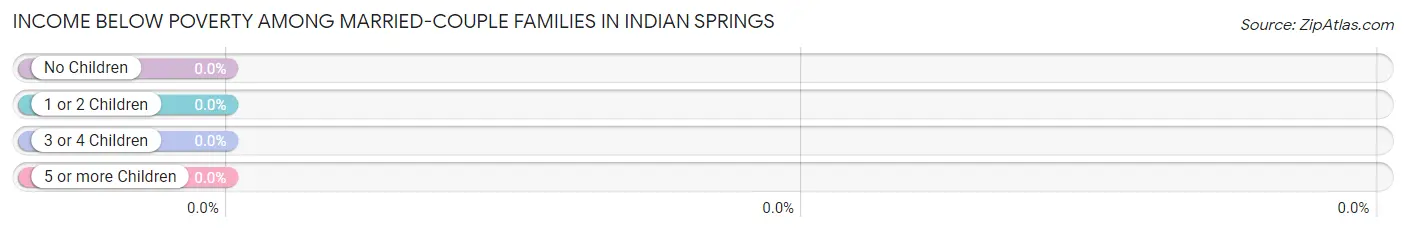
Income Below Poverty Among Married-Couple Families in Indian Springs
| Children | Above Poverty | Below Poverty |
| No Children | 166 (100.0%) | 0 (0.0%) |
| 1 or 2 Children | 2 (100.0%) | 0 (0.0%) |
| 3 or 4 Children | 1 (100.0%) | 0 (0.0%) |
| 5 or more Children | 0 (0.0%) | 0 (0.0%) |
| Total | 169 (100.0%) | 0 (0.0%) |
Income Below Poverty Among Single-Parent Households in Indian Springs
| Children | Single Father | Single Mother |
| No Children | 0 (0.0%) | 0 (0.0%) |
| 1 or 2 Children | 0 (0.0%) | 0 (0.0%) |
| 3 or 4 Children | 0 (0.0%) | 0 (0.0%) |
| 5 or more Children | 0 (0.0%) | 0 (0.0%) |
| Total | 0 (0.0%) | 0 (0.0%) |
Income Below Poverty Among Married-Couple vs Single-Parent Households in Indian Springs
| Children | Married-Couple Families | Single-Parent Households |
| No Children | 0 (0.0%) | 0 (0.0%) |
| 1 or 2 Children | 0 (0.0%) | 0 (0.0%) |
| 3 or 4 Children | 0 (0.0%) | 0 (0.0%) |
| 5 or more Children | 0 (0.0%) | 0 (0.0%) |
| Total | 0 (0.0%) | 0 (0.0%) |
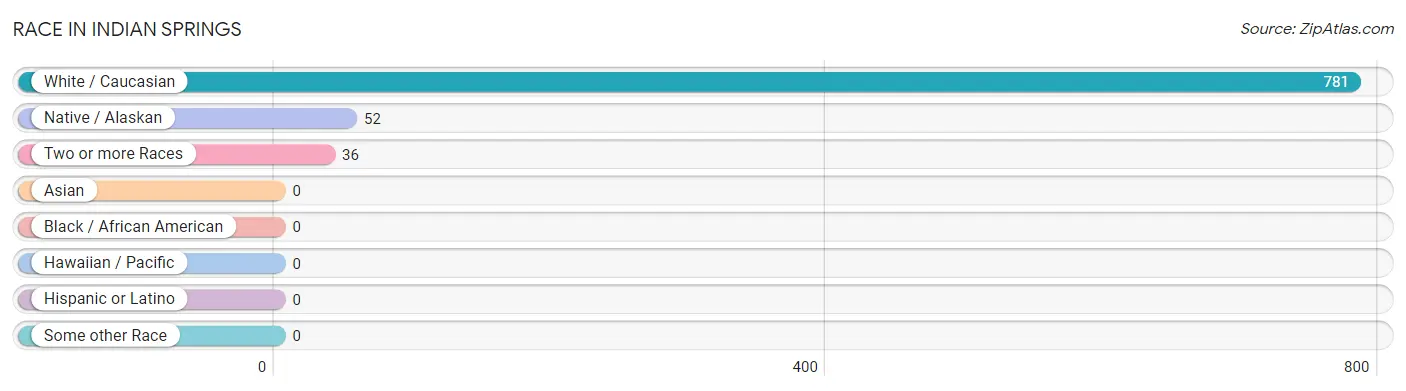
Race in Indian Springs
The most populous races in Indian Springs are White / Caucasian (781 | 89.9%), Native / Alaskan (52 | 6.0%), and Two or more Races (36 | 4.1%).
| Race | # Population | % Population |
| Asian | 0 | 0.0% |
| Black / African American | 0 | 0.0% |
| Hawaiian / Pacific | 0 | 0.0% |
| Hispanic or Latino | 0 | 0.0% |
| Native / Alaskan | 52 | 6.0% |
| White / Caucasian | 781 | 89.9% |
| Two or more Races | 36 | 4.1% |
| Some other Race | 0 | 0.0% |
| Total | 869 | 100.0% |
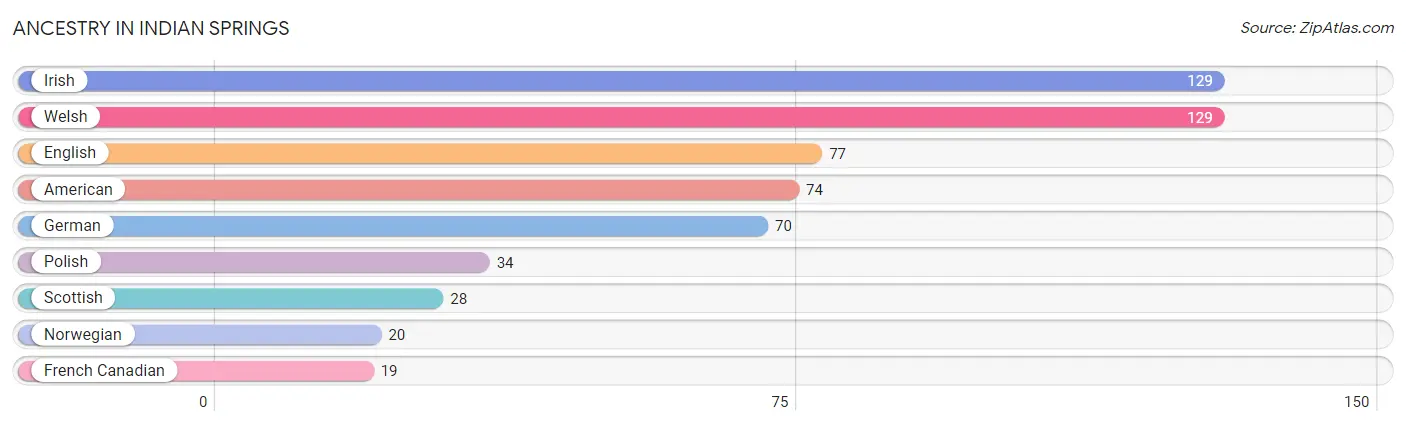
Ancestry in Indian Springs
The most populous ancestries reported in Indian Springs are Irish (129 | 14.8%), Welsh (129 | 14.8%), English (77 | 8.9%), American (74 | 8.5%), and German (70 | 8.1%), together accounting for 55.1% of all Indian Springs residents.
| Ancestry | # Population | % Population |
| American | 74 | 8.5% |
| English | 77 | 8.9% |
| French Canadian | 19 | 2.2% |
| German | 70 | 8.1% |
| Irish | 129 | 14.8% |
| Norwegian | 20 | 2.3% |
| Polish | 34 | 3.9% |
| Scottish | 28 | 3.2% |
| Welsh | 129 | 14.8% | View All 9 Rows |
Immigrants in Indian Springs

| Immigration Origin | # Population | % Population | View All 0 Rows |
Sex and Age in Indian Springs
Sex and Age in Indian Springs
The most populous age groups in Indian Springs are 65 to 69 Years (140 | 27.0%) for men and 60 to 64 Years (121 | 34.6%) for women.
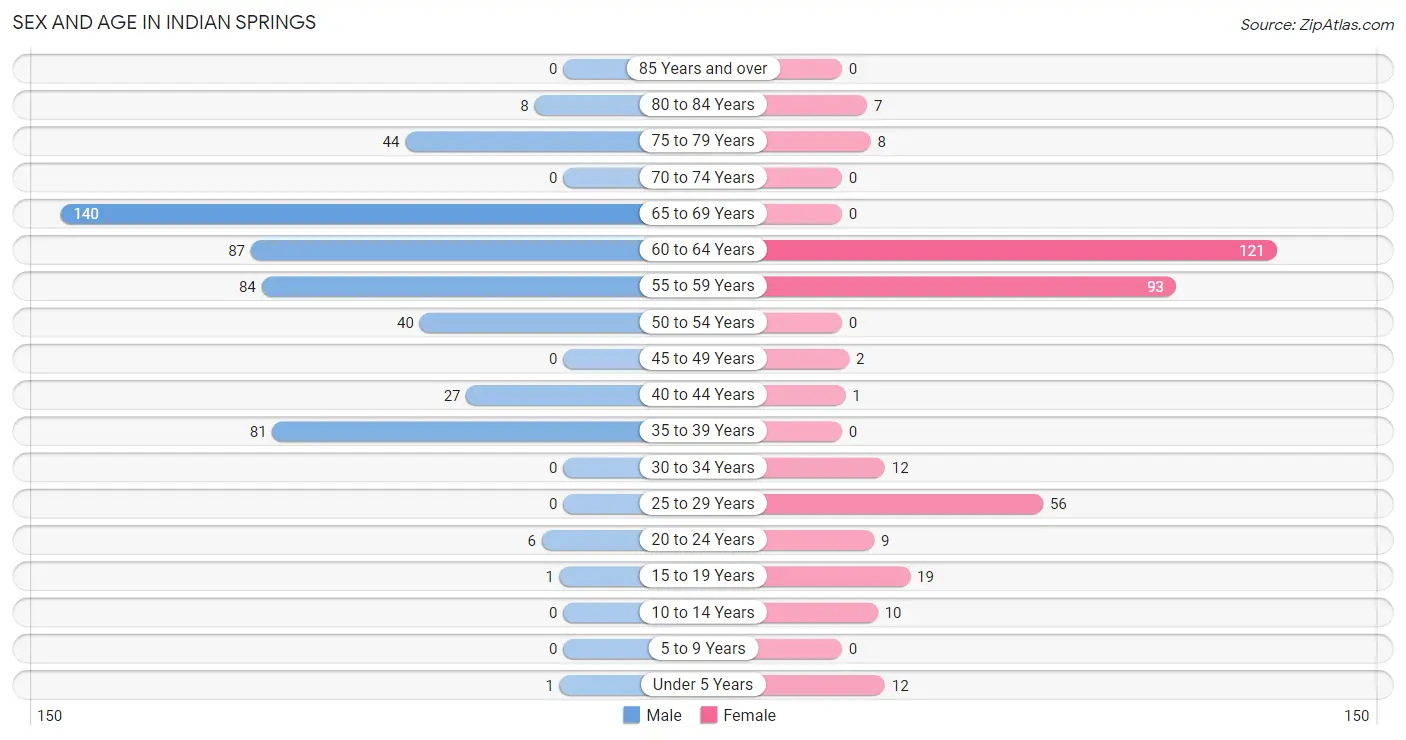
| Age Bracket | Male | Female |
| Under 5 Years | 1 (0.2%) | 12 (3.4%) |
| 5 to 9 Years | 0 (0.0%) | 0 (0.0%) |
| 10 to 14 Years | 0 (0.0%) | 10 (2.9%) |
| 15 to 19 Years | 1 (0.2%) | 19 (5.4%) |
| 20 to 24 Years | 6 (1.2%) | 9 (2.6%) |
| 25 to 29 Years | 0 (0.0%) | 56 (16.0%) |
| 30 to 34 Years | 0 (0.0%) | 12 (3.4%) |
| 35 to 39 Years | 81 (15.6%) | 0 (0.0%) |
| 40 to 44 Years | 27 (5.2%) | 1 (0.3%) |
| 45 to 49 Years | 0 (0.0%) | 2 (0.6%) |
| 50 to 54 Years | 40 (7.7%) | 0 (0.0%) |
| 55 to 59 Years | 84 (16.2%) | 93 (26.6%) |
| 60 to 64 Years | 87 (16.8%) | 121 (34.6%) |
| 65 to 69 Years | 140 (27.0%) | 0 (0.0%) |
| 70 to 74 Years | 0 (0.0%) | 0 (0.0%) |
| 75 to 79 Years | 44 (8.5%) | 8 (2.3%) |
| 80 to 84 Years | 8 (1.5%) | 7 (2.0%) |
| 85 Years and over | 0 (0.0%) | 0 (0.0%) |
| Total | 519 (100.0%) | 350 (100.0%) |
Families and Households in Indian Springs
Median Family Size in Indian Springs
The median family size in Indian Springs is 3.03 persons per family, with single male/father families (16 | 6.6%) accounting for the largest median family size of 3.44 persons per family. On the other hand, married-couple families (169 | 69.3%) represent the smallest median family size with 2.95 persons per family.
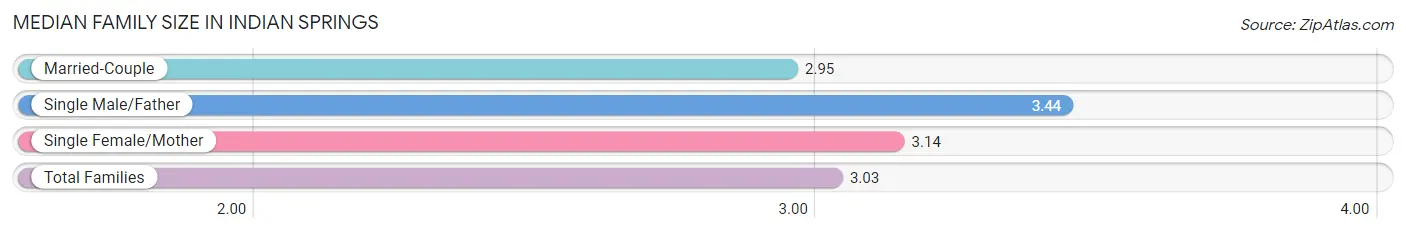
| Family Type | # Families | Family Size |
| Married-Couple | 169 (69.3%) | 2.95 |
| Single Male/Father | 16 (6.6%) | 3.44 |
| Single Female/Mother | 59 (24.2%) | 3.14 |
| Total Families | 244 (100.0%) | 3.03 |
Median Household Size in Indian Springs
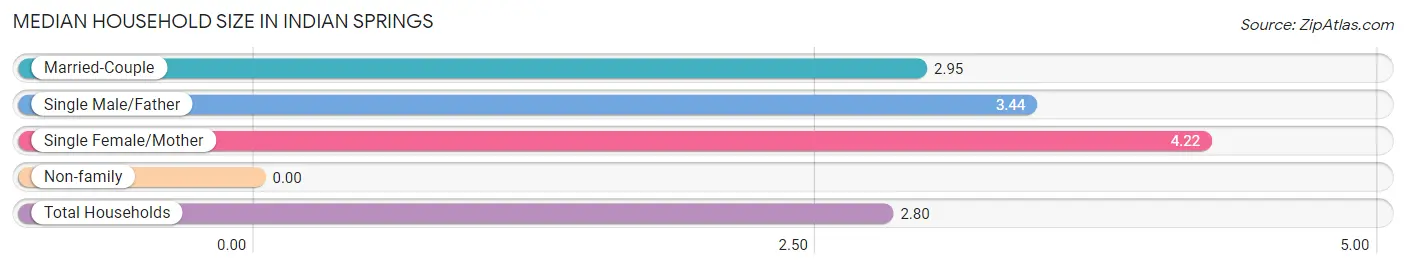
| Household Type | # Households | Household Size |
| Married-Couple | 169 (54.5%) | 2.95 |
| Single Male/Father | 16 (5.2%) | 3.44 |
| Single Female/Mother | 59 (19.0%) | 4.22 |
| Non-family | 66 (21.3%) | - |
| Total Households | 310 (100.0%) | 2.80 |
Household Size by Marriage Status in Indian Springs
Out of a total of 310 households in Indian Springs, 244 (78.7%) are family households, while 66 (21.3%) are nonfamily households. The most numerous type of family households are 2-person households, comprising 112, and the most common type of nonfamily households are 1-person households, comprising 66.
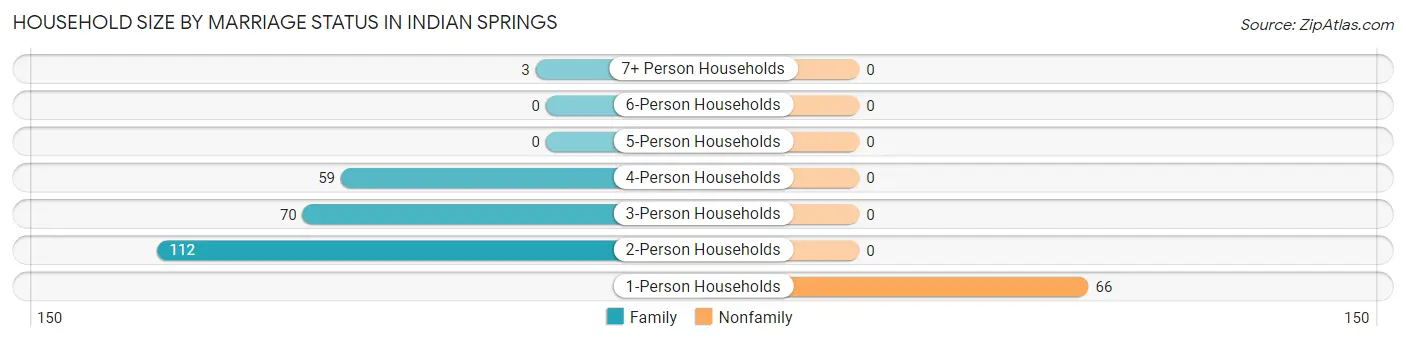
| Household Size | Family Households | Nonfamily Households |
| 1-Person Households | - | 66 (21.3%) |
| 2-Person Households | 112 (36.1%) | 0 (0.0%) |
| 3-Person Households | 70 (22.6%) | 0 (0.0%) |
| 4-Person Households | 59 (19.0%) | 0 (0.0%) |
| 5-Person Households | 0 (0.0%) | 0 (0.0%) |
| 6-Person Households | 0 (0.0%) | 0 (0.0%) |
| 7+ Person Households | 3 (1.0%) | 0 (0.0%) |
| Total | 244 (78.7%) | 66 (21.3%) |
Female Fertility in Indian Springs
Fertility by Age in Indian Springs
| Age Bracket | Women with Births | Births / 1,000 Women |
| 15 to 19 years | 0 (0.0%) | 0.0 |
| 20 to 34 years | 0 (0.0%) | 0.0 |
| 35 to 50 years | 0 (0.0%) | 0.0 |
| Total | 0 (0.0%) | 0.0 |
Fertility by Age by Marriage Status in Indian Springs
| Age Bracket | Married | Unmarried |
| 15 to 19 years | 0 (0.0%) | 0 (0.0%) |
| 20 to 34 years | 0 (0.0%) | 0 (0.0%) |
| 35 to 50 years | 0 (0.0%) | 0 (0.0%) |
| Total | 0 (0.0%) | 0 (0.0%) |
Fertility by Education in Indian Springs
| Educational Attainment | Women with Births | Births / 1,000 Women |
| Less than High School | 0 (0.0%) | 0.0 |
| High School Diploma | 0 (0.0%) | 0.0 |
| College or Associate's Degree | 0 (0.0%) | 0.0 |
| Bachelor's Degree | 0 (0.0%) | 0.0 |
| Graduate Degree | 0 (0.0%) | 0.0 |
| Total | 0 (0.0%) | 0.0 |
Fertility by Education by Marriage Status in Indian Springs
| Educational Attainment | Married | Unmarried |
| Less than High School | 0 (0.0%) | 0 (0.0%) |
| High School Diploma | 0 (0.0%) | 0 (0.0%) |
| College or Associate's Degree | 0 (0.0%) | 0 (0.0%) |
| Bachelor's Degree | 0 (0.0%) | 0 (0.0%) |
| Graduate Degree | 0 (0.0%) | 0 (0.0%) |
| Total | 0 (0.0%) | 0 (0.0%) |
Employment Characteristics in Indian Springs
Employment by Class of Employer in Indian Springs
Among the 349 employed individuals in Indian Springs, private company employees (240 | 68.8%), state government employees (41 | 11.7%), and federal government employees (40 | 11.5%) make up the most common classes of employment.
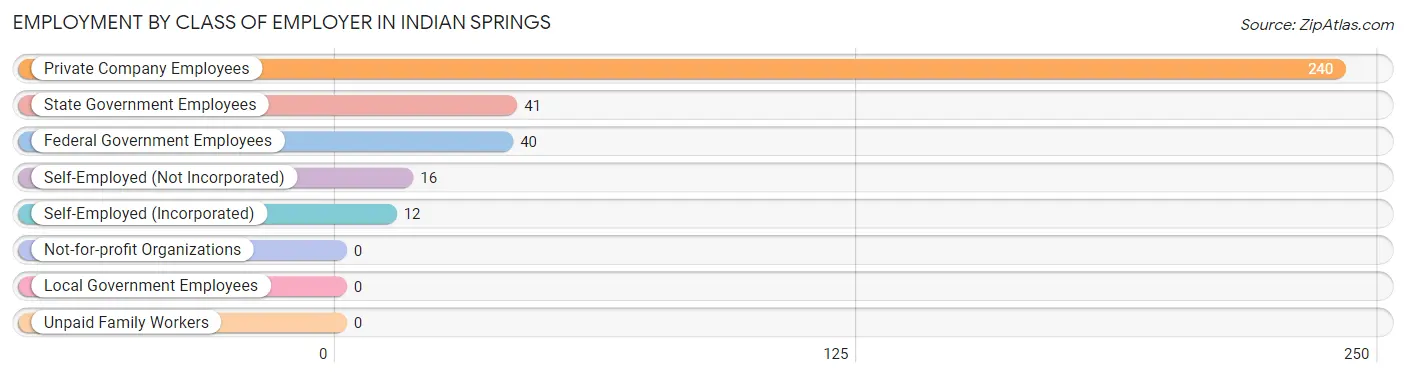
| Employer Class | # Employees | % Employees |
| Private Company Employees | 240 | 68.8% |
| Self-Employed (Incorporated) | 12 | 3.4% |
| Self-Employed (Not Incorporated) | 16 | 4.6% |
| Not-for-profit Organizations | 0 | 0.0% |
| Local Government Employees | 0 | 0.0% |
| State Government Employees | 41 | 11.7% |
| Federal Government Employees | 40 | 11.5% |
| Unpaid Family Workers | 0 | 0.0% |
| Total | 349 | 100.0% |
Employment Status by Age in Indian Springs
According to the labor force statistics for Indian Springs, out of the total population over 16 years of age (846), 41.5% or 351 individuals are in the labor force, with 0.3% or 1 of them unemployed. The age group with the highest labor force participation rate is 30 to 34 years, with 100.0% or 12 individuals in the labor force. Within the labor force, the 20 to 24 years age range has the highest percentage of unemployed individuals, with 50.0% or 1 of them being unemployed.
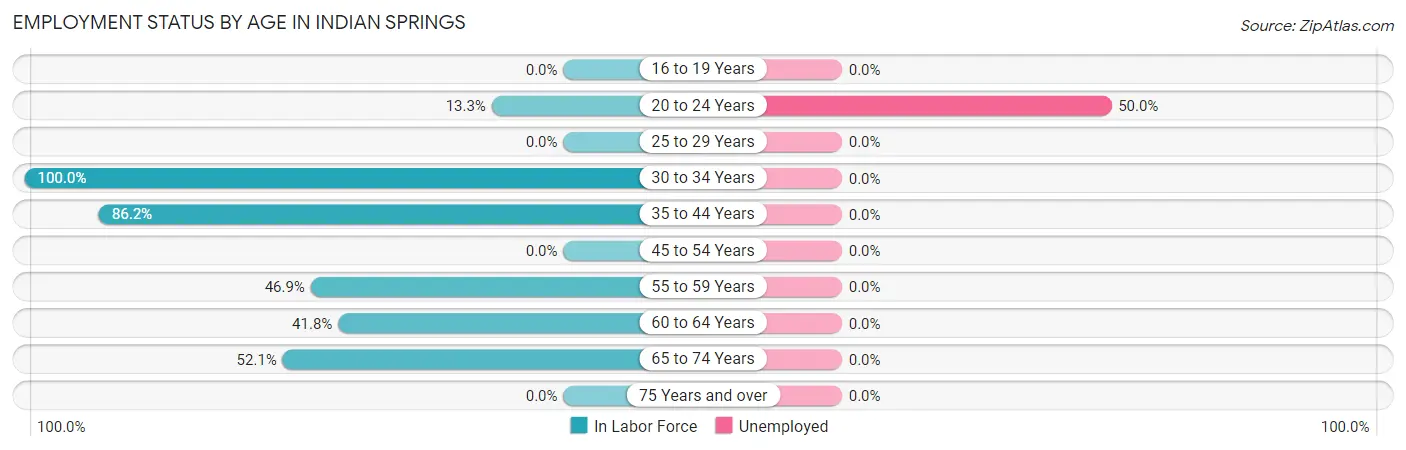
| Age Bracket | In Labor Force | Unemployed |
| 16 to 19 Years | 0 (0.0%) | 0 (0.0%) |
| 20 to 24 Years | 2 (13.3%) | 1 (50.0%) |
| 25 to 29 Years | 0 (0.0%) | 0 (0.0%) |
| 30 to 34 Years | 12 (100.0%) | 0 (0.0%) |
| 35 to 44 Years | 94 (86.2%) | 0 (0.0%) |
| 45 to 54 Years | 0 (0.0%) | 0 (0.0%) |
| 55 to 59 Years | 83 (46.9%) | 0 (0.0%) |
| 60 to 64 Years | 87 (41.8%) | 0 (0.0%) |
| 65 to 74 Years | 73 (52.1%) | 0 (0.0%) |
| 75 Years and over | 0 (0.0%) | 0 (0.0%) |
| Total | 351 (41.5%) | 1 (0.3%) |
Employment Status by Educational Attainment in Indian Springs
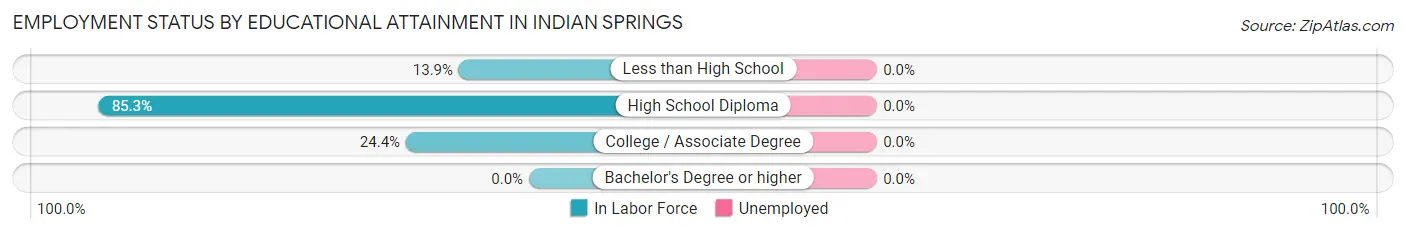
| Educational Attainment | In Labor Force | Unemployed |
| Less than High School | 19 (13.9%) | 0 (0.0%) |
| High School Diploma | 214 (85.3%) | 0 (0.0%) |
| College / Associate Degree | 43 (24.4%) | 0 (0.0%) |
| Bachelor's Degree or higher | 0 (0.0%) | 0 (0.0%) |
| Total | 276 (45.7%) | 0 (0.0%) |
Employment Occupations by Sex in Indian Springs
Management, Business, Science and Arts Occupations
The most common Management, Business, Science and Arts occupations in Indian Springs are Management (34 | 9.7%), Computers, Engineering & Science (1 | 0.3%), and Computers & Mathematics (1 | 0.3%).
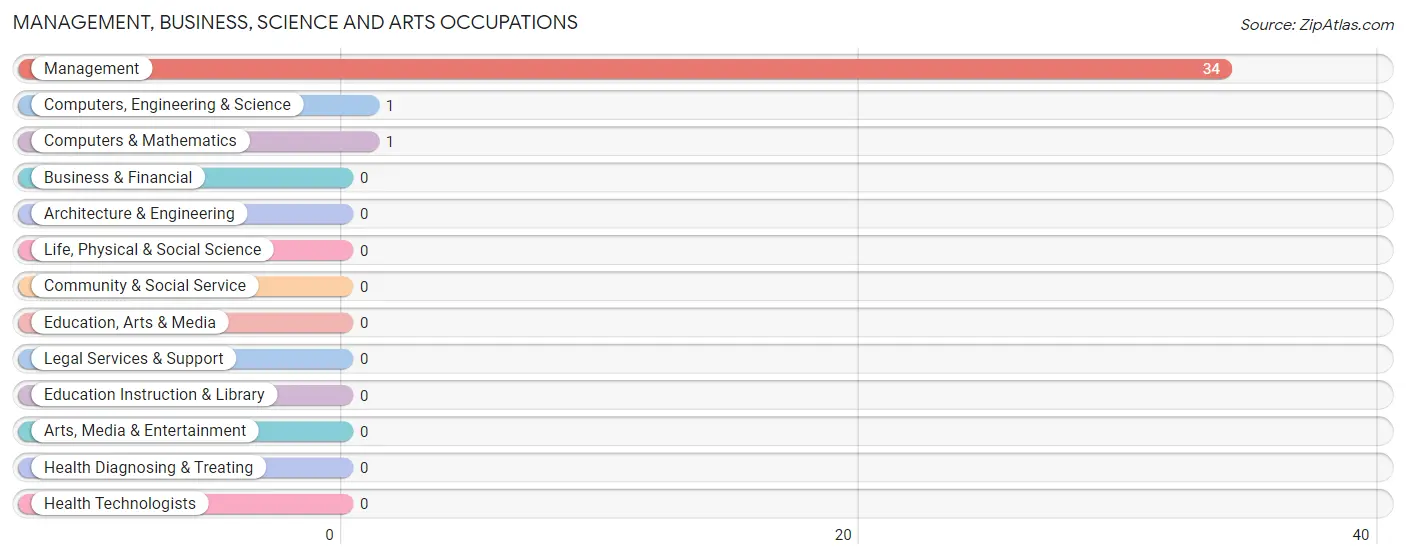
Management, Business, Science and Arts Occupations by Sex
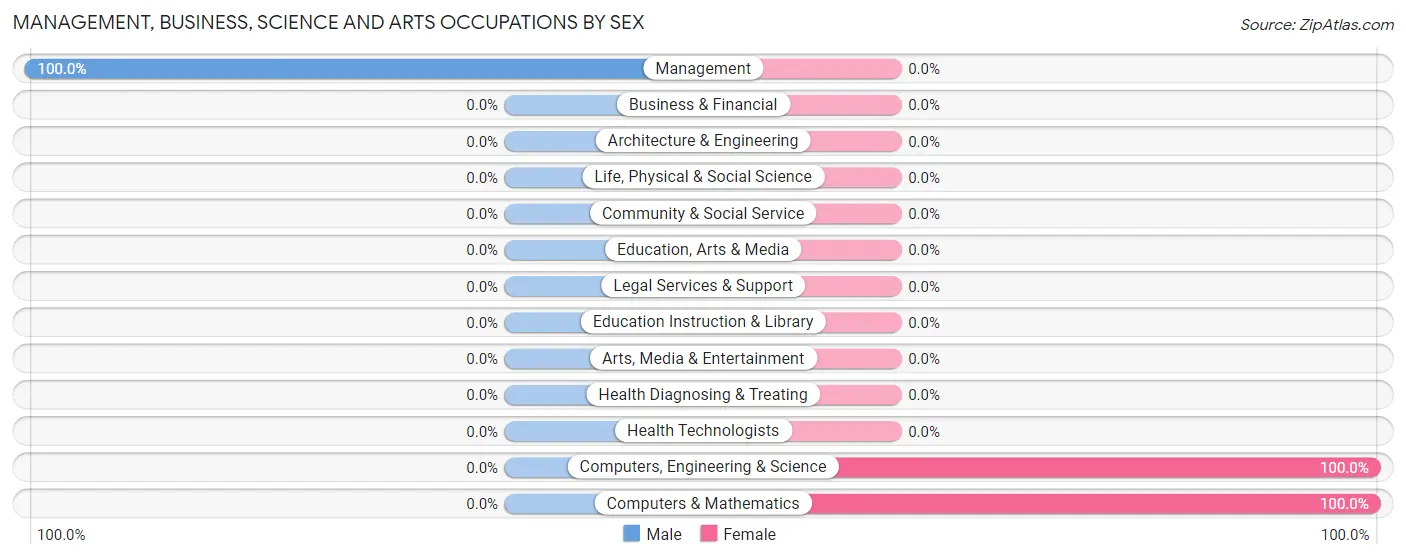
| Occupation | Male | Female |
| Management | 34 (100.0%) | 0 (0.0%) |
| Business & Financial | 0 (0.0%) | 0 (0.0%) |
| Computers, Engineering & Science | 0 (0.0%) | 1 (100.0%) |
| Computers & Mathematics | 0 (0.0%) | 1 (100.0%) |
| Architecture & Engineering | 0 (0.0%) | 0 (0.0%) |
| Life, Physical & Social Science | 0 (0.0%) | 0 (0.0%) |
| Community & Social Service | 0 (0.0%) | 0 (0.0%) |
| Education, Arts & Media | 0 (0.0%) | 0 (0.0%) |
| Legal Services & Support | 0 (0.0%) | 0 (0.0%) |
| Education Instruction & Library | 0 (0.0%) | 0 (0.0%) |
| Arts, Media & Entertainment | 0 (0.0%) | 0 (0.0%) |
| Health Diagnosing & Treating | 0 (0.0%) | 0 (0.0%) |
| Health Technologists | 0 (0.0%) | 0 (0.0%) |
| Total (Category) | 34 (97.1%) | 1 (2.9%) |
| Total (Overall) | 318 (90.9%) | 32 (9.1%) |
Services Occupations
The most common Services occupations in Indian Springs are Security & Protection (19 | 5.4%), and Law Enforcement (19 | 5.4%).
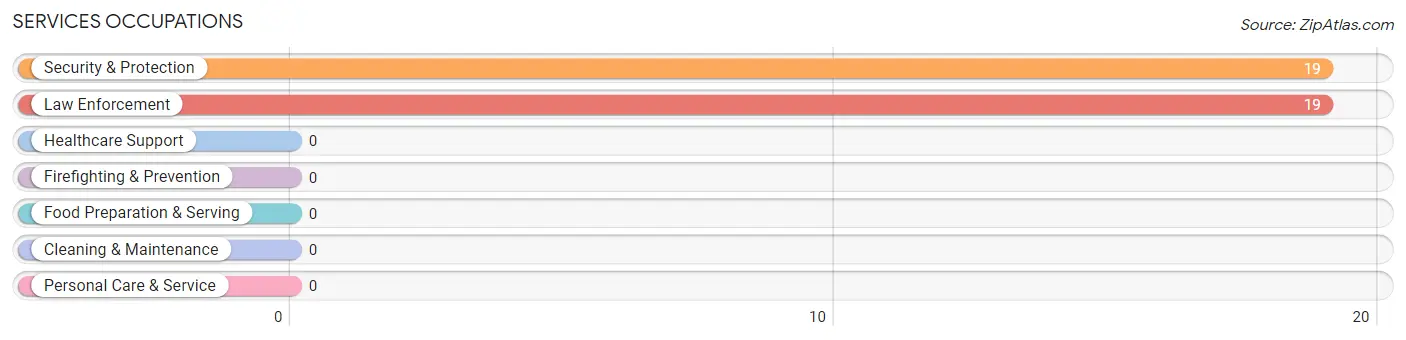
Services Occupations by Sex
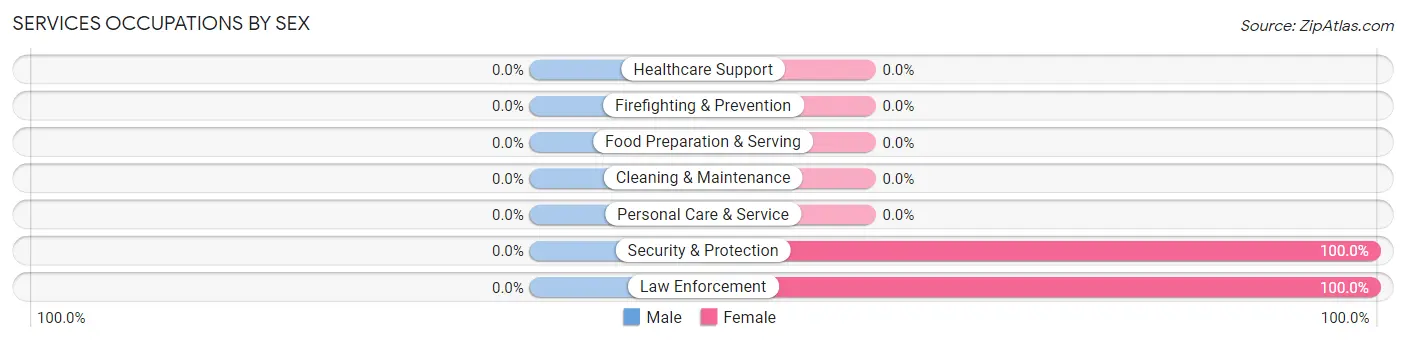
| Occupation | Male | Female |
| Healthcare Support | 0 (0.0%) | 0 (0.0%) |
| Security & Protection | 0 (0.0%) | 19 (100.0%) |
| Firefighting & Prevention | 0 (0.0%) | 0 (0.0%) |
| Law Enforcement | 0 (0.0%) | 19 (100.0%) |
| Food Preparation & Serving | 0 (0.0%) | 0 (0.0%) |
| Cleaning & Maintenance | 0 (0.0%) | 0 (0.0%) |
| Personal Care & Service | 0 (0.0%) | 0 (0.0%) |
| Total (Category) | 0 (0.0%) | 19 (100.0%) |
| Total (Overall) | 318 (90.9%) | 32 (9.1%) |
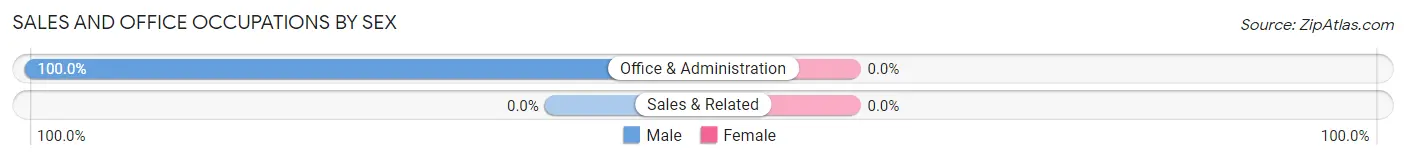
Sales and Office Occupations
The most common Sales and Office occupations in Indian Springs are , and Office & Administration (40 | 11.4%).
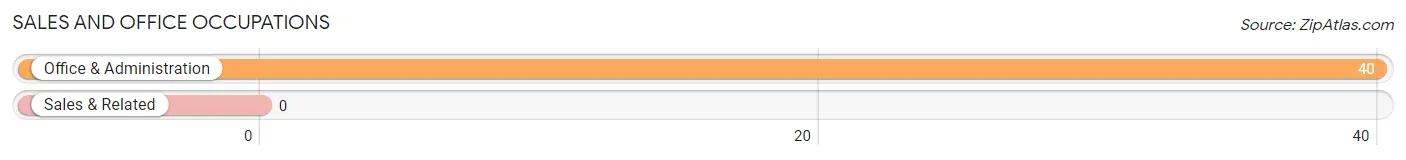
Sales and Office Occupations by Sex
| Occupation | Male | Female |
| Sales & Related | 0 (0.0%) | 0 (0.0%) |
| Office & Administration | 40 (100.0%) | 0 (0.0%) |
| Total (Category) | 40 (100.0%) | 0 (0.0%) |
| Total (Overall) | 318 (90.9%) | 32 (9.1%) |
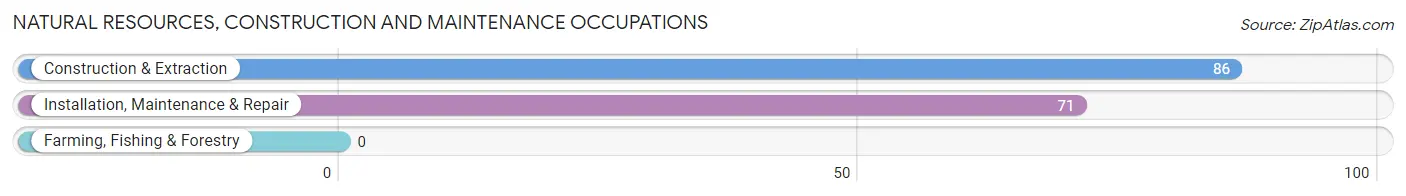
Natural Resources, Construction and Maintenance Occupations
The most common Natural Resources, Construction and Maintenance occupations in Indian Springs are Construction & Extraction (86 | 24.6%), and Installation, Maintenance & Repair (71 | 20.3%).
Natural Resources, Construction and Maintenance Occupations by Sex
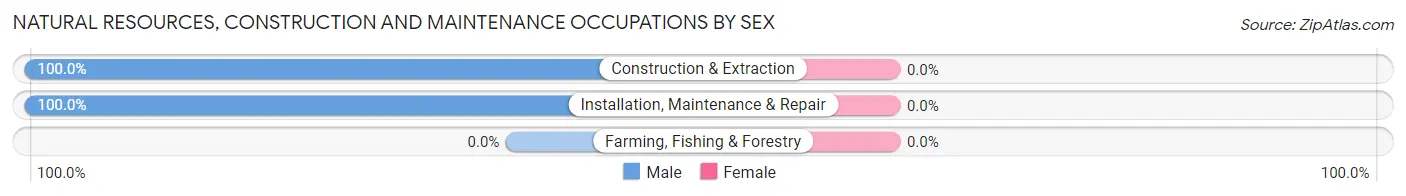
| Occupation | Male | Female |
| Farming, Fishing & Forestry | 0 (0.0%) | 0 (0.0%) |
| Construction & Extraction | 86 (100.0%) | 0 (0.0%) |
| Installation, Maintenance & Repair | 71 (100.0%) | 0 (0.0%) |
| Total (Category) | 157 (100.0%) | 0 (0.0%) |
| Total (Overall) | 318 (90.9%) | 32 (9.1%) |
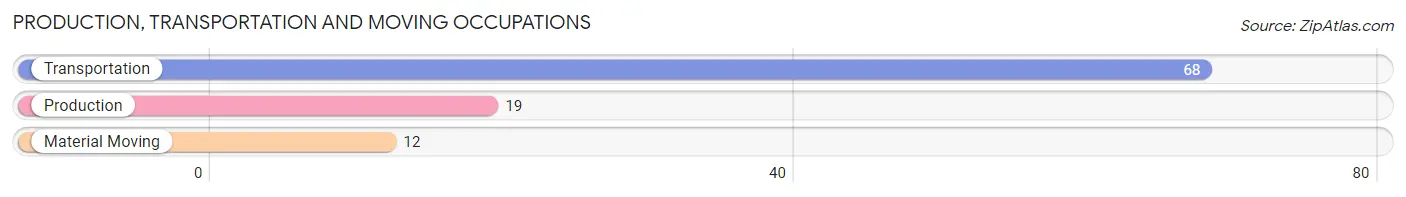
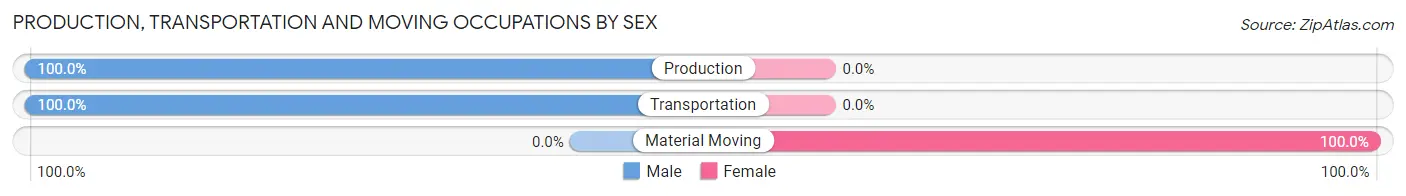
Production, Transportation and Moving Occupations
The most common Production, Transportation and Moving occupations in Indian Springs are Transportation (68 | 19.4%), Production (19 | 5.4%), and Material Moving (12 | 3.4%).
Production, Transportation and Moving Occupations by Sex
| Occupation | Male | Female |
| Production | 19 (100.0%) | 0 (0.0%) |
| Transportation | 68 (100.0%) | 0 (0.0%) |
| Material Moving | 0 (0.0%) | 12 (100.0%) |
| Total (Category) | 87 (87.9%) | 12 (12.1%) |
| Total (Overall) | 318 (90.9%) | 32 (9.1%) |
Employment Industries by Sex in Indian Springs
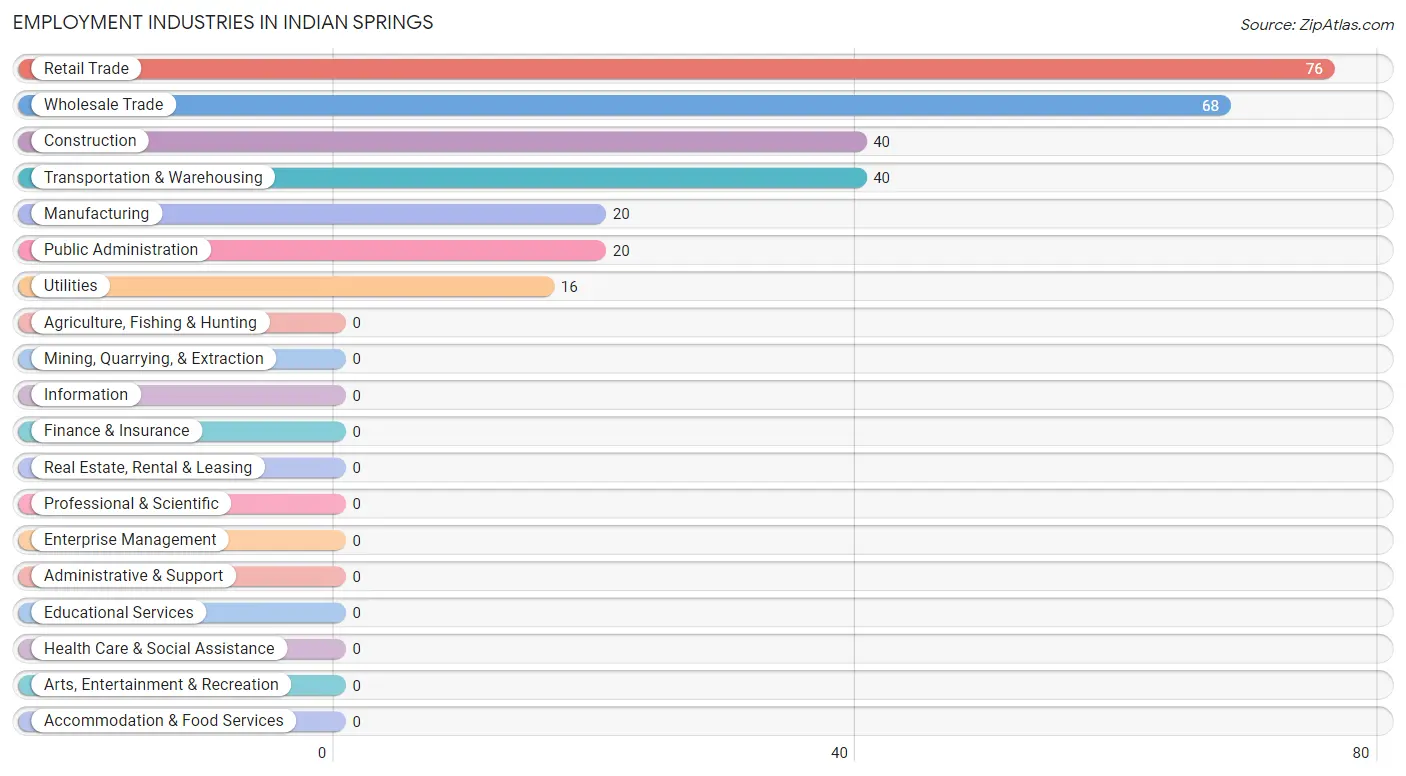
Employment Industries in Indian Springs
The major employment industries in Indian Springs include Retail Trade (76 | 21.7%), Wholesale Trade (68 | 19.4%), Construction (40 | 11.4%), Transportation & Warehousing (40 | 11.4%), and Manufacturing (20 | 5.7%).
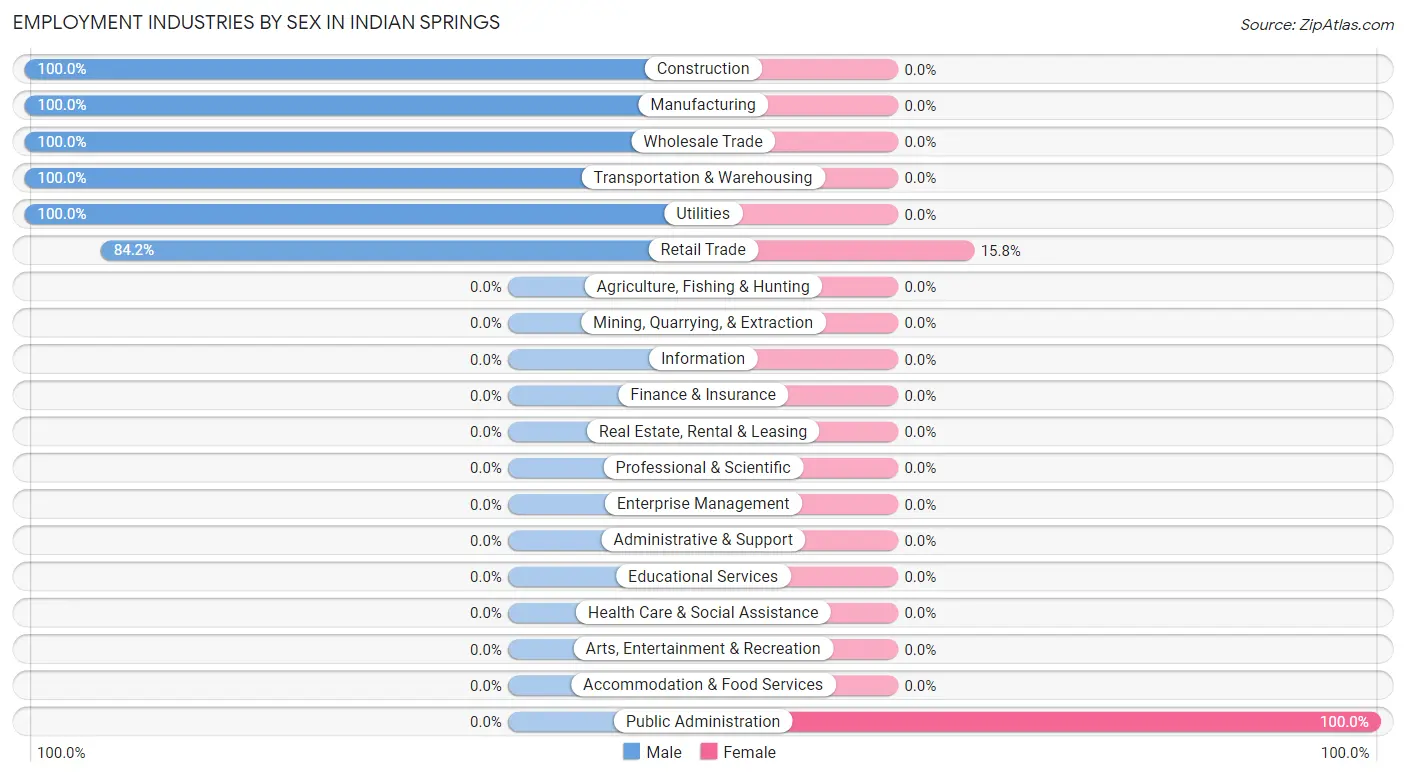
Employment Industries by Sex in Indian Springs
The Indian Springs industries that see more men than women are Construction (100.0%), Manufacturing (100.0%), and Wholesale Trade (100.0%), whereas the industries that tend to have a higher number of women are Public Administration (100.0%), and Retail Trade (15.8%).
| Industry | Male | Female |
| Agriculture, Fishing & Hunting | 0 (0.0%) | 0 (0.0%) |
| Mining, Quarrying, & Extraction | 0 (0.0%) | 0 (0.0%) |
| Construction | 40 (100.0%) | 0 (0.0%) |
| Manufacturing | 20 (100.0%) | 0 (0.0%) |
| Wholesale Trade | 68 (100.0%) | 0 (0.0%) |
| Retail Trade | 64 (84.2%) | 12 (15.8%) |
| Transportation & Warehousing | 40 (100.0%) | 0 (0.0%) |
| Utilities | 16 (100.0%) | 0 (0.0%) |
| Information | 0 (0.0%) | 0 (0.0%) |
| Finance & Insurance | 0 (0.0%) | 0 (0.0%) |
| Real Estate, Rental & Leasing | 0 (0.0%) | 0 (0.0%) |
| Professional & Scientific | 0 (0.0%) | 0 (0.0%) |
| Enterprise Management | 0 (0.0%) | 0 (0.0%) |
| Administrative & Support | 0 (0.0%) | 0 (0.0%) |
| Educational Services | 0 (0.0%) | 0 (0.0%) |
| Health Care & Social Assistance | 0 (0.0%) | 0 (0.0%) |
| Arts, Entertainment & Recreation | 0 (0.0%) | 0 (0.0%) |
| Accommodation & Food Services | 0 (0.0%) | 0 (0.0%) |
| Public Administration | 0 (0.0%) | 20 (100.0%) |
| Total | 318 (90.9%) | 32 (9.1%) |
Education in Indian Springs
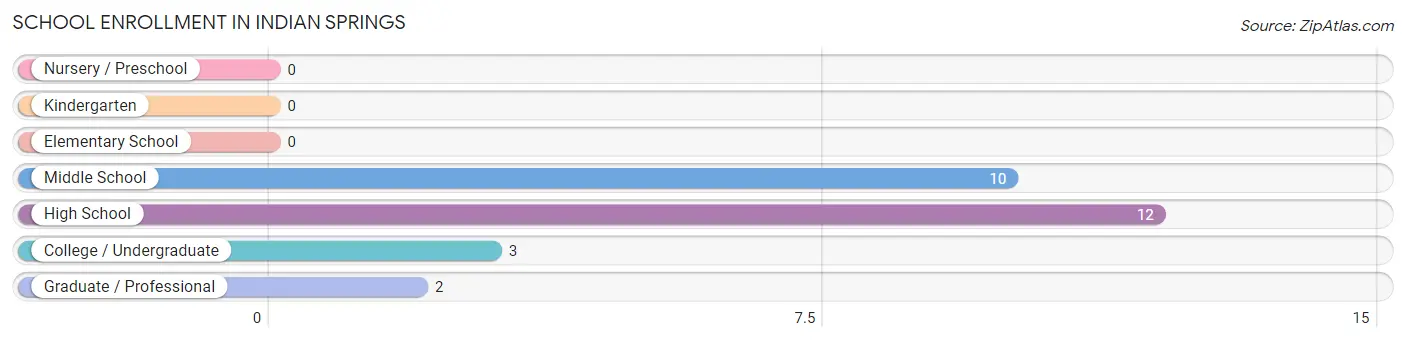
School Enrollment in Indian Springs
The most common levels of schooling among the 27 students in Indian Springs are high school (12 | 44.4%), middle school (10 | 37.0%), and college / undergraduate (3 | 11.1%).
| School Level | # Students | % Students |
| Nursery / Preschool | 0 | 0.0% |
| Kindergarten | 0 | 0.0% |
| Elementary School | 0 | 0.0% |
| Middle School | 10 | 37.0% |
| High School | 12 | 44.4% |
| College / Undergraduate | 3 | 11.1% |
| Graduate / Professional | 2 | 7.4% |
| Total | 27 | 100.0% |
School Enrollment by Age by Funding Source in Indian Springs
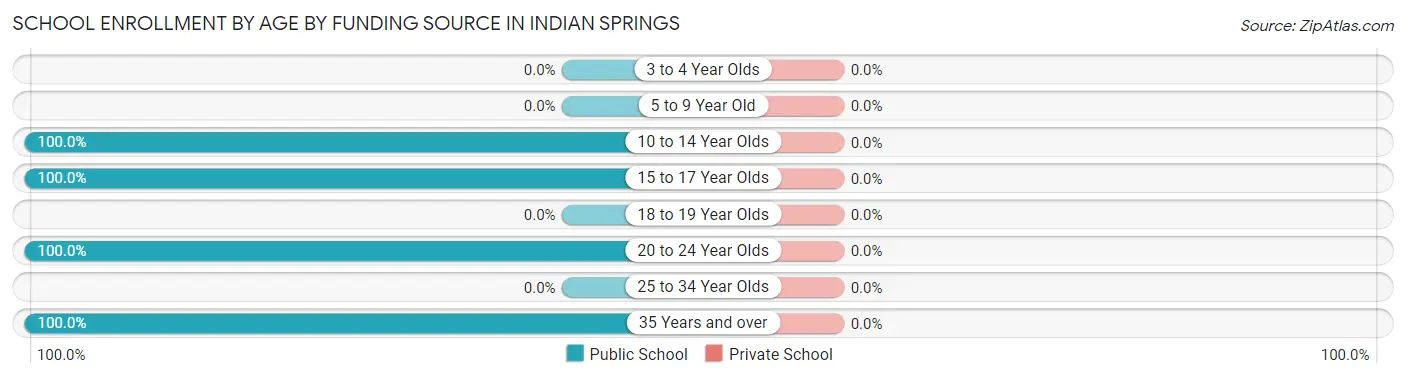
| Age Bracket | Public School | Private School |
| 3 to 4 Year Olds | 0 (0.0%) | 0 (0.0%) |
| 5 to 9 Year Old | 0 (0.0%) | 0 (0.0%) |
| 10 to 14 Year Olds | 10 (100.0%) | 0 (0.0%) |
| 15 to 17 Year Olds | 12 (100.0%) | 0 (0.0%) |
| 18 to 19 Year Olds | 0 (0.0%) | 0 (0.0%) |
| 20 to 24 Year Olds | 3 (100.0%) | 0 (0.0%) |
| 25 to 34 Year Olds | 0 (0.0%) | 0 (0.0%) |
| 35 Years and over | 2 (100.0%) | 0 (0.0%) |
| Total | 27 (100.0%) | 0 (0.0%) |
Educational Attainment by Field of Study in Indian Springs
Computers & mathematics (20 | 40.0%), psychology (18 | 36.0%), business (8 | 16.0%), science & technology (2 | 4.0%), and education (2 | 4.0%) are the most common fields of study among 50 individuals in Indian Springs who have obtained a bachelor's degree or higher.
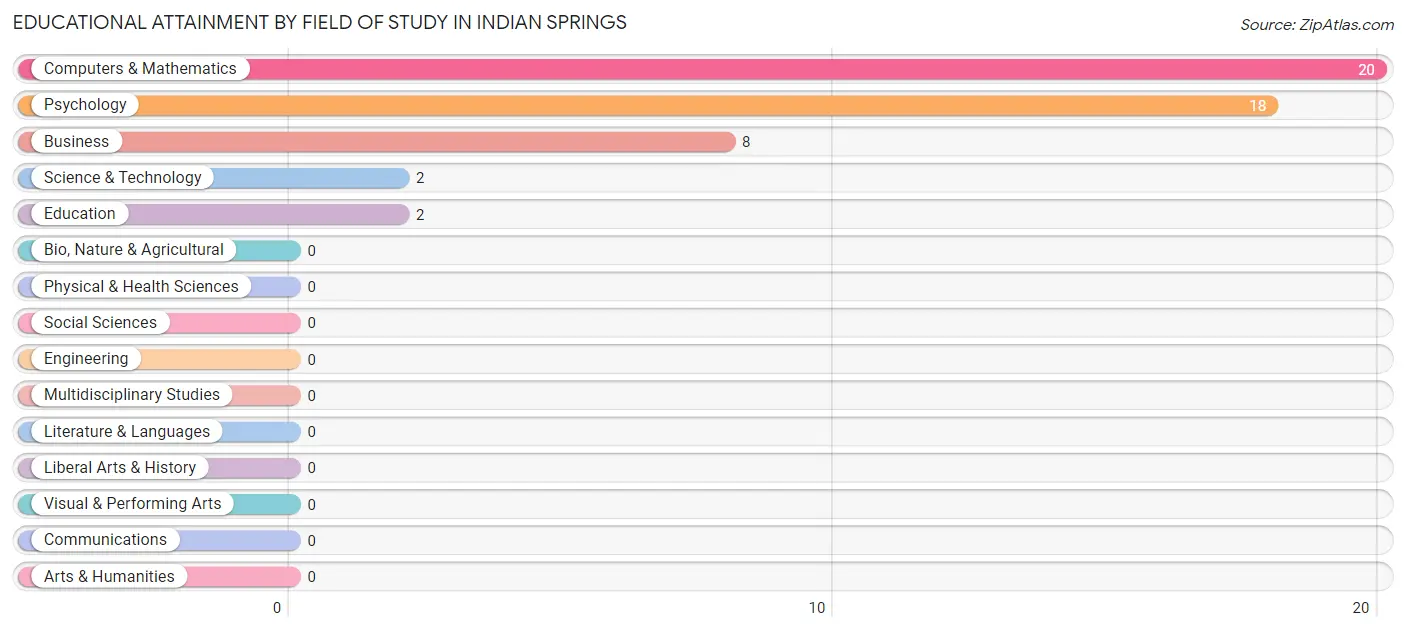
| Field of Study | # Graduates | % Graduates |
| Computers & Mathematics | 20 | 40.0% |
| Bio, Nature & Agricultural | 0 | 0.0% |
| Physical & Health Sciences | 0 | 0.0% |
| Psychology | 18 | 36.0% |
| Social Sciences | 0 | 0.0% |
| Engineering | 0 | 0.0% |
| Multidisciplinary Studies | 0 | 0.0% |
| Science & Technology | 2 | 4.0% |
| Business | 8 | 16.0% |
| Education | 2 | 4.0% |
| Literature & Languages | 0 | 0.0% |
| Liberal Arts & History | 0 | 0.0% |
| Visual & Performing Arts | 0 | 0.0% |
| Communications | 0 | 0.0% |
| Arts & Humanities | 0 | 0.0% |
| Total | 50 | 100.0% |
Transportation & Commute in Indian Springs
Vehicle Availability by Sex in Indian Springs
The most prevalent vehicle ownership categories in Indian Springs are males with 2 vehicles (276, accounting for 87.1%) and females with 2 vehicles (0, making up 862.5%).
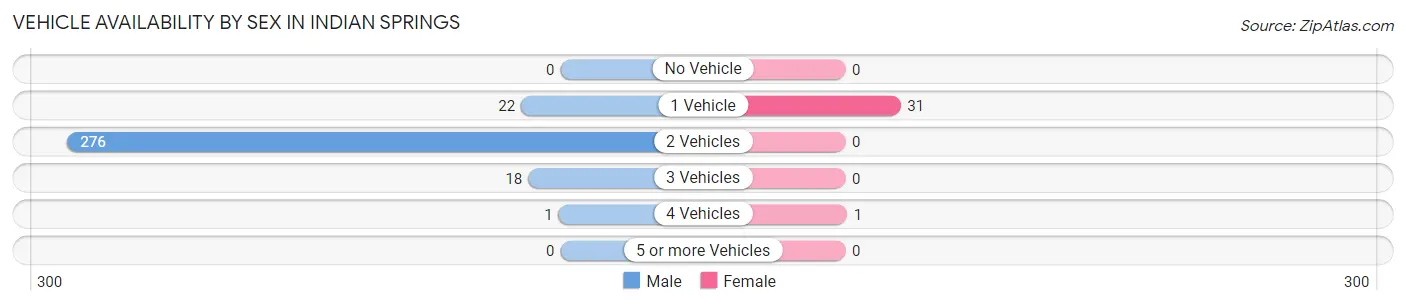
| Vehicles Available | Male | Female |
| No Vehicle | 0 (0.0%) | 0 (0.0%) |
| 1 Vehicle | 22 (6.9%) | 31 (96.9%) |
| 2 Vehicles | 276 (87.1%) | 0 (0.0%) |
| 3 Vehicles | 18 (5.7%) | 0 (0.0%) |
| 4 Vehicles | 1 (0.3%) | 1 (3.1%) |
| 5 or more Vehicles | 0 (0.0%) | 0 (0.0%) |
| Total | 317 (100.0%) | 32 (100.0%) |
Commute Time in Indian Springs
The most frequently occuring commute durations in Indian Springs are 30 to 34 minutes (156 commuters, 44.7%), 15 to 19 minutes (87 commuters, 24.9%), and 60 to 89 minutes (40 commuters, 11.5%).
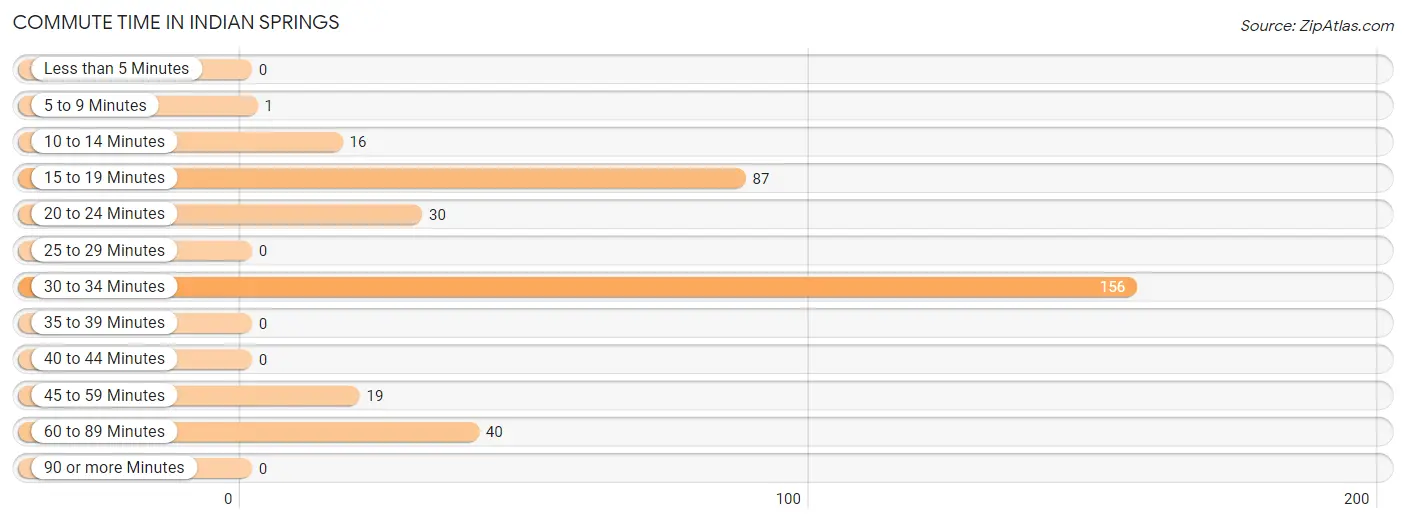
| Commute Time | # Commuters | % Commuters |
| Less than 5 Minutes | 0 | 0.0% |
| 5 to 9 Minutes | 1 | 0.3% |
| 10 to 14 Minutes | 16 | 4.6% |
| 15 to 19 Minutes | 87 | 24.9% |
| 20 to 24 Minutes | 30 | 8.6% |
| 25 to 29 Minutes | 0 | 0.0% |
| 30 to 34 Minutes | 156 | 44.7% |
| 35 to 39 Minutes | 0 | 0.0% |
| 40 to 44 Minutes | 0 | 0.0% |
| 45 to 59 Minutes | 19 | 5.4% |
| 60 to 89 Minutes | 40 | 11.5% |
| 90 or more Minutes | 0 | 0.0% |
Commute Time by Sex in Indian Springs
The most common commute times in Indian Springs are 30 to 34 minutes (156 commuters, 49.2%) for males and 45 to 59 minutes (19 commuters, 59.4%) for females.
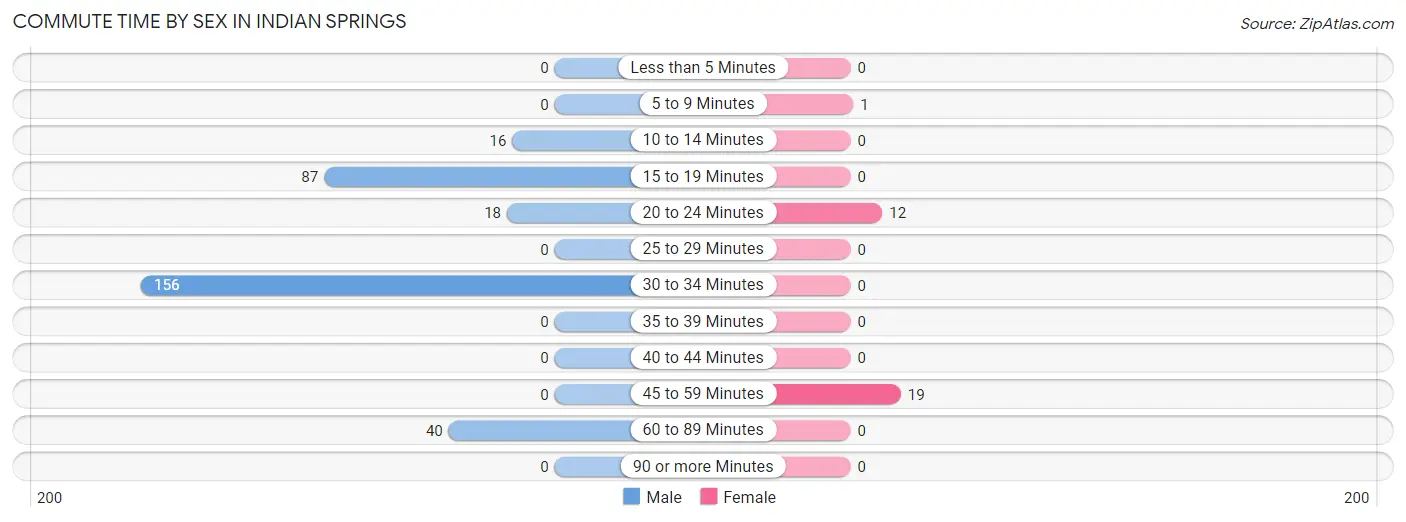
| Commute Time | Male | Female |
| Less than 5 Minutes | 0 (0.0%) | 0 (0.0%) |
| 5 to 9 Minutes | 0 (0.0%) | 1 (3.1%) |
| 10 to 14 Minutes | 16 (5.1%) | 0 (0.0%) |
| 15 to 19 Minutes | 87 (27.4%) | 0 (0.0%) |
| 20 to 24 Minutes | 18 (5.7%) | 12 (37.5%) |
| 25 to 29 Minutes | 0 (0.0%) | 0 (0.0%) |
| 30 to 34 Minutes | 156 (49.2%) | 0 (0.0%) |
| 35 to 39 Minutes | 0 (0.0%) | 0 (0.0%) |
| 40 to 44 Minutes | 0 (0.0%) | 0 (0.0%) |
| 45 to 59 Minutes | 0 (0.0%) | 19 (59.4%) |
| 60 to 89 Minutes | 40 (12.6%) | 0 (0.0%) |
| 90 or more Minutes | 0 (0.0%) | 0 (0.0%) |
Time of Departure to Work by Sex in Indian Springs
The most frequent times of departure to work in Indian Springs are 7:30 AM to 7:59 AM (173, 54.6%) for males and 12:00 AM to 4:59 AM (19, 59.4%) for females.
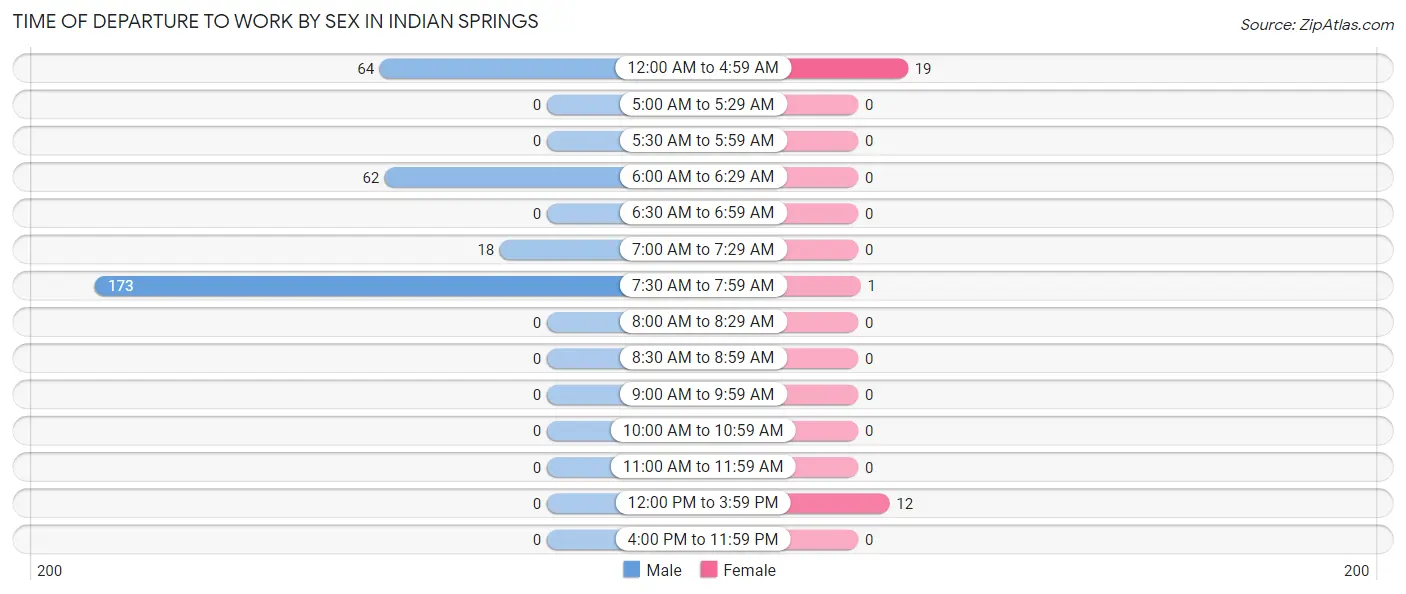
| Time of Departure | Male | Female |
| 12:00 AM to 4:59 AM | 64 (20.2%) | 19 (59.4%) |
| 5:00 AM to 5:29 AM | 0 (0.0%) | 0 (0.0%) |
| 5:30 AM to 5:59 AM | 0 (0.0%) | 0 (0.0%) |
| 6:00 AM to 6:29 AM | 62 (19.6%) | 0 (0.0%) |
| 6:30 AM to 6:59 AM | 0 (0.0%) | 0 (0.0%) |
| 7:00 AM to 7:29 AM | 18 (5.7%) | 0 (0.0%) |
| 7:30 AM to 7:59 AM | 173 (54.6%) | 1 (3.1%) |
| 8:00 AM to 8:29 AM | 0 (0.0%) | 0 (0.0%) |
| 8:30 AM to 8:59 AM | 0 (0.0%) | 0 (0.0%) |
| 9:00 AM to 9:59 AM | 0 (0.0%) | 0 (0.0%) |
| 10:00 AM to 10:59 AM | 0 (0.0%) | 0 (0.0%) |
| 11:00 AM to 11:59 AM | 0 (0.0%) | 0 (0.0%) |
| 12:00 PM to 3:59 PM | 0 (0.0%) | 12 (37.5%) |
| 4:00 PM to 11:59 PM | 0 (0.0%) | 0 (0.0%) |
| Total | 317 (100.0%) | 32 (100.0%) |
Housing Occupancy in Indian Springs
Occupancy by Ownership in Indian Springs
Of the total 310 dwellings in Indian Springs, owner-occupied units account for 299 (96.5%), while renter-occupied units make up 11 (3.5%).
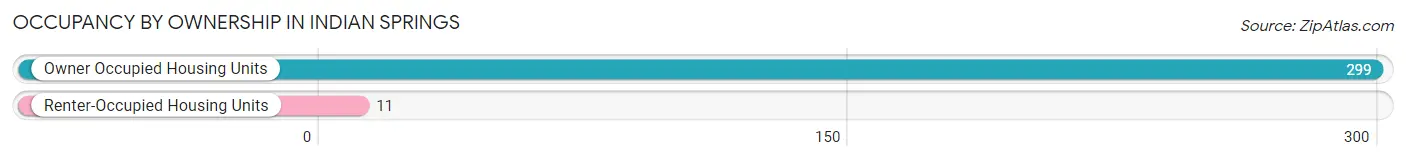
| Occupancy | # Housing Units | % Housing Units |
| Owner Occupied Housing Units | 299 | 96.5% |
| Renter-Occupied Housing Units | 11 | 3.5% |
| Total Occupied Housing Units | 310 | 100.0% |
Occupancy by Household Size in Indian Springs
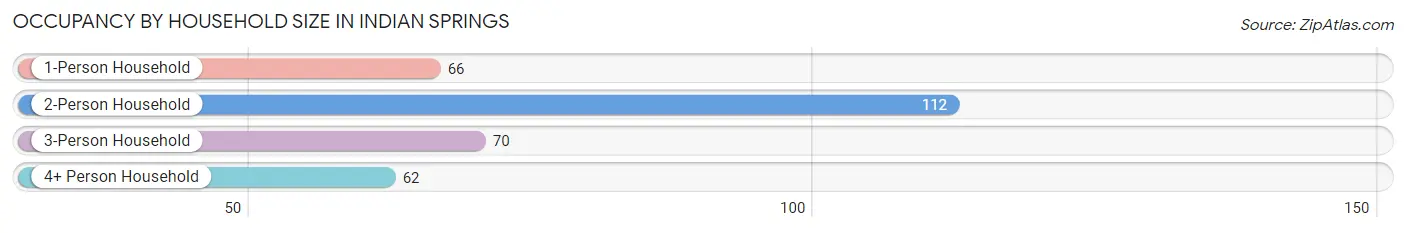
| Household Size | # Housing Units | % Housing Units |
| 1-Person Household | 66 | 21.3% |
| 2-Person Household | 112 | 36.1% |
| 3-Person Household | 70 | 22.6% |
| 4+ Person Household | 62 | 20.0% |
| Total Housing Units | 310 | 100.0% |
Occupancy by Ownership by Household Size in Indian Springs
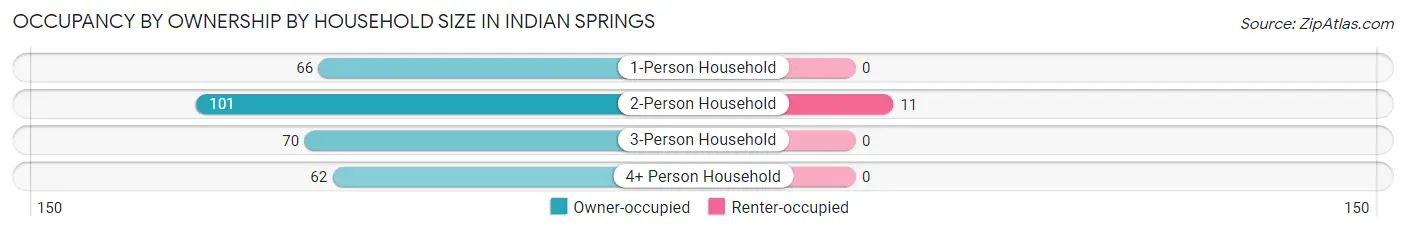
| Household Size | Owner-occupied | Renter-occupied |
| 1-Person Household | 66 (100.0%) | 0 (0.0%) |
| 2-Person Household | 101 (90.2%) | 11 (9.8%) |
| 3-Person Household | 70 (100.0%) | 0 (0.0%) |
| 4+ Person Household | 62 (100.0%) | 0 (0.0%) |
| Total Housing Units | 299 (96.5%) | 11 (3.5%) |
Occupancy by Educational Attainment in Indian Springs
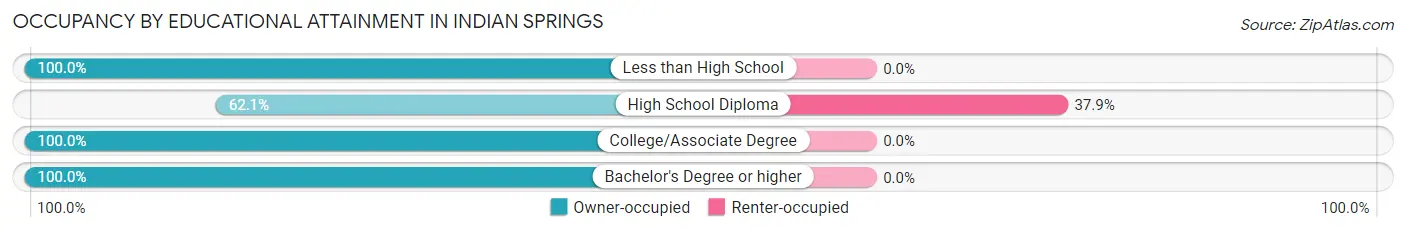
| Household Size | Owner-occupied | Renter-occupied |
| Less than High School | 114 (100.0%) | 0 (0.0%) |
| High School Diploma | 18 (62.1%) | 11 (37.9%) |
| College/Associate Degree | 157 (100.0%) | 0 (0.0%) |
| Bachelor's Degree or higher | 10 (100.0%) | 0 (0.0%) |
Occupancy by Age of Householder in Indian Springs
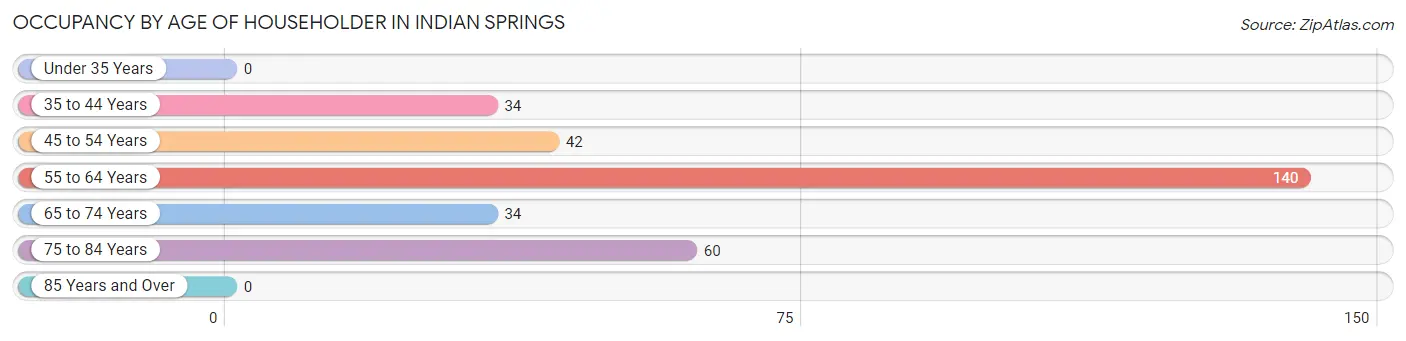
| Age Bracket | # Households | % Households |
| Under 35 Years | 0 | 0.0% |
| 35 to 44 Years | 34 | 11.0% |
| 45 to 54 Years | 42 | 13.6% |
| 55 to 64 Years | 140 | 45.2% |
| 65 to 74 Years | 34 | 11.0% |
| 75 to 84 Years | 60 | 19.4% |
| 85 Years and Over | 0 | 0.0% |
| Total | 310 | 100.0% |
Housing Finances in Indian Springs
Median Income by Occupancy in Indian Springs
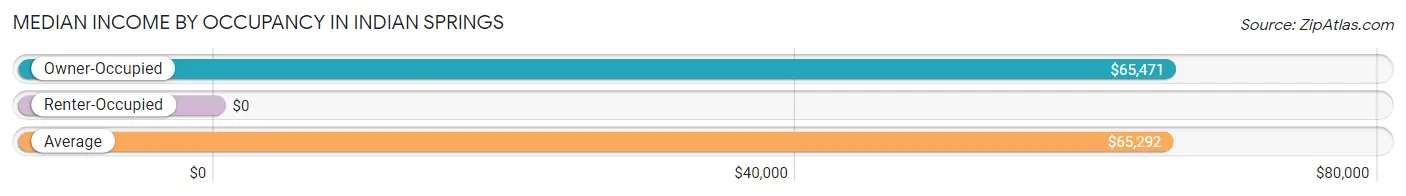
| Occupancy Type | # Households | Median Income |
| Owner-Occupied | 299 (96.5%) | $65,471 |
| Renter-Occupied | 11 (3.5%) | $0 |
| Average | 310 (100.0%) | $65,292 |
Occupancy by Householder Income Bracket in Indian Springs
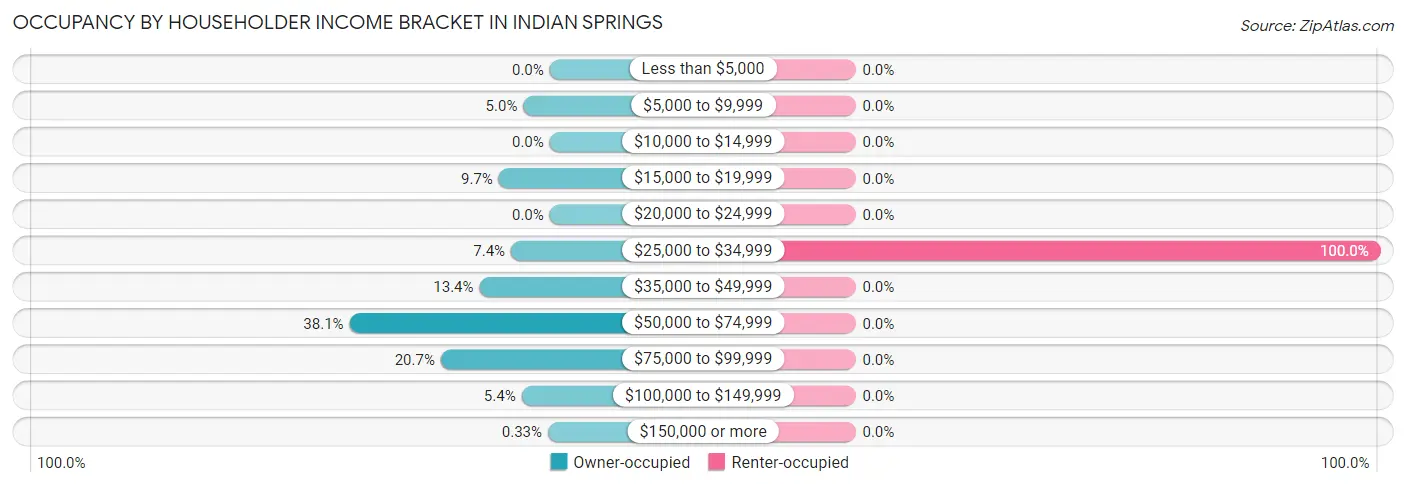
| Income Bracket | Owner-occupied | Renter-occupied |
| Less than $5,000 | 0 (0.0%) | 0 (0.0%) |
| $5,000 to $9,999 | 15 (5.0%) | 0 (0.0%) |
| $10,000 to $14,999 | 0 (0.0%) | 0 (0.0%) |
| $15,000 to $19,999 | 29 (9.7%) | 0 (0.0%) |
| $20,000 to $24,999 | 0 (0.0%) | 0 (0.0%) |
| $25,000 to $34,999 | 22 (7.4%) | 11 (100.0%) |
| $35,000 to $49,999 | 40 (13.4%) | 0 (0.0%) |
| $50,000 to $74,999 | 114 (38.1%) | 0 (0.0%) |
| $75,000 to $99,999 | 62 (20.7%) | 0 (0.0%) |
| $100,000 to $149,999 | 16 (5.3%) | 0 (0.0%) |
| $150,000 or more | 1 (0.3%) | 0 (0.0%) |
| Total | 299 (100.0%) | 11 (100.0%) |
Monthly Housing Cost Tiers in Indian Springs
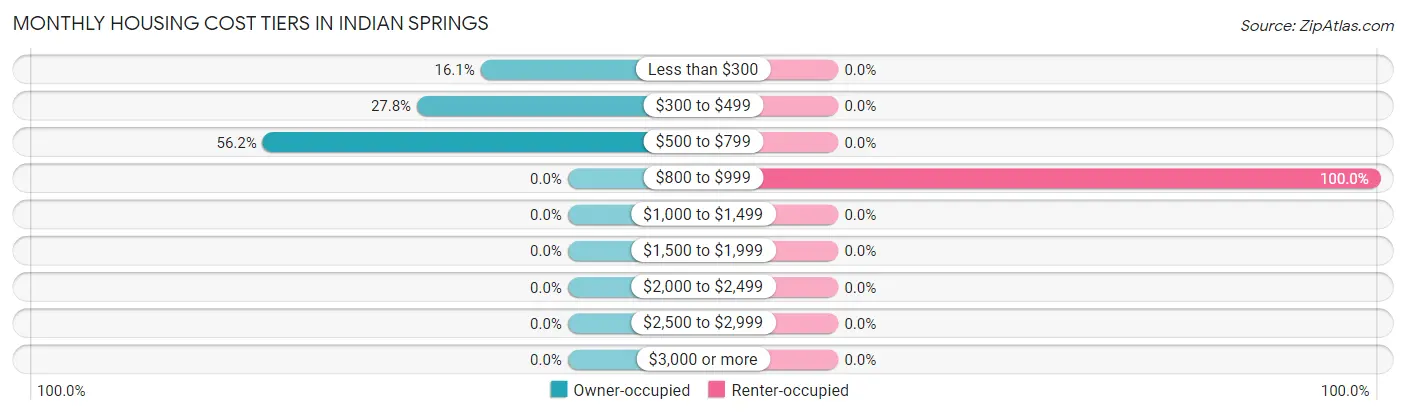
| Monthly Cost | Owner-occupied | Renter-occupied |
| Less than $300 | 48 (16.1%) | 0 (0.0%) |
| $300 to $499 | 83 (27.8%) | 0 (0.0%) |
| $500 to $799 | 168 (56.2%) | 0 (0.0%) |
| $800 to $999 | 0 (0.0%) | 11 (100.0%) |
| $1,000 to $1,499 | 0 (0.0%) | 0 (0.0%) |
| $1,500 to $1,999 | 0 (0.0%) | 0 (0.0%) |
| $2,000 to $2,499 | 0 (0.0%) | 0 (0.0%) |
| $2,500 to $2,999 | 0 (0.0%) | 0 (0.0%) |
| $3,000 or more | 0 (0.0%) | 0 (0.0%) |
| Total | 299 (100.0%) | 11 (100.0%) |
Physical Housing Characteristics in Indian Springs
Housing Structures in Indian Springs
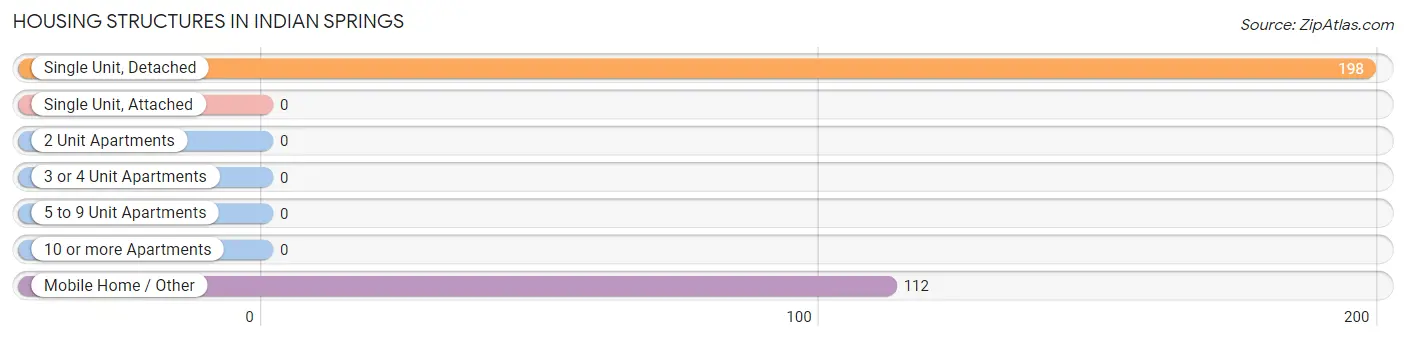
| Structure Type | # Housing Units | % Housing Units |
| Single Unit, Detached | 198 | 63.9% |
| Single Unit, Attached | 0 | 0.0% |
| 2 Unit Apartments | 0 | 0.0% |
| 3 or 4 Unit Apartments | 0 | 0.0% |
| 5 to 9 Unit Apartments | 0 | 0.0% |
| 10 or more Apartments | 0 | 0.0% |
| Mobile Home / Other | 112 | 36.1% |
| Total | 310 | 100.0% |
Housing Structures by Occupancy in Indian Springs
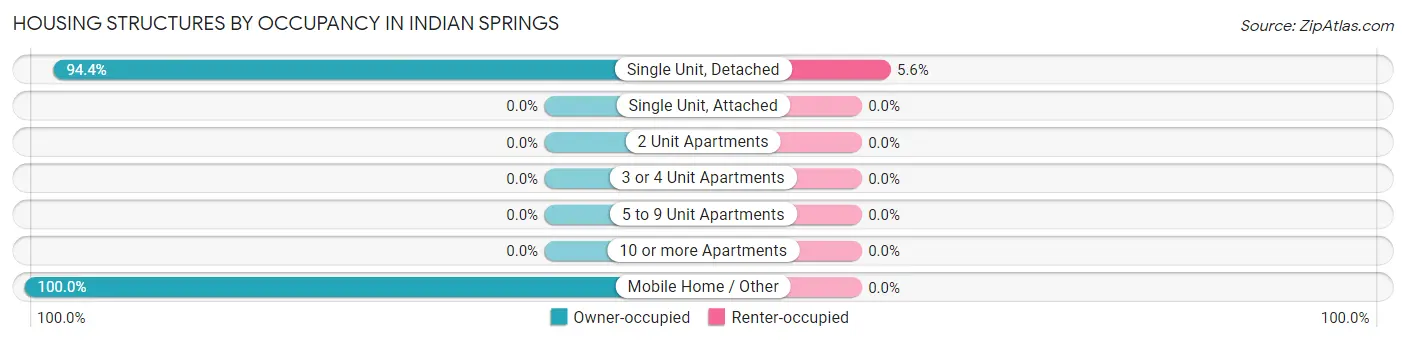
| Structure Type | Owner-occupied | Renter-occupied |
| Single Unit, Detached | 187 (94.4%) | 11 (5.6%) |
| Single Unit, Attached | 0 (0.0%) | 0 (0.0%) |
| 2 Unit Apartments | 0 (0.0%) | 0 (0.0%) |
| 3 or 4 Unit Apartments | 0 (0.0%) | 0 (0.0%) |
| 5 to 9 Unit Apartments | 0 (0.0%) | 0 (0.0%) |
| 10 or more Apartments | 0 (0.0%) | 0 (0.0%) |
| Mobile Home / Other | 112 (100.0%) | 0 (0.0%) |
| Total | 299 (96.5%) | 11 (3.5%) |
Housing Structures by Number of Rooms in Indian Springs
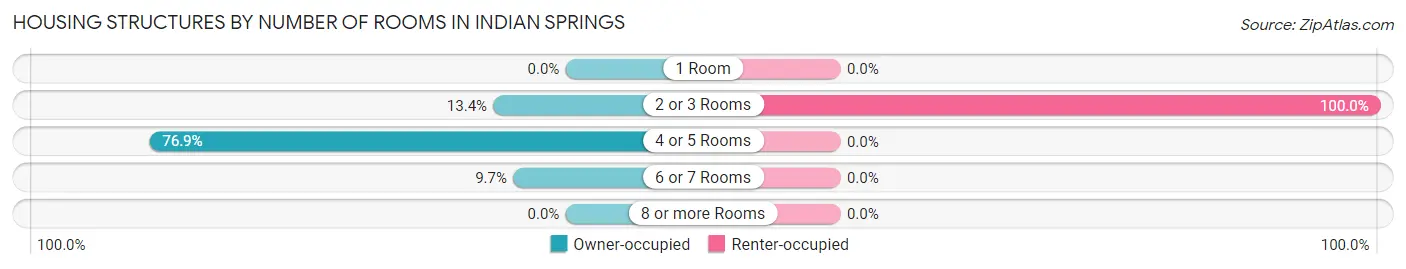
| Number of Rooms | Owner-occupied | Renter-occupied |
| 1 Room | 0 (0.0%) | 0 (0.0%) |
| 2 or 3 Rooms | 40 (13.4%) | 11 (100.0%) |
| 4 or 5 Rooms | 230 (76.9%) | 0 (0.0%) |
| 6 or 7 Rooms | 29 (9.7%) | 0 (0.0%) |
| 8 or more Rooms | 0 (0.0%) | 0 (0.0%) |
| Total | 299 (100.0%) | 11 (100.0%) |
Housing Structure by Heating Type in Indian Springs
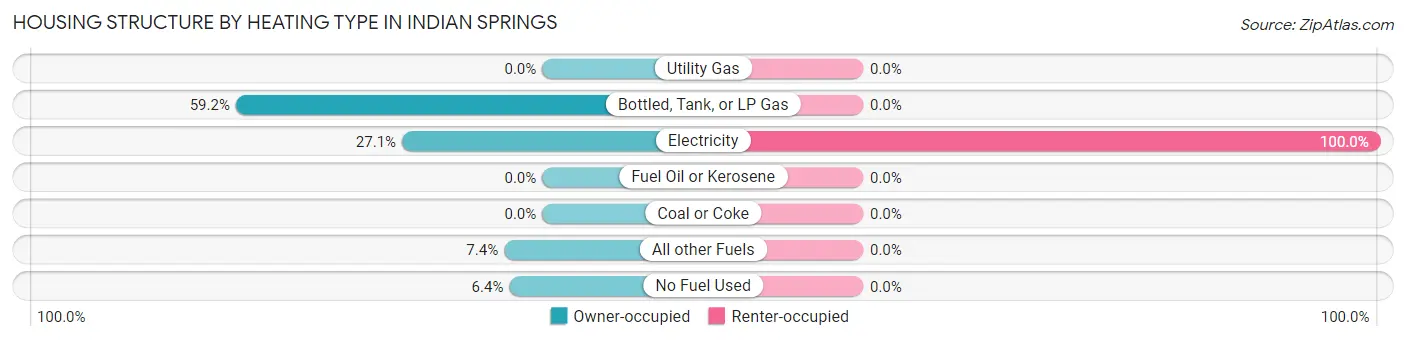
| Heating Type | Owner-occupied | Renter-occupied |
| Utility Gas | 0 (0.0%) | 0 (0.0%) |
| Bottled, Tank, or LP Gas | 177 (59.2%) | 0 (0.0%) |
| Electricity | 81 (27.1%) | 11 (100.0%) |
| Fuel Oil or Kerosene | 0 (0.0%) | 0 (0.0%) |
| Coal or Coke | 0 (0.0%) | 0 (0.0%) |
| All other Fuels | 22 (7.4%) | 0 (0.0%) |
| No Fuel Used | 19 (6.4%) | 0 (0.0%) |
| Total | 299 (100.0%) | 11 (100.0%) |
Household Vehicle Usage in Indian Springs
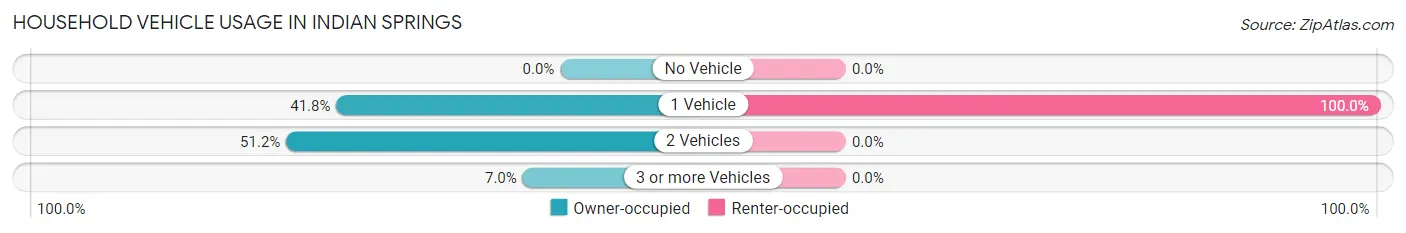
| Vehicles per Household | Owner-occupied | Renter-occupied |
| No Vehicle | 0 (0.0%) | 0 (0.0%) |
| 1 Vehicle | 125 (41.8%) | 11 (100.0%) |
| 2 Vehicles | 153 (51.2%) | 0 (0.0%) |
| 3 or more Vehicles | 21 (7.0%) | 0 (0.0%) |
| Total | 299 (100.0%) | 11 (100.0%) |
Real Estate & Mortgages in Indian Springs
Real Estate and Mortgage Overview in Indian Springs
| Characteristic | Without Mortgage | With Mortgage |
| Housing Units | 299 | 0 |
| Median Property Value | $83,700 | $0 |
| Median Household Income | $65,471 | $0 |
| Monthly Housing Costs | $521 | $0 |
| Real Estate Taxes | - | - |
Property Value by Mortgage Status in Indian Springs
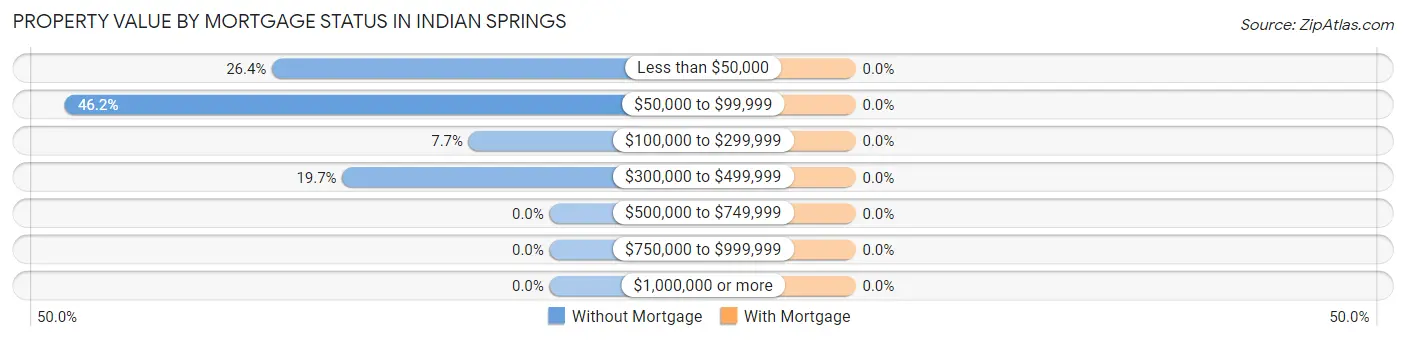
| Property Value | Without Mortgage | With Mortgage |
| Less than $50,000 | 79 (26.4%) | 0 (0.0%) |
| $50,000 to $99,999 | 138 (46.2%) | 0 (0.0%) |
| $100,000 to $299,999 | 23 (7.7%) | 0 (0.0%) |
| $300,000 to $499,999 | 59 (19.7%) | 0 (0.0%) |
| $500,000 to $749,999 | 0 (0.0%) | 0 (0.0%) |
| $750,000 to $999,999 | 0 (0.0%) | 0 (0.0%) |
| $1,000,000 or more | 0 (0.0%) | 0 (0.0%) |
| Total | 299 (100.0%) | 0 (0.0%) |
Household Income by Mortgage Status in Indian Springs
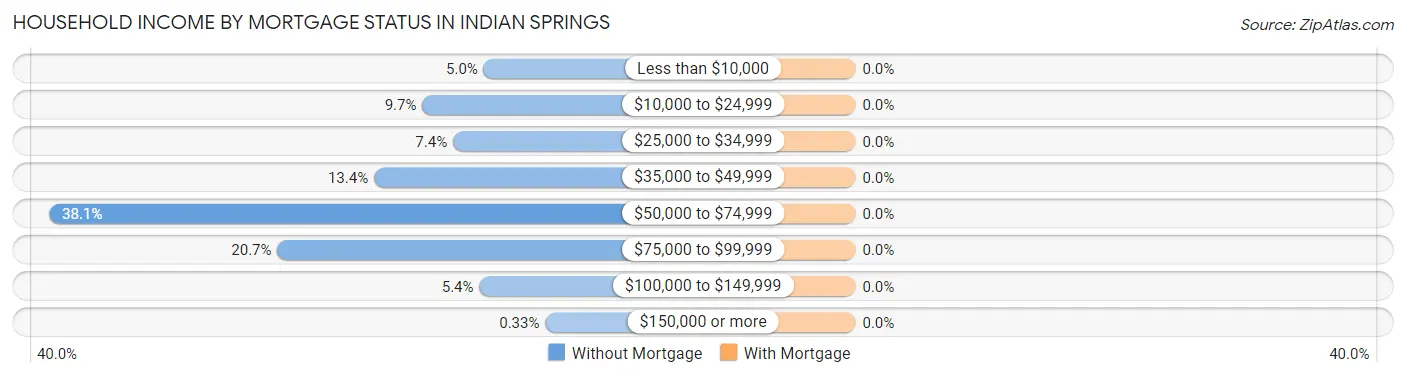
| Household Income | Without Mortgage | With Mortgage |
| Less than $10,000 | 15 (5.0%) | 0 (0.0%) |
| $10,000 to $24,999 | 29 (9.7%) | 0 (0.0%) |
| $25,000 to $34,999 | 22 (7.4%) | 0 (0.0%) |
| $35,000 to $49,999 | 40 (13.4%) | 0 (0.0%) |
| $50,000 to $74,999 | 114 (38.1%) | 0 (0.0%) |
| $75,000 to $99,999 | 62 (20.7%) | 0 (0.0%) |
| $100,000 to $149,999 | 16 (5.3%) | 0 (0.0%) |
| $150,000 or more | 1 (0.3%) | 0 (0.0%) |
| Total | 299 (100.0%) | 0 (0.0%) |
Property Value to Household Income Ratio in Indian Springs
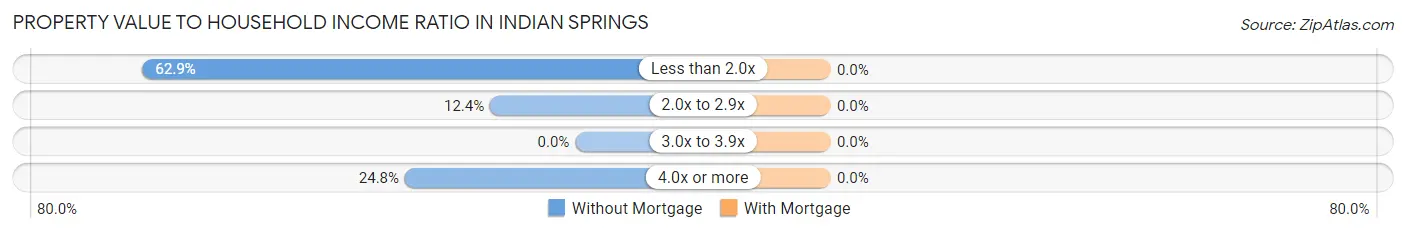
| Value-to-Income Ratio | Without Mortgage | With Mortgage |
| Less than 2.0x | 188 (62.9%) | 0 (0.0%) |
| 2.0x to 2.9x | 37 (12.4%) | 0 (0.0%) |
| 3.0x to 3.9x | 0 (0.0%) | 0 (0.0%) |
| 4.0x or more | 74 (24.7%) | 0 (0.0%) |
| Total | 299 (100.0%) | 0 (0.0%) |
Real Estate Taxes by Mortgage Status in Indian Springs
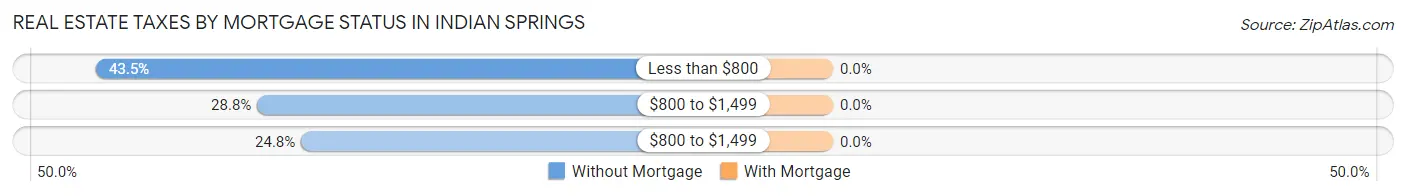
| Property Taxes | Without Mortgage | With Mortgage |
| Less than $800 | 130 (43.5%) | 0 (0.0%) |
| $800 to $1,499 | 86 (28.8%) | 0 (0.0%) |
| $800 to $1,499 | 74 (24.7%) | 0 (0.0%) |
| Total | 299 (100.0%) | 0 (0.0%) |
Health & Disability in Indian Springs
Health Insurance Coverage by Age in Indian Springs
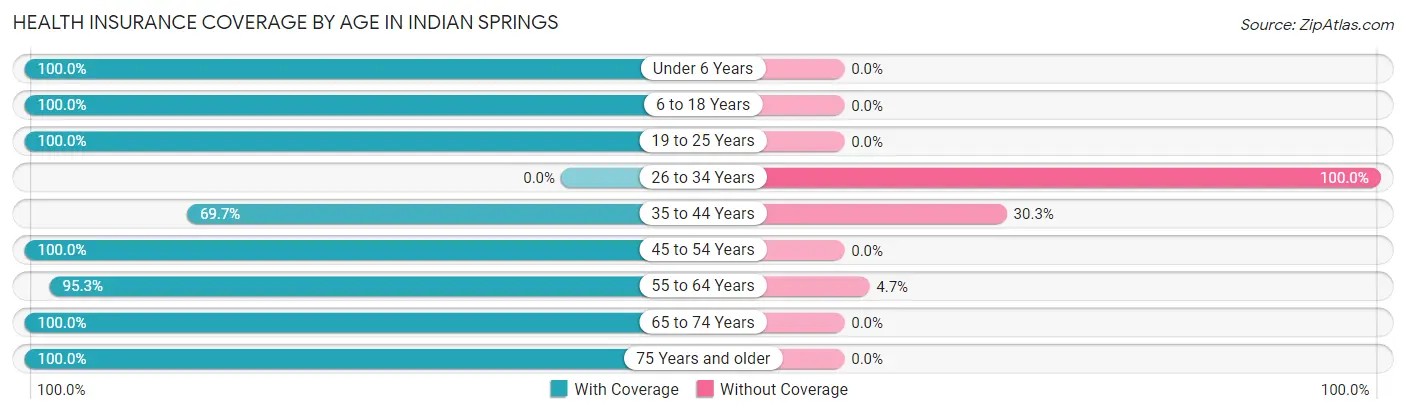
| Age Bracket | With Coverage | Without Coverage |
| Under 6 Years | 13 (100.0%) | 0 (0.0%) |
| 6 to 18 Years | 30 (100.0%) | 0 (0.0%) |
| 19 to 25 Years | 15 (100.0%) | 0 (0.0%) |
| 26 to 34 Years | 0 (0.0%) | 68 (100.0%) |
| 35 to 44 Years | 76 (69.7%) | 33 (30.3%) |
| 45 to 54 Years | 42 (100.0%) | 0 (0.0%) |
| 55 to 64 Years | 367 (95.3%) | 18 (4.7%) |
| 65 to 74 Years | 140 (100.0%) | 0 (0.0%) |
| 75 Years and older | 67 (100.0%) | 0 (0.0%) |
| Total | 750 (86.3%) | 119 (13.7%) |
Health Insurance Coverage by Citizenship Status in Indian Springs
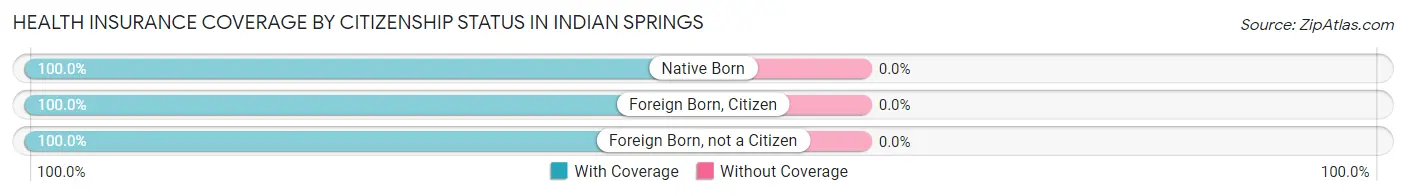
| Citizenship Status | With Coverage | Without Coverage |
| Native Born | 13 (100.0%) | 0 (0.0%) |
| Foreign Born, Citizen | 30 (100.0%) | 0 (0.0%) |
| Foreign Born, not a Citizen | 15 (100.0%) | 0 (0.0%) |
Health Insurance Coverage by Household Income in Indian Springs
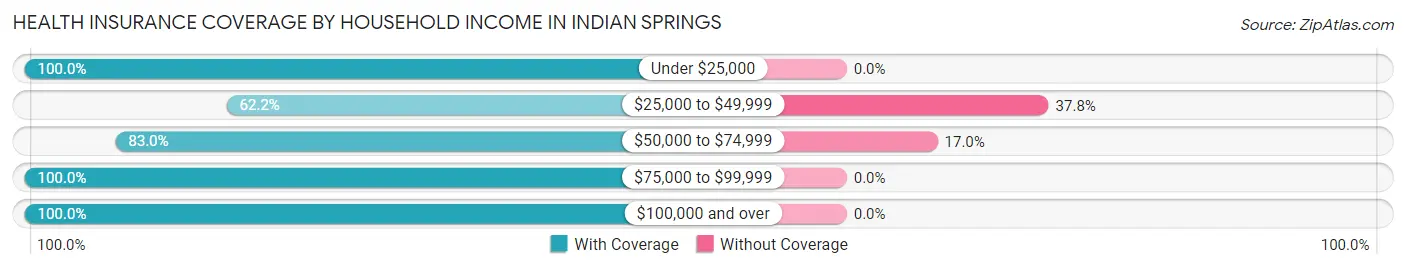
| Household Income | With Coverage | Without Coverage |
| Under $25,000 | 44 (100.0%) | 0 (0.0%) |
| $25,000 to $49,999 | 74 (62.2%) | 45 (37.8%) |
| $50,000 to $74,999 | 361 (83.0%) | 74 (17.0%) |
| $75,000 to $99,999 | 197 (100.0%) | 0 (0.0%) |
| $100,000 and over | 74 (100.0%) | 0 (0.0%) |
Public vs Private Health Insurance Coverage by Age in Indian Springs
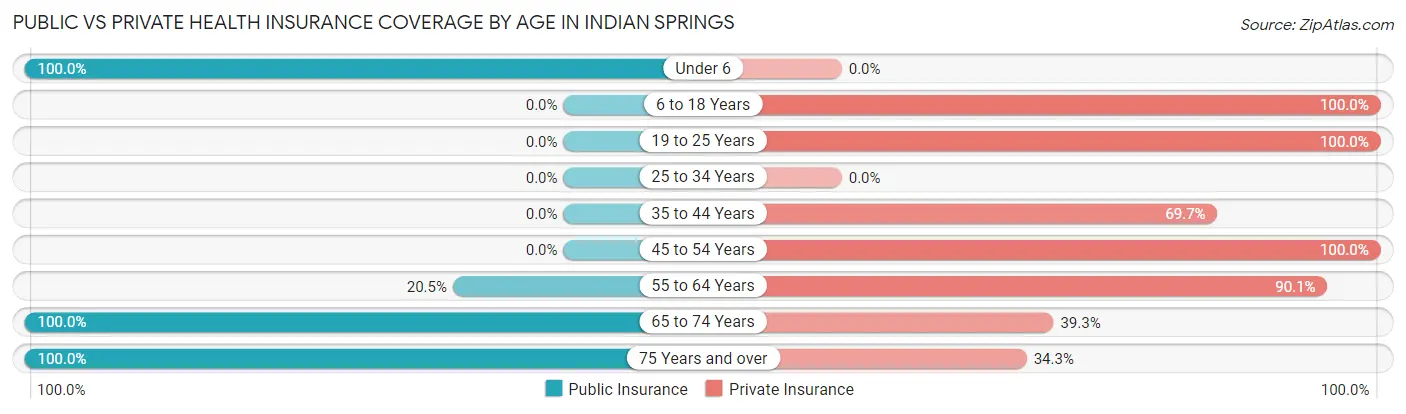
| Age Bracket | Public Insurance | Private Insurance |
| Under 6 | 13 (100.0%) | 0 (0.0%) |
| 6 to 18 Years | 0 (0.0%) | 30 (100.0%) |
| 19 to 25 Years | 0 (0.0%) | 15 (100.0%) |
| 25 to 34 Years | 0 (0.0%) | 0 (0.0%) |
| 35 to 44 Years | 0 (0.0%) | 76 (69.7%) |
| 45 to 54 Years | 0 (0.0%) | 42 (100.0%) |
| 55 to 64 Years | 79 (20.5%) | 347 (90.1%) |
| 65 to 74 Years | 140 (100.0%) | 55 (39.3%) |
| 75 Years and over | 67 (100.0%) | 23 (34.3%) |
| Total | 299 (34.4%) | 588 (67.7%) |
Disability Status by Sex by Age in Indian Springs
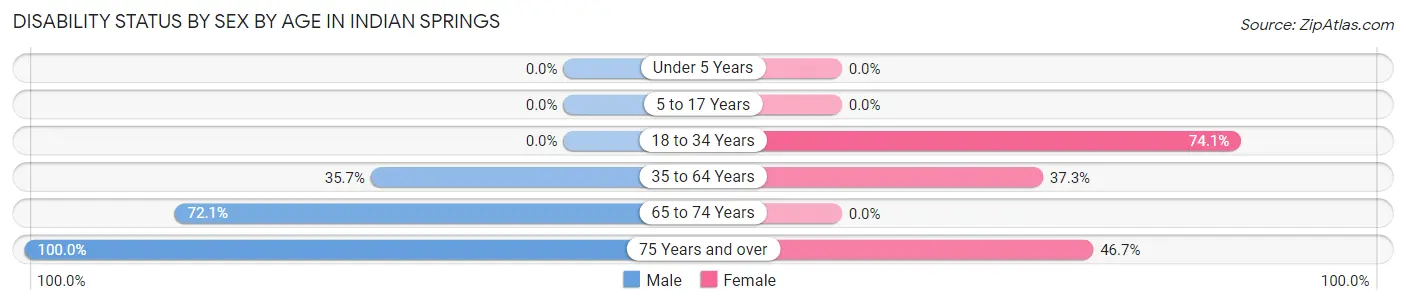
| Age Bracket | Male | Female |
| Under 5 Years | 0 (0.0%) | 0 (0.0%) |
| 5 to 17 Years | 0 (0.0%) | 0 (0.0%) |
| 18 to 34 Years | 0 (0.0%) | 63 (74.1%) |
| 35 to 64 Years | 114 (35.7%) | 81 (37.3%) |
| 65 to 74 Years | 101 (72.1%) | 0 (0.0%) |
| 75 Years and over | 52 (100.0%) | 7 (46.7%) |
Disability Class by Sex by Age in Indian Springs
Disability Class: Hearing Difficulty
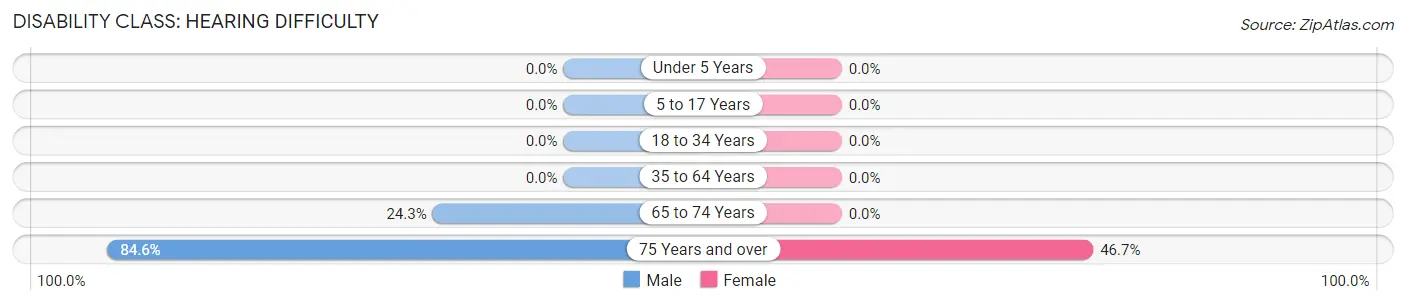
| Age Bracket | Male | Female |
| Under 5 Years | 0 (0.0%) | 0 (0.0%) |
| 5 to 17 Years | 0 (0.0%) | 0 (0.0%) |
| 18 to 34 Years | 0 (0.0%) | 0 (0.0%) |
| 35 to 64 Years | 0 (0.0%) | 0 (0.0%) |
| 65 to 74 Years | 34 (24.3%) | 0 (0.0%) |
| 75 Years and over | 44 (84.6%) | 7 (46.7%) |
Disability Class: Vision Difficulty
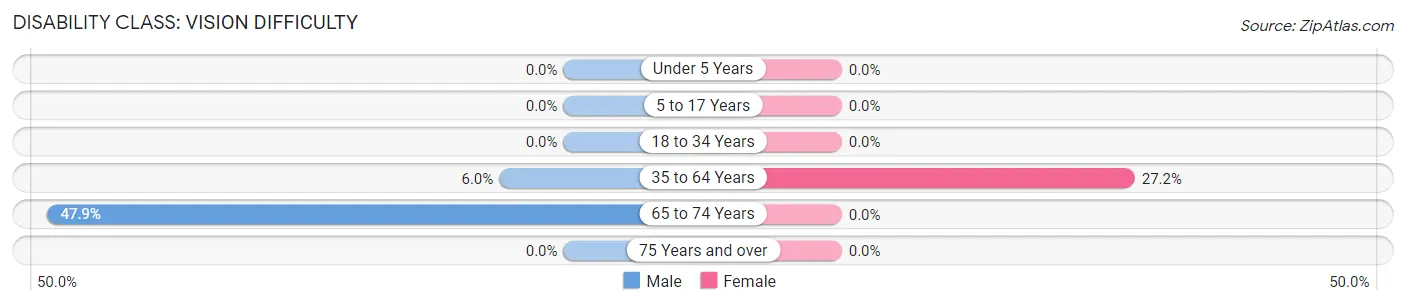
| Age Bracket | Male | Female |
| Under 5 Years | 0 (0.0%) | 0 (0.0%) |
| 5 to 17 Years | 0 (0.0%) | 0 (0.0%) |
| 18 to 34 Years | 0 (0.0%) | 0 (0.0%) |
| 35 to 64 Years | 19 (6.0%) | 59 (27.2%) |
| 65 to 74 Years | 67 (47.9%) | 0 (0.0%) |
| 75 Years and over | 0 (0.0%) | 0 (0.0%) |
Disability Class: Cognitive Difficulty
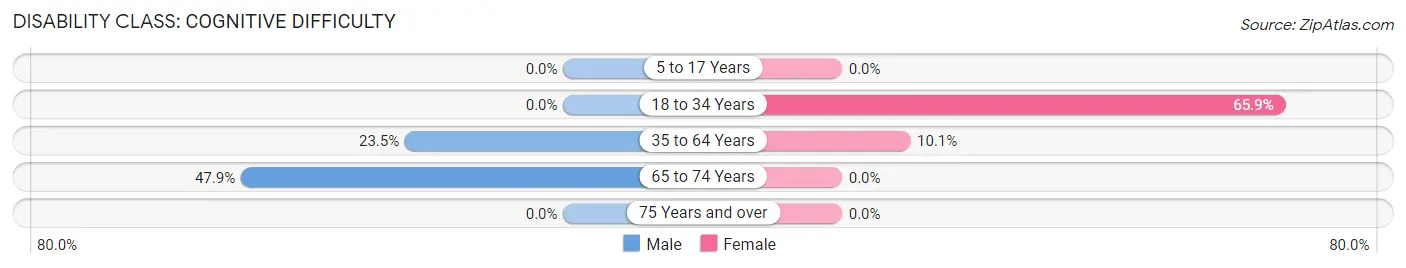
| Age Bracket | Male | Female |
| 5 to 17 Years | 0 (0.0%) | 0 (0.0%) |
| 18 to 34 Years | 0 (0.0%) | 56 (65.9%) |
| 35 to 64 Years | 75 (23.5%) | 22 (10.1%) |
| 65 to 74 Years | 67 (47.9%) | 0 (0.0%) |
| 75 Years and over | 0 (0.0%) | 0 (0.0%) |
Disability Class: Ambulatory Difficulty
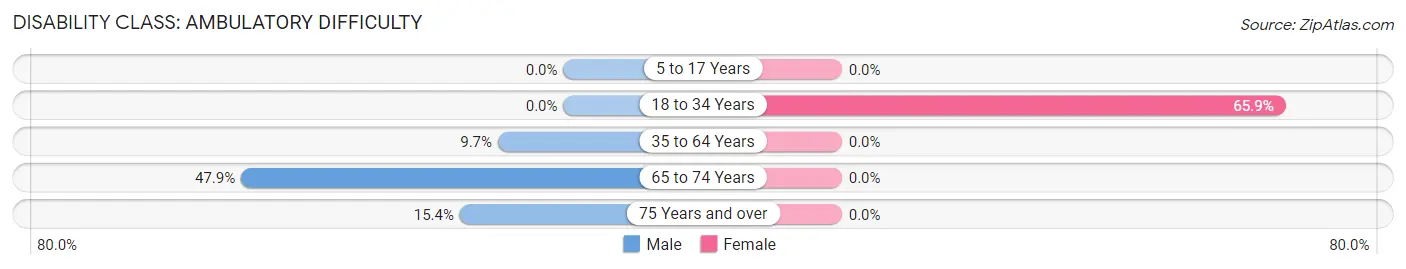
| Age Bracket | Male | Female |
| 5 to 17 Years | 0 (0.0%) | 0 (0.0%) |
| 18 to 34 Years | 0 (0.0%) | 56 (65.9%) |
| 35 to 64 Years | 31 (9.7%) | 0 (0.0%) |
| 65 to 74 Years | 67 (47.9%) | 0 (0.0%) |
| 75 Years and over | 8 (15.4%) | 0 (0.0%) |
Disability Class: Self-Care Difficulty
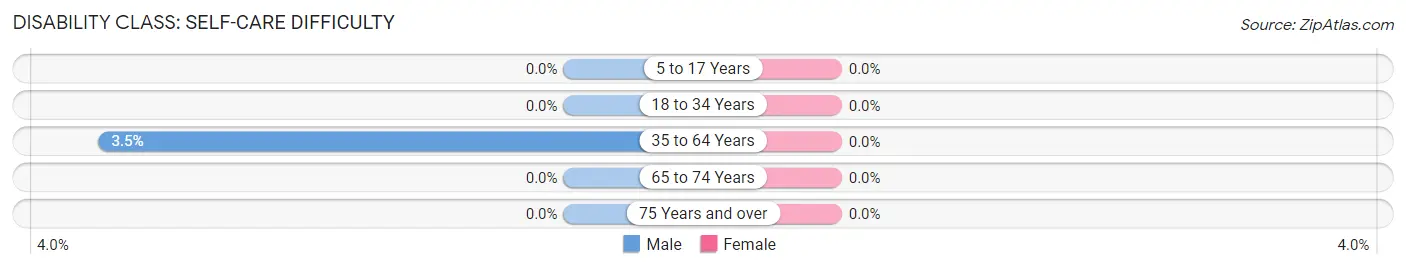
| Age Bracket | Male | Female |
| 5 to 17 Years | 0 (0.0%) | 0 (0.0%) |
| 18 to 34 Years | 0 (0.0%) | 0 (0.0%) |
| 35 to 64 Years | 11 (3.5%) | 0 (0.0%) |
| 65 to 74 Years | 0 (0.0%) | 0 (0.0%) |
| 75 Years and over | 0 (0.0%) | 0 (0.0%) |
Technology Access in Indian Springs
Computing Device Access in Indian Springs
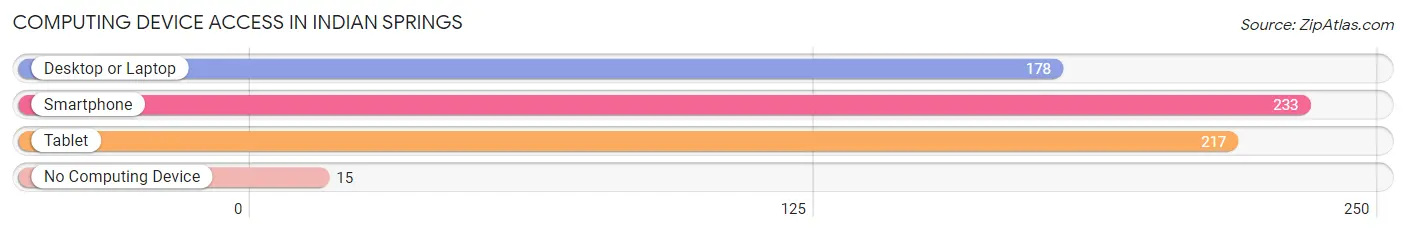
| Device Type | # Households | % Households |
| Desktop or Laptop | 178 | 57.4% |
| Smartphone | 233 | 75.2% |
| Tablet | 217 | 70.0% |
| No Computing Device | 15 | 4.8% |
| Total | 310 | 100.0% |
Internet Access in Indian Springs
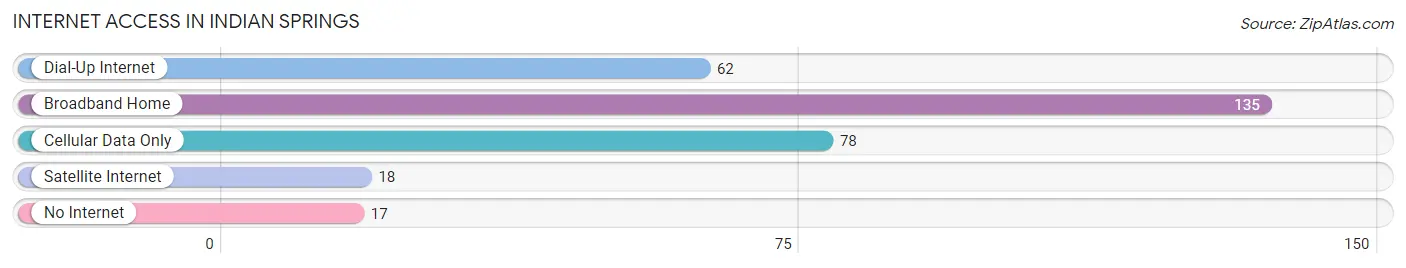
| Internet Type | # Households | % Households |
| Dial-Up Internet | 62 | 20.0% |
| Broadband Home | 135 | 43.5% |
| Cellular Data Only | 78 | 25.2% |
| Satellite Internet | 18 | 5.8% |
| No Internet | 17 | 5.5% |
| Total | 310 | 100.0% |
Indian Springs Summary
History
Indian Springs, Texas is a small unincorporated community located in the southeastern corner of Collin County, Texas. The community was first settled in the late 1800s by a group of settlers from the Choctaw Nation. The settlers named the area Indian Springs after the nearby springs that provided water for the community. The area was primarily used for farming and ranching, and the community grew slowly over the years.
In the early 1900s, the community began to grow more rapidly as the railroad came through the area. This allowed for the transportation of goods and people, and the community began to thrive. The population of Indian Springs grew to over 500 by the mid-1900s.
In the late 1900s, the community began to decline as the railroad was abandoned and the population began to move away. Today, Indian Springs is a small, rural community with a population of just over 200 people.
Geography
Indian Springs is located in the southeastern corner of Collin County, Texas. The community is situated on the banks of the Trinity River, and is surrounded by rolling hills and farmland. The area is mostly rural, with a few small businesses and farms scattered throughout the area.
The climate in Indian Springs is generally mild, with hot summers and cool winters. The average temperature in the summer is around 90 degrees Fahrenheit, and the average temperature in the winter is around 50 degrees Fahrenheit.
Economy
The economy of Indian Springs is largely based on agriculture and ranching. The area is home to several small farms and ranches, and the community is also home to a few small businesses. These businesses include a grocery store, a gas station, and a few restaurants.
The community also has a few small manufacturing businesses, such as a furniture factory and a metal fabrication shop. The area is also home to a few small oil and gas companies.
Demographics
As of the 2010 census, the population of Indian Springs was just over 200 people. The racial makeup of the community was 97.5% White, 0.5% African American, 0.5% Native American, 0.5% Asian, and 1.0% from other races. The median household income in the community was $45,000, and the median home value was $125,000.
Conclusion
Indian Springs, Texas is a small, rural community located in the southeastern corner of Collin County, Texas. The community was first settled in the late 1800s by a group of settlers from the Choctaw Nation, and the area was primarily used for farming and ranching. The economy of Indian Springs is largely based on agriculture and ranching, and the community is also home to a few small businesses. As of the 2010 census, the population of Indian Springs was just over 200 people.
Common Questions
What is Per Capita Income in Indian Springs?
Per Capita income in Indian Springs is $24,688.
What is the Median Family Income in Indian Springs?
Median Family Income in Indian Springs is $58,816.
What is the Median Household income in Indian Springs?
Median Household Income in Indian Springs is $65,292.
What is Income or Wage Gap in Indian Springs?
Income or Wage Gap in Indian Springs is 29.2%.
Women in Indian Springs earn 70.8 cents for every dollar earned by a man.
What is Inequality or Gini Index in Indian Springs?
Inequality or Gini Index in Indian Springs is 0.27.
What is the Total Population of Indian Springs?
Total Population of Indian Springs is 869.
What is the Total Male Population of Indian Springs?
Total Male Population of Indian Springs is 519.
What is the Total Female Population of Indian Springs?
Total Female Population of Indian Springs is 350.
What is the Ratio of Males per 100 Females in Indian Springs?
There are 148.29 Males per 100 Females in Indian Springs.
What is the Ratio of Females per 100 Males in Indian Springs?
There are 67.44 Females per 100 Males in Indian Springs.
What is the Median Population Age in Indian Springs?
Median Population Age in Indian Springs is 59.7 Years.
What is the Average Family Size in Indian Springs
Average Family Size in Indian Springs is 3.0 People.
What is the Average Household Size in Indian Springs
Average Household Size in Indian Springs is 2.8 People.
How Large is the Labor Force in Indian Springs?
There are 351 People in the Labor Forcein in Indian Springs.
What is the Percentage of People in the Labor Force in Indian Springs?
41.5% of People are in the Labor Force in Indian Springs.
What is the Unemployment Rate in Indian Springs?
Unemployment Rate in Indian Springs is 0.3%.