Lakeland, FL Map & Demographics
Lakeland Map
Lakeland Overview
$33,154
PER CAPITA INCOME
$69,885
AVG FAMILY INCOME
$58,290
AVG HOUSEHOLD INCOME
20.4%
WAGE / INCOME GAP [ % ]
79.6¢/ $1
WAGE / INCOME GAP [ $ ]
$10,715
FAMILY INCOME DEFICIT
0.48
INEQUALITY / GINI INDEX
114,404
TOTAL POPULATION
56,177
MALE POPULATION
58,227
FEMALE POPULATION
96.48
MALES / 100 FEMALES
103.65
FEMALES / 100 MALES
40.6
MEDIAN AGE
3.1
AVG FAMILY SIZE
2.4
AVG HOUSEHOLD SIZE
52,740
LABOR FORCE [ PEOPLE ]
55.3%
PERCENT IN LABOR FORCE
5.4%
UNEMPLOYMENT RATE
Lakeland Area Codes
Income in Lakeland
Income Overview in Lakeland
Per Capita Income in Lakeland is $33,154, while median incomes of families and households are $69,885 and $58,290 respectively.
| Characteristic | Number | Measure |
| Per Capita Income | 114,404 | $33,154 |
| Median Family Income | 26,597 | $69,885 |
| Mean Family Income | 26,597 | $98,108 |
| Median Household Income | 44,323 | $58,290 |
| Mean Household Income | 44,323 | $81,137 |
| Income Deficit | 26,597 | $10,715 |
| Wage / Income Gap (%) | 114,404 | 20.38% |
| Wage / Income Gap ($) | 114,404 | 79.62¢ per $1 |
| Gini / Inequality Index | 114,404 | 0.48 |
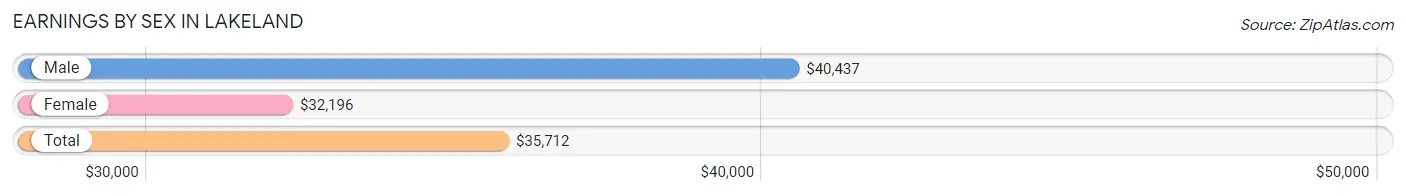
Earnings by Sex in Lakeland
Average Earnings in Lakeland are $35,712, $40,437 for men and $32,196 for women, a difference of 20.4%.
| Sex | Number | Average Earnings |
| Male | 28,739 (52.4%) | $40,437 |
| Female | 26,073 (47.6%) | $32,196 |
| Total | 54,812 (100.0%) | $35,712 |
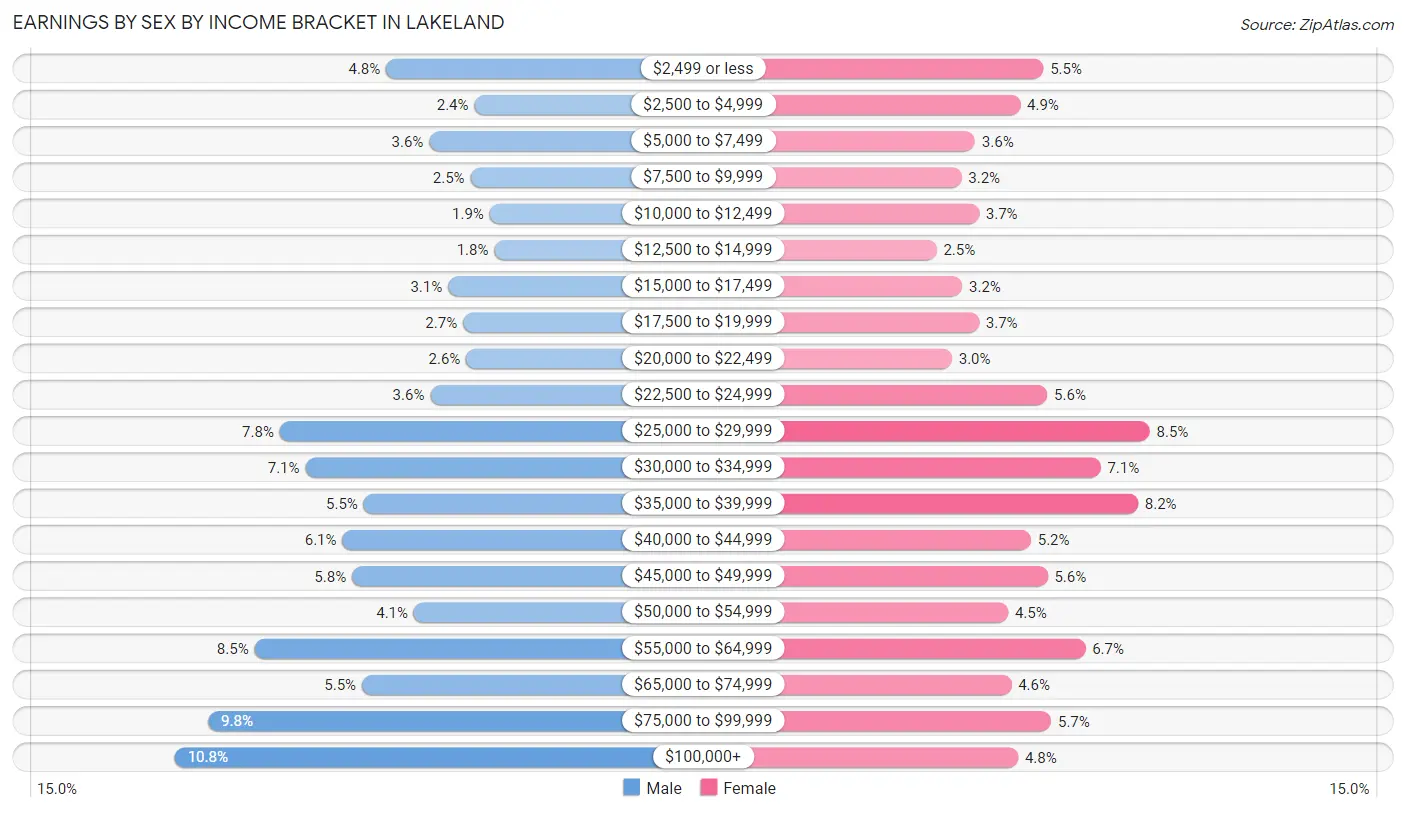
Earnings by Sex by Income Bracket in Lakeland
The most common earnings brackets in Lakeland are $100,000+ for men (3,098 | 10.8%) and $25,000 to $29,999 for women (2,219 | 8.5%).
| Income | Male | Female |
| $2,499 or less | 1,391 (4.8%) | 1,439 (5.5%) |
| $2,500 to $4,999 | 677 (2.4%) | 1,271 (4.9%) |
| $5,000 to $7,499 | 1,042 (3.6%) | 939 (3.6%) |
| $7,500 to $9,999 | 710 (2.5%) | 839 (3.2%) |
| $10,000 to $12,499 | 555 (1.9%) | 968 (3.7%) |
| $12,500 to $14,999 | 516 (1.8%) | 658 (2.5%) |
| $15,000 to $17,499 | 890 (3.1%) | 845 (3.2%) |
| $17,500 to $19,999 | 769 (2.7%) | 967 (3.7%) |
| $20,000 to $22,499 | 744 (2.6%) | 770 (2.9%) |
| $22,500 to $24,999 | 1,036 (3.6%) | 1,467 (5.6%) |
| $25,000 to $29,999 | 2,251 (7.8%) | 2,219 (8.5%) |
| $30,000 to $34,999 | 2,043 (7.1%) | 1,860 (7.1%) |
| $35,000 to $39,999 | 1,573 (5.5%) | 2,132 (8.2%) |
| $40,000 to $44,999 | 1,744 (6.1%) | 1,348 (5.2%) |
| $45,000 to $49,999 | 1,666 (5.8%) | 1,470 (5.6%) |
| $50,000 to $54,999 | 1,167 (4.1%) | 1,180 (4.5%) |
| $55,000 to $64,999 | 2,454 (8.5%) | 1,747 (6.7%) |
| $65,000 to $74,999 | 1,586 (5.5%) | 1,204 (4.6%) |
| $75,000 to $99,999 | 2,827 (9.8%) | 1,497 (5.7%) |
| $100,000+ | 3,098 (10.8%) | 1,253 (4.8%) |
| Total | 28,739 (100.0%) | 26,073 (100.0%) |
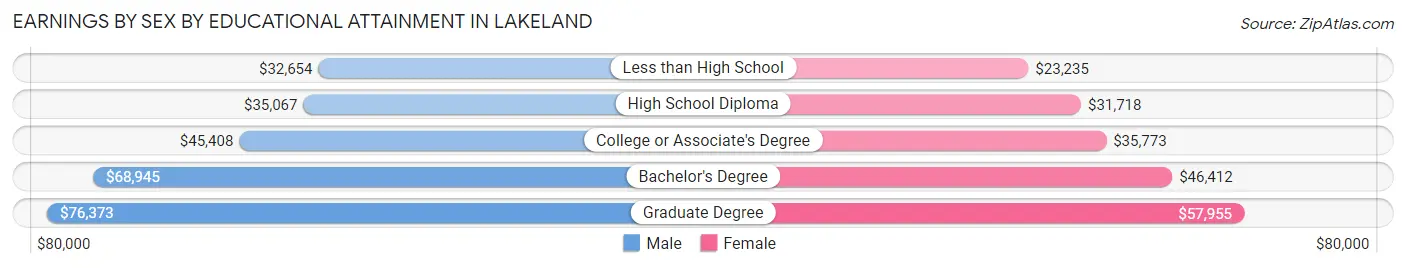
Earnings by Sex by Educational Attainment in Lakeland
Average earnings in Lakeland are $45,882 for men and $36,296 for women, a difference of 20.9%. Men with an educational attainment of graduate degree enjoy the highest average annual earnings of $76,373, while those with less than high school education earn the least with $32,654. Women with an educational attainment of graduate degree earn the most with the average annual earnings of $57,955, while those with less than high school education have the smallest earnings of $23,235.
| Educational Attainment | Male Income | Female Income |
| Less than High School | $32,654 | $23,235 |
| High School Diploma | $35,067 | $31,718 |
| College or Associate's Degree | $45,408 | $35,773 |
| Bachelor's Degree | $68,945 | $46,412 |
| Graduate Degree | $76,373 | $57,955 |
| Total | $45,882 | $36,296 |
Family Income in Lakeland
Family Income Brackets in Lakeland
According to the Lakeland family income data, there are 5,452 families falling into the $50,000 to $74,999 income range, which is the most common income bracket and makes up 20.5% of all families. Conversely, the $10,000 to $14,999 income bracket is the least frequent group with only 452 families (1.7%) belonging to this category.
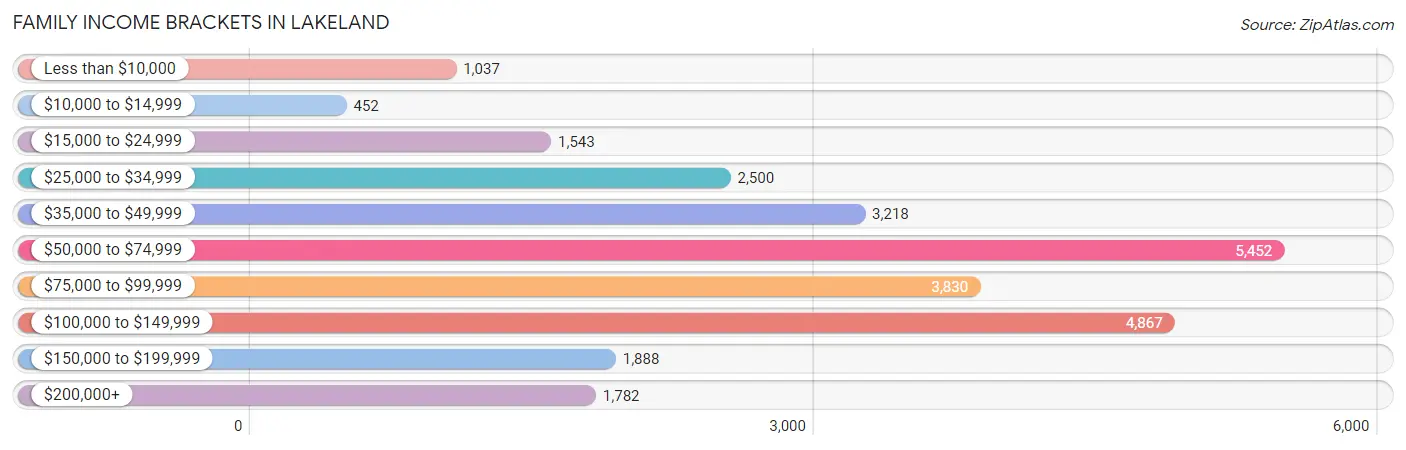
| Income Bracket | # Families | % Families |
| Less than $10,000 | 1,037 | 3.9% |
| $10,000 to $14,999 | 452 | 1.7% |
| $15,000 to $24,999 | 1,543 | 5.8% |
| $25,000 to $34,999 | 2,500 | 9.4% |
| $35,000 to $49,999 | 3,218 | 12.1% |
| $50,000 to $74,999 | 5,452 | 20.5% |
| $75,000 to $99,999 | 3,830 | 14.4% |
| $100,000 to $149,999 | 4,867 | 18.3% |
| $150,000 to $199,999 | 1,888 | 7.1% |
| $200,000+ | 1,782 | 6.7% |
Family Income by Famaliy Size in Lakeland
7+ person families (364 | 1.4%) account for the highest median family income in Lakeland with $100,000 per family, while 2-person families (14,107 | 53.0%) have the highest median income of $31,496 per family member.
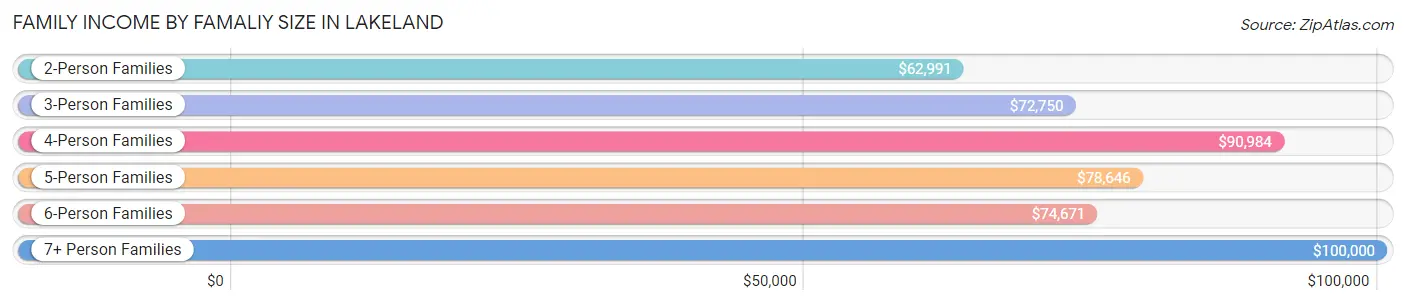
| Income Bracket | # Families | Median Income |
| 2-Person Families | 14,107 (53.0%) | $62,991 |
| 3-Person Families | 5,961 (22.4%) | $72,750 |
| 4-Person Families | 3,682 (13.8%) | $90,984 |
| 5-Person Families | 1,751 (6.6%) | $78,646 |
| 6-Person Families | 732 (2.8%) | $74,671 |
| 7+ Person Families | 364 (1.4%) | $100,000 |
| Total | 26,597 (100.0%) | $69,885 |
Family Income by Number of Earners in Lakeland
The median family income in Lakeland is $69,885, with families comprising 3+ earners (2,303) having the highest median family income of $118,092, while families with no earners (5,979) have the lowest median family income of $44,744, accounting for 8.7% and 22.5% of families, respectively.
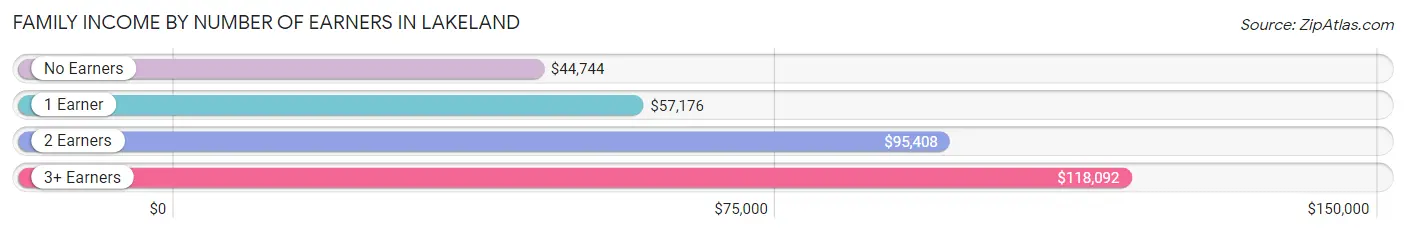
| Number of Earners | # Families | Median Income |
| No Earners | 5,979 (22.5%) | $44,744 |
| 1 Earner | 9,109 (34.3%) | $57,176 |
| 2 Earners | 9,206 (34.6%) | $95,408 |
| 3+ Earners | 2,303 (8.7%) | $118,092 |
| Total | 26,597 (100.0%) | $69,885 |
Household Income in Lakeland
Household Income Brackets in Lakeland
With 9,042 households falling in the category, the $50,000 to $74,999 income range is the most frequent in Lakeland, accounting for 20.4% of all households. In contrast, only 1,551 households (3.5%) fall into the $10,000 to $14,999 income bracket, making it the least populous group.
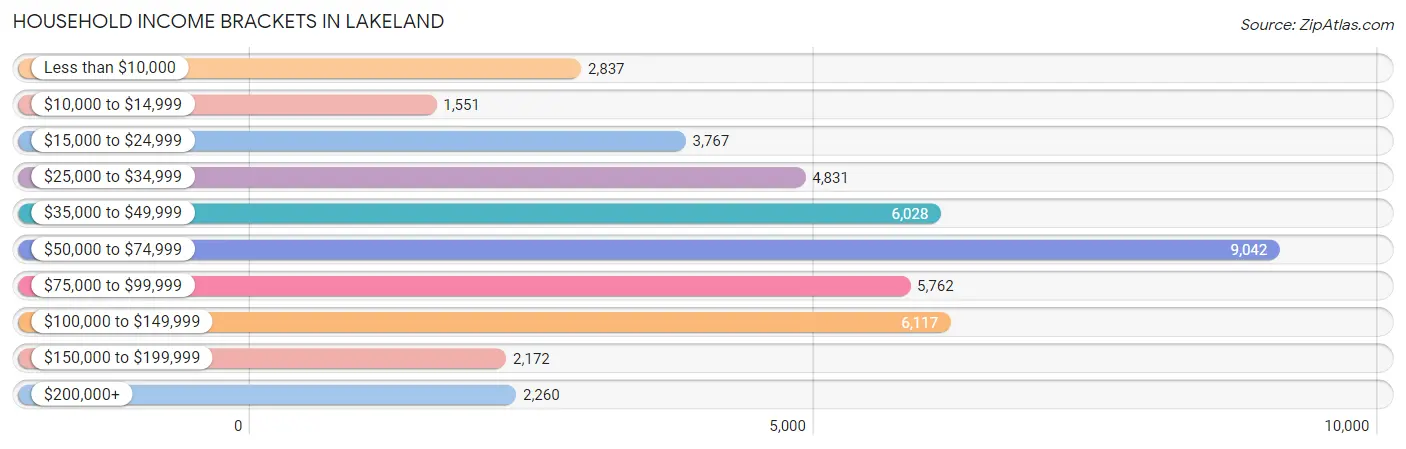
| Income Bracket | # Households | % Households |
| Less than $10,000 | 2,837 | 6.4% |
| $10,000 to $14,999 | 1,551 | 3.5% |
| $15,000 to $24,999 | 3,767 | 8.5% |
| $25,000 to $34,999 | 4,831 | 10.9% |
| $35,000 to $49,999 | 6,028 | 13.6% |
| $50,000 to $74,999 | 9,042 | 20.4% |
| $75,000 to $99,999 | 5,762 | 13.0% |
| $100,000 to $149,999 | 6,117 | 13.8% |
| $150,000 to $199,999 | 2,172 | 4.9% |
| $200,000+ | 2,260 | 5.1% |
Household Income by Householder Age in Lakeland
The median household income in Lakeland is $58,290, with the highest median household income of $67,604 found in the 25 to 44 years age bracket for the primary householder. A total of 13,488 households (30.4%) fall into this category. Meanwhile, the 15 to 24 years age bracket for the primary householder has the lowest median household income of $36,597, with 1,456 households (3.3%) in this group.
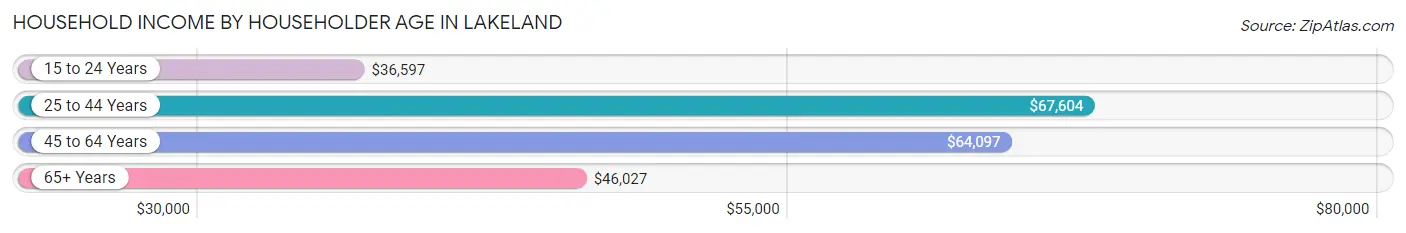
| Income Bracket | # Households | Median Income |
| 15 to 24 Years | 1,456 (3.3%) | $36,597 |
| 25 to 44 Years | 13,488 (30.4%) | $67,604 |
| 45 to 64 Years | 14,229 (32.1%) | $64,097 |
| 65+ Years | 15,150 (34.2%) | $46,027 |
| Total | 44,323 (100.0%) | $58,290 |
Poverty in Lakeland
Income Below Poverty by Sex and Age in Lakeland
With 12.5% poverty level for males and 15.7% for females among the residents of Lakeland, 16 and 17 year old males and under 5 year old females are the most vulnerable to poverty, with 320 males (25.0%) and 780 females (28.7%) in their respective age groups living below the poverty level.
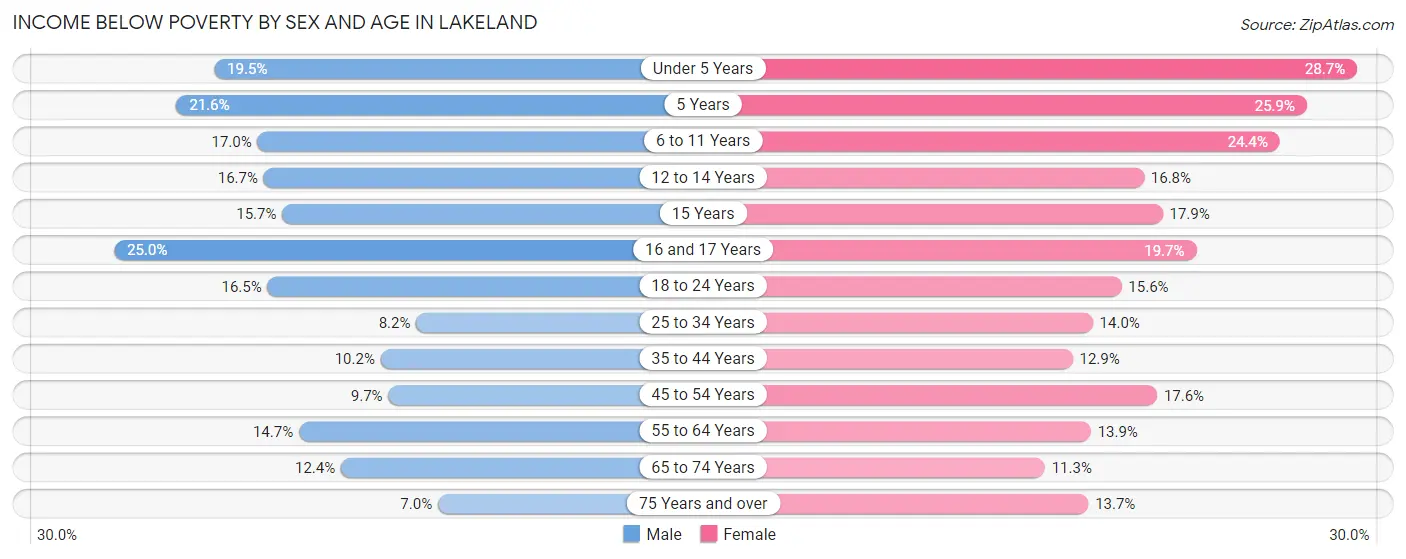
| Age Bracket | Male | Female |
| Under 5 Years | 577 (19.5%) | 780 (28.7%) |
| 5 Years | 100 (21.5%) | 152 (25.9%) |
| 6 to 11 Years | 654 (17.0%) | 821 (24.4%) |
| 12 to 14 Years | 311 (16.7%) | 293 (16.8%) |
| 15 Years | 82 (15.7%) | 87 (17.9%) |
| 16 and 17 Years | 320 (25.0%) | 241 (19.7%) |
| 18 to 24 Years | 682 (16.5%) | 667 (15.6%) |
| 25 to 34 Years | 666 (8.2%) | 938 (14.0%) |
| 35 to 44 Years | 660 (10.2%) | 895 (12.9%) |
| 45 to 54 Years | 667 (9.7%) | 1,063 (17.5%) |
| 55 to 64 Years | 902 (14.7%) | 994 (13.9%) |
| 65 to 74 Years | 690 (12.4%) | 785 (11.3%) |
| 75 Years and over | 337 (7.0%) | 833 (13.7%) |
| Total | 6,648 (12.5%) | 8,549 (15.7%) |
Income Above Poverty by Sex and Age in Lakeland
According to the poverty statistics in Lakeland, males aged 75 years and over and females aged 65 to 74 years are the age groups that are most secure financially, with 93.0% of males and 88.7% of females in these age groups living above the poverty line.
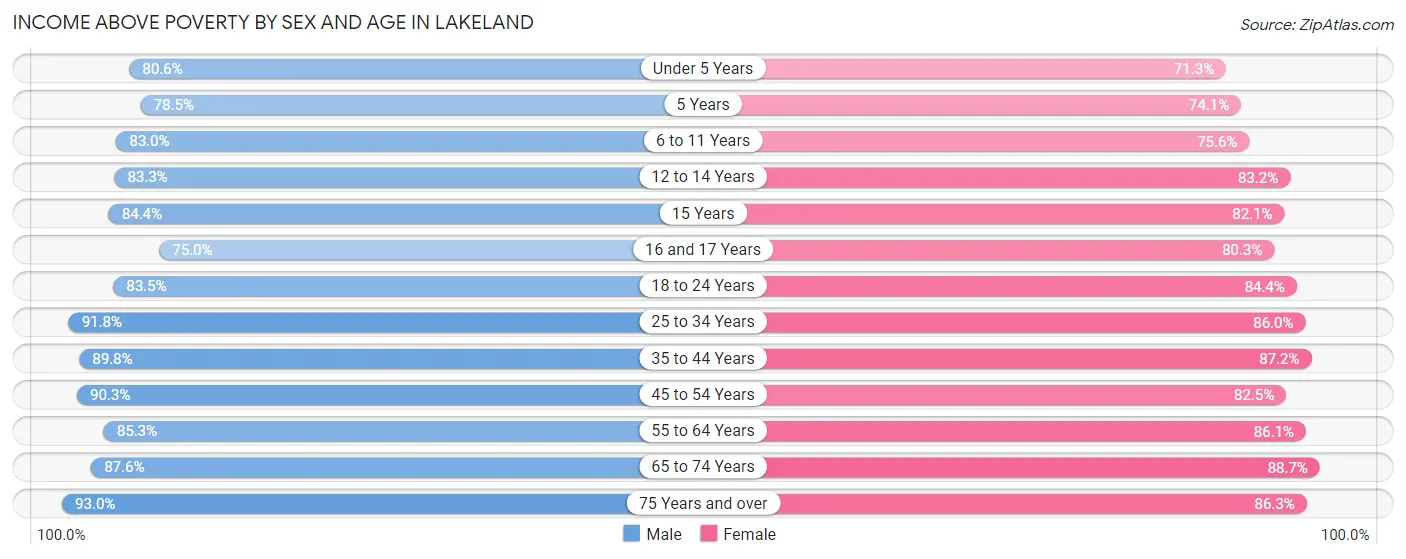
| Age Bracket | Male | Female |
| Under 5 Years | 2,390 (80.5%) | 1,939 (71.3%) |
| 5 Years | 364 (78.4%) | 435 (74.1%) |
| 6 to 11 Years | 3,186 (83.0%) | 2,545 (75.6%) |
| 12 to 14 Years | 1,553 (83.3%) | 1,449 (83.2%) |
| 15 Years | 442 (84.4%) | 400 (82.1%) |
| 16 and 17 Years | 959 (75.0%) | 980 (80.3%) |
| 18 to 24 Years | 3,460 (83.5%) | 3,617 (84.4%) |
| 25 to 34 Years | 7,468 (91.8%) | 5,774 (86.0%) |
| 35 to 44 Years | 5,827 (89.8%) | 6,072 (87.2%) |
| 45 to 54 Years | 6,178 (90.3%) | 4,994 (82.5%) |
| 55 to 64 Years | 5,226 (85.3%) | 6,179 (86.1%) |
| 65 to 74 Years | 4,882 (87.6%) | 6,161 (88.7%) |
| 75 Years and over | 4,488 (93.0%) | 5,237 (86.3%) |
| Total | 46,423 (87.5%) | 45,782 (84.3%) |
Income Below Poverty Among Married-Couple Families in Lakeland
The poverty statistics for married-couple families in Lakeland show that 6.1% or 1,119 of the total 18,365 families live below the poverty line. Families with 3 or 4 children have the highest poverty rate of 13.6%, comprising of 174 families. On the other hand, families with no children have the lowest poverty rate of 4.5%, which includes 534 families.
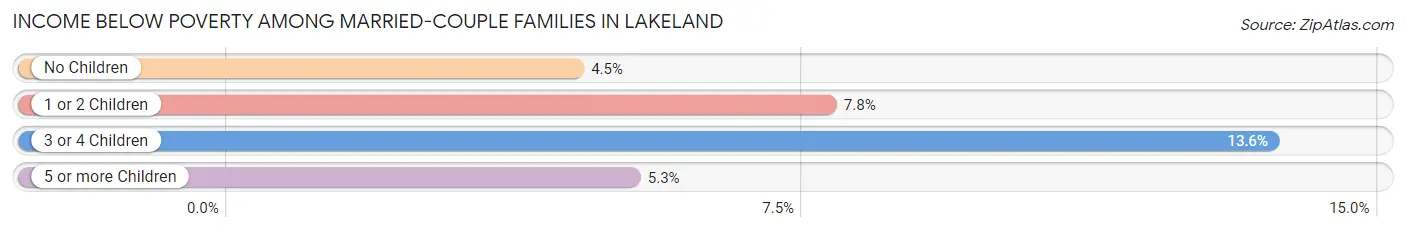
| Children | Above Poverty | Below Poverty |
| No Children | 11,274 (95.5%) | 534 (4.5%) |
| 1 or 2 Children | 4,795 (92.2%) | 407 (7.8%) |
| 3 or 4 Children | 1,105 (86.4%) | 174 (13.6%) |
| 5 or more Children | 72 (94.7%) | 4 (5.3%) |
| Total | 17,246 (93.9%) | 1,119 (6.1%) |
Income Below Poverty Among Single-Parent Households in Lakeland
According to the poverty data in Lakeland, 9.3% or 232 single-father households and 26.3% or 1,512 single-mother households are living below the poverty line. Among single-father households, those with 3 or 4 children have the highest poverty rate, with 42 households (29.6%) experiencing poverty. Likewise, among single-mother households, those with 3 or 4 children have the highest poverty rate, with 388 households (71.9%) falling below the poverty line.
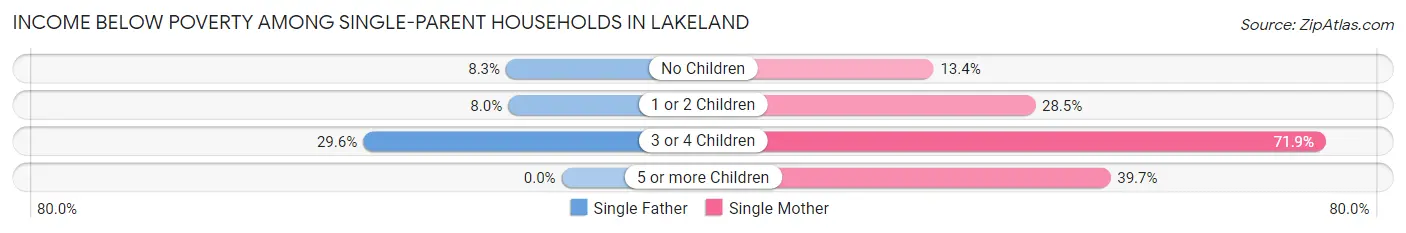
| Children | Single Father | Single Mother |
| No Children | 116 (8.3%) | 332 (13.4%) |
| 1 or 2 Children | 74 (8.0%) | 734 (28.5%) |
| 3 or 4 Children | 42 (29.6%) | 388 (71.9%) |
| 5 or more Children | 0 (0.0%) | 58 (39.7%) |
| Total | 232 (9.3%) | 1,512 (26.3%) |
Income Below Poverty Among Married-Couple vs Single-Parent Households in Lakeland
The poverty data for Lakeland shows that 1,119 of the married-couple family households (6.1%) and 1,744 of the single-parent households (21.2%) are living below the poverty level. Within the married-couple family households, those with 3 or 4 children have the highest poverty rate, with 174 households (13.6%) falling below the poverty line. Among the single-parent households, those with 3 or 4 children have the highest poverty rate, with 430 household (63.0%) living below poverty.
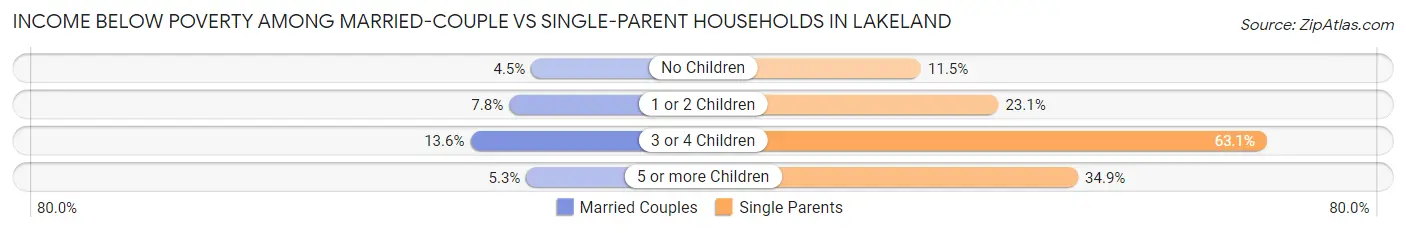
| Children | Married-Couple Families | Single-Parent Households |
| No Children | 534 (4.5%) | 448 (11.5%) |
| 1 or 2 Children | 407 (7.8%) | 808 (23.1%) |
| 3 or 4 Children | 174 (13.6%) | 430 (63.0%) |
| 5 or more Children | 4 (5.3%) | 58 (34.9%) |
| Total | 1,119 (6.1%) | 1,744 (21.2%) |
Race in Lakeland
The most populous races in Lakeland are White / Caucasian (74,527 | 65.1%), Black / African American (22,653 | 19.8%), and Hispanic or Latino (20,379 | 17.8%).
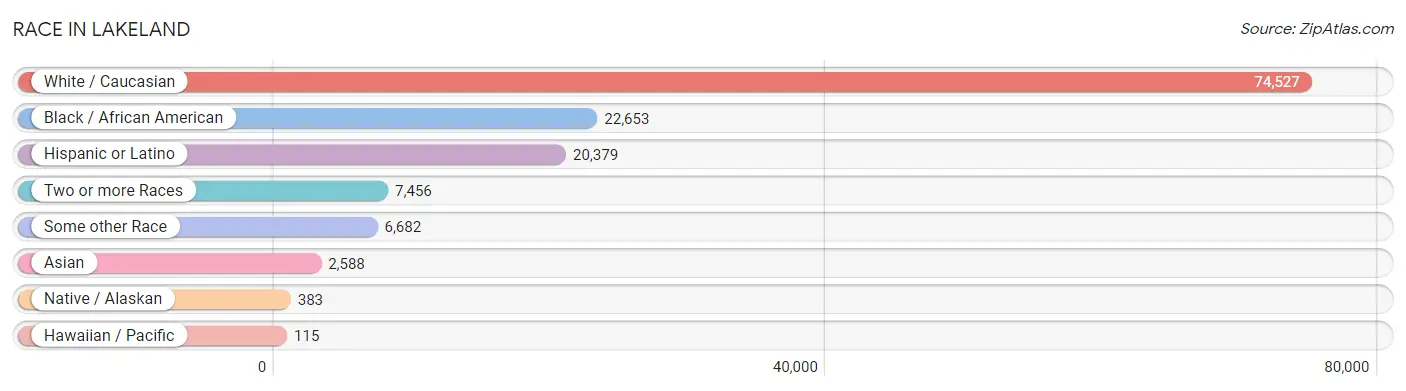
| Race | # Population | % Population |
| Asian | 2,588 | 2.3% |
| Black / African American | 22,653 | 19.8% |
| Hawaiian / Pacific | 115 | 0.1% |
| Hispanic or Latino | 20,379 | 17.8% |
| Native / Alaskan | 383 | 0.3% |
| White / Caucasian | 74,527 | 65.1% |
| Two or more Races | 7,456 | 6.5% |
| Some other Race | 6,682 | 5.8% |
| Total | 114,404 | 100.0% |
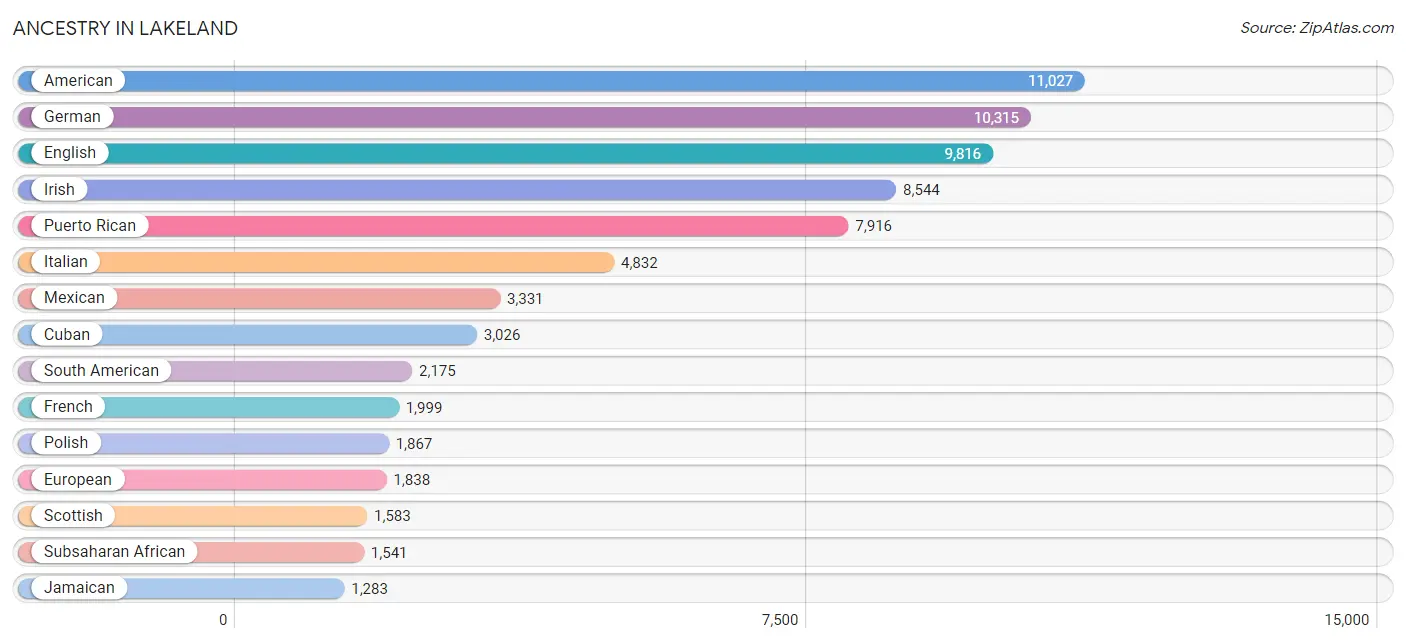
Ancestry in Lakeland
The most populous ancestries reported in Lakeland are American (11,027 | 9.6%), German (10,315 | 9.0%), English (9,816 | 8.6%), Irish (8,544 | 7.5%), and Puerto Rican (7,916 | 6.9%), together accounting for 41.6% of all Lakeland residents.
| Ancestry | # Population | % Population |
| African | 1,271 | 1.1% |
| Albanian | 7 | 0.0% |
| American | 11,027 | 9.6% |
| Arab | 385 | 0.3% |
| Australian | 14 | 0.0% |
| Austrian | 139 | 0.1% |
| Bahamian | 59 | 0.1% |
| Bangladeshi | 11 | 0.0% |
| Barbadian | 97 | 0.1% |
| Basque | 5 | 0.0% |
| Belgian | 19 | 0.0% |
| Belizean | 144 | 0.1% |
| Bhutanese | 164 | 0.1% |
| Bolivian | 168 | 0.2% |
| Brazilian | 135 | 0.1% |
| British | 1,264 | 1.1% |
| British West Indian | 97 | 0.1% |
| Burmese | 33 | 0.0% |
| Canadian | 497 | 0.4% |
| Cape Verdean | 31 | 0.0% |
| Celtic | 40 | 0.0% |
| Central American | 1,197 | 1.1% |
| Central American Indian | 249 | 0.2% |
| Cherokee | 269 | 0.2% |
| Chilean | 276 | 0.2% |
| Chippewa | 29 | 0.0% |
| Choctaw | 37 | 0.0% |
| Colombian | 514 | 0.4% |
| Costa Rican | 80 | 0.1% |
| Creek | 32 | 0.0% |
| Croatian | 42 | 0.0% |
| Cuban | 3,026 | 2.6% |
| Czech | 245 | 0.2% |
| Czechoslovakian | 35 | 0.0% |
| Danish | 168 | 0.2% |
| Dominican | 995 | 0.9% |
| Dutch | 1,107 | 1.0% |
| Dutch West Indian | 45 | 0.0% |
| Eastern European | 124 | 0.1% |
| Ecuadorian | 50 | 0.0% |
| English | 9,816 | 8.6% |
| European | 1,838 | 1.6% |
| Filipino | 43 | 0.0% |
| Finnish | 57 | 0.1% |
| French | 1,999 | 1.8% |
| French Canadian | 790 | 0.7% |
| German | 10,315 | 9.0% |
| Greek | 429 | 0.4% |
| Guatemalan | 253 | 0.2% |
| Guyanese | 68 | 0.1% |
| Haitian | 1,086 | 0.9% |
| Honduran | 178 | 0.2% |
| Hungarian | 447 | 0.4% |
| Icelander | 18 | 0.0% |
| Indian (Asian) | 280 | 0.2% |
| Iranian | 47 | 0.0% |
| Irish | 8,544 | 7.5% |
| Israeli | 33 | 0.0% |
| Italian | 4,832 | 4.2% |
| Jamaican | 1,283 | 1.1% |
| Japanese | 31 | 0.0% |
| Korean | 695 | 0.6% |
| Laotian | 23 | 0.0% |
| Lebanese | 144 | 0.1% |
| Liberian | 10 | 0.0% |
| Lithuanian | 115 | 0.1% |
| Lumbee | 28 | 0.0% |
| Menominee | 24 | 0.0% |
| Mexican | 3,331 | 2.9% |
| Moroccan | 44 | 0.0% |
| Native Hawaiian | 47 | 0.0% |
| Navajo | 197 | 0.2% |
| New Zealander | 13 | 0.0% |
| Nicaraguan | 276 | 0.2% |
| Nigerian | 194 | 0.2% |
| Northern European | 49 | 0.0% |
| Norwegian | 419 | 0.4% |
| Ottawa | 3 | 0.0% |
| Pakistani | 141 | 0.1% |
| Palestinian | 57 | 0.1% |
| Panamanian | 132 | 0.1% |
| Pennsylvania German | 9 | 0.0% |
| Peruvian | 295 | 0.3% |
| Polish | 1,867 | 1.6% |
| Portuguese | 270 | 0.2% |
| Puerto Rican | 7,916 | 6.9% |
| Romanian | 121 | 0.1% |
| Russian | 290 | 0.3% |
| Salvadoran | 278 | 0.2% |
| Samoan | 9 | 0.0% |
| Scandinavian | 234 | 0.2% |
| Scotch-Irish | 1,223 | 1.1% |
| Scottish | 1,583 | 1.4% |
| Seminole | 11 | 0.0% |
| Slavic | 78 | 0.1% |
| Slovak | 80 | 0.1% |
| Slovene | 25 | 0.0% |
| South African | 24 | 0.0% |
| South American | 2,175 | 1.9% |
| South American Indian | 258 | 0.2% |
| Spaniard | 240 | 0.2% |
| Spanish | 287 | 0.3% |
| Spanish American | 25 | 0.0% |
| Sri Lankan | 127 | 0.1% |
| Subsaharan African | 1,541 | 1.3% |
| Swedish | 680 | 0.6% |
| Swiss | 148 | 0.1% |
| Syrian | 20 | 0.0% |
| Thai | 984 | 0.9% |
| Trinidadian and Tobagonian | 42 | 0.0% |
| Turkish | 75 | 0.1% |
| Ukrainian | 59 | 0.1% |
| Uruguayan | 14 | 0.0% |
| Venezuelan | 858 | 0.7% |
| Vietnamese | 32 | 0.0% |
| Welsh | 606 | 0.5% |
| West Indian | 68 | 0.1% |
| Yaqui | 5 | 0.0% |
| Yugoslavian | 1 | 0.0% | View All 119 Rows |
Immigrants in Lakeland
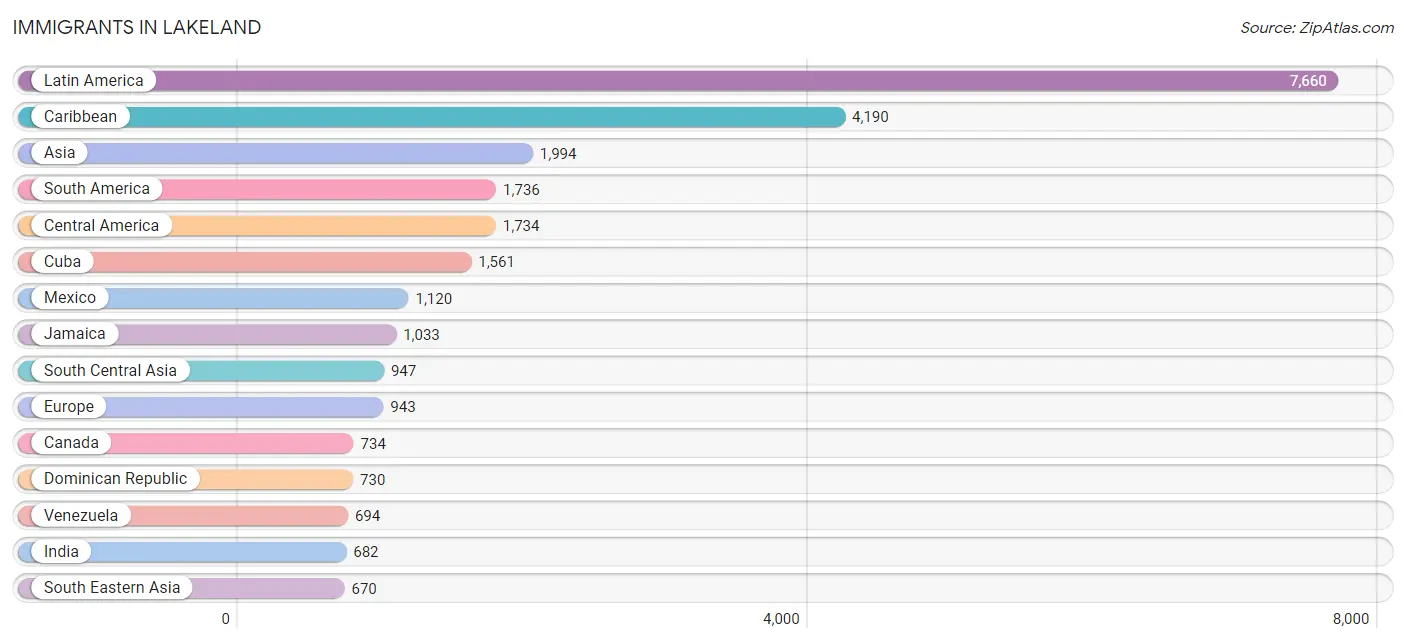
The most numerous immigrant groups reported in Lakeland came from Latin America (7,660 | 6.7%), Caribbean (4,190 | 3.7%), Asia (1,994 | 1.7%), South America (1,736 | 1.5%), and Central America (1,734 | 1.5%), together accounting for 15.1% of all Lakeland residents.
| Immigration Origin | # Population | % Population |
| Africa | 409 | 0.4% |
| Asia | 1,994 | 1.7% |
| Australia | 14 | 0.0% |
| Austria | 31 | 0.0% |
| Bangladesh | 243 | 0.2% |
| Barbados | 27 | 0.0% |
| Belize | 20 | 0.0% |
| Bolivia | 111 | 0.1% |
| Bosnia and Herzegovina | 1 | 0.0% |
| Brazil | 98 | 0.1% |
| Cabo Verde | 12 | 0.0% |
| Cambodia | 10 | 0.0% |
| Canada | 734 | 0.6% |
| Caribbean | 4,190 | 3.7% |
| Central America | 1,734 | 1.5% |
| Chile | 60 | 0.1% |
| China | 150 | 0.1% |
| Colombia | 430 | 0.4% |
| Costa Rica | 39 | 0.0% |
| Cuba | 1,561 | 1.4% |
| Denmark | 20 | 0.0% |
| Dominica | 48 | 0.0% |
| Dominican Republic | 730 | 0.6% |
| Eastern Africa | 15 | 0.0% |
| Eastern Asia | 247 | 0.2% |
| Eastern Europe | 157 | 0.1% |
| Ecuador | 50 | 0.0% |
| El Salvador | 83 | 0.1% |
| England | 178 | 0.2% |
| Europe | 943 | 0.8% |
| France | 25 | 0.0% |
| Germany | 92 | 0.1% |
| Ghana | 9 | 0.0% |
| Greece | 15 | 0.0% |
| Guatemala | 270 | 0.2% |
| Guyana | 73 | 0.1% |
| Haiti | 618 | 0.5% |
| Honduras | 104 | 0.1% |
| Hungary | 26 | 0.0% |
| India | 682 | 0.6% |
| Indonesia | 31 | 0.0% |
| Iran | 9 | 0.0% |
| Israel | 14 | 0.0% |
| Italy | 8 | 0.0% |
| Jamaica | 1,033 | 0.9% |
| Japan | 76 | 0.1% |
| Korea | 21 | 0.0% |
| Latin America | 7,660 | 6.7% |
| Lebanon | 32 | 0.0% |
| Liberia | 12 | 0.0% |
| Mexico | 1,120 | 1.0% |
| Moldova | 25 | 0.0% |
| Morocco | 36 | 0.0% |
| Netherlands | 10 | 0.0% |
| Nicaragua | 76 | 0.1% |
| Nigeria | 130 | 0.1% |
| Northern Africa | 36 | 0.0% |
| Northern Europe | 466 | 0.4% |
| Norway | 10 | 0.0% |
| Oceania | 27 | 0.0% |
| Panama | 22 | 0.0% |
| Peru | 198 | 0.2% |
| Philippines | 392 | 0.3% |
| Poland | 24 | 0.0% |
| Portugal | 30 | 0.0% |
| Russia | 53 | 0.1% |
| Scotland | 13 | 0.0% |
| South Africa | 159 | 0.1% |
| South America | 1,736 | 1.5% |
| South Central Asia | 947 | 0.8% |
| South Eastern Asia | 670 | 0.6% |
| Southern Europe | 149 | 0.1% |
| Spain | 96 | 0.1% |
| Switzerland | 13 | 0.0% |
| Syria | 9 | 0.0% |
| Taiwan | 42 | 0.0% |
| Thailand | 96 | 0.1% |
| Trinidad and Tobago | 104 | 0.1% |
| Turkey | 75 | 0.1% |
| Ukraine | 7 | 0.0% |
| Uzbekistan | 13 | 0.0% |
| Venezuela | 694 | 0.6% |
| Vietnam | 141 | 0.1% |
| Western Africa | 163 | 0.1% |
| Western Asia | 130 | 0.1% |
| Western Europe | 171 | 0.2% | View All 86 Rows |
Sex and Age in Lakeland
Sex and Age in Lakeland
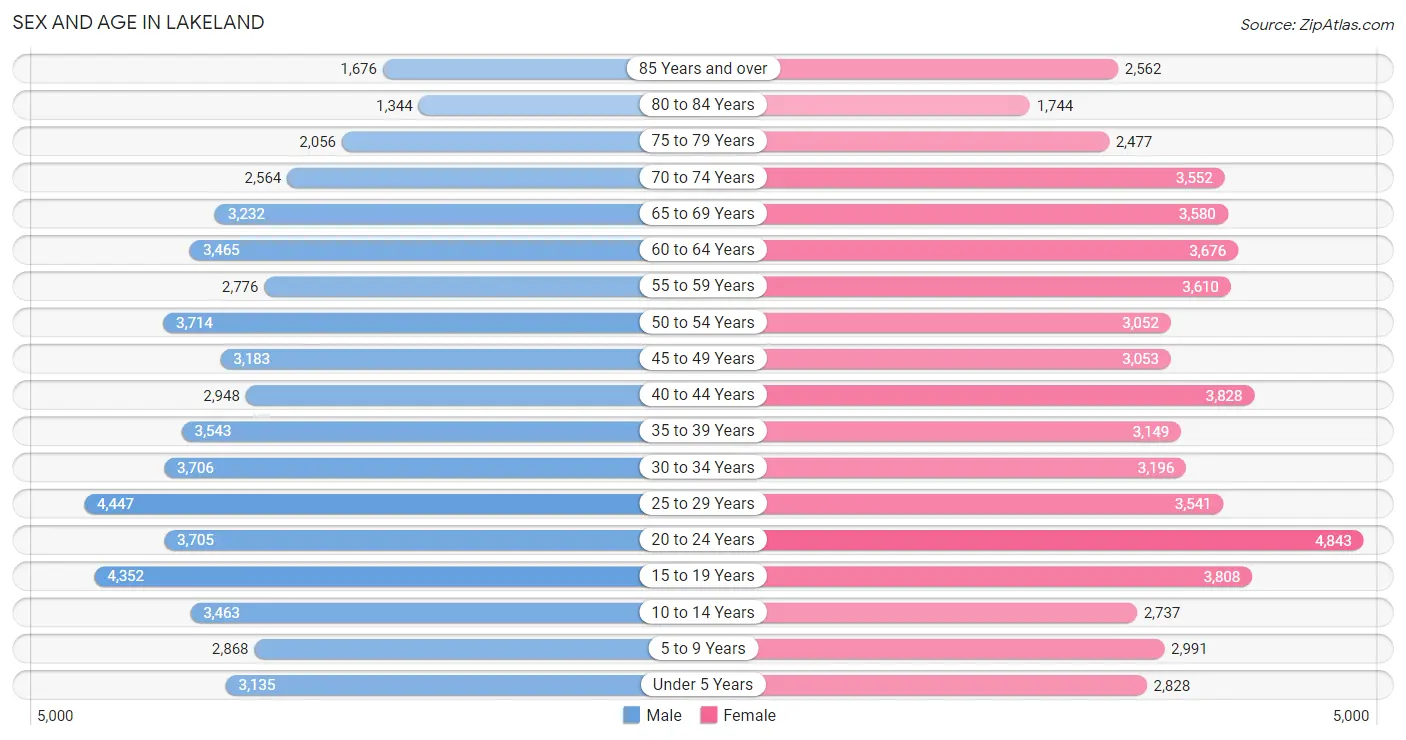
The most populous age groups in Lakeland are 25 to 29 Years (4,447 | 7.9%) for men and 20 to 24 Years (4,843 | 8.3%) for women.
| Age Bracket | Male | Female |
| Under 5 Years | 3,135 (5.6%) | 2,828 (4.9%) |
| 5 to 9 Years | 2,868 (5.1%) | 2,991 (5.1%) |
| 10 to 14 Years | 3,463 (6.2%) | 2,737 (4.7%) |
| 15 to 19 Years | 4,352 (7.7%) | 3,808 (6.5%) |
| 20 to 24 Years | 3,705 (6.6%) | 4,843 (8.3%) |
| 25 to 29 Years | 4,447 (7.9%) | 3,541 (6.1%) |
| 30 to 34 Years | 3,706 (6.6%) | 3,196 (5.5%) |
| 35 to 39 Years | 3,543 (6.3%) | 3,149 (5.4%) |
| 40 to 44 Years | 2,948 (5.2%) | 3,828 (6.6%) |
| 45 to 49 Years | 3,183 (5.7%) | 3,053 (5.2%) |
| 50 to 54 Years | 3,714 (6.6%) | 3,052 (5.2%) |
| 55 to 59 Years | 2,776 (4.9%) | 3,610 (6.2%) |
| 60 to 64 Years | 3,465 (6.2%) | 3,676 (6.3%) |
| 65 to 69 Years | 3,232 (5.8%) | 3,580 (6.1%) |
| 70 to 74 Years | 2,564 (4.6%) | 3,552 (6.1%) |
| 75 to 79 Years | 2,056 (3.7%) | 2,477 (4.3%) |
| 80 to 84 Years | 1,344 (2.4%) | 1,744 (3.0%) |
| 85 Years and over | 1,676 (3.0%) | 2,562 (4.4%) |
| Total | 56,177 (100.0%) | 58,227 (100.0%) |
Families and Households in Lakeland
Median Family Size in Lakeland
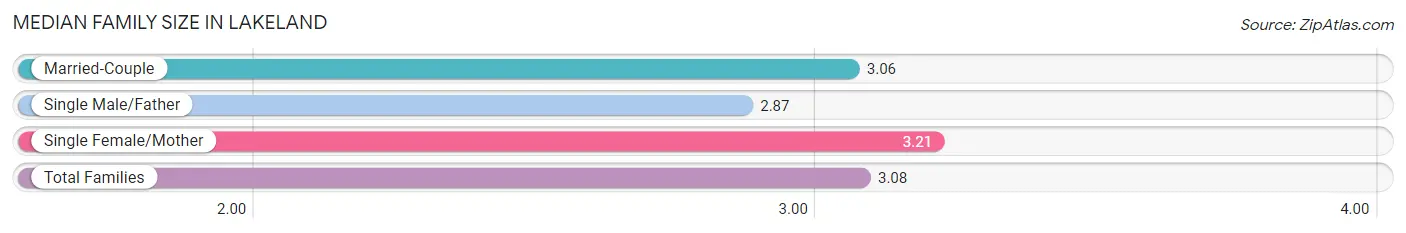
The median family size in Lakeland is 3.08 persons per family, with single female/mother families (5,742 | 21.6%) accounting for the largest median family size of 3.21 persons per family. On the other hand, single male/father families (2,490 | 9.4%) represent the smallest median family size with 2.87 persons per family.
| Family Type | # Families | Family Size |
| Married-Couple | 18,365 (69.1%) | 3.06 |
| Single Male/Father | 2,490 (9.4%) | 2.87 |
| Single Female/Mother | 5,742 (21.6%) | 3.21 |
| Total Families | 26,597 (100.0%) | 3.08 |
Median Household Size in Lakeland
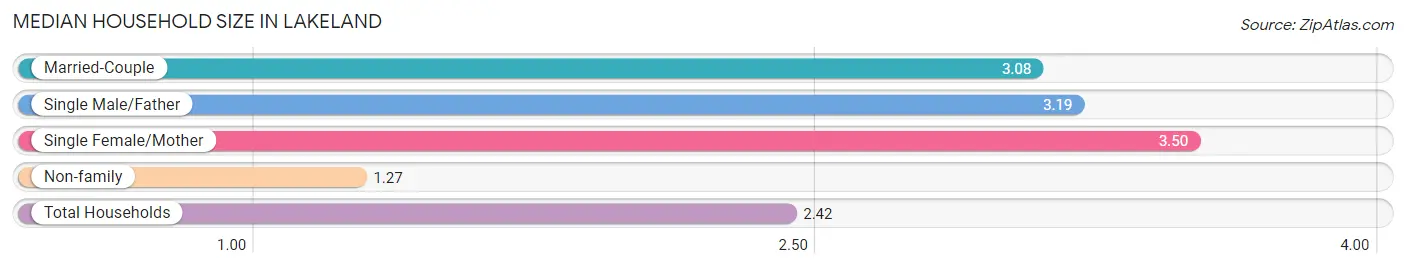
The median household size in Lakeland is 2.42 persons per household, with single female/mother households (5,742 | 13.0%) accounting for the largest median household size of 3.5 persons per household. non-family households (17,726 | 40.0%) represent the smallest median household size with 1.27 persons per household.
| Household Type | # Households | Household Size |
| Married-Couple | 18,365 (41.4%) | 3.08 |
| Single Male/Father | 2,490 (5.6%) | 3.19 |
| Single Female/Mother | 5,742 (13.0%) | 3.50 |
| Non-family | 17,726 (40.0%) | 1.27 |
| Total Households | 44,323 (100.0%) | 2.42 |
Household Size by Marriage Status in Lakeland
Out of a total of 44,323 households in Lakeland, 26,597 (60.0%) are family households, while 17,726 (40.0%) are nonfamily households. The most numerous type of family households are 2-person households, comprising 13,066, and the most common type of nonfamily households are 1-person households, comprising 14,285.
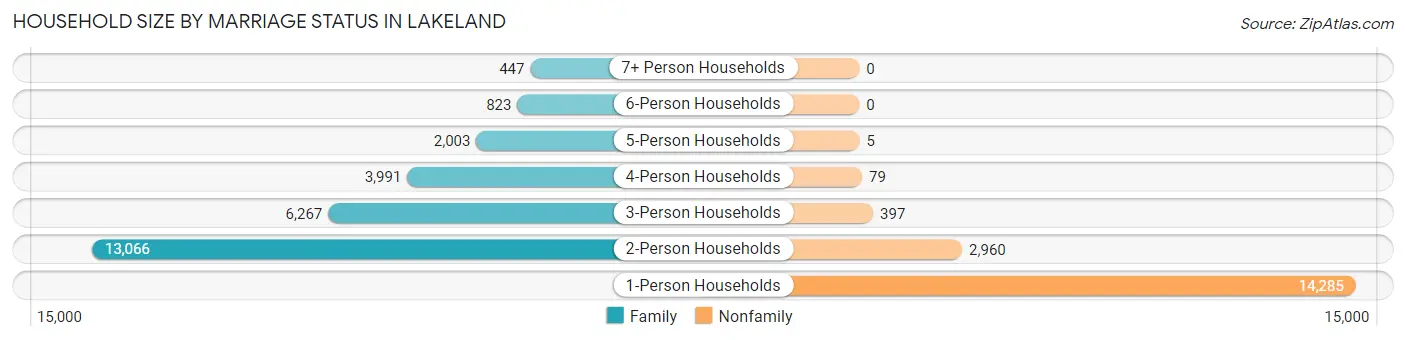
| Household Size | Family Households | Nonfamily Households |
| 1-Person Households | - | 14,285 (32.2%) |
| 2-Person Households | 13,066 (29.5%) | 2,960 (6.7%) |
| 3-Person Households | 6,267 (14.1%) | 397 (0.9%) |
| 4-Person Households | 3,991 (9.0%) | 79 (0.2%) |
| 5-Person Households | 2,003 (4.5%) | 5 (0.0%) |
| 6-Person Households | 823 (1.9%) | 0 (0.0%) |
| 7+ Person Households | 447 (1.0%) | 0 (0.0%) |
| Total | 26,597 (60.0%) | 17,726 (40.0%) |
Female Fertility in Lakeland
Fertility by Age in Lakeland
Average fertility rate in Lakeland is 43.0 births per 1,000 women. Women in the age bracket of 20 to 34 years have the highest fertility rate with 67.0 births per 1,000 women. Women in the age bracket of 20 to 34 years acount for 68.8% of all women with births.
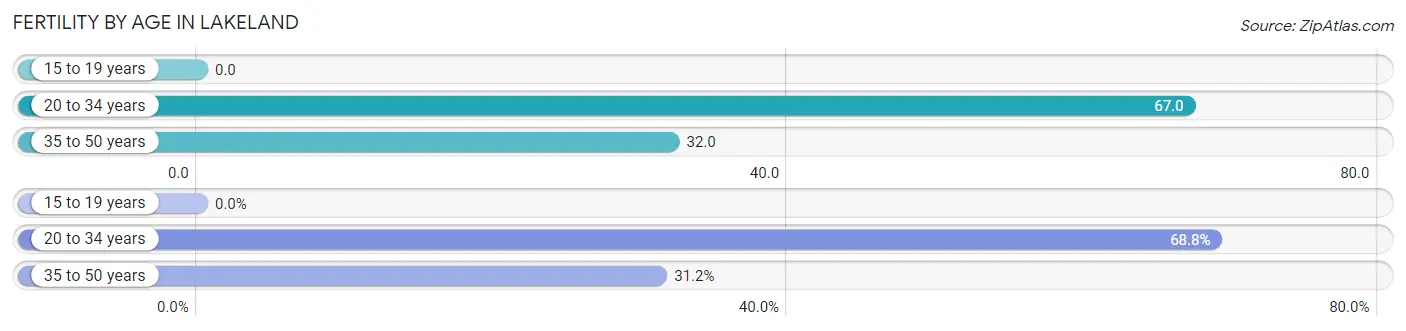
| Age Bracket | Women with Births | Births / 1,000 Women |
| 15 to 19 years | 0 (0.0%) | 0.0 |
| 20 to 34 years | 775 (68.8%) | 67.0 |
| 35 to 50 years | 351 (31.2%) | 32.0 |
| Total | 1,126 (100.0%) | 43.0 |
Fertility by Age by Marriage Status in Lakeland
47.4% of women with births (1,126) in Lakeland are married. The highest percentage of unmarried women with births falls into 35 to 50 years age bracket with 68.4% of them unmarried at the time of birth, while the lowest percentage of unmarried women with births belong to 20 to 34 years age bracket with 45.4% of them unmarried.
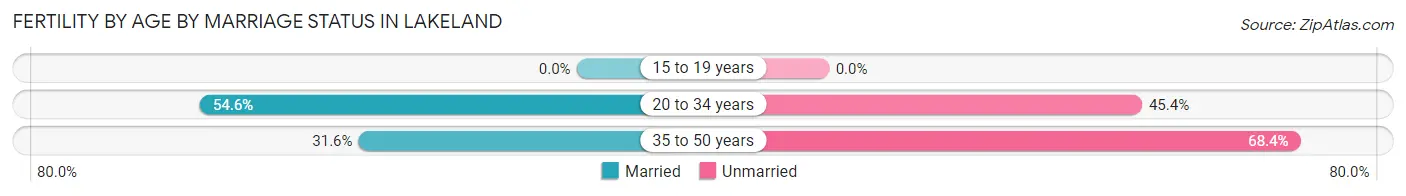
| Age Bracket | Married | Unmarried |
| 15 to 19 years | 0 (0.0%) | 0 (0.0%) |
| 20 to 34 years | 423 (54.6%) | 352 (45.4%) |
| 35 to 50 years | 111 (31.6%) | 240 (68.4%) |
| Total | 534 (47.4%) | 592 (52.6%) |
Fertility by Education in Lakeland
Average fertility rate in Lakeland is 43.0 births per 1,000 women. Women with the education attainment of bachelor's degree have the highest fertility rate of 79.0 births per 1,000 women, while women with the education attainment of less than high school have the lowest fertility at 15.0 births per 1,000 women. Women with the education attainment of college or associate's degree represent 41.6% of all women with births.
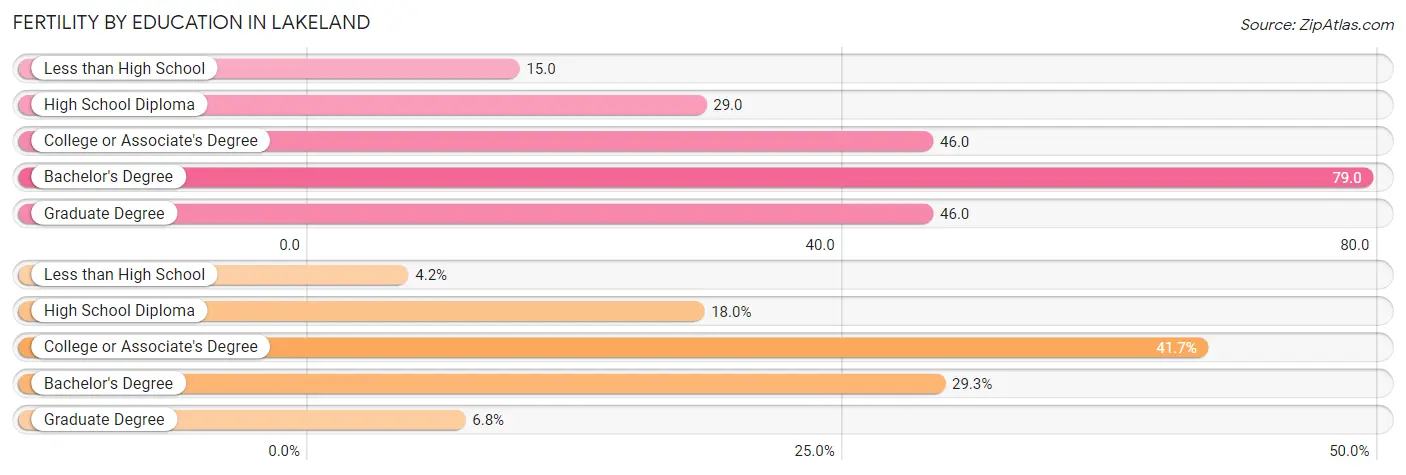
| Educational Attainment | Women with Births | Births / 1,000 Women |
| Less than High School | 47 (4.2%) | 15.0 |
| High School Diploma | 203 (18.0%) | 29.0 |
| College or Associate's Degree | 469 (41.6%) | 46.0 |
| Bachelor's Degree | 330 (29.3%) | 79.0 |
| Graduate Degree | 77 (6.8%) | 46.0 |
| Total | 1,126 (100.0%) | 43.0 |
Fertility by Education by Marriage Status in Lakeland
52.6% of women with births in Lakeland are unmarried. Women with the educational attainment of bachelor's degree are most likely to be married with 81.5% of them married at childbirth, while women with the educational attainment of high school diploma are least likely to be married with 82.3% of them unmarried at childbirth.
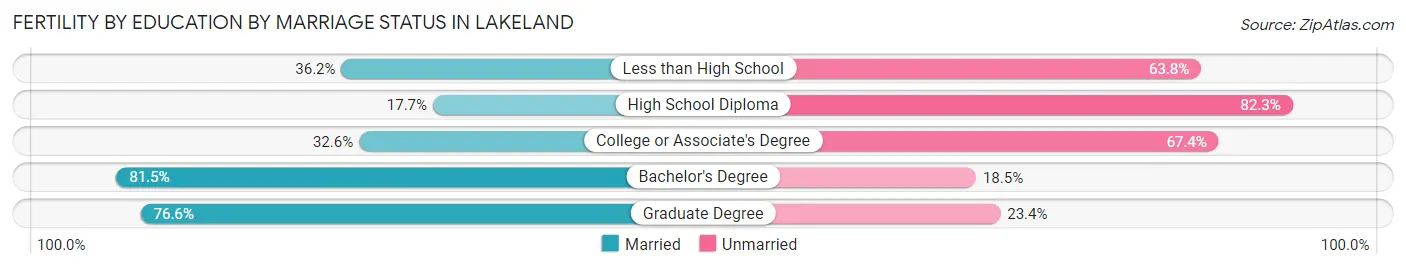
| Educational Attainment | Married | Unmarried |
| Less than High School | 17 (36.2%) | 30 (63.8%) |
| High School Diploma | 36 (17.7%) | 167 (82.3%) |
| College or Associate's Degree | 153 (32.6%) | 316 (67.4%) |
| Bachelor's Degree | 269 (81.5%) | 61 (18.5%) |
| Graduate Degree | 59 (76.6%) | 18 (23.4%) |
| Total | 534 (47.4%) | 592 (52.6%) |
Employment Characteristics in Lakeland
Employment by Class of Employer in Lakeland
Among the 49,267 employed individuals in Lakeland, private company employees (35,257 | 71.6%), not-for-profit organizations (4,716 | 9.6%), and local government employees (3,192 | 6.5%) make up the most common classes of employment.
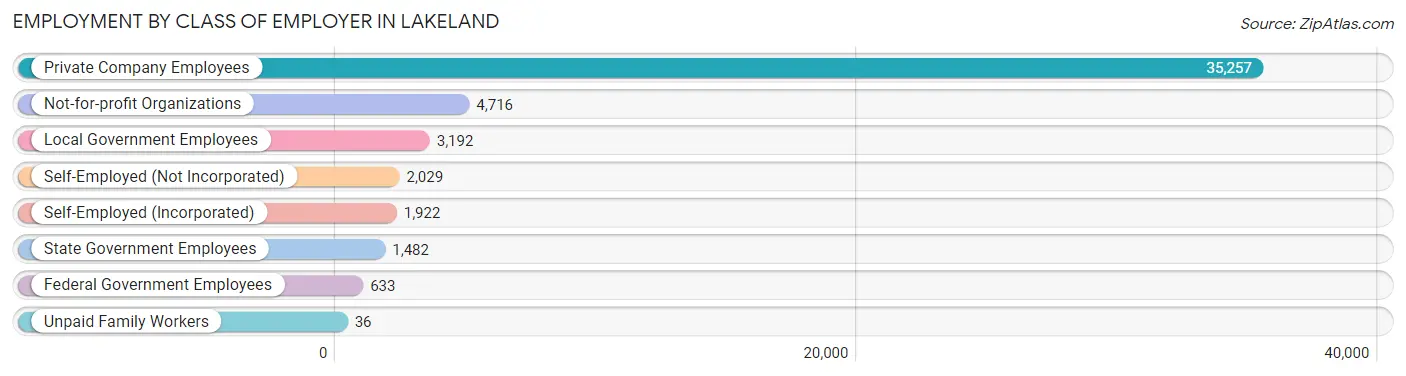
| Employer Class | # Employees | % Employees |
| Private Company Employees | 35,257 | 71.6% |
| Self-Employed (Incorporated) | 1,922 | 3.9% |
| Self-Employed (Not Incorporated) | 2,029 | 4.1% |
| Not-for-profit Organizations | 4,716 | 9.6% |
| Local Government Employees | 3,192 | 6.5% |
| State Government Employees | 1,482 | 3.0% |
| Federal Government Employees | 633 | 1.3% |
| Unpaid Family Workers | 36 | 0.1% |
| Total | 49,267 | 100.0% |
Employment Status by Age in Lakeland
According to the labor force statistics for Lakeland, out of the total population over 16 years of age (95,371), 55.3% or 52,740 individuals are in the labor force, with 5.4% or 2,848 of them unemployed. The age group with the highest labor force participation rate is 25 to 29 years, with 88.4% or 7,061 individuals in the labor force. Within the labor force, the 16 to 19 years age range has the highest percentage of unemployed individuals, with 8.8% or 170 of them being unemployed.
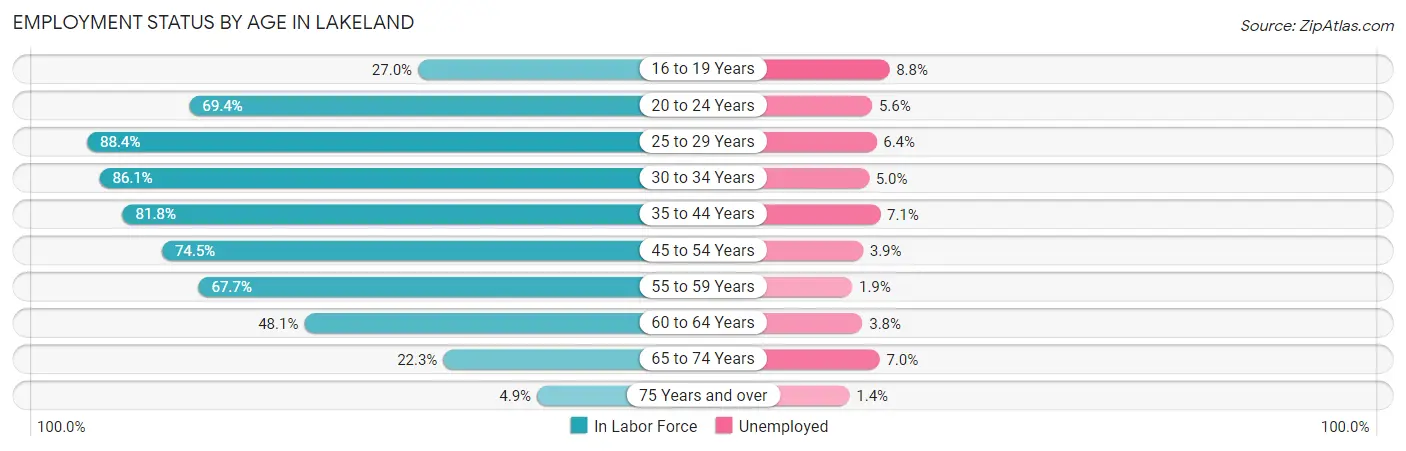
| Age Bracket | In Labor Force | Unemployed |
| 16 to 19 Years | 1,930 (27.0%) | 170 (8.8%) |
| 20 to 24 Years | 5,932 (69.4%) | 332 (5.6%) |
| 25 to 29 Years | 7,061 (88.4%) | 452 (6.4%) |
| 30 to 34 Years | 5,943 (86.1%) | 297 (5.0%) |
| 35 to 44 Years | 11,017 (81.8%) | 782 (7.1%) |
| 45 to 54 Years | 9,686 (74.5%) | 378 (3.9%) |
| 55 to 59 Years | 4,323 (67.7%) | 82 (1.9%) |
| 60 to 64 Years | 3,435 (48.1%) | 131 (3.8%) |
| 65 to 74 Years | 2,883 (22.3%) | 202 (7.0%) |
| 75 Years and over | 581 (4.9%) | 8 (1.4%) |
| Total | 52,740 (55.3%) | 2,848 (5.4%) |
Employment Status by Educational Attainment in Lakeland
According to labor force statistics for Lakeland, 75.5% of individuals (41,440) out of the total population between 25 and 64 years of age (54,887) are in the labor force, with 5.1% or 2,113 of them being unemployed. The group with the highest labor force participation rate are those with the educational attainment of bachelor's degree or higher, with 87.7% or 13,077 individuals in the labor force. Within the labor force, individuals with high school diploma education have the highest percentage of unemployment, with 7.0% or 887 of them being unemployed.
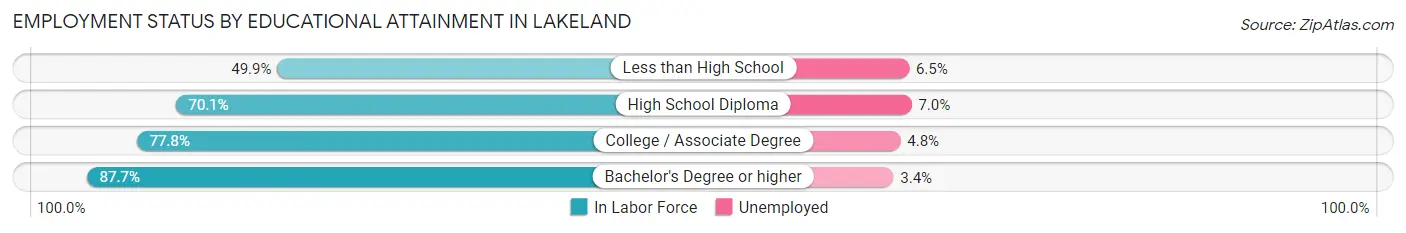
| Educational Attainment | In Labor Force | Unemployed |
| Less than High School | 2,387 (49.9%) | 311 (6.5%) |
| High School Diploma | 12,675 (70.1%) | 1,266 (7.0%) |
| College / Associate Degree | 13,312 (77.8%) | 821 (4.8%) |
| Bachelor's Degree or higher | 13,077 (87.7%) | 507 (3.4%) |
| Total | 41,440 (75.5%) | 2,799 (5.1%) |
Employment Occupations by Sex in Lakeland
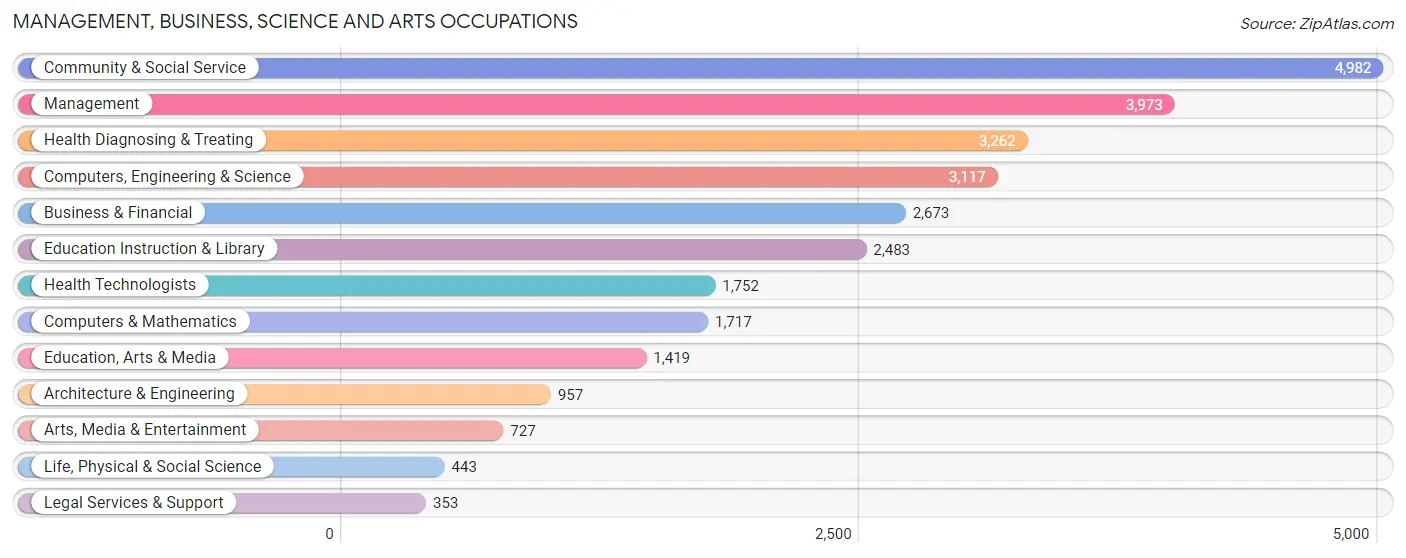
Management, Business, Science and Arts Occupations
The most common Management, Business, Science and Arts occupations in Lakeland are Community & Social Service (4,982 | 10.0%), Management (3,973 | 8.0%), Health Diagnosing & Treating (3,262 | 6.6%), Computers, Engineering & Science (3,117 | 6.3%), and Business & Financial (2,673 | 5.4%).
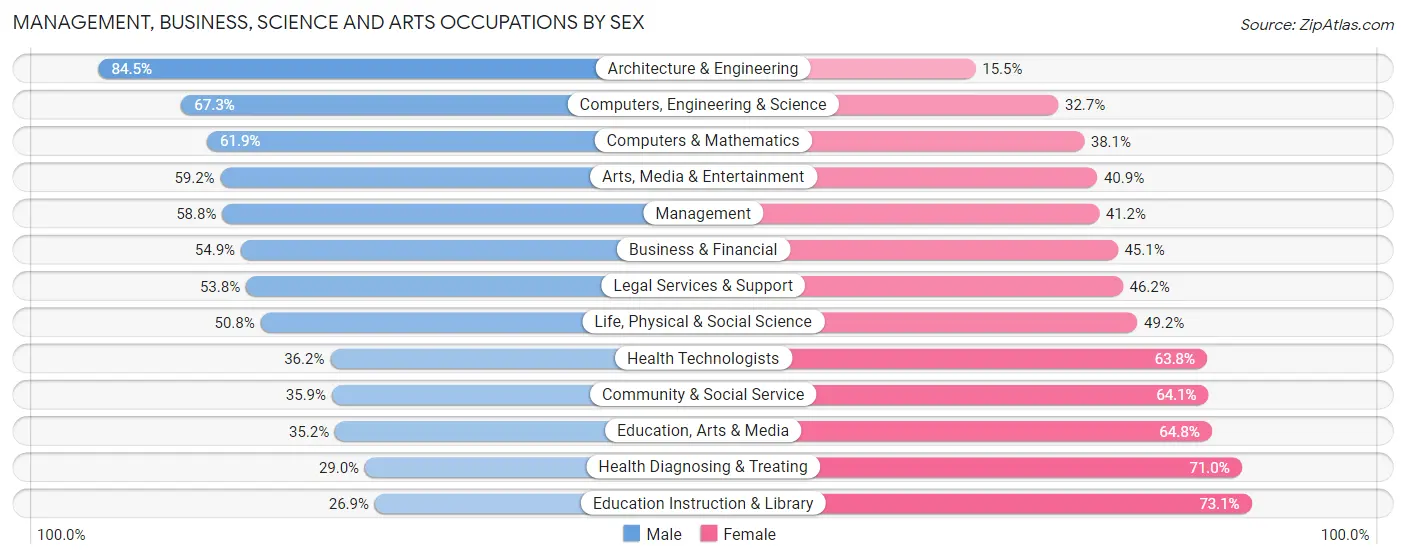
Management, Business, Science and Arts Occupations by Sex
Within the Management, Business, Science and Arts occupations in Lakeland, the most male-oriented occupations are Architecture & Engineering (84.5%), Computers, Engineering & Science (67.3%), and Computers & Mathematics (61.9%), while the most female-oriented occupations are Education Instruction & Library (73.1%), Health Diagnosing & Treating (71.0%), and Education, Arts & Media (64.8%).
| Occupation | Male | Female |
| Management | 2,335 (58.8%) | 1,638 (41.2%) |
| Business & Financial | 1,467 (54.9%) | 1,206 (45.1%) |
| Computers, Engineering & Science | 2,097 (67.3%) | 1,020 (32.7%) |
| Computers & Mathematics | 1,063 (61.9%) | 654 (38.1%) |
| Architecture & Engineering | 809 (84.5%) | 148 (15.5%) |
| Life, Physical & Social Science | 225 (50.8%) | 218 (49.2%) |
| Community & Social Service | 1,789 (35.9%) | 3,193 (64.1%) |
| Education, Arts & Media | 500 (35.2%) | 919 (64.8%) |
| Legal Services & Support | 190 (53.8%) | 163 (46.2%) |
| Education Instruction & Library | 669 (26.9%) | 1,814 (73.1%) |
| Arts, Media & Entertainment | 430 (59.2%) | 297 (40.8%) |
| Health Diagnosing & Treating | 946 (29.0%) | 2,316 (71.0%) |
| Health Technologists | 635 (36.2%) | 1,117 (63.8%) |
| Total (Category) | 8,634 (47.9%) | 9,373 (52.0%) |
| Total (Overall) | 26,119 (52.5%) | 23,640 (47.5%) |
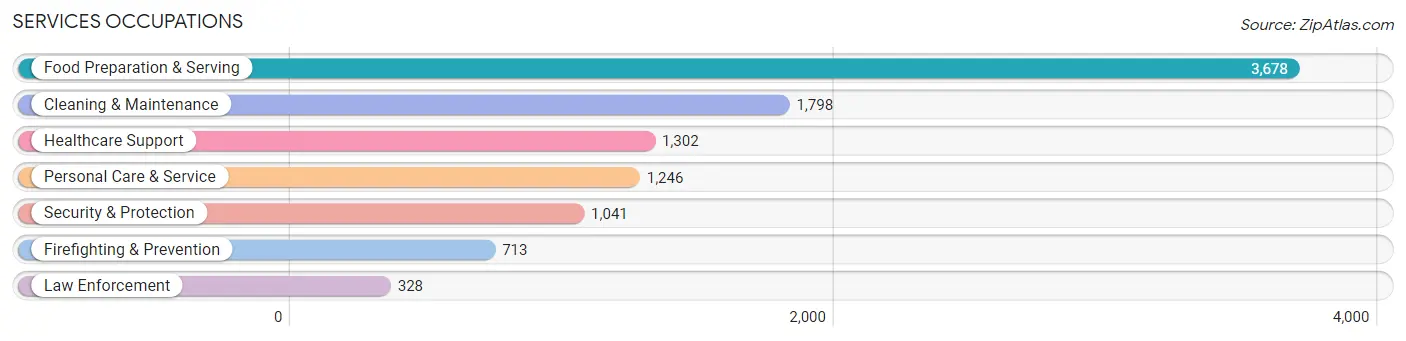
Services Occupations
The most common Services occupations in Lakeland are Food Preparation & Serving (3,678 | 7.4%), Cleaning & Maintenance (1,798 | 3.6%), Healthcare Support (1,302 | 2.6%), Personal Care & Service (1,246 | 2.5%), and Security & Protection (1,041 | 2.1%).
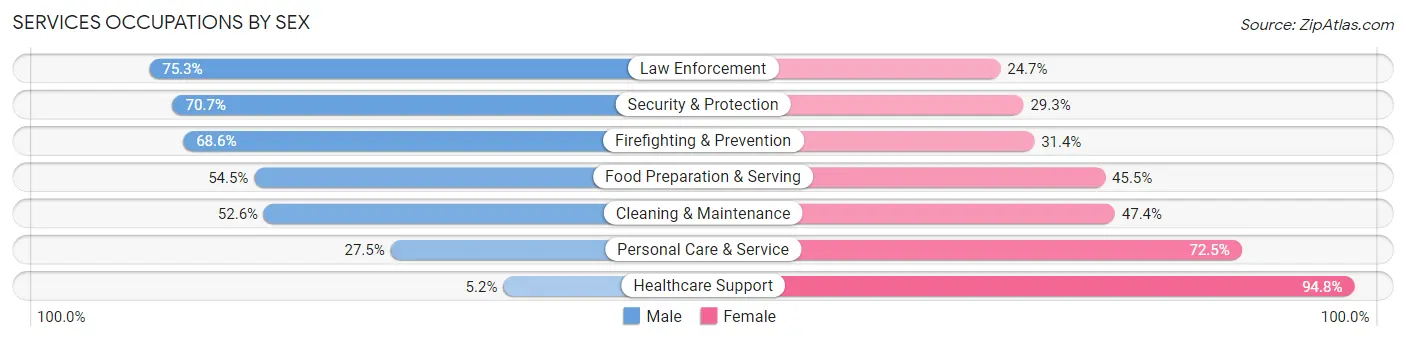
Services Occupations by Sex
Within the Services occupations in Lakeland, the most male-oriented occupations are Law Enforcement (75.3%), Security & Protection (70.7%), and Firefighting & Prevention (68.6%), while the most female-oriented occupations are Healthcare Support (94.8%), Personal Care & Service (72.5%), and Cleaning & Maintenance (47.4%).
| Occupation | Male | Female |
| Healthcare Support | 68 (5.2%) | 1,234 (94.8%) |
| Security & Protection | 736 (70.7%) | 305 (29.3%) |
| Firefighting & Prevention | 489 (68.6%) | 224 (31.4%) |
| Law Enforcement | 247 (75.3%) | 81 (24.7%) |
| Food Preparation & Serving | 2,006 (54.5%) | 1,672 (45.5%) |
| Cleaning & Maintenance | 946 (52.6%) | 852 (47.4%) |
| Personal Care & Service | 343 (27.5%) | 903 (72.5%) |
| Total (Category) | 4,099 (45.2%) | 4,966 (54.8%) |
| Total (Overall) | 26,119 (52.5%) | 23,640 (47.5%) |
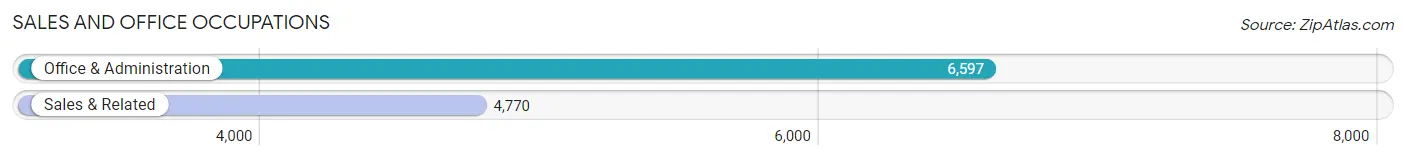
Sales and Office Occupations
The most common Sales and Office occupations in Lakeland are Office & Administration (6,597 | 13.3%), and Sales & Related (4,770 | 9.6%).
Sales and Office Occupations by Sex
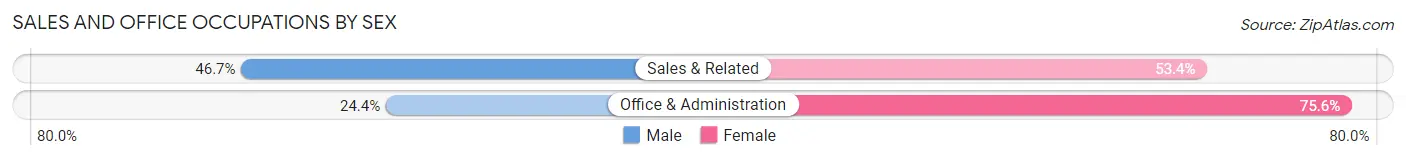
| Occupation | Male | Female |
| Sales & Related | 2,225 (46.7%) | 2,545 (53.3%) |
| Office & Administration | 1,609 (24.4%) | 4,988 (75.6%) |
| Total (Category) | 3,834 (33.7%) | 7,533 (66.3%) |
| Total (Overall) | 26,119 (52.5%) | 23,640 (47.5%) |
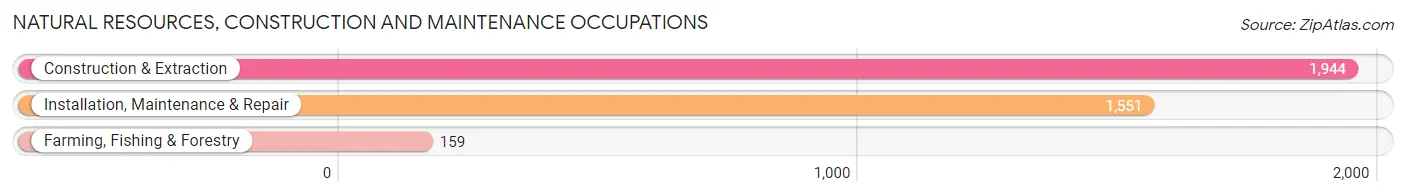
Natural Resources, Construction and Maintenance Occupations
The most common Natural Resources, Construction and Maintenance occupations in Lakeland are Construction & Extraction (1,944 | 3.9%), Installation, Maintenance & Repair (1,551 | 3.1%), and Farming, Fishing & Forestry (159 | 0.3%).
Natural Resources, Construction and Maintenance Occupations by Sex
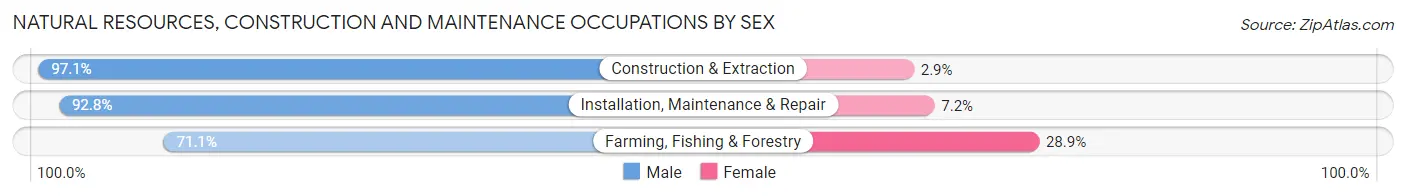
| Occupation | Male | Female |
| Farming, Fishing & Forestry | 113 (71.1%) | 46 (28.9%) |
| Construction & Extraction | 1,888 (97.1%) | 56 (2.9%) |
| Installation, Maintenance & Repair | 1,440 (92.8%) | 111 (7.2%) |
| Total (Category) | 3,441 (94.2%) | 213 (5.8%) |
| Total (Overall) | 26,119 (52.5%) | 23,640 (47.5%) |
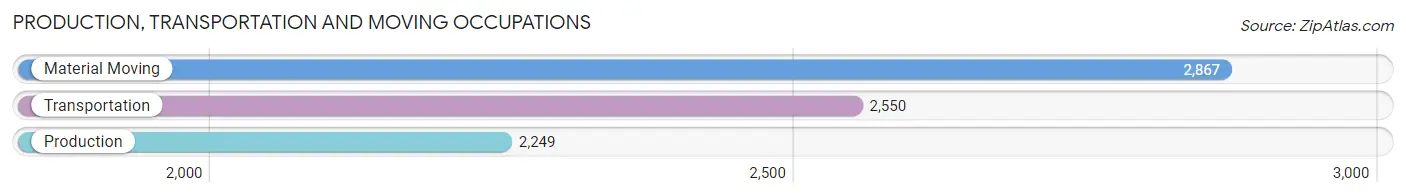
Production, Transportation and Moving Occupations
The most common Production, Transportation and Moving occupations in Lakeland are Material Moving (2,867 | 5.8%), Transportation (2,550 | 5.1%), and Production (2,249 | 4.5%).
Production, Transportation and Moving Occupations by Sex
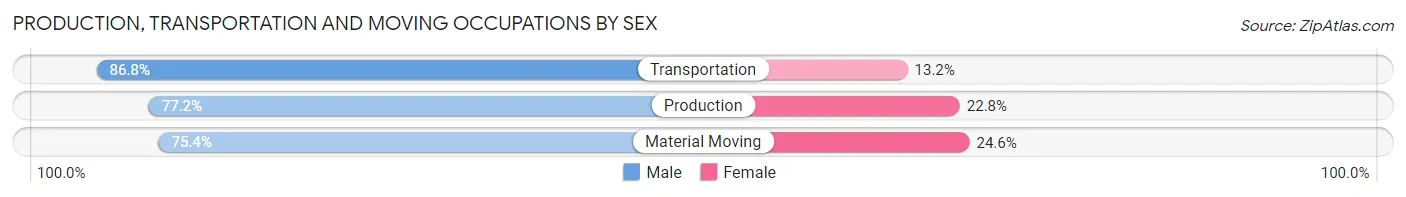
| Occupation | Male | Female |
| Production | 1,736 (77.2%) | 513 (22.8%) |
| Transportation | 2,213 (86.8%) | 337 (13.2%) |
| Material Moving | 2,162 (75.4%) | 705 (24.6%) |
| Total (Category) | 6,111 (79.7%) | 1,555 (20.3%) |
| Total (Overall) | 26,119 (52.5%) | 23,640 (47.5%) |
Employment Industries by Sex in Lakeland
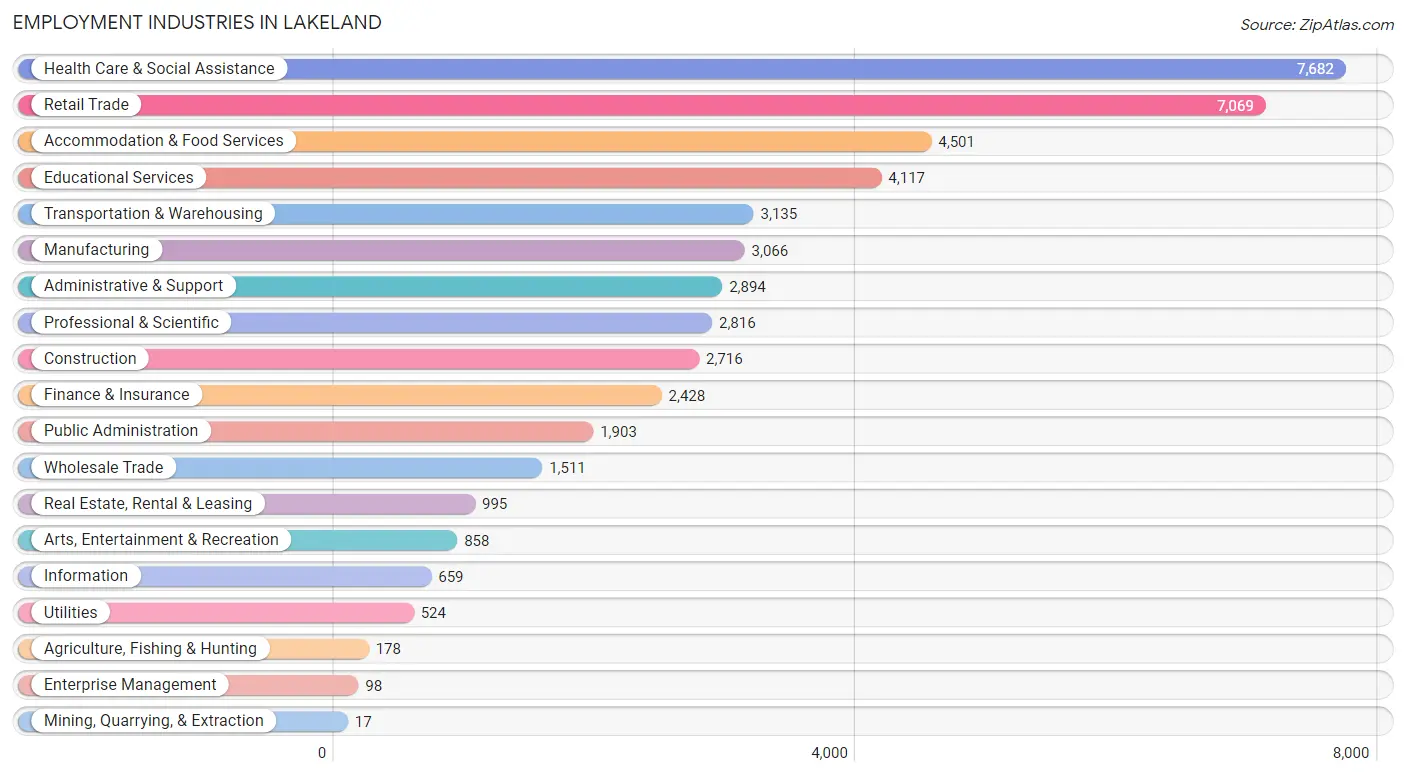
Employment Industries in Lakeland
The major employment industries in Lakeland include Health Care & Social Assistance (7,682 | 15.4%), Retail Trade (7,069 | 14.2%), Accommodation & Food Services (4,501 | 9.0%), Educational Services (4,117 | 8.3%), and Transportation & Warehousing (3,135 | 6.3%).
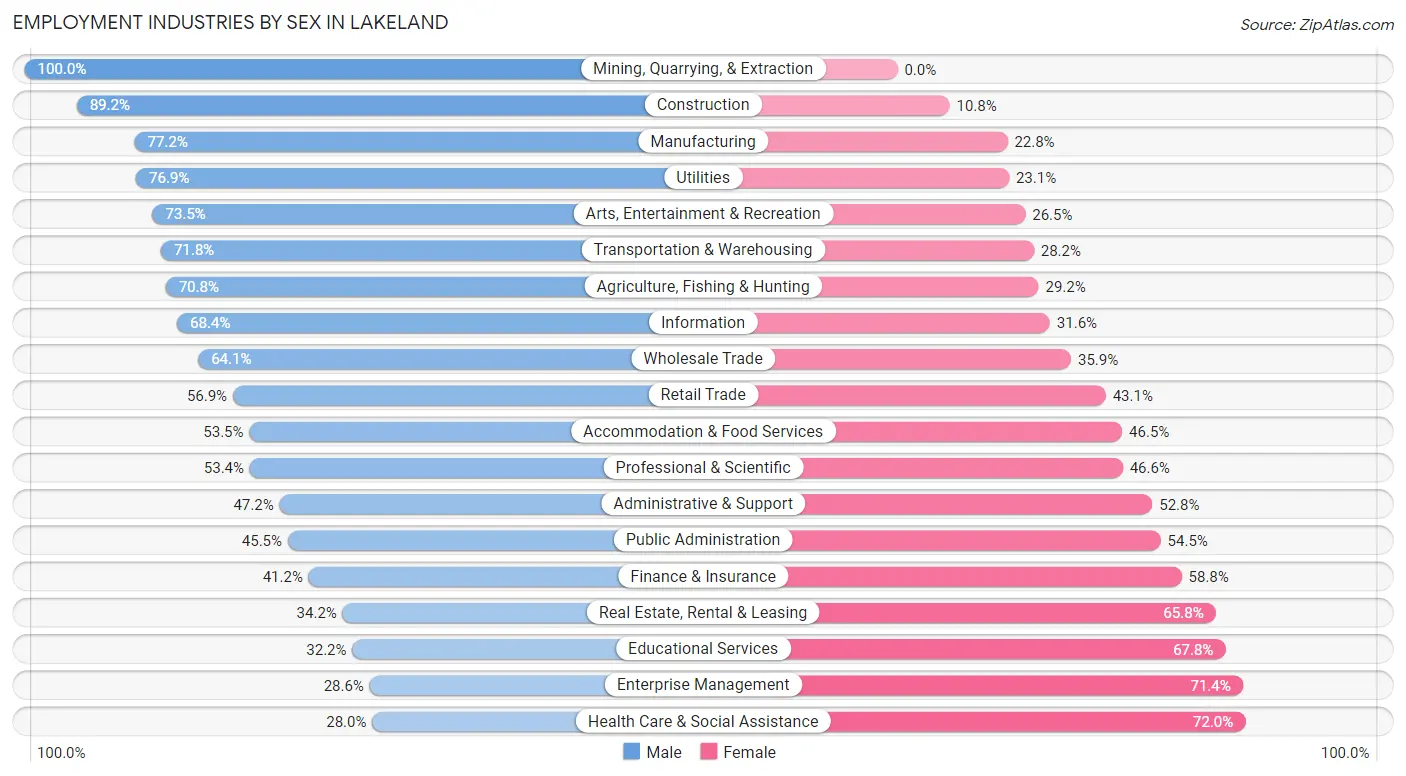
Employment Industries by Sex in Lakeland
The Lakeland industries that see more men than women are Mining, Quarrying, & Extraction (100.0%), Construction (89.2%), and Manufacturing (77.2%), whereas the industries that tend to have a higher number of women are Health Care & Social Assistance (72.0%), Enterprise Management (71.4%), and Educational Services (67.8%).
| Industry | Male | Female |
| Agriculture, Fishing & Hunting | 126 (70.8%) | 52 (29.2%) |
| Mining, Quarrying, & Extraction | 17 (100.0%) | 0 (0.0%) |
| Construction | 2,423 (89.2%) | 293 (10.8%) |
| Manufacturing | 2,368 (77.2%) | 698 (22.8%) |
| Wholesale Trade | 968 (64.1%) | 543 (35.9%) |
| Retail Trade | 4,021 (56.9%) | 3,048 (43.1%) |
| Transportation & Warehousing | 2,250 (71.8%) | 885 (28.2%) |
| Utilities | 403 (76.9%) | 121 (23.1%) |
| Information | 451 (68.4%) | 208 (31.6%) |
| Finance & Insurance | 1,000 (41.2%) | 1,428 (58.8%) |
| Real Estate, Rental & Leasing | 340 (34.2%) | 655 (65.8%) |
| Professional & Scientific | 1,503 (53.4%) | 1,313 (46.6%) |
| Enterprise Management | 28 (28.6%) | 70 (71.4%) |
| Administrative & Support | 1,367 (47.2%) | 1,527 (52.8%) |
| Educational Services | 1,324 (32.2%) | 2,793 (67.8%) |
| Health Care & Social Assistance | 2,154 (28.0%) | 5,528 (72.0%) |
| Arts, Entertainment & Recreation | 631 (73.5%) | 227 (26.5%) |
| Accommodation & Food Services | 2,407 (53.5%) | 2,094 (46.5%) |
| Public Administration | 866 (45.5%) | 1,037 (54.5%) |
| Total | 26,119 (52.5%) | 23,640 (47.5%) |
Education in Lakeland
School Enrollment in Lakeland
The most common levels of schooling among the 26,465 students in Lakeland are college / undergraduate (8,971 | 33.9%), middle school (4,958 | 18.7%), and high school (4,513 | 17.1%).
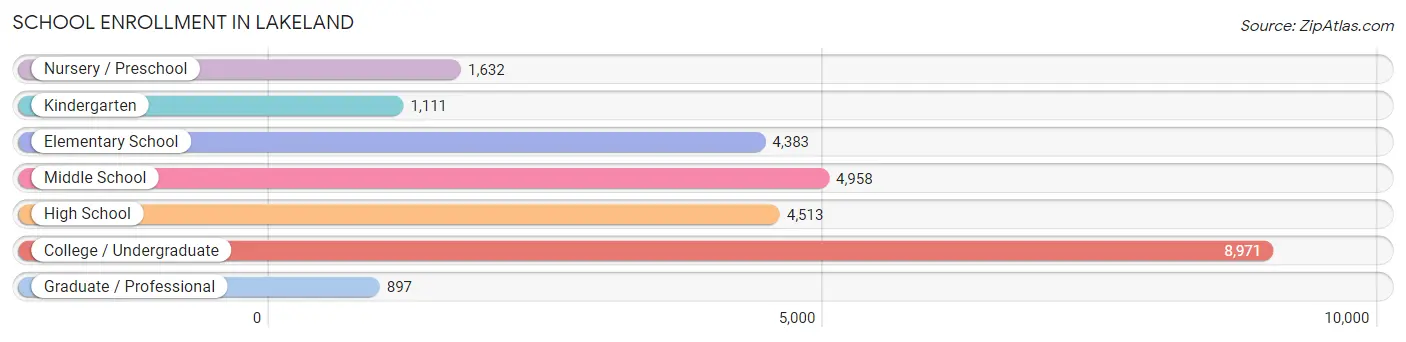
| School Level | # Students | % Students |
| Nursery / Preschool | 1,632 | 6.2% |
| Kindergarten | 1,111 | 4.2% |
| Elementary School | 4,383 | 16.6% |
| Middle School | 4,958 | 18.7% |
| High School | 4,513 | 17.1% |
| College / Undergraduate | 8,971 | 33.9% |
| Graduate / Professional | 897 | 3.4% |
| Total | 26,465 | 100.0% |
School Enrollment by Age by Funding Source in Lakeland
Out of a total of 26,465 students who are enrolled in schools in Lakeland, 9,395 (35.5%) attend a private institution, while the remaining 17,070 (64.5%) are enrolled in public schools. The age group of 20 to 24 year olds has the highest likelihood of being enrolled in private schools, with 2,502 (61.2% in the age bracket) enrolled. Conversely, the age group of 15 to 17 year olds has the lowest likelihood of being enrolled in a private school, with 2,844 (86.3% in the age bracket) attending a public institution.
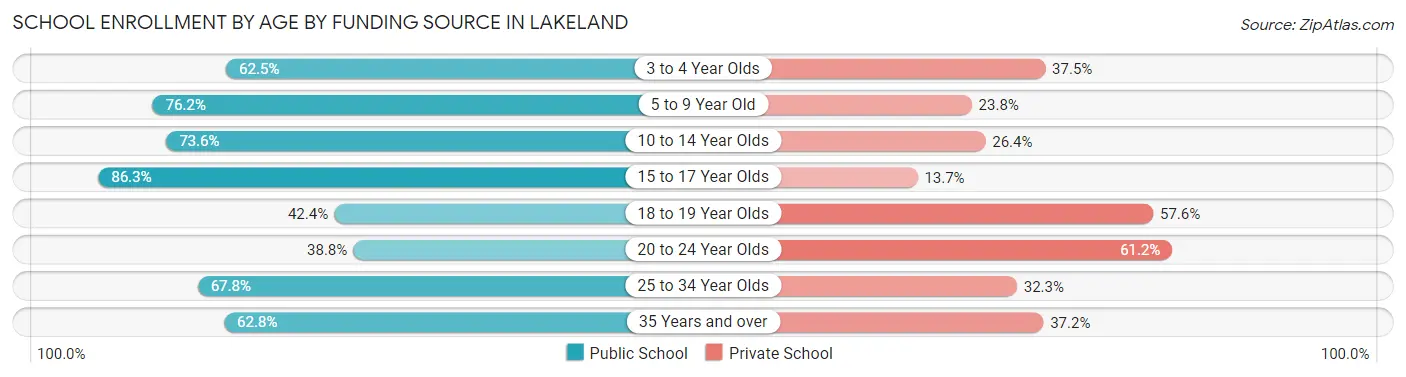
| Age Bracket | Public School | Private School |
| 3 to 4 Year Olds | 699 (62.5%) | 420 (37.5%) |
| 5 to 9 Year Old | 4,114 (76.2%) | 1,288 (23.8%) |
| 10 to 14 Year Olds | 4,449 (73.6%) | 1,594 (26.4%) |
| 15 to 17 Year Olds | 2,844 (86.3%) | 453 (13.7%) |
| 18 to 19 Year Olds | 1,601 (42.4%) | 2,178 (57.6%) |
| 20 to 24 Year Olds | 1,587 (38.8%) | 2,502 (61.2%) |
| 25 to 34 Year Olds | 853 (67.7%) | 406 (32.3%) |
| 35 Years and over | 928 (62.8%) | 549 (37.2%) |
| Total | 17,070 (64.5%) | 9,395 (35.5%) |
Educational Attainment by Field of Study in Lakeland
Business (4,804 | 20.8%), education (3,048 | 13.2%), science & technology (2,300 | 10.0%), arts & humanities (1,787 | 7.7%), and social sciences (1,776 | 7.7%) are the most common fields of study among 23,104 individuals in Lakeland who have obtained a bachelor's degree or higher.
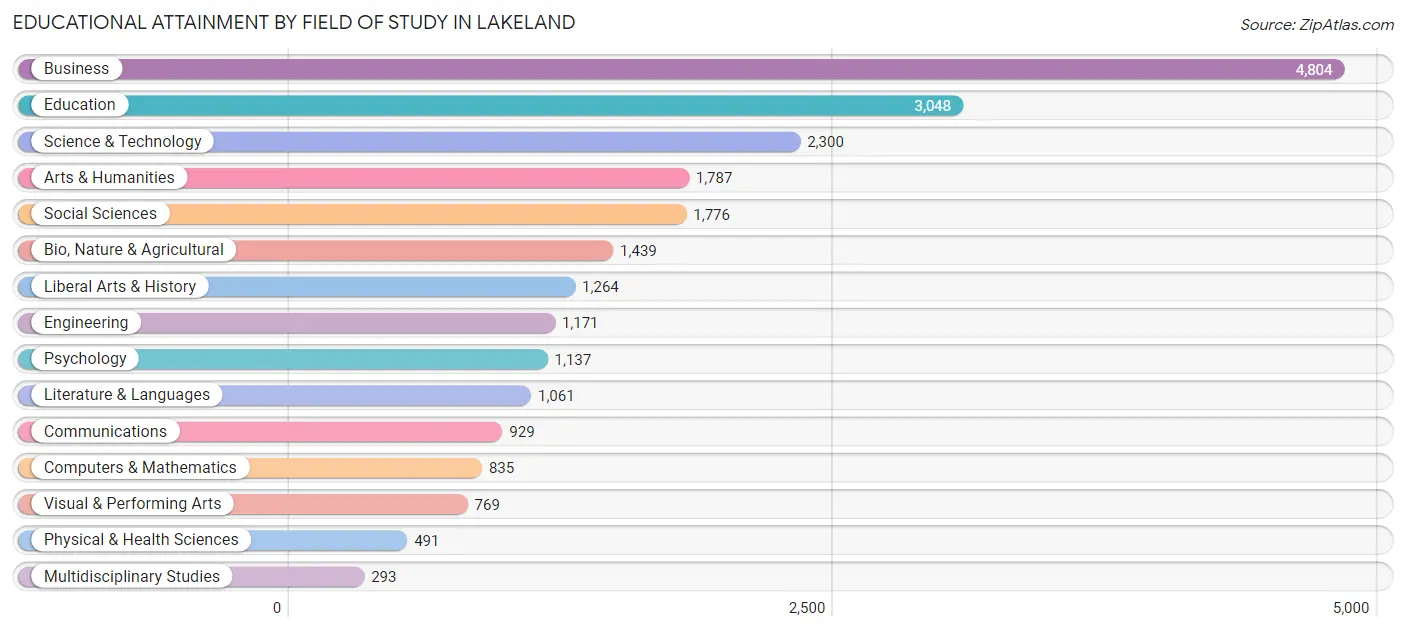
| Field of Study | # Graduates | % Graduates |
| Computers & Mathematics | 835 | 3.6% |
| Bio, Nature & Agricultural | 1,439 | 6.2% |
| Physical & Health Sciences | 491 | 2.1% |
| Psychology | 1,137 | 4.9% |
| Social Sciences | 1,776 | 7.7% |
| Engineering | 1,171 | 5.1% |
| Multidisciplinary Studies | 293 | 1.3% |
| Science & Technology | 2,300 | 10.0% |
| Business | 4,804 | 20.8% |
| Education | 3,048 | 13.2% |
| Literature & Languages | 1,061 | 4.6% |
| Liberal Arts & History | 1,264 | 5.5% |
| Visual & Performing Arts | 769 | 3.3% |
| Communications | 929 | 4.0% |
| Arts & Humanities | 1,787 | 7.7% |
| Total | 23,104 | 100.0% |
Transportation & Commute in Lakeland
Vehicle Availability by Sex in Lakeland
The most prevalent vehicle ownership categories in Lakeland are males with 2 vehicles (12,512, accounting for 49.0%) and females with 2 vehicles (9,283, making up 55.9%).
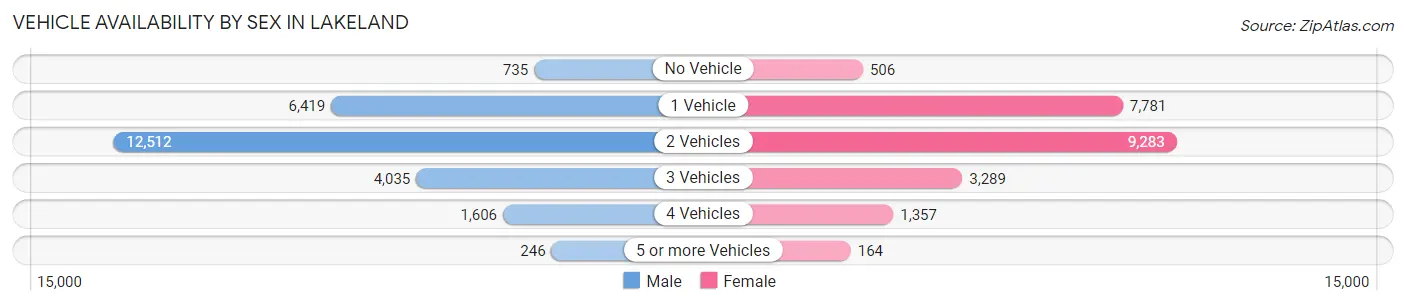
| Vehicles Available | Male | Female |
| No Vehicle | 735 (2.9%) | 506 (2.3%) |
| 1 Vehicle | 6,419 (25.1%) | 7,781 (34.8%) |
| 2 Vehicles | 12,512 (49.0%) | 9,283 (41.5%) |
| 3 Vehicles | 4,035 (15.8%) | 3,289 (14.7%) |
| 4 Vehicles | 1,606 (6.3%) | 1,357 (6.1%) |
| 5 or more Vehicles | 246 (1.0%) | 164 (0.7%) |
| Total | 25,553 (100.0%) | 22,380 (100.0%) |
Commute Time in Lakeland
The most frequently occuring commute durations in Lakeland are 15 to 19 minutes (9,207 commuters, 20.4%), 10 to 14 minutes (7,544 commuters, 16.7%), and 20 to 24 minutes (6,975 commuters, 15.5%).
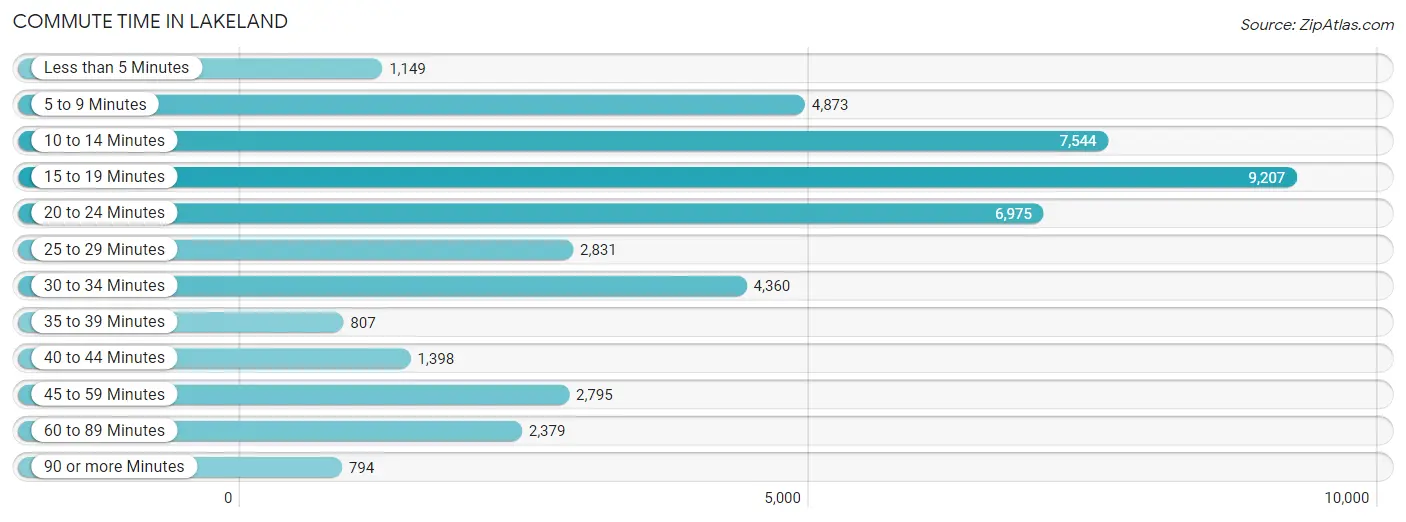
| Commute Time | # Commuters | % Commuters |
| Less than 5 Minutes | 1,149 | 2.5% |
| 5 to 9 Minutes | 4,873 | 10.8% |
| 10 to 14 Minutes | 7,544 | 16.7% |
| 15 to 19 Minutes | 9,207 | 20.4% |
| 20 to 24 Minutes | 6,975 | 15.5% |
| 25 to 29 Minutes | 2,831 | 6.3% |
| 30 to 34 Minutes | 4,360 | 9.7% |
| 35 to 39 Minutes | 807 | 1.8% |
| 40 to 44 Minutes | 1,398 | 3.1% |
| 45 to 59 Minutes | 2,795 | 6.2% |
| 60 to 89 Minutes | 2,379 | 5.3% |
| 90 or more Minutes | 794 | 1.8% |
Commute Time by Sex in Lakeland
The most common commute times in Lakeland are 15 to 19 minutes (4,587 commuters, 19.0%) for males and 15 to 19 minutes (4,620 commuters, 22.0%) for females.
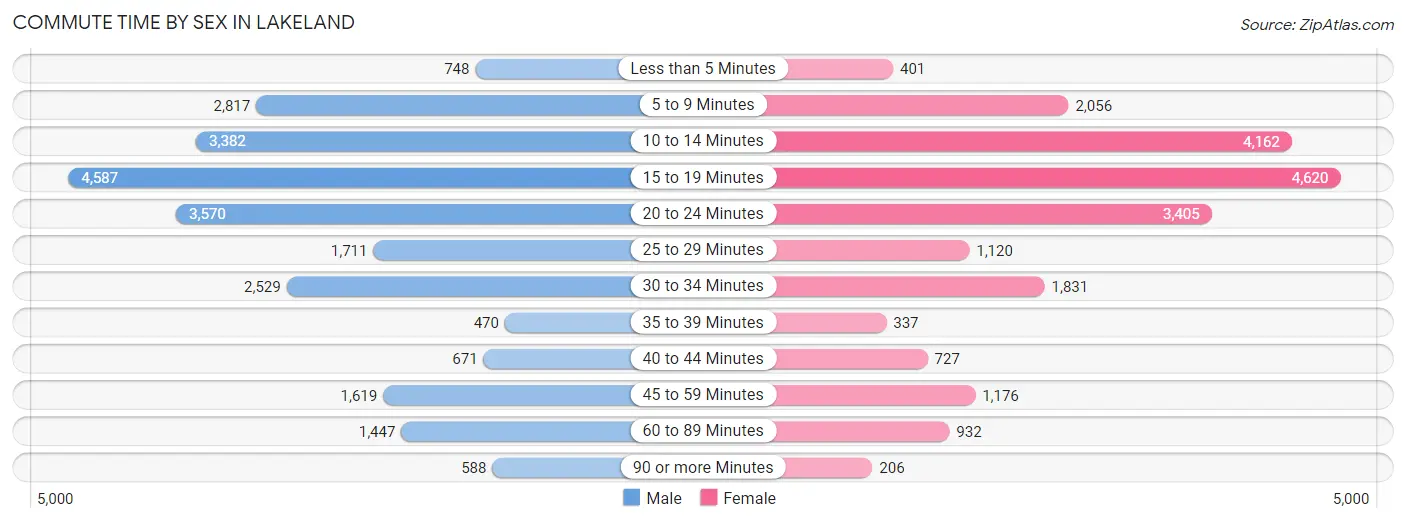
| Commute Time | Male | Female |
| Less than 5 Minutes | 748 (3.1%) | 401 (1.9%) |
| 5 to 9 Minutes | 2,817 (11.7%) | 2,056 (9.8%) |
| 10 to 14 Minutes | 3,382 (14.0%) | 4,162 (19.8%) |
| 15 to 19 Minutes | 4,587 (19.0%) | 4,620 (22.0%) |
| 20 to 24 Minutes | 3,570 (14.8%) | 3,405 (16.2%) |
| 25 to 29 Minutes | 1,711 (7.1%) | 1,120 (5.3%) |
| 30 to 34 Minutes | 2,529 (10.5%) | 1,831 (8.7%) |
| 35 to 39 Minutes | 470 (1.9%) | 337 (1.6%) |
| 40 to 44 Minutes | 671 (2.8%) | 727 (3.5%) |
| 45 to 59 Minutes | 1,619 (6.7%) | 1,176 (5.6%) |
| 60 to 89 Minutes | 1,447 (6.0%) | 932 (4.4%) |
| 90 or more Minutes | 588 (2.4%) | 206 (1.0%) |
Time of Departure to Work by Sex in Lakeland
The most frequent times of departure to work in Lakeland are 7:30 AM to 7:59 AM (3,128, 13.0%) for males and 7:00 AM to 7:29 AM (3,605, 17.2%) for females.
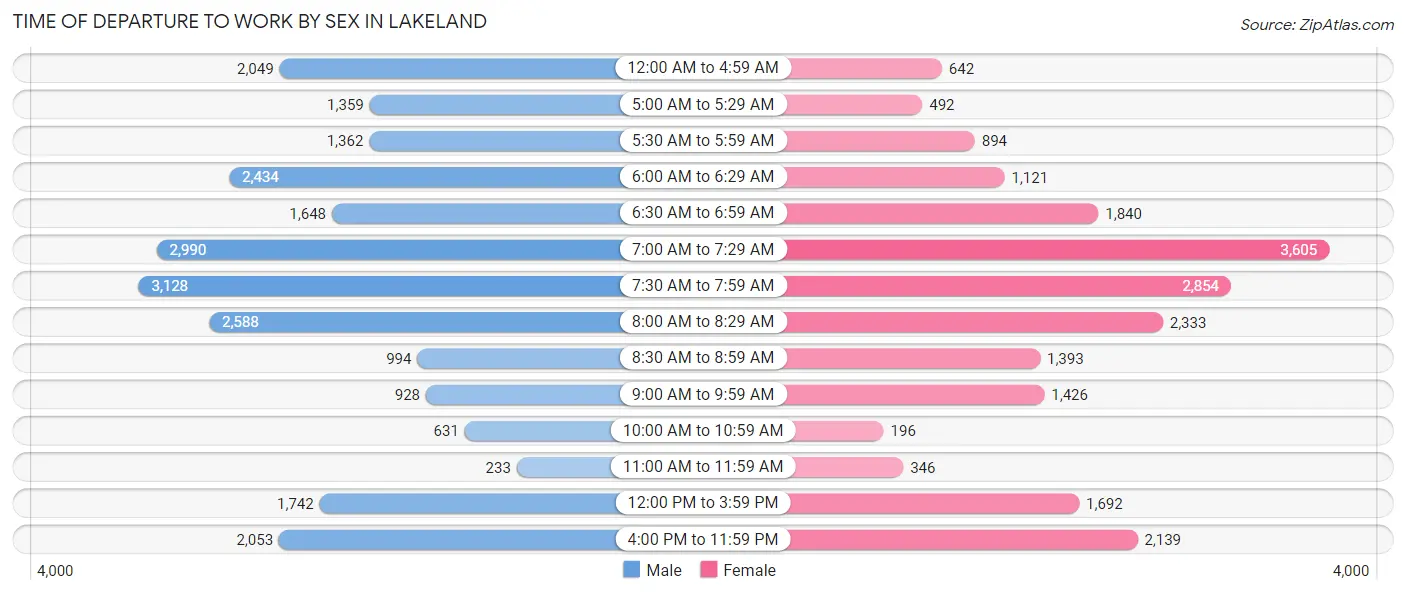
| Time of Departure | Male | Female |
| 12:00 AM to 4:59 AM | 2,049 (8.5%) | 642 (3.1%) |
| 5:00 AM to 5:29 AM | 1,359 (5.6%) | 492 (2.4%) |
| 5:30 AM to 5:59 AM | 1,362 (5.6%) | 894 (4.3%) |
| 6:00 AM to 6:29 AM | 2,434 (10.1%) | 1,121 (5.3%) |
| 6:30 AM to 6:59 AM | 1,648 (6.8%) | 1,840 (8.8%) |
| 7:00 AM to 7:29 AM | 2,990 (12.4%) | 3,605 (17.2%) |
| 7:30 AM to 7:59 AM | 3,128 (13.0%) | 2,854 (13.6%) |
| 8:00 AM to 8:29 AM | 2,588 (10.7%) | 2,333 (11.1%) |
| 8:30 AM to 8:59 AM | 994 (4.1%) | 1,393 (6.6%) |
| 9:00 AM to 9:59 AM | 928 (3.8%) | 1,426 (6.8%) |
| 10:00 AM to 10:59 AM | 631 (2.6%) | 196 (0.9%) |
| 11:00 AM to 11:59 AM | 233 (1.0%) | 346 (1.7%) |
| 12:00 PM to 3:59 PM | 1,742 (7.2%) | 1,692 (8.1%) |
| 4:00 PM to 11:59 PM | 2,053 (8.5%) | 2,139 (10.2%) |
| Total | 24,139 (100.0%) | 20,973 (100.0%) |
Housing Occupancy in Lakeland
Occupancy by Ownership in Lakeland
Of the total 44,323 dwellings in Lakeland, owner-occupied units account for 24,308 (54.8%), while renter-occupied units make up 20,015 (45.2%).
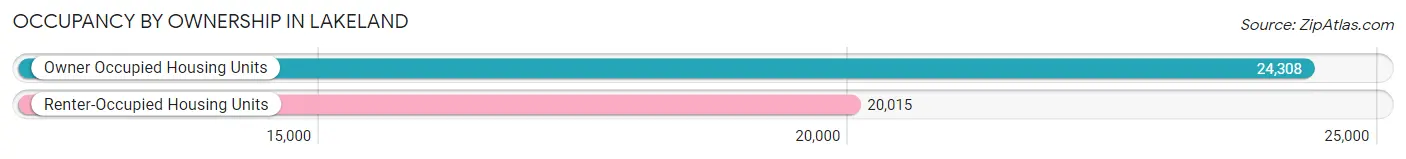
| Occupancy | # Housing Units | % Housing Units |
| Owner Occupied Housing Units | 24,308 | 54.8% |
| Renter-Occupied Housing Units | 20,015 | 45.2% |
| Total Occupied Housing Units | 44,323 | 100.0% |
Occupancy by Household Size in Lakeland
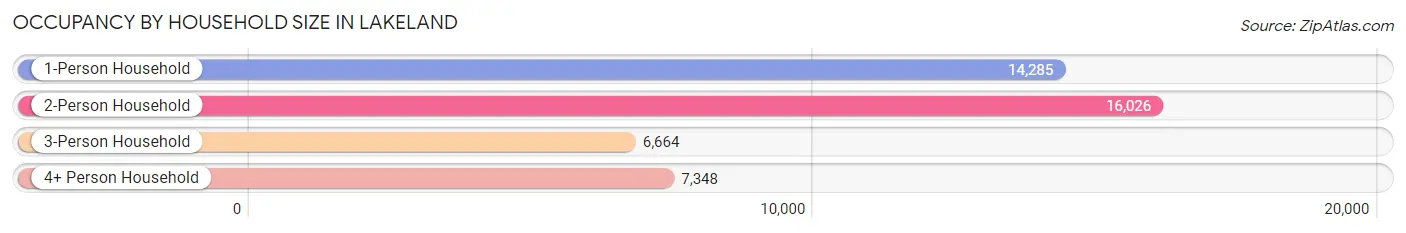
| Household Size | # Housing Units | % Housing Units |
| 1-Person Household | 14,285 | 32.2% |
| 2-Person Household | 16,026 | 36.2% |
| 3-Person Household | 6,664 | 15.0% |
| 4+ Person Household | 7,348 | 16.6% |
| Total Housing Units | 44,323 | 100.0% |
Occupancy by Ownership by Household Size in Lakeland
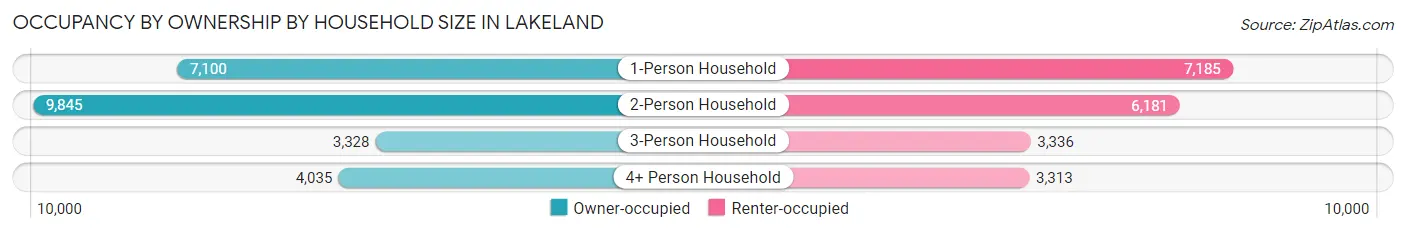
| Household Size | Owner-occupied | Renter-occupied |
| 1-Person Household | 7,100 (49.7%) | 7,185 (50.3%) |
| 2-Person Household | 9,845 (61.4%) | 6,181 (38.6%) |
| 3-Person Household | 3,328 (49.9%) | 3,336 (50.1%) |
| 4+ Person Household | 4,035 (54.9%) | 3,313 (45.1%) |
| Total Housing Units | 24,308 (54.8%) | 20,015 (45.2%) |
Occupancy by Educational Attainment in Lakeland
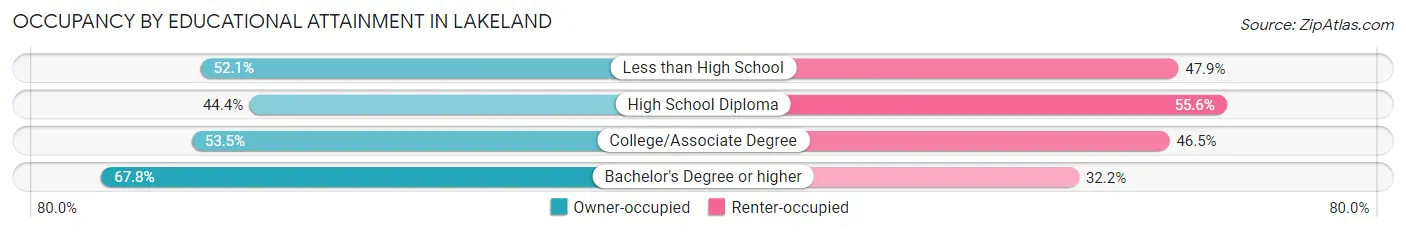
| Household Size | Owner-occupied | Renter-occupied |
| Less than High School | 1,763 (52.1%) | 1,622 (47.9%) |
| High School Diploma | 5,913 (44.4%) | 7,403 (55.6%) |
| College/Associate Degree | 7,840 (53.5%) | 6,820 (46.5%) |
| Bachelor's Degree or higher | 8,792 (67.8%) | 4,170 (32.2%) |
Occupancy by Age of Householder in Lakeland
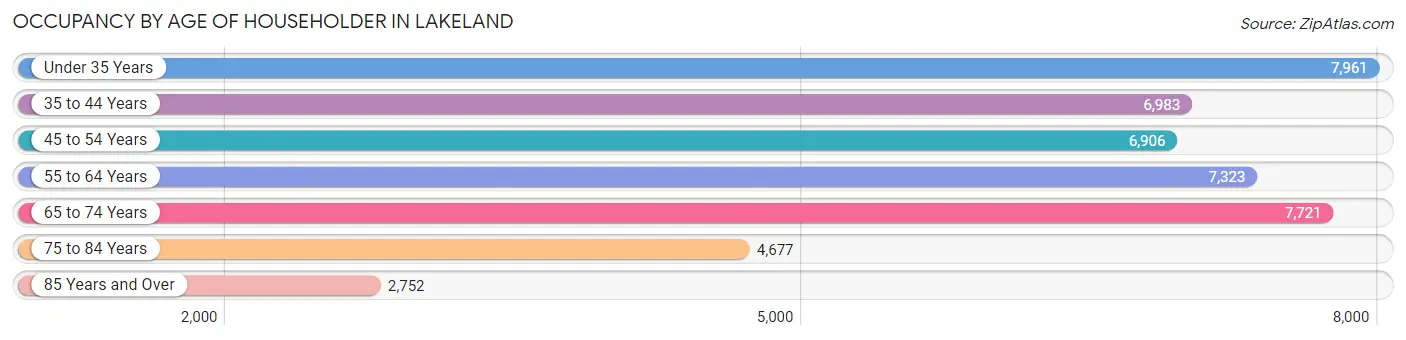
| Age Bracket | # Households | % Households |
| Under 35 Years | 7,961 | 18.0% |
| 35 to 44 Years | 6,983 | 15.8% |
| 45 to 54 Years | 6,906 | 15.6% |
| 55 to 64 Years | 7,323 | 16.5% |
| 65 to 74 Years | 7,721 | 17.4% |
| 75 to 84 Years | 4,677 | 10.5% |
| 85 Years and Over | 2,752 | 6.2% |
| Total | 44,323 | 100.0% |
Housing Finances in Lakeland
Median Income by Occupancy in Lakeland
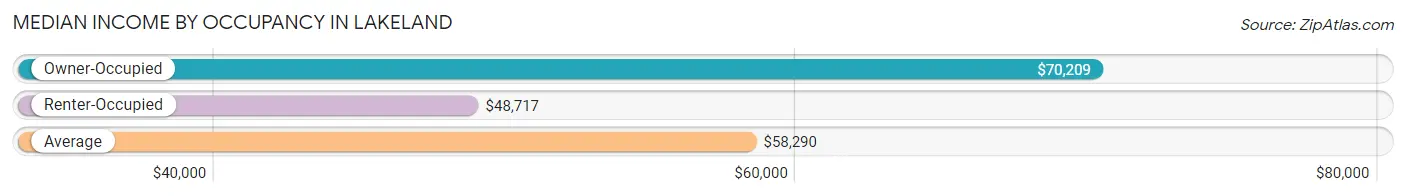
| Occupancy Type | # Households | Median Income |
| Owner-Occupied | 24,308 (54.8%) | $70,209 |
| Renter-Occupied | 20,015 (45.2%) | $48,717 |
| Average | 44,323 (100.0%) | $58,290 |
Occupancy by Householder Income Bracket in Lakeland
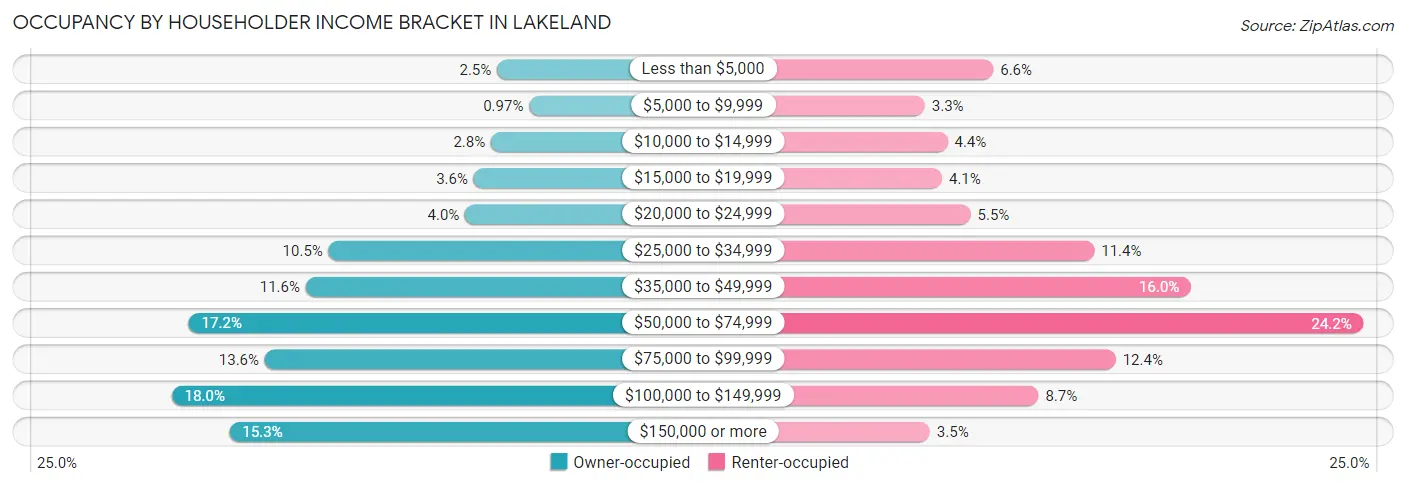
| Income Bracket | Owner-occupied | Renter-occupied |
| Less than $5,000 | 608 (2.5%) | 1,312 (6.6%) |
| $5,000 to $9,999 | 235 (1.0%) | 660 (3.3%) |
| $10,000 to $14,999 | 678 (2.8%) | 877 (4.4%) |
| $15,000 to $19,999 | 878 (3.6%) | 824 (4.1%) |
| $20,000 to $24,999 | 978 (4.0%) | 1,096 (5.5%) |
| $25,000 to $34,999 | 2,556 (10.5%) | 2,275 (11.4%) |
| $35,000 to $49,999 | 2,821 (11.6%) | 3,198 (16.0%) |
| $50,000 to $74,999 | 4,178 (17.2%) | 4,842 (24.2%) |
| $75,000 to $99,999 | 3,295 (13.6%) | 2,479 (12.4%) |
| $100,000 to $149,999 | 4,375 (18.0%) | 1,743 (8.7%) |
| $150,000 or more | 3,706 (15.2%) | 709 (3.5%) |
| Total | 24,308 (100.0%) | 20,015 (100.0%) |
Monthly Housing Cost Tiers in Lakeland
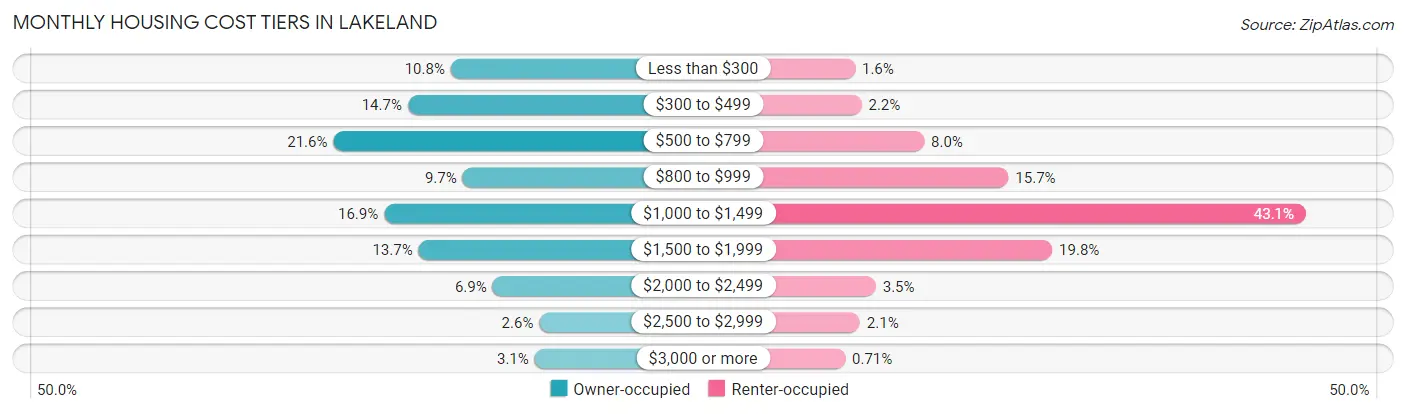
| Monthly Cost | Owner-occupied | Renter-occupied |
| Less than $300 | 2,617 (10.8%) | 325 (1.6%) |
| $300 to $499 | 3,580 (14.7%) | 444 (2.2%) |
| $500 to $799 | 5,246 (21.6%) | 1,597 (8.0%) |
| $800 to $999 | 2,353 (9.7%) | 3,151 (15.7%) |
| $1,000 to $1,499 | 4,110 (16.9%) | 8,630 (43.1%) |
| $1,500 to $1,999 | 3,340 (13.7%) | 3,956 (19.8%) |
| $2,000 to $2,499 | 1,682 (6.9%) | 706 (3.5%) |
| $2,500 to $2,999 | 638 (2.6%) | 414 (2.1%) |
| $3,000 or more | 742 (3.0%) | 142 (0.7%) |
| Total | 24,308 (100.0%) | 20,015 (100.0%) |
Physical Housing Characteristics in Lakeland
Housing Structures in Lakeland
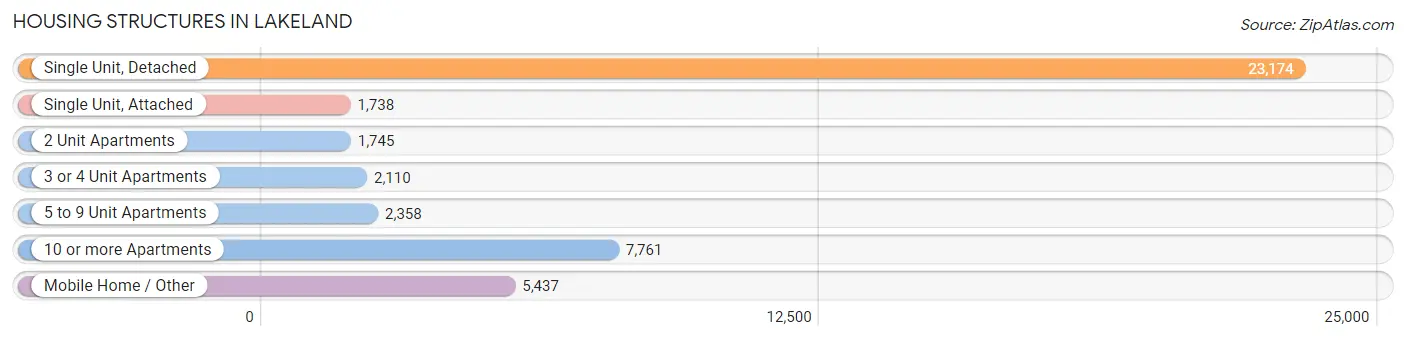
| Structure Type | # Housing Units | % Housing Units |
| Single Unit, Detached | 23,174 | 52.3% |
| Single Unit, Attached | 1,738 | 3.9% |
| 2 Unit Apartments | 1,745 | 3.9% |
| 3 or 4 Unit Apartments | 2,110 | 4.8% |
| 5 to 9 Unit Apartments | 2,358 | 5.3% |
| 10 or more Apartments | 7,761 | 17.5% |
| Mobile Home / Other | 5,437 | 12.3% |
| Total | 44,323 | 100.0% |
Housing Structures by Occupancy in Lakeland
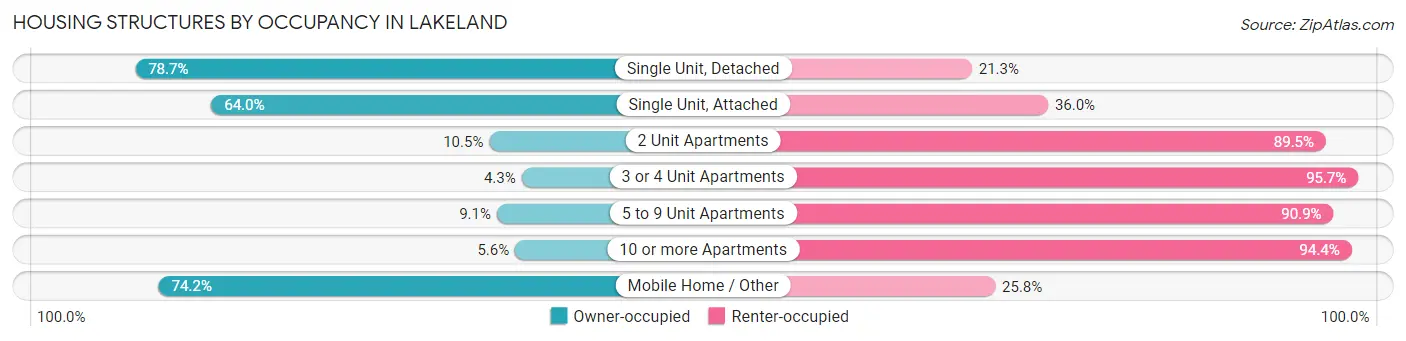
| Structure Type | Owner-occupied | Renter-occupied |
| Single Unit, Detached | 18,239 (78.7%) | 4,935 (21.3%) |
| Single Unit, Attached | 1,113 (64.0%) | 625 (36.0%) |
| 2 Unit Apartments | 184 (10.5%) | 1,561 (89.5%) |
| 3 or 4 Unit Apartments | 91 (4.3%) | 2,019 (95.7%) |
| 5 to 9 Unit Apartments | 214 (9.1%) | 2,144 (90.9%) |
| 10 or more Apartments | 432 (5.6%) | 7,329 (94.4%) |
| Mobile Home / Other | 4,035 (74.2%) | 1,402 (25.8%) |
| Total | 24,308 (54.8%) | 20,015 (45.2%) |
Housing Structures by Number of Rooms in Lakeland
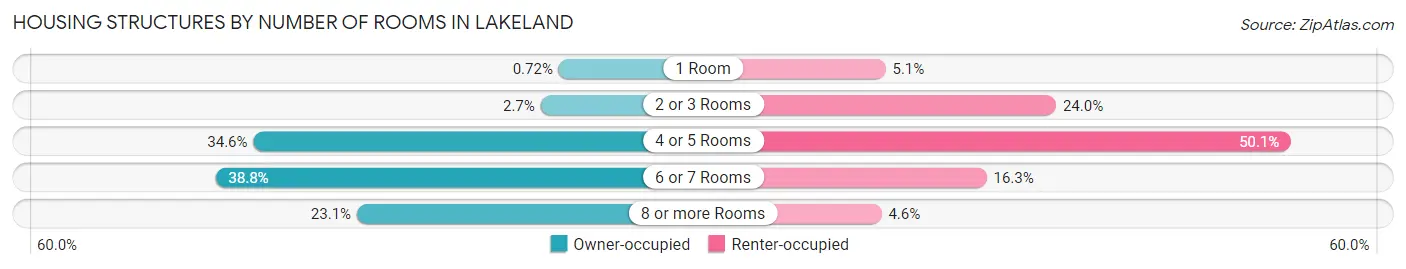
| Number of Rooms | Owner-occupied | Renter-occupied |
| 1 Room | 175 (0.7%) | 1,012 (5.1%) |
| 2 or 3 Rooms | 664 (2.7%) | 4,799 (24.0%) |
| 4 or 5 Rooms | 8,413 (34.6%) | 10,024 (50.1%) |
| 6 or 7 Rooms | 9,437 (38.8%) | 3,257 (16.3%) |
| 8 or more Rooms | 5,619 (23.1%) | 923 (4.6%) |
| Total | 24,308 (100.0%) | 20,015 (100.0%) |
Housing Structure by Heating Type in Lakeland
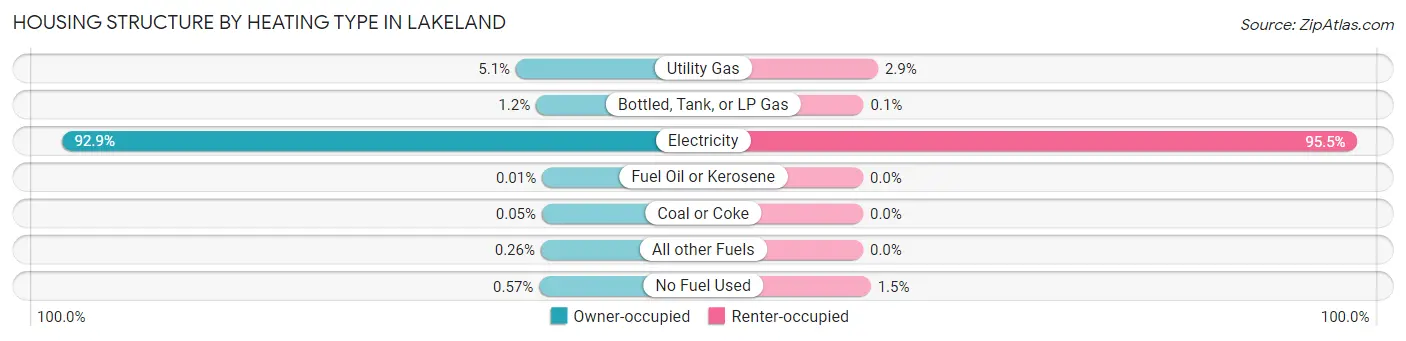
| Heating Type | Owner-occupied | Renter-occupied |
| Utility Gas | 1,230 (5.1%) | 577 (2.9%) |
| Bottled, Tank, or LP Gas | 288 (1.2%) | 21 (0.1%) |
| Electricity | 22,575 (92.9%) | 19,121 (95.5%) |
| Fuel Oil or Kerosene | 2 (0.0%) | 0 (0.0%) |
| Coal or Coke | 13 (0.1%) | 0 (0.0%) |
| All other Fuels | 62 (0.3%) | 0 (0.0%) |
| No Fuel Used | 138 (0.6%) | 296 (1.5%) |
| Total | 24,308 (100.0%) | 20,015 (100.0%) |
Household Vehicle Usage in Lakeland
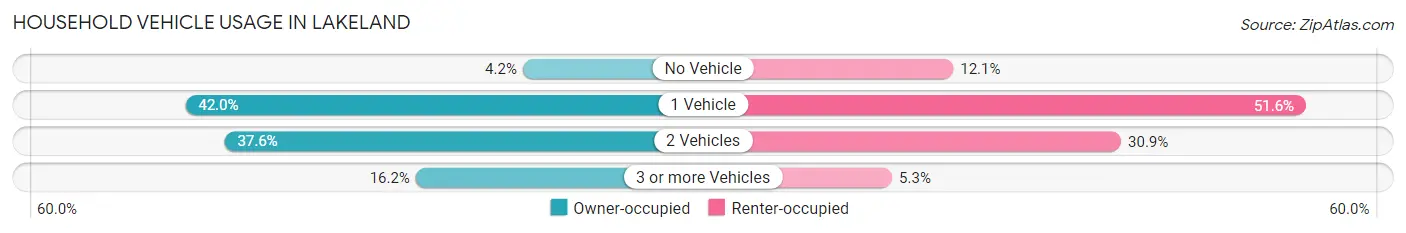
| Vehicles per Household | Owner-occupied | Renter-occupied |
| No Vehicle | 1,020 (4.2%) | 2,430 (12.1%) |
| 1 Vehicle | 10,210 (42.0%) | 10,335 (51.6%) |
| 2 Vehicles | 9,142 (37.6%) | 6,192 (30.9%) |
| 3 or more Vehicles | 3,936 (16.2%) | 1,058 (5.3%) |
| Total | 24,308 (100.0%) | 20,015 (100.0%) |
Real Estate & Mortgages in Lakeland
Real Estate and Mortgage Overview in Lakeland
| Characteristic | Without Mortgage | With Mortgage |
| Housing Units | 12,350 | 11,958 |
| Median Property Value | $158,300 | $238,300 |
| Median Household Income | $52,818 | $2,491 |
| Monthly Housing Costs | $513 | $730 |
| Real Estate Taxes | $1,060 | $620 |
Property Value by Mortgage Status in Lakeland
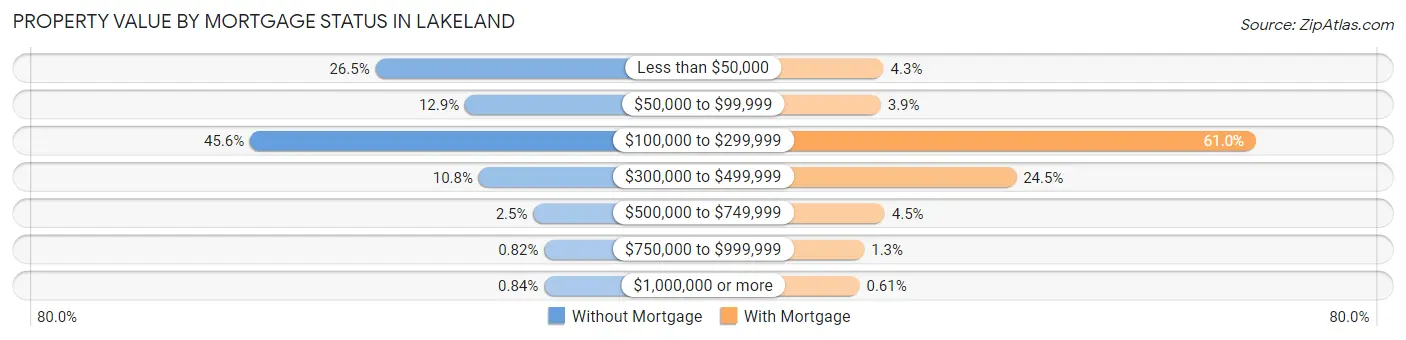
| Property Value | Without Mortgage | With Mortgage |
| Less than $50,000 | 3,277 (26.5%) | 512 (4.3%) |
| $50,000 to $99,999 | 1,592 (12.9%) | 460 (3.8%) |
| $100,000 to $299,999 | 5,636 (45.6%) | 7,294 (61.0%) |
| $300,000 to $499,999 | 1,333 (10.8%) | 2,927 (24.5%) |
| $500,000 to $749,999 | 307 (2.5%) | 533 (4.5%) |
| $750,000 to $999,999 | 101 (0.8%) | 159 (1.3%) |
| $1,000,000 or more | 104 (0.8%) | 73 (0.6%) |
| Total | 12,350 (100.0%) | 11,958 (100.0%) |
Household Income by Mortgage Status in Lakeland
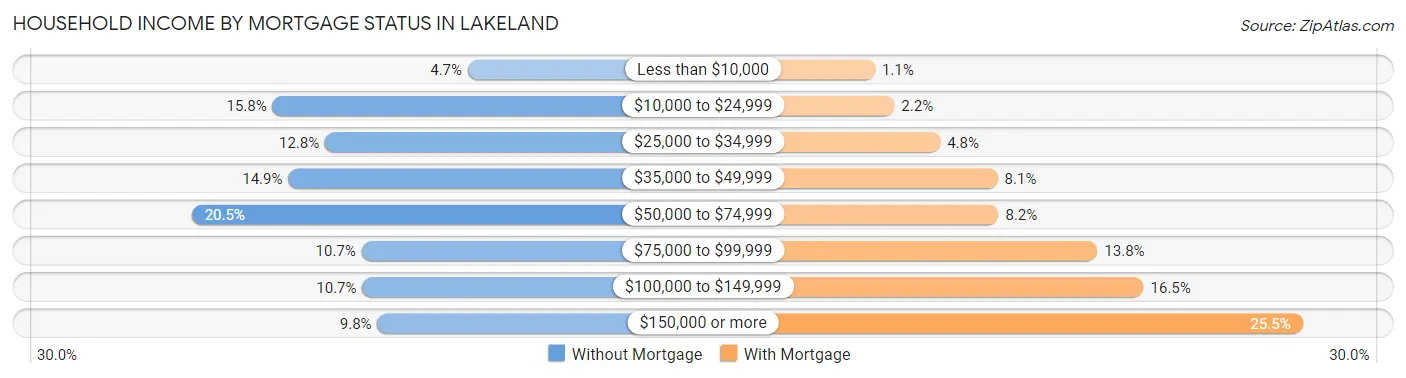
| Household Income | Without Mortgage | With Mortgage |
| Less than $10,000 | 577 (4.7%) | 133 (1.1%) |
| $10,000 to $24,999 | 1,955 (15.8%) | 266 (2.2%) |
| $25,000 to $34,999 | 1,585 (12.8%) | 579 (4.8%) |
| $35,000 to $49,999 | 1,844 (14.9%) | 971 (8.1%) |
| $50,000 to $74,999 | 2,526 (20.4%) | 977 (8.2%) |
| $75,000 to $99,999 | 1,327 (10.7%) | 1,652 (13.8%) |
| $100,000 to $149,999 | 1,321 (10.7%) | 1,968 (16.5%) |
| $150,000 or more | 1,215 (9.8%) | 3,054 (25.5%) |
| Total | 12,350 (100.0%) | 11,958 (100.0%) |
Property Value to Household Income Ratio in Lakeland
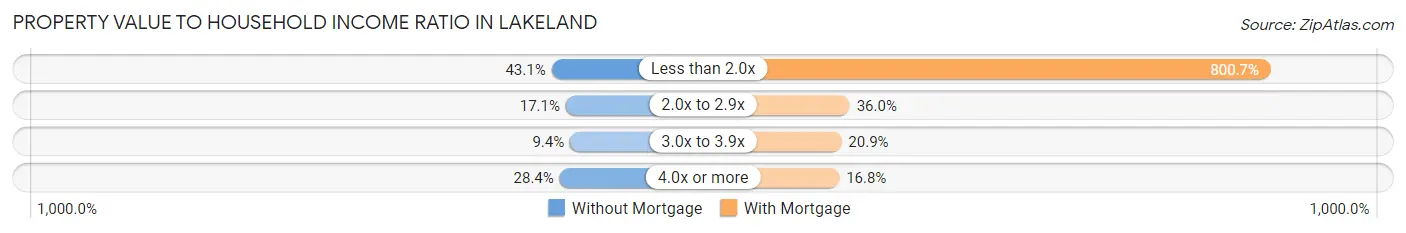
| Value-to-Income Ratio | Without Mortgage | With Mortgage |
| Less than 2.0x | 5,320 (43.1%) | 95,753 (800.7%) |
| 2.0x to 2.9x | 2,117 (17.1%) | 4,308 (36.0%) |
| 3.0x to 3.9x | 1,166 (9.4%) | 2,497 (20.9%) |
| 4.0x or more | 3,509 (28.4%) | 2,012 (16.8%) |
| Total | 12,350 (100.0%) | 11,958 (100.0%) |
Real Estate Taxes by Mortgage Status in Lakeland
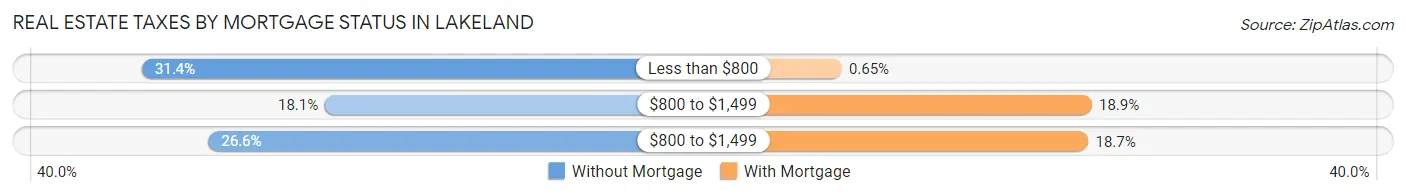
| Property Taxes | Without Mortgage | With Mortgage |
| Less than $800 | 3,882 (31.4%) | 78 (0.6%) |
| $800 to $1,499 | 2,238 (18.1%) | 2,263 (18.9%) |
| $800 to $1,499 | 3,281 (26.6%) | 2,233 (18.7%) |
| Total | 12,350 (100.0%) | 11,958 (100.0%) |
Health & Disability in Lakeland
Health Insurance Coverage by Age in Lakeland
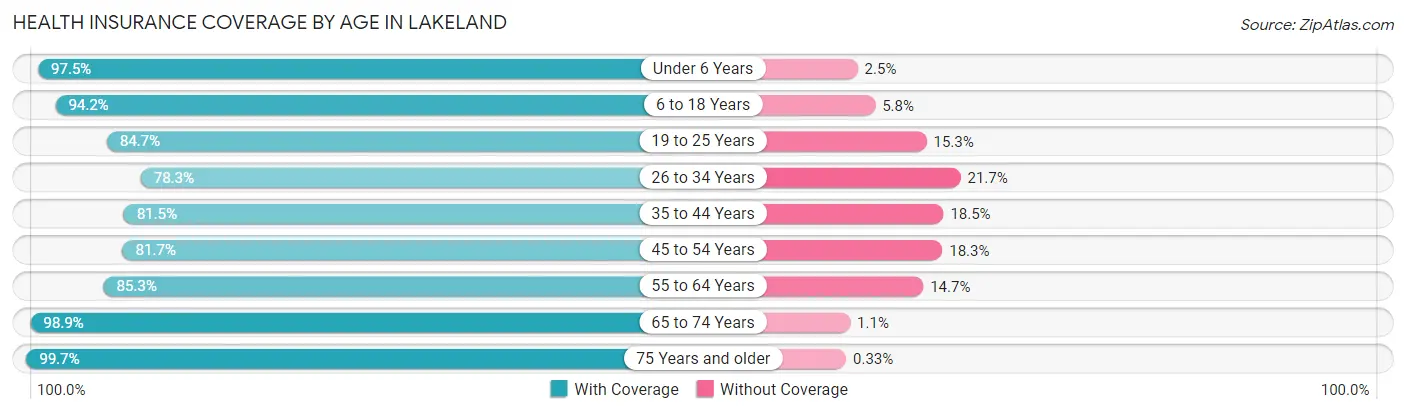
| Age Bracket | With Coverage | Without Coverage |
| Under 6 Years | 6,855 (97.5%) | 175 (2.5%) |
| 6 to 18 Years | 15,663 (94.2%) | 958 (5.8%) |
| 19 to 25 Years | 10,684 (84.7%) | 1,935 (15.3%) |
| 26 to 34 Years | 10,371 (78.3%) | 2,870 (21.7%) |
| 35 to 44 Years | 10,916 (81.5%) | 2,476 (18.5%) |
| 45 to 54 Years | 10,522 (81.7%) | 2,354 (18.3%) |
| 55 to 64 Years | 11,343 (85.3%) | 1,958 (14.7%) |
| 65 to 74 Years | 12,381 (98.9%) | 137 (1.1%) |
| 75 Years and older | 10,859 (99.7%) | 36 (0.3%) |
| Total | 99,594 (88.5%) | 12,899 (11.5%) |
Health Insurance Coverage by Citizenship Status in Lakeland
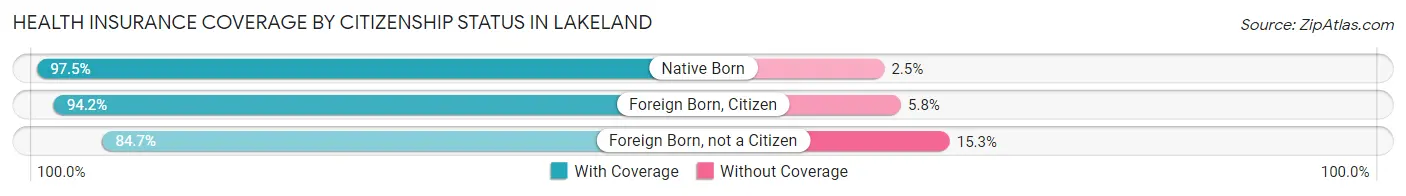
| Citizenship Status | With Coverage | Without Coverage |
| Native Born | 6,855 (97.5%) | 175 (2.5%) |
| Foreign Born, Citizen | 15,663 (94.2%) | 958 (5.8%) |
| Foreign Born, not a Citizen | 10,684 (84.7%) | 1,935 (15.3%) |
Health Insurance Coverage by Household Income in Lakeland
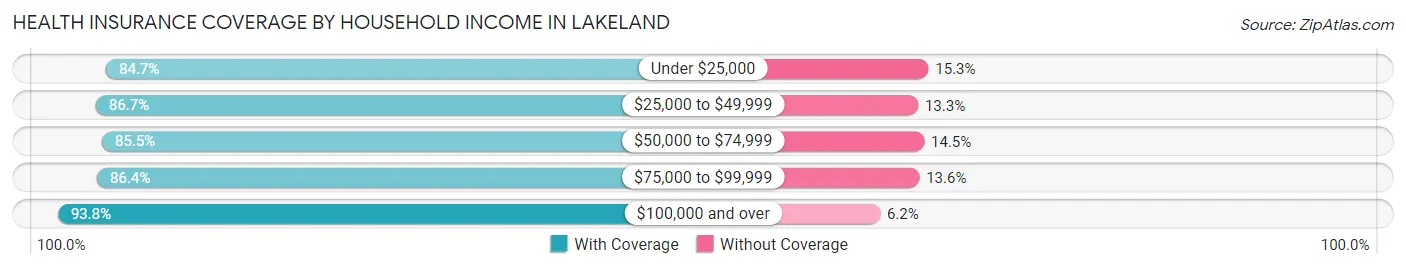
| Household Income | With Coverage | Without Coverage |
| Under $25,000 | 11,678 (84.7%) | 2,106 (15.3%) |
| $25,000 to $49,999 | 18,939 (86.7%) | 2,916 (13.3%) |
| $50,000 to $74,999 | 19,148 (85.5%) | 3,246 (14.5%) |
| $75,000 to $99,999 | 14,119 (86.4%) | 2,217 (13.6%) |
| $100,000 and over | 30,523 (93.8%) | 2,020 (6.2%) |
Public vs Private Health Insurance Coverage by Age in Lakeland
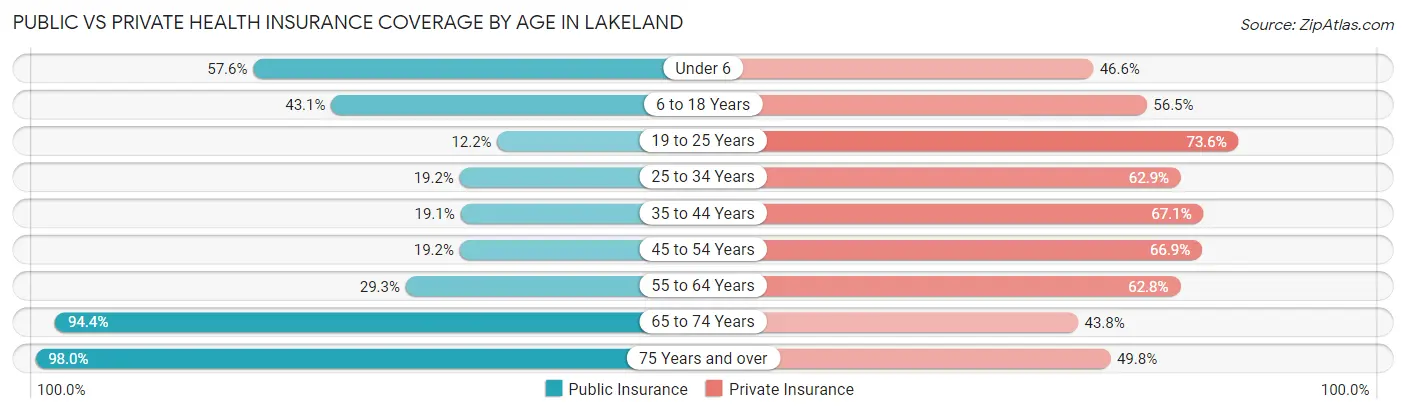
| Age Bracket | Public Insurance | Private Insurance |
| Under 6 | 4,046 (57.6%) | 3,274 (46.6%) |
| 6 to 18 Years | 7,158 (43.1%) | 9,396 (56.5%) |
| 19 to 25 Years | 1,543 (12.2%) | 9,293 (73.6%) |
| 25 to 34 Years | 2,548 (19.2%) | 8,334 (62.9%) |
| 35 to 44 Years | 2,556 (19.1%) | 8,991 (67.1%) |
| 45 to 54 Years | 2,475 (19.2%) | 8,610 (66.9%) |
| 55 to 64 Years | 3,890 (29.2%) | 8,356 (62.8%) |
| 65 to 74 Years | 11,811 (94.4%) | 5,476 (43.8%) |
| 75 Years and over | 10,680 (98.0%) | 5,424 (49.8%) |
| Total | 46,707 (41.5%) | 67,154 (59.7%) |
Disability Status by Sex by Age in Lakeland
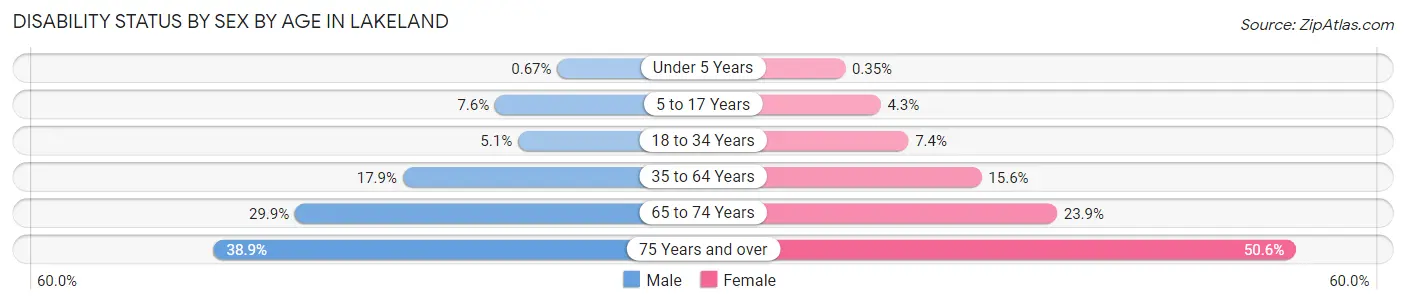
| Age Bracket | Male | Female |
| Under 5 Years | 21 (0.7%) | 10 (0.4%) |
| 5 to 17 Years | 619 (7.6%) | 322 (4.3%) |
| 18 to 34 Years | 724 (5.1%) | 1,008 (7.4%) |
| 35 to 64 Years | 3,464 (17.9%) | 3,141 (15.5%) |
| 65 to 74 Years | 1,665 (29.9%) | 1,663 (23.9%) |
| 75 Years and over | 1,879 (38.9%) | 3,070 (50.6%) |
Disability Class by Sex by Age in Lakeland
Disability Class: Hearing Difficulty
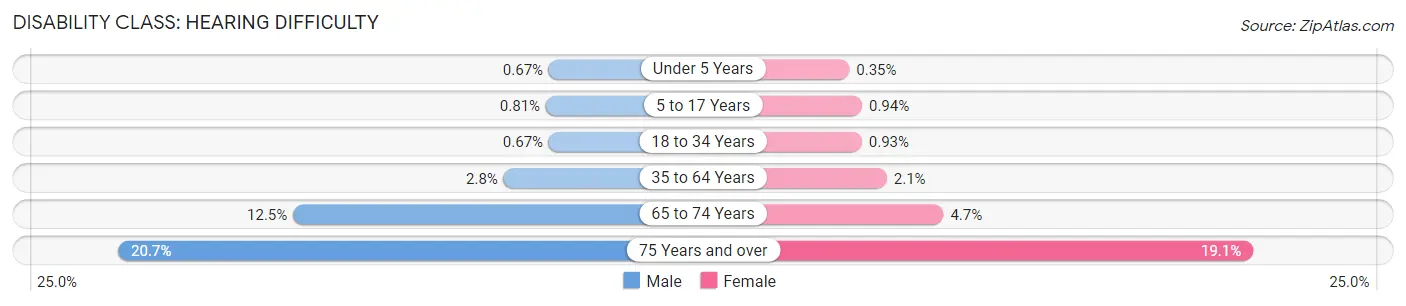
| Age Bracket | Male | Female |
| Under 5 Years | 21 (0.7%) | 10 (0.4%) |
| 5 to 17 Years | 66 (0.8%) | 70 (0.9%) |
| 18 to 34 Years | 96 (0.7%) | 126 (0.9%) |
| 35 to 64 Years | 537 (2.8%) | 423 (2.1%) |
| 65 to 74 Years | 699 (12.5%) | 328 (4.7%) |
| 75 Years and over | 997 (20.7%) | 1,158 (19.1%) |
Disability Class: Vision Difficulty
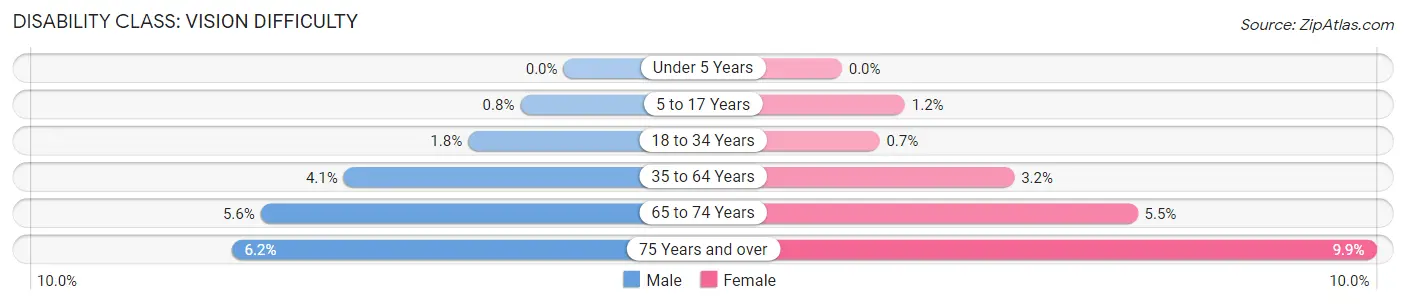
| Age Bracket | Male | Female |
| Under 5 Years | 0 (0.0%) | 0 (0.0%) |
| 5 to 17 Years | 65 (0.8%) | 87 (1.2%) |
| 18 to 34 Years | 254 (1.8%) | 95 (0.7%) |
| 35 to 64 Years | 790 (4.1%) | 646 (3.2%) |
| 65 to 74 Years | 313 (5.6%) | 381 (5.5%) |
| 75 Years and over | 297 (6.2%) | 602 (9.9%) |
Disability Class: Cognitive Difficulty
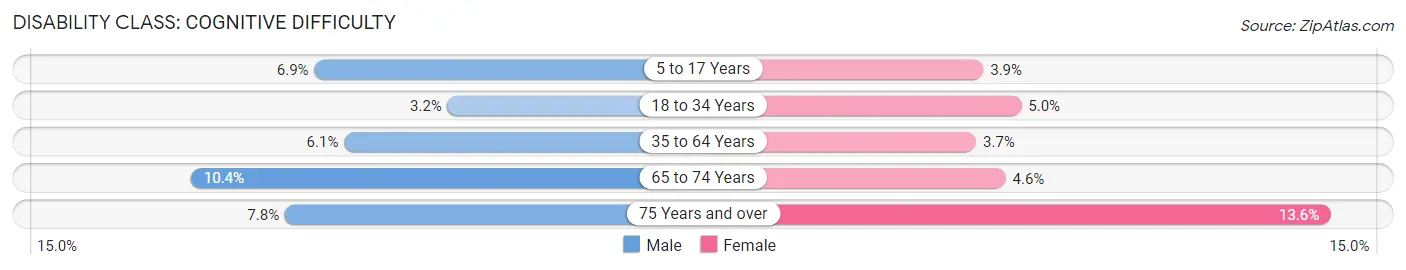
| Age Bracket | Male | Female |
| 5 to 17 Years | 564 (6.9%) | 294 (3.9%) |
| 18 to 34 Years | 461 (3.2%) | 681 (5.0%) |
| 35 to 64 Years | 1,182 (6.1%) | 756 (3.7%) |
| 65 to 74 Years | 578 (10.4%) | 317 (4.6%) |
| 75 Years and over | 374 (7.7%) | 827 (13.6%) |
Disability Class: Ambulatory Difficulty
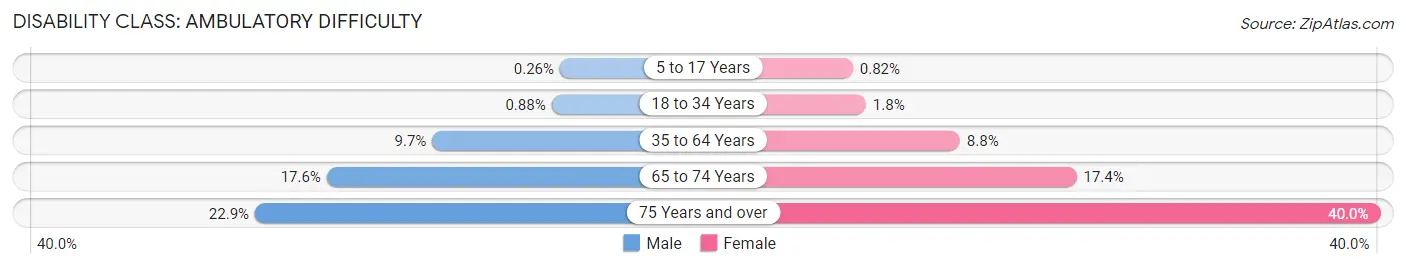
| Age Bracket | Male | Female |
| 5 to 17 Years | 21 (0.3%) | 61 (0.8%) |
| 18 to 34 Years | 126 (0.9%) | 243 (1.8%) |
| 35 to 64 Years | 1,887 (9.7%) | 1,771 (8.8%) |
| 65 to 74 Years | 979 (17.6%) | 1,211 (17.4%) |
| 75 Years and over | 1,105 (22.9%) | 2,427 (40.0%) |
Disability Class: Self-Care Difficulty
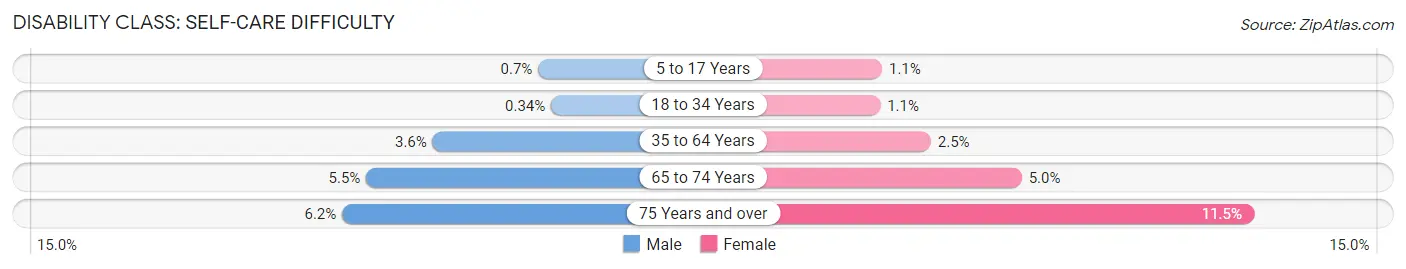
| Age Bracket | Male | Female |
| 5 to 17 Years | 57 (0.7%) | 84 (1.1%) |
| 18 to 34 Years | 49 (0.3%) | 146 (1.1%) |
| 35 to 64 Years | 705 (3.6%) | 500 (2.5%) |
| 65 to 74 Years | 306 (5.5%) | 348 (5.0%) |
| 75 Years and over | 297 (6.2%) | 696 (11.5%) |
Technology Access in Lakeland
Computing Device Access in Lakeland
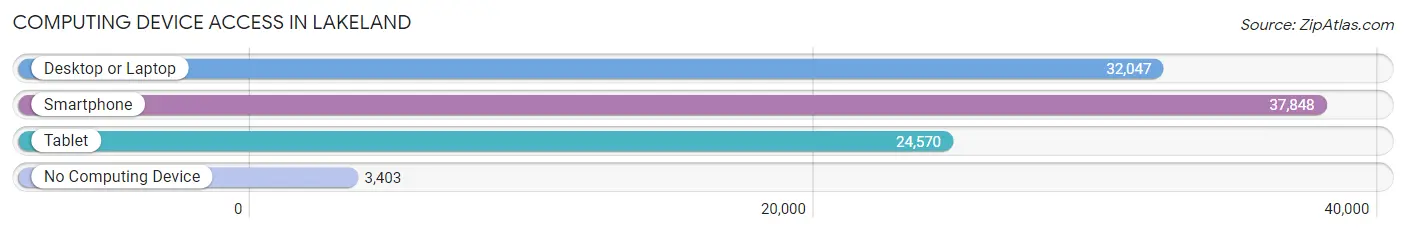
| Device Type | # Households | % Households |
| Desktop or Laptop | 32,047 | 72.3% |
| Smartphone | 37,848 | 85.4% |
| Tablet | 24,570 | 55.4% |
| No Computing Device | 3,403 | 7.7% |
| Total | 44,323 | 100.0% |
Internet Access in Lakeland
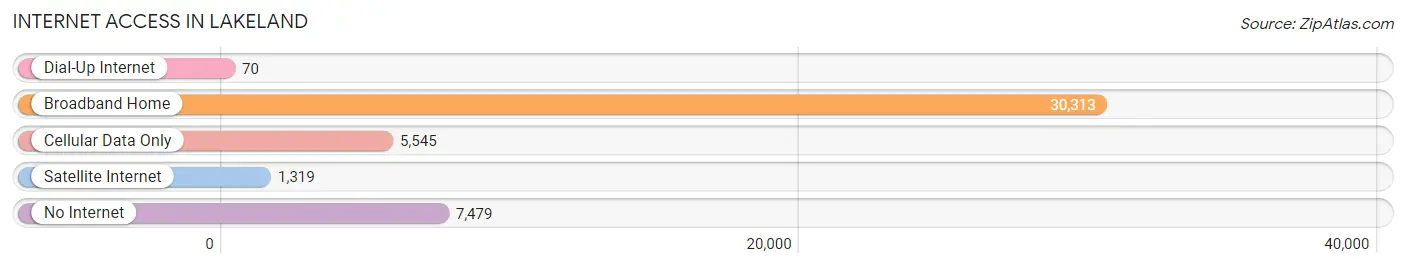
| Internet Type | # Households | % Households |
| Dial-Up Internet | 70 | 0.2% |
| Broadband Home | 30,313 | 68.4% |
| Cellular Data Only | 5,545 | 12.5% |
| Satellite Internet | 1,319 | 3.0% |
| No Internet | 7,479 | 16.9% |
| Total | 44,323 | 100.0% |
Lakeland Summary
Lakeland, Florida is a city located in Polk County, in the central part of the state. It is the county seat and the largest city in the county. The city is located between Tampa and Orlando, and is part of the Tampa Bay Area. The city has a population of over 100,000 people, making it the largest city in Polk County.
Geography
Lakeland is located in the central part of Florida, in Polk County. It is situated between Tampa and Orlando, and is part of the Tampa Bay Area. The city is located on the shores of Lake Parker, a large lake that is part of the Peace River watershed. The city is also located near the headwaters of the Peace River, which flows southward into the Gulf of Mexico. The city is located at an elevation of about 100 feet above sea level.
The city is located in a humid subtropical climate zone, with hot, humid summers and mild winters. The average temperature in the summer is around 90 degrees Fahrenheit, and the average temperature in the winter is around 60 degrees Fahrenheit. The city receives an average of about 50 inches of rain per year.
Economy
Lakeland is a major economic center in the Tampa Bay Area. The city is home to several large companies, including Publix Super Markets, Florida Southern College, and the Lakeland Regional Medical Center. The city is also home to several smaller businesses, including restaurants, retail stores, and other service-oriented businesses.
The city is also home to several major industries, including agriculture, manufacturing, and tourism. The city is home to several large agricultural operations, including citrus groves, cattle ranches, and vegetable farms. The city is also home to several large manufacturing companies, including the Lakeland-based Publix Super Markets. The city is also home to several tourist attractions, including the Florida Southern College campus, the Lakeland Center, and the Polk Museum of Art.
Demographics
As of the 2010 census, the population of Lakeland was 97,422. The population is made up of a diverse mix of people, including African Americans, Hispanics, and Asians. The city has a median household income of $41,945, and a poverty rate of 18.3%. The city has a population density of 1,845 people per square mile.
The city is home to several large universities, including Florida Southern College, Southeastern University, and Polk State College. The city is also home to several large churches, including the First Presbyterian Church of Lakeland, the First United Methodist Church of Lakeland, and the First Baptist Church of Lakeland.
Conclusion
Lakeland, Florida is a city located in Polk County, in the central part of the state. It is the county seat and the largest city in the county. The city is located between Tampa and Orlando, and is part of the Tampa Bay Area. The city has a population of over 100,000 people, making it the largest city in Polk County. The city is located in a humid subtropical climate zone, with hot, humid summers and mild winters. The city is a major economic center in the Tampa Bay Area, and is home to several large companies, including Publix Super Markets, Florida Southern College, and the Lakeland Regional Medical Center. The population of Lakeland is made up of a diverse mix of people, including African Americans, Hispanics, and Asians. The city is home to several large universities, churches, and tourist attractions.
Common Questions
What is Per Capita Income in Lakeland?
Per Capita income in Lakeland is $33,154.
What is the Median Family Income in Lakeland?
Median Family Income in Lakeland is $69,885.
What is the Median Household income in Lakeland?
Median Household Income in Lakeland is $58,290.
What is Income or Wage Gap in Lakeland?
Income or Wage Gap in Lakeland is 20.4%.
Women in Lakeland earn 79.6 cents for every dollar earned by a man.
What is Family Income Deficit in Lakeland?
Family Income Deficit in Lakeland is $10,715.
Families that are below poverty line in Lakeland earn $10,715 less on average than the poverty threshold level.
What is Inequality or Gini Index in Lakeland?
Inequality or Gini Index in Lakeland is 0.48.
What is the Total Population of Lakeland?
Total Population of Lakeland is 114,404.
What is the Total Male Population of Lakeland?
Total Male Population of Lakeland is 56,177.
What is the Total Female Population of Lakeland?
Total Female Population of Lakeland is 58,227.
What is the Ratio of Males per 100 Females in Lakeland?
There are 96.48 Males per 100 Females in Lakeland.
What is the Ratio of Females per 100 Males in Lakeland?
There are 103.65 Females per 100 Males in Lakeland.
What is the Median Population Age in Lakeland?
Median Population Age in Lakeland is 40.6 Years.
What is the Average Family Size in Lakeland
Average Family Size in Lakeland is 3.1 People.
What is the Average Household Size in Lakeland
Average Household Size in Lakeland is 2.4 People.
How Large is the Labor Force in Lakeland?
There are 52,740 People in the Labor Forcein in Lakeland.
What is the Percentage of People in the Labor Force in Lakeland?
55.3% of People are in the Labor Force in Lakeland.
What is the Unemployment Rate in Lakeland?
Unemployment Rate in Lakeland is 5.4%.