Cities with the Most Immigrants from South Africa in Connecticut
RELATED REPORTS & OPTIONS
South Africa
Connecticut
Compare Cities
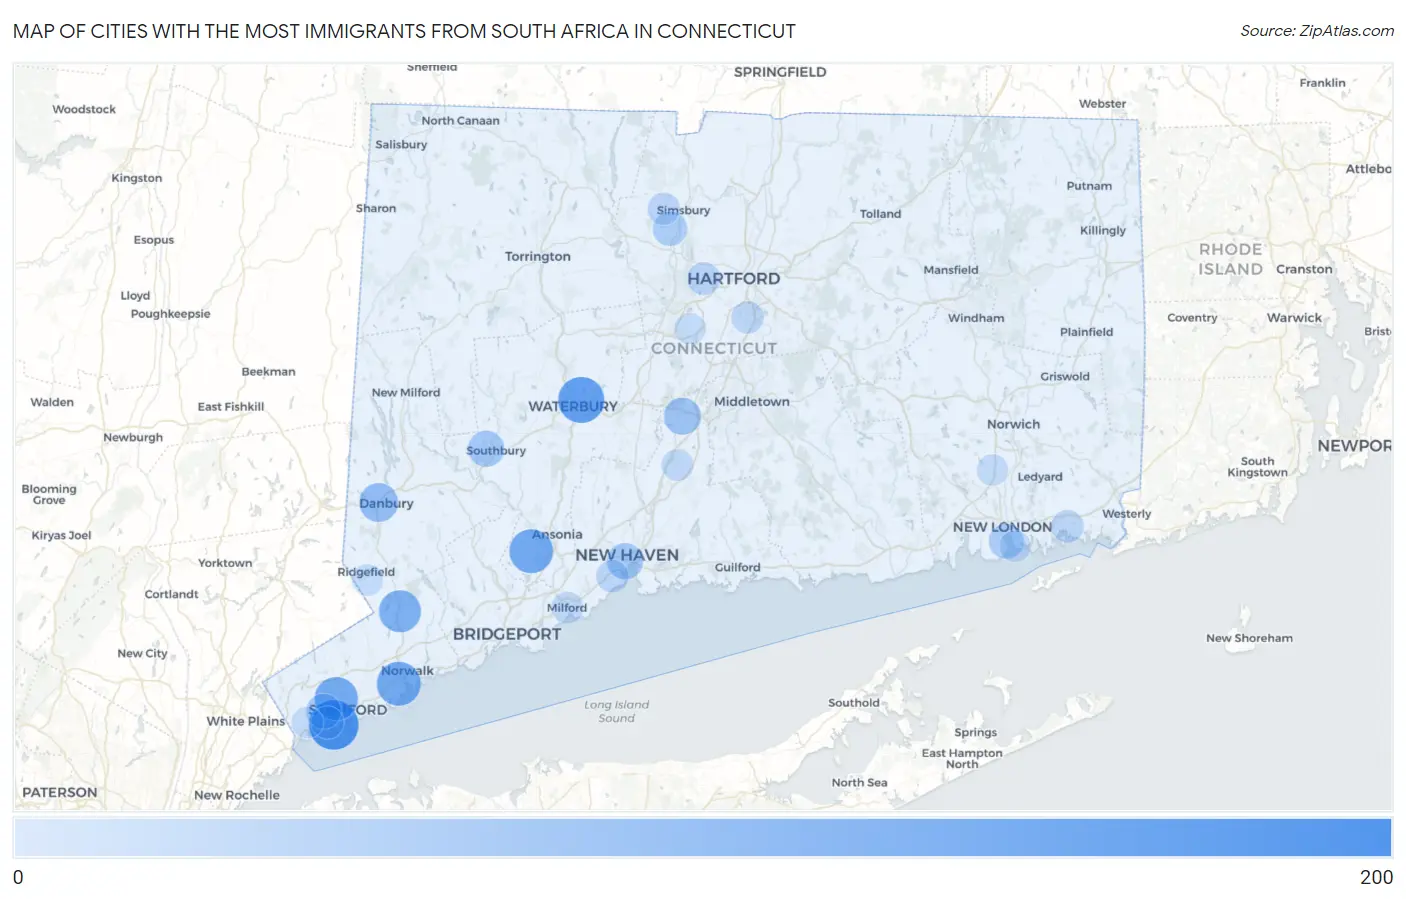
Map of Cities with the Most Immigrants from South Africa in Connecticut
0
200
Cities with the Most Immigrants from South Africa in Connecticut
| City | South Africa | vs State | vs National | |
| 1. | Old Greenwich | 151 | 1,972(7.66%)#1 | 117,055(0.13%)#96 |
| 2. | Waterbury | 124 | 1,972(6.29%)#2 | 117,055(0.11%)#122 |
| 3. | Norwalk | 106 | 1,972(5.38%)#3 | 117,055(0.09%)#161 |
| 4. | Shelton | 105 | 1,972(5.32%)#4 | 117,055(0.09%)#163 |
| 5. | Stamford | 102 | 1,972(5.17%)#5 | 117,055(0.09%)#173 |
| 6. | Cannondale | 91 | 1,972(4.61%)#6 | 117,055(0.08%)#212 |
| 7. | Danbury | 65 | 1,972(3.30%)#7 | 117,055(0.06%)#327 |
| 8. | Meriden | 52 | 1,972(2.64%)#8 | 117,055(0.04%)#423 |
| 9. | New Haven | 46 | 1,972(2.33%)#9 | 117,055(0.04%)#477 |
| 10. | Heritage Village | 46 | 1,972(2.33%)#10 | 117,055(0.04%)#494 |
| 11. | Cos Cob | 37 | 1,972(1.88%)#11 | 117,055(0.03%)#607 |
| 12. | New London | 36 | 1,972(1.83%)#12 | 117,055(0.03%)#619 |
| 13. | Compo | 32 | 1,972(1.62%)#13 | 117,055(0.03%)#707 |
| 14. | Weatogue | 32 | 1,972(1.62%)#14 | 117,055(0.03%)#708 |
| 15. | West Hartford | 20 | 1,972(1.01%)#15 | 117,055(0.02%)#962 |
| 16. | Mystic | 18 | 1,972(0.91%)#16 | 117,055(0.02%)#1,059 |
| 17. | West Haven | 17 | 1,972(0.86%)#17 | 117,055(0.01%)#1,076 |
| 18. | Riverside | 17 | 1,972(0.86%)#18 | 117,055(0.01%)#1,102 |
| 19. | Wethersfield | 16 | 1,972(0.81%)#19 | 117,055(0.01%)#1,128 |
| 20. | West Simsbury | 16 | 1,972(0.81%)#20 | 117,055(0.01%)#1,153 |
| 21. | Milford City Balance | 12 | 1,972(0.61%)#21 | 117,055(0.01%)#1,336 |
| 22. | Wallingford Center | 12 | 1,972(0.61%)#22 | 117,055(0.01%)#1,353 |
| 23. | Tashua | 11 | 1,972(0.56%)#23 | 117,055(0.01%)#1,431 |
| 24. | Greenwich | 9 | 1,972(0.46%)#24 | 117,055(0.01%)#1,522 |
| 25. | Oxoboxo River | 9 | 1,972(0.46%)#25 | 117,055(0.01%)#1,548 |
| 26. | New Britain | 8 | 1,972(0.41%)#26 | 117,055(0.01%)#1,564 |
| 27. | Ridgefield | 8 | 1,972(0.41%)#27 | 117,055(0.01%)#1,602 |
| 28. | Groton | 7 | 1,972(0.35%)#28 | 117,055(0.01%)#1,653 |
| 29. | Saugatuck | 7 | 1,972(0.35%)#29 | 117,055(0.01%)#1,664 |
| 30. | Westport | 3 | 1,972(0.15%)#30 | 117,055(0.00%)#1,912 |
| 31. | Woodmont Borough | 3 | 1,972(0.15%)#31 | 117,055(0.00%)#1,919 |
1
2Common Questions
What are the Top 10 Cities with the Most Immigrants from South Africa in Connecticut?
Top 10 Cities with the Most Immigrants from South Africa in Connecticut are:
#1
151
#2
124
#3
106
#4
105
#5
102
#6
91
#7
65
#8
52
#9
46
#10
46
What city has the Most Immigrants from South Africa in Connecticut?
Old Greenwich has the Most Immigrants from South Africa in Connecticut with 151.
What is the Total Immigrants from South Africa in the State of Connecticut?
Total Immigrants from South Africa in Connecticut is 1,972.
What is the Total Immigrants from South Africa in the United States?
Total Immigrants from South Africa in the United States is 117,055.