Novi, MI Map & Demographics
Novi Map
Novi Overview
$60,396
PER CAPITA INCOME
$139,638
AVG FAMILY INCOME
$110,588
AVG HOUSEHOLD INCOME
49.1%
WAGE / INCOME GAP [ % ]
50.9¢/ $1
WAGE / INCOME GAP [ $ ]
0.45
INEQUALITY / GINI INDEX
65,870
TOTAL POPULATION
32,442
MALE POPULATION
33,428
FEMALE POPULATION
97.05
MALES / 100 FEMALES
103.04
FEMALES / 100 MALES
40.0
MEDIAN AGE
3.1
AVG FAMILY SIZE
2.5
AVG HOUSEHOLD SIZE
35,692
LABOR FORCE [ PEOPLE ]
68.2%
PERCENT IN LABOR FORCE
4.3%
UNEMPLOYMENT RATE
Novi Area Codes
Income in Novi
Income Overview in Novi
Per Capita Income in Novi is $60,396, while median incomes of families and households are $139,638 and $110,588 respectively.
| Characteristic | Number | Measure |
| Per Capita Income | 65,870 | $60,396 |
| Median Family Income | 17,683 | $139,638 |
| Mean Family Income | 17,683 | $180,573 |
| Median Household Income | 26,516 | $110,588 |
| Mean Household Income | 26,516 | $148,274 |
| Income Deficit | 17,683 | $0 |
| Wage / Income Gap (%) | 65,870 | 49.06% |
| Wage / Income Gap ($) | 65,870 | 50.94¢ per $1 |
| Gini / Inequality Index | 65,870 | 0.45 |
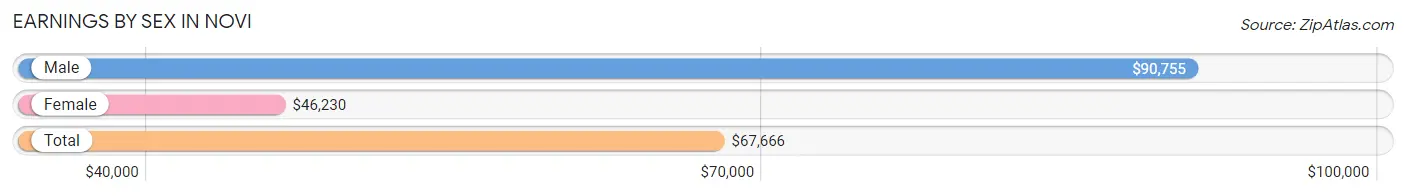
Earnings by Sex in Novi
Average Earnings in Novi are $67,666, $90,755 for men and $46,230 for women, a difference of 49.1%.
| Sex | Number | Average Earnings |
| Male | 20,561 (55.7%) | $90,755 |
| Female | 16,369 (44.3%) | $46,230 |
| Total | 36,930 (100.0%) | $67,666 |
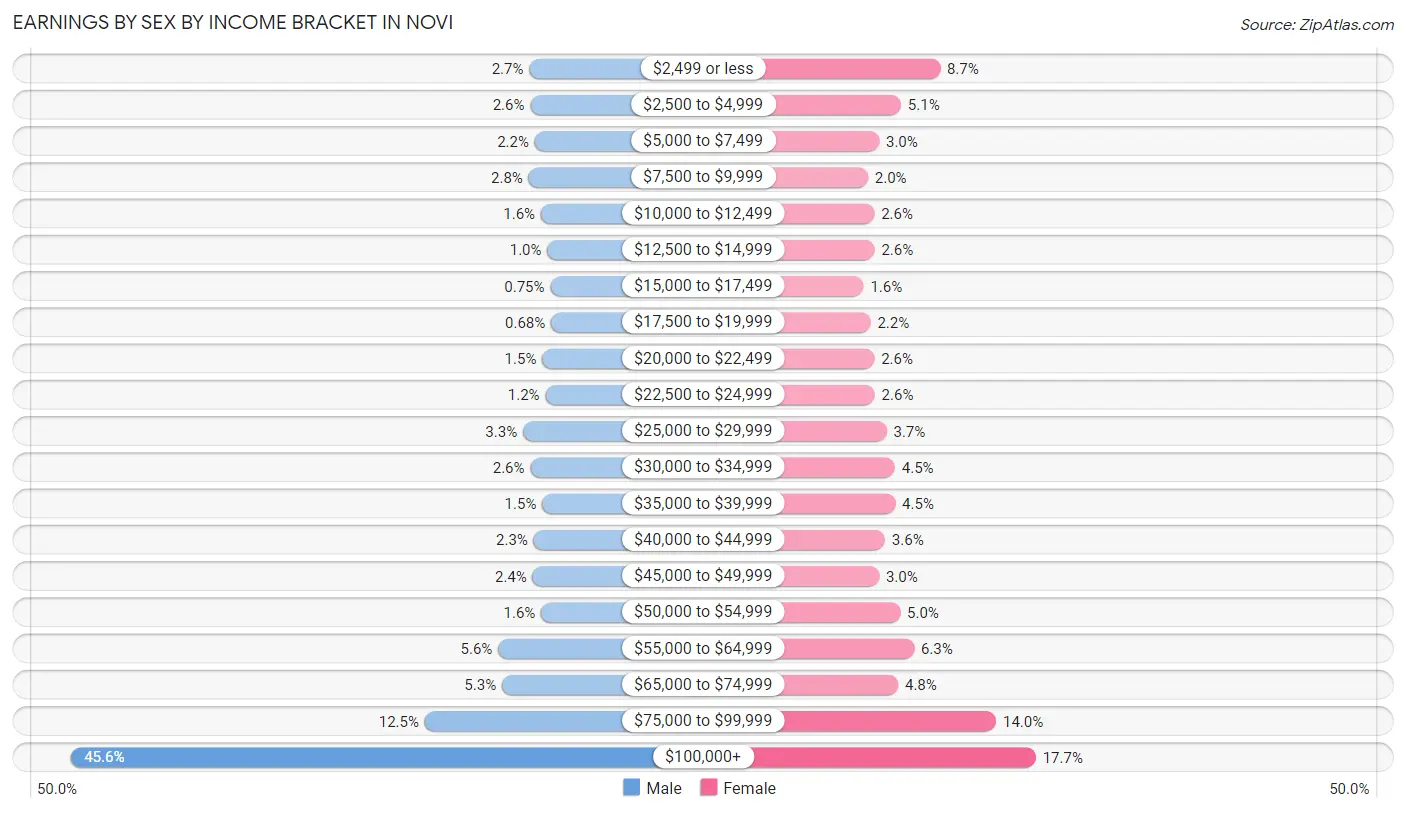
Earnings by Sex by Income Bracket in Novi
The most common earnings brackets in Novi are $100,000+ for men (9,383 | 45.6%) and $100,000+ for women (2,898 | 17.7%).
| Income | Male | Female |
| $2,499 or less | 560 (2.7%) | 1,429 (8.7%) |
| $2,500 to $4,999 | 541 (2.6%) | 830 (5.1%) |
| $5,000 to $7,499 | 455 (2.2%) | 495 (3.0%) |
| $7,500 to $9,999 | 572 (2.8%) | 322 (2.0%) |
| $10,000 to $12,499 | 336 (1.6%) | 420 (2.6%) |
| $12,500 to $14,999 | 212 (1.0%) | 424 (2.6%) |
| $15,000 to $17,499 | 154 (0.7%) | 256 (1.6%) |
| $17,500 to $19,999 | 140 (0.7%) | 363 (2.2%) |
| $20,000 to $22,499 | 310 (1.5%) | 421 (2.6%) |
| $22,500 to $24,999 | 249 (1.2%) | 428 (2.6%) |
| $25,000 to $29,999 | 680 (3.3%) | 609 (3.7%) |
| $30,000 to $34,999 | 538 (2.6%) | 736 (4.5%) |
| $35,000 to $39,999 | 311 (1.5%) | 741 (4.5%) |
| $40,000 to $44,999 | 475 (2.3%) | 585 (3.6%) |
| $45,000 to $49,999 | 495 (2.4%) | 492 (3.0%) |
| $50,000 to $54,999 | 332 (1.6%) | 817 (5.0%) |
| $55,000 to $64,999 | 1,160 (5.6%) | 1,030 (6.3%) |
| $65,000 to $74,999 | 1,086 (5.3%) | 785 (4.8%) |
| $75,000 to $99,999 | 2,572 (12.5%) | 2,288 (14.0%) |
| $100,000+ | 9,383 (45.6%) | 2,898 (17.7%) |
| Total | 20,561 (100.0%) | 16,369 (100.0%) |
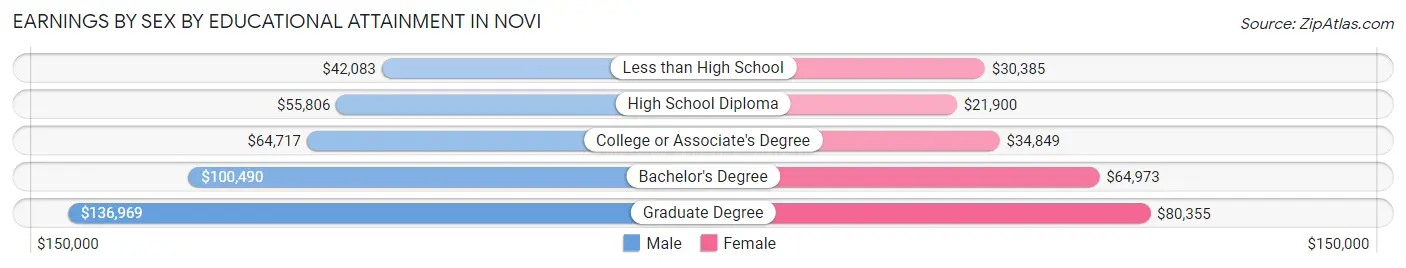
Earnings by Sex by Educational Attainment in Novi
Average earnings in Novi are $103,370 for men and $53,412 for women, a difference of 48.3%. Men with an educational attainment of graduate degree enjoy the highest average annual earnings of $136,969, while those with less than high school education earn the least with $42,083. Women with an educational attainment of graduate degree earn the most with the average annual earnings of $80,355, while those with high school diploma education have the smallest earnings of $21,900.
| Educational Attainment | Male Income | Female Income |
| Less than High School | $42,083 | $30,385 |
| High School Diploma | $55,806 | $21,900 |
| College or Associate's Degree | $64,717 | $34,849 |
| Bachelor's Degree | $100,490 | $64,973 |
| Graduate Degree | $136,969 | $80,355 |
| Total | $103,370 | $53,412 |
Family Income in Novi
Family Income Brackets in Novi
According to the Novi family income data, there are 5,393 families falling into the $200,000+ income range, which is the most common income bracket and makes up 30.5% of all families. Conversely, the $10,000 to $14,999 income bracket is the least frequent group with only 141 families (0.8%) belonging to this category.
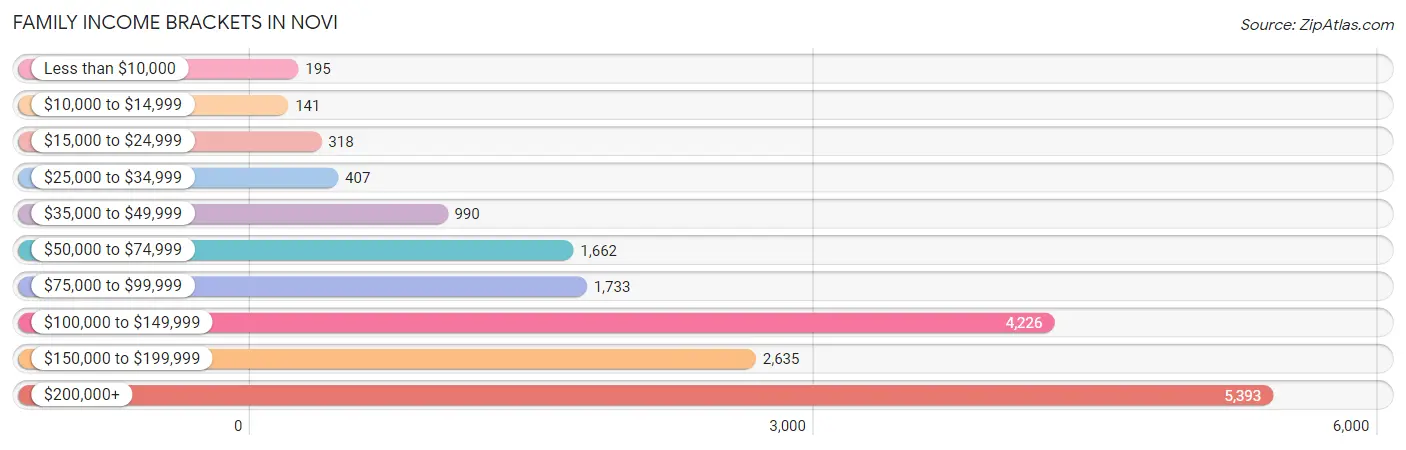
| Income Bracket | # Families | % Families |
| Less than $10,000 | 195 | 1.1% |
| $10,000 to $14,999 | 141 | 0.8% |
| $15,000 to $24,999 | 318 | 1.8% |
| $25,000 to $34,999 | 407 | 2.3% |
| $35,000 to $49,999 | 990 | 5.6% |
| $50,000 to $74,999 | 1,662 | 9.4% |
| $75,000 to $99,999 | 1,733 | 9.8% |
| $100,000 to $149,999 | 4,226 | 23.9% |
| $150,000 to $199,999 | 2,635 | 14.9% |
| $200,000+ | 5,393 | 30.5% |
Family Income by Famaliy Size in Novi
7+ person families (131 | 0.7%) account for the highest median family income in Novi with $250,001 per family, while 2-person families (6,889 | 39.0%) have the highest median income of $52,819 per family member.
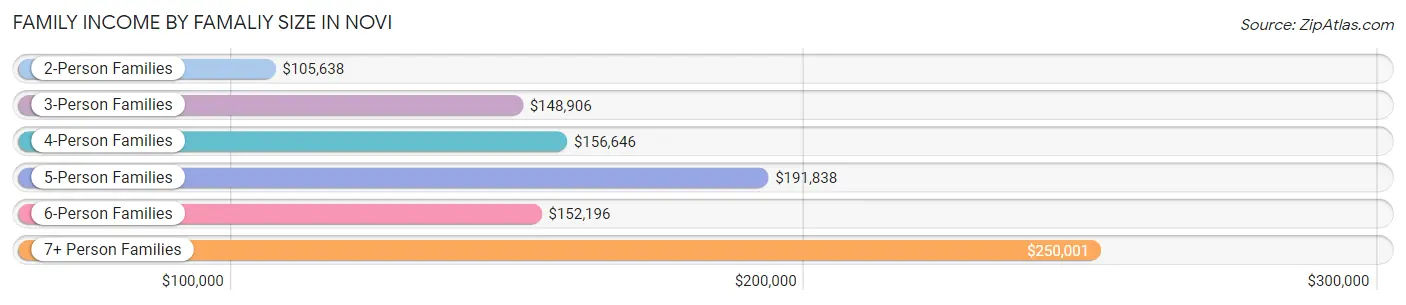
| Income Bracket | # Families | Median Income |
| 2-Person Families | 6,889 (39.0%) | $105,638 |
| 3-Person Families | 4,544 (25.7%) | $148,906 |
| 4-Person Families | 4,486 (25.4%) | $156,646 |
| 5-Person Families | 1,410 (8.0%) | $191,838 |
| 6-Person Families | 223 (1.3%) | $152,196 |
| 7+ Person Families | 131 (0.7%) | $250,001 |
| Total | 17,683 (100.0%) | $139,638 |
Family Income by Number of Earners in Novi
The median family income in Novi is $139,638, with families comprising 3+ earners (2,182) having the highest median family income of $193,333, while families with no earners (2,012) have the lowest median family income of $61,328, accounting for 12.3% and 11.4% of families, respectively.
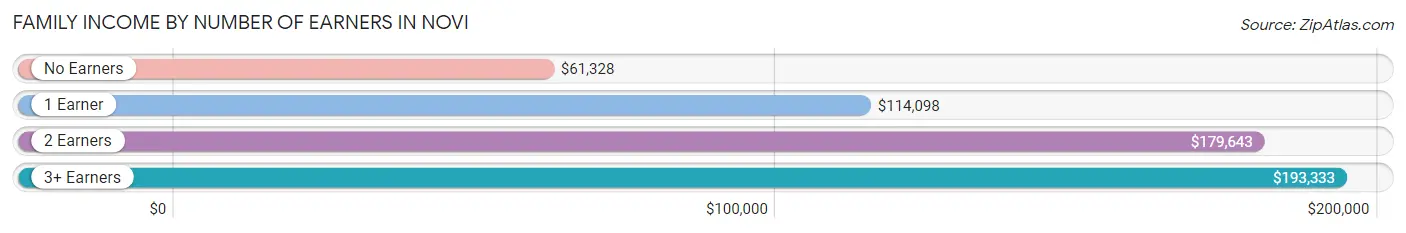
| Number of Earners | # Families | Median Income |
| No Earners | 2,012 (11.4%) | $61,328 |
| 1 Earner | 5,715 (32.3%) | $114,098 |
| 2 Earners | 7,774 (44.0%) | $179,643 |
| 3+ Earners | 2,182 (12.3%) | $193,333 |
| Total | 17,683 (100.0%) | $139,638 |
Household Income in Novi
Household Income Brackets in Novi
With 5,993 households falling in the category, the $200,000+ income range is the most frequent in Novi, accounting for 22.6% of all households. In contrast, only 318 households (1.2%) fall into the $10,000 to $14,999 income bracket, making it the least populous group.
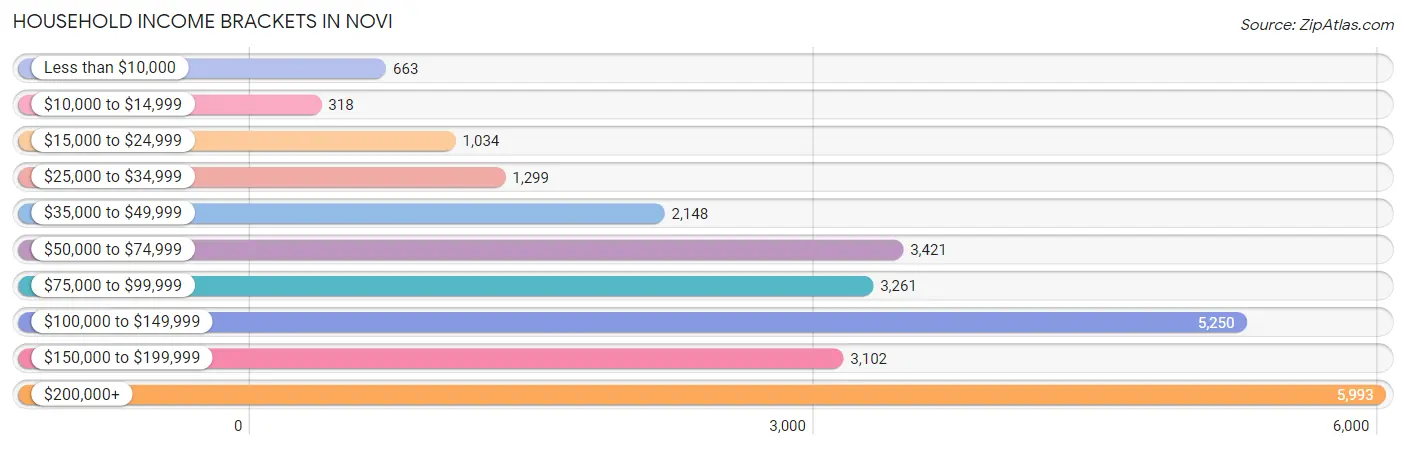
| Income Bracket | # Households | % Households |
| Less than $10,000 | 663 | 2.5% |
| $10,000 to $14,999 | 318 | 1.2% |
| $15,000 to $24,999 | 1,034 | 3.9% |
| $25,000 to $34,999 | 1,299 | 4.9% |
| $35,000 to $49,999 | 2,148 | 8.1% |
| $50,000 to $74,999 | 3,421 | 12.9% |
| $75,000 to $99,999 | 3,261 | 12.3% |
| $100,000 to $149,999 | 5,250 | 19.8% |
| $150,000 to $199,999 | 3,102 | 11.7% |
| $200,000+ | 5,993 | 22.6% |
Household Income by Householder Age in Novi
The median household income in Novi is $110,588, with the highest median household income of $150,050 found in the 45 to 64 years age bracket for the primary householder. A total of 11,235 households (42.4%) fall into this category. Meanwhile, the 65+ years age bracket for the primary householder has the lowest median household income of $59,700, with 5,909 households (22.3%) in this group.
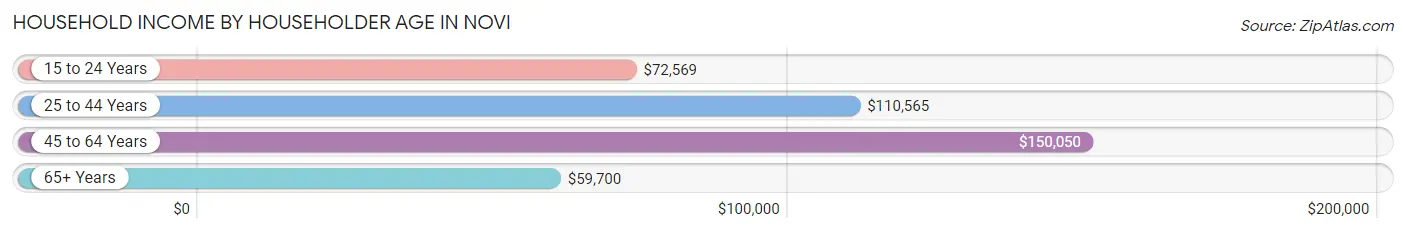
| Income Bracket | # Households | Median Income |
| 15 to 24 Years | 331 (1.3%) | $72,569 |
| 25 to 44 Years | 9,041 (34.1%) | $110,565 |
| 45 to 64 Years | 11,235 (42.4%) | $150,050 |
| 65+ Years | 5,909 (22.3%) | $59,700 |
| Total | 26,516 (100.0%) | $110,588 |
Poverty in Novi
Income Below Poverty by Sex and Age in Novi
With 2.4% poverty level for males and 5.3% for females among the residents of Novi, 25 to 34 year old males and 6 to 11 year old females are the most vulnerable to poverty, with 166 males (4.6%) and 264 females (10.1%) in their respective age groups living below the poverty level.
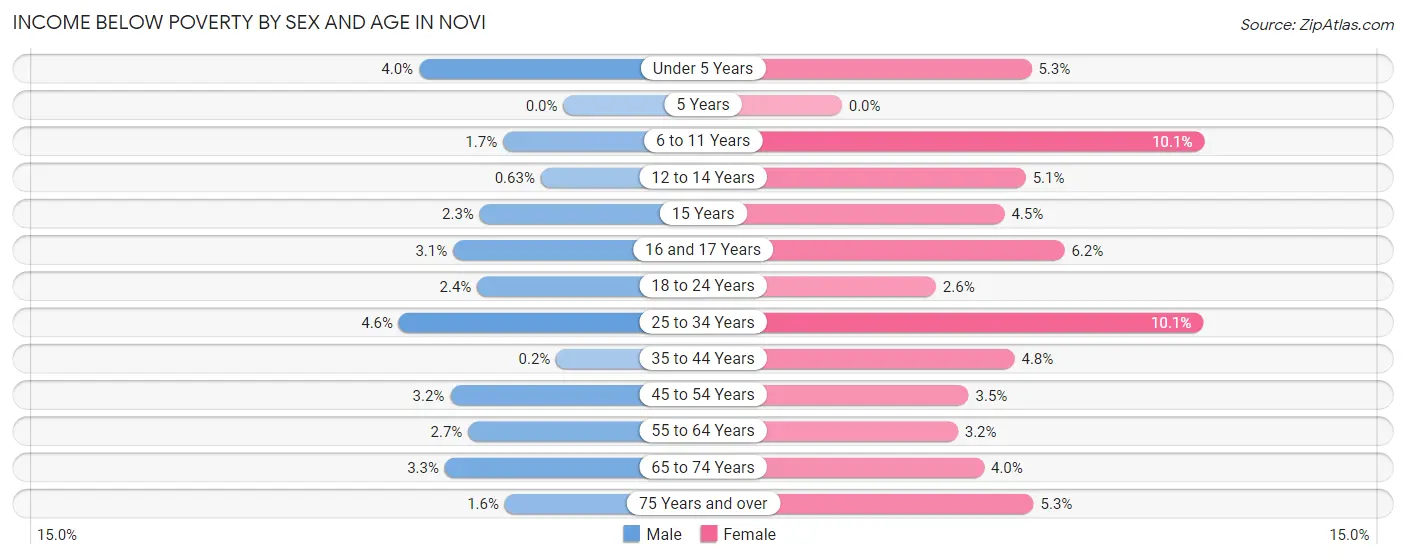
| Age Bracket | Male | Female |
| Under 5 Years | 72 (4.0%) | 91 (5.3%) |
| 5 Years | 0 (0.0%) | 0 (0.0%) |
| 6 to 11 Years | 43 (1.7%) | 264 (10.1%) |
| 12 to 14 Years | 8 (0.6%) | 77 (5.1%) |
| 15 Years | 12 (2.3%) | 27 (4.5%) |
| 16 and 17 Years | 34 (3.1%) | 50 (6.2%) |
| 18 to 24 Years | 55 (2.4%) | 59 (2.6%) |
| 25 to 34 Years | 166 (4.6%) | 419 (10.1%) |
| 35 to 44 Years | 10 (0.2%) | 227 (4.8%) |
| 45 to 54 Years | 168 (3.2%) | 173 (3.5%) |
| 55 to 64 Years | 112 (2.6%) | 127 (3.2%) |
| 65 to 74 Years | 79 (3.3%) | 126 (4.0%) |
| 75 Years and over | 25 (1.6%) | 132 (5.3%) |
| Total | 784 (2.4%) | 1,772 (5.3%) |
Income Above Poverty by Sex and Age in Novi
According to the poverty statistics in Novi, males aged 5 years and females aged 5 years are the age groups that are most secure financially, with 100.0% of males and 100.0% of females in these age groups living above the poverty line.
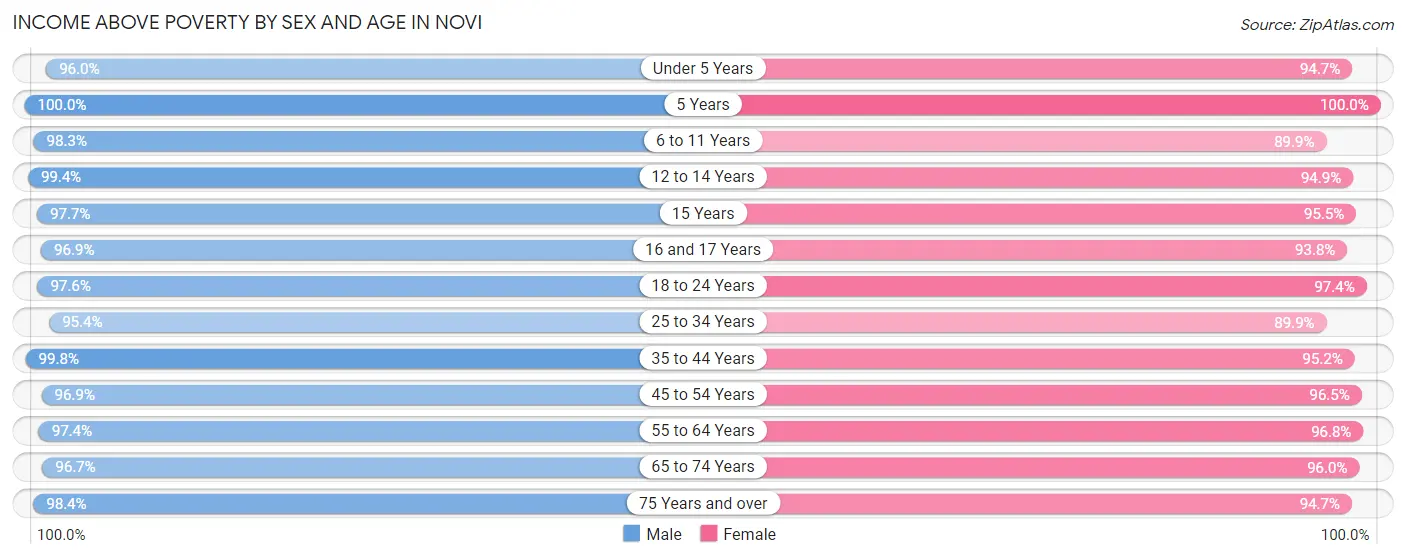
| Age Bracket | Male | Female |
| Under 5 Years | 1,717 (96.0%) | 1,633 (94.7%) |
| 5 Years | 543 (100.0%) | 383 (100.0%) |
| 6 to 11 Years | 2,522 (98.3%) | 2,353 (89.9%) |
| 12 to 14 Years | 1,270 (99.4%) | 1,427 (94.9%) |
| 15 Years | 503 (97.7%) | 569 (95.5%) |
| 16 and 17 Years | 1,074 (96.9%) | 756 (93.8%) |
| 18 to 24 Years | 2,240 (97.6%) | 2,196 (97.4%) |
| 25 to 34 Years | 3,458 (95.4%) | 3,744 (89.9%) |
| 35 to 44 Years | 5,084 (99.8%) | 4,494 (95.2%) |
| 45 to 54 Years | 5,157 (96.9%) | 4,729 (96.5%) |
| 55 to 64 Years | 4,119 (97.4%) | 3,809 (96.8%) |
| 65 to 74 Years | 2,314 (96.7%) | 3,058 (96.0%) |
| 75 Years and over | 1,510 (98.4%) | 2,338 (94.7%) |
| Total | 31,511 (97.6%) | 31,489 (94.7%) |
Income Below Poverty Among Married-Couple Families in Novi
The poverty statistics for married-couple families in Novi show that 1.1% or 163 of the total 14,820 families live below the poverty line. Families with no children have the highest poverty rate of 1.8%, comprising of 124 families. On the other hand, families with 3 or 4 children have the lowest poverty rate of 0.0%, which includes 0 families.
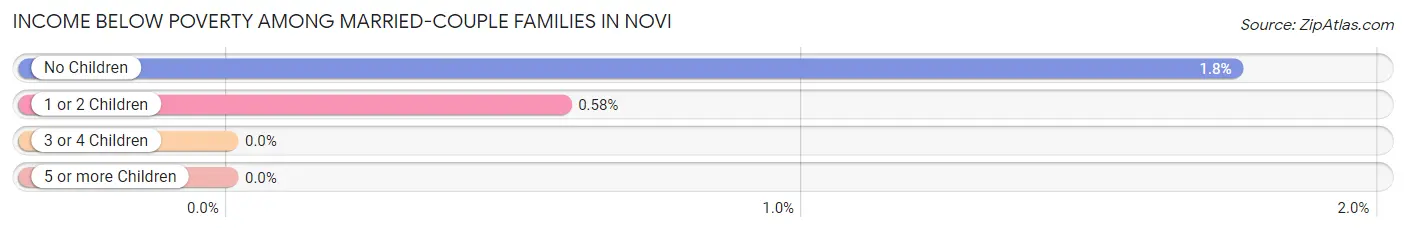
| Children | Above Poverty | Below Poverty |
| No Children | 6,946 (98.3%) | 124 (1.8%) |
| 1 or 2 Children | 6,651 (99.4%) | 39 (0.6%) |
| 3 or 4 Children | 1,060 (100.0%) | 0 (0.0%) |
| 5 or more Children | 0 (0.0%) | 0 (0.0%) |
| Total | 14,657 (98.9%) | 163 (1.1%) |
Income Below Poverty Among Single-Parent Households in Novi
According to the poverty data in Novi, 1.4% or 12 single-father households and 14.5% or 288 single-mother households are living below the poverty line. Among single-father households, those with 1 or 2 children have the highest poverty rate, with 12 households (2.4%) experiencing poverty. Likewise, among single-mother households, those with 3 or 4 children have the highest poverty rate, with 89 households (37.4%) falling below the poverty line.
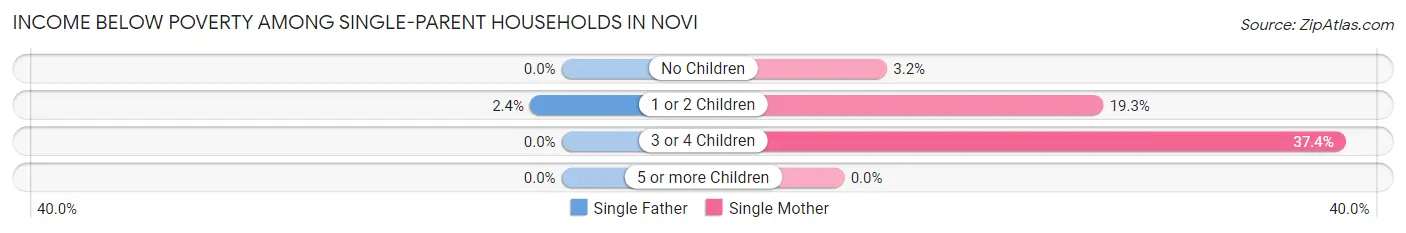
| Children | Single Father | Single Mother |
| No Children | 0 (0.0%) | 27 (3.2%) |
| 1 or 2 Children | 12 (2.4%) | 172 (19.3%) |
| 3 or 4 Children | 0 (0.0%) | 89 (37.4%) |
| 5 or more Children | 0 (0.0%) | 0 (0.0%) |
| Total | 12 (1.4%) | 288 (14.5%) |
Income Below Poverty Among Married-Couple vs Single-Parent Households in Novi
The poverty data for Novi shows that 163 of the married-couple family households (1.1%) and 300 of the single-parent households (10.5%) are living below the poverty level. Within the married-couple family households, those with no children have the highest poverty rate, with 124 households (1.8%) falling below the poverty line. Among the single-parent households, those with 3 or 4 children have the highest poverty rate, with 89 household (37.4%) living below poverty.
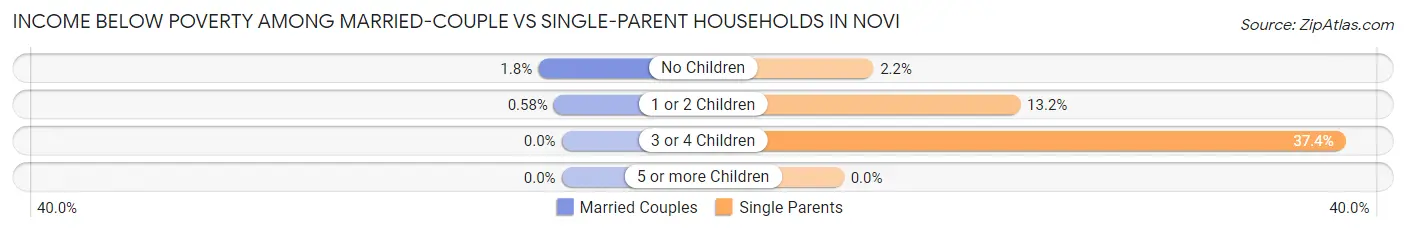
| Children | Married-Couple Families | Single-Parent Households |
| No Children | 124 (1.8%) | 27 (2.2%) |
| 1 or 2 Children | 39 (0.6%) | 184 (13.2%) |
| 3 or 4 Children | 0 (0.0%) | 89 (37.4%) |
| 5 or more Children | 0 (0.0%) | 0 (0.0%) |
| Total | 163 (1.1%) | 300 (10.5%) |
Race in Novi
The most populous races in Novi are White / Caucasian (39,798 | 60.4%), Asian (16,728 | 25.4%), and Black / African American (5,312 | 8.1%).
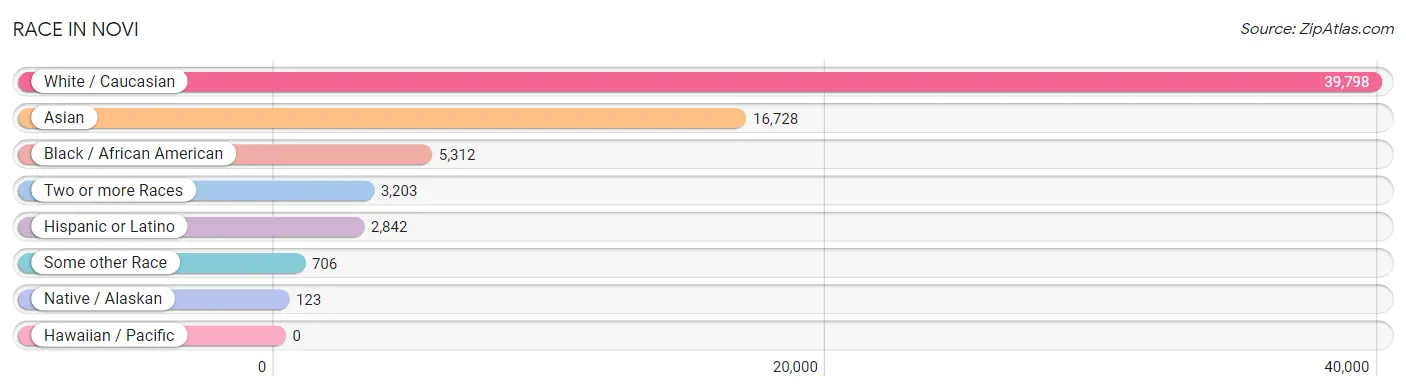
| Race | # Population | % Population |
| Asian | 16,728 | 25.4% |
| Black / African American | 5,312 | 8.1% |
| Hawaiian / Pacific | 0 | 0.0% |
| Hispanic or Latino | 2,842 | 4.3% |
| Native / Alaskan | 123 | 0.2% |
| White / Caucasian | 39,798 | 60.4% |
| Two or more Races | 3,203 | 4.9% |
| Some other Race | 706 | 1.1% |
| Total | 65,870 | 100.0% |
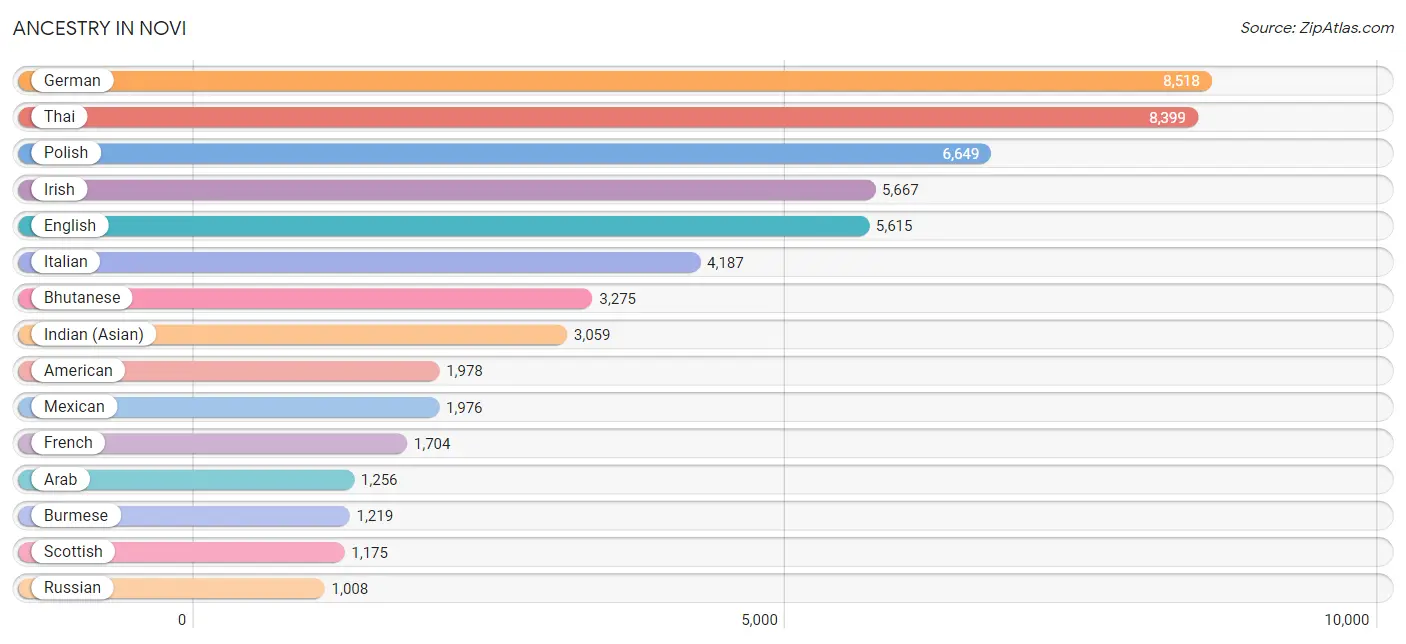
Ancestry in Novi
The most populous ancestries reported in Novi are German (8,518 | 12.9%), Thai (8,399 | 12.8%), Polish (6,649 | 10.1%), Irish (5,667 | 8.6%), and English (5,615 | 8.5%), together accounting for 52.9% of all Novi residents.
| Ancestry | # Population | % Population |
| African | 450 | 0.7% |
| Albanian | 275 | 0.4% |
| American | 1,978 | 3.0% |
| Arab | 1,256 | 1.9% |
| Argentinean | 13 | 0.0% |
| Armenian | 158 | 0.2% |
| Assyrian / Chaldean / Syriac | 955 | 1.5% |
| Australian | 16 | 0.0% |
| Austrian | 274 | 0.4% |
| Belgian | 264 | 0.4% |
| Bhutanese | 3,275 | 5.0% |
| Brazilian | 134 | 0.2% |
| British | 307 | 0.5% |
| Bulgarian | 62 | 0.1% |
| Burmese | 1,219 | 1.8% |
| Canadian | 265 | 0.4% |
| Central American | 59 | 0.1% |
| Cherokee | 37 | 0.1% |
| Chilean | 11 | 0.0% |
| Chippewa | 33 | 0.1% |
| Colombian | 32 | 0.1% |
| Croatian | 252 | 0.4% |
| Cuban | 67 | 0.1% |
| Czech | 310 | 0.5% |
| Czechoslovakian | 231 | 0.4% |
| Danish | 113 | 0.2% |
| Dominican | 163 | 0.3% |
| Dutch | 917 | 1.4% |
| Eastern European | 369 | 0.6% |
| Egyptian | 160 | 0.2% |
| English | 5,615 | 8.5% |
| European | 810 | 1.2% |
| Filipino | 24 | 0.0% |
| Finnish | 754 | 1.1% |
| French | 1,704 | 2.6% |
| French American Indian | 18 | 0.0% |
| French Canadian | 629 | 0.9% |
| German | 8,518 | 12.9% |
| Ghanaian | 57 | 0.1% |
| Greek | 905 | 1.4% |
| Guatemalan | 14 | 0.0% |
| Hungarian | 399 | 0.6% |
| Indian (Asian) | 3,059 | 4.6% |
| Iranian | 154 | 0.2% |
| Iraqi | 217 | 0.3% |
| Irish | 5,667 | 8.6% |
| Iroquois | 10 | 0.0% |
| Israeli | 4 | 0.0% |
| Italian | 4,187 | 6.4% |
| Jamaican | 65 | 0.1% |
| Jordanian | 105 | 0.2% |
| Korean | 939 | 1.4% |
| Laotian | 15 | 0.0% |
| Lebanese | 498 | 0.8% |
| Lithuanian | 256 | 0.4% |
| Lumbee | 71 | 0.1% |
| Macedonian | 122 | 0.2% |
| Maltese | 192 | 0.3% |
| Mexican | 1,976 | 3.0% |
| Mexican American Indian | 16 | 0.0% |
| Mongolian | 17 | 0.0% |
| Native Hawaiian | 10 | 0.0% |
| Nigerian | 65 | 0.1% |
| Northern European | 25 | 0.0% |
| Norwegian | 421 | 0.6% |
| Ottawa | 27 | 0.0% |
| Palestinian | 15 | 0.0% |
| Peruvian | 60 | 0.1% |
| Polish | 6,649 | 10.1% |
| Portuguese | 46 | 0.1% |
| Puerto Rican | 124 | 0.2% |
| Romanian | 365 | 0.5% |
| Russian | 1,008 | 1.5% |
| Salvadoran | 45 | 0.1% |
| Scandinavian | 197 | 0.3% |
| Scotch-Irish | 556 | 0.8% |
| Scottish | 1,175 | 1.8% |
| Serbian | 74 | 0.1% |
| Slovak | 156 | 0.2% |
| Slovene | 36 | 0.1% |
| South African | 357 | 0.5% |
| South American | 185 | 0.3% |
| Spaniard | 129 | 0.2% |
| Spanish | 95 | 0.1% |
| Sri Lankan | 157 | 0.2% |
| Subsaharan African | 942 | 1.4% |
| Swedish | 593 | 0.9% |
| Swiss | 101 | 0.2% |
| Syrian | 45 | 0.1% |
| Thai | 8,399 | 12.8% |
| Trinidadian and Tobagonian | 96 | 0.2% |
| Turkish | 71 | 0.1% |
| Ukrainian | 478 | 0.7% |
| Venezuelan | 69 | 0.1% |
| Vietnamese | 143 | 0.2% |
| Welsh | 97 | 0.2% |
| Yugoslavian | 6 | 0.0% | View All 97 Rows |
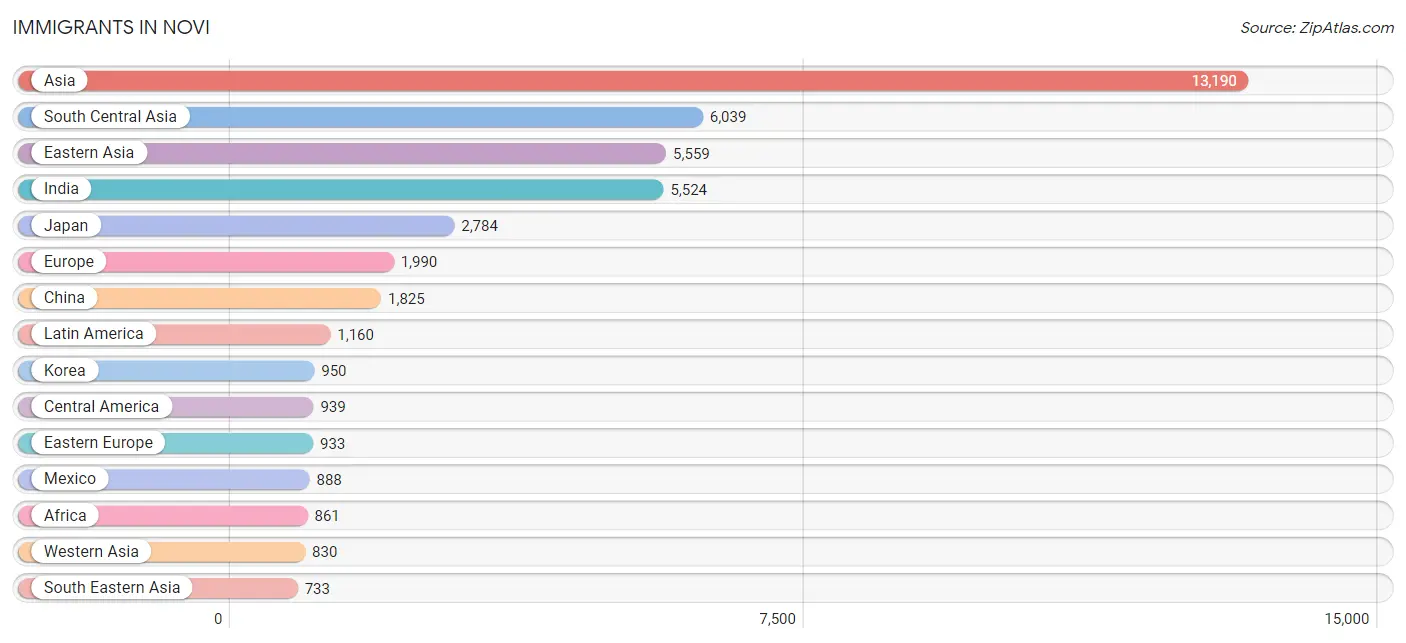
Immigrants in Novi
The most numerous immigrant groups reported in Novi came from Asia (13,190 | 20.0%), South Central Asia (6,039 | 9.2%), Eastern Asia (5,559 | 8.4%), India (5,524 | 8.4%), and Japan (2,784 | 4.2%), together accounting for 50.2% of all Novi residents.
| Immigration Origin | # Population | % Population |
| Africa | 861 | 1.3% |
| Albania | 209 | 0.3% |
| Asia | 13,190 | 20.0% |
| Australia | 19 | 0.0% |
| Austria | 59 | 0.1% |
| Bangladesh | 86 | 0.1% |
| Brazil | 59 | 0.1% |
| Bulgaria | 13 | 0.0% |
| Cameroon | 82 | 0.1% |
| Canada | 624 | 0.9% |
| Caribbean | 86 | 0.1% |
| Central America | 939 | 1.4% |
| China | 1,825 | 2.8% |
| Colombia | 5 | 0.0% |
| Cuba | 28 | 0.0% |
| Denmark | 11 | 0.0% |
| Eastern Africa | 100 | 0.2% |
| Eastern Asia | 5,559 | 8.4% |
| Eastern Europe | 933 | 1.4% |
| Egypt | 126 | 0.2% |
| El Salvador | 45 | 0.1% |
| England | 178 | 0.3% |
| Ethiopia | 9 | 0.0% |
| Europe | 1,990 | 3.0% |
| France | 6 | 0.0% |
| Germany | 352 | 0.5% |
| Ghana | 28 | 0.0% |
| Guatemala | 6 | 0.0% |
| Hong Kong | 14 | 0.0% |
| Hungary | 7 | 0.0% |
| India | 5,524 | 8.4% |
| Indonesia | 26 | 0.0% |
| Iran | 110 | 0.2% |
| Iraq | 622 | 0.9% |
| Israel | 22 | 0.0% |
| Italy | 219 | 0.3% |
| Japan | 2,784 | 4.2% |
| Jordan | 31 | 0.1% |
| Kenya | 16 | 0.0% |
| Korea | 950 | 1.4% |
| Latin America | 1,160 | 1.8% |
| Latvia | 6 | 0.0% |
| Lebanon | 98 | 0.2% |
| Malaysia | 17 | 0.0% |
| Mexico | 888 | 1.3% |
| Middle Africa | 82 | 0.1% |
| Netherlands | 10 | 0.0% |
| Nigeria | 17 | 0.0% |
| North Macedonia | 10 | 0.0% |
| Northern Africa | 126 | 0.2% |
| Northern Europe | 275 | 0.4% |
| Oceania | 19 | 0.0% |
| Pakistan | 307 | 0.5% |
| Peru | 13 | 0.0% |
| Philippines | 539 | 0.8% |
| Poland | 75 | 0.1% |
| Romania | 143 | 0.2% |
| Russia | 229 | 0.4% |
| Saudi Arabia | 12 | 0.0% |
| Senegal | 102 | 0.2% |
| Serbia | 31 | 0.1% |
| Sierra Leone | 10 | 0.0% |
| Singapore | 85 | 0.1% |
| South Africa | 357 | 0.5% |
| South America | 135 | 0.2% |
| South Central Asia | 6,039 | 9.2% |
| South Eastern Asia | 733 | 1.1% |
| Southern Europe | 355 | 0.5% |
| Spain | 136 | 0.2% |
| Sri Lanka | 12 | 0.0% |
| Syria | 45 | 0.1% |
| Taiwan | 129 | 0.2% |
| Trinidad and Tobago | 58 | 0.1% |
| Ukraine | 38 | 0.1% |
| Venezuela | 58 | 0.1% |
| Vietnam | 66 | 0.1% |
| Western Africa | 162 | 0.3% |
| Western Asia | 830 | 1.3% |
| Western Europe | 427 | 0.6% | View All 79 Rows |
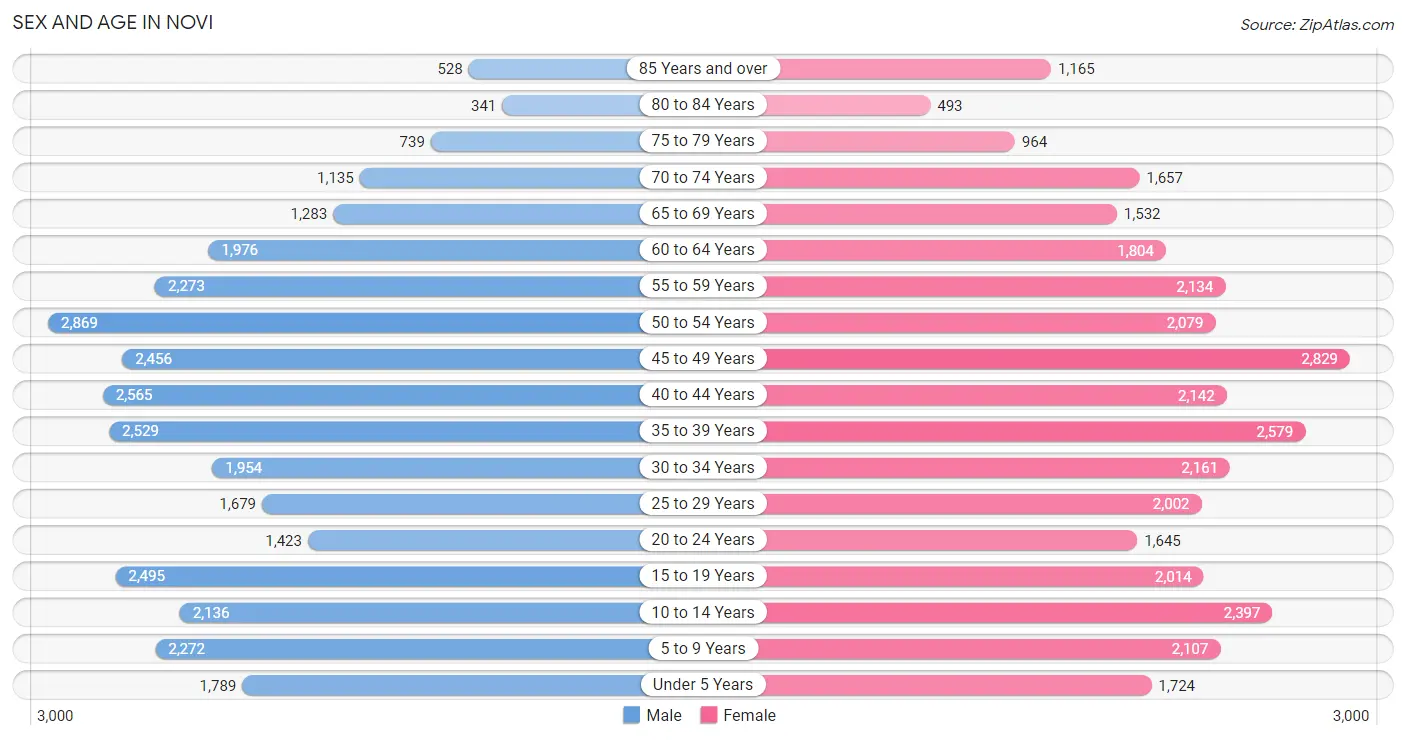
Sex and Age in Novi
Sex and Age in Novi
The most populous age groups in Novi are 50 to 54 Years (2,869 | 8.8%) for men and 45 to 49 Years (2,829 | 8.5%) for women.
| Age Bracket | Male | Female |
| Under 5 Years | 1,789 (5.5%) | 1,724 (5.2%) |
| 5 to 9 Years | 2,272 (7.0%) | 2,107 (6.3%) |
| 10 to 14 Years | 2,136 (6.6%) | 2,397 (7.2%) |
| 15 to 19 Years | 2,495 (7.7%) | 2,014 (6.0%) |
| 20 to 24 Years | 1,423 (4.4%) | 1,645 (4.9%) |
| 25 to 29 Years | 1,679 (5.2%) | 2,002 (6.0%) |
| 30 to 34 Years | 1,954 (6.0%) | 2,161 (6.5%) |
| 35 to 39 Years | 2,529 (7.8%) | 2,579 (7.7%) |
| 40 to 44 Years | 2,565 (7.9%) | 2,142 (6.4%) |
| 45 to 49 Years | 2,456 (7.6%) | 2,829 (8.5%) |
| 50 to 54 Years | 2,869 (8.8%) | 2,079 (6.2%) |
| 55 to 59 Years | 2,273 (7.0%) | 2,134 (6.4%) |
| 60 to 64 Years | 1,976 (6.1%) | 1,804 (5.4%) |
| 65 to 69 Years | 1,283 (4.0%) | 1,532 (4.6%) |
| 70 to 74 Years | 1,135 (3.5%) | 1,657 (5.0%) |
| 75 to 79 Years | 739 (2.3%) | 964 (2.9%) |
| 80 to 84 Years | 341 (1.1%) | 493 (1.5%) |
| 85 Years and over | 528 (1.6%) | 1,165 (3.5%) |
| Total | 32,442 (100.0%) | 33,428 (100.0%) |
Families and Households in Novi
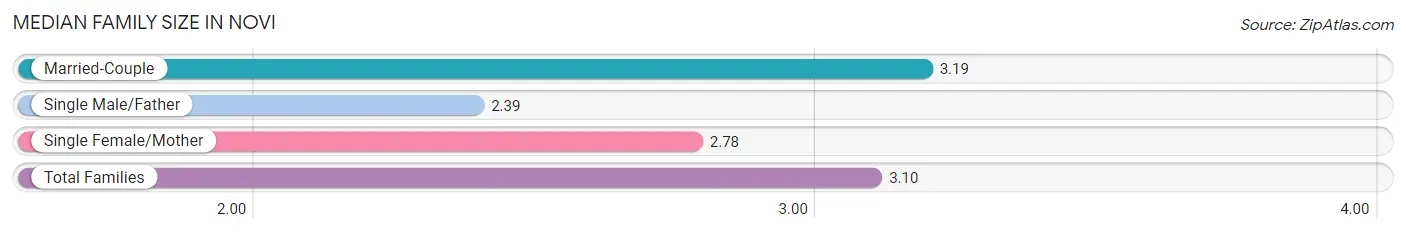
Median Family Size in Novi
The median family size in Novi is 3.10 persons per family, with married-couple families (14,820 | 83.8%) accounting for the largest median family size of 3.19 persons per family. On the other hand, single male/father families (884 | 5.0%) represent the smallest median family size with 2.39 persons per family.
| Family Type | # Families | Family Size |
| Married-Couple | 14,820 (83.8%) | 3.19 |
| Single Male/Father | 884 (5.0%) | 2.39 |
| Single Female/Mother | 1,979 (11.2%) | 2.78 |
| Total Families | 17,683 (100.0%) | 3.10 |
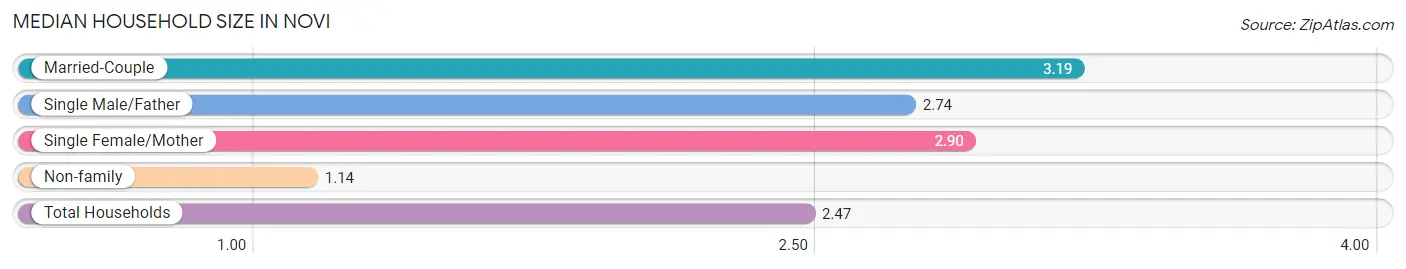
Median Household Size in Novi
The median household size in Novi is 2.47 persons per household, with married-couple households (14,820 | 55.9%) accounting for the largest median household size of 3.19 persons per household. non-family households (8,833 | 33.3%) represent the smallest median household size with 1.14 persons per household.
| Household Type | # Households | Household Size |
| Married-Couple | 14,820 (55.9%) | 3.19 |
| Single Male/Father | 884 (3.3%) | 2.74 |
| Single Female/Mother | 1,979 (7.5%) | 2.90 |
| Non-family | 8,833 (33.3%) | 1.14 |
| Total Households | 26,516 (100.0%) | 2.47 |
Household Size by Marriage Status in Novi
Out of a total of 26,516 households in Novi, 17,683 (66.7%) are family households, while 8,833 (33.3%) are nonfamily households. The most numerous type of family households are 2-person households, comprising 6,604, and the most common type of nonfamily households are 1-person households, comprising 7,818.
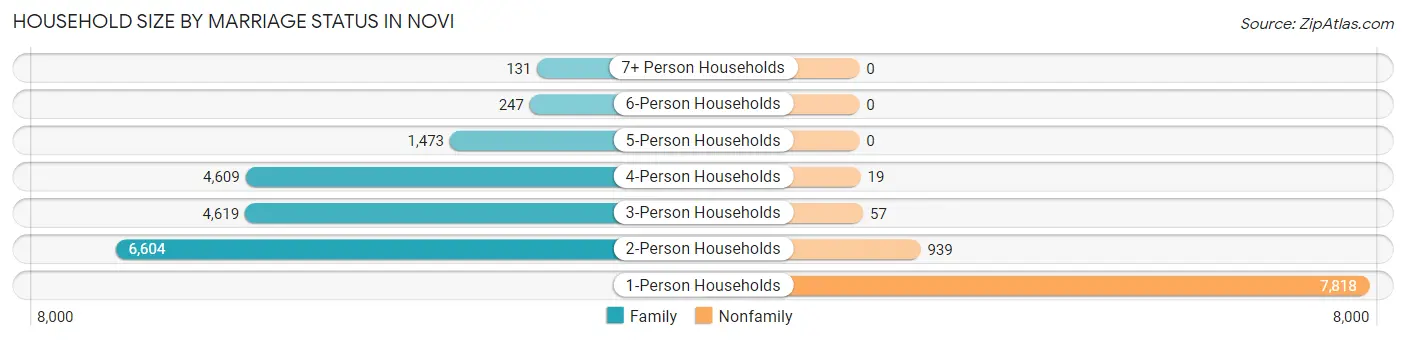
| Household Size | Family Households | Nonfamily Households |
| 1-Person Households | - | 7,818 (29.5%) |
| 2-Person Households | 6,604 (24.9%) | 939 (3.5%) |
| 3-Person Households | 4,619 (17.4%) | 57 (0.2%) |
| 4-Person Households | 4,609 (17.4%) | 19 (0.1%) |
| 5-Person Households | 1,473 (5.6%) | 0 (0.0%) |
| 6-Person Households | 247 (0.9%) | 0 (0.0%) |
| 7+ Person Households | 131 (0.5%) | 0 (0.0%) |
| Total | 17,683 (66.7%) | 8,833 (33.3%) |
Female Fertility in Novi
Fertility by Age in Novi
Average fertility rate in Novi is 46.0 births per 1,000 women. Women in the age bracket of 20 to 34 years have the highest fertility rate with 76.0 births per 1,000 women. Women in the age bracket of 20 to 34 years acount for 60.1% of all women with births.
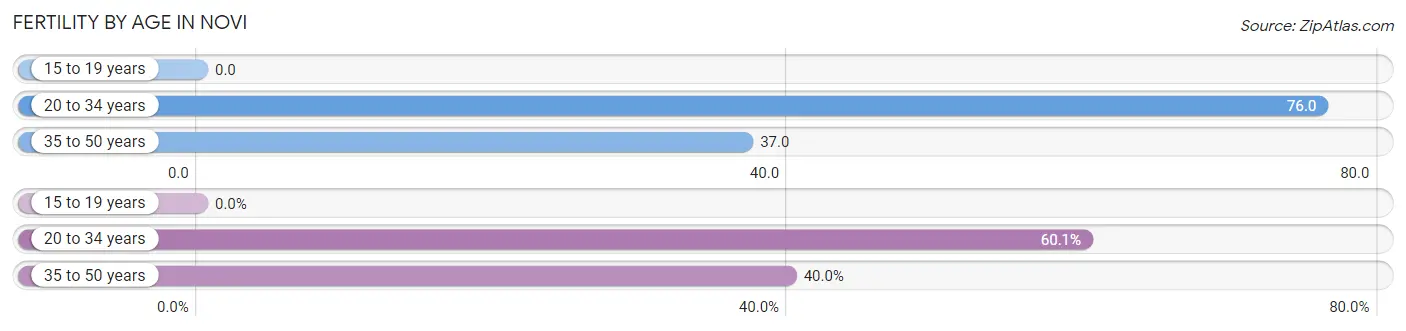
| Age Bracket | Women with Births | Births / 1,000 Women |
| 15 to 19 years | 0 (0.0%) | 0.0 |
| 20 to 34 years | 439 (60.1%) | 76.0 |
| 35 to 50 years | 292 (40.0%) | 37.0 |
| Total | 731 (100.0%) | 46.0 |
Fertility by Age by Marriage Status in Novi
76.7% of women with births (731) in Novi are married. The highest percentage of unmarried women with births falls into 20 to 34 years age bracket with 25.5% of them unmarried at the time of birth, while the lowest percentage of unmarried women with births belong to 35 to 50 years age bracket with 19.9% of them unmarried.
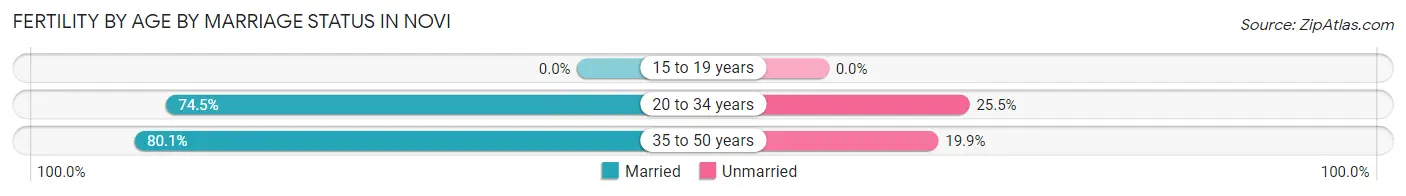
| Age Bracket | Married | Unmarried |
| 15 to 19 years | 0 (0.0%) | 0 (0.0%) |
| 20 to 34 years | 327 (74.5%) | 112 (25.5%) |
| 35 to 50 years | 234 (80.1%) | 58 (19.9%) |
| Total | 561 (76.7%) | 170 (23.3%) |
Fertility by Education in Novi
Average fertility rate in Novi is 46.0 births per 1,000 women. Women with the education attainment of graduate degree have the highest fertility rate of 83.0 births per 1,000 women, while women with the education attainment of less than high school have the lowest fertility at 14.0 births per 1,000 women. Women with the education attainment of graduate degree represent 42.4% of all women with births.
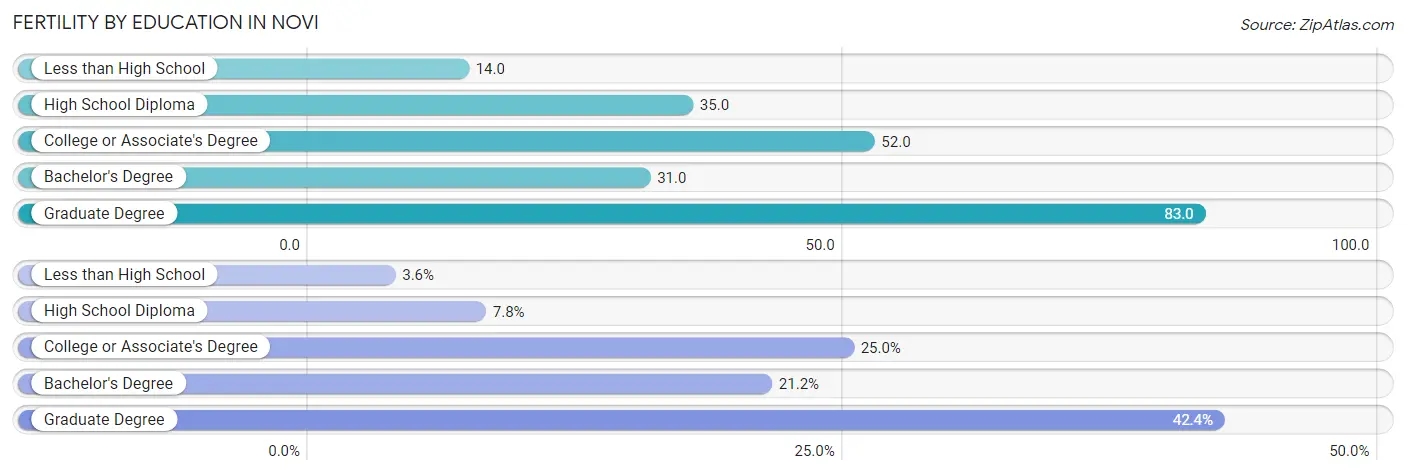
| Educational Attainment | Women with Births | Births / 1,000 Women |
| Less than High School | 26 (3.6%) | 14.0 |
| High School Diploma | 57 (7.8%) | 35.0 |
| College or Associate's Degree | 183 (25.0%) | 52.0 |
| Bachelor's Degree | 155 (21.2%) | 31.0 |
| Graduate Degree | 310 (42.4%) | 83.0 |
| Total | 731 (100.0%) | 46.0 |
Fertility by Education by Marriage Status in Novi
23.3% of women with births in Novi are unmarried. Women with the educational attainment of less than high school are most likely to be married with 100.0% of them married at childbirth, while women with the educational attainment of college or associate's degree are least likely to be married with 68.9% of them unmarried at childbirth.
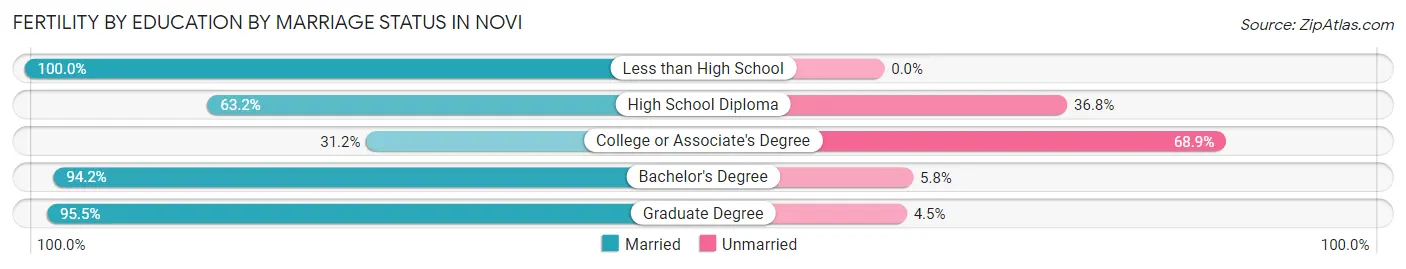
| Educational Attainment | Married | Unmarried |
| Less than High School | 26 (100.0%) | 0 (0.0%) |
| High School Diploma | 36 (63.2%) | 21 (36.8%) |
| College or Associate's Degree | 57 (31.1%) | 126 (68.9%) |
| Bachelor's Degree | 146 (94.2%) | 9 (5.8%) |
| Graduate Degree | 296 (95.5%) | 14 (4.5%) |
| Total | 561 (76.7%) | 170 (23.3%) |
Employment Characteristics in Novi
Employment by Class of Employer in Novi
Among the 33,576 employed individuals in Novi, private company employees (25,902 | 77.1%), not-for-profit organizations (2,894 | 8.6%), and self-employed (incorporated) (1,367 | 4.1%) make up the most common classes of employment.
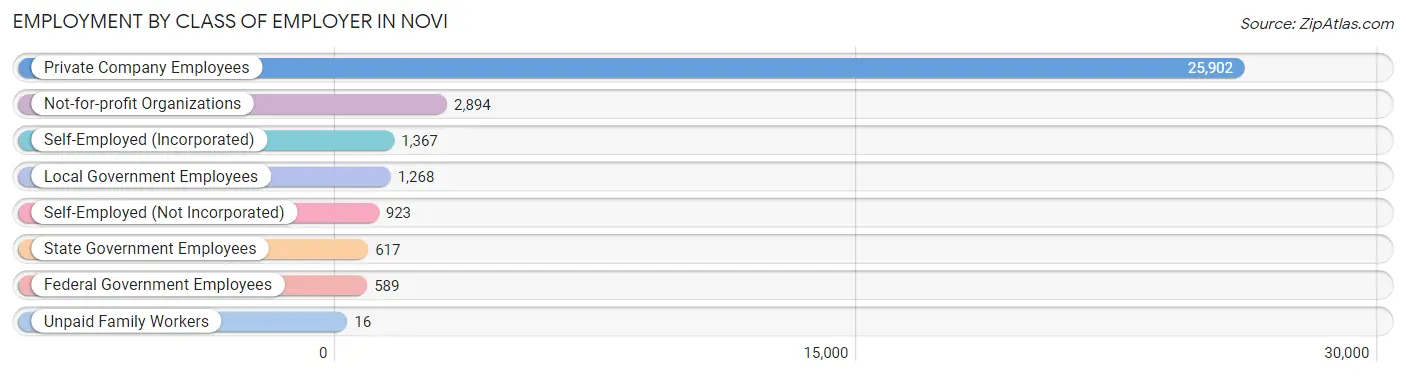
| Employer Class | # Employees | % Employees |
| Private Company Employees | 25,902 | 77.1% |
| Self-Employed (Incorporated) | 1,367 | 4.1% |
| Self-Employed (Not Incorporated) | 923 | 2.8% |
| Not-for-profit Organizations | 2,894 | 8.6% |
| Local Government Employees | 1,268 | 3.8% |
| State Government Employees | 617 | 1.8% |
| Federal Government Employees | 589 | 1.8% |
| Unpaid Family Workers | 16 | 0.1% |
| Total | 33,576 | 100.0% |
Employment Status by Age in Novi
According to the labor force statistics for Novi, out of the total population over 16 years of age (52,334), 68.2% or 35,692 individuals are in the labor force, with 4.3% or 1,535 of them unemployed. The age group with the highest labor force participation rate is 30 to 34 years, with 87.4% or 3,597 individuals in the labor force. Within the labor force, the 20 to 24 years age range has the highest percentage of unemployed individuals, with 20.2% or 515 of them being unemployed.
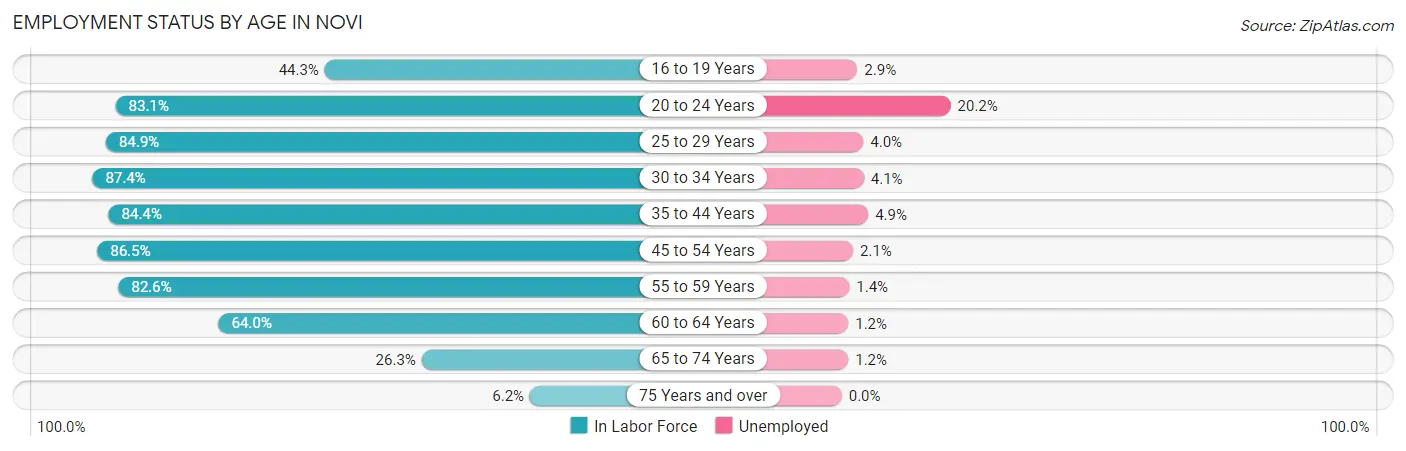
| Age Bracket | In Labor Force | Unemployed |
| 16 to 19 Years | 1,505 (44.3%) | 44 (2.9%) |
| 20 to 24 Years | 2,550 (83.1%) | 515 (20.2%) |
| 25 to 29 Years | 3,125 (84.9%) | 125 (4.0%) |
| 30 to 34 Years | 3,597 (87.4%) | 147 (4.1%) |
| 35 to 44 Years | 8,284 (84.4%) | 406 (4.9%) |
| 45 to 54 Years | 8,852 (86.5%) | 186 (2.1%) |
| 55 to 59 Years | 3,640 (82.6%) | 51 (1.4%) |
| 60 to 64 Years | 2,419 (64.0%) | 29 (1.2%) |
| 65 to 74 Years | 1,475 (26.3%) | 18 (1.2%) |
| 75 Years and over | 262 (6.2%) | 0 (0.0%) |
| Total | 35,692 (68.2%) | 1,535 (4.3%) |
Employment Status by Educational Attainment in Novi
According to labor force statistics for Novi, 83.0% of individuals (29,906) out of the total population between 25 and 64 years of age (36,031) are in the labor force, with 3.2% or 957 of them being unemployed. The group with the highest labor force participation rate are those with the educational attainment of bachelor's degree or higher, with 86.0% or 20,905 individuals in the labor force. Within the labor force, individuals with college / associate degree education have the highest percentage of unemployment, with 7.8% or 474 of them being unemployed.
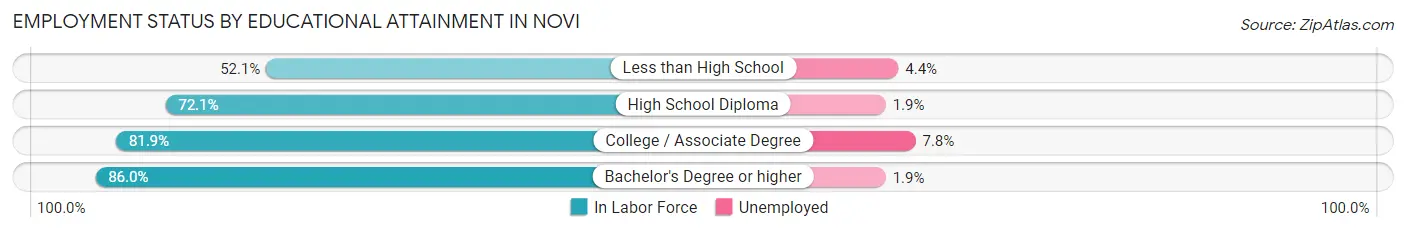
| Educational Attainment | In Labor Force | Unemployed |
| Less than High School | 405 (52.1%) | 34 (4.4%) |
| High School Diploma | 2,544 (72.1%) | 67 (1.9%) |
| College / Associate Degree | 6,075 (81.9%) | 579 (7.8%) |
| Bachelor's Degree or higher | 20,905 (86.0%) | 462 (1.9%) |
| Total | 29,906 (83.0%) | 1,153 (3.2%) |
Employment Occupations by Sex in Novi
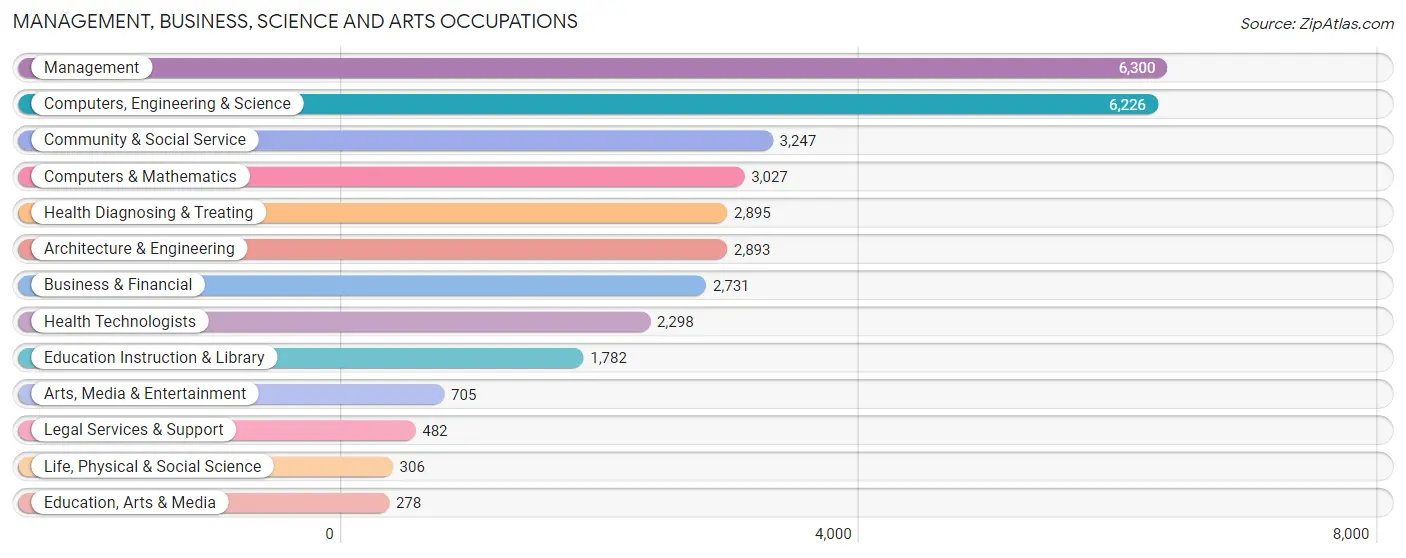
Management, Business, Science and Arts Occupations
The most common Management, Business, Science and Arts occupations in Novi are Management (6,300 | 18.4%), Computers, Engineering & Science (6,226 | 18.2%), Community & Social Service (3,247 | 9.5%), Computers & Mathematics (3,027 | 8.8%), and Health Diagnosing & Treating (2,895 | 8.5%).
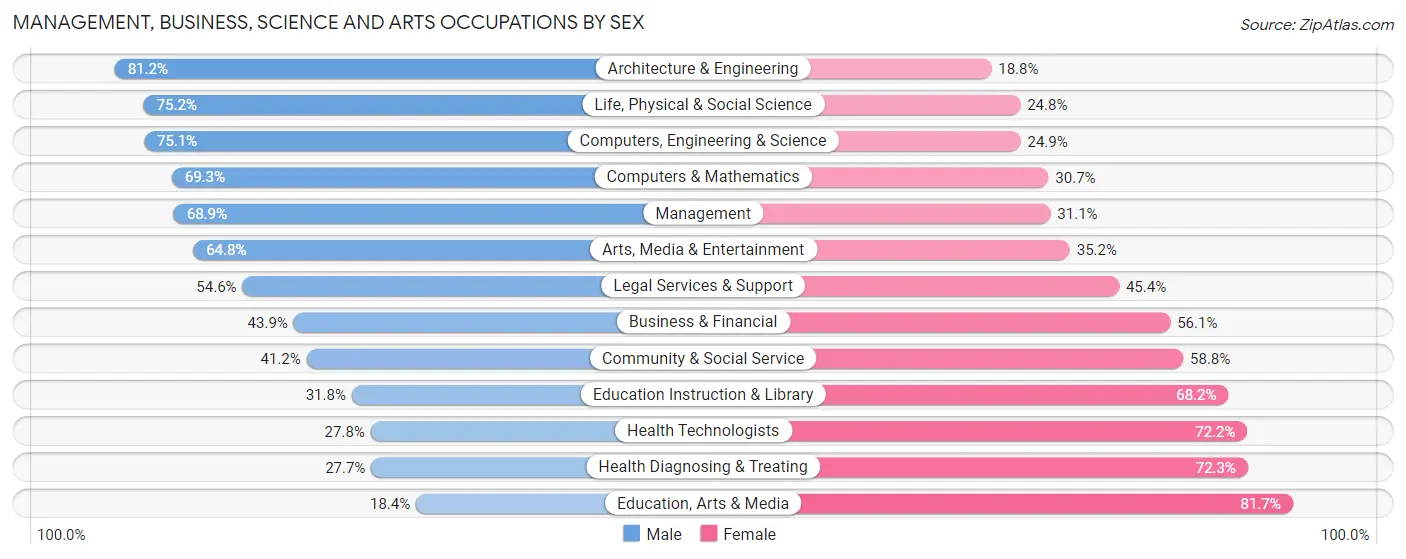
Management, Business, Science and Arts Occupations by Sex
Within the Management, Business, Science and Arts occupations in Novi, the most male-oriented occupations are Architecture & Engineering (81.2%), Life, Physical & Social Science (75.2%), and Computers, Engineering & Science (75.1%), while the most female-oriented occupations are Education, Arts & Media (81.7%), Health Diagnosing & Treating (72.3%), and Health Technologists (72.2%).
| Occupation | Male | Female |
| Management | 4,339 (68.9%) | 1,961 (31.1%) |
| Business & Financial | 1,198 (43.9%) | 1,533 (56.1%) |
| Computers, Engineering & Science | 4,676 (75.1%) | 1,550 (24.9%) |
| Computers & Mathematics | 2,097 (69.3%) | 930 (30.7%) |
| Architecture & Engineering | 2,349 (81.2%) | 544 (18.8%) |
| Life, Physical & Social Science | 230 (75.2%) | 76 (24.8%) |
| Community & Social Service | 1,337 (41.2%) | 1,910 (58.8%) |
| Education, Arts & Media | 51 (18.3%) | 227 (81.7%) |
| Legal Services & Support | 263 (54.6%) | 219 (45.4%) |
| Education Instruction & Library | 566 (31.8%) | 1,216 (68.2%) |
| Arts, Media & Entertainment | 457 (64.8%) | 248 (35.2%) |
| Health Diagnosing & Treating | 802 (27.7%) | 2,093 (72.3%) |
| Health Technologists | 639 (27.8%) | 1,659 (72.2%) |
| Total (Category) | 12,352 (57.7%) | 9,047 (42.3%) |
| Total (Overall) | 19,285 (56.4%) | 14,903 (43.6%) |
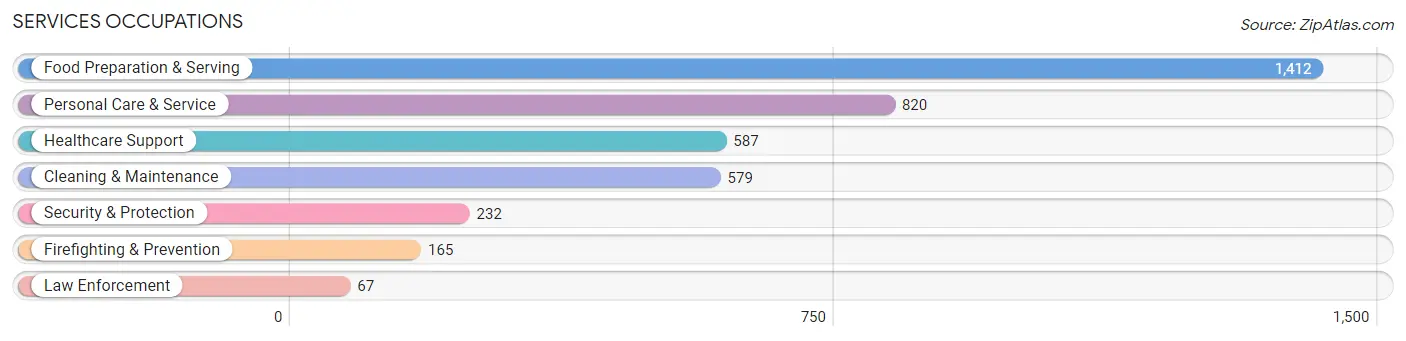
Services Occupations
The most common Services occupations in Novi are Food Preparation & Serving (1,412 | 4.1%), Personal Care & Service (820 | 2.4%), Healthcare Support (587 | 1.7%), Cleaning & Maintenance (579 | 1.7%), and Security & Protection (232 | 0.7%).
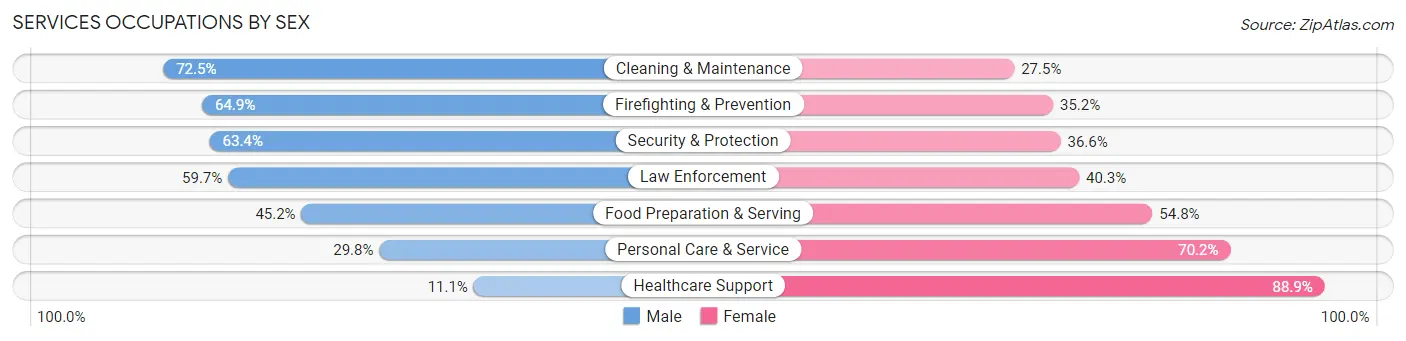
Services Occupations by Sex
Within the Services occupations in Novi, the most male-oriented occupations are Cleaning & Maintenance (72.5%), Firefighting & Prevention (64.8%), and Security & Protection (63.4%), while the most female-oriented occupations are Healthcare Support (88.9%), Personal Care & Service (70.2%), and Food Preparation & Serving (54.8%).
| Occupation | Male | Female |
| Healthcare Support | 65 (11.1%) | 522 (88.9%) |
| Security & Protection | 147 (63.4%) | 85 (36.6%) |
| Firefighting & Prevention | 107 (64.8%) | 58 (35.1%) |
| Law Enforcement | 40 (59.7%) | 27 (40.3%) |
| Food Preparation & Serving | 638 (45.2%) | 774 (54.8%) |
| Cleaning & Maintenance | 420 (72.5%) | 159 (27.5%) |
| Personal Care & Service | 244 (29.8%) | 576 (70.2%) |
| Total (Category) | 1,514 (41.7%) | 2,116 (58.3%) |
| Total (Overall) | 19,285 (56.4%) | 14,903 (43.6%) |
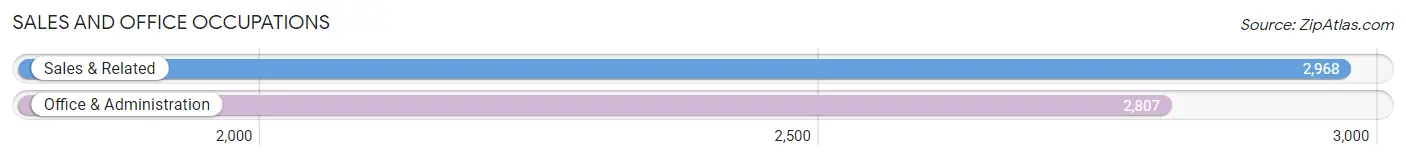
Sales and Office Occupations
The most common Sales and Office occupations in Novi are Sales & Related (2,968 | 8.7%), and Office & Administration (2,807 | 8.2%).
Sales and Office Occupations by Sex
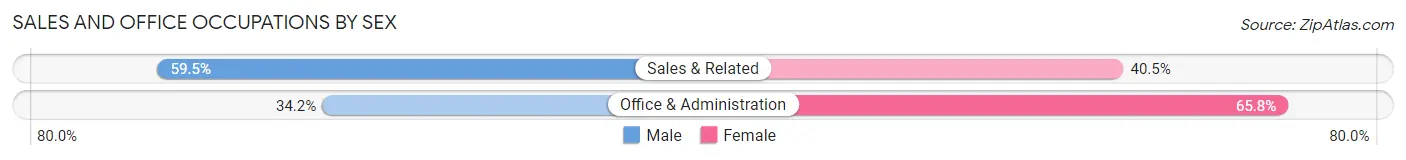
| Occupation | Male | Female |
| Sales & Related | 1,767 (59.5%) | 1,201 (40.5%) |
| Office & Administration | 961 (34.2%) | 1,846 (65.8%) |
| Total (Category) | 2,728 (47.2%) | 3,047 (52.8%) |
| Total (Overall) | 19,285 (56.4%) | 14,903 (43.6%) |
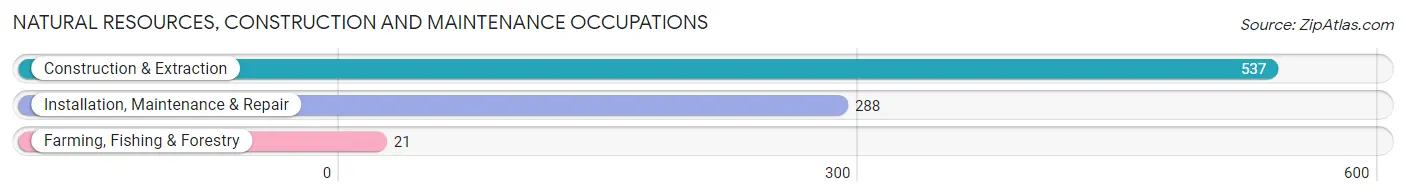
Natural Resources, Construction and Maintenance Occupations
The most common Natural Resources, Construction and Maintenance occupations in Novi are Construction & Extraction (537 | 1.6%), Installation, Maintenance & Repair (288 | 0.8%), and Farming, Fishing & Forestry (21 | 0.1%).
Natural Resources, Construction and Maintenance Occupations by Sex
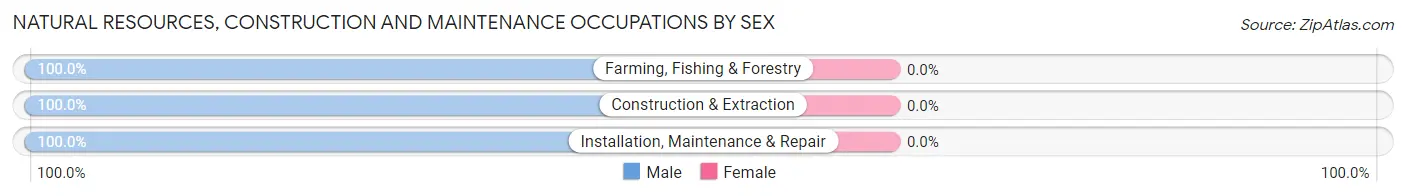
| Occupation | Male | Female |
| Farming, Fishing & Forestry | 21 (100.0%) | 0 (0.0%) |
| Construction & Extraction | 537 (100.0%) | 0 (0.0%) |
| Installation, Maintenance & Repair | 288 (100.0%) | 0 (0.0%) |
| Total (Category) | 846 (100.0%) | 0 (0.0%) |
| Total (Overall) | 19,285 (56.4%) | 14,903 (43.6%) |
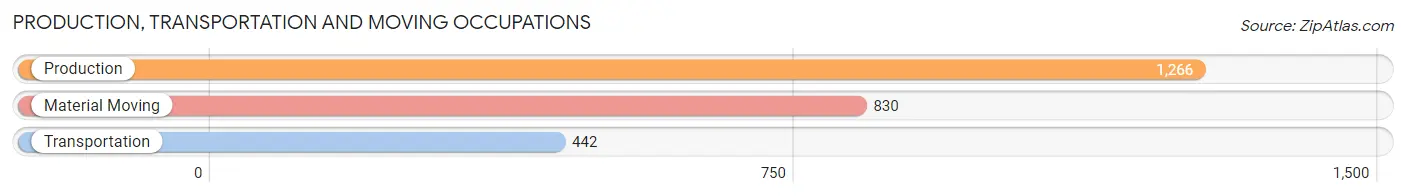
Production, Transportation and Moving Occupations
The most common Production, Transportation and Moving occupations in Novi are Production (1,266 | 3.7%), Material Moving (830 | 2.4%), and Transportation (442 | 1.3%).
Production, Transportation and Moving Occupations by Sex
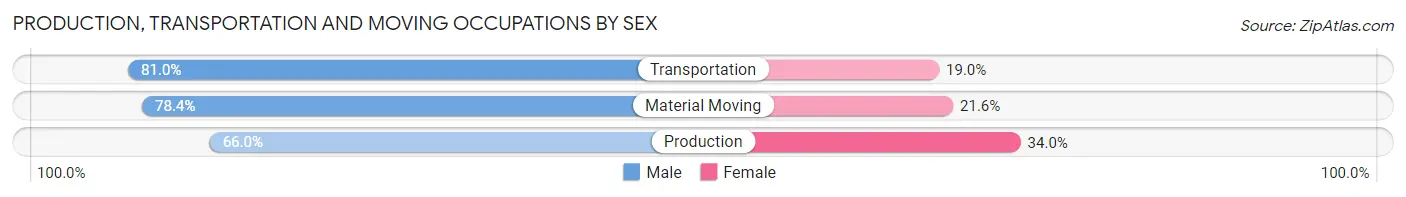
| Occupation | Male | Female |
| Production | 836 (66.0%) | 430 (34.0%) |
| Transportation | 358 (81.0%) | 84 (19.0%) |
| Material Moving | 651 (78.4%) | 179 (21.6%) |
| Total (Category) | 1,845 (72.7%) | 693 (27.3%) |
| Total (Overall) | 19,285 (56.4%) | 14,903 (43.6%) |
Employment Industries by Sex in Novi
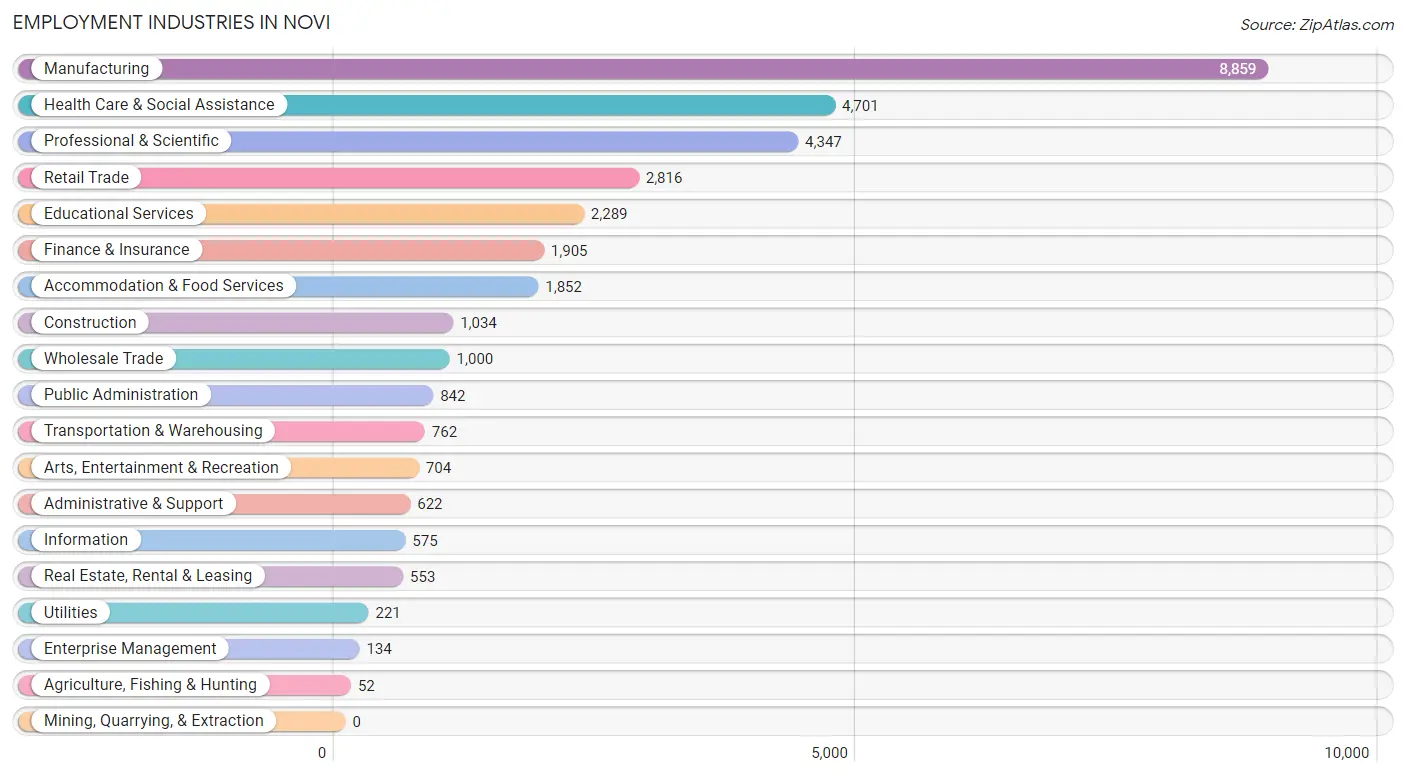
Employment Industries in Novi
The major employment industries in Novi include Manufacturing (8,859 | 25.9%), Health Care & Social Assistance (4,701 | 13.8%), Professional & Scientific (4,347 | 12.7%), Retail Trade (2,816 | 8.2%), and Educational Services (2,289 | 6.7%).
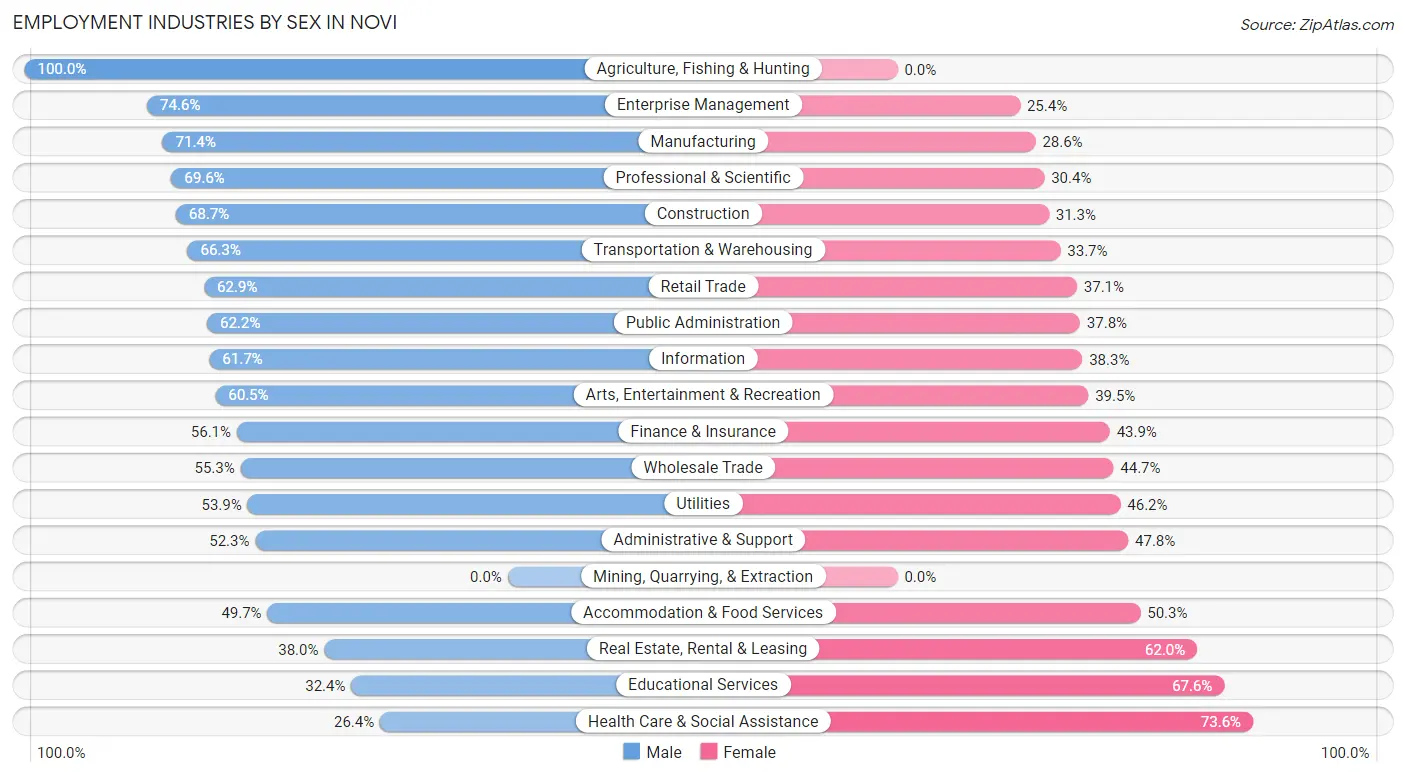
Employment Industries by Sex in Novi
The Novi industries that see more men than women are Agriculture, Fishing & Hunting (100.0%), Enterprise Management (74.6%), and Manufacturing (71.4%), whereas the industries that tend to have a higher number of women are Health Care & Social Assistance (73.6%), Educational Services (67.6%), and Real Estate, Rental & Leasing (62.0%).
| Industry | Male | Female |
| Agriculture, Fishing & Hunting | 52 (100.0%) | 0 (0.0%) |
| Mining, Quarrying, & Extraction | 0 (0.0%) | 0 (0.0%) |
| Construction | 710 (68.7%) | 324 (31.3%) |
| Manufacturing | 6,328 (71.4%) | 2,531 (28.6%) |
| Wholesale Trade | 553 (55.3%) | 447 (44.7%) |
| Retail Trade | 1,770 (62.9%) | 1,046 (37.1%) |
| Transportation & Warehousing | 505 (66.3%) | 257 (33.7%) |
| Utilities | 119 (53.8%) | 102 (46.2%) |
| Information | 355 (61.7%) | 220 (38.3%) |
| Finance & Insurance | 1,068 (56.1%) | 837 (43.9%) |
| Real Estate, Rental & Leasing | 210 (38.0%) | 343 (62.0%) |
| Professional & Scientific | 3,026 (69.6%) | 1,321 (30.4%) |
| Enterprise Management | 100 (74.6%) | 34 (25.4%) |
| Administrative & Support | 325 (52.2%) | 297 (47.7%) |
| Educational Services | 741 (32.4%) | 1,548 (67.6%) |
| Health Care & Social Assistance | 1,242 (26.4%) | 3,459 (73.6%) |
| Arts, Entertainment & Recreation | 426 (60.5%) | 278 (39.5%) |
| Accommodation & Food Services | 921 (49.7%) | 931 (50.3%) |
| Public Administration | 524 (62.2%) | 318 (37.8%) |
| Total | 19,285 (56.4%) | 14,903 (43.6%) |
Education in Novi
School Enrollment in Novi
The most common levels of schooling among the 16,672 students in Novi are high school (4,108 | 24.6%), middle school (3,736 | 22.4%), and elementary school (3,339 | 20.0%).
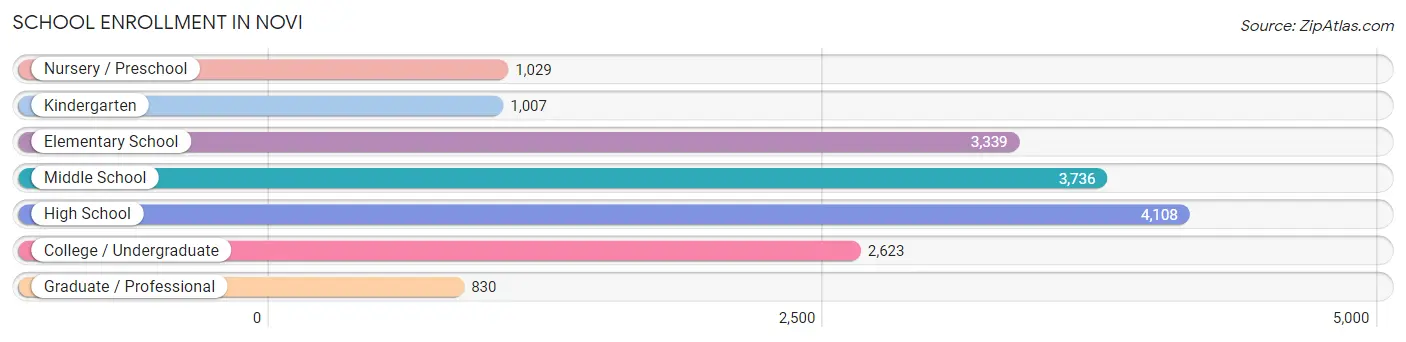
| School Level | # Students | % Students |
| Nursery / Preschool | 1,029 | 6.2% |
| Kindergarten | 1,007 | 6.0% |
| Elementary School | 3,339 | 20.0% |
| Middle School | 3,736 | 22.4% |
| High School | 4,108 | 24.6% |
| College / Undergraduate | 2,623 | 15.7% |
| Graduate / Professional | 830 | 5.0% |
| Total | 16,672 | 100.0% |
School Enrollment by Age by Funding Source in Novi
Out of a total of 16,672 students who are enrolled in schools in Novi, 2,351 (14.1%) attend a private institution, while the remaining 14,321 (85.9%) are enrolled in public schools. The age group of 3 to 4 year olds has the highest likelihood of being enrolled in private schools, with 574 (65.9% in the age bracket) enrolled. Conversely, the age group of 5 to 9 year old has the lowest likelihood of being enrolled in a private school, with 4,054 (96.9% in the age bracket) attending a public institution.
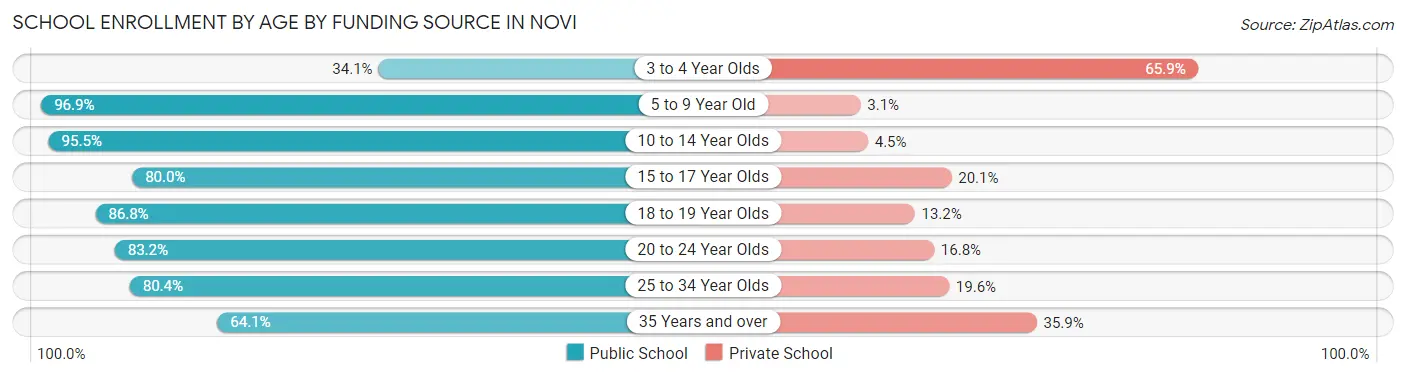
| Age Bracket | Public School | Private School |
| 3 to 4 Year Olds | 297 (34.1%) | 574 (65.9%) |
| 5 to 9 Year Old | 4,054 (96.9%) | 130 (3.1%) |
| 10 to 14 Year Olds | 4,317 (95.5%) | 203 (4.5%) |
| 15 to 17 Year Olds | 2,396 (79.9%) | 601 (20.1%) |
| 18 to 19 Year Olds | 1,118 (86.8%) | 170 (13.2%) |
| 20 to 24 Year Olds | 1,034 (83.2%) | 209 (16.8%) |
| 25 to 34 Year Olds | 525 (80.4%) | 128 (19.6%) |
| 35 Years and over | 587 (64.1%) | 329 (35.9%) |
| Total | 14,321 (85.9%) | 2,351 (14.1%) |
Educational Attainment by Field of Study in Novi
Engineering (6,837 | 22.2%), business (6,355 | 20.6%), science & technology (3,508 | 11.4%), education (2,100 | 6.8%), and computers & mathematics (1,853 | 6.0%) are the most common fields of study among 30,783 individuals in Novi who have obtained a bachelor's degree or higher.
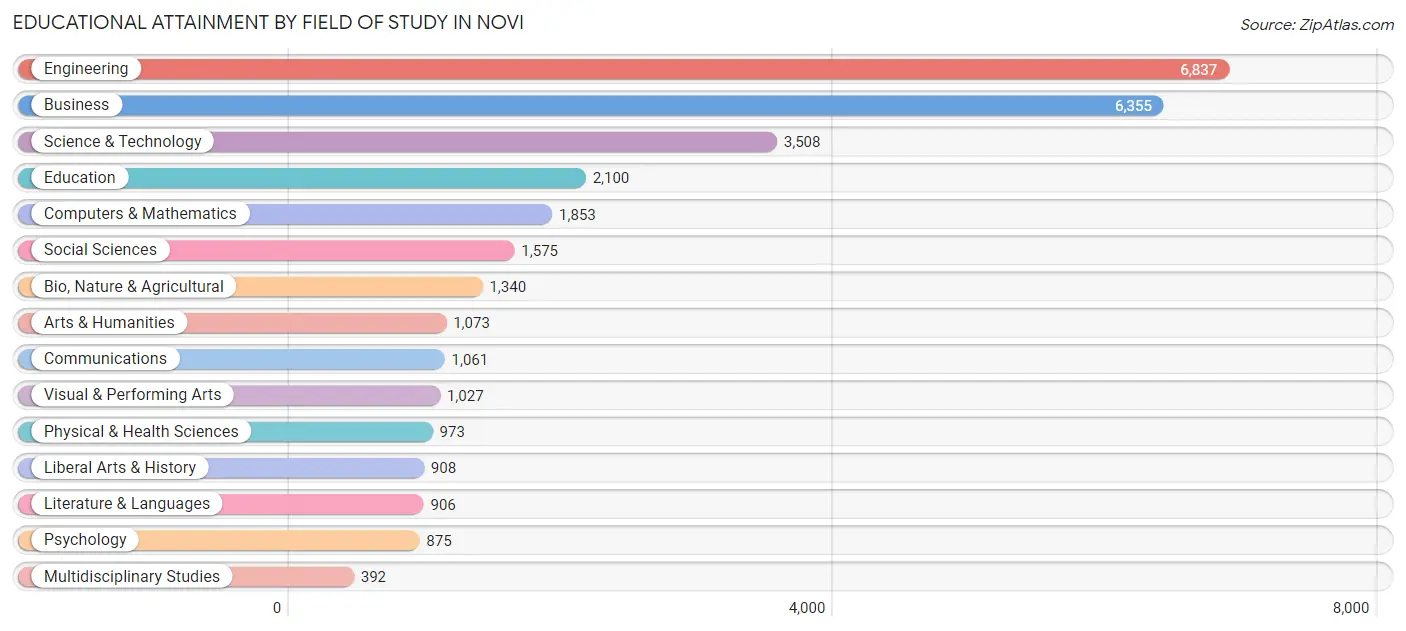
| Field of Study | # Graduates | % Graduates |
| Computers & Mathematics | 1,853 | 6.0% |
| Bio, Nature & Agricultural | 1,340 | 4.3% |
| Physical & Health Sciences | 973 | 3.2% |
| Psychology | 875 | 2.8% |
| Social Sciences | 1,575 | 5.1% |
| Engineering | 6,837 | 22.2% |
| Multidisciplinary Studies | 392 | 1.3% |
| Science & Technology | 3,508 | 11.4% |
| Business | 6,355 | 20.6% |
| Education | 2,100 | 6.8% |
| Literature & Languages | 906 | 2.9% |
| Liberal Arts & History | 908 | 2.9% |
| Visual & Performing Arts | 1,027 | 3.3% |
| Communications | 1,061 | 3.5% |
| Arts & Humanities | 1,073 | 3.5% |
| Total | 30,783 | 100.0% |
Transportation & Commute in Novi
Vehicle Availability by Sex in Novi
The most prevalent vehicle ownership categories in Novi are males with 2 vehicles (9,465, accounting for 49.8%) and females with 2 vehicles (6,441, making up 65.0%).
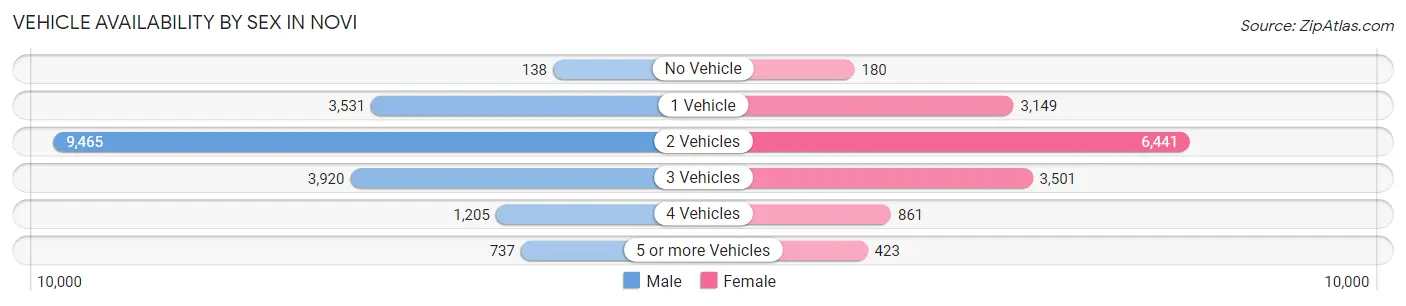
| Vehicles Available | Male | Female |
| No Vehicle | 138 (0.7%) | 180 (1.2%) |
| 1 Vehicle | 3,531 (18.6%) | 3,149 (21.6%) |
| 2 Vehicles | 9,465 (49.8%) | 6,441 (44.3%) |
| 3 Vehicles | 3,920 (20.6%) | 3,501 (24.0%) |
| 4 Vehicles | 1,205 (6.3%) | 861 (5.9%) |
| 5 or more Vehicles | 737 (3.9%) | 423 (2.9%) |
| Total | 18,996 (100.0%) | 14,555 (100.0%) |
Commute Time in Novi
The most frequently occuring commute durations in Novi are 15 to 19 minutes (4,342 commuters, 15.2%), 10 to 14 minutes (4,196 commuters, 14.7%), and 20 to 24 minutes (3,858 commuters, 13.5%).
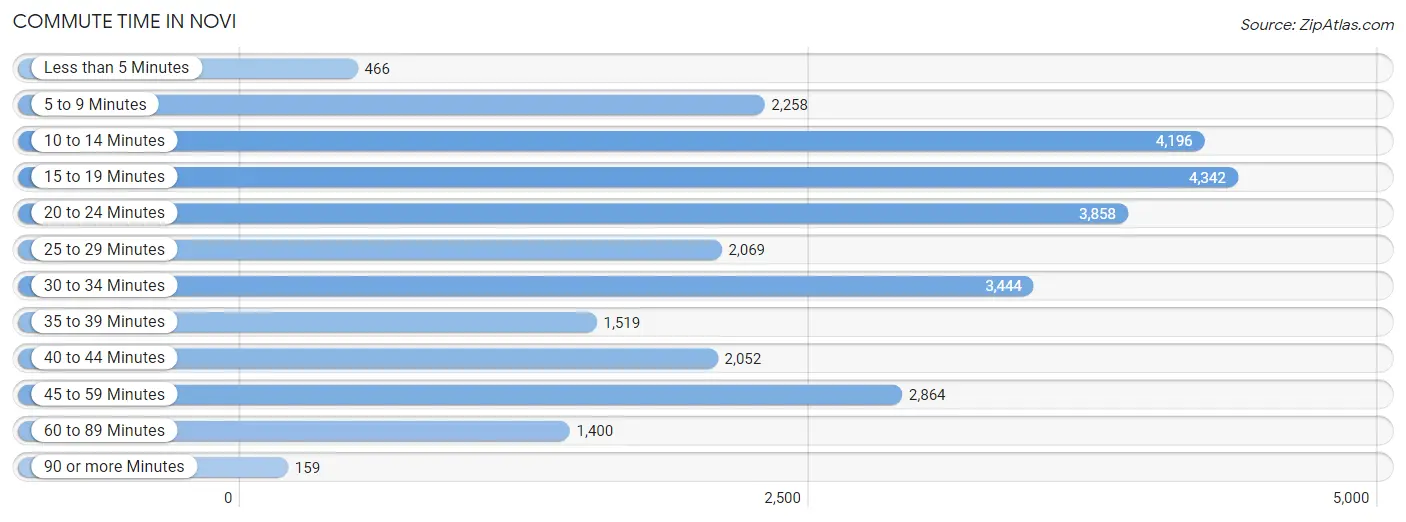
| Commute Time | # Commuters | % Commuters |
| Less than 5 Minutes | 466 | 1.6% |
| 5 to 9 Minutes | 2,258 | 7.9% |
| 10 to 14 Minutes | 4,196 | 14.7% |
| 15 to 19 Minutes | 4,342 | 15.2% |
| 20 to 24 Minutes | 3,858 | 13.5% |
| 25 to 29 Minutes | 2,069 | 7.2% |
| 30 to 34 Minutes | 3,444 | 12.0% |
| 35 to 39 Minutes | 1,519 | 5.3% |
| 40 to 44 Minutes | 2,052 | 7.2% |
| 45 to 59 Minutes | 2,864 | 10.0% |
| 60 to 89 Minutes | 1,400 | 4.9% |
| 90 or more Minutes | 159 | 0.6% |
Commute Time by Sex in Novi
The most common commute times in Novi are 15 to 19 minutes (2,447 commuters, 15.2%) for males and 10 to 14 minutes (1,949 commuters, 15.5%) for females.
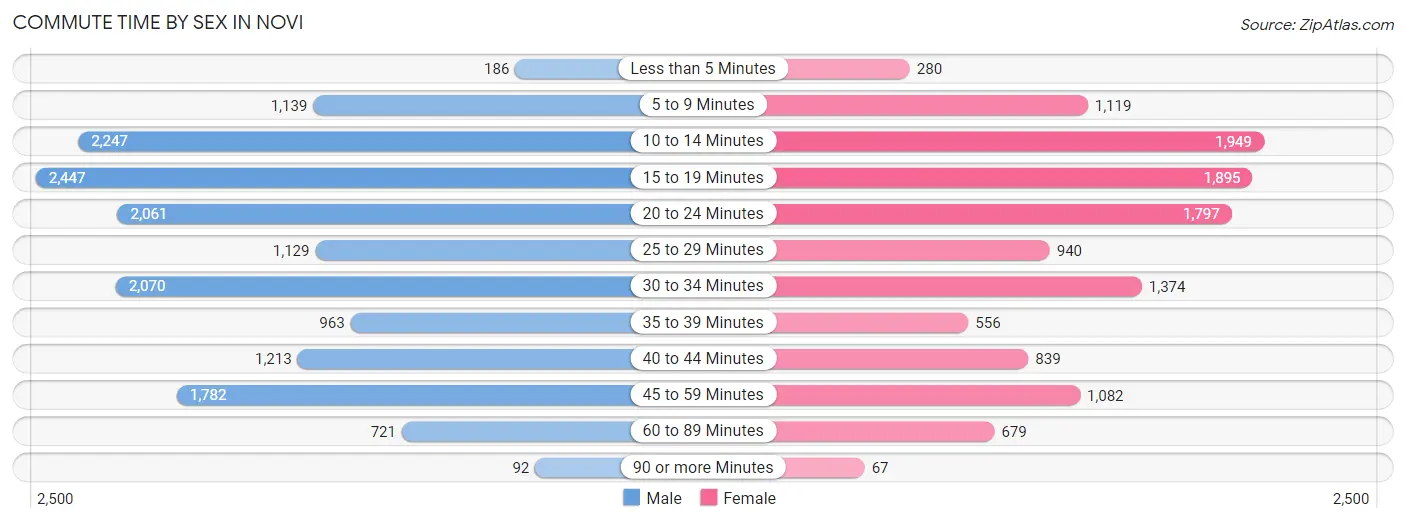
| Commute Time | Male | Female |
| Less than 5 Minutes | 186 (1.2%) | 280 (2.2%) |
| 5 to 9 Minutes | 1,139 (7.1%) | 1,119 (8.9%) |
| 10 to 14 Minutes | 2,247 (14.0%) | 1,949 (15.5%) |
| 15 to 19 Minutes | 2,447 (15.2%) | 1,895 (15.1%) |
| 20 to 24 Minutes | 2,061 (12.8%) | 1,797 (14.3%) |
| 25 to 29 Minutes | 1,129 (7.0%) | 940 (7.5%) |
| 30 to 34 Minutes | 2,070 (12.9%) | 1,374 (10.9%) |
| 35 to 39 Minutes | 963 (6.0%) | 556 (4.4%) |
| 40 to 44 Minutes | 1,213 (7.6%) | 839 (6.7%) |
| 45 to 59 Minutes | 1,782 (11.1%) | 1,082 (8.6%) |
| 60 to 89 Minutes | 721 (4.5%) | 679 (5.4%) |
| 90 or more Minutes | 92 (0.6%) | 67 (0.5%) |
Time of Departure to Work by Sex in Novi
The most frequent times of departure to work in Novi are 7:30 AM to 7:59 AM (3,043, 19.0%) for males and 7:30 AM to 7:59 AM (2,190, 17.4%) for females.
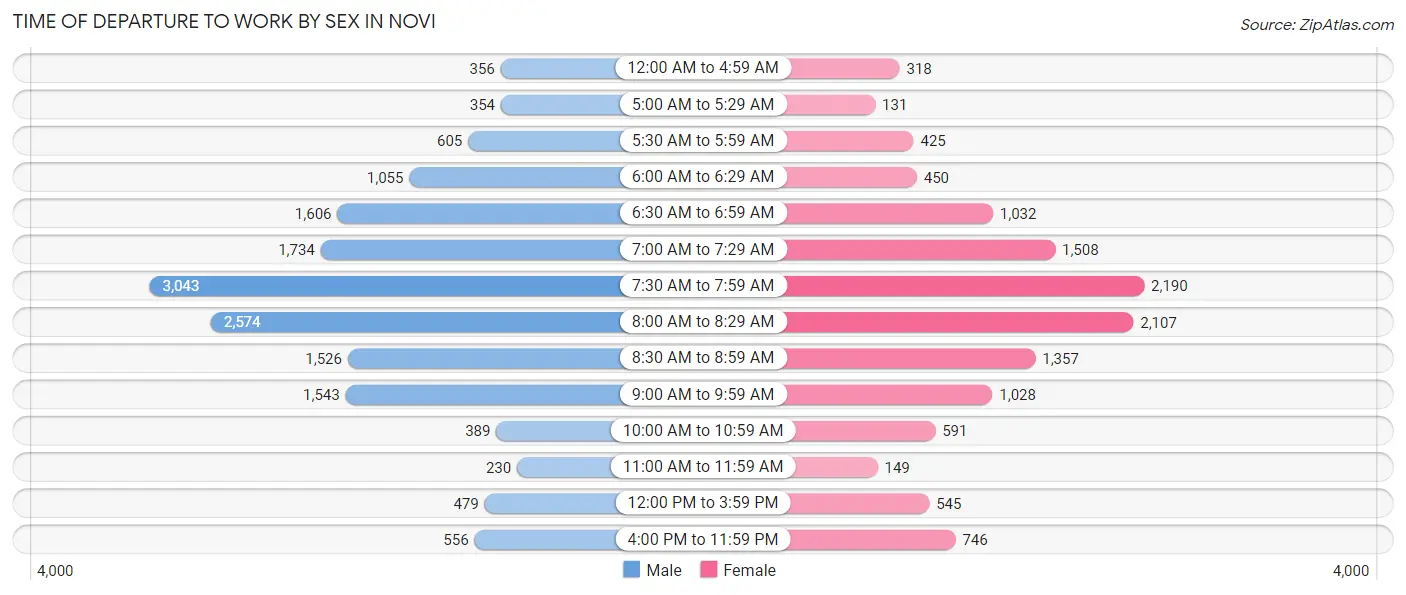
| Time of Departure | Male | Female |
| 12:00 AM to 4:59 AM | 356 (2.2%) | 318 (2.5%) |
| 5:00 AM to 5:29 AM | 354 (2.2%) | 131 (1.0%) |
| 5:30 AM to 5:59 AM | 605 (3.8%) | 425 (3.4%) |
| 6:00 AM to 6:29 AM | 1,055 (6.6%) | 450 (3.6%) |
| 6:30 AM to 6:59 AM | 1,606 (10.0%) | 1,032 (8.2%) |
| 7:00 AM to 7:29 AM | 1,734 (10.8%) | 1,508 (12.0%) |
| 7:30 AM to 7:59 AM | 3,043 (19.0%) | 2,190 (17.4%) |
| 8:00 AM to 8:29 AM | 2,574 (16.0%) | 2,107 (16.8%) |
| 8:30 AM to 8:59 AM | 1,526 (9.5%) | 1,357 (10.8%) |
| 9:00 AM to 9:59 AM | 1,543 (9.6%) | 1,028 (8.2%) |
| 10:00 AM to 10:59 AM | 389 (2.4%) | 591 (4.7%) |
| 11:00 AM to 11:59 AM | 230 (1.4%) | 149 (1.2%) |
| 12:00 PM to 3:59 PM | 479 (3.0%) | 545 (4.3%) |
| 4:00 PM to 11:59 PM | 556 (3.5%) | 746 (5.9%) |
| Total | 16,050 (100.0%) | 12,577 (100.0%) |
Housing Occupancy in Novi
Occupancy by Ownership in Novi
Of the total 26,516 dwellings in Novi, owner-occupied units account for 18,011 (67.9%), while renter-occupied units make up 8,505 (32.1%).
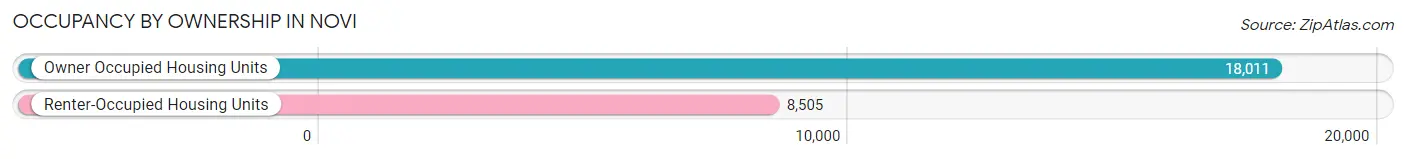
| Occupancy | # Housing Units | % Housing Units |
| Owner Occupied Housing Units | 18,011 | 67.9% |
| Renter-Occupied Housing Units | 8,505 | 32.1% |
| Total Occupied Housing Units | 26,516 | 100.0% |
Occupancy by Household Size in Novi
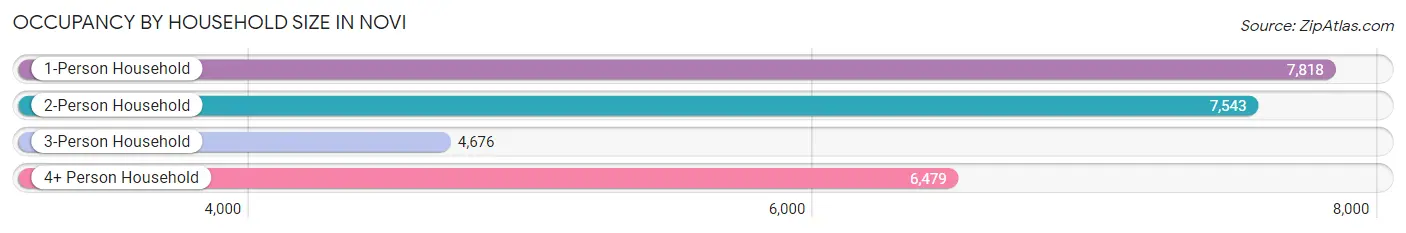
| Household Size | # Housing Units | % Housing Units |
| 1-Person Household | 7,818 | 29.5% |
| 2-Person Household | 7,543 | 28.4% |
| 3-Person Household | 4,676 | 17.6% |
| 4+ Person Household | 6,479 | 24.4% |
| Total Housing Units | 26,516 | 100.0% |
Occupancy by Ownership by Household Size in Novi
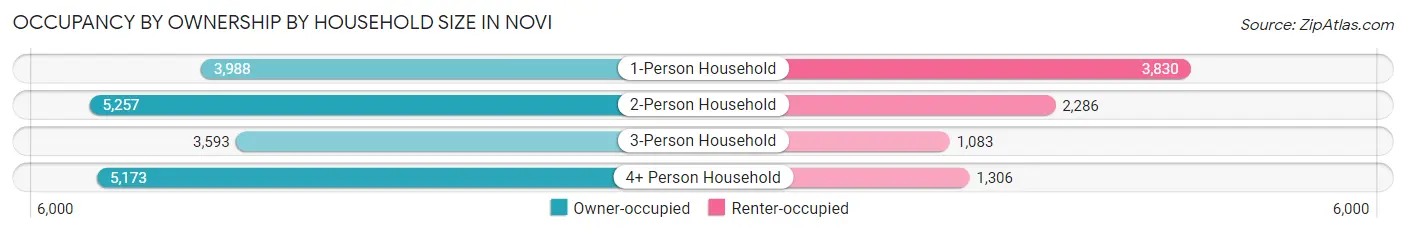
| Household Size | Owner-occupied | Renter-occupied |
| 1-Person Household | 3,988 (51.0%) | 3,830 (49.0%) |
| 2-Person Household | 5,257 (69.7%) | 2,286 (30.3%) |
| 3-Person Household | 3,593 (76.8%) | 1,083 (23.2%) |
| 4+ Person Household | 5,173 (79.8%) | 1,306 (20.2%) |
| Total Housing Units | 18,011 (67.9%) | 8,505 (32.1%) |
Occupancy by Educational Attainment in Novi
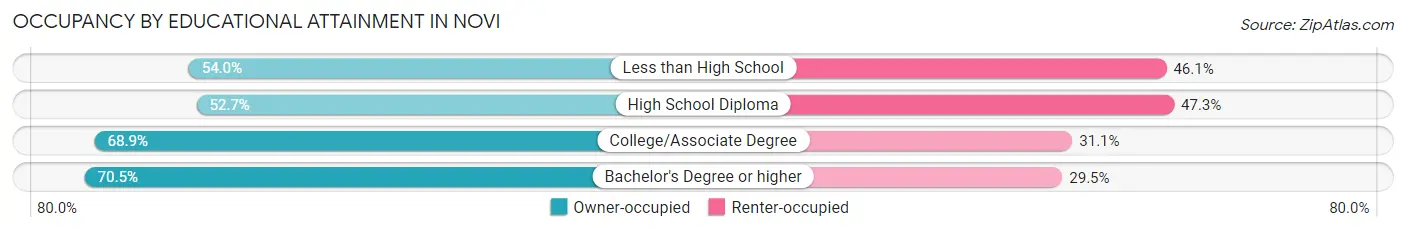
| Household Size | Owner-occupied | Renter-occupied |
| Less than High School | 287 (53.9%) | 245 (46.1%) |
| High School Diploma | 1,465 (52.7%) | 1,313 (47.3%) |
| College/Associate Degree | 4,060 (68.9%) | 1,834 (31.1%) |
| Bachelor's Degree or higher | 12,199 (70.5%) | 5,113 (29.5%) |
Occupancy by Age of Householder in Novi
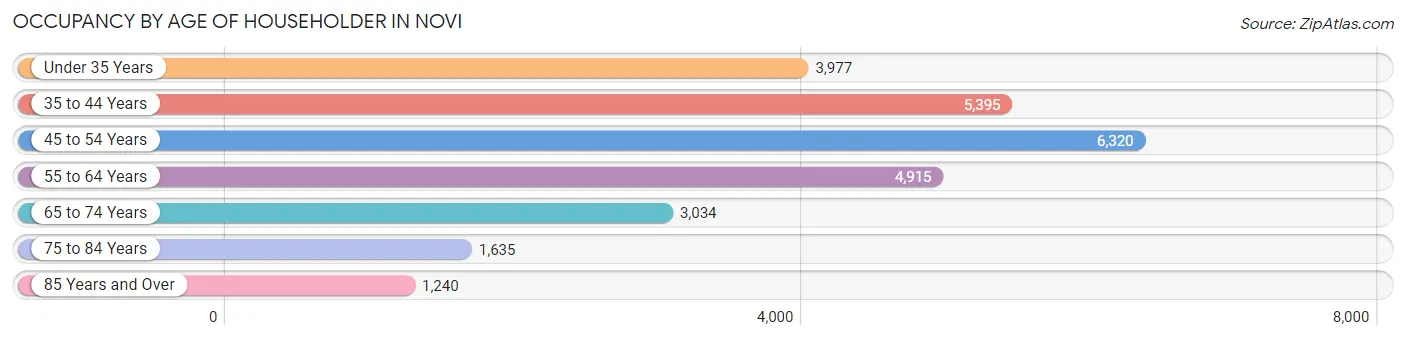
| Age Bracket | # Households | % Households |
| Under 35 Years | 3,977 | 15.0% |
| 35 to 44 Years | 5,395 | 20.3% |
| 45 to 54 Years | 6,320 | 23.8% |
| 55 to 64 Years | 4,915 | 18.5% |
| 65 to 74 Years | 3,034 | 11.4% |
| 75 to 84 Years | 1,635 | 6.2% |
| 85 Years and Over | 1,240 | 4.7% |
| Total | 26,516 | 100.0% |
Housing Finances in Novi
Median Income by Occupancy in Novi
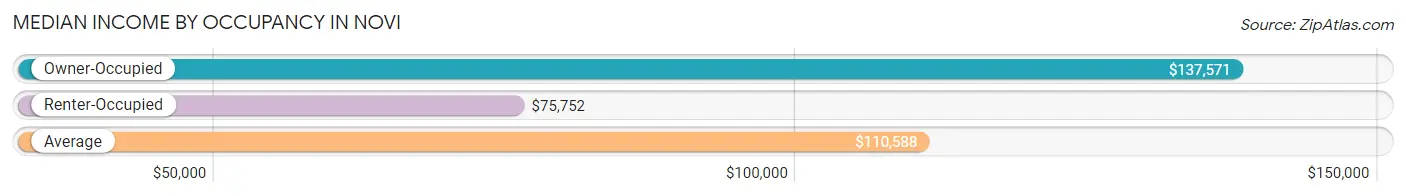
| Occupancy Type | # Households | Median Income |
| Owner-Occupied | 18,011 (67.9%) | $137,571 |
| Renter-Occupied | 8,505 (32.1%) | $75,752 |
| Average | 26,516 (100.0%) | $110,588 |
Occupancy by Householder Income Bracket in Novi
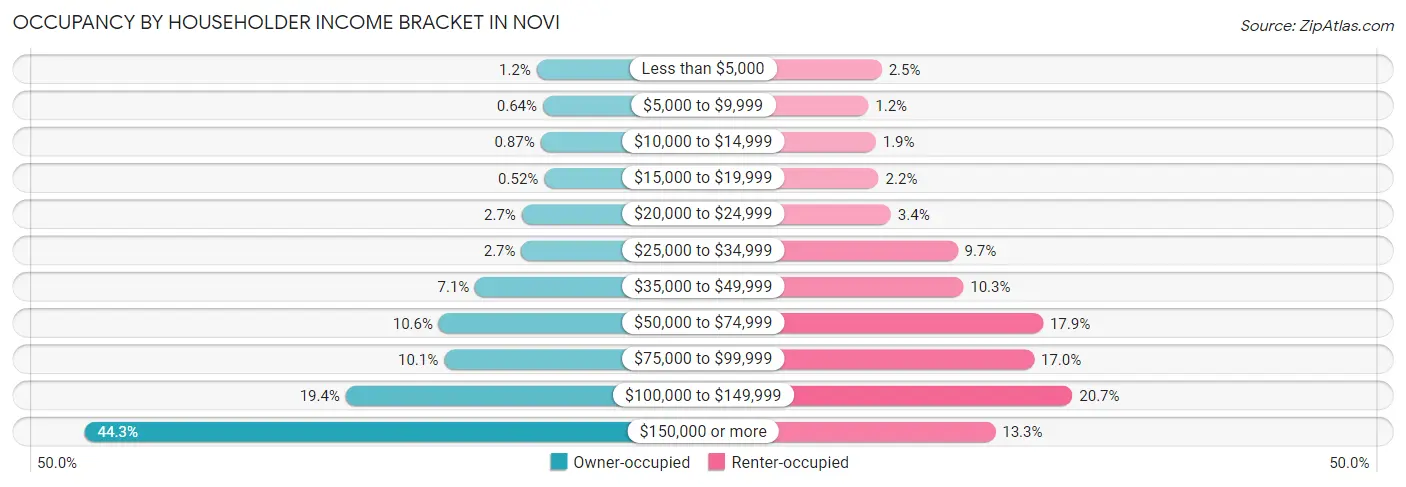
| Income Bracket | Owner-occupied | Renter-occupied |
| Less than $5,000 | 221 (1.2%) | 212 (2.5%) |
| $5,000 to $9,999 | 116 (0.6%) | 104 (1.2%) |
| $10,000 to $14,999 | 157 (0.9%) | 164 (1.9%) |
| $15,000 to $19,999 | 93 (0.5%) | 187 (2.2%) |
| $20,000 to $24,999 | 479 (2.7%) | 287 (3.4%) |
| $25,000 to $34,999 | 484 (2.7%) | 826 (9.7%) |
| $35,000 to $49,999 | 1,277 (7.1%) | 873 (10.3%) |
| $50,000 to $74,999 | 1,900 (10.5%) | 1,518 (17.8%) |
| $75,000 to $99,999 | 1,810 (10.1%) | 1,446 (17.0%) |
| $100,000 to $149,999 | 3,498 (19.4%) | 1,756 (20.6%) |
| $150,000 or more | 7,976 (44.3%) | 1,132 (13.3%) |
| Total | 18,011 (100.0%) | 8,505 (100.0%) |
Monthly Housing Cost Tiers in Novi
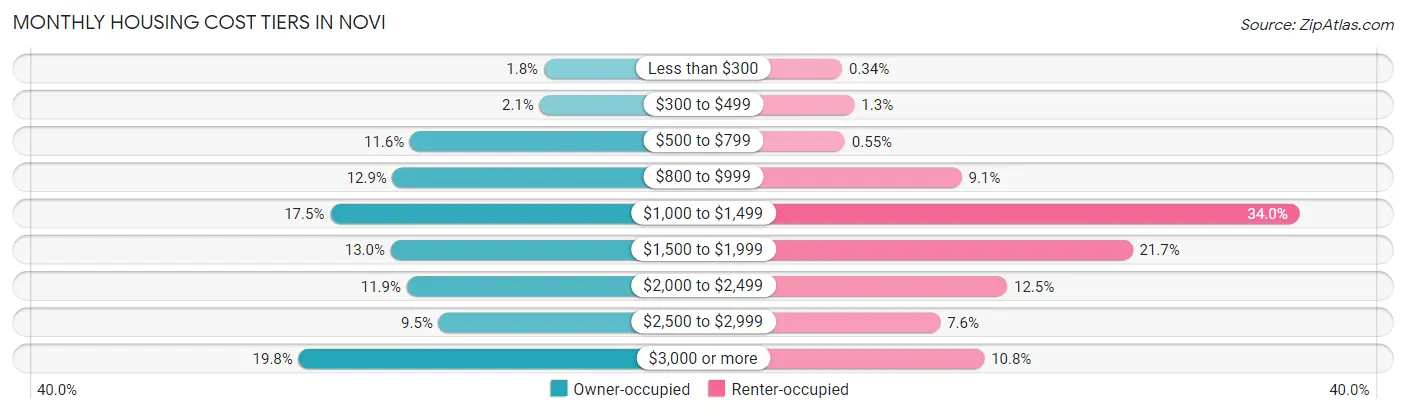
| Monthly Cost | Owner-occupied | Renter-occupied |
| Less than $300 | 315 (1.8%) | 29 (0.3%) |
| $300 to $499 | 372 (2.1%) | 106 (1.3%) |
| $500 to $799 | 2,091 (11.6%) | 47 (0.5%) |
| $800 to $999 | 2,321 (12.9%) | 777 (9.1%) |
| $1,000 to $1,499 | 3,150 (17.5%) | 2,895 (34.0%) |
| $1,500 to $1,999 | 2,347 (13.0%) | 1,848 (21.7%) |
| $2,000 to $2,499 | 2,134 (11.8%) | 1,062 (12.5%) |
| $2,500 to $2,999 | 1,711 (9.5%) | 644 (7.6%) |
| $3,000 or more | 3,570 (19.8%) | 919 (10.8%) |
| Total | 18,011 (100.0%) | 8,505 (100.0%) |
Physical Housing Characteristics in Novi
Housing Structures in Novi
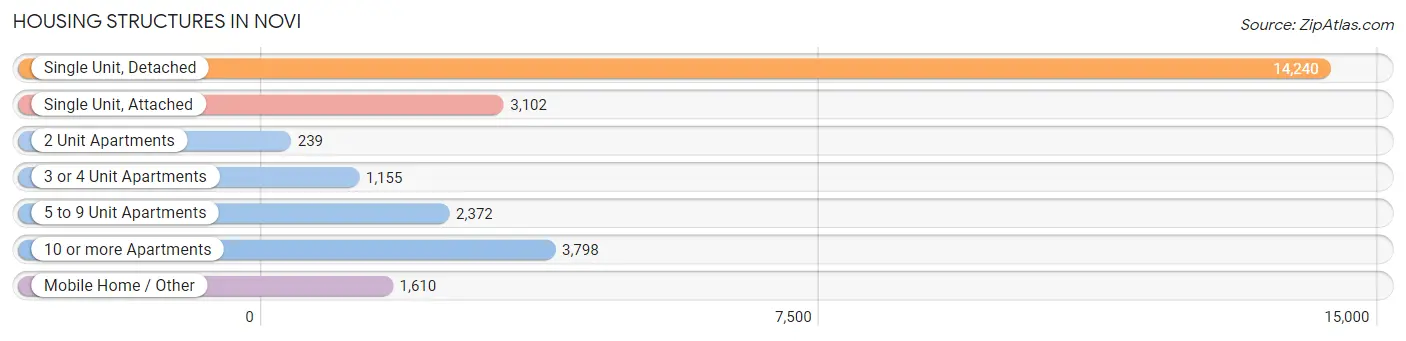
| Structure Type | # Housing Units | % Housing Units |
| Single Unit, Detached | 14,240 | 53.7% |
| Single Unit, Attached | 3,102 | 11.7% |
| 2 Unit Apartments | 239 | 0.9% |
| 3 or 4 Unit Apartments | 1,155 | 4.4% |
| 5 to 9 Unit Apartments | 2,372 | 8.9% |
| 10 or more Apartments | 3,798 | 14.3% |
| Mobile Home / Other | 1,610 | 6.1% |
| Total | 26,516 | 100.0% |
Housing Structures by Occupancy in Novi
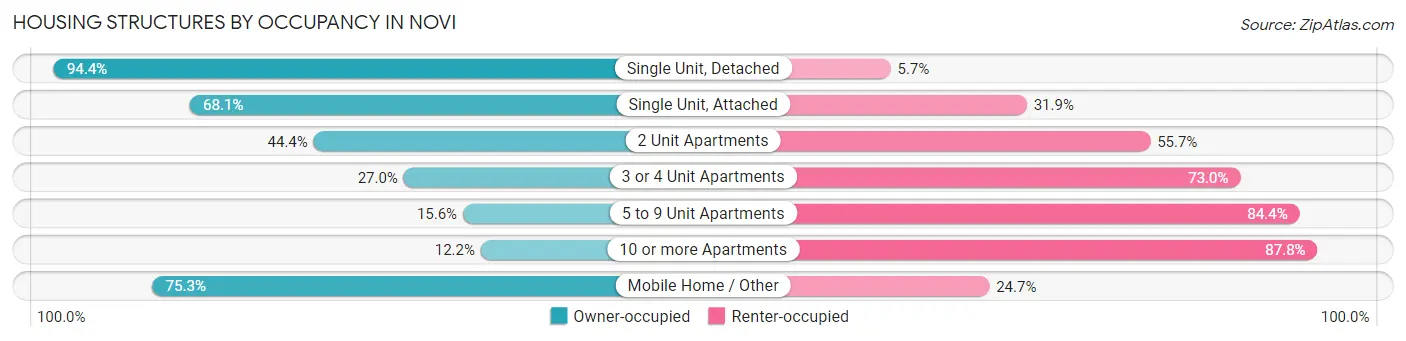
| Structure Type | Owner-occupied | Renter-occupied |
| Single Unit, Detached | 13,435 (94.4%) | 805 (5.7%) |
| Single Unit, Attached | 2,113 (68.1%) | 989 (31.9%) |
| 2 Unit Apartments | 106 (44.4%) | 133 (55.6%) |
| 3 or 4 Unit Apartments | 312 (27.0%) | 843 (73.0%) |
| 5 to 9 Unit Apartments | 370 (15.6%) | 2,002 (84.4%) |
| 10 or more Apartments | 462 (12.2%) | 3,336 (87.8%) |
| Mobile Home / Other | 1,213 (75.3%) | 397 (24.7%) |
| Total | 18,011 (67.9%) | 8,505 (32.1%) |
Housing Structures by Number of Rooms in Novi
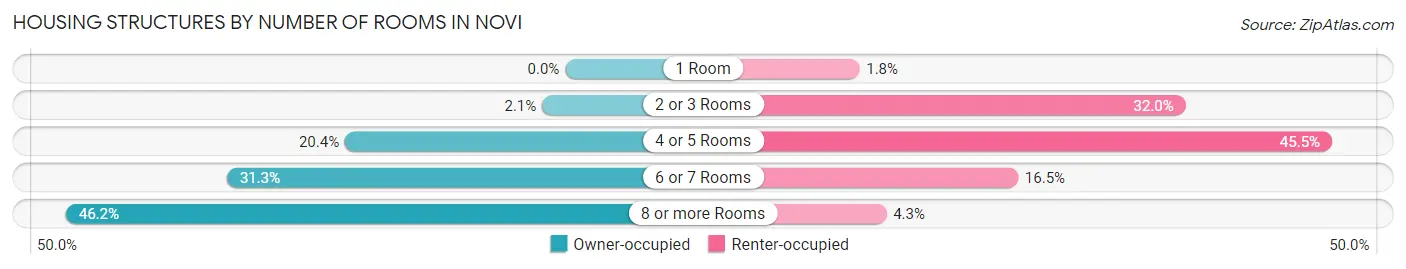
| Number of Rooms | Owner-occupied | Renter-occupied |
| 1 Room | 0 (0.0%) | 152 (1.8%) |
| 2 or 3 Rooms | 386 (2.1%) | 2,719 (32.0%) |
| 4 or 5 Rooms | 3,668 (20.4%) | 3,870 (45.5%) |
| 6 or 7 Rooms | 5,637 (31.3%) | 1,400 (16.5%) |
| 8 or more Rooms | 8,320 (46.2%) | 364 (4.3%) |
| Total | 18,011 (100.0%) | 8,505 (100.0%) |
Housing Structure by Heating Type in Novi
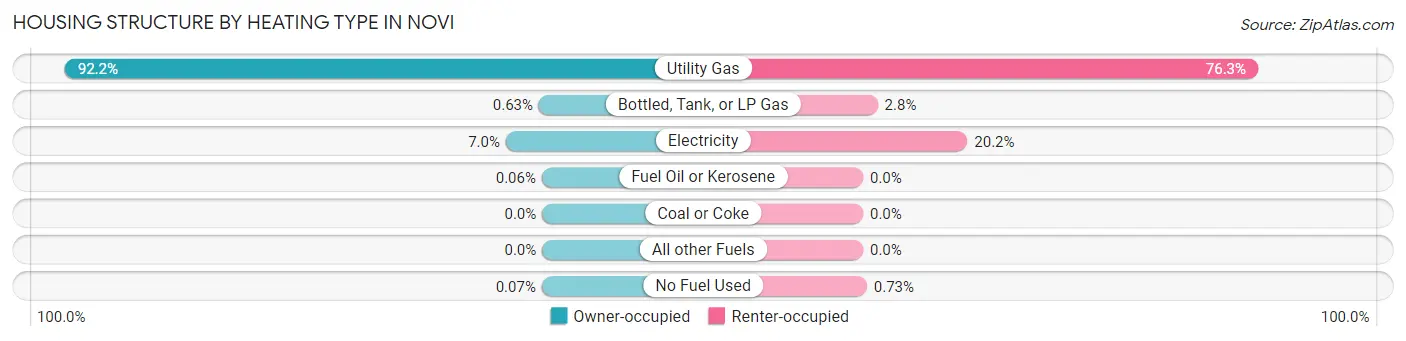
| Heating Type | Owner-occupied | Renter-occupied |
| Utility Gas | 16,611 (92.2%) | 6,488 (76.3%) |
| Bottled, Tank, or LP Gas | 113 (0.6%) | 240 (2.8%) |
| Electricity | 1,265 (7.0%) | 1,715 (20.2%) |
| Fuel Oil or Kerosene | 10 (0.1%) | 0 (0.0%) |
| Coal or Coke | 0 (0.0%) | 0 (0.0%) |
| All other Fuels | 0 (0.0%) | 0 (0.0%) |
| No Fuel Used | 12 (0.1%) | 62 (0.7%) |
| Total | 18,011 (100.0%) | 8,505 (100.0%) |
Household Vehicle Usage in Novi
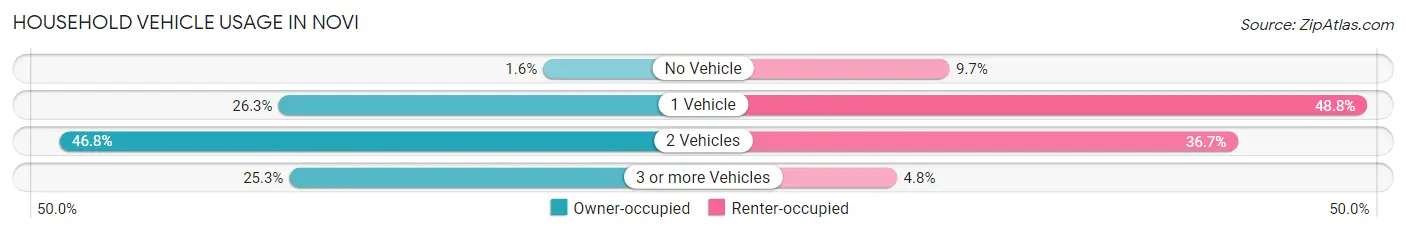
| Vehicles per Household | Owner-occupied | Renter-occupied |
| No Vehicle | 290 (1.6%) | 827 (9.7%) |
| 1 Vehicle | 4,738 (26.3%) | 4,146 (48.7%) |
| 2 Vehicles | 8,426 (46.8%) | 3,121 (36.7%) |
| 3 or more Vehicles | 4,557 (25.3%) | 411 (4.8%) |
| Total | 18,011 (100.0%) | 8,505 (100.0%) |
Real Estate & Mortgages in Novi
Real Estate and Mortgage Overview in Novi
| Characteristic | Without Mortgage | With Mortgage |
| Housing Units | 6,417 | 11,594 |
| Median Property Value | $325,900 | $413,800 |
| Median Household Income | $85,987 | $5,967 |
| Monthly Housing Costs | $852 | $3,499 |
| Real Estate Taxes | $4,958 | $475 |
Property Value by Mortgage Status in Novi
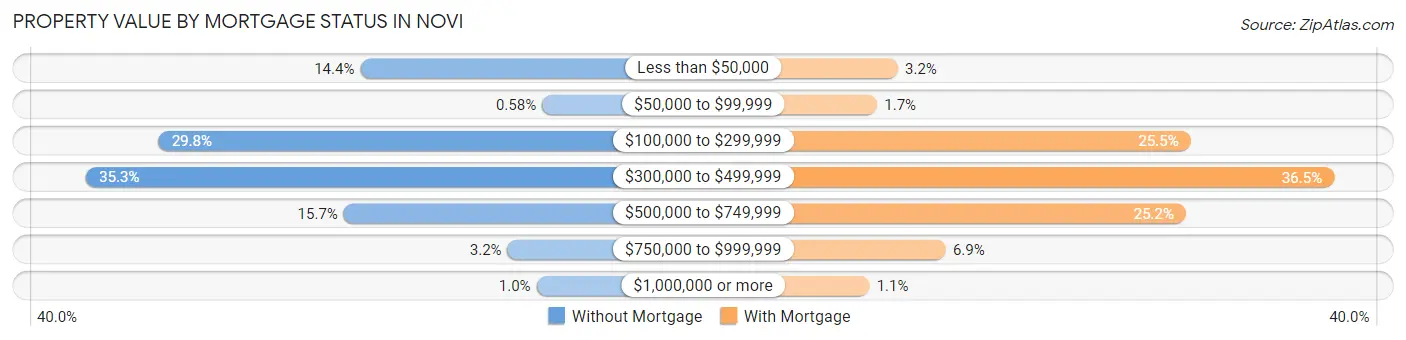
| Property Value | Without Mortgage | With Mortgage |
| Less than $50,000 | 926 (14.4%) | 376 (3.2%) |
| $50,000 to $99,999 | 37 (0.6%) | 192 (1.7%) |
| $100,000 to $299,999 | 1,911 (29.8%) | 2,959 (25.5%) |
| $300,000 to $499,999 | 2,266 (35.3%) | 4,226 (36.4%) |
| $500,000 to $749,999 | 1,007 (15.7%) | 2,917 (25.2%) |
| $750,000 to $999,999 | 206 (3.2%) | 799 (6.9%) |
| $1,000,000 or more | 64 (1.0%) | 125 (1.1%) |
| Total | 6,417 (100.0%) | 11,594 (100.0%) |
Household Income by Mortgage Status in Novi
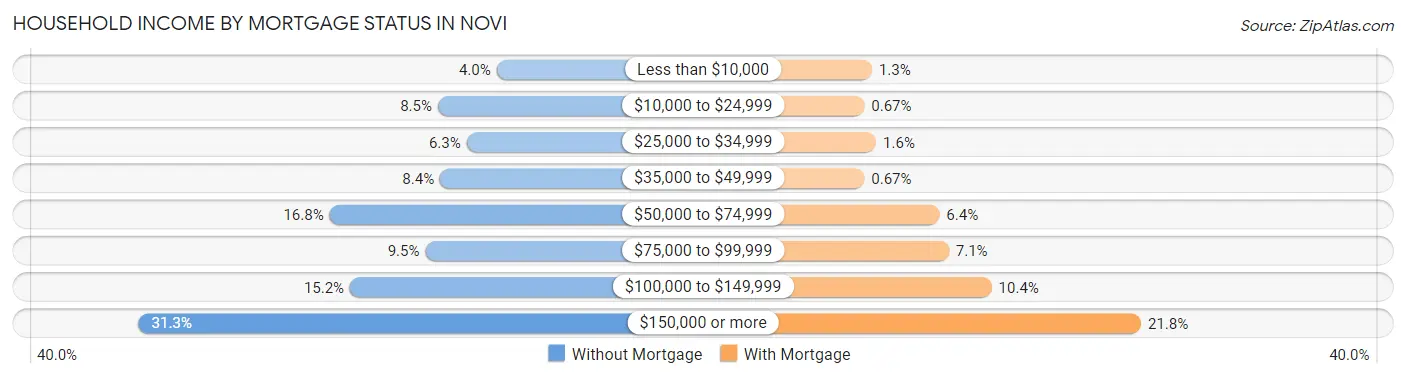
| Household Income | Without Mortgage | With Mortgage |
| Less than $10,000 | 259 (4.0%) | 145 (1.3%) |
| $10,000 to $24,999 | 547 (8.5%) | 78 (0.7%) |
| $25,000 to $34,999 | 406 (6.3%) | 182 (1.6%) |
| $35,000 to $49,999 | 536 (8.4%) | 78 (0.7%) |
| $50,000 to $74,999 | 1,076 (16.8%) | 741 (6.4%) |
| $75,000 to $99,999 | 608 (9.5%) | 824 (7.1%) |
| $100,000 to $149,999 | 976 (15.2%) | 1,202 (10.4%) |
| $150,000 or more | 2,009 (31.3%) | 2,522 (21.7%) |
| Total | 6,417 (100.0%) | 11,594 (100.0%) |
Property Value to Household Income Ratio in Novi
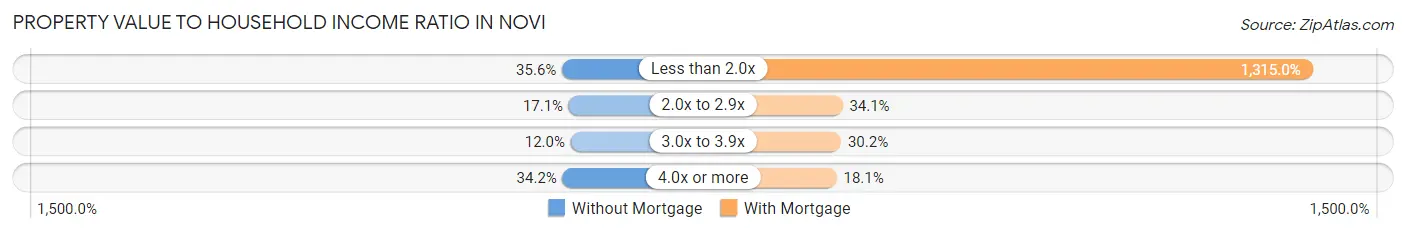
| Value-to-Income Ratio | Without Mortgage | With Mortgage |
| Less than 2.0x | 2,287 (35.6%) | 152,457 (1,315.0%) |
| 2.0x to 2.9x | 1,096 (17.1%) | 3,955 (34.1%) |
| 3.0x to 3.9x | 769 (12.0%) | 3,504 (30.2%) |
| 4.0x or more | 2,194 (34.2%) | 2,100 (18.1%) |
| Total | 6,417 (100.0%) | 11,594 (100.0%) |
Real Estate Taxes by Mortgage Status in Novi
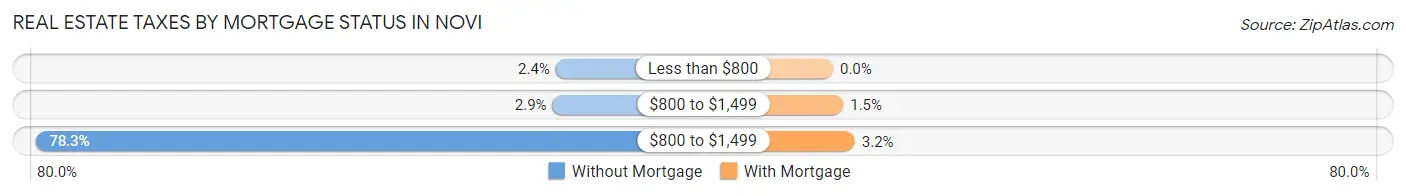
| Property Taxes | Without Mortgage | With Mortgage |
| Less than $800 | 154 (2.4%) | 0 (0.0%) |
| $800 to $1,499 | 184 (2.9%) | 174 (1.5%) |
| $800 to $1,499 | 5,023 (78.3%) | 369 (3.2%) |
| Total | 6,417 (100.0%) | 11,594 (100.0%) |
Health & Disability in Novi
Health Insurance Coverage by Age in Novi
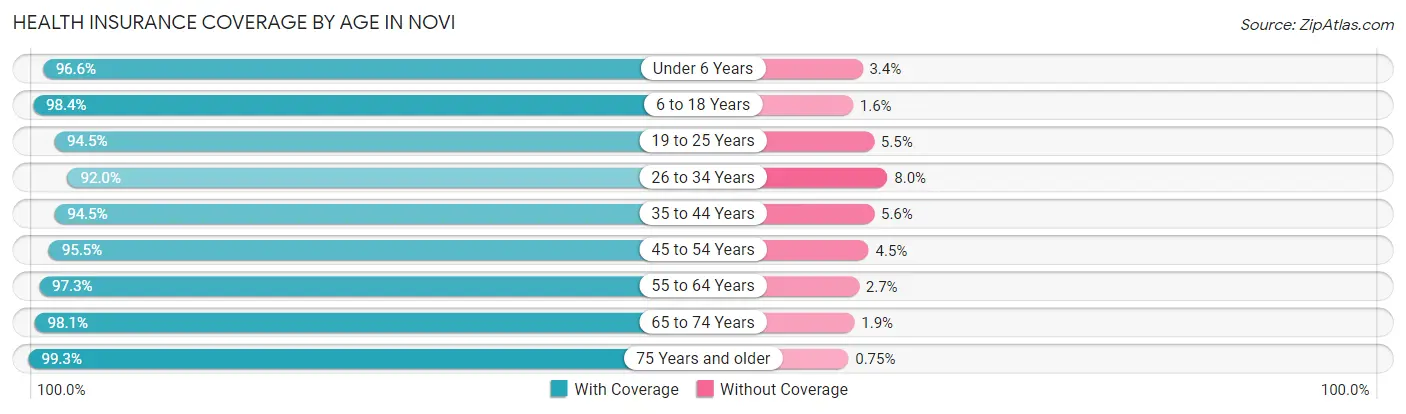
| Age Bracket | With Coverage | Without Coverage |
| Under 6 Years | 4,289 (96.6%) | 150 (3.4%) |
| 6 to 18 Years | 11,776 (98.4%) | 191 (1.6%) |
| 19 to 25 Years | 3,919 (94.5%) | 229 (5.5%) |
| 26 to 34 Years | 6,652 (92.0%) | 581 (8.0%) |
| 35 to 44 Years | 9,270 (94.5%) | 545 (5.6%) |
| 45 to 54 Years | 9,764 (95.5%) | 463 (4.5%) |
| 55 to 64 Years | 7,945 (97.3%) | 222 (2.7%) |
| 65 to 74 Years | 5,472 (98.1%) | 105 (1.9%) |
| 75 Years and older | 3,975 (99.3%) | 30 (0.7%) |
| Total | 63,062 (96.2%) | 2,516 (3.8%) |
Health Insurance Coverage by Citizenship Status in Novi
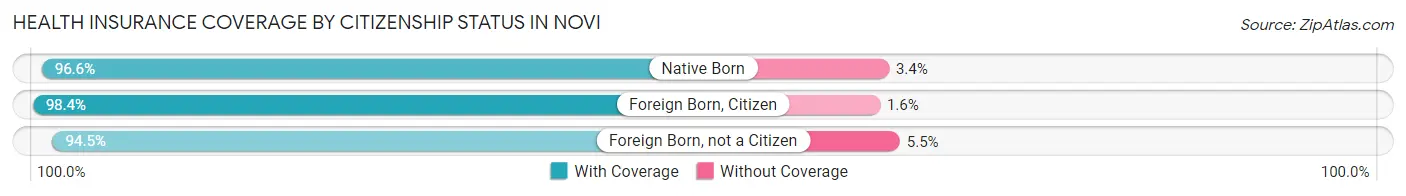
| Citizenship Status | With Coverage | Without Coverage |
| Native Born | 4,289 (96.6%) | 150 (3.4%) |
| Foreign Born, Citizen | 11,776 (98.4%) | 191 (1.6%) |
| Foreign Born, not a Citizen | 3,919 (94.5%) | 229 (5.5%) |
Health Insurance Coverage by Household Income in Novi
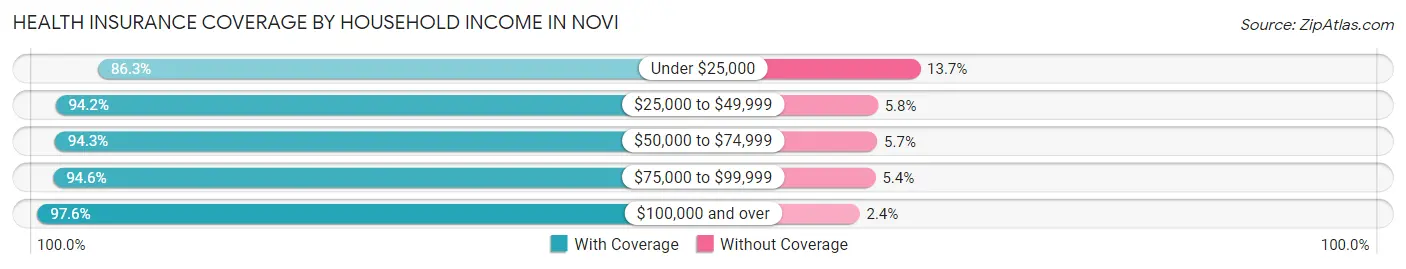
| Household Income | With Coverage | Without Coverage |
| Under $25,000 | 2,562 (86.3%) | 408 (13.7%) |
| $25,000 to $49,999 | 5,699 (94.2%) | 350 (5.8%) |
| $50,000 to $74,999 | 5,965 (94.3%) | 360 (5.7%) |
| $75,000 to $99,999 | 6,314 (94.6%) | 358 (5.4%) |
| $100,000 and over | 42,455 (97.6%) | 1,040 (2.4%) |
Public vs Private Health Insurance Coverage by Age in Novi
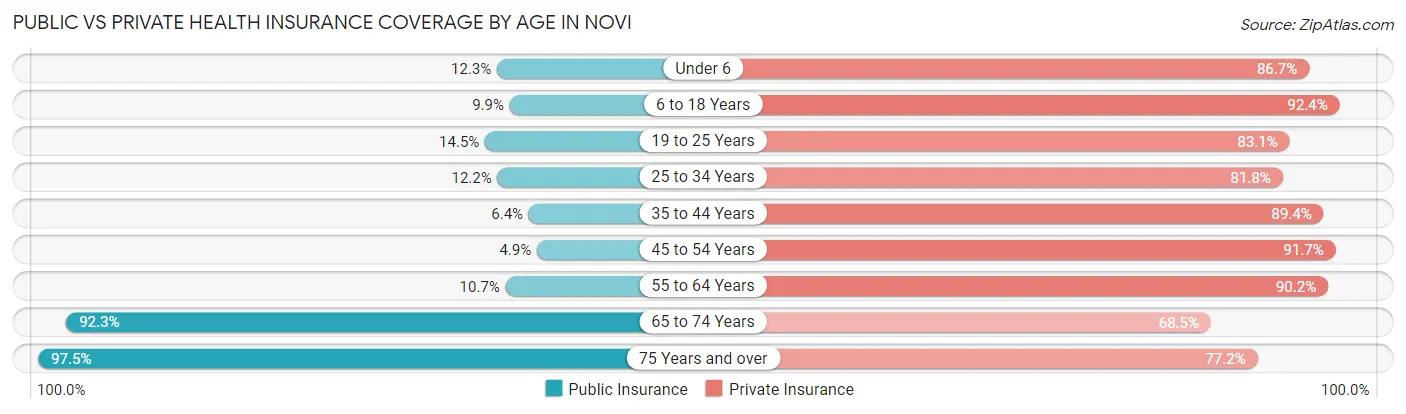
| Age Bracket | Public Insurance | Private Insurance |
| Under 6 | 546 (12.3%) | 3,849 (86.7%) |
| 6 to 18 Years | 1,190 (9.9%) | 11,058 (92.4%) |
| 19 to 25 Years | 602 (14.5%) | 3,447 (83.1%) |
| 25 to 34 Years | 883 (12.2%) | 5,918 (81.8%) |
| 35 to 44 Years | 627 (6.4%) | 8,778 (89.4%) |
| 45 to 54 Years | 500 (4.9%) | 9,373 (91.6%) |
| 55 to 64 Years | 875 (10.7%) | 7,370 (90.2%) |
| 65 to 74 Years | 5,146 (92.3%) | 3,819 (68.5%) |
| 75 Years and over | 3,904 (97.5%) | 3,090 (77.1%) |
| Total | 14,273 (21.8%) | 56,702 (86.5%) |
Disability Status by Sex by Age in Novi
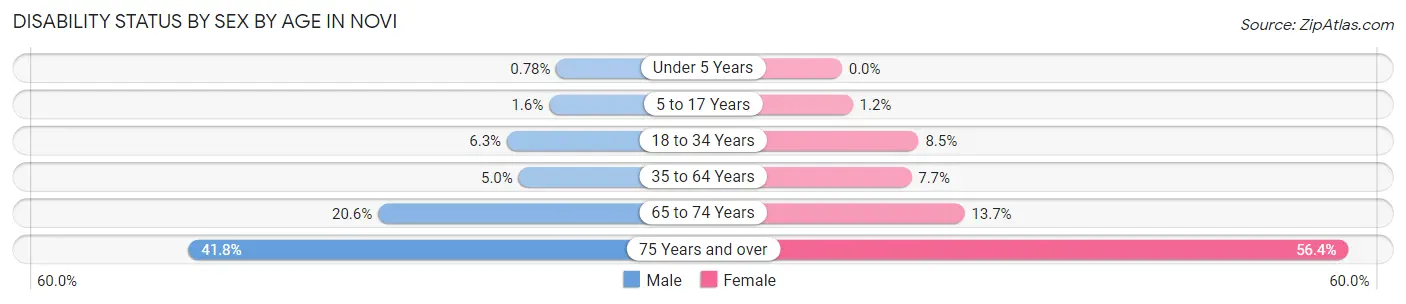
| Age Bracket | Male | Female |
| Under 5 Years | 14 (0.8%) | 0 (0.0%) |
| 5 to 17 Years | 96 (1.6%) | 71 (1.2%) |
| 18 to 34 Years | 372 (6.3%) | 548 (8.5%) |
| 35 to 64 Years | 729 (5.0%) | 1,050 (7.7%) |
| 65 to 74 Years | 494 (20.6%) | 435 (13.7%) |
| 75 Years and over | 641 (41.8%) | 1,393 (56.4%) |
Disability Class by Sex by Age in Novi
Disability Class: Hearing Difficulty
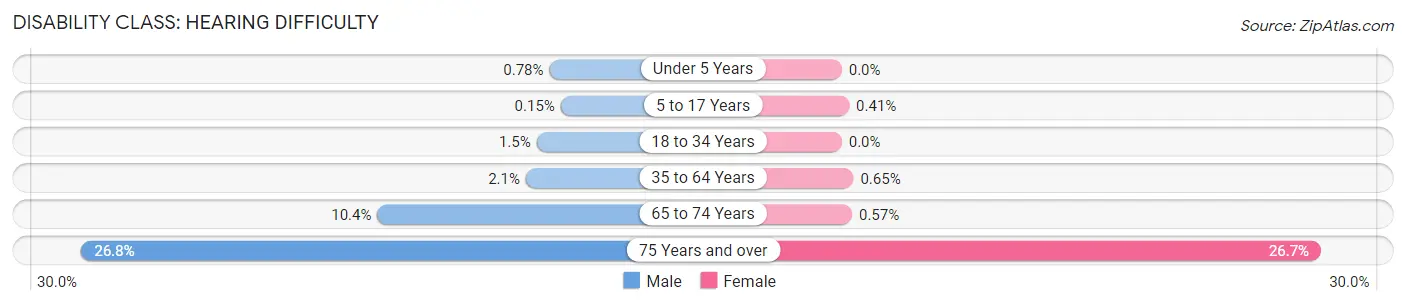
| Age Bracket | Male | Female |
| Under 5 Years | 14 (0.8%) | 0 (0.0%) |
| 5 to 17 Years | 9 (0.2%) | 24 (0.4%) |
| 18 to 34 Years | 88 (1.5%) | 0 (0.0%) |
| 35 to 64 Years | 306 (2.1%) | 88 (0.6%) |
| 65 to 74 Years | 248 (10.4%) | 18 (0.6%) |
| 75 Years and over | 412 (26.8%) | 659 (26.7%) |
Disability Class: Vision Difficulty
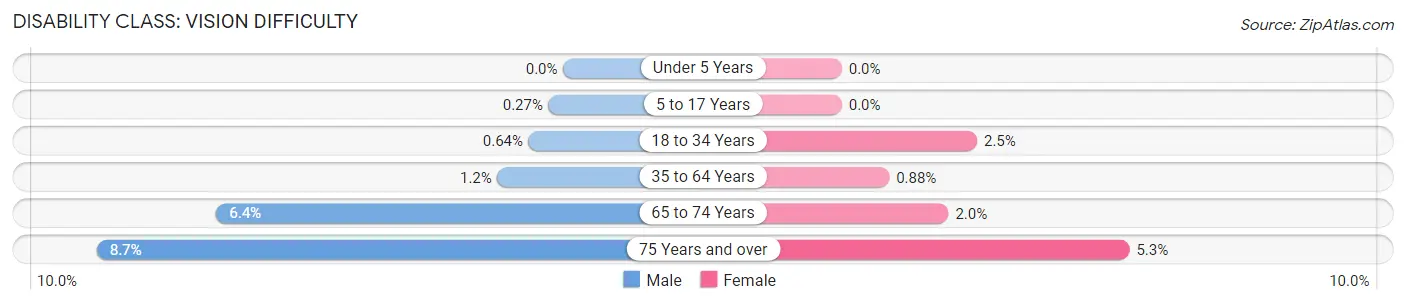
| Age Bracket | Male | Female |
| Under 5 Years | 0 (0.0%) | 0 (0.0%) |
| 5 to 17 Years | 16 (0.3%) | 0 (0.0%) |
| 18 to 34 Years | 38 (0.6%) | 161 (2.5%) |
| 35 to 64 Years | 178 (1.2%) | 119 (0.9%) |
| 65 to 74 Years | 154 (6.4%) | 63 (2.0%) |
| 75 Years and over | 133 (8.7%) | 132 (5.3%) |
Disability Class: Cognitive Difficulty
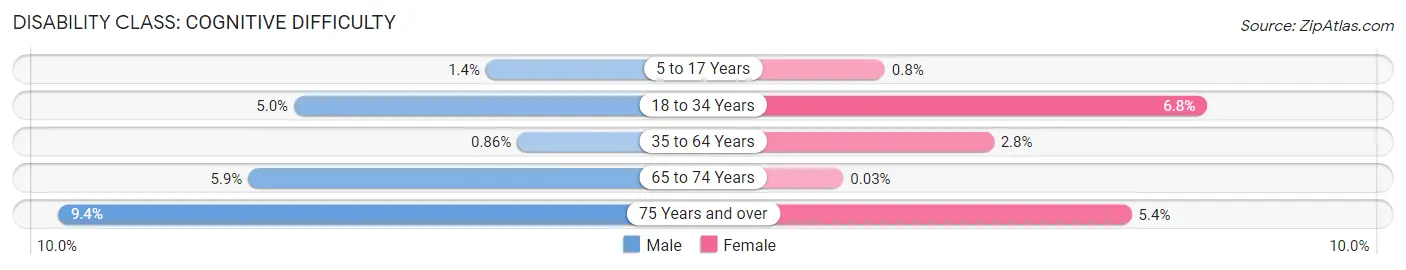
| Age Bracket | Male | Female |
| 5 to 17 Years | 87 (1.4%) | 47 (0.8%) |
| 18 to 34 Years | 296 (5.0%) | 435 (6.8%) |
| 35 to 64 Years | 126 (0.9%) | 382 (2.8%) |
| 65 to 74 Years | 140 (5.9%) | 1 (0.0%) |
| 75 Years and over | 144 (9.4%) | 133 (5.4%) |
Disability Class: Ambulatory Difficulty
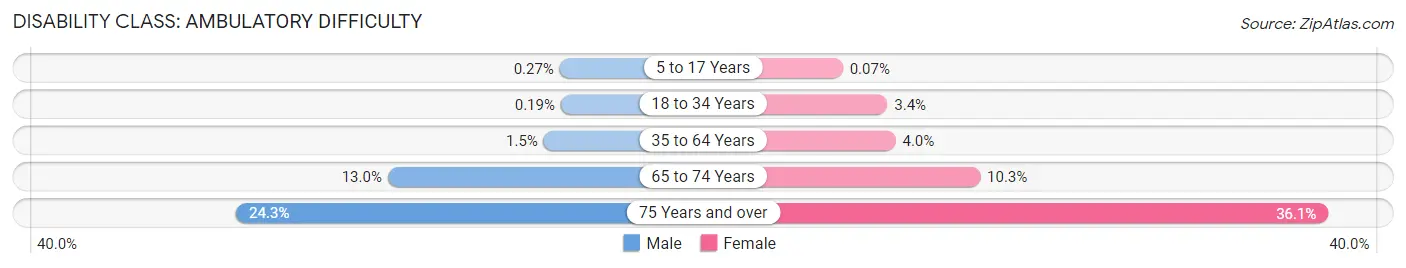
| Age Bracket | Male | Female |
| 5 to 17 Years | 16 (0.3%) | 4 (0.1%) |
| 18 to 34 Years | 11 (0.2%) | 217 (3.4%) |
| 35 to 64 Years | 214 (1.5%) | 541 (4.0%) |
| 65 to 74 Years | 312 (13.0%) | 327 (10.3%) |
| 75 Years and over | 373 (24.3%) | 892 (36.1%) |
Disability Class: Self-Care Difficulty
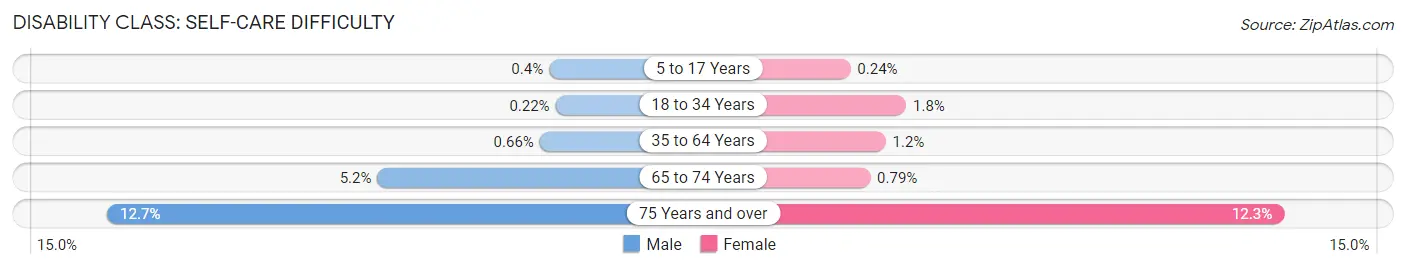
| Age Bracket | Male | Female |
| 5 to 17 Years | 24 (0.4%) | 14 (0.2%) |
| 18 to 34 Years | 13 (0.2%) | 115 (1.8%) |
| 35 to 64 Years | 96 (0.7%) | 166 (1.2%) |
| 65 to 74 Years | 124 (5.2%) | 25 (0.8%) |
| 75 Years and over | 195 (12.7%) | 304 (12.3%) |
Technology Access in Novi
Computing Device Access in Novi
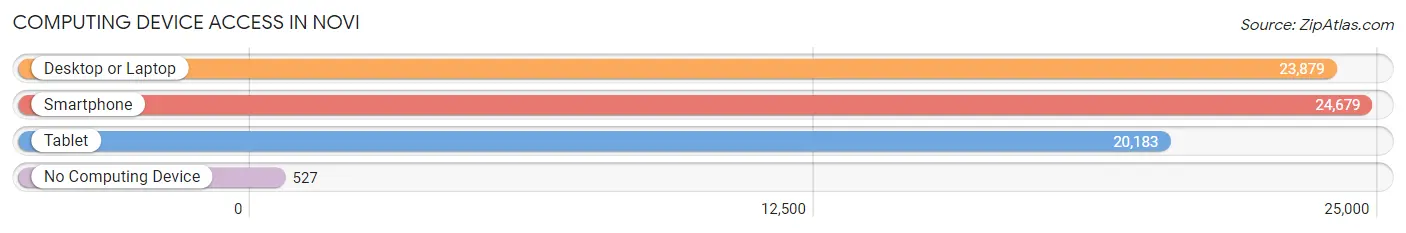
| Device Type | # Households | % Households |
| Desktop or Laptop | 23,879 | 90.1% |
| Smartphone | 24,679 | 93.1% |
| Tablet | 20,183 | 76.1% |
| No Computing Device | 527 | 2.0% |
| Total | 26,516 | 100.0% |
Internet Access in Novi
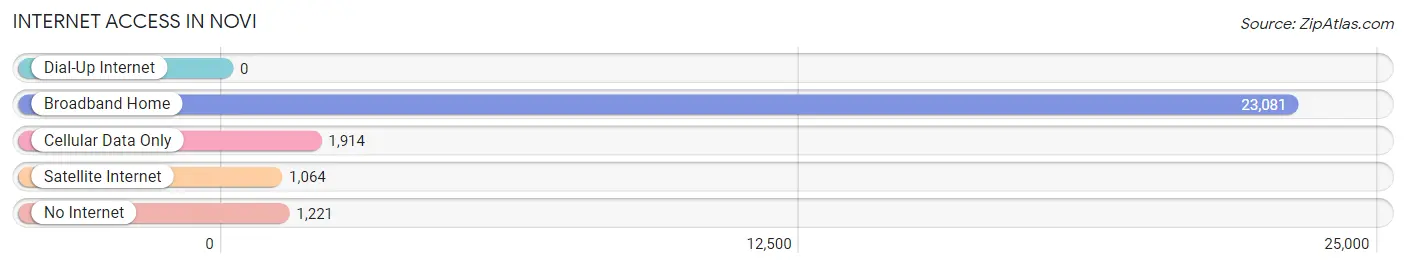
| Internet Type | # Households | % Households |
| Dial-Up Internet | 0 | 0.0% |
| Broadband Home | 23,081 | 87.1% |
| Cellular Data Only | 1,914 | 7.2% |
| Satellite Internet | 1,064 | 4.0% |
| No Internet | 1,221 | 4.6% |
| Total | 26,516 | 100.0% |
Novi Summary
Novi, Michigan is a city located in Oakland County, Michigan, United States. It is a suburb of Detroit and is part of the Detroit metropolitan area. As of the 2010 census, the city had a population of 55,224, making it the tenth largest city in Michigan.
History
The area that is now Novi was first settled in 1824 by John and James McConnell, who were among the first settlers in Oakland County. The area was originally known as Township 12, Range 2 East, and was part of the larger Township of Novi. The name Novi was derived from the Latin word for “new”.
In 1832, the Township of Novi was organized and the first township meeting was held in the home of John McConnell. The township was divided into four districts: Novi, Walled Lake, Commerce, and South Lyon.
In 1833, the first post office was established in Novi and the first school was built in 1835. The first church was built in 1837 and the first newspaper, the Novi News, was established in 1845.
In 1856, the Township of Novi was incorporated as a village. The village was divided into four wards and the first village president was elected in 1857.
In the late 1800s, Novi began to grow rapidly as a result of the railroad and the automobile industry. The first railroad line was built in 1871 and the first automobile factory was built in 1895.
In the early 1900s, Novi continued to grow and the population reached 1,000 in 1910. The village was incorporated as a city in 1958 and the population had grown to 4,000 by 1960.
Geography
Novi is located in Oakland County, Michigan, United States. It is a suburb of Detroit and is part of the Detroit metropolitan area. The city is situated on the western edge of Oakland County, approximately 25 miles northwest of Detroit.
The city has a total area of 33.2 square miles, of which 32.9 square miles is land and 0.3 square miles is water. The city is bordered by the cities of South Lyon, Wixom, Walled Lake, and Northville.
Economy
Novi is a major economic center in Oakland County. The city is home to several large companies, including Bosch, Siemens, and Johnson Controls. The city is also home to several shopping centers, including Twelve Oaks Mall and Novi Town Center.
The city’s largest employer is the automotive industry, which employs over 10,000 people in the city. Other major employers include the health care industry, retail, and education.
Demographics
As of the 2010 census, the city had a population of 55,224. The racial makeup of the city was 79.2% White, 8.3% African American, 0.3% Native American, 8.2% Asian, 0.1% Pacific Islander, 1.3% from other races, and 2.6% from two or more races. Hispanic or Latino of any race were 4.2% of the population.
The median income for a household in the city was $76,837 and the median income for a family was $90,945. The per capita income for the city was $37,945. About 4.2% of families and 5.7% of the population were below the poverty line, including 6.3% of those under age 18 and 4.2% of those age 65 or over.
Common Questions
What is Per Capita Income in Novi?
Per Capita income in Novi is $60,396.
What is the Median Family Income in Novi?
Median Family Income in Novi is $139,638.
What is the Median Household income in Novi?
Median Household Income in Novi is $110,588.
What is Income or Wage Gap in Novi?
Income or Wage Gap in Novi is 49.1%.
Women in Novi earn 50.9 cents for every dollar earned by a man.
What is Inequality or Gini Index in Novi?
Inequality or Gini Index in Novi is 0.45.
What is the Total Population of Novi?
Total Population of Novi is 65,870.
What is the Total Male Population of Novi?
Total Male Population of Novi is 32,442.
What is the Total Female Population of Novi?
Total Female Population of Novi is 33,428.
What is the Ratio of Males per 100 Females in Novi?
There are 97.05 Males per 100 Females in Novi.
What is the Ratio of Females per 100 Males in Novi?
There are 103.04 Females per 100 Males in Novi.
What is the Median Population Age in Novi?
Median Population Age in Novi is 40.0 Years.
What is the Average Family Size in Novi
Average Family Size in Novi is 3.1 People.
What is the Average Household Size in Novi
Average Household Size in Novi is 2.5 People.
How Large is the Labor Force in Novi?
There are 35,692 People in the Labor Forcein in Novi.
What is the Percentage of People in the Labor Force in Novi?
68.2% of People are in the Labor Force in Novi.
What is the Unemployment Rate in Novi?
Unemployment Rate in Novi is 4.3%.