Yorba Linda, CA Map & Demographics
Yorba Linda Map
Yorba Linda Overview
$64,265
PER CAPITA INCOME
$165,664
AVG FAMILY INCOME
$148,325
AVG HOUSEHOLD INCOME
42.9%
WAGE / INCOME GAP [ % ]
57.1¢/ $1
WAGE / INCOME GAP [ $ ]
$11,843
FAMILY INCOME DEFICIT
0.44
INEQUALITY / GINI INDEX
68,035
TOTAL POPULATION
33,539
MALE POPULATION
34,496
FEMALE POPULATION
97.23
MALES / 100 FEMALES
102.85
FEMALES / 100 MALES
44.3
MEDIAN AGE
3.3
AVG FAMILY SIZE
3.0
AVG HOUSEHOLD SIZE
34,217
LABOR FORCE [ PEOPLE ]
62.8%
PERCENT IN LABOR FORCE
4.6%
UNEMPLOYMENT RATE
Income in Yorba Linda
Income Overview in Yorba Linda
Per Capita Income in Yorba Linda is $64,265, while median incomes of families and households are $165,664 and $148,325 respectively.
| Characteristic | Number | Measure |
| Per Capita Income | 68,035 | $64,265 |
| Median Family Income | 18,537 | $165,664 |
| Mean Family Income | 18,537 | $206,136 |
| Median Household Income | 22,938 | $148,325 |
| Mean Household Income | 22,938 | $186,850 |
| Income Deficit | 18,537 | $11,843 |
| Wage / Income Gap (%) | 68,035 | 42.86% |
| Wage / Income Gap ($) | 68,035 | 57.14¢ per $1 |
| Gini / Inequality Index | 68,035 | 0.44 |
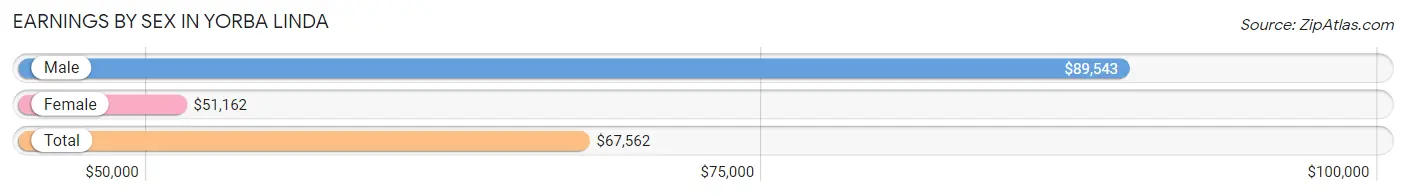
Earnings by Sex in Yorba Linda
Average Earnings in Yorba Linda are $67,562, $89,543 for men and $51,162 for women, a difference of 42.9%.
| Sex | Number | Average Earnings |
| Male | 18,982 (53.4%) | $89,543 |
| Female | 16,565 (46.6%) | $51,162 |
| Total | 35,547 (100.0%) | $67,562 |
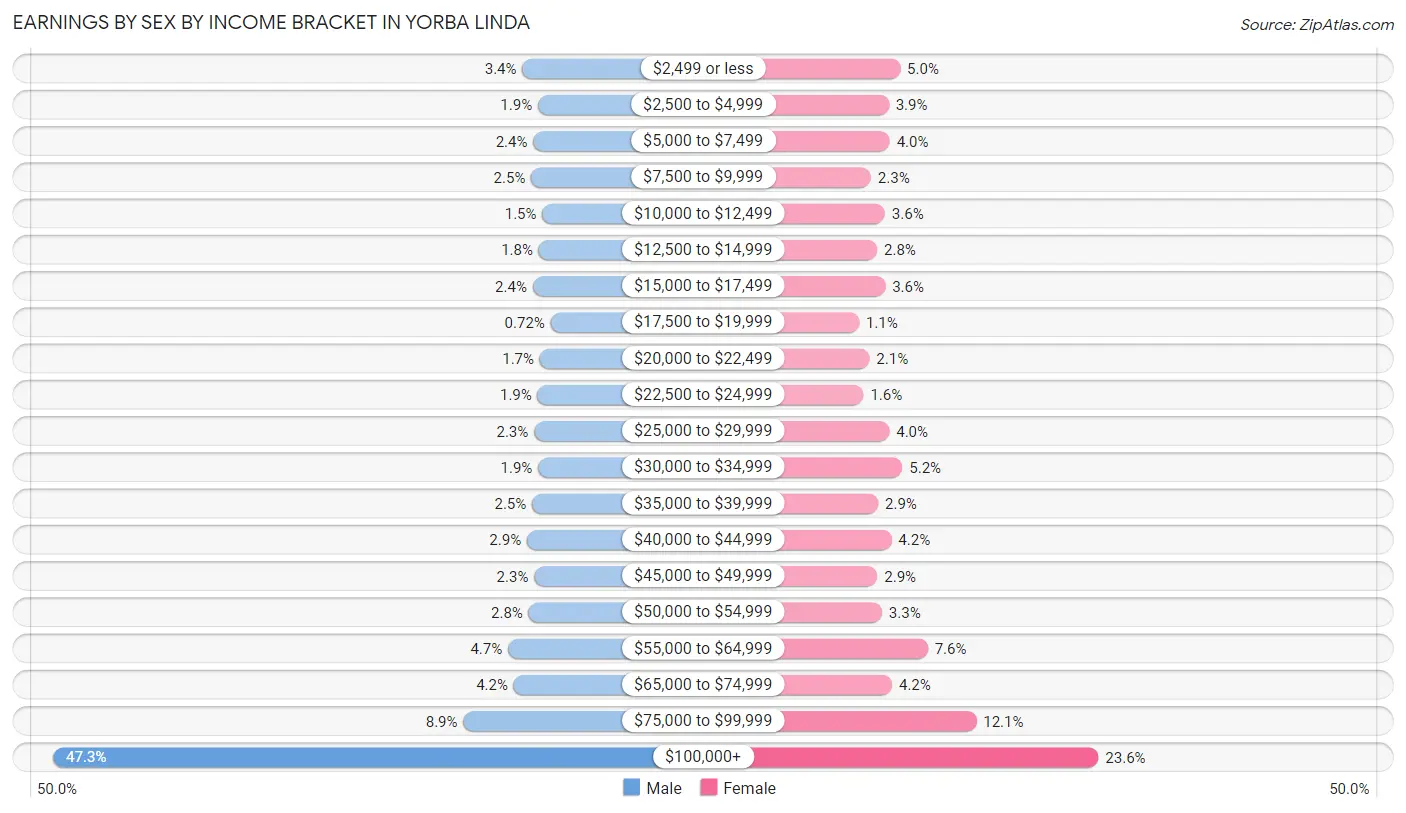
Earnings by Sex by Income Bracket in Yorba Linda
The most common earnings brackets in Yorba Linda are $100,000+ for men (8,984 | 47.3%) and $100,000+ for women (3,904 | 23.6%).
| Income | Male | Female |
| $2,499 or less | 640 (3.4%) | 828 (5.0%) |
| $2,500 to $4,999 | 362 (1.9%) | 651 (3.9%) |
| $5,000 to $7,499 | 446 (2.4%) | 666 (4.0%) |
| $7,500 to $9,999 | 482 (2.5%) | 375 (2.3%) |
| $10,000 to $12,499 | 284 (1.5%) | 592 (3.6%) |
| $12,500 to $14,999 | 348 (1.8%) | 471 (2.8%) |
| $15,000 to $17,499 | 456 (2.4%) | 596 (3.6%) |
| $17,500 to $19,999 | 137 (0.7%) | 189 (1.1%) |
| $20,000 to $22,499 | 328 (1.7%) | 352 (2.1%) |
| $22,500 to $24,999 | 369 (1.9%) | 258 (1.6%) |
| $25,000 to $29,999 | 431 (2.3%) | 659 (4.0%) |
| $30,000 to $34,999 | 359 (1.9%) | 862 (5.2%) |
| $35,000 to $39,999 | 467 (2.5%) | 485 (2.9%) |
| $40,000 to $44,999 | 559 (2.9%) | 693 (4.2%) |
| $45,000 to $49,999 | 429 (2.3%) | 473 (2.9%) |
| $50,000 to $54,999 | 527 (2.8%) | 545 (3.3%) |
| $55,000 to $64,999 | 894 (4.7%) | 1,255 (7.6%) |
| $65,000 to $74,999 | 791 (4.2%) | 702 (4.2%) |
| $75,000 to $99,999 | 1,689 (8.9%) | 2,009 (12.1%) |
| $100,000+ | 8,984 (47.3%) | 3,904 (23.6%) |
| Total | 18,982 (100.0%) | 16,565 (100.0%) |
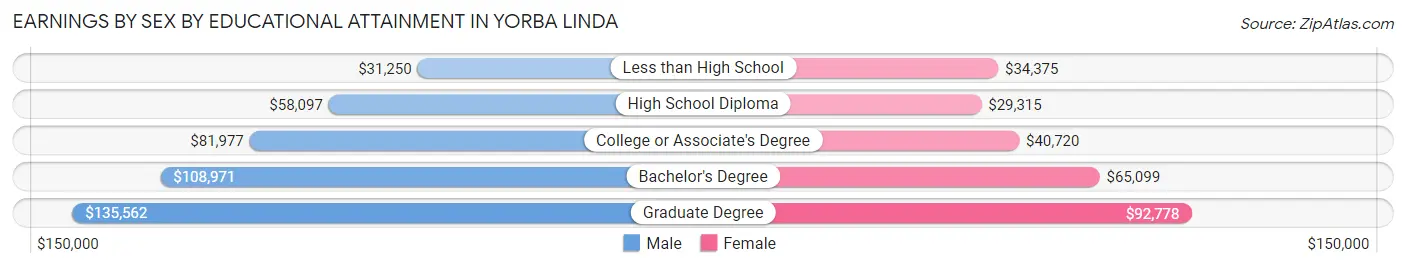
Earnings by Sex by Educational Attainment in Yorba Linda
Average earnings in Yorba Linda are $103,453 for men and $57,585 for women, a difference of 44.3%. Men with an educational attainment of graduate degree enjoy the highest average annual earnings of $135,562, while those with less than high school education earn the least with $31,250. Women with an educational attainment of graduate degree earn the most with the average annual earnings of $92,778, while those with high school diploma education have the smallest earnings of $29,315.
| Educational Attainment | Male Income | Female Income |
| Less than High School | $31,250 | $34,375 |
| High School Diploma | $58,097 | $29,315 |
| College or Associate's Degree | $81,977 | $40,720 |
| Bachelor's Degree | $108,971 | $65,099 |
| Graduate Degree | $135,562 | $92,778 |
| Total | $103,453 | $57,585 |
Family Income in Yorba Linda
Family Income Brackets in Yorba Linda
According to the Yorba Linda family income data, there are 7,081 families falling into the $200,000+ income range, which is the most common income bracket and makes up 38.2% of all families. Conversely, the $10,000 to $14,999 income bracket is the least frequent group with only 185 families (1.0%) belonging to this category.
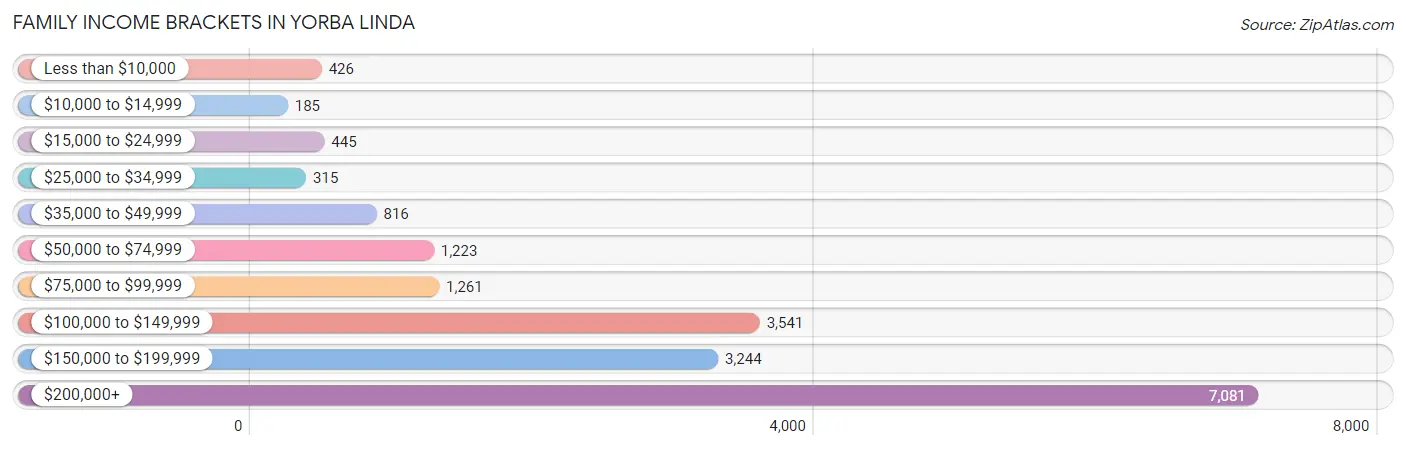
| Income Bracket | # Families | % Families |
| Less than $10,000 | 426 | 2.3% |
| $10,000 to $14,999 | 185 | 1.0% |
| $15,000 to $24,999 | 445 | 2.4% |
| $25,000 to $34,999 | 315 | 1.7% |
| $35,000 to $49,999 | 816 | 4.4% |
| $50,000 to $74,999 | 1,223 | 6.6% |
| $75,000 to $99,999 | 1,261 | 6.8% |
| $100,000 to $149,999 | 3,541 | 19.1% |
| $150,000 to $199,999 | 3,244 | 17.5% |
| $200,000+ | 7,081 | 38.2% |
Family Income by Famaliy Size in Yorba Linda
7+ person families (243 | 1.3%) account for the highest median family income in Yorba Linda with $250,001 per family, while 2-person families (7,114 | 38.4%) have the highest median income of $67,916 per family member.
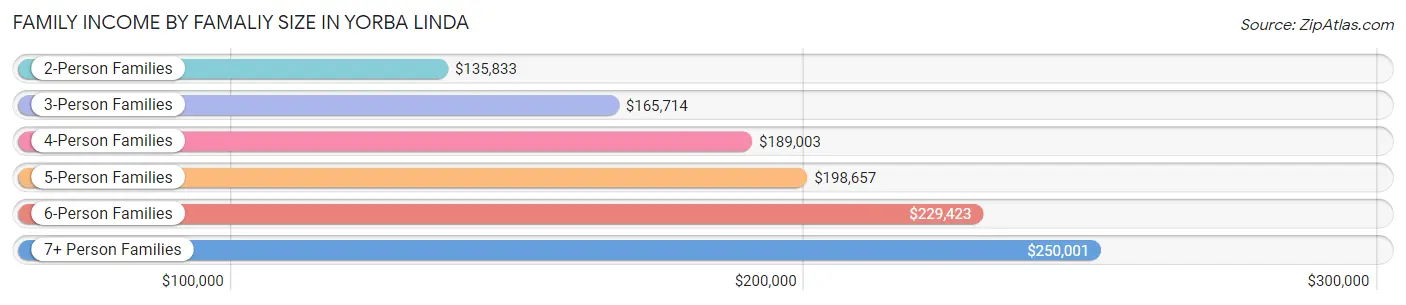
| Income Bracket | # Families | Median Income |
| 2-Person Families | 7,114 (38.4%) | $135,833 |
| 3-Person Families | 4,136 (22.3%) | $165,714 |
| 4-Person Families | 5,071 (27.4%) | $189,003 |
| 5-Person Families | 1,641 (8.8%) | $198,657 |
| 6-Person Families | 332 (1.8%) | $229,423 |
| 7+ Person Families | 243 (1.3%) | $250,001 |
| Total | 18,537 (100.0%) | $165,664 |
Family Income by Number of Earners in Yorba Linda
The median family income in Yorba Linda is $165,664, with families comprising 3+ earners (2,798) having the highest median family income of $241,458, while families with no earners (2,644) have the lowest median family income of $82,500, accounting for 15.1% and 14.3% of families, respectively.
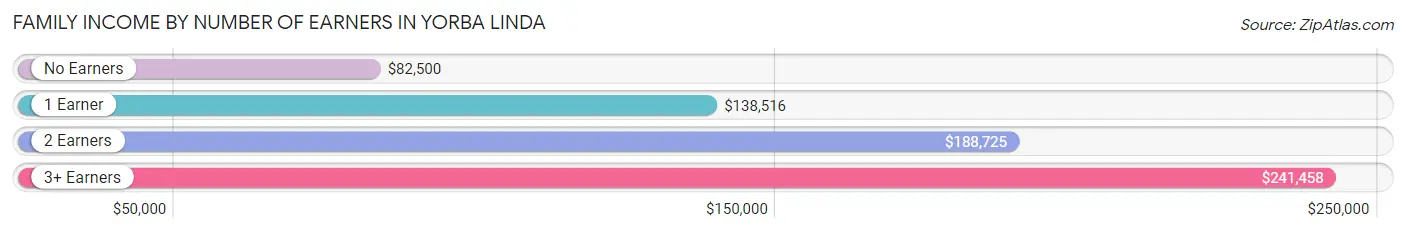
| Number of Earners | # Families | Median Income |
| No Earners | 2,644 (14.3%) | $82,500 |
| 1 Earner | 4,834 (26.1%) | $138,516 |
| 2 Earners | 8,261 (44.6%) | $188,725 |
| 3+ Earners | 2,798 (15.1%) | $241,458 |
| Total | 18,537 (100.0%) | $165,664 |
Household Income in Yorba Linda
Household Income Brackets in Yorba Linda
With 7,661 households falling in the category, the $200,000+ income range is the most frequent in Yorba Linda, accounting for 33.4% of all households. In contrast, only 459 households (2.0%) fall into the $10,000 to $14,999 income bracket, making it the least populous group.
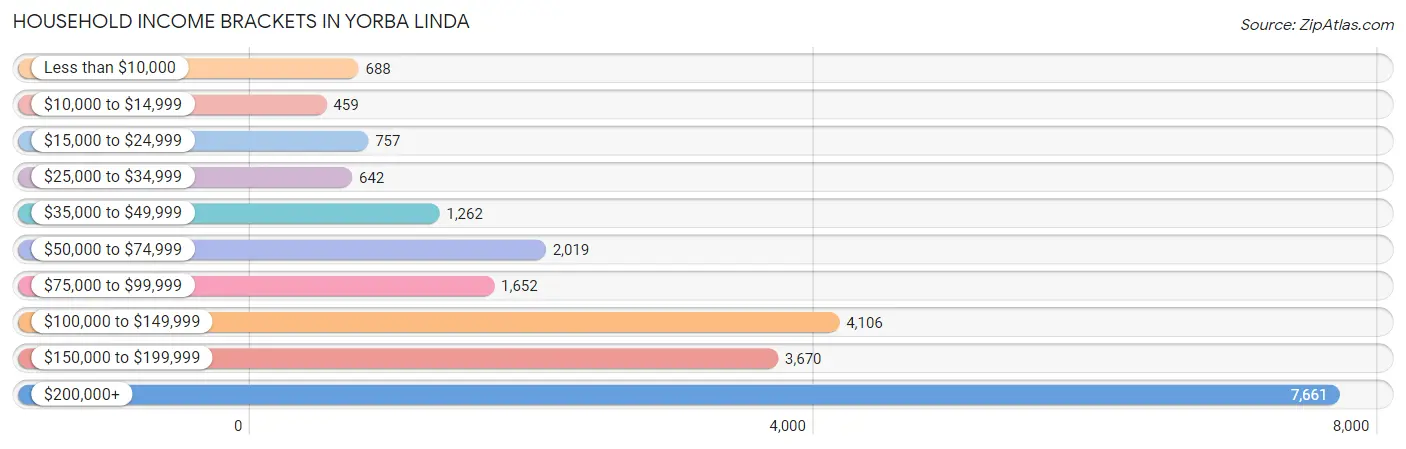
| Income Bracket | # Households | % Households |
| Less than $10,000 | 688 | 3.0% |
| $10,000 to $14,999 | 459 | 2.0% |
| $15,000 to $24,999 | 757 | 3.3% |
| $25,000 to $34,999 | 642 | 2.8% |
| $35,000 to $49,999 | 1,262 | 5.5% |
| $50,000 to $74,999 | 2,019 | 8.8% |
| $75,000 to $99,999 | 1,652 | 7.2% |
| $100,000 to $149,999 | 4,106 | 17.9% |
| $150,000 to $199,999 | 3,670 | 16.0% |
| $200,000+ | 7,661 | 33.4% |
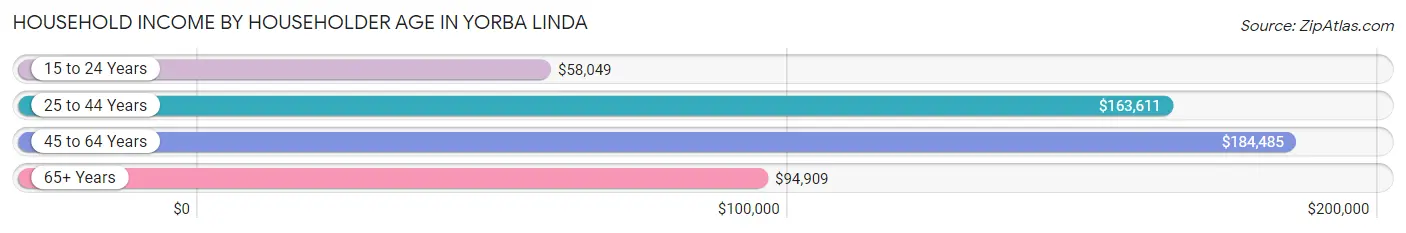
Household Income by Householder Age in Yorba Linda
The median household income in Yorba Linda is $148,325, with the highest median household income of $184,485 found in the 45 to 64 years age bracket for the primary householder. A total of 10,178 households (44.4%) fall into this category. Meanwhile, the 15 to 24 years age bracket for the primary householder has the lowest median household income of $58,049, with 122 households (0.5%) in this group.
| Income Bracket | # Households | Median Income |
| 15 to 24 Years | 122 (0.5%) | $58,049 |
| 25 to 44 Years | 5,234 (22.8%) | $163,611 |
| 45 to 64 Years | 10,178 (44.4%) | $184,485 |
| 65+ Years | 7,404 (32.3%) | $94,909 |
| Total | 22,938 (100.0%) | $148,325 |
Poverty in Yorba Linda
Income Below Poverty by Sex and Age in Yorba Linda
With 4.9% poverty level for males and 7.0% for females among the residents of Yorba Linda, 6 to 11 year old males and 12 to 14 year old females are the most vulnerable to poverty, with 335 males (10.6%) and 287 females (24.7%) in their respective age groups living below the poverty level.
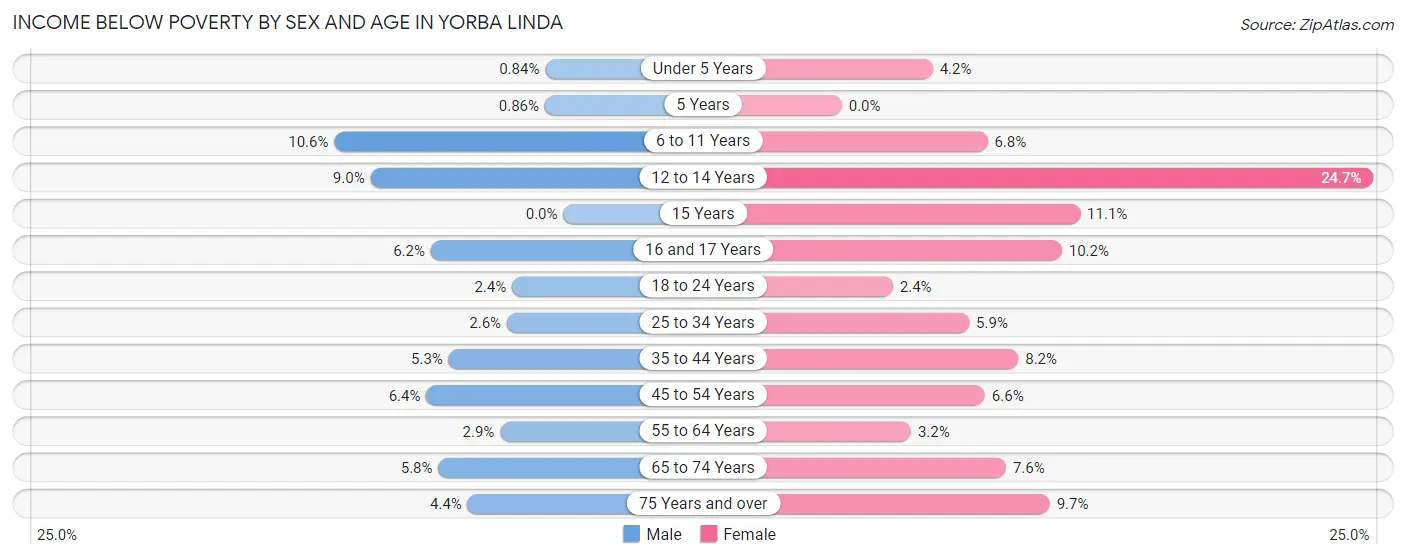
| Age Bracket | Male | Female |
| Under 5 Years | 15 (0.8%) | 67 (4.2%) |
| 5 Years | 4 (0.9%) | 0 (0.0%) |
| 6 to 11 Years | 335 (10.6%) | 199 (6.8%) |
| 12 to 14 Years | 104 (8.9%) | 287 (24.7%) |
| 15 Years | 0 (0.0%) | 52 (11.1%) |
| 16 and 17 Years | 60 (6.1%) | 96 (10.2%) |
| 18 to 24 Years | 55 (2.4%) | 54 (2.4%) |
| 25 to 34 Years | 86 (2.6%) | 189 (5.9%) |
| 35 to 44 Years | 187 (5.3%) | 368 (8.2%) |
| 45 to 54 Years | 336 (6.4%) | 335 (6.6%) |
| 55 to 64 Years | 148 (2.9%) | 157 (3.2%) |
| 65 to 74 Years | 213 (5.8%) | 305 (7.6%) |
| 75 Years and over | 104 (4.4%) | 282 (9.7%) |
| Total | 1,647 (4.9%) | 2,391 (7.0%) |
Income Above Poverty by Sex and Age in Yorba Linda
According to the poverty statistics in Yorba Linda, males aged 15 years and females aged 5 years are the age groups that are most secure financially, with 100.0% of males and 100.0% of females in these age groups living above the poverty line.
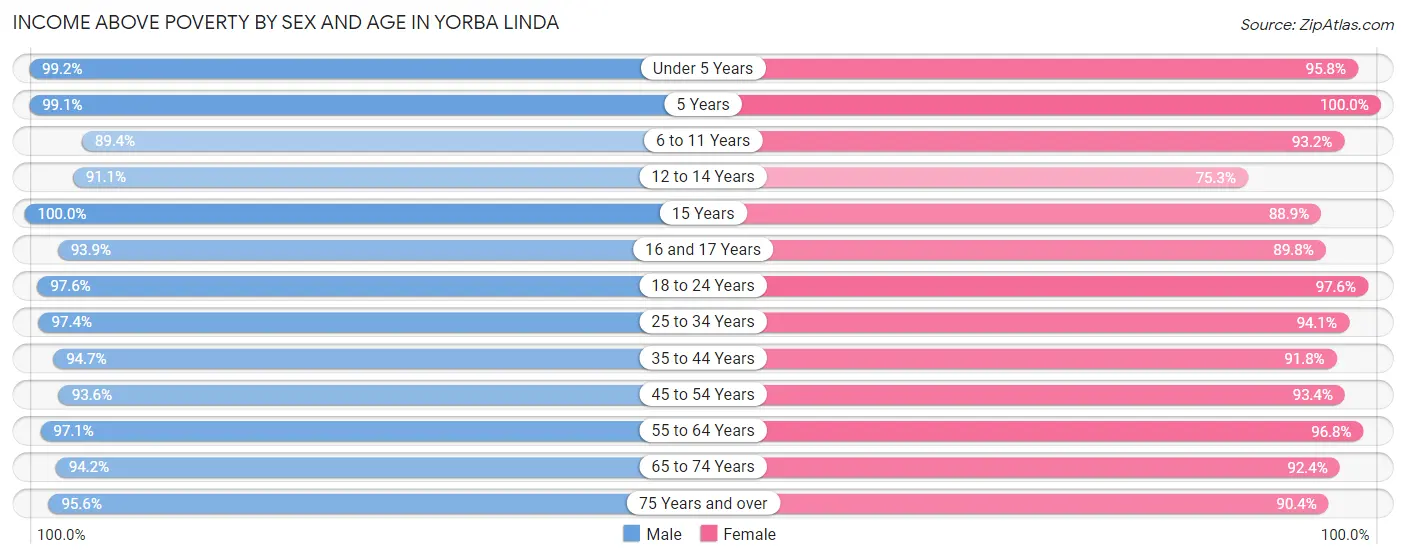
| Age Bracket | Male | Female |
| Under 5 Years | 1,775 (99.2%) | 1,522 (95.8%) |
| 5 Years | 462 (99.1%) | 341 (100.0%) |
| 6 to 11 Years | 2,816 (89.4%) | 2,746 (93.2%) |
| 12 to 14 Years | 1,058 (91.0%) | 877 (75.3%) |
| 15 Years | 389 (100.0%) | 418 (88.9%) |
| 16 and 17 Years | 915 (93.9%) | 844 (89.8%) |
| 18 to 24 Years | 2,253 (97.6%) | 2,226 (97.6%) |
| 25 to 34 Years | 3,197 (97.4%) | 3,009 (94.1%) |
| 35 to 44 Years | 3,331 (94.7%) | 4,123 (91.8%) |
| 45 to 54 Years | 4,947 (93.6%) | 4,708 (93.4%) |
| 55 to 64 Years | 4,910 (97.1%) | 4,733 (96.8%) |
| 65 to 74 Years | 3,460 (94.2%) | 3,699 (92.4%) |
| 75 Years and over | 2,236 (95.6%) | 2,641 (90.3%) |
| Total | 31,749 (95.1%) | 31,887 (93.0%) |
Income Below Poverty Among Married-Couple Families in Yorba Linda
The poverty statistics for married-couple families in Yorba Linda show that 3.5% or 565 of the total 16,003 families live below the poverty line. Families with 1 or 2 children have the highest poverty rate of 5.1%, comprising of 303 families. On the other hand, families with 5 or more children have the lowest poverty rate of 0.0%, which includes 0 families.
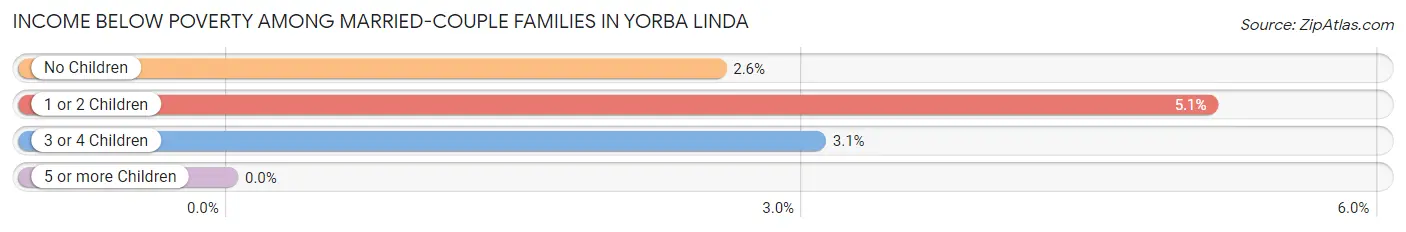
| Children | Above Poverty | Below Poverty |
| No Children | 8,841 (97.5%) | 231 (2.5%) |
| 1 or 2 Children | 5,616 (94.9%) | 303 (5.1%) |
| 3 or 4 Children | 978 (96.9%) | 31 (3.1%) |
| 5 or more Children | 3 (100.0%) | 0 (0.0%) |
| Total | 15,438 (96.5%) | 565 (3.5%) |
Income Below Poverty Among Single-Parent Households in Yorba Linda
According to the poverty data in Yorba Linda, 13.5% or 141 single-father households and 15.7% or 234 single-mother households are living below the poverty line. Among single-father households, those with 1 or 2 children have the highest poverty rate, with 117 households (31.2%) experiencing poverty. Likewise, among single-mother households, those with 3 or 4 children have the highest poverty rate, with 29 households (34.1%) falling below the poverty line.
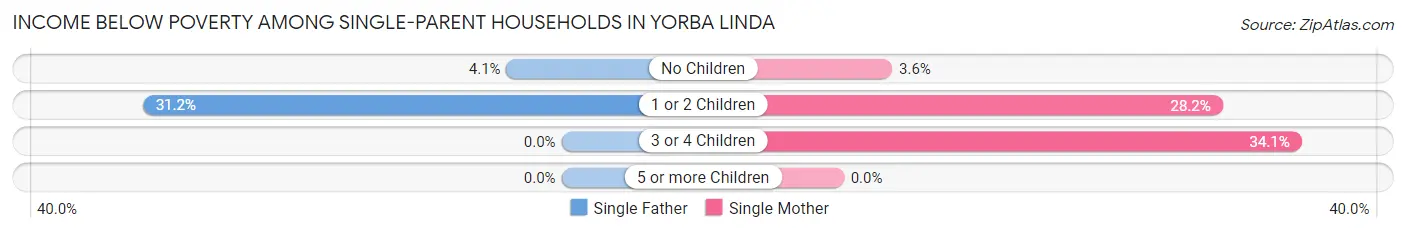
| Children | Single Father | Single Mother |
| No Children | 24 (4.1%) | 28 (3.6%) |
| 1 or 2 Children | 117 (31.2%) | 177 (28.2%) |
| 3 or 4 Children | 0 (0.0%) | 29 (34.1%) |
| 5 or more Children | 0 (0.0%) | 0 (0.0%) |
| Total | 141 (13.5%) | 234 (15.7%) |
Income Below Poverty Among Married-Couple vs Single-Parent Households in Yorba Linda
The poverty data for Yorba Linda shows that 565 of the married-couple family households (3.5%) and 375 of the single-parent households (14.8%) are living below the poverty level. Within the married-couple family households, those with 1 or 2 children have the highest poverty rate, with 303 households (5.1%) falling below the poverty line. Among the single-parent households, those with 1 or 2 children have the highest poverty rate, with 294 household (29.3%) living below poverty.
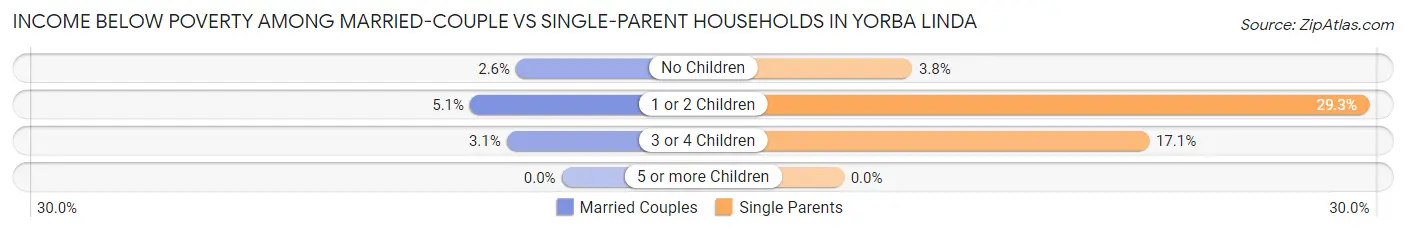
| Children | Married-Couple Families | Single-Parent Households |
| No Children | 231 (2.5%) | 52 (3.8%) |
| 1 or 2 Children | 303 (5.1%) | 294 (29.3%) |
| 3 or 4 Children | 31 (3.1%) | 29 (17.1%) |
| 5 or more Children | 0 (0.0%) | 0 (0.0%) |
| Total | 565 (3.5%) | 375 (14.8%) |
Race in Yorba Linda
The most populous races in Yorba Linda are White / Caucasian (41,239 | 60.6%), Asian (16,265 | 23.9%), and Hispanic or Latino (12,010 | 17.6%).
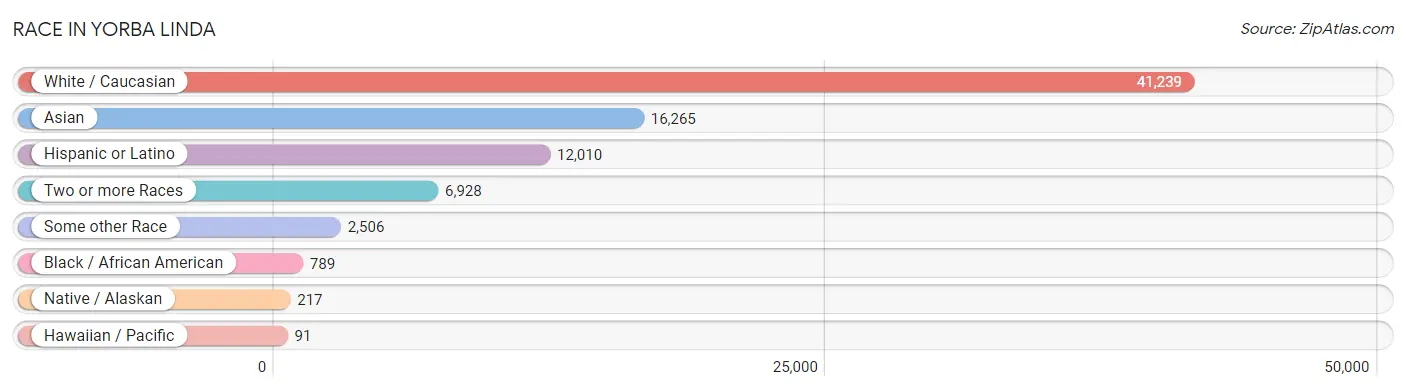
| Race | # Population | % Population |
| Asian | 16,265 | 23.9% |
| Black / African American | 789 | 1.2% |
| Hawaiian / Pacific | 91 | 0.1% |
| Hispanic or Latino | 12,010 | 17.6% |
| Native / Alaskan | 217 | 0.3% |
| White / Caucasian | 41,239 | 60.6% |
| Two or more Races | 6,928 | 10.2% |
| Some other Race | 2,506 | 3.7% |
| Total | 68,035 | 100.0% |
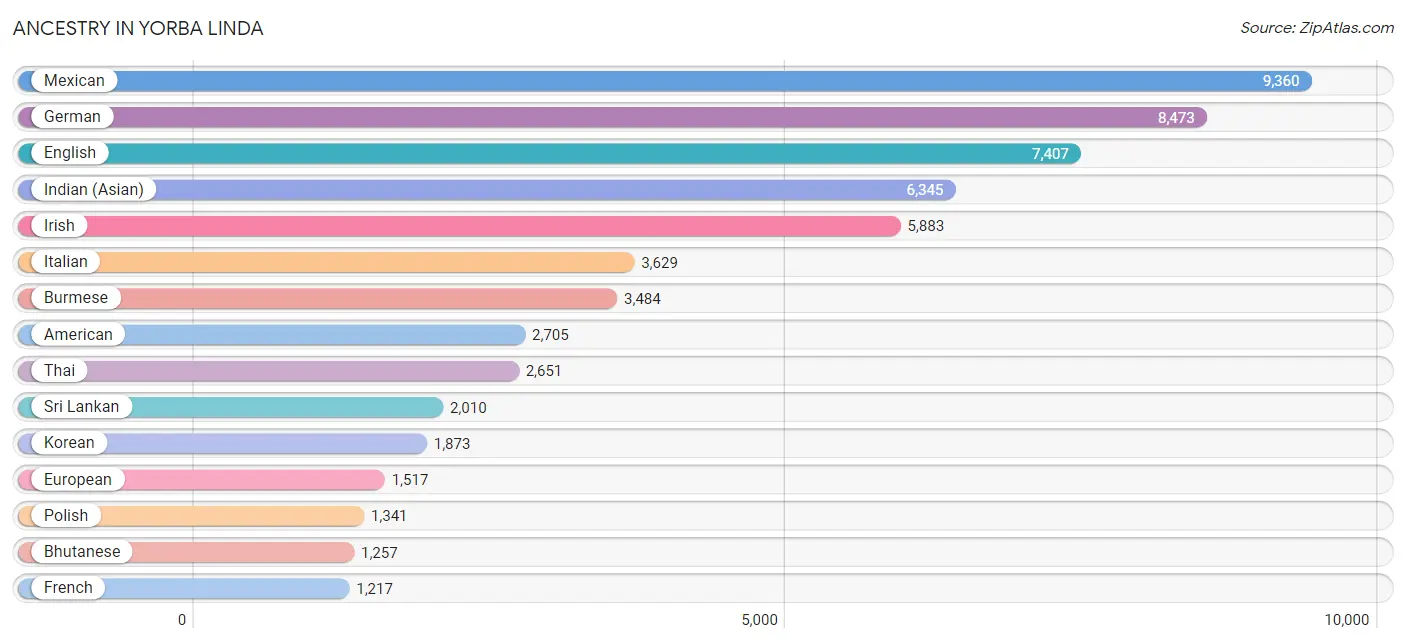
Ancestry in Yorba Linda
The most populous ancestries reported in Yorba Linda are Mexican (9,360 | 13.8%), German (8,473 | 12.4%), English (7,407 | 10.9%), Indian (Asian) (6,345 | 9.3%), and Irish (5,883 | 8.6%), together accounting for 55.1% of all Yorba Linda residents.
| Ancestry | # Population | % Population |
| African | 1 | 0.0% |
| Albanian | 45 | 0.1% |
| Aleut | 4 | 0.0% |
| American | 2,705 | 4.0% |
| Apache | 2 | 0.0% |
| Arab | 656 | 1.0% |
| Argentinean | 162 | 0.2% |
| Armenian | 298 | 0.4% |
| Australian | 31 | 0.1% |
| Austrian | 233 | 0.3% |
| Basque | 14 | 0.0% |
| Belgian | 42 | 0.1% |
| Belizean | 99 | 0.2% |
| Bhutanese | 1,257 | 1.8% |
| Bolivian | 29 | 0.0% |
| British | 500 | 0.7% |
| Burmese | 3,484 | 5.1% |
| Canadian | 359 | 0.5% |
| Central American | 631 | 0.9% |
| Cherokee | 16 | 0.0% |
| Chilean | 45 | 0.1% |
| Choctaw | 25 | 0.0% |
| Colombian | 61 | 0.1% |
| Costa Rican | 40 | 0.1% |
| Creek | 80 | 0.1% |
| Croatian | 205 | 0.3% |
| Cuban | 346 | 0.5% |
| Czech | 306 | 0.4% |
| Czechoslovakian | 119 | 0.2% |
| Danish | 428 | 0.6% |
| Delaware | 13 | 0.0% |
| Dutch | 983 | 1.4% |
| Eastern European | 340 | 0.5% |
| Ecuadorian | 57 | 0.1% |
| Egyptian | 198 | 0.3% |
| English | 7,407 | 10.9% |
| Estonian | 39 | 0.1% |
| Ethiopian | 66 | 0.1% |
| European | 1,517 | 2.2% |
| Filipino | 878 | 1.3% |
| Finnish | 87 | 0.1% |
| French | 1,217 | 1.8% |
| French American Indian | 60 | 0.1% |
| French Canadian | 164 | 0.2% |
| German | 8,473 | 12.4% |
| Greek | 281 | 0.4% |
| Guamanian / Chamorro | 50 | 0.1% |
| Guatemalan | 66 | 0.1% |
| Hungarian | 300 | 0.4% |
| Indian (Asian) | 6,345 | 9.3% |
| Indonesian | 13 | 0.0% |
| Iranian | 669 | 1.0% |
| Irish | 5,883 | 8.6% |
| Iroquois | 11 | 0.0% |
| Israeli | 35 | 0.1% |
| Italian | 3,629 | 5.3% |
| Jamaican | 39 | 0.1% |
| Japanese | 21 | 0.0% |
| Jordanian | 44 | 0.1% |
| Korean | 1,873 | 2.8% |
| Laotian | 246 | 0.4% |
| Latvian | 19 | 0.0% |
| Lebanese | 236 | 0.4% |
| Lithuanian | 149 | 0.2% |
| Luxembourger | 8 | 0.0% |
| Macedonian | 28 | 0.0% |
| Malaysian | 48 | 0.1% |
| Mexican | 9,360 | 13.8% |
| Mexican American Indian | 109 | 0.2% |
| Mongolian | 39 | 0.1% |
| Moroccan | 5 | 0.0% |
| Native Hawaiian | 66 | 0.1% |
| Nicaraguan | 149 | 0.2% |
| Nigerian | 64 | 0.1% |
| Northern European | 116 | 0.2% |
| Norwegian | 1,184 | 1.7% |
| Pakistani | 213 | 0.3% |
| Palestinian | 102 | 0.2% |
| Panamanian | 101 | 0.2% |
| Paraguayan | 23 | 0.0% |
| Pennsylvania German | 14 | 0.0% |
| Peruvian | 124 | 0.2% |
| Polish | 1,341 | 2.0% |
| Portuguese | 411 | 0.6% |
| Pueblo | 117 | 0.2% |
| Puerto Rican | 95 | 0.1% |
| Romanian | 342 | 0.5% |
| Russian | 601 | 0.9% |
| Salvadoran | 275 | 0.4% |
| Samoan | 63 | 0.1% |
| Scandinavian | 253 | 0.4% |
| Scotch-Irish | 611 | 0.9% |
| Scottish | 898 | 1.3% |
| Serbian | 115 | 0.2% |
| Shoshone | 21 | 0.0% |
| Slavic | 31 | 0.1% |
| Slovak | 133 | 0.2% |
| Slovene | 25 | 0.0% |
| South American | 541 | 0.8% |
| South American Indian | 13 | 0.0% |
| Spaniard | 341 | 0.5% |
| Spanish | 434 | 0.6% |
| Sri Lankan | 2,010 | 2.9% |
| Subsaharan African | 131 | 0.2% |
| Swedish | 841 | 1.2% |
| Swiss | 158 | 0.2% |
| Syrian | 121 | 0.2% |
| Thai | 2,651 | 3.9% |
| Turkish | 9 | 0.0% |
| Ukrainian | 149 | 0.2% |
| Uruguayan | 12 | 0.0% |
| Welsh | 361 | 0.5% |
| Yugoslavian | 11 | 0.0% | View All 113 Rows |
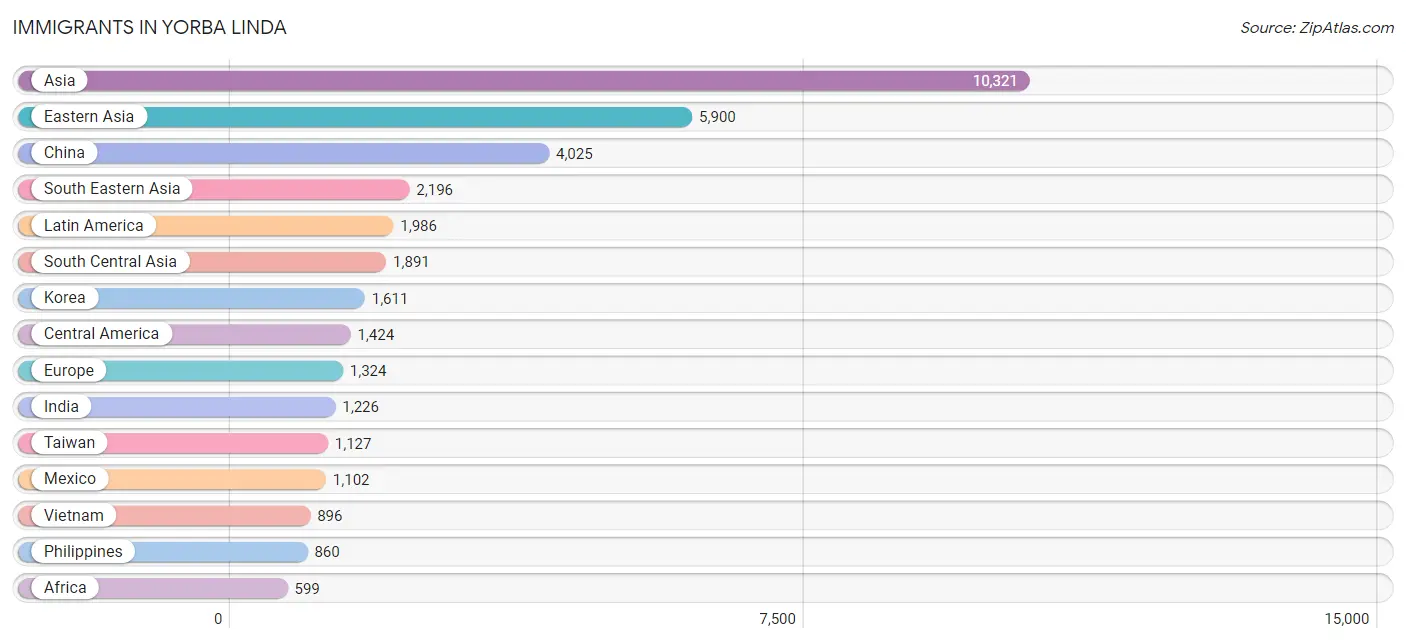
Immigrants in Yorba Linda
The most numerous immigrant groups reported in Yorba Linda came from Asia (10,321 | 15.2%), Eastern Asia (5,900 | 8.7%), China (4,025 | 5.9%), South Eastern Asia (2,196 | 3.2%), and Latin America (1,986 | 2.9%), together accounting for 35.9% of all Yorba Linda residents.
| Immigration Origin | # Population | % Population |
| Africa | 599 | 0.9% |
| Albania | 41 | 0.1% |
| Argentina | 116 | 0.2% |
| Asia | 10,321 | 15.2% |
| Australia | 56 | 0.1% |
| Bangladesh | 40 | 0.1% |
| Bolivia | 14 | 0.0% |
| Brazil | 14 | 0.0% |
| Cambodia | 18 | 0.0% |
| Canada | 433 | 0.6% |
| Caribbean | 84 | 0.1% |
| Central America | 1,424 | 2.1% |
| Chile | 69 | 0.1% |
| China | 4,025 | 5.9% |
| Colombia | 19 | 0.0% |
| Costa Rica | 16 | 0.0% |
| Cuba | 53 | 0.1% |
| Czechoslovakia | 16 | 0.0% |
| Eastern Africa | 162 | 0.2% |
| Eastern Asia | 5,900 | 8.7% |
| Eastern Europe | 488 | 0.7% |
| Ecuador | 40 | 0.1% |
| Egypt | 189 | 0.3% |
| El Salvador | 179 | 0.3% |
| England | 26 | 0.0% |
| Ethiopia | 48 | 0.1% |
| Europe | 1,324 | 1.9% |
| France | 100 | 0.2% |
| Germany | 227 | 0.3% |
| Greece | 35 | 0.1% |
| Guatemala | 53 | 0.1% |
| Hong Kong | 286 | 0.4% |
| Hungary | 17 | 0.0% |
| India | 1,226 | 1.8% |
| Indonesia | 149 | 0.2% |
| Iran | 381 | 0.6% |
| Israel | 15 | 0.0% |
| Italy | 197 | 0.3% |
| Jamaica | 31 | 0.1% |
| Japan | 264 | 0.4% |
| Jordan | 44 | 0.1% |
| Kenya | 93 | 0.1% |
| Korea | 1,611 | 2.4% |
| Latin America | 1,986 | 2.9% |
| Latvia | 10 | 0.0% |
| Lebanon | 75 | 0.1% |
| Lithuania | 9 | 0.0% |
| Malaysia | 89 | 0.1% |
| Mexico | 1,102 | 1.6% |
| Middle Africa | 9 | 0.0% |
| Moldova | 29 | 0.0% |
| Netherlands | 49 | 0.1% |
| Nicaragua | 32 | 0.1% |
| Nigeria | 35 | 0.1% |
| Northern Africa | 189 | 0.3% |
| Northern Europe | 209 | 0.3% |
| Oceania | 67 | 0.1% |
| Pakistan | 206 | 0.3% |
| Panama | 42 | 0.1% |
| Peru | 191 | 0.3% |
| Philippines | 860 | 1.3% |
| Poland | 20 | 0.0% |
| Portugal | 11 | 0.0% |
| Romania | 130 | 0.2% |
| Russia | 123 | 0.2% |
| Saudi Arabia | 17 | 0.0% |
| Scotland | 17 | 0.0% |
| Singapore | 27 | 0.0% |
| South Africa | 204 | 0.3% |
| South America | 478 | 0.7% |
| South Central Asia | 1,891 | 2.8% |
| South Eastern Asia | 2,196 | 3.2% |
| Southern Europe | 243 | 0.4% |
| Sri Lanka | 38 | 0.1% |
| Sweden | 15 | 0.0% |
| Switzerland | 8 | 0.0% |
| Syria | 109 | 0.2% |
| Taiwan | 1,127 | 1.7% |
| Thailand | 126 | 0.2% |
| Ukraine | 26 | 0.0% |
| Venezuela | 15 | 0.0% |
| Vietnam | 896 | 1.3% |
| Western Africa | 35 | 0.1% |
| Western Asia | 269 | 0.4% |
| Western Europe | 384 | 0.6% |
| Zaire | 9 | 0.0% | View All 86 Rows |
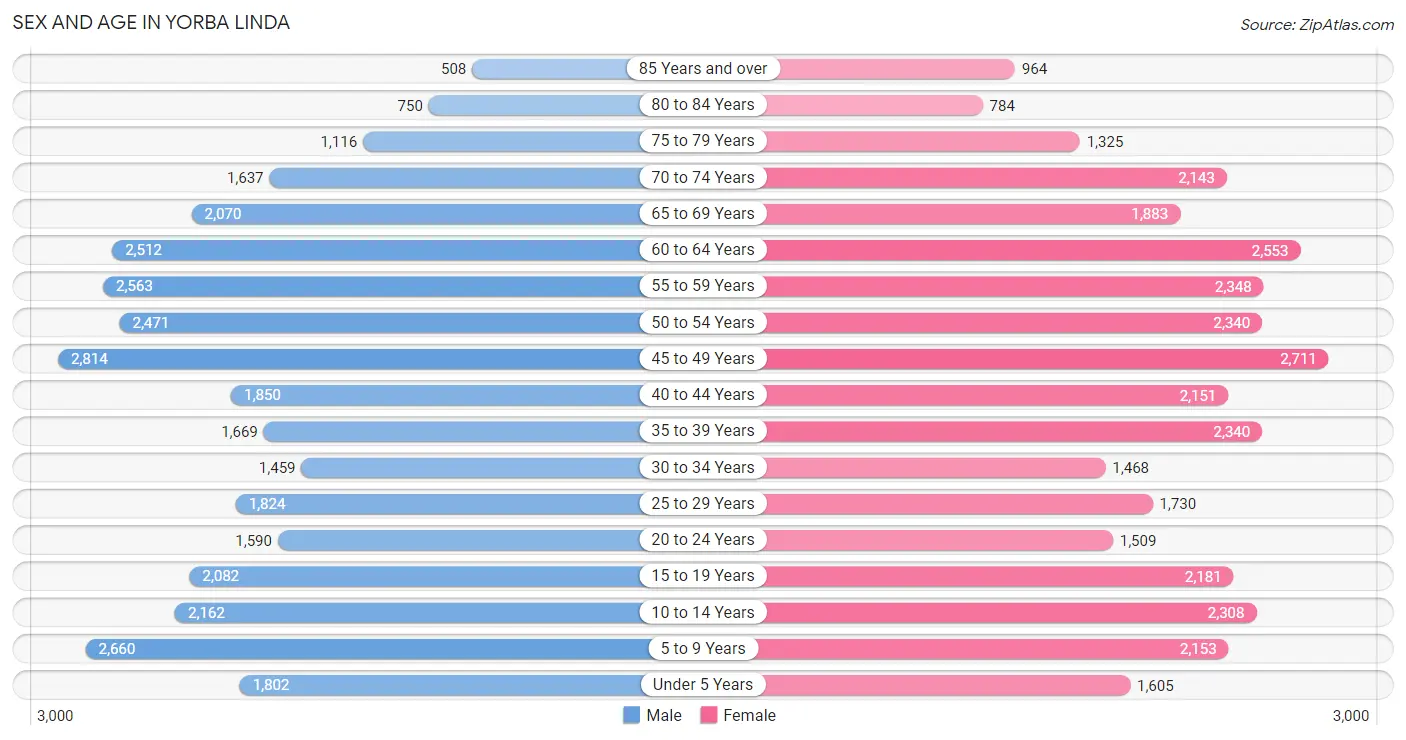
Sex and Age in Yorba Linda
Sex and Age in Yorba Linda
The most populous age groups in Yorba Linda are 45 to 49 Years (2,814 | 8.4%) for men and 45 to 49 Years (2,711 | 7.9%) for women.
| Age Bracket | Male | Female |
| Under 5 Years | 1,802 (5.4%) | 1,605 (4.6%) |
| 5 to 9 Years | 2,660 (7.9%) | 2,153 (6.2%) |
| 10 to 14 Years | 2,162 (6.5%) | 2,308 (6.7%) |
| 15 to 19 Years | 2,082 (6.2%) | 2,181 (6.3%) |
| 20 to 24 Years | 1,590 (4.7%) | 1,509 (4.4%) |
| 25 to 29 Years | 1,824 (5.4%) | 1,730 (5.0%) |
| 30 to 34 Years | 1,459 (4.3%) | 1,468 (4.3%) |
| 35 to 39 Years | 1,669 (5.0%) | 2,340 (6.8%) |
| 40 to 44 Years | 1,850 (5.5%) | 2,151 (6.2%) |
| 45 to 49 Years | 2,814 (8.4%) | 2,711 (7.9%) |
| 50 to 54 Years | 2,471 (7.4%) | 2,340 (6.8%) |
| 55 to 59 Years | 2,563 (7.6%) | 2,348 (6.8%) |
| 60 to 64 Years | 2,512 (7.5%) | 2,553 (7.4%) |
| 65 to 69 Years | 2,070 (6.2%) | 1,883 (5.5%) |
| 70 to 74 Years | 1,637 (4.9%) | 2,143 (6.2%) |
| 75 to 79 Years | 1,116 (3.3%) | 1,325 (3.8%) |
| 80 to 84 Years | 750 (2.2%) | 784 (2.3%) |
| 85 Years and over | 508 (1.5%) | 964 (2.8%) |
| Total | 33,539 (100.0%) | 34,496 (100.0%) |
Families and Households in Yorba Linda
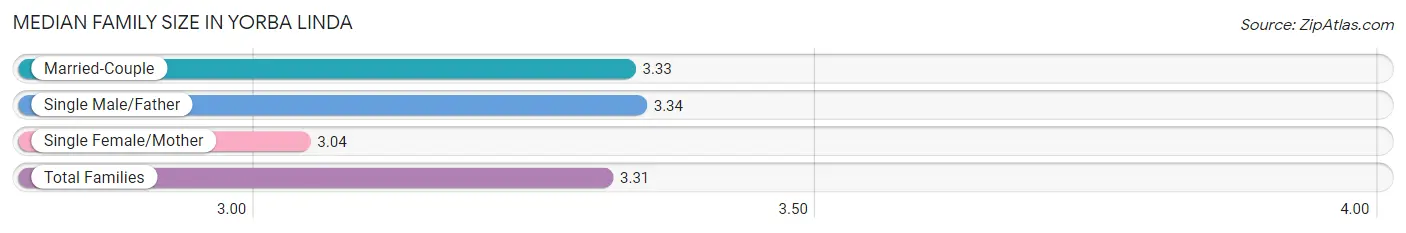
Median Family Size in Yorba Linda
The median family size in Yorba Linda is 3.31 persons per family, with single male/father families (1,046 | 5.6%) accounting for the largest median family size of 3.34 persons per family. On the other hand, single female/mother families (1,488 | 8.0%) represent the smallest median family size with 3.04 persons per family.
| Family Type | # Families | Family Size |
| Married-Couple | 16,003 (86.3%) | 3.33 |
| Single Male/Father | 1,046 (5.6%) | 3.34 |
| Single Female/Mother | 1,488 (8.0%) | 3.04 |
| Total Families | 18,537 (100.0%) | 3.31 |
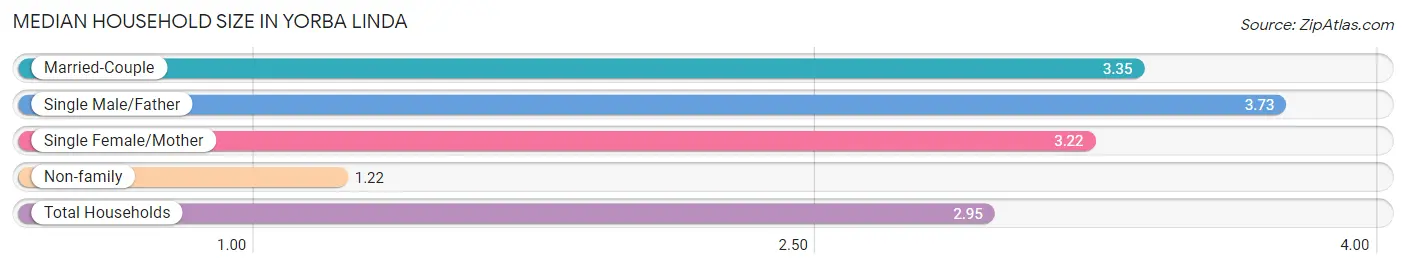
Median Household Size in Yorba Linda
The median household size in Yorba Linda is 2.95 persons per household, with single male/father households (1,046 | 4.6%) accounting for the largest median household size of 3.73 persons per household. non-family households (4,401 | 19.2%) represent the smallest median household size with 1.22 persons per household.
| Household Type | # Households | Household Size |
| Married-Couple | 16,003 (69.8%) | 3.35 |
| Single Male/Father | 1,046 (4.6%) | 3.73 |
| Single Female/Mother | 1,488 (6.5%) | 3.22 |
| Non-family | 4,401 (19.2%) | 1.22 |
| Total Households | 22,938 (100.0%) | 2.95 |
Household Size by Marriage Status in Yorba Linda
Out of a total of 22,938 households in Yorba Linda, 18,537 (80.8%) are family households, while 4,401 (19.2%) are nonfamily households. The most numerous type of family households are 2-person households, comprising 6,822, and the most common type of nonfamily households are 1-person households, comprising 3,666.
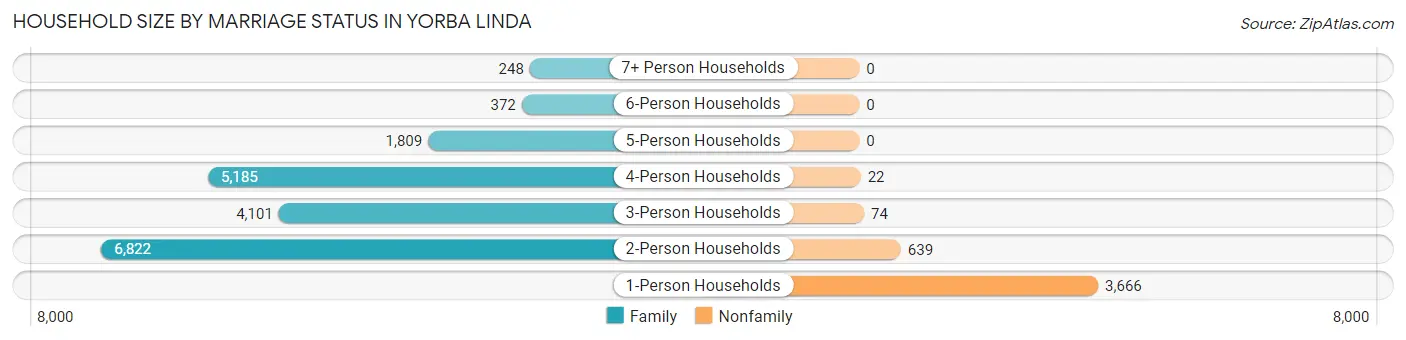
| Household Size | Family Households | Nonfamily Households |
| 1-Person Households | - | 3,666 (16.0%) |
| 2-Person Households | 6,822 (29.7%) | 639 (2.8%) |
| 3-Person Households | 4,101 (17.9%) | 74 (0.3%) |
| 4-Person Households | 5,185 (22.6%) | 22 (0.1%) |
| 5-Person Households | 1,809 (7.9%) | 0 (0.0%) |
| 6-Person Households | 372 (1.6%) | 0 (0.0%) |
| 7+ Person Households | 248 (1.1%) | 0 (0.0%) |
| Total | 18,537 (80.8%) | 4,401 (19.2%) |
Female Fertility in Yorba Linda
Fertility by Age in Yorba Linda
Average fertility rate in Yorba Linda is 41.0 births per 1,000 women. Women in the age bracket of 20 to 34 years have the highest fertility rate with 72.0 births per 1,000 women. Women in the age bracket of 20 to 34 years acount for 55.7% of all women with births.
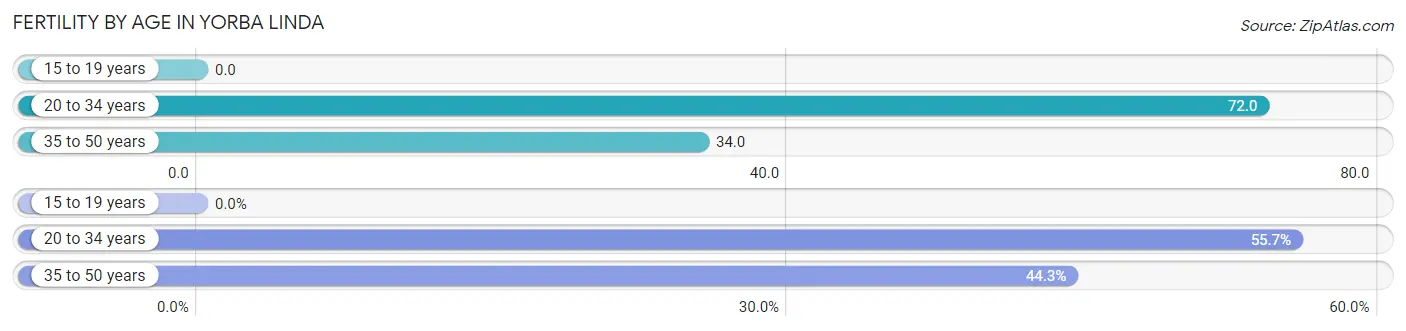
| Age Bracket | Women with Births | Births / 1,000 Women |
| 15 to 19 years | 0 (0.0%) | 0.0 |
| 20 to 34 years | 341 (55.7%) | 72.0 |
| 35 to 50 years | 271 (44.3%) | 34.0 |
| Total | 612 (100.0%) | 41.0 |
Fertility by Age by Marriage Status in Yorba Linda
97.7% of women with births (612) in Yorba Linda are married. The highest percentage of unmarried women with births falls into 20 to 34 years age bracket with 2.4% of them unmarried at the time of birth, while the lowest percentage of unmarried women with births belong to 35 to 50 years age bracket with 2.2% of them unmarried.
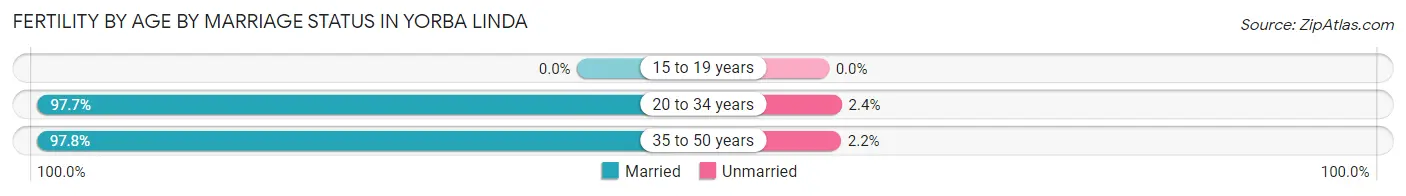
| Age Bracket | Married | Unmarried |
| 15 to 19 years | 0 (0.0%) | 0 (0.0%) |
| 20 to 34 years | 333 (97.7%) | 8 (2.4%) |
| 35 to 50 years | 265 (97.8%) | 6 (2.2%) |
| Total | 598 (97.7%) | 14 (2.3%) |
Fertility by Education in Yorba Linda
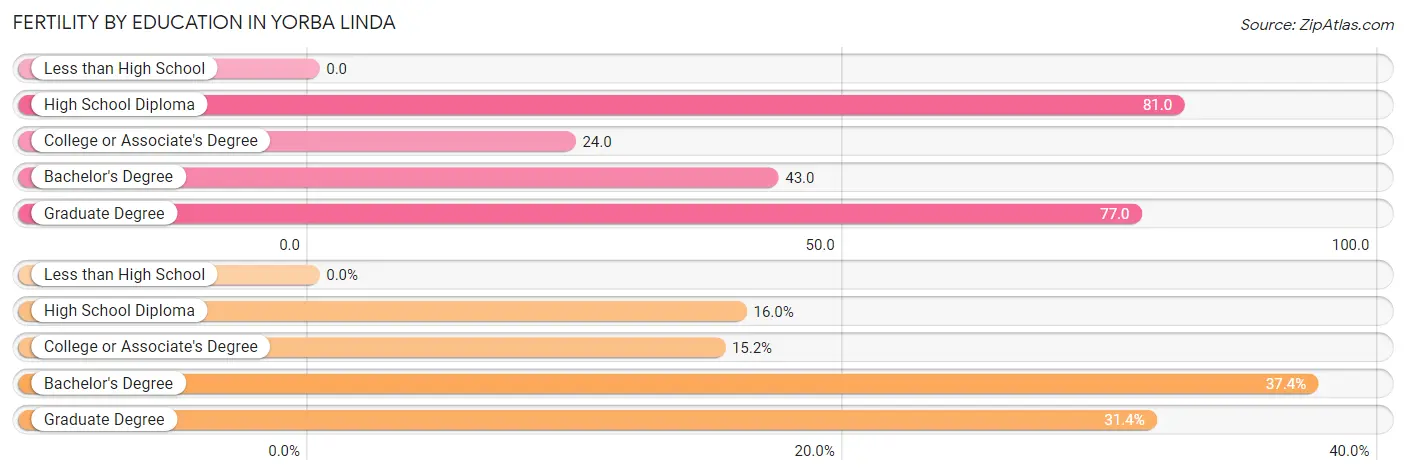
| Educational Attainment | Women with Births | Births / 1,000 Women |
| Less than High School | 0 (0.0%) | 0.0 |
| High School Diploma | 98 (16.0%) | 81.0 |
| College or Associate's Degree | 93 (15.2%) | 24.0 |
| Bachelor's Degree | 229 (37.4%) | 43.0 |
| Graduate Degree | 192 (31.4%) | 77.0 |
| Total | 612 (100.0%) | 41.0 |
Fertility by Education by Marriage Status in Yorba Linda
2.3% of women with births in Yorba Linda are unmarried. Women with the educational attainment of high school diploma are most likely to be married with 100.0% of them married at childbirth, while women with the educational attainment of college or associate's degree are least likely to be married with 6.5% of them unmarried at childbirth.
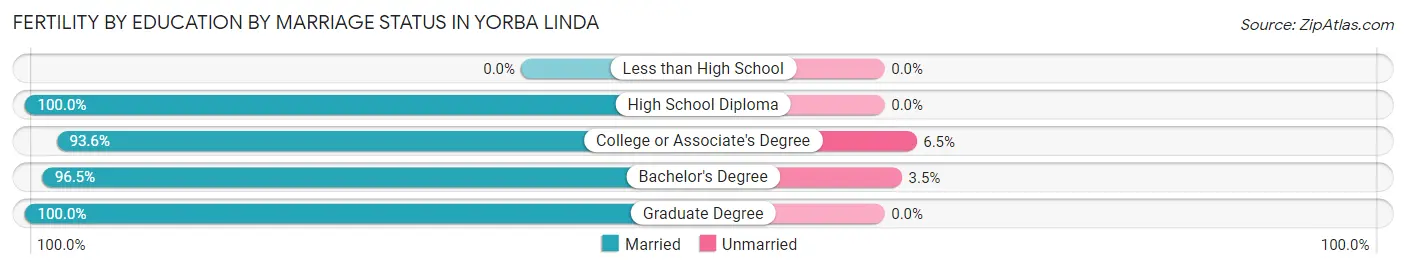
| Educational Attainment | Married | Unmarried |
| Less than High School | 0 (0.0%) | 0 (0.0%) |
| High School Diploma | 98 (100.0%) | 0 (0.0%) |
| College or Associate's Degree | 87 (93.5%) | 6 (6.5%) |
| Bachelor's Degree | 221 (96.5%) | 8 (3.5%) |
| Graduate Degree | 192 (100.0%) | 0 (0.0%) |
| Total | 598 (97.7%) | 14 (2.3%) |
Employment Characteristics in Yorba Linda
Employment by Class of Employer in Yorba Linda
Among the 31,653 employed individuals in Yorba Linda, private company employees (19,591 | 61.9%), self-employed (incorporated) (2,973 | 9.4%), and local government employees (2,807 | 8.9%) make up the most common classes of employment.
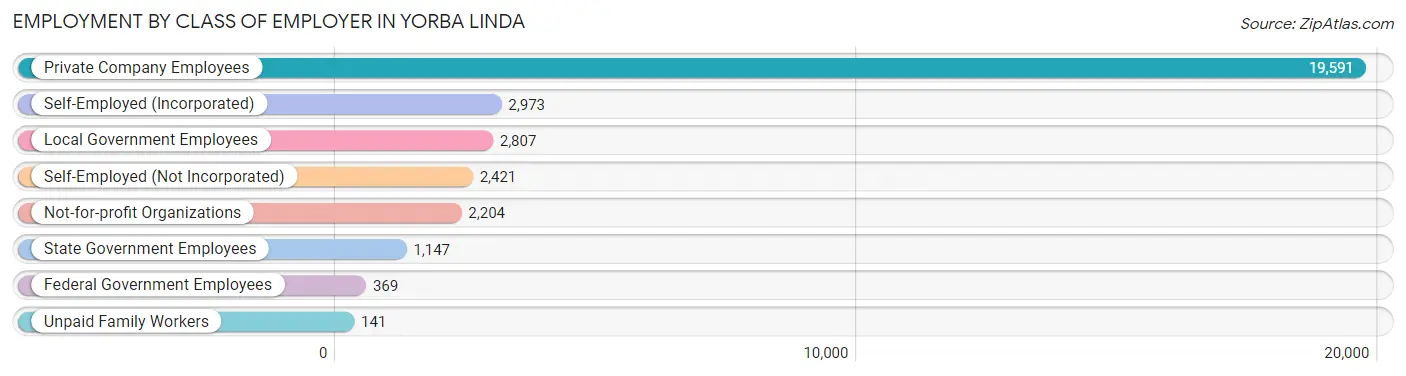
| Employer Class | # Employees | % Employees |
| Private Company Employees | 19,591 | 61.9% |
| Self-Employed (Incorporated) | 2,973 | 9.4% |
| Self-Employed (Not Incorporated) | 2,421 | 7.6% |
| Not-for-profit Organizations | 2,204 | 7.0% |
| Local Government Employees | 2,807 | 8.9% |
| State Government Employees | 1,147 | 3.6% |
| Federal Government Employees | 369 | 1.2% |
| Unpaid Family Workers | 141 | 0.4% |
| Total | 31,653 | 100.0% |
Employment Status by Age in Yorba Linda
According to the labor force statistics for Yorba Linda, out of the total population over 16 years of age (54,486), 62.8% or 34,217 individuals are in the labor force, with 4.6% or 1,574 of them unemployed. The age group with the highest labor force participation rate is 25 to 29 years, with 87.3% or 3,103 individuals in the labor force. Within the labor force, the 16 to 19 years age range has the highest percentage of unemployed individuals, with 16.3% or 190 of them being unemployed.
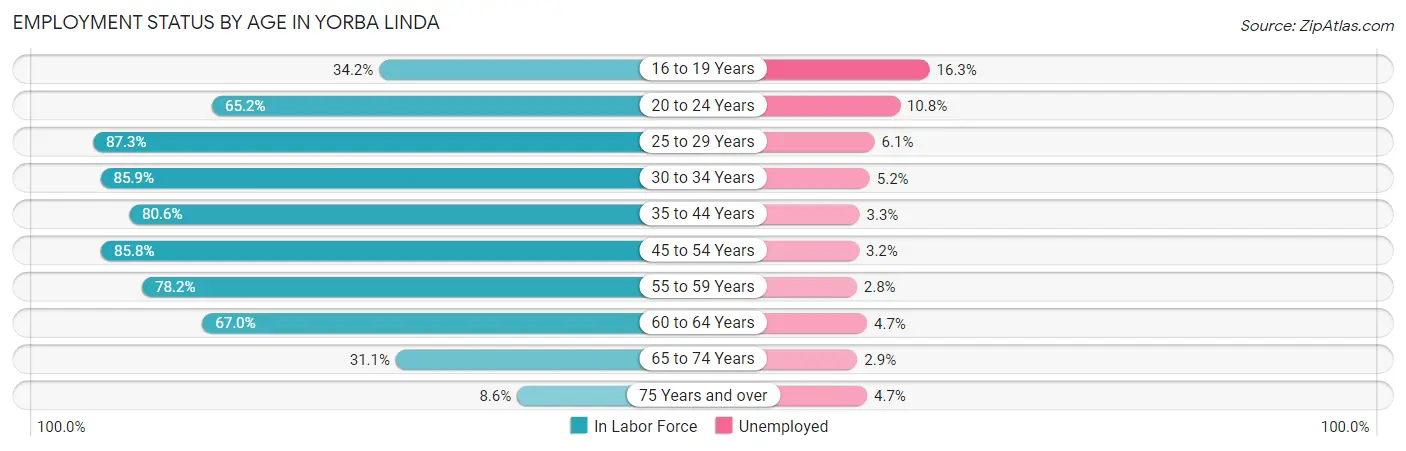
| Age Bracket | In Labor Force | Unemployed |
| 16 to 19 Years | 1,164 (34.2%) | 190 (16.3%) |
| 20 to 24 Years | 2,021 (65.2%) | 218 (10.8%) |
| 25 to 29 Years | 3,103 (87.3%) | 189 (6.1%) |
| 30 to 34 Years | 2,514 (85.9%) | 131 (5.2%) |
| 35 to 44 Years | 6,456 (80.6%) | 213 (3.3%) |
| 45 to 54 Years | 8,868 (85.8%) | 284 (3.2%) |
| 55 to 59 Years | 3,840 (78.2%) | 108 (2.8%) |
| 60 to 64 Years | 3,394 (67.0%) | 160 (4.7%) |
| 65 to 74 Years | 2,405 (31.1%) | 70 (2.9%) |
| 75 Years and over | 468 (8.6%) | 22 (4.7%) |
| Total | 34,217 (62.8%) | 1,574 (4.6%) |
Employment Status by Educational Attainment in Yorba Linda
According to labor force statistics for Yorba Linda, 81.0% of individuals (28,190) out of the total population between 25 and 64 years of age (34,803) are in the labor force, with 3.9% or 1,099 of them being unemployed. The group with the highest labor force participation rate are those with the educational attainment of bachelor's degree or higher, with 84.5% or 17,500 individuals in the labor force. Within the labor force, individuals with less than high school education have the highest percentage of unemployment, with 9.7% or 61 of them being unemployed.
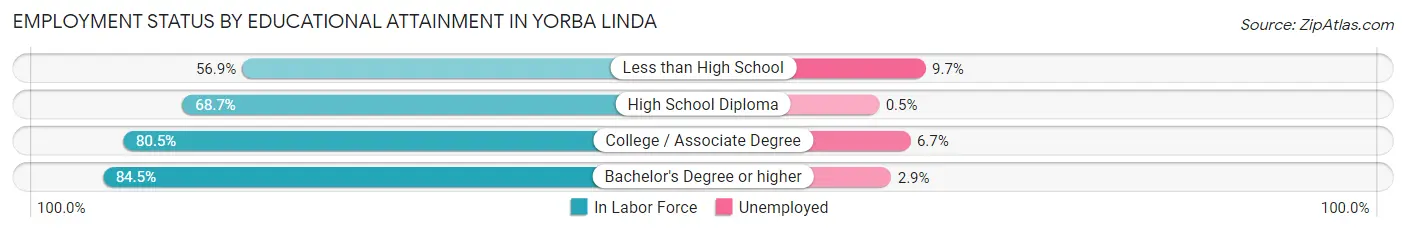
| Educational Attainment | In Labor Force | Unemployed |
| Less than High School | 630 (56.9%) | 107 (9.7%) |
| High School Diploma | 2,351 (68.7%) | 17 (0.5%) |
| College / Associate Degree | 7,698 (80.5%) | 641 (6.7%) |
| Bachelor's Degree or higher | 17,500 (84.5%) | 601 (2.9%) |
| Total | 28,190 (81.0%) | 1,357 (3.9%) |
Employment Occupations by Sex in Yorba Linda
Management, Business, Science and Arts Occupations
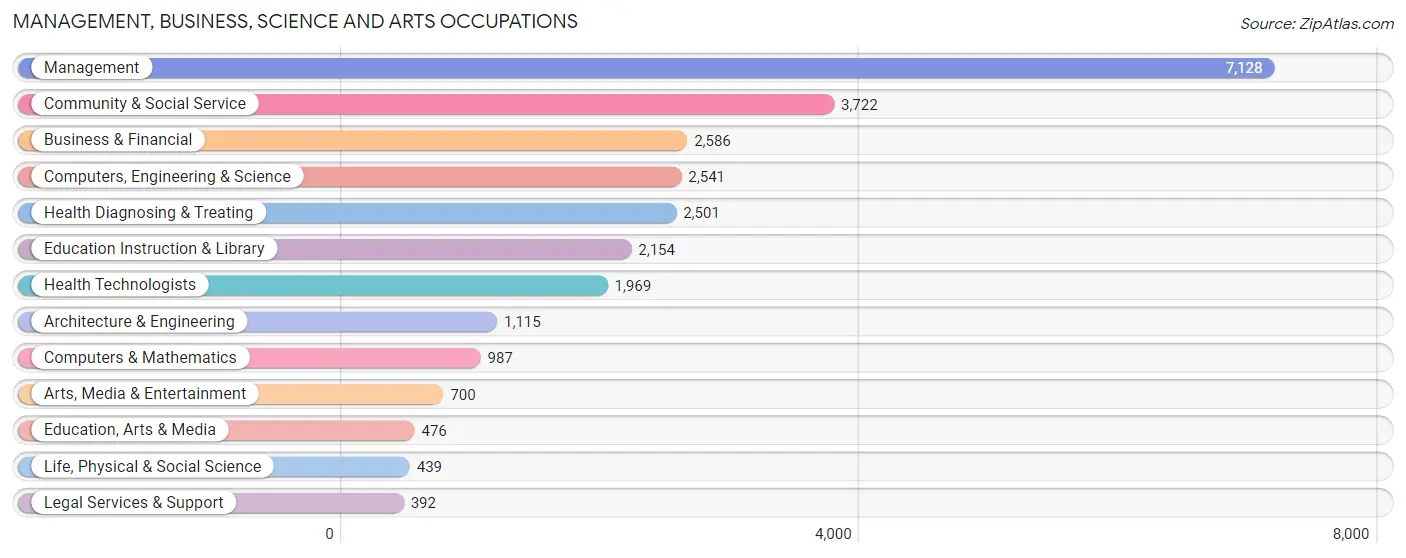
The most common Management, Business, Science and Arts occupations in Yorba Linda are Management (7,128 | 21.8%), Community & Social Service (3,722 | 11.4%), Business & Financial (2,586 | 7.9%), Computers, Engineering & Science (2,541 | 7.8%), and Health Diagnosing & Treating (2,501 | 7.7%).
Management, Business, Science and Arts Occupations by Sex
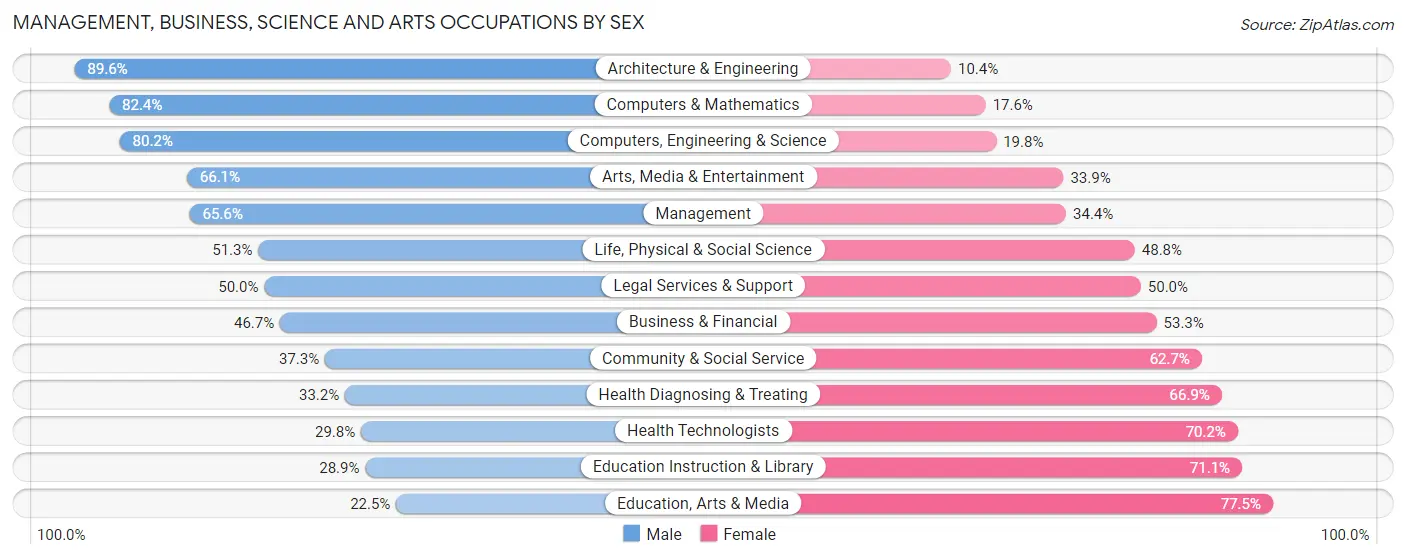
Within the Management, Business, Science and Arts occupations in Yorba Linda, the most male-oriented occupations are Architecture & Engineering (89.6%), Computers & Mathematics (82.4%), and Computers, Engineering & Science (80.2%), while the most female-oriented occupations are Education, Arts & Media (77.5%), Education Instruction & Library (71.1%), and Health Technologists (70.2%).
| Occupation | Male | Female |
| Management | 4,675 (65.6%) | 2,453 (34.4%) |
| Business & Financial | 1,208 (46.7%) | 1,378 (53.3%) |
| Computers, Engineering & Science | 2,037 (80.2%) | 504 (19.8%) |
| Computers & Mathematics | 813 (82.4%) | 174 (17.6%) |
| Architecture & Engineering | 999 (89.6%) | 116 (10.4%) |
| Life, Physical & Social Science | 225 (51.2%) | 214 (48.7%) |
| Community & Social Service | 1,389 (37.3%) | 2,333 (62.7%) |
| Education, Arts & Media | 107 (22.5%) | 369 (77.5%) |
| Legal Services & Support | 196 (50.0%) | 196 (50.0%) |
| Education Instruction & Library | 623 (28.9%) | 1,531 (71.1%) |
| Arts, Media & Entertainment | 463 (66.1%) | 237 (33.9%) |
| Health Diagnosing & Treating | 829 (33.2%) | 1,672 (66.8%) |
| Health Technologists | 587 (29.8%) | 1,382 (70.2%) |
| Total (Category) | 10,138 (54.9%) | 8,340 (45.1%) |
| Total (Overall) | 17,667 (54.1%) | 14,959 (45.9%) |
Services Occupations
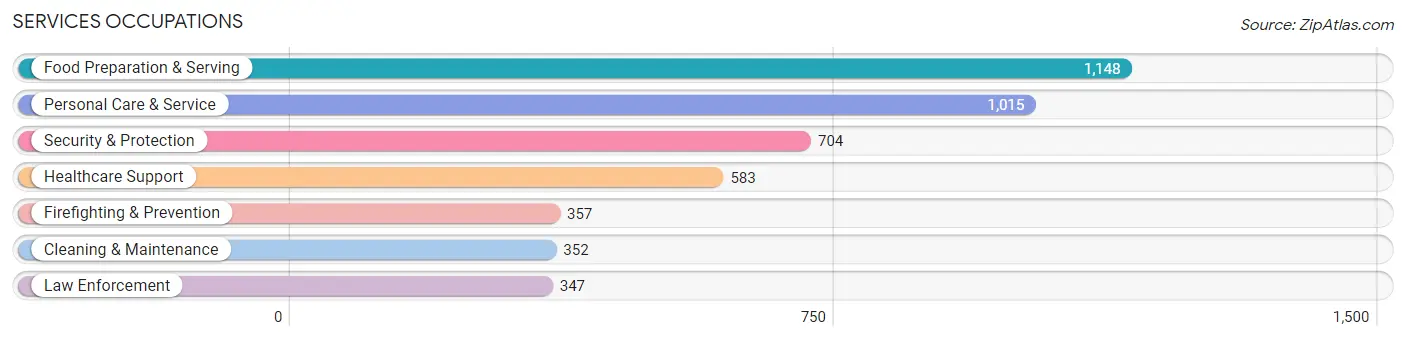
The most common Services occupations in Yorba Linda are Food Preparation & Serving (1,148 | 3.5%), Personal Care & Service (1,015 | 3.1%), Security & Protection (704 | 2.2%), Healthcare Support (583 | 1.8%), and Firefighting & Prevention (357 | 1.1%).
Services Occupations by Sex
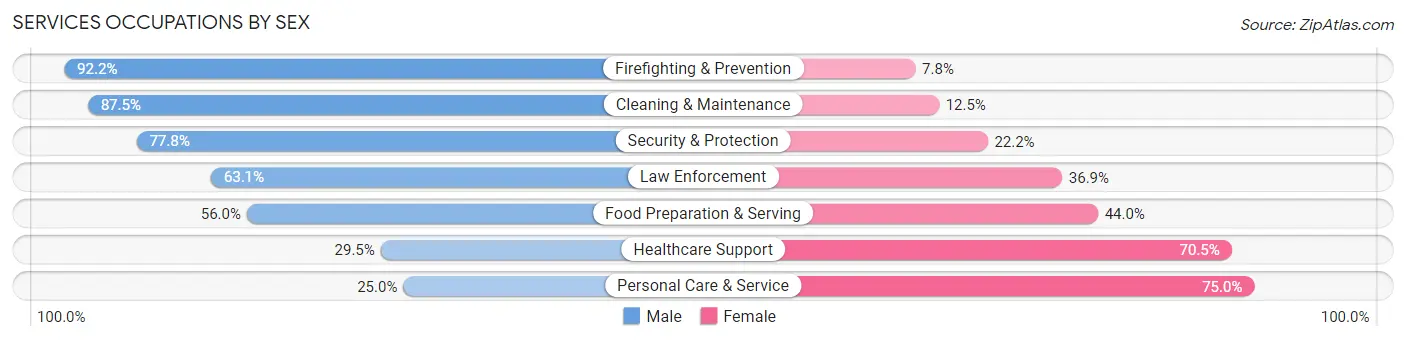
Within the Services occupations in Yorba Linda, the most male-oriented occupations are Firefighting & Prevention (92.2%), Cleaning & Maintenance (87.5%), and Security & Protection (77.8%), while the most female-oriented occupations are Personal Care & Service (75.0%), Healthcare Support (70.5%), and Food Preparation & Serving (44.0%).
| Occupation | Male | Female |
| Healthcare Support | 172 (29.5%) | 411 (70.5%) |
| Security & Protection | 548 (77.8%) | 156 (22.2%) |
| Firefighting & Prevention | 329 (92.2%) | 28 (7.8%) |
| Law Enforcement | 219 (63.1%) | 128 (36.9%) |
| Food Preparation & Serving | 643 (56.0%) | 505 (44.0%) |
| Cleaning & Maintenance | 308 (87.5%) | 44 (12.5%) |
| Personal Care & Service | 254 (25.0%) | 761 (75.0%) |
| Total (Category) | 1,925 (50.6%) | 1,877 (49.4%) |
| Total (Overall) | 17,667 (54.1%) | 14,959 (45.9%) |
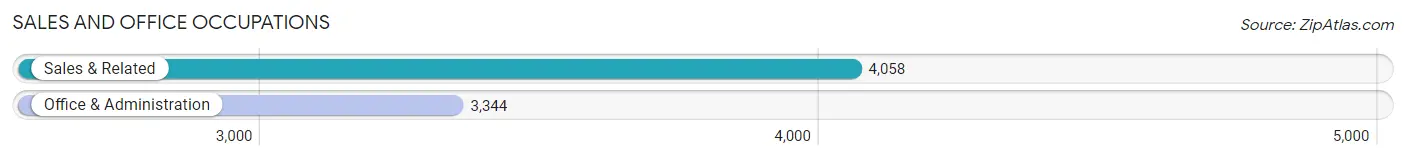
Sales and Office Occupations
The most common Sales and Office occupations in Yorba Linda are Sales & Related (4,058 | 12.4%), and Office & Administration (3,344 | 10.2%).
Sales and Office Occupations by Sex
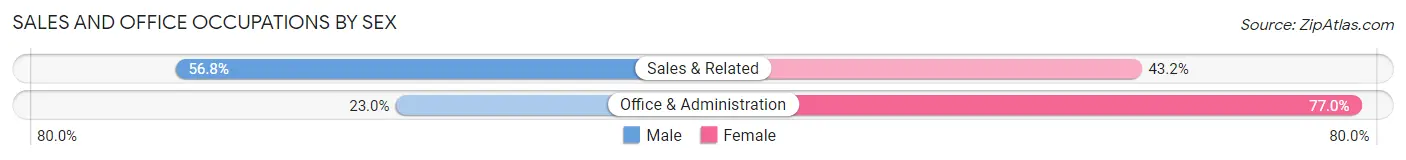
| Occupation | Male | Female |
| Sales & Related | 2,304 (56.8%) | 1,754 (43.2%) |
| Office & Administration | 768 (23.0%) | 2,576 (77.0%) |
| Total (Category) | 3,072 (41.5%) | 4,330 (58.5%) |
| Total (Overall) | 17,667 (54.1%) | 14,959 (45.9%) |
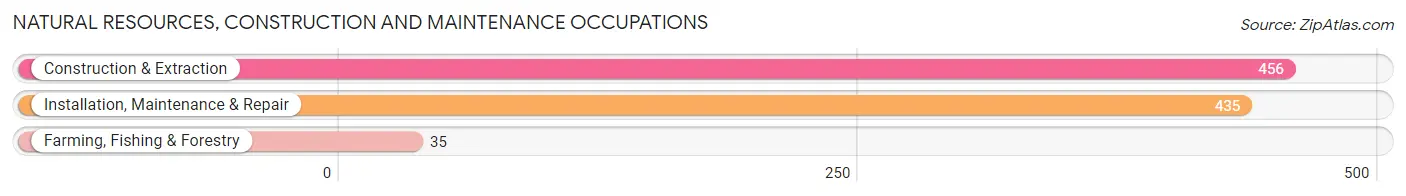
Natural Resources, Construction and Maintenance Occupations
The most common Natural Resources, Construction and Maintenance occupations in Yorba Linda are Construction & Extraction (456 | 1.4%), Installation, Maintenance & Repair (435 | 1.3%), and Farming, Fishing & Forestry (35 | 0.1%).
Natural Resources, Construction and Maintenance Occupations by Sex
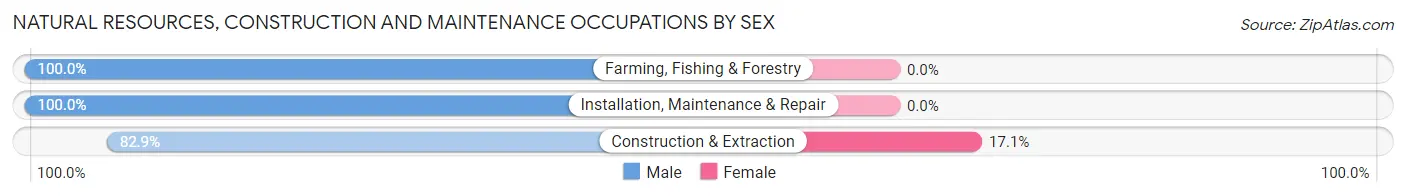
| Occupation | Male | Female |
| Farming, Fishing & Forestry | 35 (100.0%) | 0 (0.0%) |
| Construction & Extraction | 378 (82.9%) | 78 (17.1%) |
| Installation, Maintenance & Repair | 435 (100.0%) | 0 (0.0%) |
| Total (Category) | 848 (91.6%) | 78 (8.4%) |
| Total (Overall) | 17,667 (54.1%) | 14,959 (45.9%) |
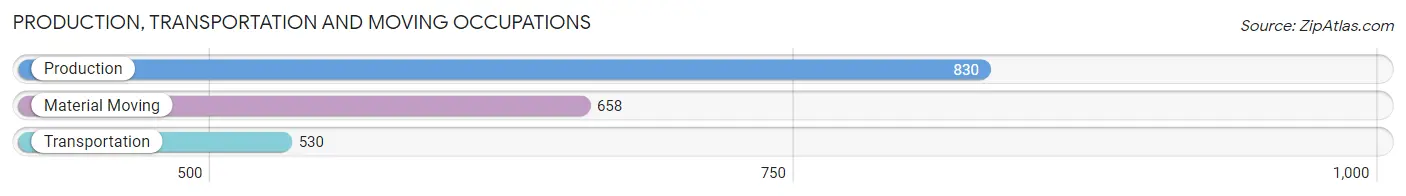
Production, Transportation and Moving Occupations
The most common Production, Transportation and Moving occupations in Yorba Linda are Production (830 | 2.5%), Material Moving (658 | 2.0%), and Transportation (530 | 1.6%).
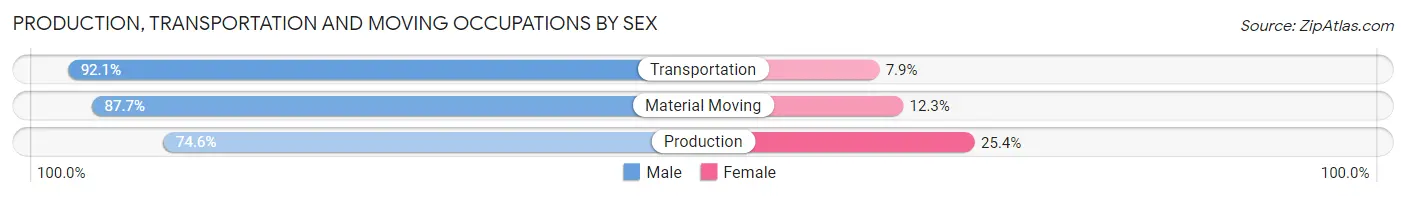
Production, Transportation and Moving Occupations by Sex
| Occupation | Male | Female |
| Production | 619 (74.6%) | 211 (25.4%) |
| Transportation | 488 (92.1%) | 42 (7.9%) |
| Material Moving | 577 (87.7%) | 81 (12.3%) |
| Total (Category) | 1,684 (83.5%) | 334 (16.6%) |
| Total (Overall) | 17,667 (54.1%) | 14,959 (45.9%) |
Employment Industries by Sex in Yorba Linda
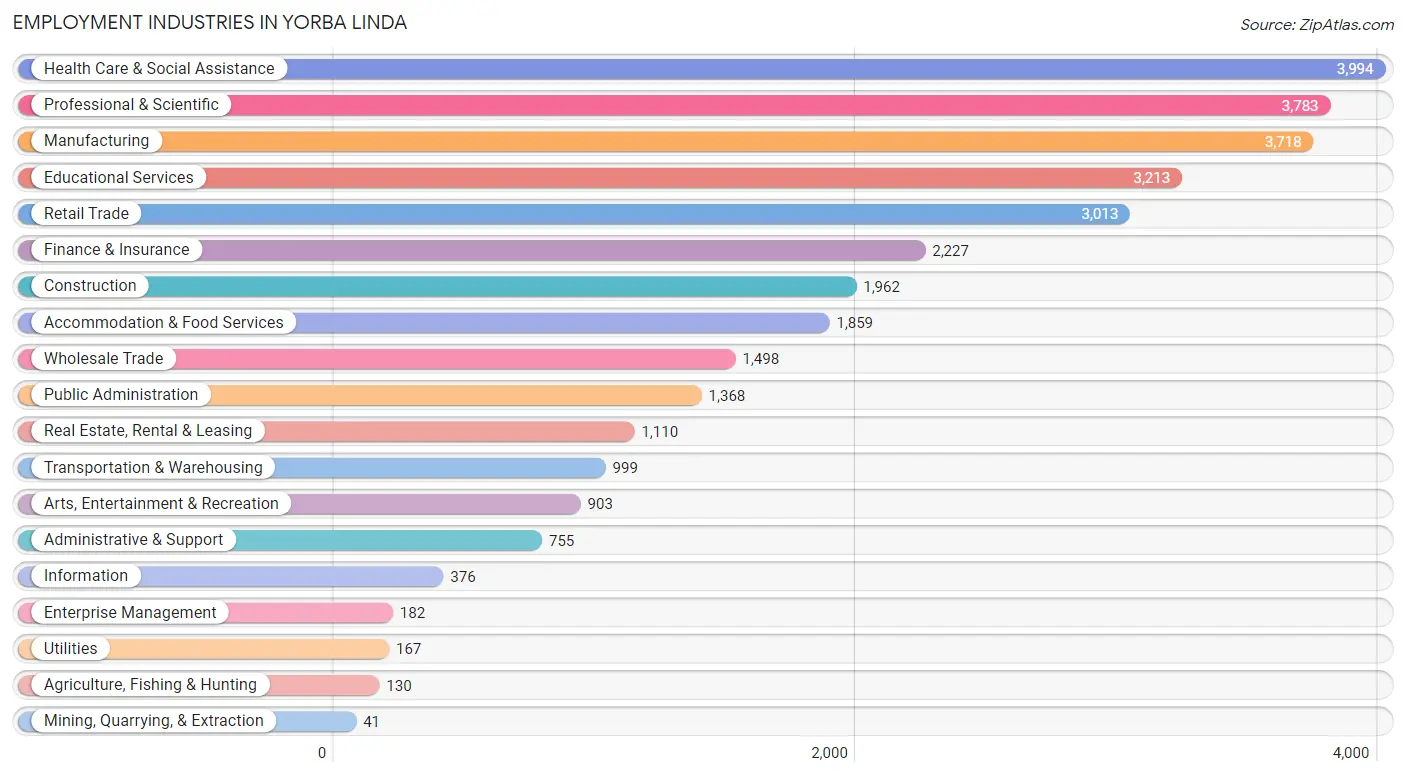
Employment Industries in Yorba Linda
The major employment industries in Yorba Linda include Health Care & Social Assistance (3,994 | 12.2%), Professional & Scientific (3,783 | 11.6%), Manufacturing (3,718 | 11.4%), Educational Services (3,213 | 9.9%), and Retail Trade (3,013 | 9.2%).
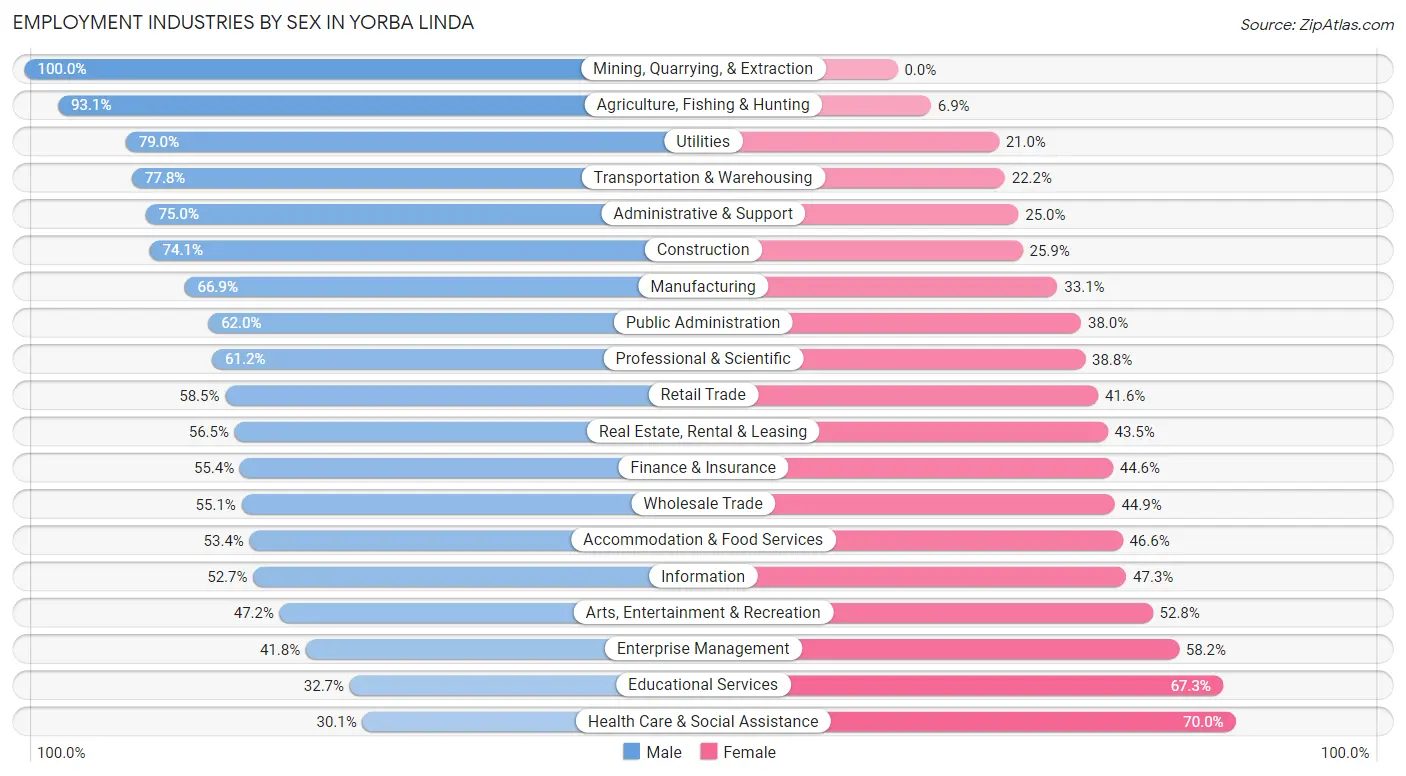
Employment Industries by Sex in Yorba Linda
The Yorba Linda industries that see more men than women are Mining, Quarrying, & Extraction (100.0%), Agriculture, Fishing & Hunting (93.1%), and Utilities (79.0%), whereas the industries that tend to have a higher number of women are Health Care & Social Assistance (70.0%), Educational Services (67.3%), and Enterprise Management (58.2%).
| Industry | Male | Female |
| Agriculture, Fishing & Hunting | 121 (93.1%) | 9 (6.9%) |
| Mining, Quarrying, & Extraction | 41 (100.0%) | 0 (0.0%) |
| Construction | 1,454 (74.1%) | 508 (25.9%) |
| Manufacturing | 2,487 (66.9%) | 1,231 (33.1%) |
| Wholesale Trade | 825 (55.1%) | 673 (44.9%) |
| Retail Trade | 1,761 (58.5%) | 1,252 (41.5%) |
| Transportation & Warehousing | 777 (77.8%) | 222 (22.2%) |
| Utilities | 132 (79.0%) | 35 (21.0%) |
| Information | 198 (52.7%) | 178 (47.3%) |
| Finance & Insurance | 1,234 (55.4%) | 993 (44.6%) |
| Real Estate, Rental & Leasing | 627 (56.5%) | 483 (43.5%) |
| Professional & Scientific | 2,314 (61.2%) | 1,469 (38.8%) |
| Enterprise Management | 76 (41.8%) | 106 (58.2%) |
| Administrative & Support | 566 (75.0%) | 189 (25.0%) |
| Educational Services | 1,050 (32.7%) | 2,163 (67.3%) |
| Health Care & Social Assistance | 1,200 (30.0%) | 2,794 (70.0%) |
| Arts, Entertainment & Recreation | 426 (47.2%) | 477 (52.8%) |
| Accommodation & Food Services | 993 (53.4%) | 866 (46.6%) |
| Public Administration | 848 (62.0%) | 520 (38.0%) |
| Total | 17,667 (54.1%) | 14,959 (45.9%) |
Education in Yorba Linda
School Enrollment in Yorba Linda
The most common levels of schooling among the 18,366 students in Yorba Linda are elementary school (4,226 | 23.0%), college / undergraduate (3,945 | 21.5%), and high school (3,847 | 20.9%).
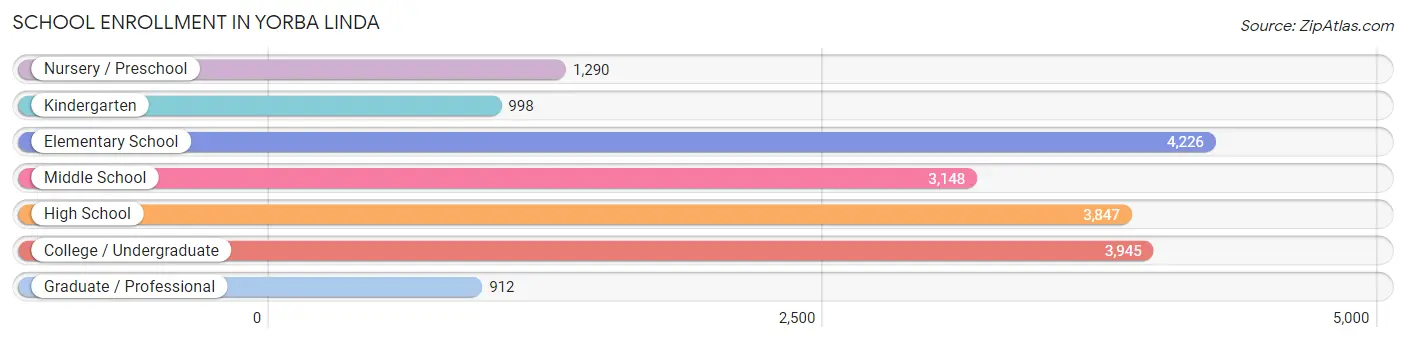
| School Level | # Students | % Students |
| Nursery / Preschool | 1,290 | 7.0% |
| Kindergarten | 998 | 5.4% |
| Elementary School | 4,226 | 23.0% |
| Middle School | 3,148 | 17.1% |
| High School | 3,847 | 20.9% |
| College / Undergraduate | 3,945 | 21.5% |
| Graduate / Professional | 912 | 5.0% |
| Total | 18,366 | 100.0% |
School Enrollment by Age by Funding Source in Yorba Linda
Out of a total of 18,366 students who are enrolled in schools in Yorba Linda, 3,049 (16.6%) attend a private institution, while the remaining 15,317 (83.4%) are enrolled in public schools. The age group of 3 to 4 year olds has the highest likelihood of being enrolled in private schools, with 675 (61.7% in the age bracket) enrolled. Conversely, the age group of 18 to 19 year olds has the lowest likelihood of being enrolled in a private school, with 1,300 (94.8% in the age bracket) attending a public institution.
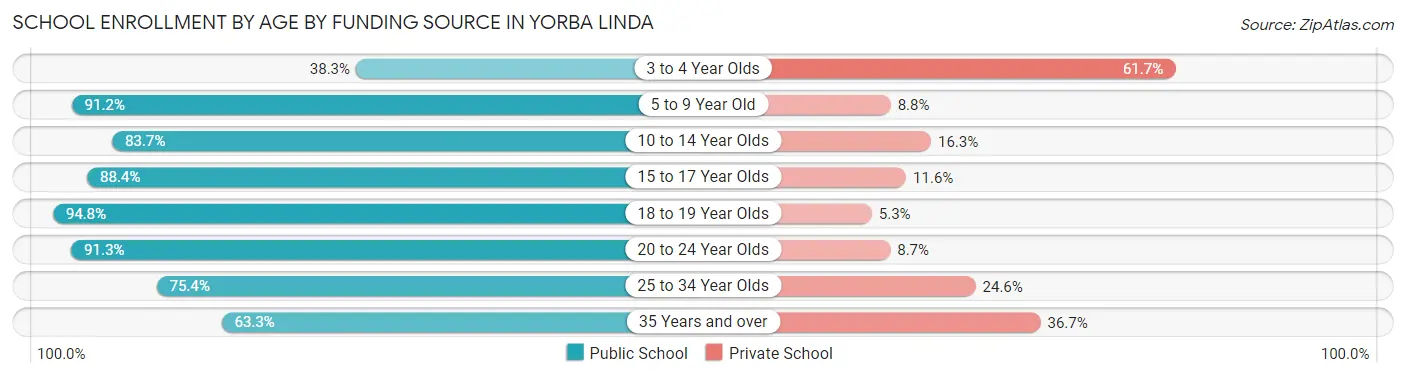
| Age Bracket | Public School | Private School |
| 3 to 4 Year Olds | 419 (38.3%) | 675 (61.7%) |
| 5 to 9 Year Old | 4,261 (91.2%) | 409 (8.8%) |
| 10 to 14 Year Olds | 3,686 (83.7%) | 717 (16.3%) |
| 15 to 17 Year Olds | 2,451 (88.4%) | 323 (11.6%) |
| 18 to 19 Year Olds | 1,300 (94.8%) | 72 (5.2%) |
| 20 to 24 Year Olds | 1,579 (91.3%) | 150 (8.7%) |
| 25 to 34 Year Olds | 893 (75.4%) | 291 (24.6%) |
| 35 Years and over | 722 (63.3%) | 418 (36.7%) |
| Total | 15,317 (83.4%) | 3,049 (16.6%) |
Educational Attainment by Field of Study in Yorba Linda
Business (6,840 | 24.5%), engineering (3,045 | 10.9%), social sciences (2,444 | 8.7%), science & technology (2,250 | 8.1%), and arts & humanities (2,016 | 7.2%) are the most common fields of study among 27,950 individuals in Yorba Linda who have obtained a bachelor's degree or higher.
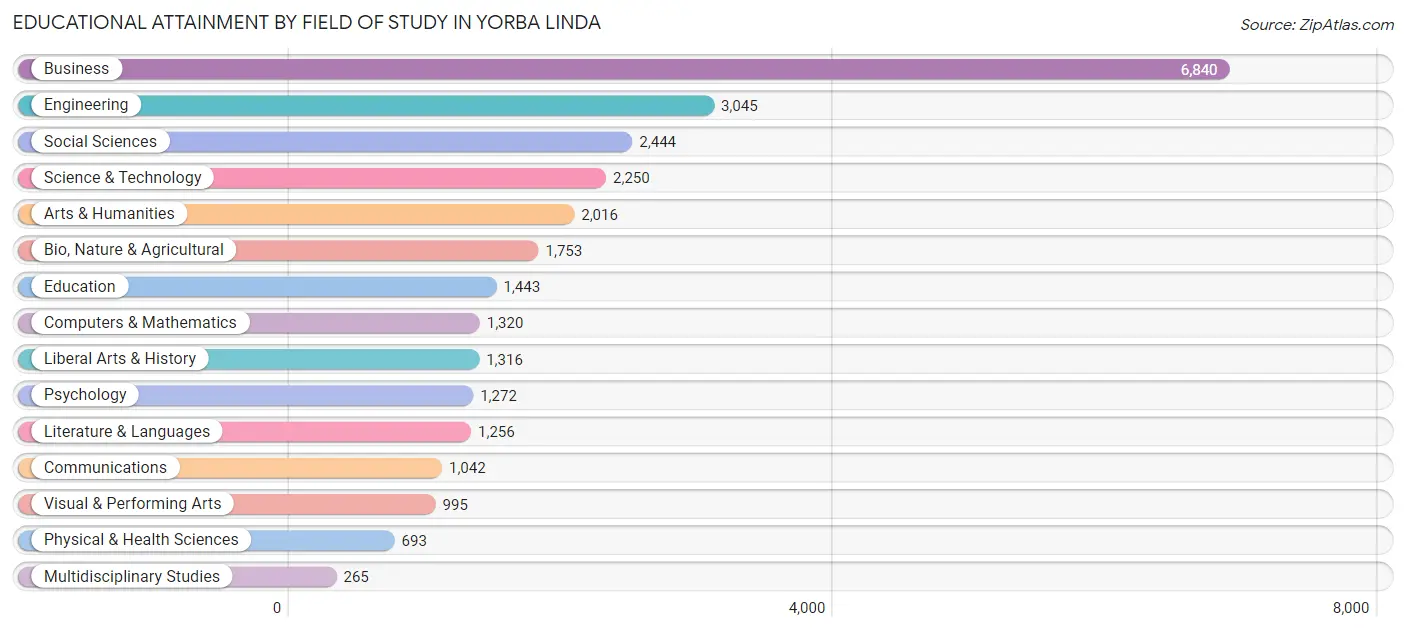
| Field of Study | # Graduates | % Graduates |
| Computers & Mathematics | 1,320 | 4.7% |
| Bio, Nature & Agricultural | 1,753 | 6.3% |
| Physical & Health Sciences | 693 | 2.5% |
| Psychology | 1,272 | 4.5% |
| Social Sciences | 2,444 | 8.7% |
| Engineering | 3,045 | 10.9% |
| Multidisciplinary Studies | 265 | 0.9% |
| Science & Technology | 2,250 | 8.1% |
| Business | 6,840 | 24.5% |
| Education | 1,443 | 5.2% |
| Literature & Languages | 1,256 | 4.5% |
| Liberal Arts & History | 1,316 | 4.7% |
| Visual & Performing Arts | 995 | 3.6% |
| Communications | 1,042 | 3.7% |
| Arts & Humanities | 2,016 | 7.2% |
| Total | 27,950 | 100.0% |
Transportation & Commute in Yorba Linda
Vehicle Availability by Sex in Yorba Linda
The most prevalent vehicle ownership categories in Yorba Linda are males with 2 vehicles (7,112, accounting for 41.1%) and females with 2 vehicles (5,796, making up 49.7%).
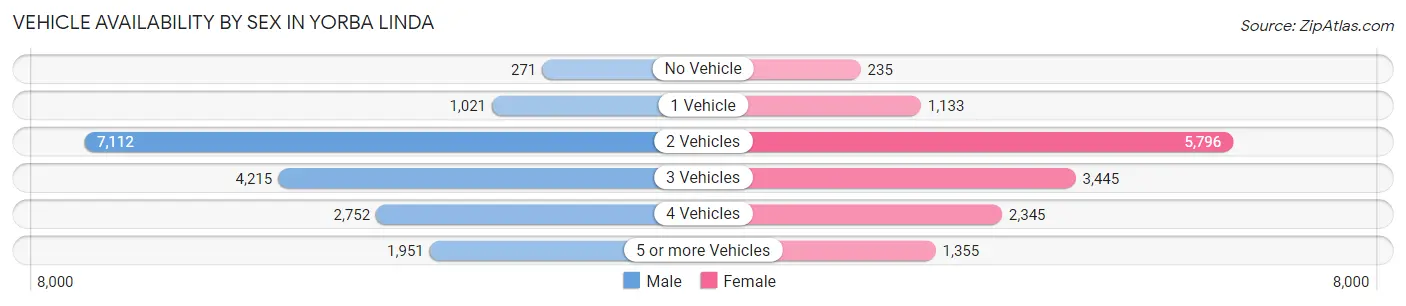
| Vehicles Available | Male | Female |
| No Vehicle | 271 (1.6%) | 235 (1.6%) |
| 1 Vehicle | 1,021 (5.9%) | 1,133 (7.9%) |
| 2 Vehicles | 7,112 (41.1%) | 5,796 (40.5%) |
| 3 Vehicles | 4,215 (24.3%) | 3,445 (24.1%) |
| 4 Vehicles | 2,752 (15.9%) | 2,345 (16.4%) |
| 5 or more Vehicles | 1,951 (11.3%) | 1,355 (9.5%) |
| Total | 17,322 (100.0%) | 14,309 (100.0%) |
Commute Time in Yorba Linda
The most frequently occuring commute durations in Yorba Linda are 30 to 34 minutes (3,994 commuters, 15.4%), 45 to 59 minutes (3,233 commuters, 12.5%), and 20 to 24 minutes (2,852 commuters, 11.0%).
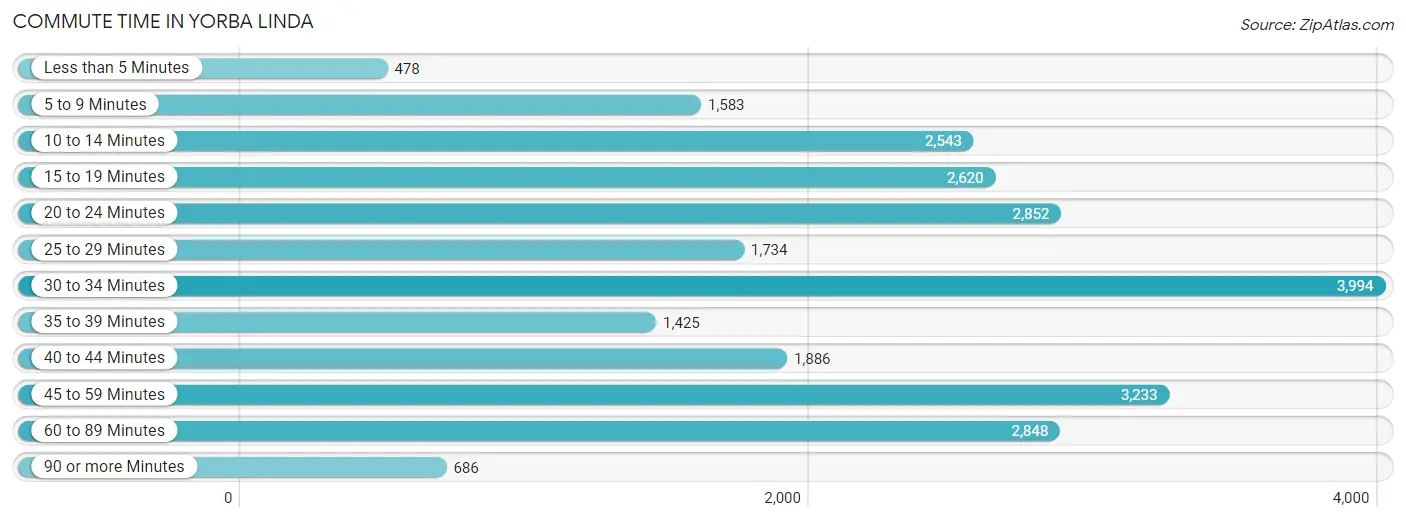
| Commute Time | # Commuters | % Commuters |
| Less than 5 Minutes | 478 | 1.8% |
| 5 to 9 Minutes | 1,583 | 6.1% |
| 10 to 14 Minutes | 2,543 | 9.8% |
| 15 to 19 Minutes | 2,620 | 10.1% |
| 20 to 24 Minutes | 2,852 | 11.0% |
| 25 to 29 Minutes | 1,734 | 6.7% |
| 30 to 34 Minutes | 3,994 | 15.4% |
| 35 to 39 Minutes | 1,425 | 5.5% |
| 40 to 44 Minutes | 1,886 | 7.3% |
| 45 to 59 Minutes | 3,233 | 12.5% |
| 60 to 89 Minutes | 2,848 | 11.0% |
| 90 or more Minutes | 686 | 2.6% |
Commute Time by Sex in Yorba Linda
The most common commute times in Yorba Linda are 30 to 34 minutes (2,282 commuters, 15.7%) for males and 30 to 34 minutes (1,712 commuters, 15.1%) for females.
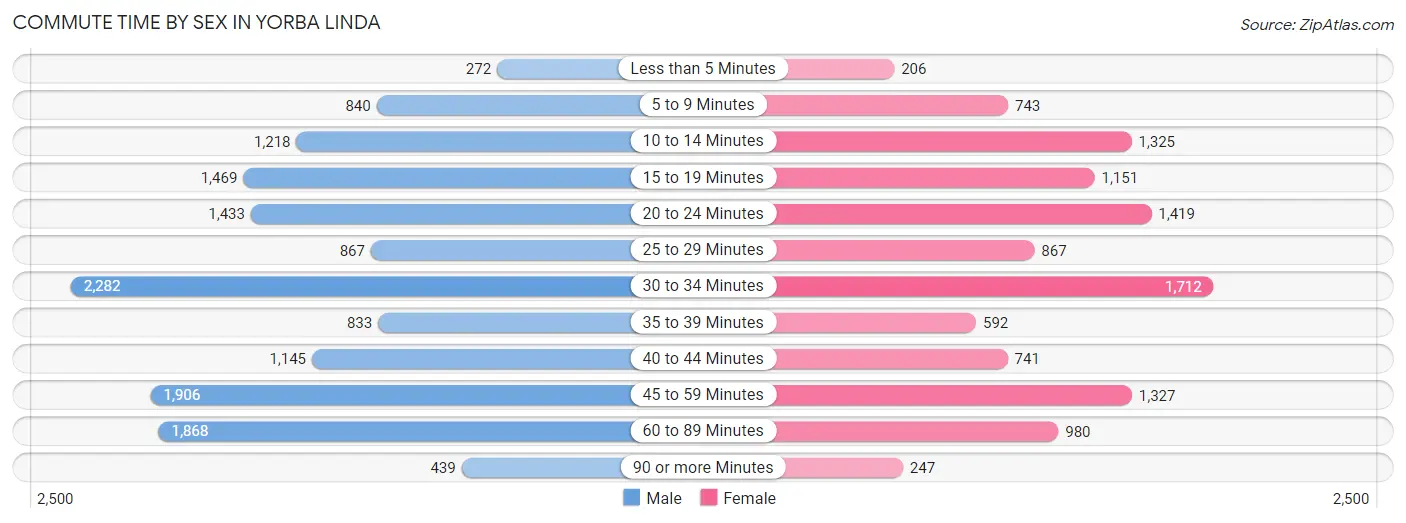
| Commute Time | Male | Female |
| Less than 5 Minutes | 272 (1.9%) | 206 (1.8%) |
| 5 to 9 Minutes | 840 (5.8%) | 743 (6.6%) |
| 10 to 14 Minutes | 1,218 (8.4%) | 1,325 (11.7%) |
| 15 to 19 Minutes | 1,469 (10.1%) | 1,151 (10.2%) |
| 20 to 24 Minutes | 1,433 (9.8%) | 1,419 (12.6%) |
| 25 to 29 Minutes | 867 (5.9%) | 867 (7.7%) |
| 30 to 34 Minutes | 2,282 (15.7%) | 1,712 (15.1%) |
| 35 to 39 Minutes | 833 (5.7%) | 592 (5.2%) |
| 40 to 44 Minutes | 1,145 (7.9%) | 741 (6.6%) |
| 45 to 59 Minutes | 1,906 (13.1%) | 1,327 (11.7%) |
| 60 to 89 Minutes | 1,868 (12.8%) | 980 (8.7%) |
| 90 or more Minutes | 439 (3.0%) | 247 (2.2%) |
Time of Departure to Work by Sex in Yorba Linda
The most frequent times of departure to work in Yorba Linda are 8:00 AM to 8:29 AM (2,118, 14.5%) for males and 7:30 AM to 7:59 AM (1,551, 13.7%) for females.
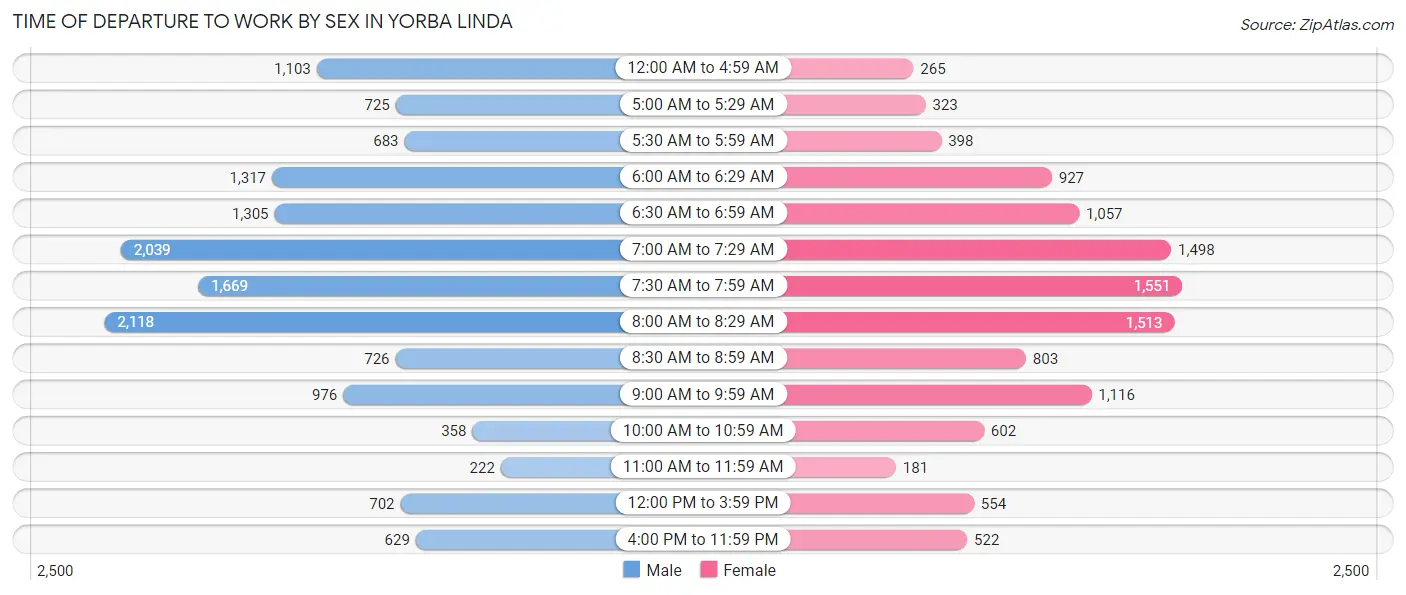
| Time of Departure | Male | Female |
| 12:00 AM to 4:59 AM | 1,103 (7.6%) | 265 (2.3%) |
| 5:00 AM to 5:29 AM | 725 (5.0%) | 323 (2.9%) |
| 5:30 AM to 5:59 AM | 683 (4.7%) | 398 (3.5%) |
| 6:00 AM to 6:29 AM | 1,317 (9.0%) | 927 (8.2%) |
| 6:30 AM to 6:59 AM | 1,305 (9.0%) | 1,057 (9.3%) |
| 7:00 AM to 7:29 AM | 2,039 (14.0%) | 1,498 (13.2%) |
| 7:30 AM to 7:59 AM | 1,669 (11.5%) | 1,551 (13.7%) |
| 8:00 AM to 8:29 AM | 2,118 (14.5%) | 1,513 (13.4%) |
| 8:30 AM to 8:59 AM | 726 (5.0%) | 803 (7.1%) |
| 9:00 AM to 9:59 AM | 976 (6.7%) | 1,116 (9.9%) |
| 10:00 AM to 10:59 AM | 358 (2.5%) | 602 (5.3%) |
| 11:00 AM to 11:59 AM | 222 (1.5%) | 181 (1.6%) |
| 12:00 PM to 3:59 PM | 702 (4.8%) | 554 (4.9%) |
| 4:00 PM to 11:59 PM | 629 (4.3%) | 522 (4.6%) |
| Total | 14,572 (100.0%) | 11,310 (100.0%) |
Housing Occupancy in Yorba Linda
Occupancy by Ownership in Yorba Linda
Of the total 22,938 dwellings in Yorba Linda, owner-occupied units account for 18,964 (82.7%), while renter-occupied units make up 3,974 (17.3%).
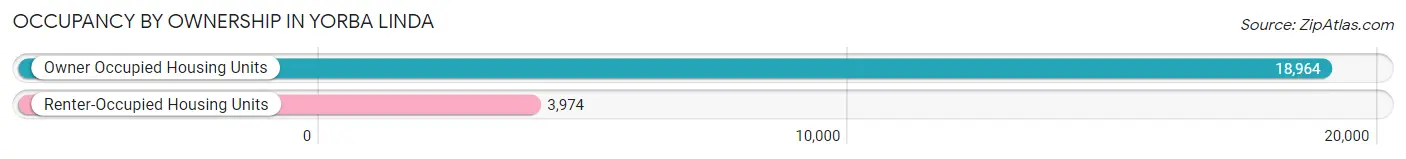
| Occupancy | # Housing Units | % Housing Units |
| Owner Occupied Housing Units | 18,964 | 82.7% |
| Renter-Occupied Housing Units | 3,974 | 17.3% |
| Total Occupied Housing Units | 22,938 | 100.0% |
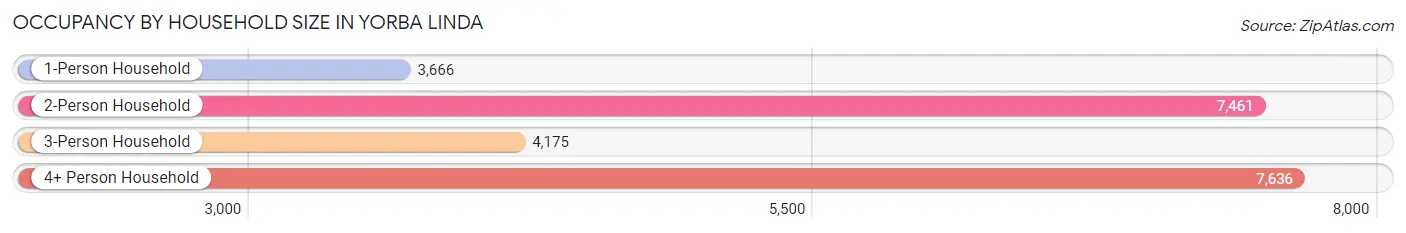
Occupancy by Household Size in Yorba Linda
| Household Size | # Housing Units | % Housing Units |
| 1-Person Household | 3,666 | 16.0% |
| 2-Person Household | 7,461 | 32.5% |
| 3-Person Household | 4,175 | 18.2% |
| 4+ Person Household | 7,636 | 33.3% |
| Total Housing Units | 22,938 | 100.0% |
Occupancy by Ownership by Household Size in Yorba Linda
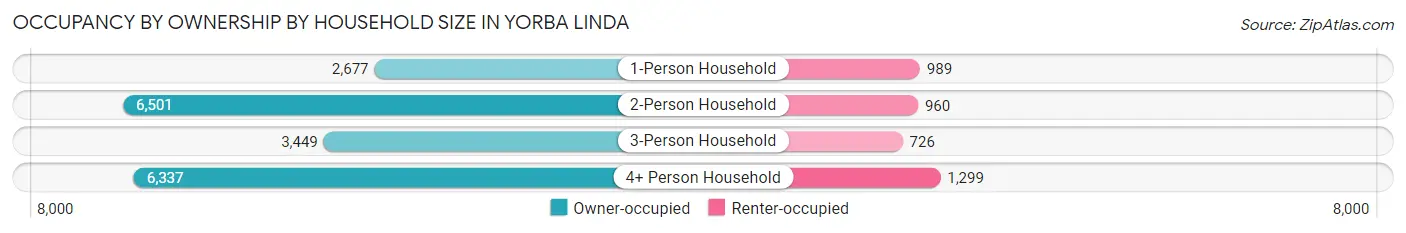
| Household Size | Owner-occupied | Renter-occupied |
| 1-Person Household | 2,677 (73.0%) | 989 (27.0%) |
| 2-Person Household | 6,501 (87.1%) | 960 (12.9%) |
| 3-Person Household | 3,449 (82.6%) | 726 (17.4%) |
| 4+ Person Household | 6,337 (83.0%) | 1,299 (17.0%) |
| Total Housing Units | 18,964 (82.7%) | 3,974 (17.3%) |
Occupancy by Educational Attainment in Yorba Linda
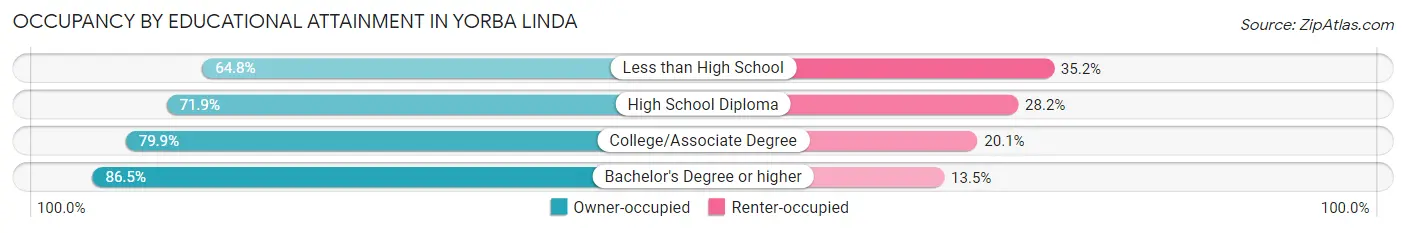
| Household Size | Owner-occupied | Renter-occupied |
| Less than High School | 465 (64.8%) | 253 (35.2%) |
| High School Diploma | 1,452 (71.9%) | 569 (28.1%) |
| College/Associate Degree | 5,205 (79.9%) | 1,307 (20.1%) |
| Bachelor's Degree or higher | 11,842 (86.5%) | 1,845 (13.5%) |
Occupancy by Age of Householder in Yorba Linda
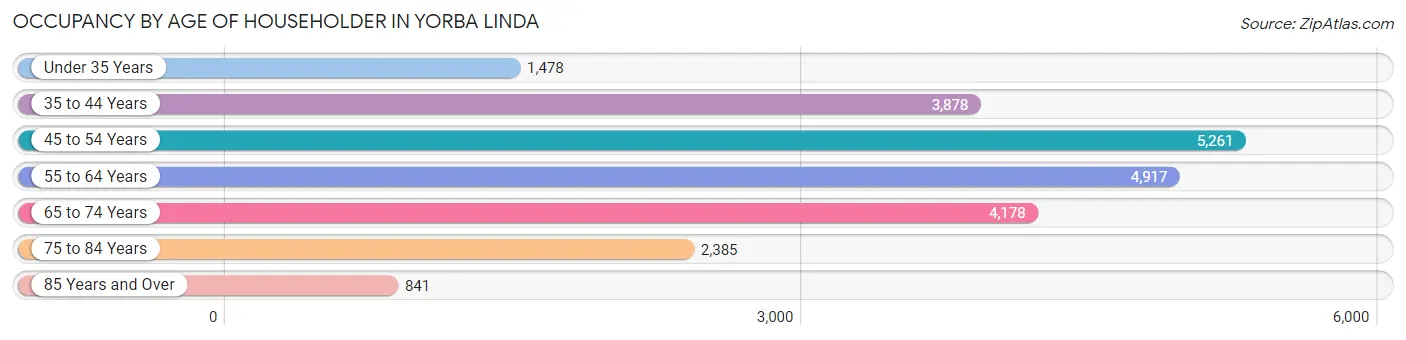
| Age Bracket | # Households | % Households |
| Under 35 Years | 1,478 | 6.4% |
| 35 to 44 Years | 3,878 | 16.9% |
| 45 to 54 Years | 5,261 | 22.9% |
| 55 to 64 Years | 4,917 | 21.4% |
| 65 to 74 Years | 4,178 | 18.2% |
| 75 to 84 Years | 2,385 | 10.4% |
| 85 Years and Over | 841 | 3.7% |
| Total | 22,938 | 100.0% |
Housing Finances in Yorba Linda
Median Income by Occupancy in Yorba Linda
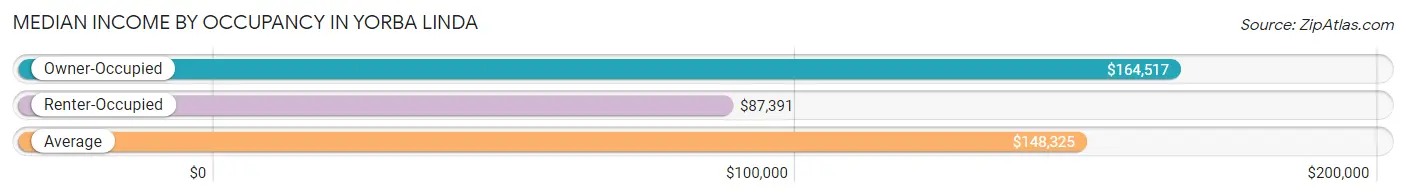
| Occupancy Type | # Households | Median Income |
| Owner-Occupied | 18,964 (82.7%) | $164,517 |
| Renter-Occupied | 3,974 (17.3%) | $87,391 |
| Average | 22,938 (100.0%) | $148,325 |
Occupancy by Householder Income Bracket in Yorba Linda
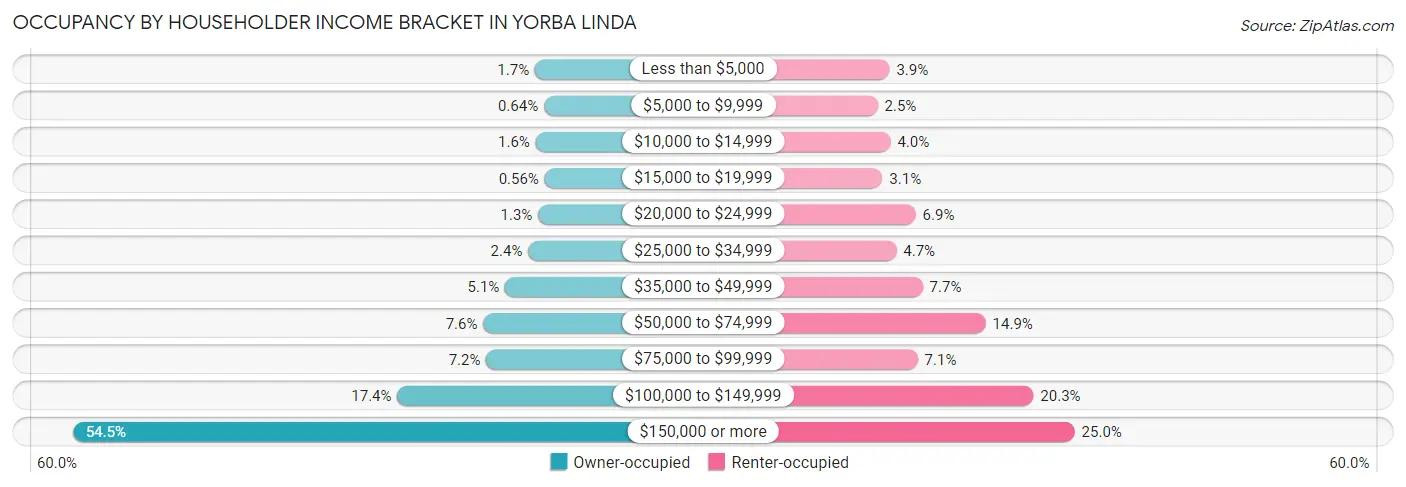
| Income Bracket | Owner-occupied | Renter-occupied |
| Less than $5,000 | 316 (1.7%) | 154 (3.9%) |
| $5,000 to $9,999 | 121 (0.6%) | 100 (2.5%) |
| $10,000 to $14,999 | 301 (1.6%) | 159 (4.0%) |
| $15,000 to $19,999 | 106 (0.6%) | 122 (3.1%) |
| $20,000 to $24,999 | 249 (1.3%) | 273 (6.9%) |
| $25,000 to $34,999 | 463 (2.4%) | 185 (4.7%) |
| $35,000 to $49,999 | 963 (5.1%) | 305 (7.7%) |
| $50,000 to $74,999 | 1,437 (7.6%) | 591 (14.9%) |
| $75,000 to $99,999 | 1,372 (7.2%) | 282 (7.1%) |
| $100,000 to $149,999 | 3,300 (17.4%) | 808 (20.3%) |
| $150,000 or more | 10,336 (54.5%) | 995 (25.0%) |
| Total | 18,964 (100.0%) | 3,974 (100.0%) |
Monthly Housing Cost Tiers in Yorba Linda
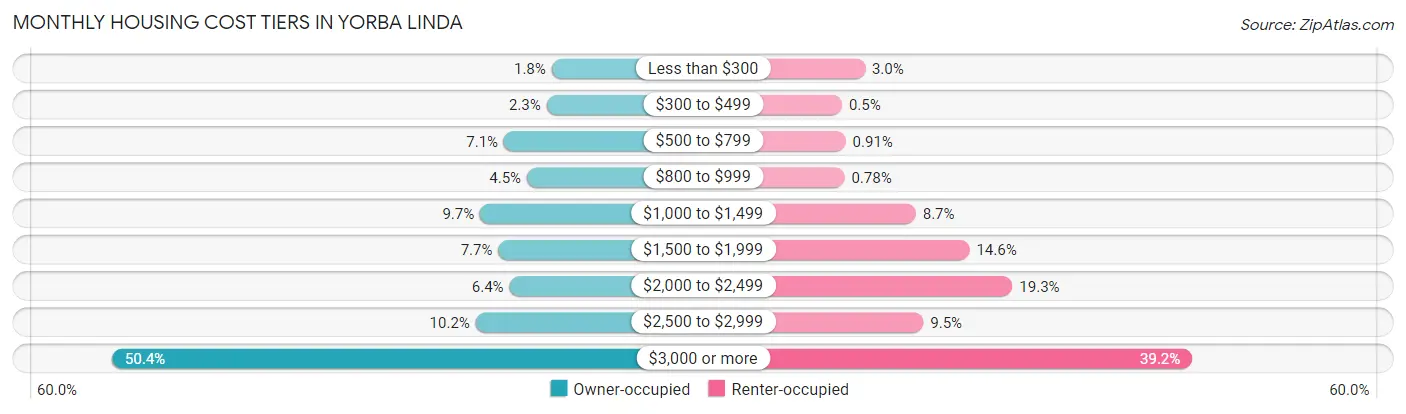
| Monthly Cost | Owner-occupied | Renter-occupied |
| Less than $300 | 337 (1.8%) | 121 (3.0%) |
| $300 to $499 | 444 (2.3%) | 20 (0.5%) |
| $500 to $799 | 1,337 (7.0%) | 36 (0.9%) |
| $800 to $999 | 856 (4.5%) | 31 (0.8%) |
| $1,000 to $1,499 | 1,838 (9.7%) | 344 (8.7%) |
| $1,500 to $1,999 | 1,454 (7.7%) | 580 (14.6%) |
| $2,000 to $2,499 | 1,221 (6.4%) | 768 (19.3%) |
| $2,500 to $2,999 | 1,929 (10.2%) | 377 (9.5%) |
| $3,000 or more | 9,548 (50.3%) | 1,557 (39.2%) |
| Total | 18,964 (100.0%) | 3,974 (100.0%) |
Physical Housing Characteristics in Yorba Linda
Housing Structures in Yorba Linda
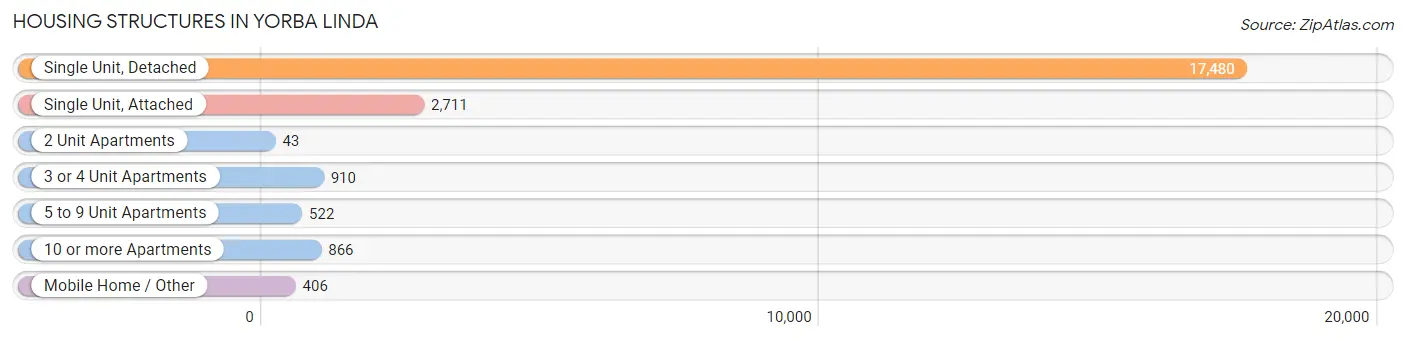
| Structure Type | # Housing Units | % Housing Units |
| Single Unit, Detached | 17,480 | 76.2% |
| Single Unit, Attached | 2,711 | 11.8% |
| 2 Unit Apartments | 43 | 0.2% |
| 3 or 4 Unit Apartments | 910 | 4.0% |
| 5 to 9 Unit Apartments | 522 | 2.3% |
| 10 or more Apartments | 866 | 3.8% |
| Mobile Home / Other | 406 | 1.8% |
| Total | 22,938 | 100.0% |
Housing Structures by Occupancy in Yorba Linda
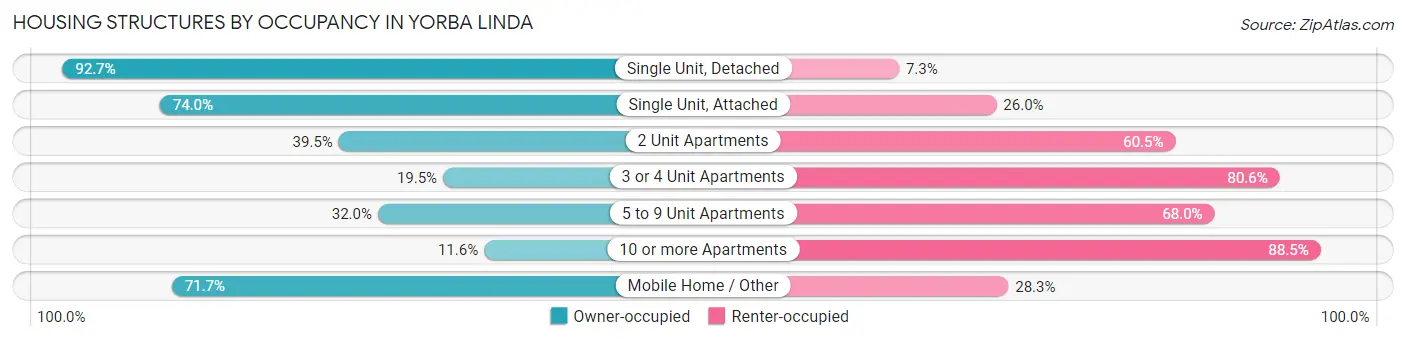
| Structure Type | Owner-occupied | Renter-occupied |
| Single Unit, Detached | 16,207 (92.7%) | 1,273 (7.3%) |
| Single Unit, Attached | 2,005 (74.0%) | 706 (26.0%) |
| 2 Unit Apartments | 17 (39.5%) | 26 (60.5%) |
| 3 or 4 Unit Apartments | 177 (19.5%) | 733 (80.5%) |
| 5 to 9 Unit Apartments | 167 (32.0%) | 355 (68.0%) |
| 10 or more Apartments | 100 (11.6%) | 766 (88.4%) |
| Mobile Home / Other | 291 (71.7%) | 115 (28.3%) |
| Total | 18,964 (82.7%) | 3,974 (17.3%) |
Housing Structures by Number of Rooms in Yorba Linda
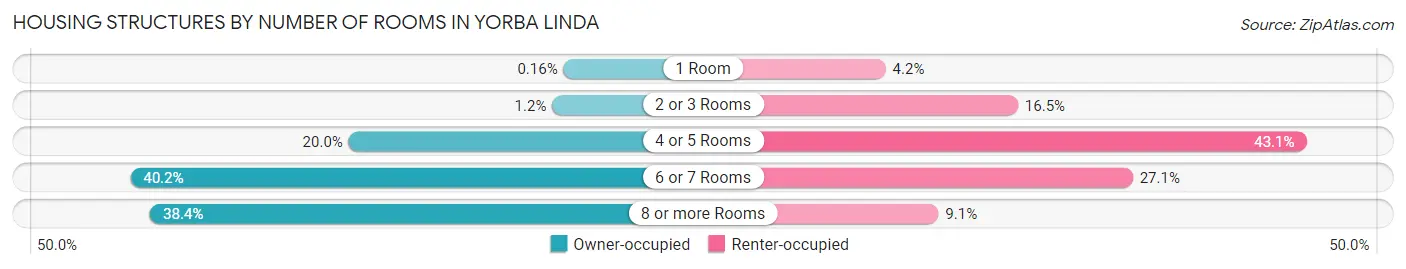
| Number of Rooms | Owner-occupied | Renter-occupied |
| 1 Room | 31 (0.2%) | 168 (4.2%) |
| 2 or 3 Rooms | 227 (1.2%) | 654 (16.5%) |
| 4 or 5 Rooms | 3,798 (20.0%) | 1,714 (43.1%) |
| 6 or 7 Rooms | 7,628 (40.2%) | 1,076 (27.1%) |
| 8 or more Rooms | 7,280 (38.4%) | 362 (9.1%) |
| Total | 18,964 (100.0%) | 3,974 (100.0%) |
Housing Structure by Heating Type in Yorba Linda
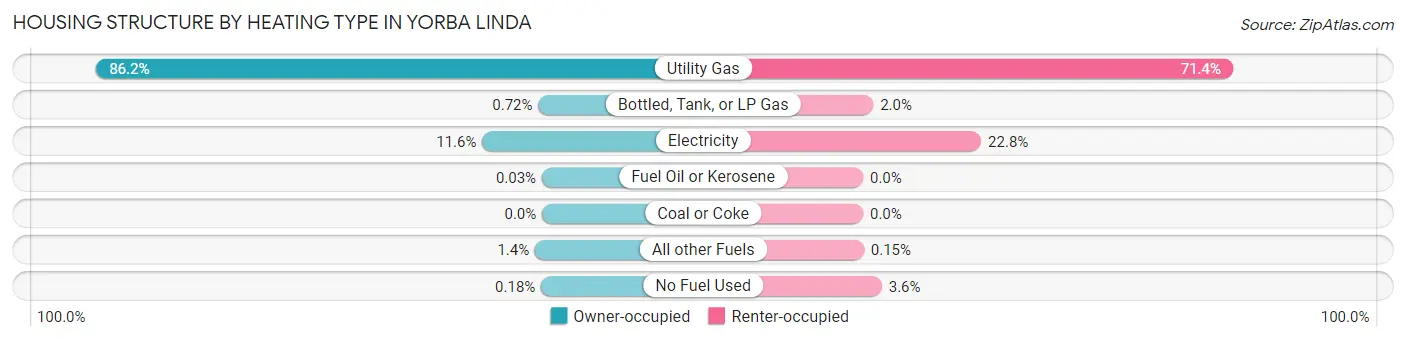
| Heating Type | Owner-occupied | Renter-occupied |
| Utility Gas | 16,338 (86.2%) | 2,839 (71.4%) |
| Bottled, Tank, or LP Gas | 137 (0.7%) | 78 (2.0%) |
| Electricity | 2,190 (11.6%) | 907 (22.8%) |
| Fuel Oil or Kerosene | 5 (0.0%) | 0 (0.0%) |
| Coal or Coke | 0 (0.0%) | 0 (0.0%) |
| All other Fuels | 259 (1.4%) | 6 (0.2%) |
| No Fuel Used | 35 (0.2%) | 144 (3.6%) |
| Total | 18,964 (100.0%) | 3,974 (100.0%) |
Household Vehicle Usage in Yorba Linda
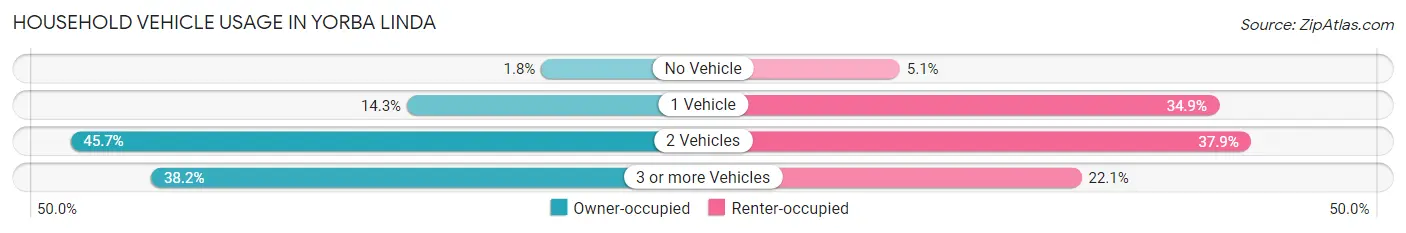
| Vehicles per Household | Owner-occupied | Renter-occupied |
| No Vehicle | 337 (1.8%) | 204 (5.1%) |
| 1 Vehicle | 2,713 (14.3%) | 1,387 (34.9%) |
| 2 Vehicles | 8,670 (45.7%) | 1,505 (37.9%) |
| 3 or more Vehicles | 7,244 (38.2%) | 878 (22.1%) |
| Total | 18,964 (100.0%) | 3,974 (100.0%) |
Real Estate & Mortgages in Yorba Linda
Real Estate and Mortgage Overview in Yorba Linda
| Characteristic | Without Mortgage | With Mortgage |
| Housing Units | 5,479 | 13,485 |
| Median Property Value | $964,600 | $1,001,600 |
| Median Household Income | $107,013 | $8,222 |
| Monthly Housing Costs | $988 | $9,441 |
| Real Estate Taxes | $6,666 | $61 |
Property Value by Mortgage Status in Yorba Linda
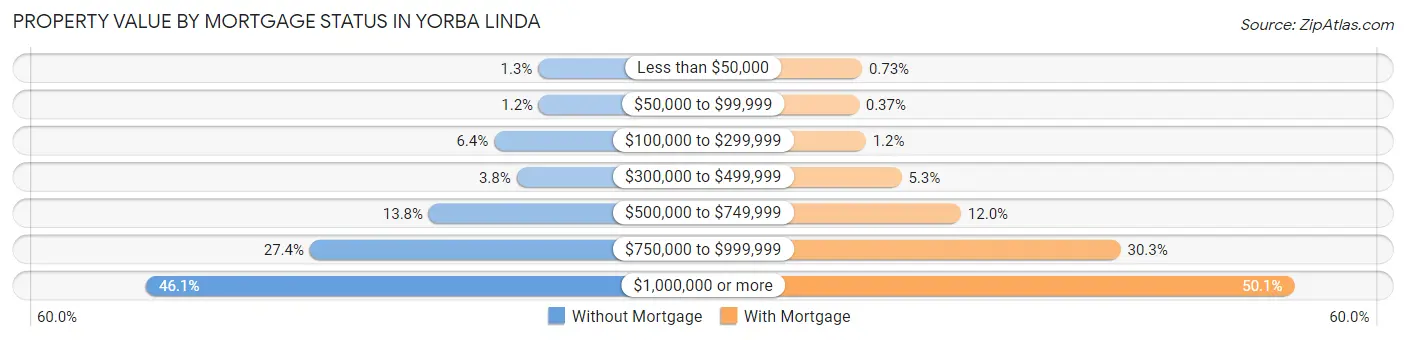
| Property Value | Without Mortgage | With Mortgage |
| Less than $50,000 | 72 (1.3%) | 99 (0.7%) |
| $50,000 to $99,999 | 67 (1.2%) | 50 (0.4%) |
| $100,000 to $299,999 | 348 (6.4%) | 157 (1.2%) |
| $300,000 to $499,999 | 207 (3.8%) | 708 (5.2%) |
| $500,000 to $749,999 | 756 (13.8%) | 1,624 (12.0%) |
| $750,000 to $999,999 | 1,502 (27.4%) | 4,085 (30.3%) |
| $1,000,000 or more | 2,527 (46.1%) | 6,762 (50.1%) |
| Total | 5,479 (100.0%) | 13,485 (100.0%) |
Household Income by Mortgage Status in Yorba Linda
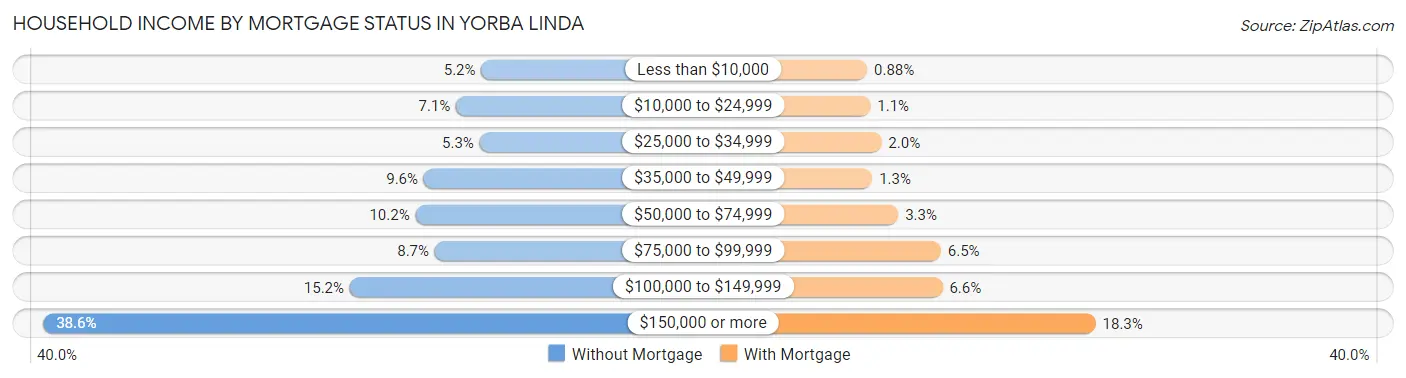
| Household Income | Without Mortgage | With Mortgage |
| Less than $10,000 | 285 (5.2%) | 119 (0.9%) |
| $10,000 to $24,999 | 390 (7.1%) | 152 (1.1%) |
| $25,000 to $34,999 | 292 (5.3%) | 266 (2.0%) |
| $35,000 to $49,999 | 525 (9.6%) | 171 (1.3%) |
| $50,000 to $74,999 | 560 (10.2%) | 438 (3.3%) |
| $75,000 to $99,999 | 479 (8.7%) | 877 (6.5%) |
| $100,000 to $149,999 | 834 (15.2%) | 893 (6.6%) |
| $150,000 or more | 2,114 (38.6%) | 2,466 (18.3%) |
| Total | 5,479 (100.0%) | 13,485 (100.0%) |
Property Value to Household Income Ratio in Yorba Linda
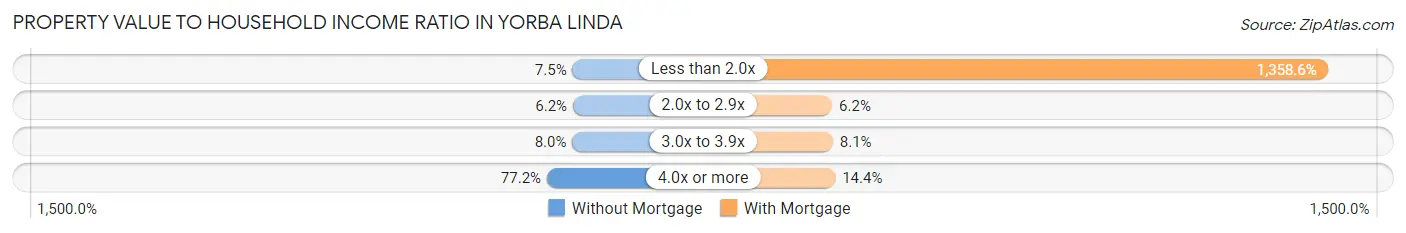
| Value-to-Income Ratio | Without Mortgage | With Mortgage |
| Less than 2.0x | 408 (7.4%) | 183,204 (1,358.6%) |
| 2.0x to 2.9x | 339 (6.2%) | 830 (6.1%) |
| 3.0x to 3.9x | 440 (8.0%) | 1,085 (8.1%) |
| 4.0x or more | 4,227 (77.1%) | 1,947 (14.4%) |
| Total | 5,479 (100.0%) | 13,485 (100.0%) |
Real Estate Taxes by Mortgage Status in Yorba Linda
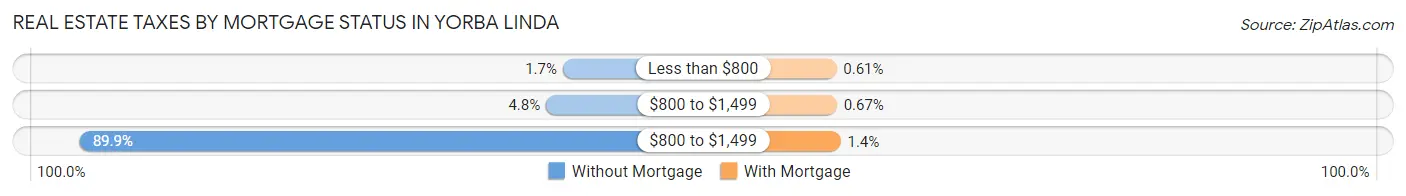
| Property Taxes | Without Mortgage | With Mortgage |
| Less than $800 | 93 (1.7%) | 82 (0.6%) |
| $800 to $1,499 | 261 (4.8%) | 90 (0.7%) |
| $800 to $1,499 | 4,927 (89.9%) | 185 (1.4%) |
| Total | 5,479 (100.0%) | 13,485 (100.0%) |
Health & Disability in Yorba Linda
Health Insurance Coverage by Age in Yorba Linda
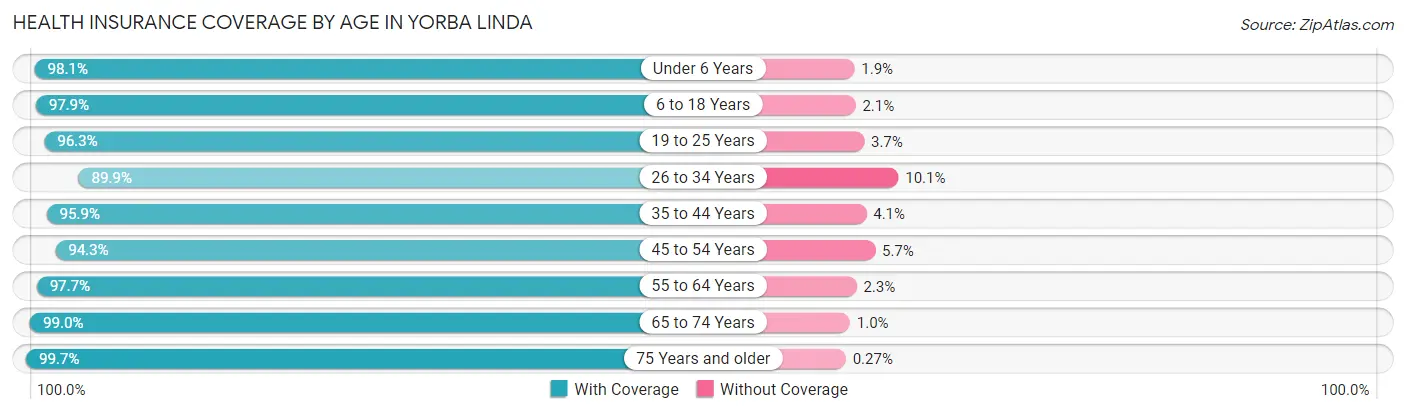
| Age Bracket | With Coverage | Without Coverage |
| Under 6 Years | 4,135 (98.1%) | 79 (1.9%) |
| 6 to 18 Years | 11,783 (97.9%) | 251 (2.1%) |
| 19 to 25 Years | 4,395 (96.3%) | 168 (3.7%) |
| 26 to 34 Years | 5,133 (89.9%) | 575 (10.1%) |
| 35 to 44 Years | 7,669 (95.9%) | 328 (4.1%) |
| 45 to 54 Years | 9,734 (94.3%) | 592 (5.7%) |
| 55 to 64 Years | 9,722 (97.7%) | 226 (2.3%) |
| 65 to 74 Years | 7,597 (99.0%) | 80 (1.0%) |
| 75 Years and older | 5,249 (99.7%) | 14 (0.3%) |
| Total | 65,417 (96.6%) | 2,313 (3.4%) |
Health Insurance Coverage by Citizenship Status in Yorba Linda
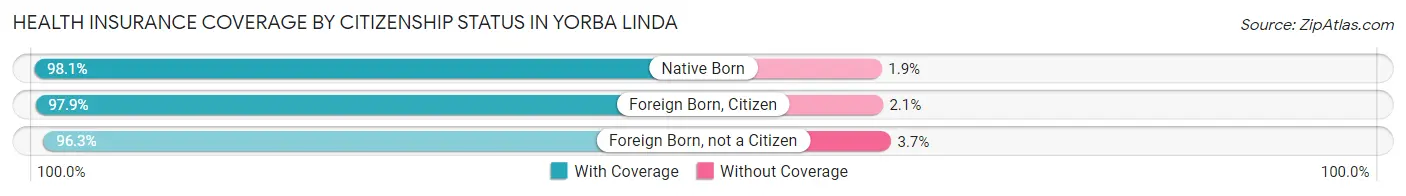
| Citizenship Status | With Coverage | Without Coverage |
| Native Born | 4,135 (98.1%) | 79 (1.9%) |
| Foreign Born, Citizen | 11,783 (97.9%) | 251 (2.1%) |
| Foreign Born, not a Citizen | 4,395 (96.3%) | 168 (3.7%) |
Health Insurance Coverage by Household Income in Yorba Linda
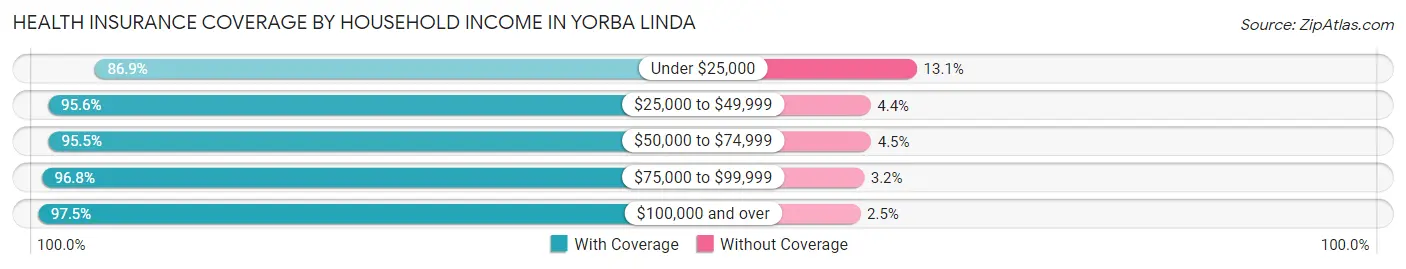
| Household Income | With Coverage | Without Coverage |
| Under $25,000 | 3,466 (86.9%) | 522 (13.1%) |
| $25,000 to $49,999 | 3,827 (95.6%) | 177 (4.4%) |
| $50,000 to $74,999 | 4,656 (95.5%) | 219 (4.5%) |
| $75,000 to $99,999 | 3,989 (96.8%) | 131 (3.2%) |
| $100,000 and over | 49,327 (97.5%) | 1,262 (2.5%) |
Public vs Private Health Insurance Coverage by Age in Yorba Linda
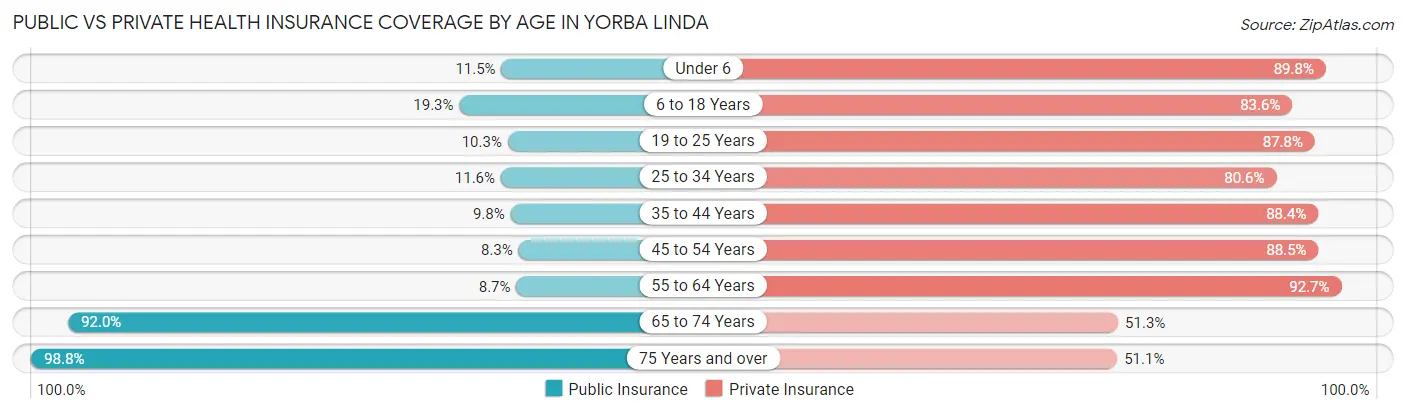
| Age Bracket | Public Insurance | Private Insurance |
| Under 6 | 484 (11.5%) | 3,785 (89.8%) |
| 6 to 18 Years | 2,322 (19.3%) | 10,061 (83.6%) |
| 19 to 25 Years | 471 (10.3%) | 4,006 (87.8%) |
| 25 to 34 Years | 662 (11.6%) | 4,603 (80.6%) |
| 35 to 44 Years | 784 (9.8%) | 7,072 (88.4%) |
| 45 to 54 Years | 857 (8.3%) | 9,135 (88.5%) |
| 55 to 64 Years | 867 (8.7%) | 9,224 (92.7%) |
| 65 to 74 Years | 7,059 (91.9%) | 3,938 (51.3%) |
| 75 Years and over | 5,199 (98.8%) | 2,691 (51.1%) |
| Total | 18,705 (27.6%) | 54,515 (80.5%) |
Disability Status by Sex by Age in Yorba Linda
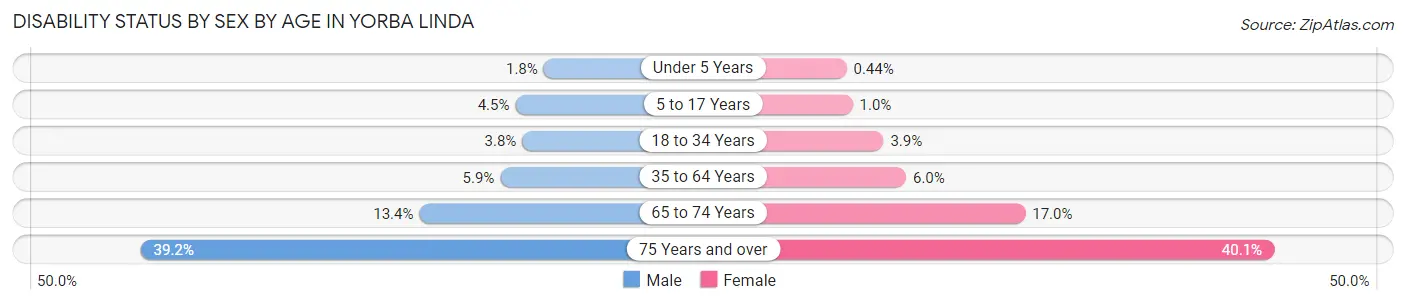
| Age Bracket | Male | Female |
| Under 5 Years | 33 (1.8%) | 7 (0.4%) |
| 5 to 17 Years | 276 (4.5%) | 59 (1.0%) |
| 18 to 34 Years | 213 (3.8%) | 212 (3.9%) |
| 35 to 64 Years | 811 (5.9%) | 859 (6.0%) |
| 65 to 74 Years | 491 (13.4%) | 682 (17.0%) |
| 75 Years and over | 918 (39.2%) | 1,172 (40.1%) |
Disability Class by Sex by Age in Yorba Linda
Disability Class: Hearing Difficulty
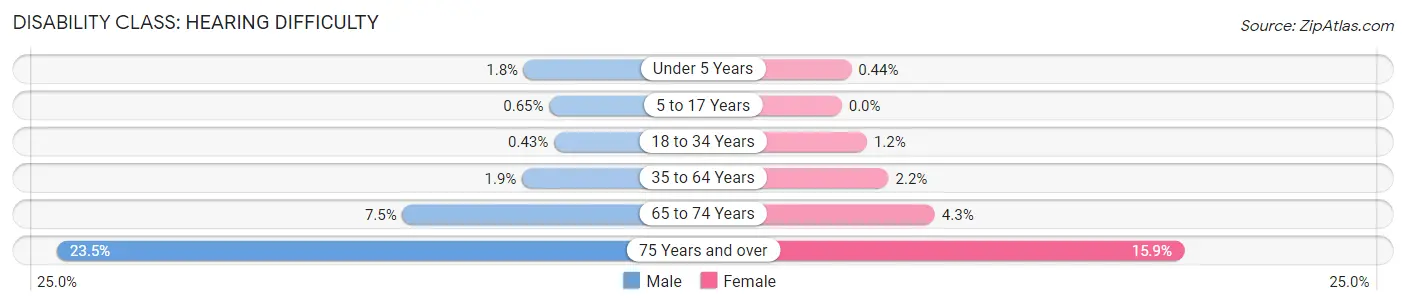
| Age Bracket | Male | Female |
| Under 5 Years | 33 (1.8%) | 7 (0.4%) |
| 5 to 17 Years | 40 (0.6%) | 0 (0.0%) |
| 18 to 34 Years | 24 (0.4%) | 64 (1.2%) |
| 35 to 64 Years | 264 (1.9%) | 313 (2.2%) |
| 65 to 74 Years | 274 (7.5%) | 173 (4.3%) |
| 75 Years and over | 550 (23.5%) | 464 (15.9%) |
Disability Class: Vision Difficulty
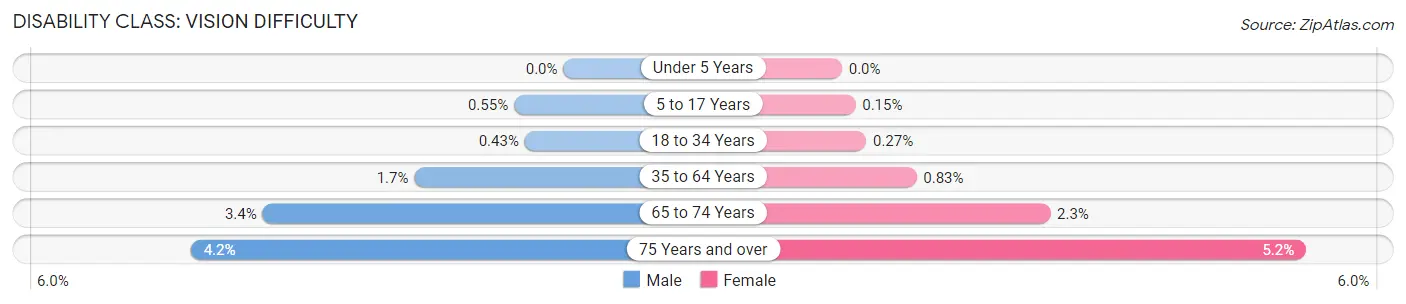
| Age Bracket | Male | Female |
| Under 5 Years | 0 (0.0%) | 0 (0.0%) |
| 5 to 17 Years | 34 (0.5%) | 9 (0.2%) |
| 18 to 34 Years | 24 (0.4%) | 15 (0.3%) |
| 35 to 64 Years | 230 (1.7%) | 120 (0.8%) |
| 65 to 74 Years | 123 (3.4%) | 93 (2.3%) |
| 75 Years and over | 97 (4.2%) | 151 (5.2%) |
Disability Class: Cognitive Difficulty
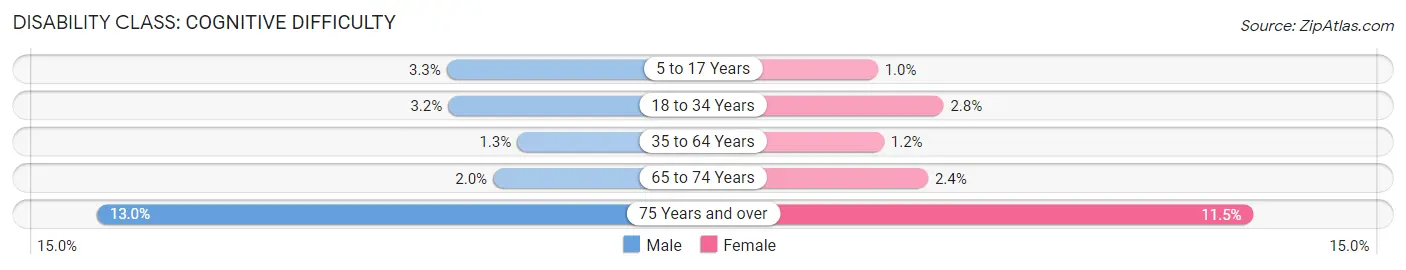
| Age Bracket | Male | Female |
| 5 to 17 Years | 201 (3.3%) | 59 (1.0%) |
| 18 to 34 Years | 179 (3.2%) | 155 (2.8%) |
| 35 to 64 Years | 178 (1.3%) | 169 (1.2%) |
| 65 to 74 Years | 72 (2.0%) | 96 (2.4%) |
| 75 Years and over | 304 (13.0%) | 335 (11.5%) |
Disability Class: Ambulatory Difficulty
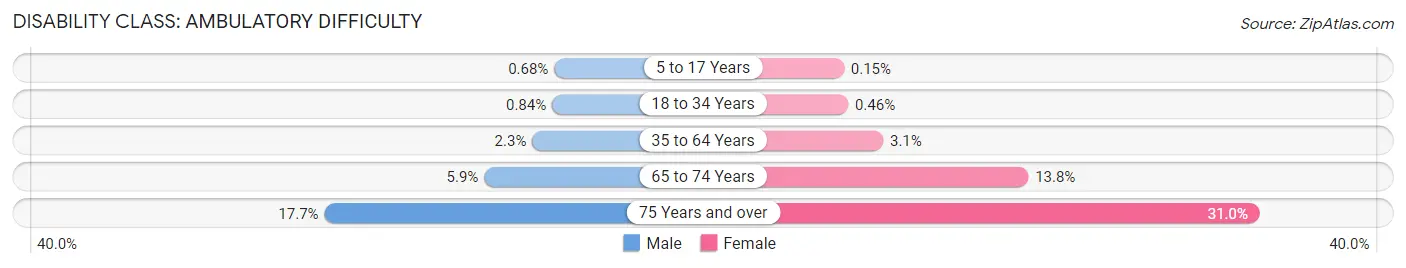
| Age Bracket | Male | Female |
| 5 to 17 Years | 42 (0.7%) | 9 (0.2%) |
| 18 to 34 Years | 47 (0.8%) | 25 (0.5%) |
| 35 to 64 Years | 320 (2.3%) | 441 (3.1%) |
| 65 to 74 Years | 216 (5.9%) | 554 (13.8%) |
| 75 Years and over | 415 (17.7%) | 907 (31.0%) |
Disability Class: Self-Care Difficulty
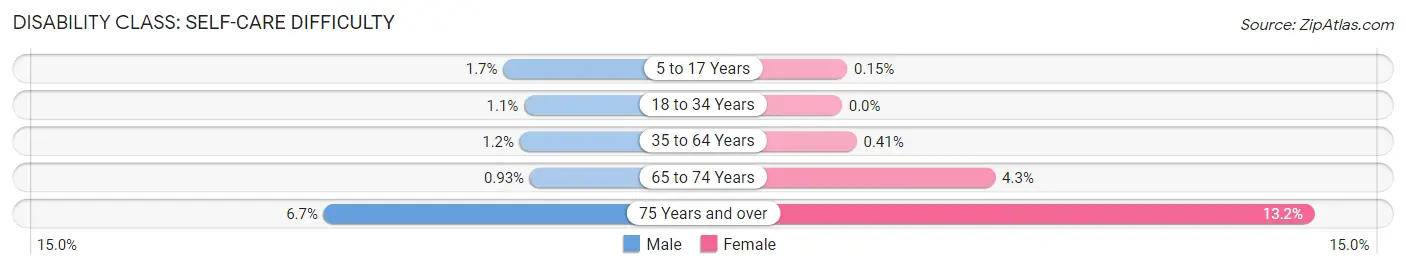
| Age Bracket | Male | Female |
| 5 to 17 Years | 103 (1.7%) | 9 (0.2%) |
| 18 to 34 Years | 61 (1.1%) | 0 (0.0%) |
| 35 to 64 Years | 167 (1.2%) | 59 (0.4%) |
| 65 to 74 Years | 34 (0.9%) | 171 (4.3%) |
| 75 Years and over | 156 (6.7%) | 385 (13.2%) |
Technology Access in Yorba Linda
Computing Device Access in Yorba Linda
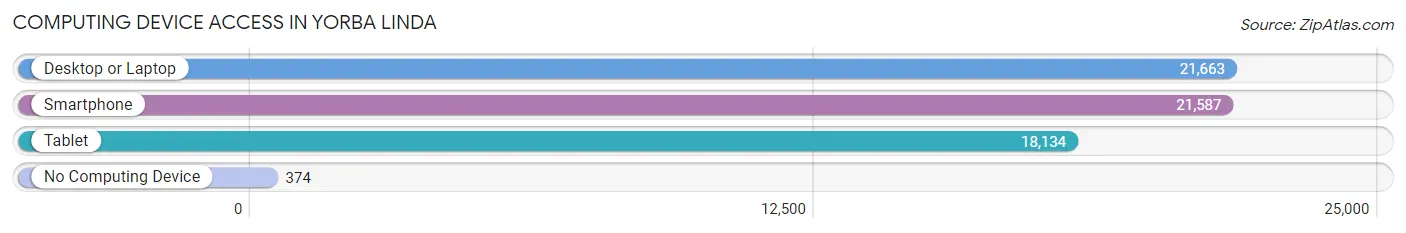
| Device Type | # Households | % Households |
| Desktop or Laptop | 21,663 | 94.4% |
| Smartphone | 21,587 | 94.1% |
| Tablet | 18,134 | 79.1% |
| No Computing Device | 374 | 1.6% |
| Total | 22,938 | 100.0% |
Internet Access in Yorba Linda
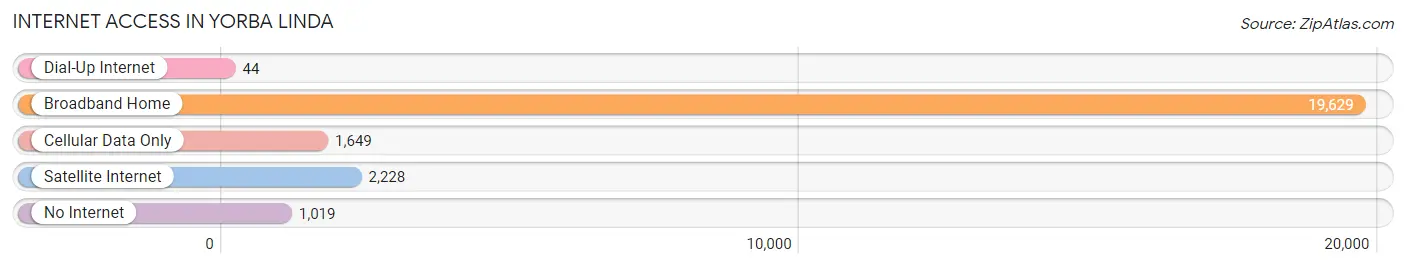
| Internet Type | # Households | % Households |
| Dial-Up Internet | 44 | 0.2% |
| Broadband Home | 19,629 | 85.6% |
| Cellular Data Only | 1,649 | 7.2% |
| Satellite Internet | 2,228 | 9.7% |
| No Internet | 1,019 | 4.4% |
| Total | 22,938 | 100.0% |
Yorba Linda Summary
Yorba Linda is a city located in Orange County, California, United States. It is situated in the northeastern corner of the county, and is bordered by the cities of Anaheim, Brea, Placentia, and Fullerton. The city is known for its rural atmosphere and its proximity to the Santa Ana Mountains. As of the 2010 census, the city had a population of 64,234.
History
Yorba Linda was originally part of the Rancho Santiago de Santa Ana, a large Spanish land grant given to the Yorba family in 1810. The land was used for cattle grazing and farming until the late 19th century, when it was subdivided and developed into residential neighborhoods. The city was incorporated in 1967, and has since grown to become one of the most affluent cities in Orange County.
Geography
Yorba Linda is located in the northeastern corner of Orange County, and is bordered by the cities of Anaheim, Brea, Placentia, and Fullerton. The city is situated in the foothills of the Santa Ana Mountains, and is approximately 25 miles southeast of Los Angeles. The city has a total area of 24.2 square miles, of which 24.1 square miles is land and 0.1 square miles is water.
Economy
Yorba Linda is a primarily residential city, and its economy is largely based on the service industry. The city is home to several corporate headquarters, including the headquarters of the fast food chain In-N-Out Burger. Other major employers in the city include the Yorba Linda Water District, the Yorba Linda Unified School District, and the Yorba Linda Country Club.
Demographics
As of the 2010 census, there were 64,234 people, 22,845 households, and 18,845 families residing in the city. The population density was 2,639.2 people per square mile. The racial makeup of the city was 74.2% White, 1.3% African American, 0.4% Native American, 15.2% Asian, 0.1% Pacific Islander, 4.7% from other races, and 4.1% from two or more races. Hispanic or Latino of any race were 17.2% of the population.
The median income for a household in the city was $101,872, and the median income for a family was $113,845. The per capita income for the city was $45,945. About 3.2% of families and 4.3% of the population were below the poverty line, including 5.2% of those under age 18 and 4.2% of those age 65 or over.
Common Questions
What is Per Capita Income in Yorba Linda?
Per Capita income in Yorba Linda is $64,265.
What is the Median Family Income in Yorba Linda?
Median Family Income in Yorba Linda is $165,664.
What is the Median Household income in Yorba Linda?
Median Household Income in Yorba Linda is $148,325.
What is Income or Wage Gap in Yorba Linda?
Income or Wage Gap in Yorba Linda is 42.9%.
Women in Yorba Linda earn 57.1 cents for every dollar earned by a man.
What is Family Income Deficit in Yorba Linda?
Family Income Deficit in Yorba Linda is $11,843.
Families that are below poverty line in Yorba Linda earn $11,843 less on average than the poverty threshold level.
What is Inequality or Gini Index in Yorba Linda?
Inequality or Gini Index in Yorba Linda is 0.44.
What is the Total Population of Yorba Linda?
Total Population of Yorba Linda is 68,035.
What is the Total Male Population of Yorba Linda?
Total Male Population of Yorba Linda is 33,539.
What is the Total Female Population of Yorba Linda?
Total Female Population of Yorba Linda is 34,496.
What is the Ratio of Males per 100 Females in Yorba Linda?
There are 97.23 Males per 100 Females in Yorba Linda.
What is the Ratio of Females per 100 Males in Yorba Linda?
There are 102.85 Females per 100 Males in Yorba Linda.
What is the Median Population Age in Yorba Linda?
Median Population Age in Yorba Linda is 44.3 Years.
What is the Average Family Size in Yorba Linda
Average Family Size in Yorba Linda is 3.3 People.
What is the Average Household Size in Yorba Linda
Average Household Size in Yorba Linda is 3.0 People.
How Large is the Labor Force in Yorba Linda?
There are 34,217 People in the Labor Forcein in Yorba Linda.
What is the Percentage of People in the Labor Force in Yorba Linda?
62.8% of People are in the Labor Force in Yorba Linda.
What is the Unemployment Rate in Yorba Linda?
Unemployment Rate in Yorba Linda is 4.6%.