Fulshear, TX Map & Demographics
Fulshear Map
Fulshear Overview
$60,425
PER CAPITA INCOME
$171,446
AVG FAMILY INCOME
$170,602
AVG HOUSEHOLD INCOME
69.6%
WAGE / INCOME GAP [ % ]
30.4¢/ $1
WAGE / INCOME GAP [ $ ]
0.31
INEQUALITY / GINI INDEX
21,552
TOTAL POPULATION
10,563
MALE POPULATION
10,989
FEMALE POPULATION
96.12
MALES / 100 FEMALES
104.03
FEMALES / 100 MALES
38.4
MEDIAN AGE
3.4
AVG FAMILY SIZE
3.3
AVG HOUSEHOLD SIZE
9,936
LABOR FORCE [ PEOPLE ]
63.1%
PERCENT IN LABOR FORCE
4.9%
UNEMPLOYMENT RATE
Fulshear Zip Codes
Income in Fulshear
Income Overview in Fulshear
Per Capita Income in Fulshear is $60,425, while median incomes of families and households are $171,446 and $170,602 respectively.
| Characteristic | Number | Measure |
| Per Capita Income | 21,552 | $60,425 |
| Median Family Income | 6,298 | $171,446 |
| Mean Family Income | 6,298 | $200,394 |
| Median Household Income | 6,496 | $170,602 |
| Mean Household Income | 6,496 | $196,263 |
| Income Deficit | 6,298 | $0 |
| Wage / Income Gap (%) | 21,552 | 69.62% |
| Wage / Income Gap ($) | 21,552 | 30.38¢ per $1 |
| Gini / Inequality Index | 21,552 | 0.31 |
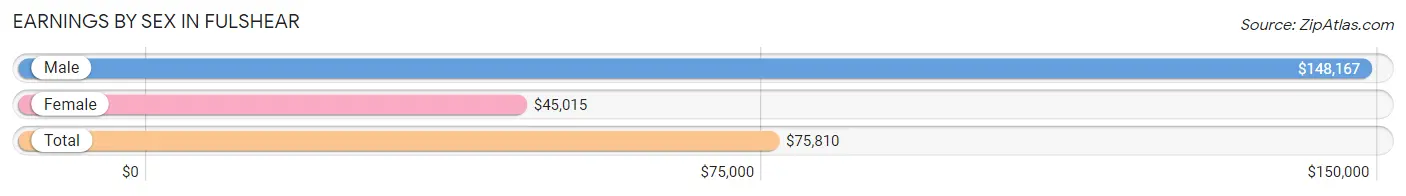
Earnings by Sex in Fulshear
Average Earnings in Fulshear are $75,810, $148,167 for men and $45,015 for women, a difference of 69.6%.
| Sex | Number | Average Earnings |
| Male | 6,190 (57.5%) | $148,167 |
| Female | 4,567 (42.5%) | $45,015 |
| Total | 10,757 (100.0%) | $75,810 |
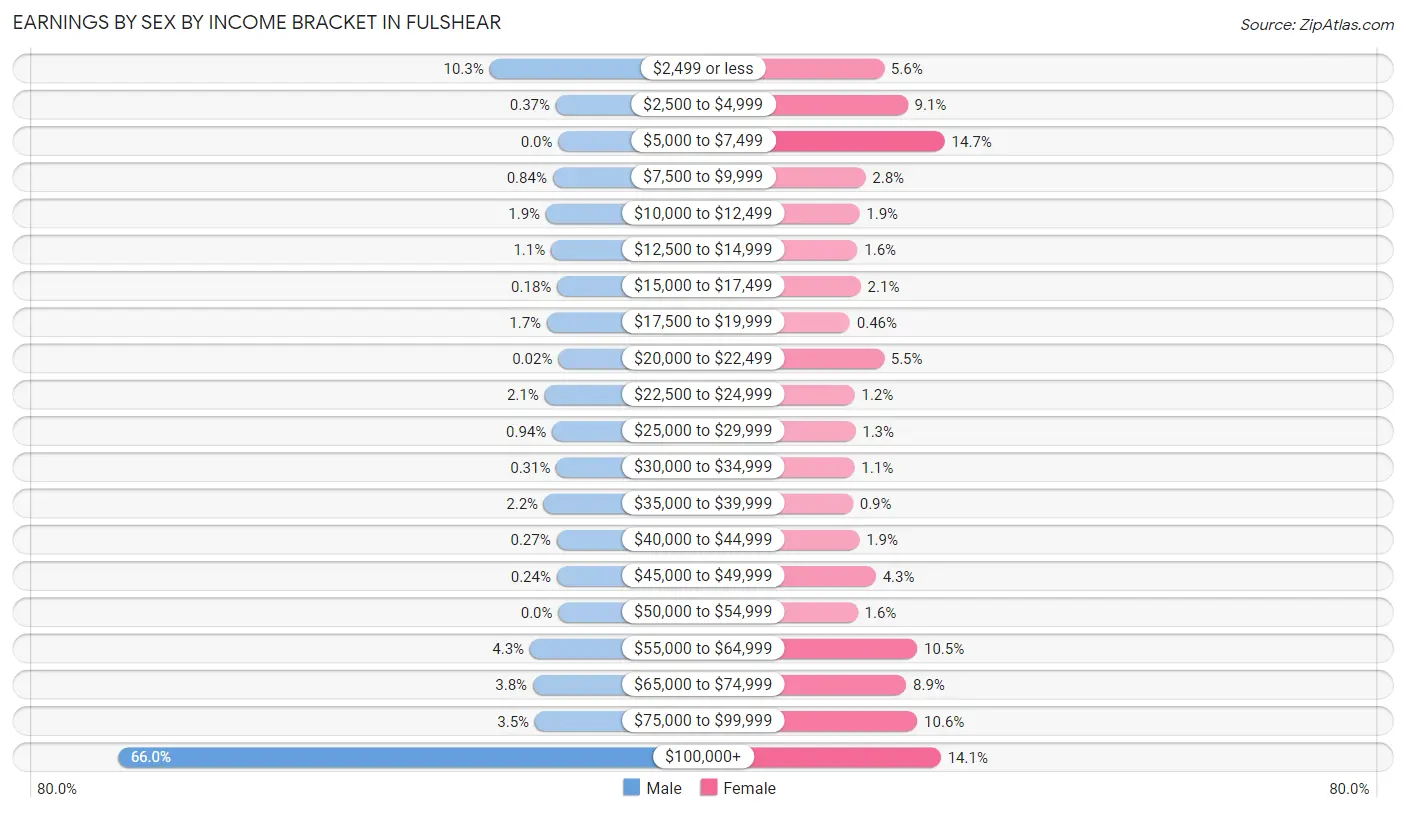
Earnings by Sex by Income Bracket in Fulshear
The most common earnings brackets in Fulshear are $100,000+ for men (4,088 | 66.0%) and $5,000 to $7,499 for women (670 | 14.7%).
| Income | Male | Female |
| $2,499 or less | 638 (10.3%) | 254 (5.6%) |
| $2,500 to $4,999 | 23 (0.4%) | 416 (9.1%) |
| $5,000 to $7,499 | 0 (0.0%) | 670 (14.7%) |
| $7,500 to $9,999 | 52 (0.8%) | 127 (2.8%) |
| $10,000 to $12,499 | 115 (1.9%) | 86 (1.9%) |
| $12,500 to $14,999 | 68 (1.1%) | 72 (1.6%) |
| $15,000 to $17,499 | 11 (0.2%) | 95 (2.1%) |
| $17,500 to $19,999 | 106 (1.7%) | 21 (0.5%) |
| $20,000 to $22,499 | 1 (0.0%) | 253 (5.5%) |
| $22,500 to $24,999 | 128 (2.1%) | 53 (1.2%) |
| $25,000 to $29,999 | 58 (0.9%) | 58 (1.3%) |
| $30,000 to $34,999 | 19 (0.3%) | 52 (1.1%) |
| $35,000 to $39,999 | 134 (2.2%) | 41 (0.9%) |
| $40,000 to $44,999 | 17 (0.3%) | 85 (1.9%) |
| $45,000 to $49,999 | 15 (0.2%) | 198 (4.3%) |
| $50,000 to $54,999 | 0 (0.0%) | 74 (1.6%) |
| $55,000 to $64,999 | 264 (4.3%) | 481 (10.5%) |
| $65,000 to $74,999 | 236 (3.8%) | 406 (8.9%) |
| $75,000 to $99,999 | 217 (3.5%) | 482 (10.5%) |
| $100,000+ | 4,088 (66.0%) | 643 (14.1%) |
| Total | 6,190 (100.0%) | 4,567 (100.0%) |
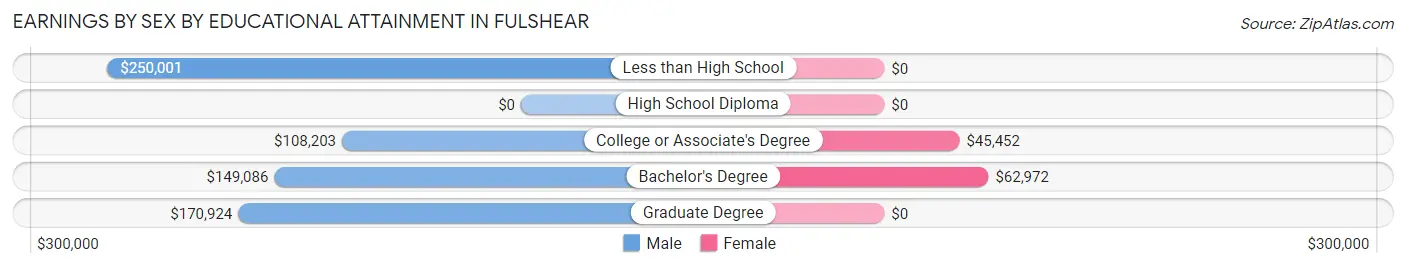
Earnings by Sex by Educational Attainment in Fulshear
Average earnings in Fulshear are $149,492 for men and $57,119 for women, a difference of 61.8%. Men with an educational attainment of less than high school enjoy the highest average annual earnings of $250,001, while those with college or associate's degree education earn the least with $108,203. Women with an educational attainment of bachelor's degree earn the most with the average annual earnings of $62,972, while those with college or associate's degree education have the smallest earnings of $45,452.
| Educational Attainment | Male Income | Female Income |
| Less than High School | $250,001 | $0 |
| High School Diploma | - | - |
| College or Associate's Degree | $108,203 | $45,452 |
| Bachelor's Degree | $149,086 | $62,972 |
| Graduate Degree | $170,924 | $0 |
| Total | $149,492 | $57,119 |
Family Income in Fulshear
Family Income Brackets in Fulshear
According to the Fulshear family income data, there are 2,343 families falling into the $200,000+ income range, which is the most common income bracket and makes up 37.2% of all families.
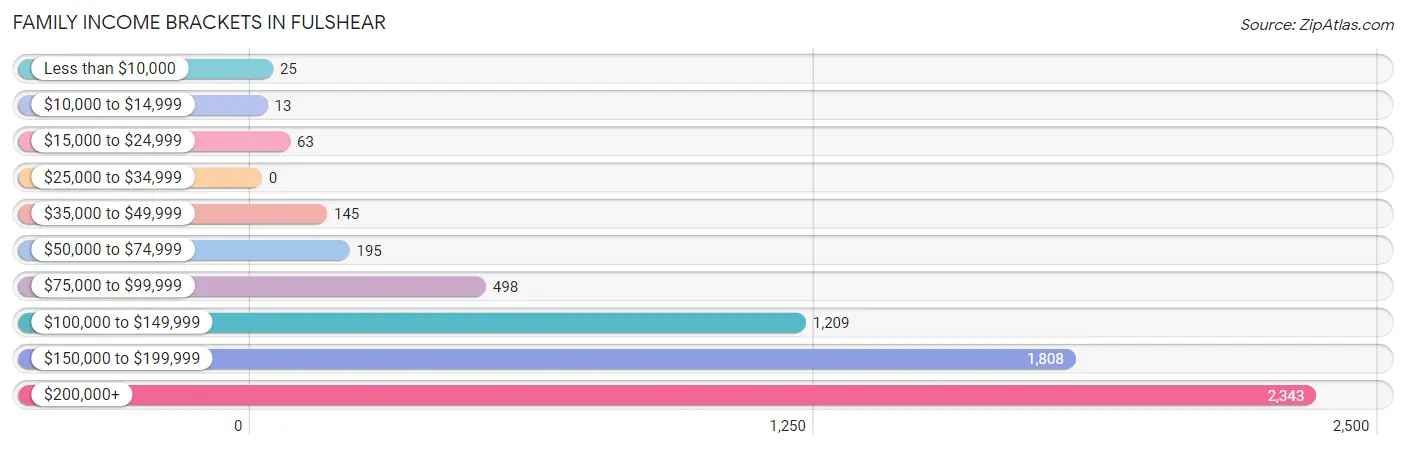
| Income Bracket | # Families | % Families |
| Less than $10,000 | 25 | 0.4% |
| $10,000 to $14,999 | 13 | 0.2% |
| $15,000 to $24,999 | 63 | 1.0% |
| $25,000 to $34,999 | 0 | 0.0% |
| $35,000 to $49,999 | 145 | 2.3% |
| $50,000 to $74,999 | 195 | 3.1% |
| $75,000 to $99,999 | 498 | 7.9% |
| $100,000 to $149,999 | 1,209 | 19.2% |
| $150,000 to $199,999 | 1,808 | 28.7% |
| $200,000+ | 2,343 | 37.2% |
Family Income by Famaliy Size in Fulshear
5-person families (954 | 15.1%) account for the highest median family income in Fulshear with $202,604 per family, while 2-person families (1,788 | 28.4%) have the highest median income of $73,334 per family member.
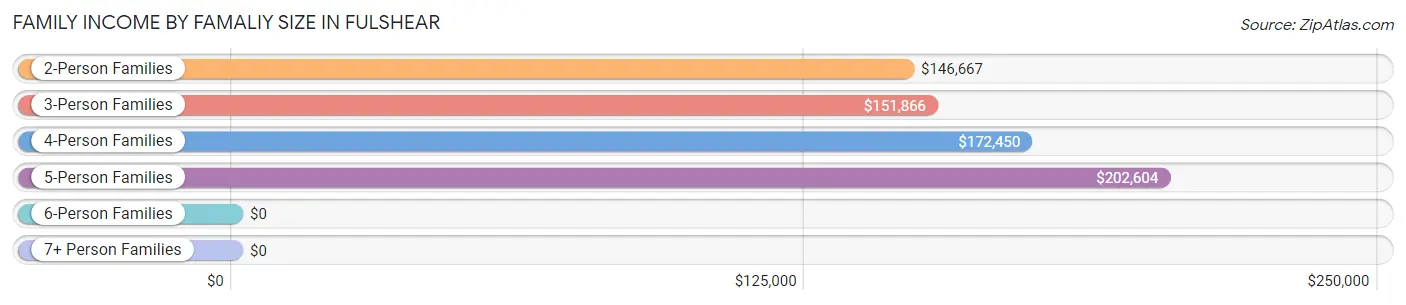
| Income Bracket | # Families | Median Income |
| 2-Person Families | 1,788 (28.4%) | $146,667 |
| 3-Person Families | 1,570 (24.9%) | $151,866 |
| 4-Person Families | 1,892 (30.0%) | $172,450 |
| 5-Person Families | 954 (15.1%) | $202,604 |
| 6-Person Families | 70 (1.1%) | $0 |
| 7+ Person Families | 24 (0.4%) | $0 |
| Total | 6,298 (100.0%) | $171,446 |
Family Income by Number of Earners in Fulshear
The median family income in Fulshear is $171,446, with families comprising 3+ earners (717) having the highest median family income of $250,001, while families with no earners (652) have the lowest median family income of $100,342, accounting for 11.4% and 10.3% of families, respectively.
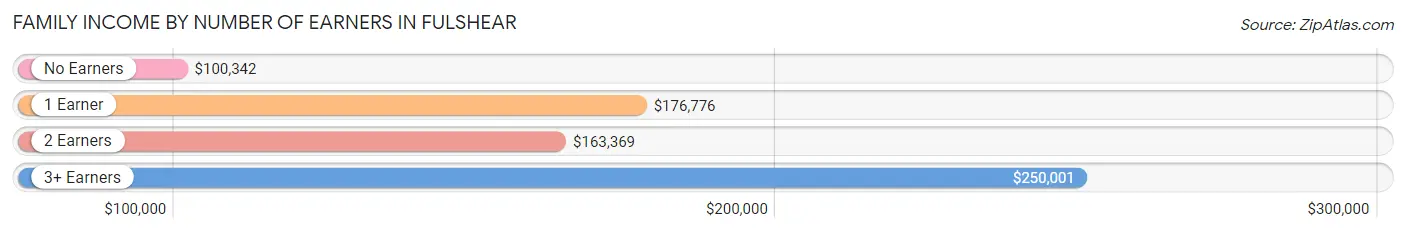
| Number of Earners | # Families | Median Income |
| No Earners | 652 (10.3%) | $100,342 |
| 1 Earner | 1,832 (29.1%) | $176,776 |
| 2 Earners | 3,097 (49.2%) | $163,369 |
| 3+ Earners | 717 (11.4%) | $250,001 |
| Total | 6,298 (100.0%) | $171,446 |
Household Income in Fulshear
Household Income Brackets in Fulshear
With 2,397 households falling in the category, the $200,000+ income range is the most frequent in Fulshear, accounting for 36.9% of all households.
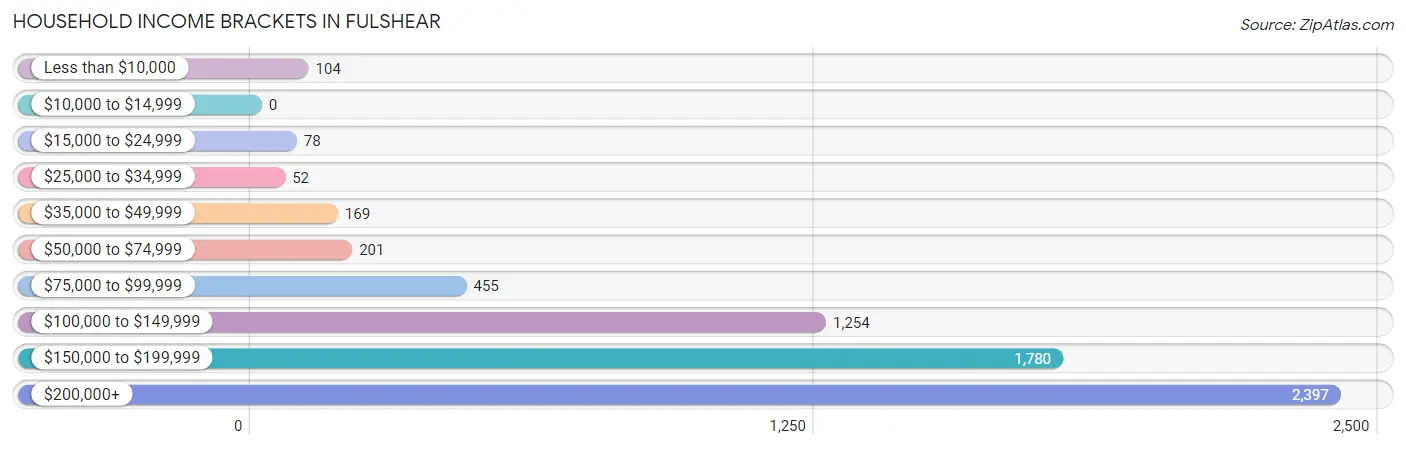
| Income Bracket | # Households | % Households |
| Less than $10,000 | 104 | 1.6% |
| $10,000 to $14,999 | 0 | 0.0% |
| $15,000 to $24,999 | 78 | 1.2% |
| $25,000 to $34,999 | 52 | 0.8% |
| $35,000 to $49,999 | 169 | 2.6% |
| $50,000 to $74,999 | 201 | 3.1% |
| $75,000 to $99,999 | 455 | 7.0% |
| $100,000 to $149,999 | 1,254 | 19.3% |
| $150,000 to $199,999 | 1,780 | 27.4% |
| $200,000+ | 2,397 | 36.9% |
Household Income by Householder Age in Fulshear
The median household income in Fulshear is $170,602, with the highest median household income of $206,061 found in the 45 to 64 years age bracket for the primary householder. A total of 3,108 households (47.8%) fall into this category.
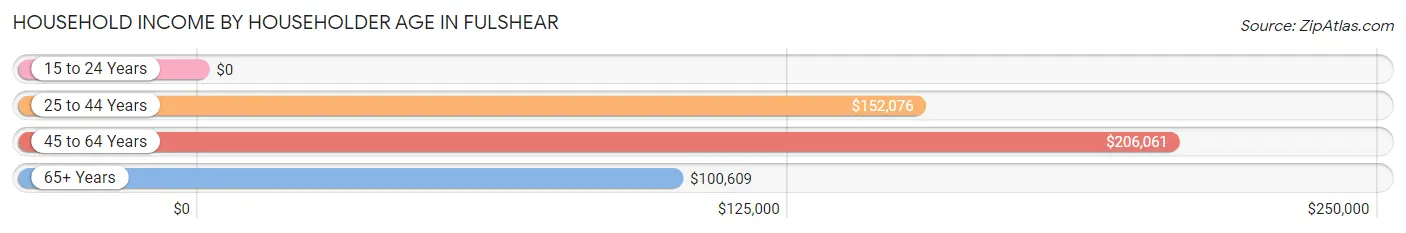
| Income Bracket | # Households | Median Income |
| 15 to 24 Years | 0 (0.0%) | $0 |
| 25 to 44 Years | 2,471 (38.0%) | $152,076 |
| 45 to 64 Years | 3,108 (47.8%) | $206,061 |
| 65+ Years | 917 (14.1%) | $100,609 |
| Total | 6,496 (100.0%) | $170,602 |
Poverty in Fulshear
Income Below Poverty by Sex and Age in Fulshear
With 0.7% poverty level for males and 2.1% for females among the residents of Fulshear, 35 to 44 year old males and 75 year old and over females are the most vulnerable to poverty, with 52 males (2.5%) and 52 females (14.9%) in their respective age groups living below the poverty level.
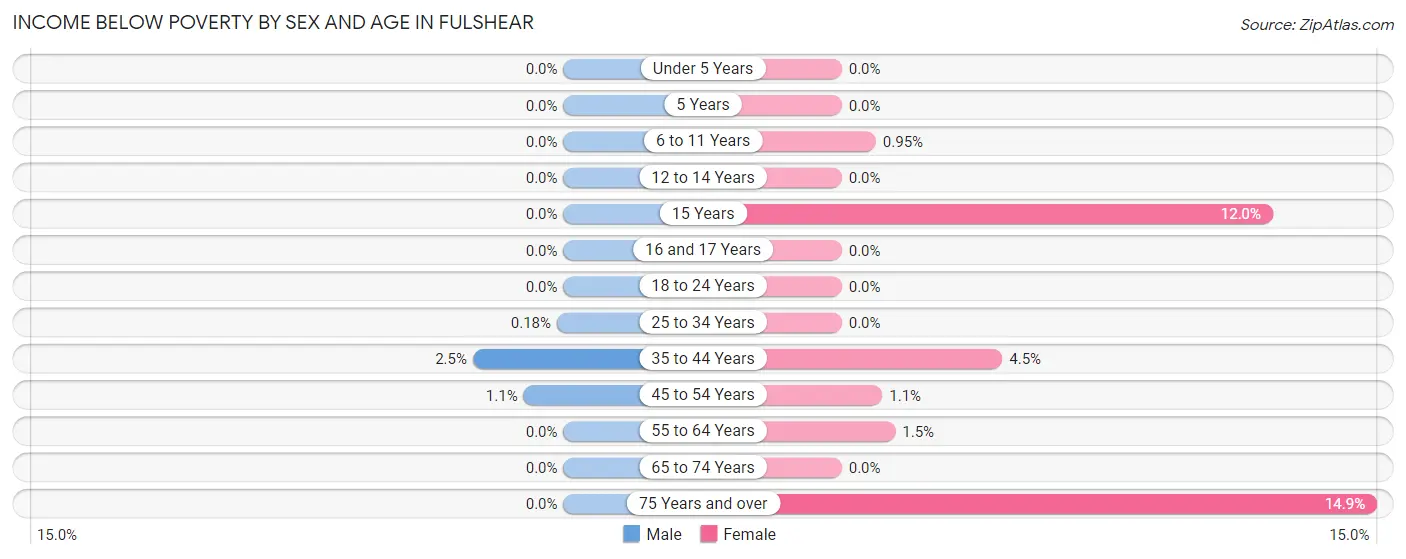
| Age Bracket | Male | Female |
| Under 5 Years | 0 (0.0%) | 0 (0.0%) |
| 5 Years | 0 (0.0%) | 0 (0.0%) |
| 6 to 11 Years | 0 (0.0%) | 19 (0.9%) |
| 12 to 14 Years | 0 (0.0%) | 0 (0.0%) |
| 15 Years | 0 (0.0%) | 21 (12.0%) |
| 16 and 17 Years | 0 (0.0%) | 0 (0.0%) |
| 18 to 24 Years | 0 (0.0%) | 0 (0.0%) |
| 25 to 34 Years | 1 (0.2%) | 0 (0.0%) |
| 35 to 44 Years | 52 (2.5%) | 109 (4.5%) |
| 45 to 54 Years | 23 (1.1%) | 19 (1.1%) |
| 55 to 64 Years | 0 (0.0%) | 12 (1.5%) |
| 65 to 74 Years | 0 (0.0%) | 0 (0.0%) |
| 75 Years and over | 0 (0.0%) | 52 (14.9%) |
| Total | 76 (0.7%) | 232 (2.1%) |
Income Above Poverty by Sex and Age in Fulshear
According to the poverty statistics in Fulshear, males aged under 5 years and females aged under 5 years are the age groups that are most secure financially, with 100.0% of males and 100.0% of females in these age groups living above the poverty line.
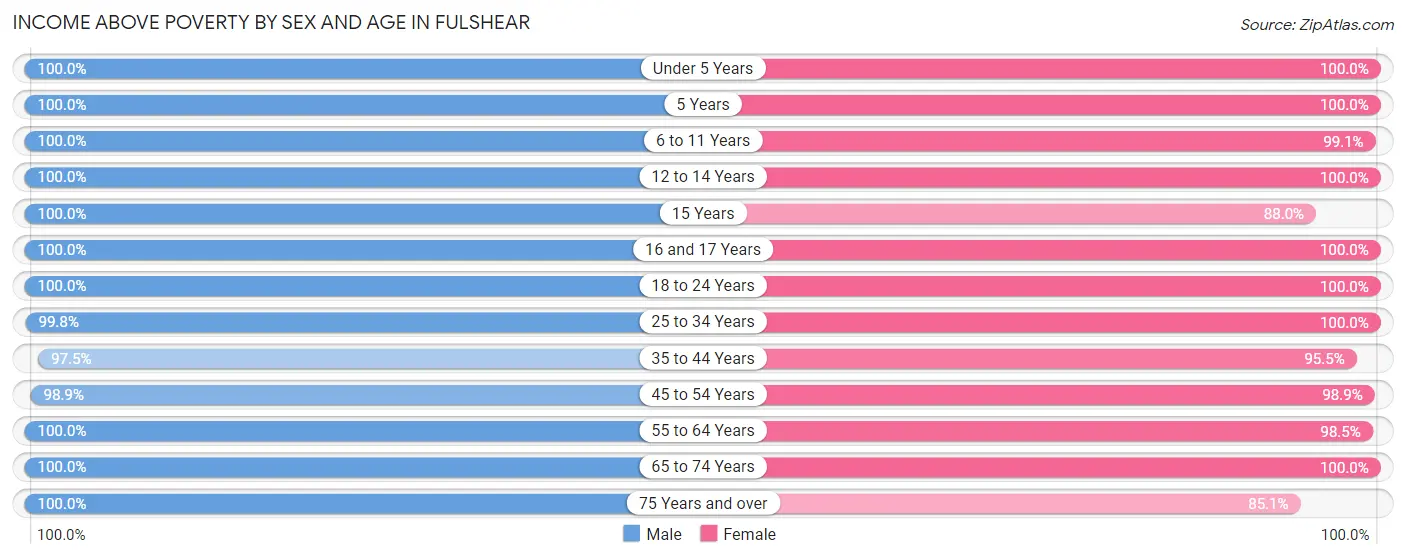
| Age Bracket | Male | Female |
| Under 5 Years | 430 (100.0%) | 459 (100.0%) |
| 5 Years | 39 (100.0%) | 75 (100.0%) |
| 6 to 11 Years | 1,046 (100.0%) | 1,975 (99.1%) |
| 12 to 14 Years | 965 (100.0%) | 426 (100.0%) |
| 15 Years | 128 (100.0%) | 154 (88.0%) |
| 16 and 17 Years | 309 (100.0%) | 910 (100.0%) |
| 18 to 24 Years | 887 (100.0%) | 479 (100.0%) |
| 25 to 34 Years | 554 (99.8%) | 481 (100.0%) |
| 35 to 44 Years | 2,014 (97.5%) | 2,327 (95.5%) |
| 45 to 54 Years | 2,040 (98.9%) | 1,668 (98.9%) |
| 55 to 64 Years | 1,147 (100.0%) | 794 (98.5%) |
| 65 to 74 Years | 690 (100.0%) | 712 (100.0%) |
| 75 Years and over | 170 (100.0%) | 297 (85.1%) |
| Total | 10,419 (99.3%) | 10,757 (97.9%) |
Income Below Poverty Among Married-Couple Families in Fulshear
The poverty statistics for married-couple families in Fulshear show that 1.2% or 72 of the total 5,843 families live below the poverty line. Families with no children have the highest poverty rate of 2.2%, comprising of 49 families. On the other hand, families with 3 or 4 children have the lowest poverty rate of 0.0%, which includes 0 families.
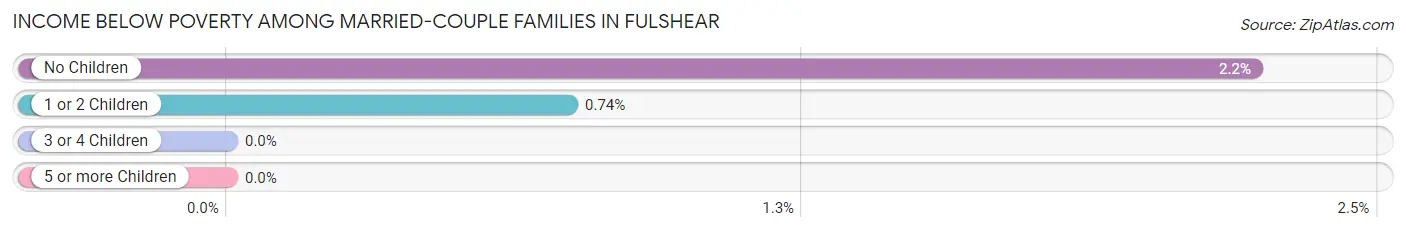
| Children | Above Poverty | Below Poverty |
| No Children | 2,149 (97.8%) | 49 (2.2%) |
| 1 or 2 Children | 3,067 (99.3%) | 23 (0.7%) |
| 3 or 4 Children | 555 (100.0%) | 0 (0.0%) |
| 5 or more Children | 0 (0.0%) | 0 (0.0%) |
| Total | 5,771 (98.8%) | 72 (1.2%) |
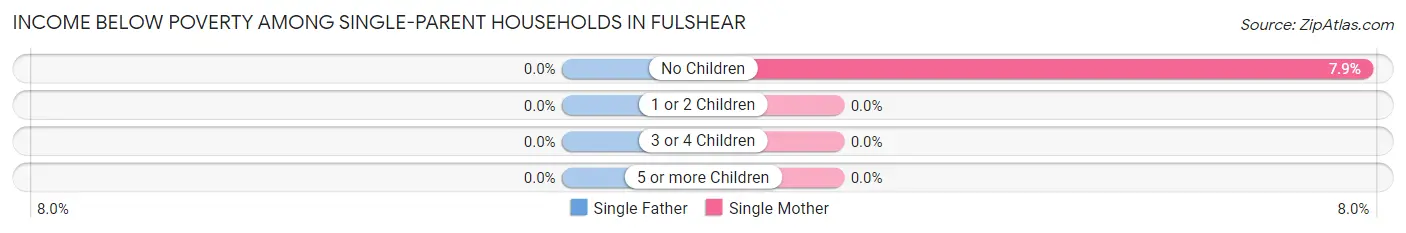
Income Below Poverty Among Single-Parent Households in Fulshear
| Children | Single Father | Single Mother |
| No Children | 0 (0.0%) | 13 (7.9%) |
| 1 or 2 Children | 0 (0.0%) | 0 (0.0%) |
| 3 or 4 Children | 0 (0.0%) | 0 (0.0%) |
| 5 or more Children | 0 (0.0%) | 0 (0.0%) |
| Total | 0 (0.0%) | 13 (6.1%) |
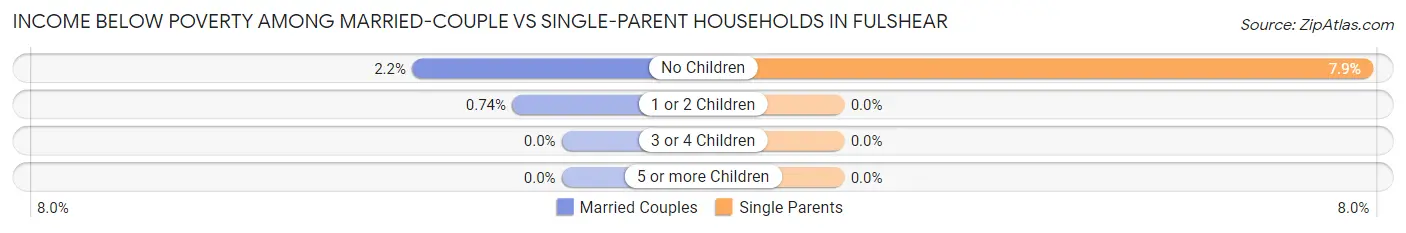
Income Below Poverty Among Married-Couple vs Single-Parent Households in Fulshear
The poverty data for Fulshear shows that 72 of the married-couple family households (1.2%) and 13 of the single-parent households (2.9%) are living below the poverty level. Within the married-couple family households, those with no children have the highest poverty rate, with 49 households (2.2%) falling below the poverty line. Among the single-parent households, those with no children have the highest poverty rate, with 13 household (7.9%) living below poverty.
| Children | Married-Couple Families | Single-Parent Households |
| No Children | 49 (2.2%) | 13 (7.9%) |
| 1 or 2 Children | 23 (0.7%) | 0 (0.0%) |
| 3 or 4 Children | 0 (0.0%) | 0 (0.0%) |
| 5 or more Children | 0 (0.0%) | 0 (0.0%) |
| Total | 72 (1.2%) | 13 (2.9%) |
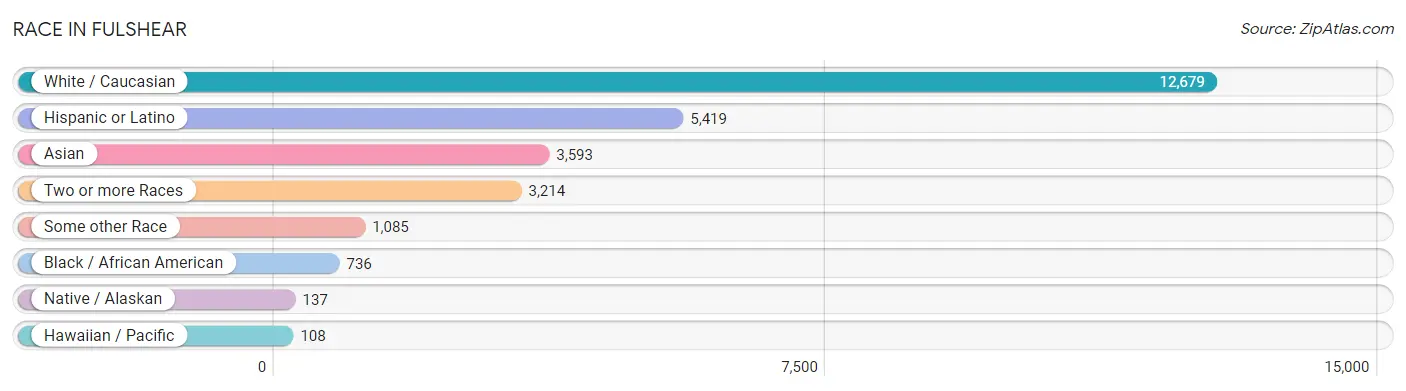
Race in Fulshear
The most populous races in Fulshear are White / Caucasian (12,679 | 58.8%), Hispanic or Latino (5,419 | 25.1%), and Asian (3,593 | 16.7%).
| Race | # Population | % Population |
| Asian | 3,593 | 16.7% |
| Black / African American | 736 | 3.4% |
| Hawaiian / Pacific | 108 | 0.5% |
| Hispanic or Latino | 5,419 | 25.1% |
| Native / Alaskan | 137 | 0.6% |
| White / Caucasian | 12,679 | 58.8% |
| Two or more Races | 3,214 | 14.9% |
| Some other Race | 1,085 | 5.0% |
| Total | 21,552 | 100.0% |
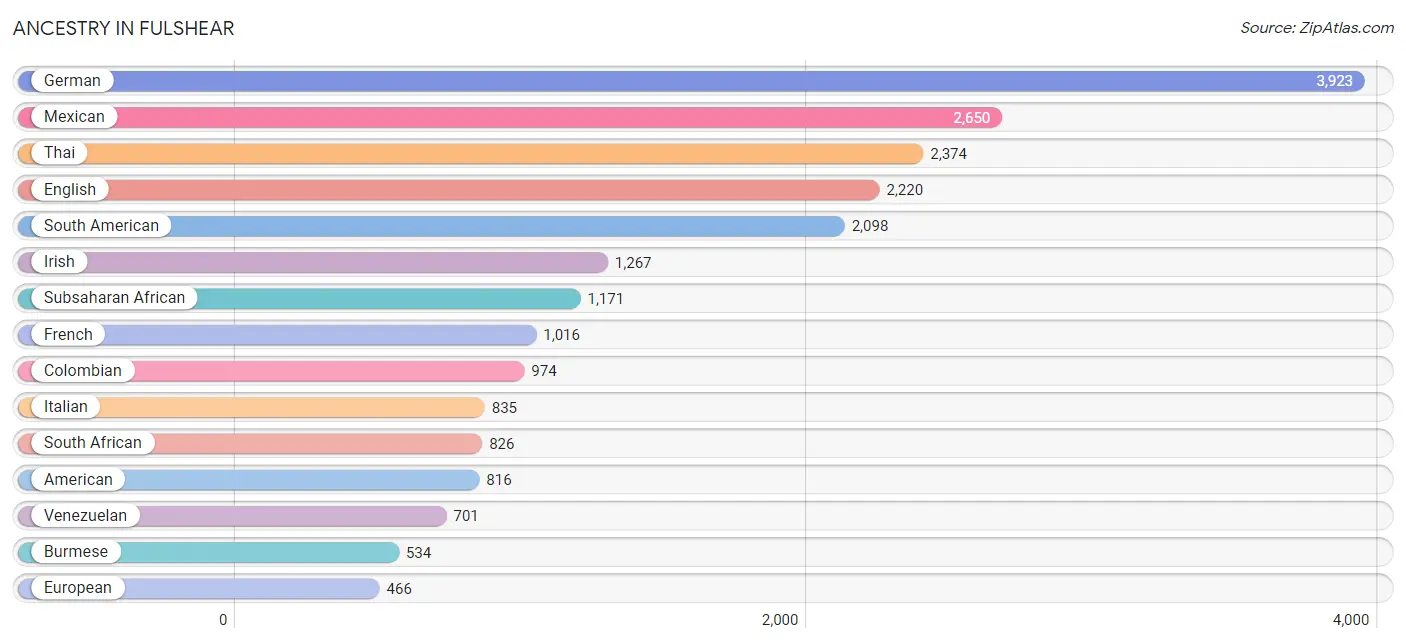
Ancestry in Fulshear
The most populous ancestries reported in Fulshear are German (3,923 | 18.2%), Mexican (2,650 | 12.3%), Thai (2,374 | 11.0%), English (2,220 | 10.3%), and South American (2,098 | 9.7%), together accounting for 61.5% of all Fulshear residents.
| Ancestry | # Population | % Population |
| African | 172 | 0.8% |
| American | 816 | 3.8% |
| Arab | 97 | 0.4% |
| Austrian | 28 | 0.1% |
| Basque | 65 | 0.3% |
| Brazilian | 16 | 0.1% |
| British | 131 | 0.6% |
| Burmese | 534 | 2.5% |
| Cajun | 30 | 0.1% |
| Canadian | 32 | 0.2% |
| Central American | 267 | 1.2% |
| Central American Indian | 137 | 0.6% |
| Cherokee | 47 | 0.2% |
| Colombian | 974 | 4.5% |
| Cuban | 40 | 0.2% |
| Czech | 425 | 2.0% |
| Czechoslovakian | 152 | 0.7% |
| Danish | 8 | 0.0% |
| Dutch | 49 | 0.2% |
| Eastern European | 18 | 0.1% |
| Ecuadorian | 24 | 0.1% |
| English | 2,220 | 10.3% |
| European | 466 | 2.2% |
| French | 1,016 | 4.7% |
| French Canadian | 6 | 0.0% |
| German | 3,923 | 18.2% |
| Greek | 6 | 0.0% |
| Guatemalan | 267 | 1.2% |
| Hungarian | 28 | 0.1% |
| Indian (Asian) | 341 | 1.6% |
| Iranian | 230 | 1.1% |
| Irish | 1,267 | 5.9% |
| Italian | 835 | 3.9% |
| Korean | 85 | 0.4% |
| Laotian | 138 | 0.6% |
| Lebanese | 48 | 0.2% |
| Lithuanian | 12 | 0.1% |
| Macedonian | 74 | 0.3% |
| Mexican | 2,650 | 12.3% |
| Nigerian | 173 | 0.8% |
| Northern European | 64 | 0.3% |
| Norwegian | 323 | 1.5% |
| Peruvian | 382 | 1.8% |
| Polish | 308 | 1.4% |
| Portuguese | 27 | 0.1% |
| Puerto Rican | 324 | 1.5% |
| Scotch-Irish | 157 | 0.7% |
| Scottish | 273 | 1.3% |
| Slavic | 8 | 0.0% |
| Slovak | 19 | 0.1% |
| South African | 826 | 3.8% |
| South American | 2,098 | 9.7% |
| Spaniard | 40 | 0.2% |
| Sri Lankan | 277 | 1.3% |
| Subsaharan African | 1,171 | 5.4% |
| Swedish | 144 | 0.7% |
| Thai | 2,374 | 11.0% |
| Uruguayan | 17 | 0.1% |
| Venezuelan | 701 | 3.3% |
| Welsh | 202 | 0.9% | View All 60 Rows |
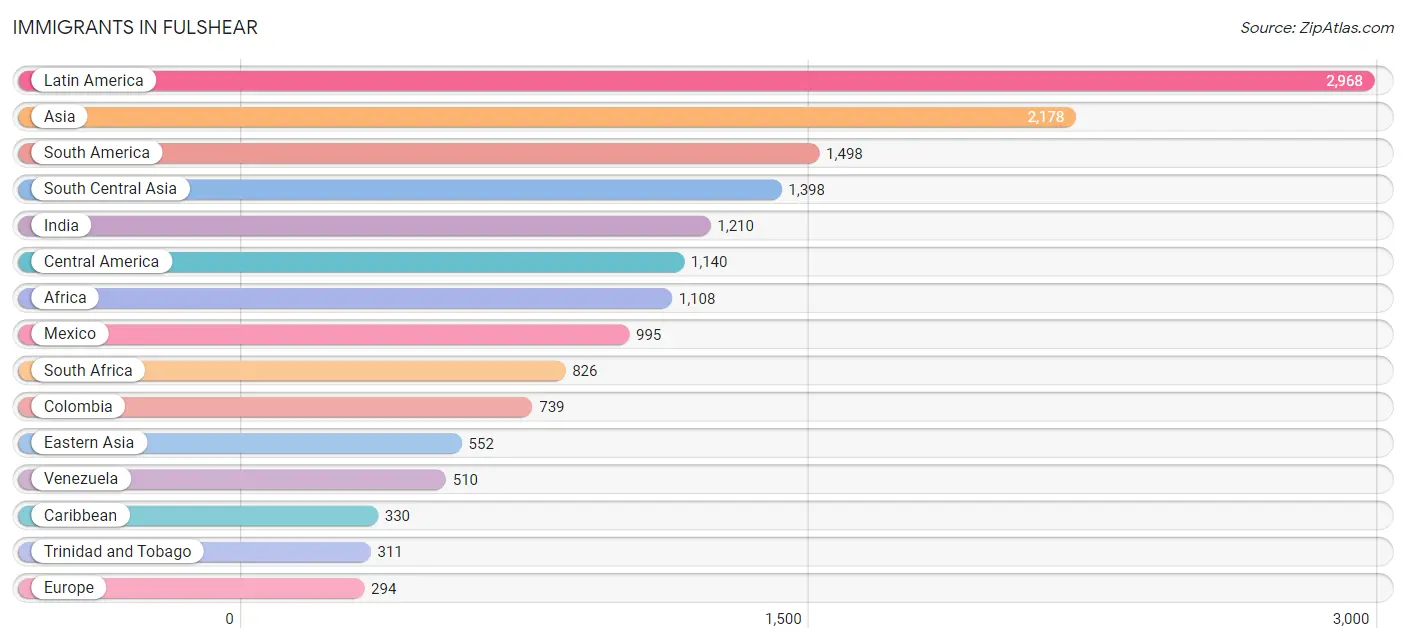
Immigrants in Fulshear
The most numerous immigrant groups reported in Fulshear came from Latin America (2,968 | 13.8%), Asia (2,178 | 10.1%), South America (1,498 | 7.0%), South Central Asia (1,398 | 6.5%), and India (1,210 | 5.6%), together accounting for 42.9% of all Fulshear residents.
| Immigration Origin | # Population | % Population |
| Africa | 1,108 | 5.1% |
| Asia | 2,178 | 10.1% |
| Brazil | 14 | 0.1% |
| Cameroon | 172 | 0.8% |
| Canada | 257 | 1.2% |
| Caribbean | 330 | 1.5% |
| Central America | 1,140 | 5.3% |
| China | 267 | 1.2% |
| Colombia | 739 | 3.4% |
| Cuba | 19 | 0.1% |
| Denmark | 4 | 0.0% |
| Eastern Asia | 552 | 2.6% |
| Eastern Europe | 86 | 0.4% |
| Ecuador | 24 | 0.1% |
| Europe | 294 | 1.4% |
| Germany | 61 | 0.3% |
| Guatemala | 145 | 0.7% |
| India | 1,210 | 5.6% |
| Indonesia | 92 | 0.4% |
| Iran | 188 | 0.9% |
| Korea | 285 | 1.3% |
| Latin America | 2,968 | 13.8% |
| Mexico | 995 | 4.6% |
| Middle Africa | 172 | 0.8% |
| Netherlands | 4 | 0.0% |
| Nigeria | 93 | 0.4% |
| North Macedonia | 86 | 0.4% |
| Northern Africa | 17 | 0.1% |
| Northern Europe | 143 | 0.7% |
| Peru | 194 | 0.9% |
| South Africa | 826 | 3.8% |
| South America | 1,498 | 7.0% |
| South Central Asia | 1,398 | 6.5% |
| South Eastern Asia | 228 | 1.1% |
| Sweden | 14 | 0.1% |
| Trinidad and Tobago | 311 | 1.4% |
| Uruguay | 17 | 0.1% |
| Venezuela | 510 | 2.4% |
| Vietnam | 136 | 0.6% |
| Western Africa | 93 | 0.4% |
| Western Europe | 65 | 0.3% | View All 41 Rows |
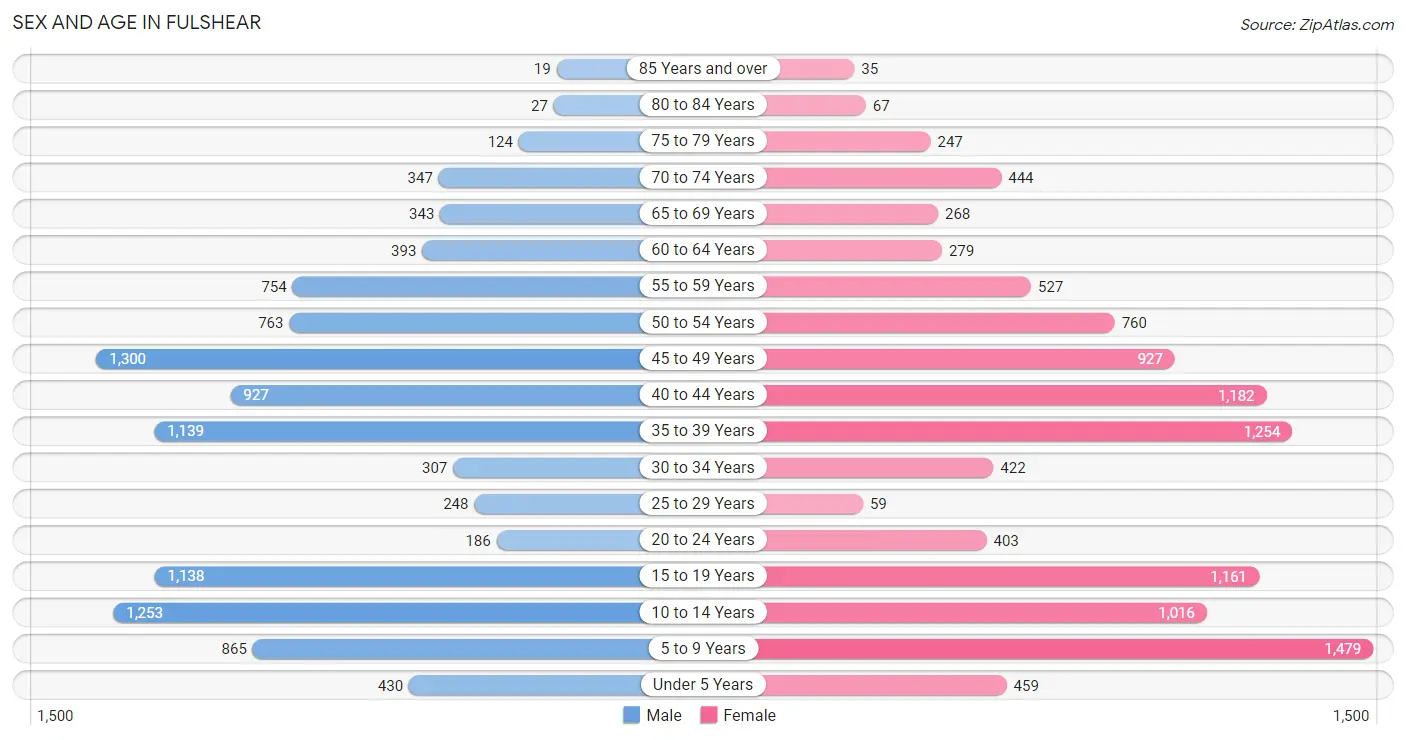
Sex and Age in Fulshear
Sex and Age in Fulshear
The most populous age groups in Fulshear are 45 to 49 Years (1,300 | 12.3%) for men and 5 to 9 Years (1,479 | 13.5%) for women.
| Age Bracket | Male | Female |
| Under 5 Years | 430 (4.1%) | 459 (4.2%) |
| 5 to 9 Years | 865 (8.2%) | 1,479 (13.5%) |
| 10 to 14 Years | 1,253 (11.9%) | 1,016 (9.2%) |
| 15 to 19 Years | 1,138 (10.8%) | 1,161 (10.6%) |
| 20 to 24 Years | 186 (1.8%) | 403 (3.7%) |
| 25 to 29 Years | 248 (2.4%) | 59 (0.5%) |
| 30 to 34 Years | 307 (2.9%) | 422 (3.8%) |
| 35 to 39 Years | 1,139 (10.8%) | 1,254 (11.4%) |
| 40 to 44 Years | 927 (8.8%) | 1,182 (10.8%) |
| 45 to 49 Years | 1,300 (12.3%) | 927 (8.4%) |
| 50 to 54 Years | 763 (7.2%) | 760 (6.9%) |
| 55 to 59 Years | 754 (7.1%) | 527 (4.8%) |
| 60 to 64 Years | 393 (3.7%) | 279 (2.5%) |
| 65 to 69 Years | 343 (3.3%) | 268 (2.4%) |
| 70 to 74 Years | 347 (3.3%) | 444 (4.0%) |
| 75 to 79 Years | 124 (1.2%) | 247 (2.2%) |
| 80 to 84 Years | 27 (0.3%) | 67 (0.6%) |
| 85 Years and over | 19 (0.2%) | 35 (0.3%) |
| Total | 10,563 (100.0%) | 10,989 (100.0%) |
Families and Households in Fulshear
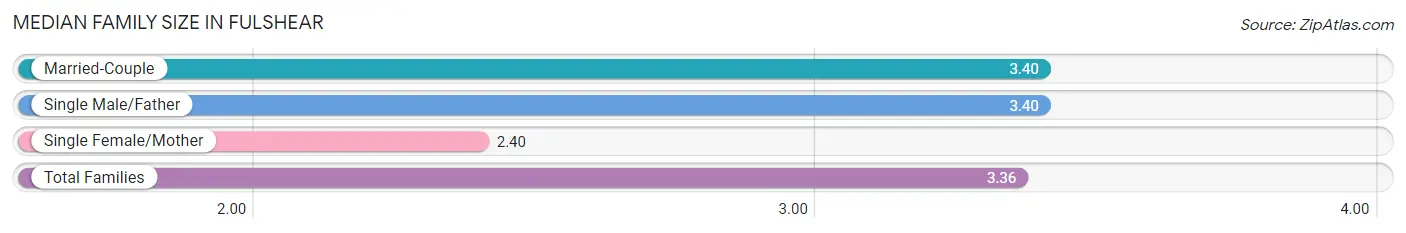
Median Family Size in Fulshear
The median family size in Fulshear is 3.36 persons per family, with married-couple families (5,843 | 92.8%) accounting for the largest median family size of 3.4 persons per family. On the other hand, single female/mother families (212 | 3.4%) represent the smallest median family size with 2.40 persons per family.
| Family Type | # Families | Family Size |
| Married-Couple | 5,843 (92.8%) | 3.40 |
| Single Male/Father | 243 (3.9%) | 3.40 |
| Single Female/Mother | 212 (3.4%) | 2.40 |
| Total Families | 6,298 (100.0%) | 3.36 |
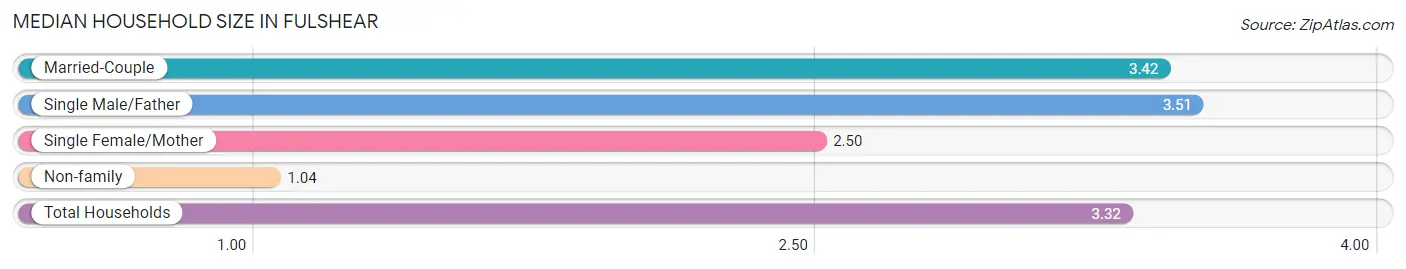
Median Household Size in Fulshear
The median household size in Fulshear is 3.32 persons per household, with single male/father households (243 | 3.7%) accounting for the largest median household size of 3.51 persons per household. non-family households (198 | 3.0%) represent the smallest median household size with 1.04 persons per household.
| Household Type | # Households | Household Size |
| Married-Couple | 5,843 (89.9%) | 3.42 |
| Single Male/Father | 243 (3.7%) | 3.51 |
| Single Female/Mother | 212 (3.3%) | 2.50 |
| Non-family | 198 (3.0%) | 1.04 |
| Total Households | 6,496 (100.0%) | 3.32 |
Household Size by Marriage Status in Fulshear
Out of a total of 6,496 households in Fulshear, 6,298 (97.0%) are family households, while 198 (3.0%) are nonfamily households. The most numerous type of family households are 4-person households, comprising 1,858, and the most common type of nonfamily households are 1-person households, comprising 190.
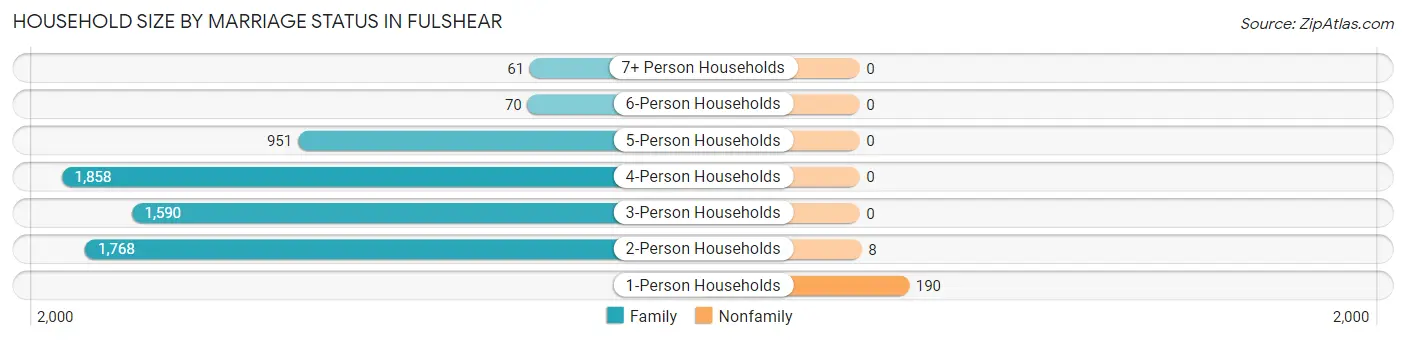
| Household Size | Family Households | Nonfamily Households |
| 1-Person Households | - | 190 (2.9%) |
| 2-Person Households | 1,768 (27.2%) | 8 (0.1%) |
| 3-Person Households | 1,590 (24.5%) | 0 (0.0%) |
| 4-Person Households | 1,858 (28.6%) | 0 (0.0%) |
| 5-Person Households | 951 (14.6%) | 0 (0.0%) |
| 6-Person Households | 70 (1.1%) | 0 (0.0%) |
| 7+ Person Households | 61 (0.9%) | 0 (0.0%) |
| Total | 6,298 (97.0%) | 198 (3.0%) |
Female Fertility in Fulshear
Fertility by Age in Fulshear
Average fertility rate in Fulshear is 22.0 births per 1,000 women. Women in the age bracket of 20 to 34 years have the highest fertility rate with 49.0 births per 1,000 women. Women in the age bracket of 35 to 50 years acount for 64.5% of all women with births.
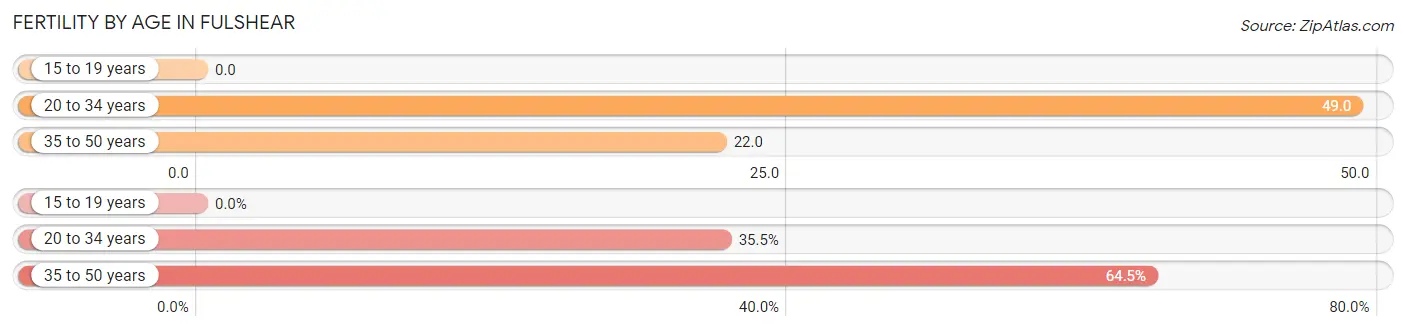
| Age Bracket | Women with Births | Births / 1,000 Women |
| 15 to 19 years | 0 (0.0%) | 0.0 |
| 20 to 34 years | 43 (35.5%) | 49.0 |
| 35 to 50 years | 78 (64.5%) | 22.0 |
| Total | 121 (100.0%) | 22.0 |
Fertility by Age by Marriage Status in Fulshear
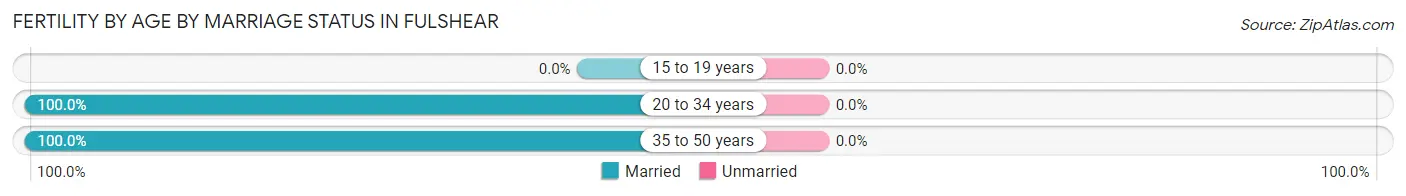
| Age Bracket | Married | Unmarried |
| 15 to 19 years | 0 (0.0%) | 0 (0.0%) |
| 20 to 34 years | 43 (100.0%) | 0 (0.0%) |
| 35 to 50 years | 78 (100.0%) | 0 (0.0%) |
| Total | 121 (100.0%) | 0 (0.0%) |
Fertility by Education in Fulshear
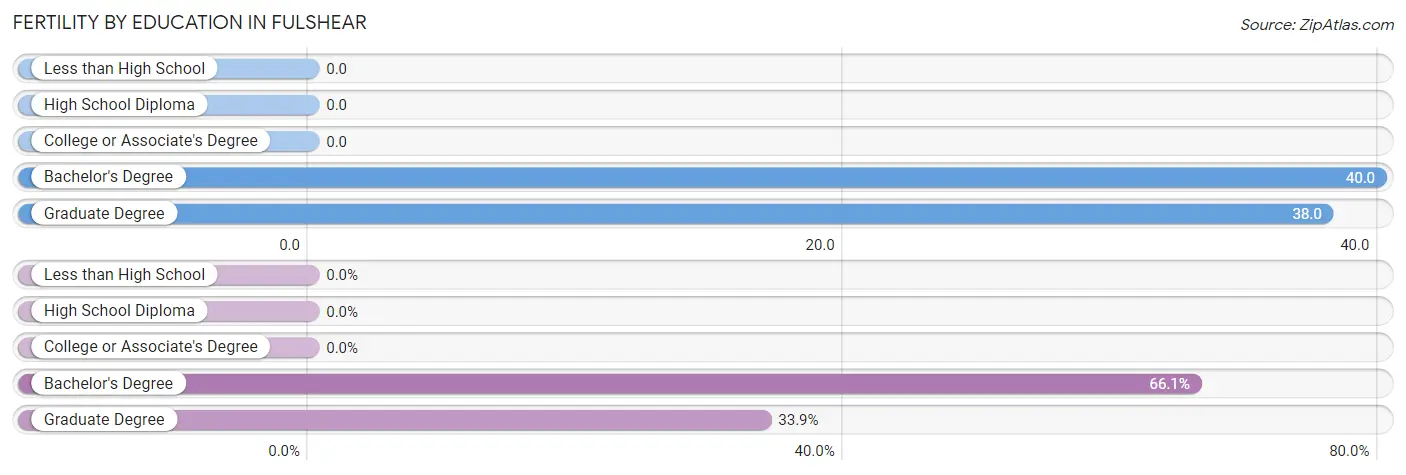
| Educational Attainment | Women with Births | Births / 1,000 Women |
| Less than High School | 0 (0.0%) | 0.0 |
| High School Diploma | 0 (0.0%) | 0.0 |
| College or Associate's Degree | 0 (0.0%) | 0.0 |
| Bachelor's Degree | 80 (66.1%) | 40.0 |
| Graduate Degree | 41 (33.9%) | 38.0 |
| Total | 121 (100.0%) | 22.0 |
Fertility by Education by Marriage Status in Fulshear

| Educational Attainment | Married | Unmarried |
| Less than High School | 0 (0.0%) | 0 (0.0%) |
| High School Diploma | 0 (0.0%) | 0 (0.0%) |
| College or Associate's Degree | 0 (0.0%) | 0 (0.0%) |
| Bachelor's Degree | 80 (100.0%) | 0 (0.0%) |
| Graduate Degree | 41 (100.0%) | 0 (0.0%) |
| Total | 121 (100.0%) | 0 (0.0%) |
Employment Characteristics in Fulshear
Employment by Class of Employer in Fulshear
Among the 9,385 employed individuals in Fulshear, private company employees (6,936 | 73.9%), local government employees (690 | 7.3%), and self-employed (incorporated) (582 | 6.2%) make up the most common classes of employment.
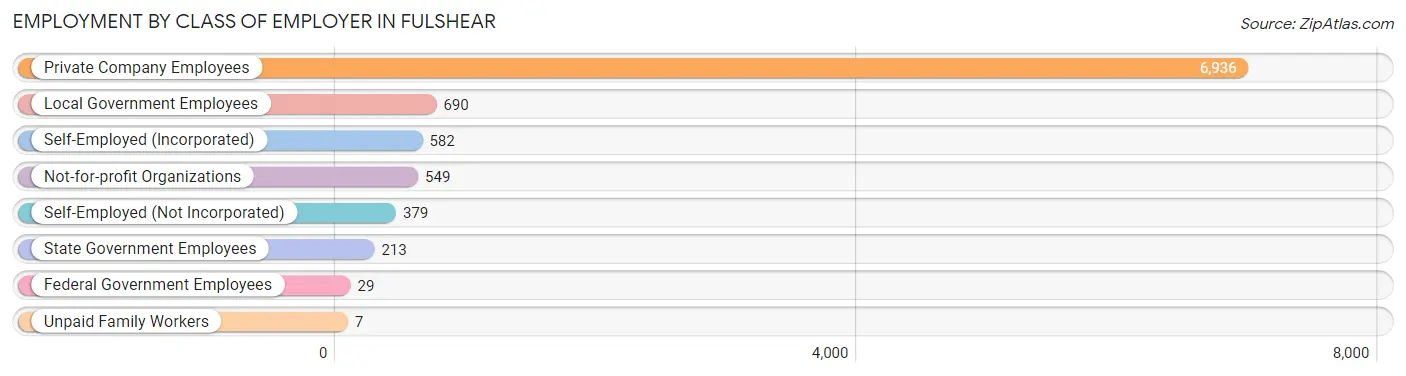
| Employer Class | # Employees | % Employees |
| Private Company Employees | 6,936 | 73.9% |
| Self-Employed (Incorporated) | 582 | 6.2% |
| Self-Employed (Not Incorporated) | 379 | 4.0% |
| Not-for-profit Organizations | 549 | 5.9% |
| Local Government Employees | 690 | 7.3% |
| State Government Employees | 213 | 2.3% |
| Federal Government Employees | 29 | 0.3% |
| Unpaid Family Workers | 7 | 0.1% |
| Total | 9,385 | 100.0% |
Employment Status by Age in Fulshear
According to the labor force statistics for Fulshear, out of the total population over 16 years of age (15,747), 63.1% or 9,936 individuals are in the labor force, with 4.9% or 487 of them unemployed. The age group with the highest labor force participation rate is 55 to 59 years, with 83.5% or 1,070 individuals in the labor force. Within the labor force, the 25 to 29 years age range has the highest percentage of unemployed individuals, with 25.6% or 58 of them being unemployed.
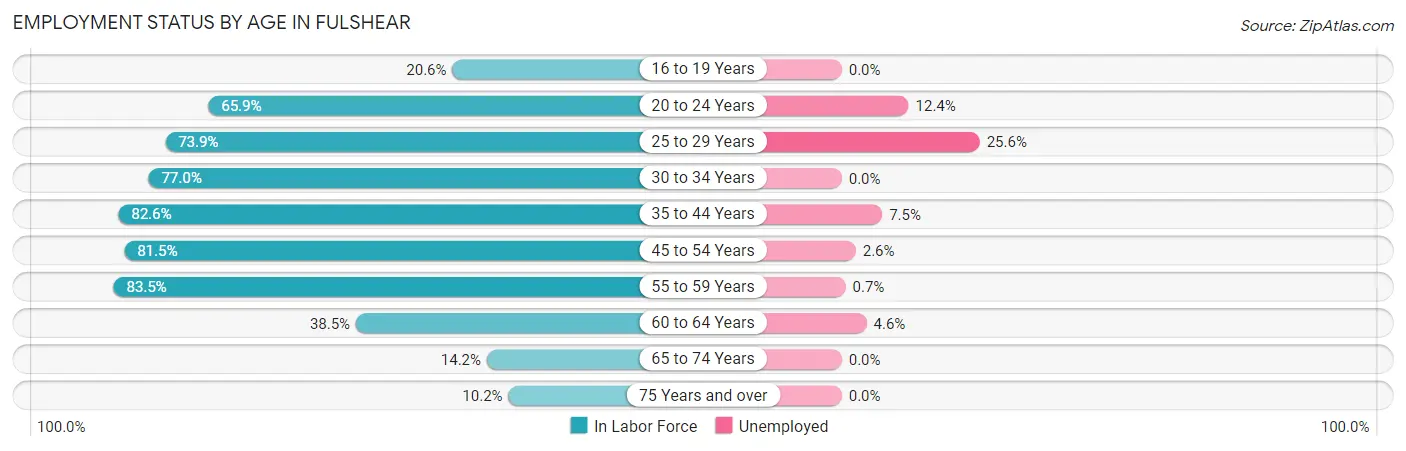
| Age Bracket | In Labor Force | Unemployed |
| 16 to 19 Years | 411 (20.6%) | 0 (0.0%) |
| 20 to 24 Years | 388 (65.9%) | 48 (12.4%) |
| 25 to 29 Years | 227 (73.9%) | 58 (25.6%) |
| 30 to 34 Years | 561 (77.0%) | 0 (0.0%) |
| 35 to 44 Years | 3,719 (82.6%) | 279 (7.5%) |
| 45 to 54 Years | 3,056 (81.5%) | 79 (2.6%) |
| 55 to 59 Years | 1,070 (83.5%) | 7 (0.7%) |
| 60 to 64 Years | 259 (38.5%) | 12 (4.6%) |
| 65 to 74 Years | 199 (14.2%) | 0 (0.0%) |
| 75 Years and over | 53 (10.2%) | 0 (0.0%) |
| Total | 9,936 (63.1%) | 487 (4.9%) |
Employment Status by Educational Attainment in Fulshear
According to labor force statistics for Fulshear, 79.1% of individuals (8,892) out of the total population between 25 and 64 years of age (11,241) are in the labor force, with 4.9% or 436 of them being unemployed. The group with the highest labor force participation rate are those with the educational attainment of bachelor's degree or higher, with 83.7% or 7,257 individuals in the labor force. Within the labor force, individuals with bachelor's degree or higher education have the highest percentage of unemployment, with 5.2% or 377 of them being unemployed.
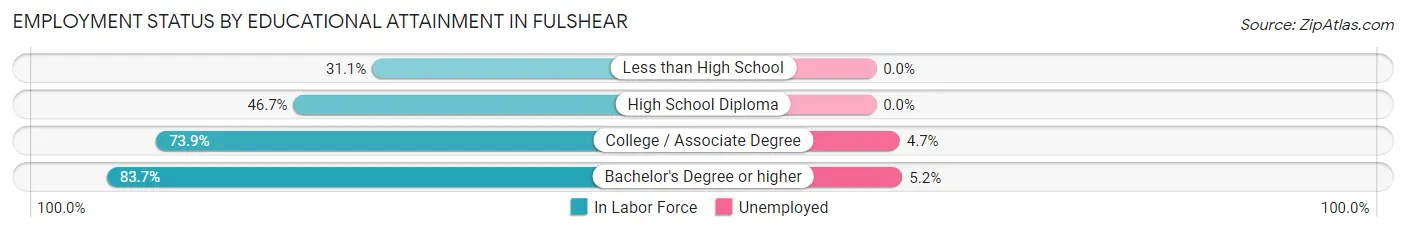
| Educational Attainment | In Labor Force | Unemployed |
| Less than High School | 38 (31.1%) | 0 (0.0%) |
| High School Diploma | 361 (46.7%) | 0 (0.0%) |
| College / Associate Degree | 1,239 (73.9%) | 79 (4.7%) |
| Bachelor's Degree or higher | 7,257 (83.7%) | 451 (5.2%) |
| Total | 8,892 (79.1%) | 551 (4.9%) |
Employment Occupations by Sex in Fulshear
Management, Business, Science and Arts Occupations
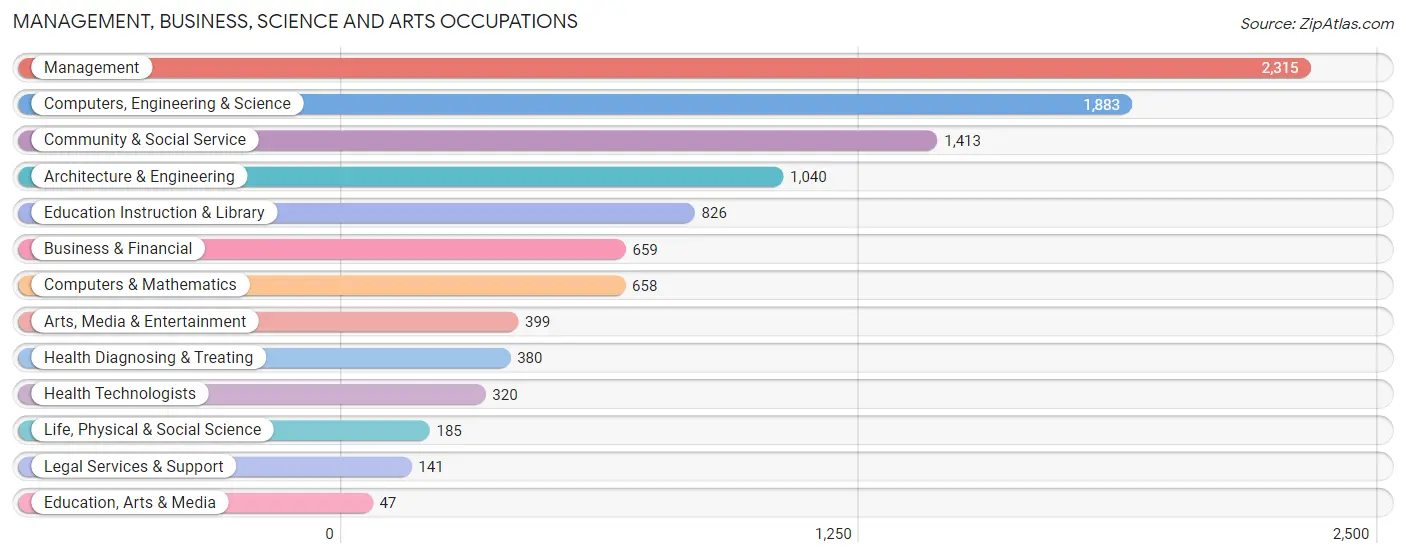
The most common Management, Business, Science and Arts occupations in Fulshear are Management (2,315 | 24.5%), Computers, Engineering & Science (1,883 | 19.9%), Community & Social Service (1,413 | 14.9%), Architecture & Engineering (1,040 | 11.0%), and Education Instruction & Library (826 | 8.7%).
Management, Business, Science and Arts Occupations by Sex
Within the Management, Business, Science and Arts occupations in Fulshear, the most male-oriented occupations are Legal Services & Support (100.0%), Architecture & Engineering (98.5%), and Computers, Engineering & Science (91.4%), while the most female-oriented occupations are Education, Arts & Media (100.0%), Education Instruction & Library (89.6%), and Arts, Media & Entertainment (85.7%).
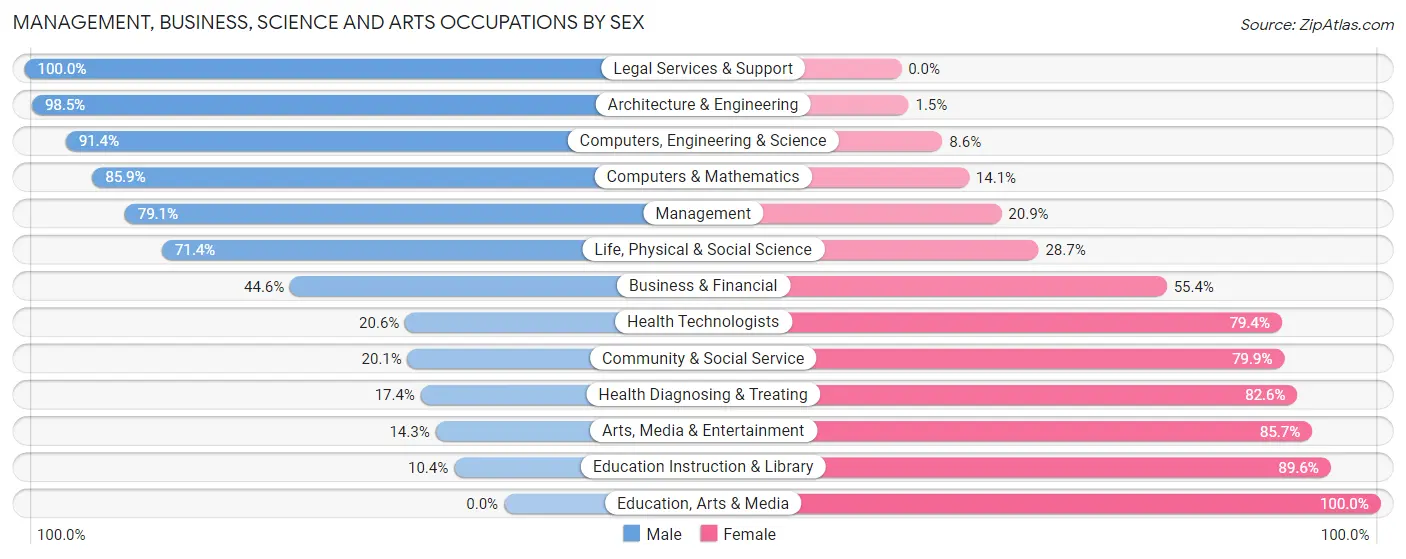
| Occupation | Male | Female |
| Management | 1,831 (79.1%) | 484 (20.9%) |
| Business & Financial | 294 (44.6%) | 365 (55.4%) |
| Computers, Engineering & Science | 1,721 (91.4%) | 162 (8.6%) |
| Computers & Mathematics | 565 (85.9%) | 93 (14.1%) |
| Architecture & Engineering | 1,024 (98.5%) | 16 (1.5%) |
| Life, Physical & Social Science | 132 (71.4%) | 53 (28.6%) |
| Community & Social Service | 284 (20.1%) | 1,129 (79.9%) |
| Education, Arts & Media | 0 (0.0%) | 47 (100.0%) |
| Legal Services & Support | 141 (100.0%) | 0 (0.0%) |
| Education Instruction & Library | 86 (10.4%) | 740 (89.6%) |
| Arts, Media & Entertainment | 57 (14.3%) | 342 (85.7%) |
| Health Diagnosing & Treating | 66 (17.4%) | 314 (82.6%) |
| Health Technologists | 66 (20.6%) | 254 (79.4%) |
| Total (Category) | 4,196 (63.1%) | 2,454 (36.9%) |
| Total (Overall) | 5,688 (60.1%) | 3,772 (39.9%) |
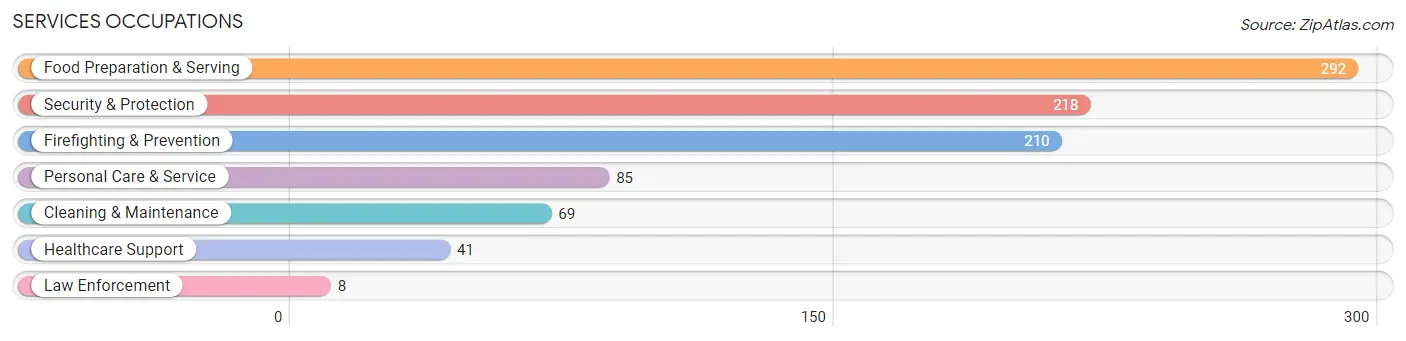
Services Occupations
The most common Services occupations in Fulshear are Food Preparation & Serving (292 | 3.1%), Security & Protection (218 | 2.3%), Firefighting & Prevention (210 | 2.2%), Personal Care & Service (85 | 0.9%), and Cleaning & Maintenance (69 | 0.7%).
Services Occupations by Sex
Within the Services occupations in Fulshear, the most male-oriented occupations are Security & Protection (100.0%), Firefighting & Prevention (100.0%), and Law Enforcement (100.0%), while the most female-oriented occupations are Healthcare Support (100.0%), Personal Care & Service (100.0%), and Food Preparation & Serving (89.0%).
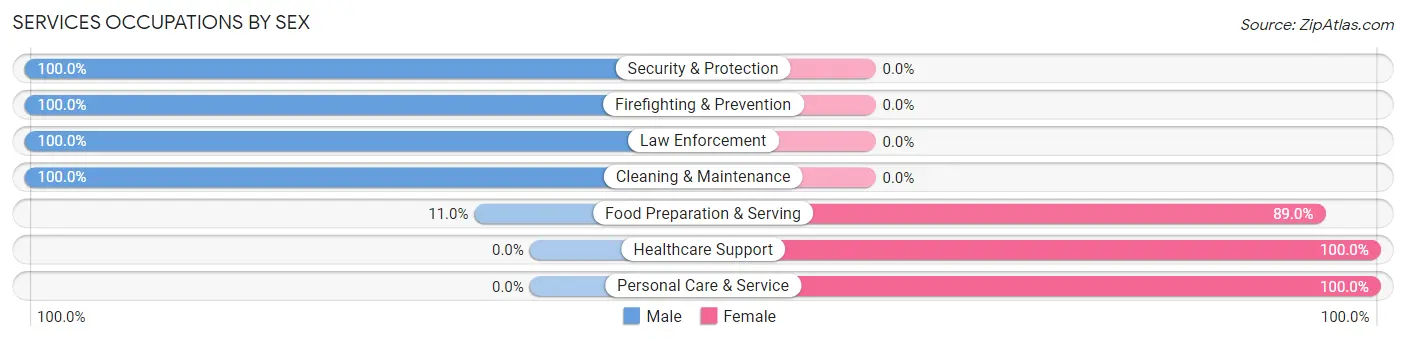
| Occupation | Male | Female |
| Healthcare Support | 0 (0.0%) | 41 (100.0%) |
| Security & Protection | 218 (100.0%) | 0 (0.0%) |
| Firefighting & Prevention | 210 (100.0%) | 0 (0.0%) |
| Law Enforcement | 8 (100.0%) | 0 (0.0%) |
| Food Preparation & Serving | 32 (11.0%) | 260 (89.0%) |
| Cleaning & Maintenance | 69 (100.0%) | 0 (0.0%) |
| Personal Care & Service | 0 (0.0%) | 85 (100.0%) |
| Total (Category) | 319 (45.3%) | 386 (54.7%) |
| Total (Overall) | 5,688 (60.1%) | 3,772 (39.9%) |
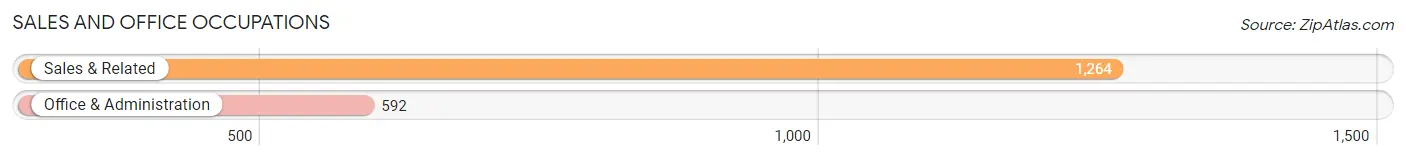
Sales and Office Occupations
The most common Sales and Office occupations in Fulshear are Sales & Related (1,264 | 13.4%), and Office & Administration (592 | 6.3%).
Sales and Office Occupations by Sex
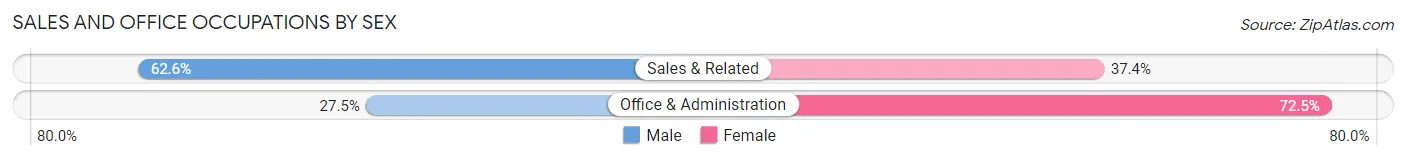
| Occupation | Male | Female |
| Sales & Related | 791 (62.6%) | 473 (37.4%) |
| Office & Administration | 163 (27.5%) | 429 (72.5%) |
| Total (Category) | 954 (51.4%) | 902 (48.6%) |
| Total (Overall) | 5,688 (60.1%) | 3,772 (39.9%) |
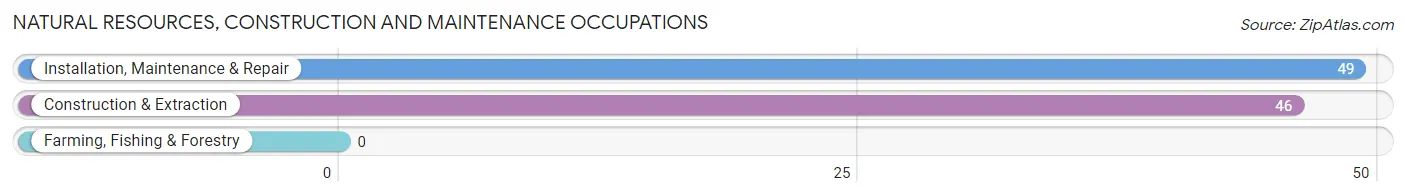
Natural Resources, Construction and Maintenance Occupations
The most common Natural Resources, Construction and Maintenance occupations in Fulshear are Installation, Maintenance & Repair (49 | 0.5%), and Construction & Extraction (46 | 0.5%).
Natural Resources, Construction and Maintenance Occupations by Sex
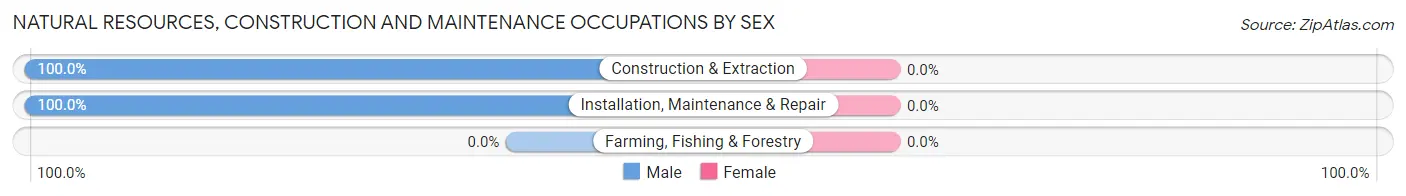
| Occupation | Male | Female |
| Farming, Fishing & Forestry | 0 (0.0%) | 0 (0.0%) |
| Construction & Extraction | 46 (100.0%) | 0 (0.0%) |
| Installation, Maintenance & Repair | 49 (100.0%) | 0 (0.0%) |
| Total (Category) | 95 (100.0%) | 0 (0.0%) |
| Total (Overall) | 5,688 (60.1%) | 3,772 (39.9%) |
Production, Transportation and Moving Occupations
The most common Production, Transportation and Moving occupations in Fulshear are Production (123 | 1.3%), and Material Moving (31 | 0.3%).
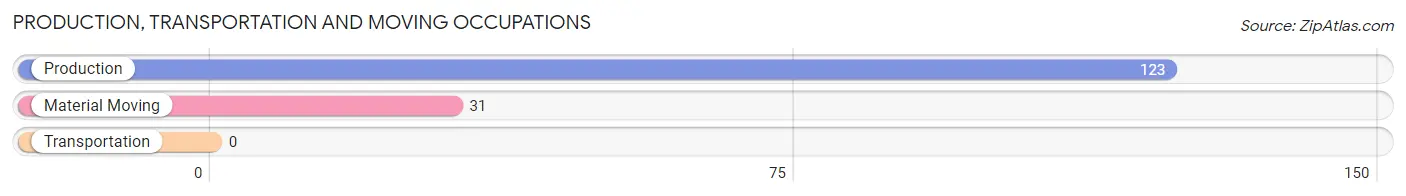
Production, Transportation and Moving Occupations by Sex
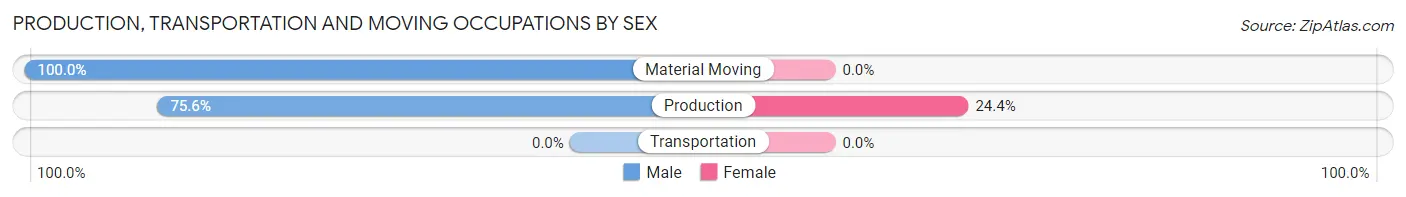
| Occupation | Male | Female |
| Production | 93 (75.6%) | 30 (24.4%) |
| Transportation | 0 (0.0%) | 0 (0.0%) |
| Material Moving | 31 (100.0%) | 0 (0.0%) |
| Total (Category) | 124 (80.5%) | 30 (19.5%) |
| Total (Overall) | 5,688 (60.1%) | 3,772 (39.9%) |
Employment Industries by Sex in Fulshear
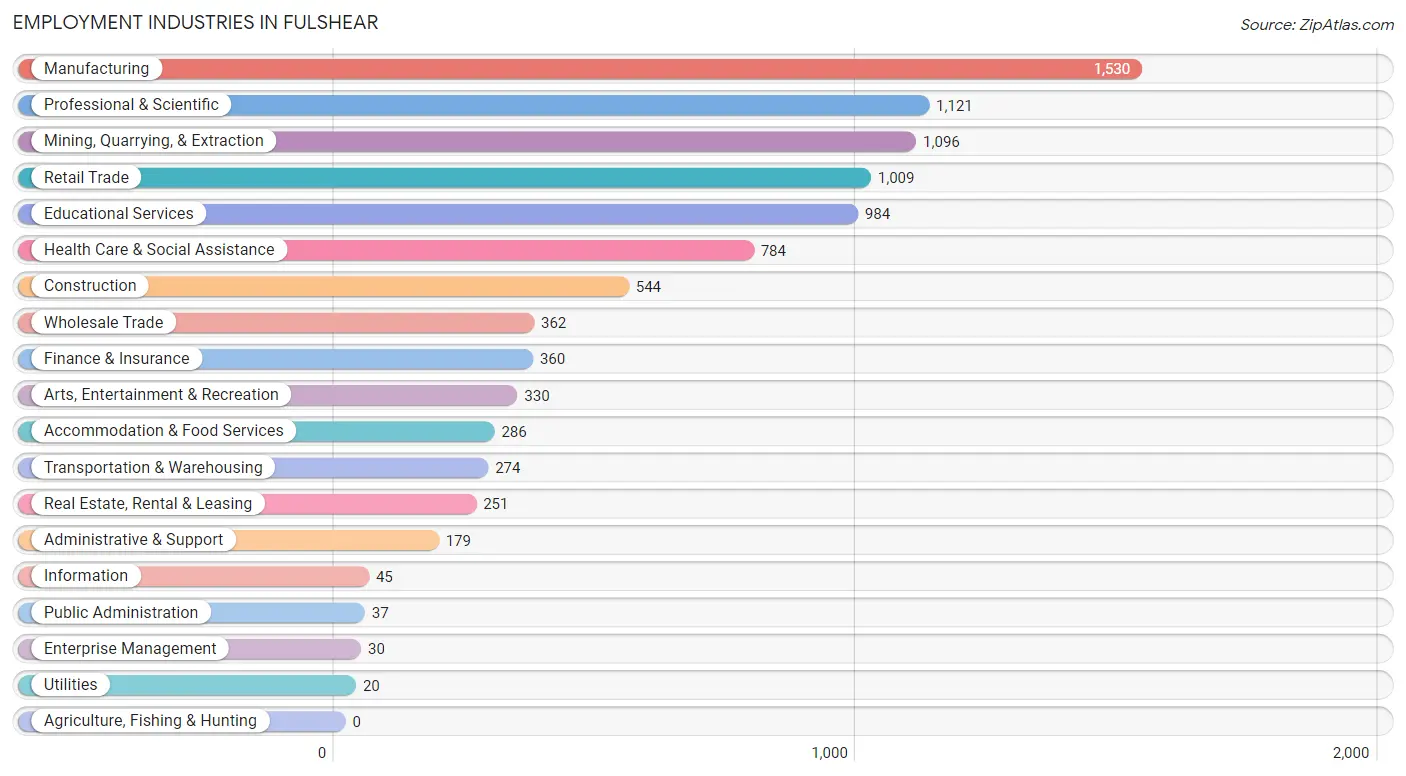
Employment Industries in Fulshear
The major employment industries in Fulshear include Manufacturing (1,530 | 16.2%), Professional & Scientific (1,121 | 11.8%), Mining, Quarrying, & Extraction (1,096 | 11.6%), Retail Trade (1,009 | 10.7%), and Educational Services (984 | 10.4%).
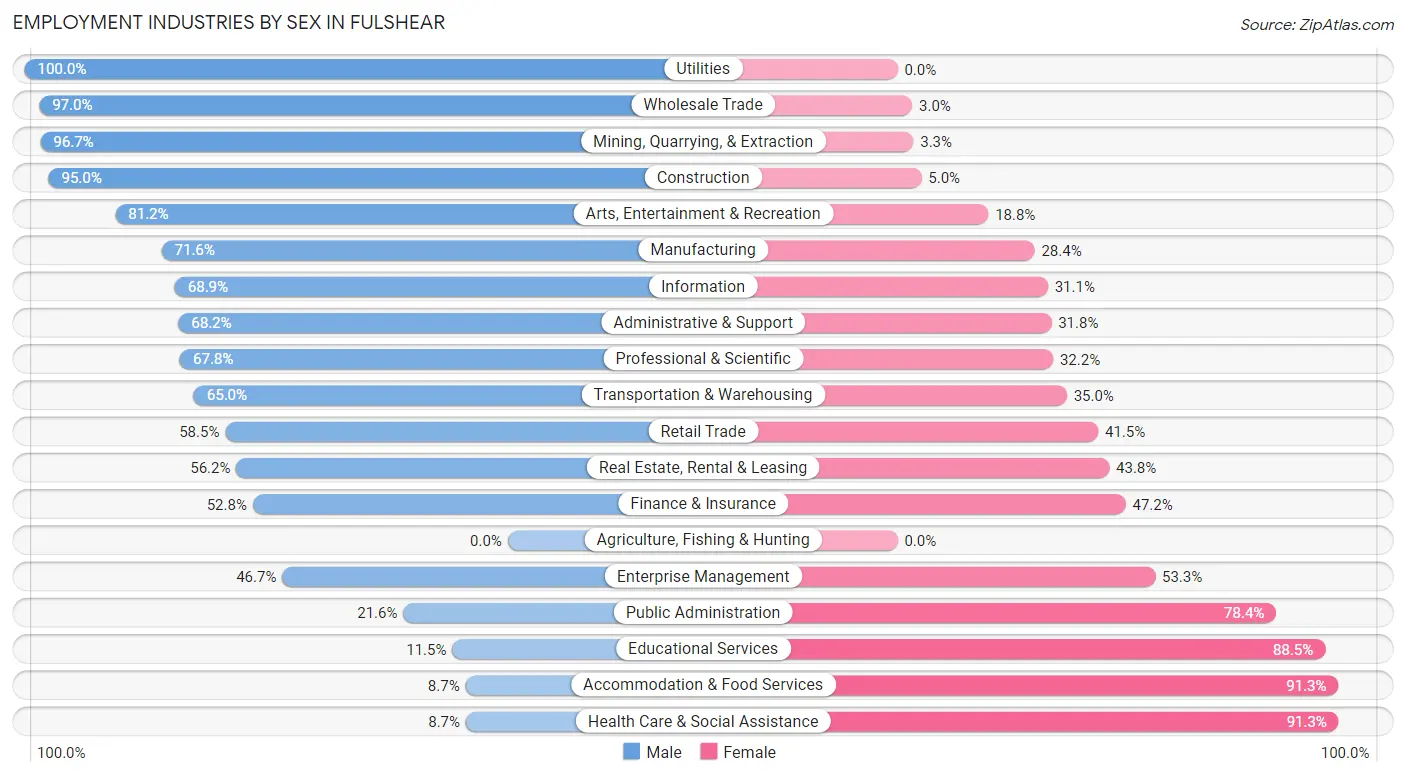
Employment Industries by Sex in Fulshear
The Fulshear industries that see more men than women are Utilities (100.0%), Wholesale Trade (97.0%), and Mining, Quarrying, & Extraction (96.7%), whereas the industries that tend to have a higher number of women are Health Care & Social Assistance (91.3%), Accommodation & Food Services (91.3%), and Educational Services (88.5%).
| Industry | Male | Female |
| Agriculture, Fishing & Hunting | 0 (0.0%) | 0 (0.0%) |
| Mining, Quarrying, & Extraction | 1,060 (96.7%) | 36 (3.3%) |
| Construction | 517 (95.0%) | 27 (5.0%) |
| Manufacturing | 1,096 (71.6%) | 434 (28.4%) |
| Wholesale Trade | 351 (97.0%) | 11 (3.0%) |
| Retail Trade | 590 (58.5%) | 419 (41.5%) |
| Transportation & Warehousing | 178 (65.0%) | 96 (35.0%) |
| Utilities | 20 (100.0%) | 0 (0.0%) |
| Information | 31 (68.9%) | 14 (31.1%) |
| Finance & Insurance | 190 (52.8%) | 170 (47.2%) |
| Real Estate, Rental & Leasing | 141 (56.2%) | 110 (43.8%) |
| Professional & Scientific | 760 (67.8%) | 361 (32.2%) |
| Enterprise Management | 14 (46.7%) | 16 (53.3%) |
| Administrative & Support | 122 (68.2%) | 57 (31.8%) |
| Educational Services | 113 (11.5%) | 871 (88.5%) |
| Health Care & Social Assistance | 68 (8.7%) | 716 (91.3%) |
| Arts, Entertainment & Recreation | 268 (81.2%) | 62 (18.8%) |
| Accommodation & Food Services | 25 (8.7%) | 261 (91.3%) |
| Public Administration | 8 (21.6%) | 29 (78.4%) |
| Total | 5,688 (60.1%) | 3,772 (39.9%) |
Education in Fulshear
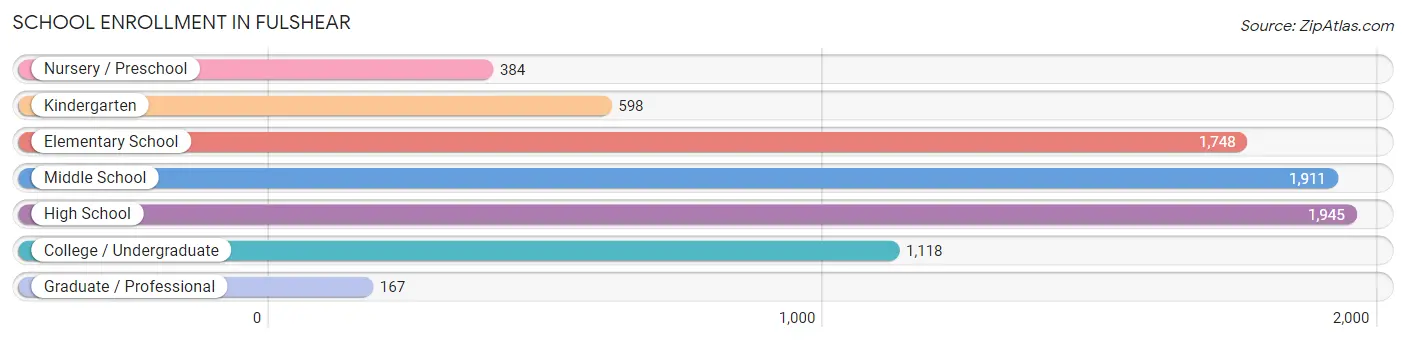
School Enrollment in Fulshear
The most common levels of schooling among the 7,871 students in Fulshear are high school (1,945 | 24.7%), middle school (1,911 | 24.3%), and elementary school (1,748 | 22.2%).
| School Level | # Students | % Students |
| Nursery / Preschool | 384 | 4.9% |
| Kindergarten | 598 | 7.6% |
| Elementary School | 1,748 | 22.2% |
| Middle School | 1,911 | 24.3% |
| High School | 1,945 | 24.7% |
| College / Undergraduate | 1,118 | 14.2% |
| Graduate / Professional | 167 | 2.1% |
| Total | 7,871 | 100.0% |
School Enrollment by Age by Funding Source in Fulshear
Out of a total of 7,871 students who are enrolled in schools in Fulshear, 779 (9.9%) attend a private institution, while the remaining 7,092 (90.1%) are enrolled in public schools. The age group of 3 to 4 year olds has the highest likelihood of being enrolled in private schools, with 218 (61.1% in the age bracket) enrolled. Conversely, the age group of 25 to 34 year olds has the lowest likelihood of being enrolled in a private school, with 37 (100.0% in the age bracket) attending a public institution.
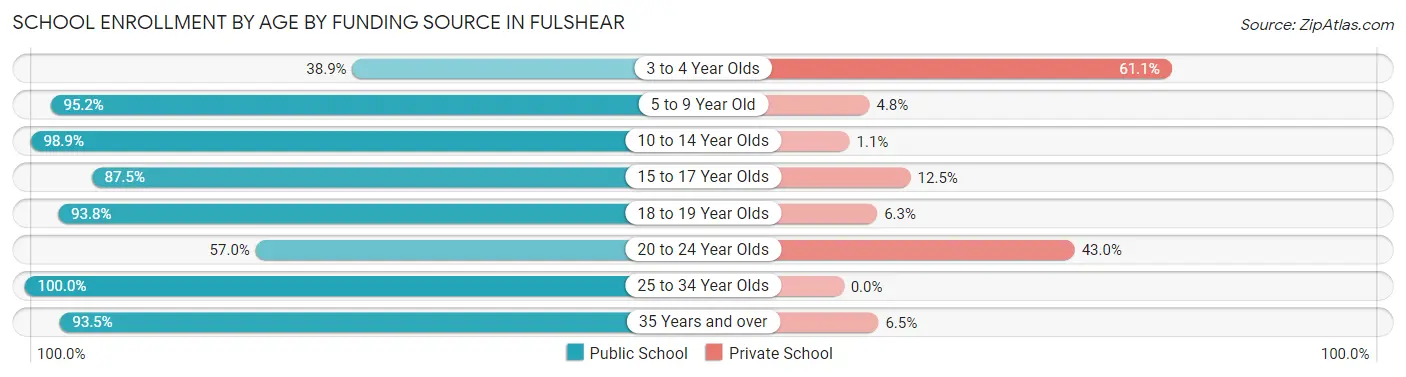
| Age Bracket | Public School | Private School |
| 3 to 4 Year Olds | 139 (38.9%) | 218 (61.1%) |
| 5 to 9 Year Old | 2,093 (95.2%) | 106 (4.8%) |
| 10 to 14 Year Olds | 2,244 (98.9%) | 25 (1.1%) |
| 15 to 17 Year Olds | 1,332 (87.5%) | 190 (12.5%) |
| 18 to 19 Year Olds | 720 (93.8%) | 48 (6.2%) |
| 20 to 24 Year Olds | 225 (57.0%) | 170 (43.0%) |
| 25 to 34 Year Olds | 37 (100.0%) | 0 (0.0%) |
| 35 Years and over | 303 (93.5%) | 21 (6.5%) |
| Total | 7,092 (90.1%) | 779 (9.9%) |
Educational Attainment by Field of Study in Fulshear
Engineering (2,583 | 25.2%), business (2,469 | 24.1%), education (879 | 8.6%), social sciences (854 | 8.3%), and science & technology (815 | 8.0%) are the most common fields of study among 10,252 individuals in Fulshear who have obtained a bachelor's degree or higher.
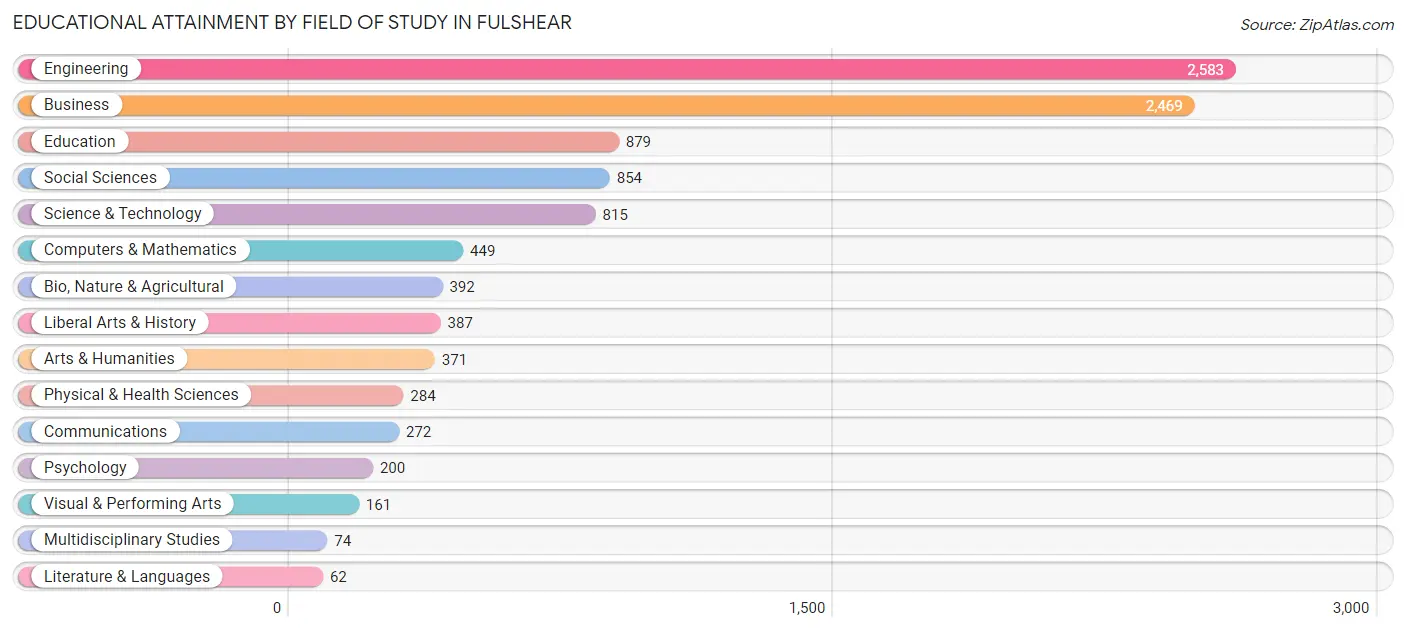
| Field of Study | # Graduates | % Graduates |
| Computers & Mathematics | 449 | 4.4% |
| Bio, Nature & Agricultural | 392 | 3.8% |
| Physical & Health Sciences | 284 | 2.8% |
| Psychology | 200 | 1.9% |
| Social Sciences | 854 | 8.3% |
| Engineering | 2,583 | 25.2% |
| Multidisciplinary Studies | 74 | 0.7% |
| Science & Technology | 815 | 8.0% |
| Business | 2,469 | 24.1% |
| Education | 879 | 8.6% |
| Literature & Languages | 62 | 0.6% |
| Liberal Arts & History | 387 | 3.8% |
| Visual & Performing Arts | 161 | 1.6% |
| Communications | 272 | 2.6% |
| Arts & Humanities | 371 | 3.6% |
| Total | 10,252 | 100.0% |
Transportation & Commute in Fulshear
Vehicle Availability by Sex in Fulshear
The most prevalent vehicle ownership categories in Fulshear are males with 2 vehicles (3,827, accounting for 67.3%) and females with 2 vehicles (2,106, making up 103.6%).
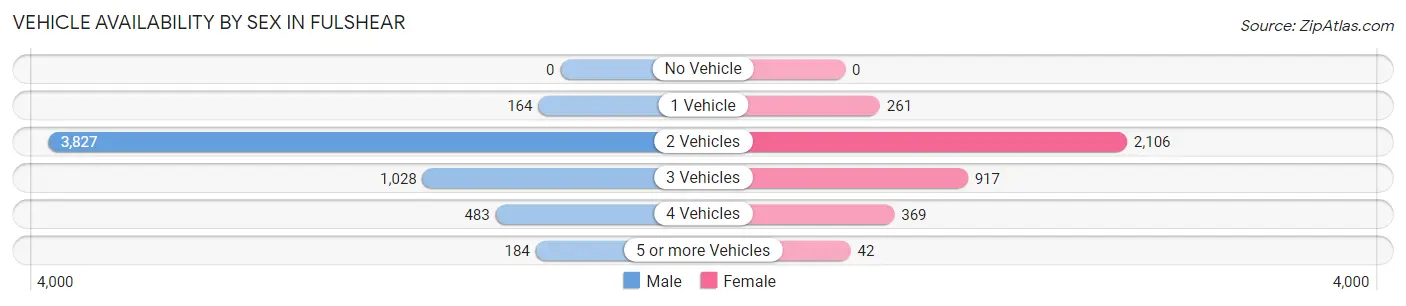
| Vehicles Available | Male | Female |
| No Vehicle | 0 (0.0%) | 0 (0.0%) |
| 1 Vehicle | 164 (2.9%) | 261 (7.1%) |
| 2 Vehicles | 3,827 (67.3%) | 2,106 (57.0%) |
| 3 Vehicles | 1,028 (18.1%) | 917 (24.8%) |
| 4 Vehicles | 483 (8.5%) | 369 (10.0%) |
| 5 or more Vehicles | 184 (3.2%) | 42 (1.1%) |
| Total | 5,686 (100.0%) | 3,695 (100.0%) |
Commute Time in Fulshear
The most frequently occuring commute durations in Fulshear are 45 to 59 minutes (1,855 commuters, 25.5%), 30 to 34 minutes (864 commuters, 11.9%), and 60 to 89 minutes (803 commuters, 11.0%).
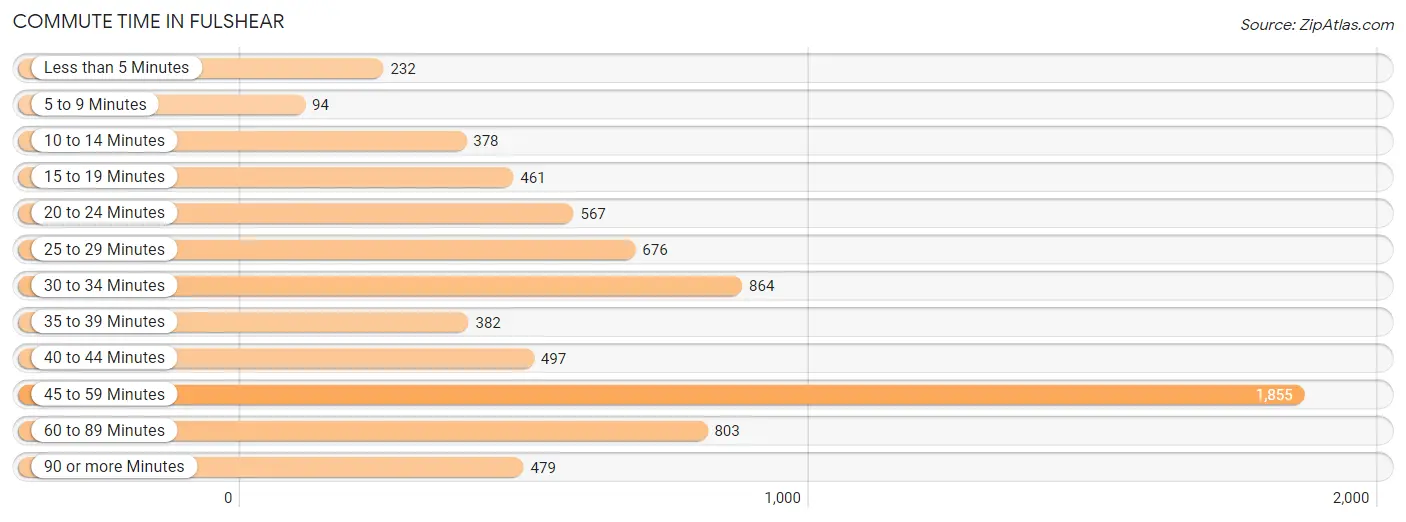
| Commute Time | # Commuters | % Commuters |
| Less than 5 Minutes | 232 | 3.2% |
| 5 to 9 Minutes | 94 | 1.3% |
| 10 to 14 Minutes | 378 | 5.2% |
| 15 to 19 Minutes | 461 | 6.3% |
| 20 to 24 Minutes | 567 | 7.8% |
| 25 to 29 Minutes | 676 | 9.3% |
| 30 to 34 Minutes | 864 | 11.9% |
| 35 to 39 Minutes | 382 | 5.2% |
| 40 to 44 Minutes | 497 | 6.8% |
| 45 to 59 Minutes | 1,855 | 25.5% |
| 60 to 89 Minutes | 803 | 11.0% |
| 90 or more Minutes | 479 | 6.6% |
Commute Time by Sex in Fulshear
The most common commute times in Fulshear are 45 to 59 minutes (1,339 commuters, 29.0%) for males and 45 to 59 minutes (516 commuters, 19.4%) for females.
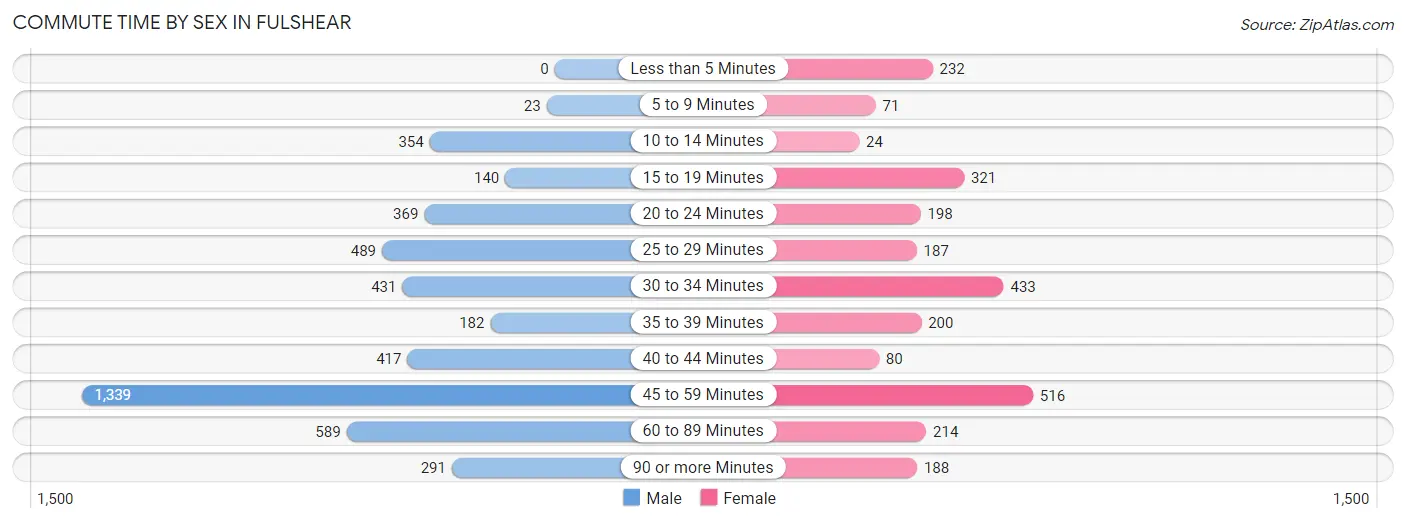
| Commute Time | Male | Female |
| Less than 5 Minutes | 0 (0.0%) | 232 (8.7%) |
| 5 to 9 Minutes | 23 (0.5%) | 71 (2.7%) |
| 10 to 14 Minutes | 354 (7.7%) | 24 (0.9%) |
| 15 to 19 Minutes | 140 (3.0%) | 321 (12.0%) |
| 20 to 24 Minutes | 369 (8.0%) | 198 (7.4%) |
| 25 to 29 Minutes | 489 (10.6%) | 187 (7.0%) |
| 30 to 34 Minutes | 431 (9.3%) | 433 (16.3%) |
| 35 to 39 Minutes | 182 (3.9%) | 200 (7.5%) |
| 40 to 44 Minutes | 417 (9.0%) | 80 (3.0%) |
| 45 to 59 Minutes | 1,339 (29.0%) | 516 (19.4%) |
| 60 to 89 Minutes | 589 (12.7%) | 214 (8.0%) |
| 90 or more Minutes | 291 (6.3%) | 188 (7.1%) |
Time of Departure to Work by Sex in Fulshear
The most frequent times of departure to work in Fulshear are 6:00 AM to 6:29 AM (918, 19.9%) for males and 7:00 AM to 7:29 AM (790, 29.6%) for females.
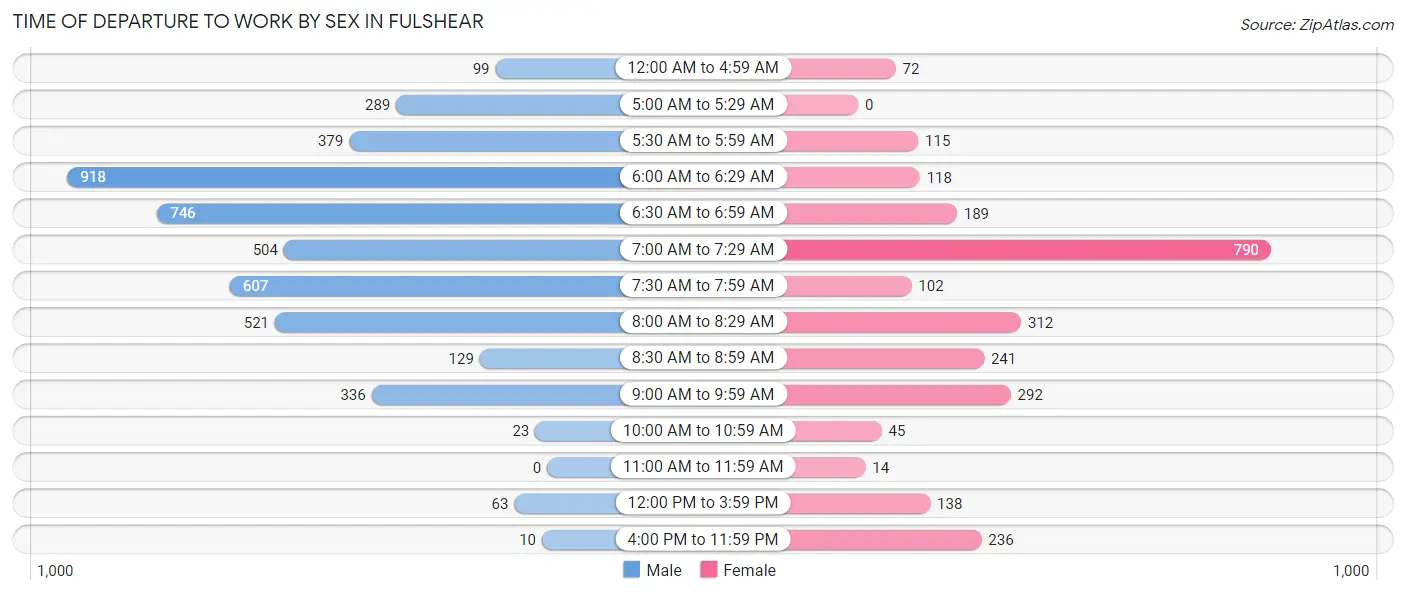
| Time of Departure | Male | Female |
| 12:00 AM to 4:59 AM | 99 (2.1%) | 72 (2.7%) |
| 5:00 AM to 5:29 AM | 289 (6.2%) | 0 (0.0%) |
| 5:30 AM to 5:59 AM | 379 (8.2%) | 115 (4.3%) |
| 6:00 AM to 6:29 AM | 918 (19.9%) | 118 (4.4%) |
| 6:30 AM to 6:59 AM | 746 (16.1%) | 189 (7.1%) |
| 7:00 AM to 7:29 AM | 504 (10.9%) | 790 (29.6%) |
| 7:30 AM to 7:59 AM | 607 (13.1%) | 102 (3.8%) |
| 8:00 AM to 8:29 AM | 521 (11.3%) | 312 (11.7%) |
| 8:30 AM to 8:59 AM | 129 (2.8%) | 241 (9.0%) |
| 9:00 AM to 9:59 AM | 336 (7.3%) | 292 (11.0%) |
| 10:00 AM to 10:59 AM | 23 (0.5%) | 45 (1.7%) |
| 11:00 AM to 11:59 AM | 0 (0.0%) | 14 (0.5%) |
| 12:00 PM to 3:59 PM | 63 (1.4%) | 138 (5.2%) |
| 4:00 PM to 11:59 PM | 10 (0.2%) | 236 (8.9%) |
| Total | 4,624 (100.0%) | 2,664 (100.0%) |
Housing Occupancy in Fulshear
Occupancy by Ownership in Fulshear
Of the total 6,496 dwellings in Fulshear, owner-occupied units account for 6,105 (94.0%), while renter-occupied units make up 391 (6.0%).
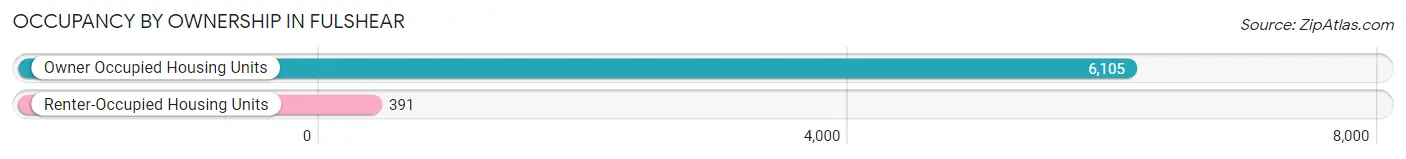
| Occupancy | # Housing Units | % Housing Units |
| Owner Occupied Housing Units | 6,105 | 94.0% |
| Renter-Occupied Housing Units | 391 | 6.0% |
| Total Occupied Housing Units | 6,496 | 100.0% |
Occupancy by Household Size in Fulshear
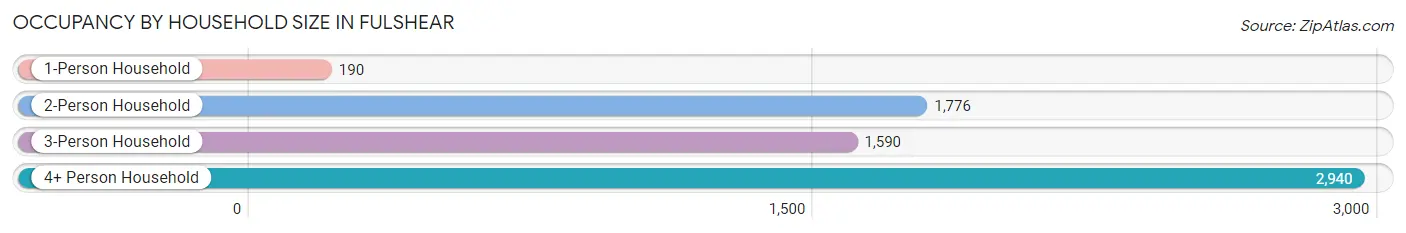
| Household Size | # Housing Units | % Housing Units |
| 1-Person Household | 190 | 2.9% |
| 2-Person Household | 1,776 | 27.3% |
| 3-Person Household | 1,590 | 24.5% |
| 4+ Person Household | 2,940 | 45.3% |
| Total Housing Units | 6,496 | 100.0% |
Occupancy by Ownership by Household Size in Fulshear
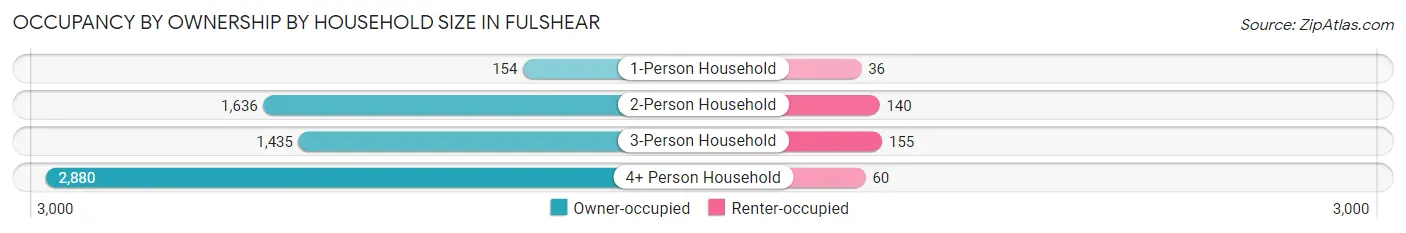
| Household Size | Owner-occupied | Renter-occupied |
| 1-Person Household | 154 (81.0%) | 36 (19.0%) |
| 2-Person Household | 1,636 (92.1%) | 140 (7.9%) |
| 3-Person Household | 1,435 (90.2%) | 155 (9.8%) |
| 4+ Person Household | 2,880 (98.0%) | 60 (2.0%) |
| Total Housing Units | 6,105 (94.0%) | 391 (6.0%) |
Occupancy by Educational Attainment in Fulshear
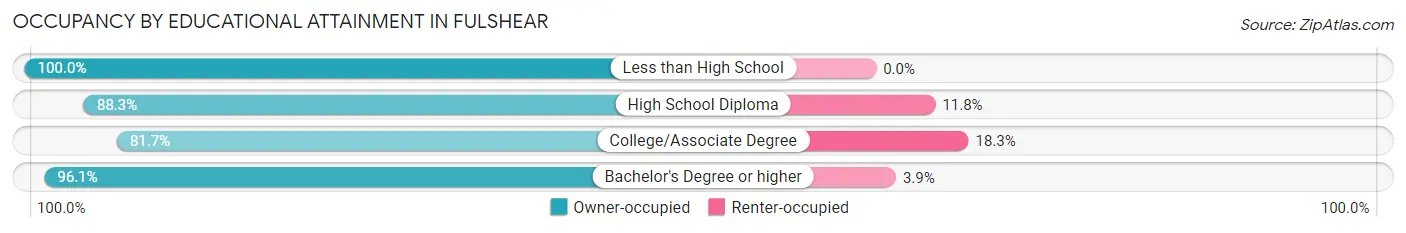
| Household Size | Owner-occupied | Renter-occupied |
| Less than High School | 35 (100.0%) | 0 (0.0%) |
| High School Diploma | 368 (88.2%) | 49 (11.7%) |
| College/Associate Degree | 598 (81.7%) | 134 (18.3%) |
| Bachelor's Degree or higher | 5,104 (96.1%) | 208 (3.9%) |
Occupancy by Age of Householder in Fulshear
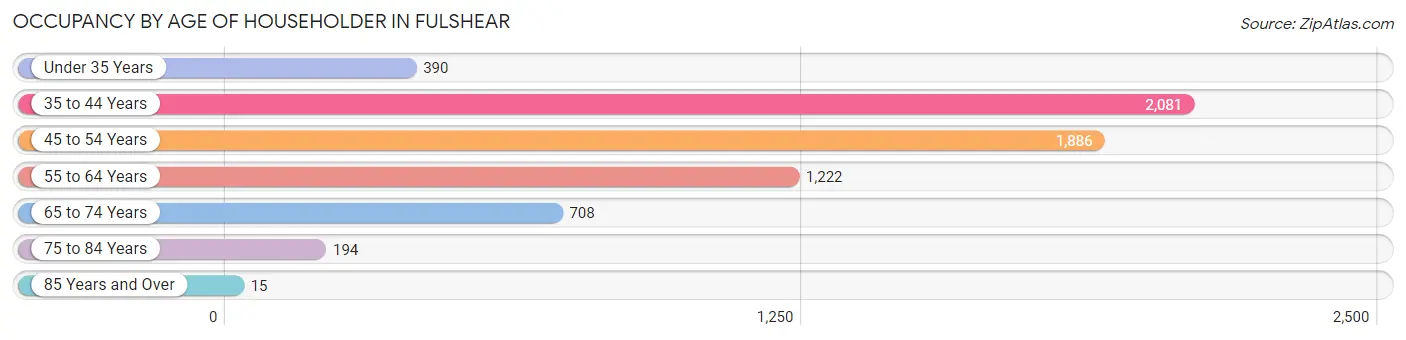
| Age Bracket | # Households | % Households |
| Under 35 Years | 390 | 6.0% |
| 35 to 44 Years | 2,081 | 32.0% |
| 45 to 54 Years | 1,886 | 29.0% |
| 55 to 64 Years | 1,222 | 18.8% |
| 65 to 74 Years | 708 | 10.9% |
| 75 to 84 Years | 194 | 3.0% |
| 85 Years and Over | 15 | 0.2% |
| Total | 6,496 | 100.0% |
Housing Finances in Fulshear
Median Income by Occupancy in Fulshear
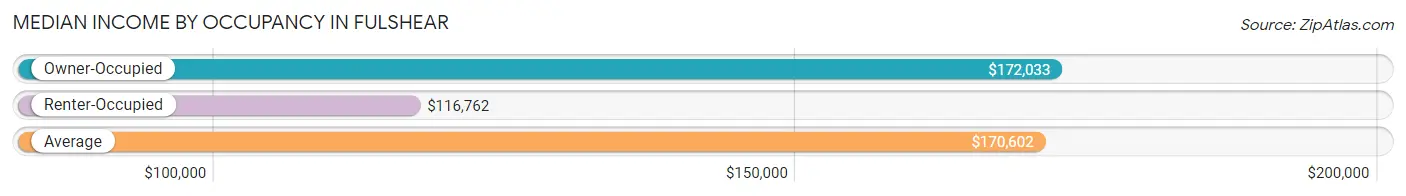
| Occupancy Type | # Households | Median Income |
| Owner-Occupied | 6,105 (94.0%) | $172,033 |
| Renter-Occupied | 391 (6.0%) | $116,762 |
| Average | 6,496 (100.0%) | $170,602 |
Occupancy by Householder Income Bracket in Fulshear
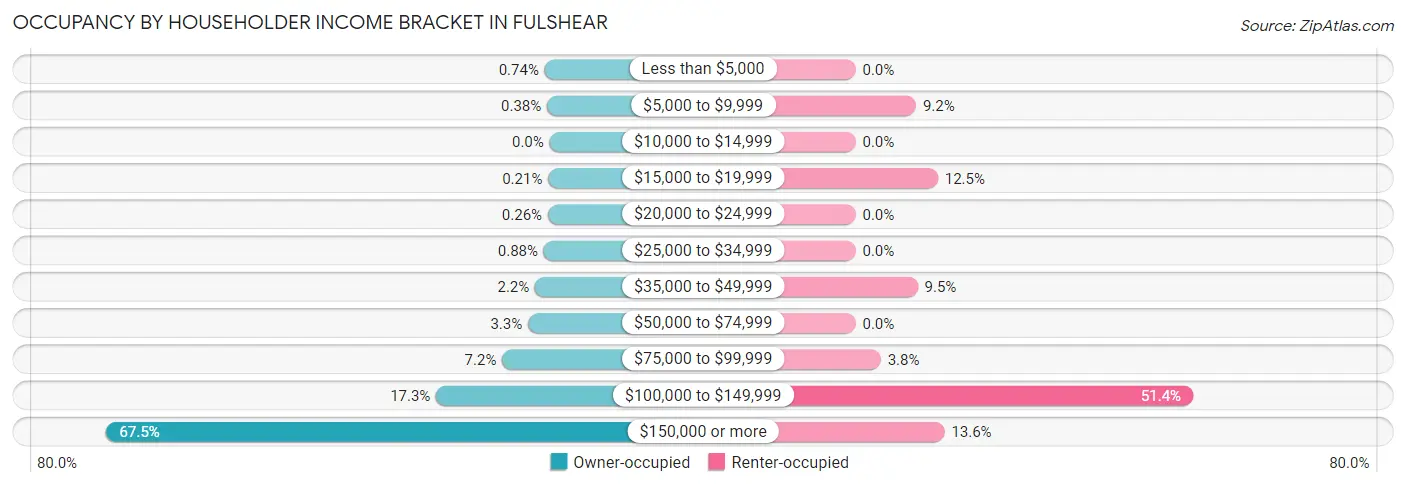
| Income Bracket | Owner-occupied | Renter-occupied |
| Less than $5,000 | 45 (0.7%) | 0 (0.0%) |
| $5,000 to $9,999 | 23 (0.4%) | 36 (9.2%) |
| $10,000 to $14,999 | 0 (0.0%) | 0 (0.0%) |
| $15,000 to $19,999 | 13 (0.2%) | 49 (12.5%) |
| $20,000 to $24,999 | 16 (0.3%) | 0 (0.0%) |
| $25,000 to $34,999 | 54 (0.9%) | 0 (0.0%) |
| $35,000 to $49,999 | 135 (2.2%) | 37 (9.5%) |
| $50,000 to $74,999 | 200 (3.3%) | 0 (0.0%) |
| $75,000 to $99,999 | 441 (7.2%) | 15 (3.8%) |
| $100,000 to $149,999 | 1,055 (17.3%) | 201 (51.4%) |
| $150,000 or more | 4,123 (67.5%) | 53 (13.6%) |
| Total | 6,105 (100.0%) | 391 (100.0%) |
Monthly Housing Cost Tiers in Fulshear
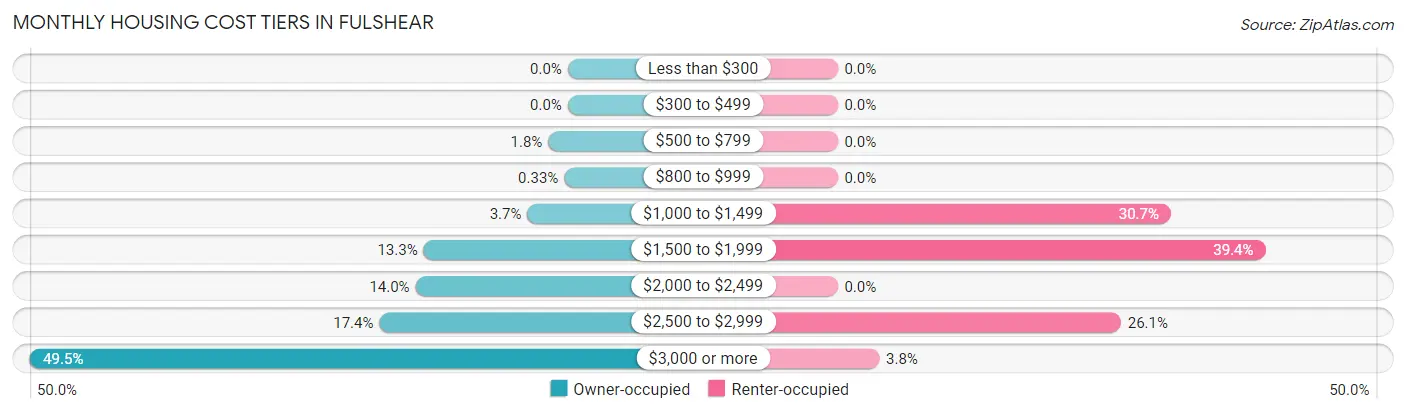
| Monthly Cost | Owner-occupied | Renter-occupied |
| Less than $300 | 0 (0.0%) | 0 (0.0%) |
| $300 to $499 | 0 (0.0%) | 0 (0.0%) |
| $500 to $799 | 110 (1.8%) | 0 (0.0%) |
| $800 to $999 | 20 (0.3%) | 0 (0.0%) |
| $1,000 to $1,499 | 227 (3.7%) | 120 (30.7%) |
| $1,500 to $1,999 | 811 (13.3%) | 154 (39.4%) |
| $2,000 to $2,499 | 856 (14.0%) | 0 (0.0%) |
| $2,500 to $2,999 | 1,059 (17.3%) | 102 (26.1%) |
| $3,000 or more | 3,022 (49.5%) | 15 (3.8%) |
| Total | 6,105 (100.0%) | 391 (100.0%) |
Physical Housing Characteristics in Fulshear
Housing Structures in Fulshear
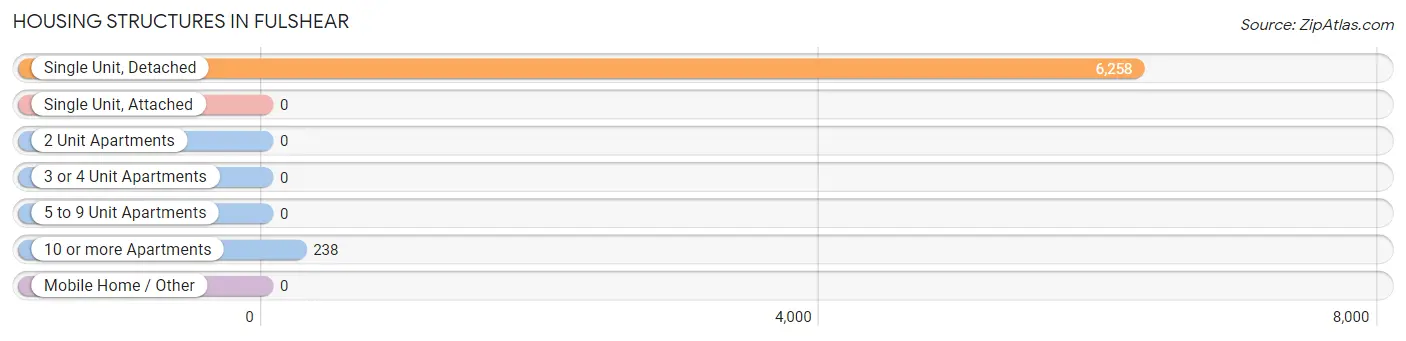
| Structure Type | # Housing Units | % Housing Units |
| Single Unit, Detached | 6,258 | 96.3% |
| Single Unit, Attached | 0 | 0.0% |
| 2 Unit Apartments | 0 | 0.0% |
| 3 or 4 Unit Apartments | 0 | 0.0% |
| 5 to 9 Unit Apartments | 0 | 0.0% |
| 10 or more Apartments | 238 | 3.7% |
| Mobile Home / Other | 0 | 0.0% |
| Total | 6,496 | 100.0% |
Housing Structures by Occupancy in Fulshear
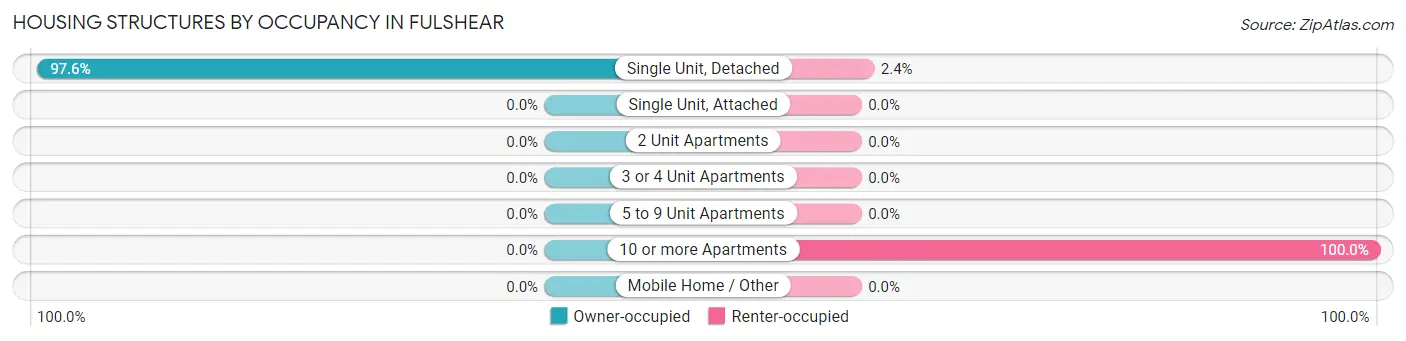
| Structure Type | Owner-occupied | Renter-occupied |
| Single Unit, Detached | 6,105 (97.6%) | 153 (2.4%) |
| Single Unit, Attached | 0 (0.0%) | 0 (0.0%) |
| 2 Unit Apartments | 0 (0.0%) | 0 (0.0%) |
| 3 or 4 Unit Apartments | 0 (0.0%) | 0 (0.0%) |
| 5 to 9 Unit Apartments | 0 (0.0%) | 0 (0.0%) |
| 10 or more Apartments | 0 (0.0%) | 238 (100.0%) |
| Mobile Home / Other | 0 (0.0%) | 0 (0.0%) |
| Total | 6,105 (94.0%) | 391 (6.0%) |
Housing Structures by Number of Rooms in Fulshear
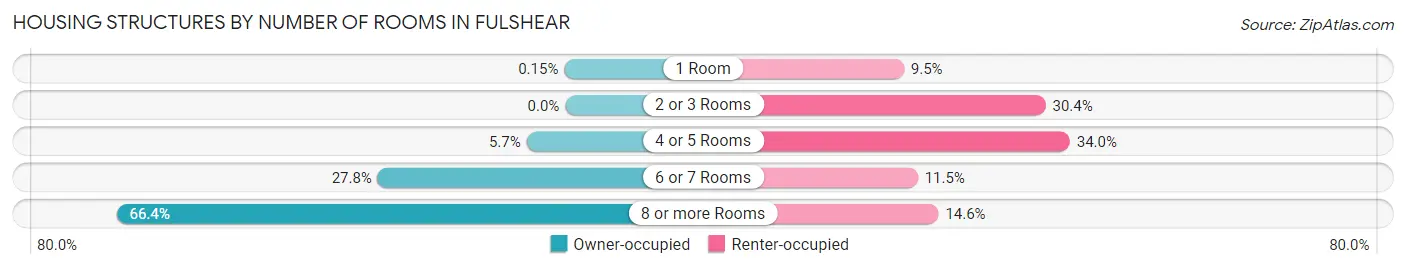
| Number of Rooms | Owner-occupied | Renter-occupied |
| 1 Room | 9 (0.2%) | 37 (9.5%) |
| 2 or 3 Rooms | 0 (0.0%) | 119 (30.4%) |
| 4 or 5 Rooms | 349 (5.7%) | 133 (34.0%) |
| 6 or 7 Rooms | 1,694 (27.8%) | 45 (11.5%) |
| 8 or more Rooms | 4,053 (66.4%) | 57 (14.6%) |
| Total | 6,105 (100.0%) | 391 (100.0%) |
Housing Structure by Heating Type in Fulshear
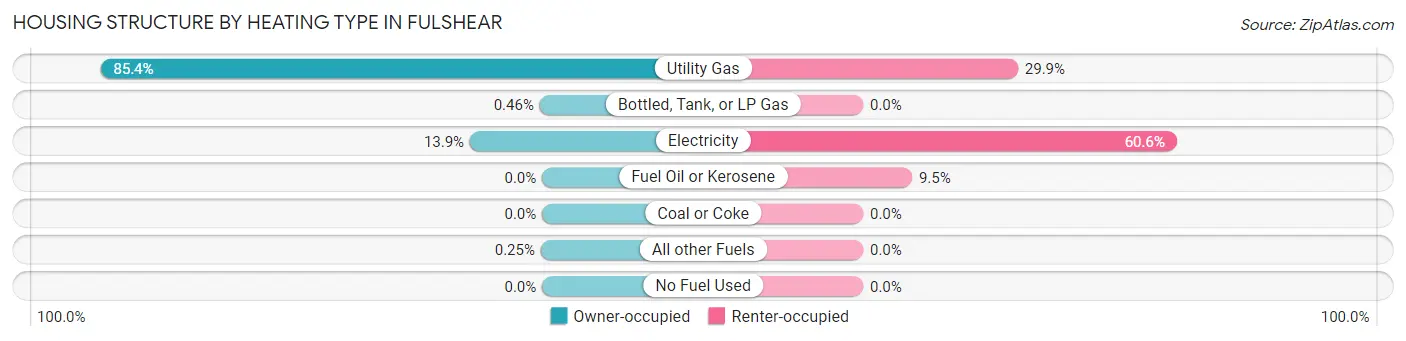
| Heating Type | Owner-occupied | Renter-occupied |
| Utility Gas | 5,211 (85.4%) | 117 (29.9%) |
| Bottled, Tank, or LP Gas | 28 (0.5%) | 0 (0.0%) |
| Electricity | 851 (13.9%) | 237 (60.6%) |
| Fuel Oil or Kerosene | 0 (0.0%) | 37 (9.5%) |
| Coal or Coke | 0 (0.0%) | 0 (0.0%) |
| All other Fuels | 15 (0.3%) | 0 (0.0%) |
| No Fuel Used | 0 (0.0%) | 0 (0.0%) |
| Total | 6,105 (100.0%) | 391 (100.0%) |
Household Vehicle Usage in Fulshear
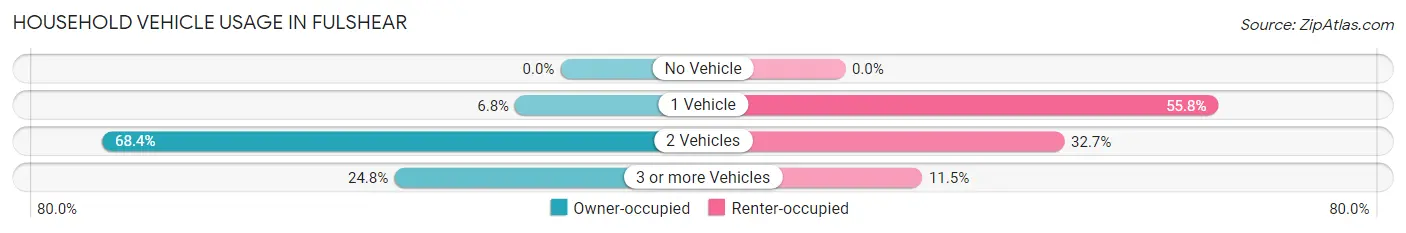
| Vehicles per Household | Owner-occupied | Renter-occupied |
| No Vehicle | 0 (0.0%) | 0 (0.0%) |
| 1 Vehicle | 413 (6.8%) | 218 (55.7%) |
| 2 Vehicles | 4,177 (68.4%) | 128 (32.7%) |
| 3 or more Vehicles | 1,515 (24.8%) | 45 (11.5%) |
| Total | 6,105 (100.0%) | 391 (100.0%) |
Real Estate & Mortgages in Fulshear
Real Estate and Mortgage Overview in Fulshear
| Characteristic | Without Mortgage | With Mortgage |
| Housing Units | 1,459 | 4,646 |
| Median Property Value | $503,300 | $480,400 |
| Median Household Income | $162,619 | $3,383 |
| Monthly Housing Costs | $1,501 | $3,018 |
| Real Estate Taxes | $10,001 | $68 |
Property Value by Mortgage Status in Fulshear
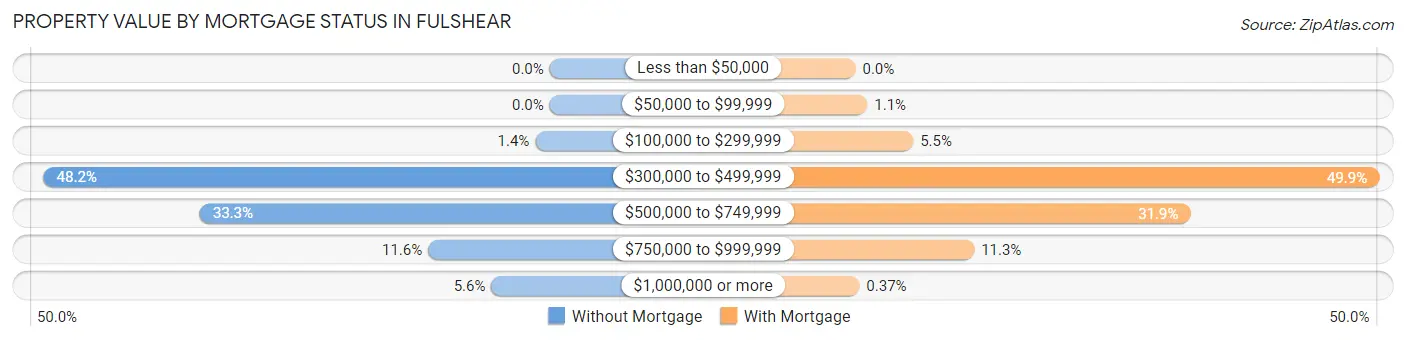
| Property Value | Without Mortgage | With Mortgage |
| Less than $50,000 | 0 (0.0%) | 0 (0.0%) |
| $50,000 to $99,999 | 0 (0.0%) | 52 (1.1%) |
| $100,000 to $299,999 | 20 (1.4%) | 255 (5.5%) |
| $300,000 to $499,999 | 703 (48.2%) | 2,316 (49.8%) |
| $500,000 to $749,999 | 486 (33.3%) | 1,481 (31.9%) |
| $750,000 to $999,999 | 169 (11.6%) | 525 (11.3%) |
| $1,000,000 or more | 81 (5.6%) | 17 (0.4%) |
| Total | 1,459 (100.0%) | 4,646 (100.0%) |
Household Income by Mortgage Status in Fulshear
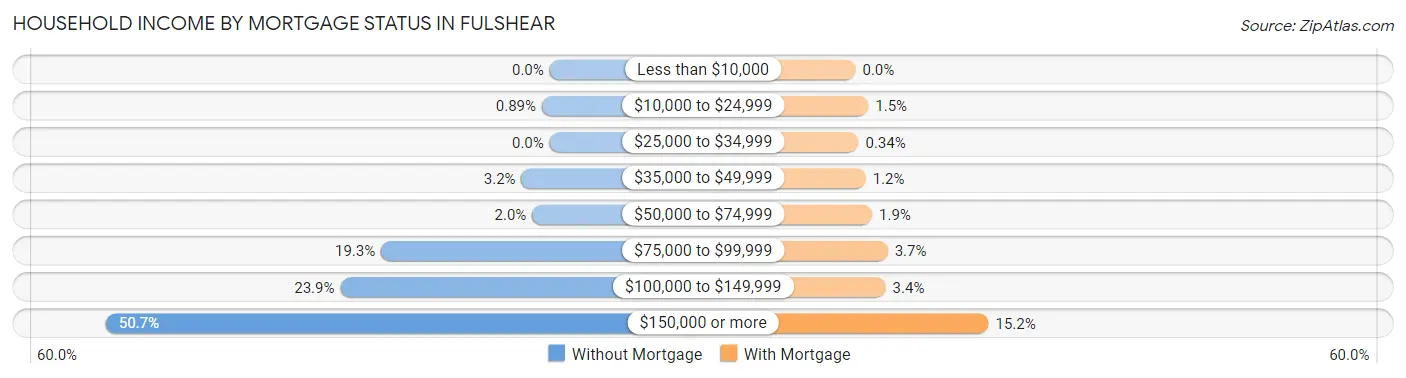
| Household Income | Without Mortgage | With Mortgage |
| Less than $10,000 | 0 (0.0%) | 0 (0.0%) |
| $10,000 to $24,999 | 13 (0.9%) | 68 (1.5%) |
| $25,000 to $34,999 | 0 (0.0%) | 16 (0.3%) |
| $35,000 to $49,999 | 47 (3.2%) | 54 (1.2%) |
| $50,000 to $74,999 | 29 (2.0%) | 88 (1.9%) |
| $75,000 to $99,999 | 281 (19.3%) | 171 (3.7%) |
| $100,000 to $149,999 | 349 (23.9%) | 160 (3.4%) |
| $150,000 or more | 740 (50.7%) | 706 (15.2%) |
| Total | 1,459 (100.0%) | 4,646 (100.0%) |
Property Value to Household Income Ratio in Fulshear
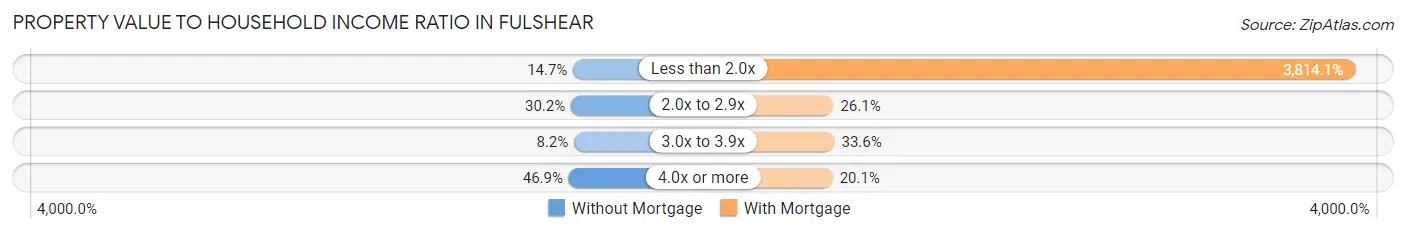
| Value-to-Income Ratio | Without Mortgage | With Mortgage |
| Less than 2.0x | 215 (14.7%) | 177,203 (3,814.1%) |
| 2.0x to 2.9x | 440 (30.2%) | 1,212 (26.1%) |
| 3.0x to 3.9x | 120 (8.2%) | 1,562 (33.6%) |
| 4.0x or more | 684 (46.9%) | 932 (20.1%) |
| Total | 1,459 (100.0%) | 4,646 (100.0%) |
Real Estate Taxes by Mortgage Status in Fulshear
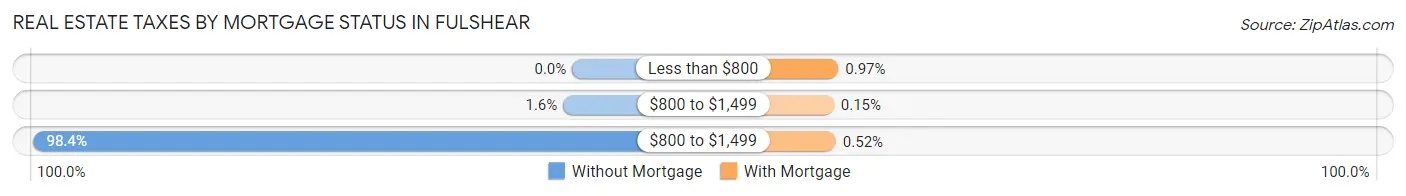
| Property Taxes | Without Mortgage | With Mortgage |
| Less than $800 | 0 (0.0%) | 45 (1.0%) |
| $800 to $1,499 | 24 (1.6%) | 7 (0.2%) |
| $800 to $1,499 | 1,435 (98.4%) | 24 (0.5%) |
| Total | 1,459 (100.0%) | 4,646 (100.0%) |
Health & Disability in Fulshear
Health Insurance Coverage by Age in Fulshear
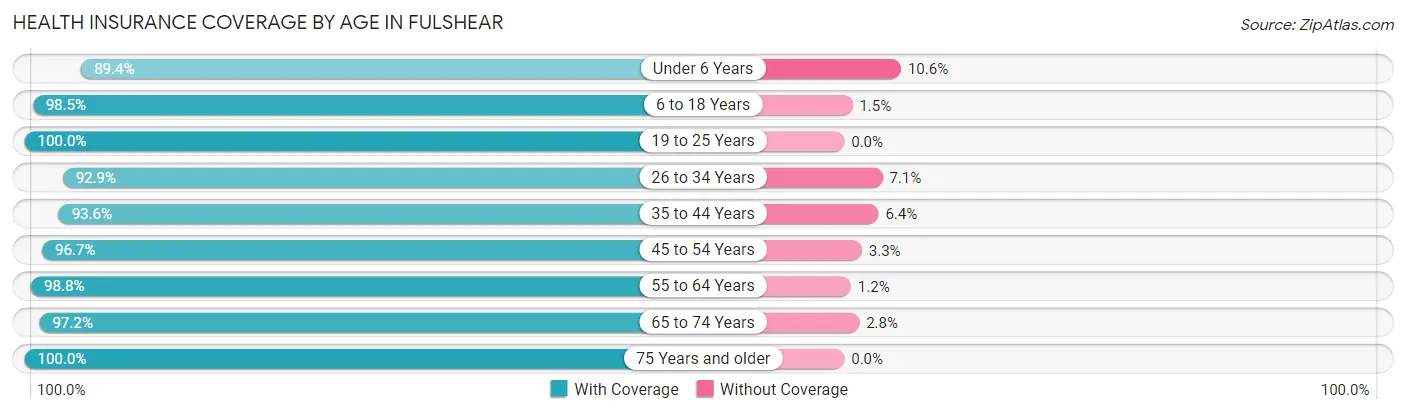
| Age Bracket | With Coverage | Without Coverage |
| Under 6 Years | 897 (89.4%) | 106 (10.6%) |
| 6 to 18 Years | 6,284 (98.5%) | 97 (1.5%) |
| 19 to 25 Years | 1,212 (100.0%) | 0 (0.0%) |
| 26 to 34 Years | 771 (92.9%) | 59 (7.1%) |
| 35 to 44 Years | 4,215 (93.6%) | 287 (6.4%) |
| 45 to 54 Years | 3,627 (96.7%) | 123 (3.3%) |
| 55 to 64 Years | 1,929 (98.8%) | 24 (1.2%) |
| 65 to 74 Years | 1,363 (97.2%) | 39 (2.8%) |
| 75 Years and older | 519 (100.0%) | 0 (0.0%) |
| Total | 20,817 (96.6%) | 735 (3.4%) |
Health Insurance Coverage by Citizenship Status in Fulshear
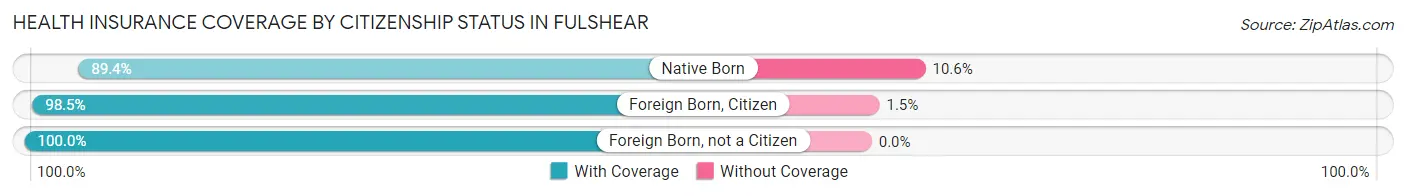
| Citizenship Status | With Coverage | Without Coverage |
| Native Born | 897 (89.4%) | 106 (10.6%) |
| Foreign Born, Citizen | 6,284 (98.5%) | 97 (1.5%) |
| Foreign Born, not a Citizen | 1,212 (100.0%) | 0 (0.0%) |
Health Insurance Coverage by Household Income in Fulshear
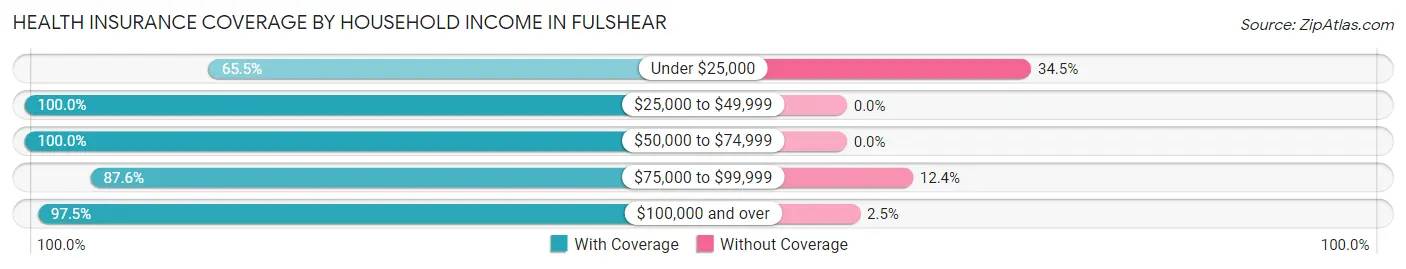
| Household Income | With Coverage | Without Coverage |
| Under $25,000 | 220 (65.5%) | 116 (34.5%) |
| $25,000 to $49,999 | 456 (100.0%) | 0 (0.0%) |
| $50,000 to $74,999 | 708 (100.0%) | 0 (0.0%) |
| $75,000 to $99,999 | 1,040 (87.6%) | 147 (12.4%) |
| $100,000 and over | 18,387 (97.5%) | 470 (2.5%) |
Public vs Private Health Insurance Coverage by Age in Fulshear
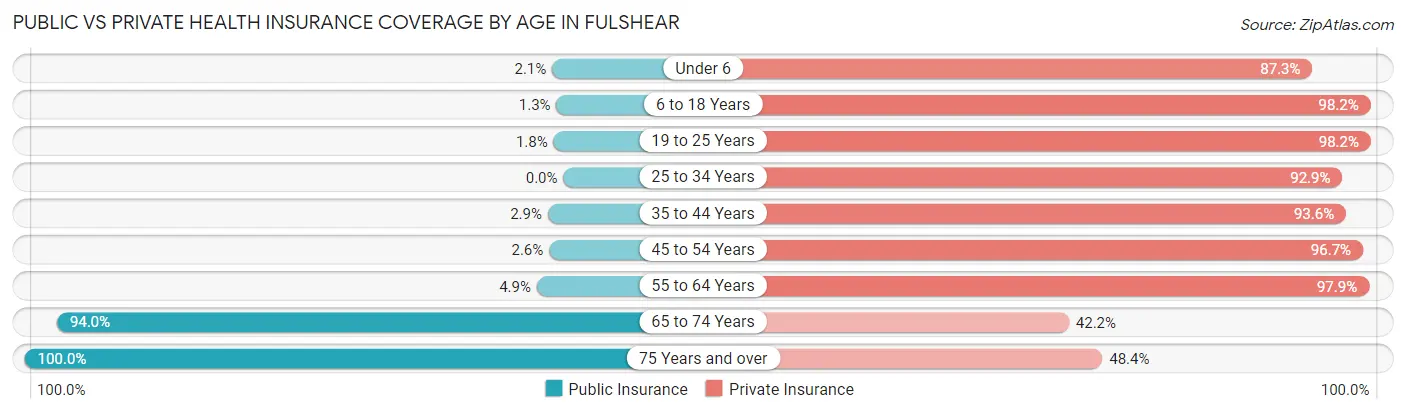
| Age Bracket | Public Insurance | Private Insurance |
| Under 6 | 21 (2.1%) | 876 (87.3%) |
| 6 to 18 Years | 82 (1.3%) | 6,263 (98.2%) |
| 19 to 25 Years | 22 (1.8%) | 1,190 (98.2%) |
| 25 to 34 Years | 0 (0.0%) | 771 (92.9%) |
| 35 to 44 Years | 130 (2.9%) | 4,213 (93.6%) |
| 45 to 54 Years | 99 (2.6%) | 3,627 (96.7%) |
| 55 to 64 Years | 96 (4.9%) | 1,911 (97.9%) |
| 65 to 74 Years | 1,318 (94.0%) | 591 (42.1%) |
| 75 Years and over | 519 (100.0%) | 251 (48.4%) |
| Total | 2,287 (10.6%) | 19,693 (91.4%) |
Disability Status by Sex by Age in Fulshear
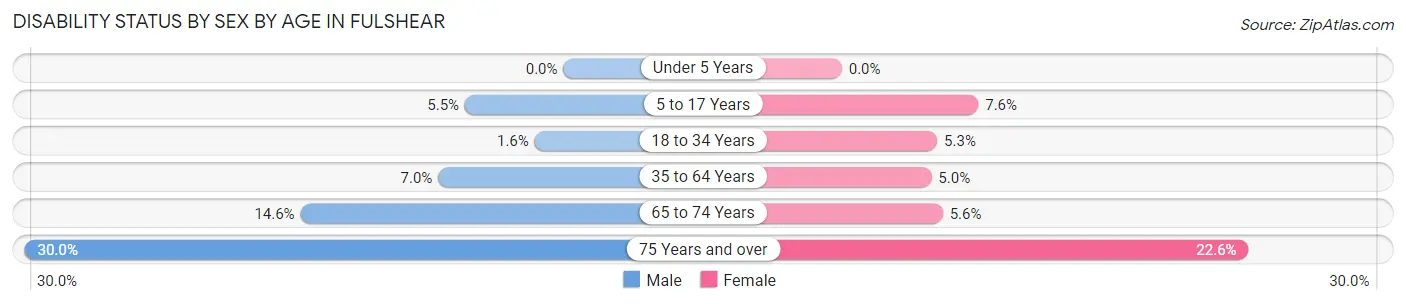
| Age Bracket | Male | Female |
| Under 5 Years | 0 (0.0%) | 0 (0.0%) |
| 5 to 17 Years | 140 (5.5%) | 272 (7.6%) |
| 18 to 34 Years | 23 (1.6%) | 51 (5.3%) |
| 35 to 64 Years | 368 (7.0%) | 246 (5.0%) |
| 65 to 74 Years | 101 (14.6%) | 40 (5.6%) |
| 75 Years and over | 51 (30.0%) | 79 (22.6%) |
Disability Class by Sex by Age in Fulshear
Disability Class: Hearing Difficulty
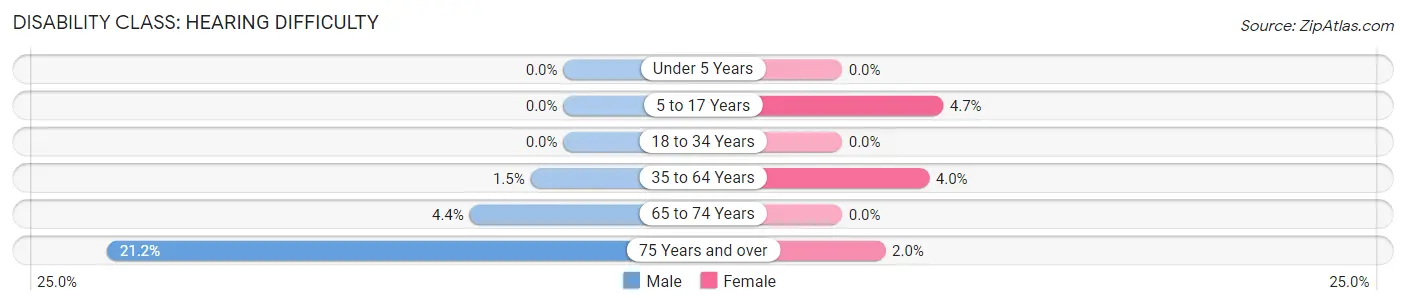
| Age Bracket | Male | Female |
| Under 5 Years | 0 (0.0%) | 0 (0.0%) |
| 5 to 17 Years | 0 (0.0%) | 168 (4.7%) |
| 18 to 34 Years | 0 (0.0%) | 0 (0.0%) |
| 35 to 64 Years | 80 (1.5%) | 199 (4.0%) |
| 65 to 74 Years | 30 (4.3%) | 0 (0.0%) |
| 75 Years and over | 36 (21.2%) | 7 (2.0%) |
Disability Class: Vision Difficulty
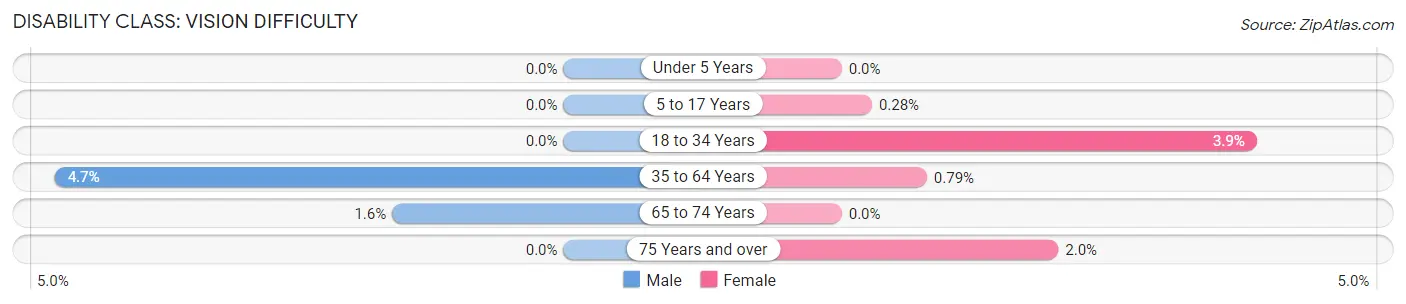
| Age Bracket | Male | Female |
| Under 5 Years | 0 (0.0%) | 0 (0.0%) |
| 5 to 17 Years | 0 (0.0%) | 10 (0.3%) |
| 18 to 34 Years | 0 (0.0%) | 37 (3.8%) |
| 35 to 64 Years | 249 (4.7%) | 39 (0.8%) |
| 65 to 74 Years | 11 (1.6%) | 0 (0.0%) |
| 75 Years and over | 0 (0.0%) | 7 (2.0%) |
Disability Class: Cognitive Difficulty
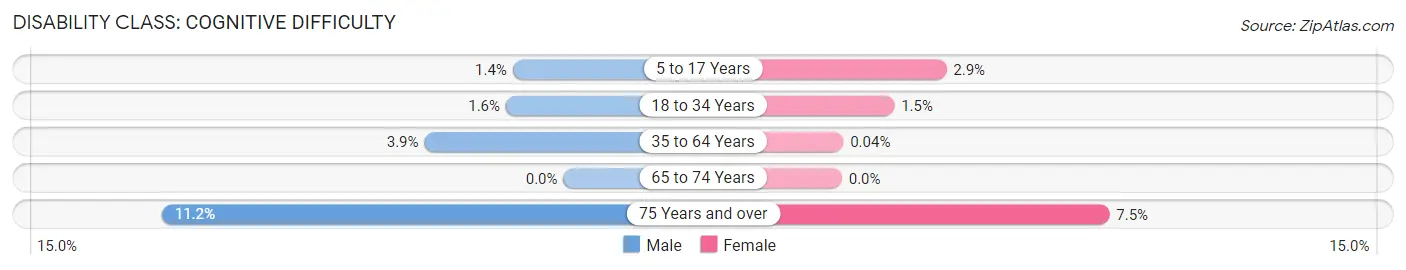
| Age Bracket | Male | Female |
| 5 to 17 Years | 36 (1.4%) | 104 (2.9%) |
| 18 to 34 Years | 23 (1.6%) | 14 (1.5%) |
| 35 to 64 Years | 204 (3.9%) | 2 (0.0%) |
| 65 to 74 Years | 0 (0.0%) | 0 (0.0%) |
| 75 Years and over | 19 (11.2%) | 26 (7.4%) |
Disability Class: Ambulatory Difficulty
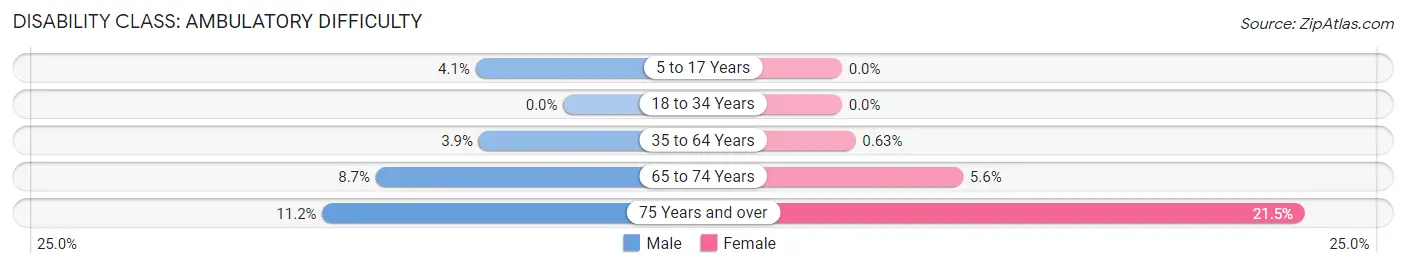
| Age Bracket | Male | Female |
| 5 to 17 Years | 104 (4.1%) | 0 (0.0%) |
| 18 to 34 Years | 0 (0.0%) | 0 (0.0%) |
| 35 to 64 Years | 207 (3.9%) | 31 (0.6%) |
| 65 to 74 Years | 60 (8.7%) | 40 (5.6%) |
| 75 Years and over | 19 (11.2%) | 75 (21.5%) |
Disability Class: Self-Care Difficulty
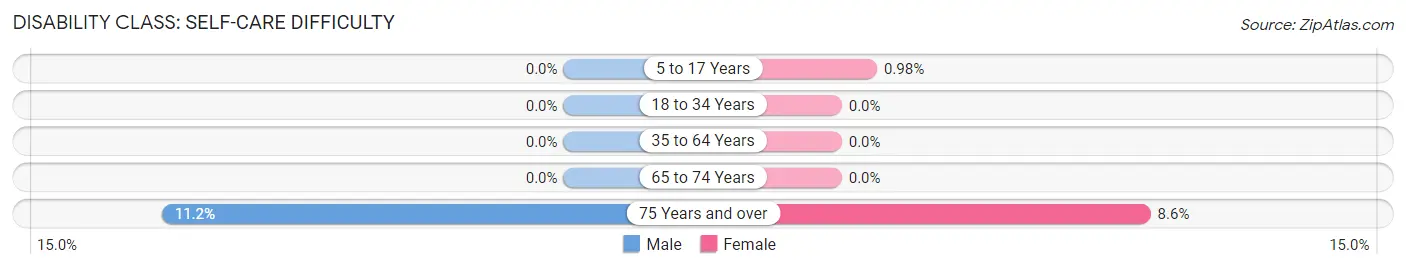
| Age Bracket | Male | Female |
| 5 to 17 Years | 0 (0.0%) | 35 (1.0%) |
| 18 to 34 Years | 0 (0.0%) | 0 (0.0%) |
| 35 to 64 Years | 0 (0.0%) | 0 (0.0%) |
| 65 to 74 Years | 0 (0.0%) | 0 (0.0%) |
| 75 Years and over | 19 (11.2%) | 30 (8.6%) |
Technology Access in Fulshear
Computing Device Access in Fulshear
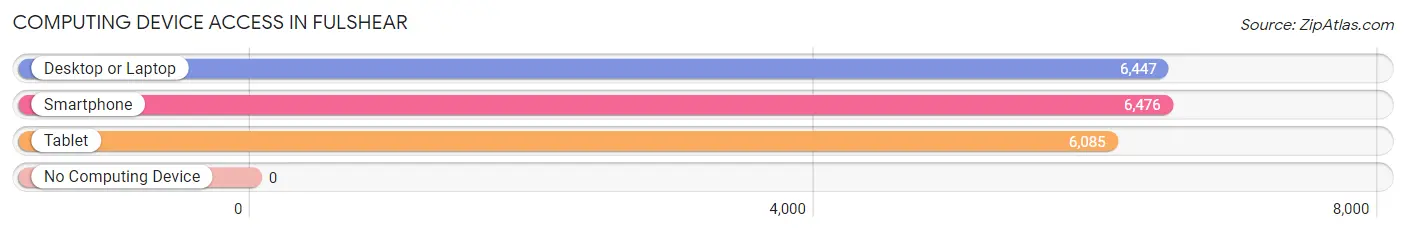
| Device Type | # Households | % Households |
| Desktop or Laptop | 6,447 | 99.3% |
| Smartphone | 6,476 | 99.7% |
| Tablet | 6,085 | 93.7% |
| No Computing Device | 0 | 0.0% |
| Total | 6,496 | 100.0% |
Internet Access in Fulshear
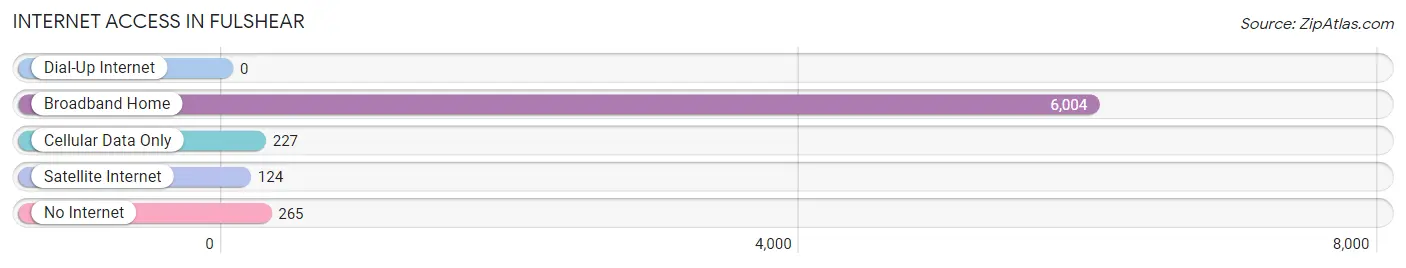
| Internet Type | # Households | % Households |
| Dial-Up Internet | 0 | 0.0% |
| Broadband Home | 6,004 | 92.4% |
| Cellular Data Only | 227 | 3.5% |
| Satellite Internet | 124 | 1.9% |
| No Internet | 265 | 4.1% |
| Total | 6,496 | 100.0% |
Fulshear Summary
Fulshear, Texas is a small city located in Fort Bend County, Texas, United States. It is part of the Houston–The Woodlands–Sugar Land metropolitan area. The city is located about 30 miles west of downtown Houston and is situated along the Brazos River. As of the 2010 census, the population of Fulshear was 1,357.
History
Fulshear was founded in 1824 by John and Mary Fulshear, who were among the first settlers in the area. The Fulshears were originally from Virginia and had moved to Texas in search of a better life. The town was named after the Fulshear family and was originally known as Fulshear's Crossing. The town was officially incorporated in 1977.
Geography
Fulshear is located at 29°45'25" North, 95°51'45" West (29.756944, -95.862500). The city has a total area of 4.2 square miles, all of which is land. The city is located along the Brazos River and is bordered by the cities of Katy and Simonton.
Economy
Fulshear's economy is largely based on the oil and gas industry. The city is home to several oil and gas companies, including Chevron, ExxonMobil, and Shell. The city also has a number of small businesses, including restaurants, retail stores, and professional services.
Demographics
As of the 2010 census, the population of Fulshear was 1,357. The racial makeup of the city was 79.2% White, 11.2% African American, 0.2% Native American, 0.7% Asian, 6.2% from other races, and 2.7% from two or more races. Hispanic or Latino of any race were 16.2% of the population.
The median income for a household in the city was $76,250, and the median income for a family was $86,250. The per capita income for the city was $31,945. About 5.2% of families and 6.7% of the population were below the poverty line, including 8.3% of those under age 18 and 4.2% of those age 65 or over.
Conclusion
Fulshear, Texas is a small city located in Fort Bend County, Texas, United States. It is part of the Houston–The Woodlands–Sugar Land metropolitan area. The city was founded in 1824 by John and Mary Fulshear and was officially incorporated in 1977. Fulshear has a total area of 4.2 square miles and is located along the Brazos River. The city's economy is largely based on the oil and gas industry, and it is home to several small businesses. As of the 2010 census, the population of Fulshear was 1,357. The racial makeup of the city was 79.2% White, 11.2% African American, 0.2% Native American, 0.7% Asian, 6.2% from other races, and 2.7% from two or more races. The median income for a household in the city was $76,250, and the median income for a family was $86,250.
Common Questions
What is Per Capita Income in Fulshear?
Per Capita income in Fulshear is $60,425.
What is the Median Family Income in Fulshear?
Median Family Income in Fulshear is $171,446.
What is the Median Household income in Fulshear?
Median Household Income in Fulshear is $170,602.
What is Income or Wage Gap in Fulshear?
Income or Wage Gap in Fulshear is 69.6%.
Women in Fulshear earn 30.4 cents for every dollar earned by a man.
What is Inequality or Gini Index in Fulshear?
Inequality or Gini Index in Fulshear is 0.31.
What is the Total Population of Fulshear?
Total Population of Fulshear is 21,552.
What is the Total Male Population of Fulshear?
Total Male Population of Fulshear is 10,563.
What is the Total Female Population of Fulshear?
Total Female Population of Fulshear is 10,989.
What is the Ratio of Males per 100 Females in Fulshear?
There are 96.12 Males per 100 Females in Fulshear.
What is the Ratio of Females per 100 Males in Fulshear?
There are 104.03 Females per 100 Males in Fulshear.
What is the Median Population Age in Fulshear?
Median Population Age in Fulshear is 38.4 Years.
What is the Average Family Size in Fulshear
Average Family Size in Fulshear is 3.4 People.
What is the Average Household Size in Fulshear
Average Household Size in Fulshear is 3.3 People.
How Large is the Labor Force in Fulshear?
There are 9,936 People in the Labor Forcein in Fulshear.
What is the Percentage of People in the Labor Force in Fulshear?
63.1% of People are in the Labor Force in Fulshear.
What is the Unemployment Rate in Fulshear?
Unemployment Rate in Fulshear is 4.9%.