Exeter, NH Map & Demographics
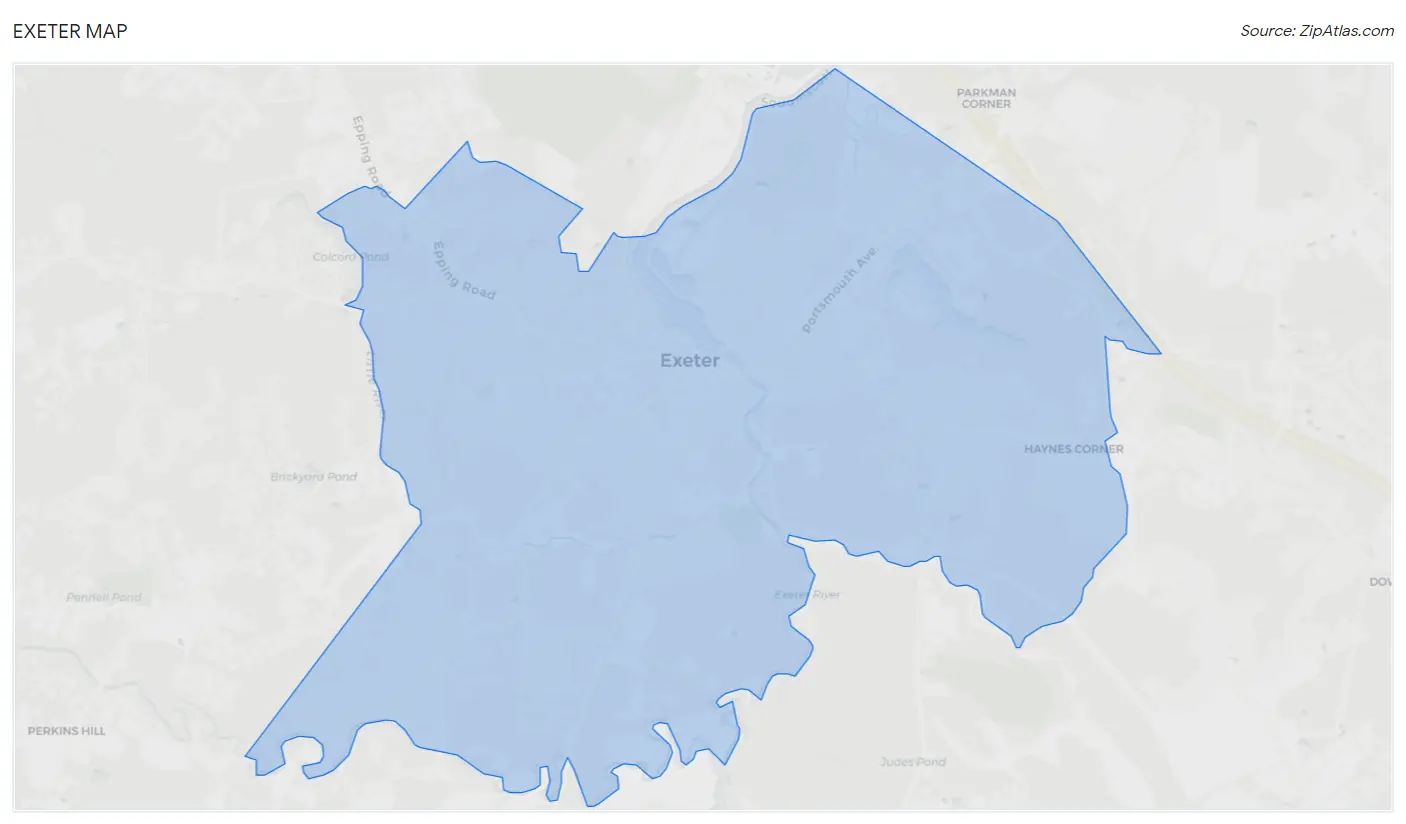
Exeter Map
Exeter Overview
$55,413
PER CAPITA INCOME
$118,793
AVG FAMILY INCOME
$79,813
AVG HOUSEHOLD INCOME
26.5%
WAGE / INCOME GAP [ % ]
73.5¢/ $1
WAGE / INCOME GAP [ $ ]
0.44
INEQUALITY / GINI INDEX
9,918
TOTAL POPULATION
4,450
MALE POPULATION
5,468
FEMALE POPULATION
81.38
MALES / 100 FEMALES
122.88
FEMALES / 100 MALES
45.9
MEDIAN AGE
2.9
AVG FAMILY SIZE
2.1
AVG HOUSEHOLD SIZE
6,516
LABOR FORCE [ PEOPLE ]
74.3%
PERCENT IN LABOR FORCE
2.7%
UNEMPLOYMENT RATE
Exeter Zip Codes
Exeter Area Codes
Income in Exeter
Income Overview in Exeter
Per Capita Income in Exeter is $55,413, while median incomes of families and households are $118,793 and $79,813 respectively.
| Characteristic | Number | Measure |
| Per Capita Income | 9,918 | $55,413 |
| Median Family Income | 2,214 | $118,793 |
| Mean Family Income | 2,214 | $151,536 |
| Median Household Income | 4,552 | $79,813 |
| Mean Household Income | 4,552 | $107,869 |
| Income Deficit | 2,214 | $0 |
| Wage / Income Gap (%) | 9,918 | 26.45% |
| Wage / Income Gap ($) | 9,918 | 73.55¢ per $1 |
| Gini / Inequality Index | 9,918 | 0.44 |
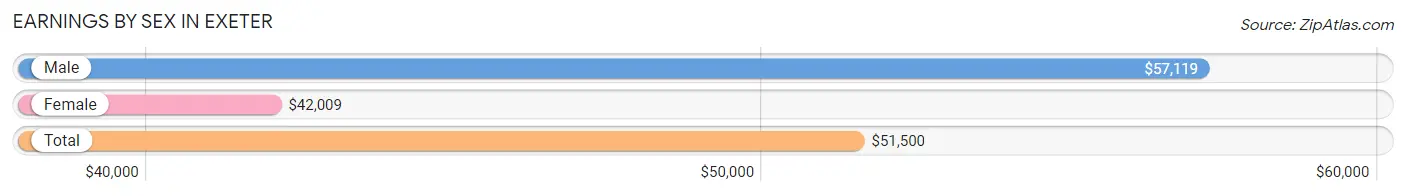
Earnings by Sex in Exeter
Average Earnings in Exeter are $51,500, $57,119 for men and $42,009 for women, a difference of 26.5%.
| Sex | Number | Average Earnings |
| Male | 3,241 (47.7%) | $57,119 |
| Female | 3,551 (52.3%) | $42,009 |
| Total | 6,792 (100.0%) | $51,500 |
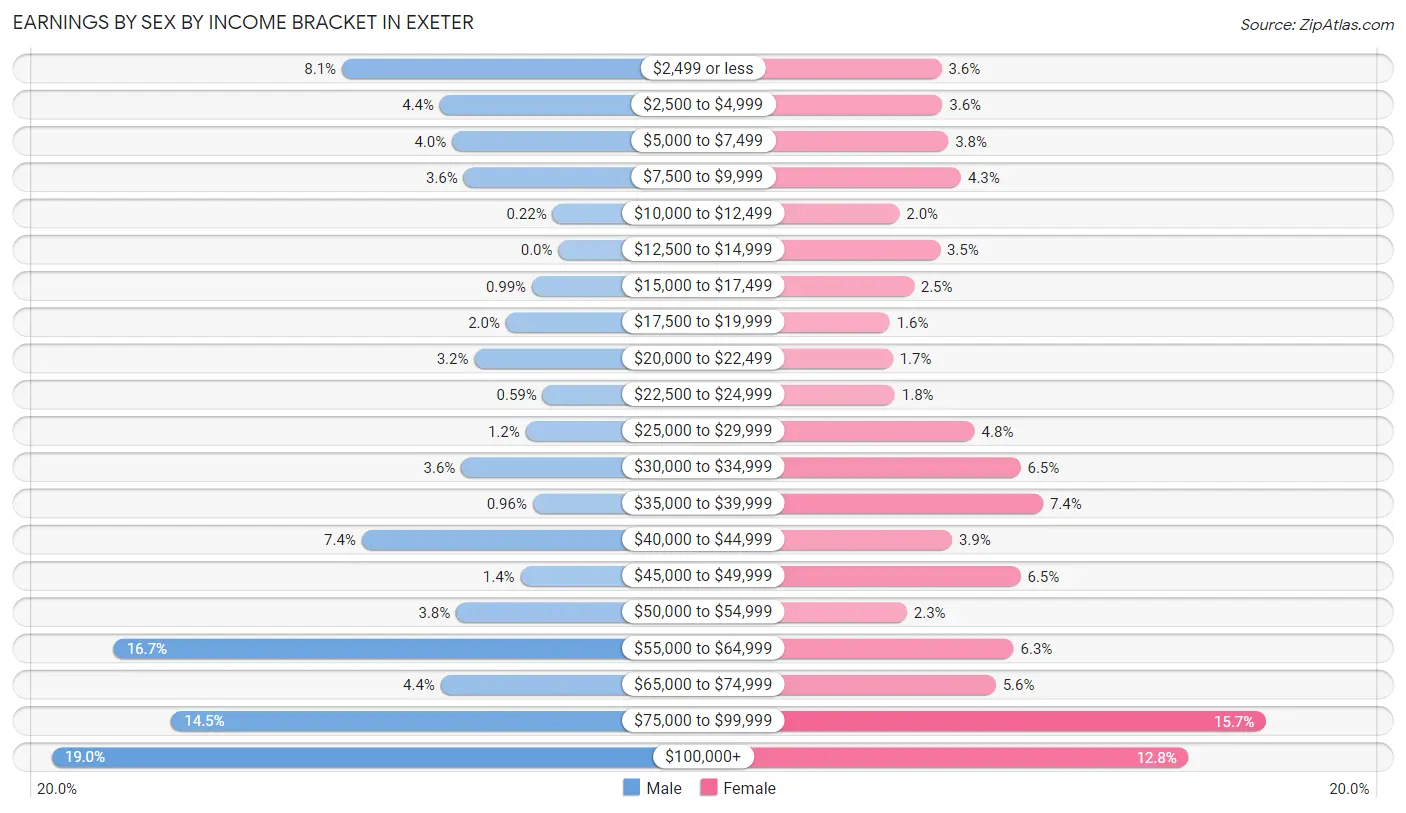
Earnings by Sex by Income Bracket in Exeter
The most common earnings brackets in Exeter are $100,000+ for men (615 | 19.0%) and $75,000 to $99,999 for women (558 | 15.7%).
| Income | Male | Female |
| $2,499 or less | 263 (8.1%) | 126 (3.5%) |
| $2,500 to $4,999 | 144 (4.4%) | 127 (3.6%) |
| $5,000 to $7,499 | 129 (4.0%) | 135 (3.8%) |
| $7,500 to $9,999 | 115 (3.5%) | 152 (4.3%) |
| $10,000 to $12,499 | 7 (0.2%) | 70 (2.0%) |
| $12,500 to $14,999 | 0 (0.0%) | 124 (3.5%) |
| $15,000 to $17,499 | 32 (1.0%) | 89 (2.5%) |
| $17,500 to $19,999 | 64 (2.0%) | 57 (1.6%) |
| $20,000 to $22,499 | 102 (3.2%) | 61 (1.7%) |
| $22,500 to $24,999 | 19 (0.6%) | 64 (1.8%) |
| $25,000 to $29,999 | 40 (1.2%) | 170 (4.8%) |
| $30,000 to $34,999 | 118 (3.6%) | 231 (6.5%) |
| $35,000 to $39,999 | 31 (1.0%) | 261 (7.3%) |
| $40,000 to $44,999 | 239 (7.4%) | 140 (3.9%) |
| $45,000 to $49,999 | 46 (1.4%) | 231 (6.5%) |
| $50,000 to $54,999 | 124 (3.8%) | 80 (2.2%) |
| $55,000 to $64,999 | 540 (16.7%) | 222 (6.2%) |
| $65,000 to $74,999 | 143 (4.4%) | 198 (5.6%) |
| $75,000 to $99,999 | 470 (14.5%) | 558 (15.7%) |
| $100,000+ | 615 (19.0%) | 455 (12.8%) |
| Total | 3,241 (100.0%) | 3,551 (100.0%) |
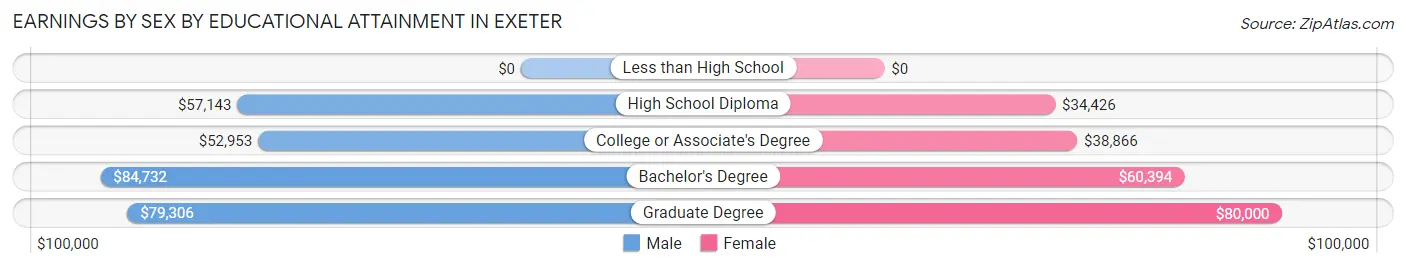
Earnings by Sex by Educational Attainment in Exeter
Average earnings in Exeter are $61,146 for men and $52,859 for women, a difference of 13.6%. Men with an educational attainment of bachelor's degree enjoy the highest average annual earnings of $84,732, while those with college or associate's degree education earn the least with $52,953. Women with an educational attainment of graduate degree earn the most with the average annual earnings of $80,000, while those with high school diploma education have the smallest earnings of $34,426.
| Educational Attainment | Male Income | Female Income |
| Less than High School | - | - |
| High School Diploma | $57,143 | $34,426 |
| College or Associate's Degree | $52,953 | $38,866 |
| Bachelor's Degree | $84,732 | $60,394 |
| Graduate Degree | $79,306 | $80,000 |
| Total | $61,146 | $52,859 |
Family Income in Exeter
Family Income Brackets in Exeter
According to the Exeter family income data, there are 589 families falling into the $100,000 to $149,999 income range, which is the most common income bracket and makes up 26.6% of all families.
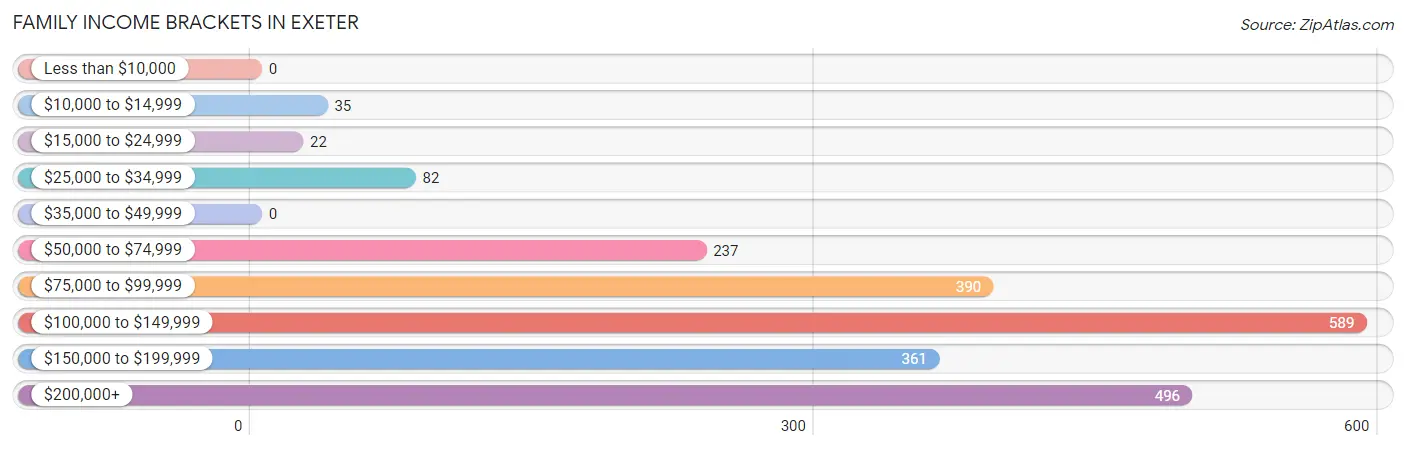
| Income Bracket | # Families | % Families |
| Less than $10,000 | 0 | 0.0% |
| $10,000 to $14,999 | 35 | 1.6% |
| $15,000 to $24,999 | 22 | 1.0% |
| $25,000 to $34,999 | 82 | 3.7% |
| $35,000 to $49,999 | 0 | 0.0% |
| $50,000 to $74,999 | 237 | 10.7% |
| $75,000 to $99,999 | 390 | 17.6% |
| $100,000 to $149,999 | 589 | 26.6% |
| $150,000 to $199,999 | 361 | 16.3% |
| $200,000+ | 496 | 22.4% |
Family Income by Famaliy Size in Exeter
5-person families (236 | 10.7%) account for the highest median family income in Exeter with $227,870 per family, while 3-person families (492 | 22.2%) have the highest median income of $52,745 per family member.
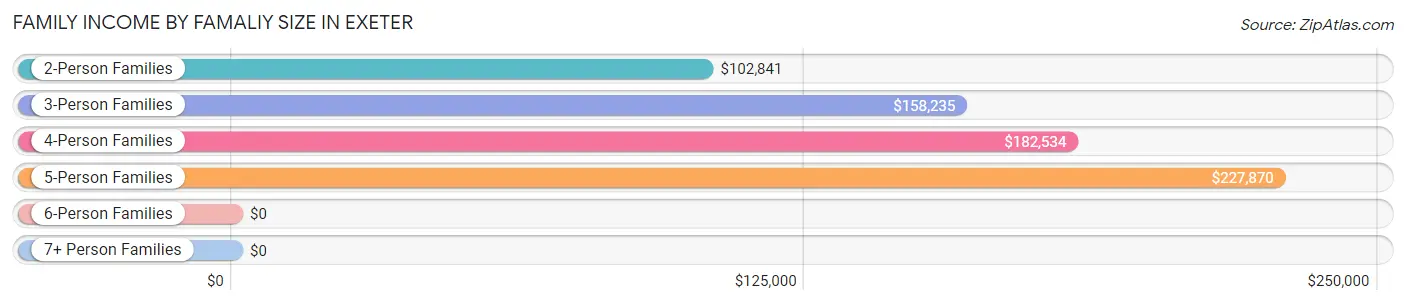
| Income Bracket | # Families | Median Income |
| 2-Person Families | 1,227 (55.4%) | $102,841 |
| 3-Person Families | 492 (22.2%) | $158,235 |
| 4-Person Families | 259 (11.7%) | $182,534 |
| 5-Person Families | 236 (10.7%) | $227,870 |
| 6-Person Families | 0 (0.0%) | $0 |
| 7+ Person Families | 0 (0.0%) | $0 |
| Total | 2,214 (100.0%) | $118,793 |
Family Income by Number of Earners in Exeter
The median family income in Exeter is $118,793, with families comprising 3+ earners (263) having the highest median family income of $210,511, while families with no earners (223) have the lowest median family income of $61,250, accounting for 11.9% and 10.1% of families, respectively.
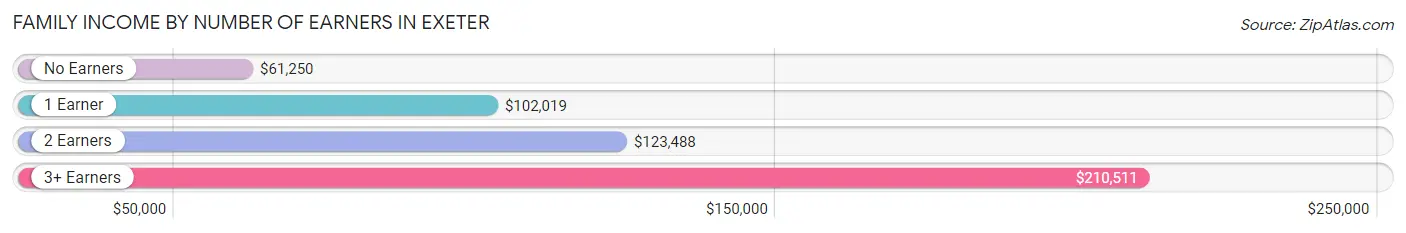
| Number of Earners | # Families | Median Income |
| No Earners | 223 (10.1%) | $61,250 |
| 1 Earner | 356 (16.1%) | $102,019 |
| 2 Earners | 1,372 (62.0%) | $123,488 |
| 3+ Earners | 263 (11.9%) | $210,511 |
| Total | 2,214 (100.0%) | $118,793 |
Household Income in Exeter
Household Income Brackets in Exeter
With 842 households falling in the category, the $100,000 to $149,999 income range is the most frequent in Exeter, accounting for 18.5% of all households. In contrast, only 96 households (2.1%) fall into the $10,000 to $14,999 income bracket, making it the least populous group.
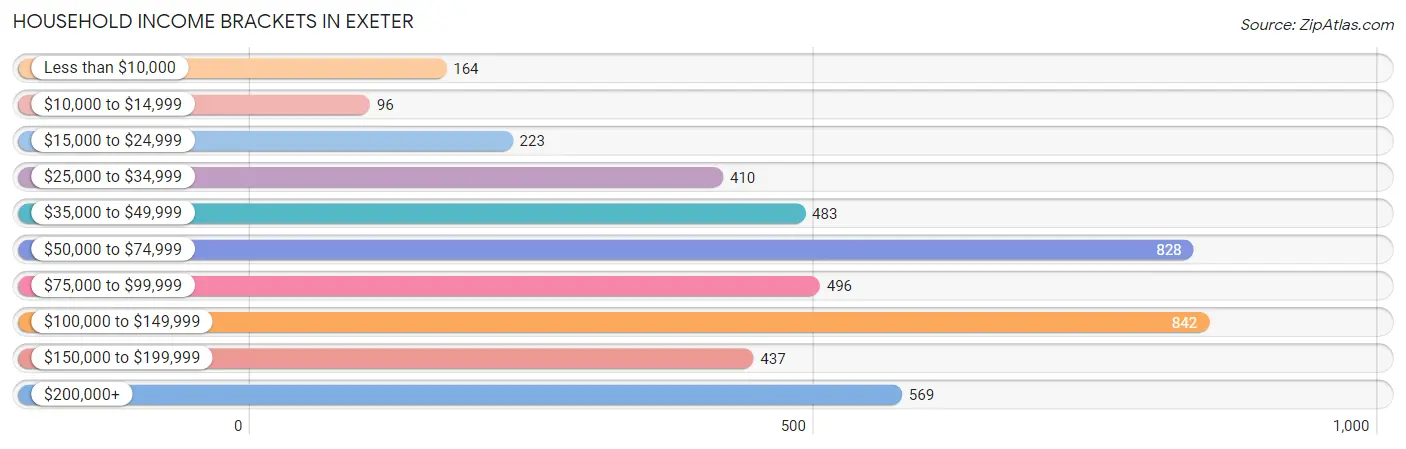
| Income Bracket | # Households | % Households |
| Less than $10,000 | 164 | 3.6% |
| $10,000 to $14,999 | 96 | 2.1% |
| $15,000 to $24,999 | 223 | 4.9% |
| $25,000 to $34,999 | 410 | 9.0% |
| $35,000 to $49,999 | 483 | 10.6% |
| $50,000 to $74,999 | 828 | 18.2% |
| $75,000 to $99,999 | 496 | 10.9% |
| $100,000 to $149,999 | 842 | 18.5% |
| $150,000 to $199,999 | 437 | 9.6% |
| $200,000+ | 569 | 12.5% |
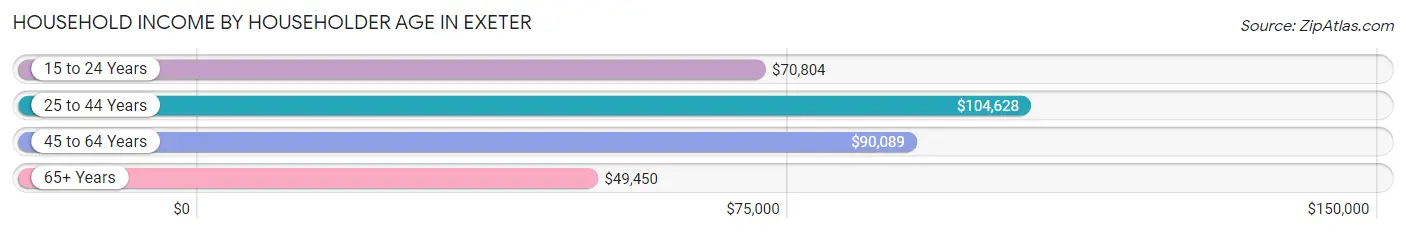
Household Income by Householder Age in Exeter
The median household income in Exeter is $79,813, with the highest median household income of $104,628 found in the 25 to 44 years age bracket for the primary householder. A total of 1,133 households (24.9%) fall into this category. Meanwhile, the 65+ years age bracket for the primary householder has the lowest median household income of $49,450, with 1,444 households (31.7%) in this group.
| Income Bracket | # Households | Median Income |
| 15 to 24 Years | 293 (6.4%) | $70,804 |
| 25 to 44 Years | 1,133 (24.9%) | $104,628 |
| 45 to 64 Years | 1,682 (36.9%) | $90,089 |
| 65+ Years | 1,444 (31.7%) | $49,450 |
| Total | 4,552 (100.0%) | $79,813 |
Poverty in Exeter
Income Below Poverty by Sex and Age in Exeter
With 7.1% poverty level for males and 7.5% for females among the residents of Exeter, 15 year old males and 55 to 64 year old females are the most vulnerable to poverty, with 12 males (48.0%) and 129 females (15.7%) in their respective age groups living below the poverty level.
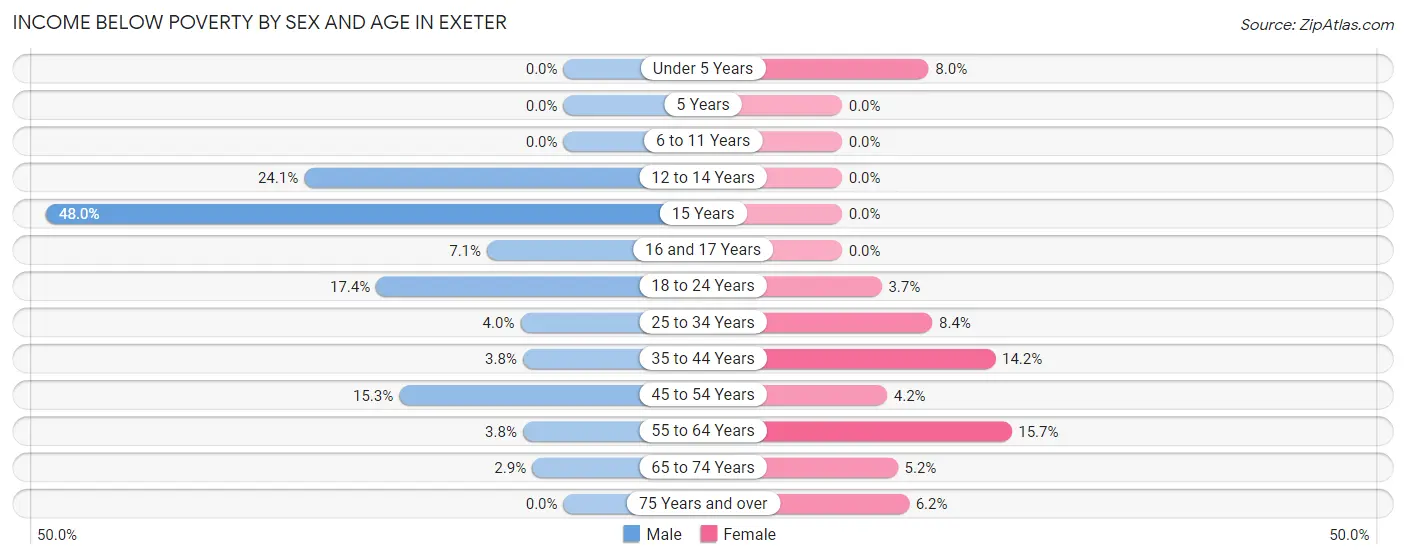
| Age Bracket | Male | Female |
| Under 5 Years | 0 (0.0%) | 9 (8.0%) |
| 5 Years | 0 (0.0%) | 0 (0.0%) |
| 6 to 11 Years | 0 (0.0%) | 0 (0.0%) |
| 12 to 14 Years | 26 (24.1%) | 0 (0.0%) |
| 15 Years | 12 (48.0%) | 0 (0.0%) |
| 16 and 17 Years | 12 (7.1%) | 0 (0.0%) |
| 18 to 24 Years | 77 (17.4%) | 21 (3.7%) |
| 25 to 34 Years | 27 (4.0%) | 58 (8.4%) |
| 35 to 44 Years | 17 (3.8%) | 91 (14.2%) |
| 45 to 54 Years | 106 (15.2%) | 34 (4.2%) |
| 55 to 64 Years | 26 (3.8%) | 129 (15.7%) |
| 65 to 74 Years | 13 (2.9%) | 34 (5.2%) |
| 75 Years and over | 0 (0.0%) | 36 (6.2%) |
| Total | 316 (7.1%) | 412 (7.5%) |
Income Above Poverty by Sex and Age in Exeter
According to the poverty statistics in Exeter, males aged under 5 years and females aged 5 years are the age groups that are most secure financially, with 100.0% of males and 100.0% of females in these age groups living above the poverty line.
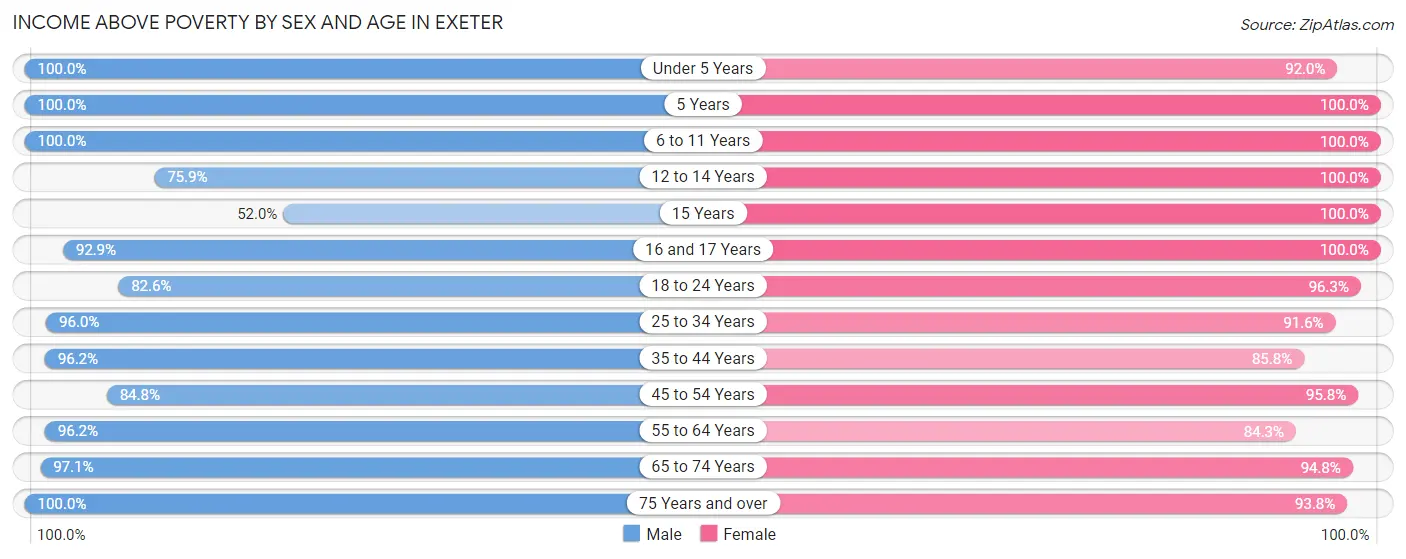
| Age Bracket | Male | Female |
| Under 5 Years | 150 (100.0%) | 103 (92.0%) |
| 5 Years | 11 (100.0%) | 69 (100.0%) |
| 6 to 11 Years | 207 (100.0%) | 410 (100.0%) |
| 12 to 14 Years | 82 (75.9%) | 39 (100.0%) |
| 15 Years | 13 (52.0%) | 7 (100.0%) |
| 16 and 17 Years | 157 (92.9%) | 53 (100.0%) |
| 18 to 24 Years | 366 (82.6%) | 549 (96.3%) |
| 25 to 34 Years | 648 (96.0%) | 634 (91.6%) |
| 35 to 44 Years | 434 (96.2%) | 549 (85.8%) |
| 45 to 54 Years | 589 (84.8%) | 779 (95.8%) |
| 55 to 64 Years | 664 (96.2%) | 691 (84.3%) |
| 65 to 74 Years | 434 (97.1%) | 622 (94.8%) |
| 75 Years and over | 363 (100.0%) | 544 (93.8%) |
| Total | 4,118 (92.9%) | 5,049 (92.5%) |
Income Below Poverty Among Married-Couple Families in Exeter
The poverty statistics for married-couple families in Exeter show that 0.7% or 13 of the total 1,796 families live below the poverty line. Families with no children have the highest poverty rate of 1.1%, comprising of 13 families. On the other hand, families with 1 or 2 children have the lowest poverty rate of 0.0%, which includes 0 families.
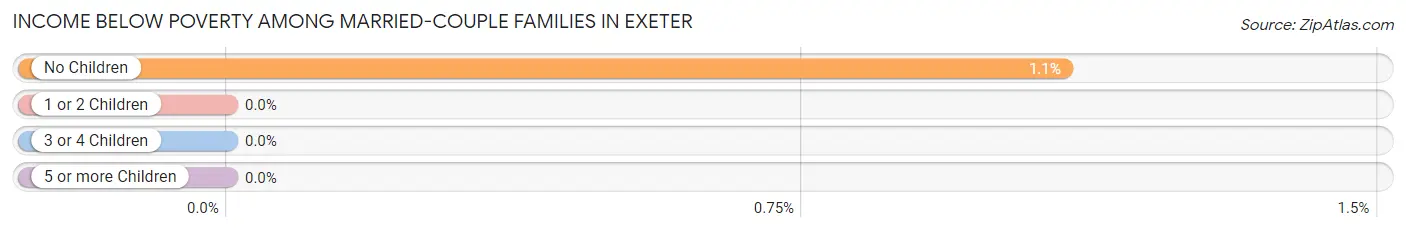
| Children | Above Poverty | Below Poverty |
| No Children | 1,182 (98.9%) | 13 (1.1%) |
| 1 or 2 Children | 440 (100.0%) | 0 (0.0%) |
| 3 or 4 Children | 161 (100.0%) | 0 (0.0%) |
| 5 or more Children | 0 (0.0%) | 0 (0.0%) |
| Total | 1,783 (99.3%) | 13 (0.7%) |
Income Below Poverty Among Single-Parent Households in Exeter
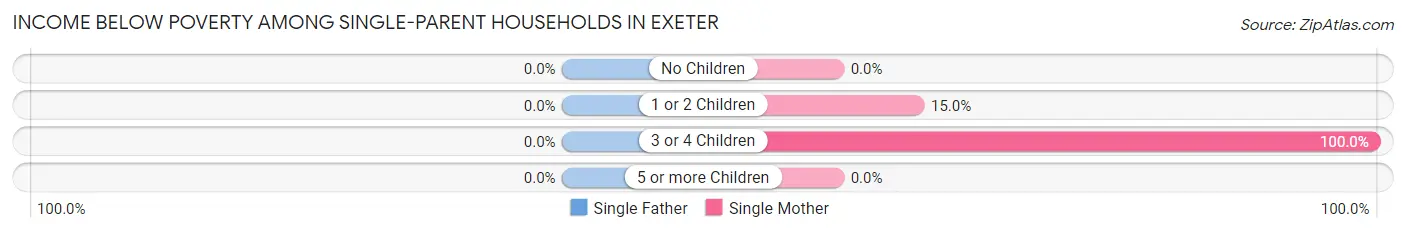
| Children | Single Father | Single Mother |
| No Children | 0 (0.0%) | 0 (0.0%) |
| 1 or 2 Children | 0 (0.0%) | 22 (15.0%) |
| 3 or 4 Children | 0 (0.0%) | 11 (100.0%) |
| 5 or more Children | 0 (0.0%) | 0 (0.0%) |
| Total | 0 (0.0%) | 33 (9.8%) |
Income Below Poverty Among Married-Couple vs Single-Parent Households in Exeter
The poverty data for Exeter shows that 13 of the married-couple family households (0.7%) and 33 of the single-parent households (7.9%) are living below the poverty level. Within the married-couple family households, those with no children have the highest poverty rate, with 13 households (1.1%) falling below the poverty line. Among the single-parent households, those with 3 or 4 children have the highest poverty rate, with 11 household (100.0%) living below poverty.
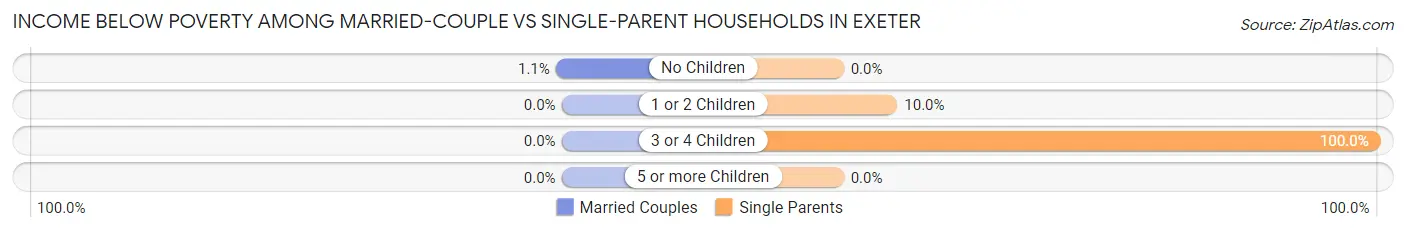
| Children | Married-Couple Families | Single-Parent Households |
| No Children | 13 (1.1%) | 0 (0.0%) |
| 1 or 2 Children | 0 (0.0%) | 22 (10.0%) |
| 3 or 4 Children | 0 (0.0%) | 11 (100.0%) |
| 5 or more Children | 0 (0.0%) | 0 (0.0%) |
| Total | 13 (0.7%) | 33 (7.9%) |
Race in Exeter
The most populous races in Exeter are White / Caucasian (8,647 | 87.2%), Two or more Races (647 | 6.5%), and Asian (514 | 5.2%).
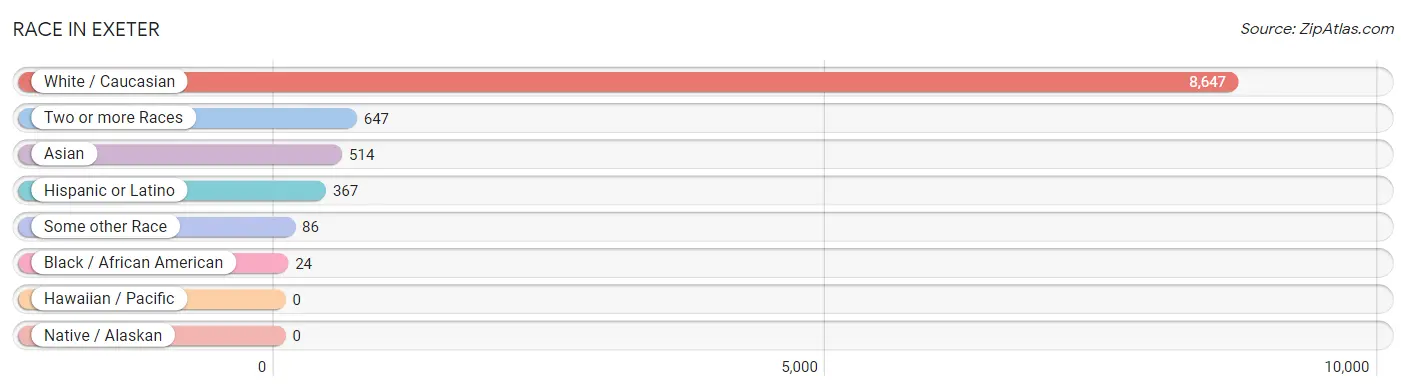
| Race | # Population | % Population |
| Asian | 514 | 5.2% |
| Black / African American | 24 | 0.2% |
| Hawaiian / Pacific | 0 | 0.0% |
| Hispanic or Latino | 367 | 3.7% |
| Native / Alaskan | 0 | 0.0% |
| White / Caucasian | 8,647 | 87.2% |
| Two or more Races | 647 | 6.5% |
| Some other Race | 86 | 0.9% |
| Total | 9,918 | 100.0% |
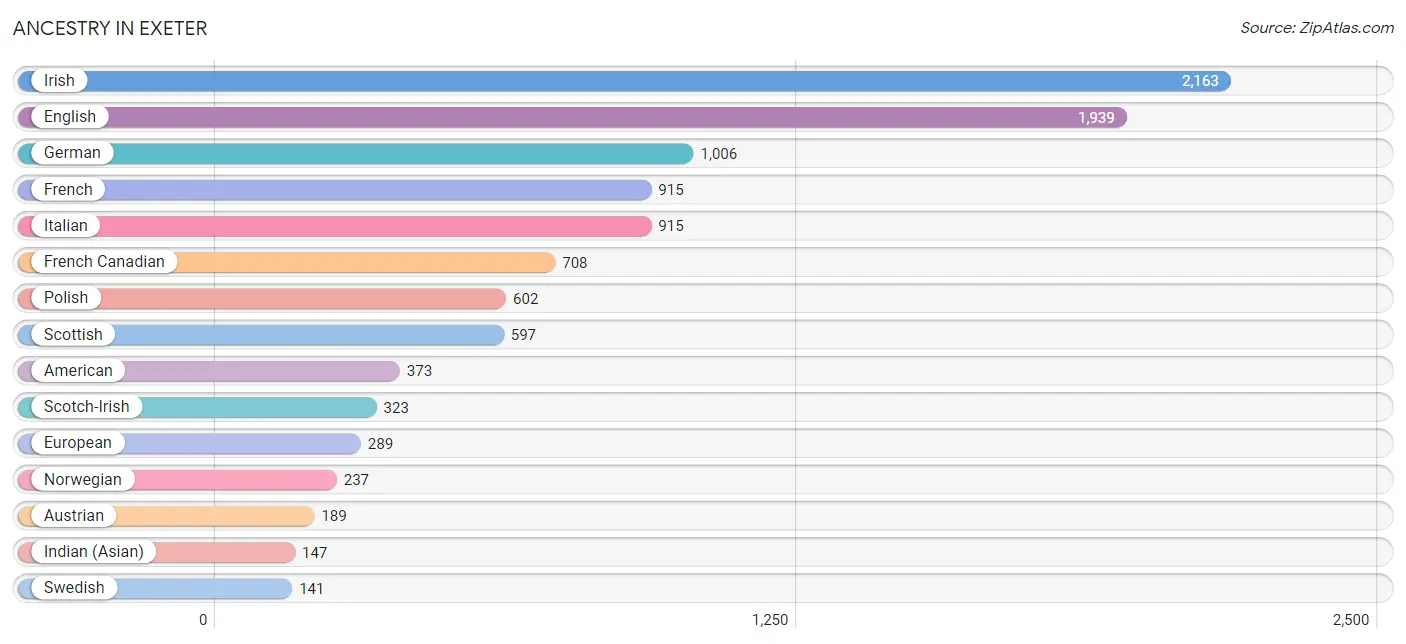
Ancestry in Exeter
The most populous ancestries reported in Exeter are Irish (2,163 | 21.8%), English (1,939 | 19.6%), German (1,006 | 10.1%), French (915 | 9.2%), and Italian (915 | 9.2%), together accounting for 70.0% of all Exeter residents.
| Ancestry | # Population | % Population |
| American | 373 | 3.8% |
| Arab | 21 | 0.2% |
| Armenian | 58 | 0.6% |
| Australian | 10 | 0.1% |
| Austrian | 189 | 1.9% |
| Bhutanese | 28 | 0.3% |
| British | 55 | 0.5% |
| Burmese | 76 | 0.8% |
| Canadian | 72 | 0.7% |
| Central American | 65 | 0.7% |
| Danish | 35 | 0.4% |
| Dominican | 39 | 0.4% |
| Dutch | 93 | 0.9% |
| Eastern European | 71 | 0.7% |
| Ecuadorian | 8 | 0.1% |
| English | 1,939 | 19.6% |
| European | 289 | 2.9% |
| Finnish | 74 | 0.7% |
| French | 915 | 9.2% |
| French Canadian | 708 | 7.1% |
| German | 1,006 | 10.1% |
| Greek | 62 | 0.6% |
| Guatemalan | 11 | 0.1% |
| Haitian | 24 | 0.2% |
| Honduran | 54 | 0.5% |
| Hungarian | 16 | 0.2% |
| Indian (Asian) | 147 | 1.5% |
| Irish | 2,163 | 21.8% |
| Italian | 915 | 9.2% |
| Korean | 121 | 1.2% |
| Latvian | 16 | 0.2% |
| Lebanese | 7 | 0.1% |
| Lithuanian | 100 | 1.0% |
| Malaysian | 54 | 0.5% |
| Mexican | 51 | 0.5% |
| Norwegian | 237 | 2.4% |
| Pennsylvania German | 12 | 0.1% |
| Polish | 602 | 6.1% |
| Portuguese | 103 | 1.0% |
| Puerto Rican | 37 | 0.4% |
| Romanian | 42 | 0.4% |
| Russian | 133 | 1.3% |
| Scandinavian | 11 | 0.1% |
| Scotch-Irish | 323 | 3.3% |
| Scottish | 597 | 6.0% |
| South American | 8 | 0.1% |
| Spaniard | 48 | 0.5% |
| Spanish | 106 | 1.1% |
| Sri Lankan | 23 | 0.2% |
| Swedish | 141 | 1.4% |
| Swiss | 12 | 0.1% |
| Thai | 113 | 1.1% |
| Turkish | 25 | 0.3% |
| Ukrainian | 52 | 0.5% |
| Welsh | 137 | 1.4% | View All 55 Rows |
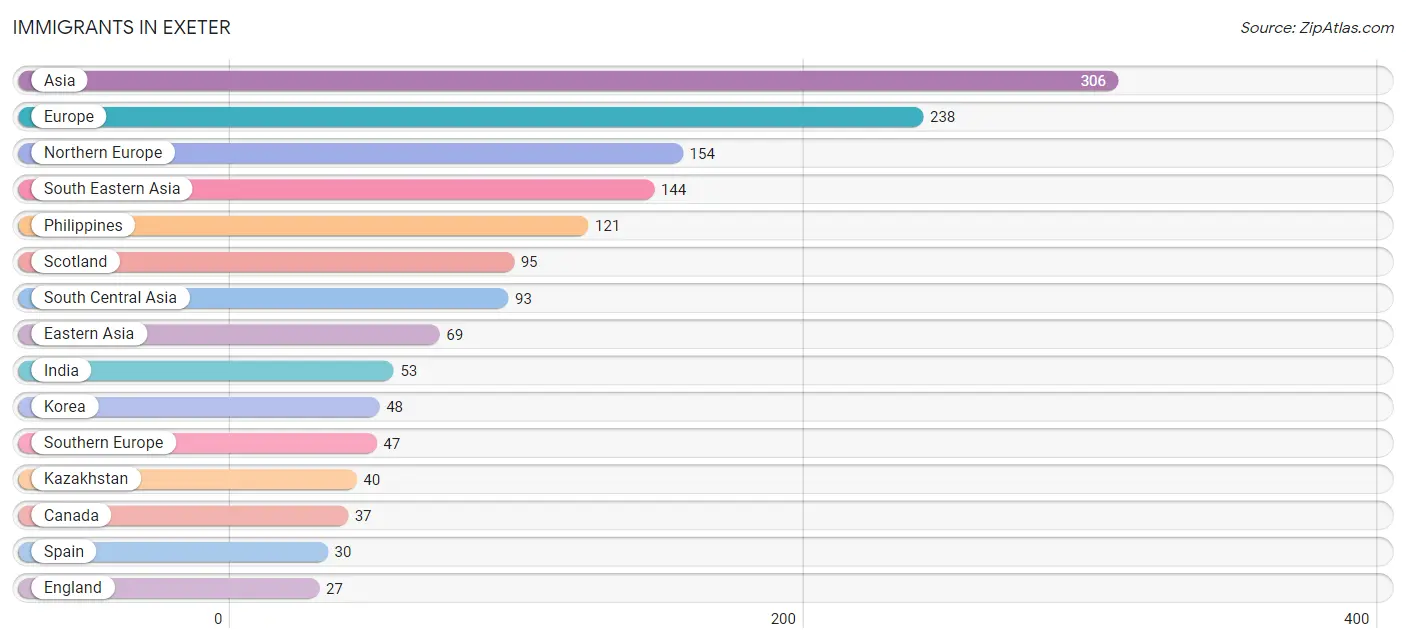
Immigrants in Exeter
The most numerous immigrant groups reported in Exeter came from Asia (306 | 3.1%), Europe (238 | 2.4%), Northern Europe (154 | 1.5%), South Eastern Asia (144 | 1.5%), and Philippines (121 | 1.2%), together accounting for 9.7% of all Exeter residents.
| Immigration Origin | # Population | % Population |
| Asia | 306 | 3.1% |
| Australia | 10 | 0.1% |
| Canada | 37 | 0.4% |
| Central America | 11 | 0.1% |
| China | 14 | 0.1% |
| Eastern Asia | 69 | 0.7% |
| Eastern Europe | 25 | 0.3% |
| England | 27 | 0.3% |
| Europe | 238 | 2.4% |
| Germany | 12 | 0.1% |
| Guatemala | 11 | 0.1% |
| India | 53 | 0.5% |
| Ireland | 17 | 0.2% |
| Italy | 17 | 0.2% |
| Japan | 7 | 0.1% |
| Kazakhstan | 40 | 0.4% |
| Korea | 48 | 0.5% |
| Latin America | 11 | 0.1% |
| Northern Europe | 154 | 1.5% |
| Oceania | 10 | 0.1% |
| Philippines | 121 | 1.2% |
| Romania | 25 | 0.3% |
| Scotland | 95 | 1.0% |
| South Central Asia | 93 | 0.9% |
| South Eastern Asia | 144 | 1.5% |
| Southern Europe | 47 | 0.5% |
| Spain | 30 | 0.3% |
| Vietnam | 23 | 0.2% |
| Western Europe | 12 | 0.1% | View All 29 Rows |
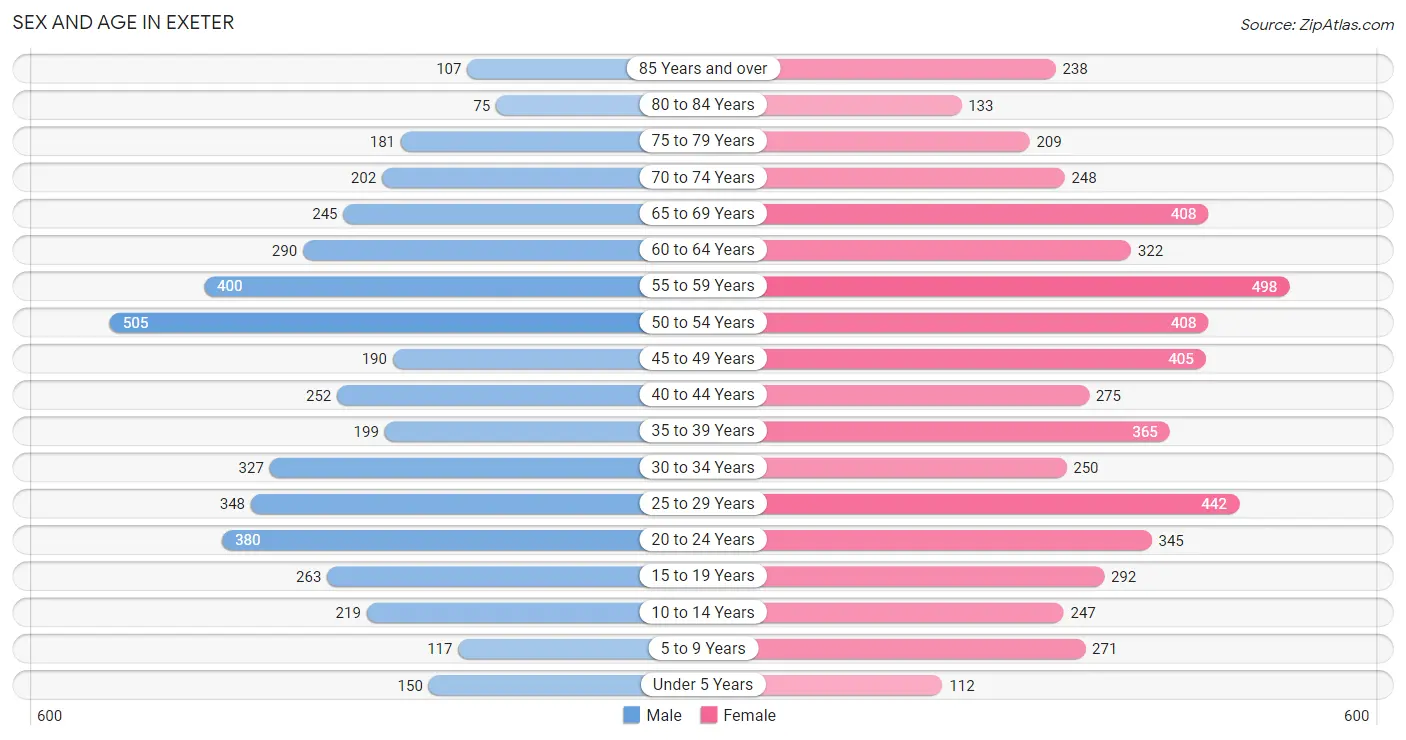
Sex and Age in Exeter
Sex and Age in Exeter
The most populous age groups in Exeter are 50 to 54 Years (505 | 11.4%) for men and 55 to 59 Years (498 | 9.1%) for women.
| Age Bracket | Male | Female |
| Under 5 Years | 150 (3.4%) | 112 (2.1%) |
| 5 to 9 Years | 117 (2.6%) | 271 (5.0%) |
| 10 to 14 Years | 219 (4.9%) | 247 (4.5%) |
| 15 to 19 Years | 263 (5.9%) | 292 (5.3%) |
| 20 to 24 Years | 380 (8.5%) | 345 (6.3%) |
| 25 to 29 Years | 348 (7.8%) | 442 (8.1%) |
| 30 to 34 Years | 327 (7.3%) | 250 (4.6%) |
| 35 to 39 Years | 199 (4.5%) | 365 (6.7%) |
| 40 to 44 Years | 252 (5.7%) | 275 (5.0%) |
| 45 to 49 Years | 190 (4.3%) | 405 (7.4%) |
| 50 to 54 Years | 505 (11.4%) | 408 (7.5%) |
| 55 to 59 Years | 400 (9.0%) | 498 (9.1%) |
| 60 to 64 Years | 290 (6.5%) | 322 (5.9%) |
| 65 to 69 Years | 245 (5.5%) | 408 (7.5%) |
| 70 to 74 Years | 202 (4.5%) | 248 (4.5%) |
| 75 to 79 Years | 181 (4.1%) | 209 (3.8%) |
| 80 to 84 Years | 75 (1.7%) | 133 (2.4%) |
| 85 Years and over | 107 (2.4%) | 238 (4.3%) |
| Total | 4,450 (100.0%) | 5,468 (100.0%) |
Families and Households in Exeter
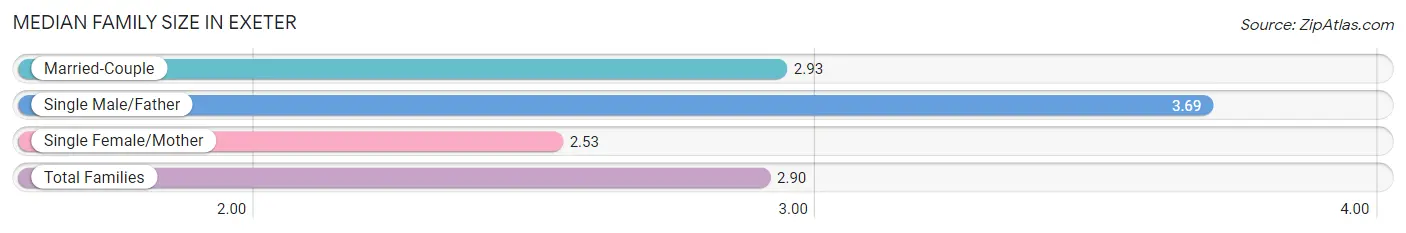
Median Family Size in Exeter
The median family size in Exeter is 2.90 persons per family, with single male/father families (80 | 3.6%) accounting for the largest median family size of 3.69 persons per family. On the other hand, single female/mother families (338 | 15.3%) represent the smallest median family size with 2.53 persons per family.
| Family Type | # Families | Family Size |
| Married-Couple | 1,796 (81.1%) | 2.93 |
| Single Male/Father | 80 (3.6%) | 3.69 |
| Single Female/Mother | 338 (15.3%) | 2.53 |
| Total Families | 2,214 (100.0%) | 2.90 |
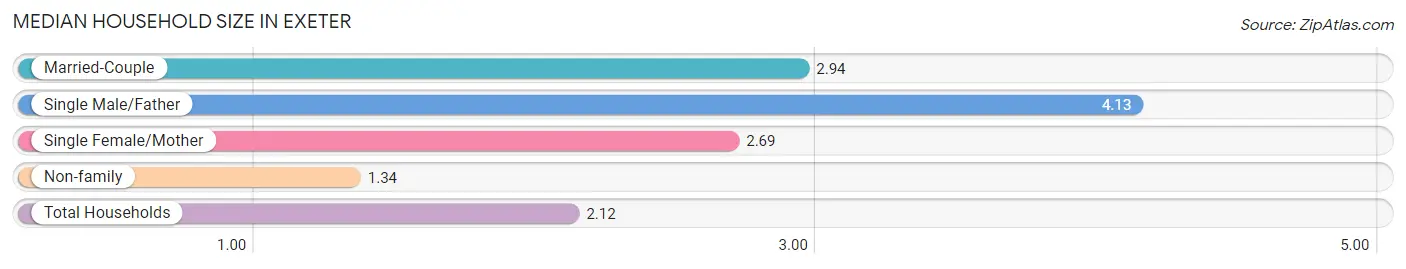
Median Household Size in Exeter
The median household size in Exeter is 2.12 persons per household, with single male/father households (80 | 1.8%) accounting for the largest median household size of 4.13 persons per household. non-family households (2,338 | 51.4%) represent the smallest median household size with 1.34 persons per household.
| Household Type | # Households | Household Size |
| Married-Couple | 1,796 (39.5%) | 2.94 |
| Single Male/Father | 80 (1.8%) | 4.13 |
| Single Female/Mother | 338 (7.4%) | 2.69 |
| Non-family | 2,338 (51.4%) | 1.34 |
| Total Households | 4,552 (100.0%) | 2.12 |
Household Size by Marriage Status in Exeter
Out of a total of 4,552 households in Exeter, 2,214 (48.6%) are family households, while 2,338 (51.4%) are nonfamily households. The most numerous type of family households are 2-person households, comprising 1,142, and the most common type of nonfamily households are 1-person households, comprising 1,654.
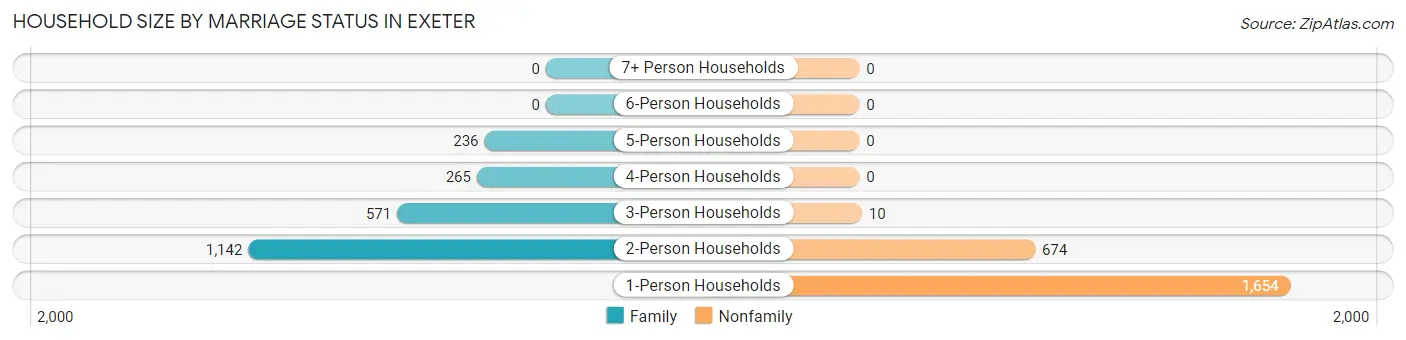
| Household Size | Family Households | Nonfamily Households |
| 1-Person Households | - | 1,654 (36.3%) |
| 2-Person Households | 1,142 (25.1%) | 674 (14.8%) |
| 3-Person Households | 571 (12.5%) | 10 (0.2%) |
| 4-Person Households | 265 (5.8%) | 0 (0.0%) |
| 5-Person Households | 236 (5.2%) | 0 (0.0%) |
| 6-Person Households | 0 (0.0%) | 0 (0.0%) |
| 7+ Person Households | 0 (0.0%) | 0 (0.0%) |
| Total | 2,214 (48.6%) | 2,338 (51.4%) |
Female Fertility in Exeter
Fertility by Age in Exeter
Average fertility rate in Exeter is 47.0 births per 1,000 women. Women in the age bracket of 20 to 34 years have the highest fertility rate with 109.0 births per 1,000 women. Women in the age bracket of 20 to 34 years acount for 100.0% of all women with births.
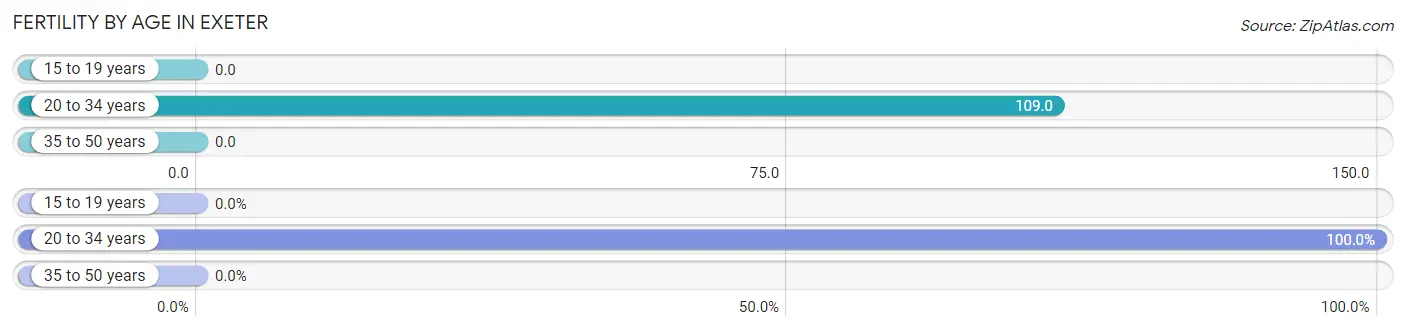
| Age Bracket | Women with Births | Births / 1,000 Women |
| 15 to 19 years | 0 (0.0%) | 0.0 |
| 20 to 34 years | 113 (100.0%) | 109.0 |
| 35 to 50 years | 0 (0.0%) | 0.0 |
| Total | 113 (100.0%) | 47.0 |
Fertility by Age by Marriage Status in Exeter
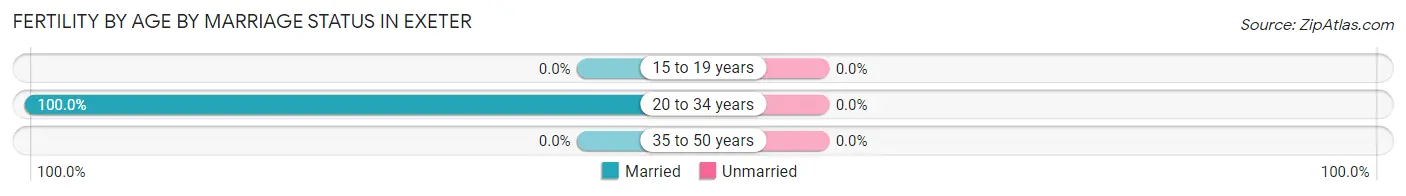
| Age Bracket | Married | Unmarried |
| 15 to 19 years | 0 (0.0%) | 0 (0.0%) |
| 20 to 34 years | 113 (100.0%) | 0 (0.0%) |
| 35 to 50 years | 0 (0.0%) | 0 (0.0%) |
| Total | 113 (100.0%) | 0 (0.0%) |
Fertility by Education in Exeter
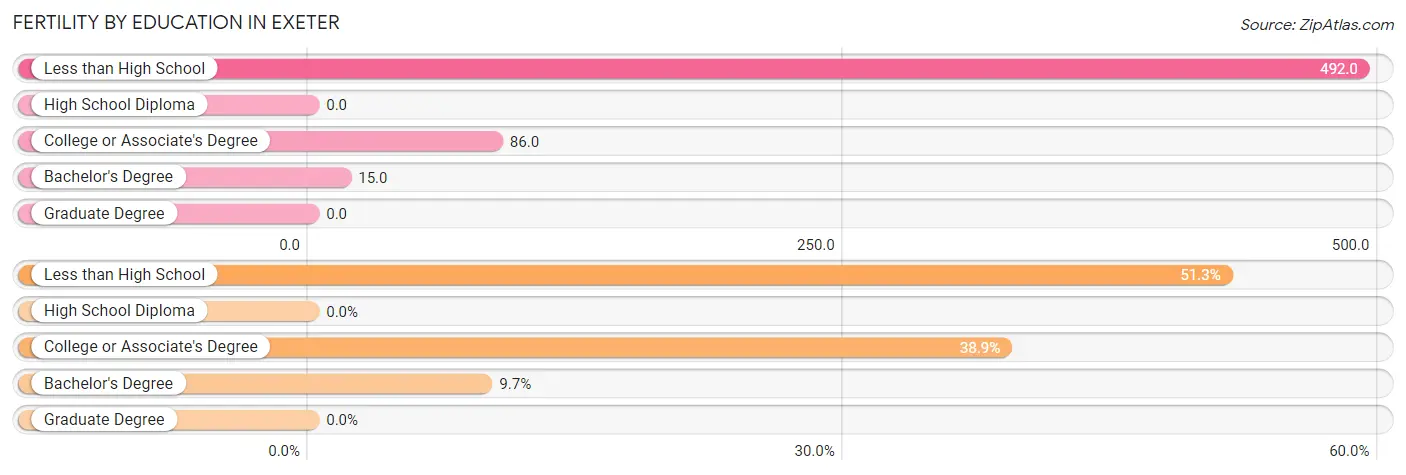
| Educational Attainment | Women with Births | Births / 1,000 Women |
| Less than High School | 58 (51.3%) | 492.0 |
| High School Diploma | 0 (0.0%) | 0.0 |
| College or Associate's Degree | 44 (38.9%) | 86.0 |
| Bachelor's Degree | 11 (9.7%) | 15.0 |
| Graduate Degree | 0 (0.0%) | 0.0 |
| Total | 113 (100.0%) | 47.0 |
Fertility by Education by Marriage Status in Exeter
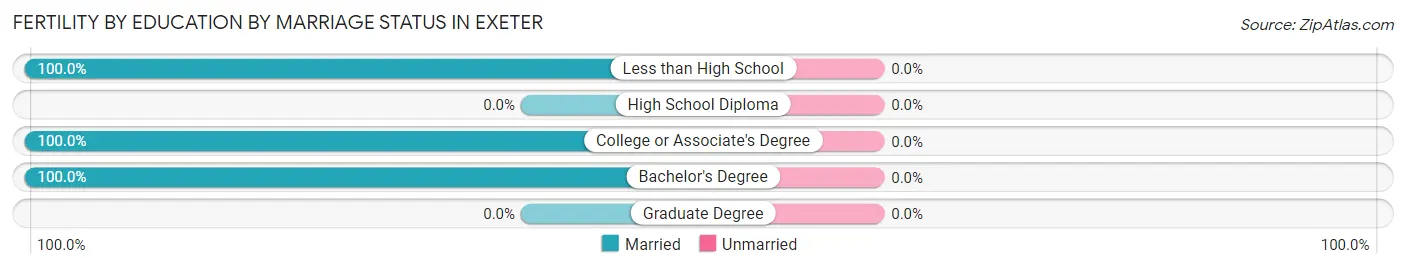
| Educational Attainment | Married | Unmarried |
| Less than High School | 58 (100.0%) | 0 (0.0%) |
| High School Diploma | 0 (0.0%) | 0 (0.0%) |
| College or Associate's Degree | 44 (100.0%) | 0 (0.0%) |
| Bachelor's Degree | 11 (100.0%) | 0 (0.0%) |
| Graduate Degree | 0 (0.0%) | 0 (0.0%) |
| Total | 113 (100.0%) | 0 (0.0%) |
Employment Characteristics in Exeter
Employment by Class of Employer in Exeter
Among the 6,160 employed individuals in Exeter, private company employees (4,011 | 65.1%), not-for-profit organizations (1,118 | 18.1%), and local government employees (423 | 6.9%) make up the most common classes of employment.
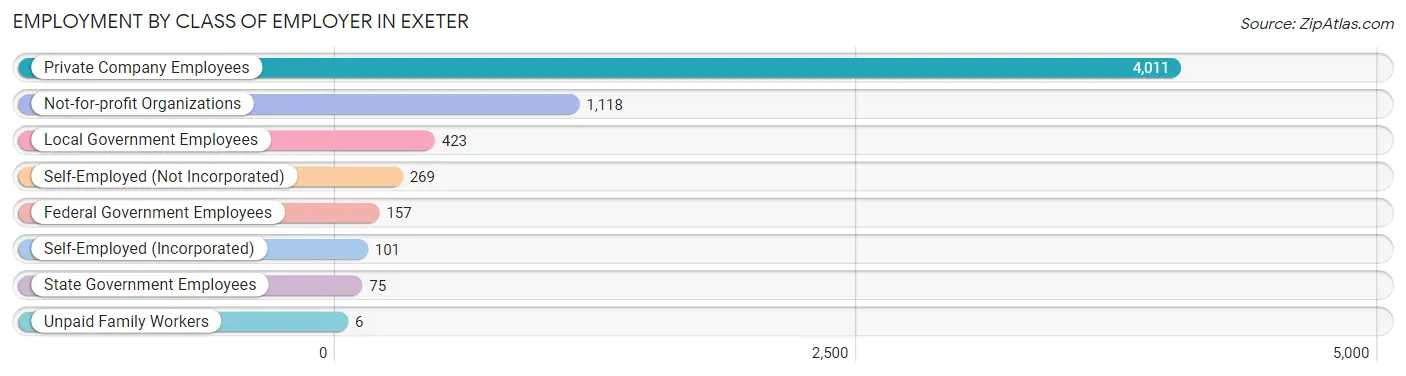
| Employer Class | # Employees | % Employees |
| Private Company Employees | 4,011 | 65.1% |
| Self-Employed (Incorporated) | 101 | 1.6% |
| Self-Employed (Not Incorporated) | 269 | 4.4% |
| Not-for-profit Organizations | 1,118 | 18.1% |
| Local Government Employees | 423 | 6.9% |
| State Government Employees | 75 | 1.2% |
| Federal Government Employees | 157 | 2.5% |
| Unpaid Family Workers | 6 | 0.1% |
| Total | 6,160 | 100.0% |
Employment Status by Age in Exeter
According to the labor force statistics for Exeter, out of the total population over 16 years of age (8,770), 74.3% or 6,516 individuals are in the labor force, with 2.7% or 176 of them unemployed. The age group with the highest labor force participation rate is 25 to 29 years, with 100.0% or 790 individuals in the labor force. Within the labor force, the 16 to 19 years age range has the highest percentage of unemployed individuals, with 8.7% or 30 of them being unemployed.
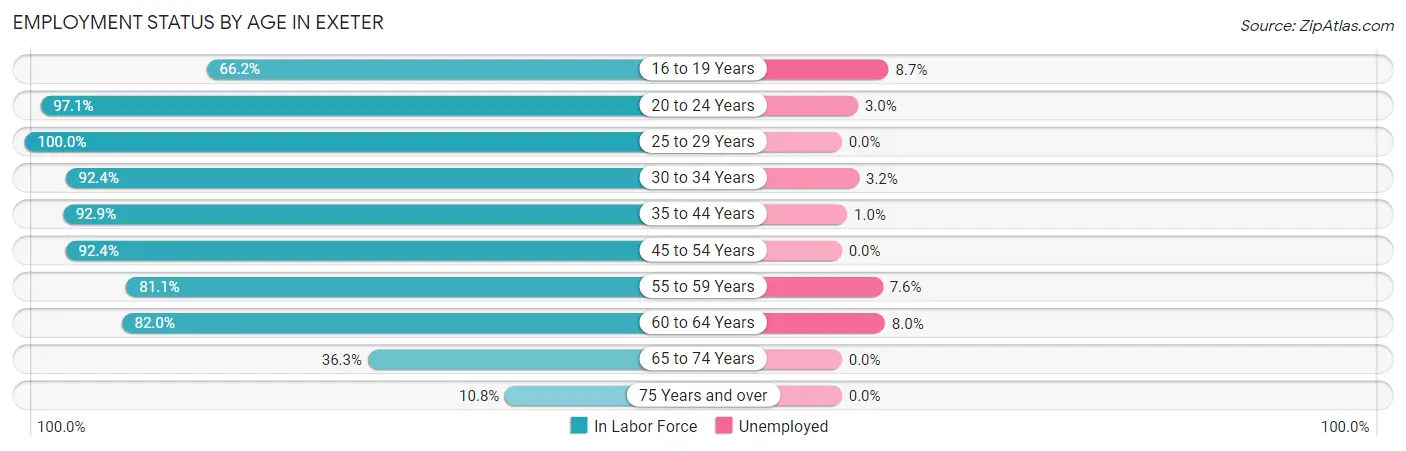
| Age Bracket | In Labor Force | Unemployed |
| 16 to 19 Years | 346 (66.2%) | 30 (8.7%) |
| 20 to 24 Years | 704 (97.1%) | 21 (3.0%) |
| 25 to 29 Years | 790 (100.0%) | 0 (0.0%) |
| 30 to 34 Years | 533 (92.4%) | 17 (3.2%) |
| 35 to 44 Years | 1,014 (92.9%) | 10 (1.0%) |
| 45 to 54 Years | 1,393 (92.4%) | 0 (0.0%) |
| 55 to 59 Years | 728 (81.1%) | 55 (7.6%) |
| 60 to 64 Years | 502 (82.0%) | 40 (8.0%) |
| 65 to 74 Years | 400 (36.3%) | 0 (0.0%) |
| 75 Years and over | 102 (10.8%) | 0 (0.0%) |
| Total | 6,516 (74.3%) | 176 (2.7%) |
Employment Status by Educational Attainment in Exeter
According to labor force statistics for Exeter, 90.6% of individuals (4,961) out of the total population between 25 and 64 years of age (5,476) are in the labor force, with 2.5% or 124 of them being unemployed. The group with the highest labor force participation rate are those with the educational attainment of less than high school, with 100.0% or 150 individuals in the labor force. Within the labor force, individuals with less than high school education have the highest percentage of unemployment, with 18.7% or 28 of them being unemployed.
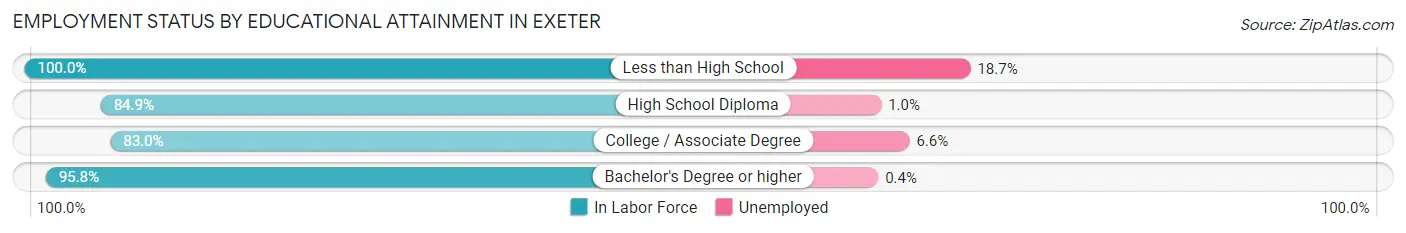
| Educational Attainment | In Labor Force | Unemployed |
| Less than High School | 150 (100.0%) | 28 (18.7%) |
| High School Diploma | 972 (84.9%) | 11 (1.0%) |
| College / Associate Degree | 1,094 (83.0%) | 87 (6.6%) |
| Bachelor's Degree or higher | 2,743 (95.8%) | 11 (0.4%) |
| Total | 4,961 (90.6%) | 137 (2.5%) |
Employment Occupations by Sex in Exeter
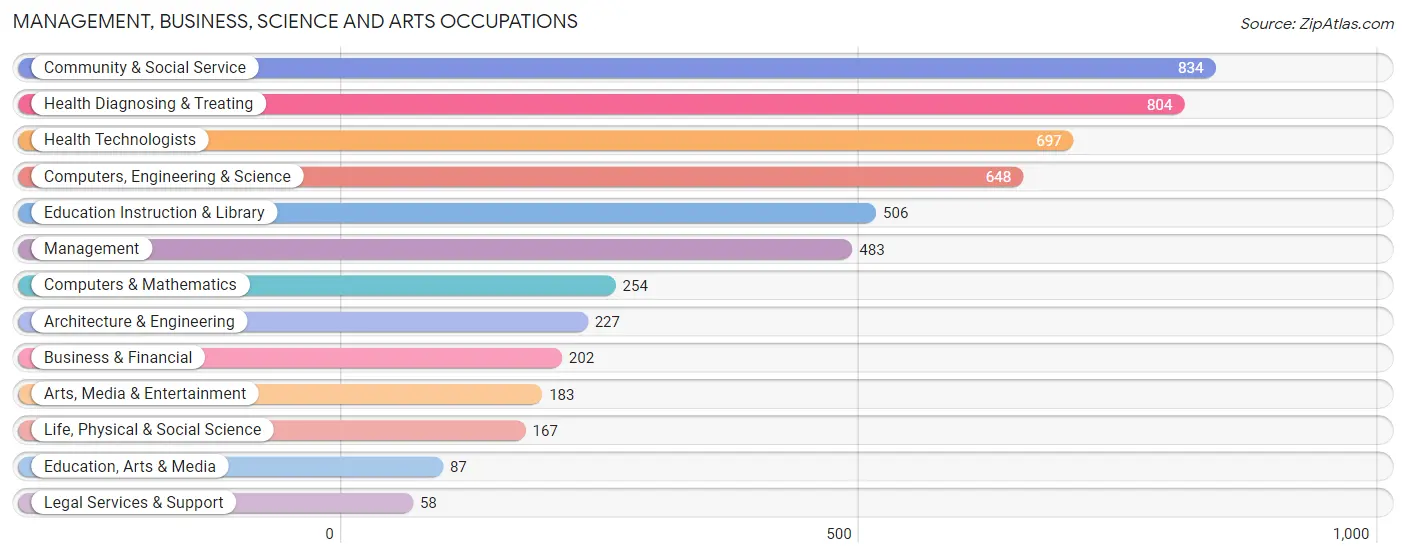
Management, Business, Science and Arts Occupations
The most common Management, Business, Science and Arts occupations in Exeter are Community & Social Service (834 | 13.2%), Health Diagnosing & Treating (804 | 12.7%), Health Technologists (697 | 11.0%), Computers, Engineering & Science (648 | 10.2%), and Education Instruction & Library (506 | 8.0%).
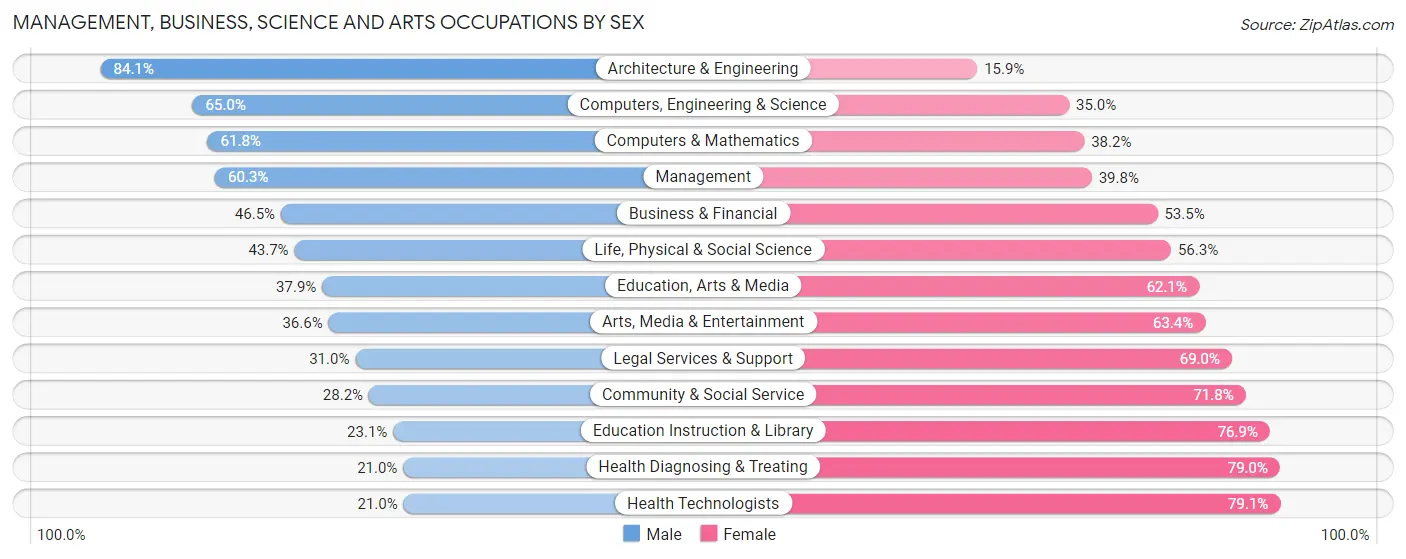
Management, Business, Science and Arts Occupations by Sex
Within the Management, Business, Science and Arts occupations in Exeter, the most male-oriented occupations are Architecture & Engineering (84.1%), Computers, Engineering & Science (65.0%), and Computers & Mathematics (61.8%), while the most female-oriented occupations are Health Technologists (79.0%), Health Diagnosing & Treating (79.0%), and Education Instruction & Library (76.9%).
| Occupation | Male | Female |
| Management | 291 (60.3%) | 192 (39.8%) |
| Business & Financial | 94 (46.5%) | 108 (53.5%) |
| Computers, Engineering & Science | 421 (65.0%) | 227 (35.0%) |
| Computers & Mathematics | 157 (61.8%) | 97 (38.2%) |
| Architecture & Engineering | 191 (84.1%) | 36 (15.9%) |
| Life, Physical & Social Science | 73 (43.7%) | 94 (56.3%) |
| Community & Social Service | 235 (28.2%) | 599 (71.8%) |
| Education, Arts & Media | 33 (37.9%) | 54 (62.1%) |
| Legal Services & Support | 18 (31.0%) | 40 (69.0%) |
| Education Instruction & Library | 117 (23.1%) | 389 (76.9%) |
| Arts, Media & Entertainment | 67 (36.6%) | 116 (63.4%) |
| Health Diagnosing & Treating | 169 (21.0%) | 635 (79.0%) |
| Health Technologists | 146 (20.9%) | 551 (79.0%) |
| Total (Category) | 1,210 (40.7%) | 1,761 (59.3%) |
| Total (Overall) | 2,988 (47.1%) | 3,351 (52.9%) |
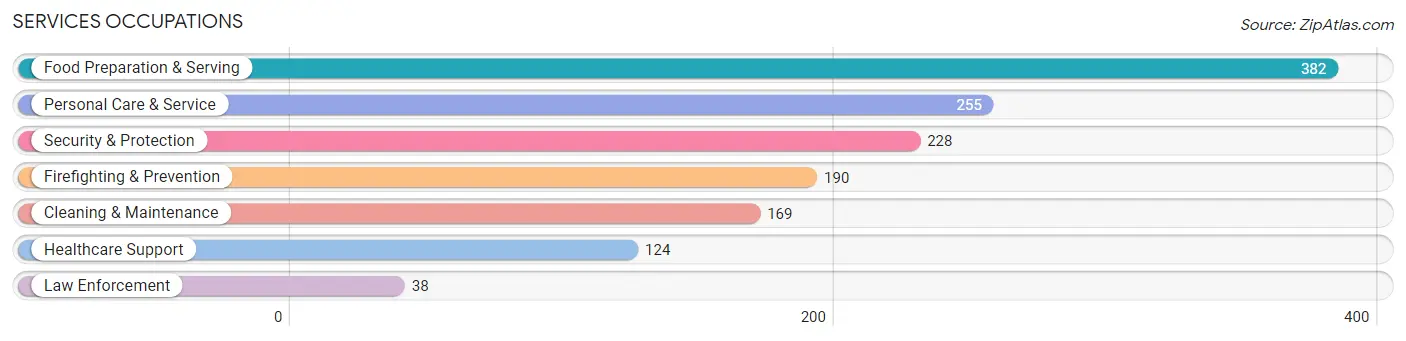
Services Occupations
The most common Services occupations in Exeter are Food Preparation & Serving (382 | 6.0%), Personal Care & Service (255 | 4.0%), Security & Protection (228 | 3.6%), Firefighting & Prevention (190 | 3.0%), and Cleaning & Maintenance (169 | 2.7%).
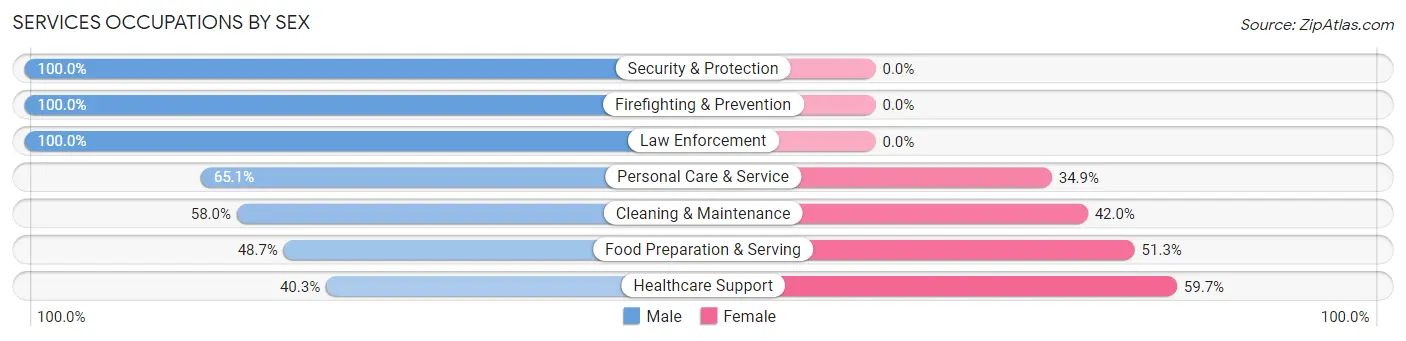
Services Occupations by Sex
Within the Services occupations in Exeter, the most male-oriented occupations are Security & Protection (100.0%), Firefighting & Prevention (100.0%), and Law Enforcement (100.0%), while the most female-oriented occupations are Healthcare Support (59.7%), Food Preparation & Serving (51.3%), and Cleaning & Maintenance (42.0%).
| Occupation | Male | Female |
| Healthcare Support | 50 (40.3%) | 74 (59.7%) |
| Security & Protection | 228 (100.0%) | 0 (0.0%) |
| Firefighting & Prevention | 190 (100.0%) | 0 (0.0%) |
| Law Enforcement | 38 (100.0%) | 0 (0.0%) |
| Food Preparation & Serving | 186 (48.7%) | 196 (51.3%) |
| Cleaning & Maintenance | 98 (58.0%) | 71 (42.0%) |
| Personal Care & Service | 166 (65.1%) | 89 (34.9%) |
| Total (Category) | 728 (62.9%) | 430 (37.1%) |
| Total (Overall) | 2,988 (47.1%) | 3,351 (52.9%) |
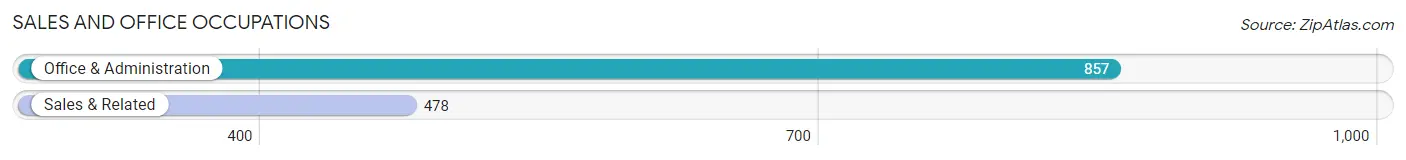
Sales and Office Occupations
The most common Sales and Office occupations in Exeter are Office & Administration (857 | 13.5%), and Sales & Related (478 | 7.5%).
Sales and Office Occupations by Sex
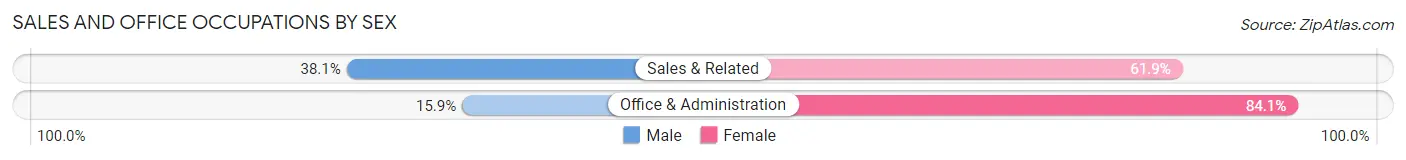
| Occupation | Male | Female |
| Sales & Related | 182 (38.1%) | 296 (61.9%) |
| Office & Administration | 136 (15.9%) | 721 (84.1%) |
| Total (Category) | 318 (23.8%) | 1,017 (76.2%) |
| Total (Overall) | 2,988 (47.1%) | 3,351 (52.9%) |
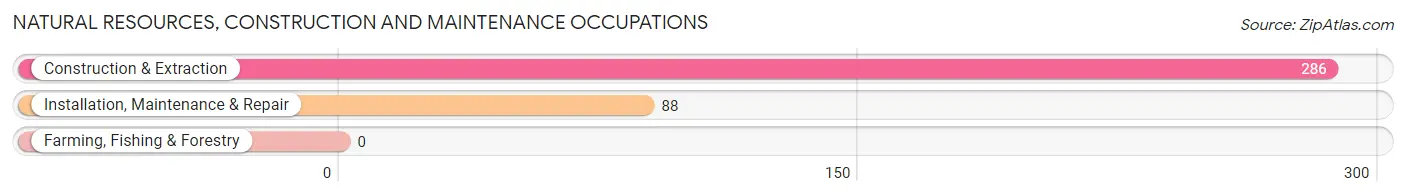
Natural Resources, Construction and Maintenance Occupations
The most common Natural Resources, Construction and Maintenance occupations in Exeter are Construction & Extraction (286 | 4.5%), and Installation, Maintenance & Repair (88 | 1.4%).
Natural Resources, Construction and Maintenance Occupations by Sex
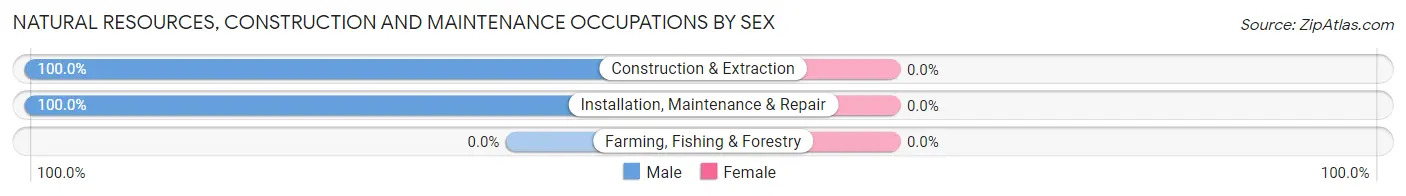
| Occupation | Male | Female |
| Farming, Fishing & Forestry | 0 (0.0%) | 0 (0.0%) |
| Construction & Extraction | 286 (100.0%) | 0 (0.0%) |
| Installation, Maintenance & Repair | 88 (100.0%) | 0 (0.0%) |
| Total (Category) | 374 (100.0%) | 0 (0.0%) |
| Total (Overall) | 2,988 (47.1%) | 3,351 (52.9%) |
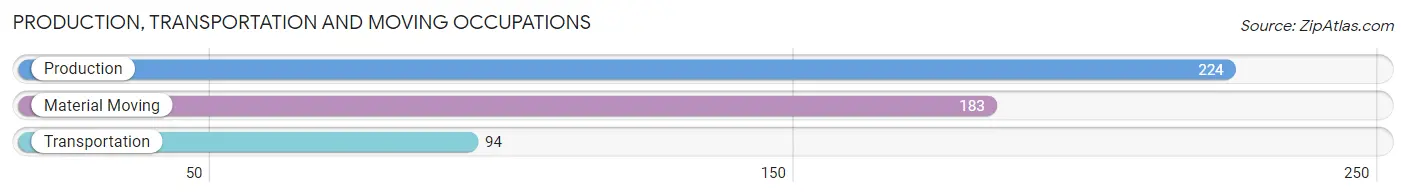
Production, Transportation and Moving Occupations
The most common Production, Transportation and Moving occupations in Exeter are Production (224 | 3.5%), Material Moving (183 | 2.9%), and Transportation (94 | 1.5%).
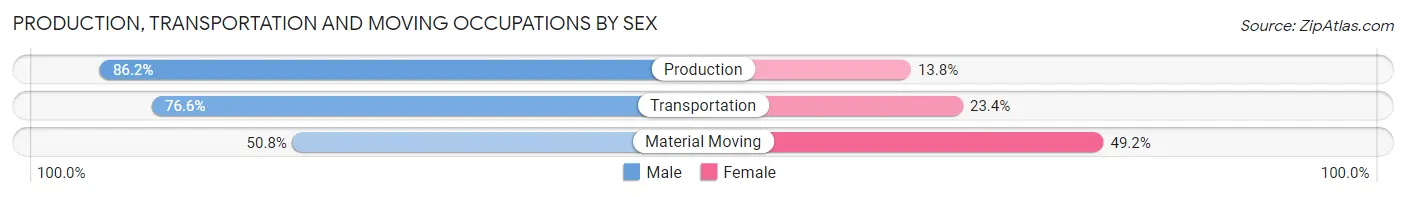
Production, Transportation and Moving Occupations by Sex
| Occupation | Male | Female |
| Production | 193 (86.2%) | 31 (13.8%) |
| Transportation | 72 (76.6%) | 22 (23.4%) |
| Material Moving | 93 (50.8%) | 90 (49.2%) |
| Total (Category) | 358 (71.5%) | 143 (28.5%) |
| Total (Overall) | 2,988 (47.1%) | 3,351 (52.9%) |
Employment Industries by Sex in Exeter
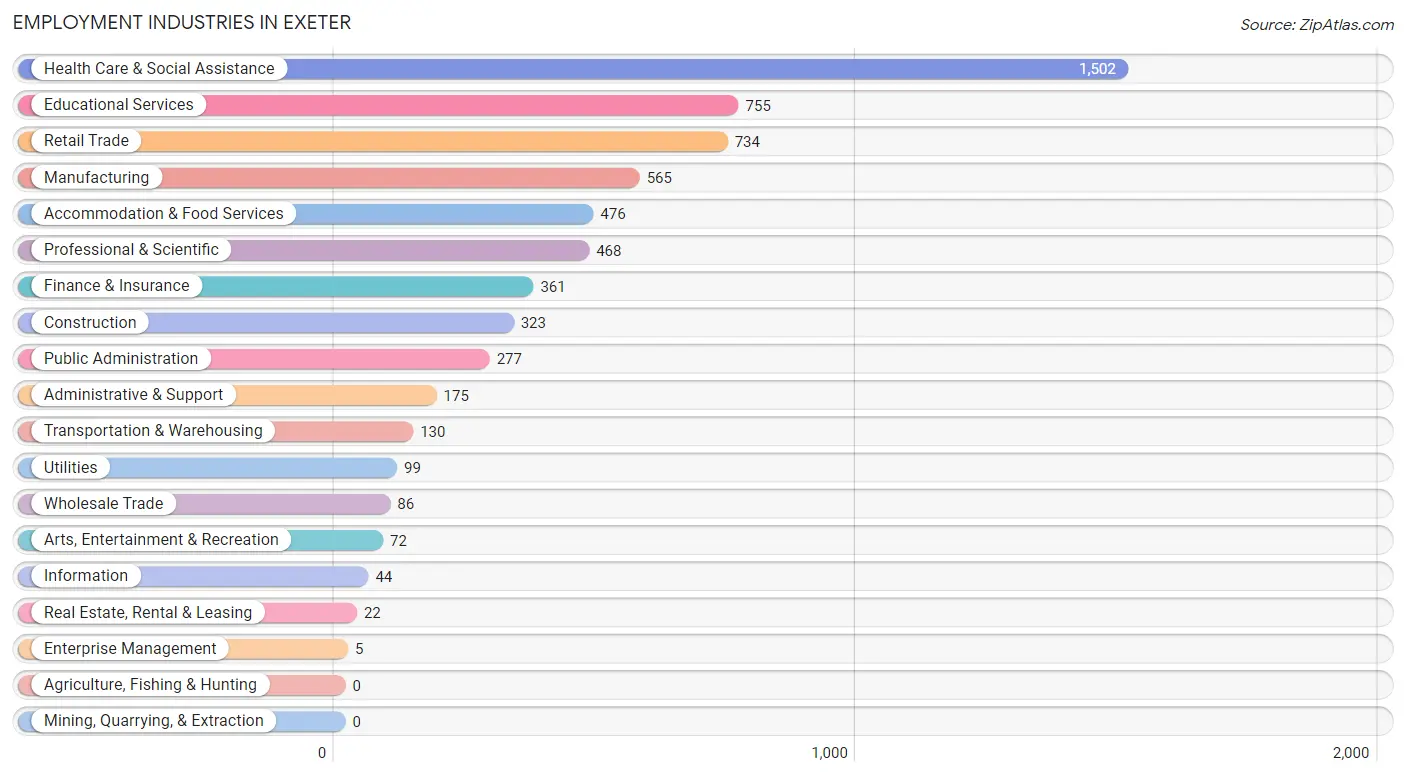
Employment Industries in Exeter
The major employment industries in Exeter include Health Care & Social Assistance (1,502 | 23.7%), Educational Services (755 | 11.9%), Retail Trade (734 | 11.6%), Manufacturing (565 | 8.9%), and Accommodation & Food Services (476 | 7.5%).
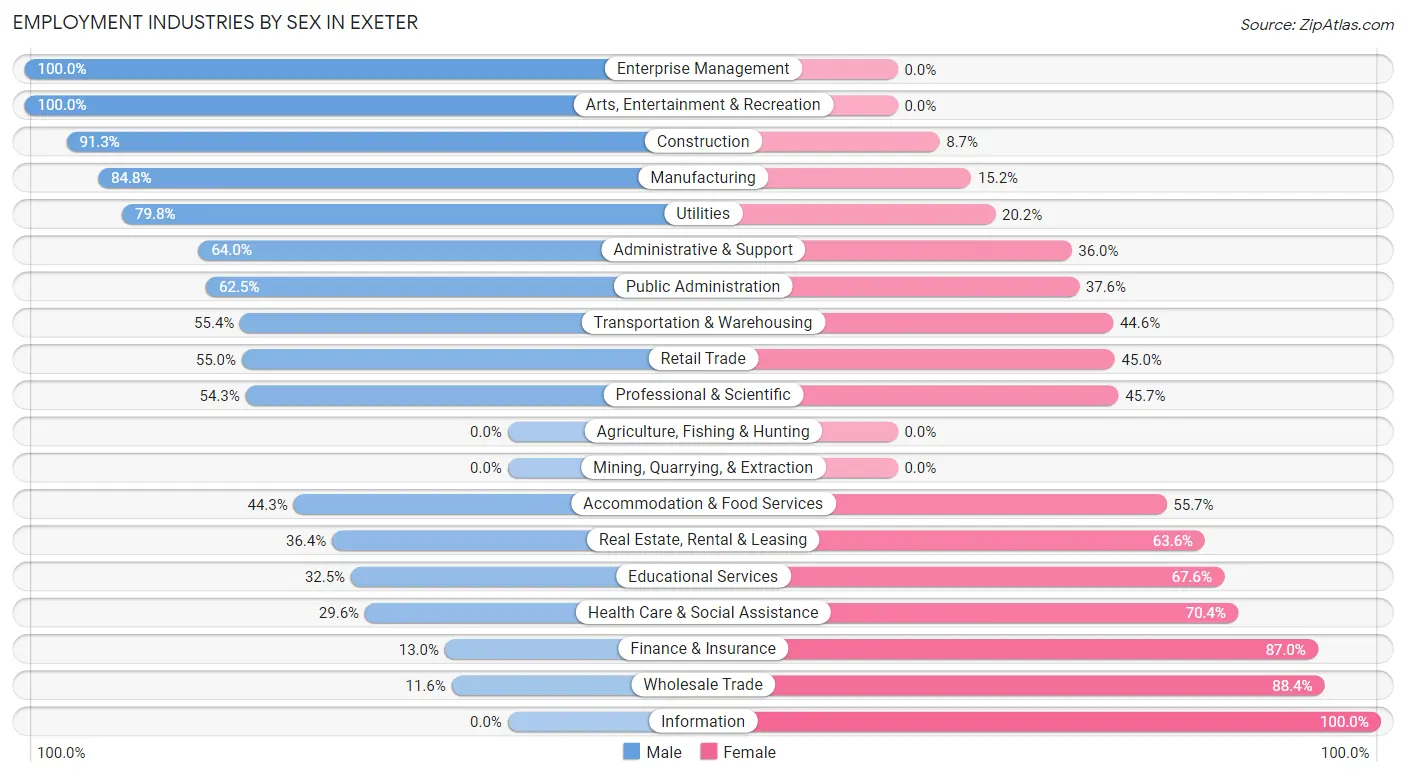
Employment Industries by Sex in Exeter
The Exeter industries that see more men than women are Enterprise Management (100.0%), Arts, Entertainment & Recreation (100.0%), and Construction (91.3%), whereas the industries that tend to have a higher number of women are Information (100.0%), Wholesale Trade (88.4%), and Finance & Insurance (87.0%).
| Industry | Male | Female |
| Agriculture, Fishing & Hunting | 0 (0.0%) | 0 (0.0%) |
| Mining, Quarrying, & Extraction | 0 (0.0%) | 0 (0.0%) |
| Construction | 295 (91.3%) | 28 (8.7%) |
| Manufacturing | 479 (84.8%) | 86 (15.2%) |
| Wholesale Trade | 10 (11.6%) | 76 (88.4%) |
| Retail Trade | 404 (55.0%) | 330 (45.0%) |
| Transportation & Warehousing | 72 (55.4%) | 58 (44.6%) |
| Utilities | 79 (79.8%) | 20 (20.2%) |
| Information | 0 (0.0%) | 44 (100.0%) |
| Finance & Insurance | 47 (13.0%) | 314 (87.0%) |
| Real Estate, Rental & Leasing | 8 (36.4%) | 14 (63.6%) |
| Professional & Scientific | 254 (54.3%) | 214 (45.7%) |
| Enterprise Management | 5 (100.0%) | 0 (0.0%) |
| Administrative & Support | 112 (64.0%) | 63 (36.0%) |
| Educational Services | 245 (32.5%) | 510 (67.5%) |
| Health Care & Social Assistance | 444 (29.6%) | 1,058 (70.4%) |
| Arts, Entertainment & Recreation | 72 (100.0%) | 0 (0.0%) |
| Accommodation & Food Services | 211 (44.3%) | 265 (55.7%) |
| Public Administration | 173 (62.5%) | 104 (37.6%) |
| Total | 2,988 (47.1%) | 3,351 (52.9%) |
Education in Exeter
School Enrollment in Exeter
The most common levels of schooling among the 1,883 students in Exeter are high school (420 | 22.3%), elementary school (407 | 21.6%), and graduate / professional (298 | 15.8%).
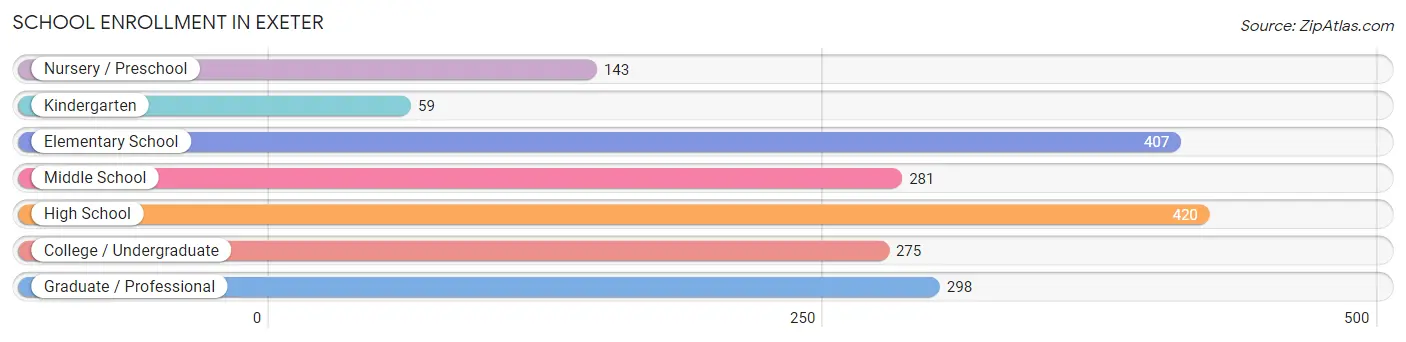
| School Level | # Students | % Students |
| Nursery / Preschool | 143 | 7.6% |
| Kindergarten | 59 | 3.1% |
| Elementary School | 407 | 21.6% |
| Middle School | 281 | 14.9% |
| High School | 420 | 22.3% |
| College / Undergraduate | 275 | 14.6% |
| Graduate / Professional | 298 | 15.8% |
| Total | 1,883 | 100.0% |
School Enrollment by Age by Funding Source in Exeter
Out of a total of 1,883 students who are enrolled in schools in Exeter, 501 (26.6%) attend a private institution, while the remaining 1,382 (73.4%) are enrolled in public schools. The age group of 3 to 4 year olds has the highest likelihood of being enrolled in private schools, with 66 (81.5% in the age bracket) enrolled. Conversely, the age group of 10 to 14 year olds has the lowest likelihood of being enrolled in a private school, with 394 (96.3% in the age bracket) attending a public institution.
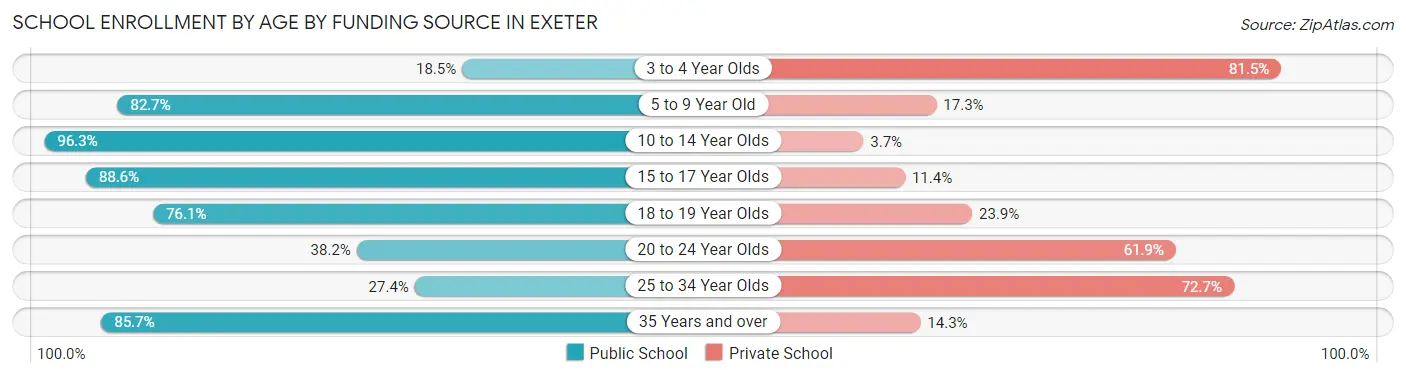
| Age Bracket | Public School | Private School |
| 3 to 4 Year Olds | 15 (18.5%) | 66 (81.5%) |
| 5 to 9 Year Old | 321 (82.7%) | 67 (17.3%) |
| 10 to 14 Year Olds | 394 (96.3%) | 15 (3.7%) |
| 15 to 17 Year Olds | 225 (88.6%) | 29 (11.4%) |
| 18 to 19 Year Olds | 229 (76.1%) | 72 (23.9%) |
| 20 to 24 Year Olds | 95 (38.2%) | 154 (61.9%) |
| 25 to 34 Year Olds | 32 (27.4%) | 85 (72.7%) |
| 35 Years and over | 72 (85.7%) | 12 (14.3%) |
| Total | 1,382 (73.4%) | 501 (26.6%) |
Educational Attainment by Field of Study in Exeter
Business (587 | 14.3%), literature & languages (513 | 12.5%), bio, nature & agricultural (473 | 11.6%), science & technology (456 | 11.1%), and visual & performing arts (250 | 6.1%) are the most common fields of study among 4,095 individuals in Exeter who have obtained a bachelor's degree or higher.
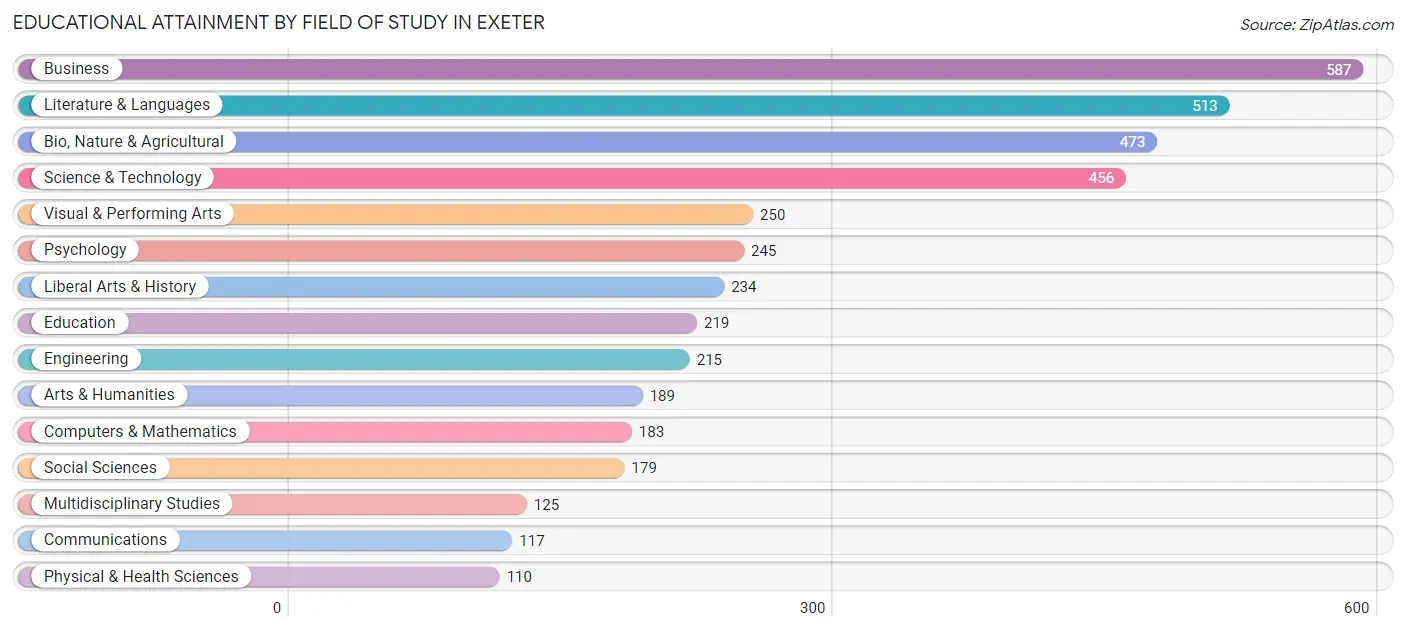
| Field of Study | # Graduates | % Graduates |
| Computers & Mathematics | 183 | 4.5% |
| Bio, Nature & Agricultural | 473 | 11.6% |
| Physical & Health Sciences | 110 | 2.7% |
| Psychology | 245 | 6.0% |
| Social Sciences | 179 | 4.4% |
| Engineering | 215 | 5.2% |
| Multidisciplinary Studies | 125 | 3.0% |
| Science & Technology | 456 | 11.1% |
| Business | 587 | 14.3% |
| Education | 219 | 5.3% |
| Literature & Languages | 513 | 12.5% |
| Liberal Arts & History | 234 | 5.7% |
| Visual & Performing Arts | 250 | 6.1% |
| Communications | 117 | 2.9% |
| Arts & Humanities | 189 | 4.6% |
| Total | 4,095 | 100.0% |
Transportation & Commute in Exeter
Vehicle Availability by Sex in Exeter
The most prevalent vehicle ownership categories in Exeter are males with 2 vehicles (1,700, accounting for 56.9%) and females with 2 vehicles (1,730, making up 54.0%).
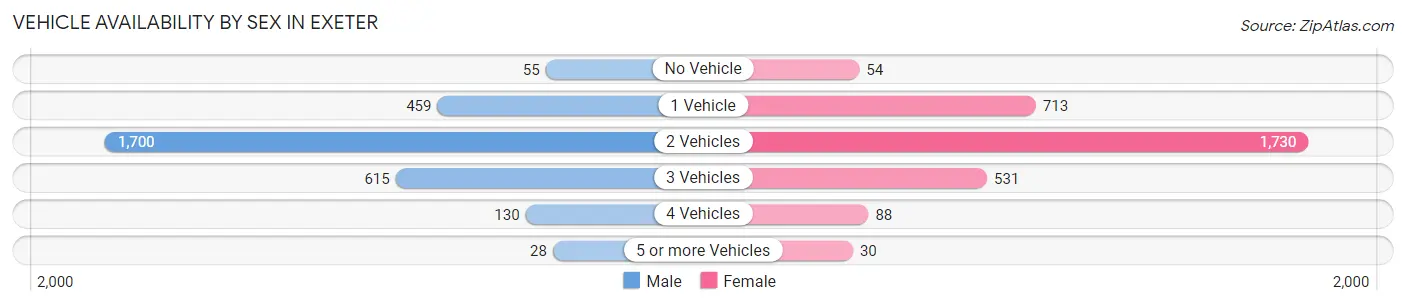
| Vehicles Available | Male | Female |
| No Vehicle | 55 (1.8%) | 54 (1.7%) |
| 1 Vehicle | 459 (15.4%) | 713 (22.7%) |
| 2 Vehicles | 1,700 (56.9%) | 1,730 (55.0%) |
| 3 Vehicles | 615 (20.6%) | 531 (16.9%) |
| 4 Vehicles | 130 (4.3%) | 88 (2.8%) |
| 5 or more Vehicles | 28 (0.9%) | 30 (0.9%) |
| Total | 2,987 (100.0%) | 3,146 (100.0%) |
Commute Time in Exeter
The most frequently occuring commute durations in Exeter are 5 to 9 minutes (1,043 commuters, 19.5%), 15 to 19 minutes (788 commuters, 14.8%), and 10 to 14 minutes (713 commuters, 13.4%).
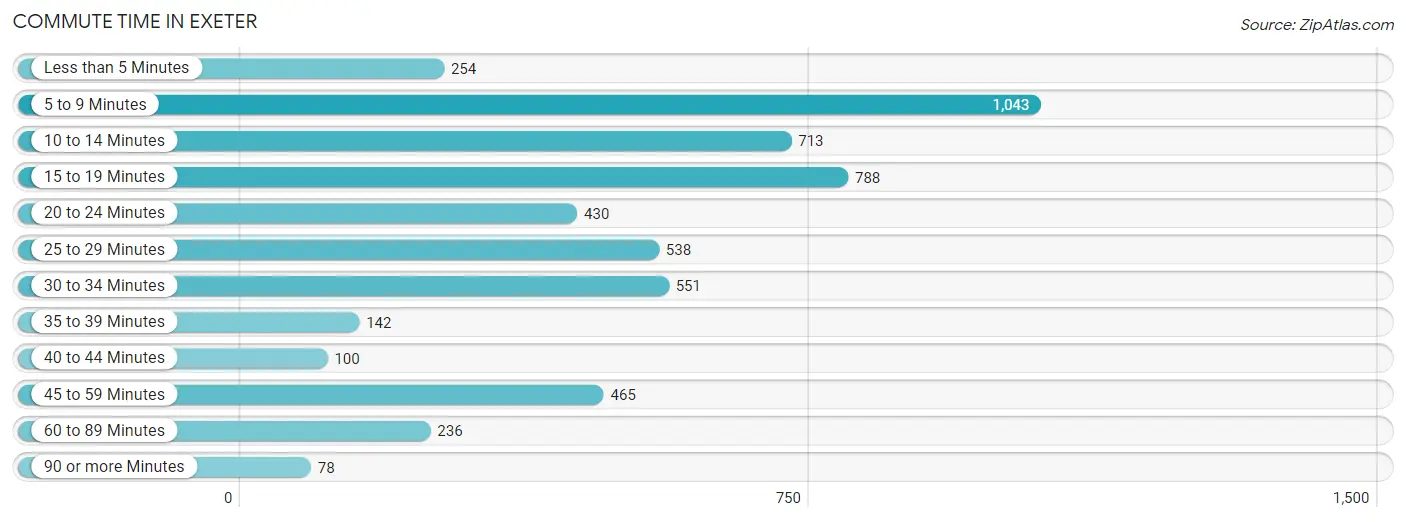
| Commute Time | # Commuters | % Commuters |
| Less than 5 Minutes | 254 | 4.8% |
| 5 to 9 Minutes | 1,043 | 19.5% |
| 10 to 14 Minutes | 713 | 13.4% |
| 15 to 19 Minutes | 788 | 14.8% |
| 20 to 24 Minutes | 430 | 8.1% |
| 25 to 29 Minutes | 538 | 10.1% |
| 30 to 34 Minutes | 551 | 10.3% |
| 35 to 39 Minutes | 142 | 2.7% |
| 40 to 44 Minutes | 100 | 1.9% |
| 45 to 59 Minutes | 465 | 8.7% |
| 60 to 89 Minutes | 236 | 4.4% |
| 90 or more Minutes | 78 | 1.5% |
Commute Time by Sex in Exeter
The most common commute times in Exeter are 15 to 19 minutes (384 commuters, 14.5%) for males and 5 to 9 minutes (708 commuters, 26.4%) for females.
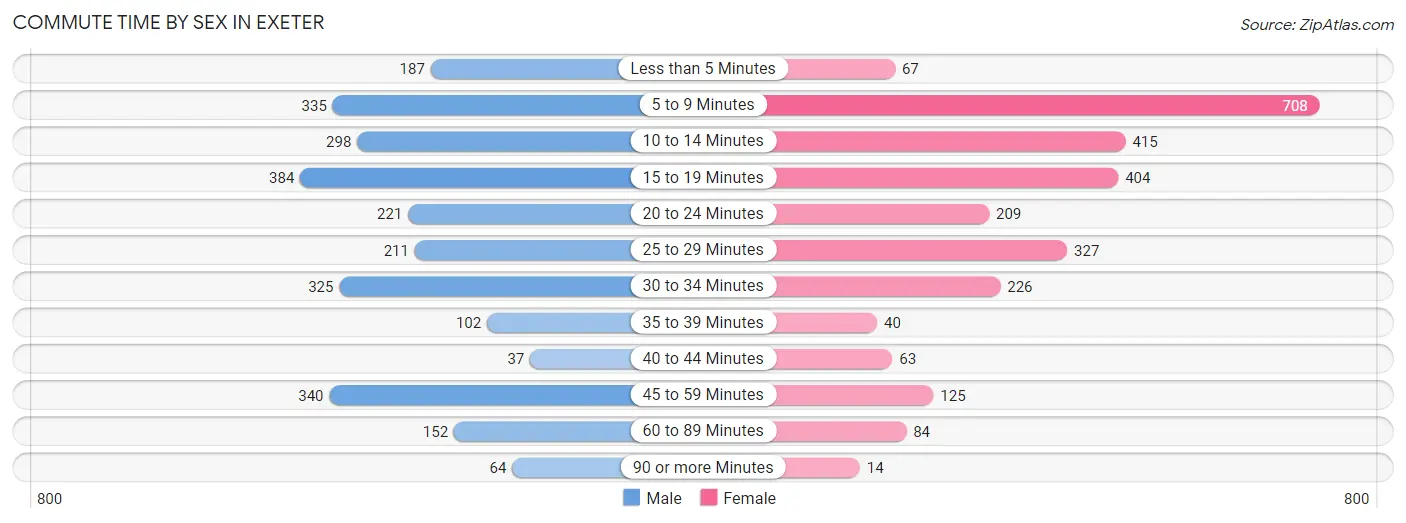
| Commute Time | Male | Female |
| Less than 5 Minutes | 187 (7.0%) | 67 (2.5%) |
| 5 to 9 Minutes | 335 (12.6%) | 708 (26.4%) |
| 10 to 14 Minutes | 298 (11.2%) | 415 (15.5%) |
| 15 to 19 Minutes | 384 (14.5%) | 404 (15.1%) |
| 20 to 24 Minutes | 221 (8.3%) | 209 (7.8%) |
| 25 to 29 Minutes | 211 (7.9%) | 327 (12.2%) |
| 30 to 34 Minutes | 325 (12.2%) | 226 (8.4%) |
| 35 to 39 Minutes | 102 (3.8%) | 40 (1.5%) |
| 40 to 44 Minutes | 37 (1.4%) | 63 (2.4%) |
| 45 to 59 Minutes | 340 (12.8%) | 125 (4.7%) |
| 60 to 89 Minutes | 152 (5.7%) | 84 (3.1%) |
| 90 or more Minutes | 64 (2.4%) | 14 (0.5%) |
Time of Departure to Work by Sex in Exeter
The most frequent times of departure to work in Exeter are 7:30 AM to 7:59 AM (380, 14.3%) for males and 12:00 PM to 3:59 PM (389, 14.5%) for females.
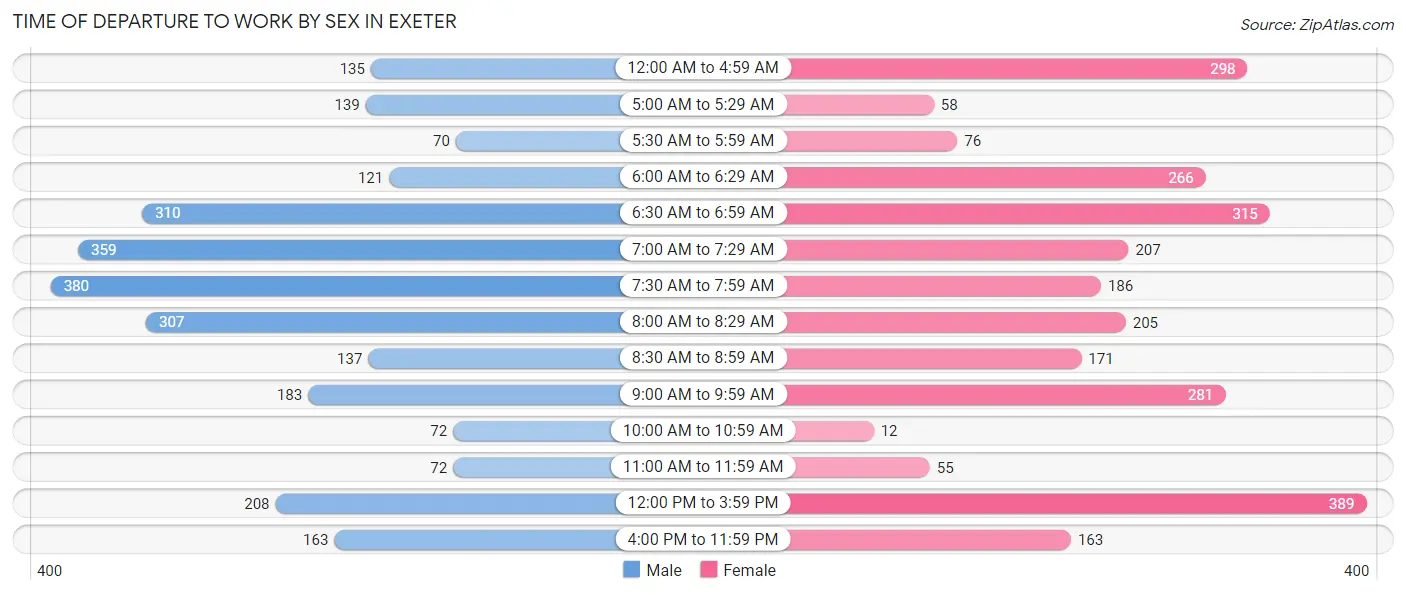
| Time of Departure | Male | Female |
| 12:00 AM to 4:59 AM | 135 (5.1%) | 298 (11.1%) |
| 5:00 AM to 5:29 AM | 139 (5.2%) | 58 (2.2%) |
| 5:30 AM to 5:59 AM | 70 (2.6%) | 76 (2.8%) |
| 6:00 AM to 6:29 AM | 121 (4.6%) | 266 (9.9%) |
| 6:30 AM to 6:59 AM | 310 (11.7%) | 315 (11.7%) |
| 7:00 AM to 7:29 AM | 359 (13.5%) | 207 (7.7%) |
| 7:30 AM to 7:59 AM | 380 (14.3%) | 186 (6.9%) |
| 8:00 AM to 8:29 AM | 307 (11.6%) | 205 (7.6%) |
| 8:30 AM to 8:59 AM | 137 (5.2%) | 171 (6.4%) |
| 9:00 AM to 9:59 AM | 183 (6.9%) | 281 (10.5%) |
| 10:00 AM to 10:59 AM | 72 (2.7%) | 12 (0.4%) |
| 11:00 AM to 11:59 AM | 72 (2.7%) | 55 (2.1%) |
| 12:00 PM to 3:59 PM | 208 (7.8%) | 389 (14.5%) |
| 4:00 PM to 11:59 PM | 163 (6.1%) | 163 (6.1%) |
| Total | 2,656 (100.0%) | 2,682 (100.0%) |
Housing Occupancy in Exeter
Occupancy by Ownership in Exeter
Of the total 4,552 dwellings in Exeter, owner-occupied units account for 2,705 (59.4%), while renter-occupied units make up 1,847 (40.6%).
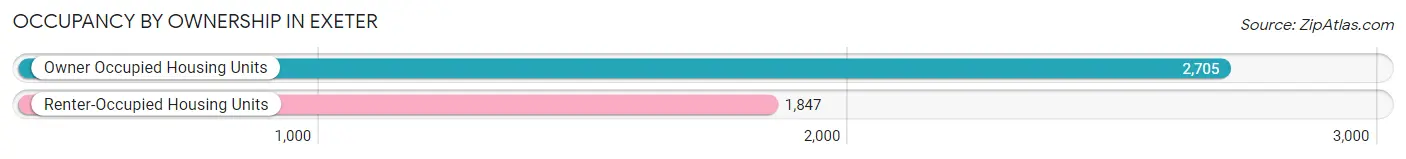
| Occupancy | # Housing Units | % Housing Units |
| Owner Occupied Housing Units | 2,705 | 59.4% |
| Renter-Occupied Housing Units | 1,847 | 40.6% |
| Total Occupied Housing Units | 4,552 | 100.0% |
Occupancy by Household Size in Exeter
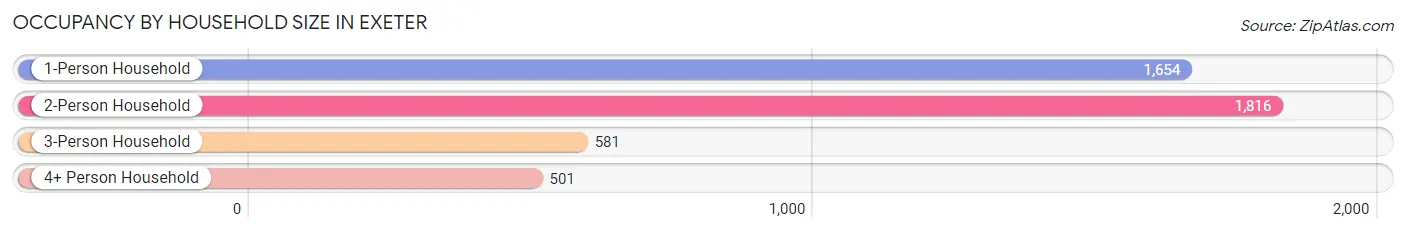
| Household Size | # Housing Units | % Housing Units |
| 1-Person Household | 1,654 | 36.3% |
| 2-Person Household | 1,816 | 39.9% |
| 3-Person Household | 581 | 12.8% |
| 4+ Person Household | 501 | 11.0% |
| Total Housing Units | 4,552 | 100.0% |
Occupancy by Ownership by Household Size in Exeter
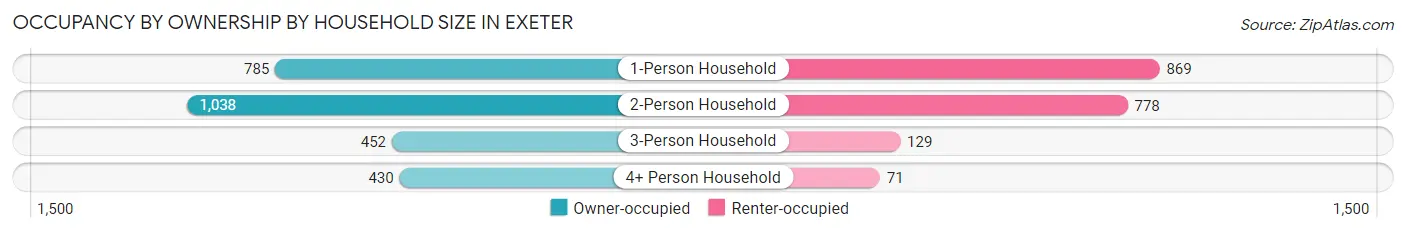
| Household Size | Owner-occupied | Renter-occupied |
| 1-Person Household | 785 (47.5%) | 869 (52.5%) |
| 2-Person Household | 1,038 (57.2%) | 778 (42.8%) |
| 3-Person Household | 452 (77.8%) | 129 (22.2%) |
| 4+ Person Household | 430 (85.8%) | 71 (14.2%) |
| Total Housing Units | 2,705 (59.4%) | 1,847 (40.6%) |
Occupancy by Educational Attainment in Exeter
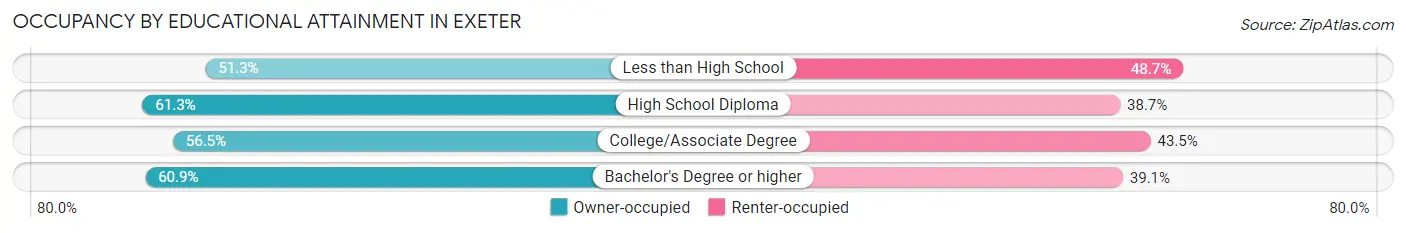
| Household Size | Owner-occupied | Renter-occupied |
| Less than High School | 77 (51.3%) | 73 (48.7%) |
| High School Diploma | 607 (61.3%) | 383 (38.7%) |
| College/Associate Degree | 719 (56.5%) | 554 (43.5%) |
| Bachelor's Degree or higher | 1,302 (60.9%) | 837 (39.1%) |
Occupancy by Age of Householder in Exeter
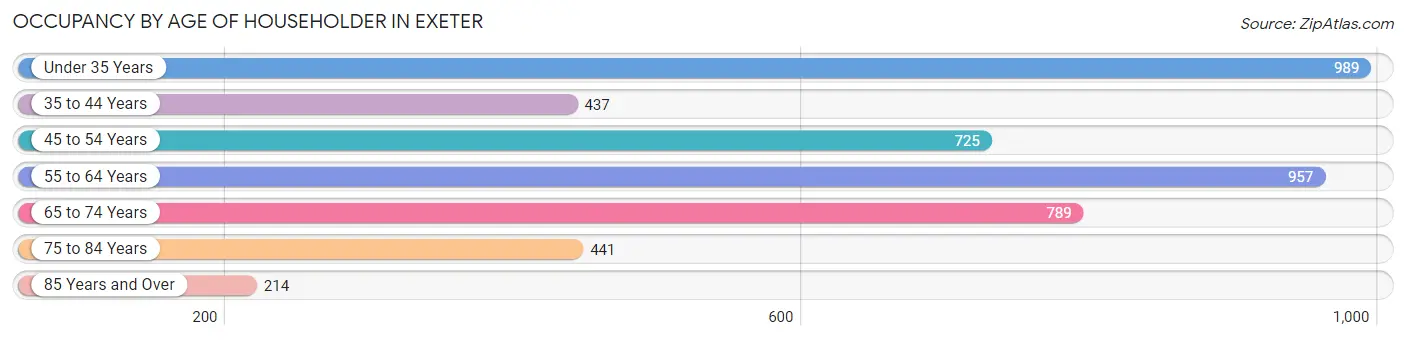
| Age Bracket | # Households | % Households |
| Under 35 Years | 989 | 21.7% |
| 35 to 44 Years | 437 | 9.6% |
| 45 to 54 Years | 725 | 15.9% |
| 55 to 64 Years | 957 | 21.0% |
| 65 to 74 Years | 789 | 17.3% |
| 75 to 84 Years | 441 | 9.7% |
| 85 Years and Over | 214 | 4.7% |
| Total | 4,552 | 100.0% |
Housing Finances in Exeter
Median Income by Occupancy in Exeter
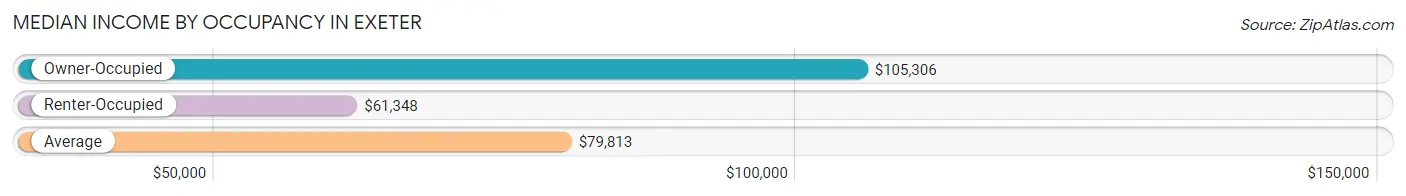
| Occupancy Type | # Households | Median Income |
| Owner-Occupied | 2,705 (59.4%) | $105,306 |
| Renter-Occupied | 1,847 (40.6%) | $61,348 |
| Average | 4,552 (100.0%) | $79,813 |
Occupancy by Householder Income Bracket in Exeter
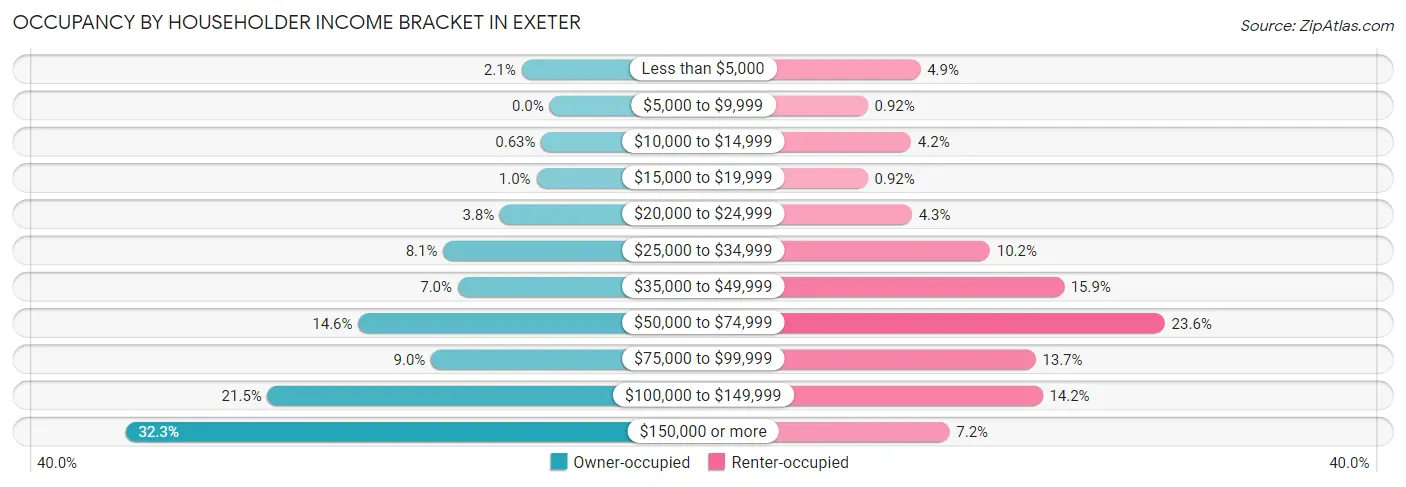
| Income Bracket | Owner-occupied | Renter-occupied |
| Less than $5,000 | 58 (2.1%) | 91 (4.9%) |
| $5,000 to $9,999 | 0 (0.0%) | 17 (0.9%) |
| $10,000 to $14,999 | 17 (0.6%) | 78 (4.2%) |
| $15,000 to $19,999 | 27 (1.0%) | 17 (0.9%) |
| $20,000 to $24,999 | 102 (3.8%) | 79 (4.3%) |
| $25,000 to $34,999 | 219 (8.1%) | 189 (10.2%) |
| $35,000 to $49,999 | 189 (7.0%) | 293 (15.9%) |
| $50,000 to $74,999 | 394 (14.6%) | 435 (23.5%) |
| $75,000 to $99,999 | 244 (9.0%) | 253 (13.7%) |
| $100,000 to $149,999 | 581 (21.5%) | 263 (14.2%) |
| $150,000 or more | 874 (32.3%) | 132 (7.1%) |
| Total | 2,705 (100.0%) | 1,847 (100.0%) |
Monthly Housing Cost Tiers in Exeter
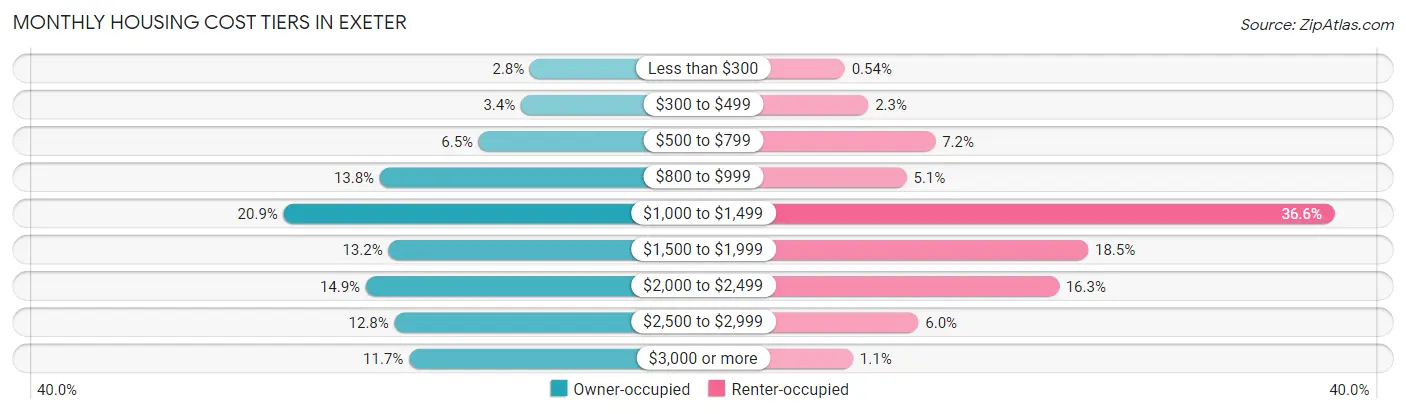
| Monthly Cost | Owner-occupied | Renter-occupied |
| Less than $300 | 75 (2.8%) | 10 (0.5%) |
| $300 to $499 | 93 (3.4%) | 42 (2.3%) |
| $500 to $799 | 177 (6.5%) | 133 (7.2%) |
| $800 to $999 | 374 (13.8%) | 94 (5.1%) |
| $1,000 to $1,499 | 566 (20.9%) | 675 (36.5%) |
| $1,500 to $1,999 | 357 (13.2%) | 341 (18.5%) |
| $2,000 to $2,499 | 402 (14.9%) | 301 (16.3%) |
| $2,500 to $2,999 | 345 (12.8%) | 110 (6.0%) |
| $3,000 or more | 316 (11.7%) | 21 (1.1%) |
| Total | 2,705 (100.0%) | 1,847 (100.0%) |
Physical Housing Characteristics in Exeter
Housing Structures in Exeter
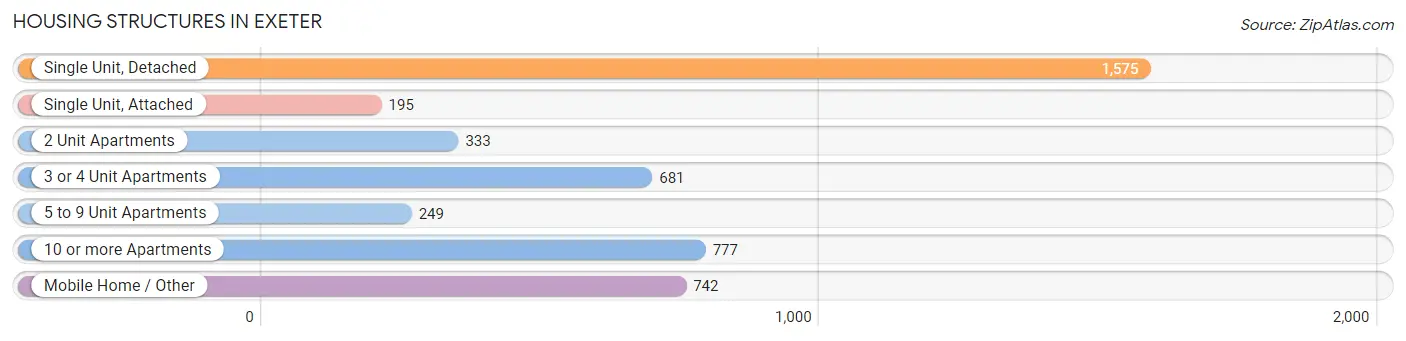
| Structure Type | # Housing Units | % Housing Units |
| Single Unit, Detached | 1,575 | 34.6% |
| Single Unit, Attached | 195 | 4.3% |
| 2 Unit Apartments | 333 | 7.3% |
| 3 or 4 Unit Apartments | 681 | 15.0% |
| 5 to 9 Unit Apartments | 249 | 5.5% |
| 10 or more Apartments | 777 | 17.1% |
| Mobile Home / Other | 742 | 16.3% |
| Total | 4,552 | 100.0% |
Housing Structures by Occupancy in Exeter
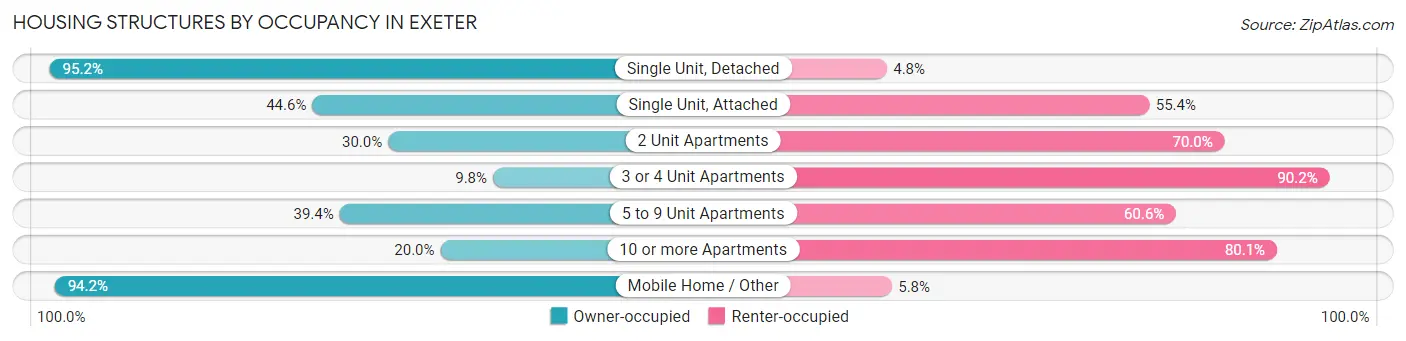
| Structure Type | Owner-occupied | Renter-occupied |
| Single Unit, Detached | 1,499 (95.2%) | 76 (4.8%) |
| Single Unit, Attached | 87 (44.6%) | 108 (55.4%) |
| 2 Unit Apartments | 100 (30.0%) | 233 (70.0%) |
| 3 or 4 Unit Apartments | 67 (9.8%) | 614 (90.2%) |
| 5 to 9 Unit Apartments | 98 (39.4%) | 151 (60.6%) |
| 10 or more Apartments | 155 (20.0%) | 622 (80.0%) |
| Mobile Home / Other | 699 (94.2%) | 43 (5.8%) |
| Total | 2,705 (59.4%) | 1,847 (40.6%) |
Housing Structures by Number of Rooms in Exeter
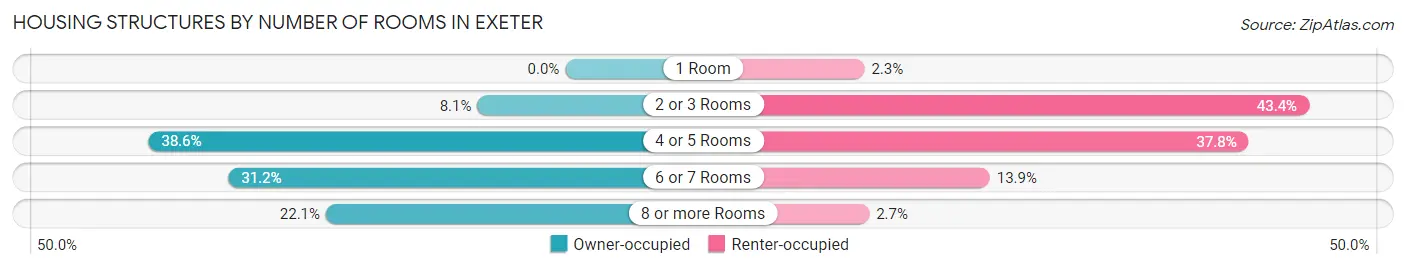
| Number of Rooms | Owner-occupied | Renter-occupied |
| 1 Room | 0 (0.0%) | 42 (2.3%) |
| 2 or 3 Rooms | 220 (8.1%) | 801 (43.4%) |
| 4 or 5 Rooms | 1,043 (38.6%) | 698 (37.8%) |
| 6 or 7 Rooms | 843 (31.2%) | 256 (13.9%) |
| 8 or more Rooms | 599 (22.1%) | 50 (2.7%) |
| Total | 2,705 (100.0%) | 1,847 (100.0%) |
Housing Structure by Heating Type in Exeter
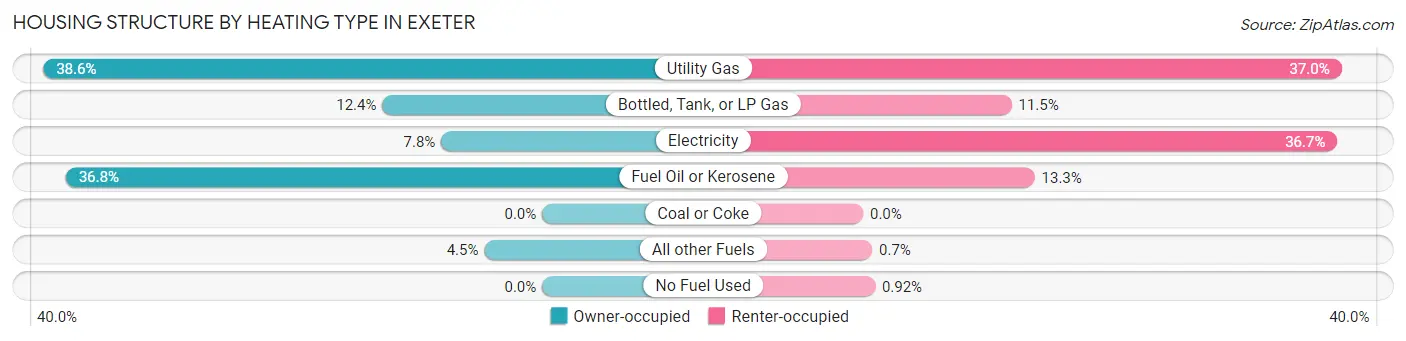
| Heating Type | Owner-occupied | Renter-occupied |
| Utility Gas | 1,043 (38.6%) | 683 (37.0%) |
| Bottled, Tank, or LP Gas | 334 (12.3%) | 212 (11.5%) |
| Electricity | 211 (7.8%) | 677 (36.6%) |
| Fuel Oil or Kerosene | 996 (36.8%) | 245 (13.3%) |
| Coal or Coke | 0 (0.0%) | 0 (0.0%) |
| All other Fuels | 121 (4.5%) | 13 (0.7%) |
| No Fuel Used | 0 (0.0%) | 17 (0.9%) |
| Total | 2,705 (100.0%) | 1,847 (100.0%) |
Household Vehicle Usage in Exeter
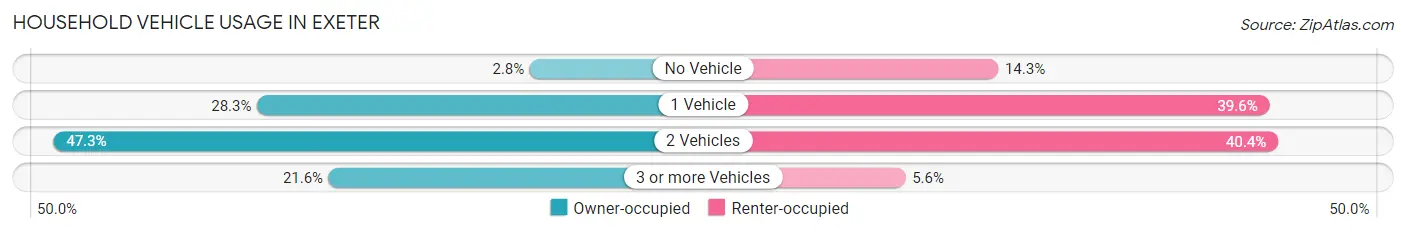
| Vehicles per Household | Owner-occupied | Renter-occupied |
| No Vehicle | 76 (2.8%) | 264 (14.3%) |
| 1 Vehicle | 765 (28.3%) | 732 (39.6%) |
| 2 Vehicles | 1,280 (47.3%) | 747 (40.4%) |
| 3 or more Vehicles | 584 (21.6%) | 104 (5.6%) |
| Total | 2,705 (100.0%) | 1,847 (100.0%) |
Real Estate & Mortgages in Exeter
Real Estate and Mortgage Overview in Exeter
| Characteristic | Without Mortgage | With Mortgage |
| Housing Units | 1,283 | 1,422 |
| Median Property Value | $171,100 | $399,000 |
| Median Household Income | $68,831 | $691 |
| Monthly Housing Costs | $1,013 | $316 |
| Real Estate Taxes | $4,978 | $33 |
Property Value by Mortgage Status in Exeter
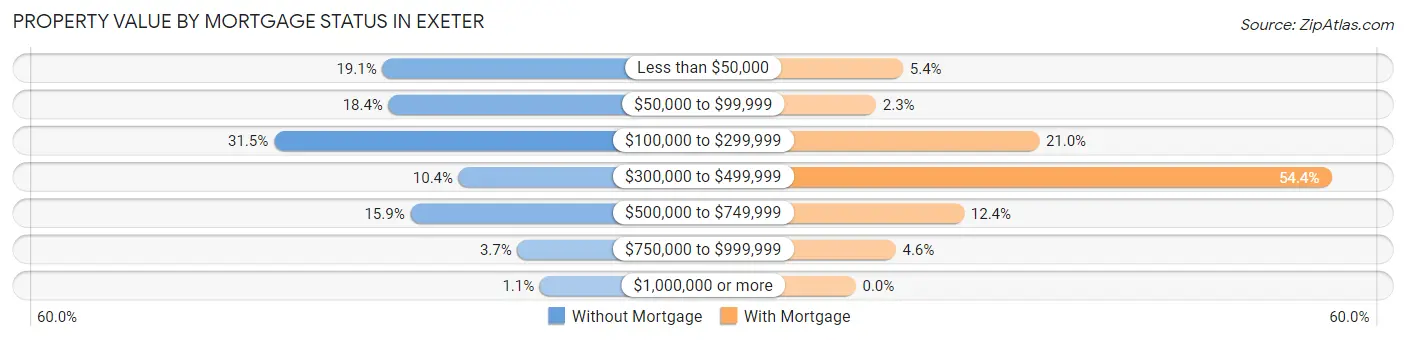
| Property Value | Without Mortgage | With Mortgage |
| Less than $50,000 | 245 (19.1%) | 77 (5.4%) |
| $50,000 to $99,999 | 236 (18.4%) | 33 (2.3%) |
| $100,000 to $299,999 | 404 (31.5%) | 298 (21.0%) |
| $300,000 to $499,999 | 133 (10.4%) | 773 (54.4%) |
| $500,000 to $749,999 | 204 (15.9%) | 176 (12.4%) |
| $750,000 to $999,999 | 47 (3.7%) | 65 (4.6%) |
| $1,000,000 or more | 14 (1.1%) | 0 (0.0%) |
| Total | 1,283 (100.0%) | 1,422 (100.0%) |
Household Income by Mortgage Status in Exeter
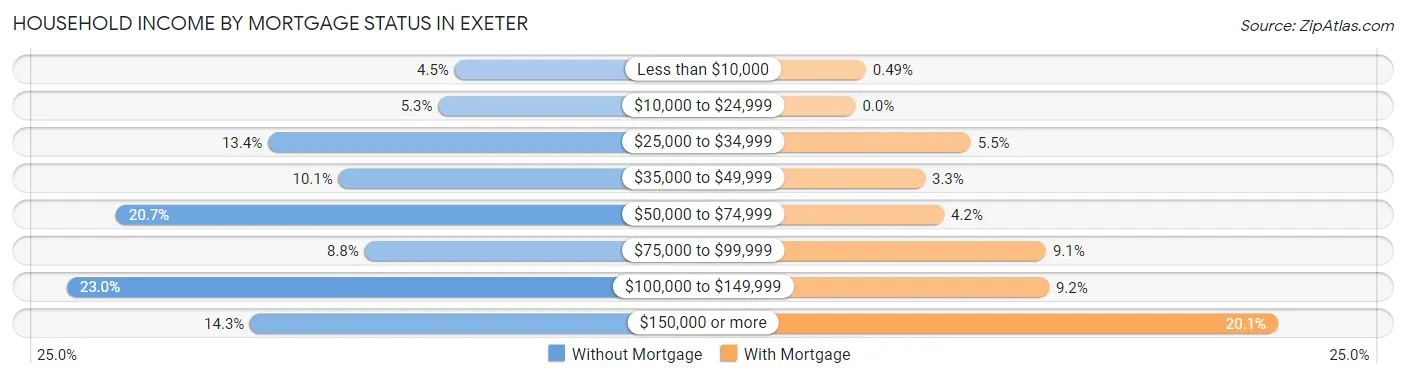
| Household Income | Without Mortgage | With Mortgage |
| Less than $10,000 | 58 (4.5%) | 7 (0.5%) |
| $10,000 to $24,999 | 68 (5.3%) | 0 (0.0%) |
| $25,000 to $34,999 | 172 (13.4%) | 78 (5.5%) |
| $35,000 to $49,999 | 129 (10.1%) | 47 (3.3%) |
| $50,000 to $74,999 | 265 (20.6%) | 60 (4.2%) |
| $75,000 to $99,999 | 113 (8.8%) | 129 (9.1%) |
| $100,000 to $149,999 | 295 (23.0%) | 131 (9.2%) |
| $150,000 or more | 183 (14.3%) | 286 (20.1%) |
| Total | 1,283 (100.0%) | 1,422 (100.0%) |
Property Value to Household Income Ratio in Exeter
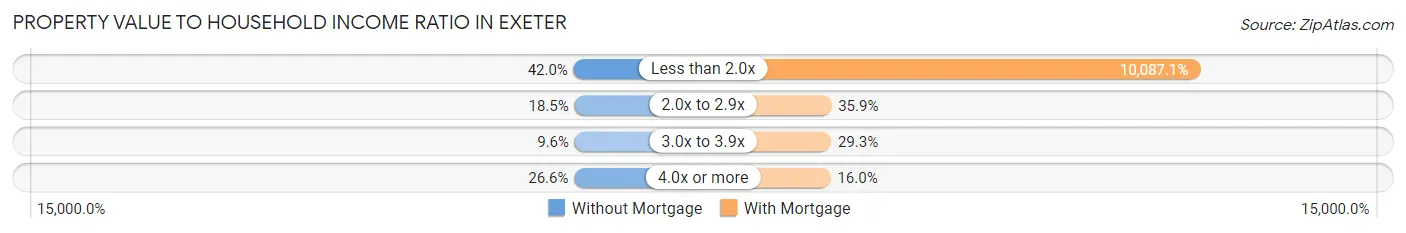
| Value-to-Income Ratio | Without Mortgage | With Mortgage |
| Less than 2.0x | 539 (42.0%) | 143,438 (10,087.1%) |
| 2.0x to 2.9x | 237 (18.5%) | 510 (35.9%) |
| 3.0x to 3.9x | 123 (9.6%) | 417 (29.3%) |
| 4.0x or more | 341 (26.6%) | 227 (16.0%) |
| Total | 1,283 (100.0%) | 1,422 (100.0%) |
Real Estate Taxes by Mortgage Status in Exeter
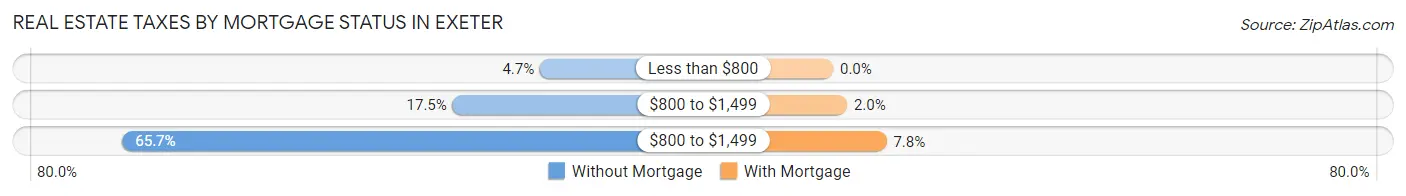
| Property Taxes | Without Mortgage | With Mortgage |
| Less than $800 | 60 (4.7%) | 0 (0.0%) |
| $800 to $1,499 | 224 (17.5%) | 29 (2.0%) |
| $800 to $1,499 | 843 (65.7%) | 111 (7.8%) |
| Total | 1,283 (100.0%) | 1,422 (100.0%) |
Health & Disability in Exeter
Health Insurance Coverage by Age in Exeter
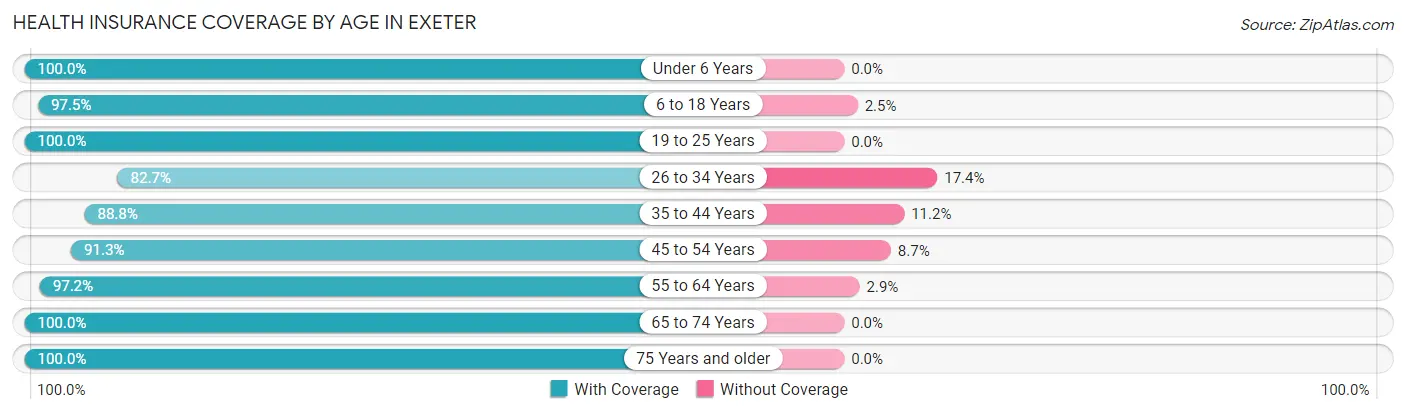
| Age Bracket | With Coverage | Without Coverage |
| Under 6 Years | 342 (100.0%) | 0 (0.0%) |
| 6 to 18 Years | 1,208 (97.5%) | 31 (2.5%) |
| 19 to 25 Years | 954 (100.0%) | 0 (0.0%) |
| 26 to 34 Years | 1,015 (82.7%) | 213 (17.3%) |
| 35 to 44 Years | 969 (88.8%) | 122 (11.2%) |
| 45 to 54 Years | 1,377 (91.3%) | 131 (8.7%) |
| 55 to 64 Years | 1,467 (97.2%) | 43 (2.9%) |
| 65 to 74 Years | 1,103 (100.0%) | 0 (0.0%) |
| 75 Years and older | 943 (100.0%) | 0 (0.0%) |
| Total | 9,378 (94.6%) | 540 (5.4%) |
Health Insurance Coverage by Citizenship Status in Exeter
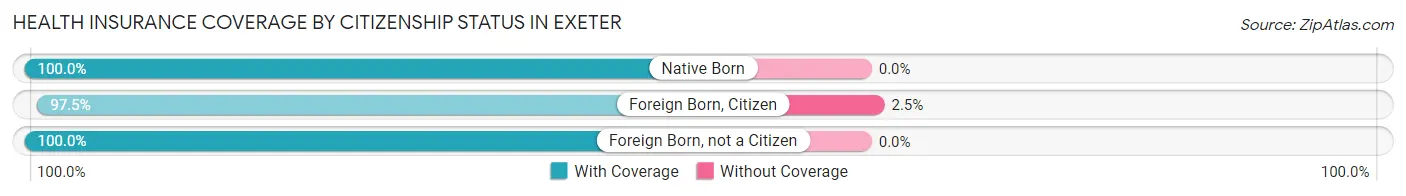
| Citizenship Status | With Coverage | Without Coverage |
| Native Born | 342 (100.0%) | 0 (0.0%) |
| Foreign Born, Citizen | 1,208 (97.5%) | 31 (2.5%) |
| Foreign Born, not a Citizen | 954 (100.0%) | 0 (0.0%) |
Health Insurance Coverage by Household Income in Exeter
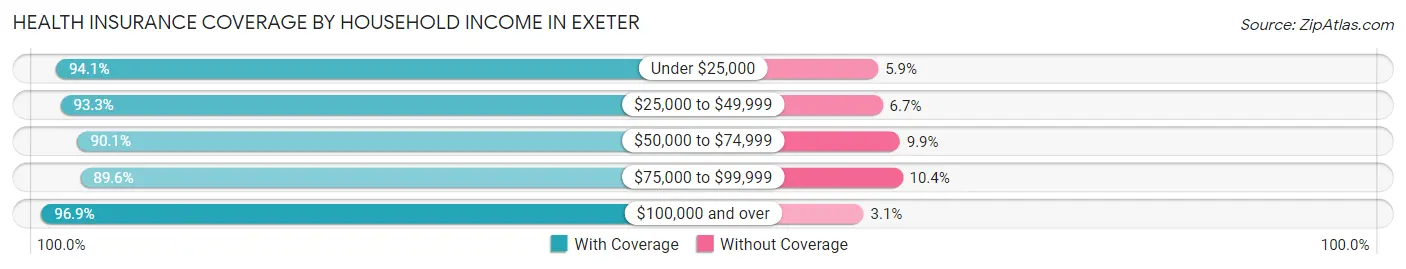
| Household Income | With Coverage | Without Coverage |
| Under $25,000 | 543 (94.1%) | 34 (5.9%) |
| $25,000 to $49,999 | 1,097 (93.3%) | 79 (6.7%) |
| $50,000 to $74,999 | 1,315 (90.1%) | 145 (9.9%) |
| $75,000 to $99,999 | 978 (89.6%) | 114 (10.4%) |
| $100,000 and over | 5,189 (96.9%) | 168 (3.1%) |
Public vs Private Health Insurance Coverage by Age in Exeter
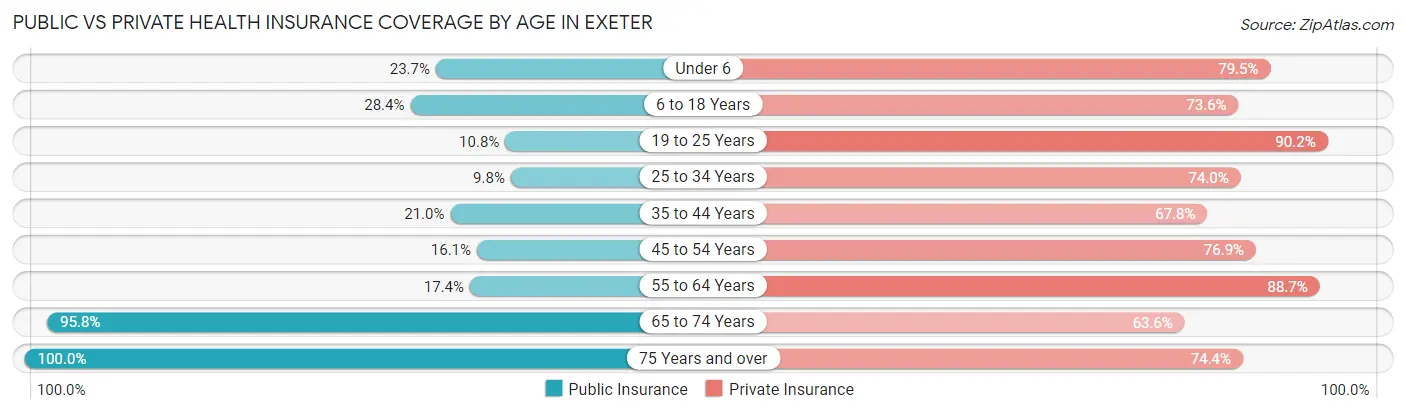
| Age Bracket | Public Insurance | Private Insurance |
| Under 6 | 81 (23.7%) | 272 (79.5%) |
| 6 to 18 Years | 352 (28.4%) | 912 (73.6%) |
| 19 to 25 Years | 103 (10.8%) | 860 (90.1%) |
| 25 to 34 Years | 120 (9.8%) | 909 (74.0%) |
| 35 to 44 Years | 229 (21.0%) | 740 (67.8%) |
| 45 to 54 Years | 242 (16.1%) | 1,159 (76.9%) |
| 55 to 64 Years | 262 (17.3%) | 1,339 (88.7%) |
| 65 to 74 Years | 1,057 (95.8%) | 702 (63.6%) |
| 75 Years and over | 943 (100.0%) | 702 (74.4%) |
| Total | 3,389 (34.2%) | 7,595 (76.6%) |
Disability Status by Sex by Age in Exeter
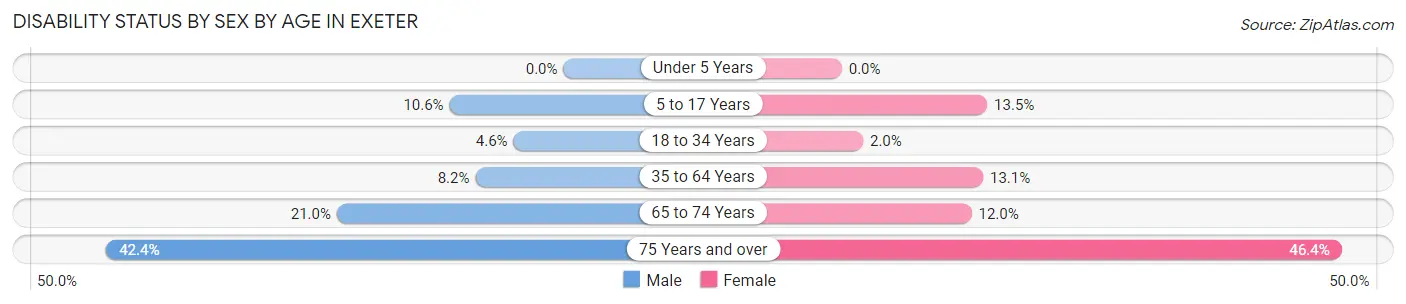
| Age Bracket | Male | Female |
| Under 5 Years | 0 (0.0%) | 0 (0.0%) |
| 5 to 17 Years | 56 (10.6%) | 78 (13.5%) |
| 18 to 34 Years | 52 (4.6%) | 25 (2.0%) |
| 35 to 64 Years | 150 (8.2%) | 298 (13.1%) |
| 65 to 74 Years | 94 (21.0%) | 79 (12.0%) |
| 75 Years and over | 154 (42.4%) | 269 (46.4%) |
Disability Class by Sex by Age in Exeter
Disability Class: Hearing Difficulty
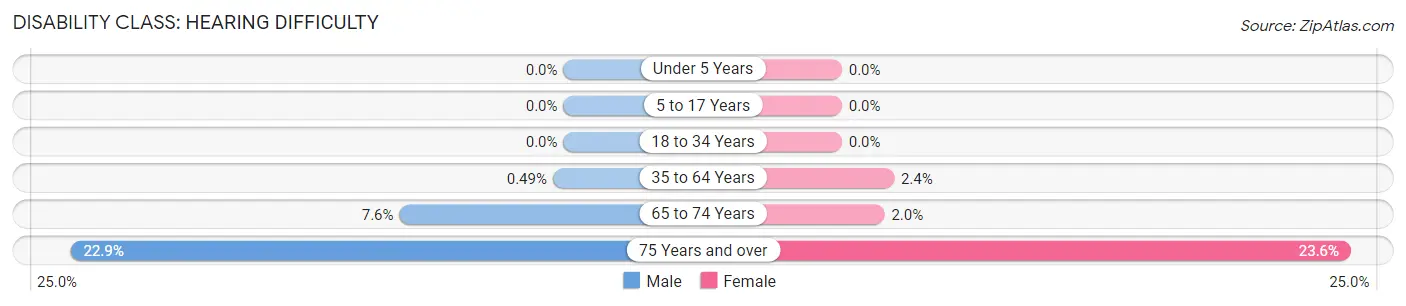
| Age Bracket | Male | Female |
| Under 5 Years | 0 (0.0%) | 0 (0.0%) |
| 5 to 17 Years | 0 (0.0%) | 0 (0.0%) |
| 18 to 34 Years | 0 (0.0%) | 0 (0.0%) |
| 35 to 64 Years | 9 (0.5%) | 55 (2.4%) |
| 65 to 74 Years | 34 (7.6%) | 13 (2.0%) |
| 75 Years and over | 83 (22.9%) | 137 (23.6%) |
Disability Class: Vision Difficulty
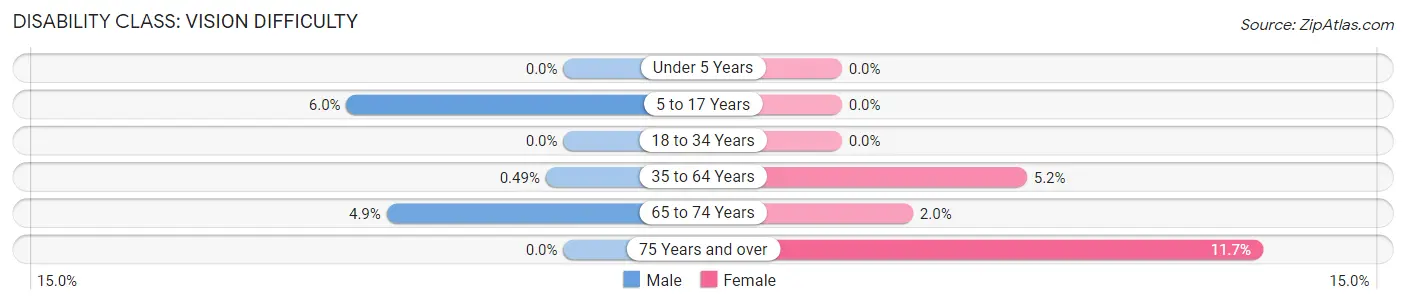
| Age Bracket | Male | Female |
| Under 5 Years | 0 (0.0%) | 0 (0.0%) |
| 5 to 17 Years | 32 (6.0%) | 0 (0.0%) |
| 18 to 34 Years | 0 (0.0%) | 0 (0.0%) |
| 35 to 64 Years | 9 (0.5%) | 117 (5.1%) |
| 65 to 74 Years | 22 (4.9%) | 13 (2.0%) |
| 75 Years and over | 0 (0.0%) | 68 (11.7%) |
Disability Class: Cognitive Difficulty
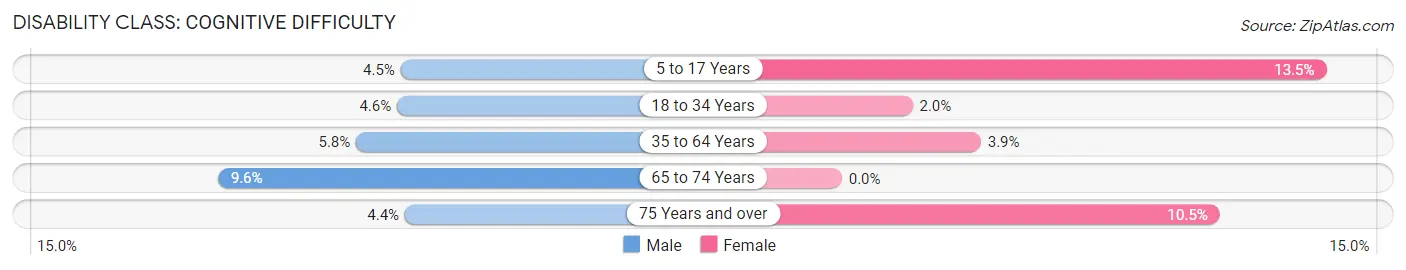
| Age Bracket | Male | Female |
| 5 to 17 Years | 24 (4.5%) | 78 (13.5%) |
| 18 to 34 Years | 52 (4.6%) | 25 (2.0%) |
| 35 to 64 Years | 106 (5.8%) | 88 (3.9%) |
| 65 to 74 Years | 43 (9.6%) | 0 (0.0%) |
| 75 Years and over | 16 (4.4%) | 61 (10.5%) |
Disability Class: Ambulatory Difficulty
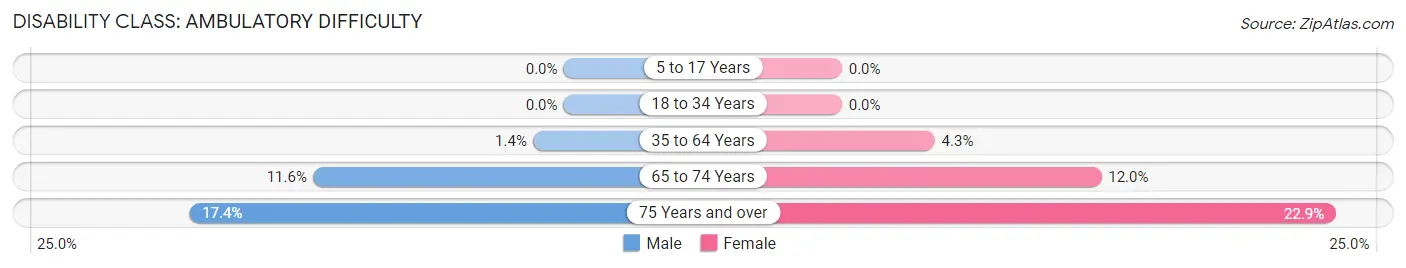
| Age Bracket | Male | Female |
| 5 to 17 Years | 0 (0.0%) | 0 (0.0%) |
| 18 to 34 Years | 0 (0.0%) | 0 (0.0%) |
| 35 to 64 Years | 26 (1.4%) | 98 (4.3%) |
| 65 to 74 Years | 52 (11.6%) | 79 (12.0%) |
| 75 Years and over | 63 (17.4%) | 133 (22.9%) |
Disability Class: Self-Care Difficulty
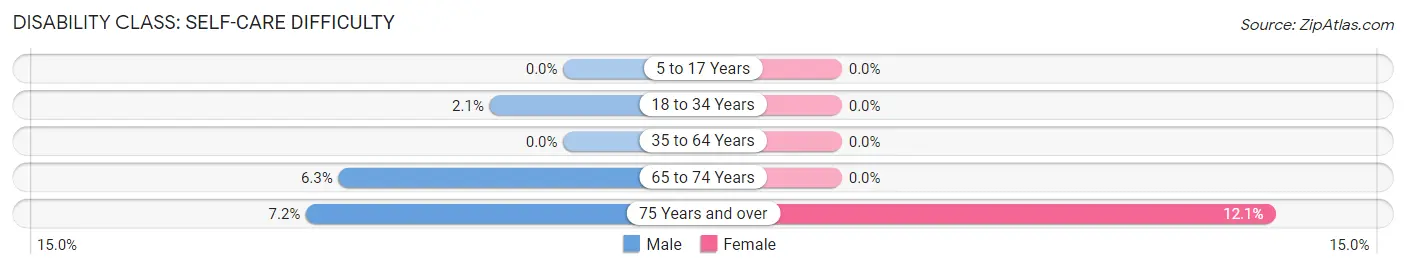
| Age Bracket | Male | Female |
| 5 to 17 Years | 0 (0.0%) | 0 (0.0%) |
| 18 to 34 Years | 23 (2.1%) | 0 (0.0%) |
| 35 to 64 Years | 0 (0.0%) | 0 (0.0%) |
| 65 to 74 Years | 28 (6.3%) | 0 (0.0%) |
| 75 Years and over | 26 (7.2%) | 70 (12.1%) |
Technology Access in Exeter
Computing Device Access in Exeter
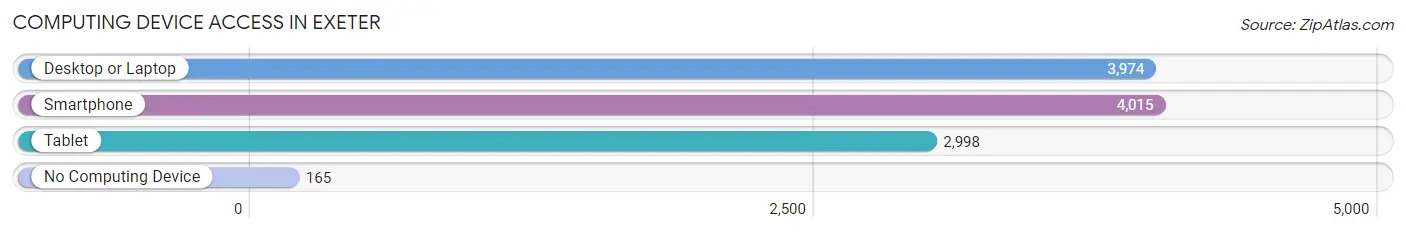
| Device Type | # Households | % Households |
| Desktop or Laptop | 3,974 | 87.3% |
| Smartphone | 4,015 | 88.2% |
| Tablet | 2,998 | 65.9% |
| No Computing Device | 165 | 3.6% |
| Total | 4,552 | 100.0% |
Internet Access in Exeter
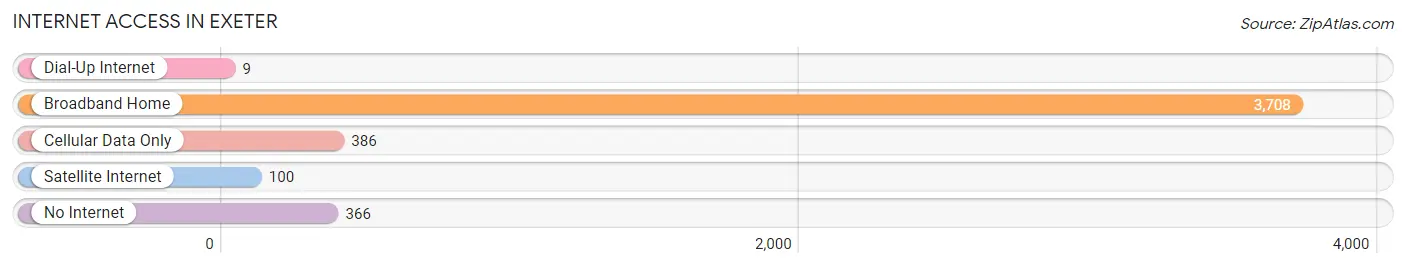
| Internet Type | # Households | % Households |
| Dial-Up Internet | 9 | 0.2% |
| Broadband Home | 3,708 | 81.5% |
| Cellular Data Only | 386 | 8.5% |
| Satellite Internet | 100 | 2.2% |
| No Internet | 366 | 8.0% |
| Total | 4,552 | 100.0% |
Exeter Summary
Exeter, New Hampshire is a small town located in the southeastern corner of the state. It is situated in the Seacoast region of New Hampshire, and is part of the greater Portsmouth metropolitan area. Exeter is a picturesque town with a rich history, a vibrant economy, and a diverse population.
History
Exeter was first settled in 1638 by a group of English colonists led by Reverend John Wheelwright. The town was named after the city of Exeter in England, and was one of the first four towns established in the state of New Hampshire. Exeter quickly became an important center of commerce and industry, and was the site of the first woolen mill in the United States. The town was also home to the first public library in the state, and the first post office in the country.
Exeter was an important center of the Revolutionary War, and was the site of the first battle of the war in 1775. The town was also the birthplace of the American Navy, and the first naval battle of the war was fought off the coast of Exeter.
Geography
Exeter is located in the southeastern corner of New Hampshire, in the Seacoast region of the state. The town is situated on the banks of the Squamscott River, and is bordered by the towns of Stratham, Newfields, and Brentwood. Exeter is approximately 25 miles from the Atlantic Ocean, and is located near the cities of Portsmouth and Dover.
The town of Exeter covers an area of approximately 11.5 square miles, and is home to a population of approximately 14,000 people. The town is mostly rural, with a mix of residential and commercial areas. The town is also home to several parks and recreational areas, including the Exeter River Wildlife Refuge and the Exeter Town Forest.
Economy
Exeter has a vibrant economy, with a mix of small businesses, retail stores, and manufacturing companies. The town is home to several large employers, including the Exeter Hospital, the Phillips Exeter Academy, and the Exeter Manufacturing Company. The town is also home to several small businesses, including restaurants, cafes, and specialty shops.
Exeter is also home to several educational institutions, including the Phillips Exeter Academy, the University of New Hampshire, and the Great Bay Community College. The town is also home to several cultural attractions, including the Exeter Historical Society, the Exeter Town Hall, and the Exeter Arts Center.
Demographics
As of the 2010 census, Exeter had a population of 14,306 people. The racial makeup of the town was 94.3% White, 1.7% African American, 0.4% Native American, 1.7% Asian, 0.1% Pacific Islander, 0.7% from other races, and 1.2% from two or more races. Hispanic or Latino of any race were 2.2% of the population.
The median household income in Exeter was $63,945, and the median family income was $77,917. The per capita income for the town was $31,945. About 4.3% of families and 6.2% of the population were below the poverty line, including 8.2% of those under age 18 and 4.2% of those age 65 or over.
Exeter is a diverse town, with a mix of cultures and backgrounds. The town is home to a variety of religious denominations, including Catholic, Protestant, Jewish, and Muslim. The town is also home to a variety of ethnicities, including Irish, Italian, French, and German.
Common Questions
What is Per Capita Income in Exeter?
Per Capita income in Exeter is $55,413.
What is the Median Family Income in Exeter?
Median Family Income in Exeter is $118,793.
What is the Median Household income in Exeter?
Median Household Income in Exeter is $79,813.
What is Income or Wage Gap in Exeter?
Income or Wage Gap in Exeter is 26.5%.
Women in Exeter earn 73.5 cents for every dollar earned by a man.
What is Inequality or Gini Index in Exeter?
Inequality or Gini Index in Exeter is 0.44.
What is the Total Population of Exeter?
Total Population of Exeter is 9,918.
What is the Total Male Population of Exeter?
Total Male Population of Exeter is 4,450.
What is the Total Female Population of Exeter?
Total Female Population of Exeter is 5,468.
What is the Ratio of Males per 100 Females in Exeter?
There are 81.38 Males per 100 Females in Exeter.
What is the Ratio of Females per 100 Males in Exeter?
There are 122.88 Females per 100 Males in Exeter.
What is the Median Population Age in Exeter?
Median Population Age in Exeter is 45.9 Years.
What is the Average Family Size in Exeter
Average Family Size in Exeter is 2.9 People.
What is the Average Household Size in Exeter
Average Household Size in Exeter is 2.1 People.
How Large is the Labor Force in Exeter?
There are 6,516 People in the Labor Forcein in Exeter.
What is the Percentage of People in the Labor Force in Exeter?
74.3% of People are in the Labor Force in Exeter.
What is the Unemployment Rate in Exeter?
Unemployment Rate in Exeter is 2.7%.