Rancho Mirage, CA Map & Demographics
Rancho Mirage Map
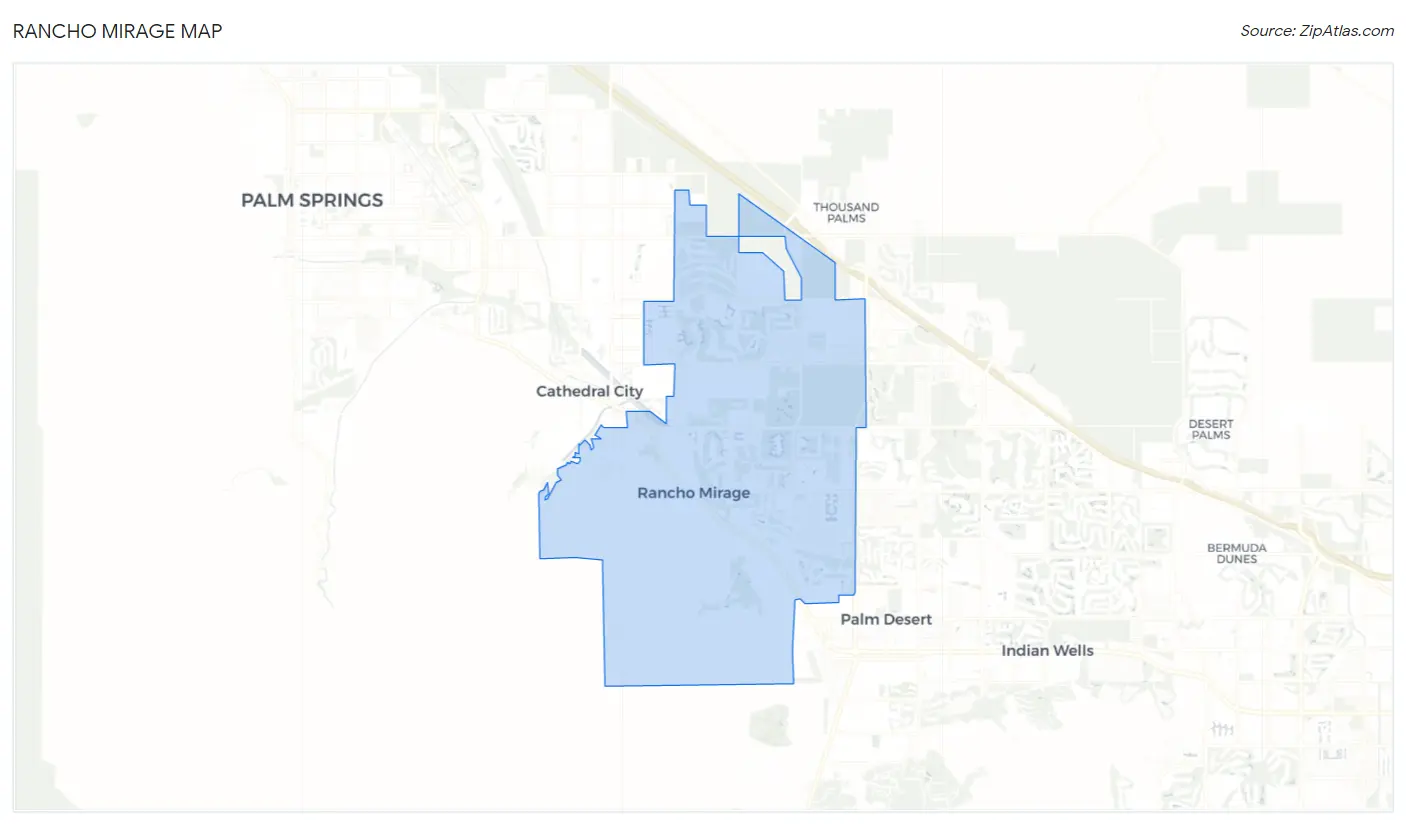
Rancho Mirage Overview
$86,546
PER CAPITA INCOME
$131,452
AVG FAMILY INCOME
$105,557
AVG HOUSEHOLD INCOME
39.2%
WAGE / INCOME GAP [ % ]
60.8¢/ $1
WAGE / INCOME GAP [ $ ]
$11,977
FAMILY INCOME DEFICIT
0.54
INEQUALITY / GINI INDEX
17,257
TOTAL POPULATION
9,057
MALE POPULATION
8,200
FEMALE POPULATION
110.45
MALES / 100 FEMALES
90.54
FEMALES / 100 MALES
64.9
MEDIAN AGE
2.4
AVG FAMILY SIZE
1.9
AVG HOUSEHOLD SIZE
6,522
LABOR FORCE [ PEOPLE ]
40.7%
PERCENT IN LABOR FORCE
10.5%
UNEMPLOYMENT RATE
Rancho Mirage Zip Codes
Rancho Mirage Area Codes
Income in Rancho Mirage
Income Overview in Rancho Mirage
Per Capita Income in Rancho Mirage is $86,546, while median incomes of families and households are $131,452 and $105,557 respectively.
| Characteristic | Number | Measure |
| Per Capita Income | 17,257 | $86,546 |
| Median Family Income | 4,934 | $131,452 |
| Mean Family Income | 4,934 | $203,281 |
| Median Household Income | 8,735 | $105,557 |
| Mean Household Income | 8,735 | $169,309 |
| Income Deficit | 4,934 | $11,977 |
| Wage / Income Gap (%) | 17,257 | 39.17% |
| Wage / Income Gap ($) | 17,257 | 60.83¢ per $1 |
| Gini / Inequality Index | 17,257 | 0.54 |
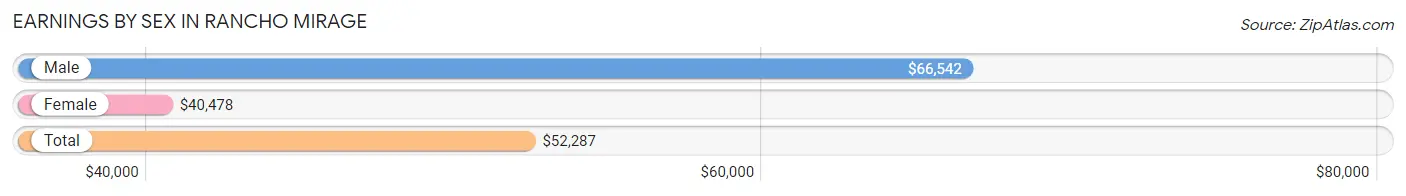
Earnings by Sex in Rancho Mirage
Average Earnings in Rancho Mirage are $52,287, $66,542 for men and $40,478 for women, a difference of 39.2%.
| Sex | Number | Average Earnings |
| Male | 3,987 (57.3%) | $66,542 |
| Female | 2,969 (42.7%) | $40,478 |
| Total | 6,956 (100.0%) | $52,287 |
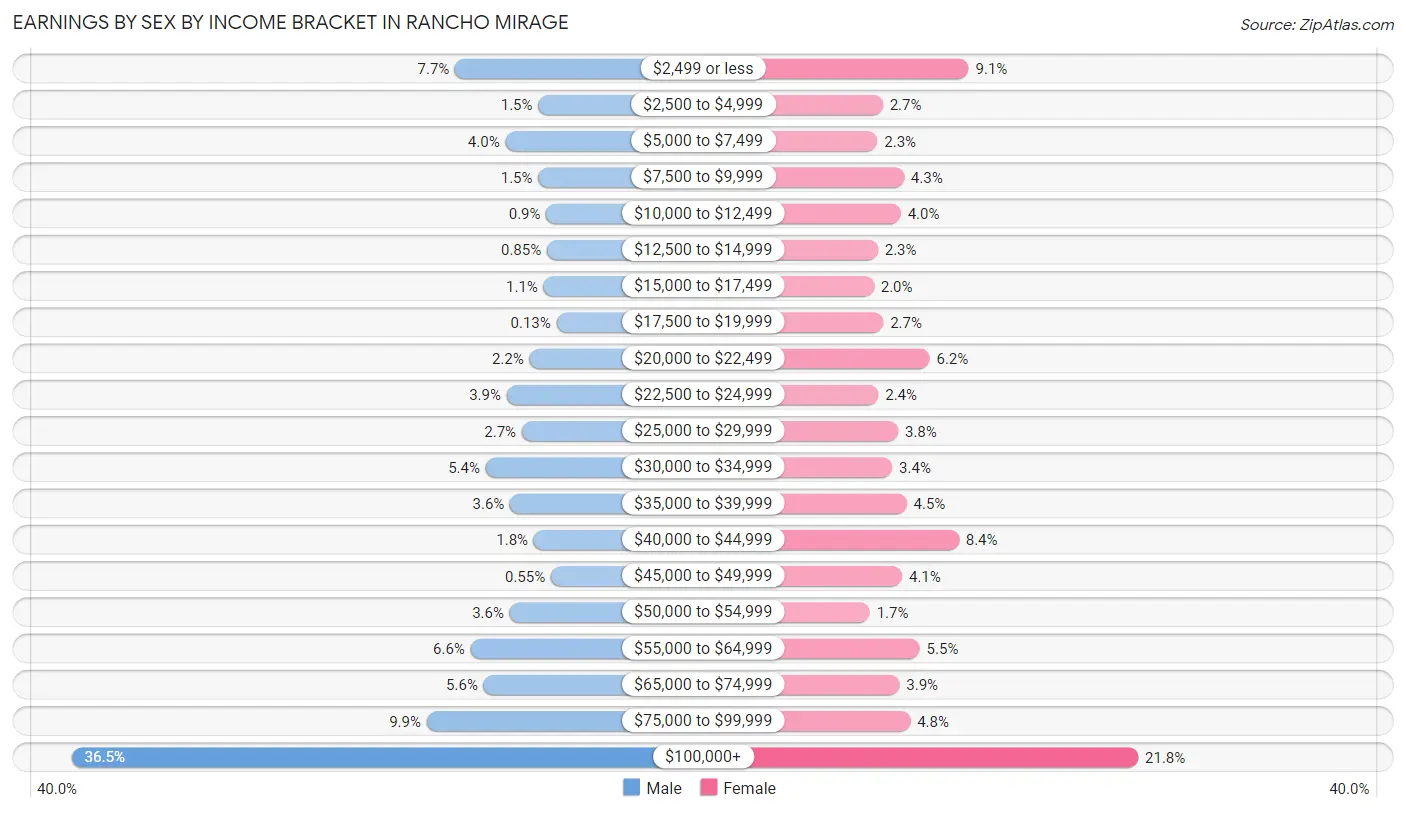
Earnings by Sex by Income Bracket in Rancho Mirage
The most common earnings brackets in Rancho Mirage are $100,000+ for men (1,454 | 36.5%) and $100,000+ for women (648 | 21.8%).
| Income | Male | Female |
| $2,499 or less | 308 (7.7%) | 271 (9.1%) |
| $2,500 to $4,999 | 60 (1.5%) | 80 (2.7%) |
| $5,000 to $7,499 | 158 (4.0%) | 68 (2.3%) |
| $7,500 to $9,999 | 60 (1.5%) | 127 (4.3%) |
| $10,000 to $12,499 | 36 (0.9%) | 120 (4.0%) |
| $12,500 to $14,999 | 34 (0.9%) | 69 (2.3%) |
| $15,000 to $17,499 | 44 (1.1%) | 60 (2.0%) |
| $17,500 to $19,999 | 5 (0.1%) | 81 (2.7%) |
| $20,000 to $22,499 | 86 (2.2%) | 184 (6.2%) |
| $22,500 to $24,999 | 154 (3.9%) | 70 (2.4%) |
| $25,000 to $29,999 | 109 (2.7%) | 114 (3.8%) |
| $30,000 to $34,999 | 217 (5.4%) | 101 (3.4%) |
| $35,000 to $39,999 | 144 (3.6%) | 133 (4.5%) |
| $40,000 to $44,999 | 73 (1.8%) | 249 (8.4%) |
| $45,000 to $49,999 | 22 (0.5%) | 123 (4.1%) |
| $50,000 to $54,999 | 145 (3.6%) | 51 (1.7%) |
| $55,000 to $64,999 | 262 (6.6%) | 162 (5.5%) |
| $65,000 to $74,999 | 223 (5.6%) | 117 (3.9%) |
| $75,000 to $99,999 | 393 (9.9%) | 141 (4.8%) |
| $100,000+ | 1,454 (36.5%) | 648 (21.8%) |
| Total | 3,987 (100.0%) | 2,969 (100.0%) |
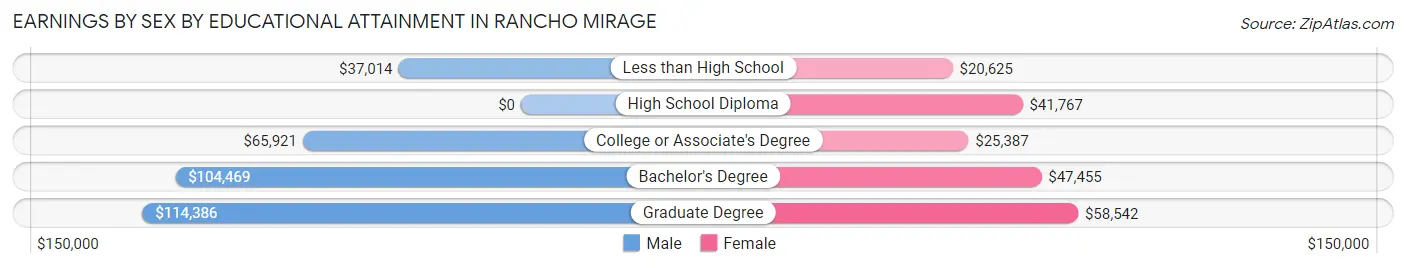
Earnings by Sex by Educational Attainment in Rancho Mirage
Average earnings in Rancho Mirage are $67,218 for men and $42,924 for women, a difference of 36.1%. Men with an educational attainment of graduate degree enjoy the highest average annual earnings of $114,386, while those with less than high school education earn the least with $37,014. Women with an educational attainment of graduate degree earn the most with the average annual earnings of $58,542, while those with less than high school education have the smallest earnings of $20,625.
| Educational Attainment | Male Income | Female Income |
| Less than High School | $37,014 | $20,625 |
| High School Diploma | - | - |
| College or Associate's Degree | $65,921 | $25,387 |
| Bachelor's Degree | $104,469 | $47,455 |
| Graduate Degree | $114,386 | $58,542 |
| Total | $67,218 | $42,924 |
Family Income in Rancho Mirage
Family Income Brackets in Rancho Mirage
According to the Rancho Mirage family income data, there are 1,707 families falling into the $200,000+ income range, which is the most common income bracket and makes up 34.6% of all families. Conversely, the $10,000 to $14,999 income bracket is the least frequent group with only 89 families (1.8%) belonging to this category.
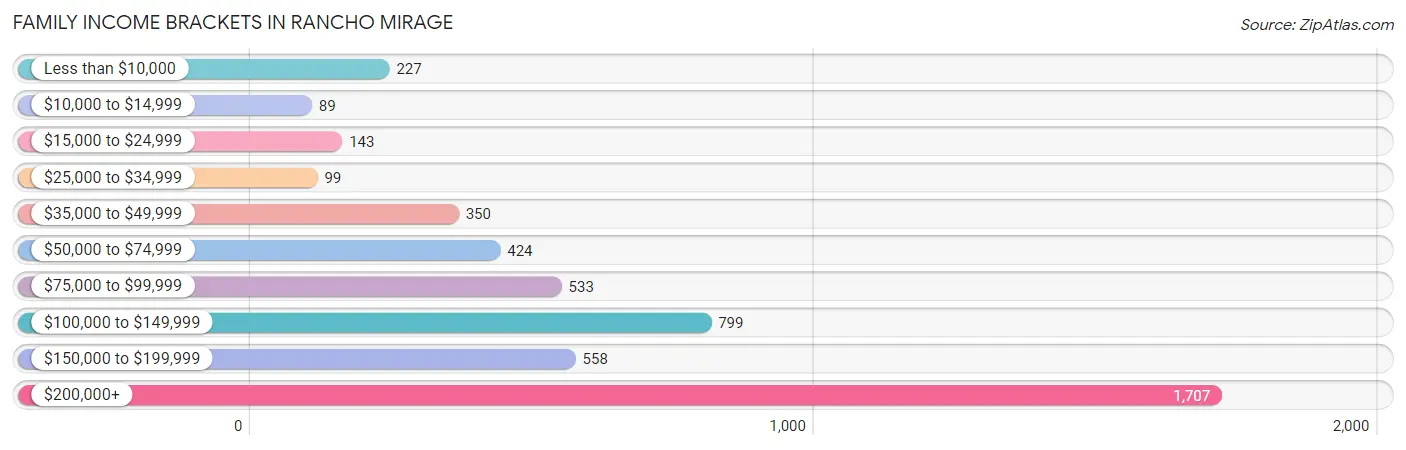
| Income Bracket | # Families | % Families |
| Less than $10,000 | 227 | 4.6% |
| $10,000 to $14,999 | 89 | 1.8% |
| $15,000 to $24,999 | 143 | 2.9% |
| $25,000 to $34,999 | 99 | 2.0% |
| $35,000 to $49,999 | 350 | 7.1% |
| $50,000 to $74,999 | 424 | 8.6% |
| $75,000 to $99,999 | 533 | 10.8% |
| $100,000 to $149,999 | 799 | 16.2% |
| $150,000 to $199,999 | 558 | 11.3% |
| $200,000+ | 1,707 | 34.6% |
Family Income by Famaliy Size in Rancho Mirage
7+ person families (59 | 1.2%) account for the highest median family income in Rancho Mirage with $228,162 per family, while 2-person families (3,737 | 75.7%) have the highest median income of $68,610 per family member.
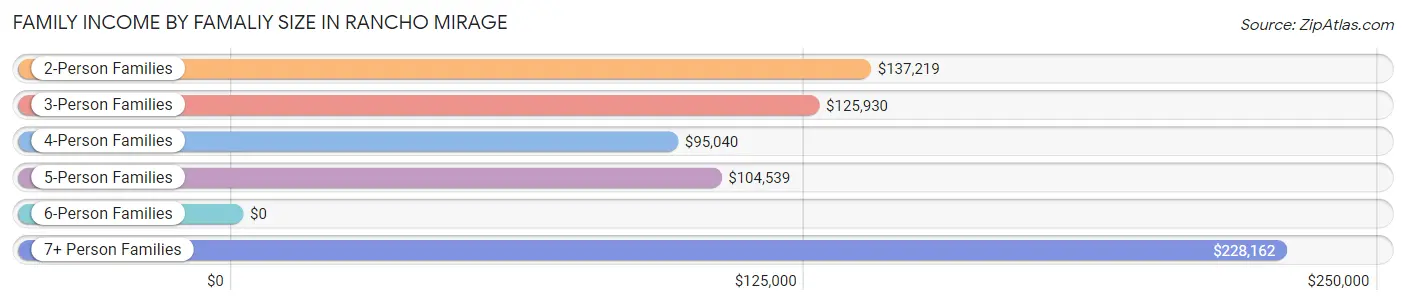
| Income Bracket | # Families | Median Income |
| 2-Person Families | 3,737 (75.7%) | $137,219 |
| 3-Person Families | 788 (16.0%) | $125,930 |
| 4-Person Families | 319 (6.5%) | $95,040 |
| 5-Person Families | 31 (0.6%) | $104,539 |
| 6-Person Families | 0 (0.0%) | $0 |
| 7+ Person Families | 59 (1.2%) | $228,162 |
| Total | 4,934 (100.0%) | $131,452 |
Family Income by Number of Earners in Rancho Mirage
The median family income in Rancho Mirage is $131,452, with families comprising 3+ earners (98) having the highest median family income of $229,118, while families with no earners (1,769) have the lowest median family income of $104,702, accounting for 2.0% and 35.8% of families, respectively.
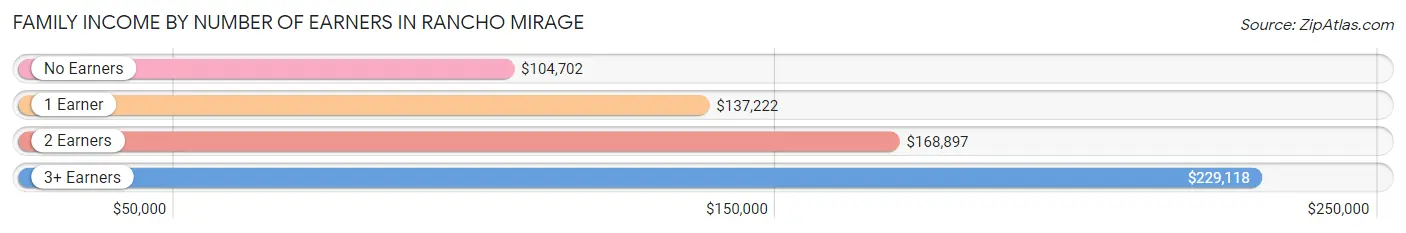
| Number of Earners | # Families | Median Income |
| No Earners | 1,769 (35.8%) | $104,702 |
| 1 Earner | 1,732 (35.1%) | $137,222 |
| 2 Earners | 1,335 (27.1%) | $168,897 |
| 3+ Earners | 98 (2.0%) | $229,118 |
| Total | 4,934 (100.0%) | $131,452 |
Household Income in Rancho Mirage
Household Income Brackets in Rancho Mirage
With 2,297 households falling in the category, the $200,000+ income range is the most frequent in Rancho Mirage, accounting for 26.3% of all households. In contrast, only 210 households (2.4%) fall into the $10,000 to $14,999 income bracket, making it the least populous group.
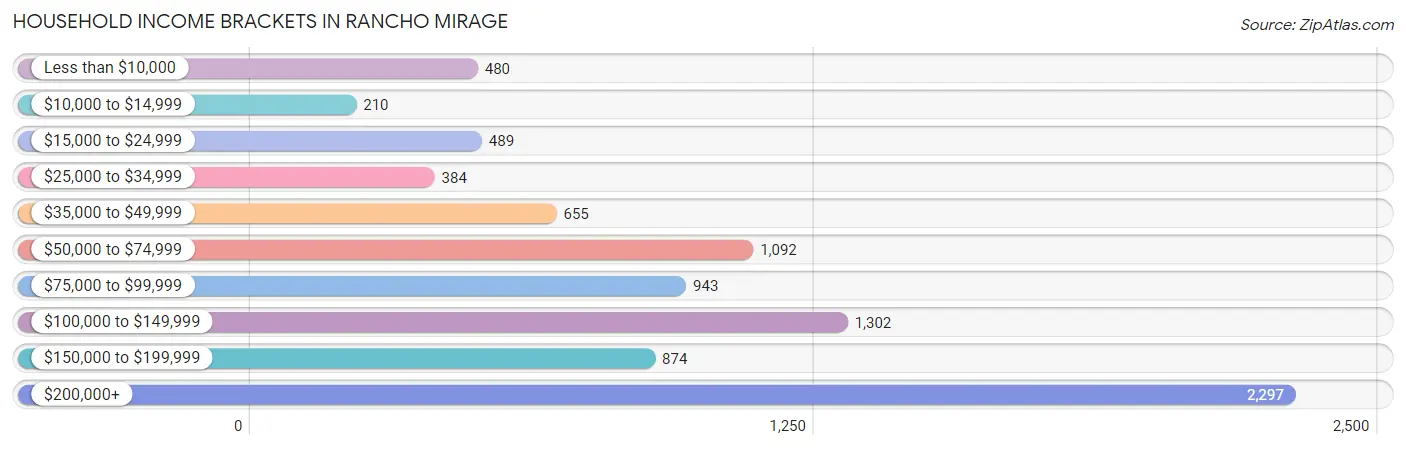
| Income Bracket | # Households | % Households |
| Less than $10,000 | 480 | 5.5% |
| $10,000 to $14,999 | 210 | 2.4% |
| $15,000 to $24,999 | 489 | 5.6% |
| $25,000 to $34,999 | 384 | 4.4% |
| $35,000 to $49,999 | 655 | 7.5% |
| $50,000 to $74,999 | 1,092 | 12.5% |
| $75,000 to $99,999 | 943 | 10.8% |
| $100,000 to $149,999 | 1,302 | 14.9% |
| $150,000 to $199,999 | 874 | 10.0% |
| $200,000+ | 2,297 | 26.3% |
Household Income by Householder Age in Rancho Mirage
The median household income in Rancho Mirage is $105,557, with the highest median household income of $138,419 found in the 45 to 64 years age bracket for the primary householder. A total of 2,661 households (30.5%) fall into this category. Meanwhile, the 15 to 24 years age bracket for the primary householder has the lowest median household income of $0, with 33 households (0.4%) in this group.
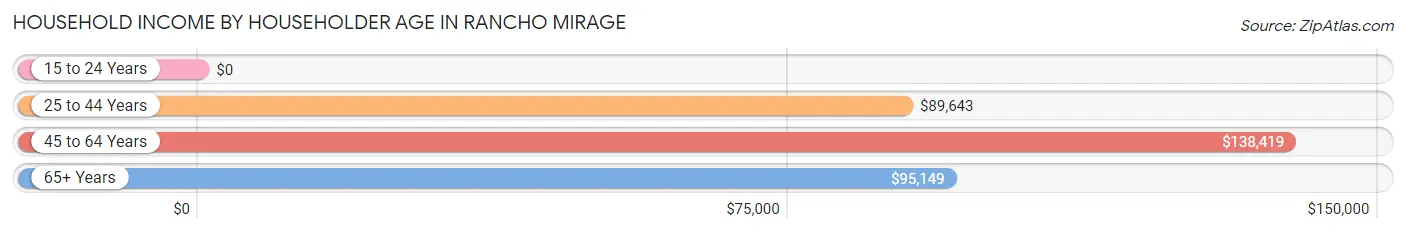
| Income Bracket | # Households | Median Income |
| 15 to 24 Years | 33 (0.4%) | $0 |
| 25 to 44 Years | 750 (8.6%) | $89,643 |
| 45 to 64 Years | 2,661 (30.5%) | $138,419 |
| 65+ Years | 5,291 (60.6%) | $95,149 |
| Total | 8,735 (100.0%) | $105,557 |
Poverty in Rancho Mirage
Income Below Poverty by Sex and Age in Rancho Mirage
With 10.7% poverty level for males and 11.3% for females among the residents of Rancho Mirage, 12 to 14 year old males and 15 year old females are the most vulnerable to poverty, with 104 males (35.2%) and 32 females (86.5%) in their respective age groups living below the poverty level.
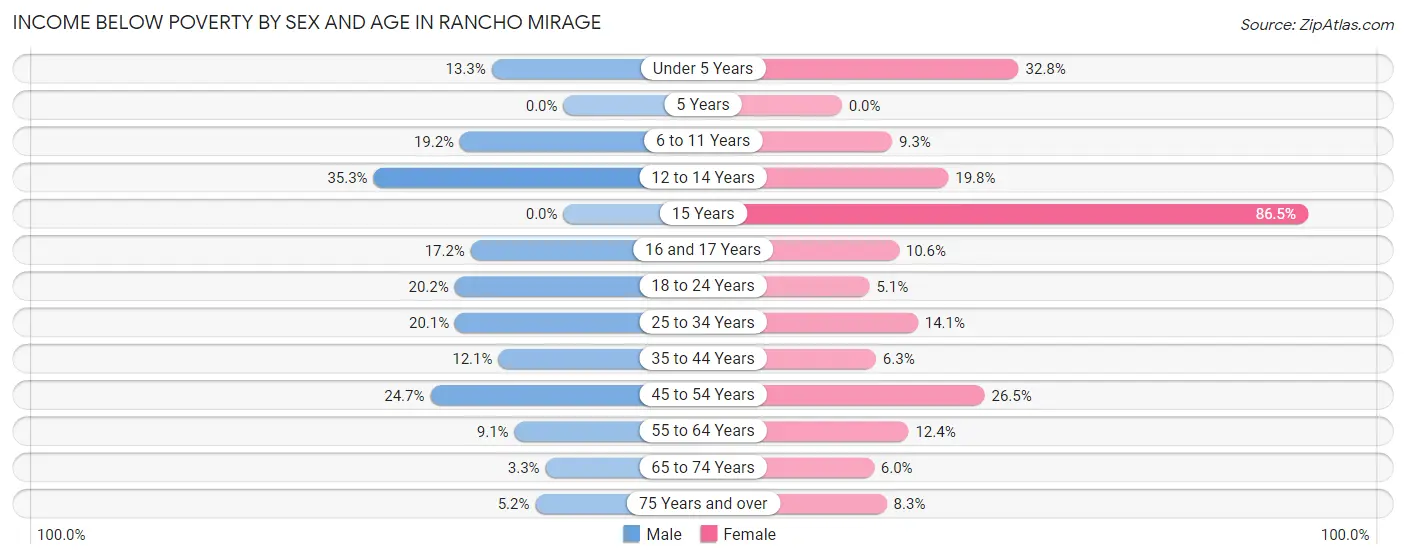
| Age Bracket | Male | Female |
| Under 5 Years | 14 (13.3%) | 64 (32.8%) |
| 5 Years | 0 (0.0%) | 0 (0.0%) |
| 6 to 11 Years | 38 (19.2%) | 17 (9.3%) |
| 12 to 14 Years | 104 (35.2%) | 17 (19.8%) |
| 15 Years | 0 (0.0%) | 32 (86.5%) |
| 16 and 17 Years | 27 (17.2%) | 11 (10.6%) |
| 18 to 24 Years | 43 (20.2%) | 8 (5.1%) |
| 25 to 34 Years | 120 (20.1%) | 45 (14.1%) |
| 35 to 44 Years | 61 (12.1%) | 28 (6.3%) |
| 45 to 54 Years | 218 (24.7%) | 196 (26.5%) |
| 55 to 64 Years | 157 (9.1%) | 194 (12.4%) |
| 65 to 74 Years | 65 (3.3%) | 124 (5.9%) |
| 75 Years and over | 117 (5.2%) | 178 (8.3%) |
| Total | 964 (10.7%) | 914 (11.3%) |
Income Above Poverty by Sex and Age in Rancho Mirage
According to the poverty statistics in Rancho Mirage, males aged 5 years and females aged 5 years are the age groups that are most secure financially, with 100.0% of males and 100.0% of females in these age groups living above the poverty line.
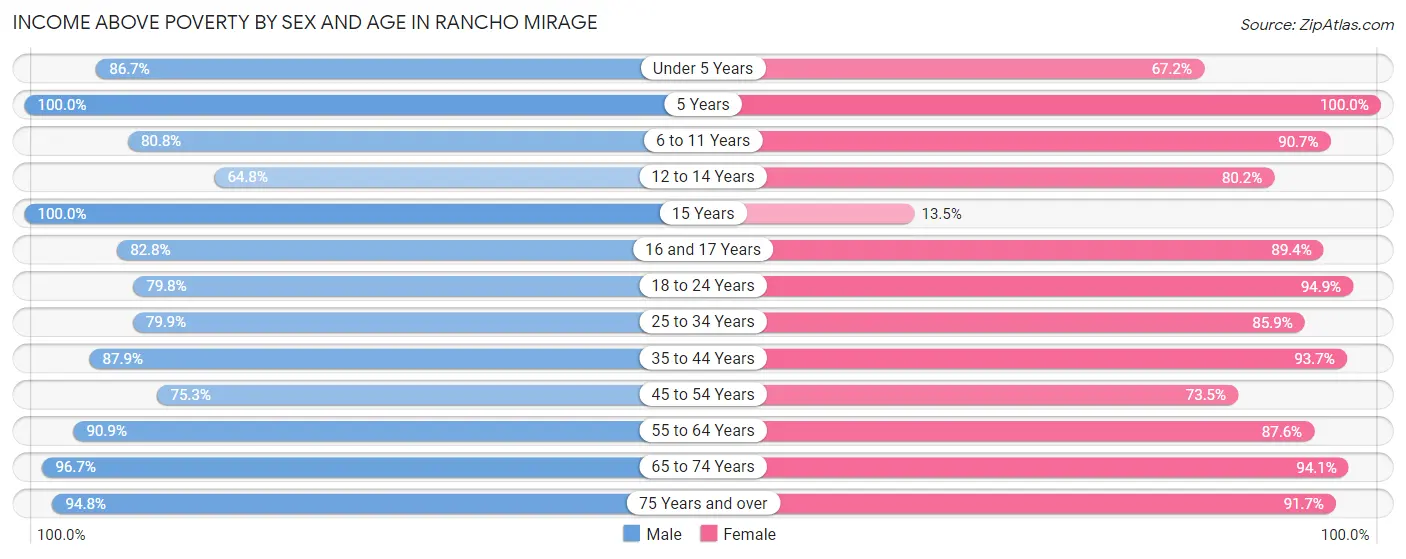
| Age Bracket | Male | Female |
| Under 5 Years | 91 (86.7%) | 131 (67.2%) |
| 5 Years | 2 (100.0%) | 39 (100.0%) |
| 6 to 11 Years | 160 (80.8%) | 165 (90.7%) |
| 12 to 14 Years | 191 (64.7%) | 69 (80.2%) |
| 15 Years | 90 (100.0%) | 5 (13.5%) |
| 16 and 17 Years | 130 (82.8%) | 93 (89.4%) |
| 18 to 24 Years | 170 (79.8%) | 148 (94.9%) |
| 25 to 34 Years | 477 (79.9%) | 274 (85.9%) |
| 35 to 44 Years | 444 (87.9%) | 414 (93.7%) |
| 45 to 54 Years | 665 (75.3%) | 544 (73.5%) |
| 55 to 64 Years | 1,572 (90.9%) | 1,373 (87.6%) |
| 65 to 74 Years | 1,885 (96.7%) | 1,960 (94.1%) |
| 75 Years and over | 2,129 (94.8%) | 1,958 (91.7%) |
| Total | 8,006 (89.2%) | 7,173 (88.7%) |
Income Below Poverty Among Married-Couple Families in Rancho Mirage
The poverty statistics for married-couple families in Rancho Mirage show that 7.0% or 311 of the total 4,427 families live below the poverty line. Families with 1 or 2 children have the highest poverty rate of 31.9%, comprising of 169 families. On the other hand, families with 3 or 4 children have the lowest poverty rate of 0.0%, which includes 0 families.
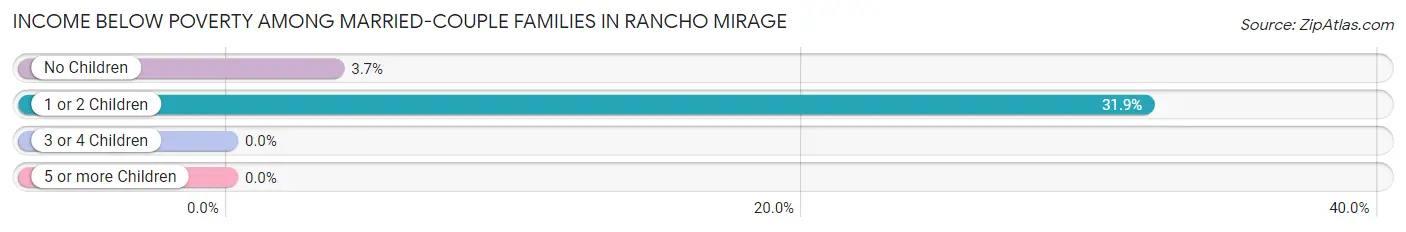
| Children | Above Poverty | Below Poverty |
| No Children | 3,699 (96.3%) | 142 (3.7%) |
| 1 or 2 Children | 361 (68.1%) | 169 (31.9%) |
| 3 or 4 Children | 27 (100.0%) | 0 (0.0%) |
| 5 or more Children | 29 (100.0%) | 0 (0.0%) |
| Total | 4,116 (93.0%) | 311 (7.0%) |
Income Below Poverty Among Single-Parent Households in Rancho Mirage
According to the poverty data in Rancho Mirage, 28.0% or 49 single-father households and 24.7% or 82 single-mother households are living below the poverty line. Among single-father households, those with 1 or 2 children have the highest poverty rate, with 39 households (41.9%) experiencing poverty. Likewise, among single-mother households, those with 1 or 2 children have the highest poverty rate, with 48 households (43.2%) falling below the poverty line.
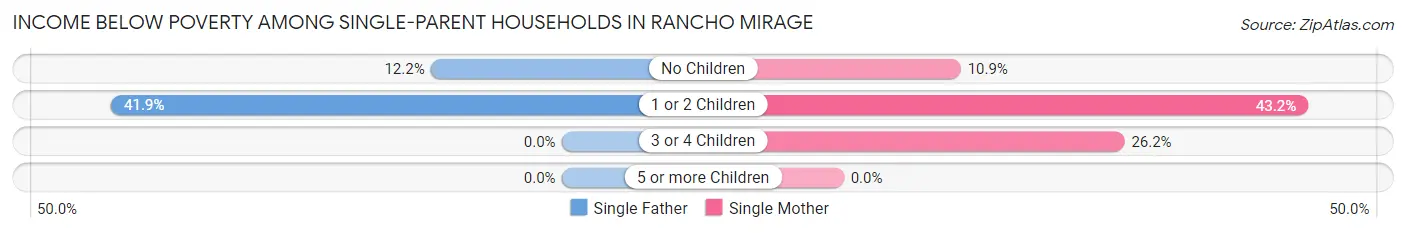
| Children | Single Father | Single Mother |
| No Children | 10 (12.2%) | 17 (10.9%) |
| 1 or 2 Children | 39 (41.9%) | 48 (43.2%) |
| 3 or 4 Children | 0 (0.0%) | 17 (26.2%) |
| 5 or more Children | 0 (0.0%) | 0 (0.0%) |
| Total | 49 (28.0%) | 82 (24.7%) |
Income Below Poverty Among Married-Couple vs Single-Parent Households in Rancho Mirage
The poverty data for Rancho Mirage shows that 311 of the married-couple family households (7.0%) and 131 of the single-parent households (25.8%) are living below the poverty level. Within the married-couple family households, those with 1 or 2 children have the highest poverty rate, with 169 households (31.9%) falling below the poverty line. Among the single-parent households, those with 1 or 2 children have the highest poverty rate, with 87 household (42.6%) living below poverty.
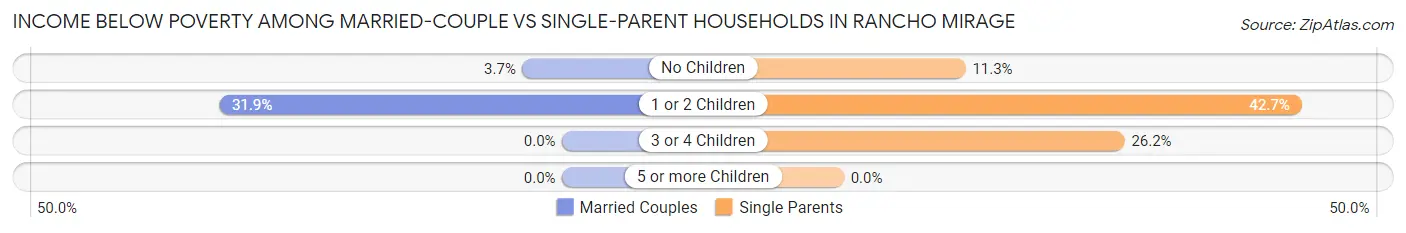
| Children | Married-Couple Families | Single-Parent Households |
| No Children | 142 (3.7%) | 27 (11.3%) |
| 1 or 2 Children | 169 (31.9%) | 87 (42.6%) |
| 3 or 4 Children | 0 (0.0%) | 17 (26.2%) |
| 5 or more Children | 0 (0.0%) | 0 (0.0%) |
| Total | 311 (7.0%) | 131 (25.8%) |
Race in Rancho Mirage
The most populous races in Rancho Mirage are White / Caucasian (14,279 | 82.7%), Hispanic or Latino (2,001 | 11.6%), and Some other Race (905 | 5.2%).
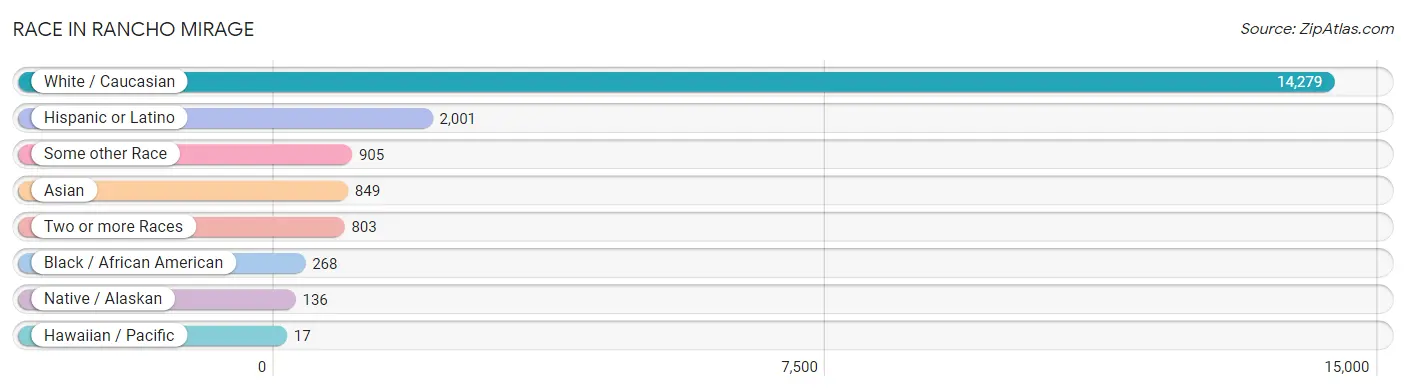
| Race | # Population | % Population |
| Asian | 849 | 4.9% |
| Black / African American | 268 | 1.5% |
| Hawaiian / Pacific | 17 | 0.1% |
| Hispanic or Latino | 2,001 | 11.6% |
| Native / Alaskan | 136 | 0.8% |
| White / Caucasian | 14,279 | 82.7% |
| Two or more Races | 803 | 4.6% |
| Some other Race | 905 | 5.2% |
| Total | 17,257 | 100.0% |
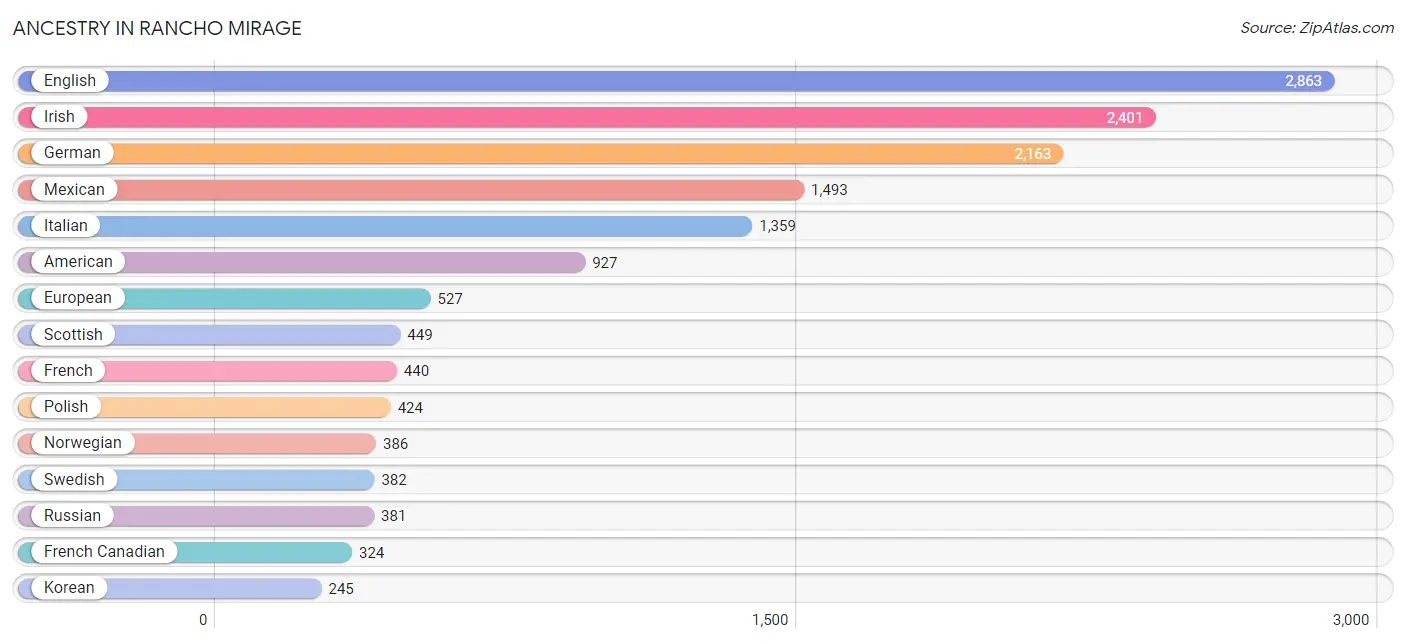
Ancestry in Rancho Mirage
The most populous ancestries reported in Rancho Mirage are English (2,863 | 16.6%), Irish (2,401 | 13.9%), German (2,163 | 12.5%), Mexican (1,493 | 8.6%), and Italian (1,359 | 7.9%), together accounting for 59.6% of all Rancho Mirage residents.
| Ancestry | # Population | % Population |
| African | 10 | 0.1% |
| American | 927 | 5.4% |
| Apache | 9 | 0.1% |
| Arab | 132 | 0.8% |
| Argentinean | 11 | 0.1% |
| Armenian | 54 | 0.3% |
| Australian | 8 | 0.1% |
| Austrian | 158 | 0.9% |
| Basque | 19 | 0.1% |
| Belgian | 27 | 0.2% |
| Bhutanese | 46 | 0.3% |
| Blackfeet | 10 | 0.1% |
| Brazilian | 91 | 0.5% |
| British | 184 | 1.1% |
| Bulgarian | 9 | 0.1% |
| Burmese | 24 | 0.1% |
| Canadian | 191 | 1.1% |
| Celtic | 8 | 0.1% |
| Central American | 134 | 0.8% |
| Cherokee | 51 | 0.3% |
| Cheyenne | 7 | 0.0% |
| Chickasaw | 9 | 0.1% |
| Chilean | 7 | 0.0% |
| Chippewa | 10 | 0.1% |
| Choctaw | 6 | 0.0% |
| Colombian | 13 | 0.1% |
| Croatian | 163 | 0.9% |
| Cuban | 103 | 0.6% |
| Czech | 25 | 0.1% |
| Czechoslovakian | 97 | 0.6% |
| Danish | 219 | 1.3% |
| Dutch | 137 | 0.8% |
| Eastern European | 146 | 0.9% |
| Egyptian | 10 | 0.1% |
| English | 2,863 | 16.6% |
| Estonian | 23 | 0.1% |
| European | 527 | 3.0% |
| Filipino | 21 | 0.1% |
| Finnish | 24 | 0.1% |
| French | 440 | 2.5% |
| French Canadian | 324 | 1.9% |
| German | 2,163 | 12.5% |
| Greek | 161 | 0.9% |
| Guamanian / Chamorro | 9 | 0.1% |
| Hungarian | 102 | 0.6% |
| Icelander | 10 | 0.1% |
| Indian (Asian) | 158 | 0.9% |
| Indonesian | 2 | 0.0% |
| Iranian | 121 | 0.7% |
| Irish | 2,401 | 13.9% |
| Italian | 1,359 | 7.9% |
| Jamaican | 10 | 0.1% |
| Japanese | 41 | 0.2% |
| Korean | 245 | 1.4% |
| Laotian | 11 | 0.1% |
| Latvian | 2 | 0.0% |
| Lebanese | 89 | 0.5% |
| Lithuanian | 86 | 0.5% |
| Mexican | 1,493 | 8.6% |
| Navajo | 13 | 0.1% |
| Nicaraguan | 1 | 0.0% |
| Northern European | 37 | 0.2% |
| Norwegian | 386 | 2.2% |
| Palestinian | 7 | 0.0% |
| Pennsylvania German | 2 | 0.0% |
| Polish | 424 | 2.5% |
| Portuguese | 39 | 0.2% |
| Potawatomi | 16 | 0.1% |
| Puerto Rican | 34 | 0.2% |
| Puget Sound Salish | 10 | 0.1% |
| Romanian | 61 | 0.4% |
| Russian | 381 | 2.2% |
| Salvadoran | 133 | 0.8% |
| Scandinavian | 77 | 0.4% |
| Scotch-Irish | 200 | 1.2% |
| Scottish | 449 | 2.6% |
| Serbian | 24 | 0.1% |
| Sioux | 12 | 0.1% |
| Slavic | 7 | 0.0% |
| Slovak | 22 | 0.1% |
| Slovene | 14 | 0.1% |
| South African | 2 | 0.0% |
| South American | 93 | 0.5% |
| Spaniard | 2 | 0.0% |
| Spanish | 72 | 0.4% |
| Sri Lankan | 194 | 1.1% |
| Subsaharan African | 12 | 0.1% |
| Swedish | 382 | 2.2% |
| Swiss | 63 | 0.4% |
| Syrian | 3 | 0.0% |
| Thai | 228 | 1.3% |
| Turkish | 20 | 0.1% |
| Ukrainian | 81 | 0.5% |
| Venezuelan | 62 | 0.4% |
| Welsh | 132 | 0.8% |
| Zimbabwean | 2 | 0.0% | View All 96 Rows |
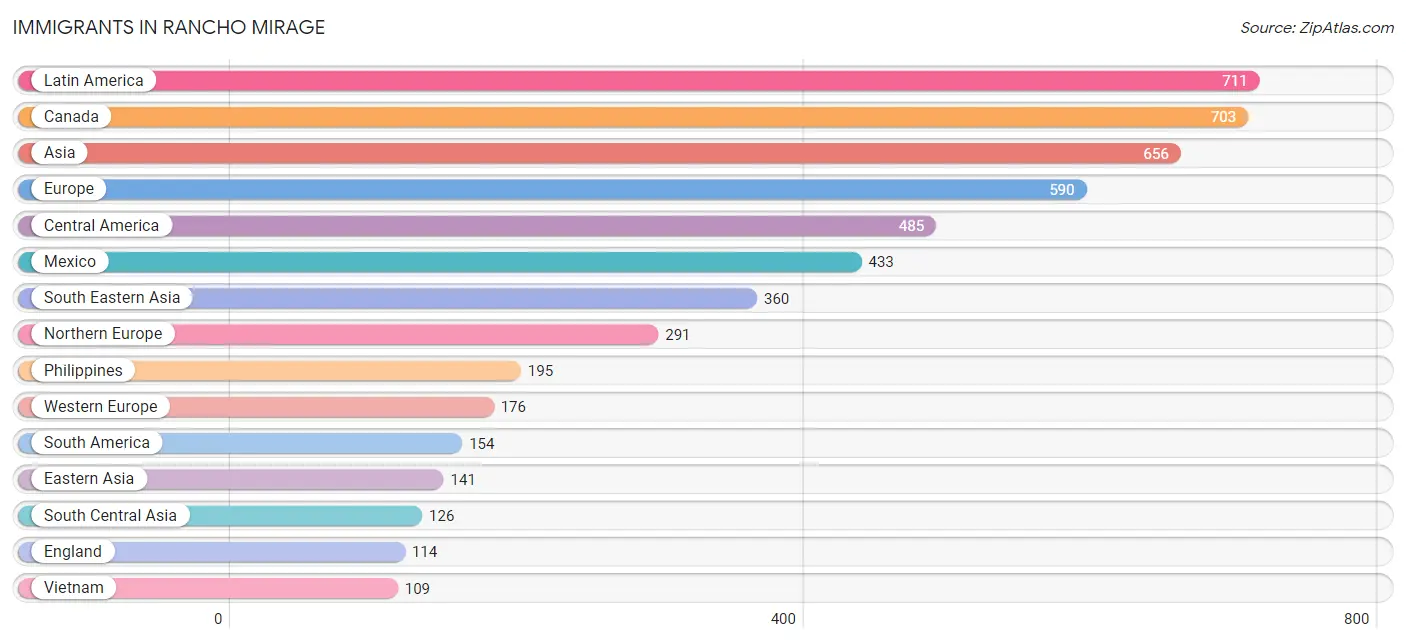
Immigrants in Rancho Mirage
The most numerous immigrant groups reported in Rancho Mirage came from Latin America (711 | 4.1%), Canada (703 | 4.1%), Asia (656 | 3.8%), Europe (590 | 3.4%), and Central America (485 | 2.8%), together accounting for 18.2% of all Rancho Mirage residents.
| Immigration Origin | # Population | % Population |
| Africa | 38 | 0.2% |
| Argentina | 22 | 0.1% |
| Asia | 656 | 3.8% |
| Austria | 37 | 0.2% |
| Belgium | 16 | 0.1% |
| Brazil | 78 | 0.4% |
| Bulgaria | 9 | 0.1% |
| Cambodia | 41 | 0.2% |
| Canada | 703 | 4.1% |
| Caribbean | 72 | 0.4% |
| Central America | 485 | 2.8% |
| China | 107 | 0.6% |
| Colombia | 13 | 0.1% |
| Cuba | 72 | 0.4% |
| Eastern Africa | 8 | 0.1% |
| Eastern Asia | 141 | 0.8% |
| Eastern Europe | 77 | 0.4% |
| Egypt | 9 | 0.1% |
| El Salvador | 25 | 0.1% |
| England | 114 | 0.7% |
| Europe | 590 | 3.4% |
| France | 25 | 0.1% |
| Germany | 80 | 0.5% |
| Honduras | 27 | 0.2% |
| Hungary | 7 | 0.0% |
| India | 70 | 0.4% |
| Indonesia | 13 | 0.1% |
| Iran | 54 | 0.3% |
| Ireland | 24 | 0.1% |
| Israel | 4 | 0.0% |
| Italy | 42 | 0.2% |
| Japan | 13 | 0.1% |
| Korea | 21 | 0.1% |
| Latin America | 711 | 4.1% |
| Lebanon | 18 | 0.1% |
| Mexico | 433 | 2.5% |
| Morocco | 6 | 0.0% |
| Netherlands | 9 | 0.1% |
| Northern Africa | 15 | 0.1% |
| Northern Europe | 291 | 1.7% |
| Norway | 23 | 0.1% |
| Philippines | 195 | 1.1% |
| Poland | 13 | 0.1% |
| Romania | 38 | 0.2% |
| Russia | 10 | 0.1% |
| Scotland | 75 | 0.4% |
| South Africa | 15 | 0.1% |
| South America | 154 | 0.9% |
| South Central Asia | 126 | 0.7% |
| South Eastern Asia | 360 | 2.1% |
| Southern Europe | 46 | 0.3% |
| Spain | 4 | 0.0% |
| Sweden | 3 | 0.0% |
| Switzerland | 9 | 0.1% |
| Taiwan | 38 | 0.2% |
| Venezuela | 41 | 0.2% |
| Vietnam | 109 | 0.6% |
| Western Asia | 22 | 0.1% |
| Western Europe | 176 | 1.0% |
| Zimbabwe | 8 | 0.1% | View All 60 Rows |
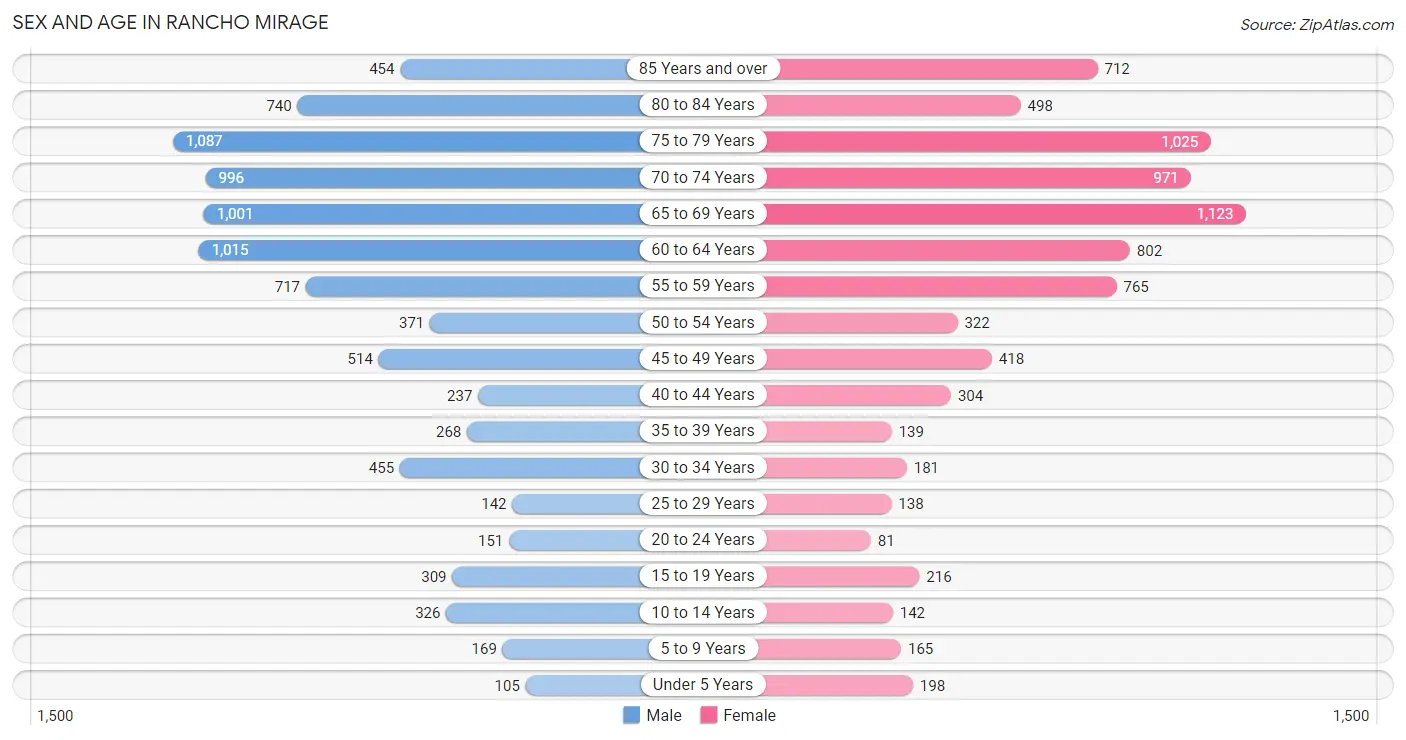
Sex and Age in Rancho Mirage
Sex and Age in Rancho Mirage
The most populous age groups in Rancho Mirage are 75 to 79 Years (1,087 | 12.0%) for men and 65 to 69 Years (1,123 | 13.7%) for women.
| Age Bracket | Male | Female |
| Under 5 Years | 105 (1.2%) | 198 (2.4%) |
| 5 to 9 Years | 169 (1.9%) | 165 (2.0%) |
| 10 to 14 Years | 326 (3.6%) | 142 (1.7%) |
| 15 to 19 Years | 309 (3.4%) | 216 (2.6%) |
| 20 to 24 Years | 151 (1.7%) | 81 (1.0%) |
| 25 to 29 Years | 142 (1.6%) | 138 (1.7%) |
| 30 to 34 Years | 455 (5.0%) | 181 (2.2%) |
| 35 to 39 Years | 268 (3.0%) | 139 (1.7%) |
| 40 to 44 Years | 237 (2.6%) | 304 (3.7%) |
| 45 to 49 Years | 514 (5.7%) | 418 (5.1%) |
| 50 to 54 Years | 371 (4.1%) | 322 (3.9%) |
| 55 to 59 Years | 717 (7.9%) | 765 (9.3%) |
| 60 to 64 Years | 1,015 (11.2%) | 802 (9.8%) |
| 65 to 69 Years | 1,001 (11.1%) | 1,123 (13.7%) |
| 70 to 74 Years | 996 (11.0%) | 971 (11.8%) |
| 75 to 79 Years | 1,087 (12.0%) | 1,025 (12.5%) |
| 80 to 84 Years | 740 (8.2%) | 498 (6.1%) |
| 85 Years and over | 454 (5.0%) | 712 (8.7%) |
| Total | 9,057 (100.0%) | 8,200 (100.0%) |
Families and Households in Rancho Mirage
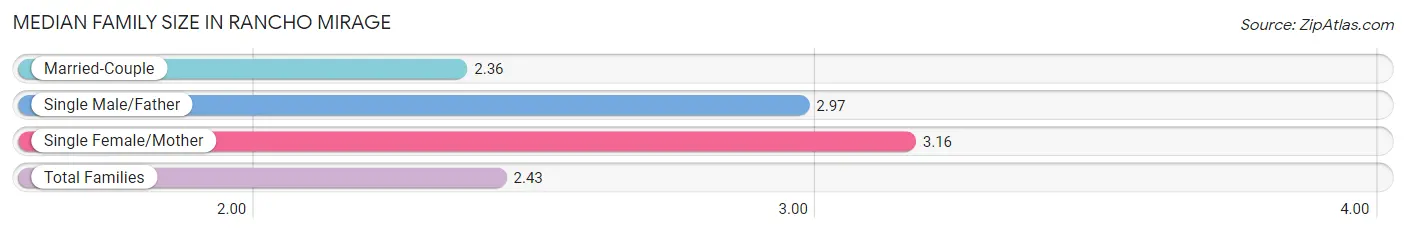
Median Family Size in Rancho Mirage
The median family size in Rancho Mirage is 2.43 persons per family, with single female/mother families (332 | 6.7%) accounting for the largest median family size of 3.16 persons per family. On the other hand, married-couple families (4,427 | 89.7%) represent the smallest median family size with 2.36 persons per family.
| Family Type | # Families | Family Size |
| Married-Couple | 4,427 (89.7%) | 2.36 |
| Single Male/Father | 175 (3.5%) | 2.97 |
| Single Female/Mother | 332 (6.7%) | 3.16 |
| Total Families | 4,934 (100.0%) | 2.43 |
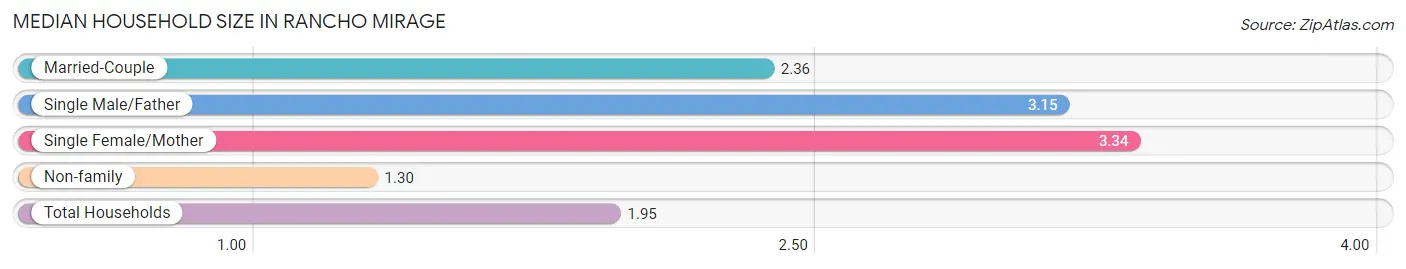
Median Household Size in Rancho Mirage
The median household size in Rancho Mirage is 1.95 persons per household, with single female/mother households (332 | 3.8%) accounting for the largest median household size of 3.34 persons per household. non-family households (3,801 | 43.5%) represent the smallest median household size with 1.30 persons per household.
| Household Type | # Households | Household Size |
| Married-Couple | 4,427 (50.7%) | 2.36 |
| Single Male/Father | 175 (2.0%) | 3.15 |
| Single Female/Mother | 332 (3.8%) | 3.34 |
| Non-family | 3,801 (43.5%) | 1.30 |
| Total Households | 8,735 (100.0%) | 1.95 |
Household Size by Marriage Status in Rancho Mirage
Out of a total of 8,735 households in Rancho Mirage, 4,934 (56.5%) are family households, while 3,801 (43.5%) are nonfamily households. The most numerous type of family households are 2-person households, comprising 3,684, and the most common type of nonfamily households are 1-person households, comprising 2,908.
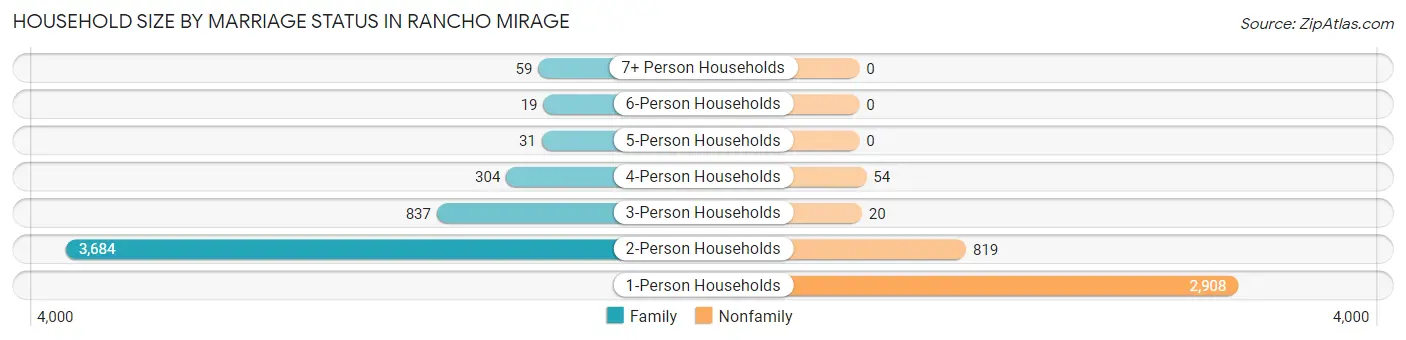
| Household Size | Family Households | Nonfamily Households |
| 1-Person Households | - | 2,908 (33.3%) |
| 2-Person Households | 3,684 (42.2%) | 819 (9.4%) |
| 3-Person Households | 837 (9.6%) | 20 (0.2%) |
| 4-Person Households | 304 (3.5%) | 54 (0.6%) |
| 5-Person Households | 31 (0.4%) | 0 (0.0%) |
| 6-Person Households | 19 (0.2%) | 0 (0.0%) |
| 7+ Person Households | 59 (0.7%) | 0 (0.0%) |
| Total | 4,934 (56.5%) | 3,801 (43.5%) |
Female Fertility in Rancho Mirage
Fertility by Age in Rancho Mirage
Average fertility rate in Rancho Mirage is 12.0 births per 1,000 women. Women in the age bracket of 20 to 34 years have the highest fertility rate with 28.0 births per 1,000 women. Women in the age bracket of 20 to 34 years acount for 61.1% of all women with births.
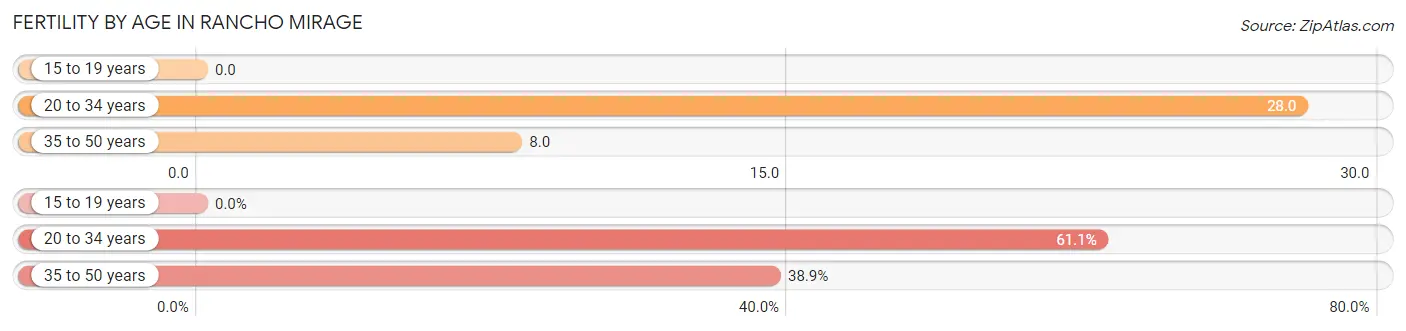
| Age Bracket | Women with Births | Births / 1,000 Women |
| 15 to 19 years | 0 (0.0%) | 0.0 |
| 20 to 34 years | 11 (61.1%) | 28.0 |
| 35 to 50 years | 7 (38.9%) | 8.0 |
| Total | 18 (100.0%) | 12.0 |
Fertility by Age by Marriage Status in Rancho Mirage
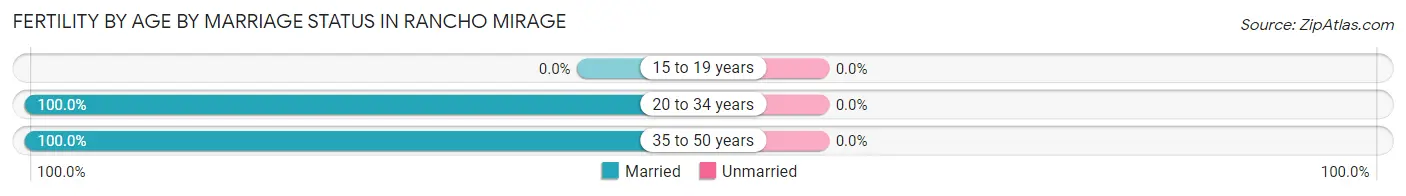
| Age Bracket | Married | Unmarried |
| 15 to 19 years | 0 (0.0%) | 0 (0.0%) |
| 20 to 34 years | 11 (100.0%) | 0 (0.0%) |
| 35 to 50 years | 7 (100.0%) | 0 (0.0%) |
| Total | 18 (100.0%) | 0 (0.0%) |
Fertility by Education in Rancho Mirage
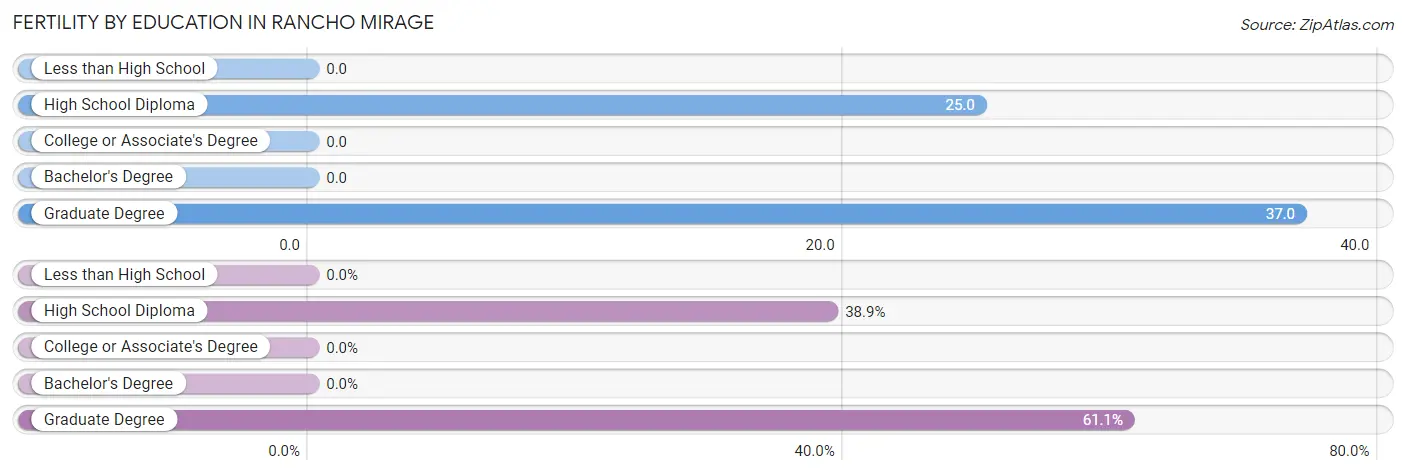
| Educational Attainment | Women with Births | Births / 1,000 Women |
| Less than High School | 0 (0.0%) | 0.0 |
| High School Diploma | 7 (38.9%) | 25.0 |
| College or Associate's Degree | 0 (0.0%) | 0.0 |
| Bachelor's Degree | 0 (0.0%) | 0.0 |
| Graduate Degree | 11 (61.1%) | 37.0 |
| Total | 18 (100.0%) | 12.0 |
Fertility by Education by Marriage Status in Rancho Mirage
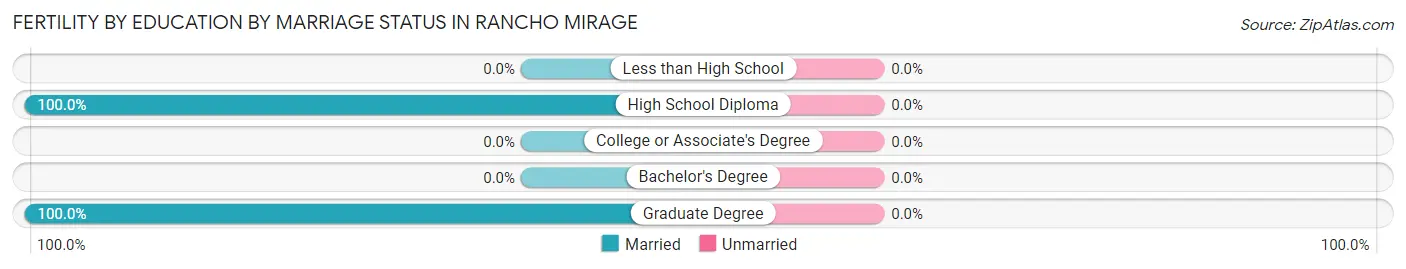
| Educational Attainment | Married | Unmarried |
| Less than High School | 0 (0.0%) | 0 (0.0%) |
| High School Diploma | 7 (100.0%) | 0 (0.0%) |
| College or Associate's Degree | 0 (0.0%) | 0 (0.0%) |
| Bachelor's Degree | 0 (0.0%) | 0 (0.0%) |
| Graduate Degree | 11 (100.0%) | 0 (0.0%) |
| Total | 18 (100.0%) | 0 (0.0%) |
Employment Characteristics in Rancho Mirage
Employment by Class of Employer in Rancho Mirage
Among the 5,553 employed individuals in Rancho Mirage, private company employees (3,068 | 55.2%), self-employed (not incorporated) (669 | 12.0%), and self-employed (incorporated) (660 | 11.9%) make up the most common classes of employment.
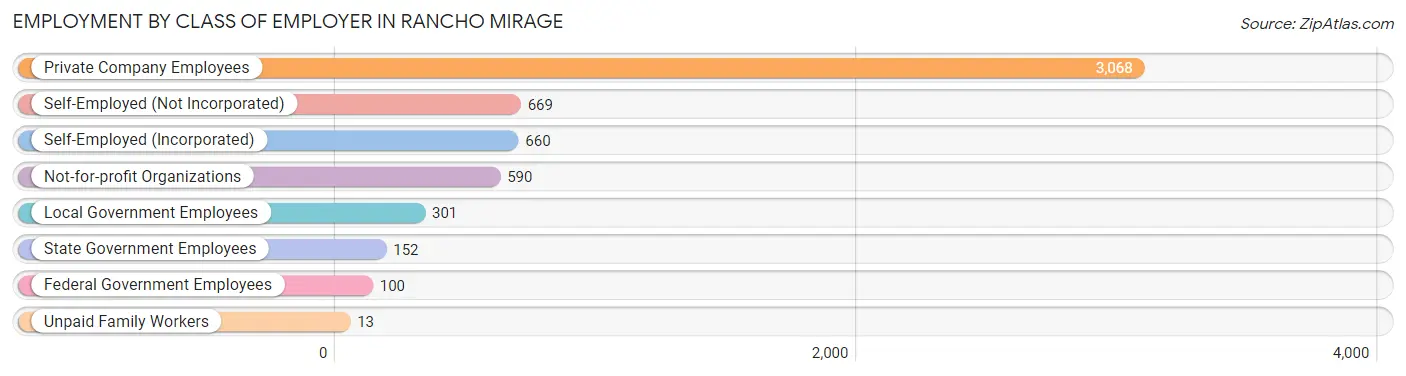
| Employer Class | # Employees | % Employees |
| Private Company Employees | 3,068 | 55.2% |
| Self-Employed (Incorporated) | 660 | 11.9% |
| Self-Employed (Not Incorporated) | 669 | 12.0% |
| Not-for-profit Organizations | 590 | 10.6% |
| Local Government Employees | 301 | 5.4% |
| State Government Employees | 152 | 2.7% |
| Federal Government Employees | 100 | 1.8% |
| Unpaid Family Workers | 13 | 0.2% |
| Total | 5,553 | 100.0% |
Employment Status by Age in Rancho Mirage
According to the labor force statistics for Rancho Mirage, out of the total population over 16 years of age (16,025), 40.7% or 6,522 individuals are in the labor force, with 10.5% or 685 of them unemployed. The age group with the highest labor force participation rate is 35 to 44 years, with 88.4% or 838 individuals in the labor force. Within the labor force, the 75 years and over age range has the highest percentage of unemployed individuals, with 23.4% or 93 of them being unemployed.
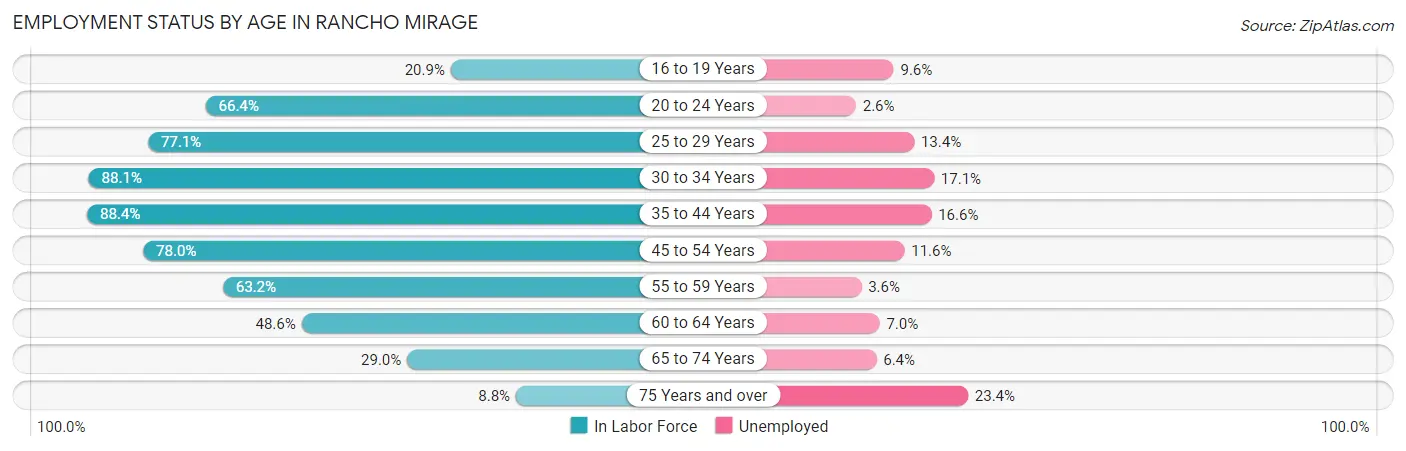
| Age Bracket | In Labor Force | Unemployed |
| 16 to 19 Years | 83 (20.9%) | 8 (9.6%) |
| 20 to 24 Years | 154 (66.4%) | 4 (2.6%) |
| 25 to 29 Years | 216 (77.1%) | 29 (13.4%) |
| 30 to 34 Years | 560 (88.1%) | 96 (17.1%) |
| 35 to 44 Years | 838 (88.4%) | 139 (16.6%) |
| 45 to 54 Years | 1,268 (78.0%) | 147 (11.6%) |
| 55 to 59 Years | 937 (63.2%) | 34 (3.6%) |
| 60 to 64 Years | 883 (48.6%) | 62 (7.0%) |
| 65 to 74 Years | 1,186 (29.0%) | 76 (6.4%) |
| 75 Years and over | 397 (8.8%) | 93 (23.4%) |
| Total | 6,522 (40.7%) | 685 (10.5%) |
Employment Status by Educational Attainment in Rancho Mirage
According to labor force statistics for Rancho Mirage, 69.3% of individuals (4,704) out of the total population between 25 and 64 years of age (6,788) are in the labor force, with 10.8% or 508 of them being unemployed. The group with the highest labor force participation rate are those with the educational attainment of less than high school, with 86.0% or 362 individuals in the labor force. Within the labor force, individuals with less than high school education have the highest percentage of unemployment, with 29.6% or 107 of them being unemployed.
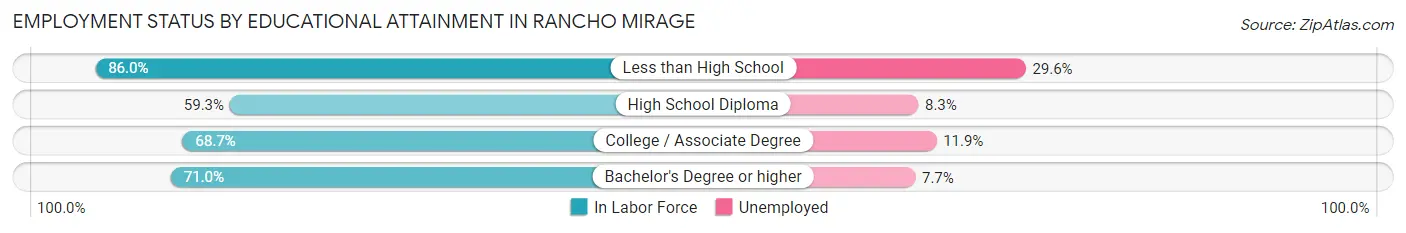
| Educational Attainment | In Labor Force | Unemployed |
| Less than High School | 362 (86.0%) | 125 (29.6%) |
| High School Diploma | 659 (59.3%) | 92 (8.3%) |
| College / Associate Degree | 1,502 (68.7%) | 260 (11.9%) |
| Bachelor's Degree or higher | 2,178 (71.0%) | 236 (7.7%) |
| Total | 4,704 (69.3%) | 733 (10.8%) |
Employment Occupations by Sex in Rancho Mirage
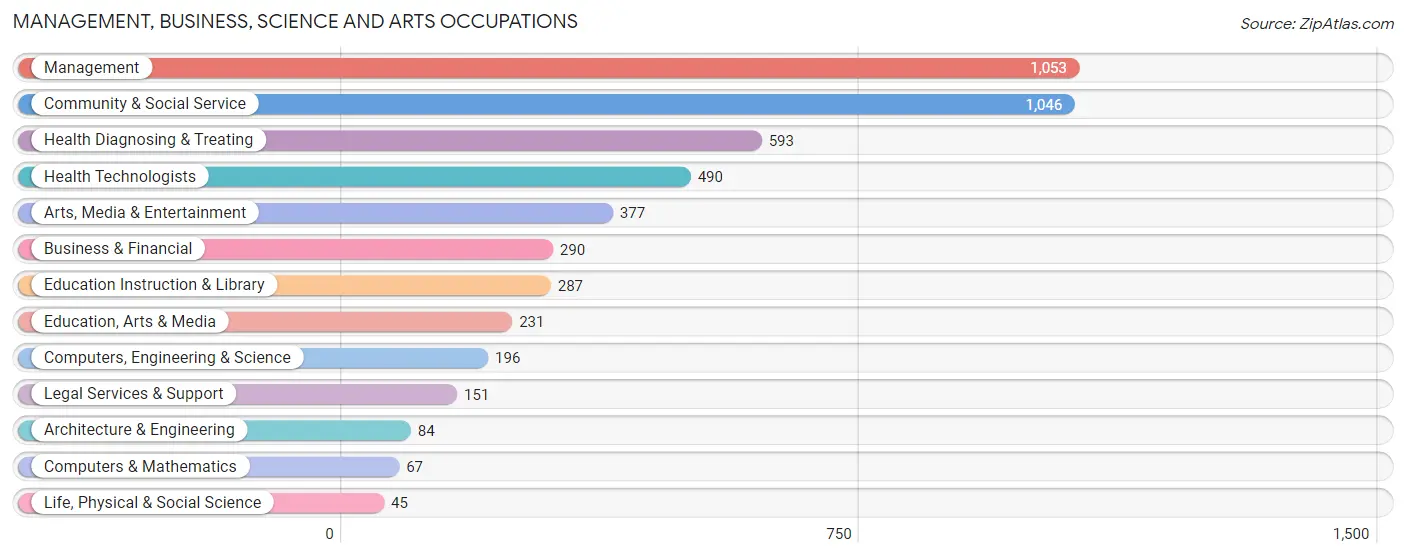
Management, Business, Science and Arts Occupations
The most common Management, Business, Science and Arts occupations in Rancho Mirage are Management (1,053 | 18.0%), Community & Social Service (1,046 | 17.9%), Health Diagnosing & Treating (593 | 10.2%), Health Technologists (490 | 8.4%), and Arts, Media & Entertainment (377 | 6.5%).
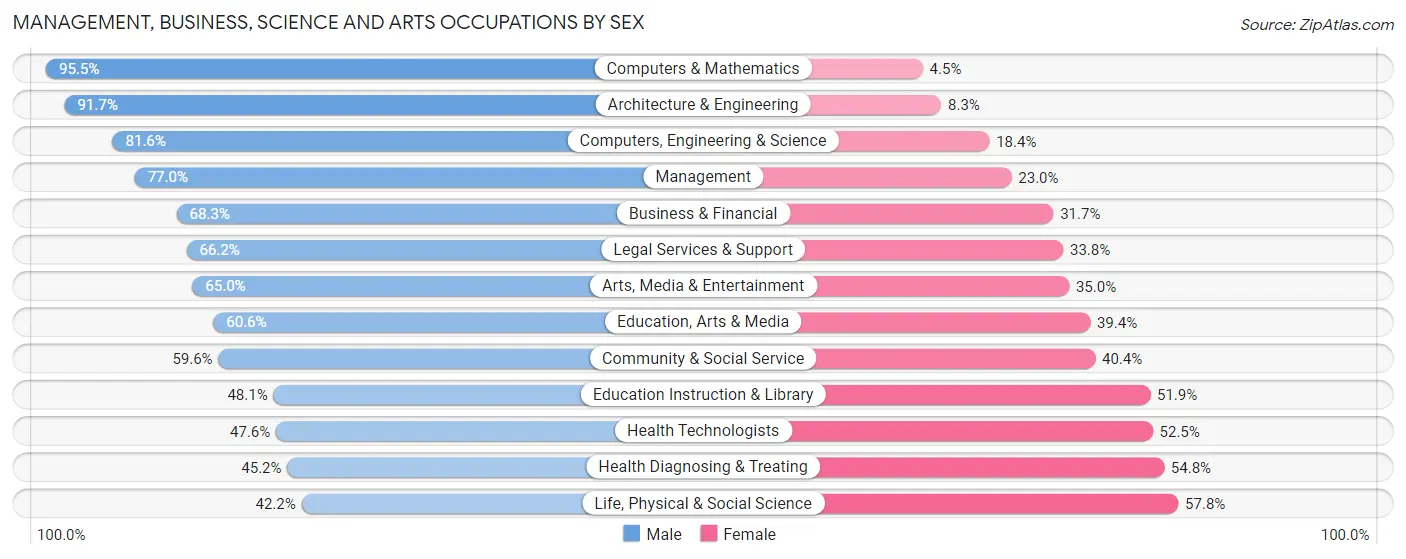
Management, Business, Science and Arts Occupations by Sex
Within the Management, Business, Science and Arts occupations in Rancho Mirage, the most male-oriented occupations are Computers & Mathematics (95.5%), Architecture & Engineering (91.7%), and Computers, Engineering & Science (81.6%), while the most female-oriented occupations are Life, Physical & Social Science (57.8%), Health Diagnosing & Treating (54.8%), and Health Technologists (52.4%).
| Occupation | Male | Female |
| Management | 811 (77.0%) | 242 (23.0%) |
| Business & Financial | 198 (68.3%) | 92 (31.7%) |
| Computers, Engineering & Science | 160 (81.6%) | 36 (18.4%) |
| Computers & Mathematics | 64 (95.5%) | 3 (4.5%) |
| Architecture & Engineering | 77 (91.7%) | 7 (8.3%) |
| Life, Physical & Social Science | 19 (42.2%) | 26 (57.8%) |
| Community & Social Service | 623 (59.6%) | 423 (40.4%) |
| Education, Arts & Media | 140 (60.6%) | 91 (39.4%) |
| Legal Services & Support | 100 (66.2%) | 51 (33.8%) |
| Education Instruction & Library | 138 (48.1%) | 149 (51.9%) |
| Arts, Media & Entertainment | 245 (65.0%) | 132 (35.0%) |
| Health Diagnosing & Treating | 268 (45.2%) | 325 (54.8%) |
| Health Technologists | 233 (47.5%) | 257 (52.4%) |
| Total (Category) | 2,060 (64.8%) | 1,118 (35.2%) |
| Total (Overall) | 3,546 (60.8%) | 2,289 (39.2%) |
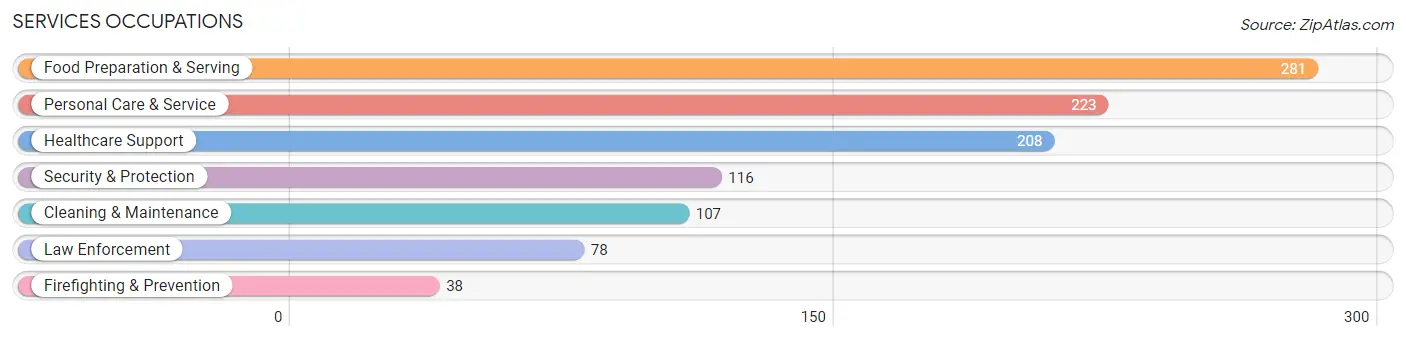
Services Occupations
The most common Services occupations in Rancho Mirage are Food Preparation & Serving (281 | 4.8%), Personal Care & Service (223 | 3.8%), Healthcare Support (208 | 3.6%), Security & Protection (116 | 2.0%), and Cleaning & Maintenance (107 | 1.8%).
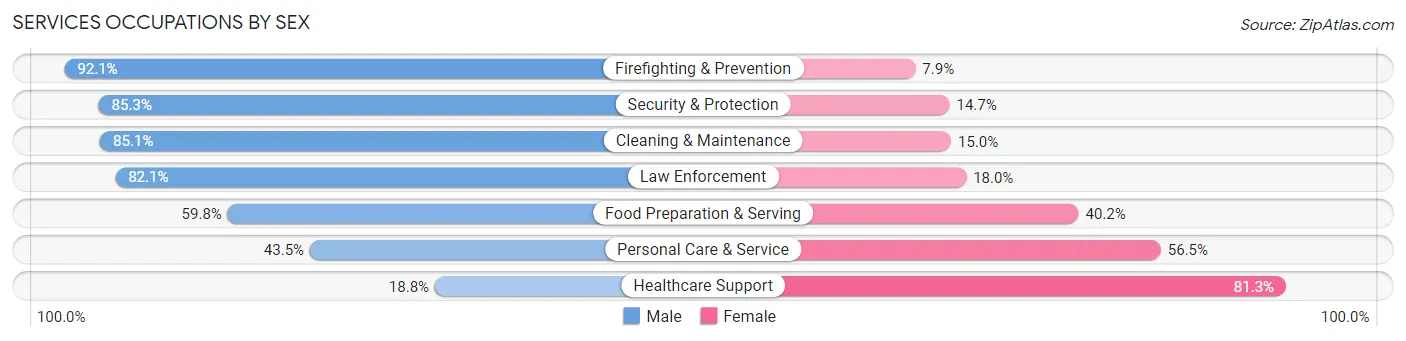
Services Occupations by Sex
Within the Services occupations in Rancho Mirage, the most male-oriented occupations are Firefighting & Prevention (92.1%), Security & Protection (85.3%), and Cleaning & Maintenance (85.1%), while the most female-oriented occupations are Healthcare Support (81.2%), Personal Care & Service (56.5%), and Food Preparation & Serving (40.2%).
| Occupation | Male | Female |
| Healthcare Support | 39 (18.8%) | 169 (81.2%) |
| Security & Protection | 99 (85.3%) | 17 (14.7%) |
| Firefighting & Prevention | 35 (92.1%) | 3 (7.9%) |
| Law Enforcement | 64 (82.1%) | 14 (17.9%) |
| Food Preparation & Serving | 168 (59.8%) | 113 (40.2%) |
| Cleaning & Maintenance | 91 (85.1%) | 16 (14.9%) |
| Personal Care & Service | 97 (43.5%) | 126 (56.5%) |
| Total (Category) | 494 (52.8%) | 441 (47.2%) |
| Total (Overall) | 3,546 (60.8%) | 2,289 (39.2%) |
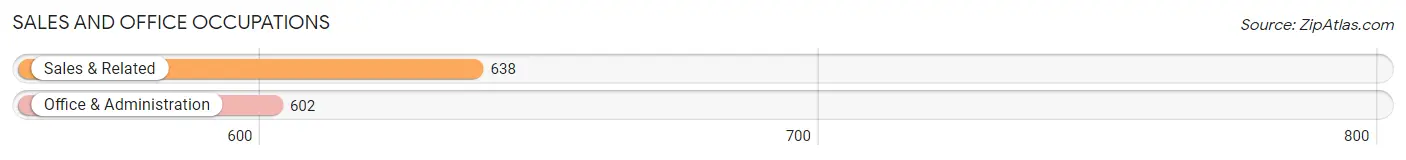
Sales and Office Occupations
The most common Sales and Office occupations in Rancho Mirage are Sales & Related (638 | 10.9%), and Office & Administration (602 | 10.3%).
Sales and Office Occupations by Sex
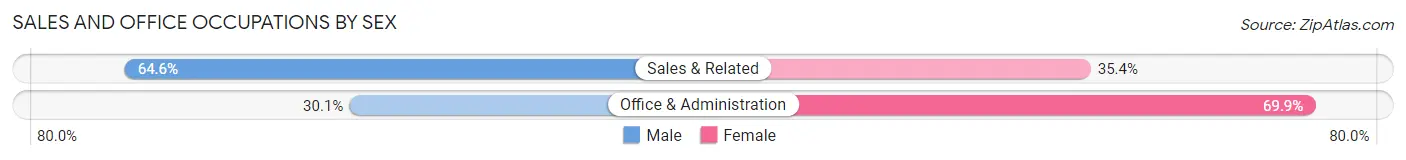
| Occupation | Male | Female |
| Sales & Related | 412 (64.6%) | 226 (35.4%) |
| Office & Administration | 181 (30.1%) | 421 (69.9%) |
| Total (Category) | 593 (47.8%) | 647 (52.2%) |
| Total (Overall) | 3,546 (60.8%) | 2,289 (39.2%) |
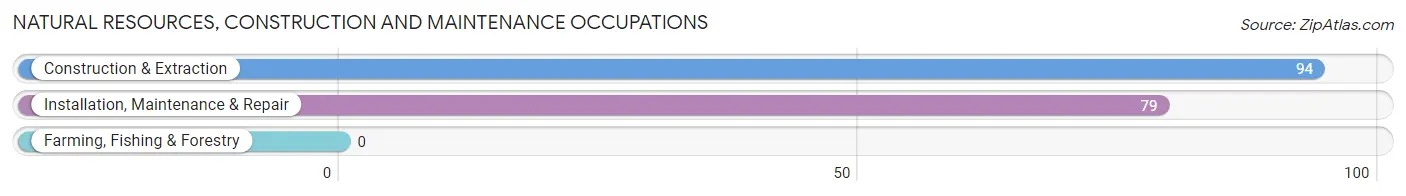
Natural Resources, Construction and Maintenance Occupations
The most common Natural Resources, Construction and Maintenance occupations in Rancho Mirage are Construction & Extraction (94 | 1.6%), and Installation, Maintenance & Repair (79 | 1.3%).
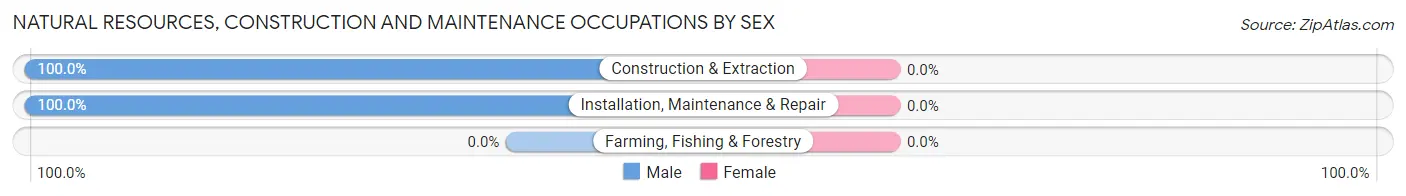
Natural Resources, Construction and Maintenance Occupations by Sex
| Occupation | Male | Female |
| Farming, Fishing & Forestry | 0 (0.0%) | 0 (0.0%) |
| Construction & Extraction | 94 (100.0%) | 0 (0.0%) |
| Installation, Maintenance & Repair | 79 (100.0%) | 0 (0.0%) |
| Total (Category) | 173 (100.0%) | 0 (0.0%) |
| Total (Overall) | 3,546 (60.8%) | 2,289 (39.2%) |
Production, Transportation and Moving Occupations
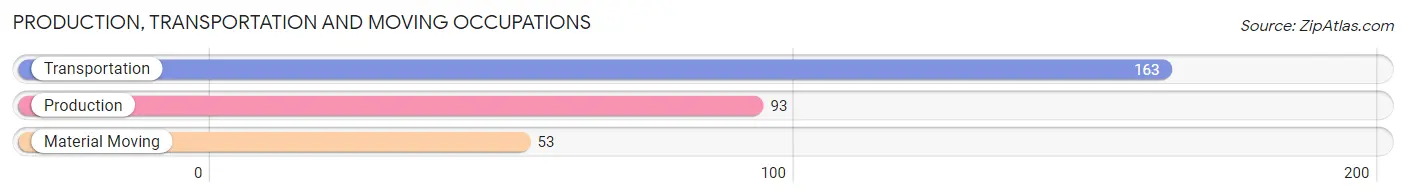
The most common Production, Transportation and Moving occupations in Rancho Mirage are Transportation (163 | 2.8%), Production (93 | 1.6%), and Material Moving (53 | 0.9%).
Production, Transportation and Moving Occupations by Sex
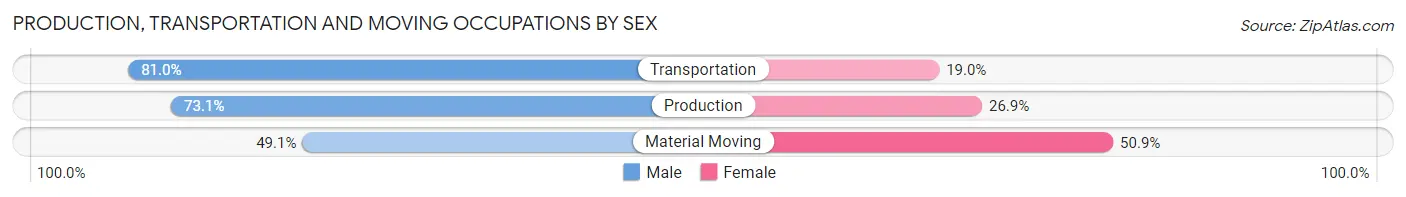
| Occupation | Male | Female |
| Production | 68 (73.1%) | 25 (26.9%) |
| Transportation | 132 (81.0%) | 31 (19.0%) |
| Material Moving | 26 (49.1%) | 27 (50.9%) |
| Total (Category) | 226 (73.1%) | 83 (26.9%) |
| Total (Overall) | 3,546 (60.8%) | 2,289 (39.2%) |
Employment Industries by Sex in Rancho Mirage
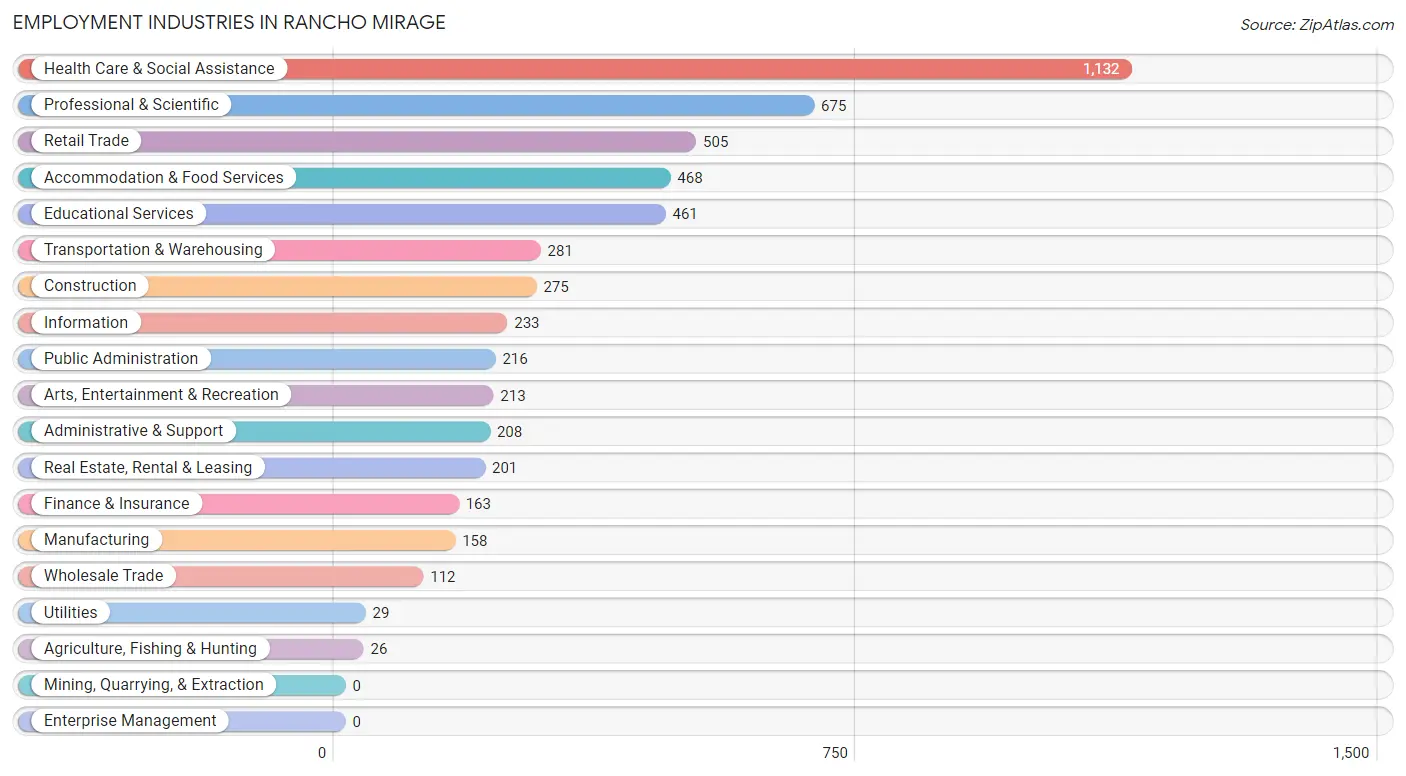
Employment Industries in Rancho Mirage
The major employment industries in Rancho Mirage include Health Care & Social Assistance (1,132 | 19.4%), Professional & Scientific (675 | 11.6%), Retail Trade (505 | 8.6%), Accommodation & Food Services (468 | 8.0%), and Educational Services (461 | 7.9%).
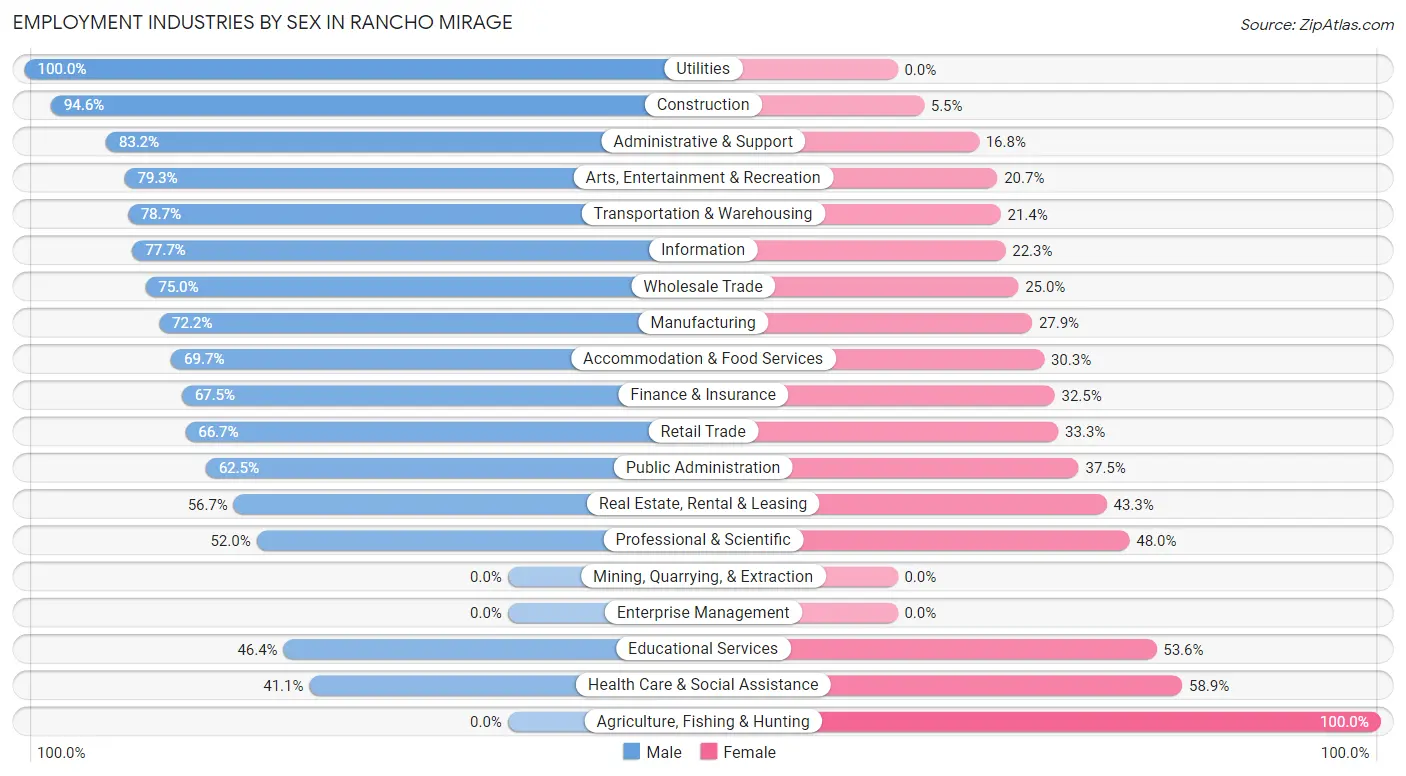
Employment Industries by Sex in Rancho Mirage
The Rancho Mirage industries that see more men than women are Utilities (100.0%), Construction (94.6%), and Administrative & Support (83.2%), whereas the industries that tend to have a higher number of women are Agriculture, Fishing & Hunting (100.0%), Health Care & Social Assistance (58.9%), and Educational Services (53.6%).
| Industry | Male | Female |
| Agriculture, Fishing & Hunting | 0 (0.0%) | 26 (100.0%) |
| Mining, Quarrying, & Extraction | 0 (0.0%) | 0 (0.0%) |
| Construction | 260 (94.6%) | 15 (5.4%) |
| Manufacturing | 114 (72.2%) | 44 (27.9%) |
| Wholesale Trade | 84 (75.0%) | 28 (25.0%) |
| Retail Trade | 337 (66.7%) | 168 (33.3%) |
| Transportation & Warehousing | 221 (78.6%) | 60 (21.3%) |
| Utilities | 29 (100.0%) | 0 (0.0%) |
| Information | 181 (77.7%) | 52 (22.3%) |
| Finance & Insurance | 110 (67.5%) | 53 (32.5%) |
| Real Estate, Rental & Leasing | 114 (56.7%) | 87 (43.3%) |
| Professional & Scientific | 351 (52.0%) | 324 (48.0%) |
| Enterprise Management | 0 (0.0%) | 0 (0.0%) |
| Administrative & Support | 173 (83.2%) | 35 (16.8%) |
| Educational Services | 214 (46.4%) | 247 (53.6%) |
| Health Care & Social Assistance | 465 (41.1%) | 667 (58.9%) |
| Arts, Entertainment & Recreation | 169 (79.3%) | 44 (20.7%) |
| Accommodation & Food Services | 326 (69.7%) | 142 (30.3%) |
| Public Administration | 135 (62.5%) | 81 (37.5%) |
| Total | 3,546 (60.8%) | 2,289 (39.2%) |
Education in Rancho Mirage
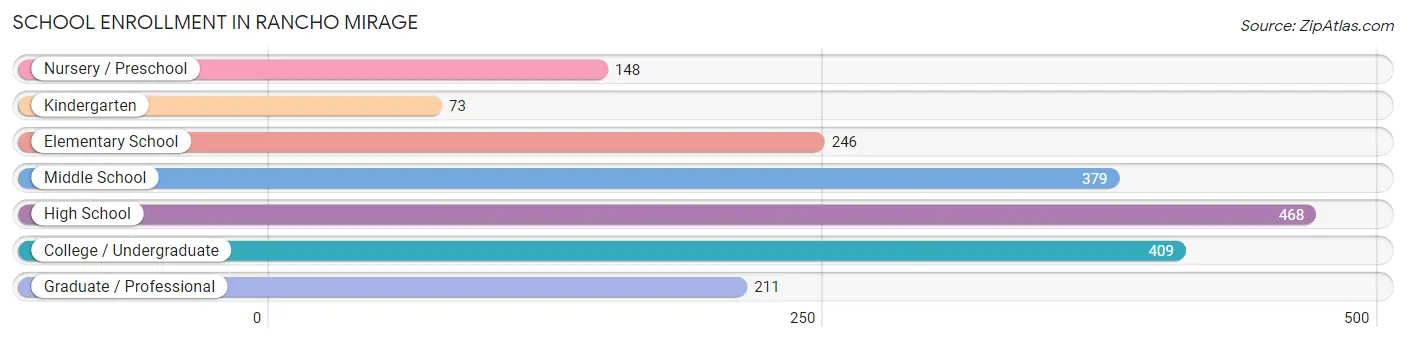
School Enrollment in Rancho Mirage
The most common levels of schooling among the 1,934 students in Rancho Mirage are high school (468 | 24.2%), college / undergraduate (409 | 21.1%), and middle school (379 | 19.6%).
| School Level | # Students | % Students |
| Nursery / Preschool | 148 | 7.6% |
| Kindergarten | 73 | 3.8% |
| Elementary School | 246 | 12.7% |
| Middle School | 379 | 19.6% |
| High School | 468 | 24.2% |
| College / Undergraduate | 409 | 21.1% |
| Graduate / Professional | 211 | 10.9% |
| Total | 1,934 | 100.0% |
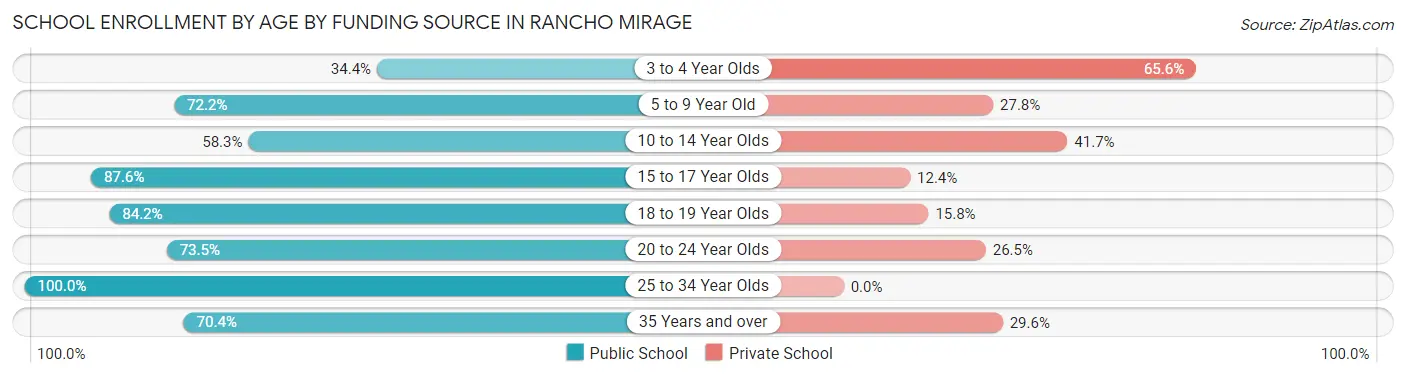
School Enrollment by Age by Funding Source in Rancho Mirage
Out of a total of 1,934 students who are enrolled in schools in Rancho Mirage, 547 (28.3%) attend a private institution, while the remaining 1,387 (71.7%) are enrolled in public schools. The age group of 3 to 4 year olds has the highest likelihood of being enrolled in private schools, with 84 (65.6% in the age bracket) enrolled. Conversely, the age group of 25 to 34 year olds has the lowest likelihood of being enrolled in a private school, with 145 (100.0% in the age bracket) attending a public institution.
| Age Bracket | Public School | Private School |
| 3 to 4 Year Olds | 44 (34.4%) | 84 (65.6%) |
| 5 to 9 Year Old | 241 (72.2%) | 93 (27.8%) |
| 10 to 14 Year Olds | 273 (58.3%) | 195 (41.7%) |
| 15 to 17 Year Olds | 326 (87.6%) | 46 (12.4%) |
| 18 to 19 Year Olds | 80 (84.2%) | 15 (15.8%) |
| 20 to 24 Year Olds | 50 (73.5%) | 18 (26.5%) |
| 25 to 34 Year Olds | 145 (100.0%) | 0 (0.0%) |
| 35 Years and over | 228 (70.4%) | 96 (29.6%) |
| Total | 1,387 (71.7%) | 547 (28.3%) |
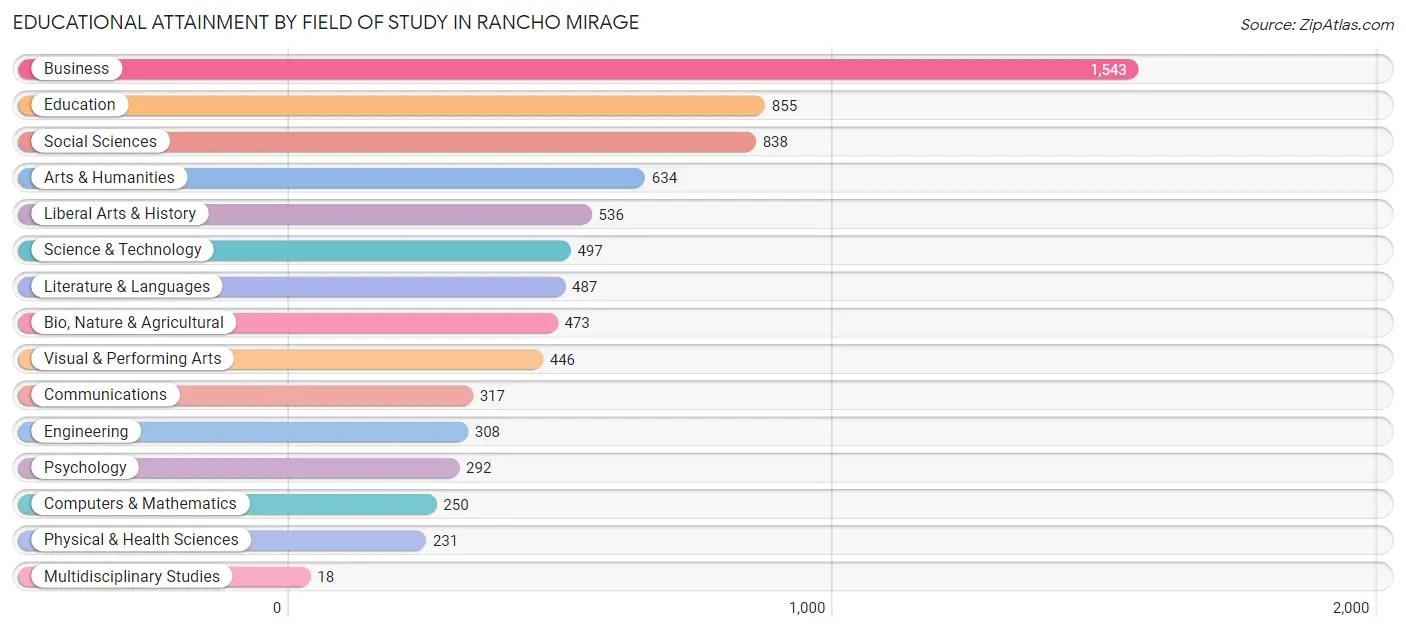
Educational Attainment by Field of Study in Rancho Mirage
Business (1,543 | 20.0%), education (855 | 11.1%), social sciences (838 | 10.8%), arts & humanities (634 | 8.2%), and liberal arts & history (536 | 6.9%) are the most common fields of study among 7,725 individuals in Rancho Mirage who have obtained a bachelor's degree or higher.
| Field of Study | # Graduates | % Graduates |
| Computers & Mathematics | 250 | 3.2% |
| Bio, Nature & Agricultural | 473 | 6.1% |
| Physical & Health Sciences | 231 | 3.0% |
| Psychology | 292 | 3.8% |
| Social Sciences | 838 | 10.8% |
| Engineering | 308 | 4.0% |
| Multidisciplinary Studies | 18 | 0.2% |
| Science & Technology | 497 | 6.4% |
| Business | 1,543 | 20.0% |
| Education | 855 | 11.1% |
| Literature & Languages | 487 | 6.3% |
| Liberal Arts & History | 536 | 6.9% |
| Visual & Performing Arts | 446 | 5.8% |
| Communications | 317 | 4.1% |
| Arts & Humanities | 634 | 8.2% |
| Total | 7,725 | 100.0% |
Transportation & Commute in Rancho Mirage
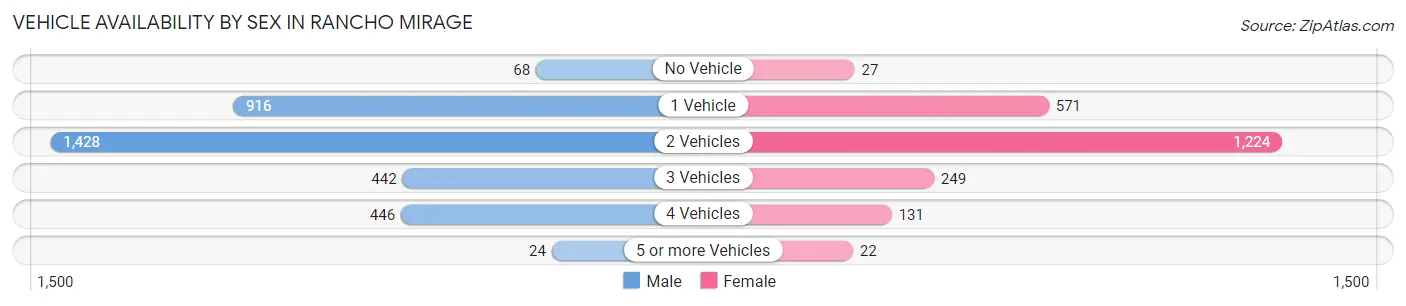
Vehicle Availability by Sex in Rancho Mirage
The most prevalent vehicle ownership categories in Rancho Mirage are males with 2 vehicles (1,428, accounting for 43.0%) and females with 2 vehicles (1,224, making up 64.2%).
| Vehicles Available | Male | Female |
| No Vehicle | 68 (2.1%) | 27 (1.2%) |
| 1 Vehicle | 916 (27.6%) | 571 (25.7%) |
| 2 Vehicles | 1,428 (43.0%) | 1,224 (55.0%) |
| 3 Vehicles | 442 (13.3%) | 249 (11.2%) |
| 4 Vehicles | 446 (13.4%) | 131 (5.9%) |
| 5 or more Vehicles | 24 (0.7%) | 22 (1.0%) |
| Total | 3,324 (100.0%) | 2,224 (100.0%) |
Commute Time in Rancho Mirage
The most frequently occuring commute durations in Rancho Mirage are 20 to 24 minutes (844 commuters, 19.7%), 10 to 14 minutes (811 commuters, 19.0%), and 15 to 19 minutes (698 commuters, 16.3%).
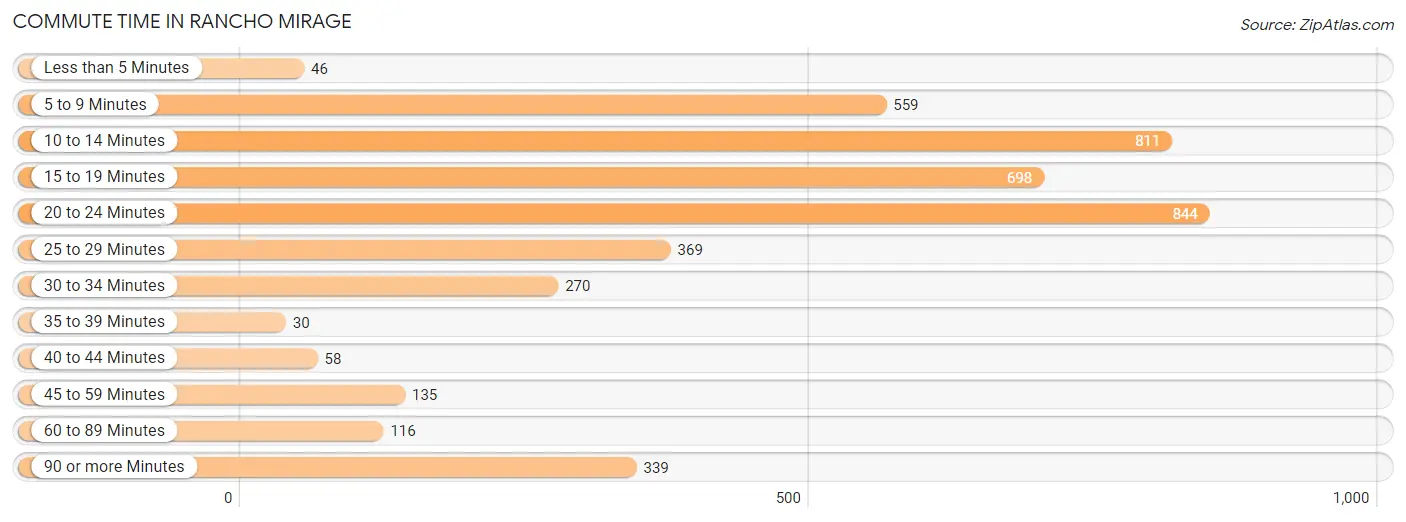
| Commute Time | # Commuters | % Commuters |
| Less than 5 Minutes | 46 | 1.1% |
| 5 to 9 Minutes | 559 | 13.1% |
| 10 to 14 Minutes | 811 | 19.0% |
| 15 to 19 Minutes | 698 | 16.3% |
| 20 to 24 Minutes | 844 | 19.7% |
| 25 to 29 Minutes | 369 | 8.6% |
| 30 to 34 Minutes | 270 | 6.3% |
| 35 to 39 Minutes | 30 | 0.7% |
| 40 to 44 Minutes | 58 | 1.4% |
| 45 to 59 Minutes | 135 | 3.2% |
| 60 to 89 Minutes | 116 | 2.7% |
| 90 or more Minutes | 339 | 7.9% |
Commute Time by Sex in Rancho Mirage
The most common commute times in Rancho Mirage are 20 to 24 minutes (489 commuters, 18.8%) for males and 10 to 14 minutes (360 commuters, 21.6%) for females.
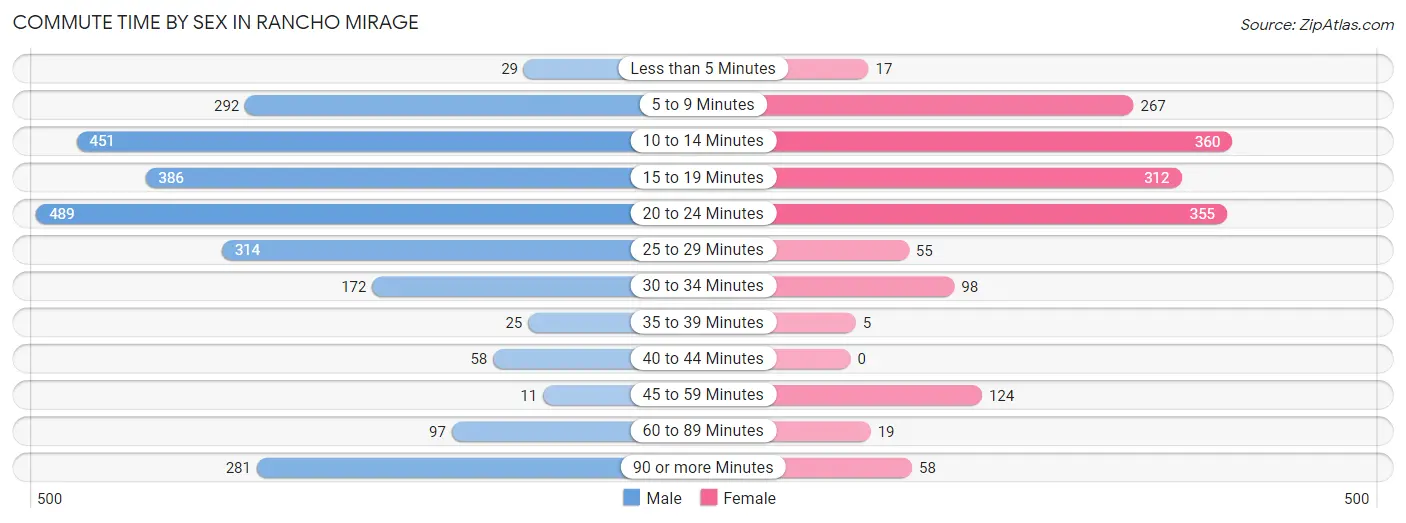
| Commute Time | Male | Female |
| Less than 5 Minutes | 29 (1.1%) | 17 (1.0%) |
| 5 to 9 Minutes | 292 (11.2%) | 267 (16.0%) |
| 10 to 14 Minutes | 451 (17.3%) | 360 (21.6%) |
| 15 to 19 Minutes | 386 (14.8%) | 312 (18.7%) |
| 20 to 24 Minutes | 489 (18.8%) | 355 (21.3%) |
| 25 to 29 Minutes | 314 (12.0%) | 55 (3.3%) |
| 30 to 34 Minutes | 172 (6.6%) | 98 (5.9%) |
| 35 to 39 Minutes | 25 (1.0%) | 5 (0.3%) |
| 40 to 44 Minutes | 58 (2.2%) | 0 (0.0%) |
| 45 to 59 Minutes | 11 (0.4%) | 124 (7.4%) |
| 60 to 89 Minutes | 97 (3.7%) | 19 (1.1%) |
| 90 or more Minutes | 281 (10.8%) | 58 (3.5%) |
Time of Departure to Work by Sex in Rancho Mirage
The most frequent times of departure to work in Rancho Mirage are 8:00 AM to 8:29 AM (407, 15.6%) for males and 7:30 AM to 7:59 AM (282, 16.9%) for females.
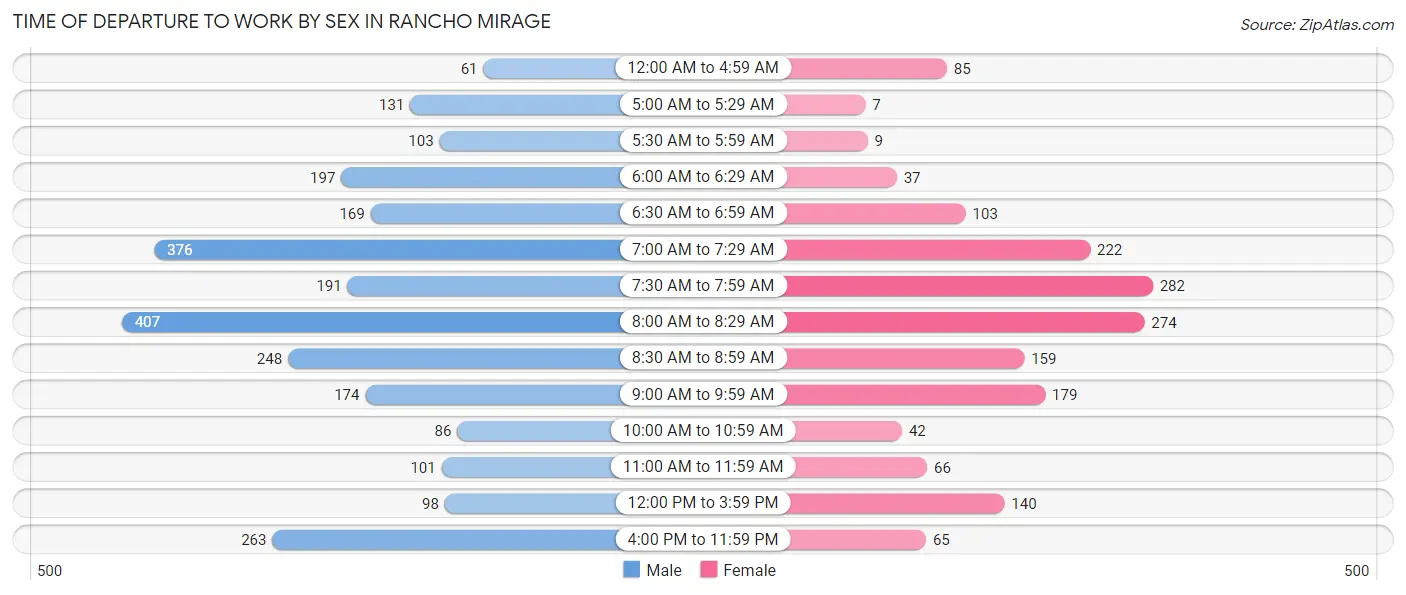
| Time of Departure | Male | Female |
| 12:00 AM to 4:59 AM | 61 (2.3%) | 85 (5.1%) |
| 5:00 AM to 5:29 AM | 131 (5.0%) | 7 (0.4%) |
| 5:30 AM to 5:59 AM | 103 (4.0%) | 9 (0.5%) |
| 6:00 AM to 6:29 AM | 197 (7.6%) | 37 (2.2%) |
| 6:30 AM to 6:59 AM | 169 (6.5%) | 103 (6.2%) |
| 7:00 AM to 7:29 AM | 376 (14.4%) | 222 (13.3%) |
| 7:30 AM to 7:59 AM | 191 (7.3%) | 282 (16.9%) |
| 8:00 AM to 8:29 AM | 407 (15.6%) | 274 (16.4%) |
| 8:30 AM to 8:59 AM | 248 (9.5%) | 159 (9.5%) |
| 9:00 AM to 9:59 AM | 174 (6.7%) | 179 (10.7%) |
| 10:00 AM to 10:59 AM | 86 (3.3%) | 42 (2.5%) |
| 11:00 AM to 11:59 AM | 101 (3.9%) | 66 (4.0%) |
| 12:00 PM to 3:59 PM | 98 (3.8%) | 140 (8.4%) |
| 4:00 PM to 11:59 PM | 263 (10.1%) | 65 (3.9%) |
| Total | 2,605 (100.0%) | 1,670 (100.0%) |
Housing Occupancy in Rancho Mirage
Occupancy by Ownership in Rancho Mirage
Of the total 8,735 dwellings in Rancho Mirage, owner-occupied units account for 7,100 (81.3%), while renter-occupied units make up 1,635 (18.7%).
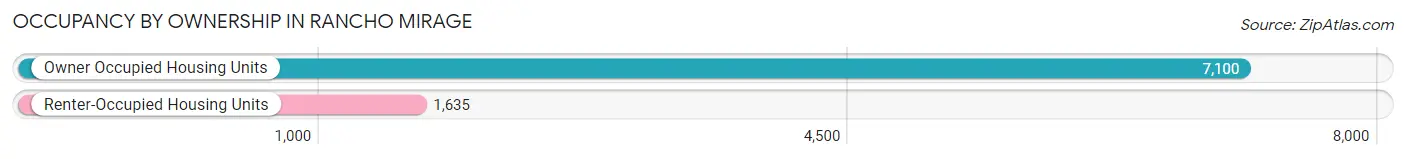
| Occupancy | # Housing Units | % Housing Units |
| Owner Occupied Housing Units | 7,100 | 81.3% |
| Renter-Occupied Housing Units | 1,635 | 18.7% |
| Total Occupied Housing Units | 8,735 | 100.0% |
Occupancy by Household Size in Rancho Mirage
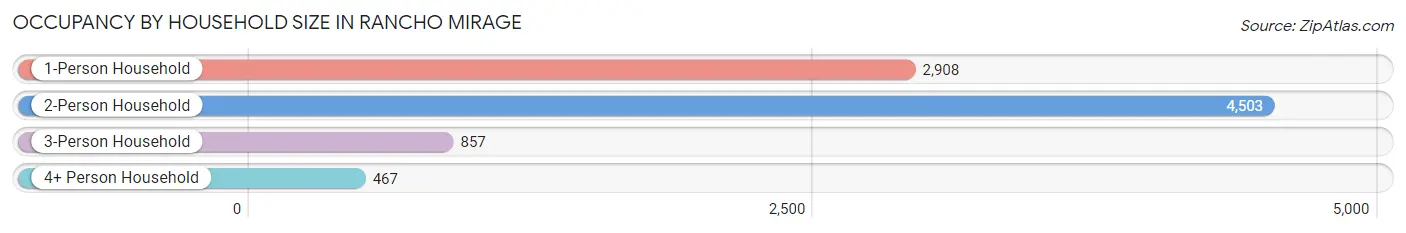
| Household Size | # Housing Units | % Housing Units |
| 1-Person Household | 2,908 | 33.3% |
| 2-Person Household | 4,503 | 51.5% |
| 3-Person Household | 857 | 9.8% |
| 4+ Person Household | 467 | 5.3% |
| Total Housing Units | 8,735 | 100.0% |
Occupancy by Ownership by Household Size in Rancho Mirage
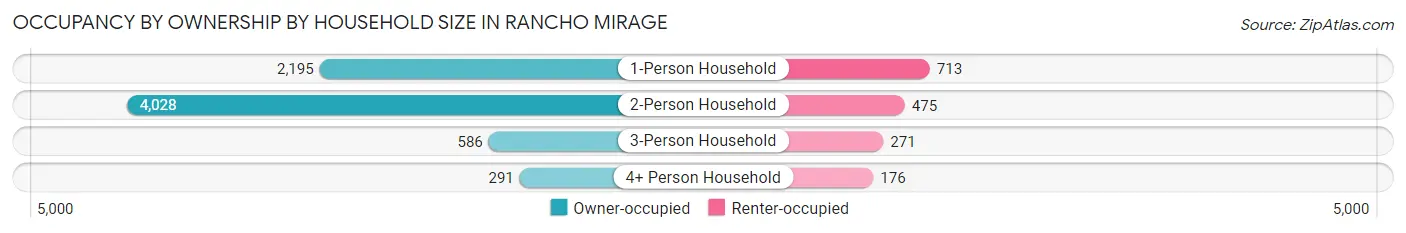
| Household Size | Owner-occupied | Renter-occupied |
| 1-Person Household | 2,195 (75.5%) | 713 (24.5%) |
| 2-Person Household | 4,028 (89.4%) | 475 (10.5%) |
| 3-Person Household | 586 (68.4%) | 271 (31.6%) |
| 4+ Person Household | 291 (62.3%) | 176 (37.7%) |
| Total Housing Units | 7,100 (81.3%) | 1,635 (18.7%) |
Occupancy by Educational Attainment in Rancho Mirage
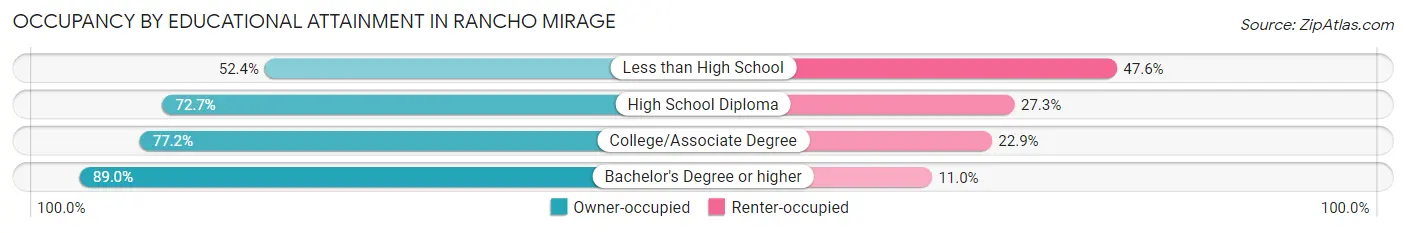
| Household Size | Owner-occupied | Renter-occupied |
| Less than High School | 243 (52.4%) | 221 (47.6%) |
| High School Diploma | 726 (72.7%) | 273 (27.3%) |
| College/Associate Degree | 2,232 (77.1%) | 661 (22.9%) |
| Bachelor's Degree or higher | 3,899 (89.0%) | 480 (11.0%) |
Occupancy by Age of Householder in Rancho Mirage
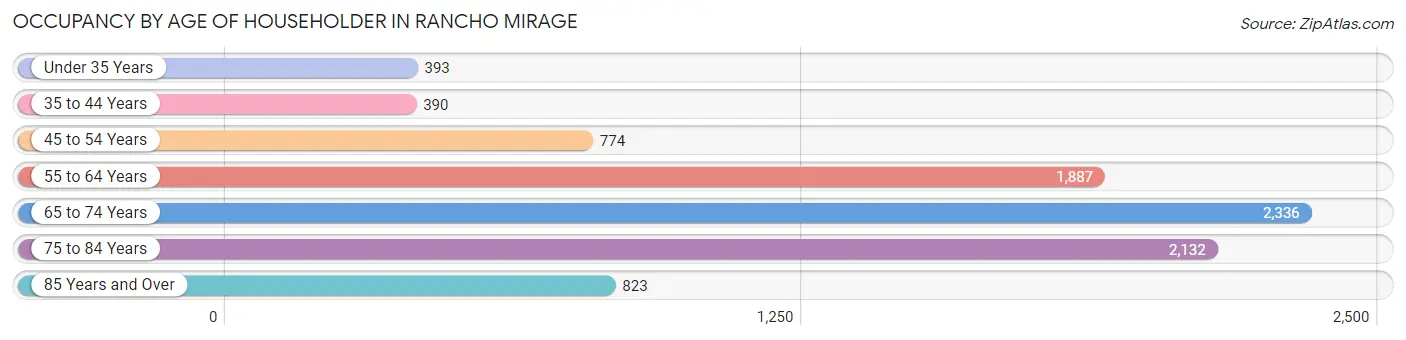
| Age Bracket | # Households | % Households |
| Under 35 Years | 393 | 4.5% |
| 35 to 44 Years | 390 | 4.5% |
| 45 to 54 Years | 774 | 8.9% |
| 55 to 64 Years | 1,887 | 21.6% |
| 65 to 74 Years | 2,336 | 26.7% |
| 75 to 84 Years | 2,132 | 24.4% |
| 85 Years and Over | 823 | 9.4% |
| Total | 8,735 | 100.0% |
Housing Finances in Rancho Mirage
Median Income by Occupancy in Rancho Mirage
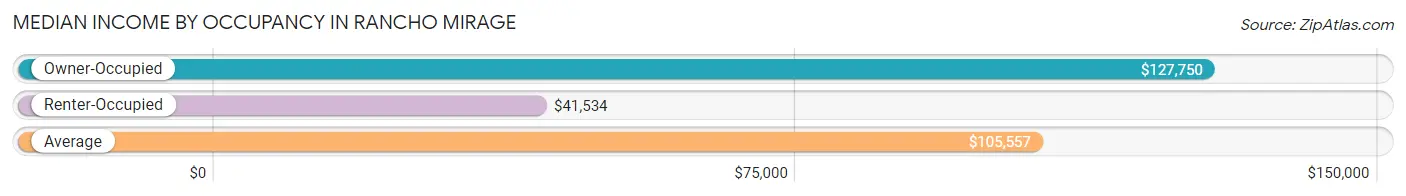
| Occupancy Type | # Households | Median Income |
| Owner-Occupied | 7,100 (81.3%) | $127,750 |
| Renter-Occupied | 1,635 (18.7%) | $41,534 |
| Average | 8,735 (100.0%) | $105,557 |
Occupancy by Householder Income Bracket in Rancho Mirage
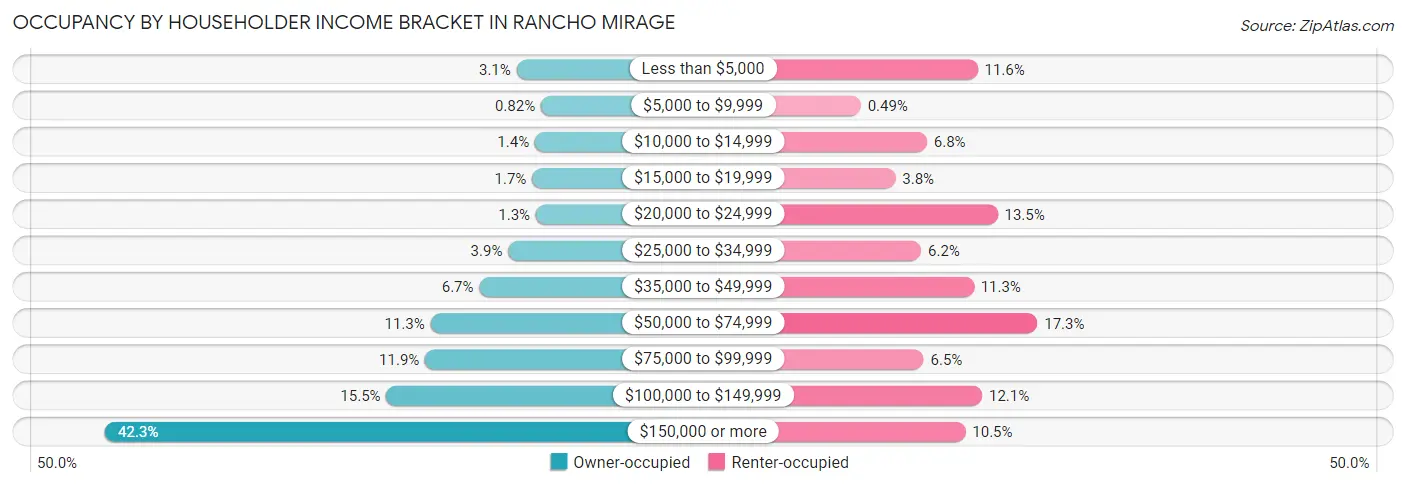
| Income Bracket | Owner-occupied | Renter-occupied |
| Less than $5,000 | 223 (3.1%) | 190 (11.6%) |
| $5,000 to $9,999 | 58 (0.8%) | 8 (0.5%) |
| $10,000 to $14,999 | 99 (1.4%) | 111 (6.8%) |
| $15,000 to $19,999 | 118 (1.7%) | 62 (3.8%) |
| $20,000 to $24,999 | 92 (1.3%) | 221 (13.5%) |
| $25,000 to $34,999 | 280 (3.9%) | 102 (6.2%) |
| $35,000 to $49,999 | 475 (6.7%) | 184 (11.3%) |
| $50,000 to $74,999 | 805 (11.3%) | 283 (17.3%) |
| $75,000 to $99,999 | 841 (11.8%) | 106 (6.5%) |
| $100,000 to $149,999 | 1,103 (15.5%) | 197 (12.0%) |
| $150,000 or more | 3,006 (42.3%) | 171 (10.5%) |
| Total | 7,100 (100.0%) | 1,635 (100.0%) |
Monthly Housing Cost Tiers in Rancho Mirage

| Monthly Cost | Owner-occupied | Renter-occupied |
| Less than $300 | 128 (1.8%) | 38 (2.3%) |
| $300 to $499 | 121 (1.7%) | 99 (6.1%) |
| $500 to $799 | 314 (4.4%) | 172 (10.5%) |
| $800 to $999 | 506 (7.1%) | 128 (7.8%) |
| $1,000 to $1,499 | 1,673 (23.6%) | 179 (11.0%) |
| $1,500 to $1,999 | 951 (13.4%) | 269 (16.5%) |
| $2,000 to $2,499 | 644 (9.1%) | 90 (5.5%) |
| $2,500 to $2,999 | 850 (12.0%) | 70 (4.3%) |
| $3,000 or more | 1,913 (26.9%) | 340 (20.8%) |
| Total | 7,100 (100.0%) | 1,635 (100.0%) |
Physical Housing Characteristics in Rancho Mirage
Housing Structures in Rancho Mirage
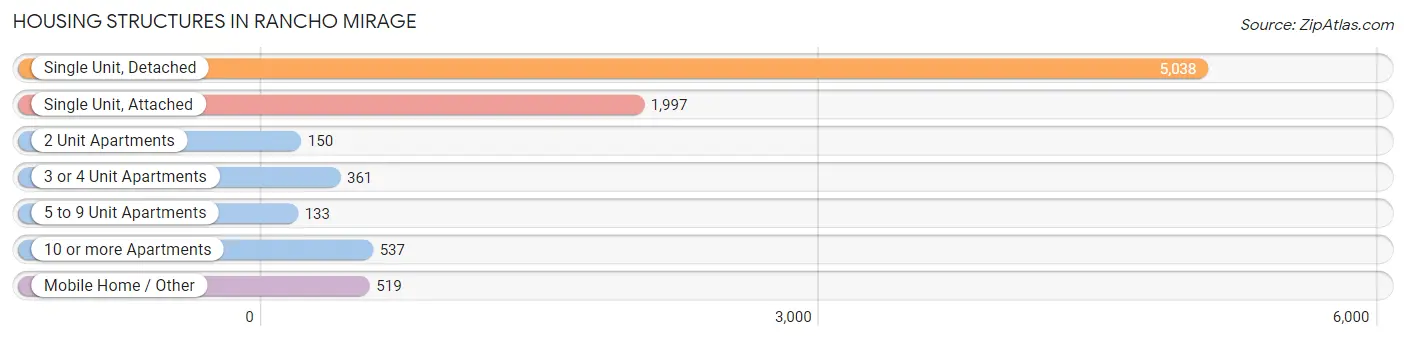
| Structure Type | # Housing Units | % Housing Units |
| Single Unit, Detached | 5,038 | 57.7% |
| Single Unit, Attached | 1,997 | 22.9% |
| 2 Unit Apartments | 150 | 1.7% |
| 3 or 4 Unit Apartments | 361 | 4.1% |
| 5 to 9 Unit Apartments | 133 | 1.5% |
| 10 or more Apartments | 537 | 6.1% |
| Mobile Home / Other | 519 | 5.9% |
| Total | 8,735 | 100.0% |
Housing Structures by Occupancy in Rancho Mirage
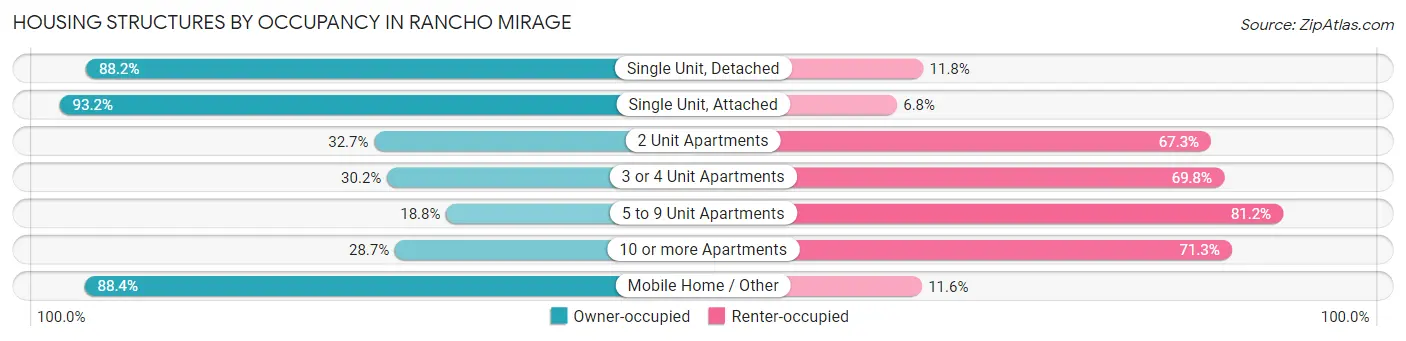
| Structure Type | Owner-occupied | Renter-occupied |
| Single Unit, Detached | 4,442 (88.2%) | 596 (11.8%) |
| Single Unit, Attached | 1,862 (93.2%) | 135 (6.8%) |
| 2 Unit Apartments | 49 (32.7%) | 101 (67.3%) |
| 3 or 4 Unit Apartments | 109 (30.2%) | 252 (69.8%) |
| 5 to 9 Unit Apartments | 25 (18.8%) | 108 (81.2%) |
| 10 or more Apartments | 154 (28.7%) | 383 (71.3%) |
| Mobile Home / Other | 459 (88.4%) | 60 (11.6%) |
| Total | 7,100 (81.3%) | 1,635 (18.7%) |
Housing Structures by Number of Rooms in Rancho Mirage
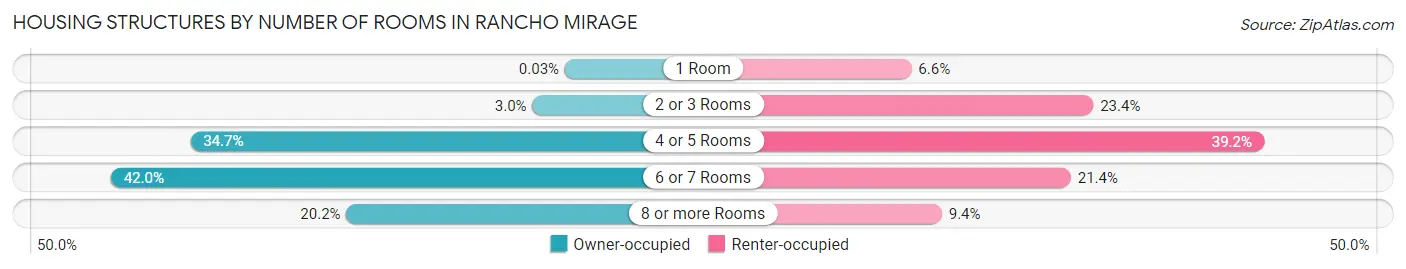
| Number of Rooms | Owner-occupied | Renter-occupied |
| 1 Room | 2 (0.0%) | 108 (6.6%) |
| 2 or 3 Rooms | 215 (3.0%) | 383 (23.4%) |
| 4 or 5 Rooms | 2,462 (34.7%) | 641 (39.2%) |
| 6 or 7 Rooms | 2,984 (42.0%) | 349 (21.3%) |
| 8 or more Rooms | 1,437 (20.2%) | 154 (9.4%) |
| Total | 7,100 (100.0%) | 1,635 (100.0%) |
Housing Structure by Heating Type in Rancho Mirage
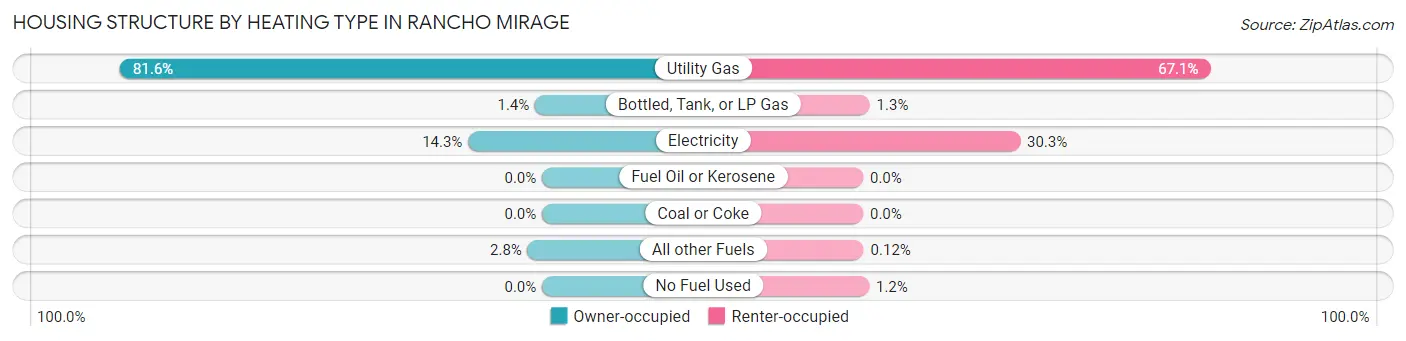
| Heating Type | Owner-occupied | Renter-occupied |
| Utility Gas | 5,792 (81.6%) | 1,097 (67.1%) |
| Bottled, Tank, or LP Gas | 96 (1.3%) | 21 (1.3%) |
| Electricity | 1,014 (14.3%) | 496 (30.3%) |
| Fuel Oil or Kerosene | 0 (0.0%) | 0 (0.0%) |
| Coal or Coke | 0 (0.0%) | 0 (0.0%) |
| All other Fuels | 198 (2.8%) | 2 (0.1%) |
| No Fuel Used | 0 (0.0%) | 19 (1.2%) |
| Total | 7,100 (100.0%) | 1,635 (100.0%) |
Household Vehicle Usage in Rancho Mirage
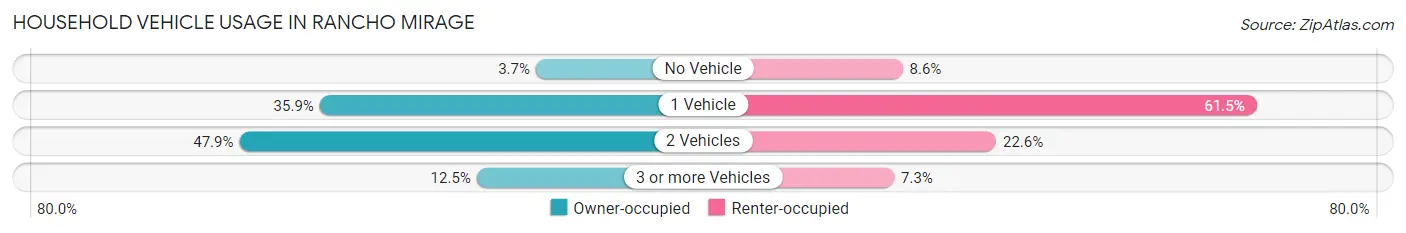
| Vehicles per Household | Owner-occupied | Renter-occupied |
| No Vehicle | 259 (3.6%) | 141 (8.6%) |
| 1 Vehicle | 2,551 (35.9%) | 1,005 (61.5%) |
| 2 Vehicles | 3,404 (47.9%) | 369 (22.6%) |
| 3 or more Vehicles | 886 (12.5%) | 120 (7.3%) |
| Total | 7,100 (100.0%) | 1,635 (100.0%) |
Real Estate & Mortgages in Rancho Mirage
Real Estate and Mortgage Overview in Rancho Mirage
| Characteristic | Without Mortgage | With Mortgage |
| Housing Units | 3,455 | 3,645 |
| Median Property Value | $623,200 | $759,900 |
| Median Household Income | $97,731 | $1,922 |
| Monthly Housing Costs | $1,198 | $1,830 |
| Real Estate Taxes | $6,284 | $21 |
Property Value by Mortgage Status in Rancho Mirage
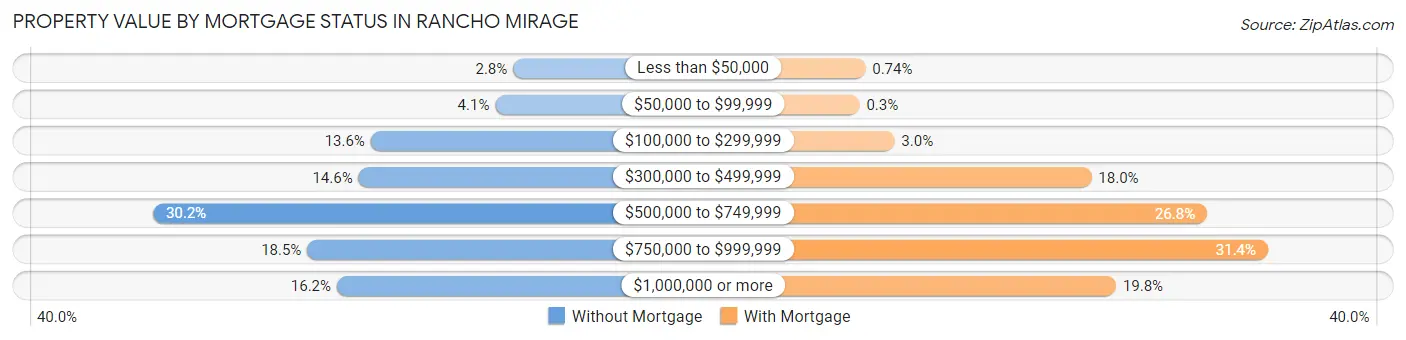
| Property Value | Without Mortgage | With Mortgage |
| Less than $50,000 | 96 (2.8%) | 27 (0.7%) |
| $50,000 to $99,999 | 143 (4.1%) | 11 (0.3%) |
| $100,000 to $299,999 | 471 (13.6%) | 108 (3.0%) |
| $300,000 to $499,999 | 503 (14.6%) | 655 (18.0%) |
| $500,000 to $749,999 | 1,044 (30.2%) | 976 (26.8%) |
| $750,000 to $999,999 | 638 (18.5%) | 1,145 (31.4%) |
| $1,000,000 or more | 560 (16.2%) | 723 (19.8%) |
| Total | 3,455 (100.0%) | 3,645 (100.0%) |
Household Income by Mortgage Status in Rancho Mirage
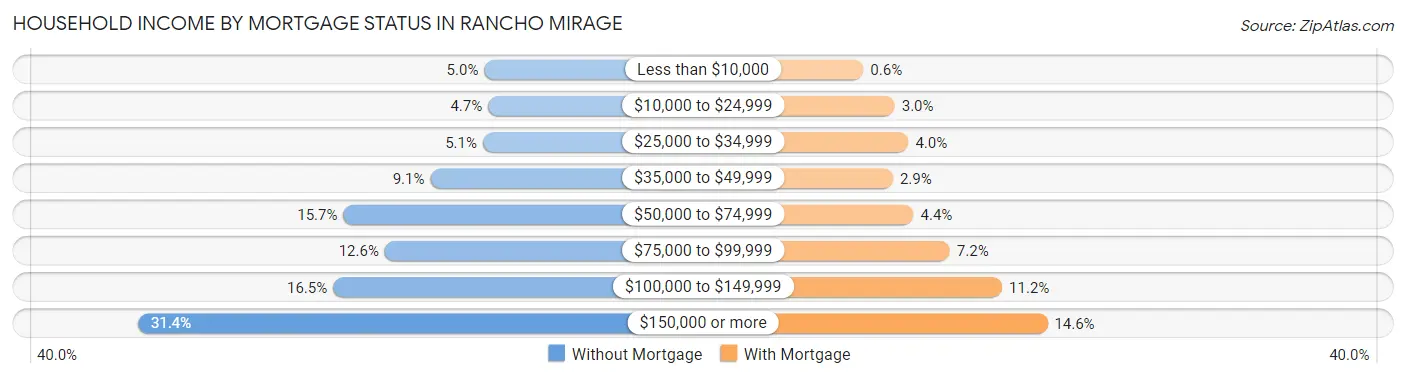
| Household Income | Without Mortgage | With Mortgage |
| Less than $10,000 | 172 (5.0%) | 22 (0.6%) |
| $10,000 to $24,999 | 162 (4.7%) | 109 (3.0%) |
| $25,000 to $34,999 | 176 (5.1%) | 147 (4.0%) |
| $35,000 to $49,999 | 314 (9.1%) | 104 (2.9%) |
| $50,000 to $74,999 | 543 (15.7%) | 161 (4.4%) |
| $75,000 to $99,999 | 434 (12.6%) | 262 (7.2%) |
| $100,000 to $149,999 | 570 (16.5%) | 407 (11.2%) |
| $150,000 or more | 1,084 (31.4%) | 533 (14.6%) |
| Total | 3,455 (100.0%) | 3,645 (100.0%) |
Property Value to Household Income Ratio in Rancho Mirage
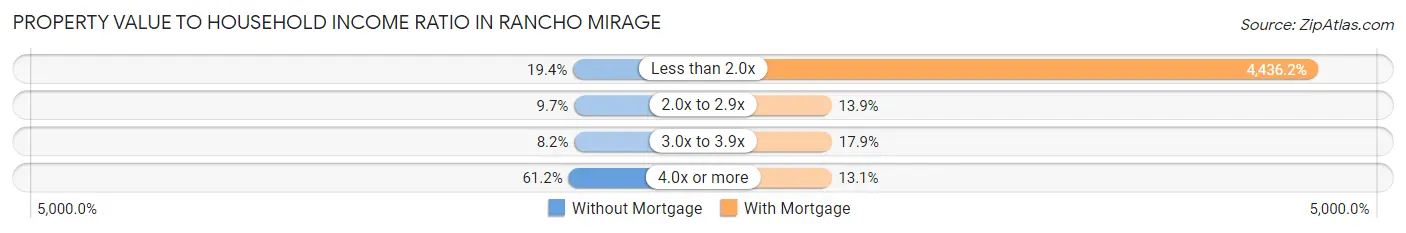
| Value-to-Income Ratio | Without Mortgage | With Mortgage |
| Less than 2.0x | 669 (19.4%) | 161,699 (4,436.2%) |
| 2.0x to 2.9x | 335 (9.7%) | 507 (13.9%) |
| 3.0x to 3.9x | 283 (8.2%) | 653 (17.9%) |
| 4.0x or more | 2,115 (61.2%) | 476 (13.1%) |
| Total | 3,455 (100.0%) | 3,645 (100.0%) |
Real Estate Taxes by Mortgage Status in Rancho Mirage
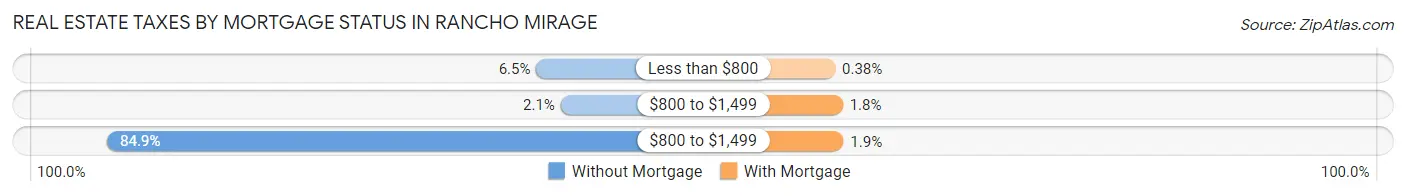
| Property Taxes | Without Mortgage | With Mortgage |
| Less than $800 | 226 (6.5%) | 14 (0.4%) |
| $800 to $1,499 | 72 (2.1%) | 64 (1.8%) |
| $800 to $1,499 | 2,934 (84.9%) | 69 (1.9%) |
| Total | 3,455 (100.0%) | 3,645 (100.0%) |
Health & Disability in Rancho Mirage
Health Insurance Coverage by Age in Rancho Mirage
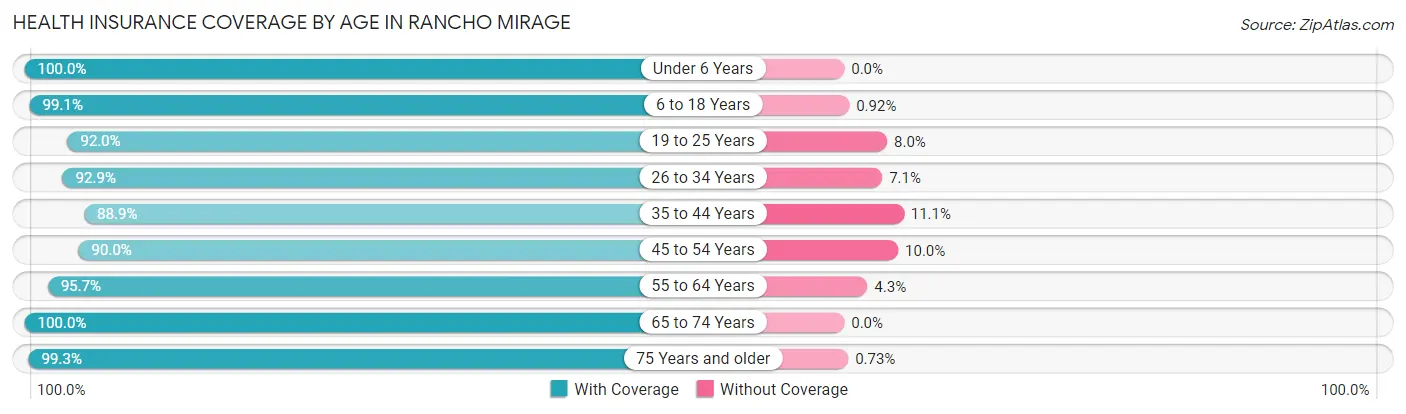
| Age Bracket | With Coverage | Without Coverage |
| Under 6 Years | 344 (100.0%) | 0 (0.0%) |
| 6 to 18 Years | 1,187 (99.1%) | 11 (0.9%) |
| 19 to 25 Years | 369 (92.0%) | 32 (8.0%) |
| 26 to 34 Years | 776 (92.9%) | 59 (7.1%) |
| 35 to 44 Years | 842 (88.9%) | 105 (11.1%) |
| 45 to 54 Years | 1,460 (90.0%) | 163 (10.0%) |
| 55 to 64 Years | 3,154 (95.7%) | 142 (4.3%) |
| 65 to 74 Years | 4,034 (100.0%) | 0 (0.0%) |
| 75 Years and older | 4,350 (99.3%) | 32 (0.7%) |
| Total | 16,516 (96.8%) | 544 (3.2%) |
Health Insurance Coverage by Citizenship Status in Rancho Mirage
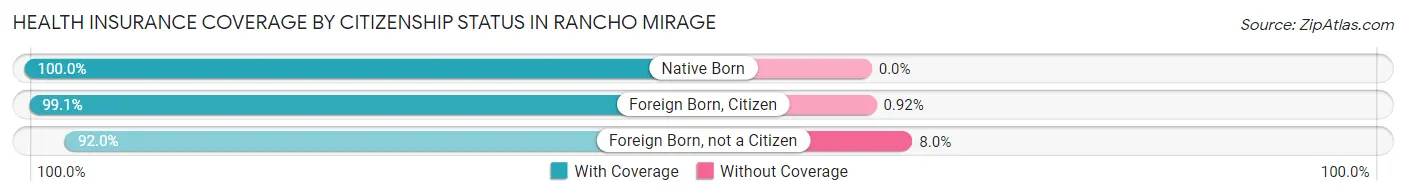
| Citizenship Status | With Coverage | Without Coverage |
| Native Born | 344 (100.0%) | 0 (0.0%) |
| Foreign Born, Citizen | 1,187 (99.1%) | 11 (0.9%) |
| Foreign Born, not a Citizen | 369 (92.0%) | 32 (8.0%) |
Health Insurance Coverage by Household Income in Rancho Mirage
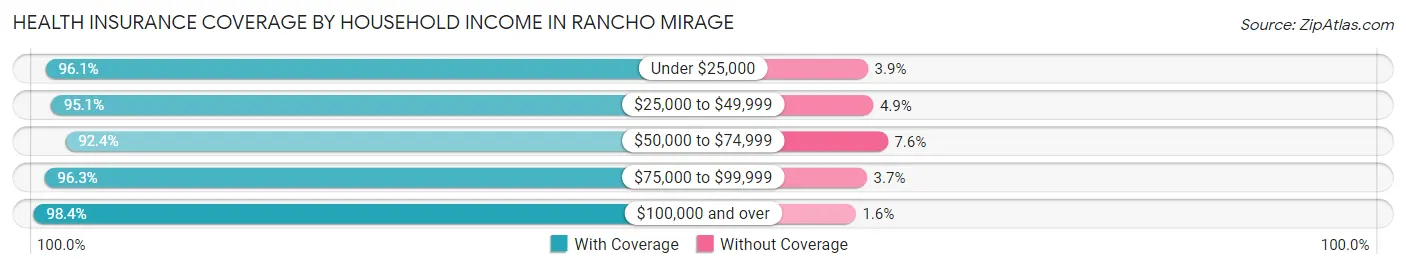
| Household Income | With Coverage | Without Coverage |
| Under $25,000 | 1,770 (96.1%) | 72 (3.9%) |
| $25,000 to $49,999 | 1,719 (95.1%) | 89 (4.9%) |
| $50,000 to $74,999 | 1,975 (92.4%) | 163 (7.6%) |
| $75,000 to $99,999 | 1,629 (96.3%) | 63 (3.7%) |
| $100,000 and over | 9,402 (98.4%) | 156 (1.6%) |
Public vs Private Health Insurance Coverage by Age in Rancho Mirage
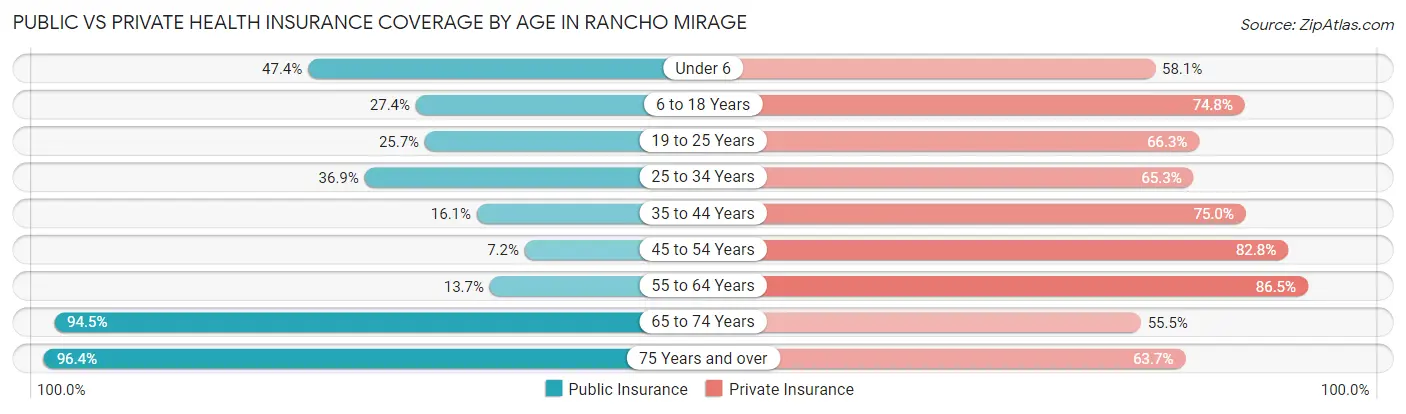
| Age Bracket | Public Insurance | Private Insurance |
| Under 6 | 163 (47.4%) | 200 (58.1%) |
| 6 to 18 Years | 328 (27.4%) | 896 (74.8%) |
| 19 to 25 Years | 103 (25.7%) | 266 (66.3%) |
| 25 to 34 Years | 308 (36.9%) | 545 (65.3%) |
| 35 to 44 Years | 152 (16.1%) | 710 (75.0%) |
| 45 to 54 Years | 116 (7.1%) | 1,344 (82.8%) |
| 55 to 64 Years | 450 (13.7%) | 2,851 (86.5%) |
| 65 to 74 Years | 3,813 (94.5%) | 2,238 (55.5%) |
| 75 Years and over | 4,226 (96.4%) | 2,793 (63.7%) |
| Total | 9,659 (56.6%) | 11,843 (69.4%) |
Disability Status by Sex by Age in Rancho Mirage
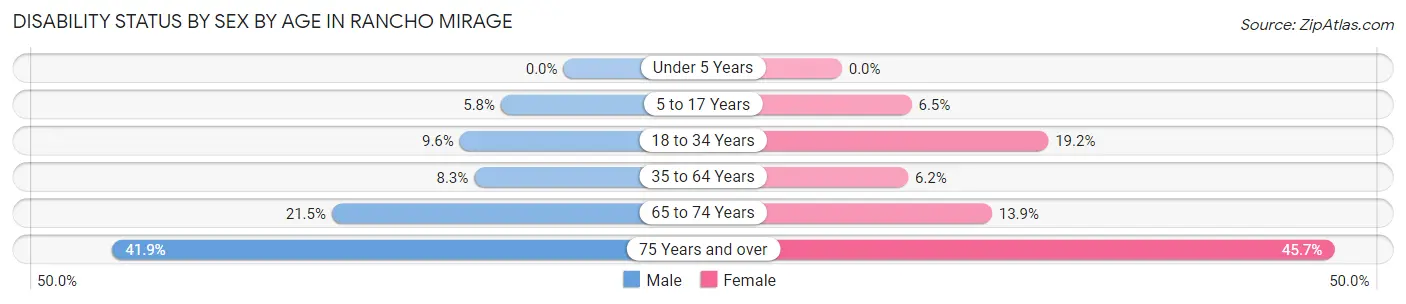
| Age Bracket | Male | Female |
| Under 5 Years | 0 (0.0%) | 0 (0.0%) |
| 5 to 17 Years | 43 (5.8%) | 29 (6.5%) |
| 18 to 34 Years | 78 (9.6%) | 91 (19.2%) |
| 35 to 64 Years | 258 (8.3%) | 169 (6.1%) |
| 65 to 74 Years | 419 (21.5%) | 290 (13.9%) |
| 75 Years and over | 940 (41.8%) | 976 (45.7%) |
Disability Class by Sex by Age in Rancho Mirage
Disability Class: Hearing Difficulty
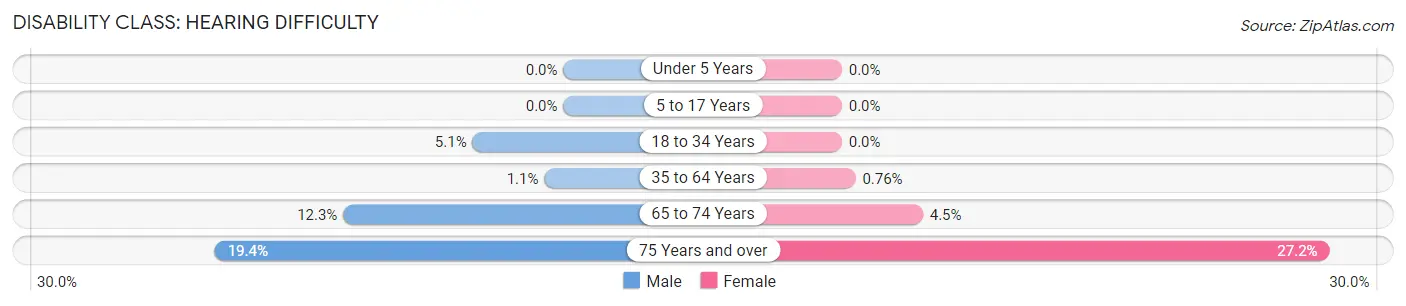
| Age Bracket | Male | Female |
| Under 5 Years | 0 (0.0%) | 0 (0.0%) |
| 5 to 17 Years | 0 (0.0%) | 0 (0.0%) |
| 18 to 34 Years | 41 (5.1%) | 0 (0.0%) |
| 35 to 64 Years | 33 (1.1%) | 21 (0.8%) |
| 65 to 74 Years | 239 (12.3%) | 94 (4.5%) |
| 75 Years and over | 436 (19.4%) | 580 (27.2%) |
Disability Class: Vision Difficulty
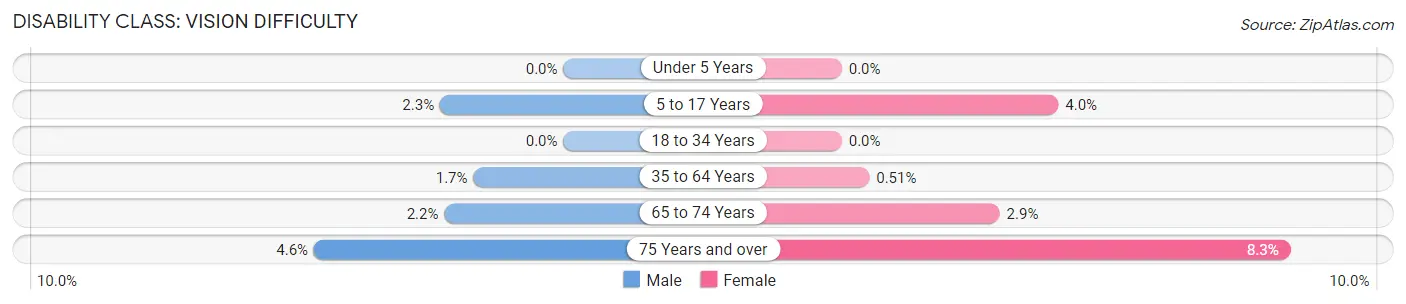
| Age Bracket | Male | Female |
| Under 5 Years | 0 (0.0%) | 0 (0.0%) |
| 5 to 17 Years | 17 (2.3%) | 18 (4.0%) |
| 18 to 34 Years | 0 (0.0%) | 0 (0.0%) |
| 35 to 64 Years | 52 (1.7%) | 14 (0.5%) |
| 65 to 74 Years | 43 (2.2%) | 61 (2.9%) |
| 75 Years and over | 104 (4.6%) | 178 (8.3%) |
Disability Class: Cognitive Difficulty
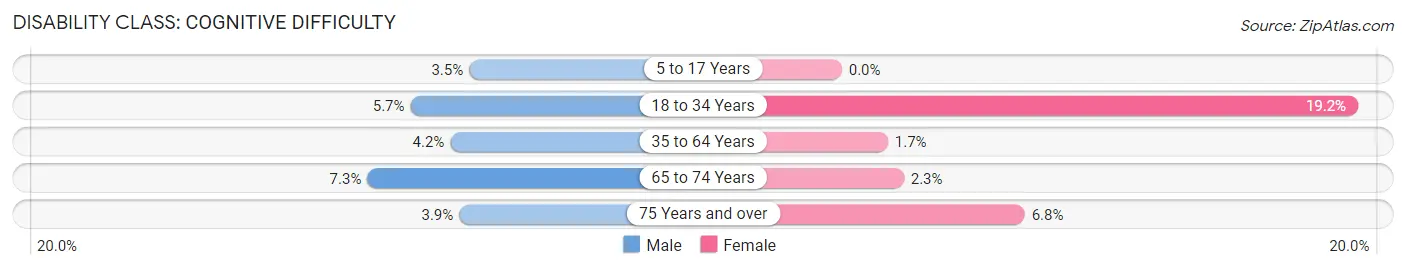
| Age Bracket | Male | Female |
| 5 to 17 Years | 26 (3.5%) | 0 (0.0%) |
| 18 to 34 Years | 46 (5.7%) | 91 (19.2%) |
| 35 to 64 Years | 131 (4.2%) | 47 (1.7%) |
| 65 to 74 Years | 142 (7.3%) | 48 (2.3%) |
| 75 Years and over | 87 (3.9%) | 145 (6.8%) |
Disability Class: Ambulatory Difficulty
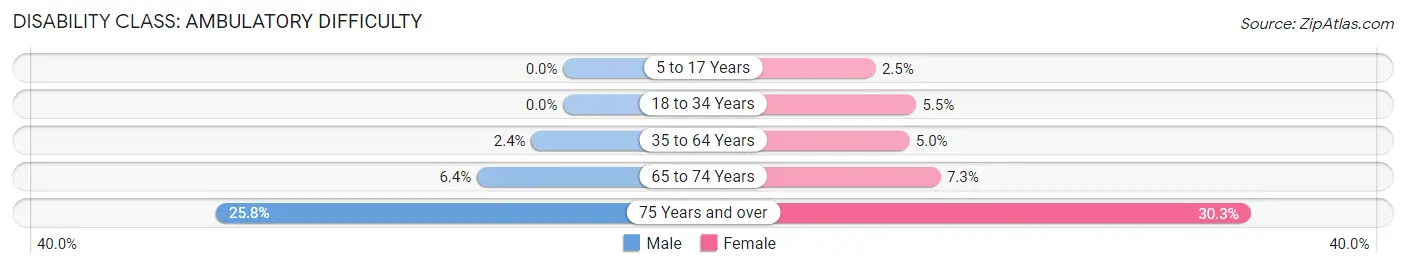
| Age Bracket | Male | Female |
| 5 to 17 Years | 0 (0.0%) | 11 (2.5%) |
| 18 to 34 Years | 0 (0.0%) | 26 (5.5%) |
| 35 to 64 Years | 74 (2.4%) | 137 (5.0%) |
| 65 to 74 Years | 125 (6.4%) | 152 (7.3%) |
| 75 Years and over | 579 (25.8%) | 648 (30.3%) |
Disability Class: Self-Care Difficulty
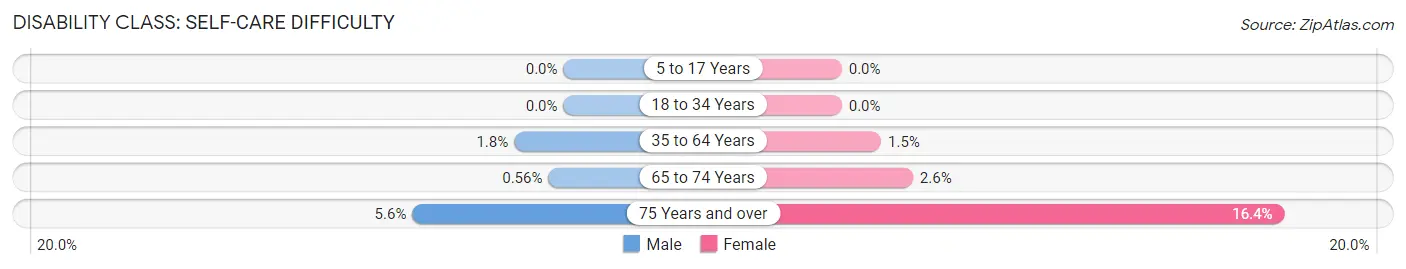
| Age Bracket | Male | Female |
| 5 to 17 Years | 0 (0.0%) | 0 (0.0%) |
| 18 to 34 Years | 0 (0.0%) | 0 (0.0%) |
| 35 to 64 Years | 57 (1.8%) | 40 (1.5%) |
| 65 to 74 Years | 11 (0.6%) | 55 (2.6%) |
| 75 Years and over | 126 (5.6%) | 351 (16.4%) |
Technology Access in Rancho Mirage
Computing Device Access in Rancho Mirage
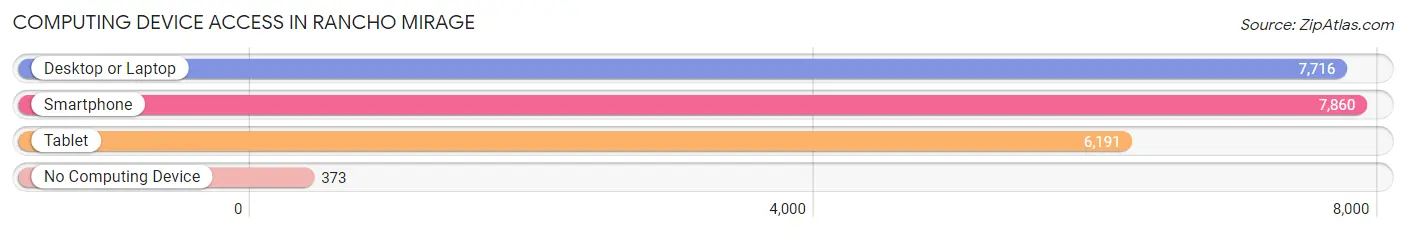
| Device Type | # Households | % Households |
| Desktop or Laptop | 7,716 | 88.3% |
| Smartphone | 7,860 | 90.0% |
| Tablet | 6,191 | 70.9% |
| No Computing Device | 373 | 4.3% |
| Total | 8,735 | 100.0% |
Internet Access in Rancho Mirage
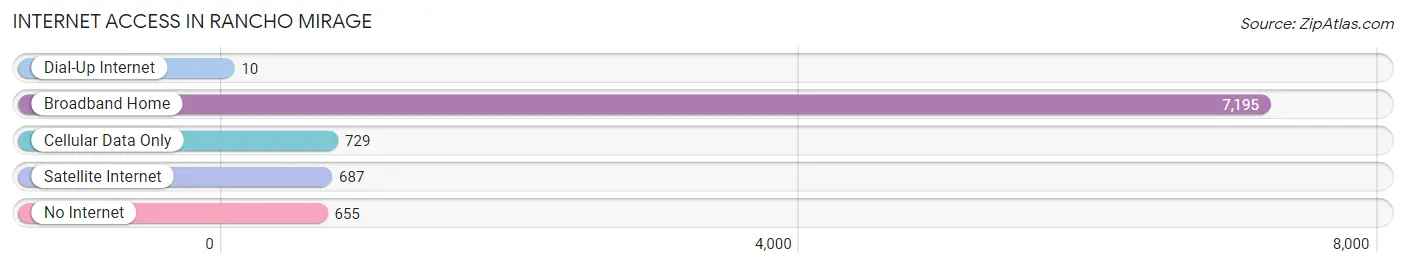
| Internet Type | # Households | % Households |
| Dial-Up Internet | 10 | 0.1% |
| Broadband Home | 7,195 | 82.4% |
| Cellular Data Only | 729 | 8.4% |
| Satellite Internet | 687 | 7.9% |
| No Internet | 655 | 7.5% |
| Total | 8,735 | 100.0% |
Rancho Mirage Summary
Rancho Mirage is a city located in Riverside County, California, United States. It is situated in the Coachella Valley, approximately 11 miles east of Palm Springs and 122 miles east of Los Angeles. The city is known for its luxury resorts, golf courses, and spas. As of the 2010 census, the city had a population of 17,218.
History
Rancho Mirage was originally part of the unincorporated area known as the "Cahuilla Indian Reservation". In 1938, the area was purchased by the Whitewater Development Company, which was owned by the four sons of Charles and Martha Robinson. The Robinsons developed the area as a planned community, and in 1941, the area was incorporated as the City of Rancho Mirage.
Geography
Rancho Mirage is located in the Coachella Valley, which is part of the Sonoran Desert. The city is bordered by the cities of Palm Desert to the north, Indian Wells to the east, and Cathedral City to the south. The city is situated at an elevation of approximately 500 feet above sea level.
The city covers an area of approximately 27 square miles, and is located approximately 11 miles east of Palm Springs and 122 miles east of Los Angeles. The city is located in the San Jacinto Mountains, and is surrounded by several mountain ranges, including the Santa Rosa Mountains to the west, the San Jacinto Mountains to the east, and the San Bernardino Mountains to the north.
Economy
Rancho Mirage is a popular tourist destination, and is home to several luxury resorts, golf courses, and spas. The city is also home to several corporate headquarters, including the headquarters of the Agua Caliente Band of Cahuilla Indians.
The city's economy is largely driven by tourism, and the city is home to several popular attractions, including the Living Desert Zoo and Gardens, the Children's Discovery Museum, and the Sunnylands Center and Gardens.
Demographics
As of the 2010 census, the city had a population of 17,218. The racial makeup of the city was 79.2% White, 4.3% African American, 0.7% Native American, 4.2% Asian, 0.1% Pacific Islander, 8.2% from other races, and 3.3% from two or more races. Hispanic or Latino of any race were 18.2% of the population.
The median income for a household in the city was $50,945, and the median income for a family was $60,945. The per capita income for the city was $30,945. About 8.2% of families and 11.2% of the population were below the poverty line, including 15.2% of those under age 18 and 6.2% of those age 65 or over.
Common Questions
What is Per Capita Income in Rancho Mirage?
Per Capita income in Rancho Mirage is $86,546.
What is the Median Family Income in Rancho Mirage?
Median Family Income in Rancho Mirage is $131,452.
What is the Median Household income in Rancho Mirage?
Median Household Income in Rancho Mirage is $105,557.
What is Income or Wage Gap in Rancho Mirage?
Income or Wage Gap in Rancho Mirage is 39.2%.
Women in Rancho Mirage earn 60.8 cents for every dollar earned by a man.
What is Family Income Deficit in Rancho Mirage?
Family Income Deficit in Rancho Mirage is $11,977.
Families that are below poverty line in Rancho Mirage earn $11,977 less on average than the poverty threshold level.
What is Inequality or Gini Index in Rancho Mirage?
Inequality or Gini Index in Rancho Mirage is 0.54.
What is the Total Population of Rancho Mirage?
Total Population of Rancho Mirage is 17,257.
What is the Total Male Population of Rancho Mirage?
Total Male Population of Rancho Mirage is 9,057.
What is the Total Female Population of Rancho Mirage?
Total Female Population of Rancho Mirage is 8,200.
What is the Ratio of Males per 100 Females in Rancho Mirage?
There are 110.45 Males per 100 Females in Rancho Mirage.
What is the Ratio of Females per 100 Males in Rancho Mirage?
There are 90.54 Females per 100 Males in Rancho Mirage.
What is the Median Population Age in Rancho Mirage?
Median Population Age in Rancho Mirage is 64.9 Years.
What is the Average Family Size in Rancho Mirage
Average Family Size in Rancho Mirage is 2.4 People.
What is the Average Household Size in Rancho Mirage
Average Household Size in Rancho Mirage is 1.9 People.
How Large is the Labor Force in Rancho Mirage?
There are 6,522 People in the Labor Forcein in Rancho Mirage.
What is the Percentage of People in the Labor Force in Rancho Mirage?
40.7% of People are in the Labor Force in Rancho Mirage.
What is the Unemployment Rate in Rancho Mirage?
Unemployment Rate in Rancho Mirage is 10.5%.