Western Springs, IL Map & Demographics
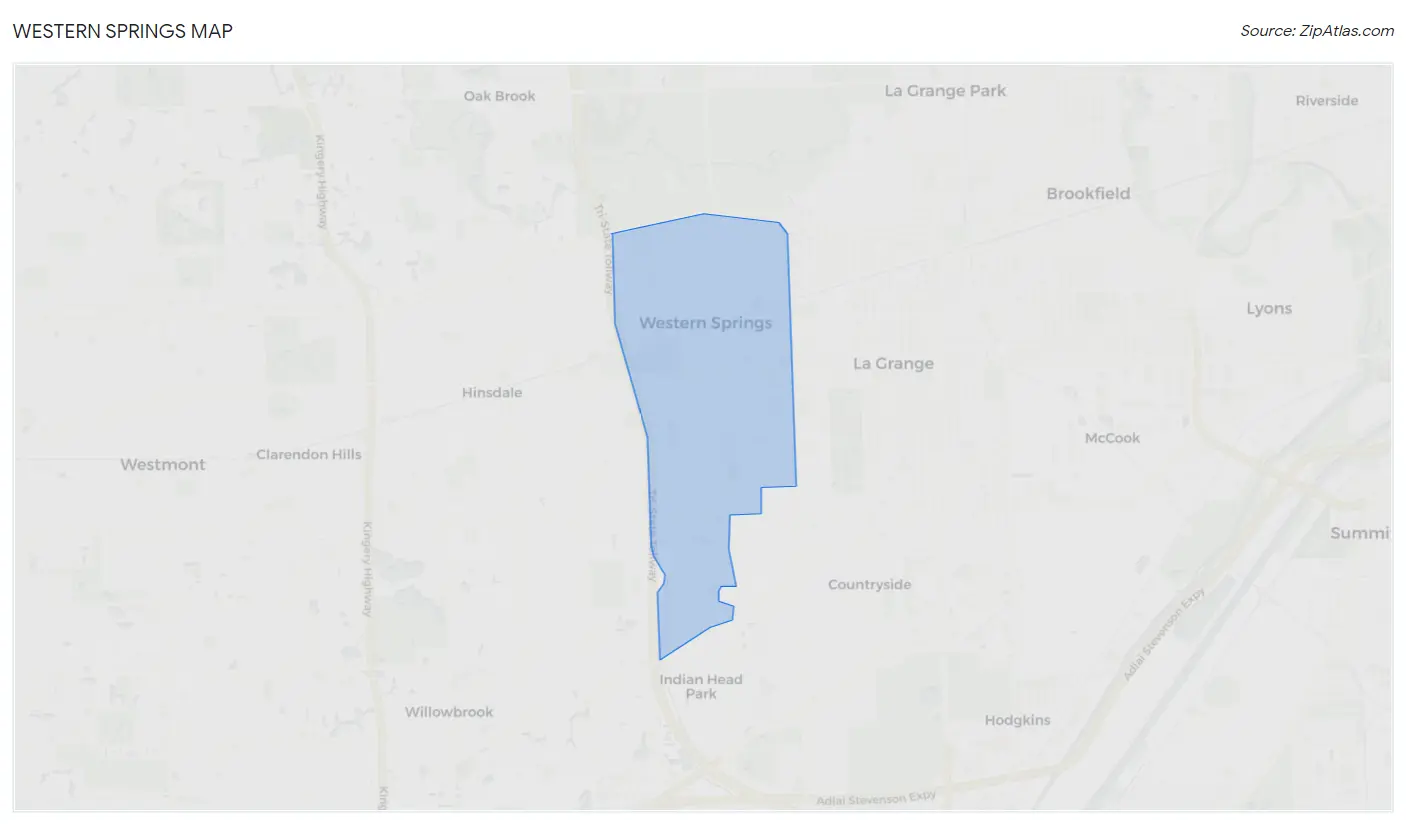
Western Springs Map
Western Springs Overview
$93,413
PER CAPITA INCOME
$225,240
AVG FAMILY INCOME
$198,836
AVG HOUSEHOLD INCOME
55.0%
WAGE / INCOME GAP [ % ]
45.0¢/ $1
WAGE / INCOME GAP [ $ ]
$11,877
FAMILY INCOME DEFICIT
0.45
INEQUALITY / GINI INDEX
13,557
TOTAL POPULATION
6,992
MALE POPULATION
6,565
FEMALE POPULATION
106.50
MALES / 100 FEMALES
93.89
FEMALES / 100 MALES
42.0
MEDIAN AGE
3.3
AVG FAMILY SIZE
3.0
AVG HOUSEHOLD SIZE
6,137
LABOR FORCE [ PEOPLE ]
63.2%
PERCENT IN LABOR FORCE
2.5%
UNEMPLOYMENT RATE
Western Springs Zip Codes
Income in Western Springs
Income Overview in Western Springs
Per Capita Income in Western Springs is $93,413, while median incomes of families and households are $225,240 and $198,836 respectively.
| Characteristic | Number | Measure |
| Per Capita Income | 13,557 | $93,413 |
| Median Family Income | 3,870 | $225,240 |
| Mean Family Income | 3,870 | $299,006 |
| Median Household Income | 4,521 | $198,836 |
| Mean Household Income | 4,521 | $276,402 |
| Income Deficit | 3,870 | $11,877 |
| Wage / Income Gap (%) | 13,557 | 54.99% |
| Wage / Income Gap ($) | 13,557 | 45.01¢ per $1 |
| Gini / Inequality Index | 13,557 | 0.45 |
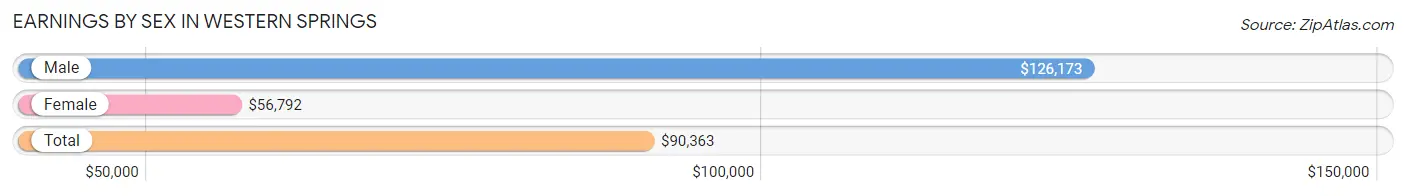
Earnings by Sex in Western Springs
Average Earnings in Western Springs are $90,363, $126,173 for men and $56,792 for women, a difference of 55.0%.
| Sex | Number | Average Earnings |
| Male | 3,732 (56.0%) | $126,173 |
| Female | 2,929 (44.0%) | $56,792 |
| Total | 6,661 (100.0%) | $90,363 |
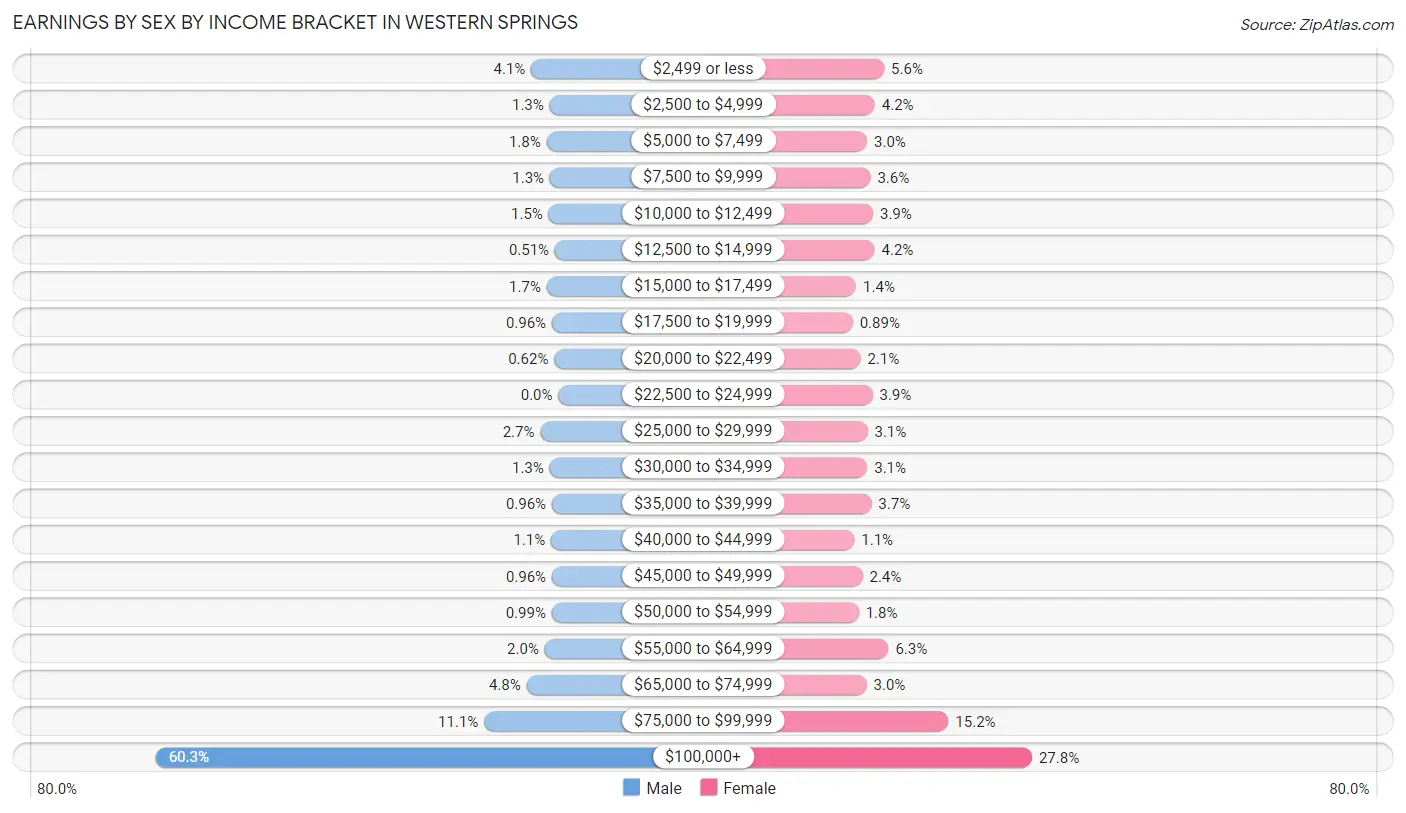
Earnings by Sex by Income Bracket in Western Springs
The most common earnings brackets in Western Springs are $100,000+ for men (2,252 | 60.3%) and $100,000+ for women (813 | 27.8%).
| Income | Male | Female |
| $2,499 or less | 152 (4.1%) | 164 (5.6%) |
| $2,500 to $4,999 | 49 (1.3%) | 123 (4.2%) |
| $5,000 to $7,499 | 66 (1.8%) | 89 (3.0%) |
| $7,500 to $9,999 | 47 (1.3%) | 104 (3.5%) |
| $10,000 to $12,499 | 54 (1.5%) | 115 (3.9%) |
| $12,500 to $14,999 | 19 (0.5%) | 122 (4.2%) |
| $15,000 to $17,499 | 65 (1.7%) | 41 (1.4%) |
| $17,500 to $19,999 | 36 (1.0%) | 26 (0.9%) |
| $20,000 to $22,499 | 23 (0.6%) | 60 (2.1%) |
| $22,500 to $24,999 | 0 (0.0%) | 113 (3.9%) |
| $25,000 to $29,999 | 101 (2.7%) | 91 (3.1%) |
| $30,000 to $34,999 | 49 (1.3%) | 90 (3.1%) |
| $35,000 to $39,999 | 36 (1.0%) | 108 (3.7%) |
| $40,000 to $44,999 | 41 (1.1%) | 33 (1.1%) |
| $45,000 to $49,999 | 36 (1.0%) | 69 (2.4%) |
| $50,000 to $54,999 | 37 (1.0%) | 52 (1.8%) |
| $55,000 to $64,999 | 76 (2.0%) | 183 (6.2%) |
| $65,000 to $74,999 | 178 (4.8%) | 87 (3.0%) |
| $75,000 to $99,999 | 415 (11.1%) | 446 (15.2%) |
| $100,000+ | 2,252 (60.3%) | 813 (27.8%) |
| Total | 3,732 (100.0%) | 2,929 (100.0%) |
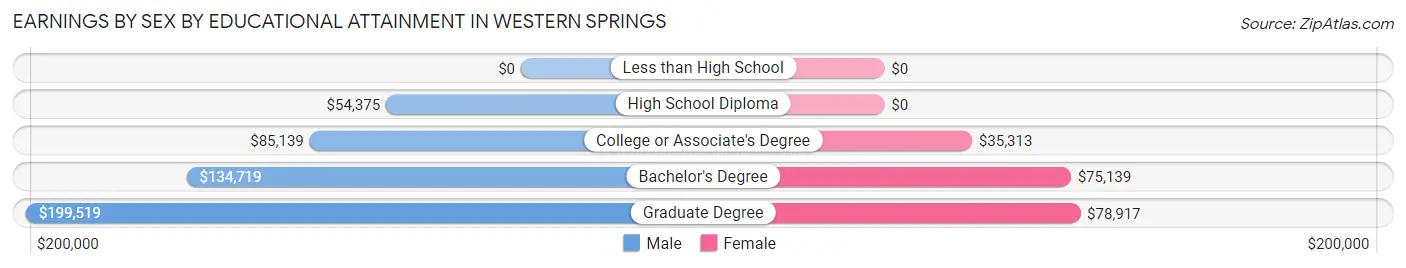
Earnings by Sex by Educational Attainment in Western Springs
Average earnings in Western Springs are $138,947 for men and $67,750 for women, a difference of 51.2%. Men with an educational attainment of graduate degree enjoy the highest average annual earnings of $199,519, while those with high school diploma education earn the least with $54,375. Women with an educational attainment of graduate degree earn the most with the average annual earnings of $78,917, while those with college or associate's degree education have the smallest earnings of $35,313.
| Educational Attainment | Male Income | Female Income |
| Less than High School | - | - |
| High School Diploma | $54,375 | $0 |
| College or Associate's Degree | $85,139 | $35,313 |
| Bachelor's Degree | $134,719 | $75,139 |
| Graduate Degree | $199,519 | $78,917 |
| Total | $138,947 | $67,750 |
Family Income in Western Springs
Family Income Brackets in Western Springs
According to the Western Springs family income data, there are 2,144 families falling into the $200,000+ income range, which is the most common income bracket and makes up 55.4% of all families.
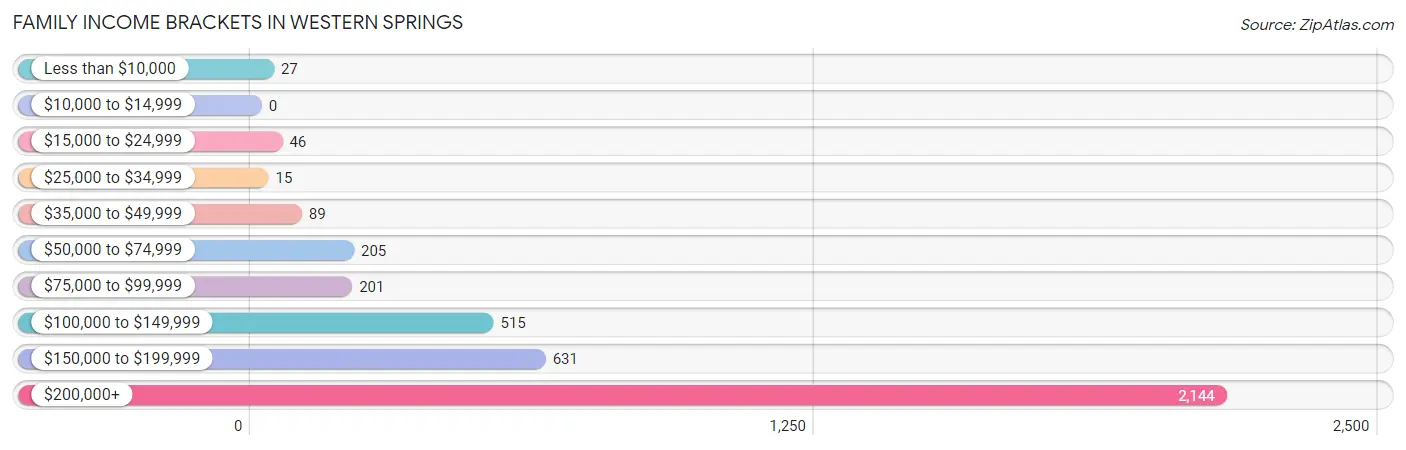
| Income Bracket | # Families | % Families |
| Less than $10,000 | 27 | 0.7% |
| $10,000 to $14,999 | 0 | 0.0% |
| $15,000 to $24,999 | 46 | 1.2% |
| $25,000 to $34,999 | 15 | 0.4% |
| $35,000 to $49,999 | 89 | 2.3% |
| $50,000 to $74,999 | 205 | 5.3% |
| $75,000 to $99,999 | 201 | 5.2% |
| $100,000 to $149,999 | 515 | 13.3% |
| $150,000 to $199,999 | 631 | 16.3% |
| $200,000+ | 2,144 | 55.4% |
Family Income by Famaliy Size in Western Springs
3-person families (810 | 20.9%) account for the highest median family income in Western Springs with $250,001 per family, while 3-person families (810 | 20.9%) have the highest median income of $83,334 per family member.
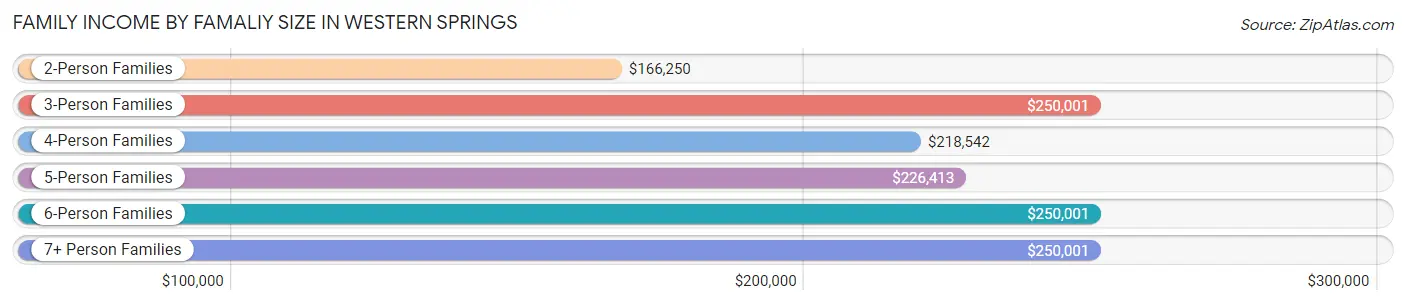
| Income Bracket | # Families | Median Income |
| 2-Person Families | 1,372 (35.4%) | $166,250 |
| 3-Person Families | 810 (20.9%) | $250,001 |
| 4-Person Families | 1,081 (27.9%) | $218,542 |
| 5-Person Families | 476 (12.3%) | $226,413 |
| 6-Person Families | 96 (2.5%) | $250,001 |
| 7+ Person Families | 35 (0.9%) | $250,001 |
| Total | 3,870 (100.0%) | $225,240 |
Family Income by Number of Earners in Western Springs
The median family income in Western Springs is $225,240, with families comprising 3+ earners (433) having the highest median family income of $250,001, while families with no earners (526) have the lowest median family income of $120,833, accounting for 11.2% and 13.6% of families, respectively.
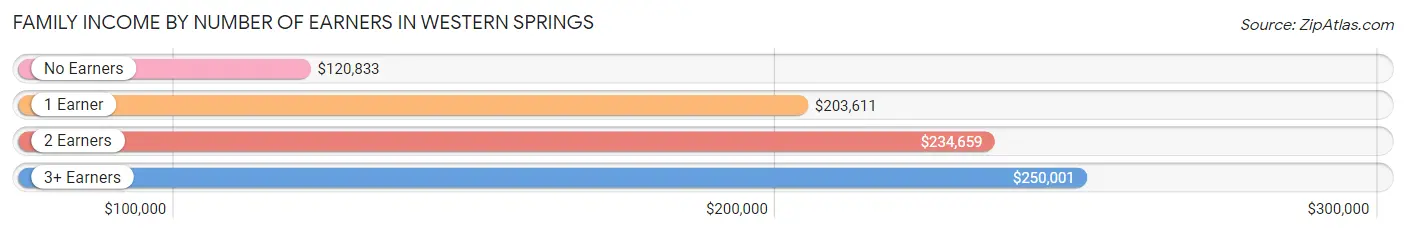
| Number of Earners | # Families | Median Income |
| No Earners | 526 (13.6%) | $120,833 |
| 1 Earner | 1,026 (26.5%) | $203,611 |
| 2 Earners | 1,885 (48.7%) | $234,659 |
| 3+ Earners | 433 (11.2%) | $250,001 |
| Total | 3,870 (100.0%) | $225,240 |
Household Income in Western Springs
Household Income Brackets in Western Springs
With 2,247 households falling in the category, the $200,000+ income range is the most frequent in Western Springs, accounting for 49.7% of all households. In contrast, only 9 households (0.2%) fall into the $10,000 to $14,999 income bracket, making it the least populous group.
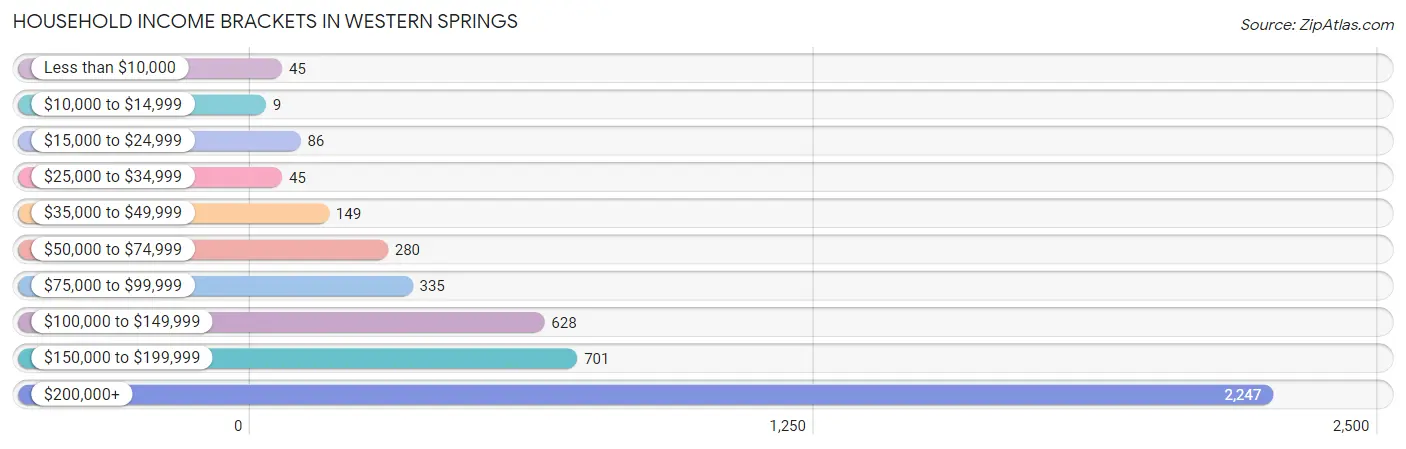
| Income Bracket | # Households | % Households |
| Less than $10,000 | 45 | 1.0% |
| $10,000 to $14,999 | 9 | 0.2% |
| $15,000 to $24,999 | 86 | 1.9% |
| $25,000 to $34,999 | 45 | 1.0% |
| $35,000 to $49,999 | 149 | 3.3% |
| $50,000 to $74,999 | 280 | 6.2% |
| $75,000 to $99,999 | 335 | 7.4% |
| $100,000 to $149,999 | 628 | 13.9% |
| $150,000 to $199,999 | 701 | 15.5% |
| $200,000+ | 2,247 | 49.7% |
Household Income by Householder Age in Western Springs
The median household income in Western Springs is $198,836, with the highest median household income of $250,001 found in the 25 to 44 years age bracket for the primary householder. A total of 1,187 households (26.3%) fall into this category.
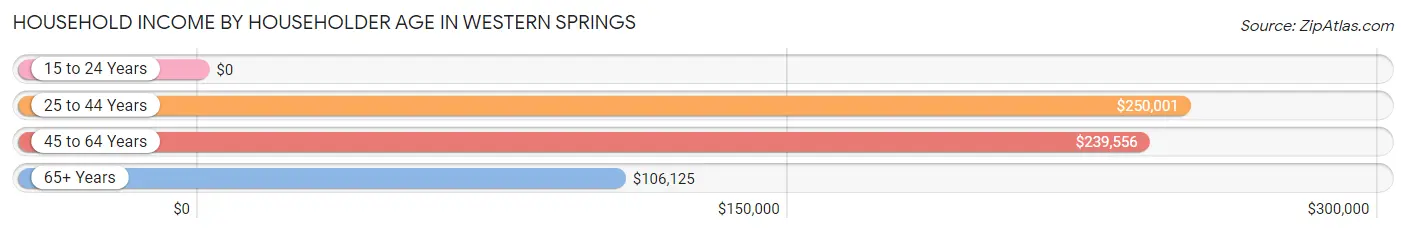
| Income Bracket | # Households | Median Income |
| 15 to 24 Years | 0 (0.0%) | $0 |
| 25 to 44 Years | 1,187 (26.3%) | $250,001 |
| 45 to 64 Years | 2,103 (46.5%) | $239,556 |
| 65+ Years | 1,231 (27.2%) | $106,125 |
| Total | 4,521 (100.0%) | $198,836 |
Poverty in Western Springs
Income Below Poverty by Sex and Age in Western Springs
With 1.7% poverty level for males and 3.5% for females among the residents of Western Springs, 18 to 24 year old males and 18 to 24 year old females are the most vulnerable to poverty, with 20 males (4.9%) and 62 females (23.5%) in their respective age groups living below the poverty level.
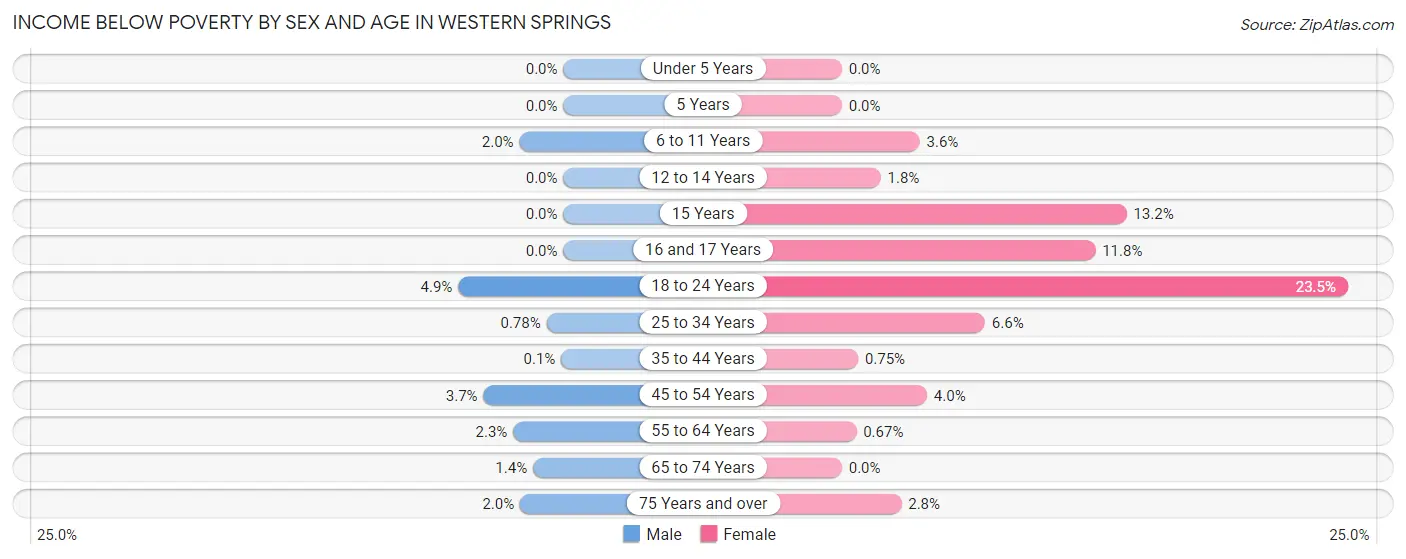
| Age Bracket | Male | Female |
| Under 5 Years | 0 (0.0%) | 0 (0.0%) |
| 5 Years | 0 (0.0%) | 0 (0.0%) |
| 6 to 11 Years | 17 (2.0%) | 27 (3.6%) |
| 12 to 14 Years | 0 (0.0%) | 7 (1.8%) |
| 15 Years | 0 (0.0%) | 21 (13.2%) |
| 16 and 17 Years | 0 (0.0%) | 26 (11.8%) |
| 18 to 24 Years | 20 (4.9%) | 62 (23.5%) |
| 25 to 34 Years | 2 (0.8%) | 17 (6.6%) |
| 35 to 44 Years | 1 (0.1%) | 7 (0.7%) |
| 45 to 54 Years | 36 (3.7%) | 40 (4.0%) |
| 55 to 64 Years | 25 (2.3%) | 7 (0.7%) |
| 65 to 74 Years | 7 (1.4%) | 0 (0.0%) |
| 75 Years and over | 8 (2.0%) | 17 (2.8%) |
| Total | 116 (1.7%) | 231 (3.5%) |
Income Above Poverty by Sex and Age in Western Springs
According to the poverty statistics in Western Springs, males aged under 5 years and females aged under 5 years are the age groups that are most secure financially, with 100.0% of males and 100.0% of females in these age groups living above the poverty line.
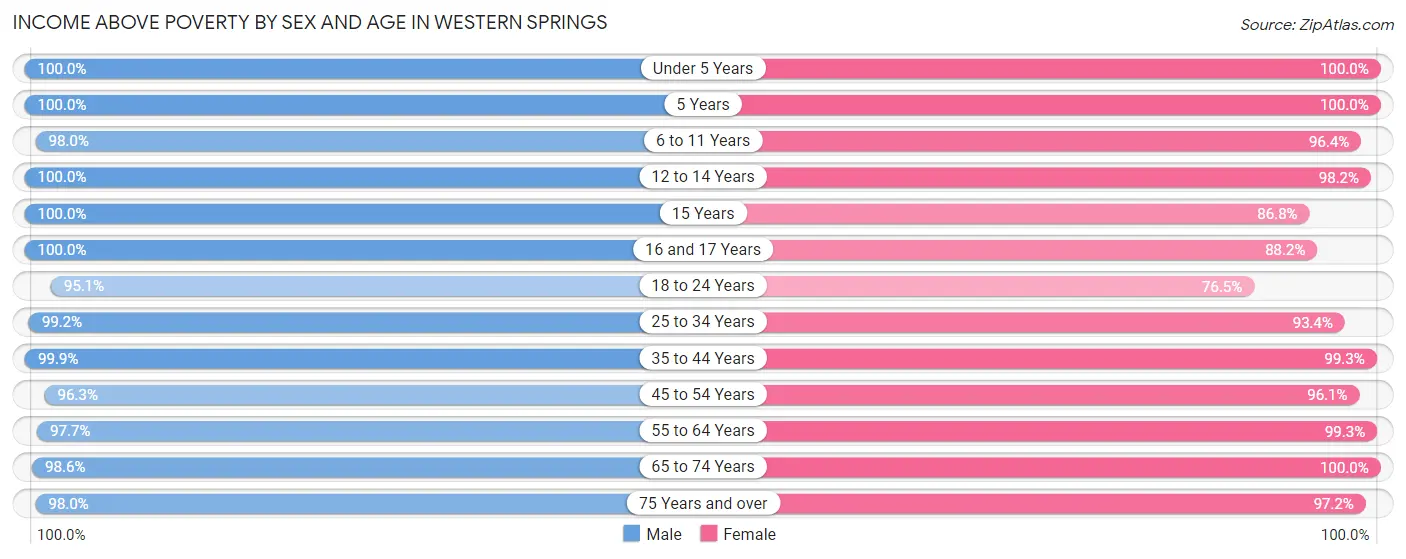
| Age Bracket | Male | Female |
| Under 5 Years | 705 (100.0%) | 347 (100.0%) |
| 5 Years | 117 (100.0%) | 91 (100.0%) |
| 6 to 11 Years | 815 (98.0%) | 721 (96.4%) |
| 12 to 14 Years | 324 (100.0%) | 382 (98.2%) |
| 15 Years | 133 (100.0%) | 138 (86.8%) |
| 16 and 17 Years | 250 (100.0%) | 195 (88.2%) |
| 18 to 24 Years | 390 (95.1%) | 202 (76.5%) |
| 25 to 34 Years | 253 (99.2%) | 239 (93.4%) |
| 35 to 44 Years | 1,025 (99.9%) | 925 (99.3%) |
| 45 to 54 Years | 935 (96.3%) | 973 (96.1%) |
| 55 to 64 Years | 1,050 (97.7%) | 1,037 (99.3%) |
| 65 to 74 Years | 488 (98.6%) | 482 (100.0%) |
| 75 Years and over | 391 (98.0%) | 600 (97.2%) |
| Total | 6,876 (98.3%) | 6,332 (96.5%) |
Income Below Poverty Among Married-Couple Families in Western Springs
The poverty statistics for married-couple families in Western Springs show that 0.9% or 32 of the total 3,568 families live below the poverty line. Families with 1 or 2 children have the highest poverty rate of 1.8%, comprising of 23 families. On the other hand, families with 3 or 4 children have the lowest poverty rate of 0.0%, which includes 0 families.
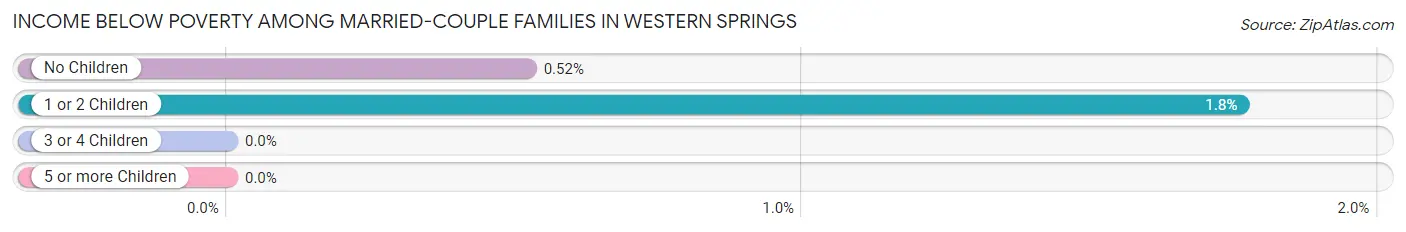
| Children | Above Poverty | Below Poverty |
| No Children | 1,713 (99.5%) | 9 (0.5%) |
| 1 or 2 Children | 1,281 (98.2%) | 23 (1.8%) |
| 3 or 4 Children | 517 (100.0%) | 0 (0.0%) |
| 5 or more Children | 25 (100.0%) | 0 (0.0%) |
| Total | 3,536 (99.1%) | 32 (0.9%) |
Income Below Poverty Among Single-Parent Households in Western Springs
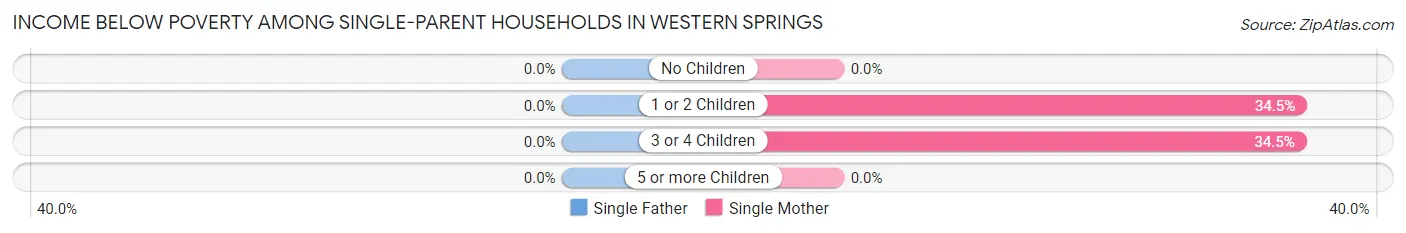
| Children | Single Father | Single Mother |
| No Children | 0 (0.0%) | 0 (0.0%) |
| 1 or 2 Children | 0 (0.0%) | 29 (34.5%) |
| 3 or 4 Children | 0 (0.0%) | 10 (34.5%) |
| 5 or more Children | 0 (0.0%) | 0 (0.0%) |
| Total | 0 (0.0%) | 39 (15.3%) |
Income Below Poverty Among Married-Couple vs Single-Parent Households in Western Springs
The poverty data for Western Springs shows that 32 of the married-couple family households (0.9%) and 39 of the single-parent households (12.9%) are living below the poverty level. Within the married-couple family households, those with 1 or 2 children have the highest poverty rate, with 23 households (1.8%) falling below the poverty line. Among the single-parent households, those with 3 or 4 children have the highest poverty rate, with 10 household (34.5%) living below poverty.
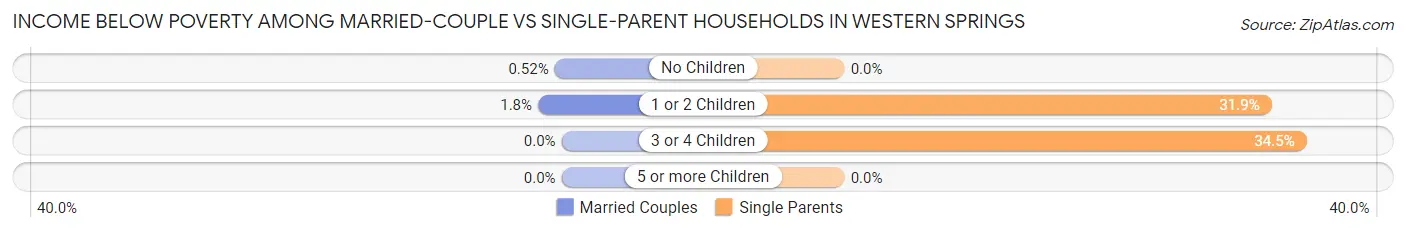
| Children | Married-Couple Families | Single-Parent Households |
| No Children | 9 (0.5%) | 0 (0.0%) |
| 1 or 2 Children | 23 (1.8%) | 29 (31.9%) |
| 3 or 4 Children | 0 (0.0%) | 10 (34.5%) |
| 5 or more Children | 0 (0.0%) | 0 (0.0%) |
| Total | 32 (0.9%) | 39 (12.9%) |
Race in Western Springs
The most populous races in Western Springs are White / Caucasian (12,535 | 92.5%), Hispanic or Latino (790 | 5.8%), and Two or more Races (599 | 4.4%).
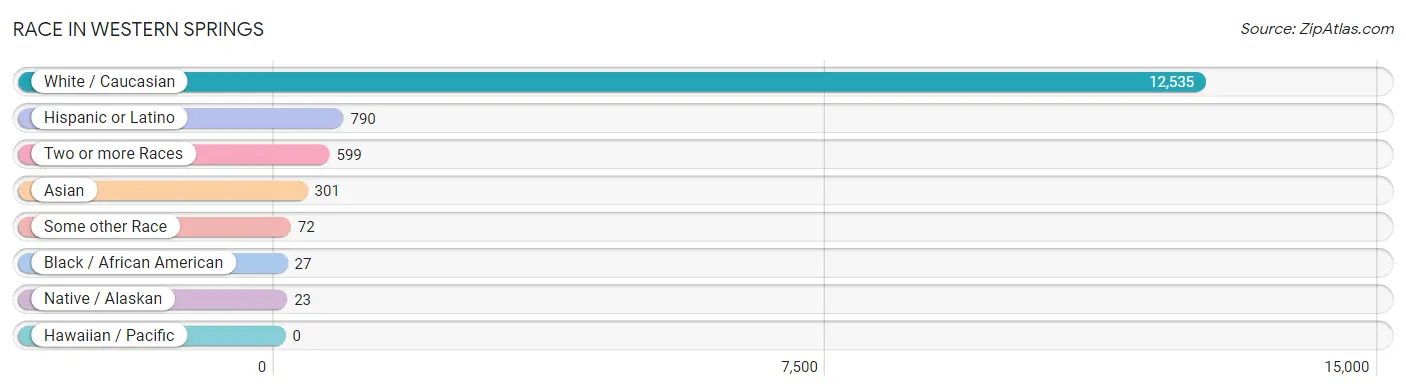
| Race | # Population | % Population |
| Asian | 301 | 2.2% |
| Black / African American | 27 | 0.2% |
| Hawaiian / Pacific | 0 | 0.0% |
| Hispanic or Latino | 790 | 5.8% |
| Native / Alaskan | 23 | 0.2% |
| White / Caucasian | 12,535 | 92.5% |
| Two or more Races | 599 | 4.4% |
| Some other Race | 72 | 0.5% |
| Total | 13,557 | 100.0% |
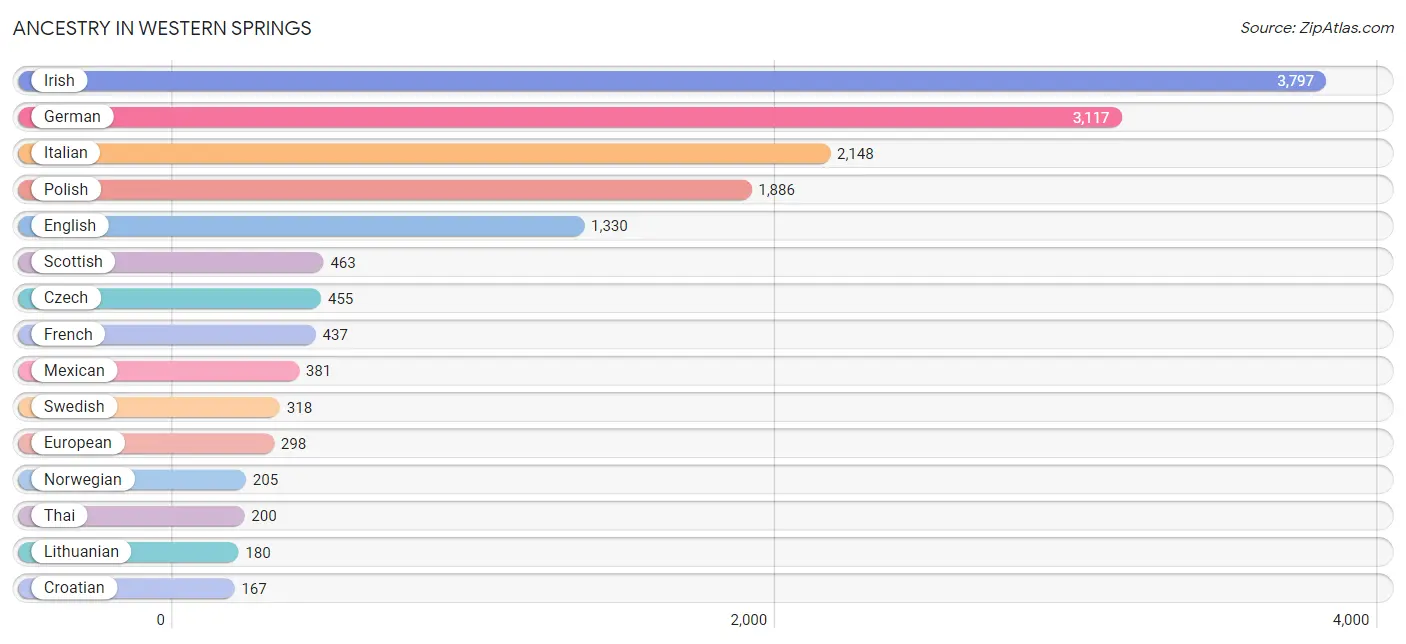
Ancestry in Western Springs
The most populous ancestries reported in Western Springs are Irish (3,797 | 28.0%), German (3,117 | 23.0%), Italian (2,148 | 15.8%), Polish (1,886 | 13.9%), and English (1,330 | 9.8%), together accounting for 90.6% of all Western Springs residents.
| Ancestry | # Population | % Population |
| Alsatian | 4 | 0.0% |
| American | 120 | 0.9% |
| Argentinean | 18 | 0.1% |
| Austrian | 71 | 0.5% |
| Belgian | 86 | 0.6% |
| Bhutanese | 79 | 0.6% |
| British | 25 | 0.2% |
| Burmese | 98 | 0.7% |
| Canadian | 70 | 0.5% |
| Central American | 23 | 0.2% |
| Cherokee | 62 | 0.5% |
| Colombian | 33 | 0.2% |
| Creek | 38 | 0.3% |
| Croatian | 167 | 1.2% |
| Cuban | 11 | 0.1% |
| Czech | 455 | 3.4% |
| Czechoslovakian | 99 | 0.7% |
| Danish | 38 | 0.3% |
| Dutch | 154 | 1.1% |
| Eastern European | 84 | 0.6% |
| Ecuadorian | 87 | 0.6% |
| English | 1,330 | 9.8% |
| European | 298 | 2.2% |
| Filipino | 11 | 0.1% |
| Finnish | 38 | 0.3% |
| French | 437 | 3.2% |
| French Canadian | 17 | 0.1% |
| German | 3,117 | 23.0% |
| Greek | 164 | 1.2% |
| Hungarian | 104 | 0.8% |
| Icelander | 7 | 0.1% |
| Indian (Asian) | 6 | 0.0% |
| Irish | 3,797 | 28.0% |
| Italian | 2,148 | 15.8% |
| Japanese | 4 | 0.0% |
| Korean | 61 | 0.4% |
| Latvian | 6 | 0.0% |
| Lithuanian | 180 | 1.3% |
| Macedonian | 46 | 0.3% |
| Mexican | 381 | 2.8% |
| Northern European | 19 | 0.1% |
| Norwegian | 205 | 1.5% |
| Polish | 1,886 | 13.9% |
| Portuguese | 7 | 0.1% |
| Puerto Rican | 74 | 0.5% |
| Romanian | 17 | 0.1% |
| Russian | 73 | 0.5% |
| Salvadoran | 23 | 0.2% |
| Scandinavian | 5 | 0.0% |
| Scotch-Irish | 59 | 0.4% |
| Scottish | 463 | 3.4% |
| Serbian | 109 | 0.8% |
| Slovak | 56 | 0.4% |
| Slovene | 39 | 0.3% |
| South African | 19 | 0.1% |
| South American | 138 | 1.0% |
| Spaniard | 45 | 0.3% |
| Spanish | 118 | 0.9% |
| Subsaharan African | 19 | 0.1% |
| Swedish | 318 | 2.4% |
| Swiss | 98 | 0.7% |
| Thai | 200 | 1.5% |
| Ukrainian | 48 | 0.4% |
| Welsh | 107 | 0.8% | View All 64 Rows |
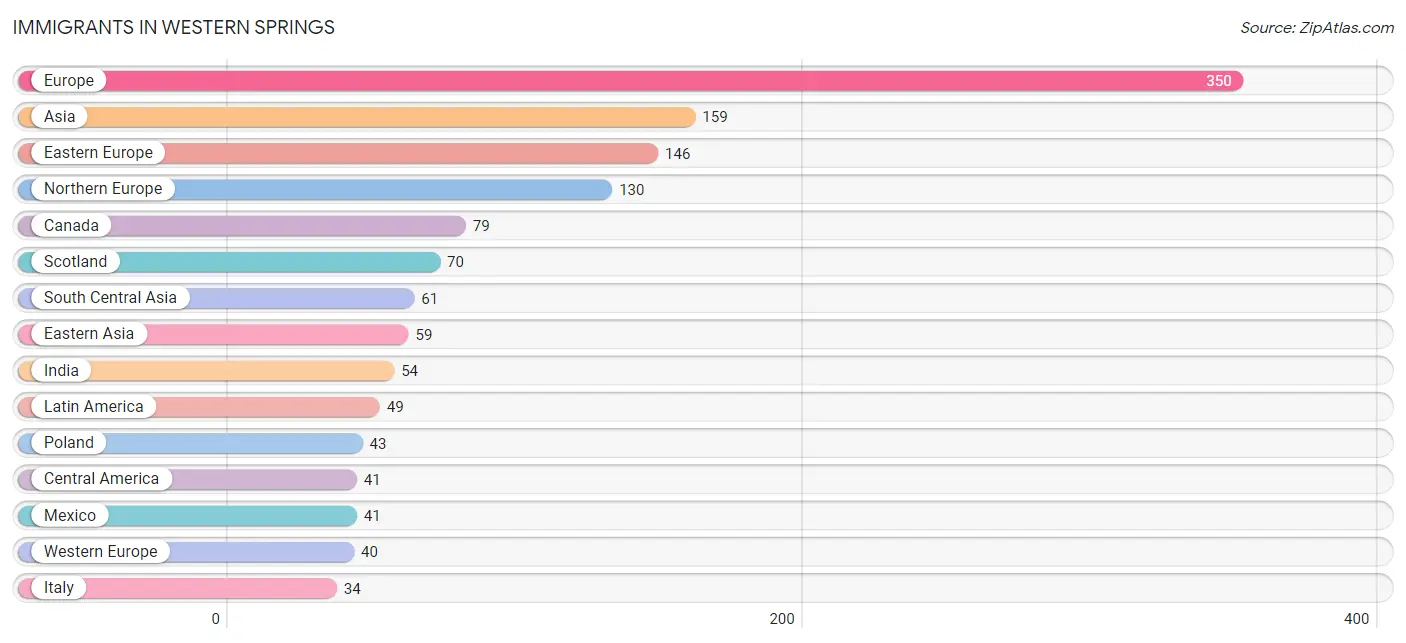
Immigrants in Western Springs
The most numerous immigrant groups reported in Western Springs came from Europe (350 | 2.6%), Asia (159 | 1.2%), Eastern Europe (146 | 1.1%), Northern Europe (130 | 1.0%), and Canada (79 | 0.6%), together accounting for 6.4% of all Western Springs residents.
| Immigration Origin | # Population | % Population |
| Africa | 27 | 0.2% |
| Argentina | 8 | 0.1% |
| Asia | 159 | 1.2% |
| Cambodia | 4 | 0.0% |
| Canada | 79 | 0.6% |
| Central America | 41 | 0.3% |
| China | 17 | 0.1% |
| Czechoslovakia | 31 | 0.2% |
| Eastern Asia | 59 | 0.4% |
| Eastern Europe | 146 | 1.1% |
| England | 9 | 0.1% |
| Europe | 350 | 2.6% |
| France | 14 | 0.1% |
| Germany | 15 | 0.1% |
| Hungary | 20 | 0.2% |
| India | 54 | 0.4% |
| Israel | 6 | 0.0% |
| Italy | 34 | 0.3% |
| Japan | 16 | 0.1% |
| Korea | 26 | 0.2% |
| Latin America | 49 | 0.4% |
| Lithuania | 9 | 0.1% |
| Mexico | 41 | 0.3% |
| Northern Europe | 130 | 1.0% |
| Pakistan | 7 | 0.1% |
| Philippines | 29 | 0.2% |
| Poland | 43 | 0.3% |
| Romania | 17 | 0.1% |
| Russia | 15 | 0.1% |
| Scotland | 70 | 0.5% |
| Serbia | 11 | 0.1% |
| South Africa | 27 | 0.2% |
| South America | 8 | 0.1% |
| South Central Asia | 61 | 0.4% |
| South Eastern Asia | 33 | 0.2% |
| Southern Europe | 34 | 0.3% |
| Switzerland | 11 | 0.1% |
| Taiwan | 11 | 0.1% |
| Western Asia | 6 | 0.0% |
| Western Europe | 40 | 0.3% | View All 40 Rows |
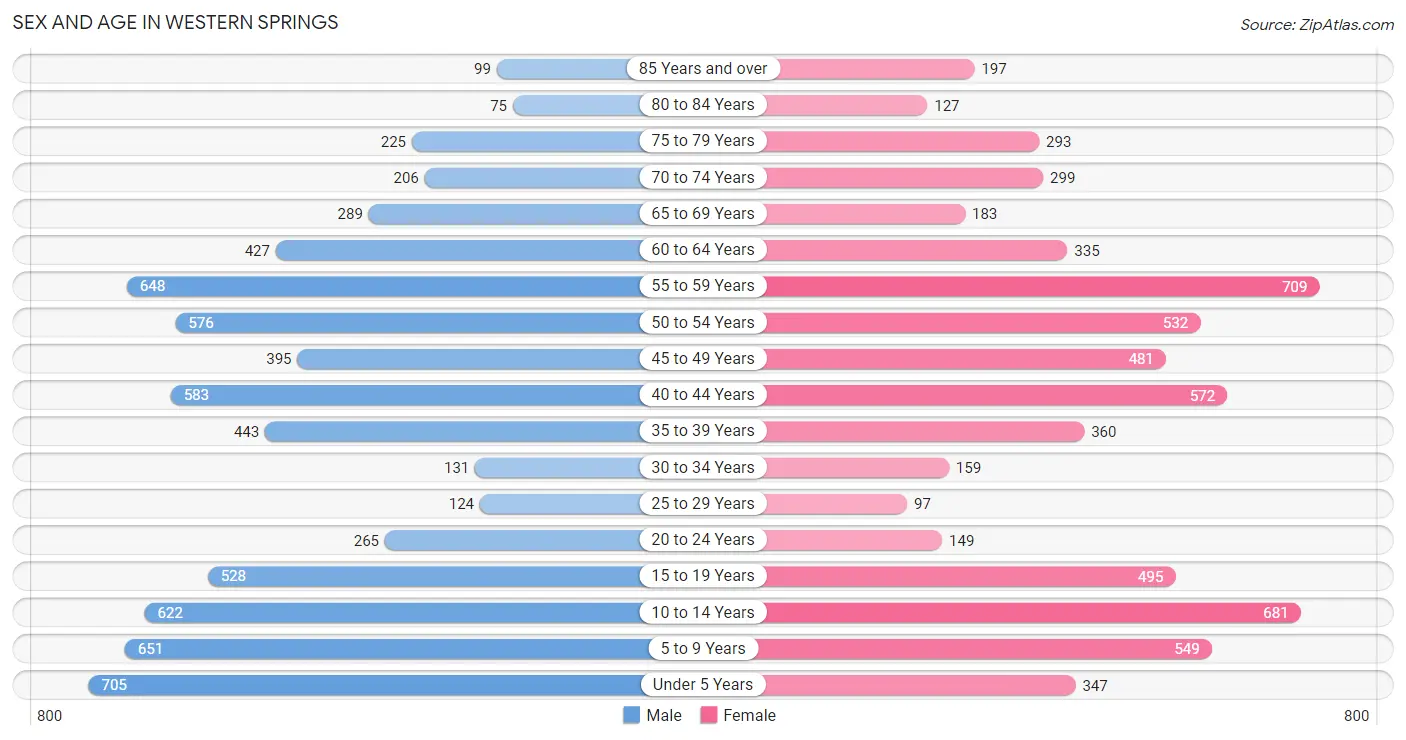
Sex and Age in Western Springs
Sex and Age in Western Springs
The most populous age groups in Western Springs are Under 5 Years (705 | 10.1%) for men and 55 to 59 Years (709 | 10.8%) for women.
| Age Bracket | Male | Female |
| Under 5 Years | 705 (10.1%) | 347 (5.3%) |
| 5 to 9 Years | 651 (9.3%) | 549 (8.4%) |
| 10 to 14 Years | 622 (8.9%) | 681 (10.4%) |
| 15 to 19 Years | 528 (7.5%) | 495 (7.5%) |
| 20 to 24 Years | 265 (3.8%) | 149 (2.3%) |
| 25 to 29 Years | 124 (1.8%) | 97 (1.5%) |
| 30 to 34 Years | 131 (1.9%) | 159 (2.4%) |
| 35 to 39 Years | 443 (6.3%) | 360 (5.5%) |
| 40 to 44 Years | 583 (8.3%) | 572 (8.7%) |
| 45 to 49 Years | 395 (5.7%) | 481 (7.3%) |
| 50 to 54 Years | 576 (8.2%) | 532 (8.1%) |
| 55 to 59 Years | 648 (9.3%) | 709 (10.8%) |
| 60 to 64 Years | 427 (6.1%) | 335 (5.1%) |
| 65 to 69 Years | 289 (4.1%) | 183 (2.8%) |
| 70 to 74 Years | 206 (2.9%) | 299 (4.5%) |
| 75 to 79 Years | 225 (3.2%) | 293 (4.5%) |
| 80 to 84 Years | 75 (1.1%) | 127 (1.9%) |
| 85 Years and over | 99 (1.4%) | 197 (3.0%) |
| Total | 6,992 (100.0%) | 6,565 (100.0%) |
Families and Households in Western Springs
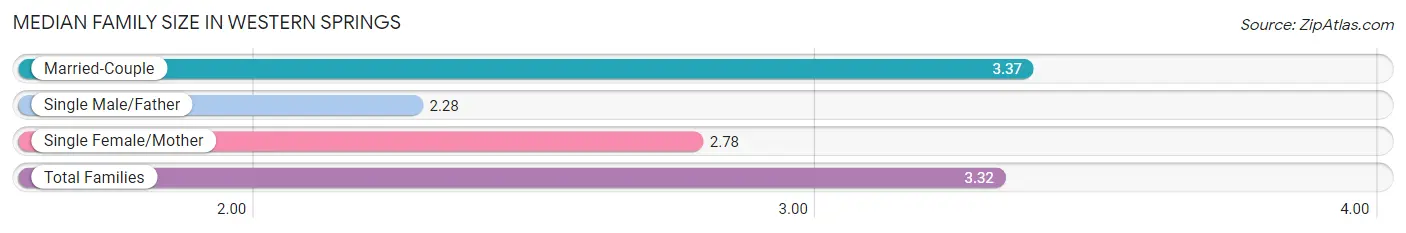
Median Family Size in Western Springs
The median family size in Western Springs is 3.32 persons per family, with married-couple families (3,568 | 92.2%) accounting for the largest median family size of 3.37 persons per family. On the other hand, single male/father families (47 | 1.2%) represent the smallest median family size with 2.28 persons per family.
| Family Type | # Families | Family Size |
| Married-Couple | 3,568 (92.2%) | 3.37 |
| Single Male/Father | 47 (1.2%) | 2.28 |
| Single Female/Mother | 255 (6.6%) | 2.78 |
| Total Families | 3,870 (100.0%) | 3.32 |
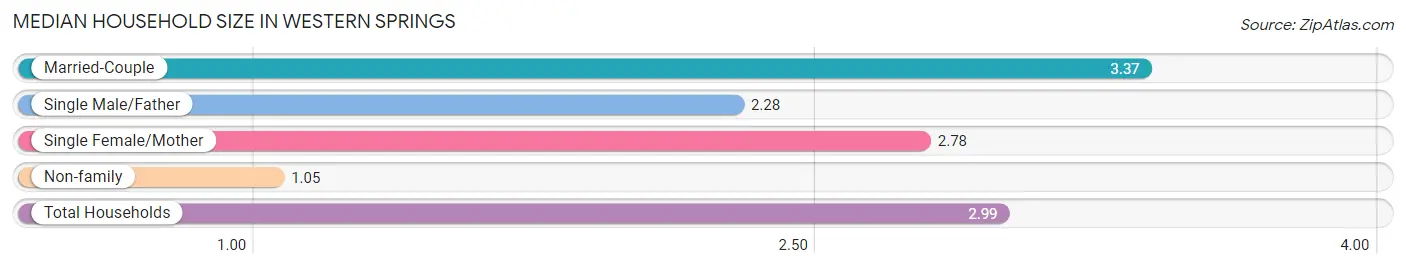
Median Household Size in Western Springs
The median household size in Western Springs is 2.99 persons per household, with married-couple households (3,568 | 78.9%) accounting for the largest median household size of 3.37 persons per household. non-family households (651 | 14.4%) represent the smallest median household size with 1.05 persons per household.
| Household Type | # Households | Household Size |
| Married-Couple | 3,568 (78.9%) | 3.37 |
| Single Male/Father | 47 (1.0%) | 2.28 |
| Single Female/Mother | 255 (5.6%) | 2.78 |
| Non-family | 651 (14.4%) | 1.05 |
| Total Households | 4,521 (100.0%) | 2.99 |
Household Size by Marriage Status in Western Springs
Out of a total of 4,521 households in Western Springs, 3,870 (85.6%) are family households, while 651 (14.4%) are nonfamily households. The most numerous type of family households are 2-person households, comprising 1,372, and the most common type of nonfamily households are 1-person households, comprising 620.
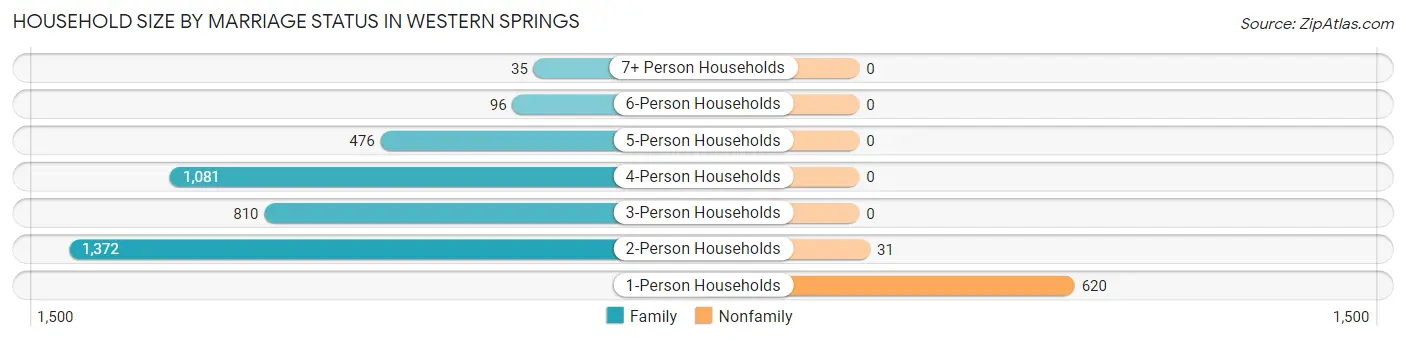
| Household Size | Family Households | Nonfamily Households |
| 1-Person Households | - | 620 (13.7%) |
| 2-Person Households | 1,372 (30.3%) | 31 (0.7%) |
| 3-Person Households | 810 (17.9%) | 0 (0.0%) |
| 4-Person Households | 1,081 (23.9%) | 0 (0.0%) |
| 5-Person Households | 476 (10.5%) | 0 (0.0%) |
| 6-Person Households | 96 (2.1%) | 0 (0.0%) |
| 7+ Person Households | 35 (0.8%) | 0 (0.0%) |
| Total | 3,870 (85.6%) | 651 (14.4%) |
Female Fertility in Western Springs
Fertility by Age in Western Springs
Average fertility rate in Western Springs is 81.0 births per 1,000 women. Women in the age bracket of 20 to 34 years have the highest fertility rate with 141.0 births per 1,000 women. Women in the age bracket of 35 to 50 years acount for 70.2% of all women with births.
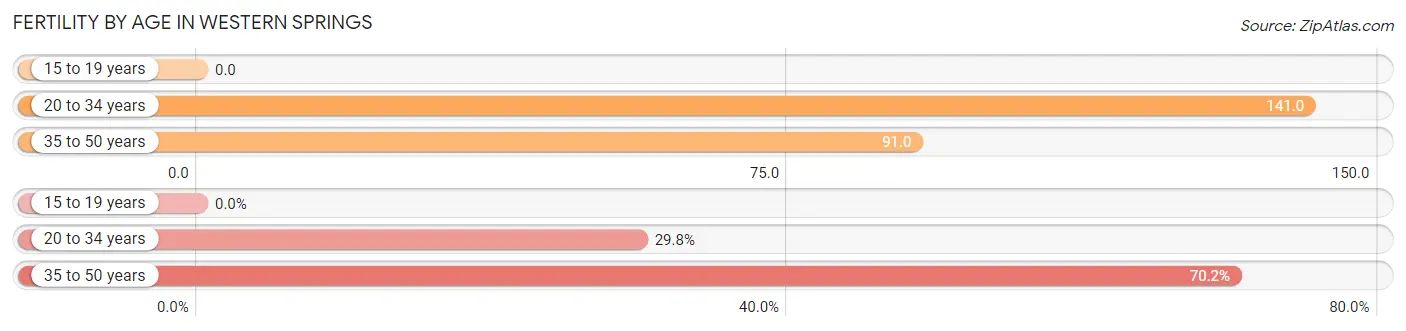
| Age Bracket | Women with Births | Births / 1,000 Women |
| 15 to 19 years | 0 (0.0%) | 0.0 |
| 20 to 34 years | 57 (29.8%) | 141.0 |
| 35 to 50 years | 134 (70.2%) | 91.0 |
| Total | 191 (100.0%) | 81.0 |
Fertility by Age by Marriage Status in Western Springs
93.2% of women with births (191) in Western Springs are married. The highest percentage of unmarried women with births falls into 20 to 34 years age bracket with 22.8% of them unmarried at the time of birth, while the lowest percentage of unmarried women with births belong to 35 to 50 years age bracket with 0.0% of them unmarried.
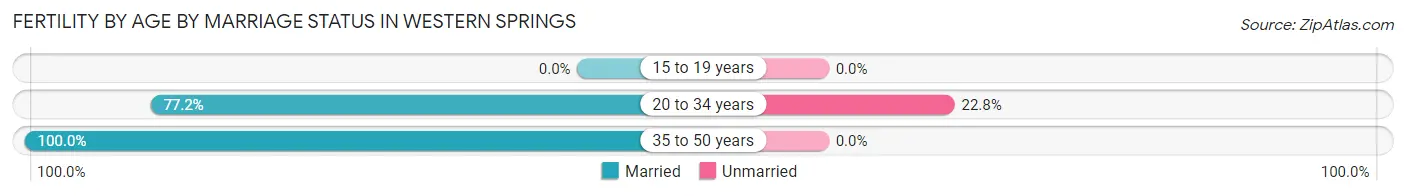
| Age Bracket | Married | Unmarried |
| 15 to 19 years | 0 (0.0%) | 0 (0.0%) |
| 20 to 34 years | 44 (77.2%) | 13 (22.8%) |
| 35 to 50 years | 134 (100.0%) | 0 (0.0%) |
| Total | 178 (93.2%) | 13 (6.8%) |
Fertility by Education in Western Springs
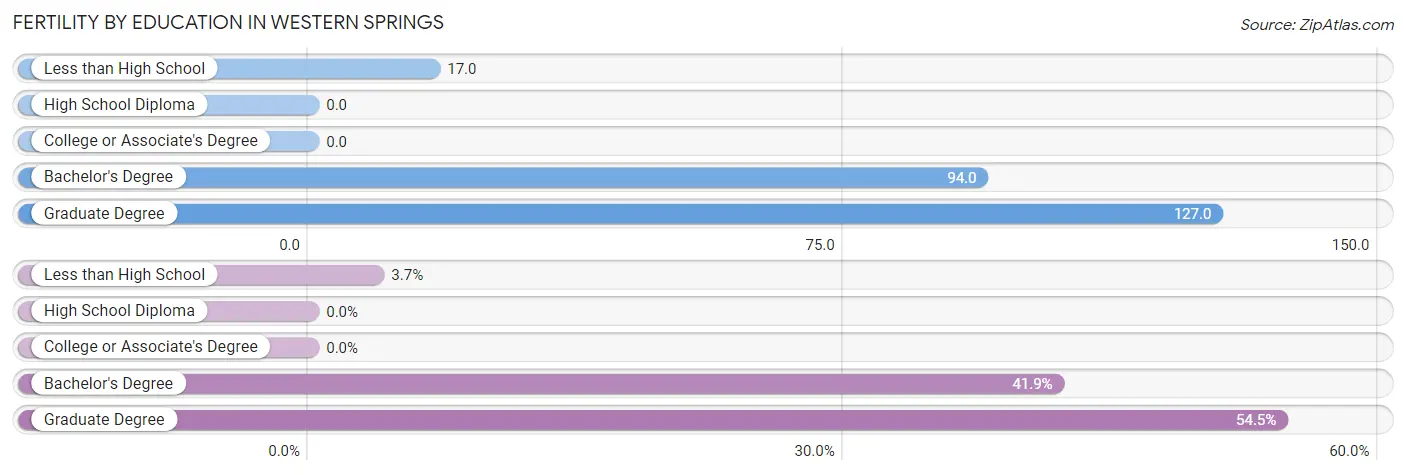
| Educational Attainment | Women with Births | Births / 1,000 Women |
| Less than High School | 7 (3.7%) | 17.0 |
| High School Diploma | 0 (0.0%) | 0.0 |
| College or Associate's Degree | 0 (0.0%) | 0.0 |
| Bachelor's Degree | 80 (41.9%) | 94.0 |
| Graduate Degree | 104 (54.4%) | 127.0 |
| Total | 191 (100.0%) | 81.0 |
Fertility by Education by Marriage Status in Western Springs
6.8% of women with births in Western Springs are unmarried. Women with the educational attainment of graduate degree are most likely to be married with 100.0% of them married at childbirth, while women with the educational attainment of less than high school are least likely to be married with 100.0% of them unmarried at childbirth.
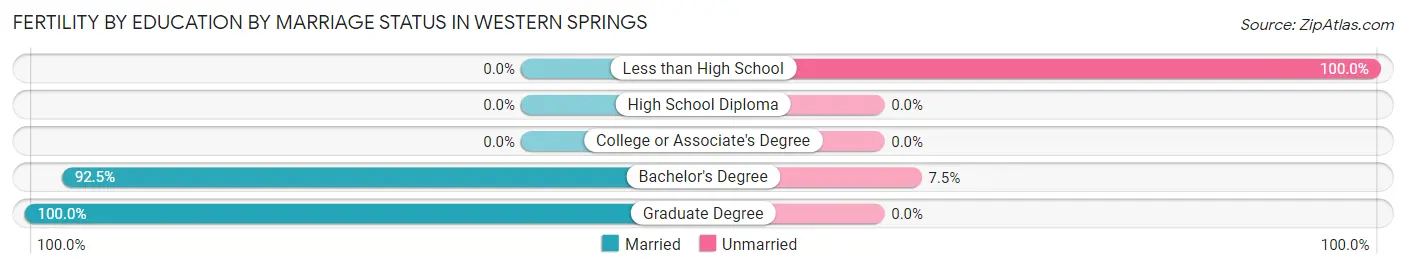
| Educational Attainment | Married | Unmarried |
| Less than High School | 0 (0.0%) | 7 (100.0%) |
| High School Diploma | 0 (0.0%) | 0 (0.0%) |
| College or Associate's Degree | 0 (0.0%) | 0 (0.0%) |
| Bachelor's Degree | 74 (92.5%) | 6 (7.5%) |
| Graduate Degree | 104 (100.0%) | 0 (0.0%) |
| Total | 178 (93.2%) | 13 (6.8%) |
Employment Characteristics in Western Springs
Employment by Class of Employer in Western Springs
Among the 5,932 employed individuals in Western Springs, private company employees (3,848 | 64.9%), self-employed (incorporated) (599 | 10.1%), and not-for-profit organizations (560 | 9.4%) make up the most common classes of employment.
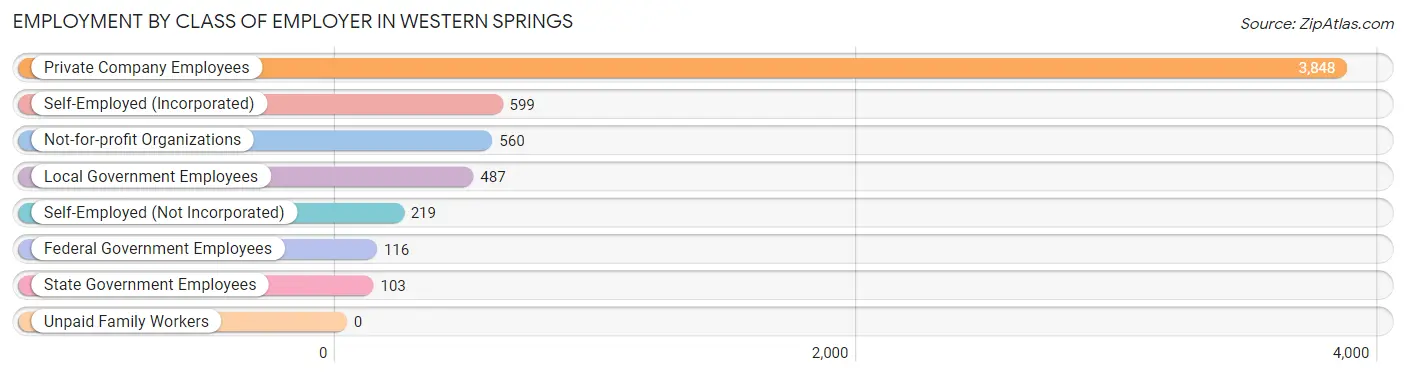
| Employer Class | # Employees | % Employees |
| Private Company Employees | 3,848 | 64.9% |
| Self-Employed (Incorporated) | 599 | 10.1% |
| Self-Employed (Not Incorporated) | 219 | 3.7% |
| Not-for-profit Organizations | 560 | 9.4% |
| Local Government Employees | 487 | 8.2% |
| State Government Employees | 103 | 1.7% |
| Federal Government Employees | 116 | 2.0% |
| Unpaid Family Workers | 0 | 0.0% |
| Total | 5,932 | 100.0% |
Employment Status by Age in Western Springs
According to the labor force statistics for Western Springs, out of the total population over 16 years of age (9,710), 63.2% or 6,137 individuals are in the labor force, with 2.5% or 153 of them unemployed. The age group with the highest labor force participation rate is 25 to 29 years, with 88.2% or 195 individuals in the labor force. Within the labor force, the 25 to 29 years age range has the highest percentage of unemployed individuals, with 11.8% or 23 of them being unemployed.
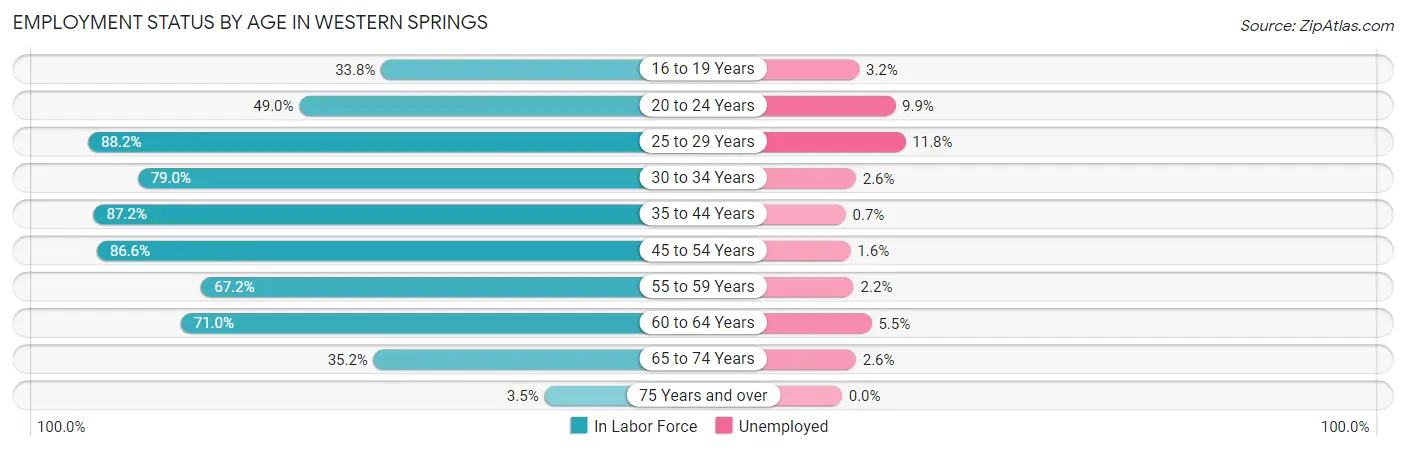
| Age Bracket | In Labor Force | Unemployed |
| 16 to 19 Years | 247 (33.8%) | 8 (3.2%) |
| 20 to 24 Years | 203 (49.0%) | 20 (9.9%) |
| 25 to 29 Years | 195 (88.2%) | 23 (11.8%) |
| 30 to 34 Years | 229 (79.0%) | 6 (2.6%) |
| 35 to 44 Years | 1,707 (87.2%) | 12 (0.7%) |
| 45 to 54 Years | 1,718 (86.6%) | 27 (1.6%) |
| 55 to 59 Years | 912 (67.2%) | 20 (2.2%) |
| 60 to 64 Years | 541 (71.0%) | 30 (5.5%) |
| 65 to 74 Years | 344 (35.2%) | 9 (2.6%) |
| 75 Years and over | 36 (3.5%) | 0 (0.0%) |
| Total | 6,137 (63.2%) | 153 (2.5%) |
Employment Status by Educational Attainment in Western Springs
According to labor force statistics for Western Springs, 80.7% of individuals (5,304) out of the total population between 25 and 64 years of age (6,572) are in the labor force, with 2.2% or 117 of them being unemployed. The group with the highest labor force participation rate are those with the educational attainment of college / associate degree, with 86.1% or 453 individuals in the labor force. Within the labor force, individuals with less than high school education have the highest percentage of unemployment, with 100.0% or 1 of them being unemployed.
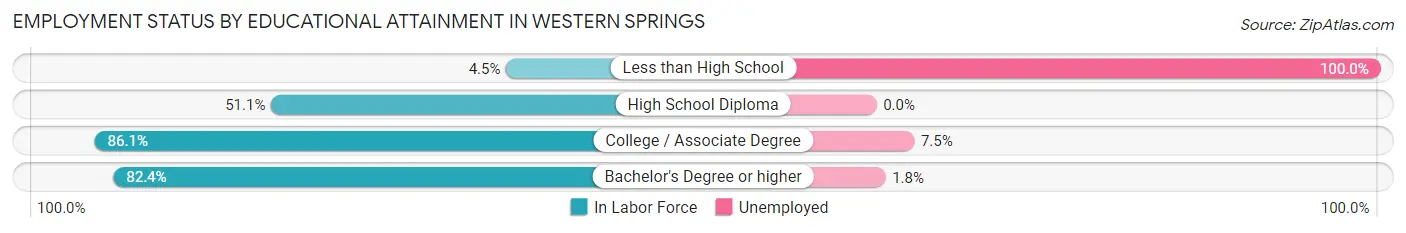
| Educational Attainment | In Labor Force | Unemployed |
| Less than High School | 1 (4.5%) | 22 (100.0%) |
| High School Diploma | 188 (51.1%) | 0 (0.0%) |
| College / Associate Degree | 453 (86.1%) | 39 (7.5%) |
| Bachelor's Degree or higher | 4,661 (82.4%) | 102 (1.8%) |
| Total | 5,304 (80.7%) | 145 (2.2%) |
Employment Occupations by Sex in Western Springs
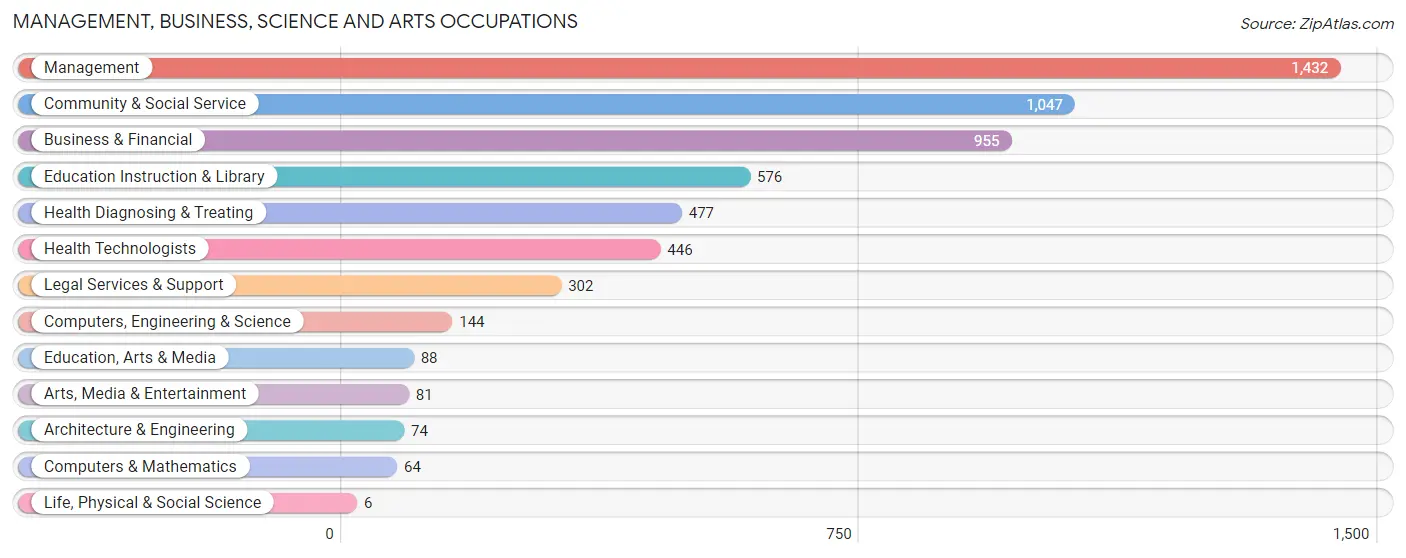
Management, Business, Science and Arts Occupations
The most common Management, Business, Science and Arts occupations in Western Springs are Management (1,432 | 23.9%), Community & Social Service (1,047 | 17.5%), Business & Financial (955 | 16.0%), Education Instruction & Library (576 | 9.6%), and Health Diagnosing & Treating (477 | 8.0%).
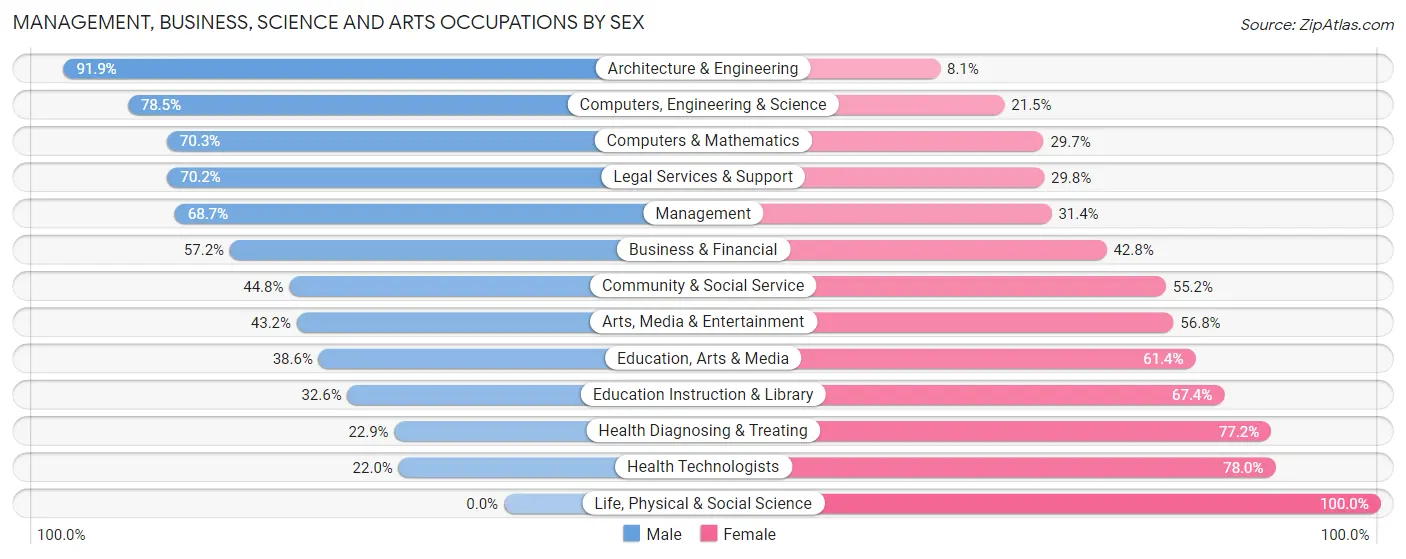
Management, Business, Science and Arts Occupations by Sex
Within the Management, Business, Science and Arts occupations in Western Springs, the most male-oriented occupations are Architecture & Engineering (91.9%), Computers, Engineering & Science (78.5%), and Computers & Mathematics (70.3%), while the most female-oriented occupations are Life, Physical & Social Science (100.0%), Health Technologists (78.0%), and Health Diagnosing & Treating (77.1%).
| Occupation | Male | Female |
| Management | 983 (68.6%) | 449 (31.4%) |
| Business & Financial | 546 (57.2%) | 409 (42.8%) |
| Computers, Engineering & Science | 113 (78.5%) | 31 (21.5%) |
| Computers & Mathematics | 45 (70.3%) | 19 (29.7%) |
| Architecture & Engineering | 68 (91.9%) | 6 (8.1%) |
| Life, Physical & Social Science | 0 (0.0%) | 6 (100.0%) |
| Community & Social Service | 469 (44.8%) | 578 (55.2%) |
| Education, Arts & Media | 34 (38.6%) | 54 (61.4%) |
| Legal Services & Support | 212 (70.2%) | 90 (29.8%) |
| Education Instruction & Library | 188 (32.6%) | 388 (67.4%) |
| Arts, Media & Entertainment | 35 (43.2%) | 46 (56.8%) |
| Health Diagnosing & Treating | 109 (22.9%) | 368 (77.1%) |
| Health Technologists | 98 (22.0%) | 348 (78.0%) |
| Total (Category) | 2,220 (54.7%) | 1,835 (45.3%) |
| Total (Overall) | 3,392 (56.7%) | 2,586 (43.3%) |
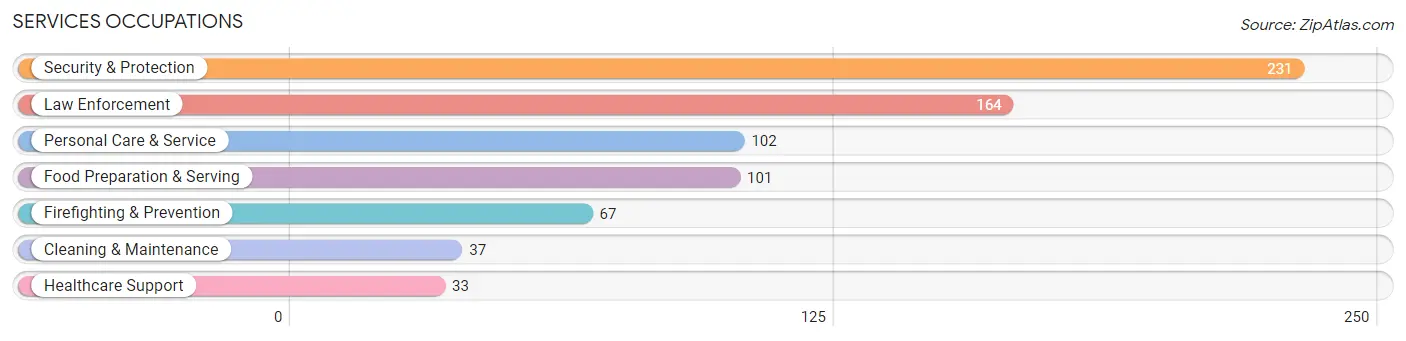
Services Occupations
The most common Services occupations in Western Springs are Security & Protection (231 | 3.9%), Law Enforcement (164 | 2.7%), Personal Care & Service (102 | 1.7%), Food Preparation & Serving (101 | 1.7%), and Firefighting & Prevention (67 | 1.1%).
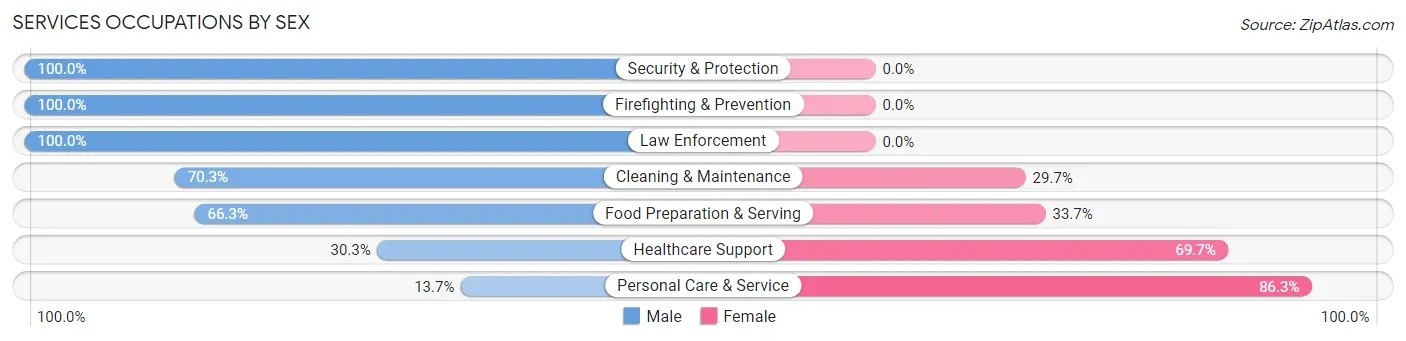
Services Occupations by Sex
Within the Services occupations in Western Springs, the most male-oriented occupations are Security & Protection (100.0%), Firefighting & Prevention (100.0%), and Law Enforcement (100.0%), while the most female-oriented occupations are Personal Care & Service (86.3%), Healthcare Support (69.7%), and Food Preparation & Serving (33.7%).
| Occupation | Male | Female |
| Healthcare Support | 10 (30.3%) | 23 (69.7%) |
| Security & Protection | 231 (100.0%) | 0 (0.0%) |
| Firefighting & Prevention | 67 (100.0%) | 0 (0.0%) |
| Law Enforcement | 164 (100.0%) | 0 (0.0%) |
| Food Preparation & Serving | 67 (66.3%) | 34 (33.7%) |
| Cleaning & Maintenance | 26 (70.3%) | 11 (29.7%) |
| Personal Care & Service | 14 (13.7%) | 88 (86.3%) |
| Total (Category) | 348 (69.1%) | 156 (30.9%) |
| Total (Overall) | 3,392 (56.7%) | 2,586 (43.3%) |
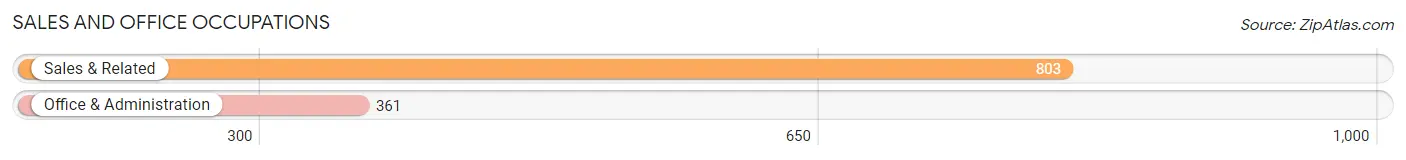
Sales and Office Occupations
The most common Sales and Office occupations in Western Springs are Sales & Related (803 | 13.4%), and Office & Administration (361 | 6.0%).
Sales and Office Occupations by Sex
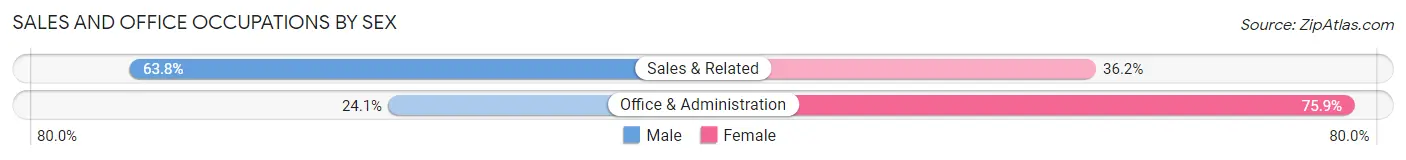
| Occupation | Male | Female |
| Sales & Related | 512 (63.8%) | 291 (36.2%) |
| Office & Administration | 87 (24.1%) | 274 (75.9%) |
| Total (Category) | 599 (51.5%) | 565 (48.5%) |
| Total (Overall) | 3,392 (56.7%) | 2,586 (43.3%) |
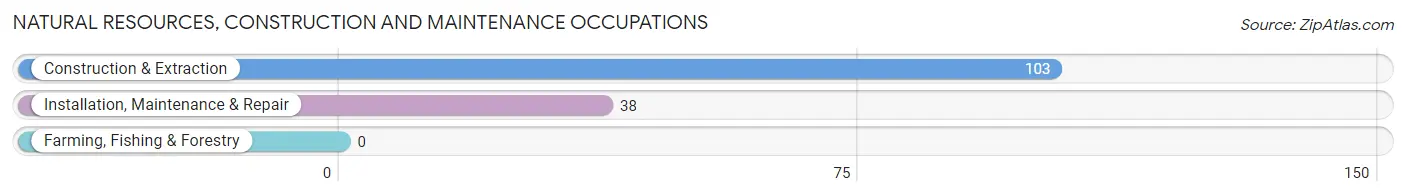
Natural Resources, Construction and Maintenance Occupations
The most common Natural Resources, Construction and Maintenance occupations in Western Springs are Construction & Extraction (103 | 1.7%), and Installation, Maintenance & Repair (38 | 0.6%).
Natural Resources, Construction and Maintenance Occupations by Sex
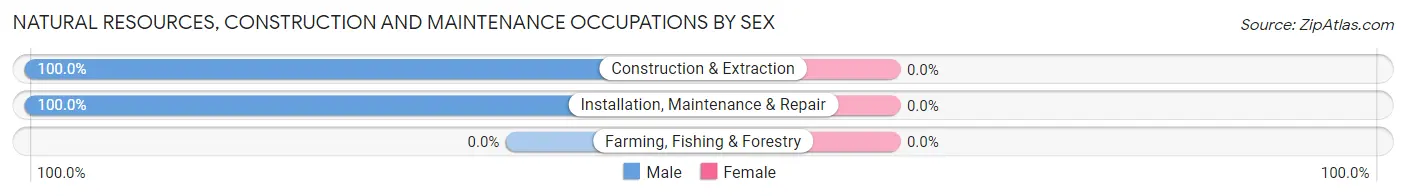
| Occupation | Male | Female |
| Farming, Fishing & Forestry | 0 (0.0%) | 0 (0.0%) |
| Construction & Extraction | 103 (100.0%) | 0 (0.0%) |
| Installation, Maintenance & Repair | 38 (100.0%) | 0 (0.0%) |
| Total (Category) | 141 (100.0%) | 0 (0.0%) |
| Total (Overall) | 3,392 (56.7%) | 2,586 (43.3%) |
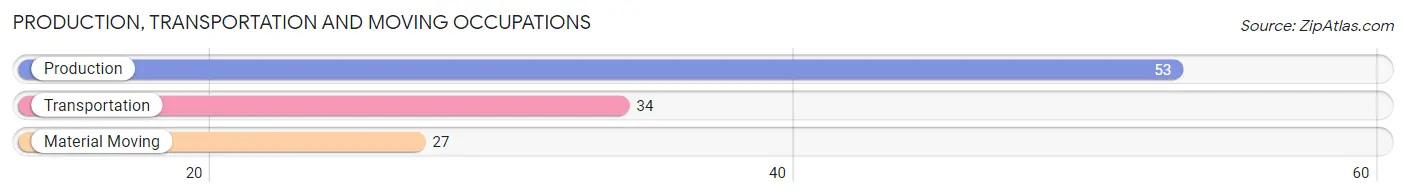
Production, Transportation and Moving Occupations
The most common Production, Transportation and Moving occupations in Western Springs are Production (53 | 0.9%), Transportation (34 | 0.6%), and Material Moving (27 | 0.4%).
Production, Transportation and Moving Occupations by Sex
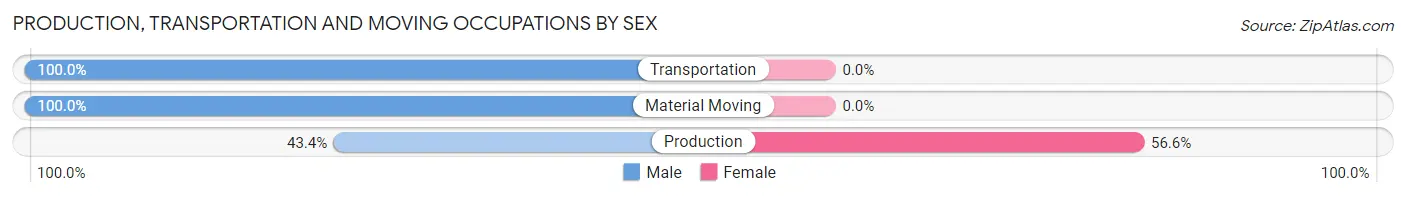
| Occupation | Male | Female |
| Production | 23 (43.4%) | 30 (56.6%) |
| Transportation | 34 (100.0%) | 0 (0.0%) |
| Material Moving | 27 (100.0%) | 0 (0.0%) |
| Total (Category) | 84 (73.7%) | 30 (26.3%) |
| Total (Overall) | 3,392 (56.7%) | 2,586 (43.3%) |
Employment Industries by Sex in Western Springs
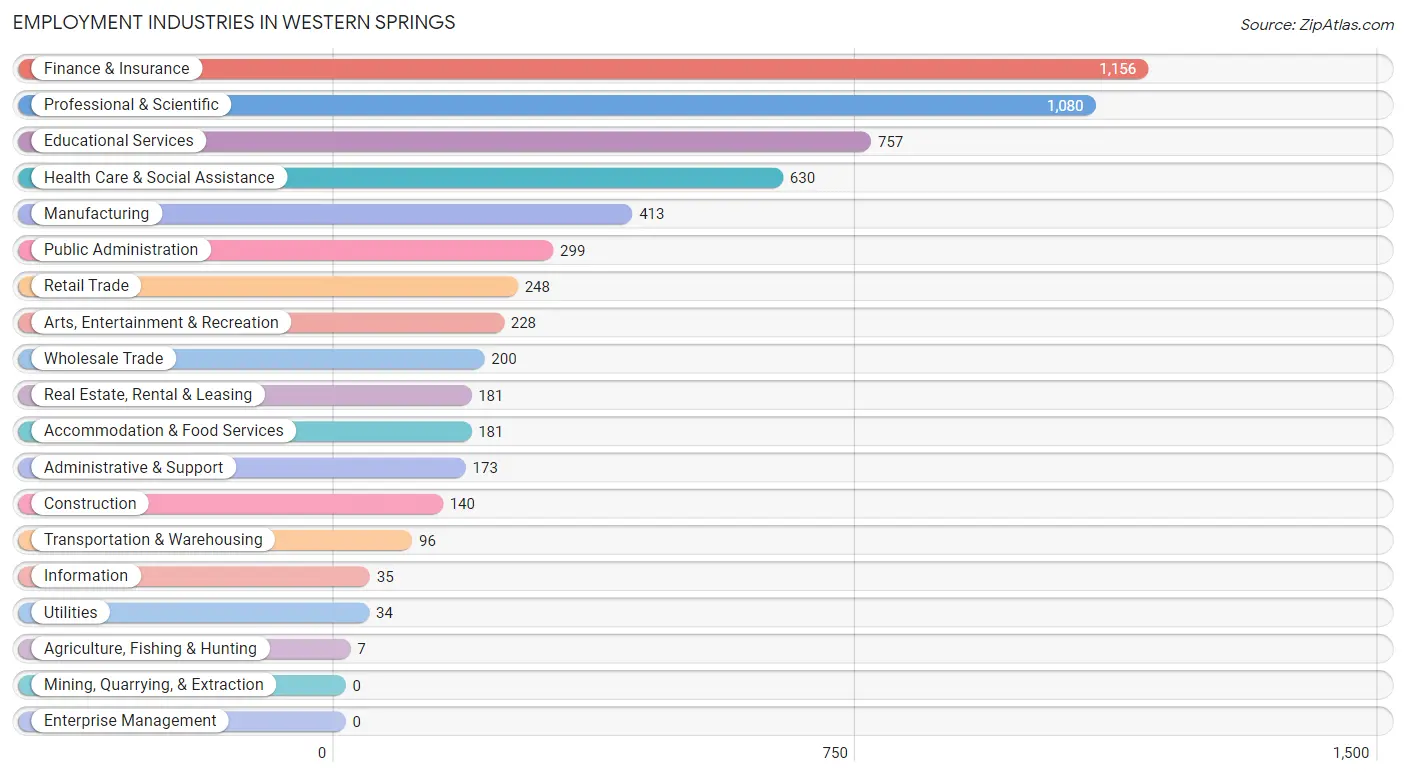
Employment Industries in Western Springs
The major employment industries in Western Springs include Finance & Insurance (1,156 | 19.3%), Professional & Scientific (1,080 | 18.1%), Educational Services (757 | 12.7%), Health Care & Social Assistance (630 | 10.5%), and Manufacturing (413 | 6.9%).
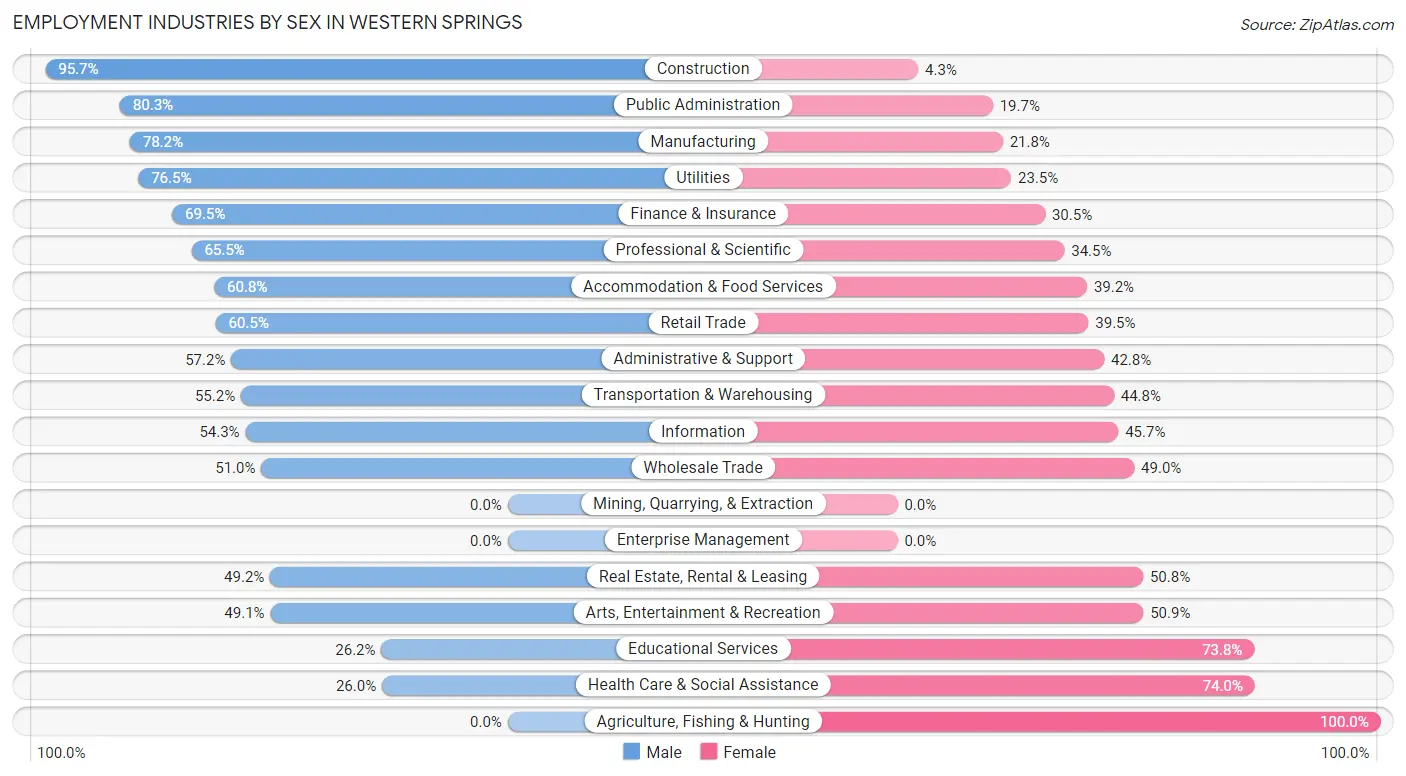
Employment Industries by Sex in Western Springs
The Western Springs industries that see more men than women are Construction (95.7%), Public Administration (80.3%), and Manufacturing (78.2%), whereas the industries that tend to have a higher number of women are Agriculture, Fishing & Hunting (100.0%), Health Care & Social Assistance (74.0%), and Educational Services (73.8%).
| Industry | Male | Female |
| Agriculture, Fishing & Hunting | 0 (0.0%) | 7 (100.0%) |
| Mining, Quarrying, & Extraction | 0 (0.0%) | 0 (0.0%) |
| Construction | 134 (95.7%) | 6 (4.3%) |
| Manufacturing | 323 (78.2%) | 90 (21.8%) |
| Wholesale Trade | 102 (51.0%) | 98 (49.0%) |
| Retail Trade | 150 (60.5%) | 98 (39.5%) |
| Transportation & Warehousing | 53 (55.2%) | 43 (44.8%) |
| Utilities | 26 (76.5%) | 8 (23.5%) |
| Information | 19 (54.3%) | 16 (45.7%) |
| Finance & Insurance | 803 (69.5%) | 353 (30.5%) |
| Real Estate, Rental & Leasing | 89 (49.2%) | 92 (50.8%) |
| Professional & Scientific | 707 (65.5%) | 373 (34.5%) |
| Enterprise Management | 0 (0.0%) | 0 (0.0%) |
| Administrative & Support | 99 (57.2%) | 74 (42.8%) |
| Educational Services | 198 (26.2%) | 559 (73.8%) |
| Health Care & Social Assistance | 164 (26.0%) | 466 (74.0%) |
| Arts, Entertainment & Recreation | 112 (49.1%) | 116 (50.9%) |
| Accommodation & Food Services | 110 (60.8%) | 71 (39.2%) |
| Public Administration | 240 (80.3%) | 59 (19.7%) |
| Total | 3,392 (56.7%) | 2,586 (43.3%) |
Education in Western Springs
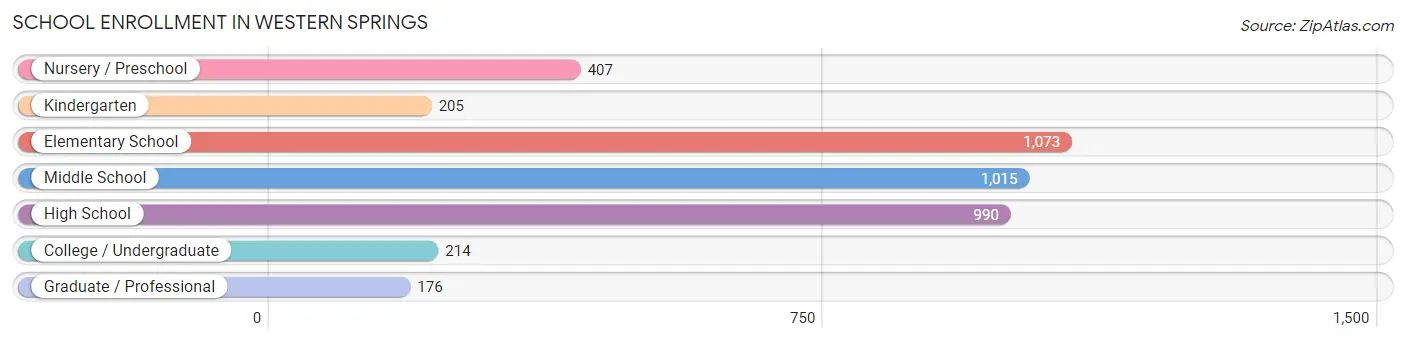
School Enrollment in Western Springs
The most common levels of schooling among the 4,080 students in Western Springs are elementary school (1,073 | 26.3%), middle school (1,015 | 24.9%), and high school (990 | 24.3%).
| School Level | # Students | % Students |
| Nursery / Preschool | 407 | 10.0% |
| Kindergarten | 205 | 5.0% |
| Elementary School | 1,073 | 26.3% |
| Middle School | 1,015 | 24.9% |
| High School | 990 | 24.3% |
| College / Undergraduate | 214 | 5.2% |
| Graduate / Professional | 176 | 4.3% |
| Total | 4,080 | 100.0% |
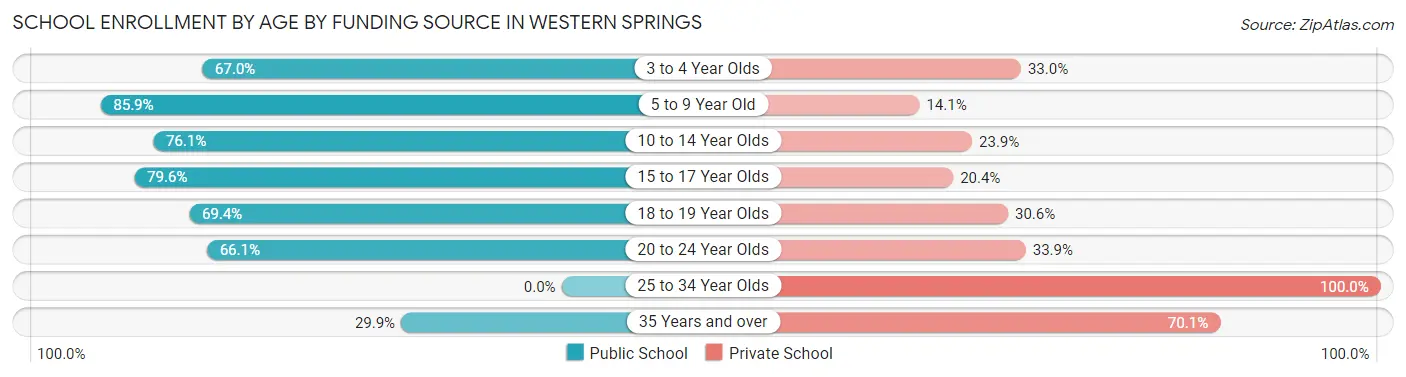
School Enrollment by Age by Funding Source in Western Springs
Out of a total of 4,080 students who are enrolled in schools in Western Springs, 1,012 (24.8%) attend a private institution, while the remaining 3,068 (75.2%) are enrolled in public schools. The age group of 25 to 34 year olds has the highest likelihood of being enrolled in private schools, with 34 (100.0% in the age bracket) enrolled. Conversely, the age group of 5 to 9 year old has the lowest likelihood of being enrolled in a private school, with 979 (85.9% in the age bracket) attending a public institution.
| Age Bracket | Public School | Private School |
| 3 to 4 Year Olds | 221 (67.0%) | 109 (33.0%) |
| 5 to 9 Year Old | 979 (85.9%) | 161 (14.1%) |
| 10 to 14 Year Olds | 986 (76.1%) | 310 (23.9%) |
| 15 to 17 Year Olds | 601 (79.6%) | 154 (20.4%) |
| 18 to 19 Year Olds | 145 (69.4%) | 64 (30.6%) |
| 20 to 24 Year Olds | 74 (66.1%) | 38 (33.9%) |
| 25 to 34 Year Olds | 0 (0.0%) | 34 (100.0%) |
| 35 Years and over | 61 (29.9%) | 143 (70.1%) |
| Total | 3,068 (75.2%) | 1,012 (24.8%) |
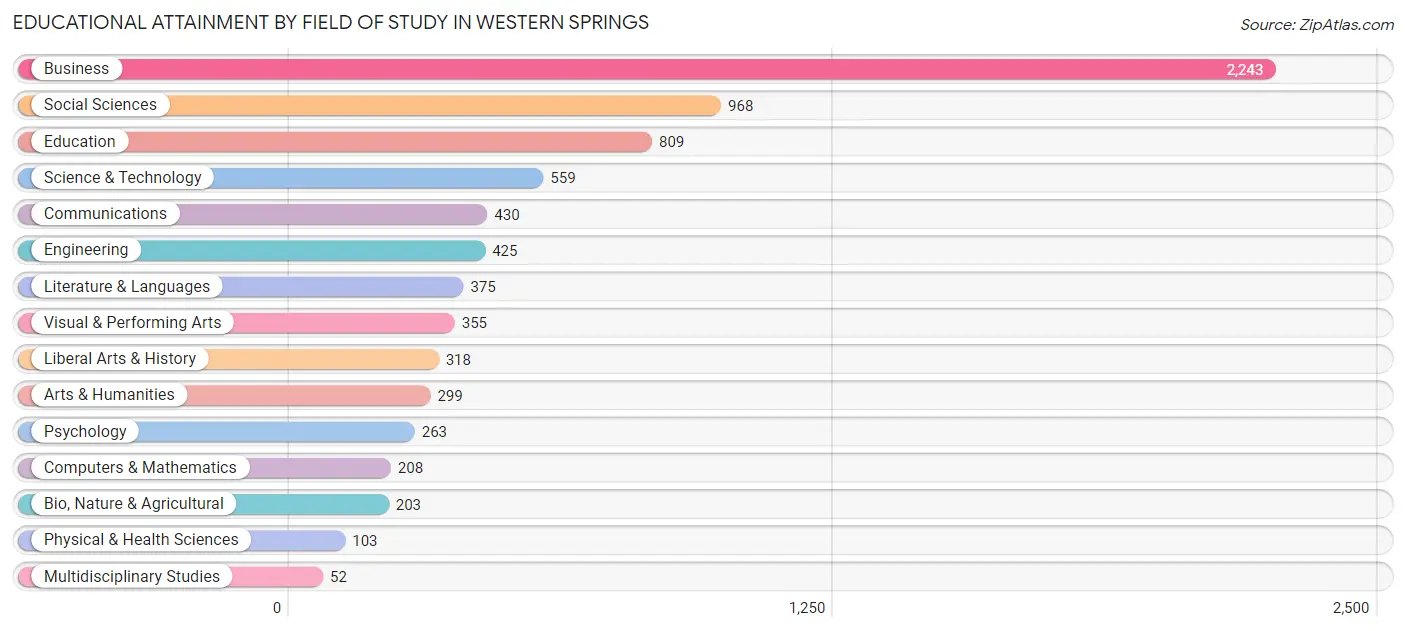
Educational Attainment by Field of Study in Western Springs
Business (2,243 | 29.5%), social sciences (968 | 12.7%), education (809 | 10.6%), science & technology (559 | 7.3%), and communications (430 | 5.7%) are the most common fields of study among 7,610 individuals in Western Springs who have obtained a bachelor's degree or higher.
| Field of Study | # Graduates | % Graduates |
| Computers & Mathematics | 208 | 2.7% |
| Bio, Nature & Agricultural | 203 | 2.7% |
| Physical & Health Sciences | 103 | 1.3% |
| Psychology | 263 | 3.5% |
| Social Sciences | 968 | 12.7% |
| Engineering | 425 | 5.6% |
| Multidisciplinary Studies | 52 | 0.7% |
| Science & Technology | 559 | 7.3% |
| Business | 2,243 | 29.5% |
| Education | 809 | 10.6% |
| Literature & Languages | 375 | 4.9% |
| Liberal Arts & History | 318 | 4.2% |
| Visual & Performing Arts | 355 | 4.7% |
| Communications | 430 | 5.7% |
| Arts & Humanities | 299 | 3.9% |
| Total | 7,610 | 100.0% |
Transportation & Commute in Western Springs
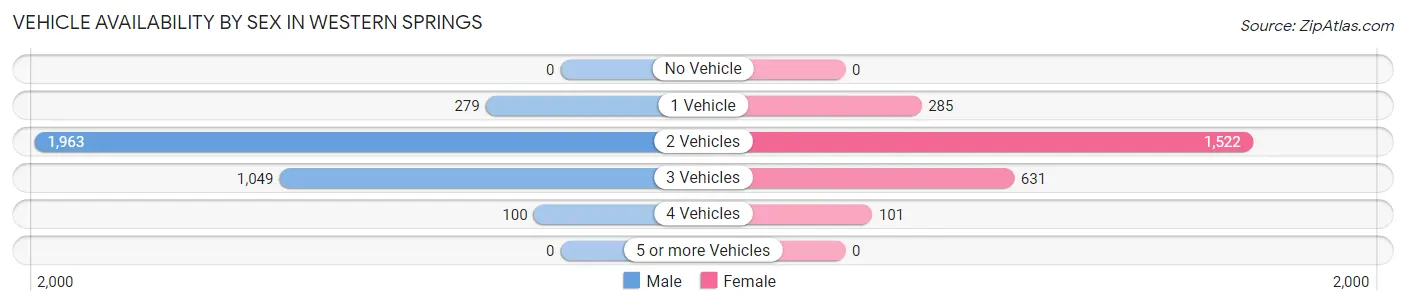
Vehicle Availability by Sex in Western Springs
The most prevalent vehicle ownership categories in Western Springs are males with 2 vehicles (1,963, accounting for 57.9%) and females with 2 vehicles (1,522, making up 77.3%).
| Vehicles Available | Male | Female |
| No Vehicle | 0 (0.0%) | 0 (0.0%) |
| 1 Vehicle | 279 (8.2%) | 285 (11.2%) |
| 2 Vehicles | 1,963 (57.9%) | 1,522 (59.9%) |
| 3 Vehicles | 1,049 (30.9%) | 631 (24.8%) |
| 4 Vehicles | 100 (2.9%) | 101 (4.0%) |
| 5 or more Vehicles | 0 (0.0%) | 0 (0.0%) |
| Total | 3,391 (100.0%) | 2,539 (100.0%) |
Commute Time in Western Springs
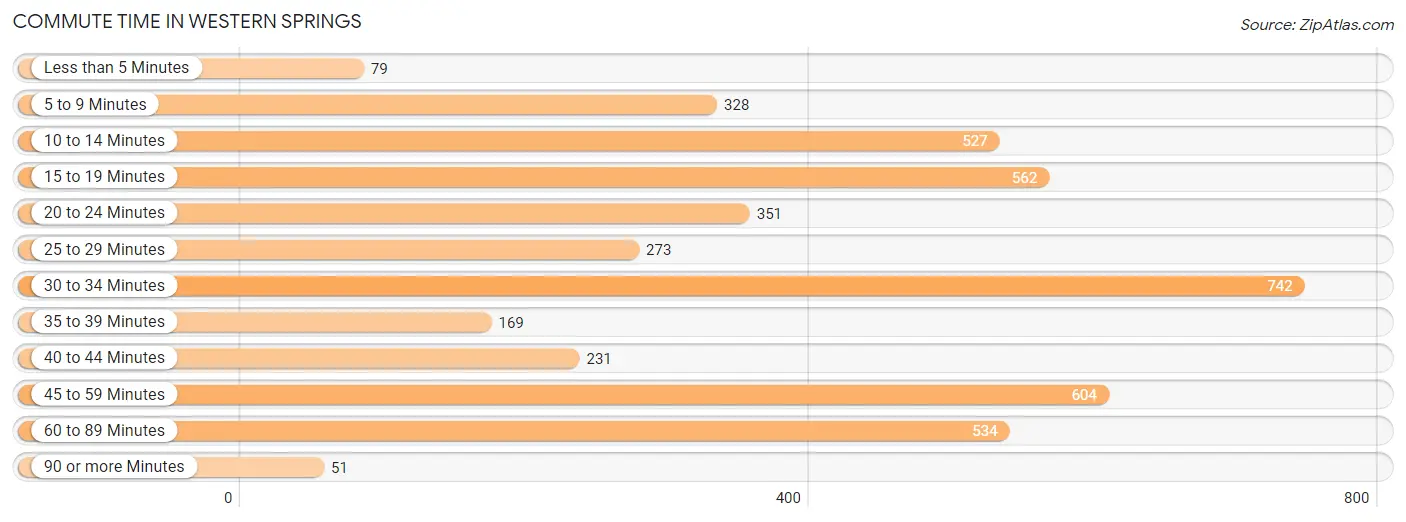
The most frequently occuring commute durations in Western Springs are 30 to 34 minutes (742 commuters, 16.7%), 45 to 59 minutes (604 commuters, 13.6%), and 15 to 19 minutes (562 commuters, 12.6%).
| Commute Time | # Commuters | % Commuters |
| Less than 5 Minutes | 79 | 1.8% |
| 5 to 9 Minutes | 328 | 7.4% |
| 10 to 14 Minutes | 527 | 11.8% |
| 15 to 19 Minutes | 562 | 12.6% |
| 20 to 24 Minutes | 351 | 7.9% |
| 25 to 29 Minutes | 273 | 6.1% |
| 30 to 34 Minutes | 742 | 16.7% |
| 35 to 39 Minutes | 169 | 3.8% |
| 40 to 44 Minutes | 231 | 5.2% |
| 45 to 59 Minutes | 604 | 13.6% |
| 60 to 89 Minutes | 534 | 12.0% |
| 90 or more Minutes | 51 | 1.1% |
Commute Time by Sex in Western Springs
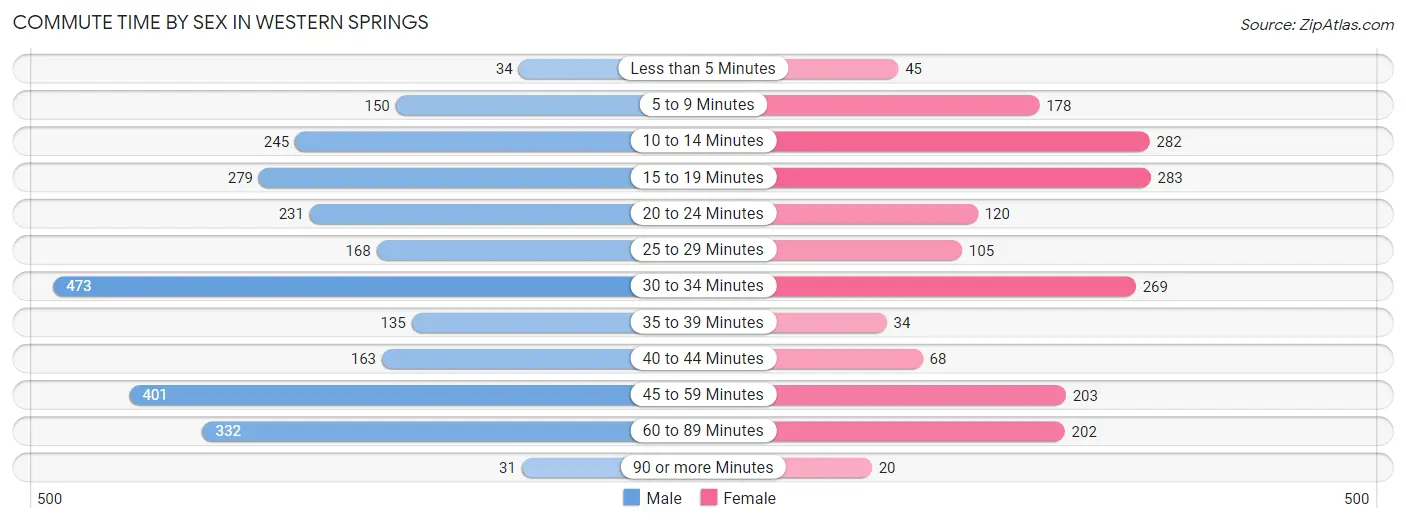
The most common commute times in Western Springs are 30 to 34 minutes (473 commuters, 17.9%) for males and 15 to 19 minutes (283 commuters, 15.6%) for females.
| Commute Time | Male | Female |
| Less than 5 Minutes | 34 (1.3%) | 45 (2.5%) |
| 5 to 9 Minutes | 150 (5.7%) | 178 (9.8%) |
| 10 to 14 Minutes | 245 (9.3%) | 282 (15.6%) |
| 15 to 19 Minutes | 279 (10.6%) | 283 (15.6%) |
| 20 to 24 Minutes | 231 (8.7%) | 120 (6.6%) |
| 25 to 29 Minutes | 168 (6.4%) | 105 (5.8%) |
| 30 to 34 Minutes | 473 (17.9%) | 269 (14.9%) |
| 35 to 39 Minutes | 135 (5.1%) | 34 (1.9%) |
| 40 to 44 Minutes | 163 (6.2%) | 68 (3.8%) |
| 45 to 59 Minutes | 401 (15.2%) | 203 (11.2%) |
| 60 to 89 Minutes | 332 (12.6%) | 202 (11.2%) |
| 90 or more Minutes | 31 (1.2%) | 20 (1.1%) |
Time of Departure to Work by Sex in Western Springs
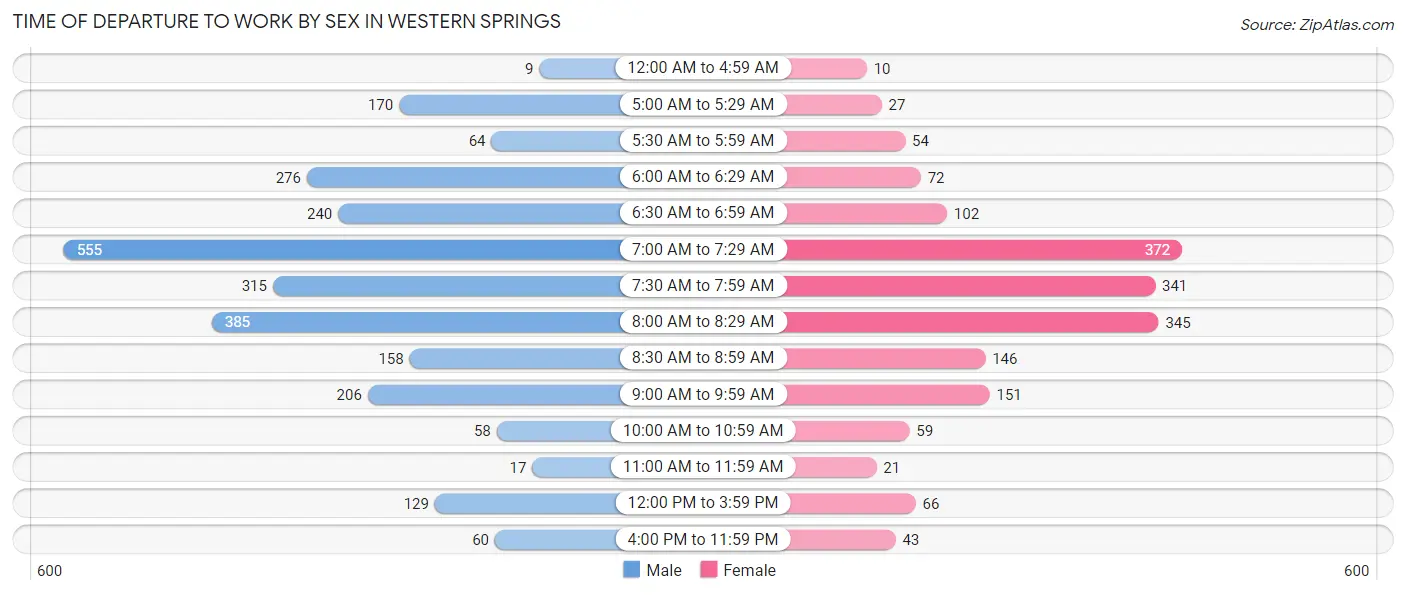
The most frequent times of departure to work in Western Springs are 7:00 AM to 7:29 AM (555, 21.0%) for males and 7:00 AM to 7:29 AM (372, 20.6%) for females.
| Time of Departure | Male | Female |
| 12:00 AM to 4:59 AM | 9 (0.3%) | 10 (0.5%) |
| 5:00 AM to 5:29 AM | 170 (6.4%) | 27 (1.5%) |
| 5:30 AM to 5:59 AM | 64 (2.4%) | 54 (3.0%) |
| 6:00 AM to 6:29 AM | 276 (10.4%) | 72 (4.0%) |
| 6:30 AM to 6:59 AM | 240 (9.1%) | 102 (5.6%) |
| 7:00 AM to 7:29 AM | 555 (21.0%) | 372 (20.6%) |
| 7:30 AM to 7:59 AM | 315 (11.9%) | 341 (18.9%) |
| 8:00 AM to 8:29 AM | 385 (14.6%) | 345 (19.1%) |
| 8:30 AM to 8:59 AM | 158 (6.0%) | 146 (8.1%) |
| 9:00 AM to 9:59 AM | 206 (7.8%) | 151 (8.4%) |
| 10:00 AM to 10:59 AM | 58 (2.2%) | 59 (3.3%) |
| 11:00 AM to 11:59 AM | 17 (0.6%) | 21 (1.2%) |
| 12:00 PM to 3:59 PM | 129 (4.9%) | 66 (3.6%) |
| 4:00 PM to 11:59 PM | 60 (2.3%) | 43 (2.4%) |
| Total | 2,642 (100.0%) | 1,809 (100.0%) |
Housing Occupancy in Western Springs
Occupancy by Ownership in Western Springs
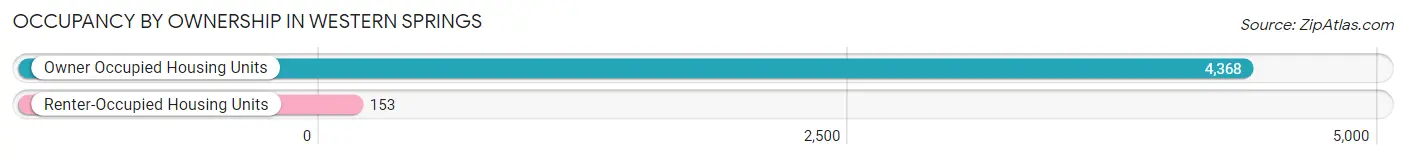
Of the total 4,521 dwellings in Western Springs, owner-occupied units account for 4,368 (96.6%), while renter-occupied units make up 153 (3.4%).
| Occupancy | # Housing Units | % Housing Units |
| Owner Occupied Housing Units | 4,368 | 96.6% |
| Renter-Occupied Housing Units | 153 | 3.4% |
| Total Occupied Housing Units | 4,521 | 100.0% |
Occupancy by Household Size in Western Springs
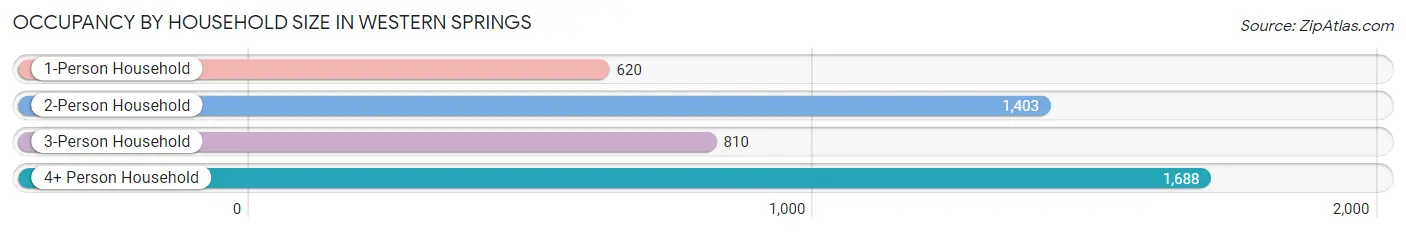
| Household Size | # Housing Units | % Housing Units |
| 1-Person Household | 620 | 13.7% |
| 2-Person Household | 1,403 | 31.0% |
| 3-Person Household | 810 | 17.9% |
| 4+ Person Household | 1,688 | 37.3% |
| Total Housing Units | 4,521 | 100.0% |
Occupancy by Ownership by Household Size in Western Springs
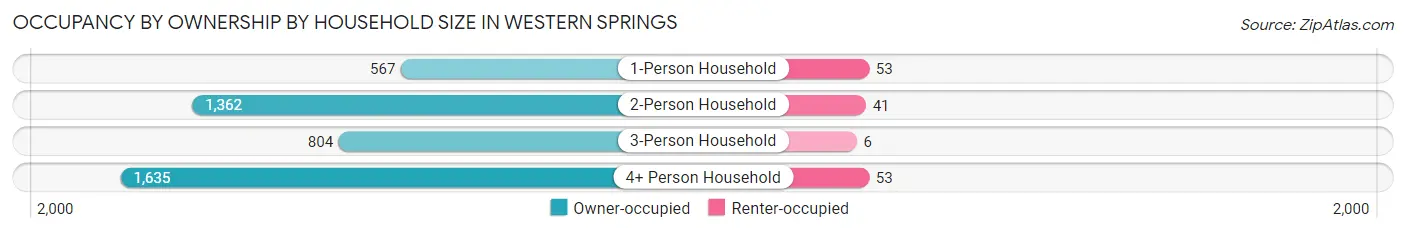
| Household Size | Owner-occupied | Renter-occupied |
| 1-Person Household | 567 (91.4%) | 53 (8.6%) |
| 2-Person Household | 1,362 (97.1%) | 41 (2.9%) |
| 3-Person Household | 804 (99.3%) | 6 (0.7%) |
| 4+ Person Household | 1,635 (96.9%) | 53 (3.1%) |
| Total Housing Units | 4,368 (96.6%) | 153 (3.4%) |
Occupancy by Educational Attainment in Western Springs
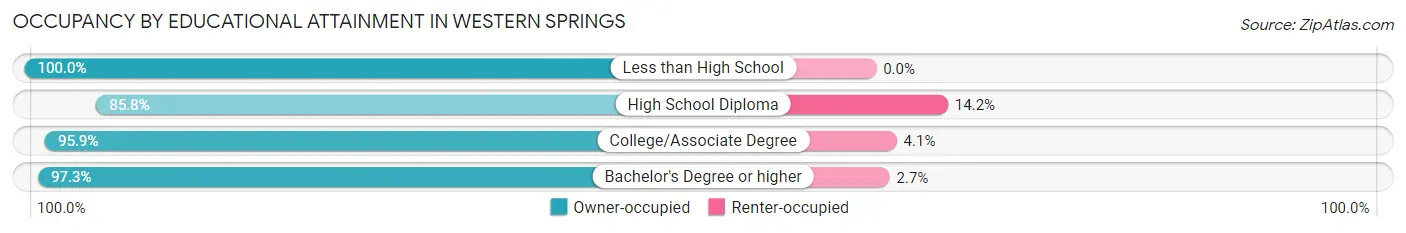
| Household Size | Owner-occupied | Renter-occupied |
| Less than High School | 8 (100.0%) | 0 (0.0%) |
| High School Diploma | 199 (85.8%) | 33 (14.2%) |
| College/Associate Degree | 425 (95.9%) | 18 (4.1%) |
| Bachelor's Degree or higher | 3,736 (97.3%) | 102 (2.7%) |
Occupancy by Age of Householder in Western Springs
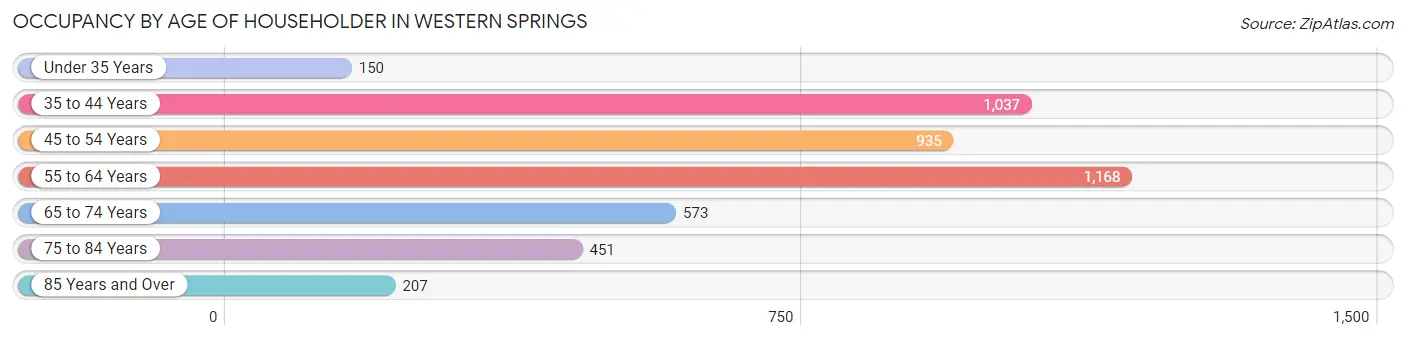
| Age Bracket | # Households | % Households |
| Under 35 Years | 150 | 3.3% |
| 35 to 44 Years | 1,037 | 22.9% |
| 45 to 54 Years | 935 | 20.7% |
| 55 to 64 Years | 1,168 | 25.8% |
| 65 to 74 Years | 573 | 12.7% |
| 75 to 84 Years | 451 | 10.0% |
| 85 Years and Over | 207 | 4.6% |
| Total | 4,521 | 100.0% |
Housing Finances in Western Springs
Median Income by Occupancy in Western Springs
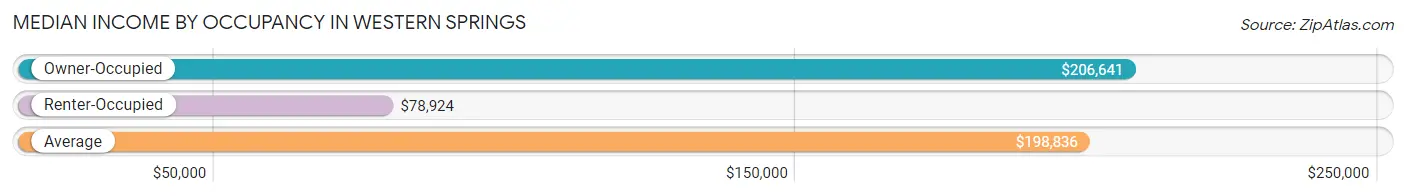
| Occupancy Type | # Households | Median Income |
| Owner-Occupied | 4,368 (96.6%) | $206,641 |
| Renter-Occupied | 153 (3.4%) | $78,924 |
| Average | 4,521 (100.0%) | $198,836 |
Occupancy by Householder Income Bracket in Western Springs
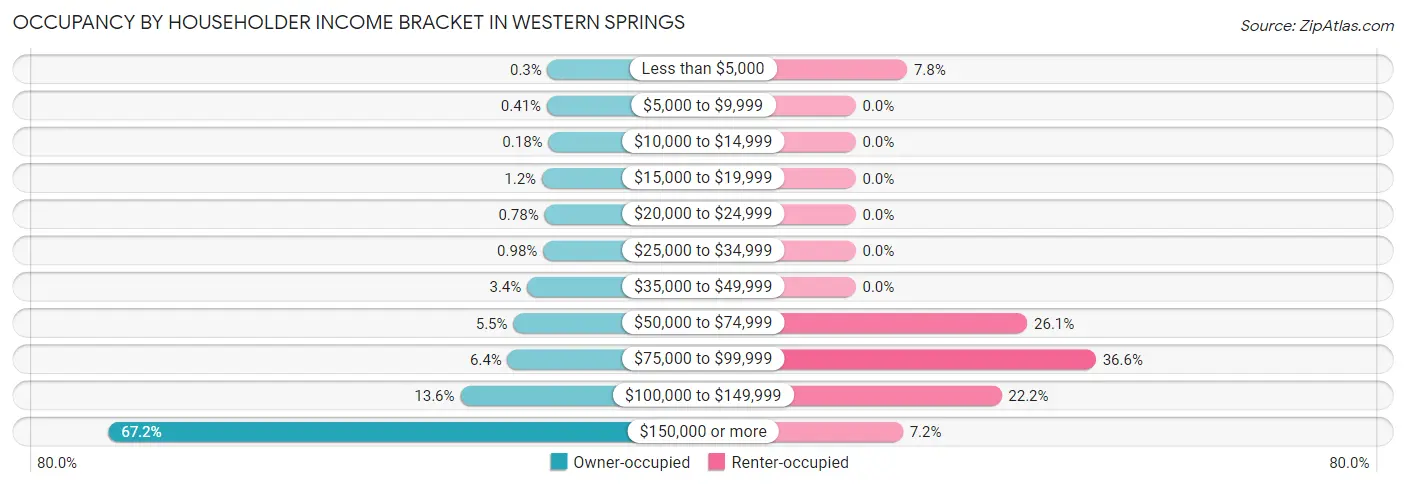
| Income Bracket | Owner-occupied | Renter-occupied |
| Less than $5,000 | 13 (0.3%) | 12 (7.8%) |
| $5,000 to $9,999 | 18 (0.4%) | 0 (0.0%) |
| $10,000 to $14,999 | 8 (0.2%) | 0 (0.0%) |
| $15,000 to $19,999 | 51 (1.2%) | 0 (0.0%) |
| $20,000 to $24,999 | 34 (0.8%) | 0 (0.0%) |
| $25,000 to $34,999 | 43 (1.0%) | 0 (0.0%) |
| $35,000 to $49,999 | 150 (3.4%) | 0 (0.0%) |
| $50,000 to $74,999 | 241 (5.5%) | 40 (26.1%) |
| $75,000 to $99,999 | 279 (6.4%) | 56 (36.6%) |
| $100,000 to $149,999 | 594 (13.6%) | 34 (22.2%) |
| $150,000 or more | 2,937 (67.2%) | 11 (7.2%) |
| Total | 4,368 (100.0%) | 153 (100.0%) |
Monthly Housing Cost Tiers in Western Springs
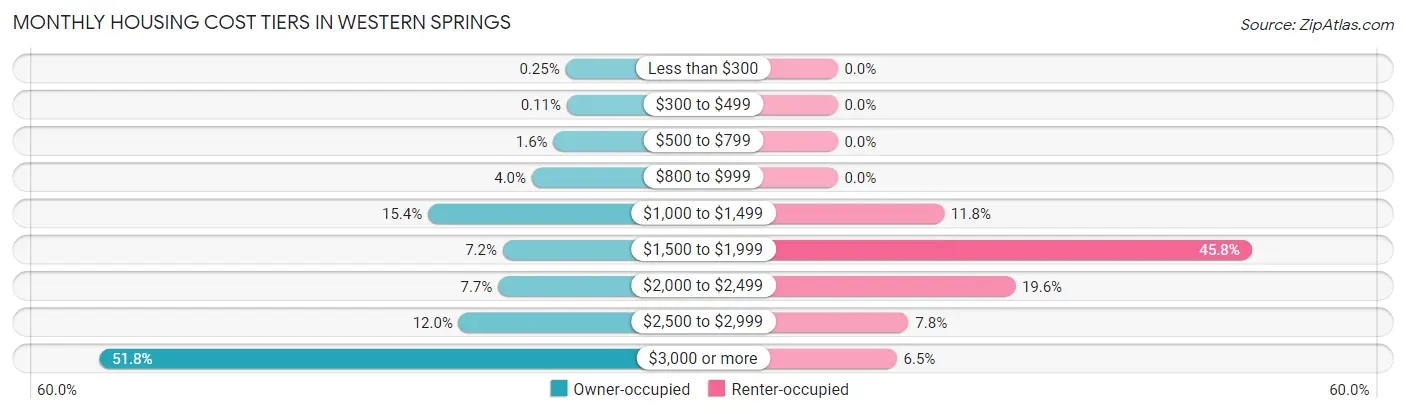
| Monthly Cost | Owner-occupied | Renter-occupied |
| Less than $300 | 11 (0.3%) | 0 (0.0%) |
| $300 to $499 | 5 (0.1%) | 0 (0.0%) |
| $500 to $799 | 69 (1.6%) | 0 (0.0%) |
| $800 to $999 | 173 (4.0%) | 0 (0.0%) |
| $1,000 to $1,499 | 674 (15.4%) | 18 (11.8%) |
| $1,500 to $1,999 | 313 (7.2%) | 70 (45.8%) |
| $2,000 to $2,499 | 336 (7.7%) | 30 (19.6%) |
| $2,500 to $2,999 | 526 (12.0%) | 12 (7.8%) |
| $3,000 or more | 2,261 (51.8%) | 10 (6.5%) |
| Total | 4,368 (100.0%) | 153 (100.0%) |
Physical Housing Characteristics in Western Springs
Housing Structures in Western Springs
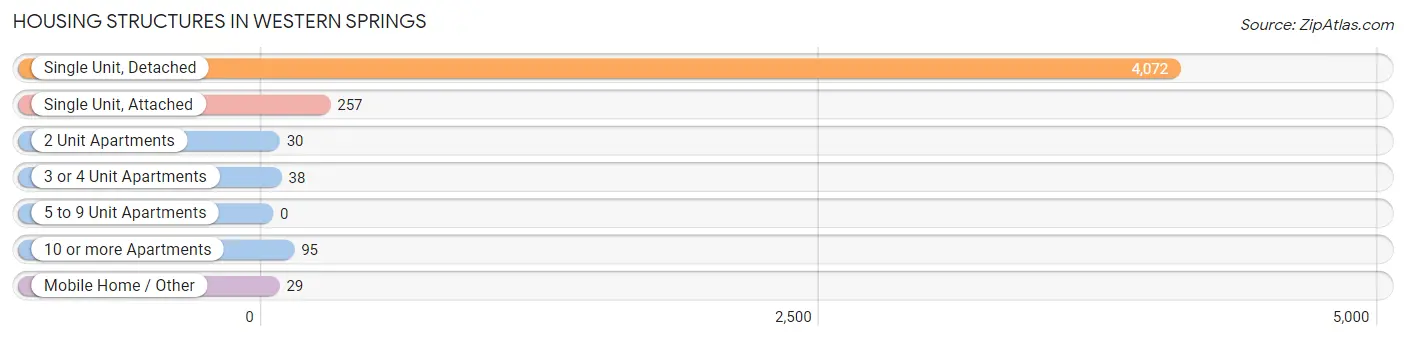
| Structure Type | # Housing Units | % Housing Units |
| Single Unit, Detached | 4,072 | 90.1% |
| Single Unit, Attached | 257 | 5.7% |
| 2 Unit Apartments | 30 | 0.7% |
| 3 or 4 Unit Apartments | 38 | 0.8% |
| 5 to 9 Unit Apartments | 0 | 0.0% |
| 10 or more Apartments | 95 | 2.1% |
| Mobile Home / Other | 29 | 0.6% |
| Total | 4,521 | 100.0% |
Housing Structures by Occupancy in Western Springs
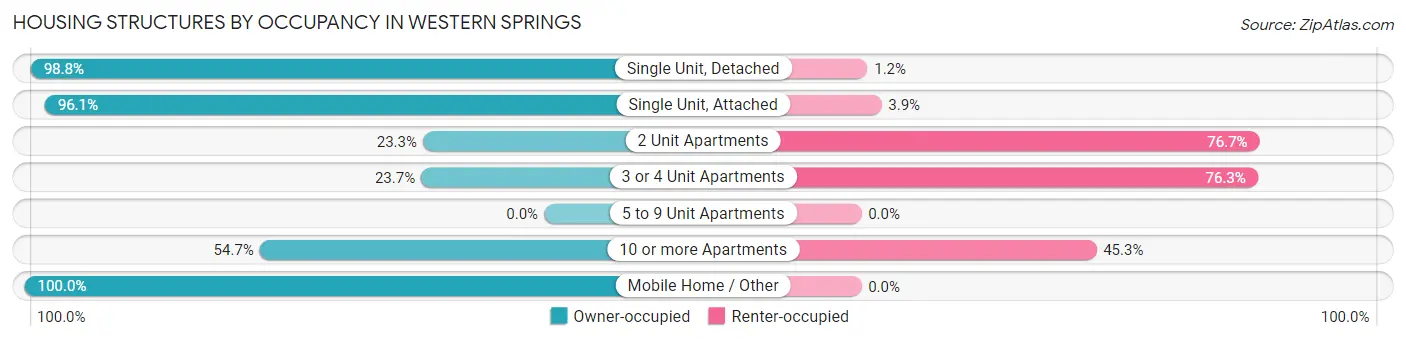
| Structure Type | Owner-occupied | Renter-occupied |
| Single Unit, Detached | 4,024 (98.8%) | 48 (1.2%) |
| Single Unit, Attached | 247 (96.1%) | 10 (3.9%) |
| 2 Unit Apartments | 7 (23.3%) | 23 (76.7%) |
| 3 or 4 Unit Apartments | 9 (23.7%) | 29 (76.3%) |
| 5 to 9 Unit Apartments | 0 (0.0%) | 0 (0.0%) |
| 10 or more Apartments | 52 (54.7%) | 43 (45.3%) |
| Mobile Home / Other | 29 (100.0%) | 0 (0.0%) |
| Total | 4,368 (96.6%) | 153 (3.4%) |
Housing Structures by Number of Rooms in Western Springs
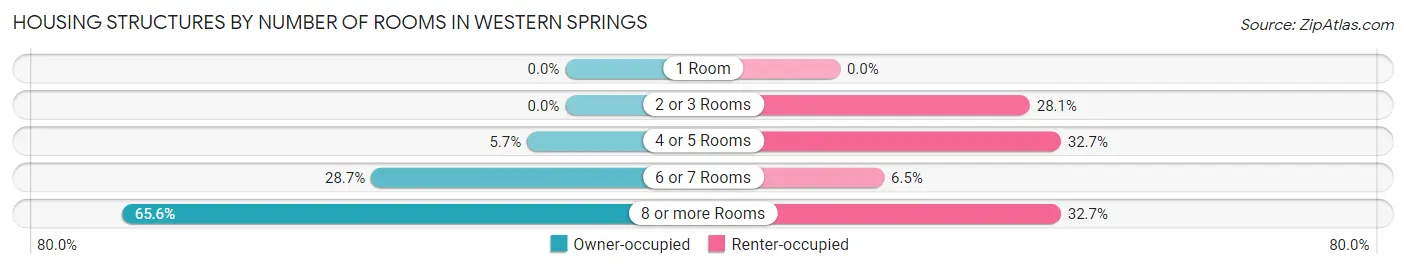
| Number of Rooms | Owner-occupied | Renter-occupied |
| 1 Room | 0 (0.0%) | 0 (0.0%) |
| 2 or 3 Rooms | 0 (0.0%) | 43 (28.1%) |
| 4 or 5 Rooms | 247 (5.7%) | 50 (32.7%) |
| 6 or 7 Rooms | 1,255 (28.7%) | 10 (6.5%) |
| 8 or more Rooms | 2,866 (65.6%) | 50 (32.7%) |
| Total | 4,368 (100.0%) | 153 (100.0%) |
Housing Structure by Heating Type in Western Springs
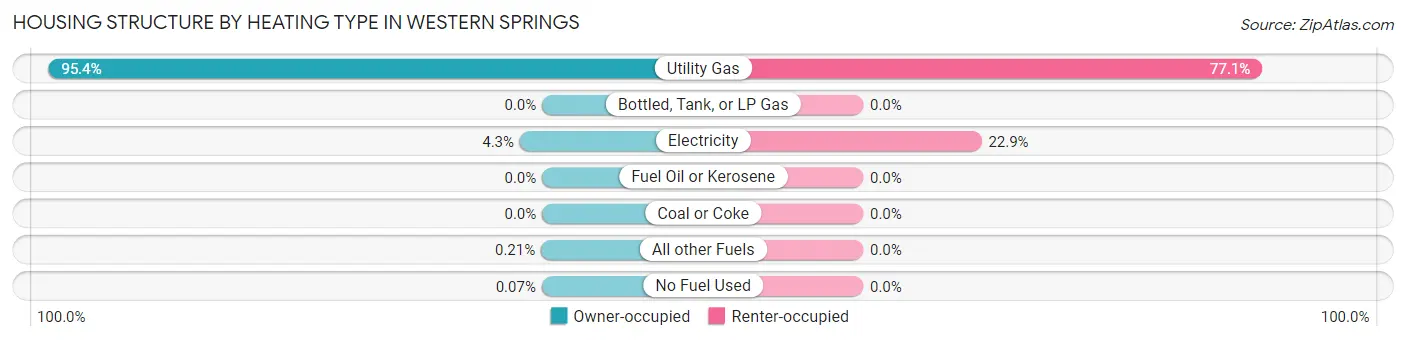
| Heating Type | Owner-occupied | Renter-occupied |
| Utility Gas | 4,168 (95.4%) | 118 (77.1%) |
| Bottled, Tank, or LP Gas | 0 (0.0%) | 0 (0.0%) |
| Electricity | 188 (4.3%) | 35 (22.9%) |
| Fuel Oil or Kerosene | 0 (0.0%) | 0 (0.0%) |
| Coal or Coke | 0 (0.0%) | 0 (0.0%) |
| All other Fuels | 9 (0.2%) | 0 (0.0%) |
| No Fuel Used | 3 (0.1%) | 0 (0.0%) |
| Total | 4,368 (100.0%) | 153 (100.0%) |
Household Vehicle Usage in Western Springs
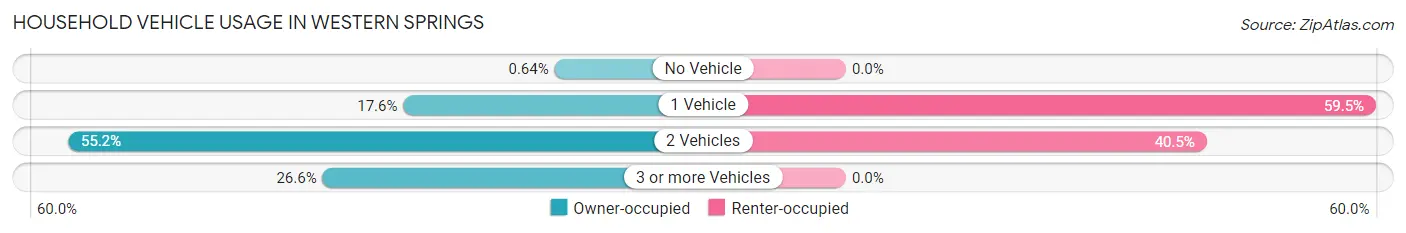
| Vehicles per Household | Owner-occupied | Renter-occupied |
| No Vehicle | 28 (0.6%) | 0 (0.0%) |
| 1 Vehicle | 768 (17.6%) | 91 (59.5%) |
| 2 Vehicles | 2,409 (55.1%) | 62 (40.5%) |
| 3 or more Vehicles | 1,163 (26.6%) | 0 (0.0%) |
| Total | 4,368 (100.0%) | 153 (100.0%) |
Real Estate & Mortgages in Western Springs
Real Estate and Mortgage Overview in Western Springs
| Characteristic | Without Mortgage | With Mortgage |
| Housing Units | 1,385 | 2,983 |
| Median Property Value | $605,300 | $710,700 |
| Median Household Income | $149,688 | $2,245 |
| Monthly Housing Costs | $1,287 | $2,175 |
| Real Estate Taxes | $10,001 | $5 |
Property Value by Mortgage Status in Western Springs
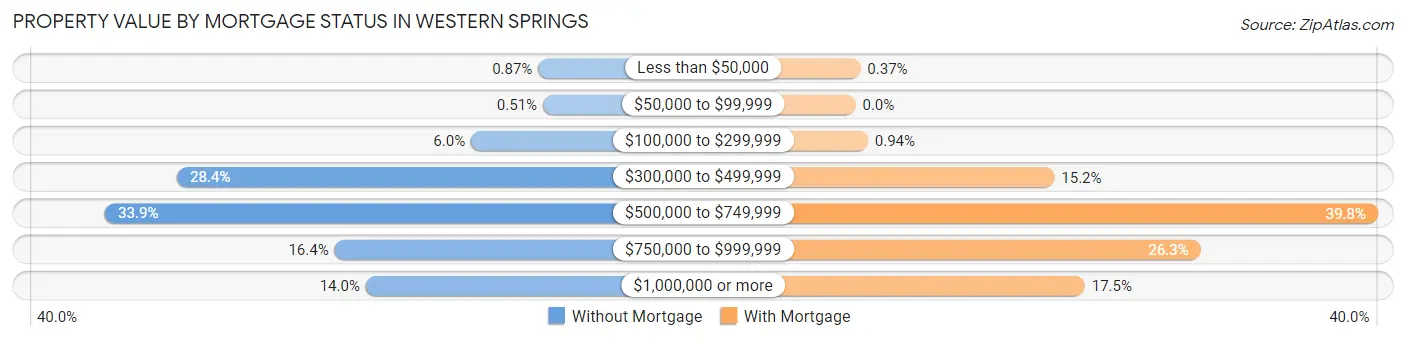
| Property Value | Without Mortgage | With Mortgage |
| Less than $50,000 | 12 (0.9%) | 11 (0.4%) |
| $50,000 to $99,999 | 7 (0.5%) | 0 (0.0%) |
| $100,000 to $299,999 | 83 (6.0%) | 28 (0.9%) |
| $300,000 to $499,999 | 393 (28.4%) | 452 (15.1%) |
| $500,000 to $749,999 | 469 (33.9%) | 1,187 (39.8%) |
| $750,000 to $999,999 | 227 (16.4%) | 784 (26.3%) |
| $1,000,000 or more | 194 (14.0%) | 521 (17.5%) |
| Total | 1,385 (100.0%) | 2,983 (100.0%) |
Household Income by Mortgage Status in Western Springs
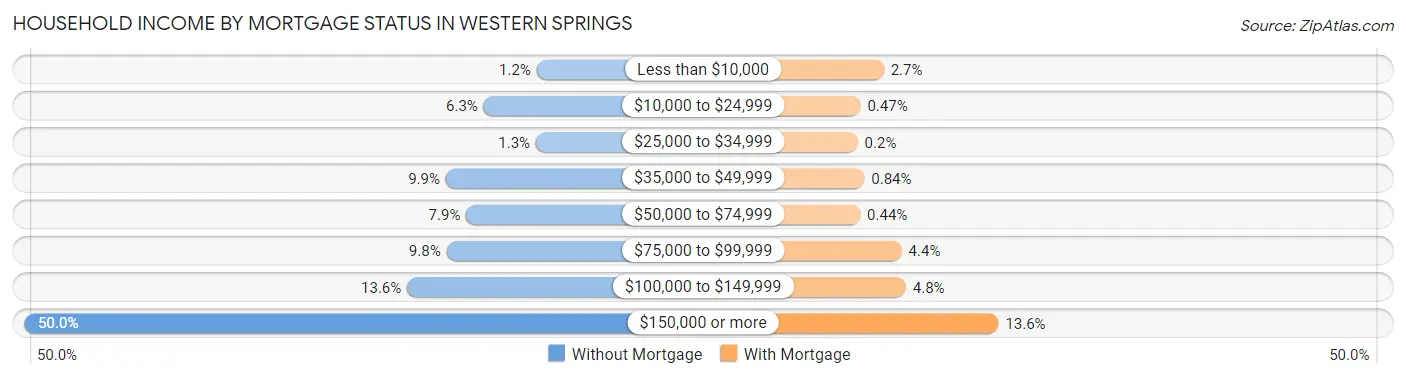
| Household Income | Without Mortgage | With Mortgage |
| Less than $10,000 | 17 (1.2%) | 80 (2.7%) |
| $10,000 to $24,999 | 87 (6.3%) | 14 (0.5%) |
| $25,000 to $34,999 | 18 (1.3%) | 6 (0.2%) |
| $35,000 to $49,999 | 137 (9.9%) | 25 (0.8%) |
| $50,000 to $74,999 | 110 (7.9%) | 13 (0.4%) |
| $75,000 to $99,999 | 136 (9.8%) | 131 (4.4%) |
| $100,000 to $149,999 | 188 (13.6%) | 143 (4.8%) |
| $150,000 or more | 692 (50.0%) | 406 (13.6%) |
| Total | 1,385 (100.0%) | 2,983 (100.0%) |
Property Value to Household Income Ratio in Western Springs
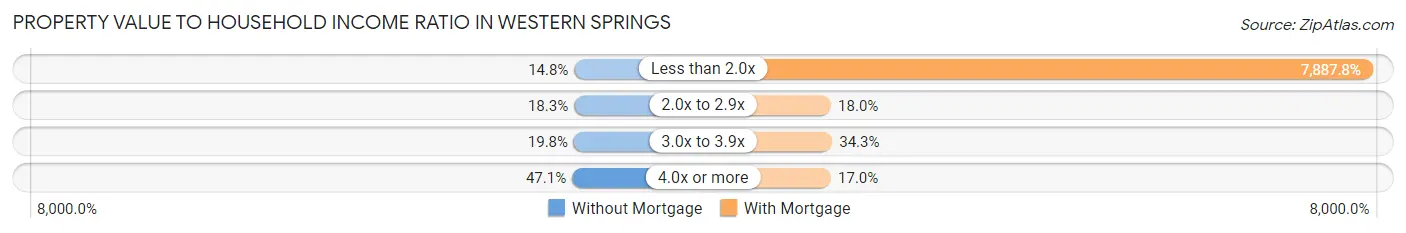
| Value-to-Income Ratio | Without Mortgage | With Mortgage |
| Less than 2.0x | 205 (14.8%) | 235,293 (7,887.8%) |
| 2.0x to 2.9x | 254 (18.3%) | 538 (18.0%) |
| 3.0x to 3.9x | 274 (19.8%) | 1,022 (34.3%) |
| 4.0x or more | 652 (47.1%) | 508 (17.0%) |
| Total | 1,385 (100.0%) | 2,983 (100.0%) |
Real Estate Taxes by Mortgage Status in Western Springs
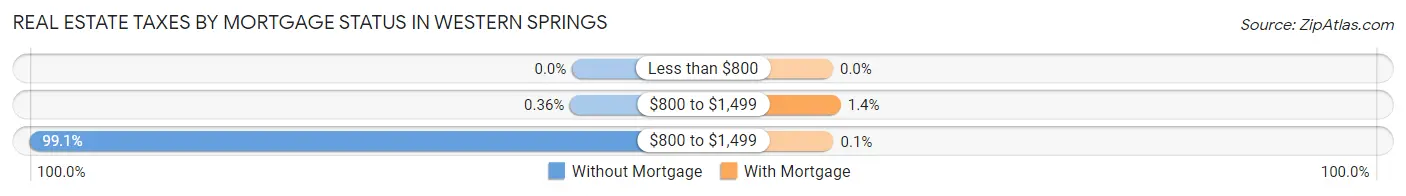
| Property Taxes | Without Mortgage | With Mortgage |
| Less than $800 | 0 (0.0%) | 0 (0.0%) |
| $800 to $1,499 | 5 (0.4%) | 42 (1.4%) |
| $800 to $1,499 | 1,373 (99.1%) | 3 (0.1%) |
| Total | 1,385 (100.0%) | 2,983 (100.0%) |
Health & Disability in Western Springs
Health Insurance Coverage by Age in Western Springs
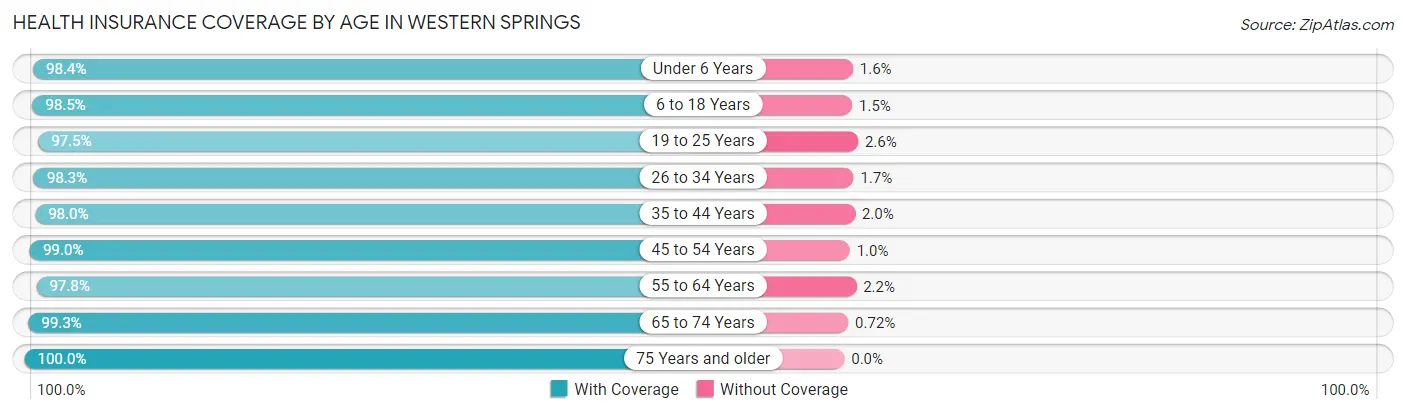
| Age Bracket | With Coverage | Without Coverage |
| Under 6 Years | 1,240 (98.4%) | 20 (1.6%) |
| 6 to 18 Years | 3,182 (98.5%) | 47 (1.5%) |
| 19 to 25 Years | 535 (97.5%) | 14 (2.5%) |
| 26 to 34 Years | 457 (98.3%) | 8 (1.7%) |
| 35 to 44 Years | 1,919 (98.0%) | 39 (2.0%) |
| 45 to 54 Years | 1,964 (99.0%) | 20 (1.0%) |
| 55 to 64 Years | 2,072 (97.8%) | 47 (2.2%) |
| 65 to 74 Years | 970 (99.3%) | 7 (0.7%) |
| 75 Years and older | 1,016 (100.0%) | 0 (0.0%) |
| Total | 13,355 (98.5%) | 202 (1.5%) |
Health Insurance Coverage by Citizenship Status in Western Springs
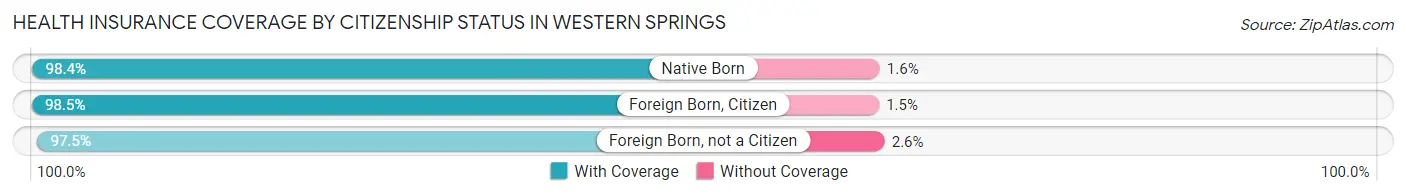
| Citizenship Status | With Coverage | Without Coverage |
| Native Born | 1,240 (98.4%) | 20 (1.6%) |
| Foreign Born, Citizen | 3,182 (98.5%) | 47 (1.5%) |
| Foreign Born, not a Citizen | 535 (97.5%) | 14 (2.5%) |
Health Insurance Coverage by Household Income in Western Springs
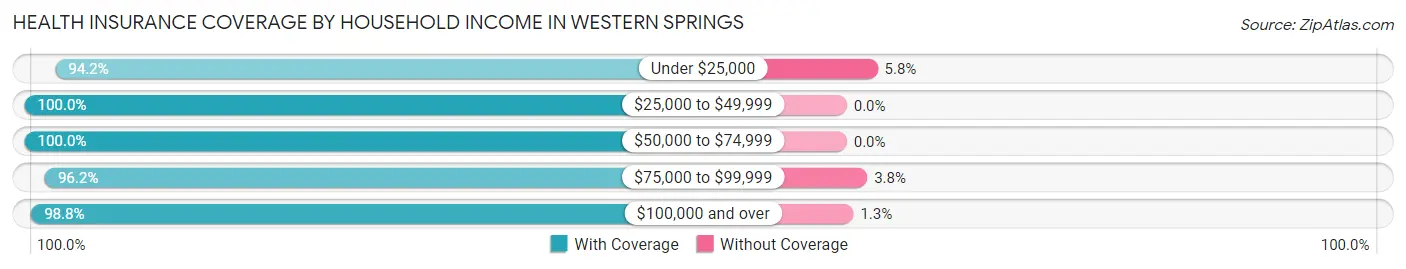
| Household Income | With Coverage | Without Coverage |
| Under $25,000 | 294 (94.2%) | 18 (5.8%) |
| $25,000 to $49,999 | 300 (100.0%) | 0 (0.0%) |
| $50,000 to $74,999 | 517 (100.0%) | 0 (0.0%) |
| $75,000 to $99,999 | 754 (96.2%) | 30 (3.8%) |
| $100,000 and over | 11,474 (98.8%) | 145 (1.3%) |
Public vs Private Health Insurance Coverage by Age in Western Springs
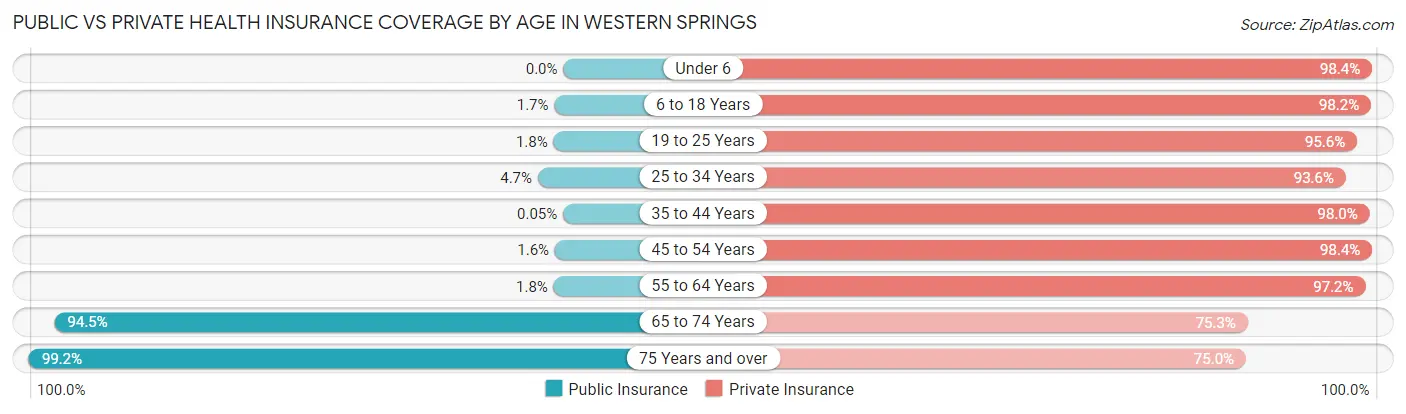
| Age Bracket | Public Insurance | Private Insurance |
| Under 6 | 0 (0.0%) | 1,240 (98.4%) |
| 6 to 18 Years | 54 (1.7%) | 3,172 (98.2%) |
| 19 to 25 Years | 10 (1.8%) | 525 (95.6%) |
| 25 to 34 Years | 22 (4.7%) | 435 (93.5%) |
| 35 to 44 Years | 1 (0.1%) | 1,918 (98.0%) |
| 45 to 54 Years | 31 (1.6%) | 1,953 (98.4%) |
| 55 to 64 Years | 38 (1.8%) | 2,059 (97.2%) |
| 65 to 74 Years | 923 (94.5%) | 736 (75.3%) |
| 75 Years and over | 1,008 (99.2%) | 762 (75.0%) |
| Total | 2,087 (15.4%) | 12,800 (94.4%) |
Disability Status by Sex by Age in Western Springs
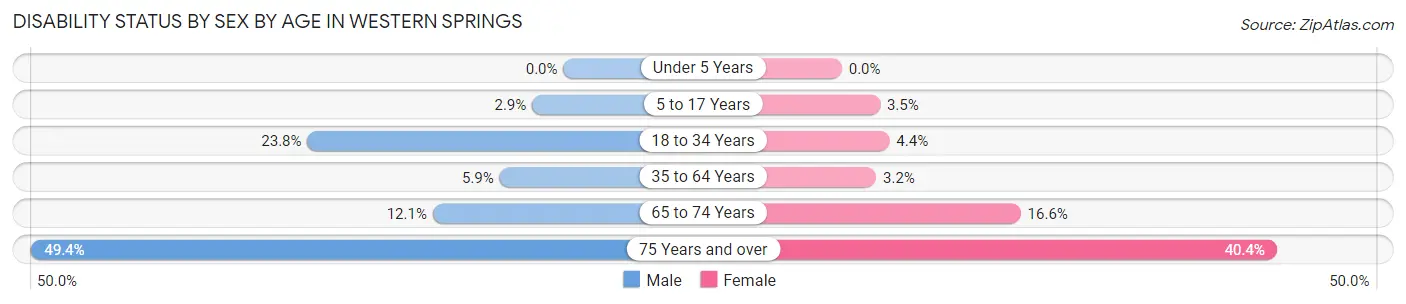
| Age Bracket | Male | Female |
| Under 5 Years | 0 (0.0%) | 0 (0.0%) |
| 5 to 17 Years | 48 (2.9%) | 57 (3.5%) |
| 18 to 34 Years | 158 (23.8%) | 23 (4.4%) |
| 35 to 64 Years | 182 (5.9%) | 95 (3.2%) |
| 65 to 74 Years | 60 (12.1%) | 80 (16.6%) |
| 75 Years and over | 197 (49.4%) | 249 (40.4%) |
Disability Class by Sex by Age in Western Springs
Disability Class: Hearing Difficulty
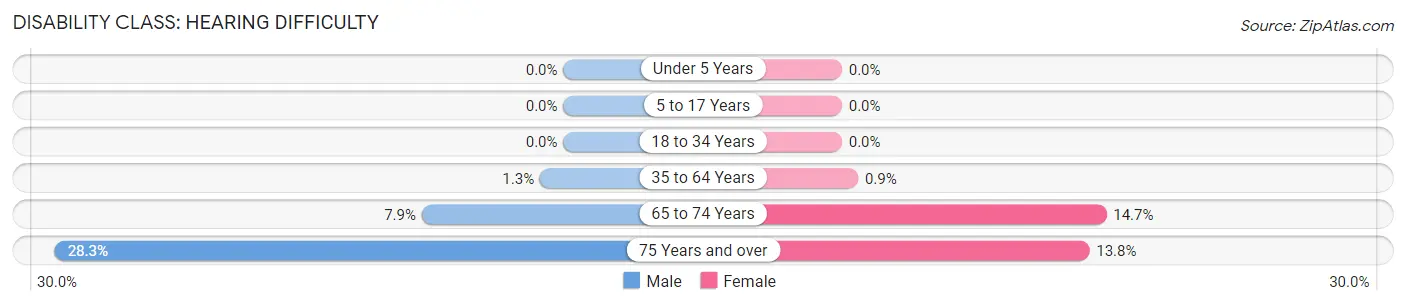
| Age Bracket | Male | Female |
| Under 5 Years | 0 (0.0%) | 0 (0.0%) |
| 5 to 17 Years | 0 (0.0%) | 0 (0.0%) |
| 18 to 34 Years | 0 (0.0%) | 0 (0.0%) |
| 35 to 64 Years | 40 (1.3%) | 27 (0.9%) |
| 65 to 74 Years | 39 (7.9%) | 71 (14.7%) |
| 75 Years and over | 113 (28.3%) | 85 (13.8%) |
Disability Class: Vision Difficulty
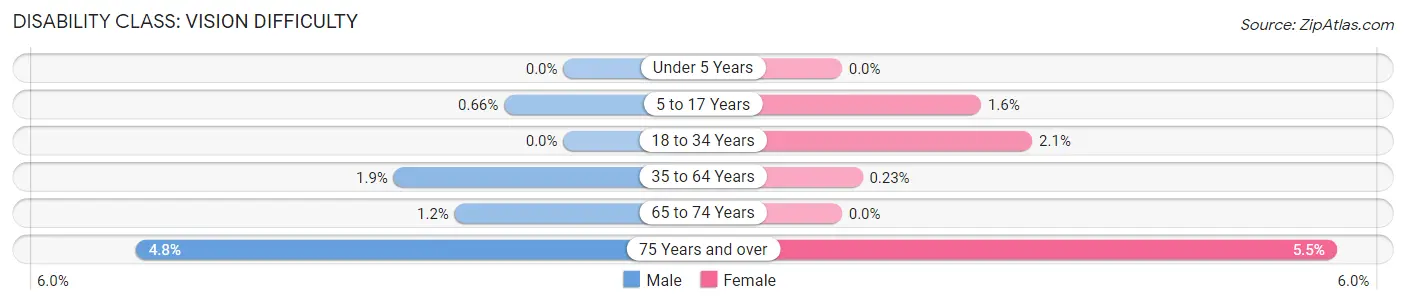
| Age Bracket | Male | Female |
| Under 5 Years | 0 (0.0%) | 0 (0.0%) |
| 5 to 17 Years | 11 (0.7%) | 25 (1.5%) |
| 18 to 34 Years | 0 (0.0%) | 11 (2.1%) |
| 35 to 64 Years | 58 (1.9%) | 7 (0.2%) |
| 65 to 74 Years | 6 (1.2%) | 0 (0.0%) |
| 75 Years and over | 19 (4.8%) | 34 (5.5%) |
Disability Class: Cognitive Difficulty
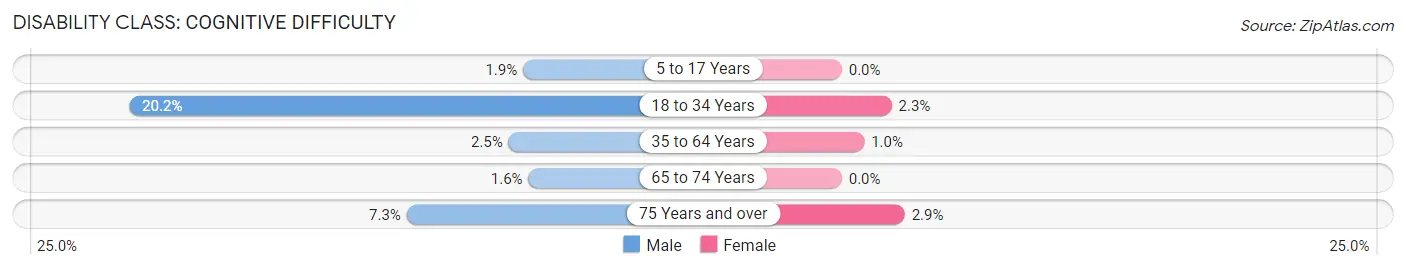
| Age Bracket | Male | Female |
| 5 to 17 Years | 31 (1.9%) | 0 (0.0%) |
| 18 to 34 Years | 134 (20.2%) | 12 (2.3%) |
| 35 to 64 Years | 78 (2.5%) | 31 (1.0%) |
| 65 to 74 Years | 8 (1.6%) | 0 (0.0%) |
| 75 Years and over | 29 (7.3%) | 18 (2.9%) |
Disability Class: Ambulatory Difficulty
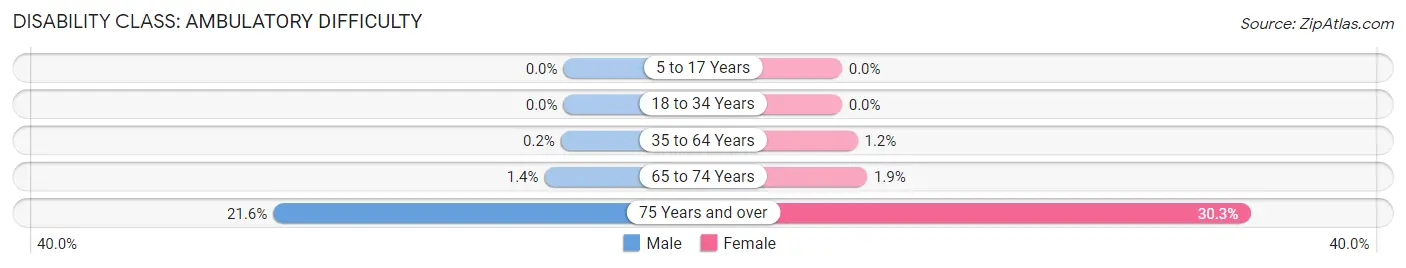
| Age Bracket | Male | Female |
| 5 to 17 Years | 0 (0.0%) | 0 (0.0%) |
| 18 to 34 Years | 0 (0.0%) | 0 (0.0%) |
| 35 to 64 Years | 6 (0.2%) | 35 (1.2%) |
| 65 to 74 Years | 7 (1.4%) | 9 (1.9%) |
| 75 Years and over | 86 (21.5%) | 187 (30.3%) |
Disability Class: Self-Care Difficulty
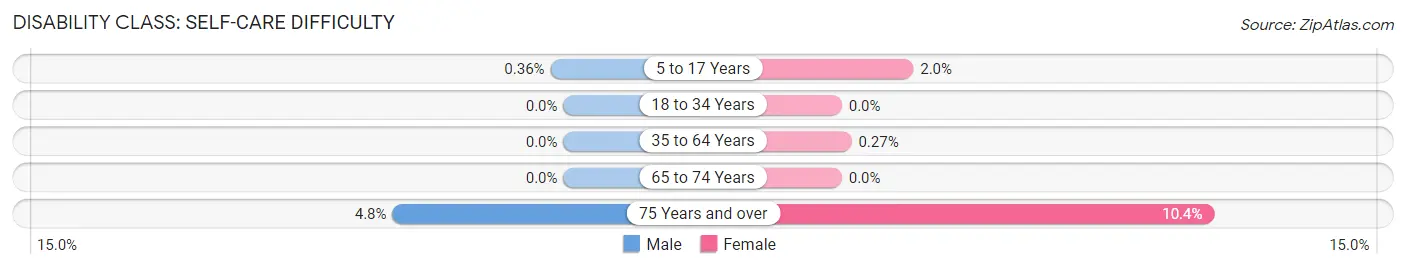
| Age Bracket | Male | Female |
| 5 to 17 Years | 6 (0.4%) | 32 (2.0%) |
| 18 to 34 Years | 0 (0.0%) | 0 (0.0%) |
| 35 to 64 Years | 0 (0.0%) | 8 (0.3%) |
| 65 to 74 Years | 0 (0.0%) | 0 (0.0%) |
| 75 Years and over | 19 (4.8%) | 64 (10.4%) |
Technology Access in Western Springs
Computing Device Access in Western Springs
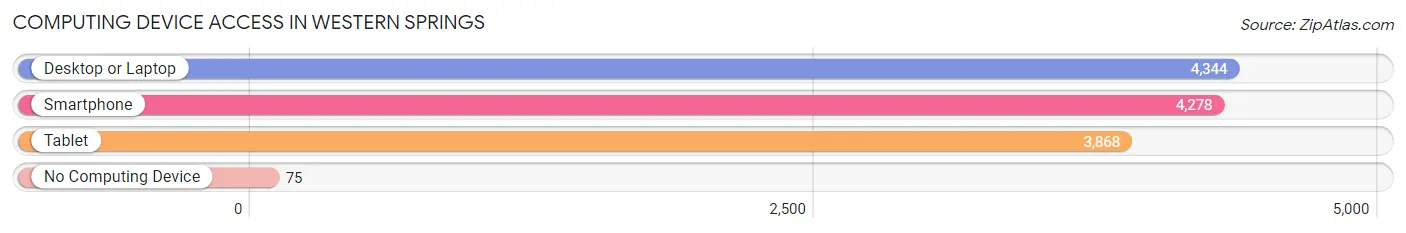
| Device Type | # Households | % Households |
| Desktop or Laptop | 4,344 | 96.1% |
| Smartphone | 4,278 | 94.6% |
| Tablet | 3,868 | 85.6% |
| No Computing Device | 75 | 1.7% |
| Total | 4,521 | 100.0% |
Internet Access in Western Springs
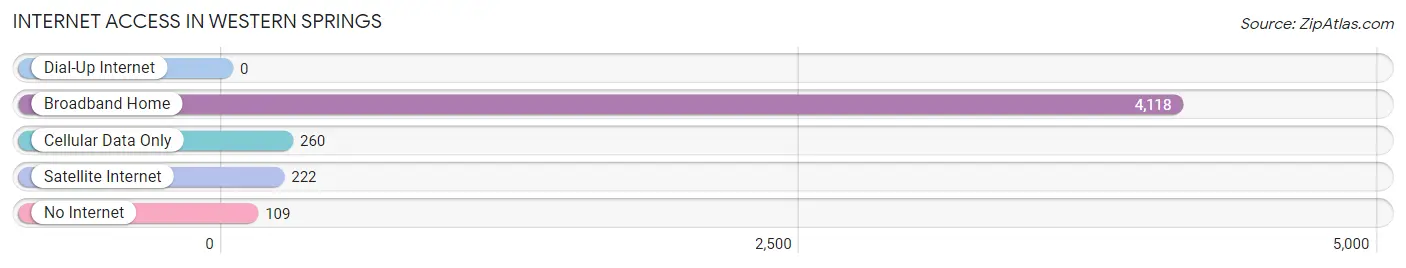
| Internet Type | # Households | % Households |
| Dial-Up Internet | 0 | 0.0% |
| Broadband Home | 4,118 | 91.1% |
| Cellular Data Only | 260 | 5.8% |
| Satellite Internet | 222 | 4.9% |
| No Internet | 109 | 2.4% |
| Total | 4,521 | 100.0% |
Western Springs Summary
History
The village of Western Springs, Illinois is located in Cook County, approximately 15 miles west of downtown Chicago. The area was first settled in the 1830s by a group of German immigrants who named the area “Germantown”. The village was officially incorporated in 1888 and was renamed “Western Springs” in 1889.
The village was originally a farming community, but it quickly grew into a residential suburb of Chicago. The village was known for its large estates and beautiful homes, and it was a popular destination for wealthy Chicagoans looking to escape the hustle and bustle of the city.
In the early 20th century, the village was home to a number of prominent businesses, including the Western Springs National Bank, the Western Springs Hotel, and the Western Springs Water Company. The village also had a thriving retail district, which included a number of department stores, grocery stores, and other businesses.
The village was also home to a number of cultural institutions, including the Western Springs Historical Society, the Western Springs Art Center, and the Western Springs Library. The village was also home to a number of churches, including the First Congregational Church, the First Methodist Church, and the First Presbyterian Church.
Geography
Western Springs is located in Cook County, Illinois, approximately 15 miles west of downtown Chicago. The village is bordered by the villages of La Grange, La Grange Park, and Brookfield to the north, the village of Hinsdale to the east, the village of Willowbrook to the south, and the village of Burr Ridge to the west.
The village is situated on the Des Plaines River, which flows through the village from north to south. The village is also home to a number of parks, including the Western Springs Park District, the Western Springs Park, and the Western Springs Nature Center.
Economy
The village of Western Springs has a strong and diverse economy. The village is home to a number of businesses, including retail stores, restaurants, and professional services. The village is also home to a number of corporate headquarters, including the headquarters of the Western Springs National Bank, the Western Springs Water Company, and the Western Springs Art Center.
The village is also home to a number of educational institutions, including the Western Springs School District, the Western Springs College of Arts and Sciences, and the Western Springs Academy.
Demographics
As of the 2010 census, the village of Western Springs had a population of 12,975. The population was spread out with a median age of 44.7 years. The racial makeup of the village was 87.3% White, 4.2% African American, 0.2% Native American, 4.7% Asian, and 3.6% from other races.
The village had a median household income of $107,945, and the per capita income was $50,945. The village had a poverty rate of 2.3%. The village had a high rate of homeownership, with 81.3% of the population owning their own homes.
Conclusion
Western Springs, Illinois is a vibrant and diverse village located in Cook County, approximately 15 miles west of downtown Chicago. The village has a long and rich history, and it has grown into a thriving residential suburb of Chicago. The village has a strong and diverse economy, and it is home to a number of businesses, educational institutions, and cultural institutions. The village also has a high rate of homeownership, and the population is diverse in terms of race and income.
Common Questions
What is Per Capita Income in Western Springs?
Per Capita income in Western Springs is $93,413.
What is the Median Family Income in Western Springs?
Median Family Income in Western Springs is $225,240.
What is the Median Household income in Western Springs?
Median Household Income in Western Springs is $198,836.
What is Income or Wage Gap in Western Springs?
Income or Wage Gap in Western Springs is 55.0%.
Women in Western Springs earn 45.0 cents for every dollar earned by a man.
What is Family Income Deficit in Western Springs?
Family Income Deficit in Western Springs is $11,877.
Families that are below poverty line in Western Springs earn $11,877 less on average than the poverty threshold level.
What is Inequality or Gini Index in Western Springs?
Inequality or Gini Index in Western Springs is 0.45.
What is the Total Population of Western Springs?
Total Population of Western Springs is 13,557.
What is the Total Male Population of Western Springs?
Total Male Population of Western Springs is 6,992.
What is the Total Female Population of Western Springs?
Total Female Population of Western Springs is 6,565.
What is the Ratio of Males per 100 Females in Western Springs?
There are 106.50 Males per 100 Females in Western Springs.
What is the Ratio of Females per 100 Males in Western Springs?
There are 93.89 Females per 100 Males in Western Springs.
What is the Median Population Age in Western Springs?
Median Population Age in Western Springs is 42.0 Years.
What is the Average Family Size in Western Springs
Average Family Size in Western Springs is 3.3 People.
What is the Average Household Size in Western Springs
Average Household Size in Western Springs is 3.0 People.
How Large is the Labor Force in Western Springs?
There are 6,137 People in the Labor Forcein in Western Springs.
What is the Percentage of People in the Labor Force in Western Springs?
63.2% of People are in the Labor Force in Western Springs.
What is the Unemployment Rate in Western Springs?
Unemployment Rate in Western Springs is 2.5%.