Mill Creek, WA Map & Demographics
Mill Creek Map

Mill Creek Overview
$61,422
PER CAPITA INCOME
$152,779
AVG FAMILY INCOME
$118,276
AVG HOUSEHOLD INCOME
48.7%
WAGE / INCOME GAP [ % ]
51.3¢/ $1
WAGE / INCOME GAP [ $ ]
0.43
INEQUALITY / GINI INDEX
20,797
TOTAL POPULATION
9,828
MALE POPULATION
10,969
FEMALE POPULATION
89.60
MALES / 100 FEMALES
111.61
FEMALES / 100 MALES
38.3
MEDIAN AGE
3.0
AVG FAMILY SIZE
2.5
AVG HOUSEHOLD SIZE
11,421
LABOR FORCE [ PEOPLE ]
68.7%
PERCENT IN LABOR FORCE
4.2%
UNEMPLOYMENT RATE
Mill Creek Area Codes
Income in Mill Creek
Income Overview in Mill Creek
Per Capita Income in Mill Creek is $61,422, while median incomes of families and households are $152,779 and $118,276 respectively.
| Characteristic | Number | Measure |
| Per Capita Income | 20,797 | $61,422 |
| Median Family Income | 5,645 | $152,779 |
| Mean Family Income | 5,645 | $184,095 |
| Median Household Income | 8,378 | $118,276 |
| Mean Household Income | 8,378 | $152,074 |
| Income Deficit | 5,645 | $0 |
| Wage / Income Gap (%) | 20,797 | 48.69% |
| Wage / Income Gap ($) | 20,797 | 51.31¢ per $1 |
| Gini / Inequality Index | 20,797 | 0.43 |
Earnings by Sex in Mill Creek
Average Earnings in Mill Creek are $68,448, $87,209 for men and $44,744 for women, a difference of 48.7%.
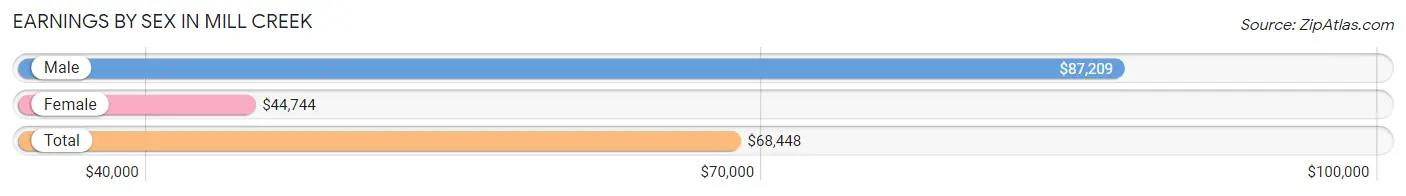
| Sex | Number | Average Earnings |
| Male | 6,090 (51.1%) | $87,209 |
| Female | 5,825 (48.9%) | $44,744 |
| Total | 11,915 (100.0%) | $68,448 |
Earnings by Sex by Income Bracket in Mill Creek
The most common earnings brackets in Mill Creek are $100,000+ for men (2,832 | 46.5%) and $100,000+ for women (1,517 | 26.0%).
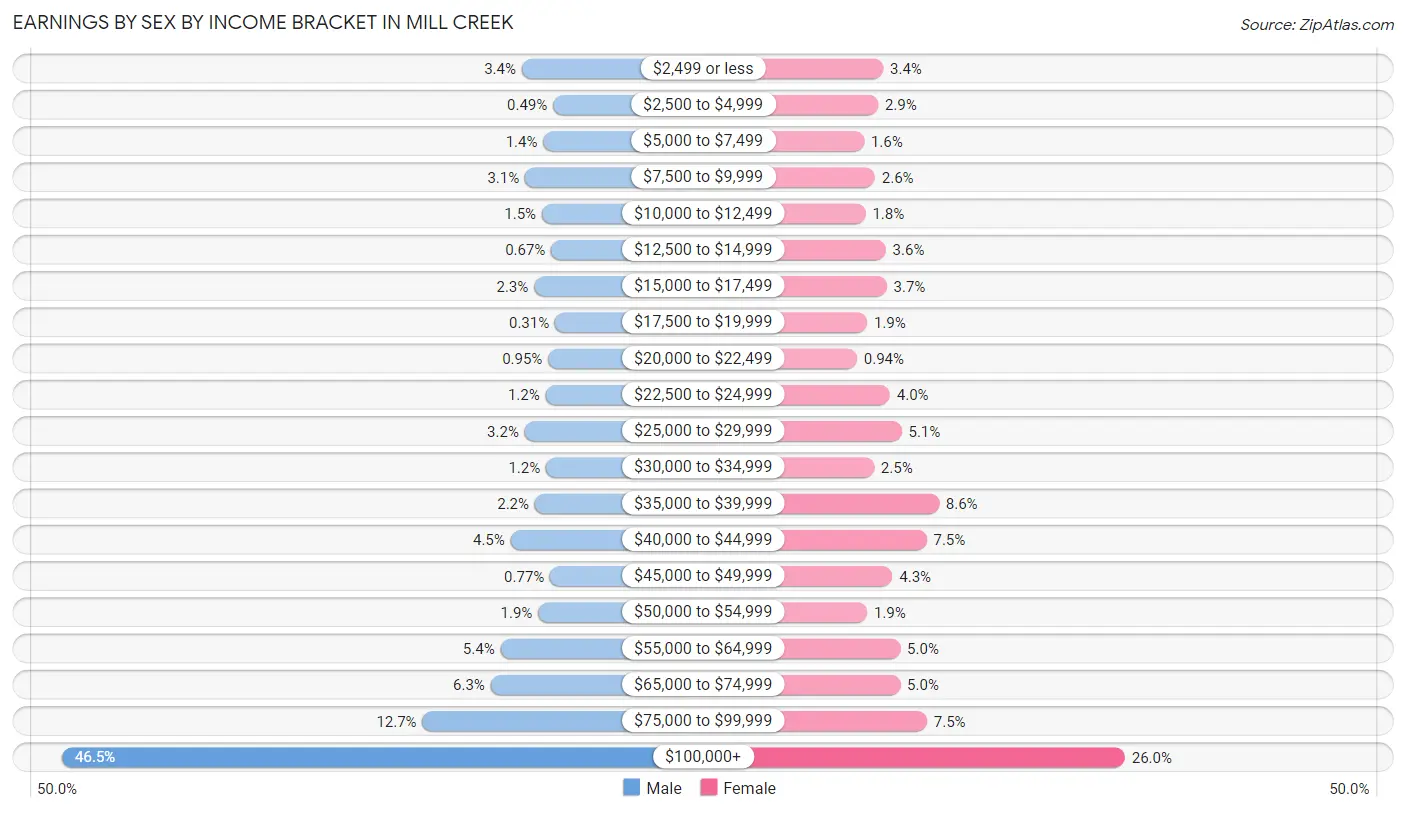
| Income | Male | Female |
| $2,499 or less | 208 (3.4%) | 198 (3.4%) |
| $2,500 to $4,999 | 30 (0.5%) | 170 (2.9%) |
| $5,000 to $7,499 | 86 (1.4%) | 94 (1.6%) |
| $7,500 to $9,999 | 190 (3.1%) | 153 (2.6%) |
| $10,000 to $12,499 | 94 (1.5%) | 102 (1.8%) |
| $12,500 to $14,999 | 41 (0.7%) | 212 (3.6%) |
| $15,000 to $17,499 | 138 (2.3%) | 217 (3.7%) |
| $17,500 to $19,999 | 19 (0.3%) | 110 (1.9%) |
| $20,000 to $22,499 | 58 (0.9%) | 55 (0.9%) |
| $22,500 to $24,999 | 73 (1.2%) | 235 (4.0%) |
| $25,000 to $29,999 | 192 (3.2%) | 299 (5.1%) |
| $30,000 to $34,999 | 70 (1.1%) | 148 (2.5%) |
| $35,000 to $39,999 | 134 (2.2%) | 502 (8.6%) |
| $40,000 to $44,999 | 272 (4.5%) | 435 (7.5%) |
| $45,000 to $49,999 | 47 (0.8%) | 249 (4.3%) |
| $50,000 to $54,999 | 115 (1.9%) | 110 (1.9%) |
| $55,000 to $64,999 | 330 (5.4%) | 291 (5.0%) |
| $65,000 to $74,999 | 386 (6.3%) | 291 (5.0%) |
| $75,000 to $99,999 | 775 (12.7%) | 437 (7.5%) |
| $100,000+ | 2,832 (46.5%) | 1,517 (26.0%) |
| Total | 6,090 (100.0%) | 5,825 (100.0%) |
Earnings by Sex by Educational Attainment in Mill Creek
Average earnings in Mill Creek are $100,000 for men and $55,159 for women, a difference of 44.8%. Men with an educational attainment of graduate degree enjoy the highest average annual earnings of $151,364, while those with less than high school education earn the least with $2,499. Women with an educational attainment of graduate degree earn the most with the average annual earnings of $96,890, while those with high school diploma education have the smallest earnings of $36,989.
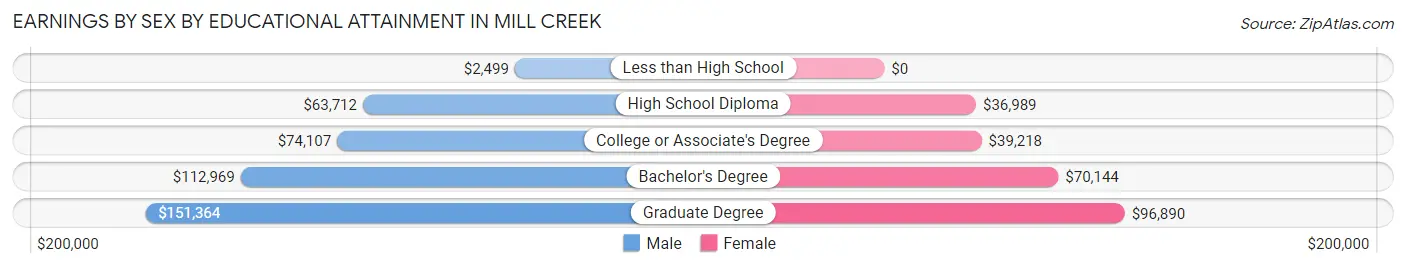
| Educational Attainment | Male Income | Female Income |
| Less than High School | $2,499 | $0 |
| High School Diploma | $63,712 | $36,989 |
| College or Associate's Degree | $74,107 | $39,218 |
| Bachelor's Degree | $112,969 | $70,144 |
| Graduate Degree | $151,364 | $96,890 |
| Total | $100,000 | $55,159 |
Family Income in Mill Creek
Family Income Brackets in Mill Creek
According to the Mill Creek family income data, there are 1,914 families falling into the $200,000+ income range, which is the most common income bracket and makes up 33.9% of all families. Conversely, the $10,000 to $14,999 income bracket is the least frequent group with only 40 families (0.7%) belonging to this category.
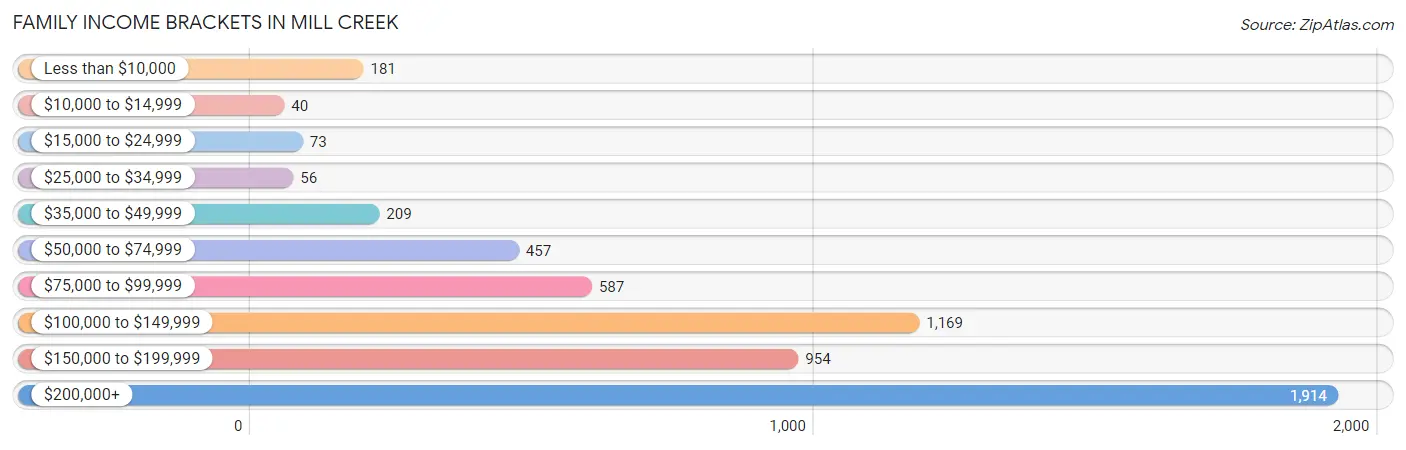
| Income Bracket | # Families | % Families |
| Less than $10,000 | 181 | 3.2% |
| $10,000 to $14,999 | 40 | 0.7% |
| $15,000 to $24,999 | 73 | 1.3% |
| $25,000 to $34,999 | 56 | 1.0% |
| $35,000 to $49,999 | 209 | 3.7% |
| $50,000 to $74,999 | 457 | 8.1% |
| $75,000 to $99,999 | 587 | 10.4% |
| $100,000 to $149,999 | 1,169 | 20.7% |
| $150,000 to $199,999 | 954 | 16.9% |
| $200,000+ | 1,914 | 33.9% |
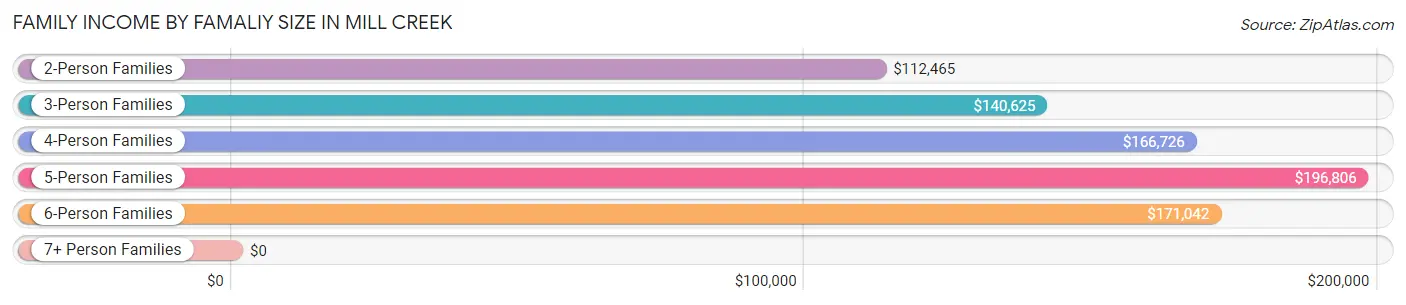
Family Income by Famaliy Size in Mill Creek
5-person families (529 | 9.4%) account for the highest median family income in Mill Creek with $196,806 per family, while 2-person families (2,318 | 41.1%) have the highest median income of $56,232 per family member.
| Income Bracket | # Families | Median Income |
| 2-Person Families | 2,318 (41.1%) | $112,465 |
| 3-Person Families | 1,410 (25.0%) | $140,625 |
| 4-Person Families | 1,177 (20.8%) | $166,726 |
| 5-Person Families | 529 (9.4%) | $196,806 |
| 6-Person Families | 19 (0.3%) | $171,042 |
| 7+ Person Families | 192 (3.4%) | $0 |
| Total | 5,645 (100.0%) | $152,779 |
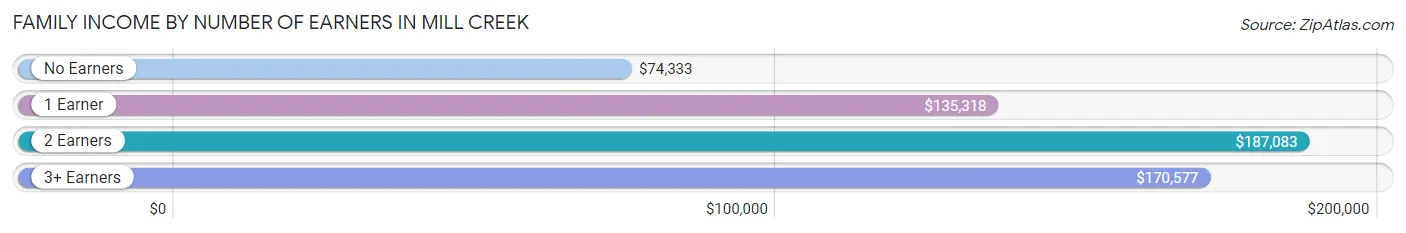
Family Income by Number of Earners in Mill Creek
The median family income in Mill Creek is $152,779, with families comprising 2 earners (2,538) having the highest median family income of $187,083, while families with no earners (618) have the lowest median family income of $74,333, accounting for 45.0% and 11.0% of families, respectively.
| Number of Earners | # Families | Median Income |
| No Earners | 618 (11.0%) | $74,333 |
| 1 Earner | 1,683 (29.8%) | $135,318 |
| 2 Earners | 2,538 (45.0%) | $187,083 |
| 3+ Earners | 806 (14.3%) | $170,577 |
| Total | 5,645 (100.0%) | $152,779 |
Household Income in Mill Creek
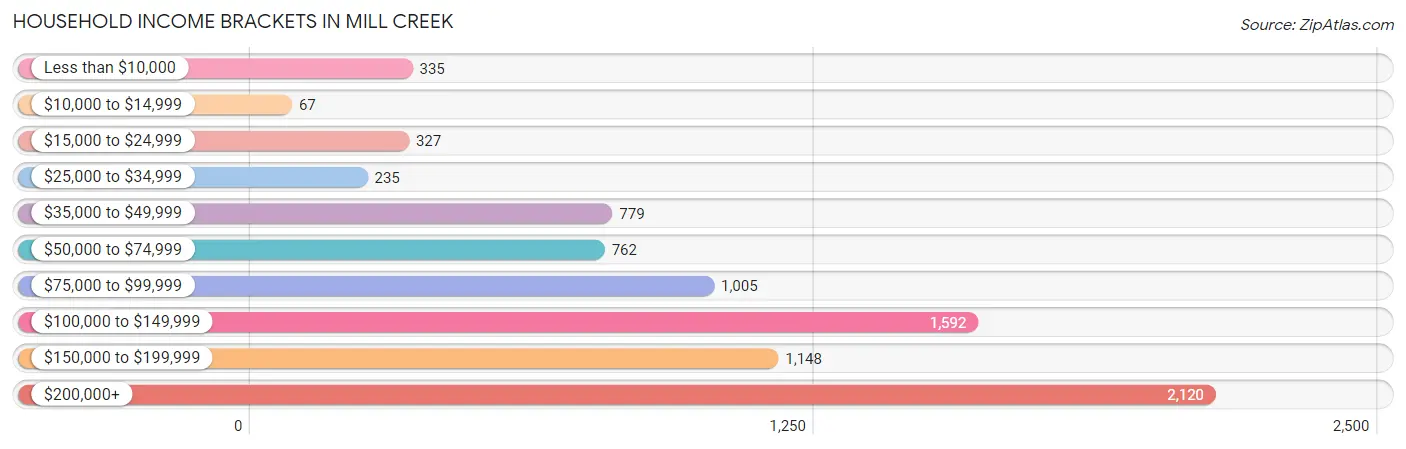
Household Income Brackets in Mill Creek
With 2,120 households falling in the category, the $200,000+ income range is the most frequent in Mill Creek, accounting for 25.3% of all households. In contrast, only 67 households (0.8%) fall into the $10,000 to $14,999 income bracket, making it the least populous group.
| Income Bracket | # Households | % Households |
| Less than $10,000 | 335 | 4.0% |
| $10,000 to $14,999 | 67 | 0.8% |
| $15,000 to $24,999 | 327 | 3.9% |
| $25,000 to $34,999 | 235 | 2.8% |
| $35,000 to $49,999 | 779 | 9.3% |
| $50,000 to $74,999 | 762 | 9.1% |
| $75,000 to $99,999 | 1,005 | 12.0% |
| $100,000 to $149,999 | 1,592 | 19.0% |
| $150,000 to $199,999 | 1,148 | 13.7% |
| $200,000+ | 2,120 | 25.3% |
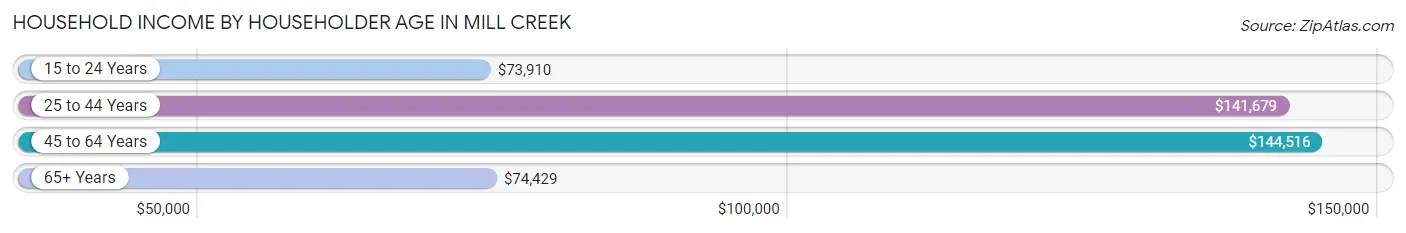
Household Income by Householder Age in Mill Creek
The median household income in Mill Creek is $118,276, with the highest median household income of $144,516 found in the 45 to 64 years age bracket for the primary householder. A total of 3,115 households (37.2%) fall into this category. Meanwhile, the 15 to 24 years age bracket for the primary householder has the lowest median household income of $73,910, with 393 households (4.7%) in this group.
| Income Bracket | # Households | Median Income |
| 15 to 24 Years | 393 (4.7%) | $73,910 |
| 25 to 44 Years | 3,022 (36.1%) | $141,679 |
| 45 to 64 Years | 3,115 (37.2%) | $144,516 |
| 65+ Years | 1,848 (22.1%) | $74,429 |
| Total | 8,378 (100.0%) | $118,276 |
Poverty in Mill Creek
Income Below Poverty by Sex and Age in Mill Creek
With 4.6% poverty level for males and 3.8% for females among the residents of Mill Creek, 15 year old males and 6 to 11 year old females are the most vulnerable to poverty, with 45 males (24.3%) and 65 females (8.7%) in their respective age groups living below the poverty level.
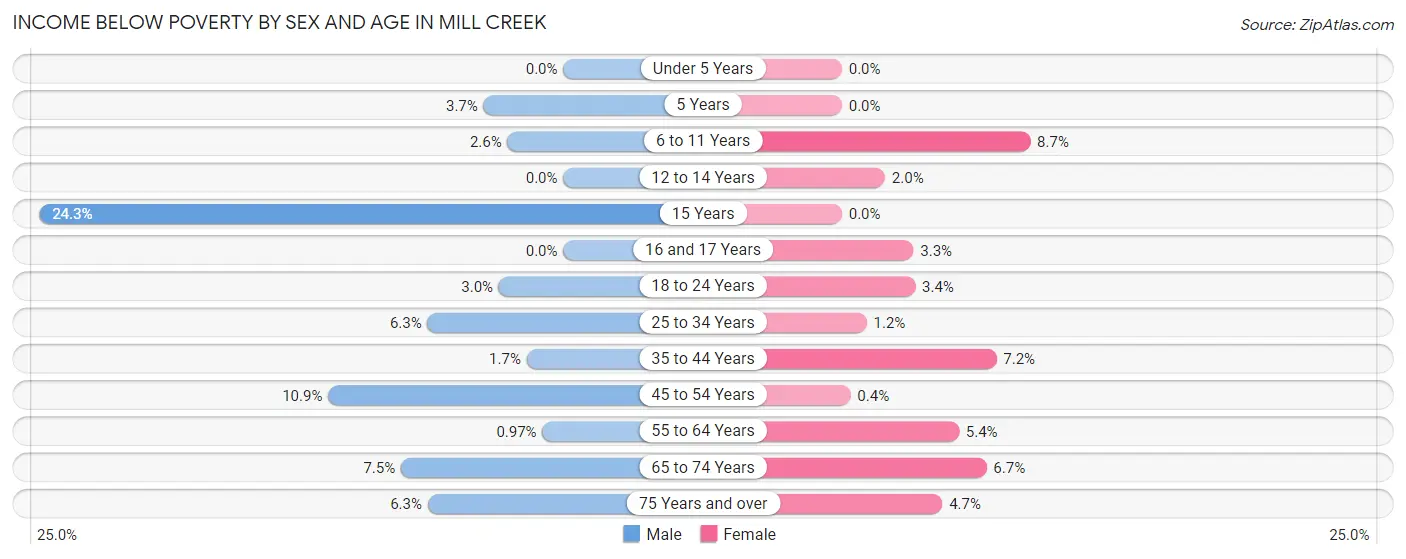
| Age Bracket | Male | Female |
| Under 5 Years | 0 (0.0%) | 0 (0.0%) |
| 5 Years | 8 (3.7%) | 0 (0.0%) |
| 6 to 11 Years | 17 (2.6%) | 65 (8.7%) |
| 12 to 14 Years | 0 (0.0%) | 11 (2.0%) |
| 15 Years | 45 (24.3%) | 0 (0.0%) |
| 16 and 17 Years | 0 (0.0%) | 10 (3.3%) |
| 18 to 24 Years | 18 (3.0%) | 35 (3.4%) |
| 25 to 34 Years | 109 (6.3%) | 17 (1.1%) |
| 35 to 44 Years | 27 (1.7%) | 97 (7.2%) |
| 45 to 54 Years | 135 (10.9%) | 6 (0.4%) |
| 55 to 64 Years | 13 (1.0%) | 65 (5.4%) |
| 65 to 74 Years | 54 (7.5%) | 69 (6.7%) |
| 75 Years and over | 27 (6.3%) | 41 (4.7%) |
| Total | 453 (4.6%) | 416 (3.8%) |
Income Above Poverty by Sex and Age in Mill Creek
According to the poverty statistics in Mill Creek, males aged under 5 years and females aged under 5 years are the age groups that are most secure financially, with 100.0% of males and 100.0% of females in these age groups living above the poverty line.
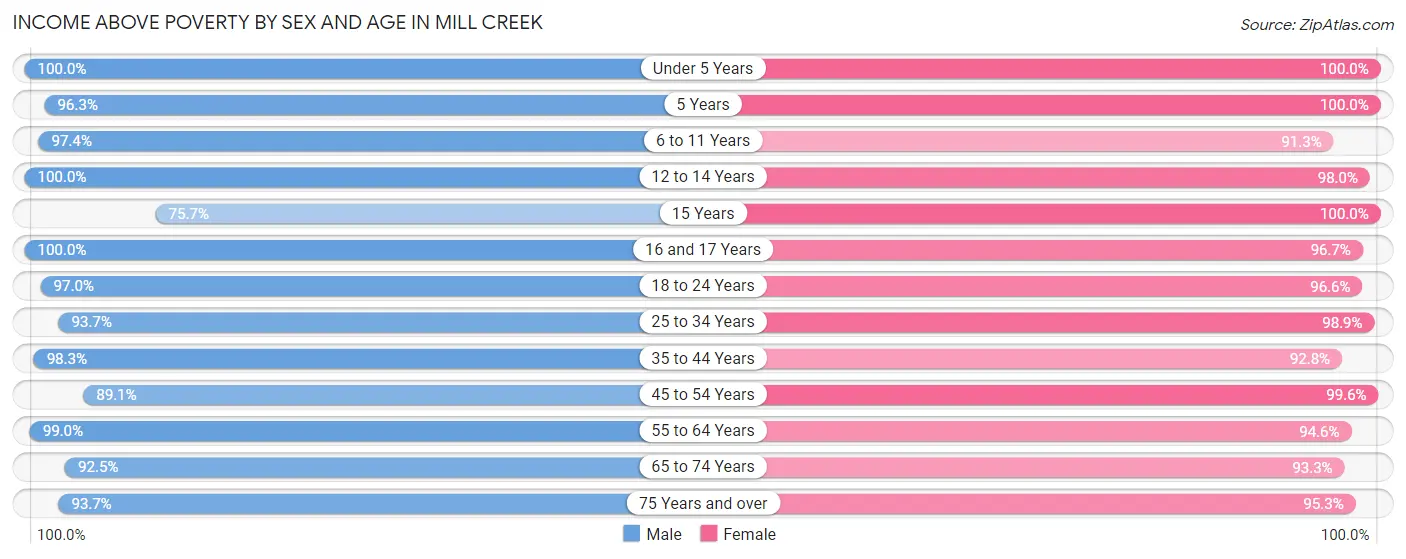
| Age Bracket | Male | Female |
| Under 5 Years | 615 (100.0%) | 671 (100.0%) |
| 5 Years | 208 (96.3%) | 52 (100.0%) |
| 6 to 11 Years | 640 (97.4%) | 679 (91.3%) |
| 12 to 14 Years | 343 (100.0%) | 538 (98.0%) |
| 15 Years | 140 (75.7%) | 86 (100.0%) |
| 16 and 17 Years | 141 (100.0%) | 291 (96.7%) |
| 18 to 24 Years | 585 (97.0%) | 995 (96.6%) |
| 25 to 34 Years | 1,622 (93.7%) | 1,461 (98.9%) |
| 35 to 44 Years | 1,558 (98.3%) | 1,256 (92.8%) |
| 45 to 54 Years | 1,102 (89.1%) | 1,511 (99.6%) |
| 55 to 64 Years | 1,325 (99.0%) | 1,131 (94.6%) |
| 65 to 74 Years | 663 (92.5%) | 959 (93.3%) |
| 75 Years and over | 402 (93.7%) | 839 (95.3%) |
| Total | 9,344 (95.4%) | 10,469 (96.2%) |
Income Below Poverty Among Married-Couple Families in Mill Creek
The poverty statistics for married-couple families in Mill Creek show that 1.4% or 66 of the total 4,739 families live below the poverty line. Families with no children have the highest poverty rate of 2.2%, comprising of 52 families. On the other hand, families with 3 or 4 children have the lowest poverty rate of 0.0%, which includes 0 families.
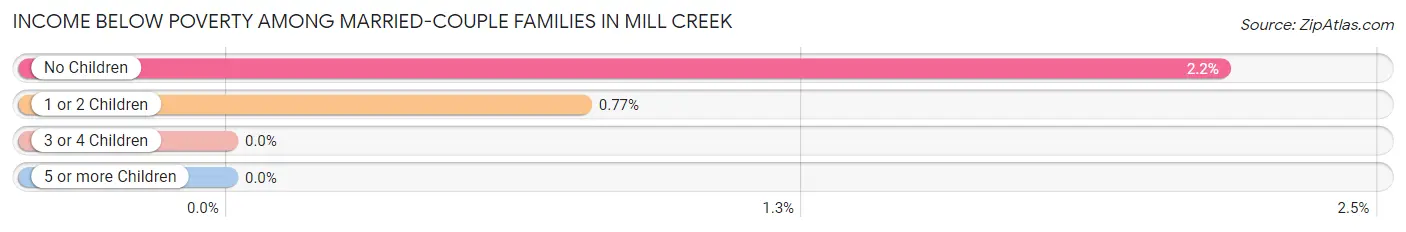
| Children | Above Poverty | Below Poverty |
| No Children | 2,350 (97.8%) | 52 (2.2%) |
| 1 or 2 Children | 1,812 (99.2%) | 14 (0.8%) |
| 3 or 4 Children | 487 (100.0%) | 0 (0.0%) |
| 5 or more Children | 24 (100.0%) | 0 (0.0%) |
| Total | 4,673 (98.6%) | 66 (1.4%) |
Income Below Poverty Among Single-Parent Households in Mill Creek
According to the poverty data in Mill Creek, 32.1% or 80 single-father households and 14.3% or 94 single-mother households are living below the poverty line. Among single-father households, those with no children have the highest poverty rate, with 61 households (52.6%) experiencing poverty. Likewise, among single-mother households, those with 1 or 2 children have the highest poverty rate, with 94 households (27.3%) falling below the poverty line.
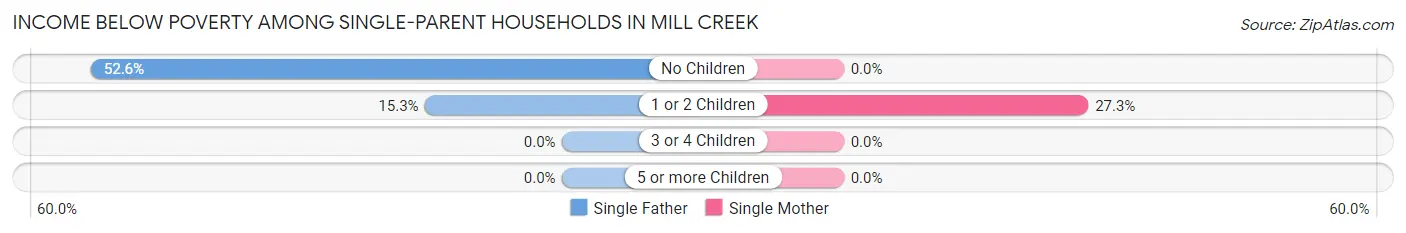
| Children | Single Father | Single Mother |
| No Children | 61 (52.6%) | 0 (0.0%) |
| 1 or 2 Children | 19 (15.3%) | 94 (27.3%) |
| 3 or 4 Children | 0 (0.0%) | 0 (0.0%) |
| 5 or more Children | 0 (0.0%) | 0 (0.0%) |
| Total | 80 (32.1%) | 94 (14.3%) |
Income Below Poverty Among Married-Couple vs Single-Parent Households in Mill Creek
The poverty data for Mill Creek shows that 66 of the married-couple family households (1.4%) and 174 of the single-parent households (19.2%) are living below the poverty level. Within the married-couple family households, those with no children have the highest poverty rate, with 52 households (2.2%) falling below the poverty line. Among the single-parent households, those with 1 or 2 children have the highest poverty rate, with 113 household (24.1%) living below poverty.
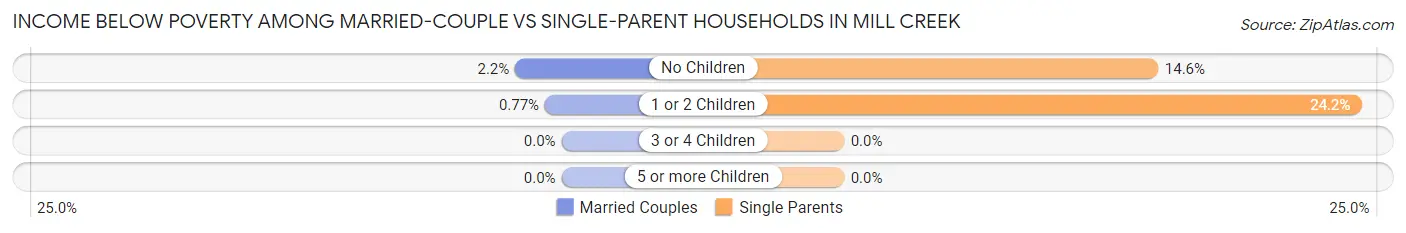
| Children | Married-Couple Families | Single-Parent Households |
| No Children | 52 (2.2%) | 61 (14.6%) |
| 1 or 2 Children | 14 (0.8%) | 113 (24.1%) |
| 3 or 4 Children | 0 (0.0%) | 0 (0.0%) |
| 5 or more Children | 0 (0.0%) | 0 (0.0%) |
| Total | 66 (1.4%) | 174 (19.2%) |
Race in Mill Creek
The most populous races in Mill Creek are White / Caucasian (13,000 | 62.5%), Asian (4,242 | 20.4%), and Two or more Races (1,747 | 8.4%).
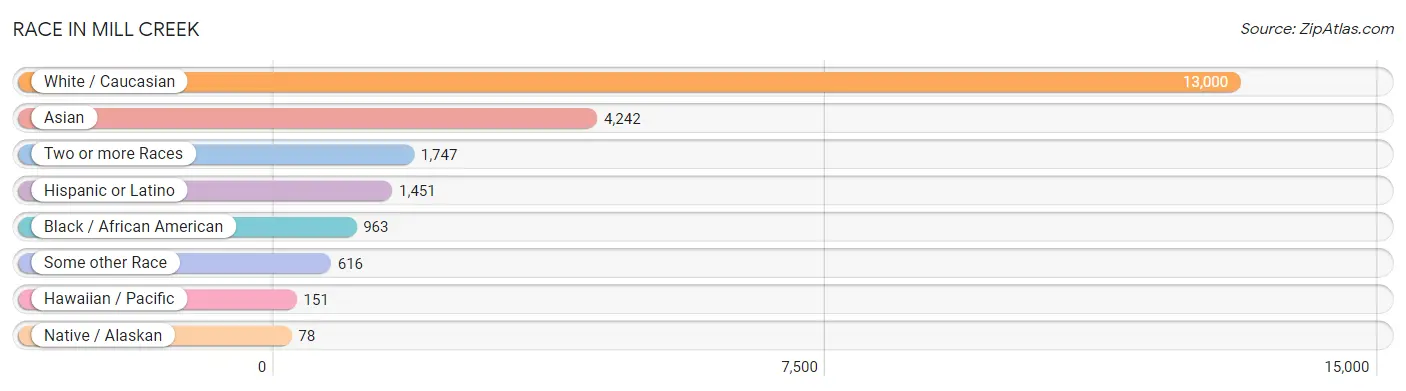
| Race | # Population | % Population |
| Asian | 4,242 | 20.4% |
| Black / African American | 963 | 4.6% |
| Hawaiian / Pacific | 151 | 0.7% |
| Hispanic or Latino | 1,451 | 7.0% |
| Native / Alaskan | 78 | 0.4% |
| White / Caucasian | 13,000 | 62.5% |
| Two or more Races | 1,747 | 8.4% |
| Some other Race | 616 | 3.0% |
| Total | 20,797 | 100.0% |
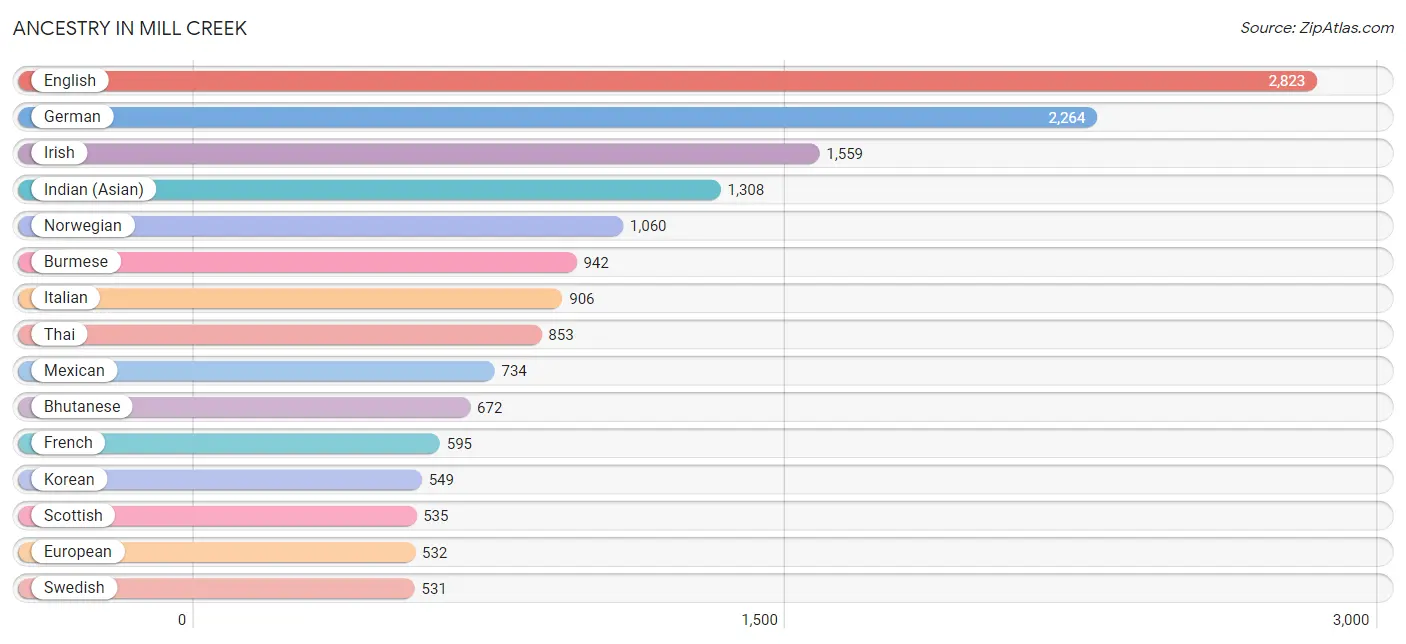
Ancestry in Mill Creek
The most populous ancestries reported in Mill Creek are English (2,823 | 13.6%), German (2,264 | 10.9%), Irish (1,559 | 7.5%), Indian (Asian) (1,308 | 6.3%), and Norwegian (1,060 | 5.1%), together accounting for 43.3% of all Mill Creek residents.
| Ancestry | # Population | % Population |
| American | 372 | 1.8% |
| Arab | 325 | 1.6% |
| Australian | 22 | 0.1% |
| Austrian | 32 | 0.2% |
| Bahamian | 31 | 0.2% |
| Belgian | 59 | 0.3% |
| Bhutanese | 672 | 3.2% |
| Blackfeet | 31 | 0.2% |
| British | 271 | 1.3% |
| Bulgarian | 370 | 1.8% |
| Burmese | 942 | 4.5% |
| Canadian | 40 | 0.2% |
| Central American | 173 | 0.8% |
| Cherokee | 66 | 0.3% |
| Choctaw | 4 | 0.0% |
| Colombian | 32 | 0.2% |
| Colville | 93 | 0.4% |
| Croatian | 7 | 0.0% |
| Cuban | 13 | 0.1% |
| Czechoslovakian | 52 | 0.3% |
| Danish | 415 | 2.0% |
| Dominican | 76 | 0.4% |
| Dutch | 355 | 1.7% |
| Eastern European | 6 | 0.0% |
| Ecuadorian | 17 | 0.1% |
| Egyptian | 28 | 0.1% |
| English | 2,823 | 13.6% |
| European | 532 | 2.6% |
| Filipino | 170 | 0.8% |
| Finnish | 243 | 1.2% |
| French | 595 | 2.9% |
| French Canadian | 89 | 0.4% |
| German | 2,264 | 10.9% |
| Greek | 46 | 0.2% |
| Guamanian / Chamorro | 117 | 0.6% |
| Guatemalan | 97 | 0.5% |
| Haitian | 101 | 0.5% |
| Hungarian | 34 | 0.2% |
| Icelander | 29 | 0.1% |
| Indian (Asian) | 1,308 | 6.3% |
| Inupiat | 25 | 0.1% |
| Iranian | 64 | 0.3% |
| Irish | 1,559 | 7.5% |
| Italian | 906 | 4.4% |
| Jamaican | 107 | 0.5% |
| Japanese | 144 | 0.7% |
| Korean | 549 | 2.6% |
| Malaysian | 191 | 0.9% |
| Mexican | 734 | 3.5% |
| Native Hawaiian | 10 | 0.1% |
| Nicaraguan | 76 | 0.4% |
| Nigerian | 36 | 0.2% |
| Northern European | 53 | 0.3% |
| Norwegian | 1,060 | 5.1% |
| Pakistani | 43 | 0.2% |
| Polish | 253 | 1.2% |
| Portuguese | 116 | 0.6% |
| Puerto Rican | 42 | 0.2% |
| Romanian | 43 | 0.2% |
| Russian | 90 | 0.4% |
| Samoan | 25 | 0.1% |
| Scandinavian | 224 | 1.1% |
| Scotch-Irish | 178 | 0.9% |
| Scottish | 535 | 2.6% |
| Serbian | 10 | 0.1% |
| Sioux | 6 | 0.0% |
| Slovak | 10 | 0.1% |
| South African | 143 | 0.7% |
| South American | 338 | 1.6% |
| Spanish | 62 | 0.3% |
| Sri Lankan | 83 | 0.4% |
| Subsaharan African | 179 | 0.9% |
| Swedish | 531 | 2.5% |
| Swiss | 149 | 0.7% |
| Syrian | 226 | 1.1% |
| Thai | 853 | 4.1% |
| Tlingit-Haida | 25 | 0.1% |
| Turkish | 7 | 0.0% |
| Ukrainian | 36 | 0.2% |
| Venezuelan | 289 | 1.4% |
| Vietnamese | 45 | 0.2% |
| Welsh | 180 | 0.9% |
| Yugoslavian | 68 | 0.3% | View All 83 Rows |
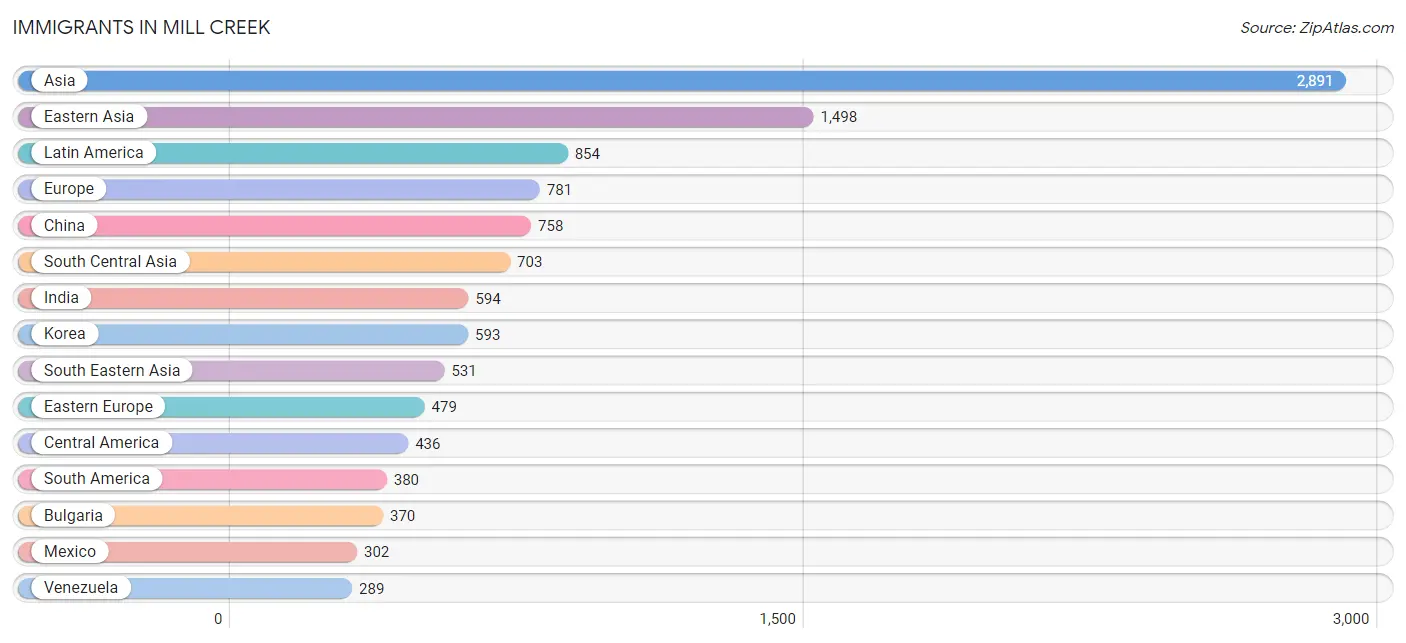
Immigrants in Mill Creek
The most numerous immigrant groups reported in Mill Creek came from Asia (2,891 | 13.9%), Eastern Asia (1,498 | 7.2%), Latin America (854 | 4.1%), Europe (781 | 3.8%), and China (758 | 3.6%), together accounting for 32.6% of all Mill Creek residents.
| Immigration Origin | # Population | % Population |
| Africa | 139 | 0.7% |
| Asia | 2,891 | 13.9% |
| Australia | 12 | 0.1% |
| Bangladesh | 39 | 0.2% |
| Bosnia and Herzegovina | 25 | 0.1% |
| Brazil | 69 | 0.3% |
| Bulgaria | 370 | 1.8% |
| Cambodia | 100 | 0.5% |
| Canada | 128 | 0.6% |
| Caribbean | 38 | 0.2% |
| Central America | 436 | 2.1% |
| China | 758 | 3.6% |
| Dominican Republic | 38 | 0.2% |
| Eastern Africa | 8 | 0.0% |
| Eastern Asia | 1,498 | 7.2% |
| Eastern Europe | 479 | 2.3% |
| Egypt | 28 | 0.1% |
| England | 75 | 0.4% |
| Ethiopia | 8 | 0.0% |
| Europe | 781 | 3.8% |
| France | 13 | 0.1% |
| Germany | 8 | 0.0% |
| Guatemala | 97 | 0.5% |
| Hong Kong | 83 | 0.4% |
| India | 594 | 2.9% |
| Indonesia | 15 | 0.1% |
| Iran | 56 | 0.3% |
| Ireland | 45 | 0.2% |
| Japan | 147 | 0.7% |
| Korea | 593 | 2.9% |
| Laos | 112 | 0.5% |
| Latin America | 854 | 4.1% |
| Mexico | 302 | 1.5% |
| Nicaragua | 37 | 0.2% |
| Northern Africa | 28 | 0.1% |
| Northern Europe | 281 | 1.3% |
| Norway | 12 | 0.1% |
| Oceania | 12 | 0.1% |
| Peru | 8 | 0.0% |
| Philippines | 232 | 1.1% |
| Romania | 9 | 0.0% |
| Russia | 47 | 0.2% |
| Saudi Arabia | 22 | 0.1% |
| Scotland | 93 | 0.4% |
| South Africa | 103 | 0.5% |
| South America | 380 | 1.8% |
| South Central Asia | 703 | 3.4% |
| South Eastern Asia | 531 | 2.5% |
| Sri Lanka | 14 | 0.1% |
| Syria | 120 | 0.6% |
| Taiwan | 186 | 0.9% |
| Thailand | 43 | 0.2% |
| Ukraine | 4 | 0.0% |
| Venezuela | 289 | 1.4% |
| Vietnam | 29 | 0.1% |
| Western Asia | 142 | 0.7% |
| Western Europe | 21 | 0.1% | View All 57 Rows |
Sex and Age in Mill Creek
Sex and Age in Mill Creek
The most populous age groups in Mill Creek are 25 to 29 Years (994 | 10.1%) for men and 30 to 34 Years (893 | 8.1%) for women.
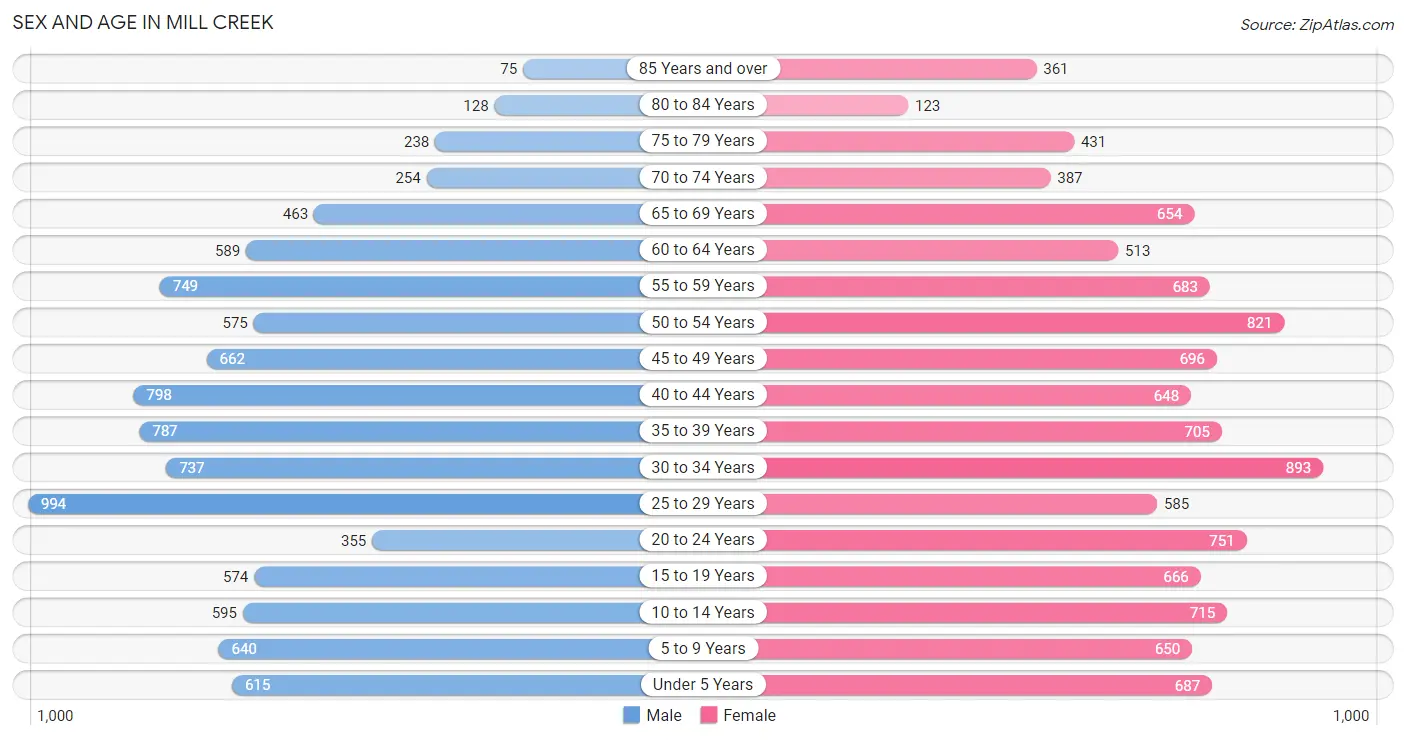
| Age Bracket | Male | Female |
| Under 5 Years | 615 (6.3%) | 687 (6.3%) |
| 5 to 9 Years | 640 (6.5%) | 650 (5.9%) |
| 10 to 14 Years | 595 (6.0%) | 715 (6.5%) |
| 15 to 19 Years | 574 (5.8%) | 666 (6.1%) |
| 20 to 24 Years | 355 (3.6%) | 751 (6.9%) |
| 25 to 29 Years | 994 (10.1%) | 585 (5.3%) |
| 30 to 34 Years | 737 (7.5%) | 893 (8.1%) |
| 35 to 39 Years | 787 (8.0%) | 705 (6.4%) |
| 40 to 44 Years | 798 (8.1%) | 648 (5.9%) |
| 45 to 49 Years | 662 (6.7%) | 696 (6.4%) |
| 50 to 54 Years | 575 (5.9%) | 821 (7.5%) |
| 55 to 59 Years | 749 (7.6%) | 683 (6.2%) |
| 60 to 64 Years | 589 (6.0%) | 513 (4.7%) |
| 65 to 69 Years | 463 (4.7%) | 654 (6.0%) |
| 70 to 74 Years | 254 (2.6%) | 387 (3.5%) |
| 75 to 79 Years | 238 (2.4%) | 431 (3.9%) |
| 80 to 84 Years | 128 (1.3%) | 123 (1.1%) |
| 85 Years and over | 75 (0.8%) | 361 (3.3%) |
| Total | 9,828 (100.0%) | 10,969 (100.0%) |
Families and Households in Mill Creek
Median Family Size in Mill Creek
The median family size in Mill Creek is 3.04 persons per family, with married-couple families (4,739 | 84.0%) accounting for the largest median family size of 3.1 persons per family. On the other hand, single male/father families (249 | 4.4%) represent the smallest median family size with 2.67 persons per family.
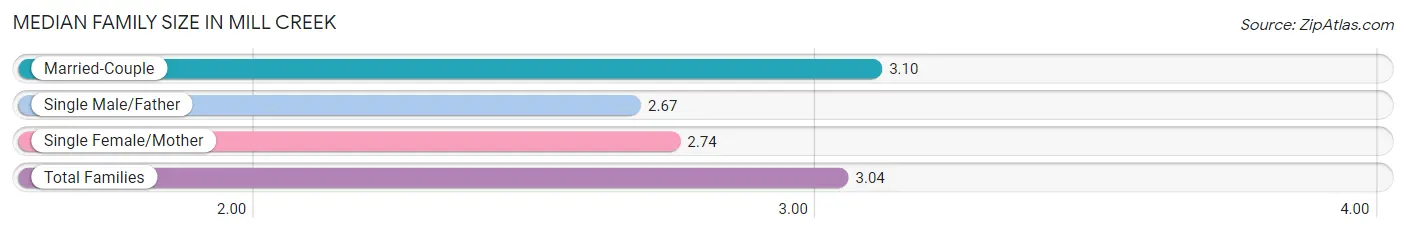
| Family Type | # Families | Family Size |
| Married-Couple | 4,739 (84.0%) | 3.10 |
| Single Male/Father | 249 (4.4%) | 2.67 |
| Single Female/Mother | 657 (11.6%) | 2.74 |
| Total Families | 5,645 (100.0%) | 3.04 |
Median Household Size in Mill Creek
The median household size in Mill Creek is 2.47 persons per household, with married-couple households (4,739 | 56.6%) accounting for the largest median household size of 3.11 persons per household. non-family households (2,733 | 32.6%) represent the smallest median household size with 1.18 persons per household.
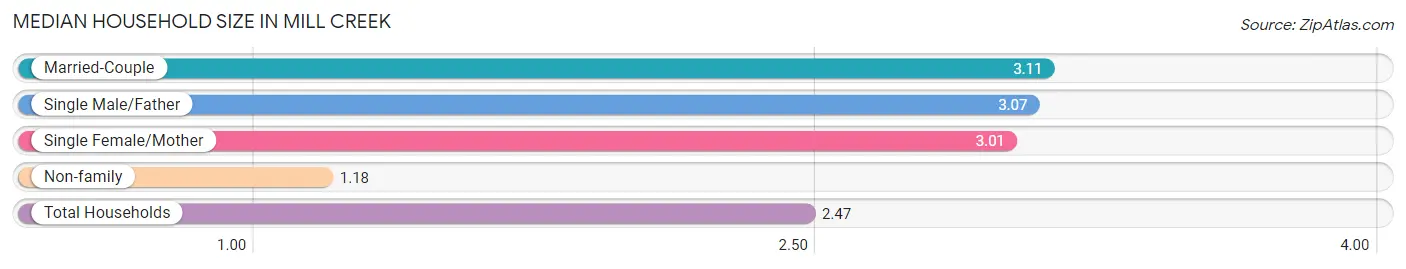
| Household Type | # Households | Household Size |
| Married-Couple | 4,739 (56.6%) | 3.11 |
| Single Male/Father | 249 (3.0%) | 3.07 |
| Single Female/Mother | 657 (7.8%) | 3.01 |
| Non-family | 2,733 (32.6%) | 1.18 |
| Total Households | 8,378 (100.0%) | 2.47 |
Household Size by Marriage Status in Mill Creek
Out of a total of 8,378 households in Mill Creek, 5,645 (67.4%) are family households, while 2,733 (32.6%) are nonfamily households. The most numerous type of family households are 2-person households, comprising 2,266, and the most common type of nonfamily households are 1-person households, comprising 2,244.
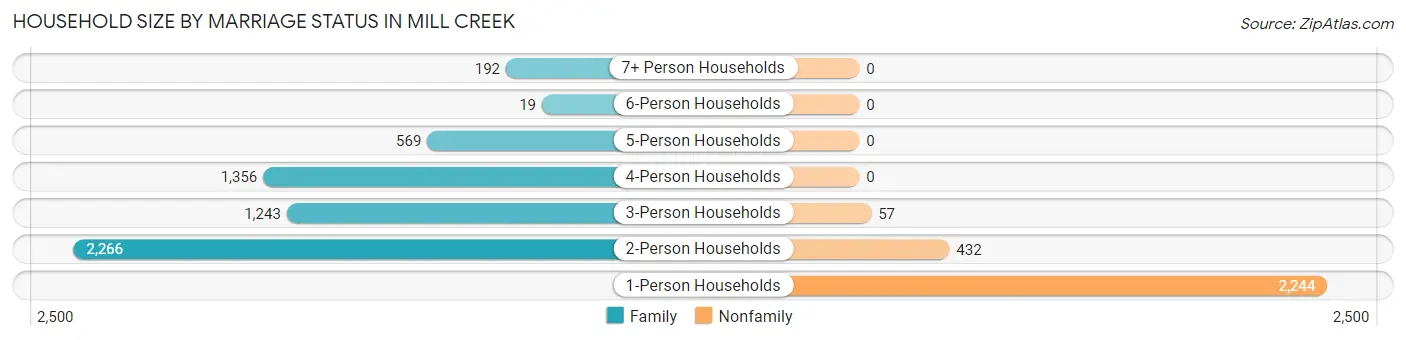
| Household Size | Family Households | Nonfamily Households |
| 1-Person Households | - | 2,244 (26.8%) |
| 2-Person Households | 2,266 (27.1%) | 432 (5.2%) |
| 3-Person Households | 1,243 (14.8%) | 57 (0.7%) |
| 4-Person Households | 1,356 (16.2%) | 0 (0.0%) |
| 5-Person Households | 569 (6.8%) | 0 (0.0%) |
| 6-Person Households | 19 (0.2%) | 0 (0.0%) |
| 7+ Person Households | 192 (2.3%) | 0 (0.0%) |
| Total | 5,645 (67.4%) | 2,733 (32.6%) |
Female Fertility in Mill Creek
Fertility by Age in Mill Creek
Average fertility rate in Mill Creek is 80.0 births per 1,000 women. Women in the age bracket of 35 to 50 years have the highest fertility rate with 112.0 births per 1,000 women. Women in the age bracket of 35 to 50 years acount for 59.8% of all women with births.
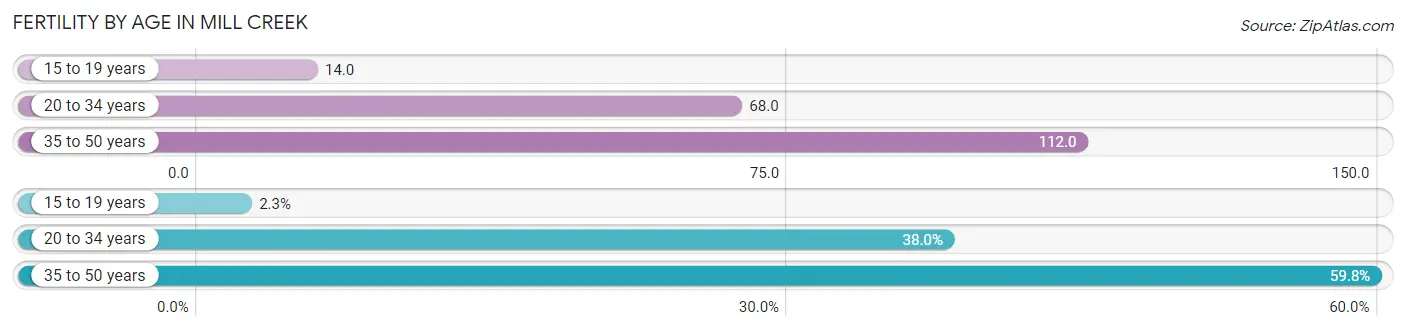
| Age Bracket | Women with Births | Births / 1,000 Women |
| 15 to 19 years | 9 (2.2%) | 14.0 |
| 20 to 34 years | 152 (38.0%) | 68.0 |
| 35 to 50 years | 239 (59.8%) | 112.0 |
| Total | 400 (100.0%) | 80.0 |
Fertility by Age by Marriage Status in Mill Creek
75.2% of women with births (400) in Mill Creek are married. The highest percentage of unmarried women with births falls into 15 to 19 years age bracket with 100.0% of them unmarried at the time of birth, while the lowest percentage of unmarried women with births belong to 20 to 34 years age bracket with 8.6% of them unmarried.
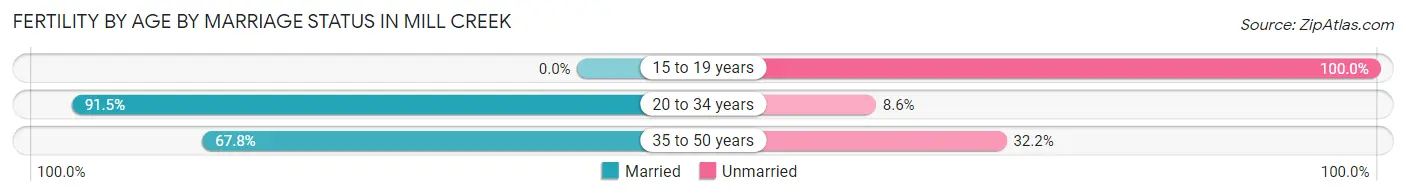
| Age Bracket | Married | Unmarried |
| 15 to 19 years | 0 (0.0%) | 9 (100.0%) |
| 20 to 34 years | 139 (91.4%) | 13 (8.6%) |
| 35 to 50 years | 162 (67.8%) | 77 (32.2%) |
| Total | 301 (75.2%) | 99 (24.7%) |
Fertility by Education in Mill Creek
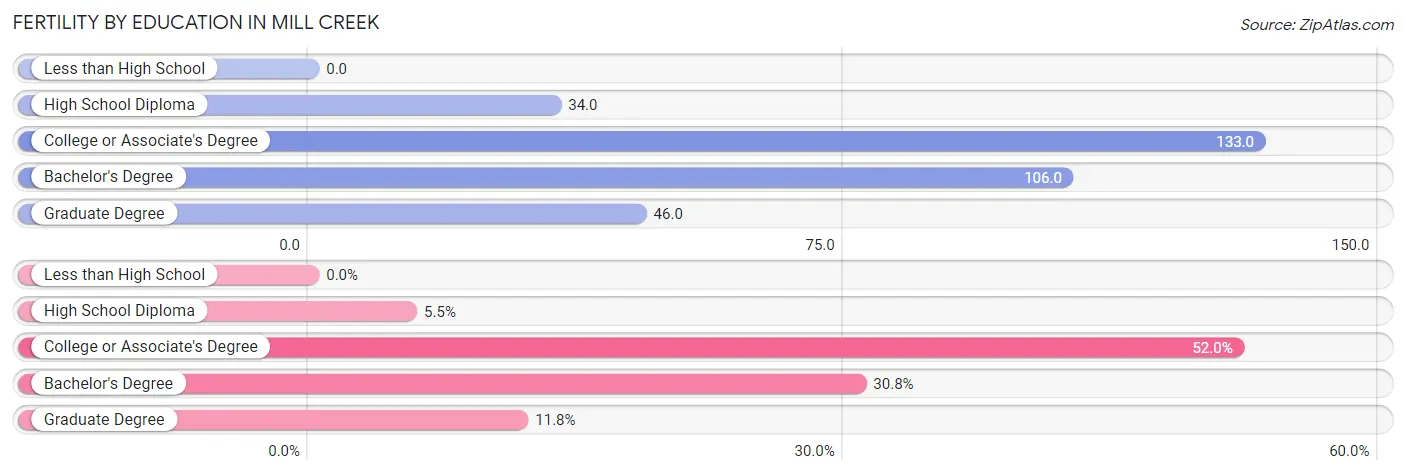
| Educational Attainment | Women with Births | Births / 1,000 Women |
| Less than High School | 0 (0.0%) | 0.0 |
| High School Diploma | 22 (5.5%) | 34.0 |
| College or Associate's Degree | 208 (52.0%) | 133.0 |
| Bachelor's Degree | 123 (30.7%) | 106.0 |
| Graduate Degree | 47 (11.7%) | 46.0 |
| Total | 400 (100.0%) | 80.0 |
Fertility by Education by Marriage Status in Mill Creek
24.7% of women with births in Mill Creek are unmarried. Women with the educational attainment of high school diploma are most likely to be married with 100.0% of them married at childbirth, while women with the educational attainment of college or associate's degree are least likely to be married with 47.6% of them unmarried at childbirth.
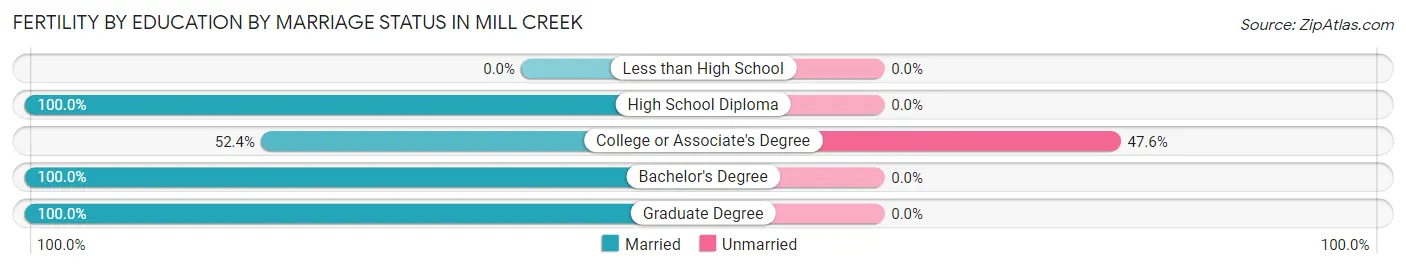
| Educational Attainment | Married | Unmarried |
| Less than High School | 0 (0.0%) | 0 (0.0%) |
| High School Diploma | 22 (100.0%) | 0 (0.0%) |
| College or Associate's Degree | 109 (52.4%) | 99 (47.6%) |
| Bachelor's Degree | 123 (100.0%) | 0 (0.0%) |
| Graduate Degree | 47 (100.0%) | 0 (0.0%) |
| Total | 301 (75.2%) | 99 (24.7%) |
Employment Characteristics in Mill Creek
Employment by Class of Employer in Mill Creek
Among the 10,809 employed individuals in Mill Creek, private company employees (7,925 | 73.3%), local government employees (678 | 6.3%), and not-for-profit organizations (521 | 4.8%) make up the most common classes of employment.
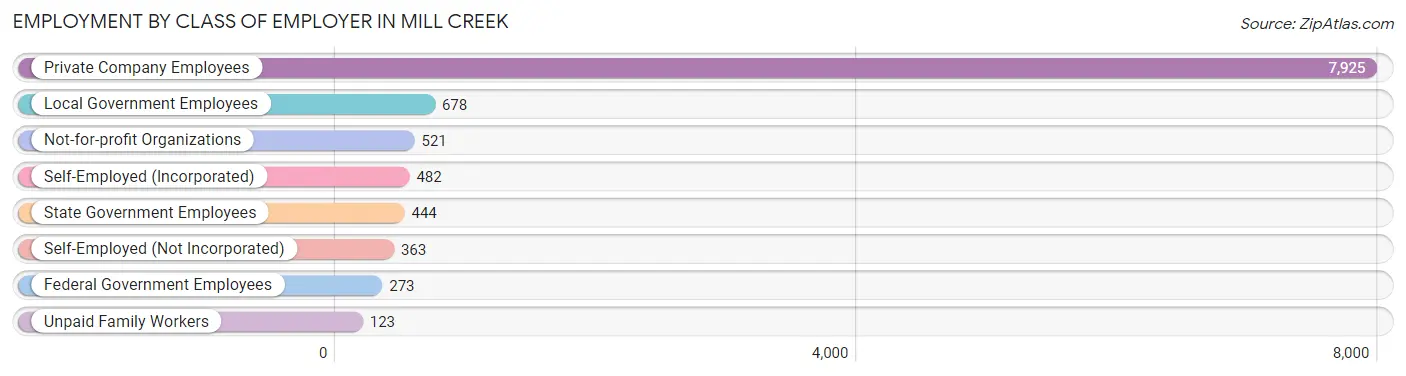
| Employer Class | # Employees | % Employees |
| Private Company Employees | 7,925 | 73.3% |
| Self-Employed (Incorporated) | 482 | 4.5% |
| Self-Employed (Not Incorporated) | 363 | 3.4% |
| Not-for-profit Organizations | 521 | 4.8% |
| Local Government Employees | 678 | 6.3% |
| State Government Employees | 444 | 4.1% |
| Federal Government Employees | 273 | 2.5% |
| Unpaid Family Workers | 123 | 1.1% |
| Total | 10,809 | 100.0% |
Employment Status by Age in Mill Creek
According to the labor force statistics for Mill Creek, out of the total population over 16 years of age (16,624), 68.7% or 11,421 individuals are in the labor force, with 4.2% or 480 of them unemployed. The age group with the highest labor force participation rate is 30 to 34 years, with 94.5% or 1,540 individuals in the labor force. Within the labor force, the 16 to 19 years age range has the highest percentage of unemployed individuals, with 22.9% or 61 of them being unemployed.
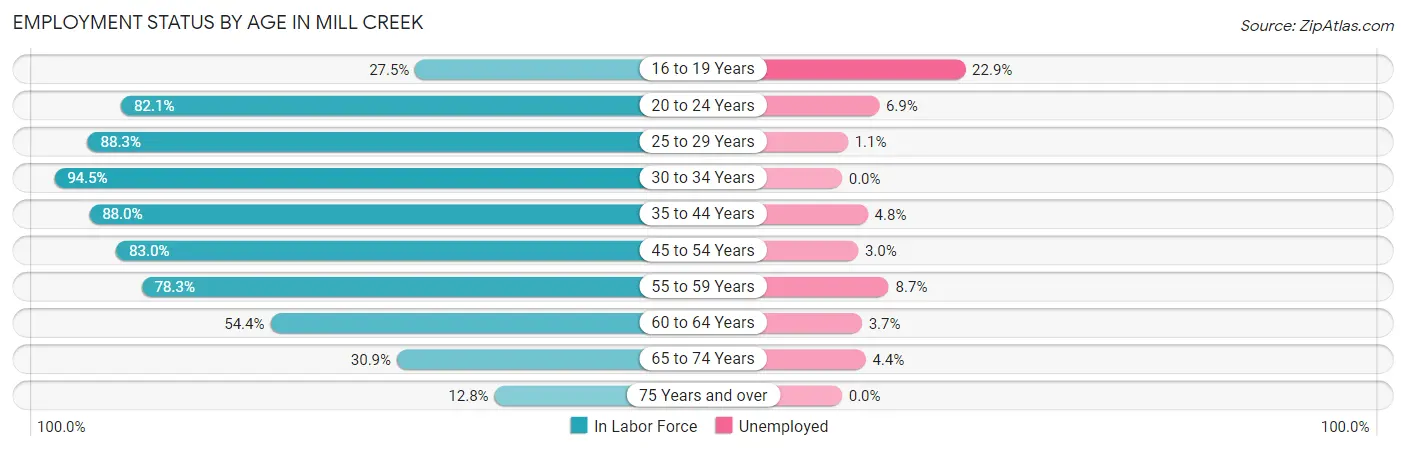
| Age Bracket | In Labor Force | Unemployed |
| 16 to 19 Years | 266 (27.5%) | 61 (22.9%) |
| 20 to 24 Years | 908 (82.1%) | 63 (6.9%) |
| 25 to 29 Years | 1,394 (88.3%) | 15 (1.1%) |
| 30 to 34 Years | 1,540 (94.5%) | 0 (0.0%) |
| 35 to 44 Years | 2,585 (88.0%) | 124 (4.8%) |
| 45 to 54 Years | 2,286 (83.0%) | 69 (3.0%) |
| 55 to 59 Years | 1,121 (78.3%) | 98 (8.7%) |
| 60 to 64 Years | 599 (54.4%) | 22 (3.7%) |
| 65 to 74 Years | 543 (30.9%) | 24 (4.4%) |
| 75 Years and over | 174 (12.8%) | 0 (0.0%) |
| Total | 11,421 (68.7%) | 480 (4.2%) |
Employment Status by Educational Attainment in Mill Creek
According to labor force statistics for Mill Creek, 83.3% of individuals (9,525) out of the total population between 25 and 64 years of age (11,435) are in the labor force, with 3.4% or 324 of them being unemployed. The group with the highest labor force participation rate are those with the educational attainment of bachelor's degree or higher, with 87.6% or 5,499 individuals in the labor force. Within the labor force, individuals with college / associate degree education have the highest percentage of unemployment, with 4.5% or 130 of them being unemployed.
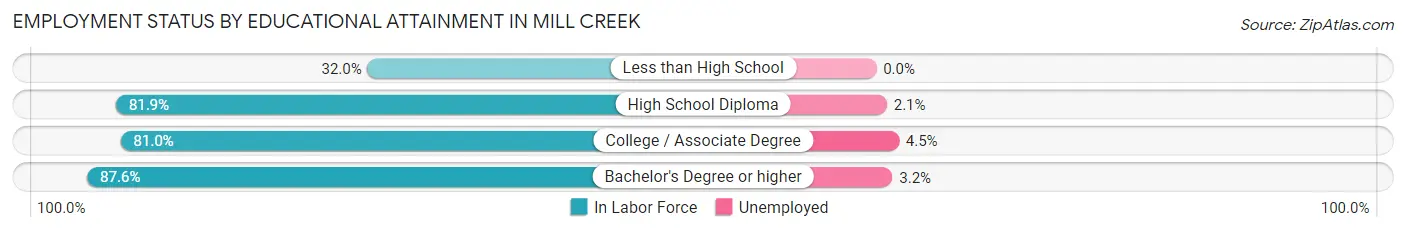
| Educational Attainment | In Labor Force | Unemployed |
| Less than High School | 106 (32.0%) | 0 (0.0%) |
| High School Diploma | 1,040 (81.9%) | 27 (2.1%) |
| College / Associate Degree | 2,881 (81.0%) | 160 (4.5%) |
| Bachelor's Degree or higher | 5,499 (87.6%) | 201 (3.2%) |
| Total | 9,525 (83.3%) | 389 (3.4%) |
Employment Occupations by Sex in Mill Creek
Management, Business, Science and Arts Occupations
The most common Management, Business, Science and Arts occupations in Mill Creek are Computers, Engineering & Science (2,003 | 18.4%), Management (1,832 | 16.9%), Computers & Mathematics (1,282 | 11.8%), Community & Social Service (996 | 9.2%), and Business & Financial (986 | 9.1%).
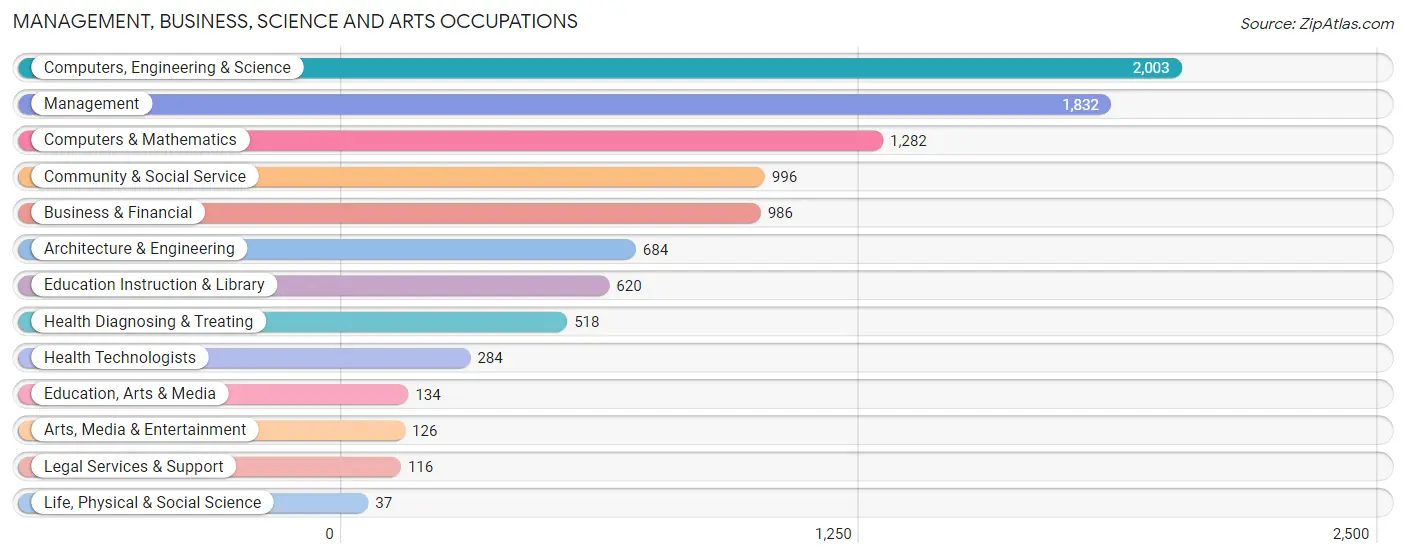
Management, Business, Science and Arts Occupations by Sex
Within the Management, Business, Science and Arts occupations in Mill Creek, the most male-oriented occupations are Architecture & Engineering (79.7%), Computers, Engineering & Science (72.4%), and Computers & Mathematics (68.7%), while the most female-oriented occupations are Education, Arts & Media (88.8%), Education Instruction & Library (81.3%), and Arts, Media & Entertainment (79.4%).
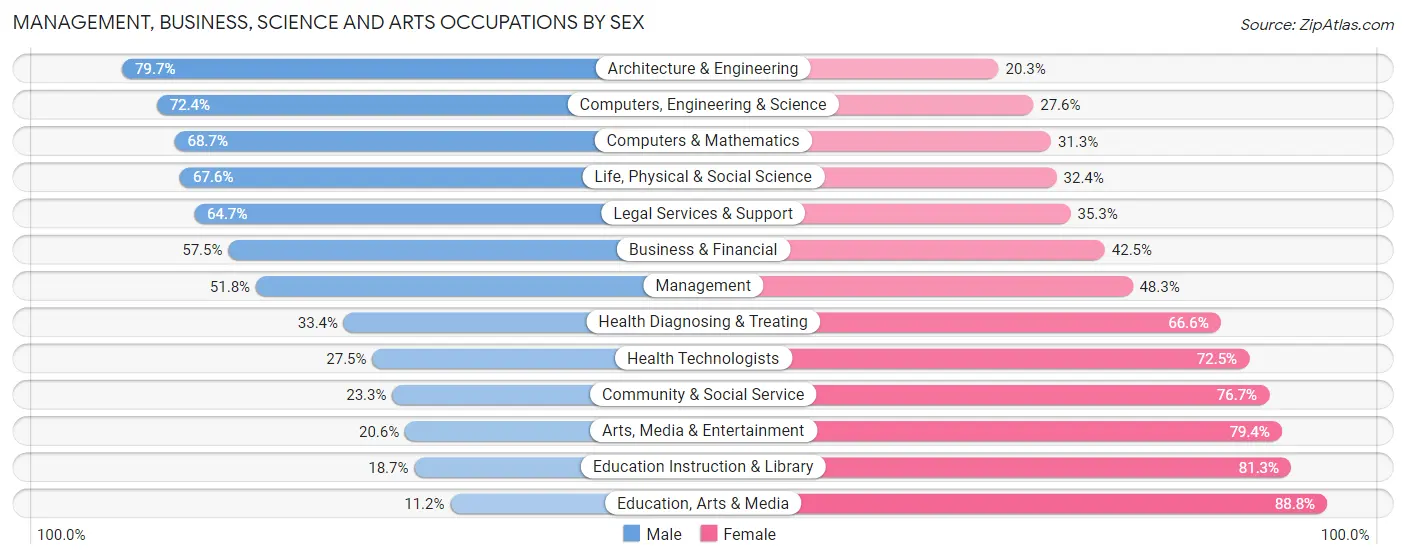
| Occupation | Male | Female |
| Management | 948 (51.7%) | 884 (48.2%) |
| Business & Financial | 567 (57.5%) | 419 (42.5%) |
| Computers, Engineering & Science | 1,451 (72.4%) | 552 (27.6%) |
| Computers & Mathematics | 881 (68.7%) | 401 (31.3%) |
| Architecture & Engineering | 545 (79.7%) | 139 (20.3%) |
| Life, Physical & Social Science | 25 (67.6%) | 12 (32.4%) |
| Community & Social Service | 232 (23.3%) | 764 (76.7%) |
| Education, Arts & Media | 15 (11.2%) | 119 (88.8%) |
| Legal Services & Support | 75 (64.7%) | 41 (35.3%) |
| Education Instruction & Library | 116 (18.7%) | 504 (81.3%) |
| Arts, Media & Entertainment | 26 (20.6%) | 100 (79.4%) |
| Health Diagnosing & Treating | 173 (33.4%) | 345 (66.6%) |
| Health Technologists | 78 (27.5%) | 206 (72.5%) |
| Total (Category) | 3,371 (53.2%) | 2,964 (46.8%) |
| Total (Overall) | 5,588 (51.4%) | 5,272 (48.5%) |
Services Occupations
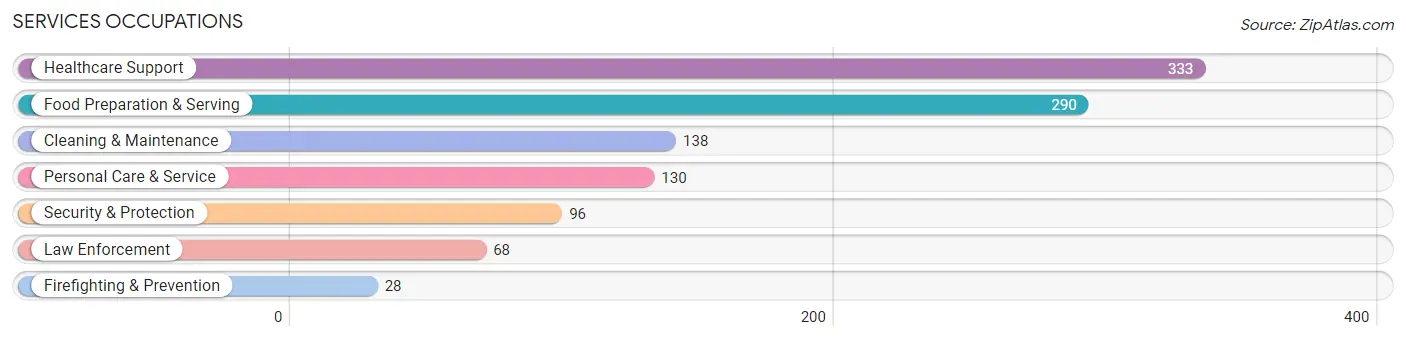
The most common Services occupations in Mill Creek are Healthcare Support (333 | 3.1%), Food Preparation & Serving (290 | 2.7%), Cleaning & Maintenance (138 | 1.3%), Personal Care & Service (130 | 1.2%), and Security & Protection (96 | 0.9%).
Services Occupations by Sex
Within the Services occupations in Mill Creek, the most male-oriented occupations are Security & Protection (100.0%), Firefighting & Prevention (100.0%), and Law Enforcement (100.0%), while the most female-oriented occupations are Healthcare Support (91.0%), Personal Care & Service (81.5%), and Cleaning & Maintenance (36.2%).
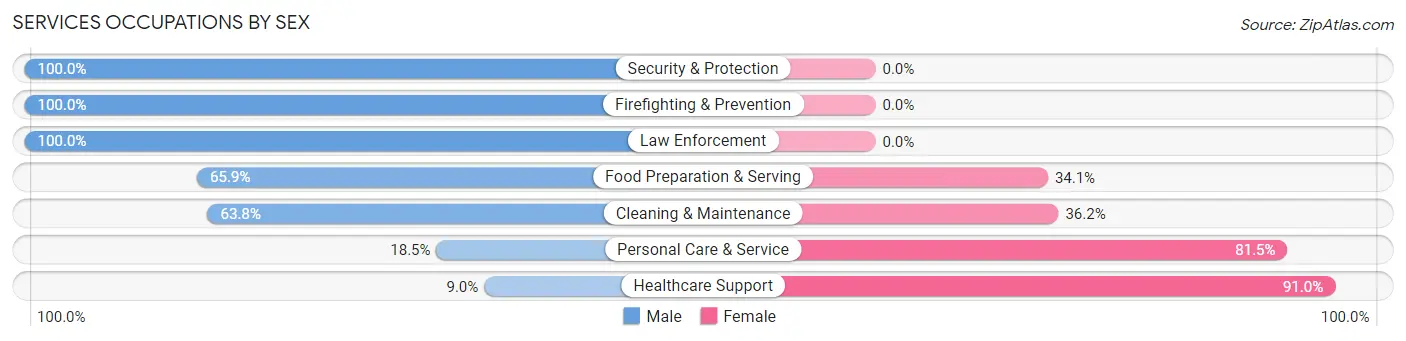
| Occupation | Male | Female |
| Healthcare Support | 30 (9.0%) | 303 (91.0%) |
| Security & Protection | 96 (100.0%) | 0 (0.0%) |
| Firefighting & Prevention | 28 (100.0%) | 0 (0.0%) |
| Law Enforcement | 68 (100.0%) | 0 (0.0%) |
| Food Preparation & Serving | 191 (65.9%) | 99 (34.1%) |
| Cleaning & Maintenance | 88 (63.8%) | 50 (36.2%) |
| Personal Care & Service | 24 (18.5%) | 106 (81.5%) |
| Total (Category) | 429 (43.5%) | 558 (56.5%) |
| Total (Overall) | 5,588 (51.4%) | 5,272 (48.5%) |
Sales and Office Occupations
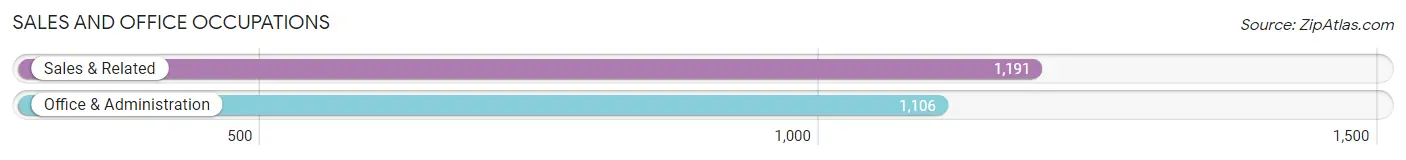
The most common Sales and Office occupations in Mill Creek are Sales & Related (1,191 | 11.0%), and Office & Administration (1,106 | 10.2%).
Sales and Office Occupations by Sex
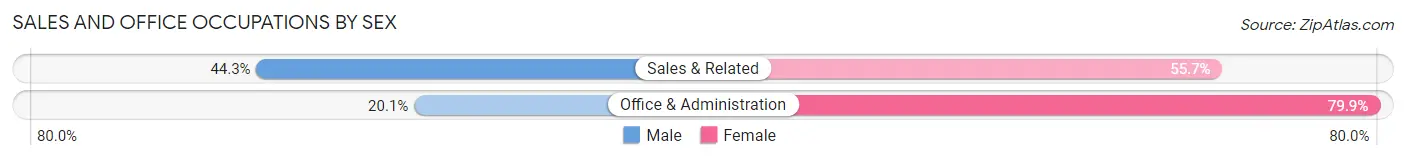
| Occupation | Male | Female |
| Sales & Related | 528 (44.3%) | 663 (55.7%) |
| Office & Administration | 222 (20.1%) | 884 (79.9%) |
| Total (Category) | 750 (32.7%) | 1,547 (67.3%) |
| Total (Overall) | 5,588 (51.4%) | 5,272 (48.5%) |
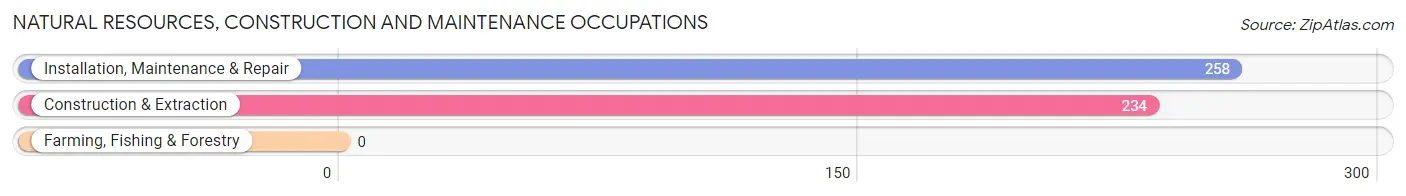
Natural Resources, Construction and Maintenance Occupations
The most common Natural Resources, Construction and Maintenance occupations in Mill Creek are Installation, Maintenance & Repair (258 | 2.4%), and Construction & Extraction (234 | 2.1%).
Natural Resources, Construction and Maintenance Occupations by Sex
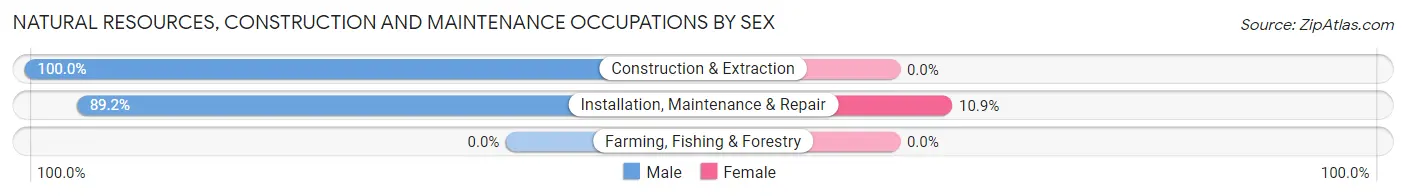
| Occupation | Male | Female |
| Farming, Fishing & Forestry | 0 (0.0%) | 0 (0.0%) |
| Construction & Extraction | 234 (100.0%) | 0 (0.0%) |
| Installation, Maintenance & Repair | 230 (89.1%) | 28 (10.8%) |
| Total (Category) | 464 (94.3%) | 28 (5.7%) |
| Total (Overall) | 5,588 (51.4%) | 5,272 (48.5%) |
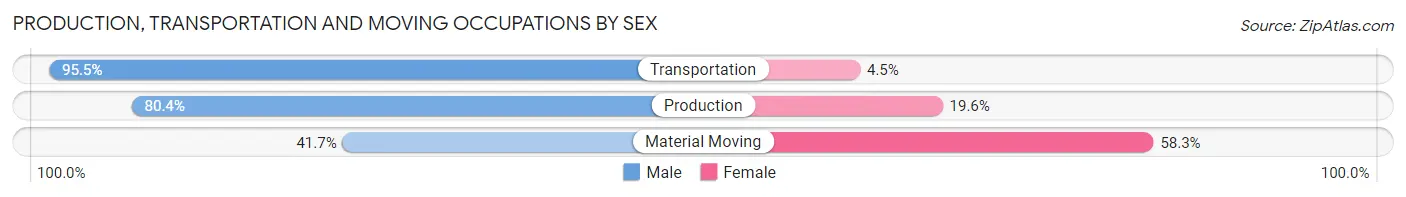
Production, Transportation and Moving Occupations
The most common Production, Transportation and Moving occupations in Mill Creek are Production (336 | 3.1%), Transportation (245 | 2.3%), and Material Moving (168 | 1.5%).
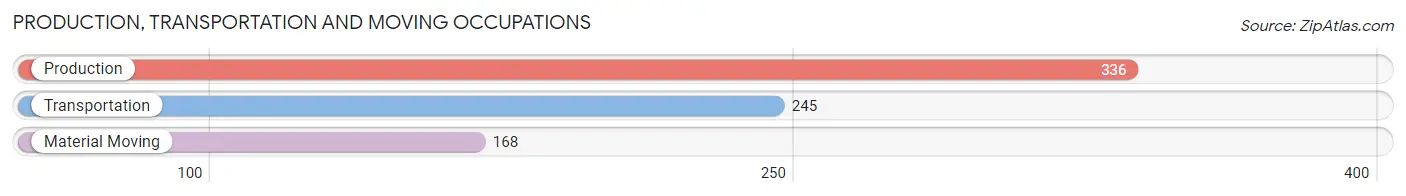
Production, Transportation and Moving Occupations by Sex
| Occupation | Male | Female |
| Production | 270 (80.4%) | 66 (19.6%) |
| Transportation | 234 (95.5%) | 11 (4.5%) |
| Material Moving | 70 (41.7%) | 98 (58.3%) |
| Total (Category) | 574 (76.6%) | 175 (23.4%) |
| Total (Overall) | 5,588 (51.4%) | 5,272 (48.5%) |
Employment Industries by Sex in Mill Creek
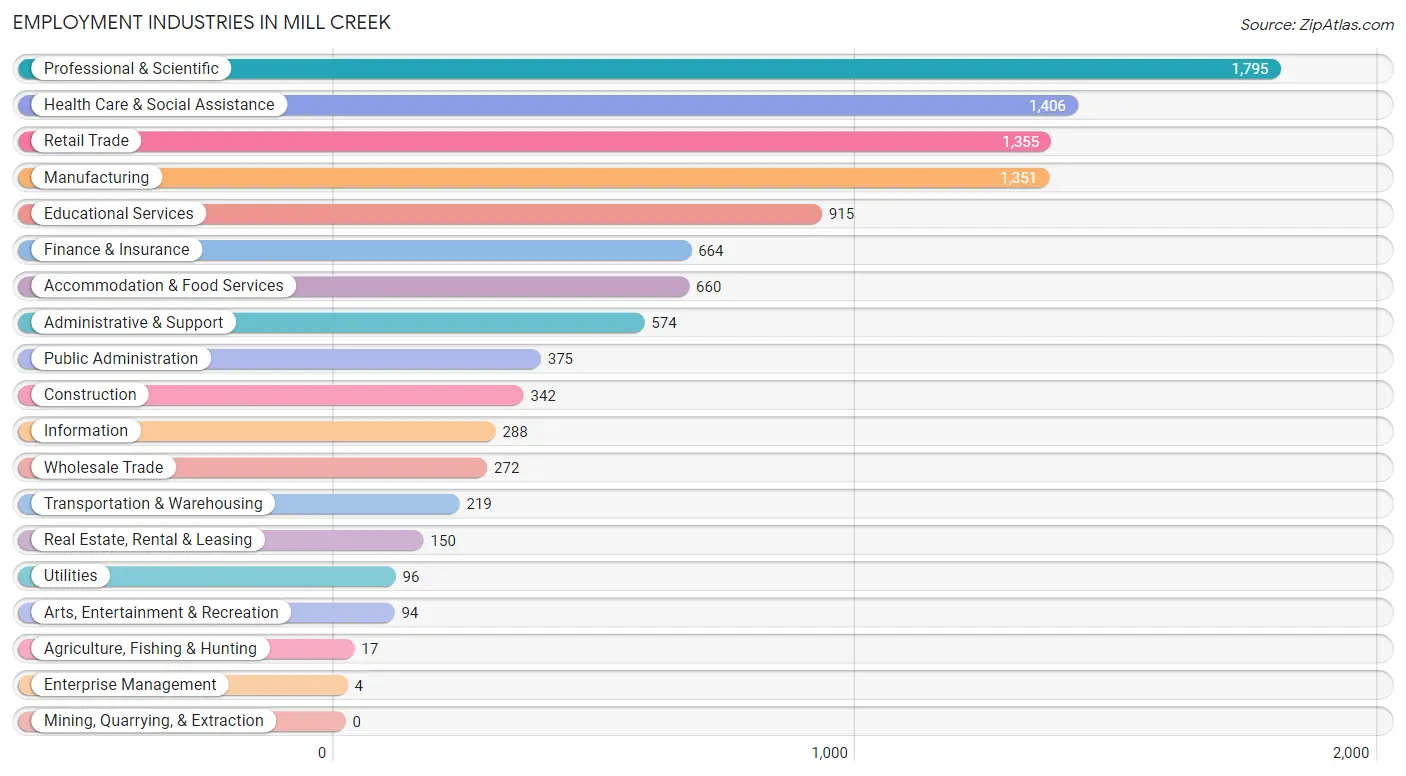
Employment Industries in Mill Creek
The major employment industries in Mill Creek include Professional & Scientific (1,795 | 16.5%), Health Care & Social Assistance (1,406 | 13.0%), Retail Trade (1,355 | 12.5%), Manufacturing (1,351 | 12.4%), and Educational Services (915 | 8.4%).
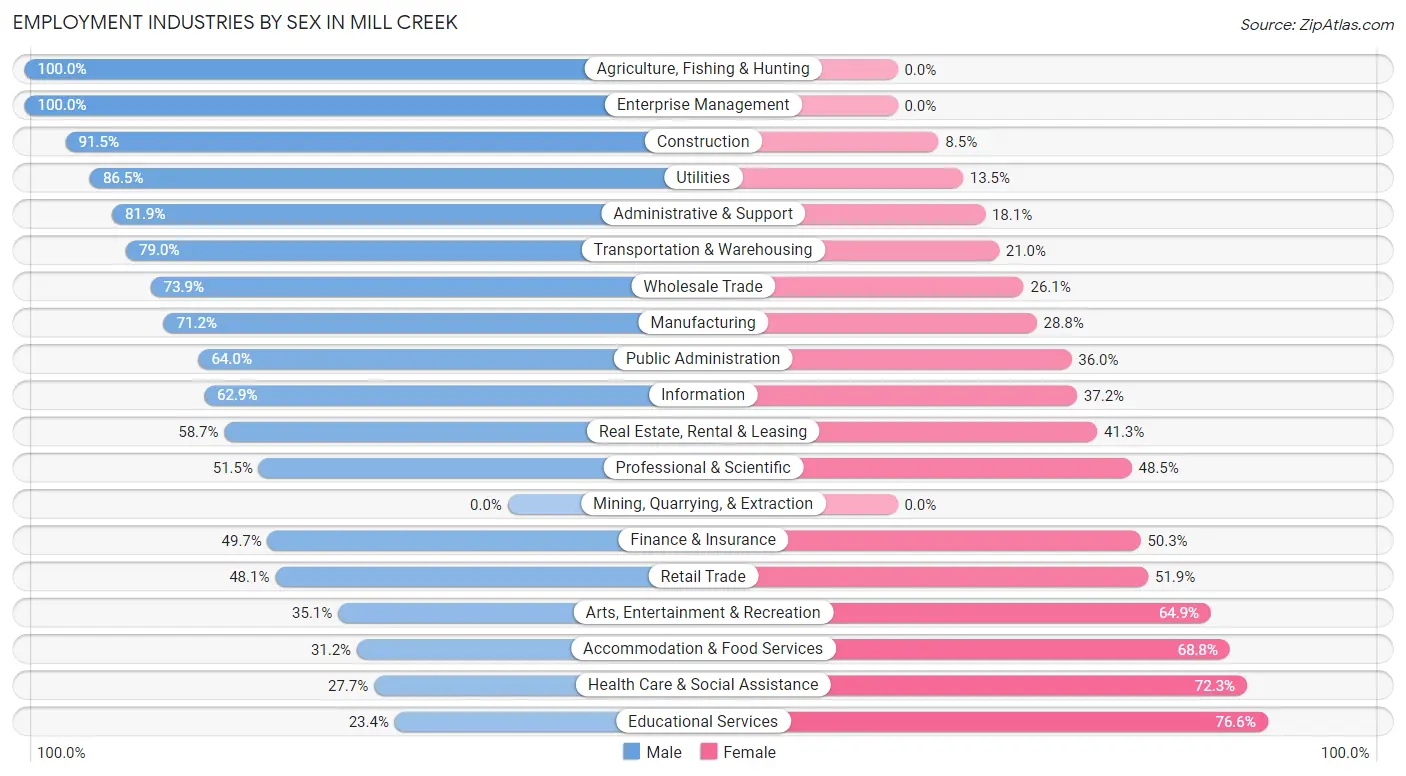
Employment Industries by Sex in Mill Creek
The Mill Creek industries that see more men than women are Agriculture, Fishing & Hunting (100.0%), Enterprise Management (100.0%), and Construction (91.5%), whereas the industries that tend to have a higher number of women are Educational Services (76.6%), Health Care & Social Assistance (72.3%), and Accommodation & Food Services (68.8%).
| Industry | Male | Female |
| Agriculture, Fishing & Hunting | 17 (100.0%) | 0 (0.0%) |
| Mining, Quarrying, & Extraction | 0 (0.0%) | 0 (0.0%) |
| Construction | 313 (91.5%) | 29 (8.5%) |
| Manufacturing | 962 (71.2%) | 389 (28.8%) |
| Wholesale Trade | 201 (73.9%) | 71 (26.1%) |
| Retail Trade | 652 (48.1%) | 703 (51.9%) |
| Transportation & Warehousing | 173 (79.0%) | 46 (21.0%) |
| Utilities | 83 (86.5%) | 13 (13.5%) |
| Information | 181 (62.8%) | 107 (37.1%) |
| Finance & Insurance | 330 (49.7%) | 334 (50.3%) |
| Real Estate, Rental & Leasing | 88 (58.7%) | 62 (41.3%) |
| Professional & Scientific | 925 (51.5%) | 870 (48.5%) |
| Enterprise Management | 4 (100.0%) | 0 (0.0%) |
| Administrative & Support | 470 (81.9%) | 104 (18.1%) |
| Educational Services | 214 (23.4%) | 701 (76.6%) |
| Health Care & Social Assistance | 389 (27.7%) | 1,017 (72.3%) |
| Arts, Entertainment & Recreation | 33 (35.1%) | 61 (64.9%) |
| Accommodation & Food Services | 206 (31.2%) | 454 (68.8%) |
| Public Administration | 240 (64.0%) | 135 (36.0%) |
| Total | 5,588 (51.4%) | 5,272 (48.5%) |
Education in Mill Creek
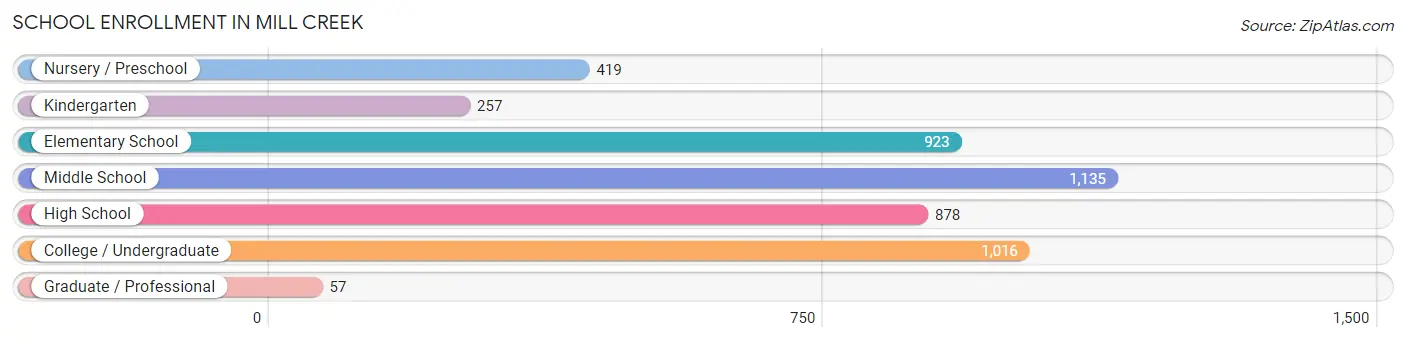
School Enrollment in Mill Creek
The most common levels of schooling among the 4,685 students in Mill Creek are middle school (1,135 | 24.2%), college / undergraduate (1,016 | 21.7%), and elementary school (923 | 19.7%).
| School Level | # Students | % Students |
| Nursery / Preschool | 419 | 8.9% |
| Kindergarten | 257 | 5.5% |
| Elementary School | 923 | 19.7% |
| Middle School | 1,135 | 24.2% |
| High School | 878 | 18.7% |
| College / Undergraduate | 1,016 | 21.7% |
| Graduate / Professional | 57 | 1.2% |
| Total | 4,685 | 100.0% |
School Enrollment by Age by Funding Source in Mill Creek
Out of a total of 4,685 students who are enrolled in schools in Mill Creek, 717 (15.3%) attend a private institution, while the remaining 3,968 (84.7%) are enrolled in public schools. The age group of 3 to 4 year olds has the highest likelihood of being enrolled in private schools, with 215 (68.9% in the age bracket) enrolled. Conversely, the age group of 15 to 17 year olds has the lowest likelihood of being enrolled in a private school, with 654 (98.5% in the age bracket) attending a public institution.
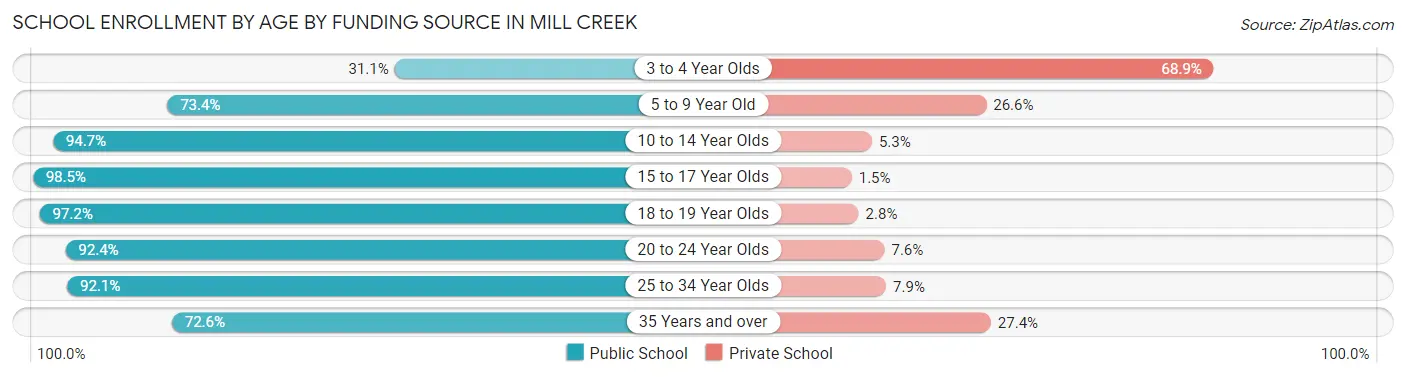
| Age Bracket | Public School | Private School |
| 3 to 4 Year Olds | 97 (31.1%) | 215 (68.9%) |
| 5 to 9 Year Old | 890 (73.4%) | 322 (26.6%) |
| 10 to 14 Year Olds | 1,222 (94.7%) | 68 (5.3%) |
| 15 to 17 Year Olds | 654 (98.5%) | 10 (1.5%) |
| 18 to 19 Year Olds | 348 (97.2%) | 10 (2.8%) |
| 20 to 24 Year Olds | 413 (92.4%) | 34 (7.6%) |
| 25 to 34 Year Olds | 256 (92.1%) | 22 (7.9%) |
| 35 Years and over | 90 (72.6%) | 34 (27.4%) |
| Total | 3,968 (84.7%) | 717 (15.3%) |
Educational Attainment by Field of Study in Mill Creek
Business (1,890 | 23.1%), engineering (1,050 | 12.9%), computers & mathematics (948 | 11.6%), social sciences (605 | 7.4%), and education (603 | 7.4%) are the most common fields of study among 8,169 individuals in Mill Creek who have obtained a bachelor's degree or higher.
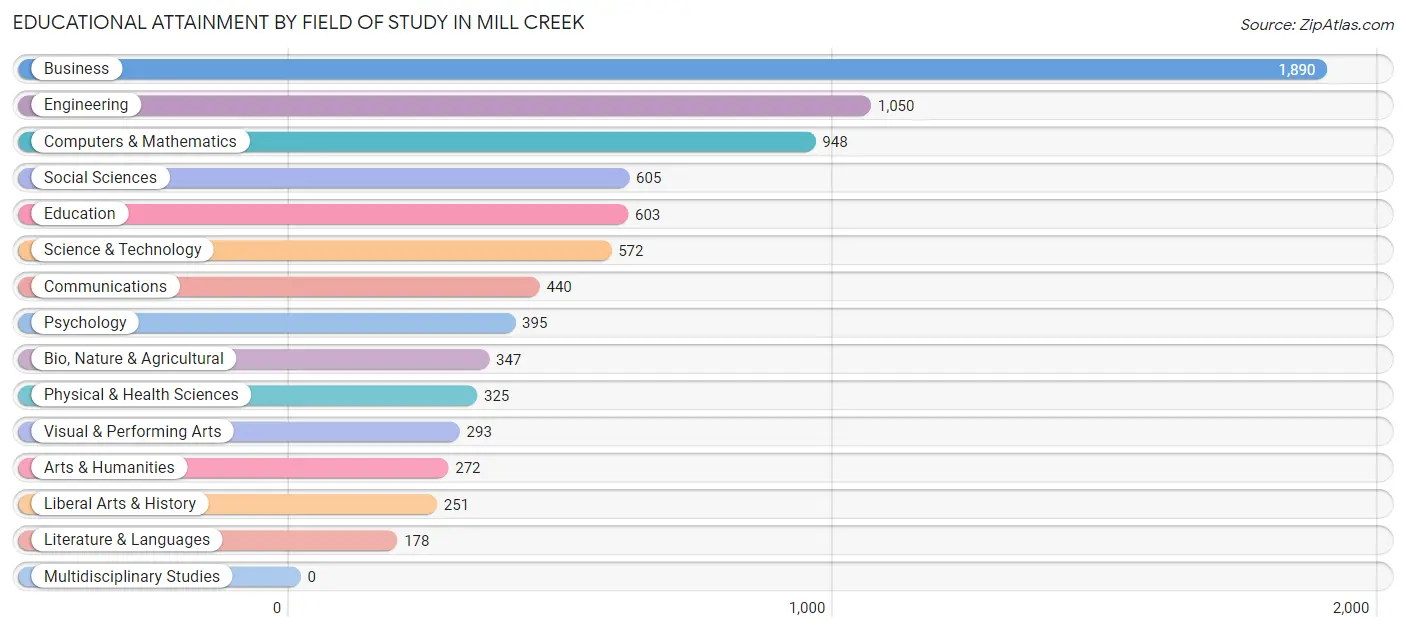
| Field of Study | # Graduates | % Graduates |
| Computers & Mathematics | 948 | 11.6% |
| Bio, Nature & Agricultural | 347 | 4.3% |
| Physical & Health Sciences | 325 | 4.0% |
| Psychology | 395 | 4.8% |
| Social Sciences | 605 | 7.4% |
| Engineering | 1,050 | 12.9% |
| Multidisciplinary Studies | 0 | 0.0% |
| Science & Technology | 572 | 7.0% |
| Business | 1,890 | 23.1% |
| Education | 603 | 7.4% |
| Literature & Languages | 178 | 2.2% |
| Liberal Arts & History | 251 | 3.1% |
| Visual & Performing Arts | 293 | 3.6% |
| Communications | 440 | 5.4% |
| Arts & Humanities | 272 | 3.3% |
| Total | 8,169 | 100.0% |
Transportation & Commute in Mill Creek
Vehicle Availability by Sex in Mill Creek
The most prevalent vehicle ownership categories in Mill Creek are males with 2 vehicles (2,323, accounting for 41.6%) and females with 2 vehicles (2,069, making up 44.5%).
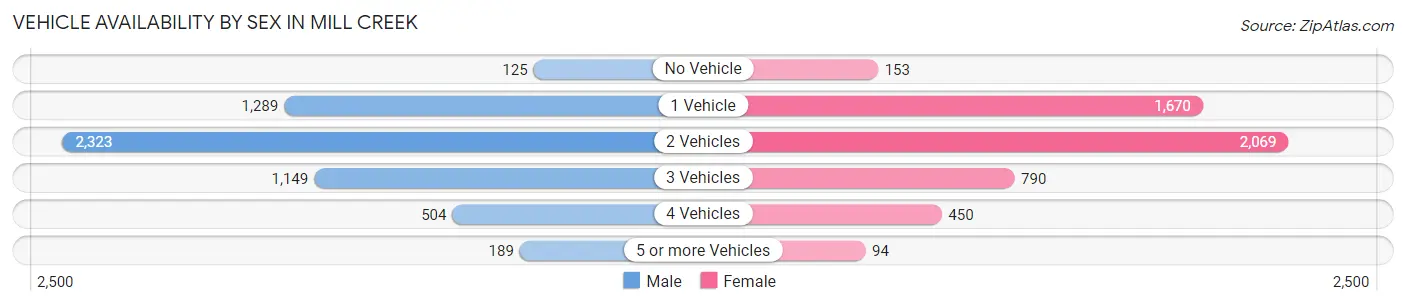
| Vehicles Available | Male | Female |
| No Vehicle | 125 (2.2%) | 153 (2.9%) |
| 1 Vehicle | 1,289 (23.1%) | 1,670 (32.0%) |
| 2 Vehicles | 2,323 (41.6%) | 2,069 (39.6%) |
| 3 Vehicles | 1,149 (20.6%) | 790 (15.1%) |
| 4 Vehicles | 504 (9.0%) | 450 (8.6%) |
| 5 or more Vehicles | 189 (3.4%) | 94 (1.8%) |
| Total | 5,579 (100.0%) | 5,226 (100.0%) |
Commute Time in Mill Creek
The most frequently occuring commute durations in Mill Creek are 45 to 59 minutes (1,222 commuters, 15.0%), 30 to 34 minutes (1,149 commuters, 14.2%), and 20 to 24 minutes (1,145 commuters, 14.1%).
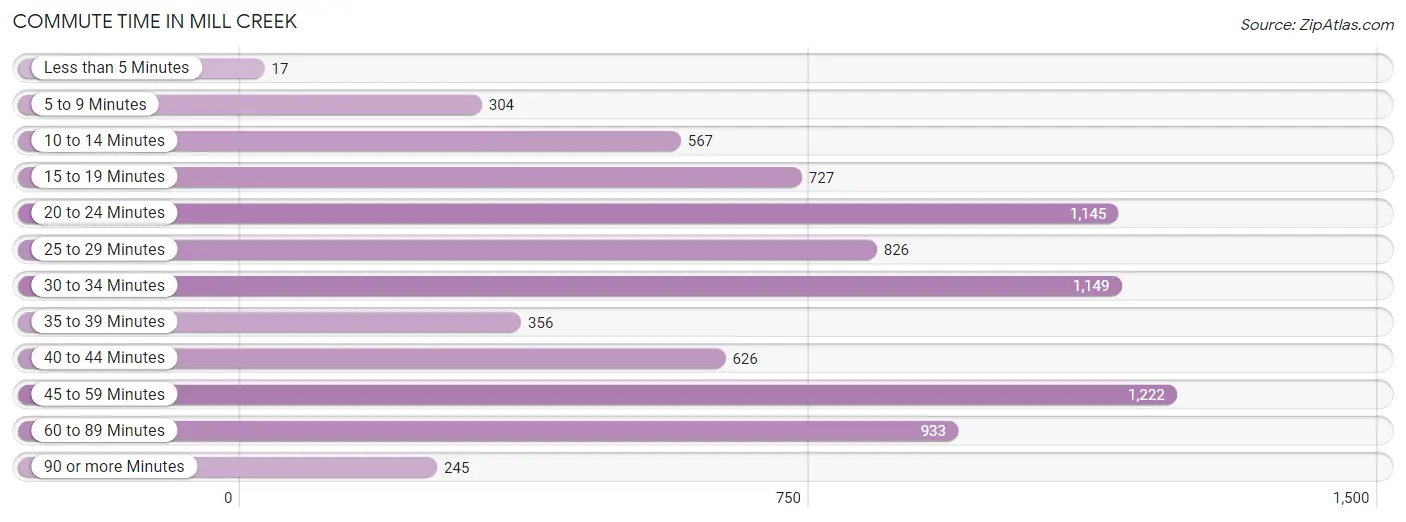
| Commute Time | # Commuters | % Commuters |
| Less than 5 Minutes | 17 | 0.2% |
| 5 to 9 Minutes | 304 | 3.7% |
| 10 to 14 Minutes | 567 | 7.0% |
| 15 to 19 Minutes | 727 | 9.0% |
| 20 to 24 Minutes | 1,145 | 14.1% |
| 25 to 29 Minutes | 826 | 10.2% |
| 30 to 34 Minutes | 1,149 | 14.2% |
| 35 to 39 Minutes | 356 | 4.4% |
| 40 to 44 Minutes | 626 | 7.7% |
| 45 to 59 Minutes | 1,222 | 15.0% |
| 60 to 89 Minutes | 933 | 11.5% |
| 90 or more Minutes | 245 | 3.0% |
Commute Time by Sex in Mill Creek
The most common commute times in Mill Creek are 30 to 34 minutes (676 commuters, 15.8%) for males and 45 to 59 minutes (574 commuters, 15.0%) for females.
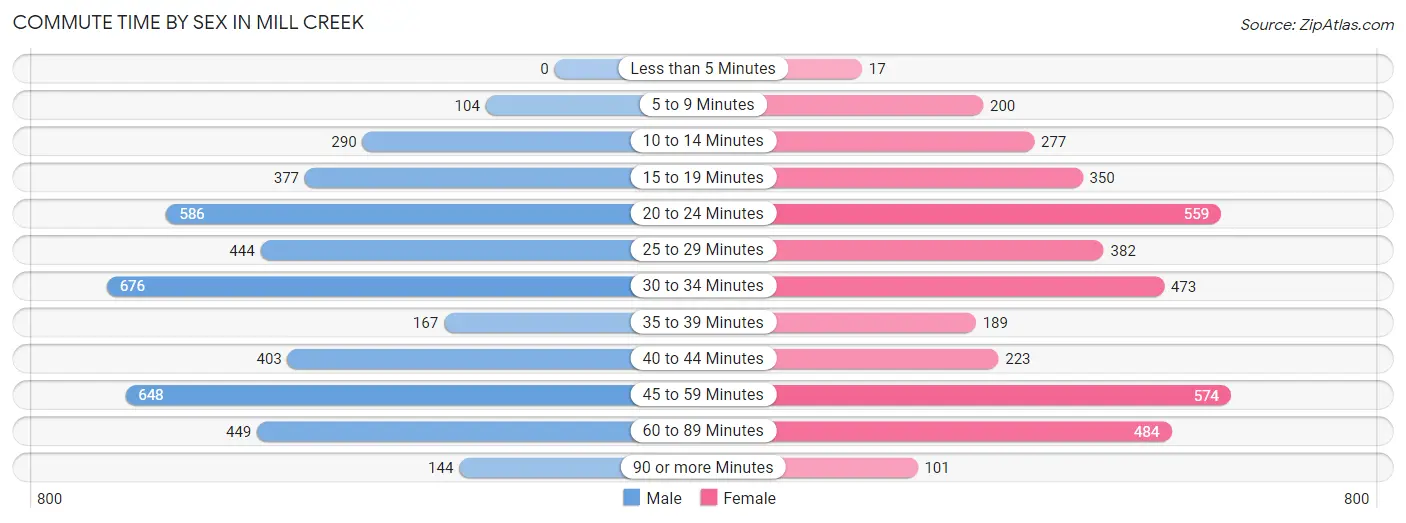
| Commute Time | Male | Female |
| Less than 5 Minutes | 0 (0.0%) | 17 (0.4%) |
| 5 to 9 Minutes | 104 (2.4%) | 200 (5.2%) |
| 10 to 14 Minutes | 290 (6.8%) | 277 (7.2%) |
| 15 to 19 Minutes | 377 (8.8%) | 350 (9.1%) |
| 20 to 24 Minutes | 586 (13.7%) | 559 (14.6%) |
| 25 to 29 Minutes | 444 (10.3%) | 382 (10.0%) |
| 30 to 34 Minutes | 676 (15.8%) | 473 (12.3%) |
| 35 to 39 Minutes | 167 (3.9%) | 189 (4.9%) |
| 40 to 44 Minutes | 403 (9.4%) | 223 (5.8%) |
| 45 to 59 Minutes | 648 (15.1%) | 574 (15.0%) |
| 60 to 89 Minutes | 449 (10.5%) | 484 (12.6%) |
| 90 or more Minutes | 144 (3.4%) | 101 (2.6%) |
Time of Departure to Work by Sex in Mill Creek
The most frequent times of departure to work in Mill Creek are 6:30 AM to 6:59 AM (534, 12.4%) for males and 6:30 AM to 6:59 AM (578, 15.1%) for females.
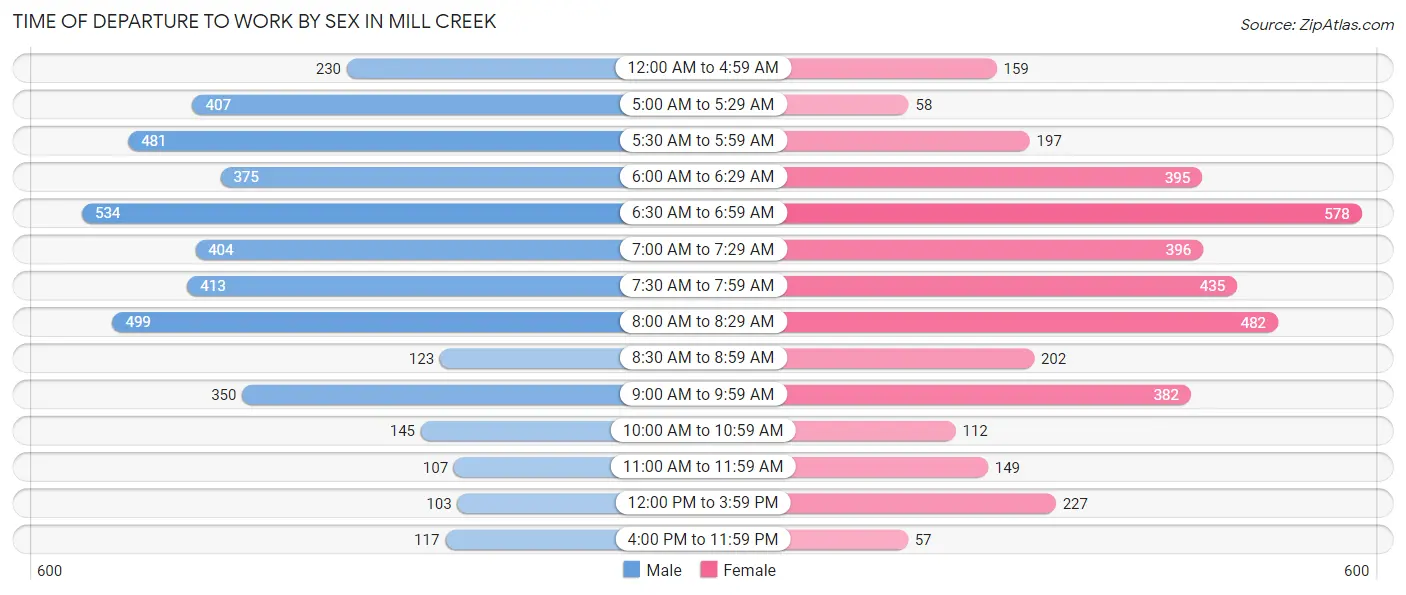
| Time of Departure | Male | Female |
| 12:00 AM to 4:59 AM | 230 (5.4%) | 159 (4.2%) |
| 5:00 AM to 5:29 AM | 407 (9.5%) | 58 (1.5%) |
| 5:30 AM to 5:59 AM | 481 (11.2%) | 197 (5.1%) |
| 6:00 AM to 6:29 AM | 375 (8.7%) | 395 (10.3%) |
| 6:30 AM to 6:59 AM | 534 (12.4%) | 578 (15.1%) |
| 7:00 AM to 7:29 AM | 404 (9.4%) | 396 (10.3%) |
| 7:30 AM to 7:59 AM | 413 (9.6%) | 435 (11.4%) |
| 8:00 AM to 8:29 AM | 499 (11.6%) | 482 (12.6%) |
| 8:30 AM to 8:59 AM | 123 (2.9%) | 202 (5.3%) |
| 9:00 AM to 9:59 AM | 350 (8.2%) | 382 (10.0%) |
| 10:00 AM to 10:59 AM | 145 (3.4%) | 112 (2.9%) |
| 11:00 AM to 11:59 AM | 107 (2.5%) | 149 (3.9%) |
| 12:00 PM to 3:59 PM | 103 (2.4%) | 227 (5.9%) |
| 4:00 PM to 11:59 PM | 117 (2.7%) | 57 (1.5%) |
| Total | 4,288 (100.0%) | 3,829 (100.0%) |
Housing Occupancy in Mill Creek
Occupancy by Ownership in Mill Creek
Of the total 8,378 dwellings in Mill Creek, owner-occupied units account for 5,091 (60.8%), while renter-occupied units make up 3,287 (39.2%).
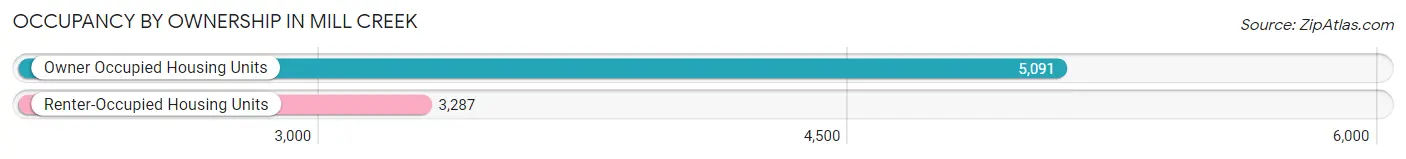
| Occupancy | # Housing Units | % Housing Units |
| Owner Occupied Housing Units | 5,091 | 60.8% |
| Renter-Occupied Housing Units | 3,287 | 39.2% |
| Total Occupied Housing Units | 8,378 | 100.0% |
Occupancy by Household Size in Mill Creek
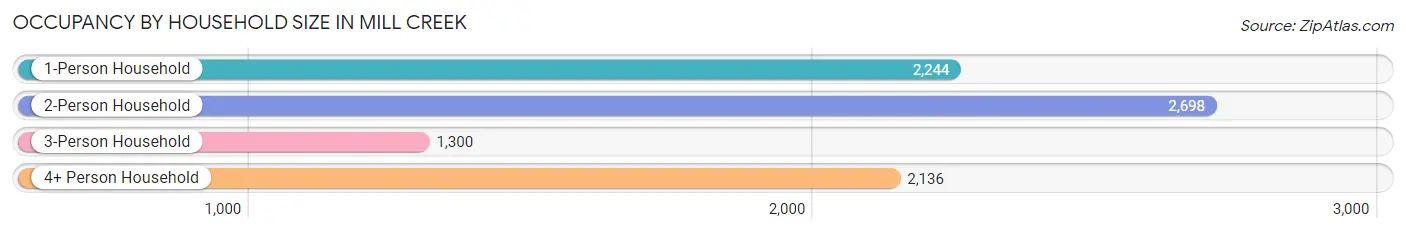
| Household Size | # Housing Units | % Housing Units |
| 1-Person Household | 2,244 | 26.8% |
| 2-Person Household | 2,698 | 32.2% |
| 3-Person Household | 1,300 | 15.5% |
| 4+ Person Household | 2,136 | 25.5% |
| Total Housing Units | 8,378 | 100.0% |
Occupancy by Ownership by Household Size in Mill Creek
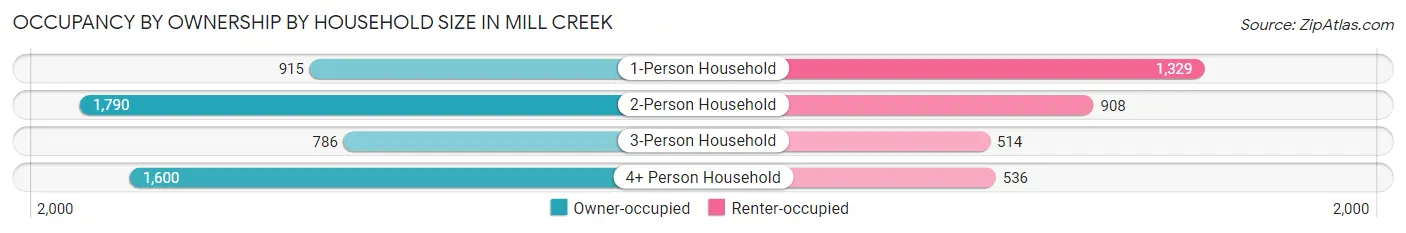
| Household Size | Owner-occupied | Renter-occupied |
| 1-Person Household | 915 (40.8%) | 1,329 (59.2%) |
| 2-Person Household | 1,790 (66.3%) | 908 (33.7%) |
| 3-Person Household | 786 (60.5%) | 514 (39.5%) |
| 4+ Person Household | 1,600 (74.9%) | 536 (25.1%) |
| Total Housing Units | 5,091 (60.8%) | 3,287 (39.2%) |
Occupancy by Educational Attainment in Mill Creek
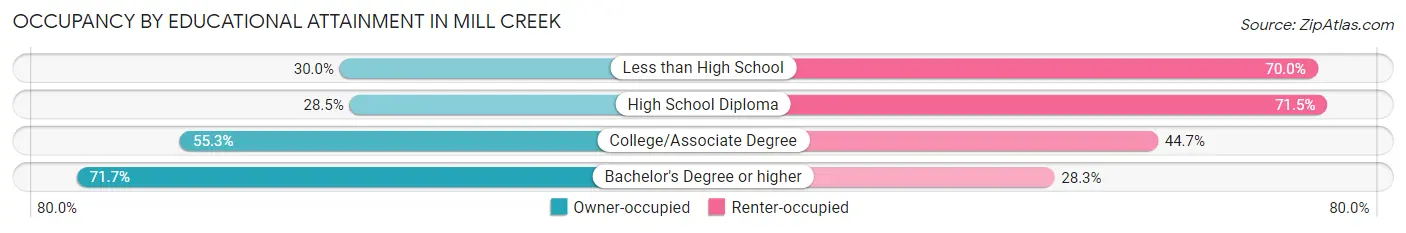
| Household Size | Owner-occupied | Renter-occupied |
| Less than High School | 48 (30.0%) | 112 (70.0%) |
| High School Diploma | 261 (28.5%) | 656 (71.5%) |
| College/Associate Degree | 1,537 (55.3%) | 1,241 (44.7%) |
| Bachelor's Degree or higher | 3,245 (71.7%) | 1,278 (28.3%) |
Occupancy by Age of Householder in Mill Creek
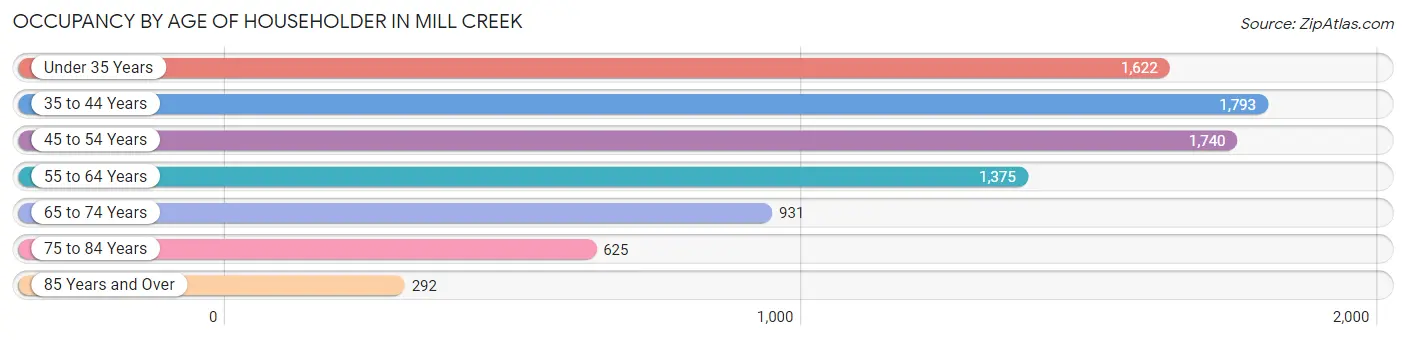
| Age Bracket | # Households | % Households |
| Under 35 Years | 1,622 | 19.4% |
| 35 to 44 Years | 1,793 | 21.4% |
| 45 to 54 Years | 1,740 | 20.8% |
| 55 to 64 Years | 1,375 | 16.4% |
| 65 to 74 Years | 931 | 11.1% |
| 75 to 84 Years | 625 | 7.5% |
| 85 Years and Over | 292 | 3.5% |
| Total | 8,378 | 100.0% |
Housing Finances in Mill Creek
Median Income by Occupancy in Mill Creek
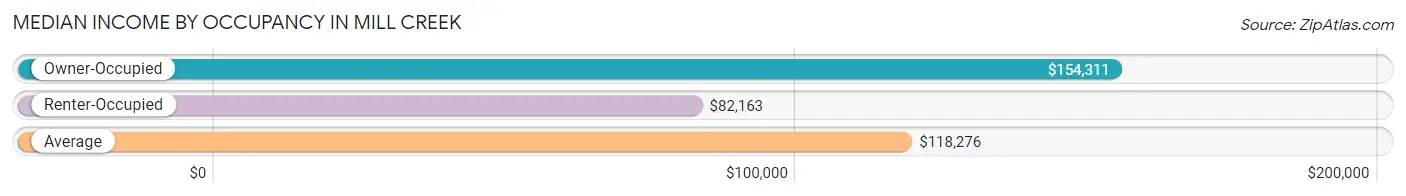
| Occupancy Type | # Households | Median Income |
| Owner-Occupied | 5,091 (60.8%) | $154,311 |
| Renter-Occupied | 3,287 (39.2%) | $82,163 |
| Average | 8,378 (100.0%) | $118,276 |
Occupancy by Householder Income Bracket in Mill Creek
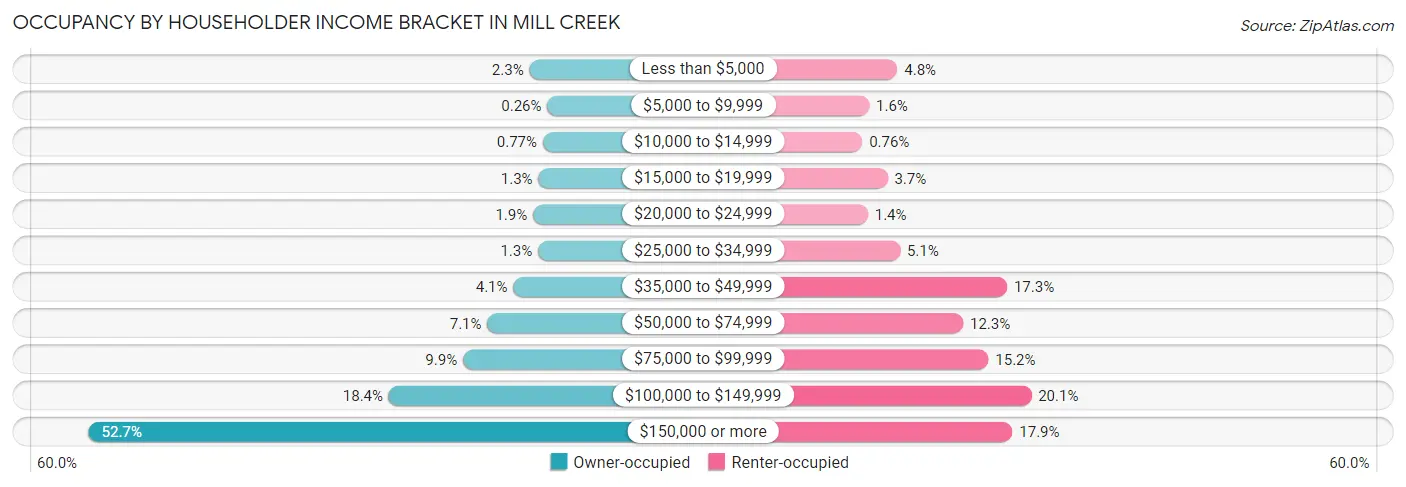
| Income Bracket | Owner-occupied | Renter-occupied |
| Less than $5,000 | 117 (2.3%) | 157 (4.8%) |
| $5,000 to $9,999 | 13 (0.3%) | 51 (1.5%) |
| $10,000 to $14,999 | 39 (0.8%) | 25 (0.8%) |
| $15,000 to $19,999 | 65 (1.3%) | 120 (3.6%) |
| $20,000 to $24,999 | 96 (1.9%) | 46 (1.4%) |
| $25,000 to $34,999 | 67 (1.3%) | 167 (5.1%) |
| $35,000 to $49,999 | 211 (4.1%) | 569 (17.3%) |
| $50,000 to $74,999 | 362 (7.1%) | 404 (12.3%) |
| $75,000 to $99,999 | 504 (9.9%) | 499 (15.2%) |
| $100,000 to $149,999 | 935 (18.4%) | 660 (20.1%) |
| $150,000 or more | 2,682 (52.7%) | 589 (17.9%) |
| Total | 5,091 (100.0%) | 3,287 (100.0%) |
Monthly Housing Cost Tiers in Mill Creek
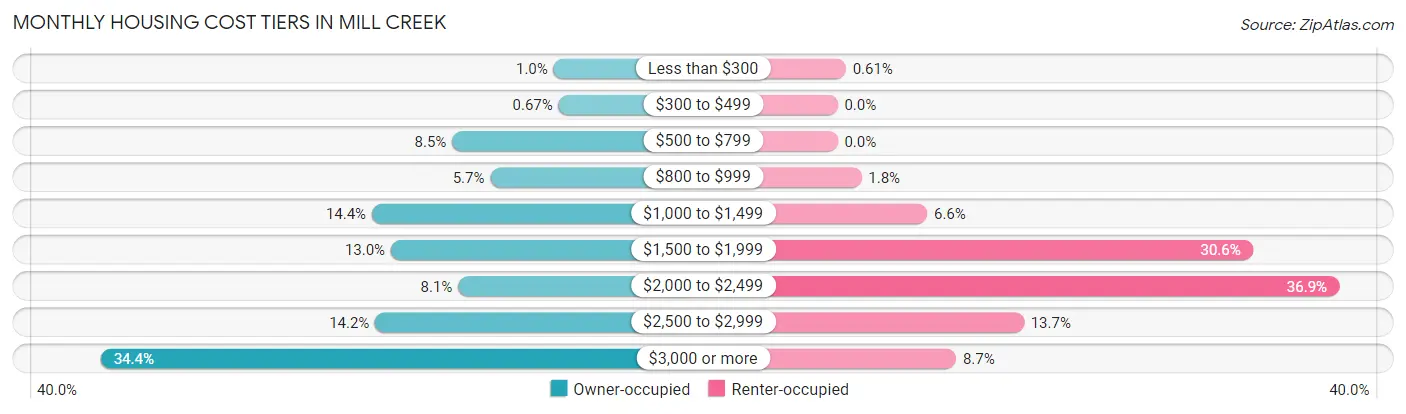
| Monthly Cost | Owner-occupied | Renter-occupied |
| Less than $300 | 53 (1.0%) | 20 (0.6%) |
| $300 to $499 | 34 (0.7%) | 0 (0.0%) |
| $500 to $799 | 433 (8.5%) | 0 (0.0%) |
| $800 to $999 | 290 (5.7%) | 58 (1.8%) |
| $1,000 to $1,499 | 734 (14.4%) | 217 (6.6%) |
| $1,500 to $1,999 | 663 (13.0%) | 1,005 (30.6%) |
| $2,000 to $2,499 | 411 (8.1%) | 1,214 (36.9%) |
| $2,500 to $2,999 | 722 (14.2%) | 451 (13.7%) |
| $3,000 or more | 1,751 (34.4%) | 287 (8.7%) |
| Total | 5,091 (100.0%) | 3,287 (100.0%) |
Physical Housing Characteristics in Mill Creek
Housing Structures in Mill Creek
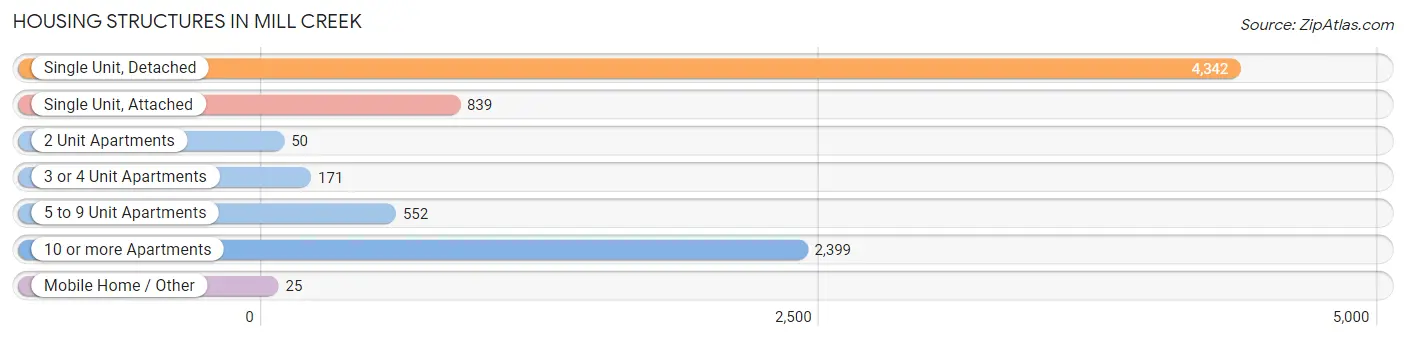
| Structure Type | # Housing Units | % Housing Units |
| Single Unit, Detached | 4,342 | 51.8% |
| Single Unit, Attached | 839 | 10.0% |
| 2 Unit Apartments | 50 | 0.6% |
| 3 or 4 Unit Apartments | 171 | 2.0% |
| 5 to 9 Unit Apartments | 552 | 6.6% |
| 10 or more Apartments | 2,399 | 28.6% |
| Mobile Home / Other | 25 | 0.3% |
| Total | 8,378 | 100.0% |
Housing Structures by Occupancy in Mill Creek
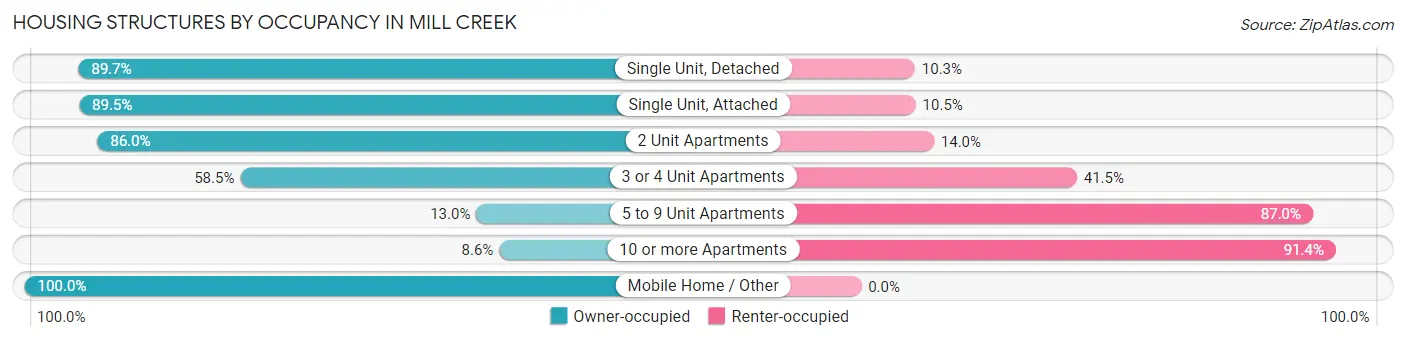
| Structure Type | Owner-occupied | Renter-occupied |
| Single Unit, Detached | 3,893 (89.7%) | 449 (10.3%) |
| Single Unit, Attached | 751 (89.5%) | 88 (10.5%) |
| 2 Unit Apartments | 43 (86.0%) | 7 (14.0%) |
| 3 or 4 Unit Apartments | 100 (58.5%) | 71 (41.5%) |
| 5 to 9 Unit Apartments | 72 (13.0%) | 480 (87.0%) |
| 10 or more Apartments | 207 (8.6%) | 2,192 (91.4%) |
| Mobile Home / Other | 25 (100.0%) | 0 (0.0%) |
| Total | 5,091 (60.8%) | 3,287 (39.2%) |
Housing Structures by Number of Rooms in Mill Creek
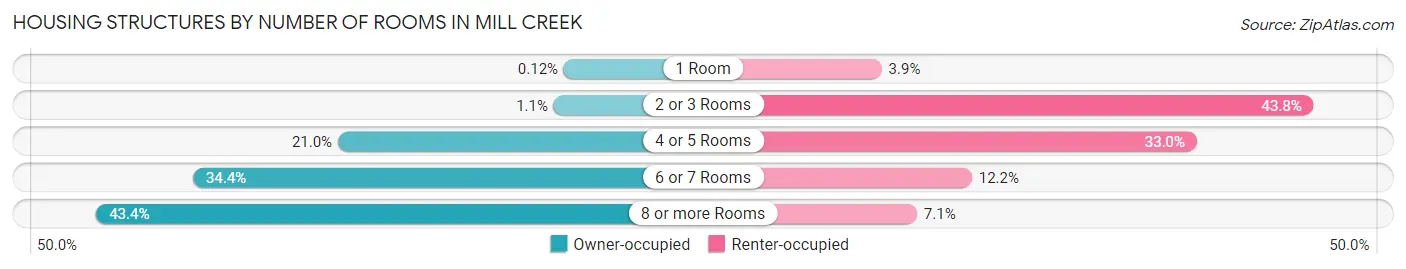
| Number of Rooms | Owner-occupied | Renter-occupied |
| 1 Room | 6 (0.1%) | 127 (3.9%) |
| 2 or 3 Rooms | 54 (1.1%) | 1,440 (43.8%) |
| 4 or 5 Rooms | 1,070 (21.0%) | 1,085 (33.0%) |
| 6 or 7 Rooms | 1,753 (34.4%) | 401 (12.2%) |
| 8 or more Rooms | 2,208 (43.4%) | 234 (7.1%) |
| Total | 5,091 (100.0%) | 3,287 (100.0%) |
Housing Structure by Heating Type in Mill Creek
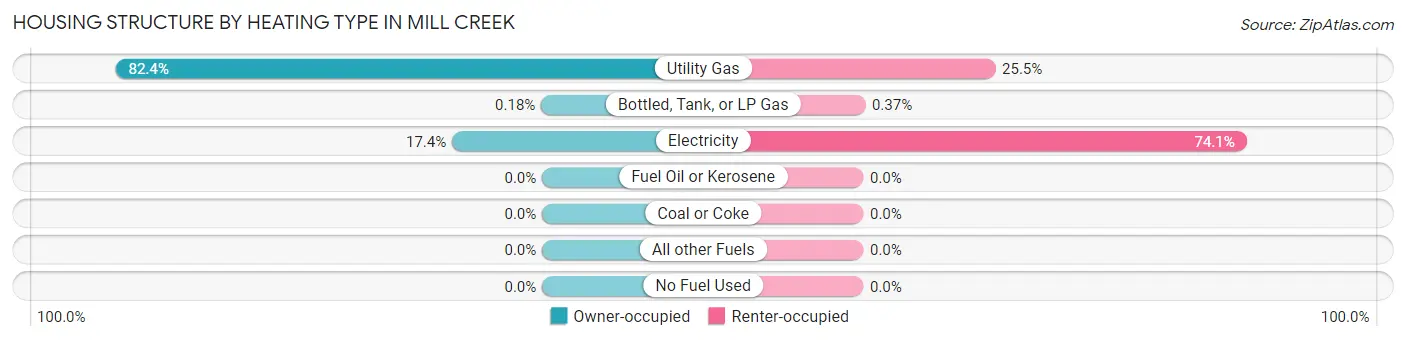
| Heating Type | Owner-occupied | Renter-occupied |
| Utility Gas | 4,196 (82.4%) | 839 (25.5%) |
| Bottled, Tank, or LP Gas | 9 (0.2%) | 12 (0.4%) |
| Electricity | 886 (17.4%) | 2,436 (74.1%) |
| Fuel Oil or Kerosene | 0 (0.0%) | 0 (0.0%) |
| Coal or Coke | 0 (0.0%) | 0 (0.0%) |
| All other Fuels | 0 (0.0%) | 0 (0.0%) |
| No Fuel Used | 0 (0.0%) | 0 (0.0%) |
| Total | 5,091 (100.0%) | 3,287 (100.0%) |
Household Vehicle Usage in Mill Creek
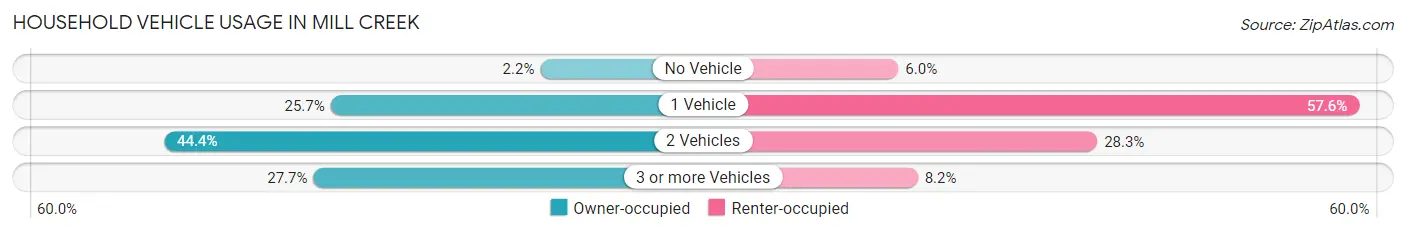
| Vehicles per Household | Owner-occupied | Renter-occupied |
| No Vehicle | 114 (2.2%) | 197 (6.0%) |
| 1 Vehicle | 1,310 (25.7%) | 1,893 (57.6%) |
| 2 Vehicles | 2,259 (44.4%) | 929 (28.3%) |
| 3 or more Vehicles | 1,408 (27.7%) | 268 (8.2%) |
| Total | 5,091 (100.0%) | 3,287 (100.0%) |
Real Estate & Mortgages in Mill Creek
Real Estate and Mortgage Overview in Mill Creek
| Characteristic | Without Mortgage | With Mortgage |
| Housing Units | 1,359 | 3,732 |
| Median Property Value | $747,400 | $786,700 |
| Median Household Income | $101,775 | $2,246 |
| Monthly Housing Costs | $947 | $1,735 |
| Real Estate Taxes | $6,150 | $49 |
Property Value by Mortgage Status in Mill Creek
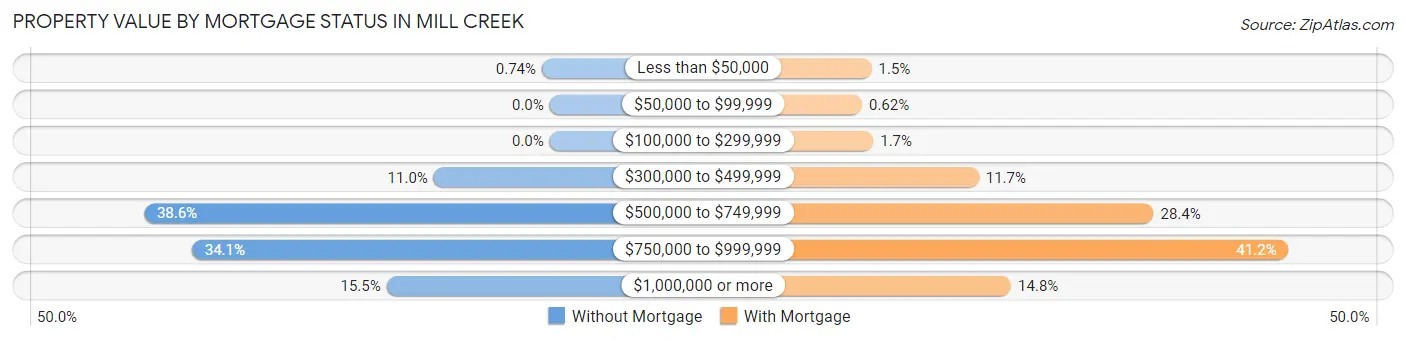
| Property Value | Without Mortgage | With Mortgage |
| Less than $50,000 | 10 (0.7%) | 57 (1.5%) |
| $50,000 to $99,999 | 0 (0.0%) | 23 (0.6%) |
| $100,000 to $299,999 | 0 (0.0%) | 63 (1.7%) |
| $300,000 to $499,999 | 150 (11.0%) | 438 (11.7%) |
| $500,000 to $749,999 | 525 (38.6%) | 1,059 (28.4%) |
| $750,000 to $999,999 | 463 (34.1%) | 1,539 (41.2%) |
| $1,000,000 or more | 211 (15.5%) | 553 (14.8%) |
| Total | 1,359 (100.0%) | 3,732 (100.0%) |
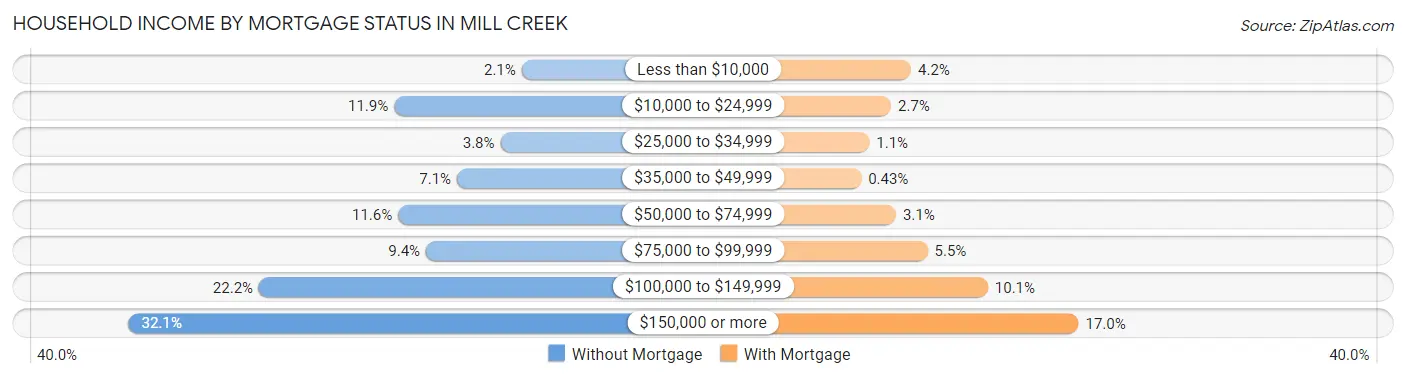
Household Income by Mortgage Status in Mill Creek
| Household Income | Without Mortgage | With Mortgage |
| Less than $10,000 | 29 (2.1%) | 158 (4.2%) |
| $10,000 to $24,999 | 161 (11.8%) | 101 (2.7%) |
| $25,000 to $34,999 | 51 (3.7%) | 39 (1.1%) |
| $35,000 to $49,999 | 96 (7.1%) | 16 (0.4%) |
| $50,000 to $74,999 | 157 (11.6%) | 115 (3.1%) |
| $75,000 to $99,999 | 128 (9.4%) | 205 (5.5%) |
| $100,000 to $149,999 | 301 (22.2%) | 376 (10.1%) |
| $150,000 or more | 436 (32.1%) | 634 (17.0%) |
| Total | 1,359 (100.0%) | 3,732 (100.0%) |
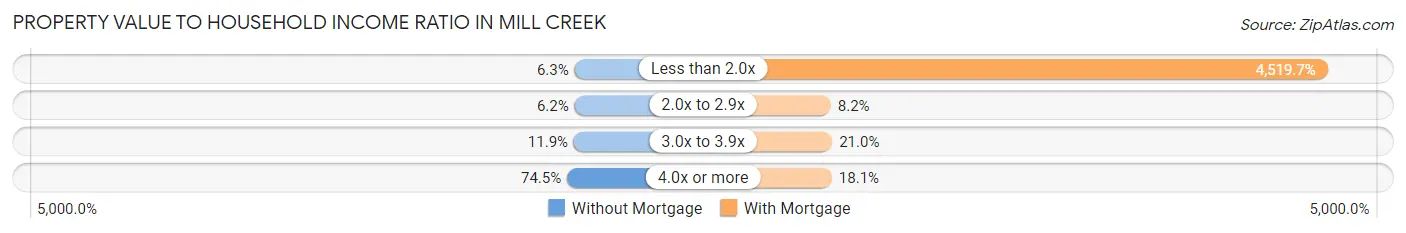
Property Value to Household Income Ratio in Mill Creek
| Value-to-Income Ratio | Without Mortgage | With Mortgage |
| Less than 2.0x | 86 (6.3%) | 168,676 (4,519.7%) |
| 2.0x to 2.9x | 84 (6.2%) | 305 (8.2%) |
| 3.0x to 3.9x | 161 (11.8%) | 784 (21.0%) |
| 4.0x or more | 1,012 (74.5%) | 674 (18.1%) |
| Total | 1,359 (100.0%) | 3,732 (100.0%) |
Real Estate Taxes by Mortgage Status in Mill Creek

| Property Taxes | Without Mortgage | With Mortgage |
| Less than $800 | 68 (5.0%) | 23 (0.6%) |
| $800 to $1,499 | 0 (0.0%) | 41 (1.1%) |
| $800 to $1,499 | 1,281 (94.3%) | 61 (1.6%) |
| Total | 1,359 (100.0%) | 3,732 (100.0%) |
Health & Disability in Mill Creek
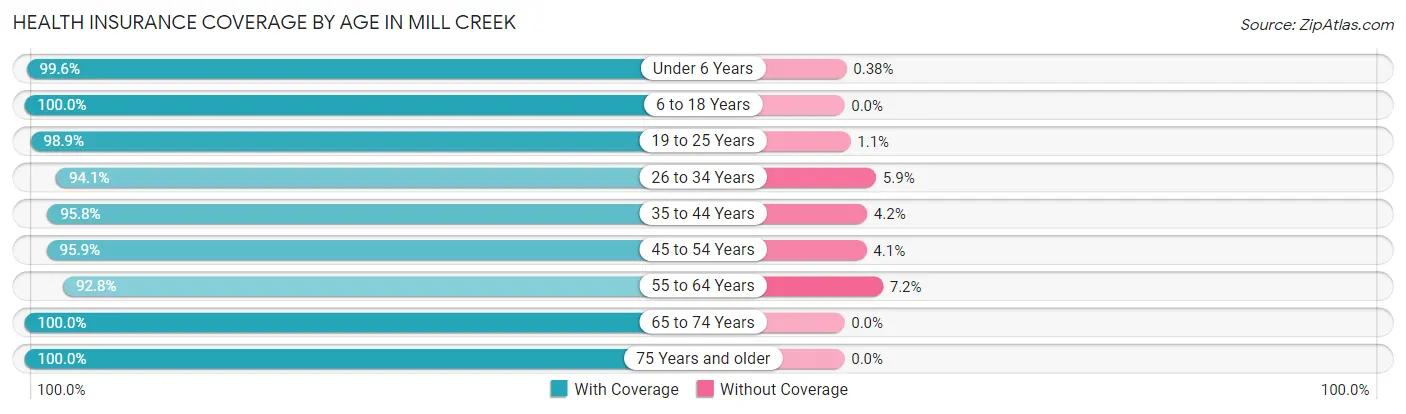
Health Insurance Coverage by Age in Mill Creek
| Age Bracket | With Coverage | Without Coverage |
| Under 6 Years | 1,564 (99.6%) | 6 (0.4%) |
| 6 to 18 Years | 3,311 (100.0%) | 0 (0.0%) |
| 19 to 25 Years | 1,669 (98.9%) | 19 (1.1%) |
| 26 to 34 Years | 2,652 (94.1%) | 166 (5.9%) |
| 35 to 44 Years | 2,814 (95.8%) | 124 (4.2%) |
| 45 to 54 Years | 2,628 (95.9%) | 113 (4.1%) |
| 55 to 64 Years | 2,352 (92.8%) | 182 (7.2%) |
| 65 to 74 Years | 1,745 (100.0%) | 0 (0.0%) |
| 75 Years and older | 1,309 (100.0%) | 0 (0.0%) |
| Total | 20,044 (97.1%) | 610 (2.9%) |
Health Insurance Coverage by Citizenship Status in Mill Creek

| Citizenship Status | With Coverage | Without Coverage |
| Native Born | 1,564 (99.6%) | 6 (0.4%) |
| Foreign Born, Citizen | 3,311 (100.0%) | 0 (0.0%) |
| Foreign Born, not a Citizen | 1,669 (98.9%) | 19 (1.1%) |
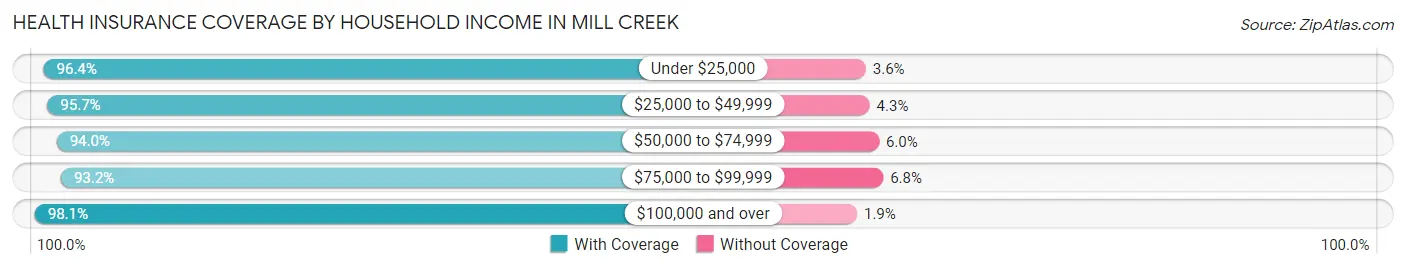
Health Insurance Coverage by Household Income in Mill Creek
| Household Income | With Coverage | Without Coverage |
| Under $25,000 | 1,082 (96.4%) | 40 (3.6%) |
| $25,000 to $49,999 | 1,318 (95.7%) | 59 (4.3%) |
| $50,000 to $74,999 | 1,295 (94.0%) | 83 (6.0%) |
| $75,000 to $99,999 | 2,008 (93.2%) | 147 (6.8%) |
| $100,000 and over | 14,319 (98.1%) | 281 (1.9%) |
Public vs Private Health Insurance Coverage by Age in Mill Creek
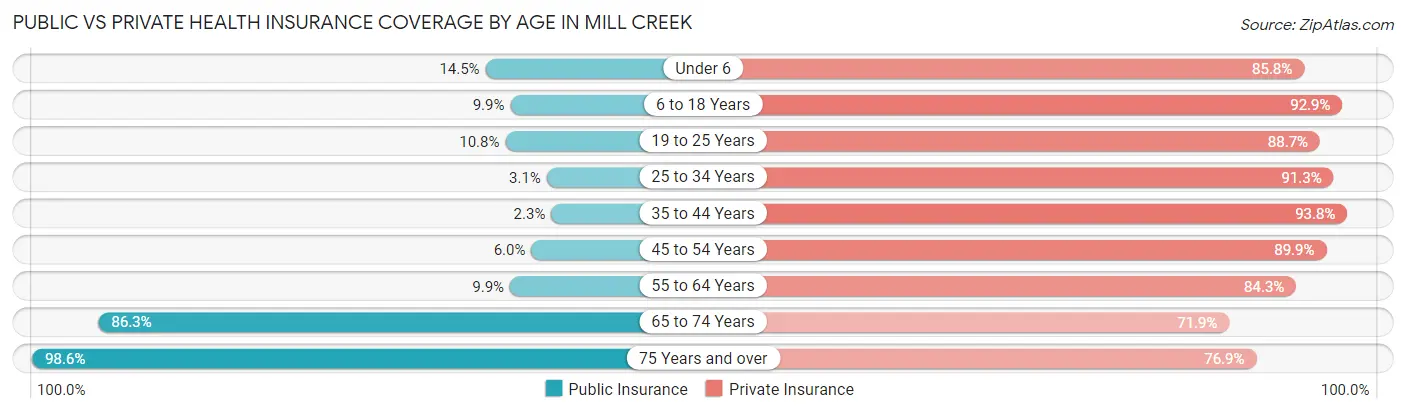
| Age Bracket | Public Insurance | Private Insurance |
| Under 6 | 227 (14.5%) | 1,347 (85.8%) |
| 6 to 18 Years | 326 (9.9%) | 3,076 (92.9%) |
| 19 to 25 Years | 182 (10.8%) | 1,498 (88.7%) |
| 25 to 34 Years | 87 (3.1%) | 2,572 (91.3%) |
| 35 to 44 Years | 66 (2.2%) | 2,756 (93.8%) |
| 45 to 54 Years | 163 (5.9%) | 2,465 (89.9%) |
| 55 to 64 Years | 251 (9.9%) | 2,137 (84.3%) |
| 65 to 74 Years | 1,506 (86.3%) | 1,255 (71.9%) |
| 75 Years and over | 1,291 (98.6%) | 1,007 (76.9%) |
| Total | 4,099 (19.9%) | 18,113 (87.7%) |
Disability Status by Sex by Age in Mill Creek
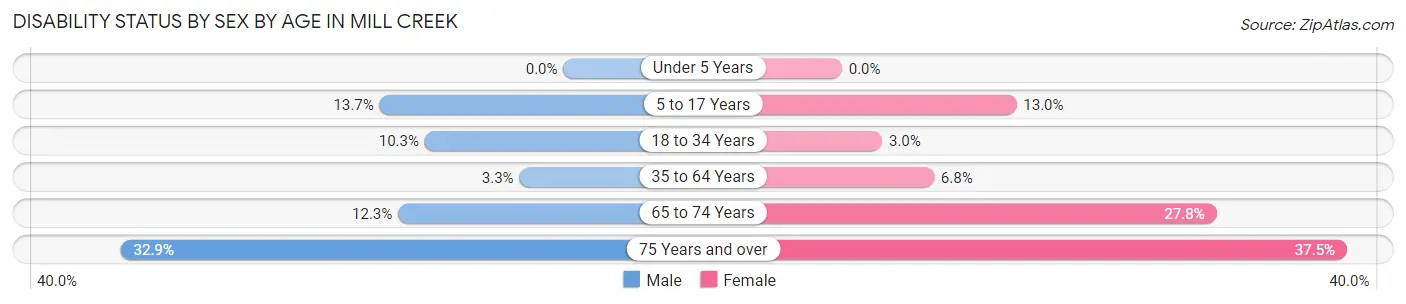
| Age Bracket | Male | Female |
| Under 5 Years | 0 (0.0%) | 0 (0.0%) |
| 5 to 17 Years | 213 (13.7%) | 227 (13.0%) |
| 18 to 34 Years | 233 (10.3%) | 75 (3.0%) |
| 35 to 64 Years | 135 (3.3%) | 278 (6.8%) |
| 65 to 74 Years | 88 (12.3%) | 286 (27.8%) |
| 75 Years and over | 141 (32.9%) | 330 (37.5%) |
Disability Class by Sex by Age in Mill Creek
Disability Class: Hearing Difficulty
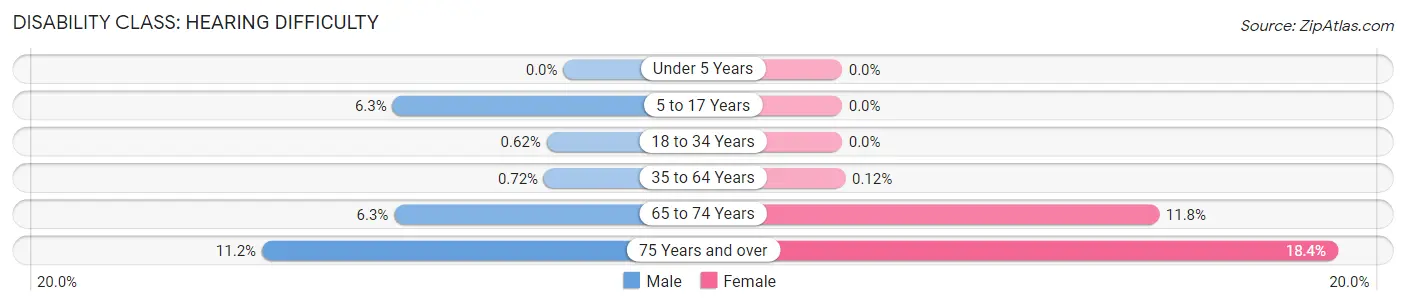
| Age Bracket | Male | Female |
| Under 5 Years | 0 (0.0%) | 0 (0.0%) |
| 5 to 17 Years | 99 (6.3%) | 0 (0.0%) |
| 18 to 34 Years | 14 (0.6%) | 0 (0.0%) |
| 35 to 64 Years | 30 (0.7%) | 5 (0.1%) |
| 65 to 74 Years | 45 (6.3%) | 121 (11.8%) |
| 75 Years and over | 48 (11.2%) | 162 (18.4%) |
Disability Class: Vision Difficulty
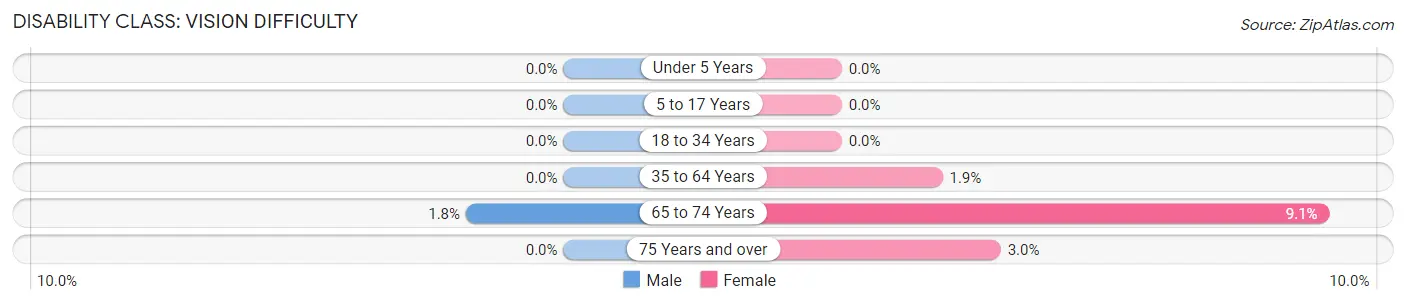
| Age Bracket | Male | Female |
| Under 5 Years | 0 (0.0%) | 0 (0.0%) |
| 5 to 17 Years | 0 (0.0%) | 0 (0.0%) |
| 18 to 34 Years | 0 (0.0%) | 0 (0.0%) |
| 35 to 64 Years | 0 (0.0%) | 76 (1.9%) |
| 65 to 74 Years | 13 (1.8%) | 93 (9.0%) |
| 75 Years and over | 0 (0.0%) | 26 (2.9%) |
Disability Class: Cognitive Difficulty
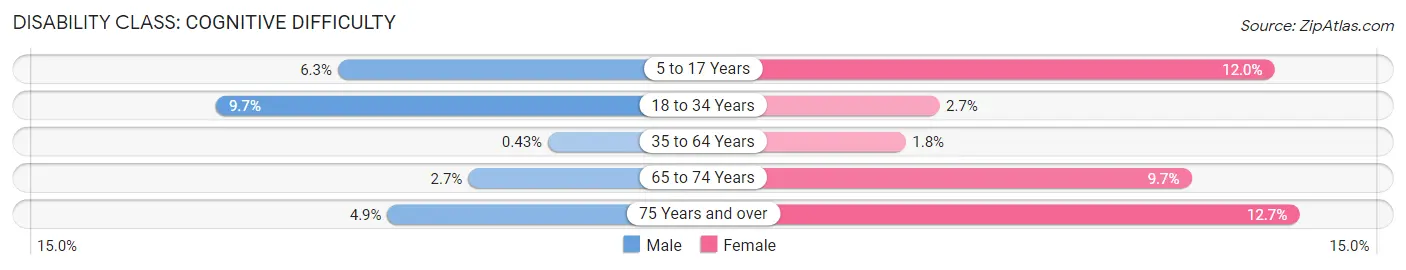
| Age Bracket | Male | Female |
| 5 to 17 Years | 98 (6.3%) | 211 (12.0%) |
| 18 to 34 Years | 219 (9.7%) | 68 (2.7%) |
| 35 to 64 Years | 18 (0.4%) | 72 (1.8%) |
| 65 to 74 Years | 19 (2.6%) | 100 (9.7%) |
| 75 Years and over | 21 (4.9%) | 112 (12.7%) |
Disability Class: Ambulatory Difficulty
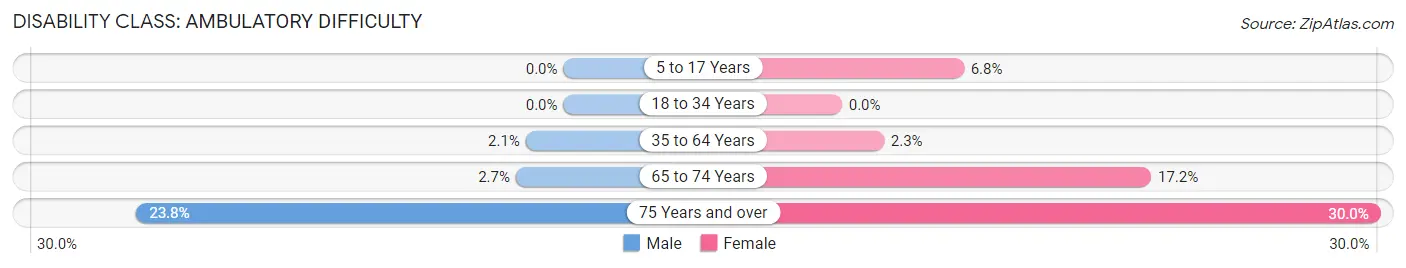
| Age Bracket | Male | Female |
| 5 to 17 Years | 0 (0.0%) | 119 (6.8%) |
| 18 to 34 Years | 0 (0.0%) | 0 (0.0%) |
| 35 to 64 Years | 87 (2.1%) | 95 (2.3%) |
| 65 to 74 Years | 19 (2.6%) | 177 (17.2%) |
| 75 Years and over | 102 (23.8%) | 264 (30.0%) |
Disability Class: Self-Care Difficulty
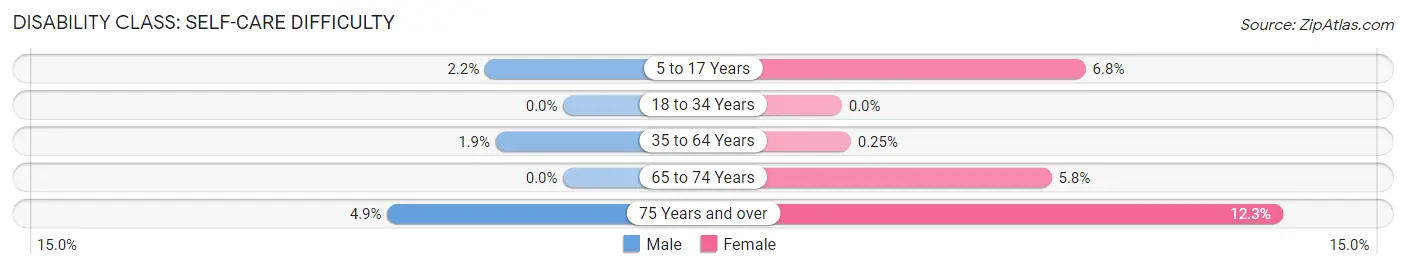
| Age Bracket | Male | Female |
| 5 to 17 Years | 34 (2.2%) | 119 (6.8%) |
| 18 to 34 Years | 0 (0.0%) | 0 (0.0%) |
| 35 to 64 Years | 78 (1.9%) | 10 (0.3%) |
| 65 to 74 Years | 0 (0.0%) | 60 (5.8%) |
| 75 Years and over | 21 (4.9%) | 108 (12.3%) |
Technology Access in Mill Creek
Computing Device Access in Mill Creek
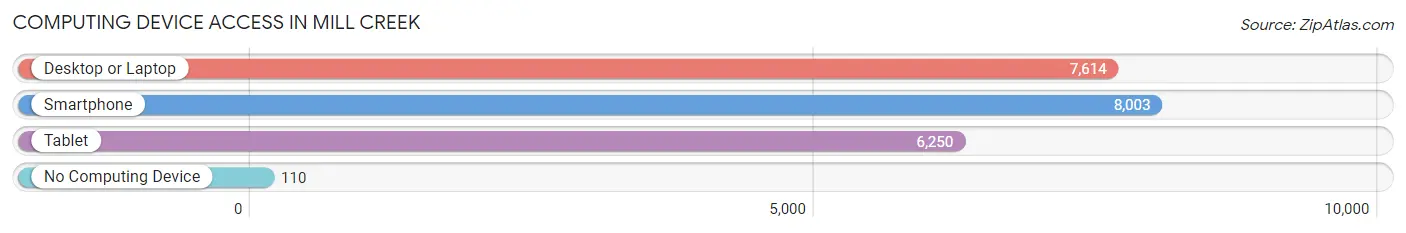
| Device Type | # Households | % Households |
| Desktop or Laptop | 7,614 | 90.9% |
| Smartphone | 8,003 | 95.5% |
| Tablet | 6,250 | 74.6% |
| No Computing Device | 110 | 1.3% |
| Total | 8,378 | 100.0% |
Internet Access in Mill Creek
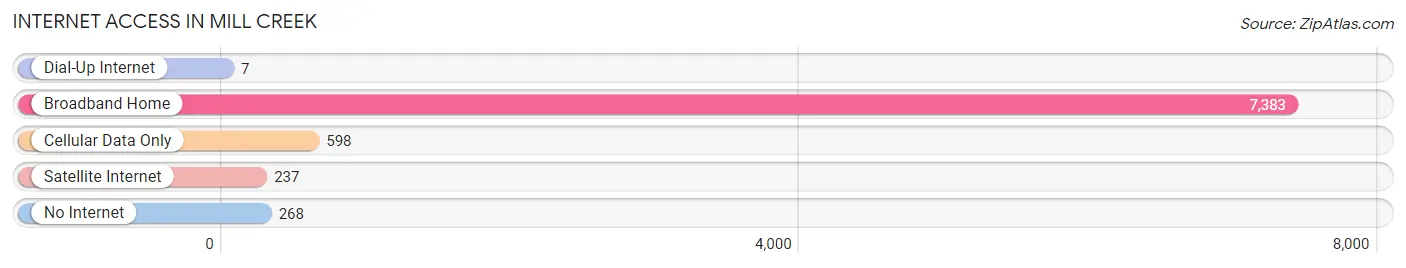
| Internet Type | # Households | % Households |
| Dial-Up Internet | 7 | 0.1% |
| Broadband Home | 7,383 | 88.1% |
| Cellular Data Only | 598 | 7.1% |
| Satellite Internet | 237 | 2.8% |
| No Internet | 268 | 3.2% |
| Total | 8,378 | 100.0% |
Mill Creek Summary
Introduction
Mill Creek is a city located in Snohomish County, Washington, United States. It is located about 20 miles northeast of Seattle and is part of the Seattle metropolitan area. The city was incorporated in 1983 and has a population of about 20,000 people.
History
The area that is now Mill Creek was originally inhabited by the Snohomish people, who lived in the area for thousands of years before the arrival of European settlers. The first European settlers arrived in the area in the late 1800s, and the area was officially incorporated as a city in 1983.
The city was named after a nearby creek, which was named after a local mill that was built in the area in the late 1800s. The mill was used to grind grain and was a major source of employment for the local population.
Geography
Mill Creek is located in Snohomish County, Washington, about 20 miles northeast of Seattle. The city is situated in the foothills of the Cascade Mountains and is surrounded by forests and wetlands. The city has a total area of 8.3 square miles, of which 8.2 square miles is land and 0.1 square miles is water.
The city is located at an elevation of about 500 feet above sea level and has a humid continental climate, with warm summers and cold winters. The average annual temperature is around 50 degrees Fahrenheit, and the average annual precipitation is around 40 inches.
Economy
Mill Creek is a major economic center in the Seattle metropolitan area. The city is home to a number of major employers, including Boeing, Microsoft, Amazon, and Starbucks. The city also has a number of retail stores, restaurants, and other businesses.
The city is also home to a number of educational institutions, including the University of Washington Bothell, Cascadia College, and Everett Community College.
Demographics
As of the 2010 census, the population of Mill Creek was 19,845. The racial makeup of the city was 79.3% White, 8.2% Asian, 5.2% Hispanic or Latino, 3.7% African American, 0.7% Native American, and 2.9% from other races.
The median household income in the city was $87,845, and the median family income was $97,845. The per capita income in the city was $37,845.
Conclusion
Mill Creek is a city located in Snohomish County, Washington, United States. It is located about 20 miles northeast of Seattle and is part of the Seattle metropolitan area. The city was incorporated in 1983 and has a population of about 20,000 people. The city is a major economic center in the Seattle metropolitan area and is home to a number of major employers, including Boeing, Microsoft, Amazon, and Starbucks. The city also has a number of educational institutions, including the University of Washington Bothell, Cascadia College, and Everett Community College. The population of Mill Creek is diverse, with 79.3% White, 8.2% Asian, 5.2% Hispanic or Latino, 3.7% African American, 0.7% Native American, and 2.9% from other races. The median household income in the city was $87,845, and the median family income was $97,845.
Common Questions
What is Per Capita Income in Mill Creek?
Per Capita income in Mill Creek is $61,422.
What is the Median Family Income in Mill Creek?
Median Family Income in Mill Creek is $152,779.
What is the Median Household income in Mill Creek?
Median Household Income in Mill Creek is $118,276.
What is Income or Wage Gap in Mill Creek?
Income or Wage Gap in Mill Creek is 48.7%.
Women in Mill Creek earn 51.3 cents for every dollar earned by a man.
What is Inequality or Gini Index in Mill Creek?
Inequality or Gini Index in Mill Creek is 0.43.
What is the Total Population of Mill Creek?
Total Population of Mill Creek is 20,797.
What is the Total Male Population of Mill Creek?
Total Male Population of Mill Creek is 9,828.
What is the Total Female Population of Mill Creek?
Total Female Population of Mill Creek is 10,969.
What is the Ratio of Males per 100 Females in Mill Creek?
There are 89.60 Males per 100 Females in Mill Creek.
What is the Ratio of Females per 100 Males in Mill Creek?
There are 111.61 Females per 100 Males in Mill Creek.
What is the Median Population Age in Mill Creek?
Median Population Age in Mill Creek is 38.3 Years.
What is the Average Family Size in Mill Creek
Average Family Size in Mill Creek is 3.0 People.
What is the Average Household Size in Mill Creek
Average Household Size in Mill Creek is 2.5 People.
How Large is the Labor Force in Mill Creek?
There are 11,421 People in the Labor Forcein in Mill Creek.
What is the Percentage of People in the Labor Force in Mill Creek?
68.7% of People are in the Labor Force in Mill Creek.
What is the Unemployment Rate in Mill Creek?
Unemployment Rate in Mill Creek is 4.2%.