Danbury, CT Map & Demographics
Danbury Map
Danbury Overview
$42,497
PER CAPITA INCOME
$96,830
AVG FAMILY INCOME
$79,983
AVG HOUSEHOLD INCOME
24.4%
WAGE / INCOME GAP [ % ]
75.6¢/ $1
WAGE / INCOME GAP [ $ ]
$11,877
FAMILY INCOME DEFICIT
0.47
INEQUALITY / GINI INDEX
86,456
TOTAL POPULATION
42,814
MALE POPULATION
43,642
FEMALE POPULATION
98.10
MALES / 100 FEMALES
101.93
FEMALES / 100 MALES
38.6
MEDIAN AGE
3.2
AVG FAMILY SIZE
2.6
AVG HOUSEHOLD SIZE
49,909
LABOR FORCE [ PEOPLE ]
70.4%
PERCENT IN LABOR FORCE
6.0%
UNEMPLOYMENT RATE
Income in Danbury
Income Overview in Danbury
Per Capita Income in Danbury is $42,497, while median incomes of families and households are $96,830 and $79,983 respectively.
| Characteristic | Number | Measure |
| Per Capita Income | 86,456 | $42,497 |
| Median Family Income | 20,715 | $96,830 |
| Mean Family Income | 20,715 | $126,806 |
| Median Household Income | 31,692 | $79,983 |
| Mean Household Income | 31,692 | $112,609 |
| Income Deficit | 20,715 | $11,877 |
| Wage / Income Gap (%) | 86,456 | 24.44% |
| Wage / Income Gap ($) | 86,456 | 75.56¢ per $1 |
| Gini / Inequality Index | 86,456 | 0.47 |
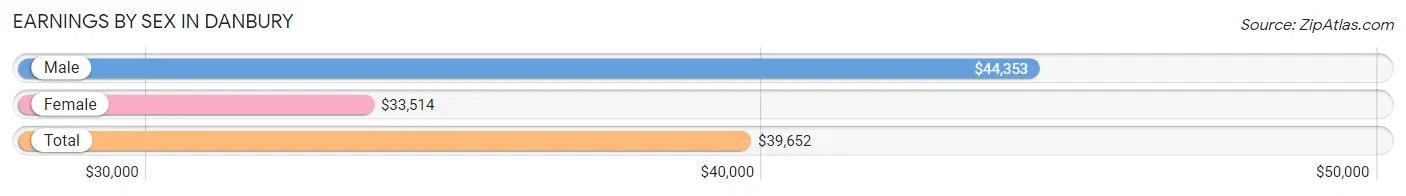
Earnings by Sex in Danbury
Average Earnings in Danbury are $39,652, $44,353 for men and $33,514 for women, a difference of 24.4%.
| Sex | Number | Average Earnings |
| Male | 27,630 (53.4%) | $44,353 |
| Female | 24,088 (46.6%) | $33,514 |
| Total | 51,718 (100.0%) | $39,652 |
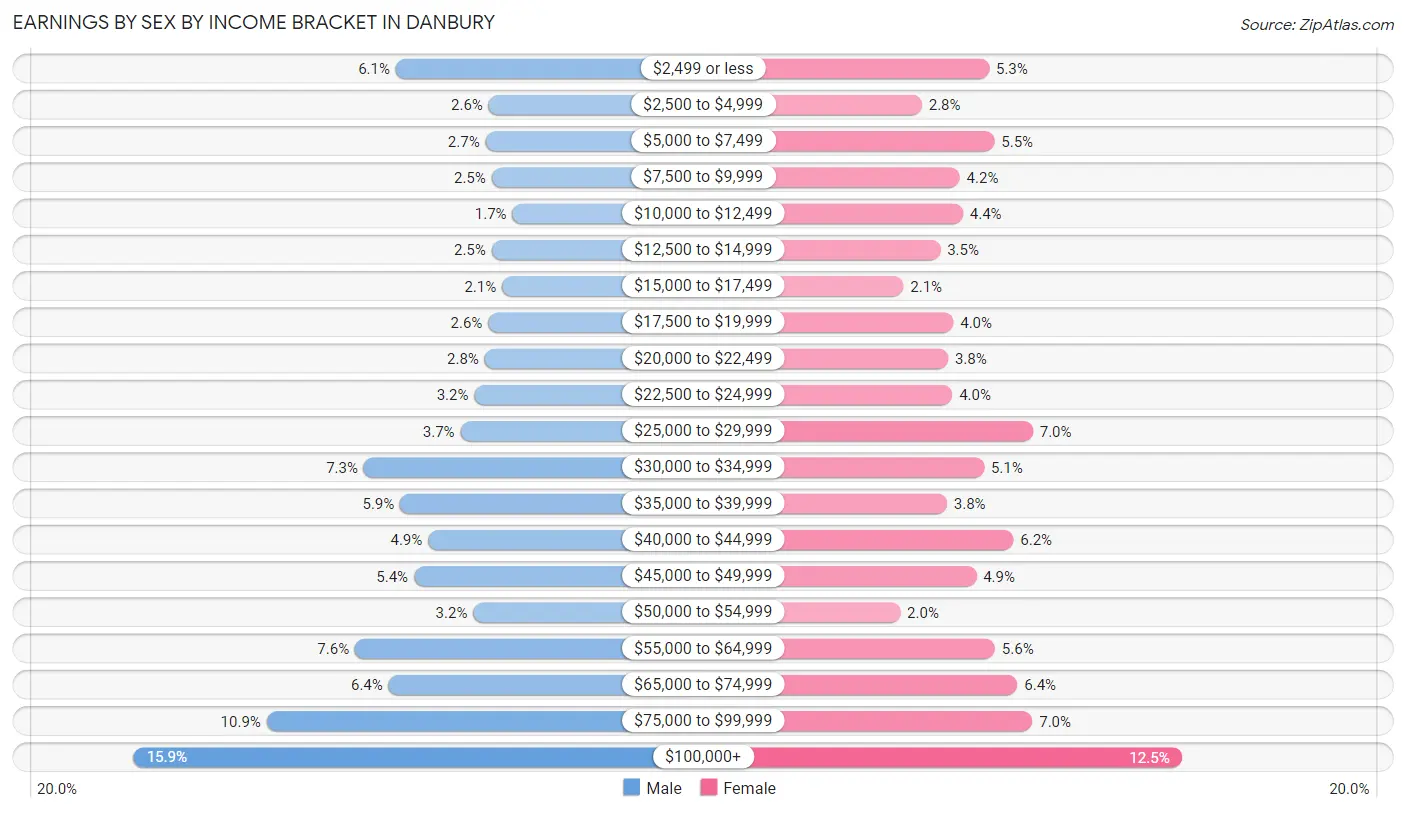
Earnings by Sex by Income Bracket in Danbury
The most common earnings brackets in Danbury are $100,000+ for men (4,396 | 15.9%) and $100,000+ for women (3,021 | 12.5%).
| Income | Male | Female |
| $2,499 or less | 1,683 (6.1%) | 1,283 (5.3%) |
| $2,500 to $4,999 | 722 (2.6%) | 677 (2.8%) |
| $5,000 to $7,499 | 754 (2.7%) | 1,333 (5.5%) |
| $7,500 to $9,999 | 690 (2.5%) | 1,020 (4.2%) |
| $10,000 to $12,499 | 476 (1.7%) | 1,048 (4.3%) |
| $12,500 to $14,999 | 692 (2.5%) | 843 (3.5%) |
| $15,000 to $17,499 | 582 (2.1%) | 511 (2.1%) |
| $17,500 to $19,999 | 728 (2.6%) | 962 (4.0%) |
| $20,000 to $22,499 | 763 (2.8%) | 913 (3.8%) |
| $22,500 to $24,999 | 870 (3.2%) | 951 (4.0%) |
| $25,000 to $29,999 | 1,014 (3.7%) | 1,679 (7.0%) |
| $30,000 to $34,999 | 2,014 (7.3%) | 1,239 (5.1%) |
| $35,000 to $39,999 | 1,639 (5.9%) | 903 (3.7%) |
| $40,000 to $44,999 | 1,349 (4.9%) | 1,503 (6.2%) |
| $45,000 to $49,999 | 1,495 (5.4%) | 1,168 (4.9%) |
| $50,000 to $54,999 | 881 (3.2%) | 482 (2.0%) |
| $55,000 to $64,999 | 2,106 (7.6%) | 1,338 (5.6%) |
| $65,000 to $74,999 | 1,756 (6.4%) | 1,540 (6.4%) |
| $75,000 to $99,999 | 3,020 (10.9%) | 1,674 (7.0%) |
| $100,000+ | 4,396 (15.9%) | 3,021 (12.5%) |
| Total | 27,630 (100.0%) | 24,088 (100.0%) |
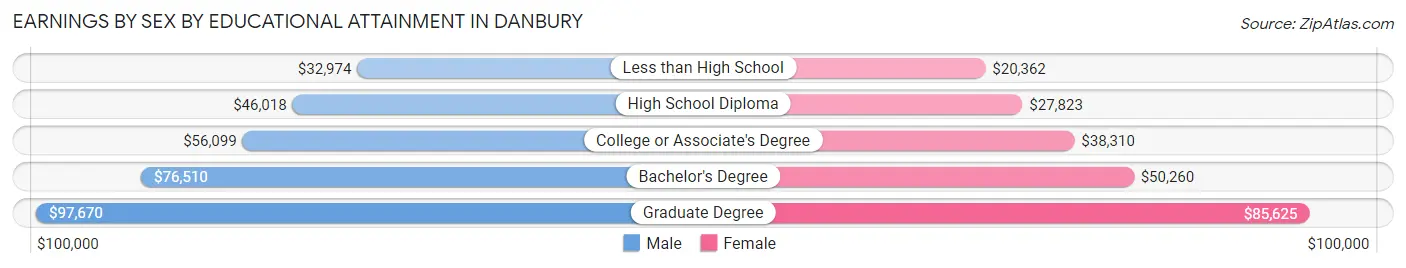
Earnings by Sex by Educational Attainment in Danbury
Average earnings in Danbury are $52,773 for men and $41,342 for women, a difference of 21.7%. Men with an educational attainment of graduate degree enjoy the highest average annual earnings of $97,670, while those with less than high school education earn the least with $32,974. Women with an educational attainment of graduate degree earn the most with the average annual earnings of $85,625, while those with less than high school education have the smallest earnings of $20,362.
| Educational Attainment | Male Income | Female Income |
| Less than High School | $32,974 | $20,362 |
| High School Diploma | $46,018 | $27,823 |
| College or Associate's Degree | $56,099 | $38,310 |
| Bachelor's Degree | $76,510 | $50,260 |
| Graduate Degree | $97,670 | $85,625 |
| Total | $52,773 | $41,342 |
Family Income in Danbury
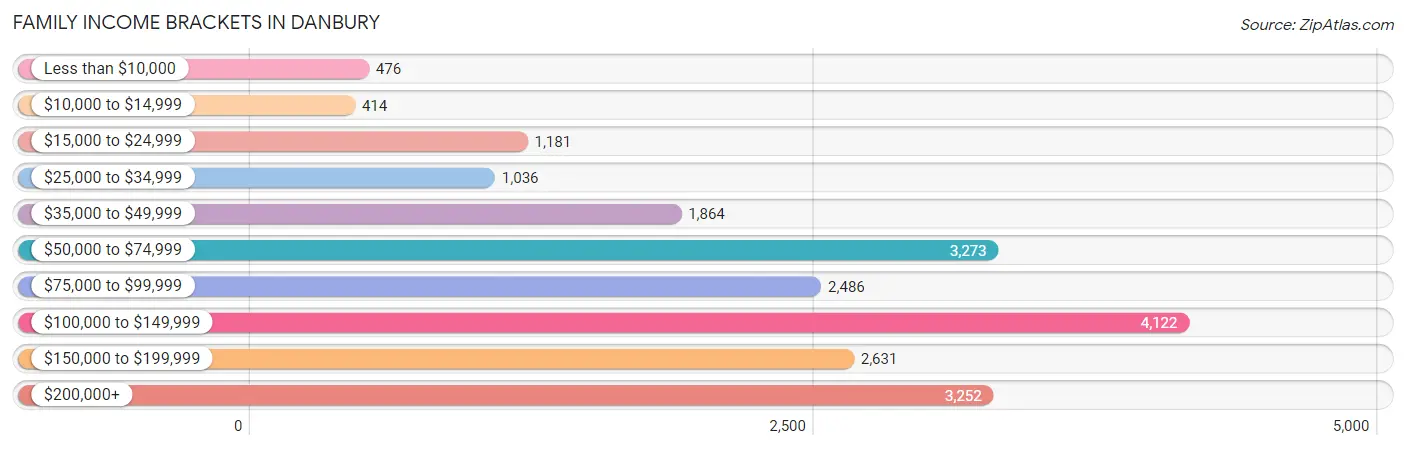
Family Income Brackets in Danbury
According to the Danbury family income data, there are 4,122 families falling into the $100,000 to $149,999 income range, which is the most common income bracket and makes up 19.9% of all families. Conversely, the $10,000 to $14,999 income bracket is the least frequent group with only 414 families (2.0%) belonging to this category.
| Income Bracket | # Families | % Families |
| Less than $10,000 | 476 | 2.3% |
| $10,000 to $14,999 | 414 | 2.0% |
| $15,000 to $24,999 | 1,181 | 5.7% |
| $25,000 to $34,999 | 1,036 | 5.0% |
| $35,000 to $49,999 | 1,864 | 9.0% |
| $50,000 to $74,999 | 3,273 | 15.8% |
| $75,000 to $99,999 | 2,486 | 12.0% |
| $100,000 to $149,999 | 4,122 | 19.9% |
| $150,000 to $199,999 | 2,631 | 12.7% |
| $200,000+ | 3,252 | 15.7% |
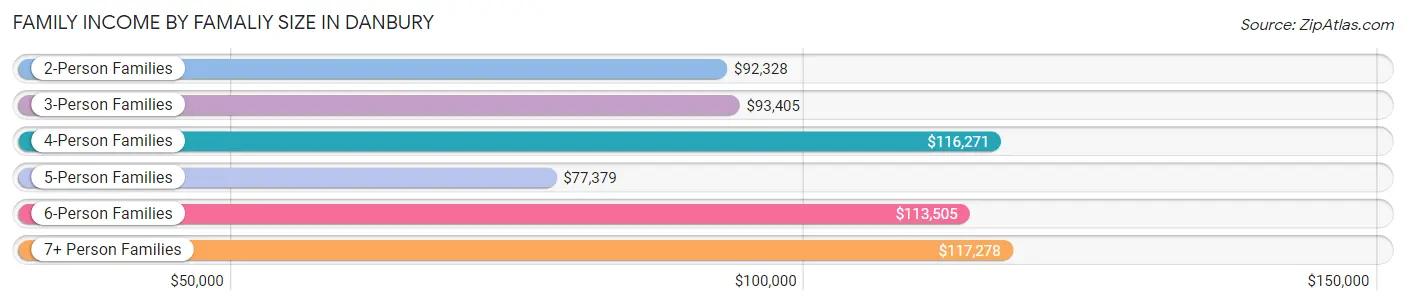
Family Income by Famaliy Size in Danbury
7+ person families (232 | 1.1%) account for the highest median family income in Danbury with $117,278 per family, while 2-person families (8,685 | 41.9%) have the highest median income of $46,164 per family member.
| Income Bracket | # Families | Median Income |
| 2-Person Families | 8,685 (41.9%) | $92,328 |
| 3-Person Families | 4,438 (21.4%) | $93,405 |
| 4-Person Families | 4,503 (21.7%) | $116,271 |
| 5-Person Families | 2,102 (10.2%) | $77,379 |
| 6-Person Families | 755 (3.6%) | $113,505 |
| 7+ Person Families | 232 (1.1%) | $117,278 |
| Total | 20,715 (100.0%) | $96,830 |
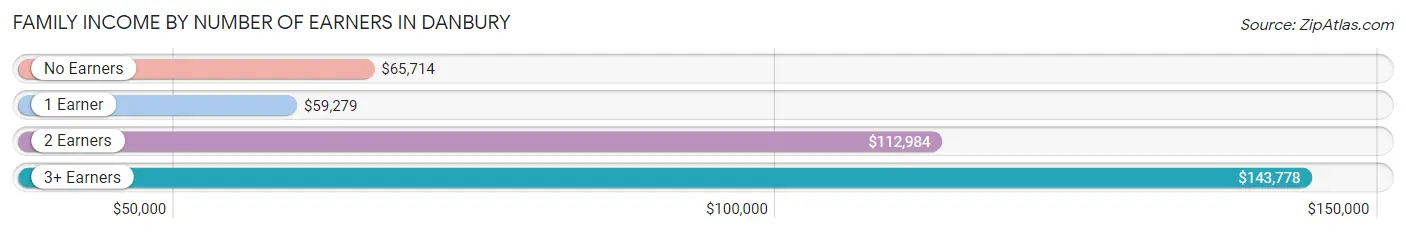
Family Income by Number of Earners in Danbury
The median family income in Danbury is $96,830, with families comprising 3+ earners (3,984) having the highest median family income of $143,778, while families with 1 earner (5,899) have the lowest median family income of $59,279, accounting for 19.2% and 28.5% of families, respectively.
| Number of Earners | # Families | Median Income |
| No Earners | 1,976 (9.5%) | $65,714 |
| 1 Earner | 5,899 (28.5%) | $59,279 |
| 2 Earners | 8,856 (42.7%) | $112,984 |
| 3+ Earners | 3,984 (19.2%) | $143,778 |
| Total | 20,715 (100.0%) | $96,830 |
Household Income in Danbury
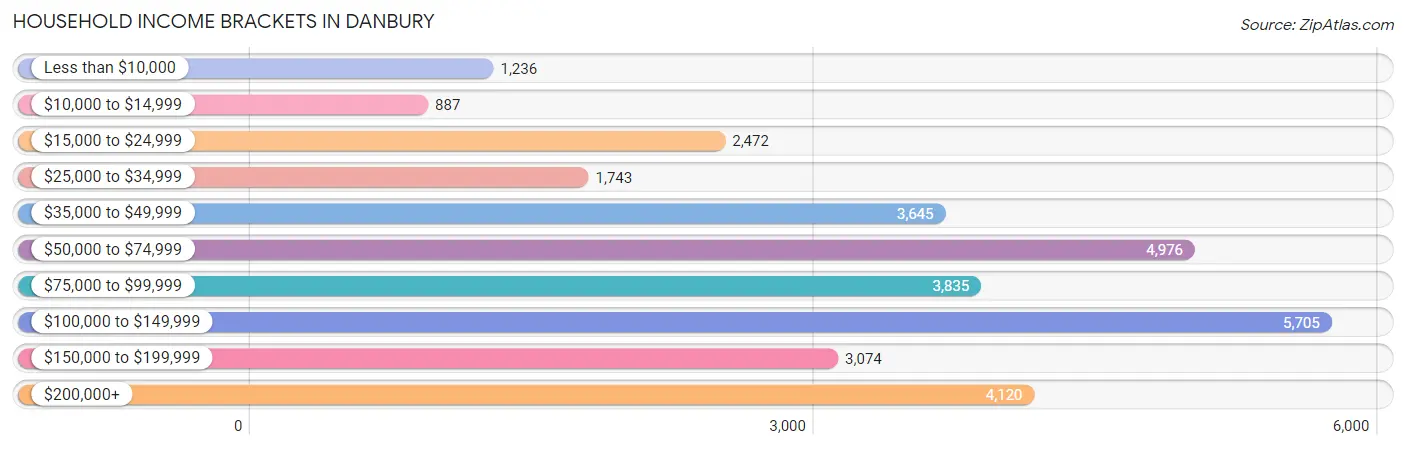
Household Income Brackets in Danbury
With 5,705 households falling in the category, the $100,000 to $149,999 income range is the most frequent in Danbury, accounting for 18.0% of all households. In contrast, only 887 households (2.8%) fall into the $10,000 to $14,999 income bracket, making it the least populous group.
| Income Bracket | # Households | % Households |
| Less than $10,000 | 1,236 | 3.9% |
| $10,000 to $14,999 | 887 | 2.8% |
| $15,000 to $24,999 | 2,472 | 7.8% |
| $25,000 to $34,999 | 1,743 | 5.5% |
| $35,000 to $49,999 | 3,645 | 11.5% |
| $50,000 to $74,999 | 4,976 | 15.7% |
| $75,000 to $99,999 | 3,835 | 12.1% |
| $100,000 to $149,999 | 5,705 | 18.0% |
| $150,000 to $199,999 | 3,074 | 9.7% |
| $200,000+ | 4,120 | 13.0% |
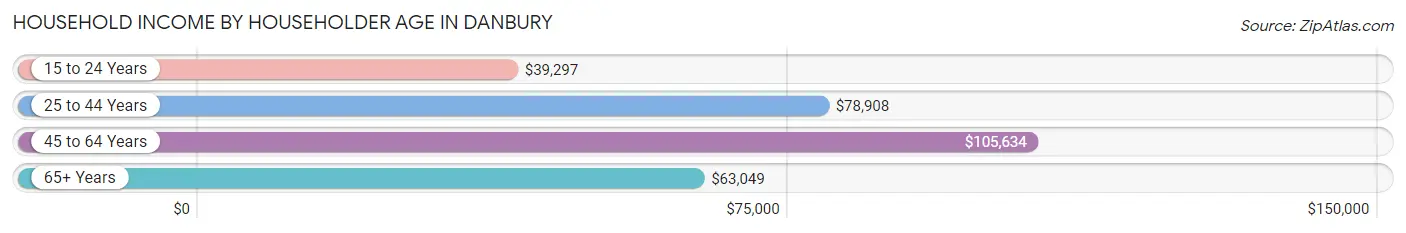
Household Income by Householder Age in Danbury
The median household income in Danbury is $79,983, with the highest median household income of $105,634 found in the 45 to 64 years age bracket for the primary householder. A total of 12,863 households (40.6%) fall into this category. Meanwhile, the 15 to 24 years age bracket for the primary householder has the lowest median household income of $39,297, with 701 households (2.2%) in this group.
| Income Bracket | # Households | Median Income |
| 15 to 24 Years | 701 (2.2%) | $39,297 |
| 25 to 44 Years | 9,980 (31.5%) | $78,908 |
| 45 to 64 Years | 12,863 (40.6%) | $105,634 |
| 65+ Years | 8,148 (25.7%) | $63,049 |
| Total | 31,692 (100.0%) | $79,983 |
Poverty in Danbury
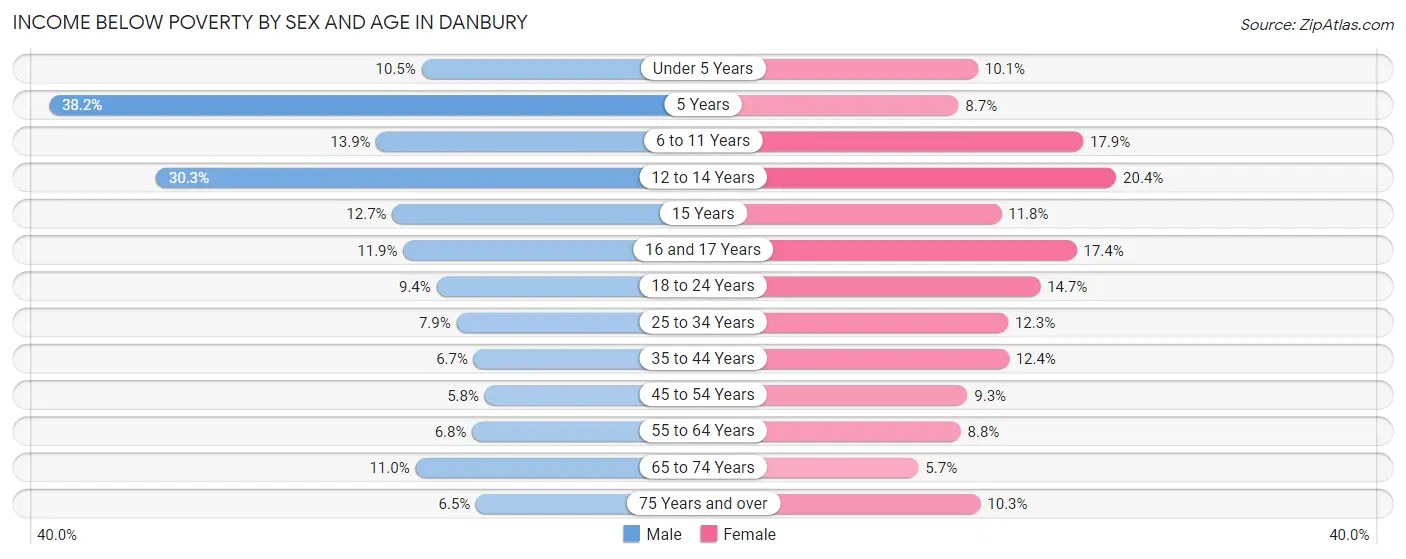
Income Below Poverty by Sex and Age in Danbury
With 9.4% poverty level for males and 11.7% for females among the residents of Danbury, 5 year old males and 12 to 14 year old females are the most vulnerable to poverty, with 181 males (38.2%) and 332 females (20.4%) in their respective age groups living below the poverty level.
| Age Bracket | Male | Female |
| Under 5 Years | 231 (10.5%) | 215 (10.1%) |
| 5 Years | 181 (38.2%) | 44 (8.7%) |
| 6 to 11 Years | 403 (13.9%) | 601 (17.9%) |
| 12 to 14 Years | 395 (30.2%) | 332 (20.4%) |
| 15 Years | 66 (12.7%) | 36 (11.8%) |
| 16 and 17 Years | 91 (11.9%) | 209 (17.4%) |
| 18 to 24 Years | 402 (9.4%) | 630 (14.7%) |
| 25 to 34 Years | 463 (7.9%) | 662 (12.3%) |
| 35 to 44 Years | 407 (6.7%) | 637 (12.4%) |
| 45 to 54 Years | 327 (5.8%) | 527 (9.3%) |
| 55 to 64 Years | 387 (6.8%) | 492 (8.8%) |
| 65 to 74 Years | 390 (11.0%) | 218 (5.7%) |
| 75 Years and over | 115 (6.5%) | 334 (10.3%) |
| Total | 3,858 (9.4%) | 4,937 (11.7%) |
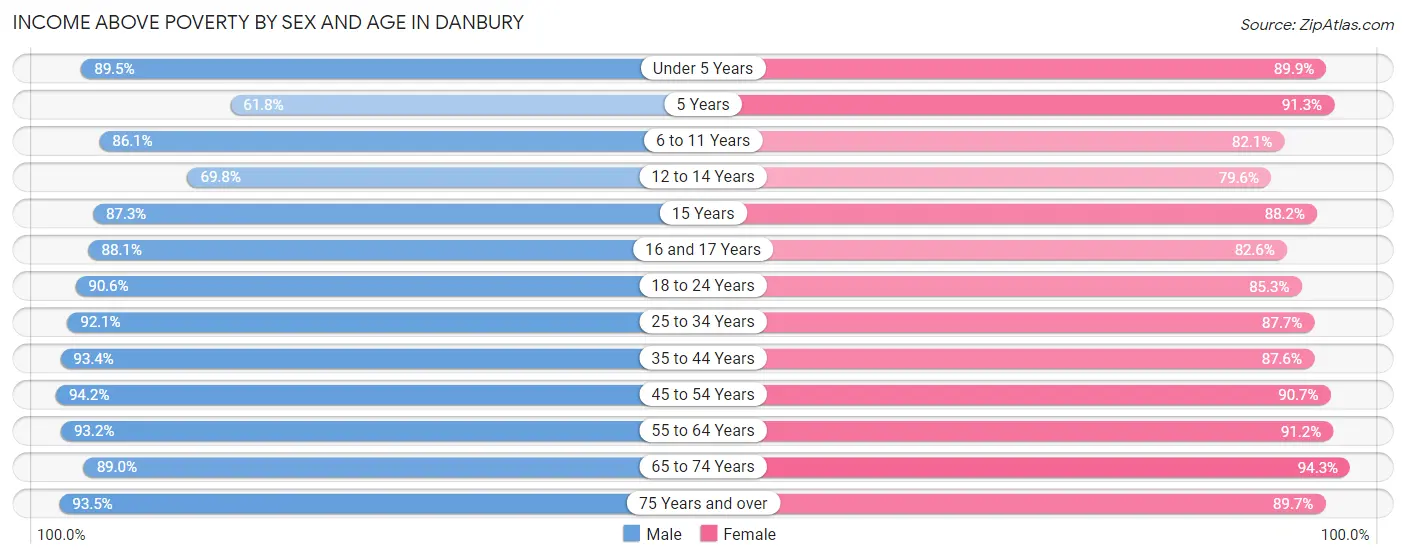
Income Above Poverty by Sex and Age in Danbury
According to the poverty statistics in Danbury, males aged 45 to 54 years and females aged 65 to 74 years are the age groups that are most secure financially, with 94.2% of males and 94.3% of females in these age groups living above the poverty line.
| Age Bracket | Male | Female |
| Under 5 Years | 1,962 (89.5%) | 1,914 (89.9%) |
| 5 Years | 293 (61.8%) | 464 (91.3%) |
| 6 to 11 Years | 2,500 (86.1%) | 2,755 (82.1%) |
| 12 to 14 Years | 911 (69.8%) | 1,298 (79.6%) |
| 15 Years | 454 (87.3%) | 268 (88.2%) |
| 16 and 17 Years | 675 (88.1%) | 990 (82.6%) |
| 18 to 24 Years | 3,868 (90.6%) | 3,647 (85.3%) |
| 25 to 34 Years | 5,379 (92.1%) | 4,702 (87.7%) |
| 35 to 44 Years | 5,709 (93.3%) | 4,505 (87.6%) |
| 45 to 54 Years | 5,281 (94.2%) | 5,127 (90.7%) |
| 55 to 64 Years | 5,340 (93.2%) | 5,084 (91.2%) |
| 65 to 74 Years | 3,161 (89.0%) | 3,615 (94.3%) |
| 75 Years and over | 1,662 (93.5%) | 2,913 (89.7%) |
| Total | 37,195 (90.6%) | 37,282 (88.3%) |
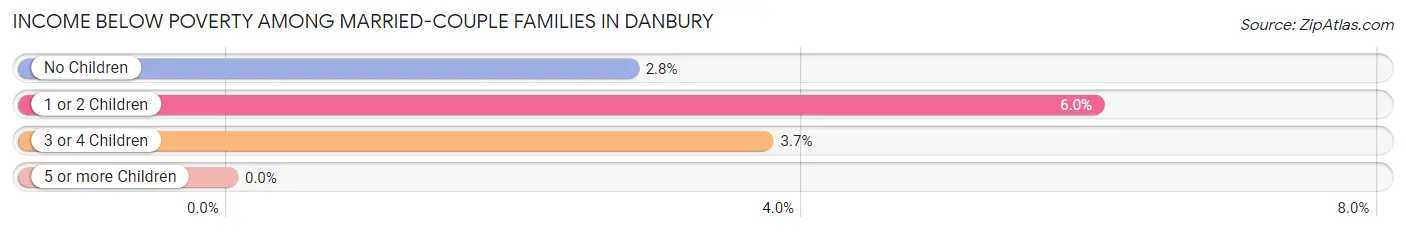
Income Below Poverty Among Married-Couple Families in Danbury
The poverty statistics for married-couple families in Danbury show that 4.1% or 604 of the total 14,826 families live below the poverty line. Families with 1 or 2 children have the highest poverty rate of 6.0%, comprising of 341 families. On the other hand, families with 5 or more children have the lowest poverty rate of 0.0%, which includes 0 families.
| Children | Above Poverty | Below Poverty |
| No Children | 8,062 (97.2%) | 231 (2.8%) |
| 1 or 2 Children | 5,315 (94.0%) | 341 (6.0%) |
| 3 or 4 Children | 827 (96.3%) | 32 (3.7%) |
| 5 or more Children | 18 (100.0%) | 0 (0.0%) |
| Total | 14,222 (95.9%) | 604 (4.1%) |
Income Below Poverty Among Single-Parent Households in Danbury
According to the poverty data in Danbury, 15.8% or 241 single-father households and 19.3% or 841 single-mother households are living below the poverty line. Among single-father households, those with 3 or 4 children have the highest poverty rate, with 44 households (26.8%) experiencing poverty. Likewise, among single-mother households, those with 3 or 4 children have the highest poverty rate, with 301 households (75.6%) falling below the poverty line.
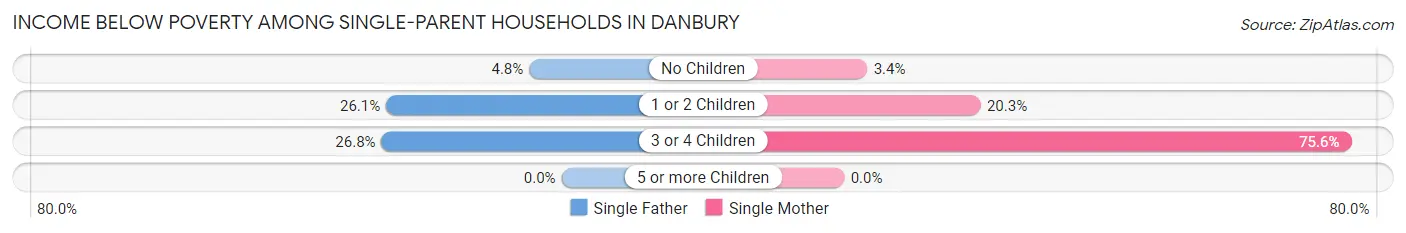
| Children | Single Father | Single Mother |
| No Children | 36 (4.8%) | 54 (3.4%) |
| 1 or 2 Children | 161 (26.1%) | 486 (20.3%) |
| 3 or 4 Children | 44 (26.8%) | 301 (75.6%) |
| 5 or more Children | 0 (0.0%) | 0 (0.0%) |
| Total | 241 (15.8%) | 841 (19.3%) |
Income Below Poverty Among Married-Couple vs Single-Parent Households in Danbury
The poverty data for Danbury shows that 604 of the married-couple family households (4.1%) and 1,082 of the single-parent households (18.4%) are living below the poverty level. Within the married-couple family households, those with 1 or 2 children have the highest poverty rate, with 341 households (6.0%) falling below the poverty line. Among the single-parent households, those with 3 or 4 children have the highest poverty rate, with 345 household (61.4%) living below poverty.
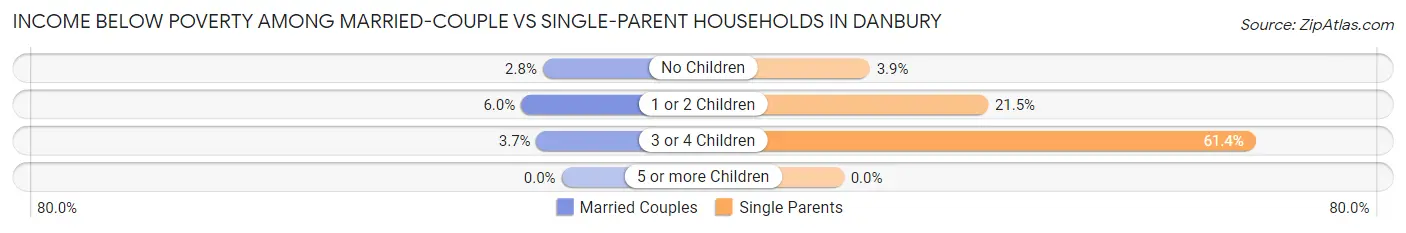
| Children | Married-Couple Families | Single-Parent Households |
| No Children | 231 (2.8%) | 90 (3.9%) |
| 1 or 2 Children | 341 (6.0%) | 647 (21.5%) |
| 3 or 4 Children | 32 (3.7%) | 345 (61.4%) |
| 5 or more Children | 0 (0.0%) | 0 (0.0%) |
| Total | 604 (4.1%) | 1,082 (18.4%) |
Race in Danbury
The most populous races in Danbury are White / Caucasian (43,712 | 50.6%), Hispanic or Latino (27,435 | 31.7%), and Some other Race (16,231 | 18.8%).
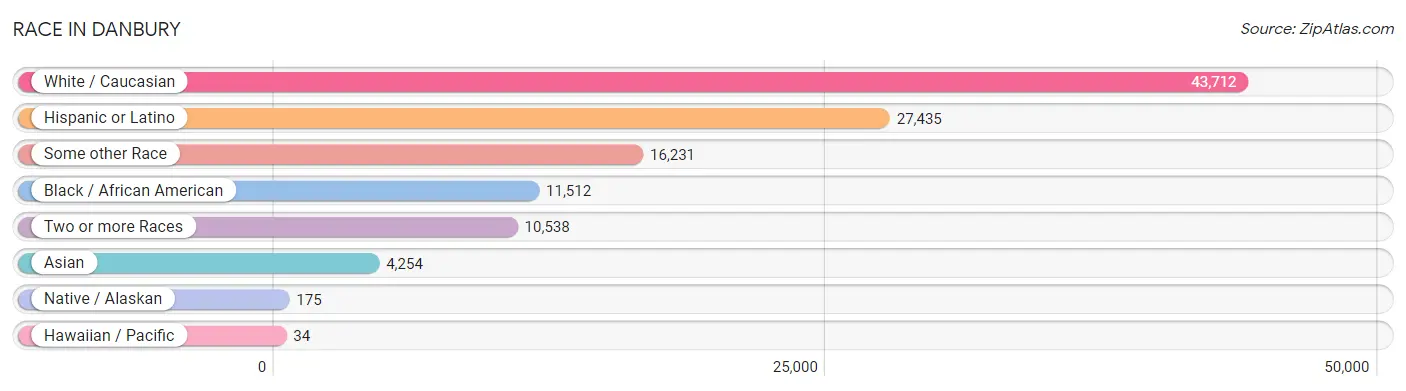
| Race | # Population | % Population |
| Asian | 4,254 | 4.9% |
| Black / African American | 11,512 | 13.3% |
| Hawaiian / Pacific | 34 | 0.0% |
| Hispanic or Latino | 27,435 | 31.7% |
| Native / Alaskan | 175 | 0.2% |
| White / Caucasian | 43,712 | 50.6% |
| Two or more Races | 10,538 | 12.2% |
| Some other Race | 16,231 | 18.8% |
| Total | 86,456 | 100.0% |
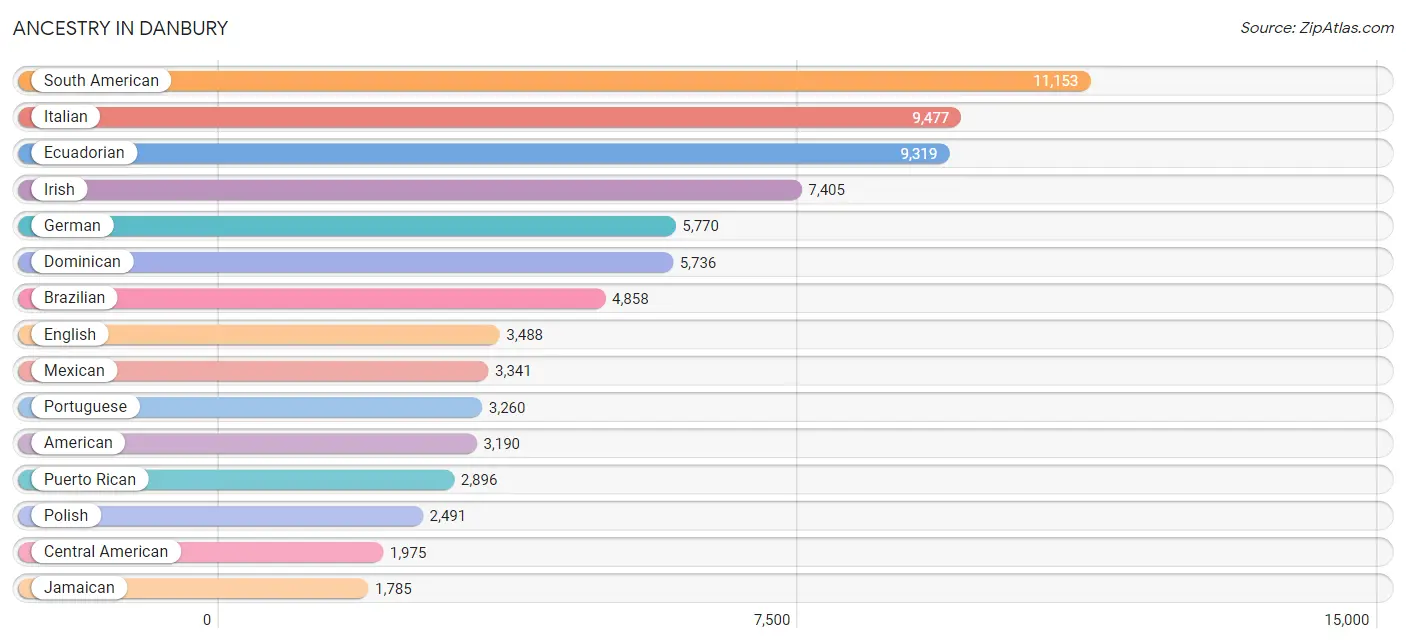
Ancestry in Danbury
The most populous ancestries reported in Danbury are South American (11,153 | 12.9%), Italian (9,477 | 11.0%), Ecuadorian (9,319 | 10.8%), Irish (7,405 | 8.6%), and German (5,770 | 6.7%), together accounting for 49.9% of all Danbury residents.
| Ancestry | # Population | % Population |
| Afghan | 2 | 0.0% |
| African | 572 | 0.7% |
| Albanian | 14 | 0.0% |
| American | 3,190 | 3.7% |
| Apache | 4 | 0.0% |
| Arab | 1,284 | 1.5% |
| Argentinean | 431 | 0.5% |
| Armenian | 144 | 0.2% |
| Australian | 104 | 0.1% |
| Austrian | 324 | 0.4% |
| Barbadian | 80 | 0.1% |
| Basque | 13 | 0.0% |
| Belgian | 14 | 0.0% |
| Belizean | 27 | 0.0% |
| Bhutanese | 165 | 0.2% |
| Blackfeet | 15 | 0.0% |
| Brazilian | 4,858 | 5.6% |
| British | 272 | 0.3% |
| British West Indian | 15 | 0.0% |
| Bulgarian | 21 | 0.0% |
| Burmese | 72 | 0.1% |
| Canadian | 51 | 0.1% |
| Cape Verdean | 48 | 0.1% |
| Carpatho Rusyn | 13 | 0.0% |
| Central American | 1,975 | 2.3% |
| Central American Indian | 190 | 0.2% |
| Cherokee | 50 | 0.1% |
| Chilean | 55 | 0.1% |
| Chippewa | 8 | 0.0% |
| Colombian | 308 | 0.4% |
| Comanche | 4 | 0.0% |
| Costa Rican | 196 | 0.2% |
| Creek | 10 | 0.0% |
| Croatian | 102 | 0.1% |
| Cuban | 298 | 0.3% |
| Czech | 132 | 0.2% |
| Czechoslovakian | 354 | 0.4% |
| Danish | 228 | 0.3% |
| Dominican | 5,736 | 6.6% |
| Dutch | 248 | 0.3% |
| Eastern European | 237 | 0.3% |
| Ecuadorian | 9,319 | 10.8% |
| English | 3,488 | 4.0% |
| European | 708 | 0.8% |
| Finnish | 34 | 0.0% |
| French | 1,000 | 1.2% |
| French American Indian | 29 | 0.0% |
| French Canadian | 632 | 0.7% |
| German | 5,770 | 6.7% |
| Ghanaian | 306 | 0.4% |
| Greek | 738 | 0.9% |
| Guatemalan | 879 | 1.0% |
| Guyanese | 234 | 0.3% |
| Haitian | 195 | 0.2% |
| Honduran | 162 | 0.2% |
| Hungarian | 988 | 1.1% |
| Icelander | 16 | 0.0% |
| Indian (Asian) | 769 | 0.9% |
| Iranian | 5 | 0.0% |
| Irish | 7,405 | 8.6% |
| Iroquois | 8 | 0.0% |
| Israeli | 177 | 0.2% |
| Italian | 9,477 | 11.0% |
| Jamaican | 1,785 | 2.1% |
| Japanese | 654 | 0.8% |
| Korean | 437 | 0.5% |
| Latvian | 260 | 0.3% |
| Lebanese | 864 | 1.0% |
| Lithuanian | 321 | 0.4% |
| Macedonian | 185 | 0.2% |
| Malaysian | 35 | 0.0% |
| Mexican | 3,341 | 3.9% |
| Mongolian | 73 | 0.1% |
| Moroccan | 22 | 0.0% |
| Nicaraguan | 170 | 0.2% |
| Nigerian | 95 | 0.1% |
| Northern European | 17 | 0.0% |
| Norwegian | 251 | 0.3% |
| Pakistani | 17 | 0.0% |
| Palestinian | 40 | 0.1% |
| Panamanian | 54 | 0.1% |
| Paraguayan | 10 | 0.0% |
| Pennsylvania German | 14 | 0.0% |
| Peruvian | 678 | 0.8% |
| Polish | 2,491 | 2.9% |
| Portuguese | 3,260 | 3.8% |
| Puerto Rican | 2,896 | 3.4% |
| Romanian | 53 | 0.1% |
| Russian | 987 | 1.1% |
| Salvadoran | 475 | 0.5% |
| Scandinavian | 102 | 0.1% |
| Scotch-Irish | 228 | 0.3% |
| Scottish | 869 | 1.0% |
| Serbian | 69 | 0.1% |
| Slavic | 61 | 0.1% |
| Slovak | 254 | 0.3% |
| Slovene | 25 | 0.0% |
| South African | 59 | 0.1% |
| South American | 11,153 | 12.9% |
| South American Indian | 20 | 0.0% |
| Spaniard | 119 | 0.1% |
| Spanish | 87 | 0.1% |
| Sri Lankan | 332 | 0.4% |
| Subsaharan African | 1,406 | 1.6% |
| Swedish | 651 | 0.7% |
| Swiss | 57 | 0.1% |
| Syrian | 164 | 0.2% |
| Thai | 1,653 | 1.9% |
| Trinidadian and Tobagonian | 15 | 0.0% |
| Ugandan | 230 | 0.3% |
| Ukrainian | 258 | 0.3% |
| Venezuelan | 263 | 0.3% |
| Vietnamese | 187 | 0.2% |
| Welsh | 375 | 0.4% |
| West Indian | 285 | 0.3% |
| Yugoslavian | 9 | 0.0% | View All 116 Rows |
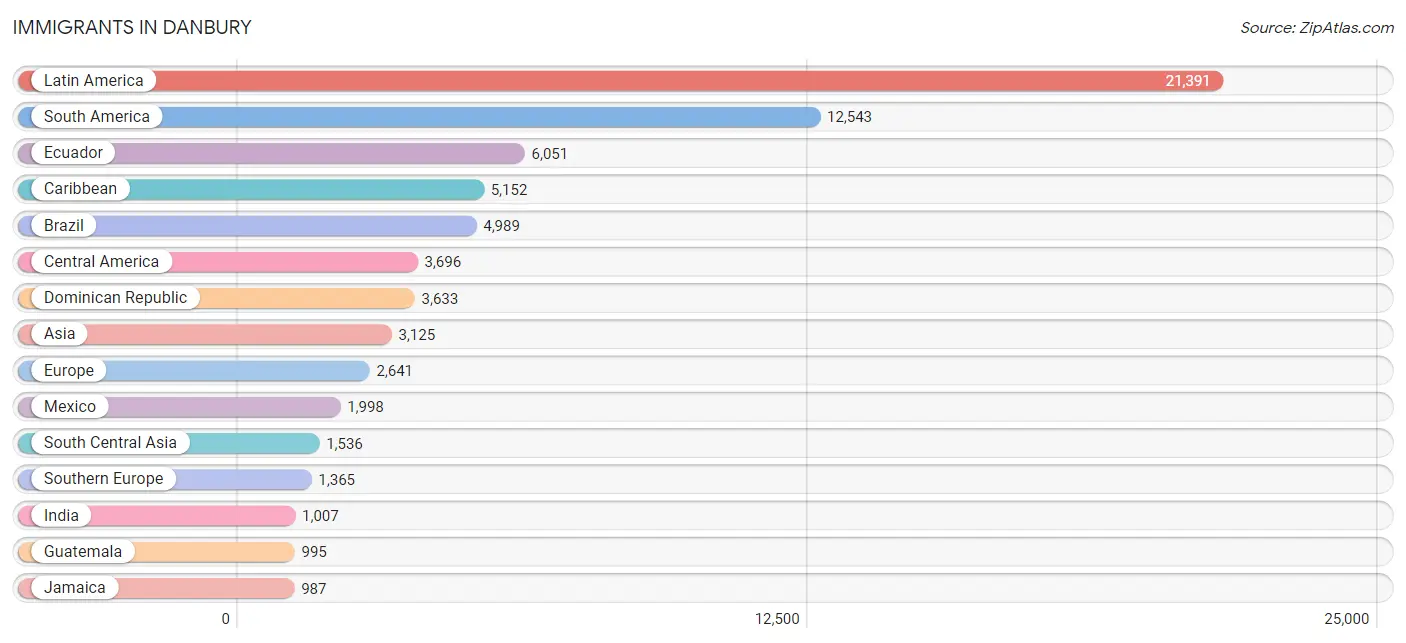
Immigrants in Danbury
The most numerous immigrant groups reported in Danbury came from Latin America (21,391 | 24.7%), South America (12,543 | 14.5%), Ecuador (6,051 | 7.0%), Caribbean (5,152 | 6.0%), and Brazil (4,989 | 5.8%), together accounting for 58.0% of all Danbury residents.
| Immigration Origin | # Population | % Population |
| Afghanistan | 2 | 0.0% |
| Africa | 850 | 1.0% |
| Argentina | 255 | 0.3% |
| Asia | 3,125 | 3.6% |
| Australia | 52 | 0.1% |
| Azores | 14 | 0.0% |
| Bangladesh | 167 | 0.2% |
| Barbados | 72 | 0.1% |
| Belarus | 18 | 0.0% |
| Belize | 27 | 0.0% |
| Bosnia and Herzegovina | 49 | 0.1% |
| Brazil | 4,989 | 5.8% |
| Bulgaria | 32 | 0.0% |
| Cabo Verde | 27 | 0.0% |
| Cambodia | 201 | 0.2% |
| Canada | 175 | 0.2% |
| Caribbean | 5,152 | 6.0% |
| Central America | 3,696 | 4.3% |
| Chile | 55 | 0.1% |
| China | 345 | 0.4% |
| Colombia | 264 | 0.3% |
| Costa Rica | 224 | 0.3% |
| Croatia | 15 | 0.0% |
| Cuba | 91 | 0.1% |
| Czechoslovakia | 18 | 0.0% |
| Dominica | 129 | 0.2% |
| Dominican Republic | 3,633 | 4.2% |
| Eastern Africa | 184 | 0.2% |
| Eastern Asia | 461 | 0.5% |
| Eastern Europe | 755 | 0.9% |
| Ecuador | 6,051 | 7.0% |
| El Salvador | 263 | 0.3% |
| England | 121 | 0.1% |
| Europe | 2,641 | 3.0% |
| France | 10 | 0.0% |
| Germany | 101 | 0.1% |
| Ghana | 292 | 0.3% |
| Greece | 79 | 0.1% |
| Guatemala | 995 | 1.1% |
| Guyana | 174 | 0.2% |
| Haiti | 137 | 0.2% |
| Honduras | 96 | 0.1% |
| Hong Kong | 4 | 0.0% |
| Hungary | 167 | 0.2% |
| India | 1,007 | 1.2% |
| Iran | 5 | 0.0% |
| Iraq | 4 | 0.0% |
| Ireland | 86 | 0.1% |
| Israel | 56 | 0.1% |
| Italy | 261 | 0.3% |
| Jamaica | 987 | 1.1% |
| Japan | 72 | 0.1% |
| Jordan | 13 | 0.0% |
| Korea | 44 | 0.1% |
| Laos | 2 | 0.0% |
| Latin America | 21,391 | 24.7% |
| Lebanon | 49 | 0.1% |
| Liberia | 3 | 0.0% |
| Malaysia | 34 | 0.0% |
| Mexico | 1,998 | 2.3% |
| Middle Africa | 39 | 0.1% |
| Netherlands | 10 | 0.0% |
| Nicaragua | 85 | 0.1% |
| Nigeria | 125 | 0.1% |
| North Macedonia | 88 | 0.1% |
| Northern Africa | 8 | 0.0% |
| Northern Europe | 323 | 0.4% |
| Oceania | 68 | 0.1% |
| Pakistan | 355 | 0.4% |
| Panama | 8 | 0.0% |
| Peru | 515 | 0.6% |
| Philippines | 534 | 0.6% |
| Poland | 74 | 0.1% |
| Portugal | 894 | 1.0% |
| Romania | 98 | 0.1% |
| Russia | 104 | 0.1% |
| Scotland | 78 | 0.1% |
| Serbia | 36 | 0.0% |
| Sierra Leone | 36 | 0.0% |
| South Africa | 65 | 0.1% |
| South America | 12,543 | 14.5% |
| South Central Asia | 1,536 | 1.8% |
| South Eastern Asia | 951 | 1.1% |
| Southern Europe | 1,365 | 1.6% |
| Spain | 131 | 0.2% |
| Sudan | 8 | 0.0% |
| Sweden | 11 | 0.0% |
| Switzerland | 65 | 0.1% |
| Taiwan | 32 | 0.0% |
| Thailand | 54 | 0.1% |
| Trinidad and Tobago | 16 | 0.0% |
| Turkey | 35 | 0.0% |
| Uganda | 172 | 0.2% |
| Ukraine | 44 | 0.1% |
| Uruguay | 10 | 0.0% |
| Venezuela | 230 | 0.3% |
| Vietnam | 126 | 0.2% |
| West Indies | 87 | 0.1% |
| Western Africa | 519 | 0.6% |
| Western Asia | 177 | 0.2% |
| Western Europe | 186 | 0.2% | View All 101 Rows |
Sex and Age in Danbury
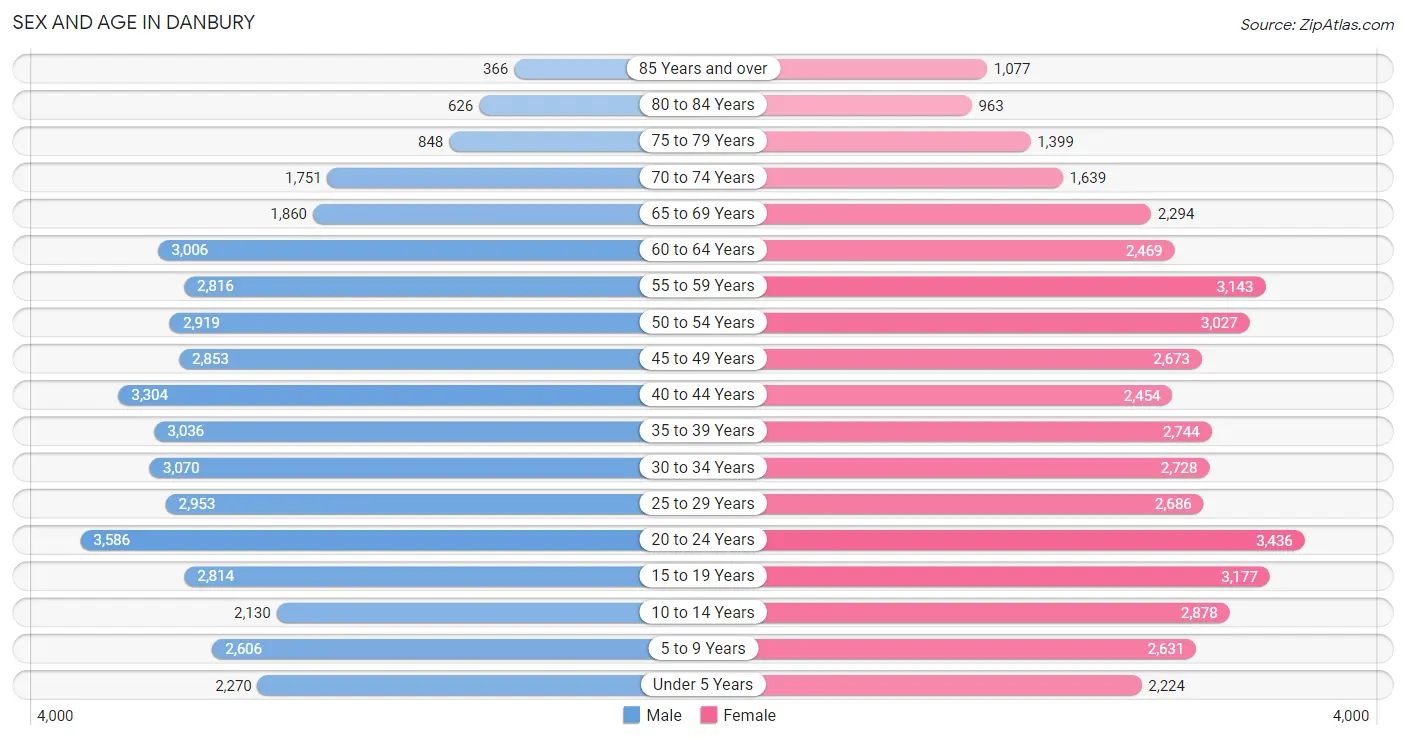
Sex and Age in Danbury
The most populous age groups in Danbury are 20 to 24 Years (3,586 | 8.4%) for men and 20 to 24 Years (3,436 | 7.9%) for women.
| Age Bracket | Male | Female |
| Under 5 Years | 2,270 (5.3%) | 2,224 (5.1%) |
| 5 to 9 Years | 2,606 (6.1%) | 2,631 (6.0%) |
| 10 to 14 Years | 2,130 (5.0%) | 2,878 (6.6%) |
| 15 to 19 Years | 2,814 (6.6%) | 3,177 (7.3%) |
| 20 to 24 Years | 3,586 (8.4%) | 3,436 (7.9%) |
| 25 to 29 Years | 2,953 (6.9%) | 2,686 (6.1%) |
| 30 to 34 Years | 3,070 (7.2%) | 2,728 (6.2%) |
| 35 to 39 Years | 3,036 (7.1%) | 2,744 (6.3%) |
| 40 to 44 Years | 3,304 (7.7%) | 2,454 (5.6%) |
| 45 to 49 Years | 2,853 (6.7%) | 2,673 (6.1%) |
| 50 to 54 Years | 2,919 (6.8%) | 3,027 (6.9%) |
| 55 to 59 Years | 2,816 (6.6%) | 3,143 (7.2%) |
| 60 to 64 Years | 3,006 (7.0%) | 2,469 (5.7%) |
| 65 to 69 Years | 1,860 (4.3%) | 2,294 (5.3%) |
| 70 to 74 Years | 1,751 (4.1%) | 1,639 (3.8%) |
| 75 to 79 Years | 848 (2.0%) | 1,399 (3.2%) |
| 80 to 84 Years | 626 (1.5%) | 963 (2.2%) |
| 85 Years and over | 366 (0.9%) | 1,077 (2.5%) |
| Total | 42,814 (100.0%) | 43,642 (100.0%) |
Families and Households in Danbury
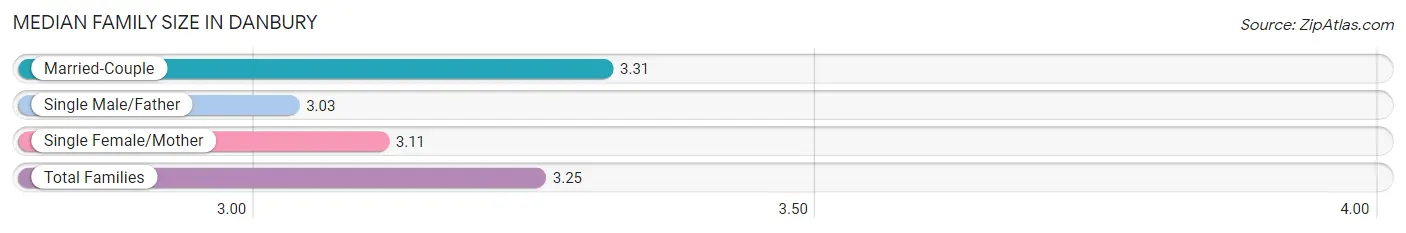
Median Family Size in Danbury
The median family size in Danbury is 3.25 persons per family, with married-couple families (14,826 | 71.6%) accounting for the largest median family size of 3.31 persons per family. On the other hand, single male/father families (1,527 | 7.4%) represent the smallest median family size with 3.03 persons per family.
| Family Type | # Families | Family Size |
| Married-Couple | 14,826 (71.6%) | 3.31 |
| Single Male/Father | 1,527 (7.4%) | 3.03 |
| Single Female/Mother | 4,362 (21.1%) | 3.11 |
| Total Families | 20,715 (100.0%) | 3.25 |
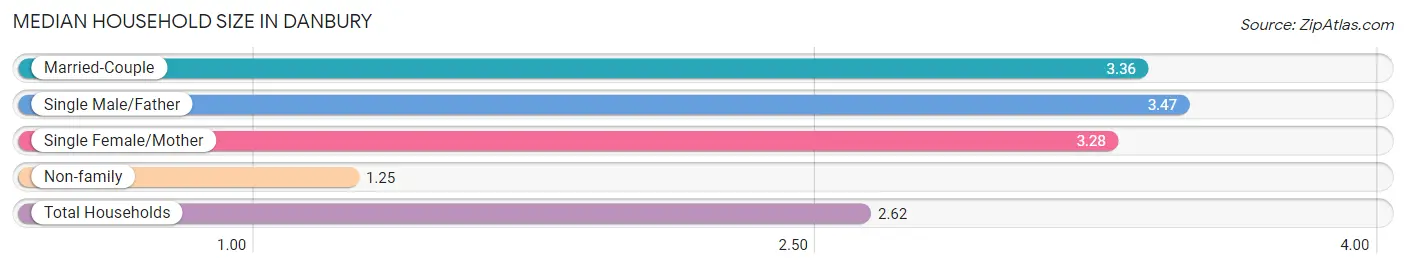
Median Household Size in Danbury
The median household size in Danbury is 2.62 persons per household, with single male/father households (1,527 | 4.8%) accounting for the largest median household size of 3.47 persons per household. non-family households (10,977 | 34.6%) represent the smallest median household size with 1.25 persons per household.
| Household Type | # Households | Household Size |
| Married-Couple | 14,826 (46.8%) | 3.36 |
| Single Male/Father | 1,527 (4.8%) | 3.47 |
| Single Female/Mother | 4,362 (13.8%) | 3.28 |
| Non-family | 10,977 (34.6%) | 1.25 |
| Total Households | 31,692 (100.0%) | 2.62 |
Household Size by Marriage Status in Danbury
Out of a total of 31,692 households in Danbury, 20,715 (65.4%) are family households, while 10,977 (34.6%) are nonfamily households. The most numerous type of family households are 2-person households, comprising 8,267, and the most common type of nonfamily households are 1-person households, comprising 8,850.
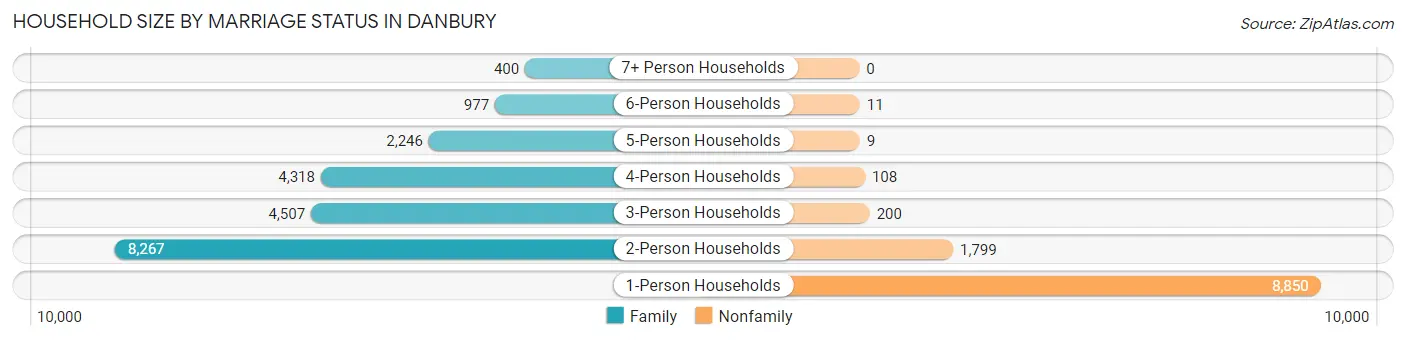
| Household Size | Family Households | Nonfamily Households |
| 1-Person Households | - | 8,850 (27.9%) |
| 2-Person Households | 8,267 (26.1%) | 1,799 (5.7%) |
| 3-Person Households | 4,507 (14.2%) | 200 (0.6%) |
| 4-Person Households | 4,318 (13.6%) | 108 (0.3%) |
| 5-Person Households | 2,246 (7.1%) | 9 (0.0%) |
| 6-Person Households | 977 (3.1%) | 11 (0.0%) |
| 7+ Person Households | 400 (1.3%) | 0 (0.0%) |
| Total | 20,715 (65.4%) | 10,977 (34.6%) |
Female Fertility in Danbury
Fertility by Age in Danbury
Average fertility rate in Danbury is 41.0 births per 1,000 women. Women in the age bracket of 20 to 34 years have the highest fertility rate with 67.0 births per 1,000 women. Women in the age bracket of 20 to 34 years acount for 70.1% of all women with births.
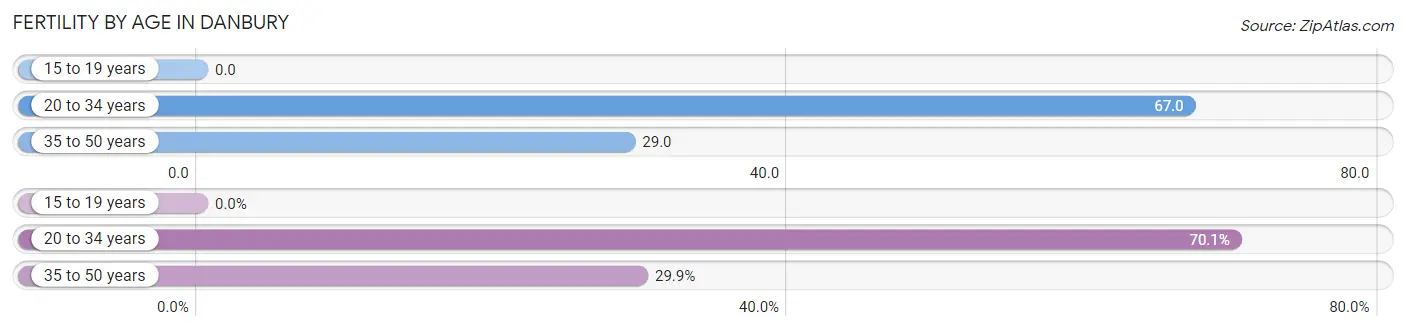
| Age Bracket | Women with Births | Births / 1,000 Women |
| 15 to 19 years | 0 (0.0%) | 0.0 |
| 20 to 34 years | 592 (70.1%) | 67.0 |
| 35 to 50 years | 252 (29.9%) | 29.0 |
| Total | 844 (100.0%) | 41.0 |
Fertility by Age by Marriage Status in Danbury
77.0% of women with births (844) in Danbury are married. The highest percentage of unmarried women with births falls into 35 to 50 years age bracket with 28.2% of them unmarried at the time of birth, while the lowest percentage of unmarried women with births belong to 20 to 34 years age bracket with 20.8% of them unmarried.
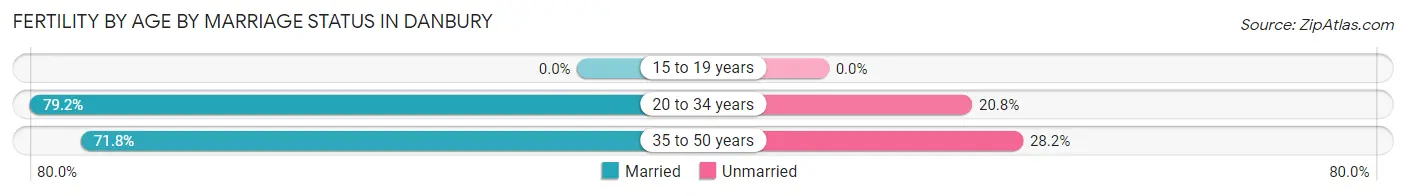
| Age Bracket | Married | Unmarried |
| 15 to 19 years | 0 (0.0%) | 0 (0.0%) |
| 20 to 34 years | 469 (79.2%) | 123 (20.8%) |
| 35 to 50 years | 181 (71.8%) | 71 (28.2%) |
| Total | 650 (77.0%) | 194 (23.0%) |
Fertility by Education in Danbury
Average fertility rate in Danbury is 41.0 births per 1,000 women. Women with the education attainment of graduate degree have the highest fertility rate of 54.0 births per 1,000 women, while women with the education attainment of high school diploma have the lowest fertility at 35.0 births per 1,000 women. Women with the education attainment of college or associate's degree represent 27.1% of all women with births.
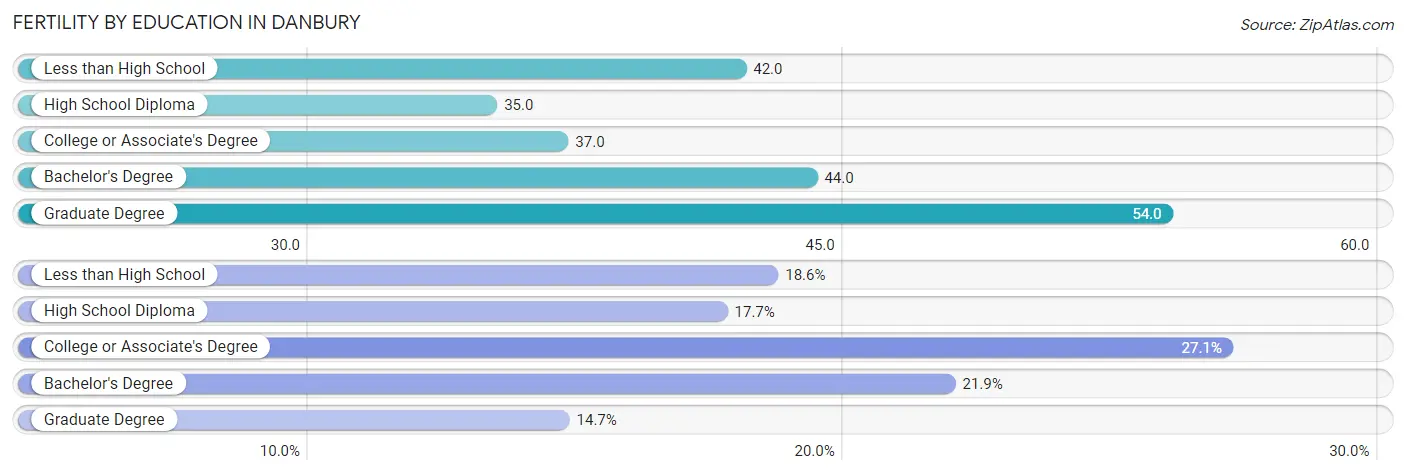
| Educational Attainment | Women with Births | Births / 1,000 Women |
| Less than High School | 157 (18.6%) | 42.0 |
| High School Diploma | 149 (17.6%) | 35.0 |
| College or Associate's Degree | 229 (27.1%) | 37.0 |
| Bachelor's Degree | 185 (21.9%) | 44.0 |
| Graduate Degree | 124 (14.7%) | 54.0 |
| Total | 844 (100.0%) | 41.0 |
Fertility by Education by Marriage Status in Danbury
23.0% of women with births in Danbury are unmarried. Women with the educational attainment of bachelor's degree are most likely to be married with 100.0% of them married at childbirth, while women with the educational attainment of college or associate's degree are least likely to be married with 46.7% of them unmarried at childbirth.
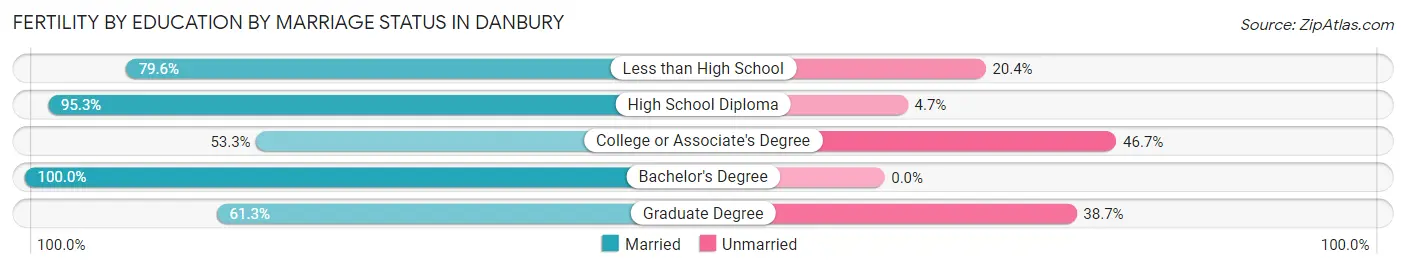
| Educational Attainment | Married | Unmarried |
| Less than High School | 125 (79.6%) | 32 (20.4%) |
| High School Diploma | 142 (95.3%) | 7 (4.7%) |
| College or Associate's Degree | 122 (53.3%) | 107 (46.7%) |
| Bachelor's Degree | 185 (100.0%) | 0 (0.0%) |
| Graduate Degree | 76 (61.3%) | 48 (38.7%) |
| Total | 650 (77.0%) | 194 (23.0%) |
Employment Characteristics in Danbury
Employment by Class of Employer in Danbury
Among the 45,125 employed individuals in Danbury, private company employees (32,216 | 71.4%), not-for-profit organizations (3,598 | 8.0%), and self-employed (not incorporated) (3,424 | 7.6%) make up the most common classes of employment.
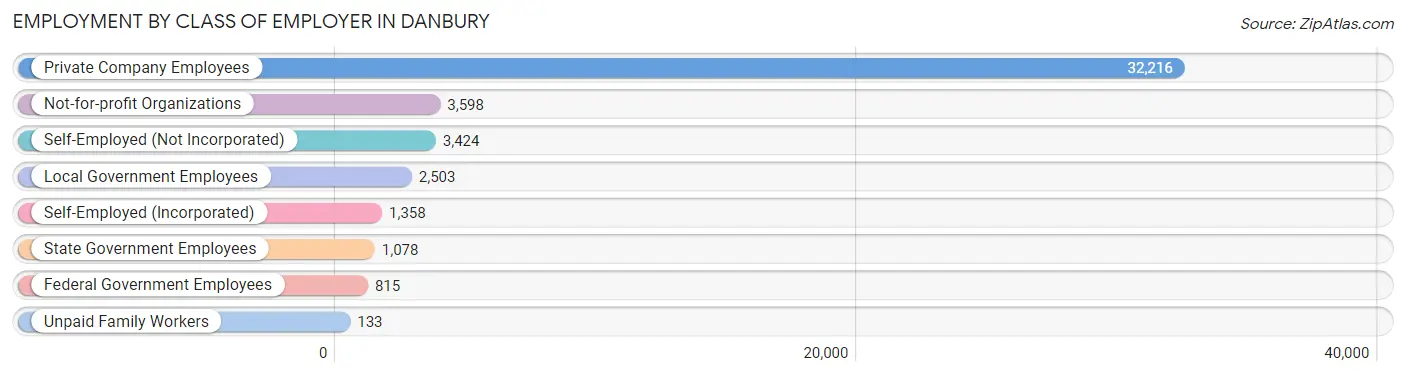
| Employer Class | # Employees | % Employees |
| Private Company Employees | 32,216 | 71.4% |
| Self-Employed (Incorporated) | 1,358 | 3.0% |
| Self-Employed (Not Incorporated) | 3,424 | 7.6% |
| Not-for-profit Organizations | 3,598 | 8.0% |
| Local Government Employees | 2,503 | 5.6% |
| State Government Employees | 1,078 | 2.4% |
| Federal Government Employees | 815 | 1.8% |
| Unpaid Family Workers | 133 | 0.3% |
| Total | 45,125 | 100.0% |
Employment Status by Age in Danbury
According to the labor force statistics for Danbury, out of the total population over 16 years of age (70,893), 70.4% or 49,909 individuals are in the labor force, with 6.0% or 2,995 of them unemployed. The age group with the highest labor force participation rate is 25 to 29 years, with 90.4% or 5,098 individuals in the labor force. Within the labor force, the 16 to 19 years age range has the highest percentage of unemployed individuals, with 14.7% or 360 of them being unemployed.
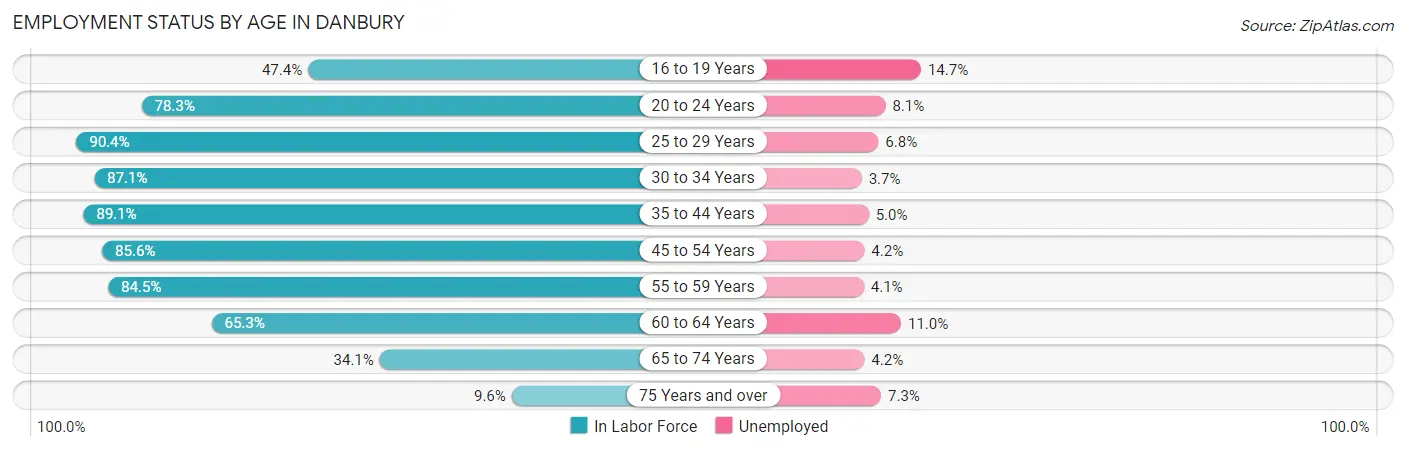
| Age Bracket | In Labor Force | Unemployed |
| 16 to 19 Years | 2,449 (47.4%) | 360 (14.7%) |
| 20 to 24 Years | 5,498 (78.3%) | 445 (8.1%) |
| 25 to 29 Years | 5,098 (90.4%) | 347 (6.8%) |
| 30 to 34 Years | 5,050 (87.1%) | 187 (3.7%) |
| 35 to 44 Years | 10,280 (89.1%) | 514 (5.0%) |
| 45 to 54 Years | 9,820 (85.6%) | 412 (4.2%) |
| 55 to 59 Years | 5,035 (84.5%) | 206 (4.1%) |
| 60 to 64 Years | 3,575 (65.3%) | 393 (11.0%) |
| 65 to 74 Years | 2,573 (34.1%) | 108 (4.2%) |
| 75 Years and over | 507 (9.6%) | 37 (7.3%) |
| Total | 49,909 (70.4%) | 2,995 (6.0%) |
Employment Status by Educational Attainment in Danbury
According to labor force statistics for Danbury, 84.7% of individuals (38,861) out of the total population between 25 and 64 years of age (45,881) are in the labor force, with 5.3% or 2,060 of them being unemployed. The group with the highest labor force participation rate are those with the educational attainment of bachelor's degree or higher, with 91.0% or 14,075 individuals in the labor force. Within the labor force, individuals with less than high school education have the highest percentage of unemployment, with 6.6% or 410 of them being unemployed.
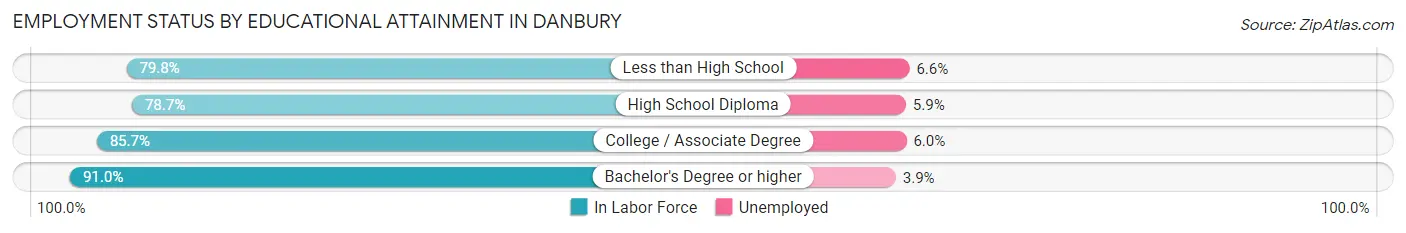
| Educational Attainment | In Labor Force | Unemployed |
| Less than High School | 6,218 (79.8%) | 514 (6.6%) |
| High School Diploma | 9,290 (78.7%) | 696 (5.9%) |
| College / Associate Degree | 9,271 (85.7%) | 649 (6.0%) |
| Bachelor's Degree or higher | 14,075 (91.0%) | 603 (3.9%) |
| Total | 38,861 (84.7%) | 2,432 (5.3%) |
Employment Occupations by Sex in Danbury
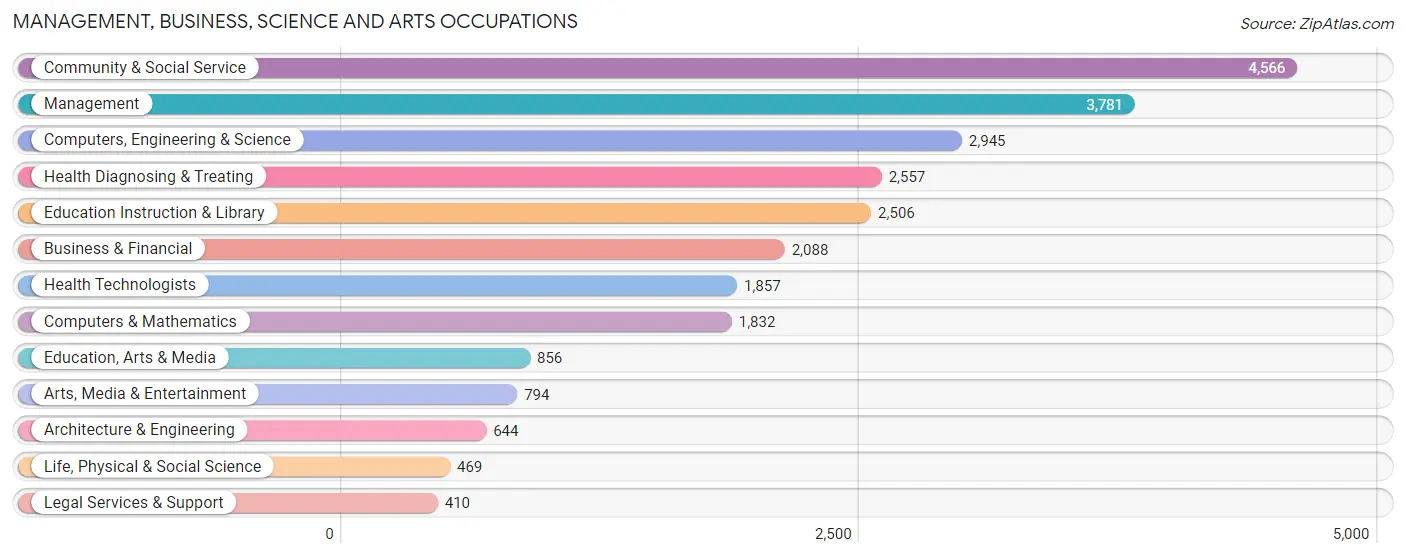
Management, Business, Science and Arts Occupations
The most common Management, Business, Science and Arts occupations in Danbury are Community & Social Service (4,566 | 9.8%), Management (3,781 | 8.1%), Computers, Engineering & Science (2,945 | 6.3%), Health Diagnosing & Treating (2,557 | 5.5%), and Education Instruction & Library (2,506 | 5.3%).
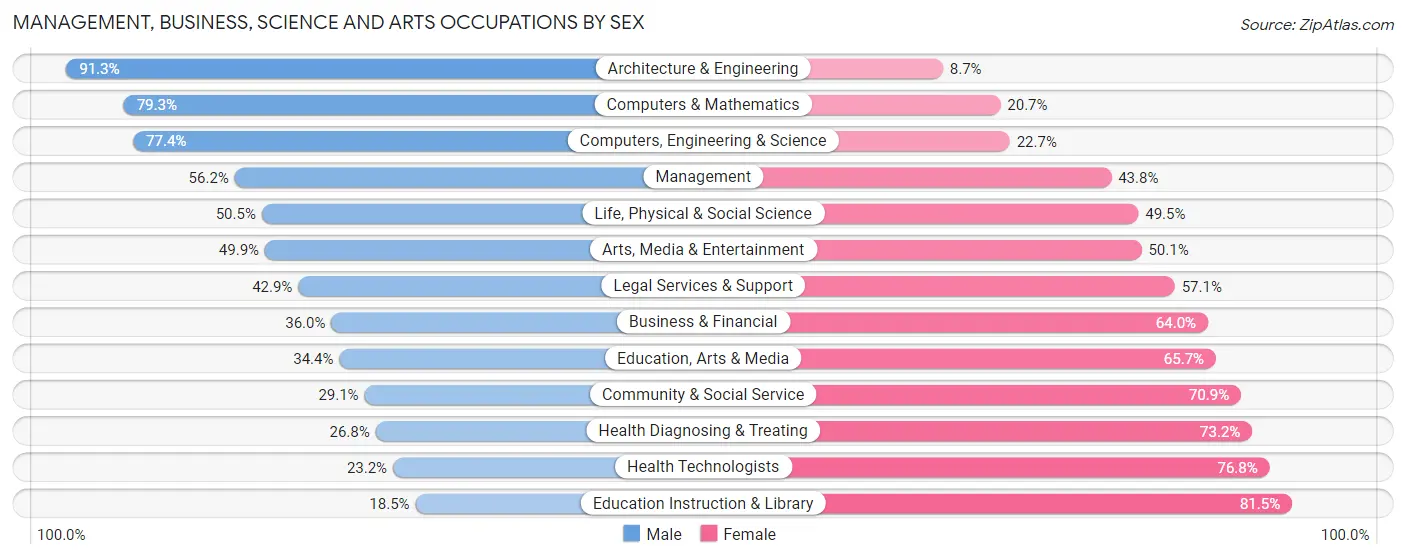
Management, Business, Science and Arts Occupations by Sex
Within the Management, Business, Science and Arts occupations in Danbury, the most male-oriented occupations are Architecture & Engineering (91.3%), Computers & Mathematics (79.3%), and Computers, Engineering & Science (77.3%), while the most female-oriented occupations are Education Instruction & Library (81.5%), Health Technologists (76.8%), and Health Diagnosing & Treating (73.2%).
| Occupation | Male | Female |
| Management | 2,124 (56.2%) | 1,657 (43.8%) |
| Business & Financial | 752 (36.0%) | 1,336 (64.0%) |
| Computers, Engineering & Science | 2,278 (77.3%) | 667 (22.7%) |
| Computers & Mathematics | 1,453 (79.3%) | 379 (20.7%) |
| Architecture & Engineering | 588 (91.3%) | 56 (8.7%) |
| Life, Physical & Social Science | 237 (50.5%) | 232 (49.5%) |
| Community & Social Service | 1,329 (29.1%) | 3,237 (70.9%) |
| Education, Arts & Media | 294 (34.4%) | 562 (65.6%) |
| Legal Services & Support | 176 (42.9%) | 234 (57.1%) |
| Education Instruction & Library | 463 (18.5%) | 2,043 (81.5%) |
| Arts, Media & Entertainment | 396 (49.9%) | 398 (50.1%) |
| Health Diagnosing & Treating | 685 (26.8%) | 1,872 (73.2%) |
| Health Technologists | 430 (23.2%) | 1,427 (76.8%) |
| Total (Category) | 7,168 (45.0%) | 8,769 (55.0%) |
| Total (Overall) | 24,588 (52.5%) | 22,218 (47.5%) |
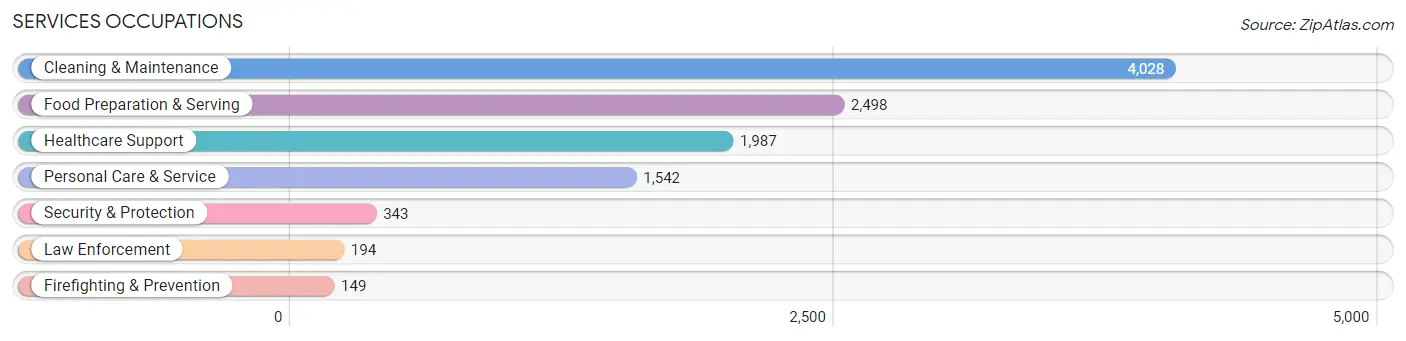
Services Occupations
The most common Services occupations in Danbury are Cleaning & Maintenance (4,028 | 8.6%), Food Preparation & Serving (2,498 | 5.3%), Healthcare Support (1,987 | 4.3%), Personal Care & Service (1,542 | 3.3%), and Security & Protection (343 | 0.7%).
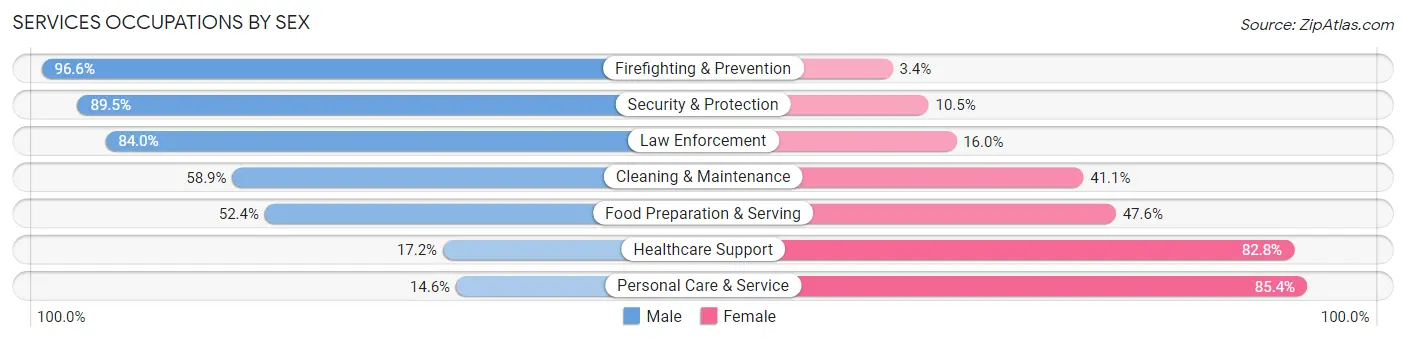
Services Occupations by Sex
Within the Services occupations in Danbury, the most male-oriented occupations are Firefighting & Prevention (96.6%), Security & Protection (89.5%), and Law Enforcement (84.0%), while the most female-oriented occupations are Personal Care & Service (85.4%), Healthcare Support (82.8%), and Food Preparation & Serving (47.6%).
| Occupation | Male | Female |
| Healthcare Support | 341 (17.2%) | 1,646 (82.8%) |
| Security & Protection | 307 (89.5%) | 36 (10.5%) |
| Firefighting & Prevention | 144 (96.6%) | 5 (3.4%) |
| Law Enforcement | 163 (84.0%) | 31 (16.0%) |
| Food Preparation & Serving | 1,310 (52.4%) | 1,188 (47.6%) |
| Cleaning & Maintenance | 2,371 (58.9%) | 1,657 (41.1%) |
| Personal Care & Service | 225 (14.6%) | 1,317 (85.4%) |
| Total (Category) | 4,554 (43.8%) | 5,844 (56.2%) |
| Total (Overall) | 24,588 (52.5%) | 22,218 (47.5%) |
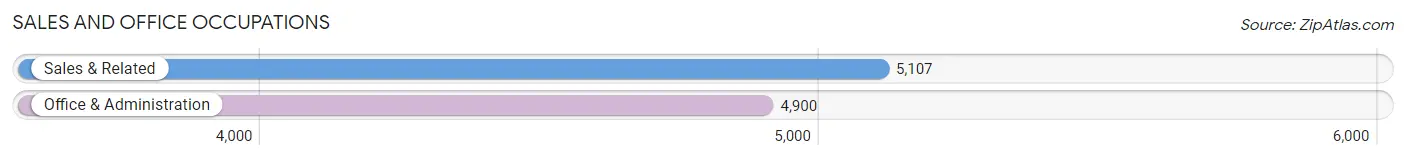
Sales and Office Occupations
The most common Sales and Office occupations in Danbury are Sales & Related (5,107 | 10.9%), and Office & Administration (4,900 | 10.5%).
Sales and Office Occupations by Sex
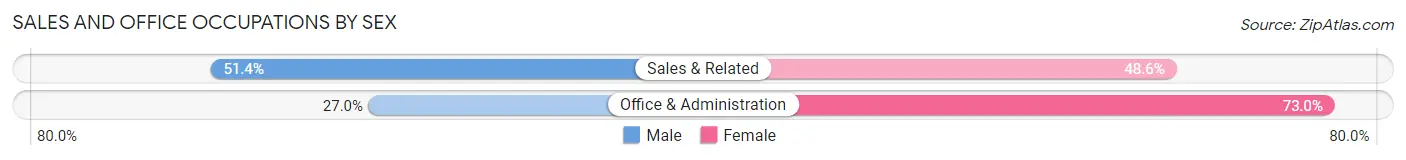
| Occupation | Male | Female |
| Sales & Related | 2,625 (51.4%) | 2,482 (48.6%) |
| Office & Administration | 1,325 (27.0%) | 3,575 (73.0%) |
| Total (Category) | 3,950 (39.5%) | 6,057 (60.5%) |
| Total (Overall) | 24,588 (52.5%) | 22,218 (47.5%) |
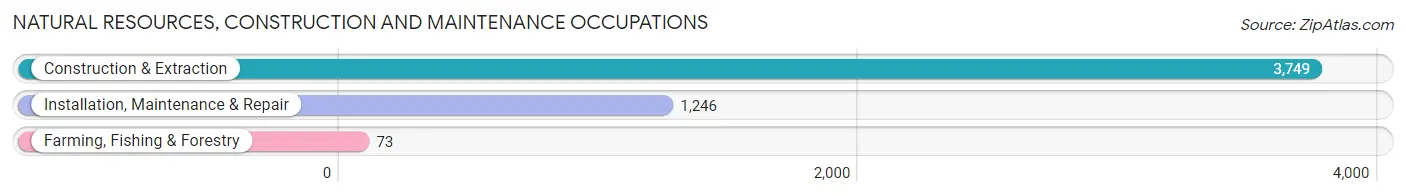
Natural Resources, Construction and Maintenance Occupations
The most common Natural Resources, Construction and Maintenance occupations in Danbury are Construction & Extraction (3,749 | 8.0%), Installation, Maintenance & Repair (1,246 | 2.7%), and Farming, Fishing & Forestry (73 | 0.2%).
Natural Resources, Construction and Maintenance Occupations by Sex
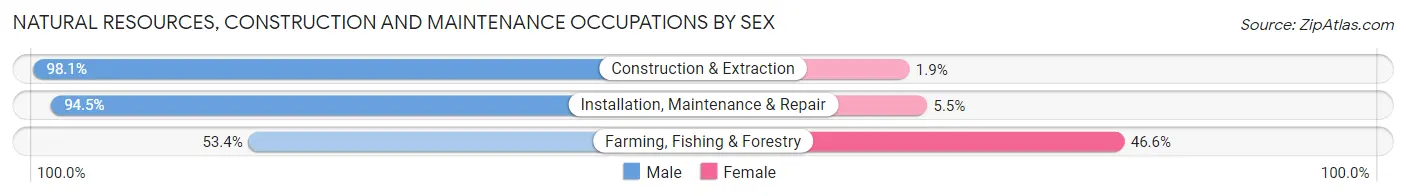
| Occupation | Male | Female |
| Farming, Fishing & Forestry | 39 (53.4%) | 34 (46.6%) |
| Construction & Extraction | 3,679 (98.1%) | 70 (1.9%) |
| Installation, Maintenance & Repair | 1,177 (94.5%) | 69 (5.5%) |
| Total (Category) | 4,895 (96.6%) | 173 (3.4%) |
| Total (Overall) | 24,588 (52.5%) | 22,218 (47.5%) |
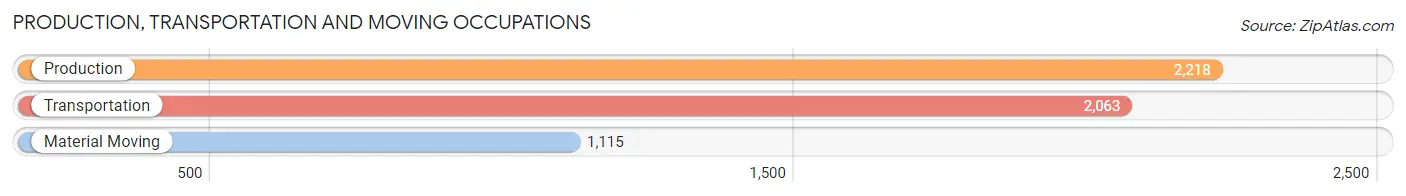
Production, Transportation and Moving Occupations
The most common Production, Transportation and Moving occupations in Danbury are Production (2,218 | 4.7%), Transportation (2,063 | 4.4%), and Material Moving (1,115 | 2.4%).
Production, Transportation and Moving Occupations by Sex
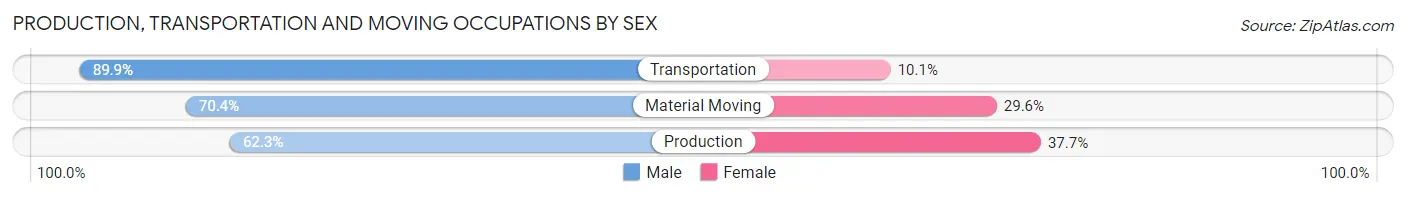
| Occupation | Male | Female |
| Production | 1,382 (62.3%) | 836 (37.7%) |
| Transportation | 1,854 (89.9%) | 209 (10.1%) |
| Material Moving | 785 (70.4%) | 330 (29.6%) |
| Total (Category) | 4,021 (74.5%) | 1,375 (25.5%) |
| Total (Overall) | 24,588 (52.5%) | 22,218 (47.5%) |
Employment Industries by Sex in Danbury
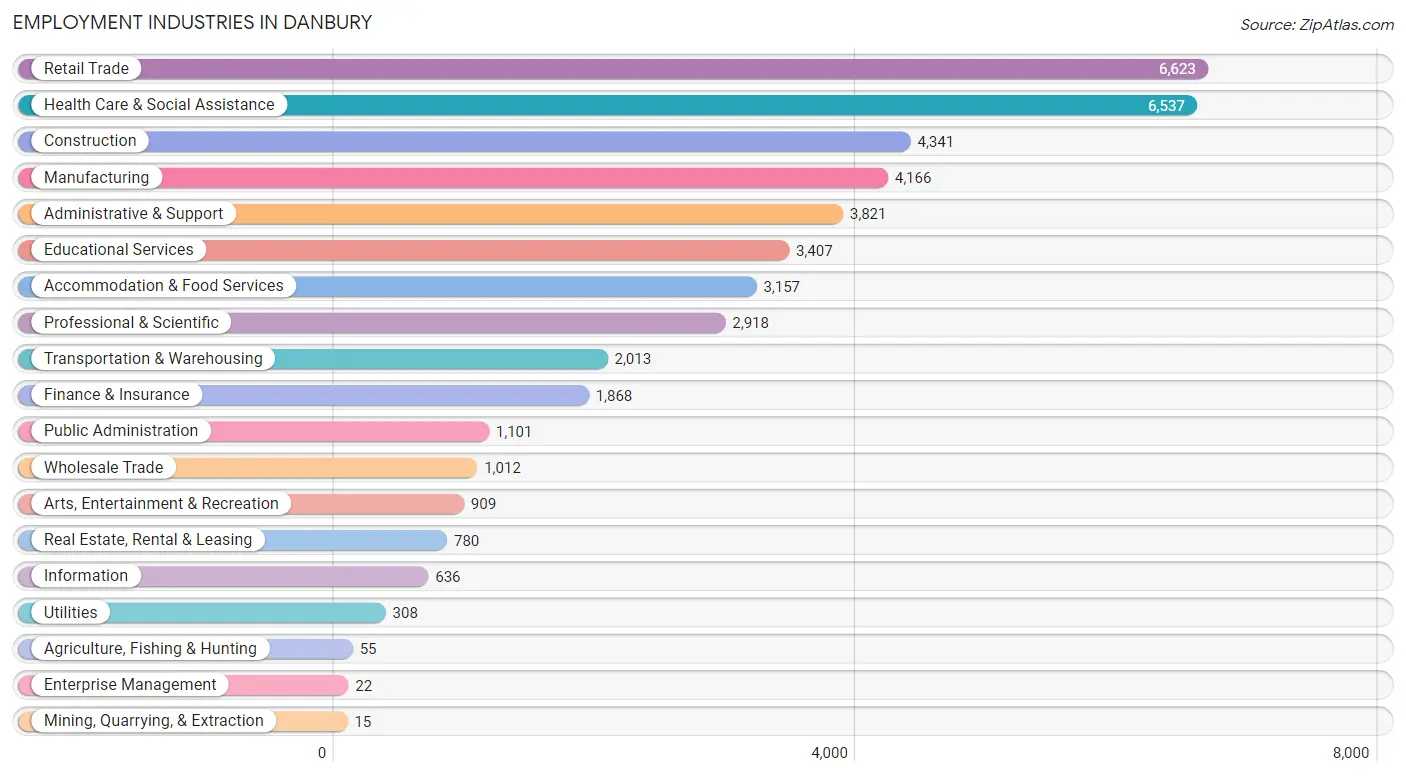
Employment Industries in Danbury
The major employment industries in Danbury include Retail Trade (6,623 | 14.1%), Health Care & Social Assistance (6,537 | 14.0%), Construction (4,341 | 9.3%), Manufacturing (4,166 | 8.9%), and Administrative & Support (3,821 | 8.2%).
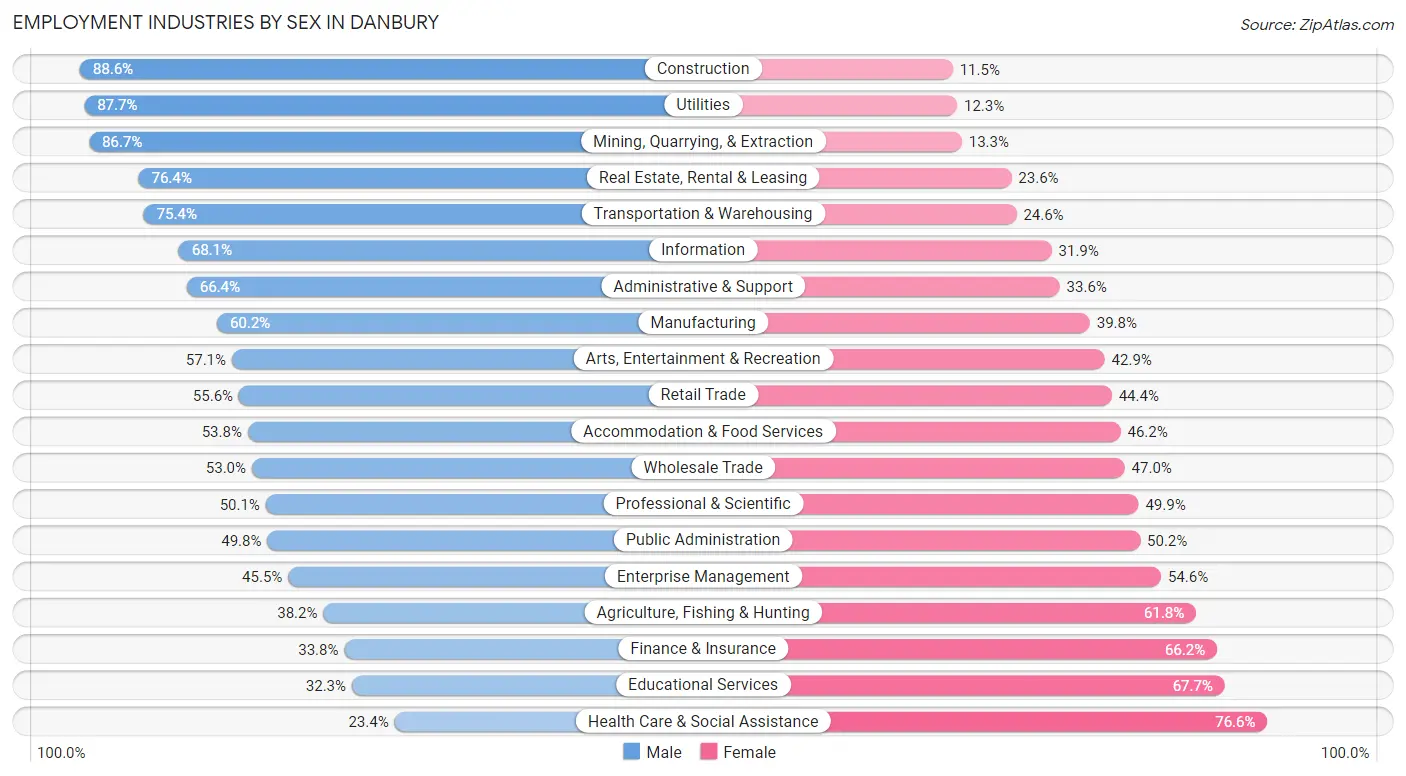
Employment Industries by Sex in Danbury
The Danbury industries that see more men than women are Construction (88.5%), Utilities (87.7%), and Mining, Quarrying, & Extraction (86.7%), whereas the industries that tend to have a higher number of women are Health Care & Social Assistance (76.6%), Educational Services (67.7%), and Finance & Insurance (66.2%).
| Industry | Male | Female |
| Agriculture, Fishing & Hunting | 21 (38.2%) | 34 (61.8%) |
| Mining, Quarrying, & Extraction | 13 (86.7%) | 2 (13.3%) |
| Construction | 3,844 (88.5%) | 497 (11.5%) |
| Manufacturing | 2,507 (60.2%) | 1,659 (39.8%) |
| Wholesale Trade | 536 (53.0%) | 476 (47.0%) |
| Retail Trade | 3,685 (55.6%) | 2,938 (44.4%) |
| Transportation & Warehousing | 1,517 (75.4%) | 496 (24.6%) |
| Utilities | 270 (87.7%) | 38 (12.3%) |
| Information | 433 (68.1%) | 203 (31.9%) |
| Finance & Insurance | 632 (33.8%) | 1,236 (66.2%) |
| Real Estate, Rental & Leasing | 596 (76.4%) | 184 (23.6%) |
| Professional & Scientific | 1,462 (50.1%) | 1,456 (49.9%) |
| Enterprise Management | 10 (45.5%) | 12 (54.5%) |
| Administrative & Support | 2,538 (66.4%) | 1,283 (33.6%) |
| Educational Services | 1,099 (32.3%) | 2,308 (67.7%) |
| Health Care & Social Assistance | 1,532 (23.4%) | 5,005 (76.6%) |
| Arts, Entertainment & Recreation | 519 (57.1%) | 390 (42.9%) |
| Accommodation & Food Services | 1,699 (53.8%) | 1,458 (46.2%) |
| Public Administration | 548 (49.8%) | 553 (50.2%) |
| Total | 24,588 (52.5%) | 22,218 (47.5%) |
Education in Danbury
School Enrollment in Danbury
The most common levels of schooling among the 21,842 students in Danbury are college / undergraduate (6,177 | 28.3%), middle school (4,191 | 19.2%), and high school (4,179 | 19.1%).
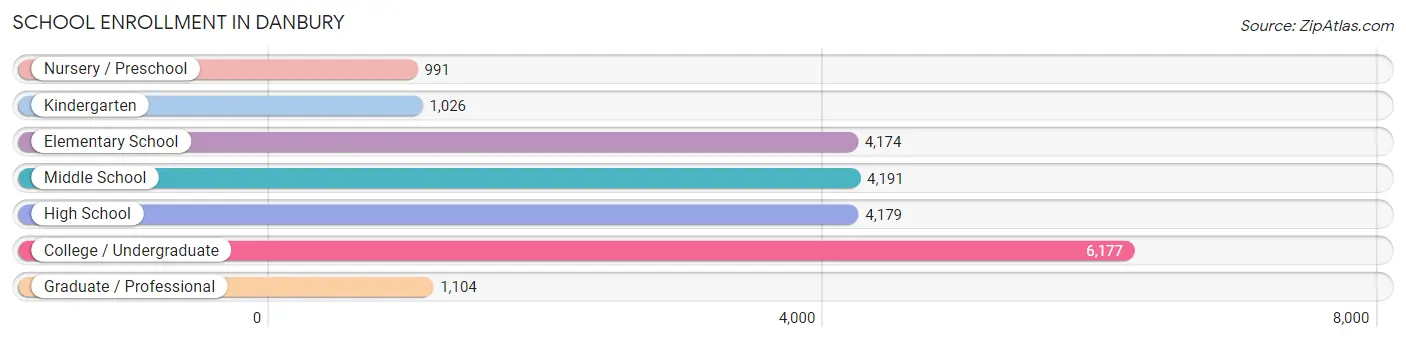
| School Level | # Students | % Students |
| Nursery / Preschool | 991 | 4.5% |
| Kindergarten | 1,026 | 4.7% |
| Elementary School | 4,174 | 19.1% |
| Middle School | 4,191 | 19.2% |
| High School | 4,179 | 19.1% |
| College / Undergraduate | 6,177 | 28.3% |
| Graduate / Professional | 1,104 | 5.1% |
| Total | 21,842 | 100.0% |
School Enrollment by Age by Funding Source in Danbury
Out of a total of 21,842 students who are enrolled in schools in Danbury, 3,538 (16.2%) attend a private institution, while the remaining 18,304 (83.8%) are enrolled in public schools. The age group of 35 years and over has the highest likelihood of being enrolled in private schools, with 382 (41.8% in the age bracket) enrolled. Conversely, the age group of 15 to 17 year olds has the lowest likelihood of being enrolled in a private school, with 2,555 (93.8% in the age bracket) attending a public institution.
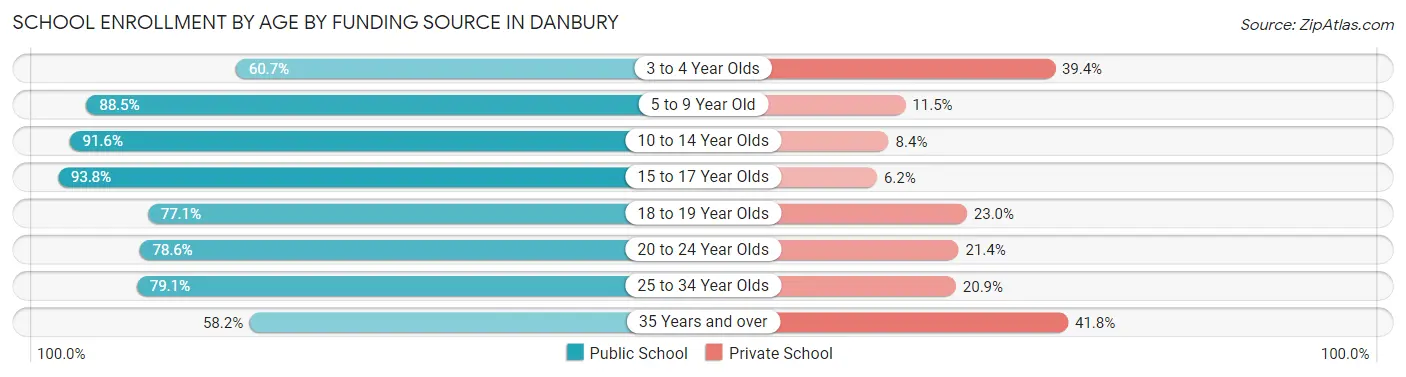
| Age Bracket | Public School | Private School |
| 3 to 4 Year Olds | 638 (60.7%) | 414 (39.4%) |
| 5 to 9 Year Old | 4,365 (88.5%) | 567 (11.5%) |
| 10 to 14 Year Olds | 4,491 (91.6%) | 411 (8.4%) |
| 15 to 17 Year Olds | 2,555 (93.8%) | 169 (6.2%) |
| 18 to 19 Year Olds | 2,088 (77.0%) | 622 (23.0%) |
| 20 to 24 Year Olds | 2,328 (78.6%) | 634 (21.4%) |
| 25 to 34 Year Olds | 1,302 (79.1%) | 344 (20.9%) |
| 35 Years and over | 532 (58.2%) | 382 (41.8%) |
| Total | 18,304 (83.8%) | 3,538 (16.2%) |
Educational Attainment by Field of Study in Danbury
Business (4,426 | 20.9%), education (2,502 | 11.8%), science & technology (1,755 | 8.3%), social sciences (1,721 | 8.1%), and engineering (1,486 | 7.0%) are the most common fields of study among 21,183 individuals in Danbury who have obtained a bachelor's degree or higher.
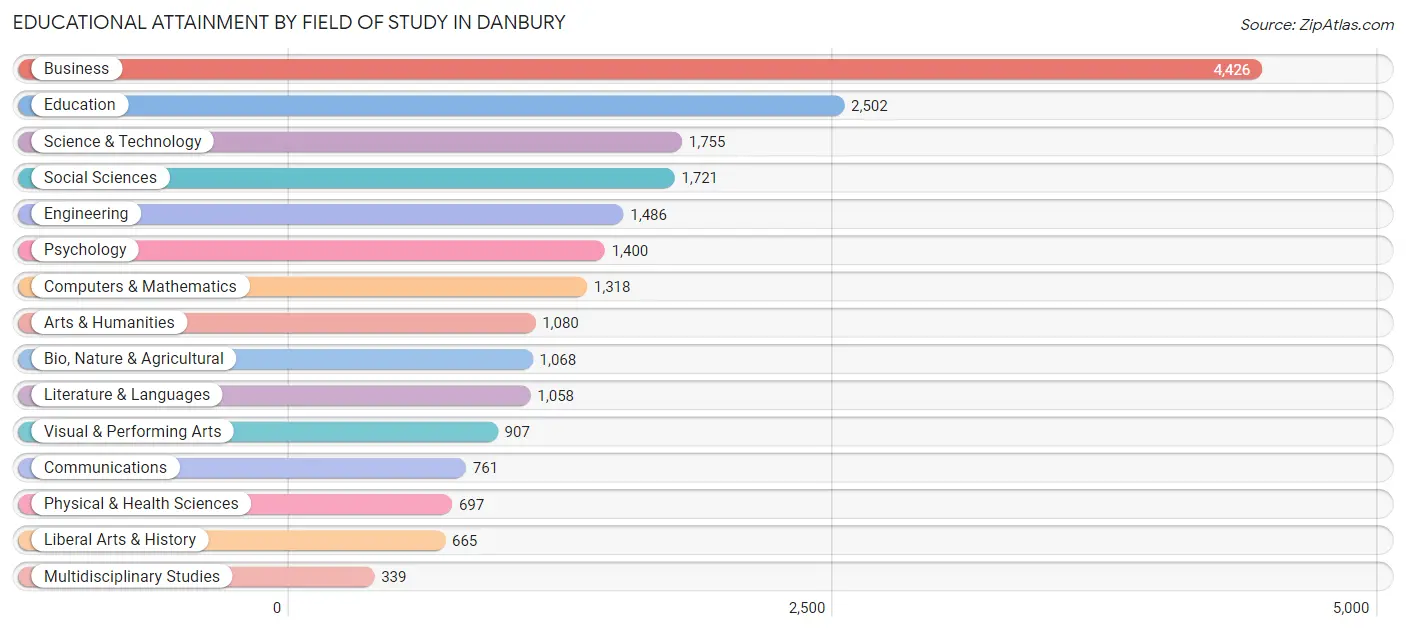
| Field of Study | # Graduates | % Graduates |
| Computers & Mathematics | 1,318 | 6.2% |
| Bio, Nature & Agricultural | 1,068 | 5.0% |
| Physical & Health Sciences | 697 | 3.3% |
| Psychology | 1,400 | 6.6% |
| Social Sciences | 1,721 | 8.1% |
| Engineering | 1,486 | 7.0% |
| Multidisciplinary Studies | 339 | 1.6% |
| Science & Technology | 1,755 | 8.3% |
| Business | 4,426 | 20.9% |
| Education | 2,502 | 11.8% |
| Literature & Languages | 1,058 | 5.0% |
| Liberal Arts & History | 665 | 3.1% |
| Visual & Performing Arts | 907 | 4.3% |
| Communications | 761 | 3.6% |
| Arts & Humanities | 1,080 | 5.1% |
| Total | 21,183 | 100.0% |
Transportation & Commute in Danbury
Vehicle Availability by Sex in Danbury
The most prevalent vehicle ownership categories in Danbury are males with 2 vehicles (9,850, accounting for 41.8%) and females with 2 vehicles (7,925, making up 47.4%).
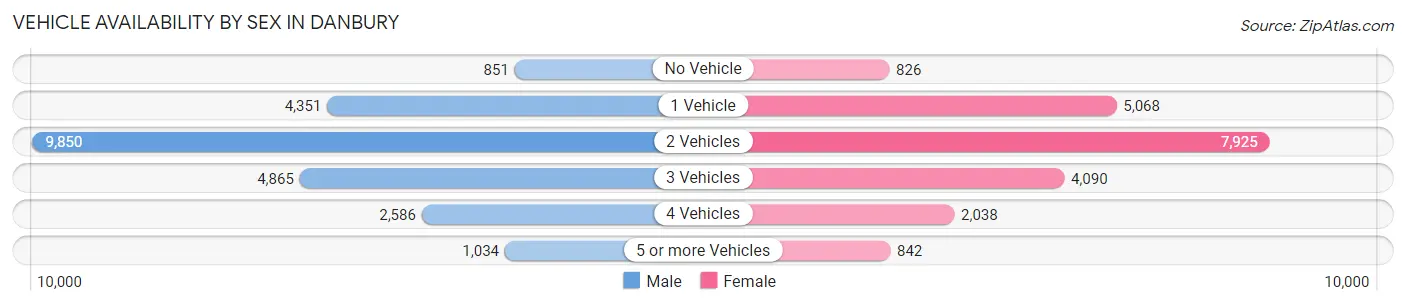
| Vehicles Available | Male | Female |
| No Vehicle | 851 (3.6%) | 826 (4.0%) |
| 1 Vehicle | 4,351 (18.5%) | 5,068 (24.4%) |
| 2 Vehicles | 9,850 (41.8%) | 7,925 (38.1%) |
| 3 Vehicles | 4,865 (20.7%) | 4,090 (19.7%) |
| 4 Vehicles | 2,586 (11.0%) | 2,038 (9.8%) |
| 5 or more Vehicles | 1,034 (4.4%) | 842 (4.1%) |
| Total | 23,537 (100.0%) | 20,789 (100.0%) |
Commute Time in Danbury
The most frequently occuring commute durations in Danbury are 15 to 19 minutes (6,694 commuters, 16.5%), 10 to 14 minutes (6,405 commuters, 15.8%), and 20 to 24 minutes (4,812 commuters, 11.9%).
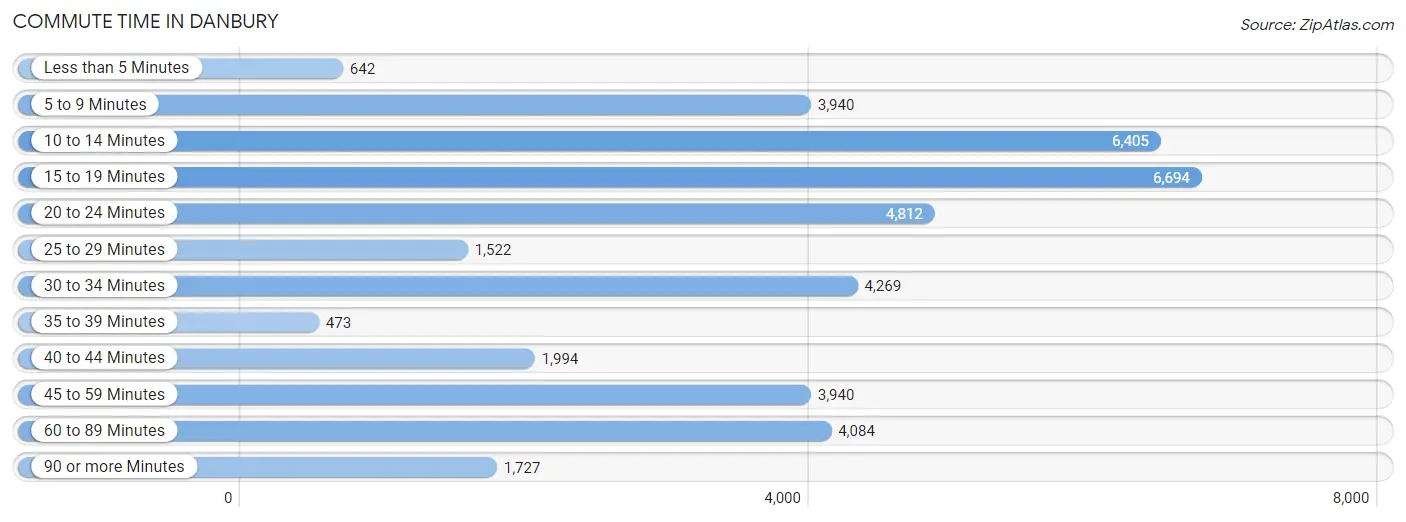
| Commute Time | # Commuters | % Commuters |
| Less than 5 Minutes | 642 | 1.6% |
| 5 to 9 Minutes | 3,940 | 9.7% |
| 10 to 14 Minutes | 6,405 | 15.8% |
| 15 to 19 Minutes | 6,694 | 16.5% |
| 20 to 24 Minutes | 4,812 | 11.9% |
| 25 to 29 Minutes | 1,522 | 3.8% |
| 30 to 34 Minutes | 4,269 | 10.5% |
| 35 to 39 Minutes | 473 | 1.2% |
| 40 to 44 Minutes | 1,994 | 4.9% |
| 45 to 59 Minutes | 3,940 | 9.7% |
| 60 to 89 Minutes | 4,084 | 10.1% |
| 90 or more Minutes | 1,727 | 4.3% |
Commute Time by Sex in Danbury
The most common commute times in Danbury are 15 to 19 minutes (3,353 commuters, 15.5%) for males and 10 to 14 minutes (3,355 commuters, 17.7%) for females.
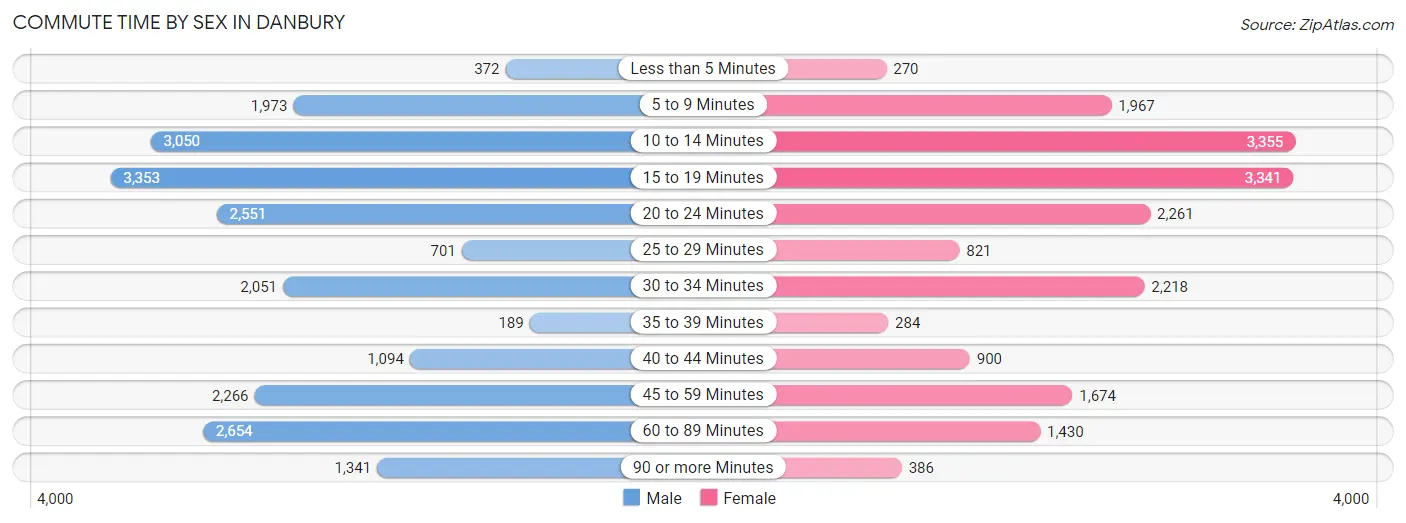
| Commute Time | Male | Female |
| Less than 5 Minutes | 372 (1.7%) | 270 (1.4%) |
| 5 to 9 Minutes | 1,973 (9.1%) | 1,967 (10.4%) |
| 10 to 14 Minutes | 3,050 (14.1%) | 3,355 (17.7%) |
| 15 to 19 Minutes | 3,353 (15.5%) | 3,341 (17.7%) |
| 20 to 24 Minutes | 2,551 (11.8%) | 2,261 (12.0%) |
| 25 to 29 Minutes | 701 (3.3%) | 821 (4.3%) |
| 30 to 34 Minutes | 2,051 (9.5%) | 2,218 (11.7%) |
| 35 to 39 Minutes | 189 (0.9%) | 284 (1.5%) |
| 40 to 44 Minutes | 1,094 (5.1%) | 900 (4.8%) |
| 45 to 59 Minutes | 2,266 (10.5%) | 1,674 (8.8%) |
| 60 to 89 Minutes | 2,654 (12.3%) | 1,430 (7.6%) |
| 90 or more Minutes | 1,341 (6.2%) | 386 (2.0%) |
Time of Departure to Work by Sex in Danbury
The most frequent times of departure to work in Danbury are 7:00 AM to 7:29 AM (3,324, 15.4%) for males and 8:00 AM to 8:29 AM (3,367, 17.8%) for females.
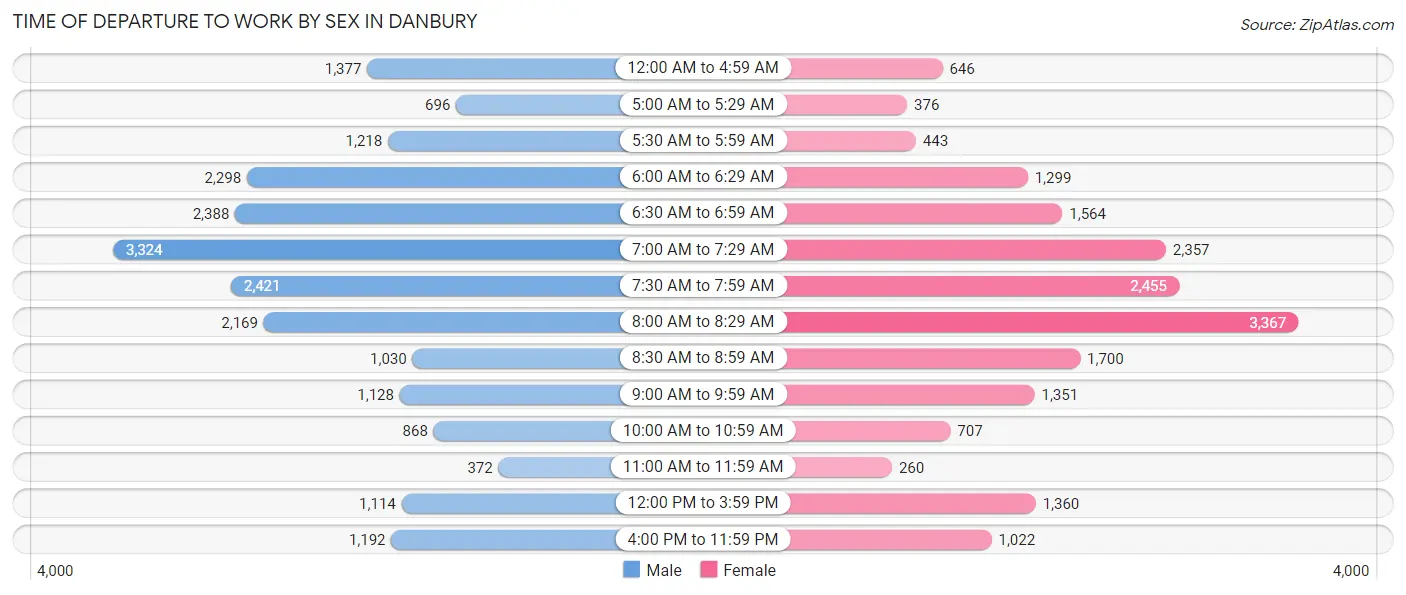
| Time of Departure | Male | Female |
| 12:00 AM to 4:59 AM | 1,377 (6.4%) | 646 (3.4%) |
| 5:00 AM to 5:29 AM | 696 (3.2%) | 376 (2.0%) |
| 5:30 AM to 5:59 AM | 1,218 (5.6%) | 443 (2.3%) |
| 6:00 AM to 6:29 AM | 2,298 (10.6%) | 1,299 (6.9%) |
| 6:30 AM to 6:59 AM | 2,388 (11.1%) | 1,564 (8.3%) |
| 7:00 AM to 7:29 AM | 3,324 (15.4%) | 2,357 (12.5%) |
| 7:30 AM to 7:59 AM | 2,421 (11.2%) | 2,455 (13.0%) |
| 8:00 AM to 8:29 AM | 2,169 (10.0%) | 3,367 (17.8%) |
| 8:30 AM to 8:59 AM | 1,030 (4.8%) | 1,700 (9.0%) |
| 9:00 AM to 9:59 AM | 1,128 (5.2%) | 1,351 (7.1%) |
| 10:00 AM to 10:59 AM | 868 (4.0%) | 707 (3.7%) |
| 11:00 AM to 11:59 AM | 372 (1.7%) | 260 (1.4%) |
| 12:00 PM to 3:59 PM | 1,114 (5.2%) | 1,360 (7.2%) |
| 4:00 PM to 11:59 PM | 1,192 (5.5%) | 1,022 (5.4%) |
| Total | 21,595 (100.0%) | 18,907 (100.0%) |
Housing Occupancy in Danbury
Occupancy by Ownership in Danbury
Of the total 31,692 dwellings in Danbury, owner-occupied units account for 17,722 (55.9%), while renter-occupied units make up 13,970 (44.1%).
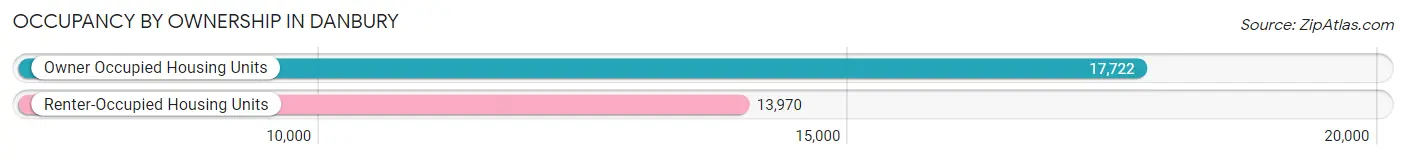
| Occupancy | # Housing Units | % Housing Units |
| Owner Occupied Housing Units | 17,722 | 55.9% |
| Renter-Occupied Housing Units | 13,970 | 44.1% |
| Total Occupied Housing Units | 31,692 | 100.0% |
Occupancy by Household Size in Danbury
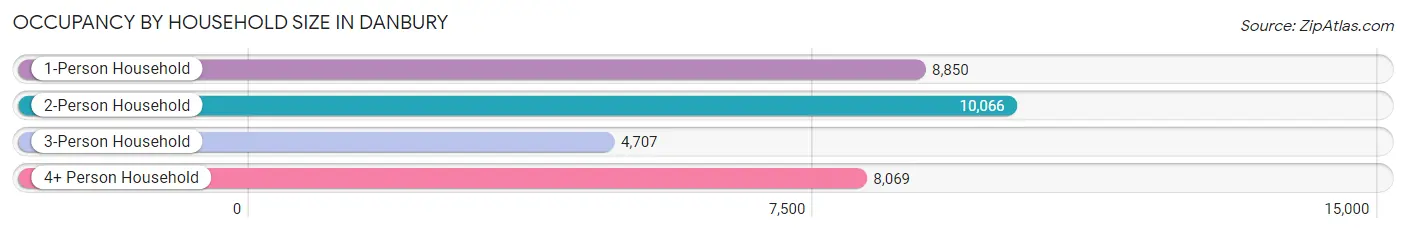
| Household Size | # Housing Units | % Housing Units |
| 1-Person Household | 8,850 | 27.9% |
| 2-Person Household | 10,066 | 31.8% |
| 3-Person Household | 4,707 | 14.8% |
| 4+ Person Household | 8,069 | 25.5% |
| Total Housing Units | 31,692 | 100.0% |
Occupancy by Ownership by Household Size in Danbury
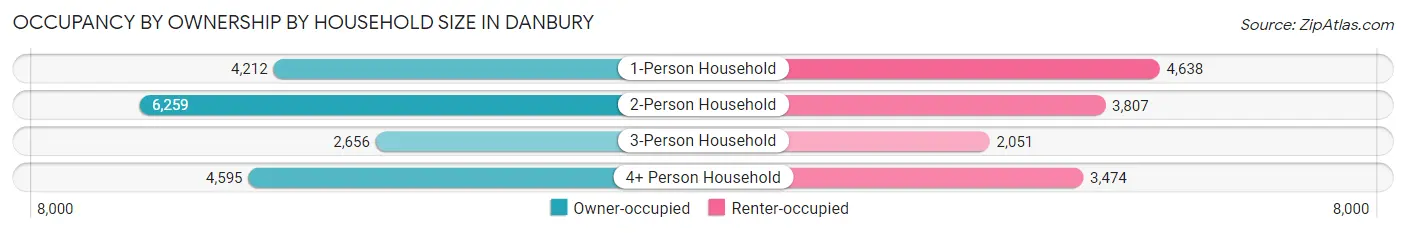
| Household Size | Owner-occupied | Renter-occupied |
| 1-Person Household | 4,212 (47.6%) | 4,638 (52.4%) |
| 2-Person Household | 6,259 (62.2%) | 3,807 (37.8%) |
| 3-Person Household | 2,656 (56.4%) | 2,051 (43.6%) |
| 4+ Person Household | 4,595 (57.0%) | 3,474 (43.0%) |
| Total Housing Units | 17,722 (55.9%) | 13,970 (44.1%) |
Occupancy by Educational Attainment in Danbury
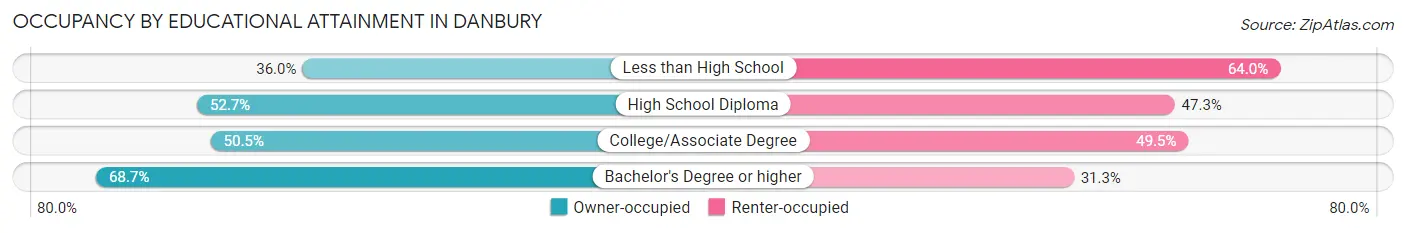
| Household Size | Owner-occupied | Renter-occupied |
| Less than High School | 1,551 (36.0%) | 2,762 (64.0%) |
| High School Diploma | 4,142 (52.7%) | 3,724 (47.3%) |
| College/Associate Degree | 3,807 (50.5%) | 3,733 (49.5%) |
| Bachelor's Degree or higher | 8,222 (68.7%) | 3,751 (31.3%) |
Occupancy by Age of Householder in Danbury
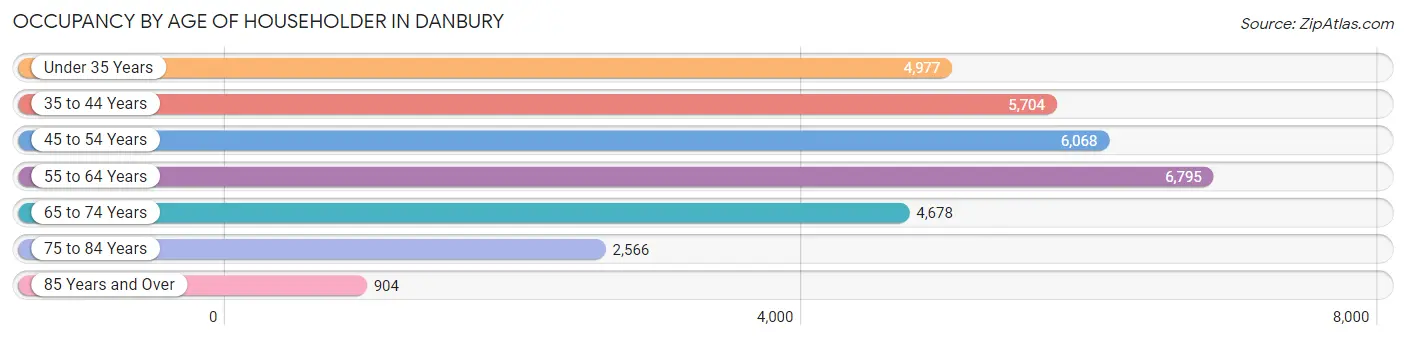
| Age Bracket | # Households | % Households |
| Under 35 Years | 4,977 | 15.7% |
| 35 to 44 Years | 5,704 | 18.0% |
| 45 to 54 Years | 6,068 | 19.2% |
| 55 to 64 Years | 6,795 | 21.4% |
| 65 to 74 Years | 4,678 | 14.8% |
| 75 to 84 Years | 2,566 | 8.1% |
| 85 Years and Over | 904 | 2.9% |
| Total | 31,692 | 100.0% |
Housing Finances in Danbury
Median Income by Occupancy in Danbury
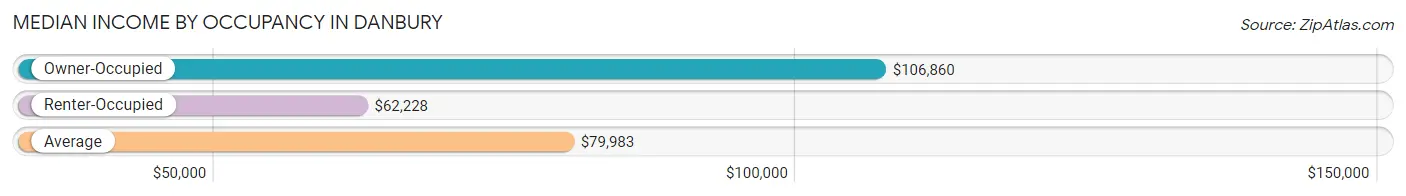
| Occupancy Type | # Households | Median Income |
| Owner-Occupied | 17,722 (55.9%) | $106,860 |
| Renter-Occupied | 13,970 (44.1%) | $62,228 |
| Average | 31,692 (100.0%) | $79,983 |
Occupancy by Householder Income Bracket in Danbury
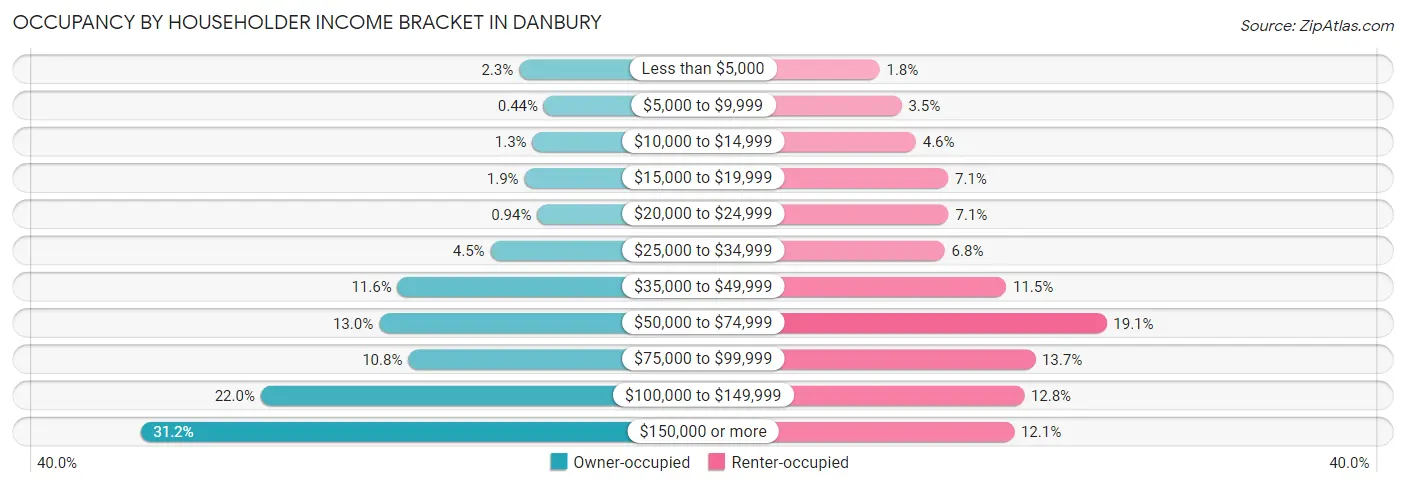
| Income Bracket | Owner-occupied | Renter-occupied |
| Less than $5,000 | 413 (2.3%) | 255 (1.8%) |
| $5,000 to $9,999 | 78 (0.4%) | 489 (3.5%) |
| $10,000 to $14,999 | 232 (1.3%) | 641 (4.6%) |
| $15,000 to $19,999 | 341 (1.9%) | 985 (7.0%) |
| $20,000 to $24,999 | 167 (0.9%) | 991 (7.1%) |
| $25,000 to $34,999 | 799 (4.5%) | 948 (6.8%) |
| $35,000 to $49,999 | 2,054 (11.6%) | 1,603 (11.5%) |
| $50,000 to $74,999 | 2,303 (13.0%) | 2,670 (19.1%) |
| $75,000 to $99,999 | 1,909 (10.8%) | 1,910 (13.7%) |
| $100,000 to $149,999 | 3,901 (22.0%) | 1,792 (12.8%) |
| $150,000 or more | 5,525 (31.2%) | 1,686 (12.1%) |
| Total | 17,722 (100.0%) | 13,970 (100.0%) |
Monthly Housing Cost Tiers in Danbury
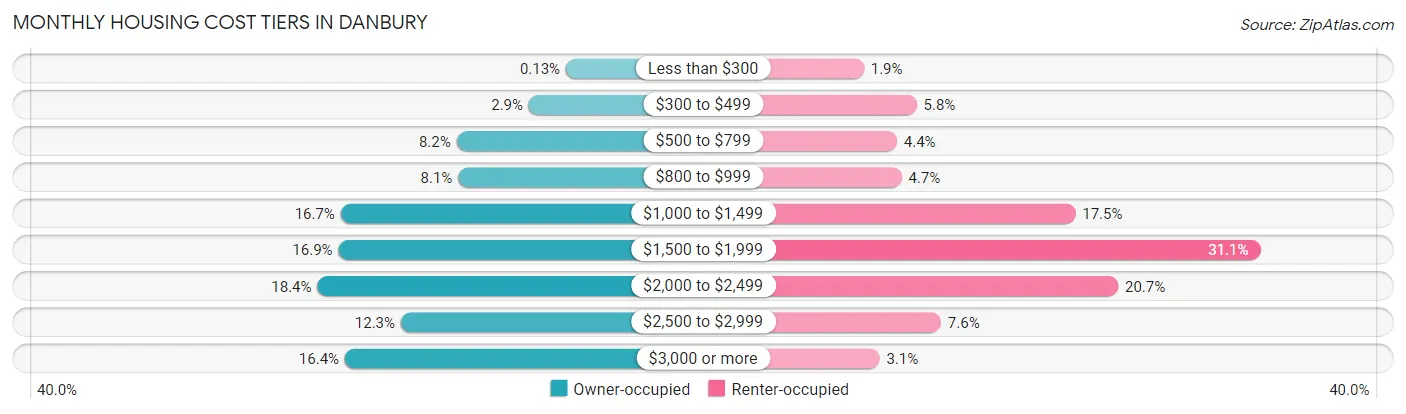
| Monthly Cost | Owner-occupied | Renter-occupied |
| Less than $300 | 23 (0.1%) | 271 (1.9%) |
| $300 to $499 | 507 (2.9%) | 814 (5.8%) |
| $500 to $799 | 1,451 (8.2%) | 612 (4.4%) |
| $800 to $999 | 1,431 (8.1%) | 660 (4.7%) |
| $1,000 to $1,499 | 2,963 (16.7%) | 2,448 (17.5%) |
| $1,500 to $1,999 | 2,993 (16.9%) | 4,350 (31.1%) |
| $2,000 to $2,499 | 3,268 (18.4%) | 2,887 (20.7%) |
| $2,500 to $2,999 | 2,178 (12.3%) | 1,065 (7.6%) |
| $3,000 or more | 2,908 (16.4%) | 433 (3.1%) |
| Total | 17,722 (100.0%) | 13,970 (100.0%) |
Physical Housing Characteristics in Danbury
Housing Structures in Danbury
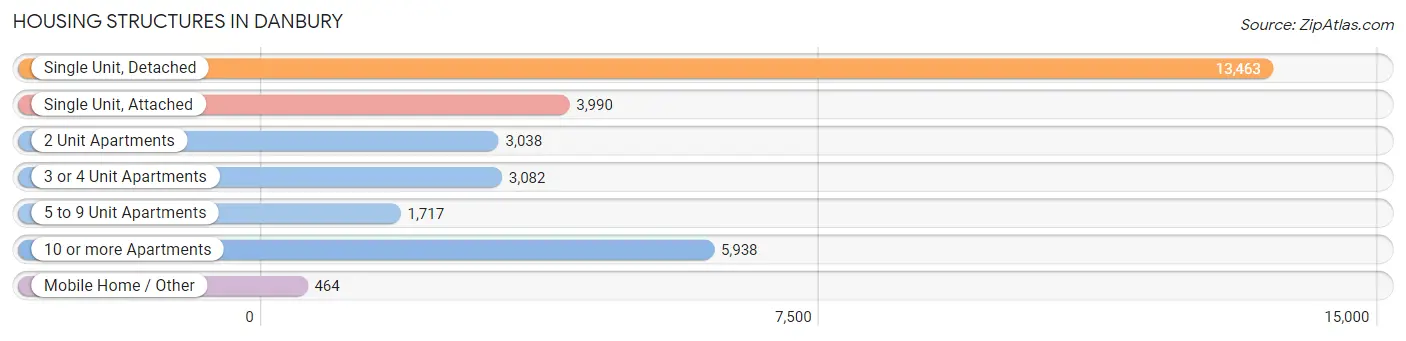
| Structure Type | # Housing Units | % Housing Units |
| Single Unit, Detached | 13,463 | 42.5% |
| Single Unit, Attached | 3,990 | 12.6% |
| 2 Unit Apartments | 3,038 | 9.6% |
| 3 or 4 Unit Apartments | 3,082 | 9.7% |
| 5 to 9 Unit Apartments | 1,717 | 5.4% |
| 10 or more Apartments | 5,938 | 18.7% |
| Mobile Home / Other | 464 | 1.5% |
| Total | 31,692 | 100.0% |
Housing Structures by Occupancy in Danbury
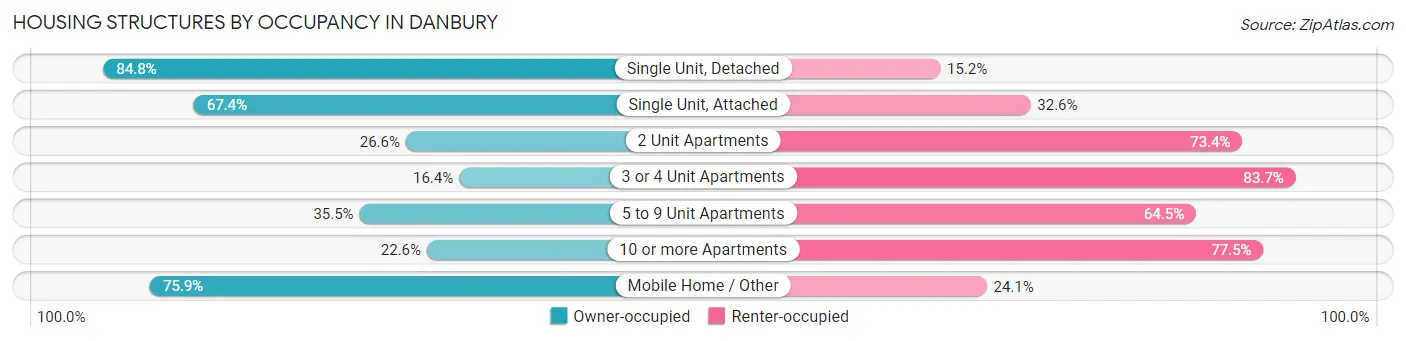
| Structure Type | Owner-occupied | Renter-occupied |
| Single Unit, Detached | 11,419 (84.8%) | 2,044 (15.2%) |
| Single Unit, Attached | 2,690 (67.4%) | 1,300 (32.6%) |
| 2 Unit Apartments | 808 (26.6%) | 2,230 (73.4%) |
| 3 or 4 Unit Apartments | 504 (16.4%) | 2,578 (83.7%) |
| 5 to 9 Unit Apartments | 610 (35.5%) | 1,107 (64.5%) |
| 10 or more Apartments | 1,339 (22.6%) | 4,599 (77.4%) |
| Mobile Home / Other | 352 (75.9%) | 112 (24.1%) |
| Total | 17,722 (55.9%) | 13,970 (44.1%) |
Housing Structures by Number of Rooms in Danbury
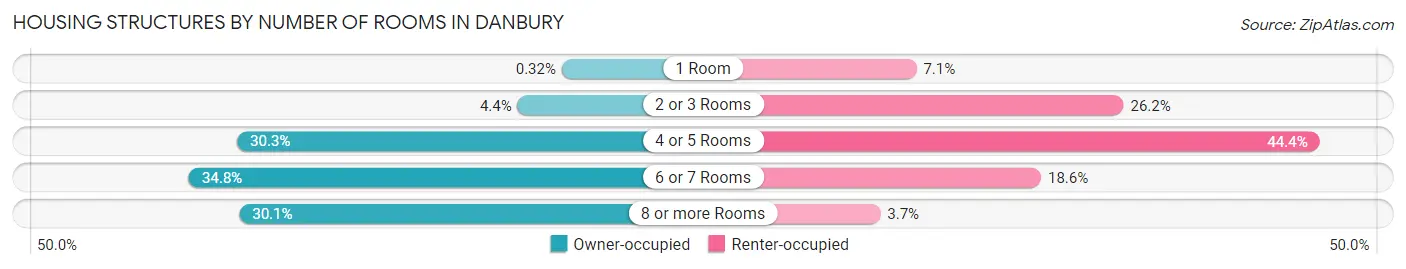
| Number of Rooms | Owner-occupied | Renter-occupied |
| 1 Room | 57 (0.3%) | 989 (7.1%) |
| 2 or 3 Rooms | 781 (4.4%) | 3,664 (26.2%) |
| 4 or 5 Rooms | 5,376 (30.3%) | 6,196 (44.4%) |
| 6 or 7 Rooms | 6,167 (34.8%) | 2,598 (18.6%) |
| 8 or more Rooms | 5,341 (30.1%) | 523 (3.7%) |
| Total | 17,722 (100.0%) | 13,970 (100.0%) |
Housing Structure by Heating Type in Danbury
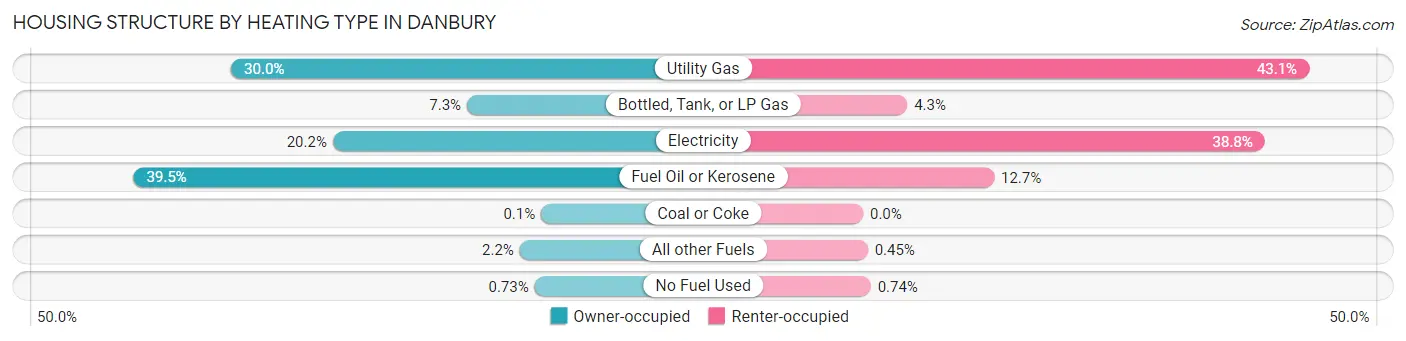
| Heating Type | Owner-occupied | Renter-occupied |
| Utility Gas | 5,323 (30.0%) | 6,018 (43.1%) |
| Bottled, Tank, or LP Gas | 1,287 (7.3%) | 597 (4.3%) |
| Electricity | 3,585 (20.2%) | 5,420 (38.8%) |
| Fuel Oil or Kerosene | 6,996 (39.5%) | 1,768 (12.7%) |
| Coal or Coke | 17 (0.1%) | 0 (0.0%) |
| All other Fuels | 384 (2.2%) | 63 (0.4%) |
| No Fuel Used | 130 (0.7%) | 104 (0.7%) |
| Total | 17,722 (100.0%) | 13,970 (100.0%) |
Household Vehicle Usage in Danbury
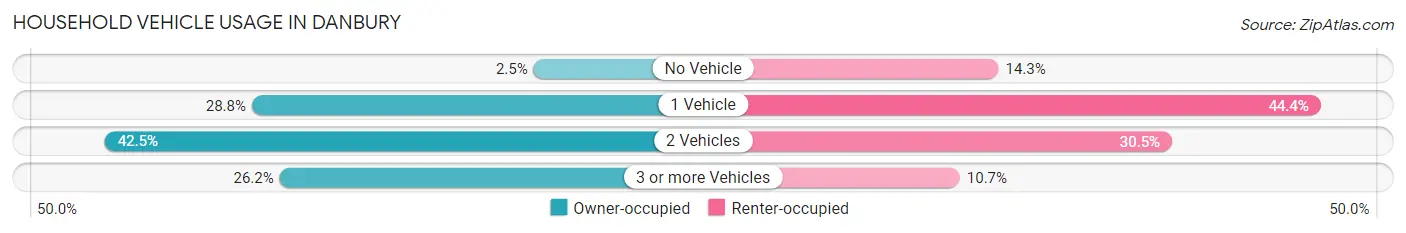
| Vehicles per Household | Owner-occupied | Renter-occupied |
| No Vehicle | 441 (2.5%) | 2,003 (14.3%) |
| 1 Vehicle | 5,102 (28.8%) | 6,204 (44.4%) |
| 2 Vehicles | 7,536 (42.5%) | 4,264 (30.5%) |
| 3 or more Vehicles | 4,643 (26.2%) | 1,499 (10.7%) |
| Total | 17,722 (100.0%) | 13,970 (100.0%) |
Real Estate & Mortgages in Danbury
Real Estate and Mortgage Overview in Danbury
| Characteristic | Without Mortgage | With Mortgage |
| Housing Units | 5,719 | 12,003 |
| Median Property Value | $329,400 | $364,200 |
| Median Household Income | $85,228 | $4,065 |
| Monthly Housing Costs | $936 | $2,835 |
| Real Estate Taxes | $5,019 | $172 |
Property Value by Mortgage Status in Danbury
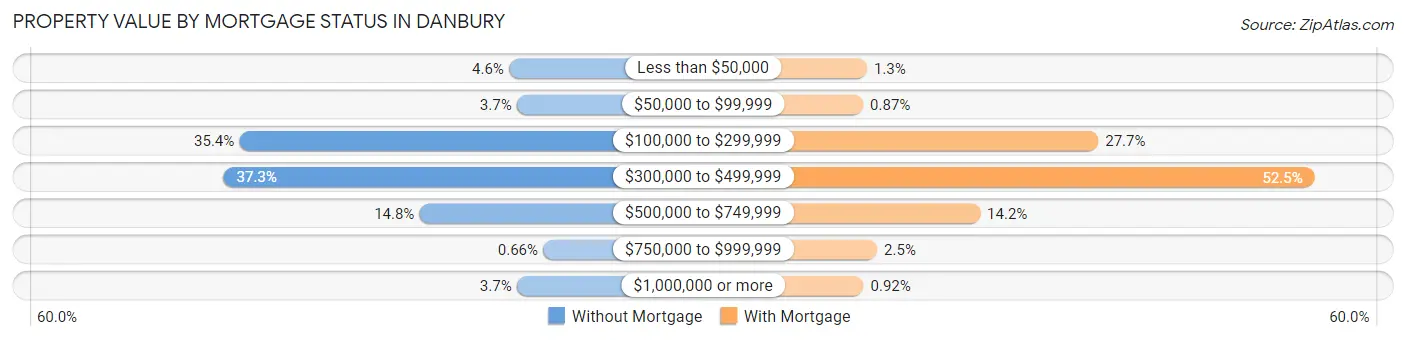
| Property Value | Without Mortgage | With Mortgage |
| Less than $50,000 | 261 (4.6%) | 157 (1.3%) |
| $50,000 to $99,999 | 210 (3.7%) | 105 (0.9%) |
| $100,000 to $299,999 | 2,023 (35.4%) | 3,330 (27.7%) |
| $300,000 to $499,999 | 2,131 (37.3%) | 6,295 (52.4%) |
| $500,000 to $749,999 | 846 (14.8%) | 1,709 (14.2%) |
| $750,000 to $999,999 | 38 (0.7%) | 296 (2.5%) |
| $1,000,000 or more | 210 (3.7%) | 111 (0.9%) |
| Total | 5,719 (100.0%) | 12,003 (100.0%) |
Household Income by Mortgage Status in Danbury
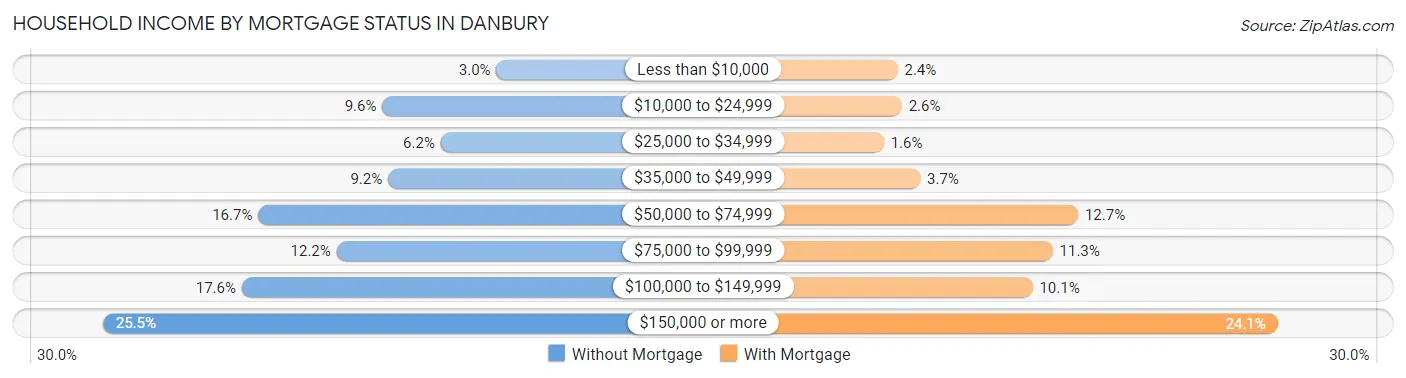
| Household Income | Without Mortgage | With Mortgage |
| Less than $10,000 | 174 (3.0%) | 288 (2.4%) |
| $10,000 to $24,999 | 547 (9.6%) | 317 (2.6%) |
| $25,000 to $34,999 | 356 (6.2%) | 193 (1.6%) |
| $35,000 to $49,999 | 528 (9.2%) | 443 (3.7%) |
| $50,000 to $74,999 | 952 (16.7%) | 1,526 (12.7%) |
| $75,000 to $99,999 | 696 (12.2%) | 1,351 (11.3%) |
| $100,000 to $149,999 | 1,006 (17.6%) | 1,213 (10.1%) |
| $150,000 or more | 1,460 (25.5%) | 2,895 (24.1%) |
| Total | 5,719 (100.0%) | 12,003 (100.0%) |
Property Value to Household Income Ratio in Danbury
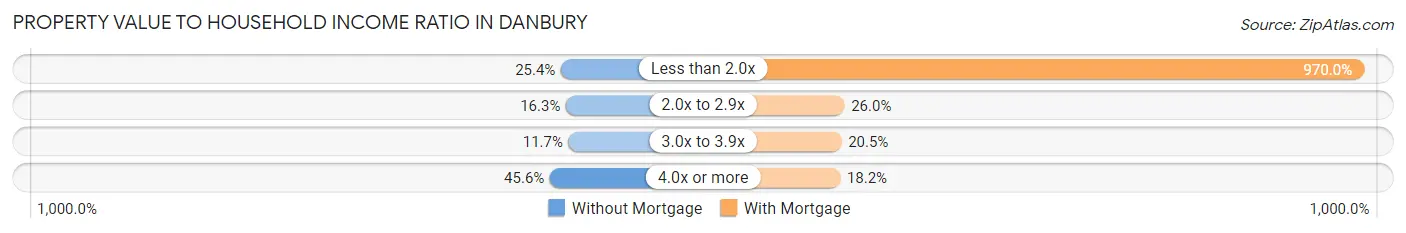
| Value-to-Income Ratio | Without Mortgage | With Mortgage |
| Less than 2.0x | 1,455 (25.4%) | 116,427 (970.0%) |
| 2.0x to 2.9x | 934 (16.3%) | 3,123 (26.0%) |
| 3.0x to 3.9x | 671 (11.7%) | 2,459 (20.5%) |
| 4.0x or more | 2,605 (45.6%) | 2,188 (18.2%) |
| Total | 5,719 (100.0%) | 12,003 (100.0%) |
Real Estate Taxes by Mortgage Status in Danbury
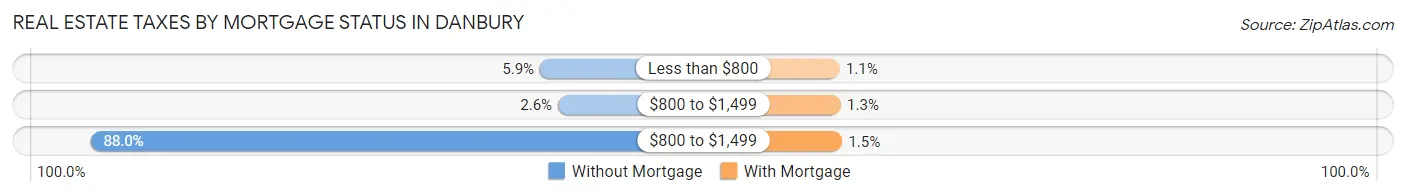
| Property Taxes | Without Mortgage | With Mortgage |
| Less than $800 | 336 (5.9%) | 130 (1.1%) |
| $800 to $1,499 | 148 (2.6%) | 156 (1.3%) |
| $800 to $1,499 | 5,031 (88.0%) | 185 (1.5%) |
| Total | 5,719 (100.0%) | 12,003 (100.0%) |
Health & Disability in Danbury
Health Insurance Coverage by Age in Danbury
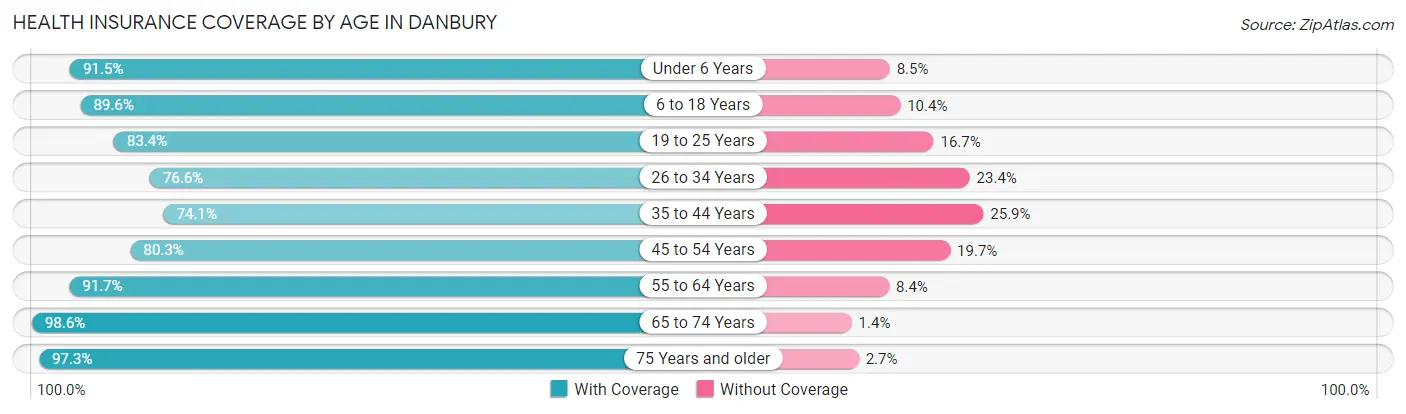
| Age Bracket | With Coverage | Without Coverage |
| Under 6 Years | 5,012 (91.5%) | 464 (8.5%) |
| 6 to 18 Years | 12,318 (89.6%) | 1,435 (10.4%) |
| 19 to 25 Years | 7,721 (83.4%) | 1,542 (16.7%) |
| 26 to 34 Years | 8,011 (76.6%) | 2,445 (23.4%) |
| 35 to 44 Years | 8,288 (74.1%) | 2,901 (25.9%) |
| 45 to 54 Years | 9,039 (80.3%) | 2,223 (19.7%) |
| 55 to 64 Years | 10,359 (91.6%) | 944 (8.4%) |
| 65 to 74 Years | 7,283 (98.6%) | 101 (1.4%) |
| 75 Years and older | 4,889 (97.3%) | 135 (2.7%) |
| Total | 72,920 (85.7%) | 12,190 (14.3%) |
Health Insurance Coverage by Citizenship Status in Danbury
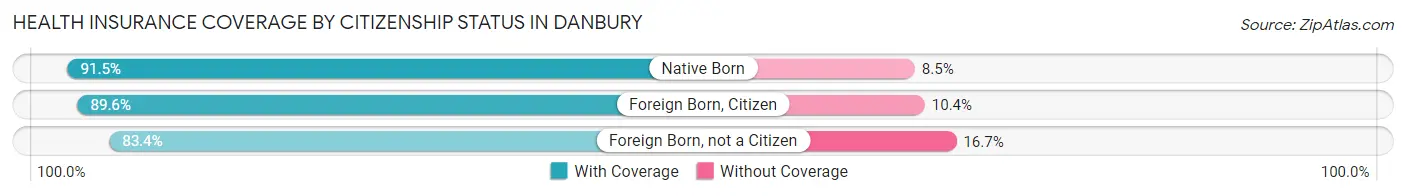
| Citizenship Status | With Coverage | Without Coverage |
| Native Born | 5,012 (91.5%) | 464 (8.5%) |
| Foreign Born, Citizen | 12,318 (89.6%) | 1,435 (10.4%) |
| Foreign Born, not a Citizen | 7,721 (83.4%) | 1,542 (16.7%) |
Health Insurance Coverage by Household Income in Danbury
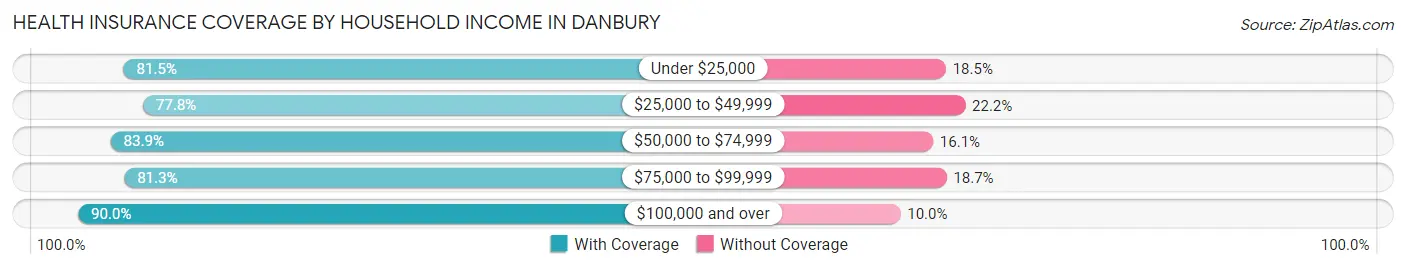
| Household Income | With Coverage | Without Coverage |
| Under $25,000 | 7,094 (81.5%) | 1,615 (18.5%) |
| $25,000 to $49,999 | 8,938 (77.8%) | 2,546 (22.2%) |
| $50,000 to $74,999 | 10,865 (83.9%) | 2,090 (16.1%) |
| $75,000 to $99,999 | 7,598 (81.3%) | 1,744 (18.7%) |
| $100,000 and over | 36,529 (90.0%) | 4,070 (10.0%) |
Public vs Private Health Insurance Coverage by Age in Danbury
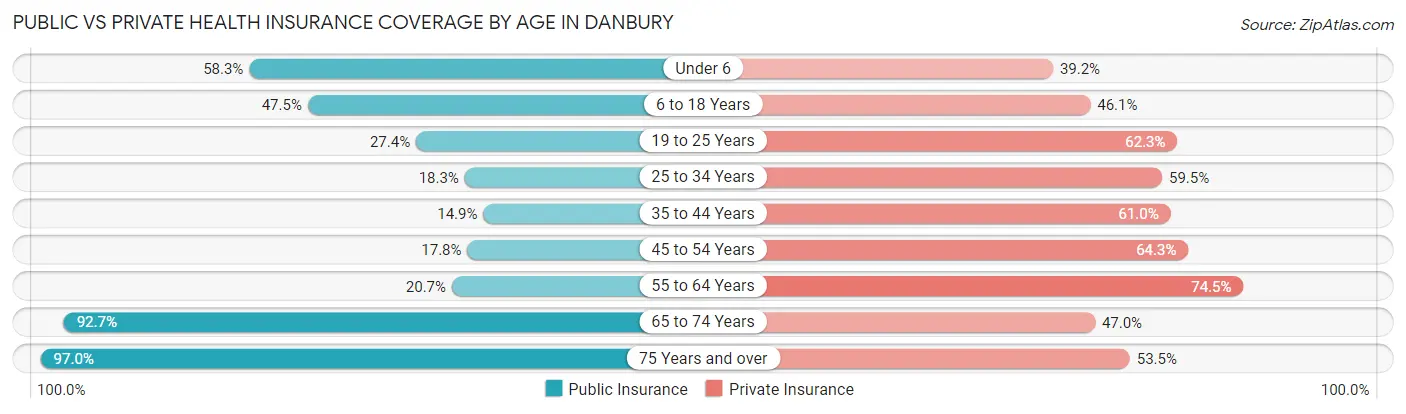
| Age Bracket | Public Insurance | Private Insurance |
| Under 6 | 3,193 (58.3%) | 2,146 (39.2%) |
| 6 to 18 Years | 6,526 (47.4%) | 6,343 (46.1%) |
| 19 to 25 Years | 2,533 (27.4%) | 5,769 (62.3%) |
| 25 to 34 Years | 1,915 (18.3%) | 6,216 (59.5%) |
| 35 to 44 Years | 1,663 (14.9%) | 6,828 (61.0%) |
| 45 to 54 Years | 2,007 (17.8%) | 7,242 (64.3%) |
| 55 to 64 Years | 2,340 (20.7%) | 8,424 (74.5%) |
| 65 to 74 Years | 6,847 (92.7%) | 3,470 (47.0%) |
| 75 Years and over | 4,874 (97.0%) | 2,686 (53.5%) |
| Total | 31,898 (37.5%) | 49,124 (57.7%) |
Disability Status by Sex by Age in Danbury
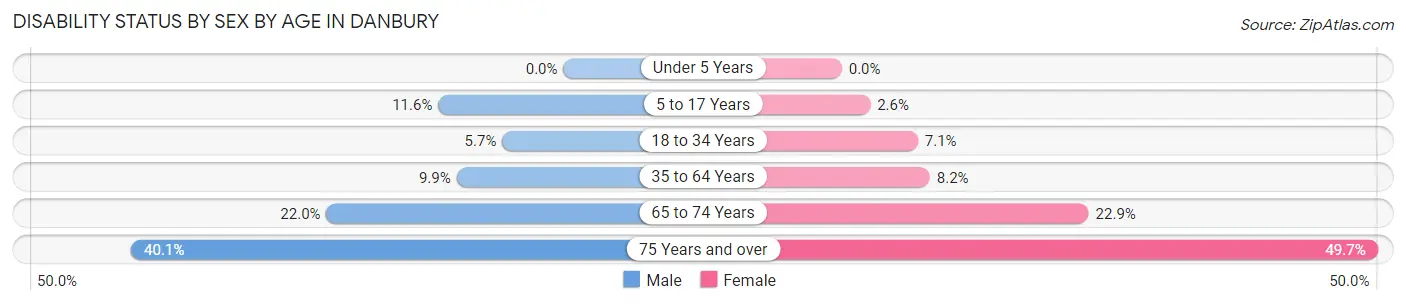
| Age Bracket | Male | Female |
| Under 5 Years | 0 (0.0%) | 0 (0.0%) |
| 5 to 17 Years | 699 (11.6%) | 186 (2.6%) |
| 18 to 34 Years | 620 (5.7%) | 738 (7.1%) |
| 35 to 64 Years | 1,723 (9.9%) | 1,337 (8.2%) |
| 65 to 74 Years | 781 (22.0%) | 878 (22.9%) |
| 75 Years and over | 713 (40.1%) | 1,614 (49.7%) |
Disability Class by Sex by Age in Danbury
Disability Class: Hearing Difficulty
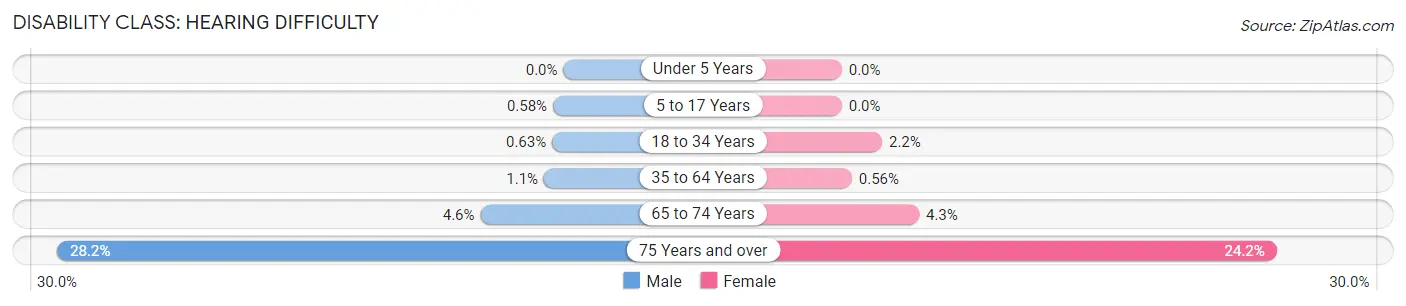
| Age Bracket | Male | Female |
| Under 5 Years | 0 (0.0%) | 0 (0.0%) |
| 5 to 17 Years | 35 (0.6%) | 0 (0.0%) |
| 18 to 34 Years | 69 (0.6%) | 234 (2.2%) |
| 35 to 64 Years | 188 (1.1%) | 92 (0.6%) |
| 65 to 74 Years | 164 (4.6%) | 165 (4.3%) |
| 75 Years and over | 501 (28.2%) | 786 (24.2%) |
Disability Class: Vision Difficulty
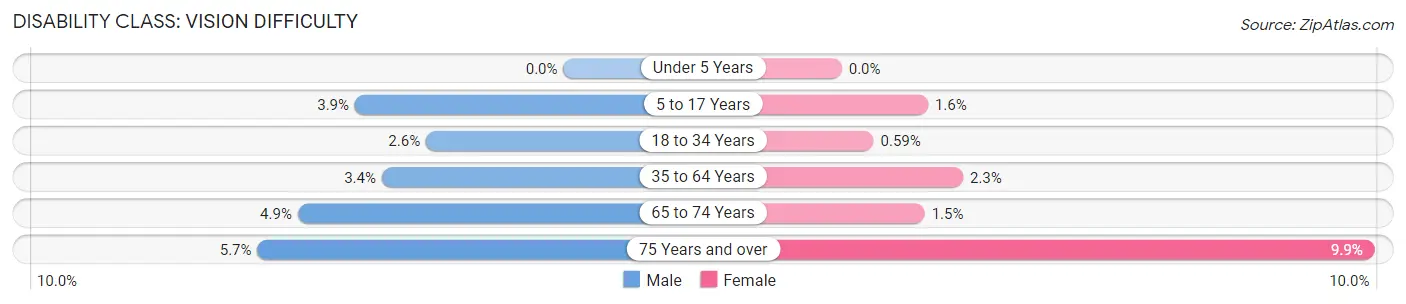
| Age Bracket | Male | Female |
| Under 5 Years | 0 (0.0%) | 0 (0.0%) |
| 5 to 17 Years | 233 (3.9%) | 113 (1.6%) |
| 18 to 34 Years | 279 (2.5%) | 62 (0.6%) |
| 35 to 64 Years | 586 (3.4%) | 369 (2.2%) |
| 65 to 74 Years | 175 (4.9%) | 59 (1.5%) |
| 75 Years and over | 101 (5.7%) | 321 (9.9%) |
Disability Class: Cognitive Difficulty
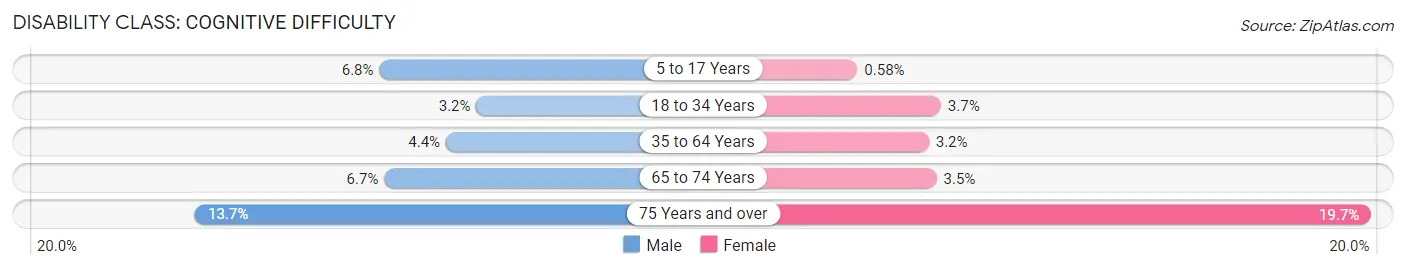
| Age Bracket | Male | Female |
| 5 to 17 Years | 411 (6.8%) | 41 (0.6%) |
| 18 to 34 Years | 353 (3.2%) | 384 (3.7%) |
| 35 to 64 Years | 757 (4.4%) | 529 (3.2%) |
| 65 to 74 Years | 236 (6.7%) | 135 (3.5%) |
| 75 Years and over | 243 (13.7%) | 638 (19.7%) |
Disability Class: Ambulatory Difficulty
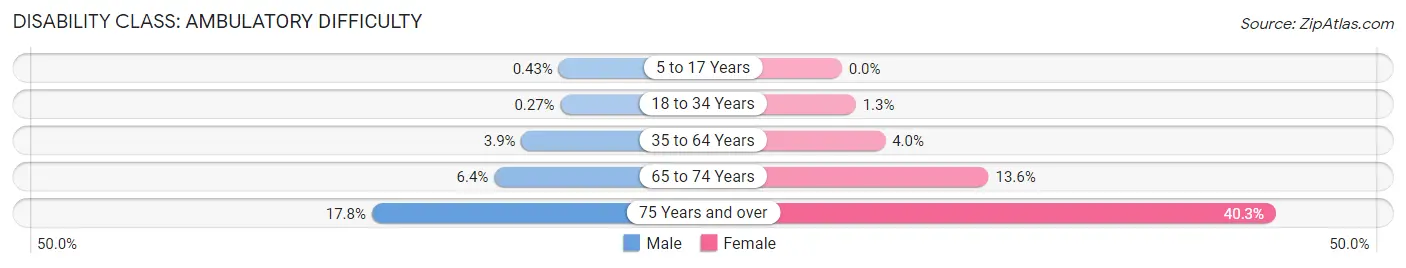
| Age Bracket | Male | Female |
| 5 to 17 Years | 26 (0.4%) | 0 (0.0%) |
| 18 to 34 Years | 29 (0.3%) | 135 (1.3%) |
| 35 to 64 Years | 677 (3.9%) | 659 (4.0%) |
| 65 to 74 Years | 228 (6.4%) | 522 (13.6%) |
| 75 Years and over | 316 (17.8%) | 1,308 (40.3%) |
Disability Class: Self-Care Difficulty
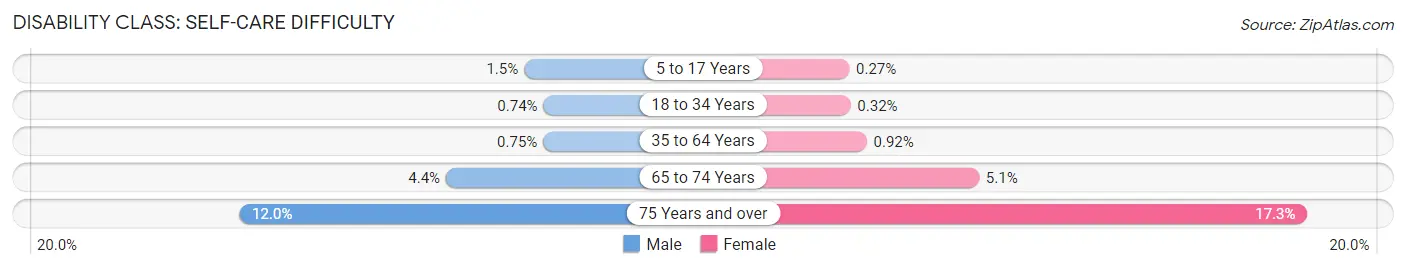
| Age Bracket | Male | Female |
| 5 to 17 Years | 88 (1.5%) | 19 (0.3%) |
| 18 to 34 Years | 81 (0.7%) | 33 (0.3%) |
| 35 to 64 Years | 130 (0.7%) | 150 (0.9%) |
| 65 to 74 Years | 155 (4.4%) | 195 (5.1%) |
| 75 Years and over | 214 (12.0%) | 561 (17.3%) |
Technology Access in Danbury
Computing Device Access in Danbury
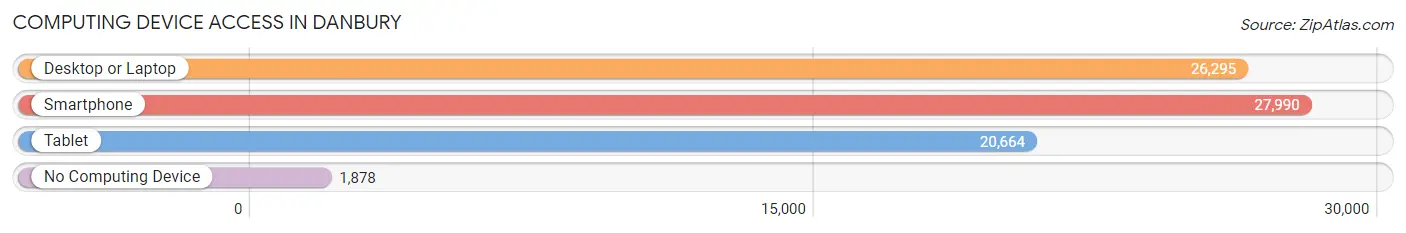
| Device Type | # Households | % Households |
| Desktop or Laptop | 26,295 | 83.0% |
| Smartphone | 27,990 | 88.3% |
| Tablet | 20,664 | 65.2% |
| No Computing Device | 1,878 | 5.9% |
| Total | 31,692 | 100.0% |
Internet Access in Danbury
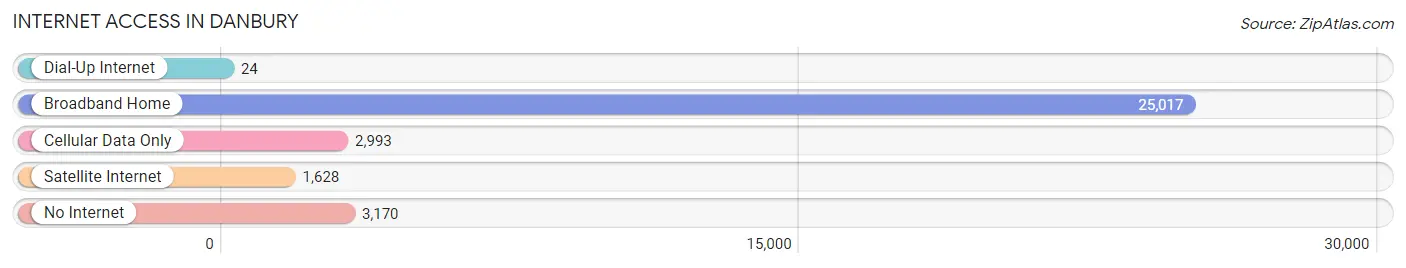
| Internet Type | # Households | % Households |
| Dial-Up Internet | 24 | 0.1% |
| Broadband Home | 25,017 | 78.9% |
| Cellular Data Only | 2,993 | 9.4% |
| Satellite Internet | 1,628 | 5.1% |
| No Internet | 3,170 | 10.0% |
| Total | 31,692 | 100.0% |
Danbury Summary
Danbury, Connecticut is a city located in Fairfield County, Connecticut, United States. It is the seventh-largest city in the state, with a population of 84,657 as of the 2010 census. Danbury is located approximately 70 miles northeast of New York City, making it a popular commuter town for those who work in the city.
History
The area that is now Danbury was first settled by Europeans in 1685, when a group of settlers from the New Haven Colony purchased land from the local Native American tribes. The settlers named the area Pahquioque, which is derived from the Native American word for “open plain.” The area was later renamed Danbury in 1687, after the town of Danbury in Essex, England.
In the late 1700s, Danbury became an important center for the production of hats. The hat industry was so important to the city that it was nicknamed “The Hat City.” The hat industry declined in the early 1900s, but Danbury was able to transition to a more diversified economy.
Geography
Danbury is located in southwestern Connecticut, in Fairfield County. It is situated on the Still River, which flows through the city. The city is bordered by the towns of Bethel, Brookfield, New Fairfield, Newtown, and Ridgefield.
The city has a total area of 28.3 square miles, of which 27.9 square miles is land and 0.4 square miles is water. The terrain is mostly flat, with some hills in the northern and western parts of the city.
Economy
Danbury’s economy is largely based on the service industry, with many residents employed in healthcare, education, retail, and hospitality. The city is also home to several large corporations, including Praxair, Boehringer Ingelheim, and Ethan Allen.
The city is also home to several major shopping centers, including the Danbury Fair Mall, which is the largest shopping mall in Connecticut.
Demographics
As of the 2010 census, Danbury had a population of 84,657. The racial makeup of the city was 79.2% White, 8.2% African American, 0.3% Native American, 4.2% Asian, 0.1% Pacific Islander, 4.7% from other races, and 3.3% from two or more races. Hispanic or Latino of any race were 16.2% of the population.
The median income for a household in the city was $60,837, and the median income for a family was $71,817. The per capita income for the city was $27,837. About 8.2% of families and 10.7% of the population were below the poverty line, including 14.2% of those under age 18 and 8.2% of those age 65 or over.
Danbury is a diverse city, with a variety of cultures and backgrounds represented. The city is home to a large Hispanic population, as well as a growing Asian population. The city also has a large Italian-American population, with many residents tracing their ancestry to the city’s hat-making industry.
Common Questions
What is Per Capita Income in Danbury?
Per Capita income in Danbury is $42,497.
What is the Median Family Income in Danbury?
Median Family Income in Danbury is $96,830.
What is the Median Household income in Danbury?
Median Household Income in Danbury is $79,983.
What is Income or Wage Gap in Danbury?
Income or Wage Gap in Danbury is 24.4%.
Women in Danbury earn 75.6 cents for every dollar earned by a man.
What is Family Income Deficit in Danbury?
Family Income Deficit in Danbury is $11,877.
Families that are below poverty line in Danbury earn $11,877 less on average than the poverty threshold level.
What is Inequality or Gini Index in Danbury?
Inequality or Gini Index in Danbury is 0.47.
What is the Total Population of Danbury?
Total Population of Danbury is 86,456.
What is the Total Male Population of Danbury?
Total Male Population of Danbury is 42,814.
What is the Total Female Population of Danbury?
Total Female Population of Danbury is 43,642.
What is the Ratio of Males per 100 Females in Danbury?
There are 98.10 Males per 100 Females in Danbury.
What is the Ratio of Females per 100 Males in Danbury?
There are 101.93 Females per 100 Males in Danbury.
What is the Median Population Age in Danbury?
Median Population Age in Danbury is 38.6 Years.
What is the Average Family Size in Danbury
Average Family Size in Danbury is 3.2 People.
What is the Average Household Size in Danbury
Average Household Size in Danbury is 2.6 People.
How Large is the Labor Force in Danbury?
There are 49,909 People in the Labor Forcein in Danbury.
What is the Percentage of People in the Labor Force in Danbury?
70.4% of People are in the Labor Force in Danbury.
What is the Unemployment Rate in Danbury?
Unemployment Rate in Danbury is 6.0%.