Portsmouth, NH Map & Demographics
Portsmouth Map
Portsmouth Overview
$67,924
PER CAPITA INCOME
$135,696
AVG FAMILY INCOME
$100,169
AVG HOUSEHOLD INCOME
23.5%
WAGE / INCOME GAP [ % ]
76.5¢/ $1
WAGE / INCOME GAP [ $ ]
0.47
INEQUALITY / GINI INDEX
22,138
TOTAL POPULATION
10,744
MALE POPULATION
11,394
FEMALE POPULATION
94.30
MALES / 100 FEMALES
106.05
FEMALES / 100 MALES
42.1
MEDIAN AGE
2.8
AVG FAMILY SIZE
2.1
AVG HOUSEHOLD SIZE
13,191
LABOR FORCE [ PEOPLE ]
68.6%
PERCENT IN LABOR FORCE
2.5%
UNEMPLOYMENT RATE
Portsmouth Zip Codes
Portsmouth Area Codes
Income in Portsmouth
Income Overview in Portsmouth
Per Capita Income in Portsmouth is $67,924, while median incomes of families and households are $135,696 and $100,169 respectively.
| Characteristic | Number | Measure |
| Per Capita Income | 22,138 | $67,924 |
| Median Family Income | 5,266 | $135,696 |
| Mean Family Income | 5,266 | $178,490 |
| Median Household Income | 10,435 | $100,169 |
| Mean Household Income | 10,435 | $139,653 |
| Income Deficit | 5,266 | $0 |
| Wage / Income Gap (%) | 22,138 | 23.54% |
| Wage / Income Gap ($) | 22,138 | 76.46¢ per $1 |
| Gini / Inequality Index | 22,138 | 0.47 |
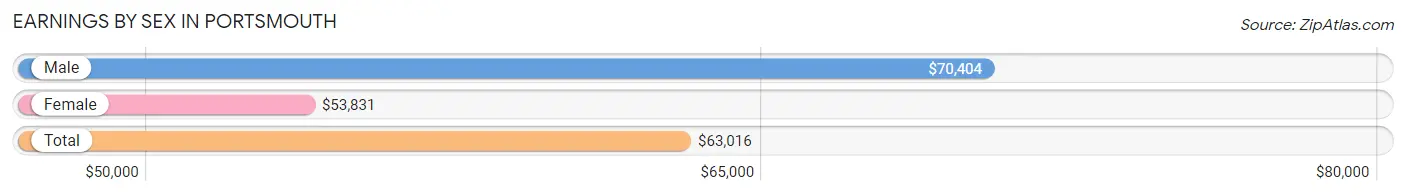
Earnings by Sex in Portsmouth
Average Earnings in Portsmouth are $63,016, $70,404 for men and $53,831 for women, a difference of 23.5%.
| Sex | Number | Average Earnings |
| Male | 7,437 (53.2%) | $70,404 |
| Female | 6,543 (46.8%) | $53,831 |
| Total | 13,980 (100.0%) | $63,016 |
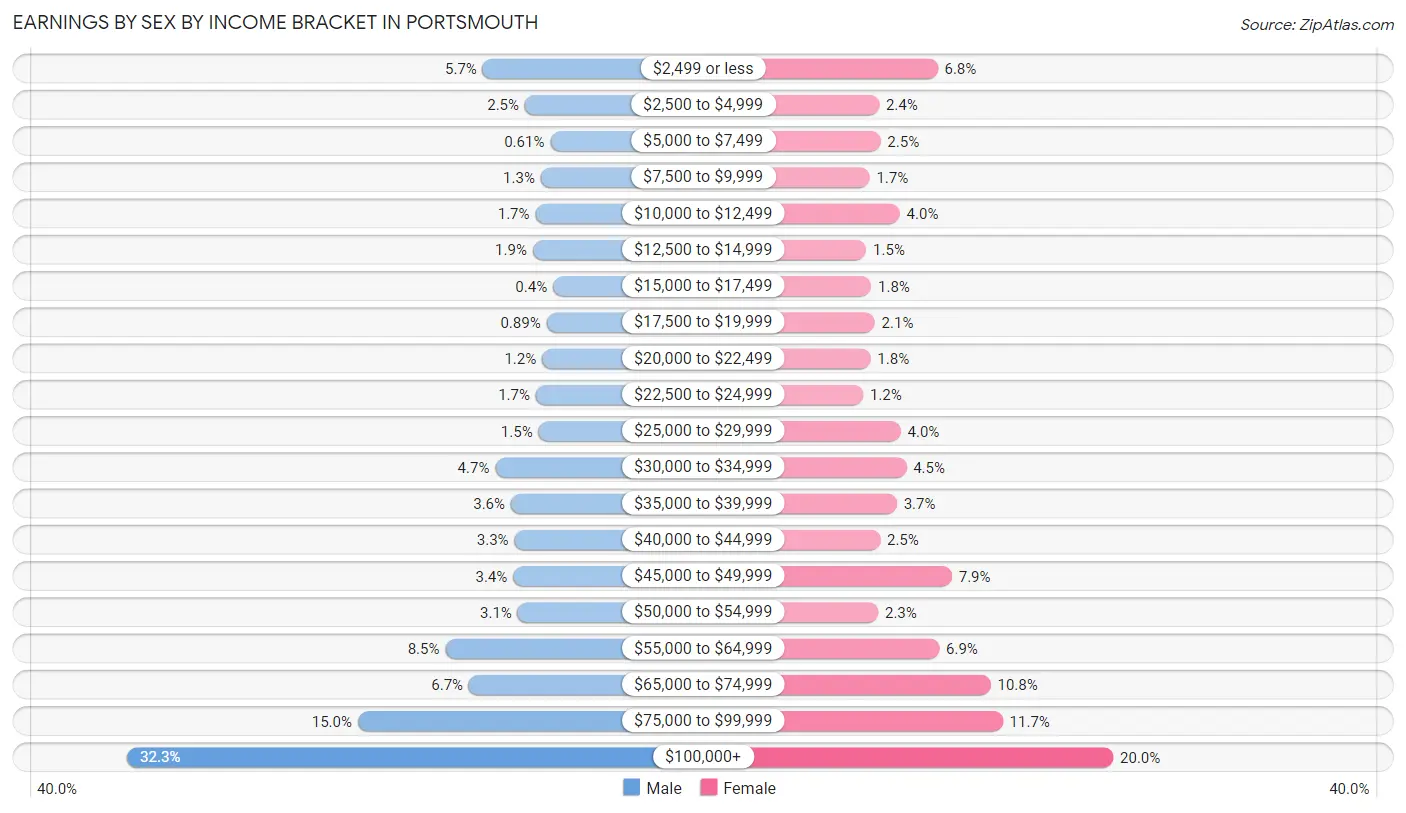
Earnings by Sex by Income Bracket in Portsmouth
The most common earnings brackets in Portsmouth are $100,000+ for men (2,403 | 32.3%) and $100,000+ for women (1,306 | 20.0%).
| Income | Male | Female |
| $2,499 or less | 422 (5.7%) | 445 (6.8%) |
| $2,500 to $4,999 | 187 (2.5%) | 158 (2.4%) |
| $5,000 to $7,499 | 45 (0.6%) | 165 (2.5%) |
| $7,500 to $9,999 | 98 (1.3%) | 111 (1.7%) |
| $10,000 to $12,499 | 128 (1.7%) | 259 (4.0%) |
| $12,500 to $14,999 | 143 (1.9%) | 95 (1.5%) |
| $15,000 to $17,499 | 30 (0.4%) | 119 (1.8%) |
| $17,500 to $19,999 | 66 (0.9%) | 137 (2.1%) |
| $20,000 to $22,499 | 91 (1.2%) | 116 (1.8%) |
| $22,500 to $24,999 | 126 (1.7%) | 79 (1.2%) |
| $25,000 to $29,999 | 111 (1.5%) | 264 (4.0%) |
| $30,000 to $34,999 | 352 (4.7%) | 291 (4.4%) |
| $35,000 to $39,999 | 265 (3.6%) | 245 (3.7%) |
| $40,000 to $44,999 | 245 (3.3%) | 163 (2.5%) |
| $45,000 to $49,999 | 252 (3.4%) | 515 (7.9%) |
| $50,000 to $54,999 | 227 (3.0%) | 153 (2.3%) |
| $55,000 to $64,999 | 630 (8.5%) | 453 (6.9%) |
| $65,000 to $74,999 | 498 (6.7%) | 705 (10.8%) |
| $75,000 to $99,999 | 1,118 (15.0%) | 764 (11.7%) |
| $100,000+ | 2,403 (32.3%) | 1,306 (20.0%) |
| Total | 7,437 (100.0%) | 6,543 (100.0%) |
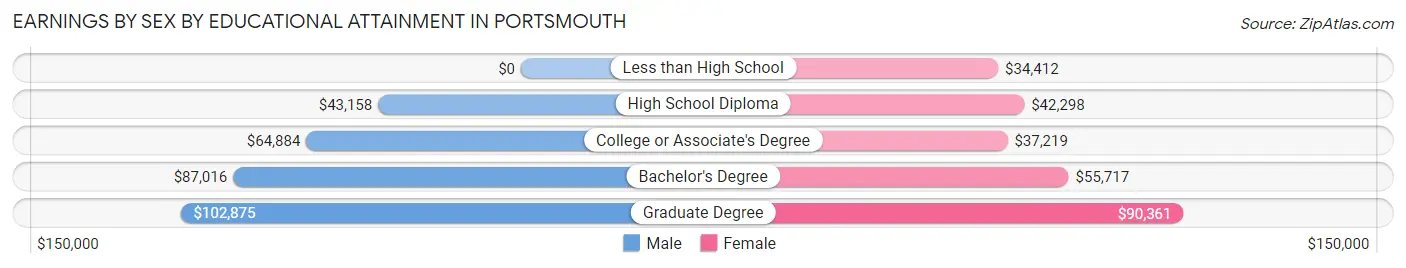
Earnings by Sex by Educational Attainment in Portsmouth
Average earnings in Portsmouth are $83,977 for men and $58,281 for women, a difference of 30.6%. Men with an educational attainment of graduate degree enjoy the highest average annual earnings of $102,875, while those with high school diploma education earn the least with $43,158. Women with an educational attainment of graduate degree earn the most with the average annual earnings of $90,361, while those with less than high school education have the smallest earnings of $34,412.
| Educational Attainment | Male Income | Female Income |
| Less than High School | - | - |
| High School Diploma | $43,158 | $42,298 |
| College or Associate's Degree | $64,884 | $37,219 |
| Bachelor's Degree | $87,016 | $55,717 |
| Graduate Degree | $102,875 | $90,361 |
| Total | $83,977 | $58,281 |
Family Income in Portsmouth
Family Income Brackets in Portsmouth
According to the Portsmouth family income data, there are 1,496 families falling into the $200,000+ income range, which is the most common income bracket and makes up 28.4% of all families. Conversely, the $25,000 to $34,999 income bracket is the least frequent group with only 37 families (0.7%) belonging to this category.
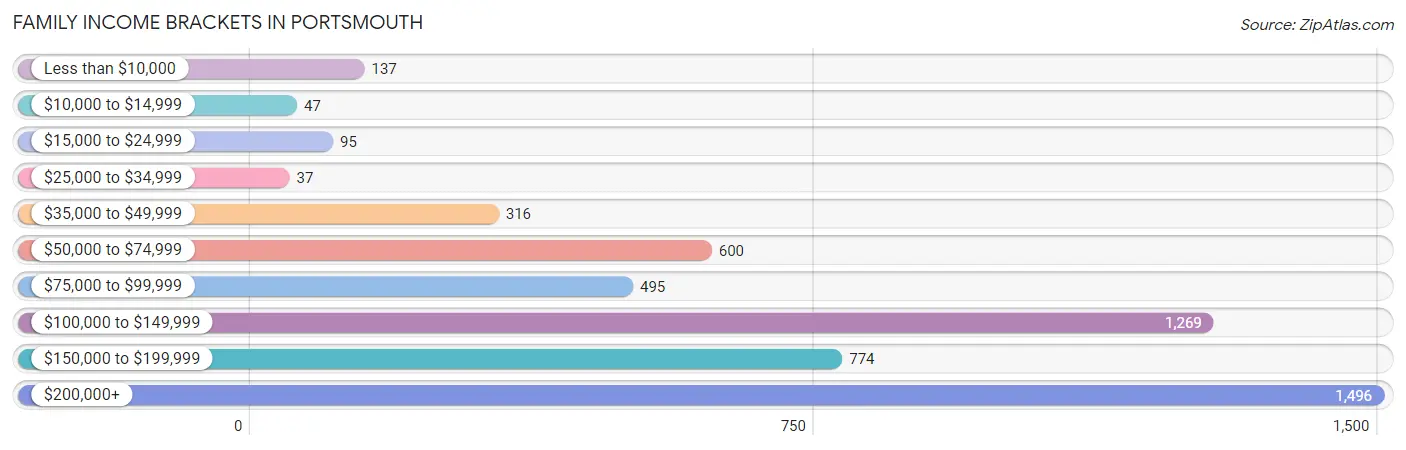
| Income Bracket | # Families | % Families |
| Less than $10,000 | 137 | 2.6% |
| $10,000 to $14,999 | 47 | 0.9% |
| $15,000 to $24,999 | 95 | 1.8% |
| $25,000 to $34,999 | 37 | 0.7% |
| $35,000 to $49,999 | 316 | 6.0% |
| $50,000 to $74,999 | 600 | 11.4% |
| $75,000 to $99,999 | 495 | 9.4% |
| $100,000 to $149,999 | 1,269 | 24.1% |
| $150,000 to $199,999 | 774 | 14.7% |
| $200,000+ | 1,496 | 28.4% |
Family Income by Famaliy Size in Portsmouth
6-person families (54 | 1.0%) account for the highest median family income in Portsmouth with $226,786 per family, while 2-person families (3,255 | 61.8%) have the highest median income of $63,312 per family member.
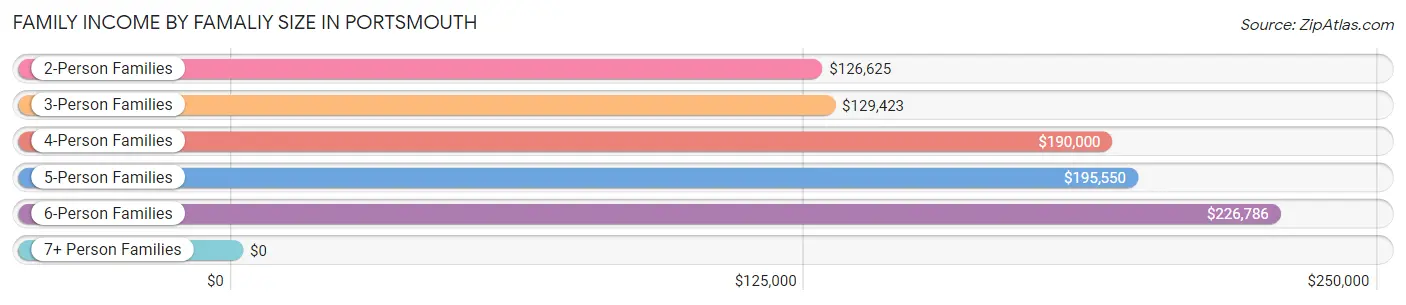
| Income Bracket | # Families | Median Income |
| 2-Person Families | 3,255 (61.8%) | $126,625 |
| 3-Person Families | 1,026 (19.5%) | $129,423 |
| 4-Person Families | 672 (12.8%) | $190,000 |
| 5-Person Families | 255 (4.8%) | $195,550 |
| 6-Person Families | 54 (1.0%) | $226,786 |
| 7+ Person Families | 4 (0.1%) | $0 |
| Total | 5,266 (100.0%) | $135,696 |
Family Income by Number of Earners in Portsmouth
The median family income in Portsmouth is $135,696, with families comprising 2 earners (2,488) having the highest median family income of $159,695, while families with no earners (694) have the lowest median family income of $68,696, accounting for 47.2% and 13.2% of families, respectively.
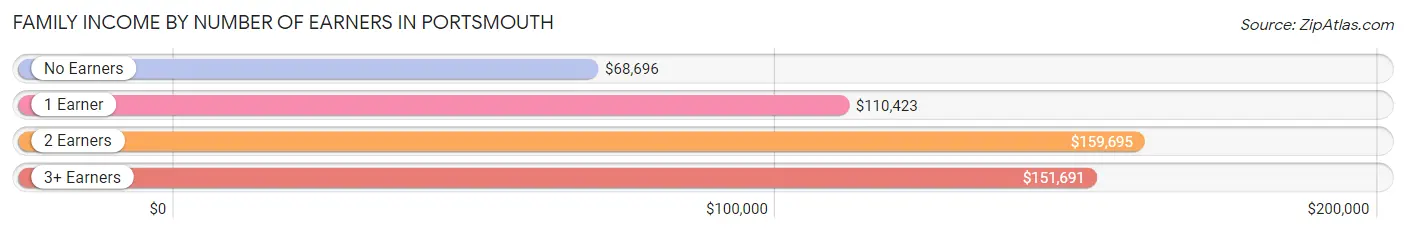
| Number of Earners | # Families | Median Income |
| No Earners | 694 (13.2%) | $68,696 |
| 1 Earner | 1,605 (30.5%) | $110,423 |
| 2 Earners | 2,488 (47.2%) | $159,695 |
| 3+ Earners | 479 (9.1%) | $151,691 |
| Total | 5,266 (100.0%) | $135,696 |
Household Income in Portsmouth
Household Income Brackets in Portsmouth
With 2,170 households falling in the category, the $100,000 to $149,999 income range is the most frequent in Portsmouth, accounting for 20.8% of all households. In contrast, only 271 households (2.6%) fall into the $10,000 to $14,999 income bracket, making it the least populous group.
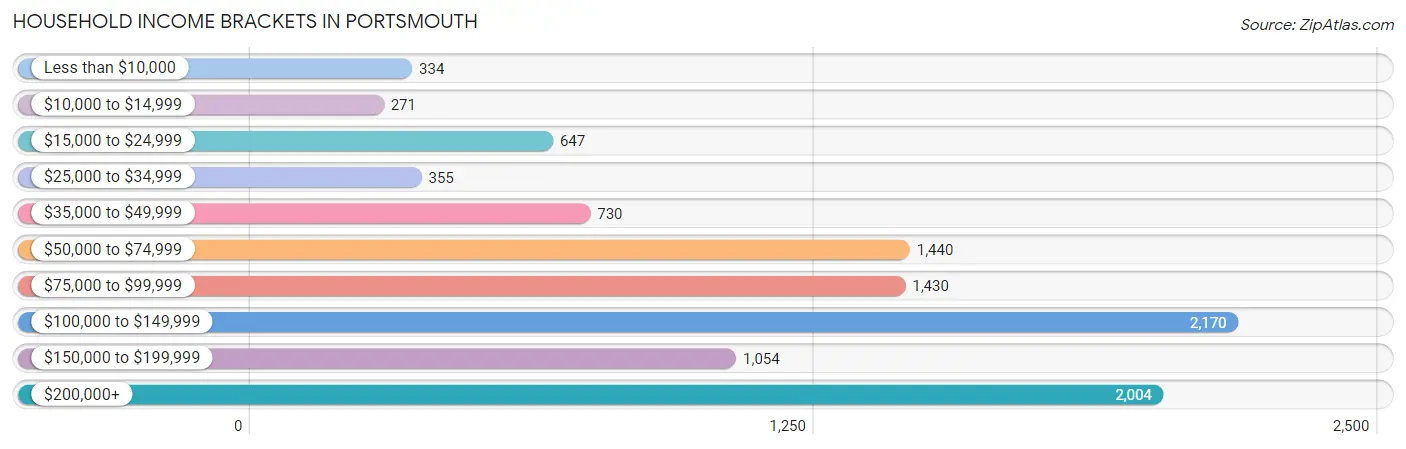
| Income Bracket | # Households | % Households |
| Less than $10,000 | 334 | 3.2% |
| $10,000 to $14,999 | 271 | 2.6% |
| $15,000 to $24,999 | 647 | 6.2% |
| $25,000 to $34,999 | 355 | 3.4% |
| $35,000 to $49,999 | 730 | 7.0% |
| $50,000 to $74,999 | 1,440 | 13.8% |
| $75,000 to $99,999 | 1,430 | 13.7% |
| $100,000 to $149,999 | 2,170 | 20.8% |
| $150,000 to $199,999 | 1,054 | 10.1% |
| $200,000+ | 2,004 | 19.2% |
Household Income by Householder Age in Portsmouth
The median household income in Portsmouth is $100,169, with the highest median household income of $122,315 found in the 45 to 64 years age bracket for the primary householder. A total of 3,550 households (34.0%) fall into this category. Meanwhile, the 65+ years age bracket for the primary householder has the lowest median household income of $68,145, with 2,657 households (25.5%) in this group.
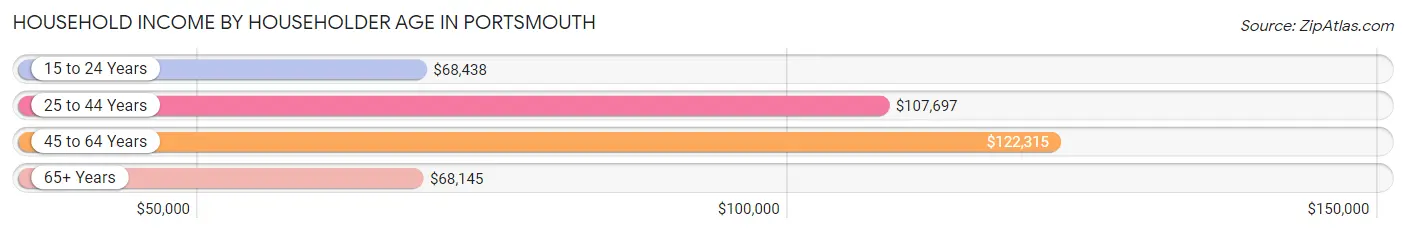
| Income Bracket | # Households | Median Income |
| 15 to 24 Years | 461 (4.4%) | $68,438 |
| 25 to 44 Years | 3,767 (36.1%) | $107,697 |
| 45 to 64 Years | 3,550 (34.0%) | $122,315 |
| 65+ Years | 2,657 (25.5%) | $68,145 |
| Total | 10,435 (100.0%) | $100,169 |
Poverty in Portsmouth
Income Below Poverty by Sex and Age in Portsmouth
With 4.4% poverty level for males and 7.5% for females among the residents of Portsmouth, under 5 year old males and 16 and 17 year old females are the most vulnerable to poverty, with 83 males (18.5%) and 35 females (20.8%) in their respective age groups living below the poverty level.
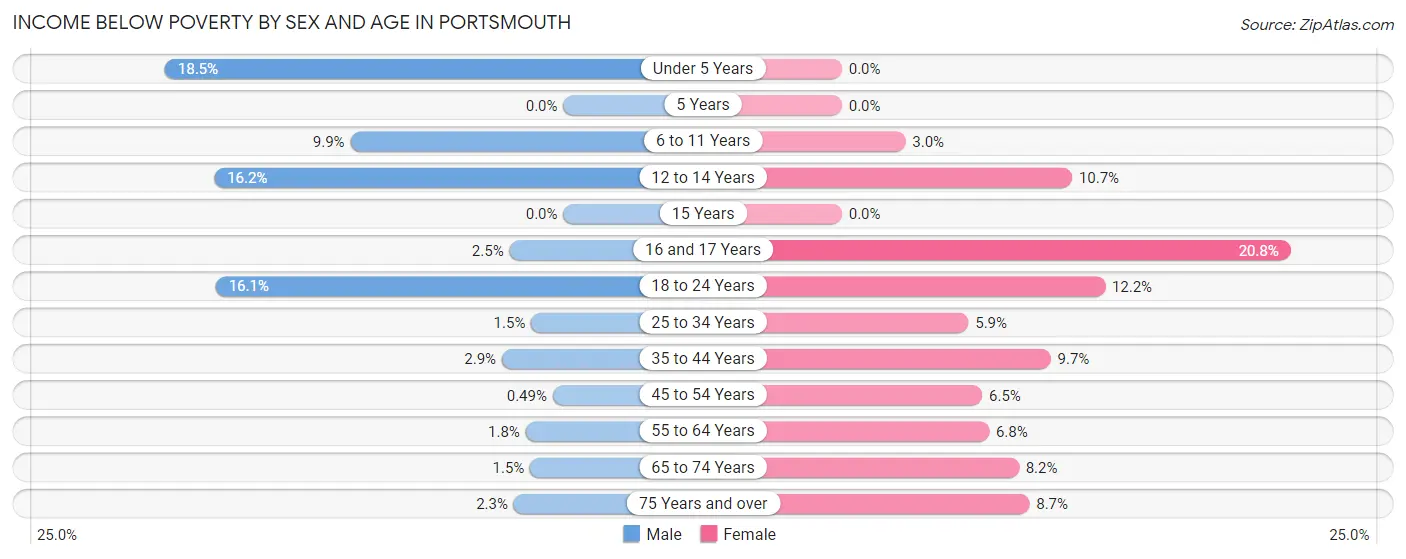
| Age Bracket | Male | Female |
| Under 5 Years | 83 (18.5%) | 0 (0.0%) |
| 5 Years | 0 (0.0%) | 0 (0.0%) |
| 6 to 11 Years | 57 (9.9%) | 17 (2.9%) |
| 12 to 14 Years | 29 (16.2%) | 33 (10.7%) |
| 15 Years | 0 (0.0%) | 0 (0.0%) |
| 16 and 17 Years | 6 (2.5%) | 35 (20.8%) |
| 18 to 24 Years | 160 (16.1%) | 89 (12.2%) |
| 25 to 34 Years | 25 (1.5%) | 118 (5.9%) |
| 35 to 44 Years | 43 (2.9%) | 139 (9.7%) |
| 45 to 54 Years | 7 (0.5%) | 85 (6.5%) |
| 55 to 64 Years | 28 (1.8%) | 110 (6.8%) |
| 65 to 74 Years | 17 (1.5%) | 107 (8.2%) |
| 75 Years and over | 17 (2.3%) | 90 (8.7%) |
| Total | 472 (4.4%) | 823 (7.5%) |
Income Above Poverty by Sex and Age in Portsmouth
According to the poverty statistics in Portsmouth, males aged 5 years and females aged under 5 years are the age groups that are most secure financially, with 100.0% of males and 100.0% of females in these age groups living above the poverty line.
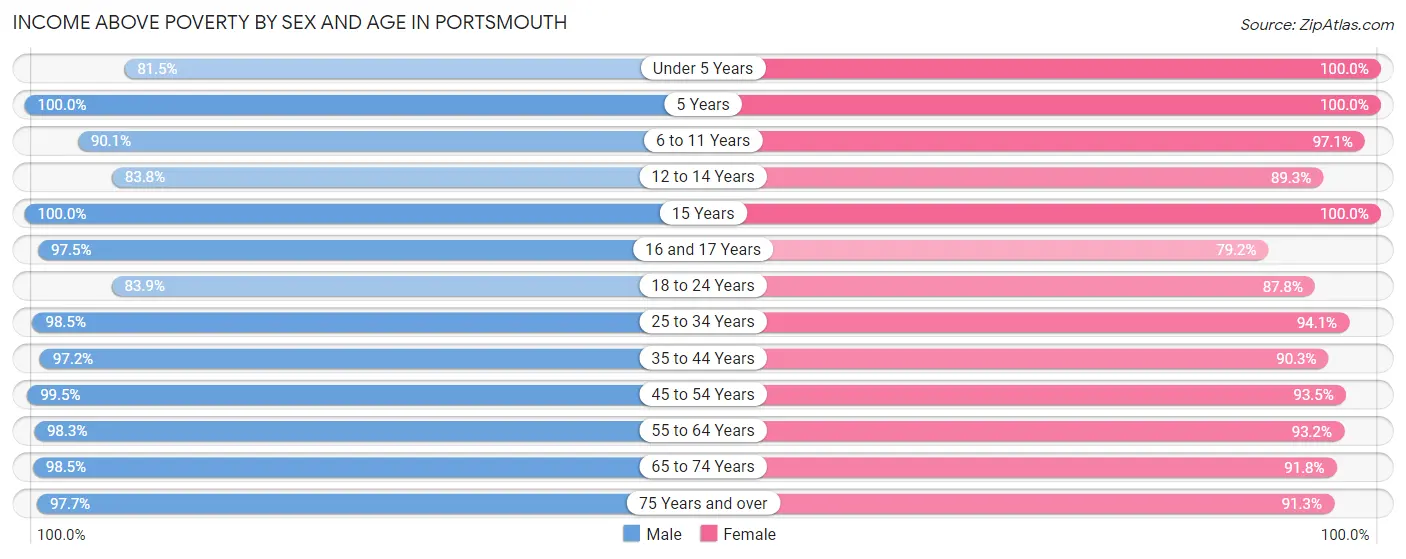
| Age Bracket | Male | Female |
| Under 5 Years | 366 (81.5%) | 454 (100.0%) |
| 5 Years | 64 (100.0%) | 28 (100.0%) |
| 6 to 11 Years | 520 (90.1%) | 559 (97.1%) |
| 12 to 14 Years | 150 (83.8%) | 276 (89.3%) |
| 15 Years | 117 (100.0%) | 41 (100.0%) |
| 16 and 17 Years | 234 (97.5%) | 133 (79.2%) |
| 18 to 24 Years | 832 (83.9%) | 640 (87.8%) |
| 25 to 34 Years | 1,652 (98.5%) | 1,891 (94.1%) |
| 35 to 44 Years | 1,468 (97.2%) | 1,295 (90.3%) |
| 45 to 54 Years | 1,429 (99.5%) | 1,221 (93.5%) |
| 55 to 64 Years | 1,575 (98.3%) | 1,501 (93.2%) |
| 65 to 74 Years | 1,085 (98.5%) | 1,197 (91.8%) |
| 75 Years and over | 722 (97.7%) | 944 (91.3%) |
| Total | 10,214 (95.6%) | 10,180 (92.5%) |
Income Below Poverty Among Married-Couple Families in Portsmouth
The poverty statistics for married-couple families in Portsmouth show that 0.1% or 5 of the total 4,158 families live below the poverty line. Families with 1 or 2 children have the highest poverty rate of 0.5%, comprising of 5 families. On the other hand, families with no children have the lowest poverty rate of 0.0%, which includes 0 families.
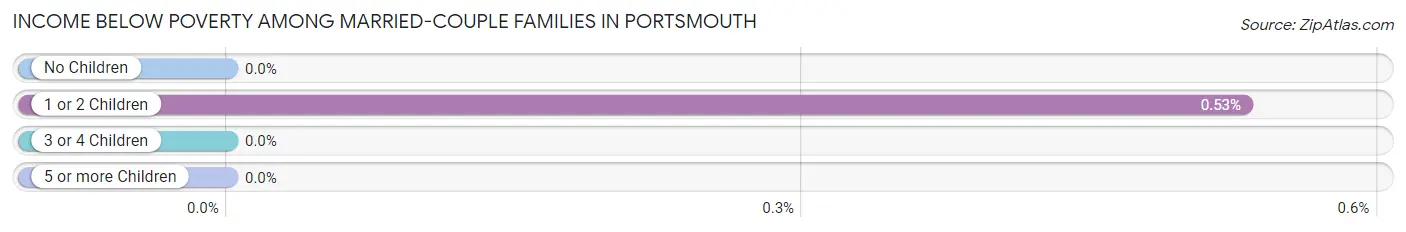
| Children | Above Poverty | Below Poverty |
| No Children | 2,943 (100.0%) | 0 (0.0%) |
| 1 or 2 Children | 930 (99.5%) | 5 (0.5%) |
| 3 or 4 Children | 280 (100.0%) | 0 (0.0%) |
| 5 or more Children | 0 (0.0%) | 0 (0.0%) |
| Total | 4,153 (99.9%) | 5 (0.1%) |
Income Below Poverty Among Single-Parent Households in Portsmouth
According to the poverty data in Portsmouth, 9.1% or 25 single-father households and 19.8% or 165 single-mother households are living below the poverty line. Among single-father households, those with 1 or 2 children have the highest poverty rate, with 25 households (25.3%) experiencing poverty. Likewise, among single-mother households, those with 1 or 2 children have the highest poverty rate, with 156 households (35.9%) falling below the poverty line.
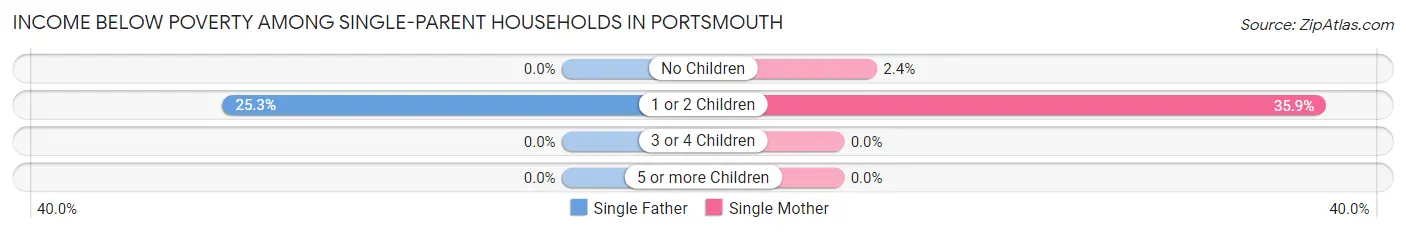
| Children | Single Father | Single Mother |
| No Children | 0 (0.0%) | 9 (2.4%) |
| 1 or 2 Children | 25 (25.3%) | 156 (35.9%) |
| 3 or 4 Children | 0 (0.0%) | 0 (0.0%) |
| 5 or more Children | 0 (0.0%) | 0 (0.0%) |
| Total | 25 (9.1%) | 165 (19.8%) |
Income Below Poverty Among Married-Couple vs Single-Parent Households in Portsmouth
The poverty data for Portsmouth shows that 5 of the married-couple family households (0.1%) and 190 of the single-parent households (17.2%) are living below the poverty level. Within the married-couple family households, those with 1 or 2 children have the highest poverty rate, with 5 households (0.5%) falling below the poverty line. Among the single-parent households, those with 1 or 2 children have the highest poverty rate, with 181 household (34.0%) living below poverty.
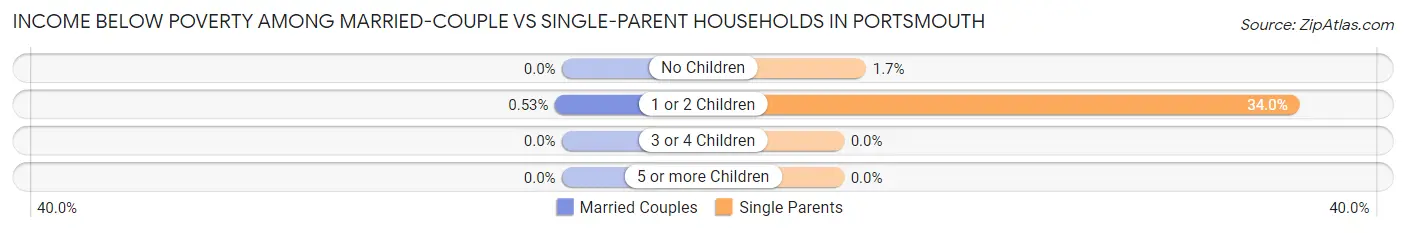
| Children | Married-Couple Families | Single-Parent Households |
| No Children | 0 (0.0%) | 9 (1.7%) |
| 1 or 2 Children | 5 (0.5%) | 181 (34.0%) |
| 3 or 4 Children | 0 (0.0%) | 0 (0.0%) |
| 5 or more Children | 0 (0.0%) | 0 (0.0%) |
| Total | 5 (0.1%) | 190 (17.2%) |
Race in Portsmouth
The most populous races in Portsmouth are White / Caucasian (19,540 | 88.3%), Asian (939 | 4.2%), and Two or more Races (906 | 4.1%).
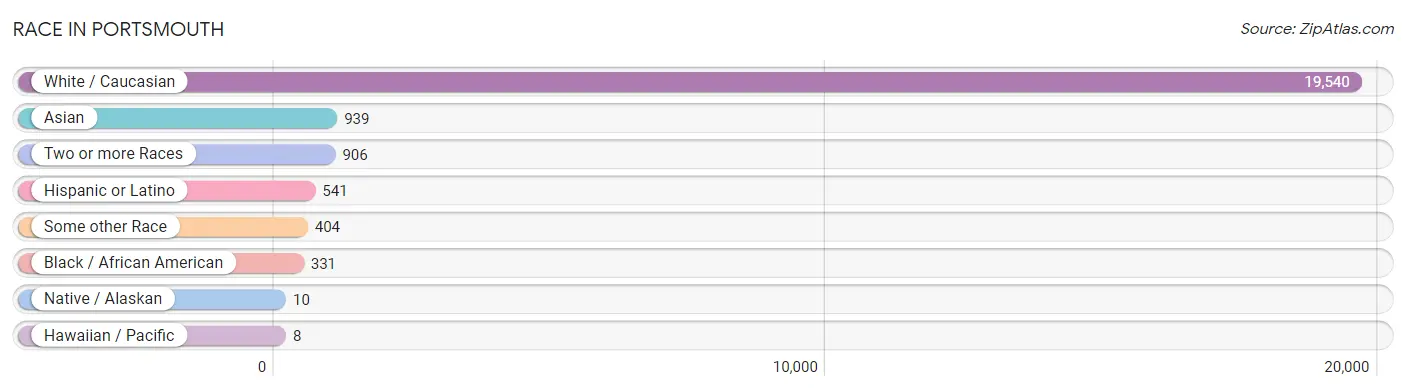
| Race | # Population | % Population |
| Asian | 939 | 4.2% |
| Black / African American | 331 | 1.5% |
| Hawaiian / Pacific | 8 | 0.0% |
| Hispanic or Latino | 541 | 2.4% |
| Native / Alaskan | 10 | 0.1% |
| White / Caucasian | 19,540 | 88.3% |
| Two or more Races | 906 | 4.1% |
| Some other Race | 404 | 1.8% |
| Total | 22,138 | 100.0% |
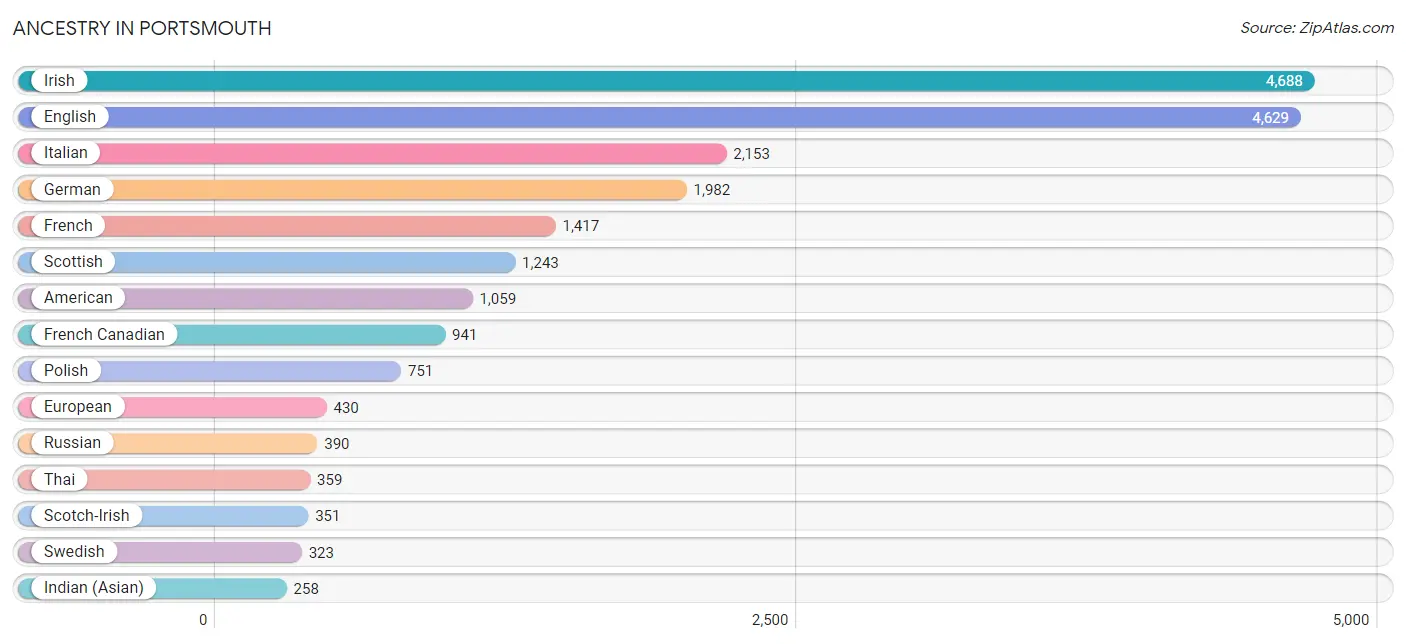
Ancestry in Portsmouth
The most populous ancestries reported in Portsmouth are Irish (4,688 | 21.2%), English (4,629 | 20.9%), Italian (2,153 | 9.7%), German (1,982 | 8.9%), and French (1,417 | 6.4%), together accounting for 67.2% of all Portsmouth residents.
| Ancestry | # Population | % Population |
| Albanian | 60 | 0.3% |
| American | 1,059 | 4.8% |
| Arab | 166 | 0.7% |
| Argentinean | 14 | 0.1% |
| Armenian | 25 | 0.1% |
| Australian | 41 | 0.2% |
| Austrian | 65 | 0.3% |
| Belgian | 58 | 0.3% |
| Bhutanese | 7 | 0.0% |
| Brazilian | 17 | 0.1% |
| British | 238 | 1.1% |
| Bulgarian | 15 | 0.1% |
| Burmese | 235 | 1.1% |
| Cajun | 11 | 0.1% |
| Canadian | 131 | 0.6% |
| Cape Verdean | 10 | 0.1% |
| Central American | 23 | 0.1% |
| Cherokee | 11 | 0.1% |
| Chilean | 14 | 0.1% |
| Colombian | 34 | 0.2% |
| Croatian | 30 | 0.1% |
| Czech | 17 | 0.1% |
| Danish | 100 | 0.4% |
| Dominican | 111 | 0.5% |
| Dutch | 210 | 0.9% |
| Eastern European | 113 | 0.5% |
| English | 4,629 | 20.9% |
| Estonian | 20 | 0.1% |
| European | 430 | 1.9% |
| Finnish | 97 | 0.4% |
| French | 1,417 | 6.4% |
| French Canadian | 941 | 4.3% |
| German | 1,982 | 8.9% |
| German Russian | 17 | 0.1% |
| Ghanaian | 12 | 0.1% |
| Greek | 170 | 0.8% |
| Guamanian / Chamorro | 4 | 0.0% |
| Guatemalan | 23 | 0.1% |
| Haitian | 3 | 0.0% |
| Hungarian | 33 | 0.2% |
| Indian (Asian) | 258 | 1.2% |
| Iraqi | 29 | 0.1% |
| Irish | 4,688 | 21.2% |
| Israeli | 17 | 0.1% |
| Italian | 2,153 | 9.7% |
| Jamaican | 2 | 0.0% |
| Korean | 149 | 0.7% |
| Latvian | 17 | 0.1% |
| Lebanese | 21 | 0.1% |
| Lithuanian | 203 | 0.9% |
| Malaysian | 62 | 0.3% |
| Mexican | 70 | 0.3% |
| Native Hawaiian | 37 | 0.2% |
| Nigerian | 8 | 0.0% |
| Northern European | 94 | 0.4% |
| Norwegian | 211 | 0.9% |
| Palestinian | 8 | 0.0% |
| Peruvian | 5 | 0.0% |
| Polish | 751 | 3.4% |
| Portuguese | 73 | 0.3% |
| Puerto Rican | 162 | 0.7% |
| Romanian | 48 | 0.2% |
| Russian | 390 | 1.8% |
| Scandinavian | 49 | 0.2% |
| Scotch-Irish | 351 | 1.6% |
| Scottish | 1,243 | 5.6% |
| Serbian | 62 | 0.3% |
| Slavic | 12 | 0.1% |
| Slovak | 27 | 0.1% |
| Slovene | 9 | 0.0% |
| South African | 3 | 0.0% |
| South American | 67 | 0.3% |
| Spaniard | 57 | 0.3% |
| Spanish | 33 | 0.2% |
| Sri Lankan | 27 | 0.1% |
| Subsaharan African | 33 | 0.2% |
| Swedish | 323 | 1.5% |
| Swiss | 80 | 0.4% |
| Syrian | 108 | 0.5% |
| Thai | 359 | 1.6% |
| Turkish | 29 | 0.1% |
| Ukrainian | 183 | 0.8% |
| Welsh | 187 | 0.8% |
| West Indian | 6 | 0.0% | View All 84 Rows |
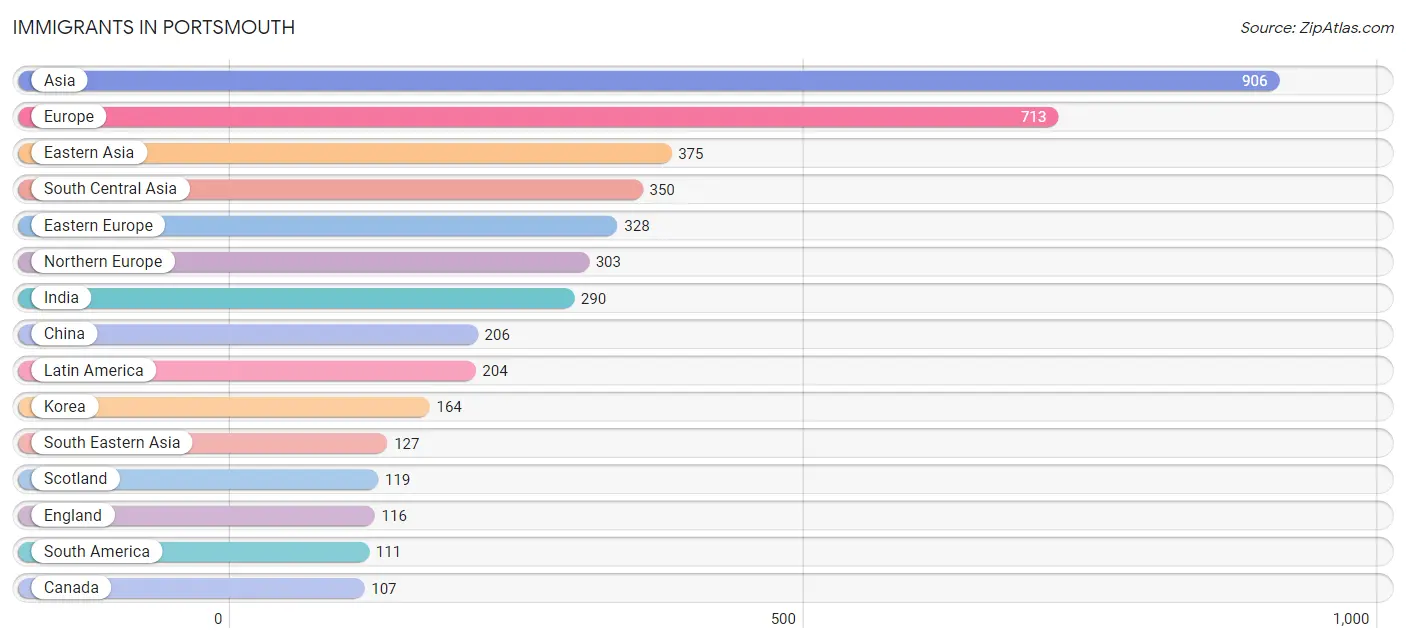
Immigrants in Portsmouth
The most numerous immigrant groups reported in Portsmouth came from Asia (906 | 4.1%), Europe (713 | 3.2%), Eastern Asia (375 | 1.7%), South Central Asia (350 | 1.6%), and Eastern Europe (328 | 1.5%), together accounting for 12.1% of all Portsmouth residents.
| Immigration Origin | # Population | % Population |
| Africa | 24 | 0.1% |
| Albania | 54 | 0.2% |
| Argentina | 14 | 0.1% |
| Asia | 906 | 4.1% |
| Bangladesh | 10 | 0.1% |
| Brazil | 68 | 0.3% |
| Bulgaria | 15 | 0.1% |
| Canada | 107 | 0.5% |
| Caribbean | 70 | 0.3% |
| Central America | 23 | 0.1% |
| China | 206 | 0.9% |
| Colombia | 24 | 0.1% |
| Denmark | 9 | 0.0% |
| Dominican Republic | 65 | 0.3% |
| Eastern Asia | 375 | 1.7% |
| Eastern Europe | 328 | 1.5% |
| England | 116 | 0.5% |
| Europe | 713 | 3.2% |
| France | 27 | 0.1% |
| Germany | 14 | 0.1% |
| Greece | 5 | 0.0% |
| Guatemala | 23 | 0.1% |
| Haiti | 3 | 0.0% |
| India | 290 | 1.3% |
| Iraq | 25 | 0.1% |
| Ireland | 15 | 0.1% |
| Italy | 36 | 0.2% |
| Jamaica | 2 | 0.0% |
| Japan | 5 | 0.0% |
| Korea | 164 | 0.7% |
| Laos | 35 | 0.2% |
| Latin America | 204 | 0.9% |
| Moldova | 29 | 0.1% |
| Nepal | 41 | 0.2% |
| Northern Africa | 11 | 0.1% |
| Northern Europe | 303 | 1.4% |
| Peru | 5 | 0.0% |
| Philippines | 82 | 0.4% |
| Russia | 96 | 0.4% |
| Scotland | 119 | 0.5% |
| South Africa | 13 | 0.1% |
| South America | 111 | 0.5% |
| South Central Asia | 350 | 1.6% |
| South Eastern Asia | 127 | 0.6% |
| Southern Europe | 41 | 0.2% |
| Sri Lanka | 9 | 0.0% |
| Turkey | 29 | 0.1% |
| Ukraine | 65 | 0.3% |
| Vietnam | 10 | 0.1% |
| Western Asia | 54 | 0.2% |
| Western Europe | 41 | 0.2% | View All 51 Rows |
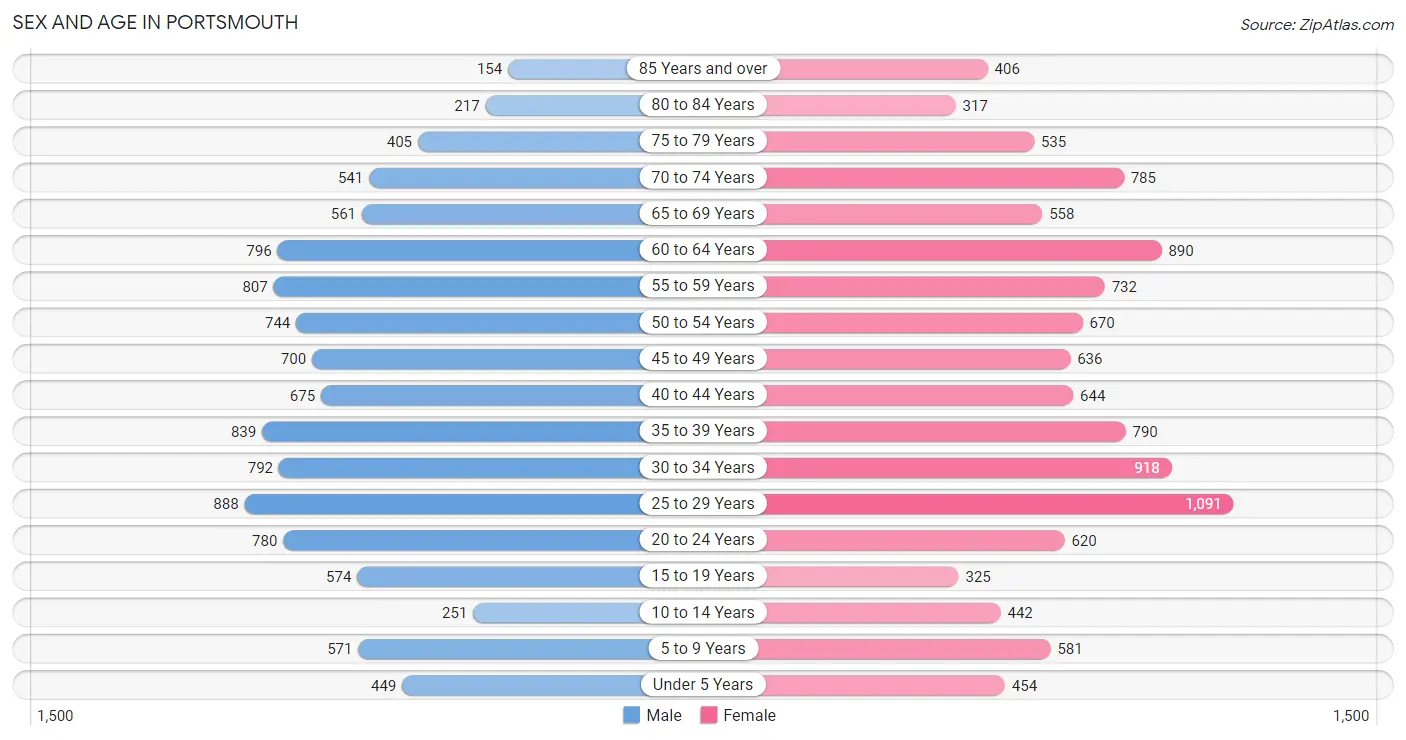
Sex and Age in Portsmouth
Sex and Age in Portsmouth
The most populous age groups in Portsmouth are 25 to 29 Years (888 | 8.3%) for men and 25 to 29 Years (1,091 | 9.6%) for women.
| Age Bracket | Male | Female |
| Under 5 Years | 449 (4.2%) | 454 (4.0%) |
| 5 to 9 Years | 571 (5.3%) | 581 (5.1%) |
| 10 to 14 Years | 251 (2.3%) | 442 (3.9%) |
| 15 to 19 Years | 574 (5.3%) | 325 (2.9%) |
| 20 to 24 Years | 780 (7.3%) | 620 (5.4%) |
| 25 to 29 Years | 888 (8.3%) | 1,091 (9.6%) |
| 30 to 34 Years | 792 (7.4%) | 918 (8.1%) |
| 35 to 39 Years | 839 (7.8%) | 790 (6.9%) |
| 40 to 44 Years | 675 (6.3%) | 644 (5.7%) |
| 45 to 49 Years | 700 (6.5%) | 636 (5.6%) |
| 50 to 54 Years | 744 (6.9%) | 670 (5.9%) |
| 55 to 59 Years | 807 (7.5%) | 732 (6.4%) |
| 60 to 64 Years | 796 (7.4%) | 890 (7.8%) |
| 65 to 69 Years | 561 (5.2%) | 558 (4.9%) |
| 70 to 74 Years | 541 (5.0%) | 785 (6.9%) |
| 75 to 79 Years | 405 (3.8%) | 535 (4.7%) |
| 80 to 84 Years | 217 (2.0%) | 317 (2.8%) |
| 85 Years and over | 154 (1.4%) | 406 (3.6%) |
| Total | 10,744 (100.0%) | 11,394 (100.0%) |
Families and Households in Portsmouth
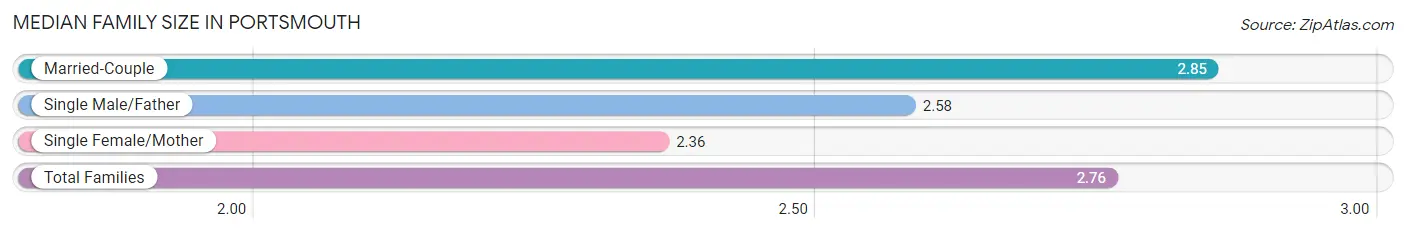
Median Family Size in Portsmouth
The median family size in Portsmouth is 2.76 persons per family, with married-couple families (4,158 | 79.0%) accounting for the largest median family size of 2.85 persons per family. On the other hand, single female/mother families (832 | 15.8%) represent the smallest median family size with 2.36 persons per family.
| Family Type | # Families | Family Size |
| Married-Couple | 4,158 (79.0%) | 2.85 |
| Single Male/Father | 276 (5.2%) | 2.58 |
| Single Female/Mother | 832 (15.8%) | 2.36 |
| Total Families | 5,266 (100.0%) | 2.76 |
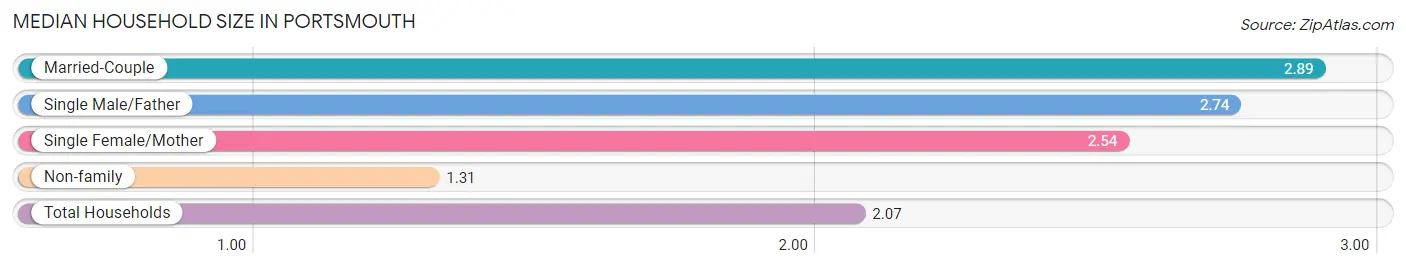
Median Household Size in Portsmouth
The median household size in Portsmouth is 2.07 persons per household, with married-couple households (4,158 | 39.9%) accounting for the largest median household size of 2.89 persons per household. non-family households (5,169 | 49.5%) represent the smallest median household size with 1.31 persons per household.
| Household Type | # Households | Household Size |
| Married-Couple | 4,158 (39.9%) | 2.89 |
| Single Male/Father | 276 (2.6%) | 2.74 |
| Single Female/Mother | 832 (8.0%) | 2.54 |
| Non-family | 5,169 (49.5%) | 1.31 |
| Total Households | 10,435 (100.0%) | 2.07 |
Household Size by Marriage Status in Portsmouth
Out of a total of 10,435 households in Portsmouth, 5,266 (50.5%) are family households, while 5,169 (49.5%) are nonfamily households. The most numerous type of family households are 2-person households, comprising 3,059, and the most common type of nonfamily households are 1-person households, comprising 3,919.
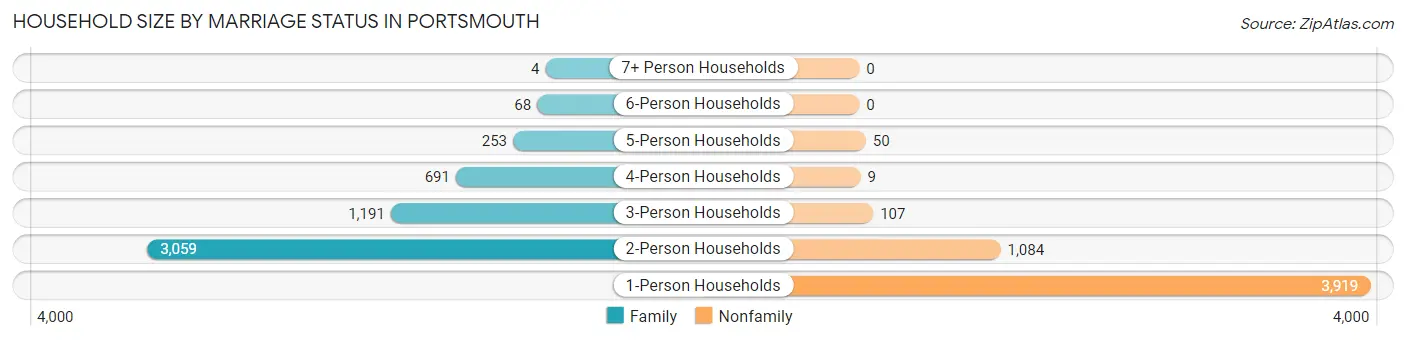
| Household Size | Family Households | Nonfamily Households |
| 1-Person Households | - | 3,919 (37.6%) |
| 2-Person Households | 3,059 (29.3%) | 1,084 (10.4%) |
| 3-Person Households | 1,191 (11.4%) | 107 (1.0%) |
| 4-Person Households | 691 (6.6%) | 9 (0.1%) |
| 5-Person Households | 253 (2.4%) | 50 (0.5%) |
| 6-Person Households | 68 (0.6%) | 0 (0.0%) |
| 7+ Person Households | 4 (0.0%) | 0 (0.0%) |
| Total | 5,266 (50.5%) | 5,169 (49.5%) |
Female Fertility in Portsmouth
Fertility by Age in Portsmouth
Average fertility rate in Portsmouth is 55.0 births per 1,000 women. Women in the age bracket of 20 to 34 years have the highest fertility rate with 66.0 births per 1,000 women. Women in the age bracket of 20 to 34 years acount for 60.5% of all women with births.
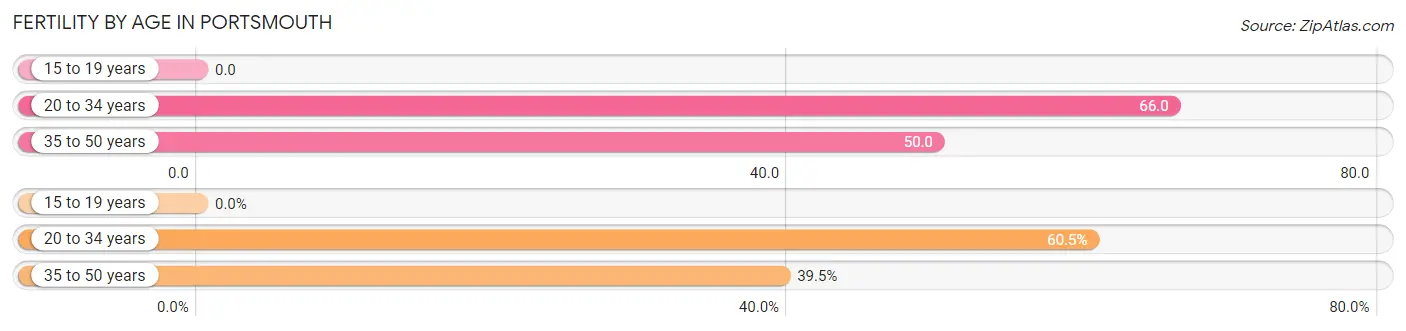
| Age Bracket | Women with Births | Births / 1,000 Women |
| 15 to 19 years | 0 (0.0%) | 0.0 |
| 20 to 34 years | 173 (60.5%) | 66.0 |
| 35 to 50 years | 113 (39.5%) | 50.0 |
| Total | 286 (100.0%) | 55.0 |
Fertility by Age by Marriage Status in Portsmouth
64.3% of women with births (286) in Portsmouth are married. The highest percentage of unmarried women with births falls into 20 to 34 years age bracket with 53.2% of them unmarried at the time of birth, while the lowest percentage of unmarried women with births belong to 35 to 50 years age bracket with 8.9% of them unmarried.
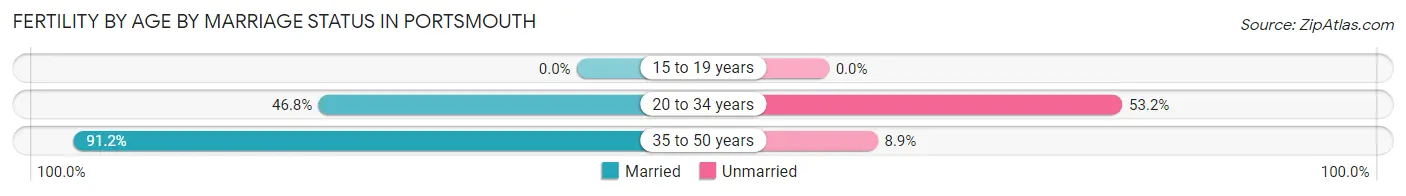
| Age Bracket | Married | Unmarried |
| 15 to 19 years | 0 (0.0%) | 0 (0.0%) |
| 20 to 34 years | 81 (46.8%) | 92 (53.2%) |
| 35 to 50 years | 103 (91.1%) | 10 (8.8%) |
| Total | 184 (64.3%) | 102 (35.7%) |
Fertility by Education in Portsmouth
Average fertility rate in Portsmouth is 55.0 births per 1,000 women. Women with the education attainment of college or associate's degree have the highest fertility rate of 86.0 births per 1,000 women, while women with the education attainment of high school diploma have the lowest fertility at 23.0 births per 1,000 women. Women with the education attainment of bachelor's degree represent 45.1% of all women with births.
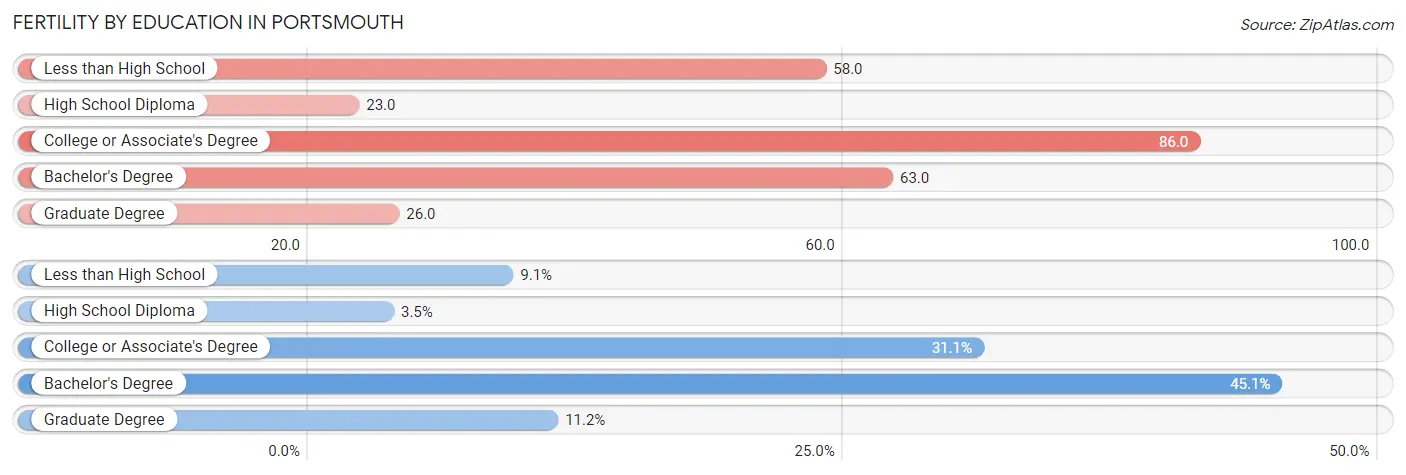
| Educational Attainment | Women with Births | Births / 1,000 Women |
| Less than High School | 26 (9.1%) | 58.0 |
| High School Diploma | 10 (3.5%) | 23.0 |
| College or Associate's Degree | 89 (31.1%) | 86.0 |
| Bachelor's Degree | 129 (45.1%) | 63.0 |
| Graduate Degree | 32 (11.2%) | 26.0 |
| Total | 286 (100.0%) | 55.0 |
Fertility by Education by Marriage Status in Portsmouth
35.7% of women with births in Portsmouth are unmarried. Women with the educational attainment of high school diploma are most likely to be married with 100.0% of them married at childbirth, while women with the educational attainment of college or associate's degree are least likely to be married with 100.0% of them unmarried at childbirth.
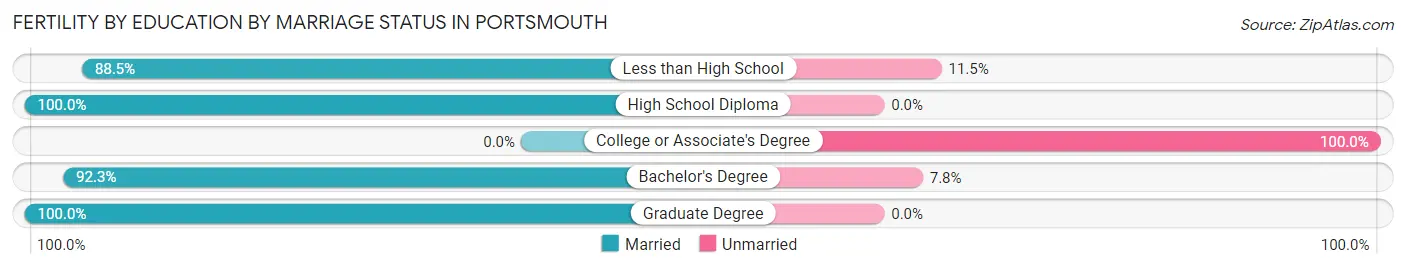
| Educational Attainment | Married | Unmarried |
| Less than High School | 23 (88.5%) | 3 (11.5%) |
| High School Diploma | 10 (100.0%) | 0 (0.0%) |
| College or Associate's Degree | 0 (0.0%) | 89 (100.0%) |
| Bachelor's Degree | 119 (92.2%) | 10 (7.7%) |
| Graduate Degree | 32 (100.0%) | 0 (0.0%) |
| Total | 184 (64.3%) | 102 (35.7%) |
Employment Characteristics in Portsmouth
Employment by Class of Employer in Portsmouth
Among the 12,811 employed individuals in Portsmouth, private company employees (8,344 | 65.1%), not-for-profit organizations (1,159 | 9.0%), and self-employed (not incorporated) (1,107 | 8.6%) make up the most common classes of employment.
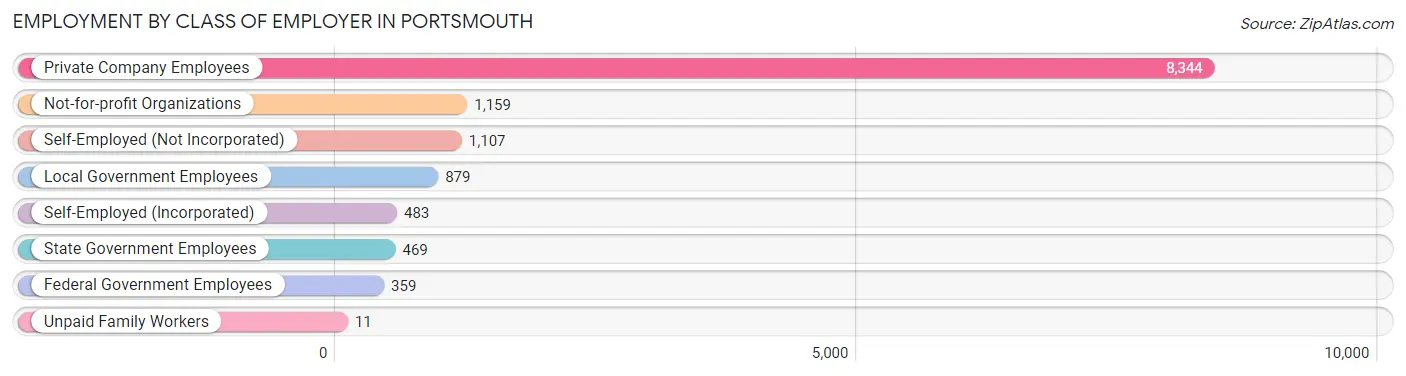
| Employer Class | # Employees | % Employees |
| Private Company Employees | 8,344 | 65.1% |
| Self-Employed (Incorporated) | 483 | 3.8% |
| Self-Employed (Not Incorporated) | 1,107 | 8.6% |
| Not-for-profit Organizations | 1,159 | 9.0% |
| Local Government Employees | 879 | 6.9% |
| State Government Employees | 469 | 3.7% |
| Federal Government Employees | 359 | 2.8% |
| Unpaid Family Workers | 11 | 0.1% |
| Total | 12,811 | 100.0% |
Employment Status by Age in Portsmouth
According to the labor force statistics for Portsmouth, out of the total population over 16 years of age (19,229), 68.6% or 13,191 individuals are in the labor force, with 2.5% or 330 of them unemployed. The age group with the highest labor force participation rate is 25 to 29 years, with 92.5% or 1,831 individuals in the labor force. Within the labor force, the 20 to 24 years age range has the highest percentage of unemployed individuals, with 4.8% or 58 of them being unemployed.
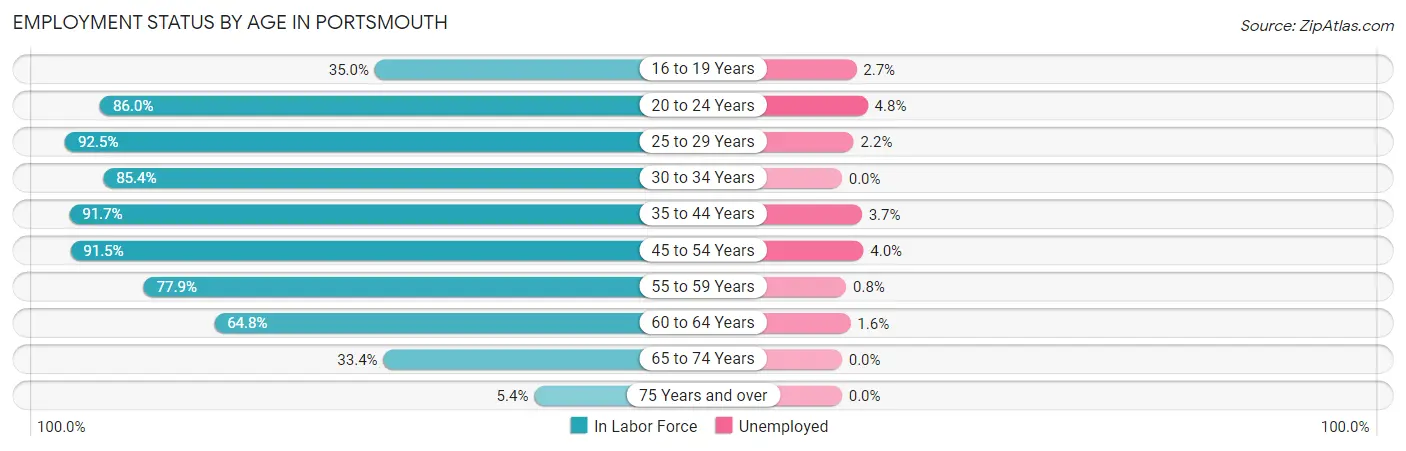
| Age Bracket | In Labor Force | Unemployed |
| 16 to 19 Years | 258 (35.0%) | 7 (2.7%) |
| 20 to 24 Years | 1,204 (86.0%) | 58 (4.8%) |
| 25 to 29 Years | 1,831 (92.5%) | 40 (2.2%) |
| 30 to 34 Years | 1,460 (85.4%) | 0 (0.0%) |
| 35 to 44 Years | 2,703 (91.7%) | 100 (3.7%) |
| 45 to 54 Years | 2,516 (91.5%) | 101 (4.0%) |
| 55 to 59 Years | 1,199 (77.9%) | 10 (0.8%) |
| 60 to 64 Years | 1,093 (64.8%) | 17 (1.6%) |
| 65 to 74 Years | 817 (33.4%) | 0 (0.0%) |
| 75 Years and over | 110 (5.4%) | 0 (0.0%) |
| Total | 13,191 (68.6%) | 330 (2.5%) |
Employment Status by Educational Attainment in Portsmouth
According to labor force statistics for Portsmouth, 85.7% of individuals (10,808) out of the total population between 25 and 64 years of age (12,612) are in the labor force, with 2.5% or 270 of them being unemployed. The group with the highest labor force participation rate are those with the educational attainment of bachelor's degree or higher, with 88.6% or 7,627 individuals in the labor force. Within the labor force, individuals with less than high school education have the highest percentage of unemployment, with 11.9% or 29 of them being unemployed.
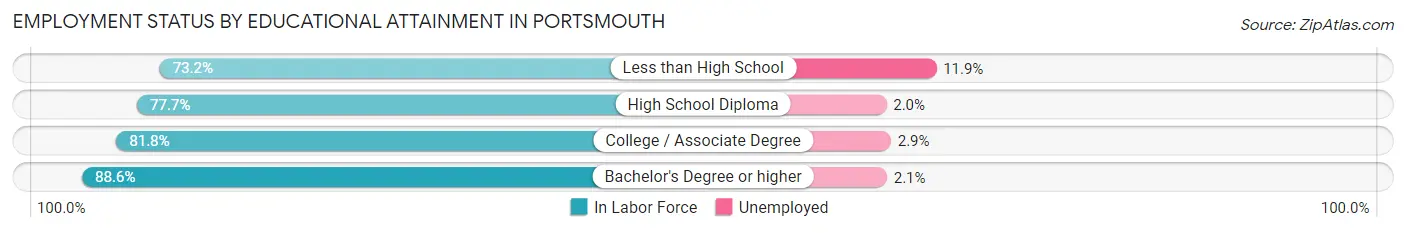
| Educational Attainment | In Labor Force | Unemployed |
| Less than High School | 243 (73.2%) | 40 (11.9%) |
| High School Diploma | 1,270 (77.7%) | 33 (2.0%) |
| College / Associate Degree | 1,667 (81.8%) | 59 (2.9%) |
| Bachelor's Degree or higher | 7,627 (88.6%) | 181 (2.1%) |
| Total | 10,808 (85.7%) | 315 (2.5%) |
Employment Occupations by Sex in Portsmouth
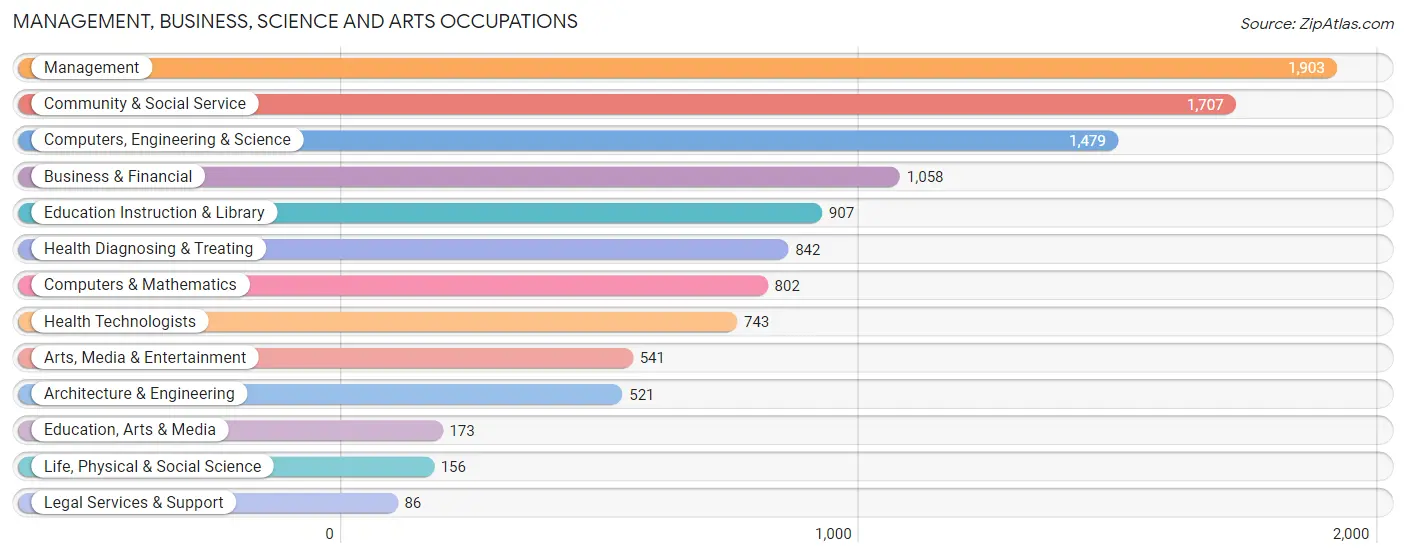
Management, Business, Science and Arts Occupations
The most common Management, Business, Science and Arts occupations in Portsmouth are Management (1,903 | 14.9%), Community & Social Service (1,707 | 13.4%), Computers, Engineering & Science (1,479 | 11.6%), Business & Financial (1,058 | 8.3%), and Education Instruction & Library (907 | 7.1%).
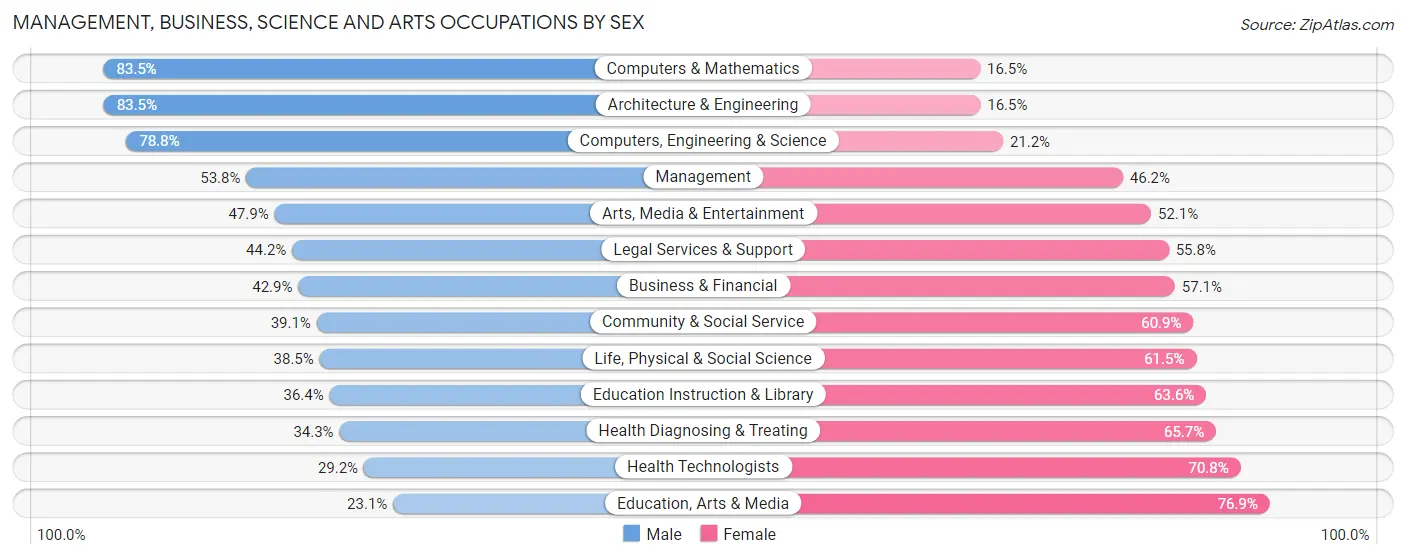
Management, Business, Science and Arts Occupations by Sex
Within the Management, Business, Science and Arts occupations in Portsmouth, the most male-oriented occupations are Computers & Mathematics (83.5%), Architecture & Engineering (83.5%), and Computers, Engineering & Science (78.8%), while the most female-oriented occupations are Education, Arts & Media (76.9%), Health Technologists (70.8%), and Health Diagnosing & Treating (65.7%).
| Occupation | Male | Female |
| Management | 1,023 (53.8%) | 880 (46.2%) |
| Business & Financial | 454 (42.9%) | 604 (57.1%) |
| Computers, Engineering & Science | 1,165 (78.8%) | 314 (21.2%) |
| Computers & Mathematics | 670 (83.5%) | 132 (16.5%) |
| Architecture & Engineering | 435 (83.5%) | 86 (16.5%) |
| Life, Physical & Social Science | 60 (38.5%) | 96 (61.5%) |
| Community & Social Service | 667 (39.1%) | 1,040 (60.9%) |
| Education, Arts & Media | 40 (23.1%) | 133 (76.9%) |
| Legal Services & Support | 38 (44.2%) | 48 (55.8%) |
| Education Instruction & Library | 330 (36.4%) | 577 (63.6%) |
| Arts, Media & Entertainment | 259 (47.9%) | 282 (52.1%) |
| Health Diagnosing & Treating | 289 (34.3%) | 553 (65.7%) |
| Health Technologists | 217 (29.2%) | 526 (70.8%) |
| Total (Category) | 3,598 (51.5%) | 3,391 (48.5%) |
| Total (Overall) | 6,738 (52.7%) | 6,047 (47.3%) |
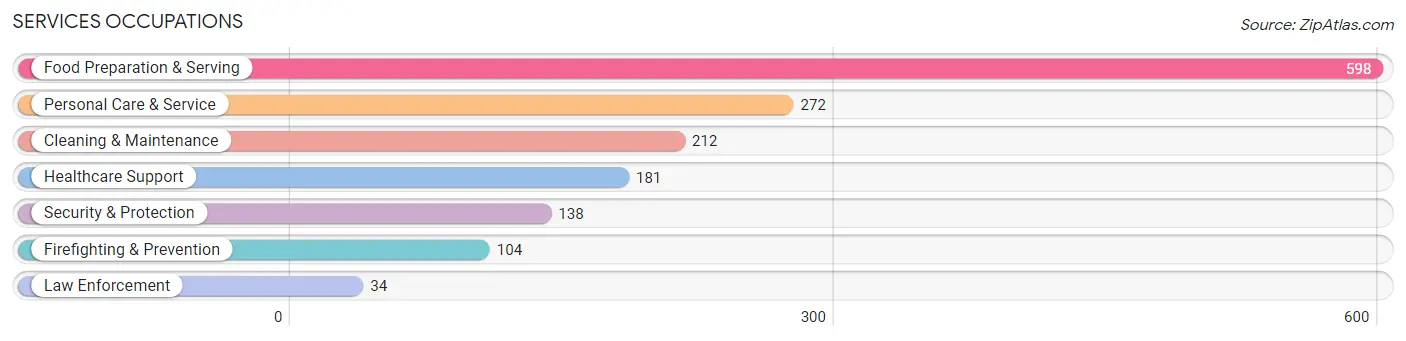
Services Occupations
The most common Services occupations in Portsmouth are Food Preparation & Serving (598 | 4.7%), Personal Care & Service (272 | 2.1%), Cleaning & Maintenance (212 | 1.7%), Healthcare Support (181 | 1.4%), and Security & Protection (138 | 1.1%).
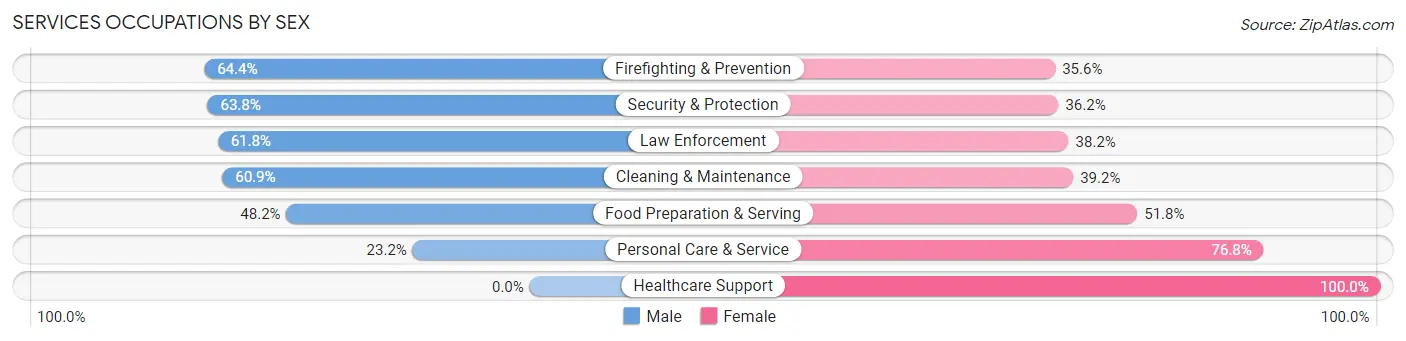
Services Occupations by Sex
Within the Services occupations in Portsmouth, the most male-oriented occupations are Firefighting & Prevention (64.4%), Security & Protection (63.8%), and Law Enforcement (61.8%), while the most female-oriented occupations are Healthcare Support (100.0%), Personal Care & Service (76.8%), and Food Preparation & Serving (51.8%).
| Occupation | Male | Female |
| Healthcare Support | 0 (0.0%) | 181 (100.0%) |
| Security & Protection | 88 (63.8%) | 50 (36.2%) |
| Firefighting & Prevention | 67 (64.4%) | 37 (35.6%) |
| Law Enforcement | 21 (61.8%) | 13 (38.2%) |
| Food Preparation & Serving | 288 (48.2%) | 310 (51.8%) |
| Cleaning & Maintenance | 129 (60.9%) | 83 (39.2%) |
| Personal Care & Service | 63 (23.2%) | 209 (76.8%) |
| Total (Category) | 568 (40.5%) | 833 (59.5%) |
| Total (Overall) | 6,738 (52.7%) | 6,047 (47.3%) |
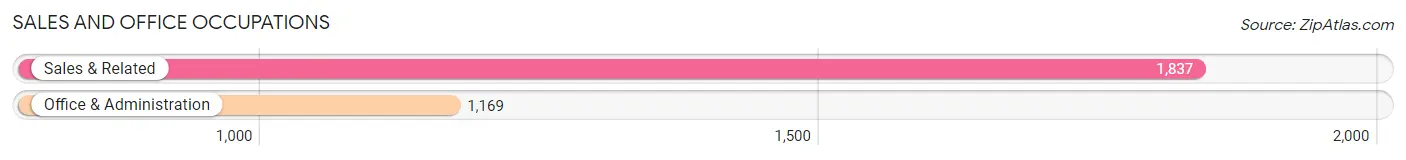
Sales and Office Occupations
The most common Sales and Office occupations in Portsmouth are Sales & Related (1,837 | 14.4%), and Office & Administration (1,169 | 9.1%).
Sales and Office Occupations by Sex
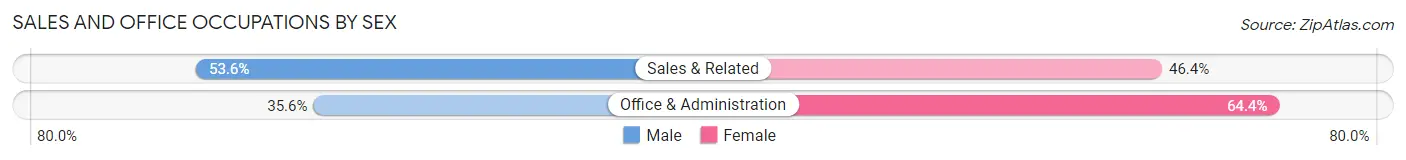
| Occupation | Male | Female |
| Sales & Related | 985 (53.6%) | 852 (46.4%) |
| Office & Administration | 416 (35.6%) | 753 (64.4%) |
| Total (Category) | 1,401 (46.6%) | 1,605 (53.4%) |
| Total (Overall) | 6,738 (52.7%) | 6,047 (47.3%) |
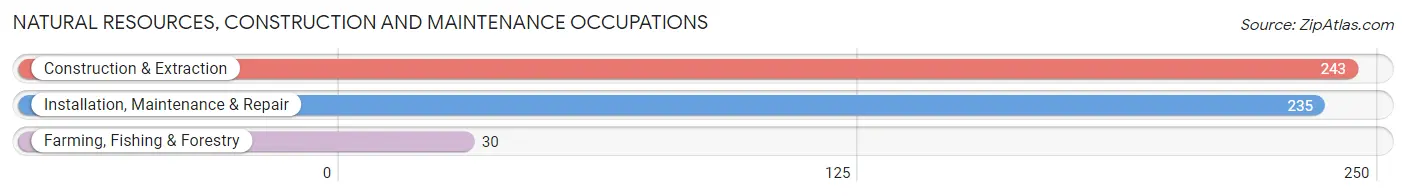
Natural Resources, Construction and Maintenance Occupations
The most common Natural Resources, Construction and Maintenance occupations in Portsmouth are Construction & Extraction (243 | 1.9%), Installation, Maintenance & Repair (235 | 1.8%), and Farming, Fishing & Forestry (30 | 0.2%).
Natural Resources, Construction and Maintenance Occupations by Sex
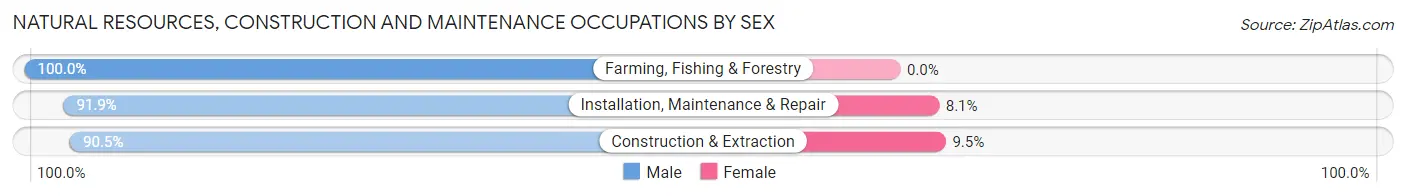
| Occupation | Male | Female |
| Farming, Fishing & Forestry | 30 (100.0%) | 0 (0.0%) |
| Construction & Extraction | 220 (90.5%) | 23 (9.5%) |
| Installation, Maintenance & Repair | 216 (91.9%) | 19 (8.1%) |
| Total (Category) | 466 (91.7%) | 42 (8.3%) |
| Total (Overall) | 6,738 (52.7%) | 6,047 (47.3%) |
Production, Transportation and Moving Occupations
The most common Production, Transportation and Moving occupations in Portsmouth are Production (493 | 3.9%), Material Moving (229 | 1.8%), and Transportation (159 | 1.2%).
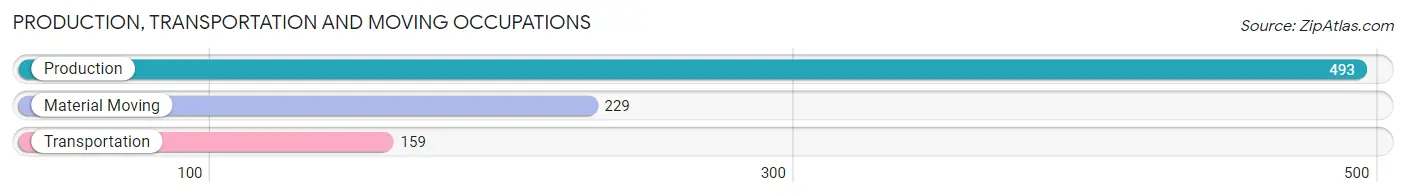
Production, Transportation and Moving Occupations by Sex
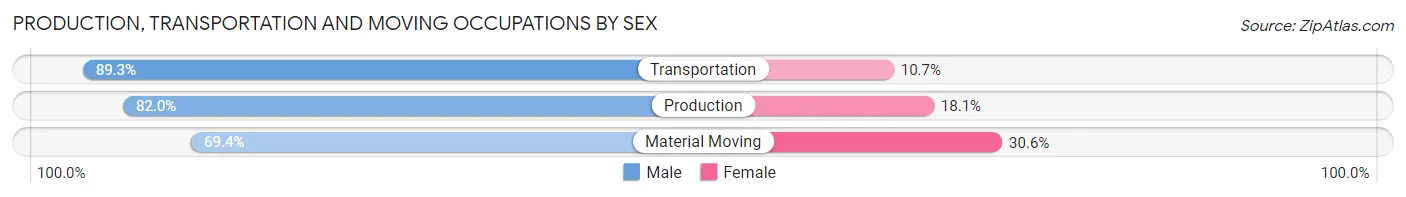
| Occupation | Male | Female |
| Production | 404 (82.0%) | 89 (18.0%) |
| Transportation | 142 (89.3%) | 17 (10.7%) |
| Material Moving | 159 (69.4%) | 70 (30.6%) |
| Total (Category) | 705 (80.0%) | 176 (20.0%) |
| Total (Overall) | 6,738 (52.7%) | 6,047 (47.3%) |
Employment Industries by Sex in Portsmouth
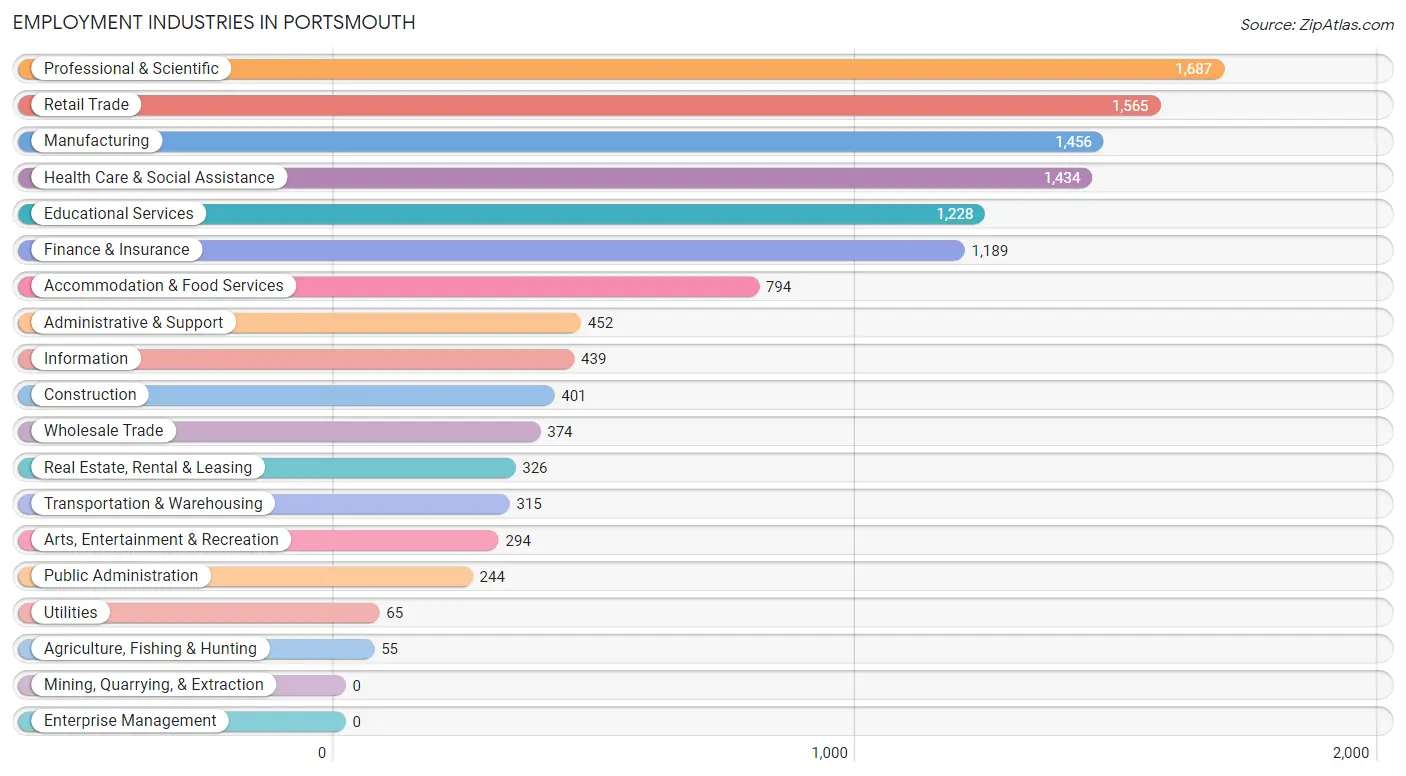
Employment Industries in Portsmouth
The major employment industries in Portsmouth include Professional & Scientific (1,687 | 13.2%), Retail Trade (1,565 | 12.2%), Manufacturing (1,456 | 11.4%), Health Care & Social Assistance (1,434 | 11.2%), and Educational Services (1,228 | 9.6%).
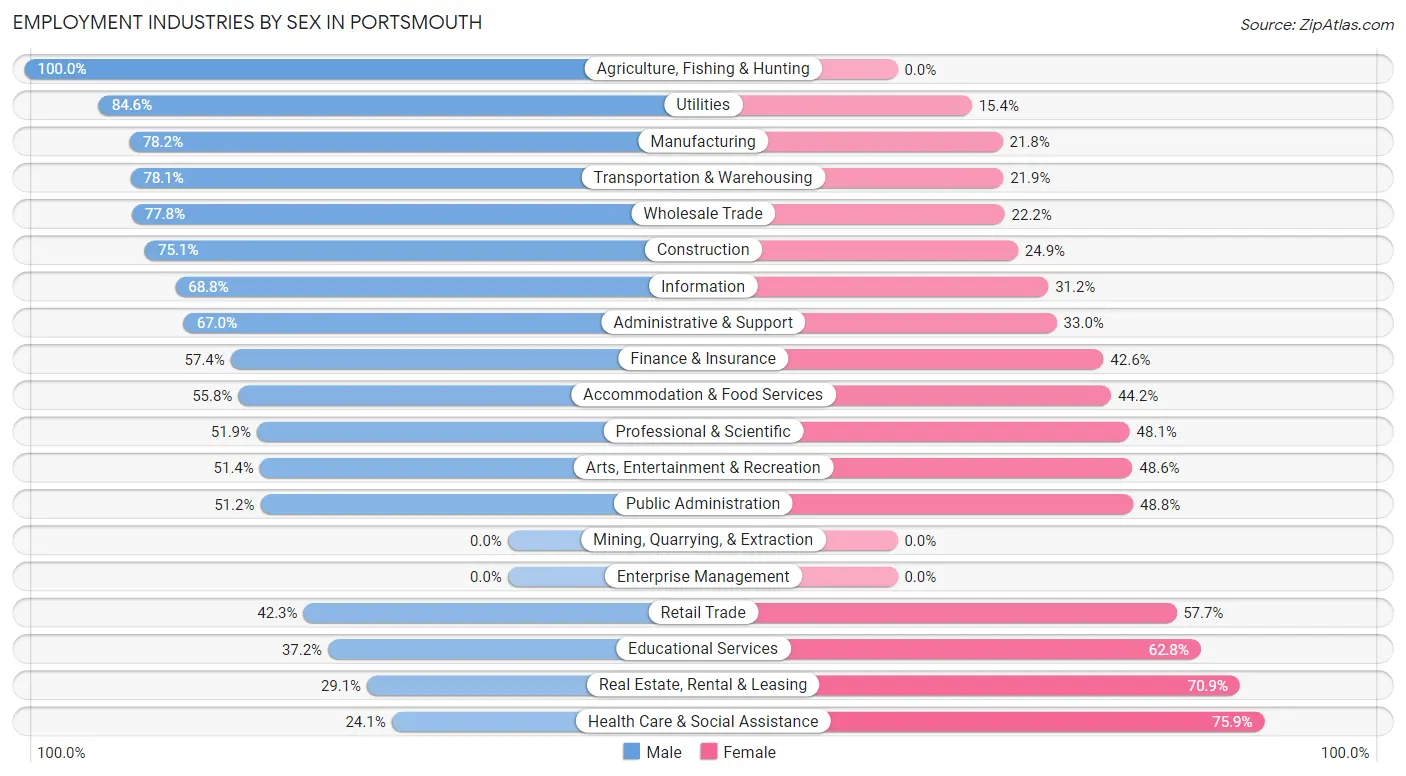
Employment Industries by Sex in Portsmouth
The Portsmouth industries that see more men than women are Agriculture, Fishing & Hunting (100.0%), Utilities (84.6%), and Manufacturing (78.2%), whereas the industries that tend to have a higher number of women are Health Care & Social Assistance (75.9%), Real Estate, Rental & Leasing (70.9%), and Educational Services (62.8%).
| Industry | Male | Female |
| Agriculture, Fishing & Hunting | 55 (100.0%) | 0 (0.0%) |
| Mining, Quarrying, & Extraction | 0 (0.0%) | 0 (0.0%) |
| Construction | 301 (75.1%) | 100 (24.9%) |
| Manufacturing | 1,139 (78.2%) | 317 (21.8%) |
| Wholesale Trade | 291 (77.8%) | 83 (22.2%) |
| Retail Trade | 662 (42.3%) | 903 (57.7%) |
| Transportation & Warehousing | 246 (78.1%) | 69 (21.9%) |
| Utilities | 55 (84.6%) | 10 (15.4%) |
| Information | 302 (68.8%) | 137 (31.2%) |
| Finance & Insurance | 682 (57.4%) | 507 (42.6%) |
| Real Estate, Rental & Leasing | 95 (29.1%) | 231 (70.9%) |
| Professional & Scientific | 876 (51.9%) | 811 (48.1%) |
| Enterprise Management | 0 (0.0%) | 0 (0.0%) |
| Administrative & Support | 303 (67.0%) | 149 (33.0%) |
| Educational Services | 457 (37.2%) | 771 (62.8%) |
| Health Care & Social Assistance | 345 (24.1%) | 1,089 (75.9%) |
| Arts, Entertainment & Recreation | 151 (51.4%) | 143 (48.6%) |
| Accommodation & Food Services | 443 (55.8%) | 351 (44.2%) |
| Public Administration | 125 (51.2%) | 119 (48.8%) |
| Total | 6,738 (52.7%) | 6,047 (47.3%) |
Education in Portsmouth
School Enrollment in Portsmouth
The most common levels of schooling among the 3,810 students in Portsmouth are elementary school (902 | 23.7%), high school (801 | 21.0%), and college / undergraduate (719 | 18.9%).

| School Level | # Students | % Students |
| Nursery / Preschool | 352 | 9.2% |
| Kindergarten | 157 | 4.1% |
| Elementary School | 902 | 23.7% |
| Middle School | 618 | 16.2% |
| High School | 801 | 21.0% |
| College / Undergraduate | 719 | 18.9% |
| Graduate / Professional | 261 | 6.9% |
| Total | 3,810 | 100.0% |
School Enrollment by Age by Funding Source in Portsmouth
Out of a total of 3,810 students who are enrolled in schools in Portsmouth, 1,010 (26.5%) attend a private institution, while the remaining 2,800 (73.5%) are enrolled in public schools. The age group of 3 to 4 year olds has the highest likelihood of being enrolled in private schools, with 221 (73.7% in the age bracket) enrolled. Conversely, the age group of 15 to 17 year olds has the lowest likelihood of being enrolled in a private school, with 517 (90.9% in the age bracket) attending a public institution.
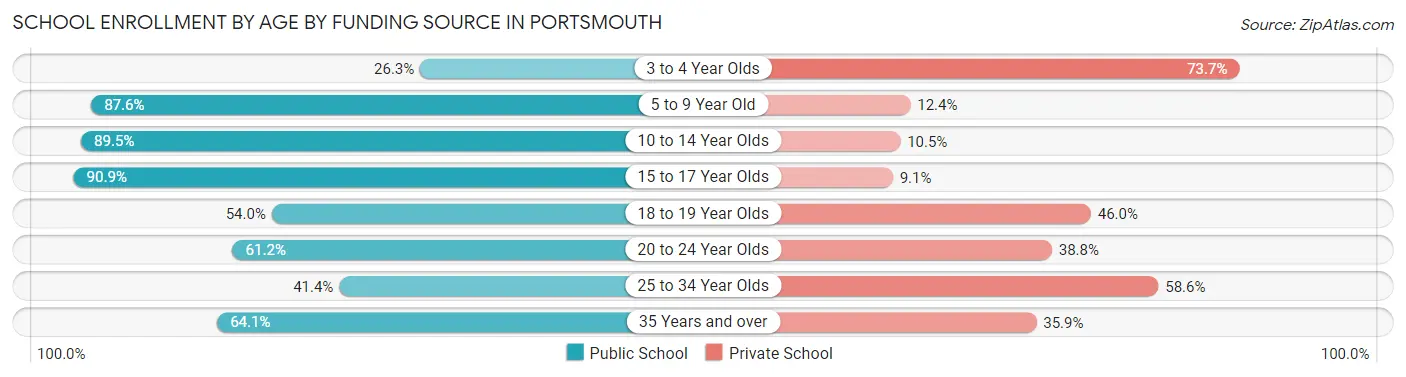
| Age Bracket | Public School | Private School |
| 3 to 4 Year Olds | 79 (26.3%) | 221 (73.7%) |
| 5 to 9 Year Old | 932 (87.6%) | 132 (12.4%) |
| 10 to 14 Year Olds | 620 (89.5%) | 73 (10.5%) |
| 15 to 17 Year Olds | 517 (90.9%) | 52 (9.1%) |
| 18 to 19 Year Olds | 136 (54.0%) | 116 (46.0%) |
| 20 to 24 Year Olds | 316 (61.2%) | 200 (38.8%) |
| 25 to 34 Year Olds | 118 (41.4%) | 167 (58.6%) |
| 35 Years and over | 84 (64.1%) | 47 (35.9%) |
| Total | 2,800 (73.5%) | 1,010 (26.5%) |
Educational Attainment by Field of Study in Portsmouth
Business (2,228 | 18.9%), social sciences (1,112 | 9.4%), engineering (932 | 7.9%), literature & languages (837 | 7.1%), and education (833 | 7.1%) are the most common fields of study among 11,785 individuals in Portsmouth who have obtained a bachelor's degree or higher.
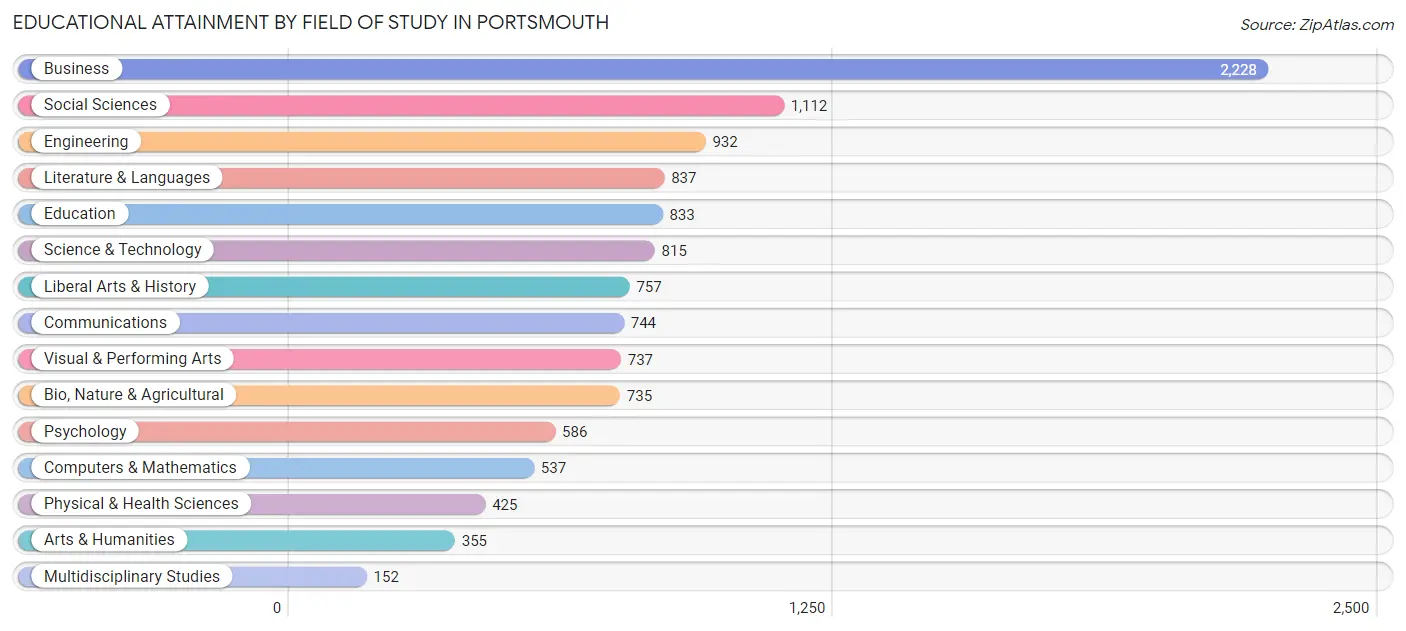
| Field of Study | # Graduates | % Graduates |
| Computers & Mathematics | 537 | 4.6% |
| Bio, Nature & Agricultural | 735 | 6.2% |
| Physical & Health Sciences | 425 | 3.6% |
| Psychology | 586 | 5.0% |
| Social Sciences | 1,112 | 9.4% |
| Engineering | 932 | 7.9% |
| Multidisciplinary Studies | 152 | 1.3% |
| Science & Technology | 815 | 6.9% |
| Business | 2,228 | 18.9% |
| Education | 833 | 7.1% |
| Literature & Languages | 837 | 7.1% |
| Liberal Arts & History | 757 | 6.4% |
| Visual & Performing Arts | 737 | 6.2% |
| Communications | 744 | 6.3% |
| Arts & Humanities | 355 | 3.0% |
| Total | 11,785 | 100.0% |
Transportation & Commute in Portsmouth
Vehicle Availability by Sex in Portsmouth
The most prevalent vehicle ownership categories in Portsmouth are males with 2 vehicles (3,694, accounting for 54.7%) and females with 2 vehicles (2,686, making up 61.3%).
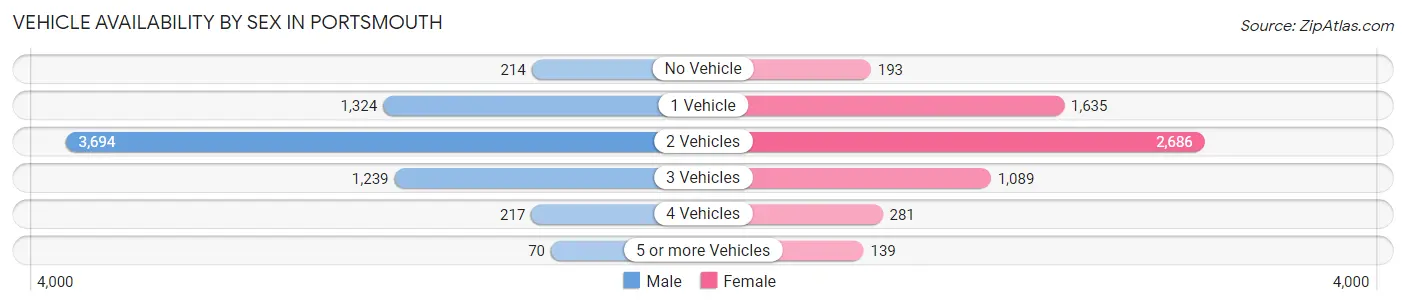
| Vehicles Available | Male | Female |
| No Vehicle | 214 (3.2%) | 193 (3.2%) |
| 1 Vehicle | 1,324 (19.6%) | 1,635 (27.2%) |
| 2 Vehicles | 3,694 (54.7%) | 2,686 (44.6%) |
| 3 Vehicles | 1,239 (18.3%) | 1,089 (18.1%) |
| 4 Vehicles | 217 (3.2%) | 281 (4.7%) |
| 5 or more Vehicles | 70 (1.0%) | 139 (2.3%) |
| Total | 6,758 (100.0%) | 6,023 (100.0%) |
Commute Time in Portsmouth
The most frequently occuring commute durations in Portsmouth are 10 to 14 minutes (2,236 commuters, 21.2%), 5 to 9 minutes (2,121 commuters, 20.1%), and 20 to 24 minutes (1,357 commuters, 12.9%).
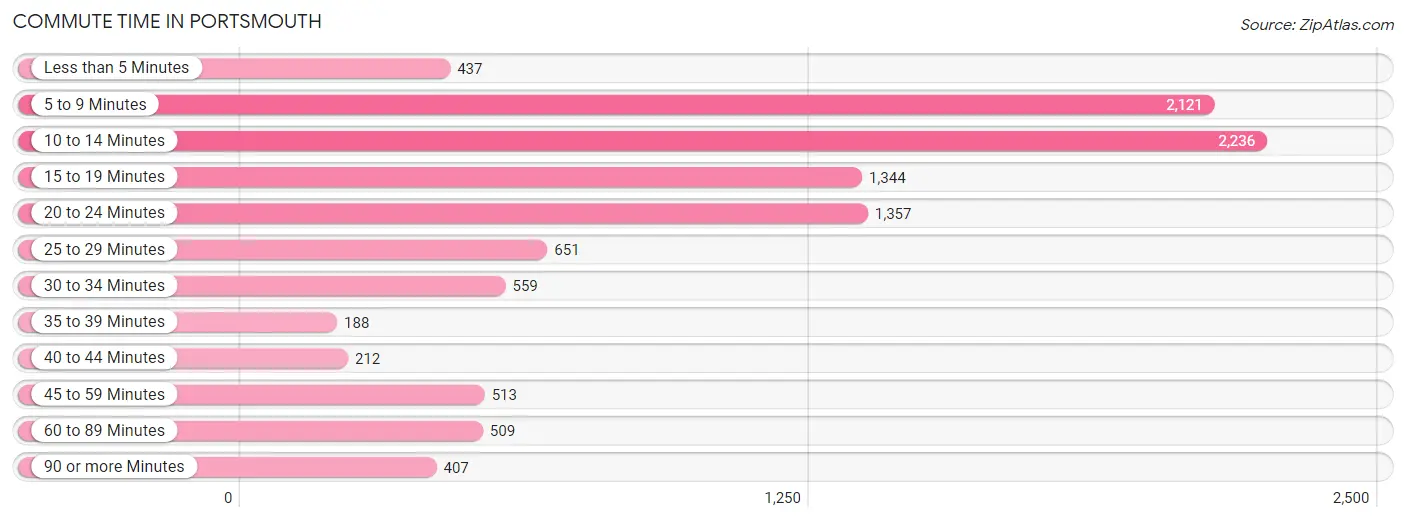
| Commute Time | # Commuters | % Commuters |
| Less than 5 Minutes | 437 | 4.2% |
| 5 to 9 Minutes | 2,121 | 20.1% |
| 10 to 14 Minutes | 2,236 | 21.2% |
| 15 to 19 Minutes | 1,344 | 12.8% |
| 20 to 24 Minutes | 1,357 | 12.9% |
| 25 to 29 Minutes | 651 | 6.2% |
| 30 to 34 Minutes | 559 | 5.3% |
| 35 to 39 Minutes | 188 | 1.8% |
| 40 to 44 Minutes | 212 | 2.0% |
| 45 to 59 Minutes | 513 | 4.9% |
| 60 to 89 Minutes | 509 | 4.8% |
| 90 or more Minutes | 407 | 3.9% |
Commute Time by Sex in Portsmouth
The most common commute times in Portsmouth are 10 to 14 minutes (1,303 commuters, 24.2%) for males and 5 to 9 minutes (1,119 commuters, 21.7%) for females.
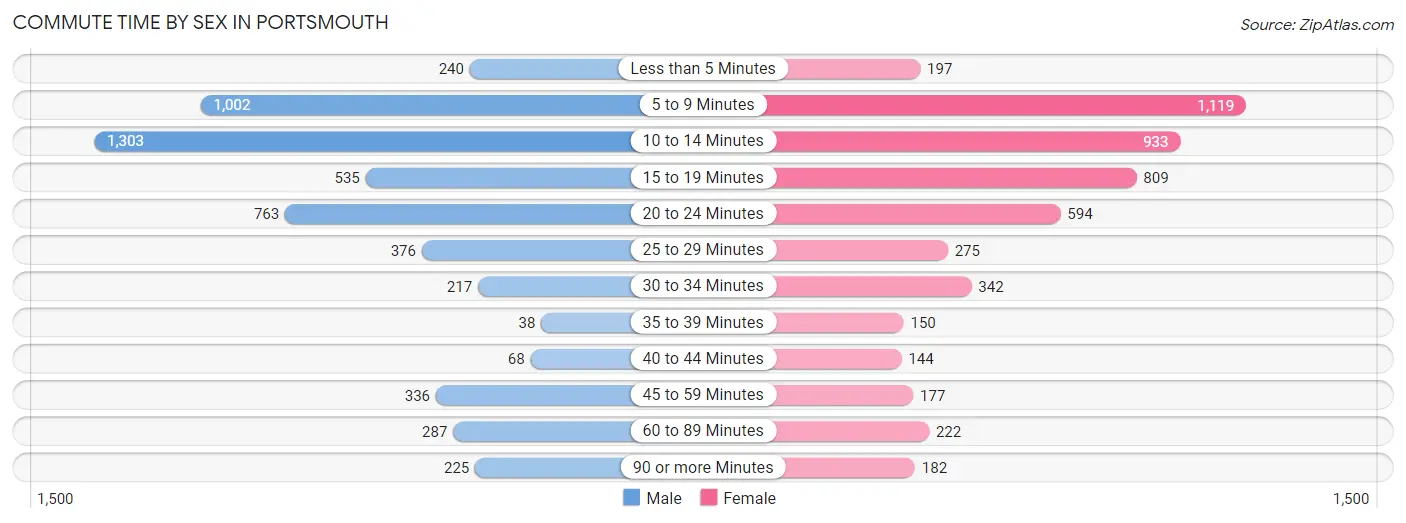
| Commute Time | Male | Female |
| Less than 5 Minutes | 240 (4.4%) | 197 (3.8%) |
| 5 to 9 Minutes | 1,002 (18.6%) | 1,119 (21.7%) |
| 10 to 14 Minutes | 1,303 (24.2%) | 933 (18.1%) |
| 15 to 19 Minutes | 535 (9.9%) | 809 (15.7%) |
| 20 to 24 Minutes | 763 (14.2%) | 594 (11.6%) |
| 25 to 29 Minutes | 376 (7.0%) | 275 (5.3%) |
| 30 to 34 Minutes | 217 (4.0%) | 342 (6.7%) |
| 35 to 39 Minutes | 38 (0.7%) | 150 (2.9%) |
| 40 to 44 Minutes | 68 (1.3%) | 144 (2.8%) |
| 45 to 59 Minutes | 336 (6.2%) | 177 (3.4%) |
| 60 to 89 Minutes | 287 (5.3%) | 222 (4.3%) |
| 90 or more Minutes | 225 (4.2%) | 182 (3.5%) |
Time of Departure to Work by Sex in Portsmouth
The most frequent times of departure to work in Portsmouth are 7:30 AM to 7:59 AM (866, 16.1%) for males and 8:00 AM to 8:29 AM (956, 18.6%) for females.
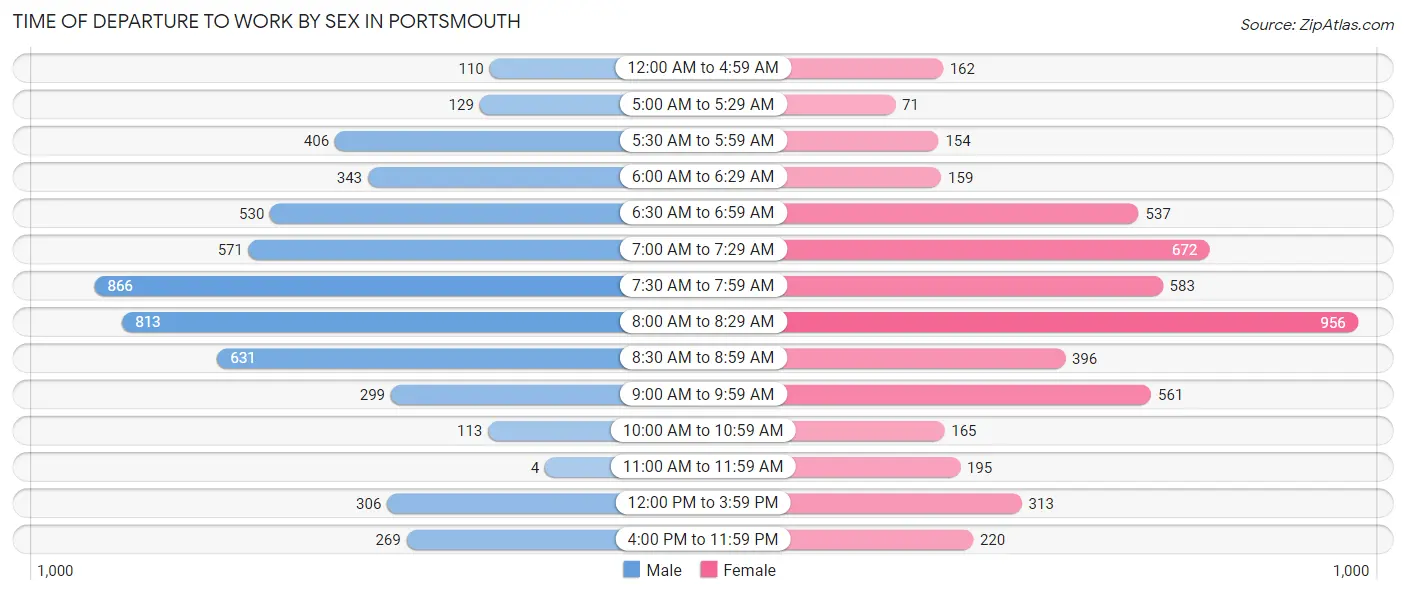
| Time of Departure | Male | Female |
| 12:00 AM to 4:59 AM | 110 (2.0%) | 162 (3.2%) |
| 5:00 AM to 5:29 AM | 129 (2.4%) | 71 (1.4%) |
| 5:30 AM to 5:59 AM | 406 (7.5%) | 154 (3.0%) |
| 6:00 AM to 6:29 AM | 343 (6.4%) | 159 (3.1%) |
| 6:30 AM to 6:59 AM | 530 (9.8%) | 537 (10.4%) |
| 7:00 AM to 7:29 AM | 571 (10.6%) | 672 (13.1%) |
| 7:30 AM to 7:59 AM | 866 (16.1%) | 583 (11.3%) |
| 8:00 AM to 8:29 AM | 813 (15.1%) | 956 (18.6%) |
| 8:30 AM to 8:59 AM | 631 (11.7%) | 396 (7.7%) |
| 9:00 AM to 9:59 AM | 299 (5.6%) | 561 (10.9%) |
| 10:00 AM to 10:59 AM | 113 (2.1%) | 165 (3.2%) |
| 11:00 AM to 11:59 AM | 4 (0.1%) | 195 (3.8%) |
| 12:00 PM to 3:59 PM | 306 (5.7%) | 313 (6.1%) |
| 4:00 PM to 11:59 PM | 269 (5.0%) | 220 (4.3%) |
| Total | 5,390 (100.0%) | 5,144 (100.0%) |
Housing Occupancy in Portsmouth
Occupancy by Ownership in Portsmouth
Of the total 10,435 dwellings in Portsmouth, owner-occupied units account for 5,446 (52.2%), while renter-occupied units make up 4,989 (47.8%).
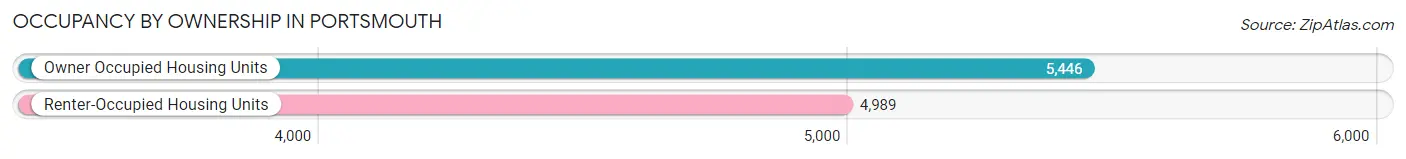
| Occupancy | # Housing Units | % Housing Units |
| Owner Occupied Housing Units | 5,446 | 52.2% |
| Renter-Occupied Housing Units | 4,989 | 47.8% |
| Total Occupied Housing Units | 10,435 | 100.0% |
Occupancy by Household Size in Portsmouth
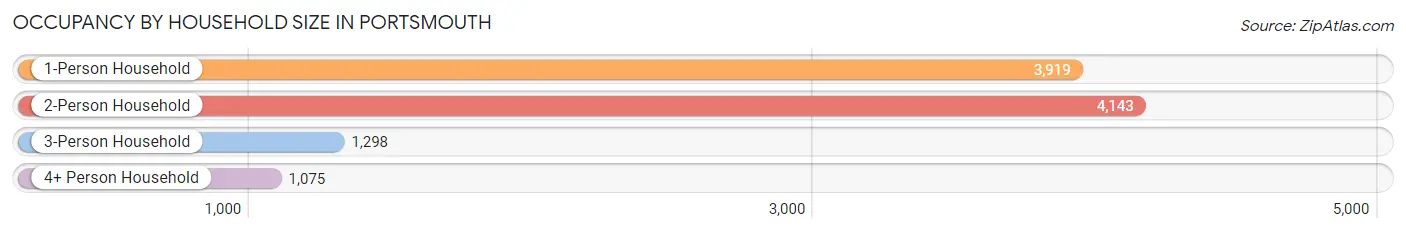
| Household Size | # Housing Units | % Housing Units |
| 1-Person Household | 3,919 | 37.6% |
| 2-Person Household | 4,143 | 39.7% |
| 3-Person Household | 1,298 | 12.4% |
| 4+ Person Household | 1,075 | 10.3% |
| Total Housing Units | 10,435 | 100.0% |
Occupancy by Ownership by Household Size in Portsmouth
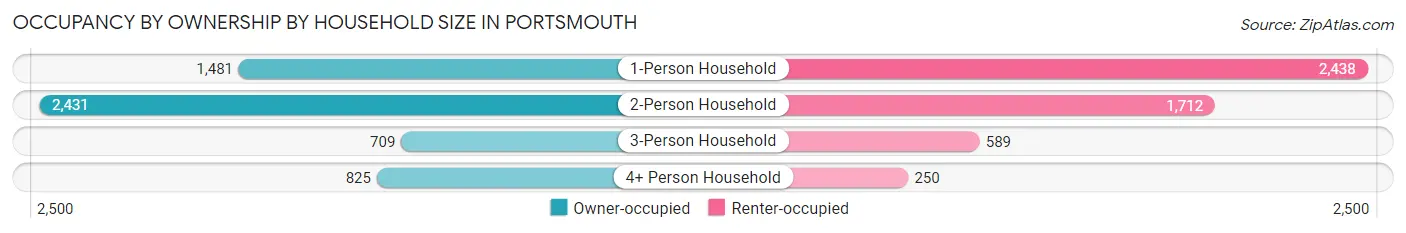
| Household Size | Owner-occupied | Renter-occupied |
| 1-Person Household | 1,481 (37.8%) | 2,438 (62.2%) |
| 2-Person Household | 2,431 (58.7%) | 1,712 (41.3%) |
| 3-Person Household | 709 (54.6%) | 589 (45.4%) |
| 4+ Person Household | 825 (76.7%) | 250 (23.3%) |
| Total Housing Units | 5,446 (52.2%) | 4,989 (47.8%) |
Occupancy by Educational Attainment in Portsmouth
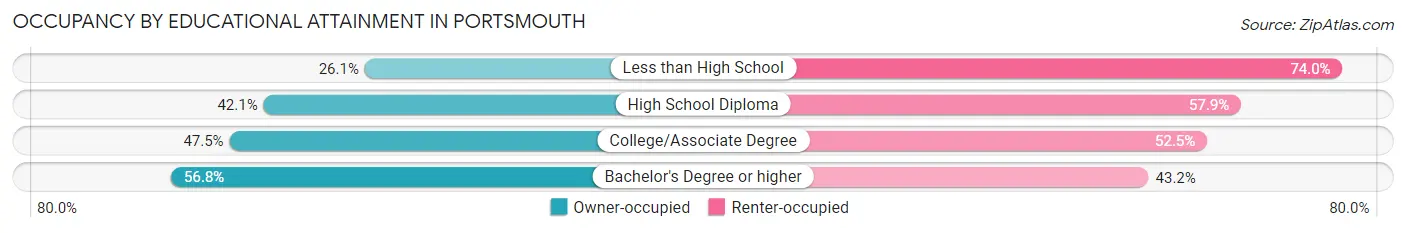
| Household Size | Owner-occupied | Renter-occupied |
| Less than High School | 81 (26.1%) | 230 (74.0%) |
| High School Diploma | 606 (42.1%) | 833 (57.9%) |
| College/Associate Degree | 886 (47.5%) | 979 (52.5%) |
| Bachelor's Degree or higher | 3,873 (56.8%) | 2,947 (43.2%) |
Occupancy by Age of Householder in Portsmouth
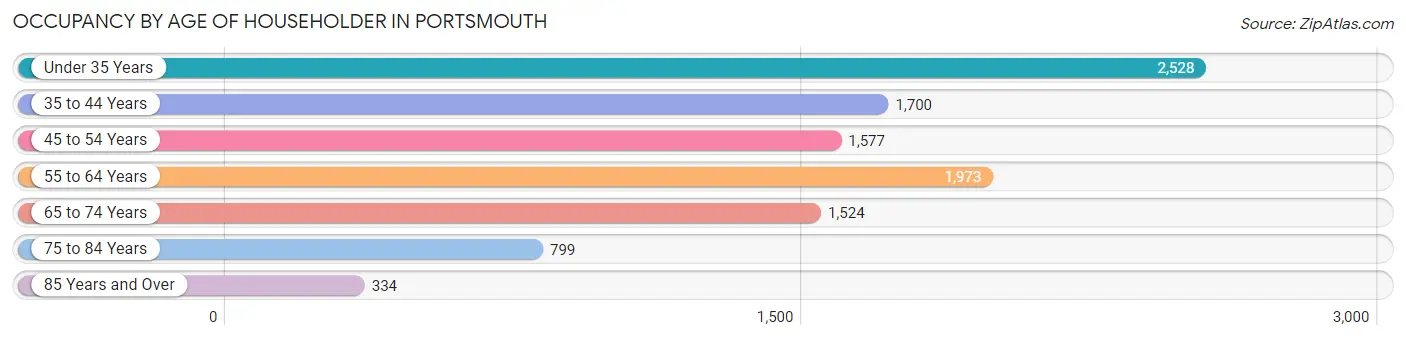
| Age Bracket | # Households | % Households |
| Under 35 Years | 2,528 | 24.2% |
| 35 to 44 Years | 1,700 | 16.3% |
| 45 to 54 Years | 1,577 | 15.1% |
| 55 to 64 Years | 1,973 | 18.9% |
| 65 to 74 Years | 1,524 | 14.6% |
| 75 to 84 Years | 799 | 7.7% |
| 85 Years and Over | 334 | 3.2% |
| Total | 10,435 | 100.0% |
Housing Finances in Portsmouth
Median Income by Occupancy in Portsmouth
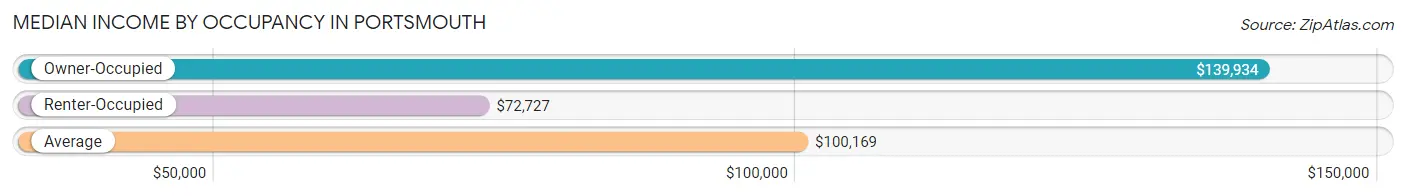
| Occupancy Type | # Households | Median Income |
| Owner-Occupied | 5,446 (52.2%) | $139,934 |
| Renter-Occupied | 4,989 (47.8%) | $72,727 |
| Average | 10,435 (100.0%) | $100,169 |
Occupancy by Householder Income Bracket in Portsmouth
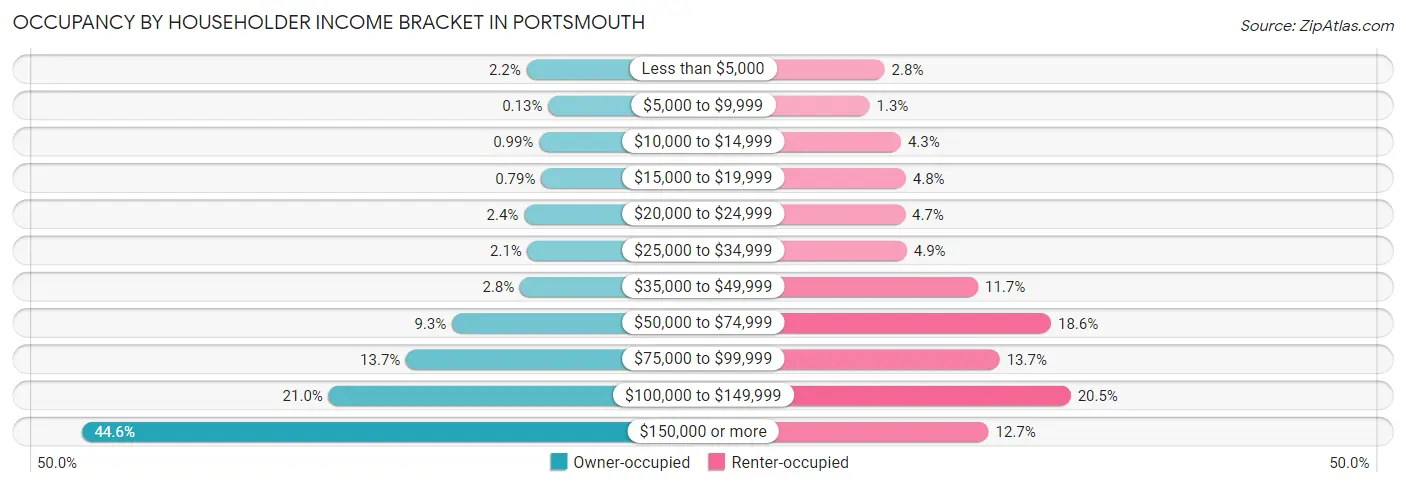
| Income Bracket | Owner-occupied | Renter-occupied |
| Less than $5,000 | 119 (2.2%) | 138 (2.8%) |
| $5,000 to $9,999 | 7 (0.1%) | 67 (1.3%) |
| $10,000 to $14,999 | 54 (1.0%) | 216 (4.3%) |
| $15,000 to $19,999 | 43 (0.8%) | 239 (4.8%) |
| $20,000 to $24,999 | 132 (2.4%) | 235 (4.7%) |
| $25,000 to $34,999 | 114 (2.1%) | 244 (4.9%) |
| $35,000 to $49,999 | 153 (2.8%) | 582 (11.7%) |
| $50,000 to $74,999 | 506 (9.3%) | 929 (18.6%) |
| $75,000 to $99,999 | 744 (13.7%) | 685 (13.7%) |
| $100,000 to $149,999 | 1,146 (21.0%) | 1,022 (20.5%) |
| $150,000 or more | 2,428 (44.6%) | 632 (12.7%) |
| Total | 5,446 (100.0%) | 4,989 (100.0%) |
Monthly Housing Cost Tiers in Portsmouth
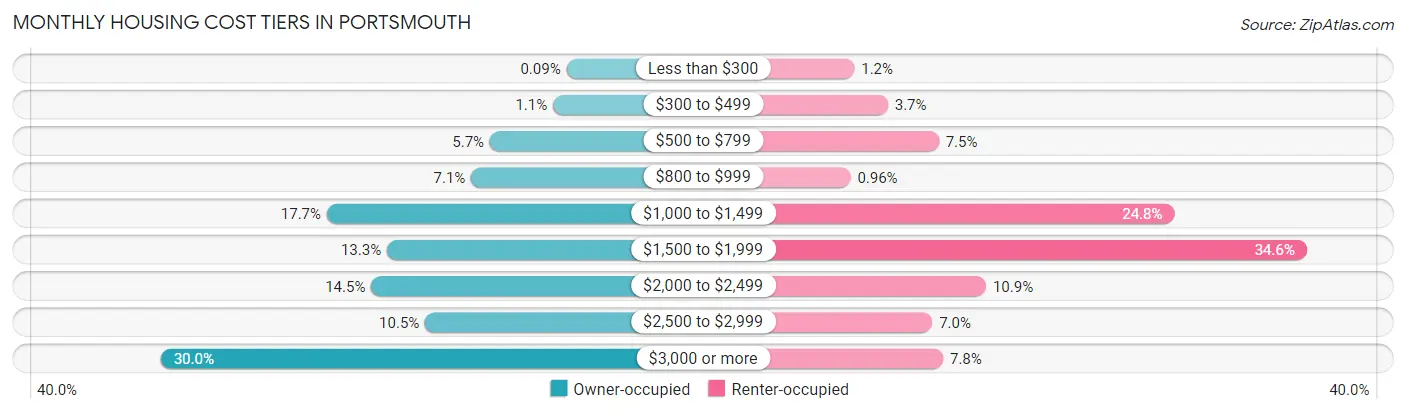
| Monthly Cost | Owner-occupied | Renter-occupied |
| Less than $300 | 5 (0.1%) | 62 (1.2%) |
| $300 to $499 | 59 (1.1%) | 185 (3.7%) |
| $500 to $799 | 312 (5.7%) | 372 (7.5%) |
| $800 to $999 | 387 (7.1%) | 48 (1.0%) |
| $1,000 to $1,499 | 966 (17.7%) | 1,238 (24.8%) |
| $1,500 to $1,999 | 725 (13.3%) | 1,724 (34.6%) |
| $2,000 to $2,499 | 788 (14.5%) | 546 (10.9%) |
| $2,500 to $2,999 | 572 (10.5%) | 348 (7.0%) |
| $3,000 or more | 1,632 (30.0%) | 388 (7.8%) |
| Total | 5,446 (100.0%) | 4,989 (100.0%) |
Physical Housing Characteristics in Portsmouth
Housing Structures in Portsmouth
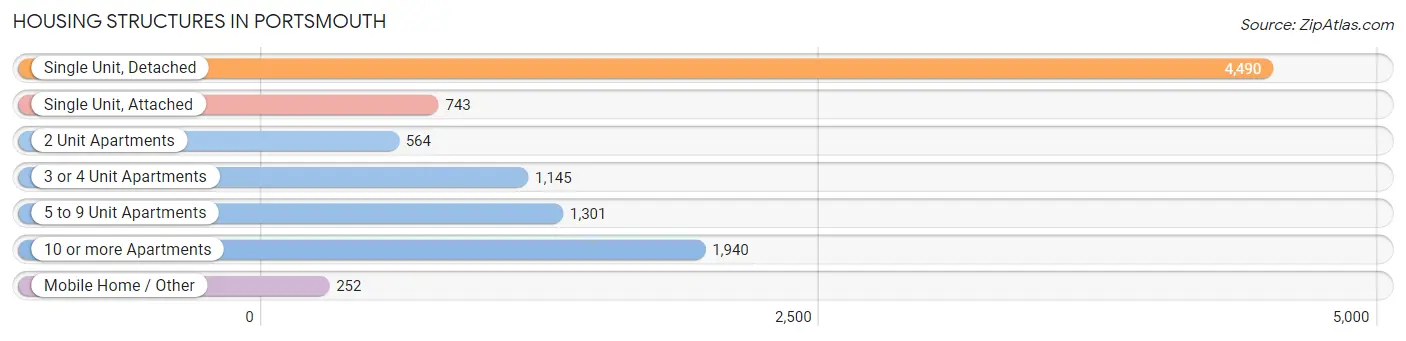
| Structure Type | # Housing Units | % Housing Units |
| Single Unit, Detached | 4,490 | 43.0% |
| Single Unit, Attached | 743 | 7.1% |
| 2 Unit Apartments | 564 | 5.4% |
| 3 or 4 Unit Apartments | 1,145 | 11.0% |
| 5 to 9 Unit Apartments | 1,301 | 12.5% |
| 10 or more Apartments | 1,940 | 18.6% |
| Mobile Home / Other | 252 | 2.4% |
| Total | 10,435 | 100.0% |
Housing Structures by Occupancy in Portsmouth
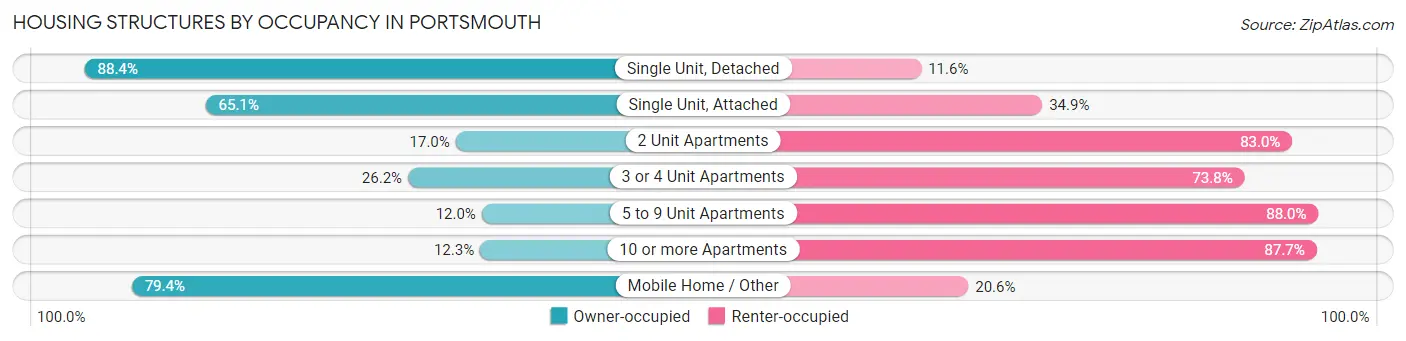
| Structure Type | Owner-occupied | Renter-occupied |
| Single Unit, Detached | 3,971 (88.4%) | 519 (11.6%) |
| Single Unit, Attached | 484 (65.1%) | 259 (34.9%) |
| 2 Unit Apartments | 96 (17.0%) | 468 (83.0%) |
| 3 or 4 Unit Apartments | 300 (26.2%) | 845 (73.8%) |
| 5 to 9 Unit Apartments | 156 (12.0%) | 1,145 (88.0%) |
| 10 or more Apartments | 239 (12.3%) | 1,701 (87.7%) |
| Mobile Home / Other | 200 (79.4%) | 52 (20.6%) |
| Total | 5,446 (52.2%) | 4,989 (47.8%) |
Housing Structures by Number of Rooms in Portsmouth
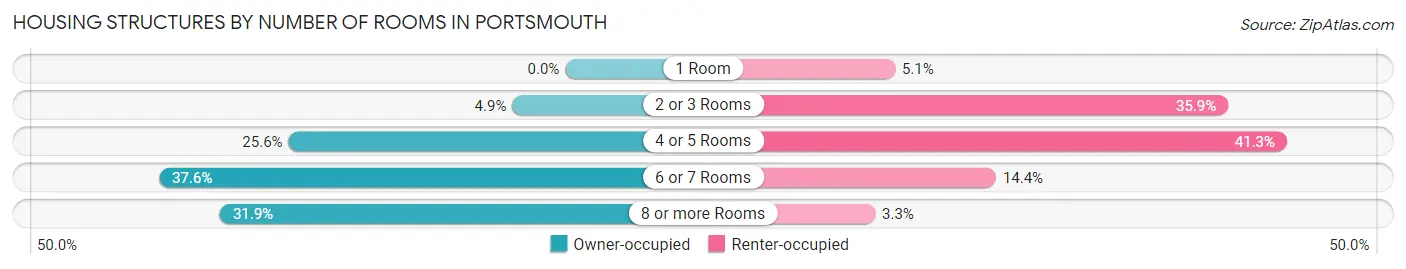
| Number of Rooms | Owner-occupied | Renter-occupied |
| 1 Room | 0 (0.0%) | 254 (5.1%) |
| 2 or 3 Rooms | 267 (4.9%) | 1,791 (35.9%) |
| 4 or 5 Rooms | 1,394 (25.6%) | 2,062 (41.3%) |
| 6 or 7 Rooms | 2,046 (37.6%) | 720 (14.4%) |
| 8 or more Rooms | 1,739 (31.9%) | 162 (3.3%) |
| Total | 5,446 (100.0%) | 4,989 (100.0%) |
Housing Structure by Heating Type in Portsmouth
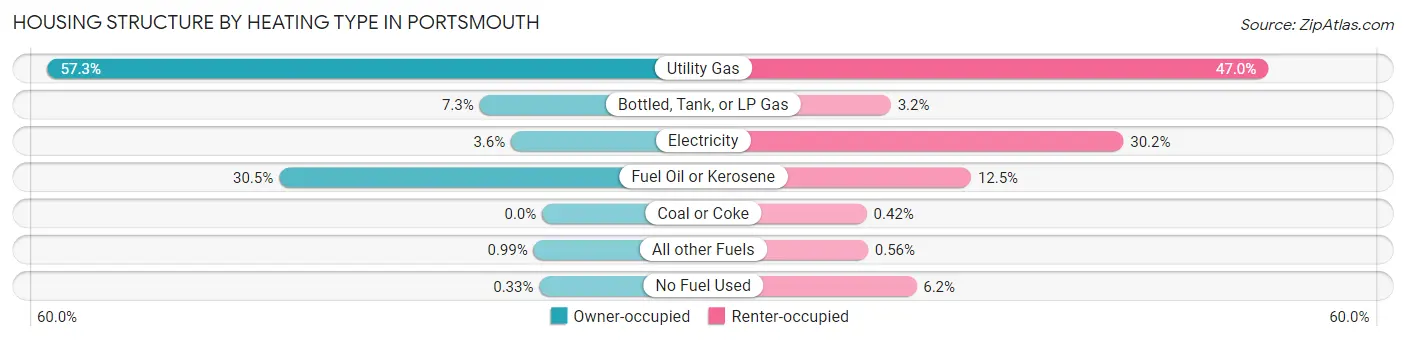
| Heating Type | Owner-occupied | Renter-occupied |
| Utility Gas | 3,122 (57.3%) | 2,343 (47.0%) |
| Bottled, Tank, or LP Gas | 395 (7.2%) | 160 (3.2%) |
| Electricity | 196 (3.6%) | 1,505 (30.2%) |
| Fuel Oil or Kerosene | 1,661 (30.5%) | 624 (12.5%) |
| Coal or Coke | 0 (0.0%) | 21 (0.4%) |
| All other Fuels | 54 (1.0%) | 28 (0.6%) |
| No Fuel Used | 18 (0.3%) | 308 (6.2%) |
| Total | 5,446 (100.0%) | 4,989 (100.0%) |
Household Vehicle Usage in Portsmouth
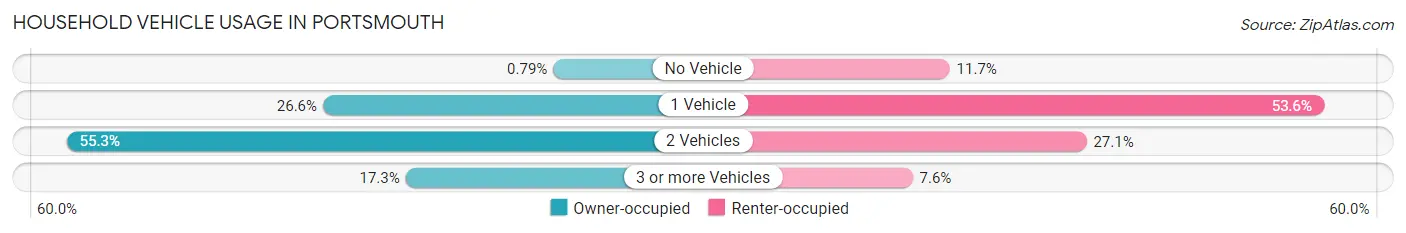
| Vehicles per Household | Owner-occupied | Renter-occupied |
| No Vehicle | 43 (0.8%) | 585 (11.7%) |
| 1 Vehicle | 1,448 (26.6%) | 2,676 (53.6%) |
| 2 Vehicles | 3,011 (55.3%) | 1,350 (27.1%) |
| 3 or more Vehicles | 944 (17.3%) | 378 (7.6%) |
| Total | 5,446 (100.0%) | 4,989 (100.0%) |
Real Estate & Mortgages in Portsmouth
Real Estate and Mortgage Overview in Portsmouth
| Characteristic | Without Mortgage | With Mortgage |
| Housing Units | 1,860 | 3,586 |
| Median Property Value | $549,900 | $612,300 |
| Median Household Income | $101,569 | $1,907 |
| Monthly Housing Costs | $1,136 | $1,583 |
| Real Estate Taxes | $7,251 | $25 |
Property Value by Mortgage Status in Portsmouth
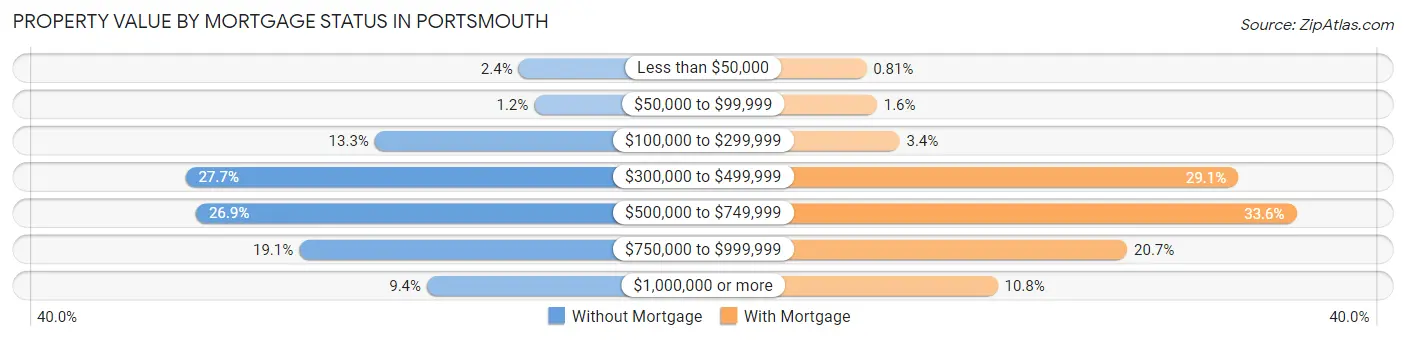
| Property Value | Without Mortgage | With Mortgage |
| Less than $50,000 | 44 (2.4%) | 29 (0.8%) |
| $50,000 to $99,999 | 22 (1.2%) | 58 (1.6%) |
| $100,000 to $299,999 | 248 (13.3%) | 120 (3.4%) |
| $300,000 to $499,999 | 516 (27.7%) | 1,045 (29.1%) |
| $500,000 to $749,999 | 501 (26.9%) | 1,204 (33.6%) |
| $750,000 to $999,999 | 355 (19.1%) | 742 (20.7%) |
| $1,000,000 or more | 174 (9.3%) | 388 (10.8%) |
| Total | 1,860 (100.0%) | 3,586 (100.0%) |
Household Income by Mortgage Status in Portsmouth
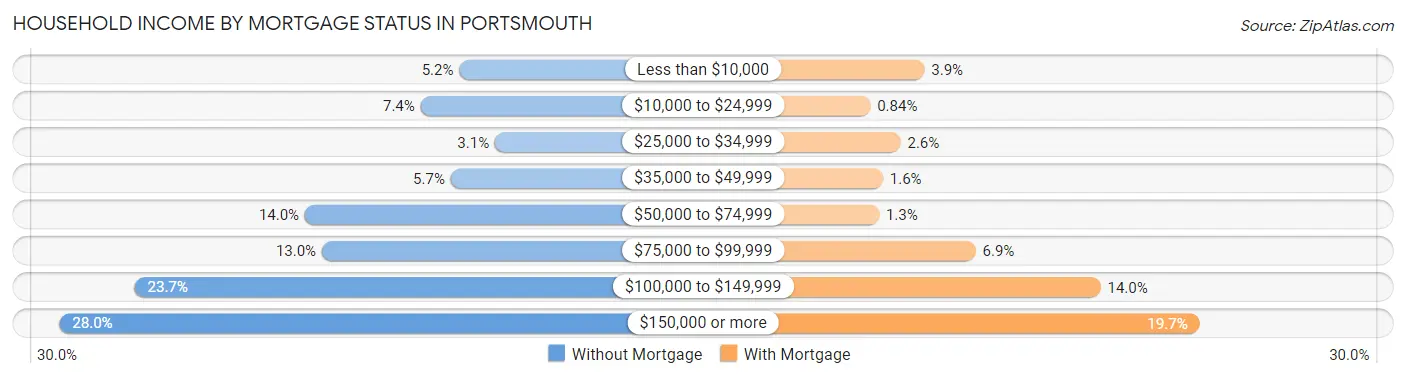
| Household Income | Without Mortgage | With Mortgage |
| Less than $10,000 | 96 (5.2%) | 141 (3.9%) |
| $10,000 to $24,999 | 137 (7.4%) | 30 (0.8%) |
| $25,000 to $34,999 | 58 (3.1%) | 92 (2.6%) |
| $35,000 to $49,999 | 105 (5.7%) | 56 (1.6%) |
| $50,000 to $74,999 | 260 (14.0%) | 48 (1.3%) |
| $75,000 to $99,999 | 242 (13.0%) | 246 (6.9%) |
| $100,000 to $149,999 | 441 (23.7%) | 502 (14.0%) |
| $150,000 or more | 521 (28.0%) | 705 (19.7%) |
| Total | 1,860 (100.0%) | 3,586 (100.0%) |
Property Value to Household Income Ratio in Portsmouth
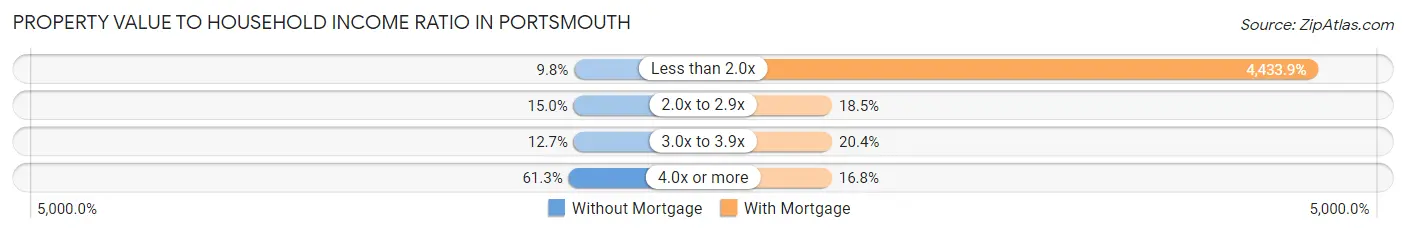
| Value-to-Income Ratio | Without Mortgage | With Mortgage |
| Less than 2.0x | 183 (9.8%) | 159,000 (4,433.9%) |
| 2.0x to 2.9x | 278 (14.9%) | 662 (18.5%) |
| 3.0x to 3.9x | 236 (12.7%) | 733 (20.4%) |
| 4.0x or more | 1,141 (61.3%) | 601 (16.8%) |
| Total | 1,860 (100.0%) | 3,586 (100.0%) |
Real Estate Taxes by Mortgage Status in Portsmouth
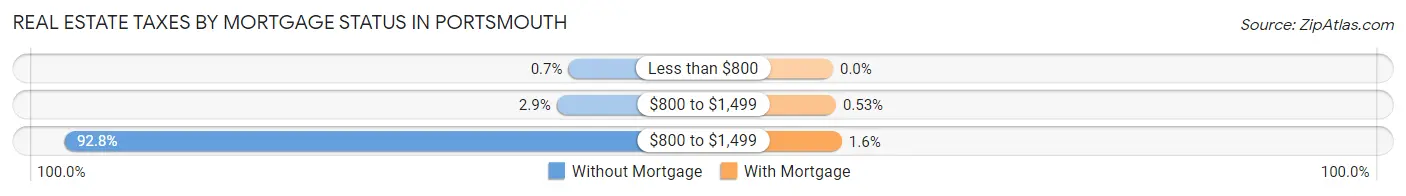
| Property Taxes | Without Mortgage | With Mortgage |
| Less than $800 | 13 (0.7%) | 0 (0.0%) |
| $800 to $1,499 | 53 (2.9%) | 19 (0.5%) |
| $800 to $1,499 | 1,726 (92.8%) | 58 (1.6%) |
| Total | 1,860 (100.0%) | 3,586 (100.0%) |
Health & Disability in Portsmouth
Health Insurance Coverage by Age in Portsmouth
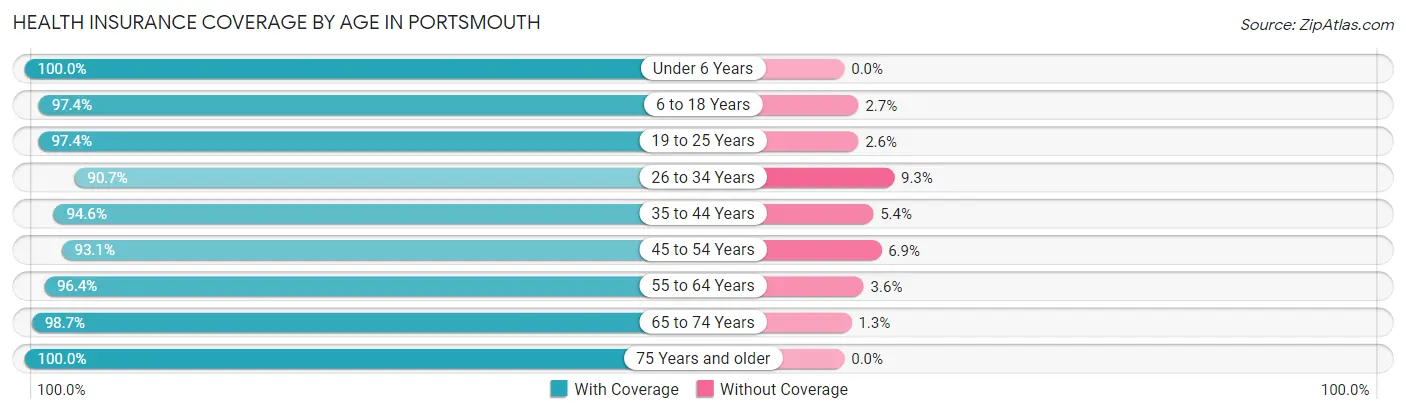
| Age Bracket | With Coverage | Without Coverage |
| Under 6 Years | 1,026 (100.0%) | 0 (0.0%) |
| 6 to 18 Years | 2,352 (97.4%) | 64 (2.6%) |
| 19 to 25 Years | 1,984 (97.4%) | 53 (2.6%) |
| 26 to 34 Years | 2,867 (90.7%) | 293 (9.3%) |
| 35 to 44 Years | 2,786 (94.6%) | 159 (5.4%) |
| 45 to 54 Years | 2,553 (93.1%) | 189 (6.9%) |
| 55 to 64 Years | 3,098 (96.4%) | 116 (3.6%) |
| 65 to 74 Years | 2,374 (98.7%) | 32 (1.3%) |
| 75 Years and older | 1,773 (100.0%) | 0 (0.0%) |
| Total | 20,813 (95.8%) | 906 (4.2%) |
Health Insurance Coverage by Citizenship Status in Portsmouth
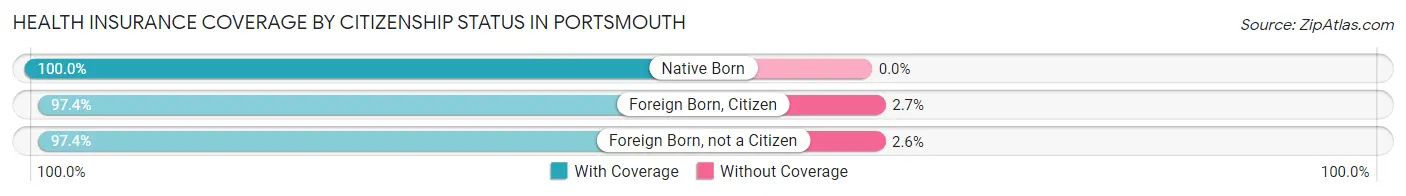
| Citizenship Status | With Coverage | Without Coverage |
| Native Born | 1,026 (100.0%) | 0 (0.0%) |
| Foreign Born, Citizen | 2,352 (97.4%) | 64 (2.6%) |
| Foreign Born, not a Citizen | 1,984 (97.4%) | 53 (2.6%) |
Health Insurance Coverage by Household Income in Portsmouth
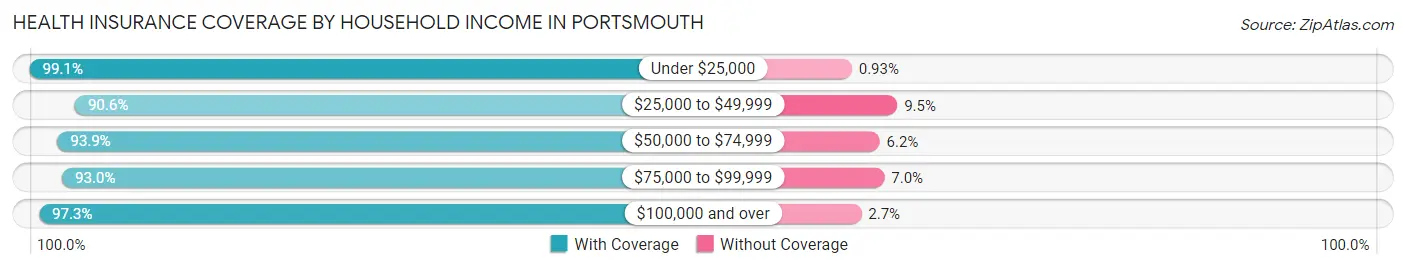
| Household Income | With Coverage | Without Coverage |
| Under $25,000 | 1,806 (99.1%) | 17 (0.9%) |
| $25,000 to $49,999 | 1,581 (90.5%) | 165 (9.5%) |
| $50,000 to $74,999 | 2,074 (93.9%) | 136 (6.1%) |
| $75,000 to $99,999 | 2,456 (93.0%) | 186 (7.0%) |
| $100,000 and over | 12,780 (97.3%) | 357 (2.7%) |
Public vs Private Health Insurance Coverage by Age in Portsmouth
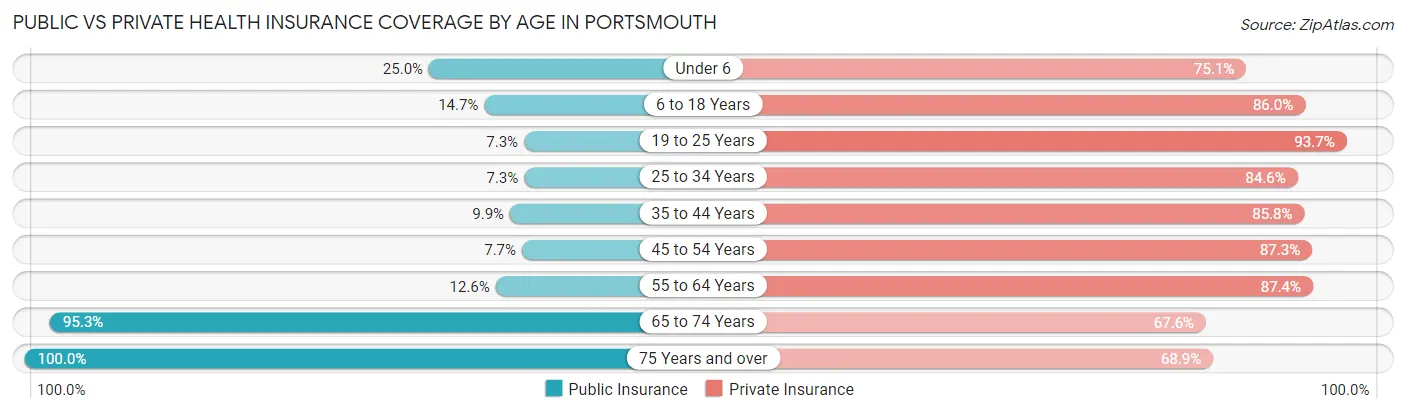
| Age Bracket | Public Insurance | Private Insurance |
| Under 6 | 256 (24.9%) | 770 (75.0%) |
| 6 to 18 Years | 355 (14.7%) | 2,077 (86.0%) |
| 19 to 25 Years | 149 (7.3%) | 1,908 (93.7%) |
| 25 to 34 Years | 230 (7.3%) | 2,673 (84.6%) |
| 35 to 44 Years | 292 (9.9%) | 2,528 (85.8%) |
| 45 to 54 Years | 211 (7.7%) | 2,393 (87.3%) |
| 55 to 64 Years | 404 (12.6%) | 2,810 (87.4%) |
| 65 to 74 Years | 2,293 (95.3%) | 1,626 (67.6%) |
| 75 Years and over | 1,773 (100.0%) | 1,222 (68.9%) |
| Total | 5,963 (27.5%) | 18,007 (82.9%) |
Disability Status by Sex by Age in Portsmouth
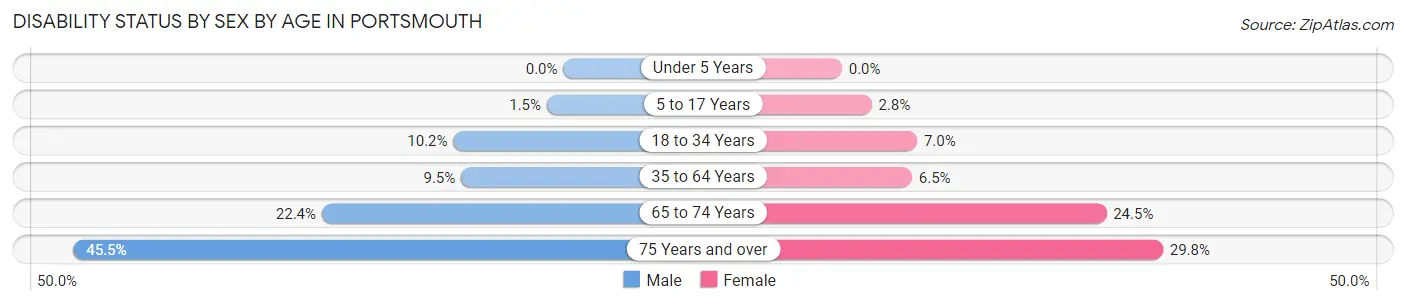
| Age Bracket | Male | Female |
| Under 5 Years | 0 (0.0%) | 0 (0.0%) |
| 5 to 17 Years | 18 (1.5%) | 34 (2.8%) |
| 18 to 34 Years | 266 (10.2%) | 190 (7.0%) |
| 35 to 64 Years | 432 (9.5%) | 283 (6.5%) |
| 65 to 74 Years | 247 (22.4%) | 320 (24.5%) |
| 75 Years and over | 336 (45.5%) | 308 (29.8%) |
Disability Class by Sex by Age in Portsmouth
Disability Class: Hearing Difficulty
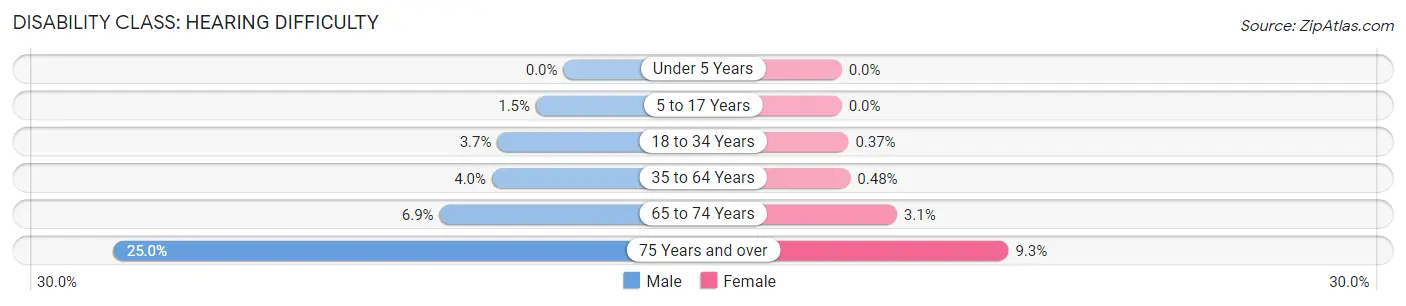
| Age Bracket | Male | Female |
| Under 5 Years | 0 (0.0%) | 0 (0.0%) |
| 5 to 17 Years | 18 (1.5%) | 0 (0.0%) |
| 18 to 34 Years | 96 (3.7%) | 10 (0.4%) |
| 35 to 64 Years | 181 (4.0%) | 21 (0.5%) |
| 65 to 74 Years | 76 (6.9%) | 40 (3.1%) |
| 75 Years and over | 185 (25.0%) | 96 (9.3%) |
Disability Class: Vision Difficulty
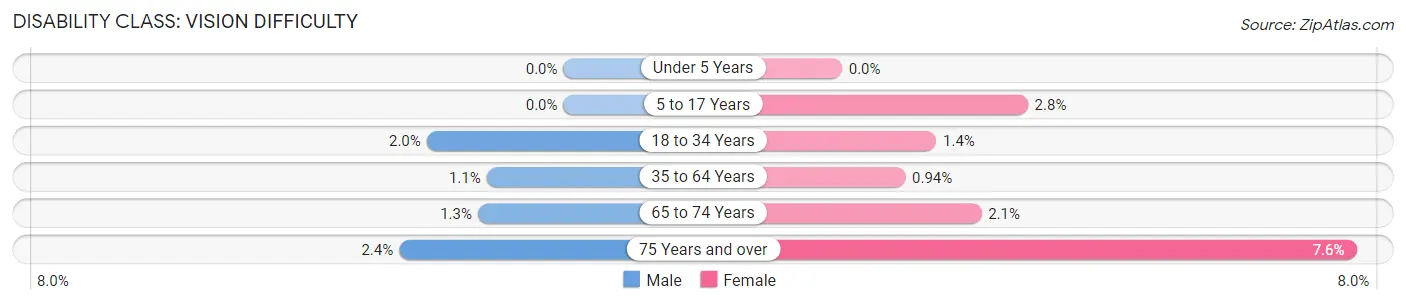
| Age Bracket | Male | Female |
| Under 5 Years | 0 (0.0%) | 0 (0.0%) |
| 5 to 17 Years | 0 (0.0%) | 34 (2.8%) |
| 18 to 34 Years | 53 (2.0%) | 38 (1.4%) |
| 35 to 64 Years | 52 (1.1%) | 41 (0.9%) |
| 65 to 74 Years | 14 (1.3%) | 27 (2.1%) |
| 75 Years and over | 18 (2.4%) | 79 (7.6%) |
Disability Class: Cognitive Difficulty
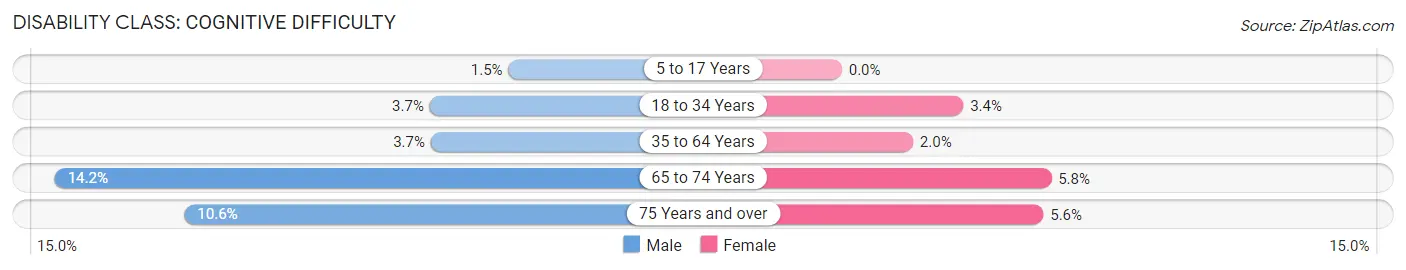
| Age Bracket | Male | Female |
| 5 to 17 Years | 18 (1.5%) | 0 (0.0%) |
| 18 to 34 Years | 97 (3.7%) | 92 (3.4%) |
| 35 to 64 Years | 168 (3.7%) | 86 (2.0%) |
| 65 to 74 Years | 156 (14.2%) | 76 (5.8%) |
| 75 Years and over | 78 (10.5%) | 58 (5.6%) |
Disability Class: Ambulatory Difficulty
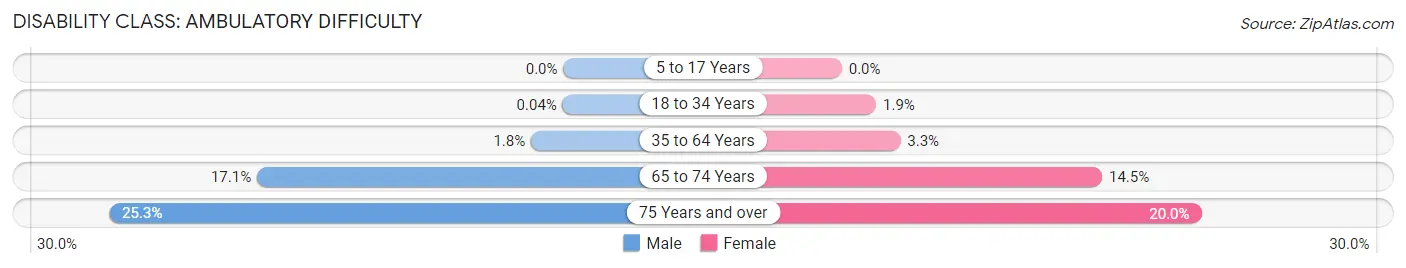
| Age Bracket | Male | Female |
| 5 to 17 Years | 0 (0.0%) | 0 (0.0%) |
| 18 to 34 Years | 1 (0.0%) | 52 (1.9%) |
| 35 to 64 Years | 82 (1.8%) | 142 (3.3%) |
| 65 to 74 Years | 188 (17.1%) | 189 (14.5%) |
| 75 Years and over | 187 (25.3%) | 207 (20.0%) |
Disability Class: Self-Care Difficulty
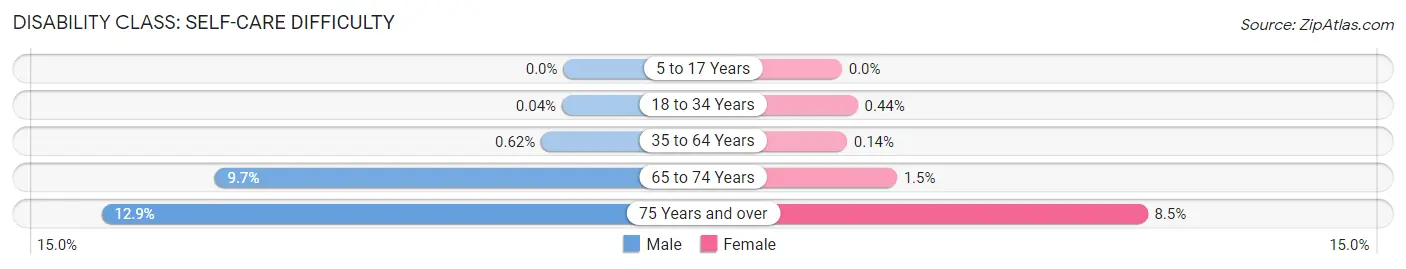
| Age Bracket | Male | Female |
| 5 to 17 Years | 0 (0.0%) | 0 (0.0%) |
| 18 to 34 Years | 1 (0.0%) | 12 (0.4%) |
| 35 to 64 Years | 28 (0.6%) | 6 (0.1%) |
| 65 to 74 Years | 107 (9.7%) | 20 (1.5%) |
| 75 Years and over | 95 (12.9%) | 88 (8.5%) |
Technology Access in Portsmouth
Computing Device Access in Portsmouth
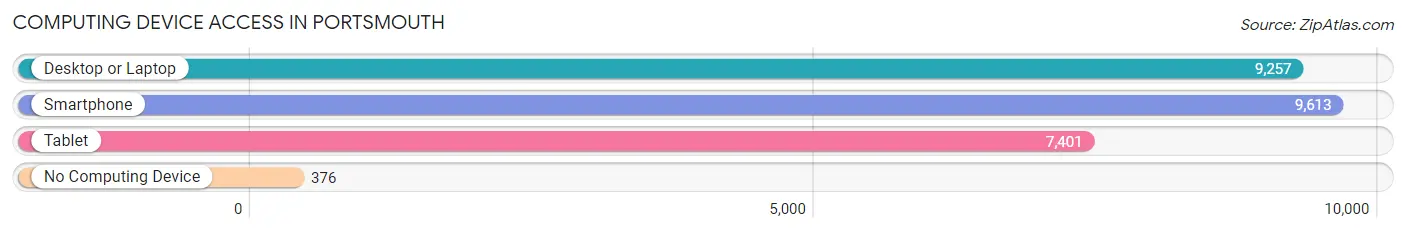
| Device Type | # Households | % Households |
| Desktop or Laptop | 9,257 | 88.7% |
| Smartphone | 9,613 | 92.1% |
| Tablet | 7,401 | 70.9% |
| No Computing Device | 376 | 3.6% |
| Total | 10,435 | 100.0% |
Internet Access in Portsmouth
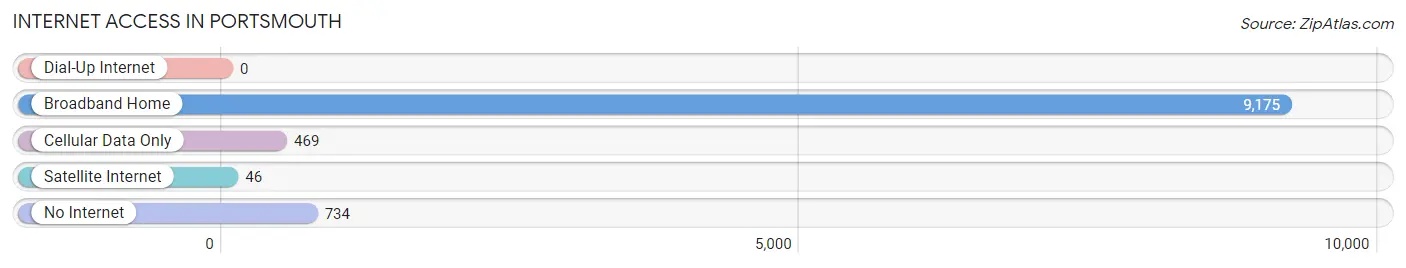
| Internet Type | # Households | % Households |
| Dial-Up Internet | 0 | 0.0% |
| Broadband Home | 9,175 | 87.9% |
| Cellular Data Only | 469 | 4.5% |
| Satellite Internet | 46 | 0.4% |
| No Internet | 734 | 7.0% |
| Total | 10,435 | 100.0% |
Portsmouth Summary
Portsmouth, New Hampshire is a city located in Rockingham County, in the southeastern corner of the state. It is the only city in the county and the fourth-largest city in the state. Portsmouth is situated along the Piscataqua River, which separates New Hampshire from Maine. The city is known for its rich history, vibrant economy, and diverse population.
Geography
Portsmouth is located in the southeastern corner of New Hampshire, on the Piscataqua River, which separates the state from Maine. The city is situated on a peninsula, with the Atlantic Ocean to the east and the Piscataqua River to the west. The city is bordered by the towns of Newington, Greenland, and Rye. The city covers an area of 16.3 square miles, with a population of 21,233 as of the 2010 census.
Climate
Portsmouth has a humid continental climate, with warm summers and cold winters. The average temperature in the summer is around 70°F, while the average temperature in the winter is around 25°F. The city receives an average of 43 inches of precipitation per year, with the most occurring in the summer months.
History
Portsmouth was first settled in 1630 by English colonists, who named it after the English port city of Portsmouth. The city was incorporated in 1653 and quickly became an important port city. During the American Revolution, Portsmouth was a major center of privateering and shipbuilding. In the 19th century, the city became a major center of industry, with the construction of the Portsmouth Naval Shipyard in 1800. The city was also a major center of the Underground Railroad, with many escaped slaves finding refuge in the city.
Economy
Portsmouth is a major economic center in the region, with a diverse economy that includes manufacturing, healthcare, education, and tourism. The city is home to the Portsmouth Naval Shipyard, which is the largest employer in the city. Other major employers include the University of New Hampshire, Portsmouth Regional Hospital, and the Pease International Tradeport. The city also has a thriving tourism industry, with many visitors coming to the city to explore its historic sites and attractions.
Demographics
As of the 2010 census, the population of Portsmouth was 21,233. The city has a diverse population, with the largest ethnic groups being White (83.3%), African American (7.2%), Asian (4.3%), and Hispanic or Latino (2.7%). The median household income in the city is $63,945, and the median home value is $346,400.
Portsmouth is a vibrant city with a rich history, diverse economy, and diverse population. The city is home to many historic sites and attractions, as well as a thriving economy and a diverse population. The city is a great place to live, work, and visit, and is sure to continue to be a major economic and cultural center in the region for years to come.
Common Questions
What is Per Capita Income in Portsmouth?
Per Capita income in Portsmouth is $67,924.
What is the Median Family Income in Portsmouth?
Median Family Income in Portsmouth is $135,696.
What is the Median Household income in Portsmouth?
Median Household Income in Portsmouth is $100,169.
What is Income or Wage Gap in Portsmouth?
Income or Wage Gap in Portsmouth is 23.5%.
Women in Portsmouth earn 76.5 cents for every dollar earned by a man.
What is Inequality or Gini Index in Portsmouth?
Inequality or Gini Index in Portsmouth is 0.47.
What is the Total Population of Portsmouth?
Total Population of Portsmouth is 22,138.
What is the Total Male Population of Portsmouth?
Total Male Population of Portsmouth is 10,744.
What is the Total Female Population of Portsmouth?
Total Female Population of Portsmouth is 11,394.
What is the Ratio of Males per 100 Females in Portsmouth?
There are 94.30 Males per 100 Females in Portsmouth.
What is the Ratio of Females per 100 Males in Portsmouth?
There are 106.05 Females per 100 Males in Portsmouth.
What is the Median Population Age in Portsmouth?
Median Population Age in Portsmouth is 42.1 Years.
What is the Average Family Size in Portsmouth
Average Family Size in Portsmouth is 2.8 People.
What is the Average Household Size in Portsmouth
Average Household Size in Portsmouth is 2.1 People.
How Large is the Labor Force in Portsmouth?
There are 13,191 People in the Labor Forcein in Portsmouth.
What is the Percentage of People in the Labor Force in Portsmouth?
68.6% of People are in the Labor Force in Portsmouth.
What is the Unemployment Rate in Portsmouth?
Unemployment Rate in Portsmouth is 2.5%.