Kings Park, NY Map & Demographics
Kings Park Map
Kings Park Overview
$55,999
PER CAPITA INCOME
$161,089
AVG FAMILY INCOME
$117,869
AVG HOUSEHOLD INCOME
30.5%
WAGE / INCOME GAP [ % ]
69.5¢/ $1
WAGE / INCOME GAP [ $ ]
0.42
INEQUALITY / GINI INDEX
16,730
TOTAL POPULATION
8,056
MALE POPULATION
8,674
FEMALE POPULATION
92.88
MALES / 100 FEMALES
107.67
FEMALES / 100 MALES
43.5
MEDIAN AGE
3.2
AVG FAMILY SIZE
2.6
AVG HOUSEHOLD SIZE
9,120
LABOR FORCE [ PEOPLE ]
65.5%
PERCENT IN LABOR FORCE
4.5%
UNEMPLOYMENT RATE
Kings Park Zip Codes
Kings Park Area Codes
Income in Kings Park
Income Overview in Kings Park
Per Capita Income in Kings Park is $55,999, while median incomes of families and households are $161,089 and $117,869 respectively.
| Characteristic | Number | Measure |
| Per Capita Income | 16,730 | $55,999 |
| Median Family Income | 4,257 | $161,089 |
| Mean Family Income | 4,257 | $172,836 |
| Median Household Income | 6,325 | $117,869 |
| Mean Household Income | 6,325 | $144,656 |
| Income Deficit | 4,257 | $0 |
| Wage / Income Gap (%) | 16,730 | 30.51% |
| Wage / Income Gap ($) | 16,730 | 69.49¢ per $1 |
| Gini / Inequality Index | 16,730 | 0.42 |
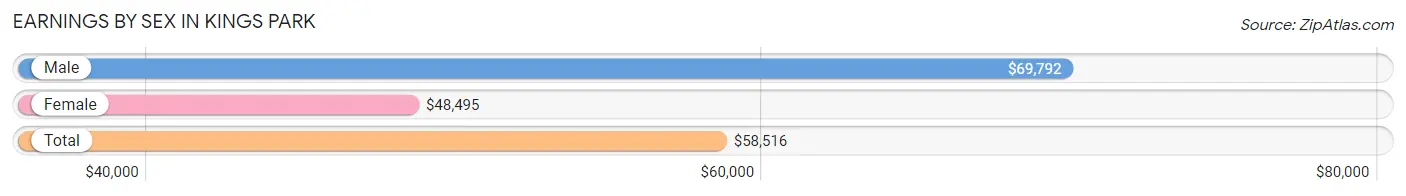
Earnings by Sex in Kings Park
Average Earnings in Kings Park are $58,516, $69,792 for men and $48,495 for women, a difference of 30.5%.
| Sex | Number | Average Earnings |
| Male | 4,745 (50.7%) | $69,792 |
| Female | 4,612 (49.3%) | $48,495 |
| Total | 9,357 (100.0%) | $58,516 |
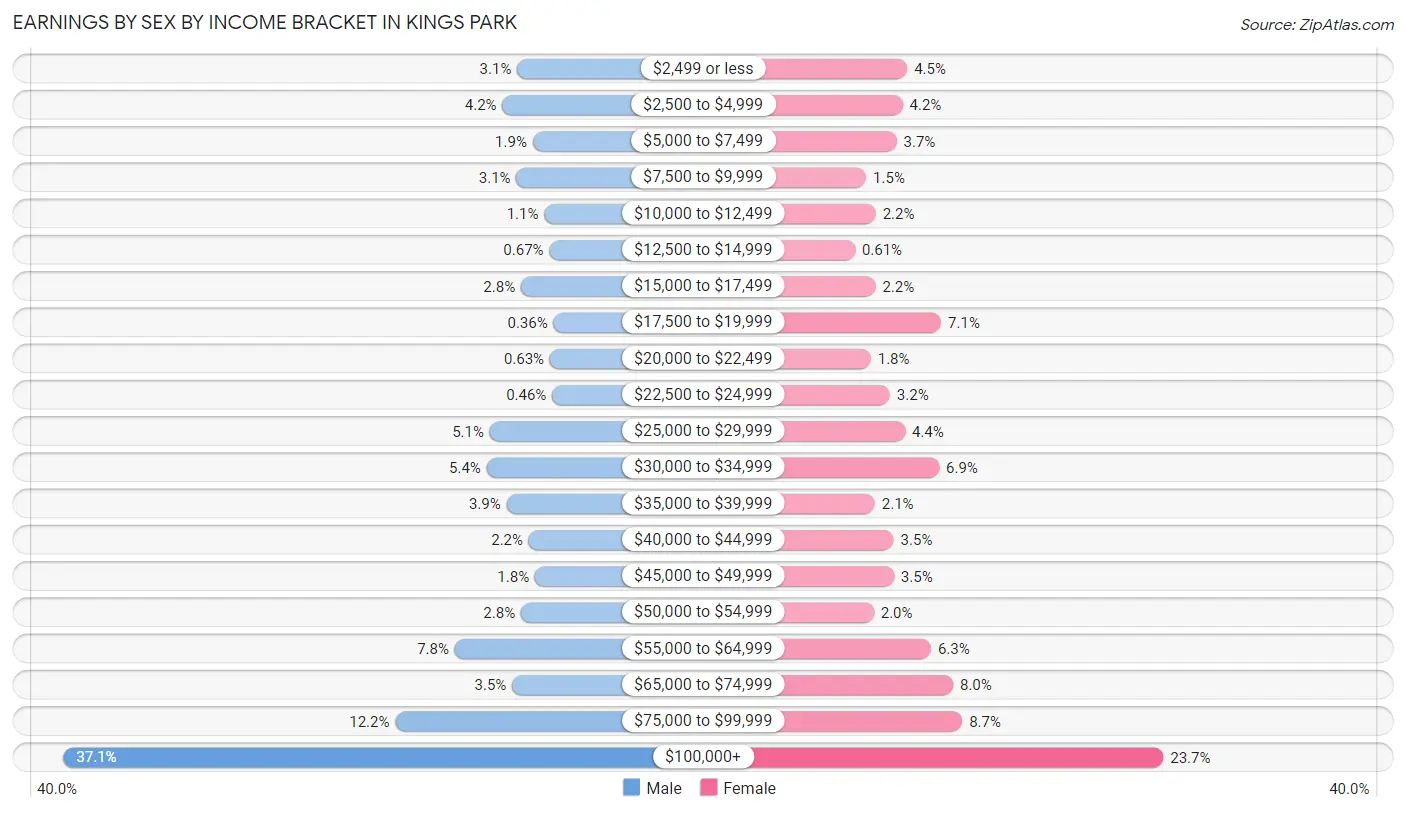
Earnings by Sex by Income Bracket in Kings Park
The most common earnings brackets in Kings Park are $100,000+ for men (1,760 | 37.1%) and $100,000+ for women (1,094 | 23.7%).
| Income | Male | Female |
| $2,499 or less | 146 (3.1%) | 209 (4.5%) |
| $2,500 to $4,999 | 199 (4.2%) | 193 (4.2%) |
| $5,000 to $7,499 | 91 (1.9%) | 172 (3.7%) |
| $7,500 to $9,999 | 149 (3.1%) | 67 (1.5%) |
| $10,000 to $12,499 | 50 (1.1%) | 100 (2.2%) |
| $12,500 to $14,999 | 32 (0.7%) | 28 (0.6%) |
| $15,000 to $17,499 | 133 (2.8%) | 99 (2.1%) |
| $17,500 to $19,999 | 17 (0.4%) | 326 (7.1%) |
| $20,000 to $22,499 | 30 (0.6%) | 83 (1.8%) |
| $22,500 to $24,999 | 22 (0.5%) | 149 (3.2%) |
| $25,000 to $29,999 | 244 (5.1%) | 201 (4.4%) |
| $30,000 to $34,999 | 255 (5.4%) | 319 (6.9%) |
| $35,000 to $39,999 | 184 (3.9%) | 97 (2.1%) |
| $40,000 to $44,999 | 105 (2.2%) | 162 (3.5%) |
| $45,000 to $49,999 | 83 (1.8%) | 163 (3.5%) |
| $50,000 to $54,999 | 133 (2.8%) | 93 (2.0%) |
| $55,000 to $64,999 | 368 (7.8%) | 291 (6.3%) |
| $65,000 to $74,999 | 164 (3.5%) | 367 (8.0%) |
| $75,000 to $99,999 | 580 (12.2%) | 399 (8.6%) |
| $100,000+ | 1,760 (37.1%) | 1,094 (23.7%) |
| Total | 4,745 (100.0%) | 4,612 (100.0%) |
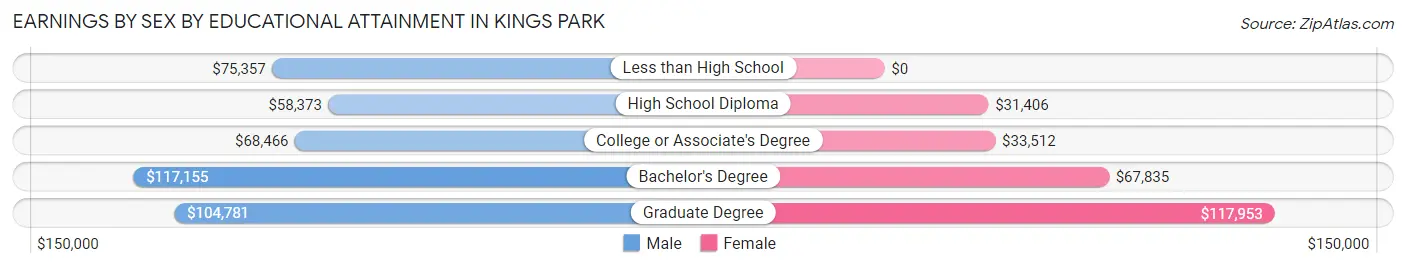
Earnings by Sex by Educational Attainment in Kings Park
Average earnings in Kings Park are $88,246 for men and $59,825 for women, a difference of 32.2%. Men with an educational attainment of bachelor's degree enjoy the highest average annual earnings of $117,155, while those with high school diploma education earn the least with $58,373. Women with an educational attainment of graduate degree earn the most with the average annual earnings of $117,953, while those with high school diploma education have the smallest earnings of $31,406.
| Educational Attainment | Male Income | Female Income |
| Less than High School | $75,357 | $0 |
| High School Diploma | $58,373 | $31,406 |
| College or Associate's Degree | $68,466 | $33,512 |
| Bachelor's Degree | $117,155 | $67,835 |
| Graduate Degree | $104,781 | $117,953 |
| Total | $88,246 | $59,825 |
Family Income in Kings Park
Family Income Brackets in Kings Park
According to the Kings Park family income data, there are 1,362 families falling into the $200,000+ income range, which is the most common income bracket and makes up 32.0% of all families. Conversely, the $10,000 to $14,999 income bracket is the least frequent group with only 13 families (0.3%) belonging to this category.
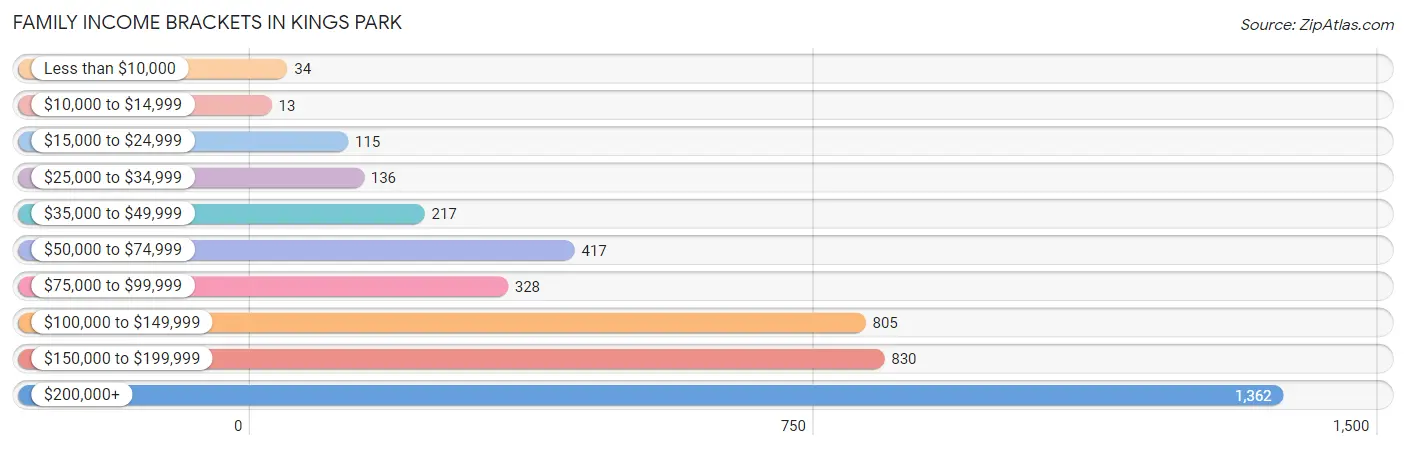
| Income Bracket | # Families | % Families |
| Less than $10,000 | 34 | 0.8% |
| $10,000 to $14,999 | 13 | 0.3% |
| $15,000 to $24,999 | 115 | 2.7% |
| $25,000 to $34,999 | 136 | 3.2% |
| $35,000 to $49,999 | 217 | 5.1% |
| $50,000 to $74,999 | 417 | 9.8% |
| $75,000 to $99,999 | 328 | 7.7% |
| $100,000 to $149,999 | 805 | 18.9% |
| $150,000 to $199,999 | 830 | 19.5% |
| $200,000+ | 1,362 | 32.0% |
Family Income by Famaliy Size in Kings Park
4-person families (1,013 | 23.8%) account for the highest median family income in Kings Park with $206,850 per family, while 4-person families (1,013 | 23.8%) have the highest median income of $51,712 per family member.
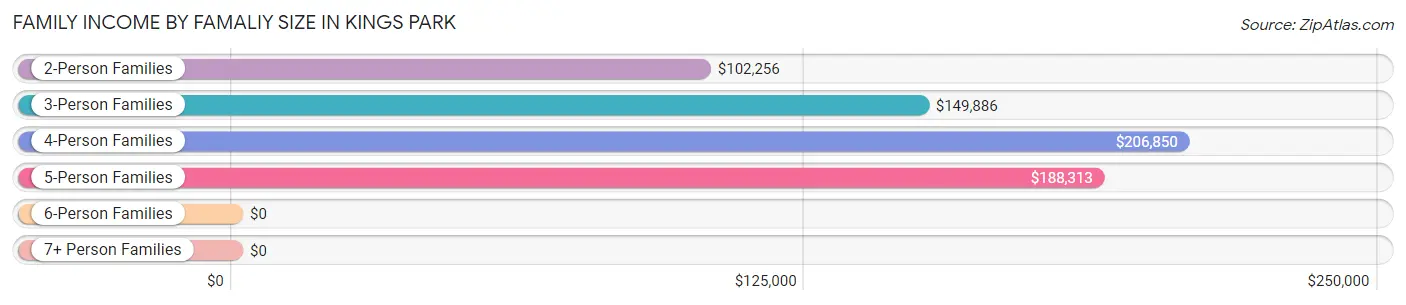
| Income Bracket | # Families | Median Income |
| 2-Person Families | 1,746 (41.0%) | $102,256 |
| 3-Person Families | 1,061 (24.9%) | $149,886 |
| 4-Person Families | 1,013 (23.8%) | $206,850 |
| 5-Person Families | 371 (8.7%) | $188,313 |
| 6-Person Families | 34 (0.8%) | $0 |
| 7+ Person Families | 32 (0.7%) | $0 |
| Total | 4,257 (100.0%) | $161,089 |
Family Income by Number of Earners in Kings Park
The median family income in Kings Park is $161,089, with families comprising 3+ earners (686) having the highest median family income of $188,448, while families with no earners (514) have the lowest median family income of $61,250, accounting for 16.1% and 12.1% of families, respectively.
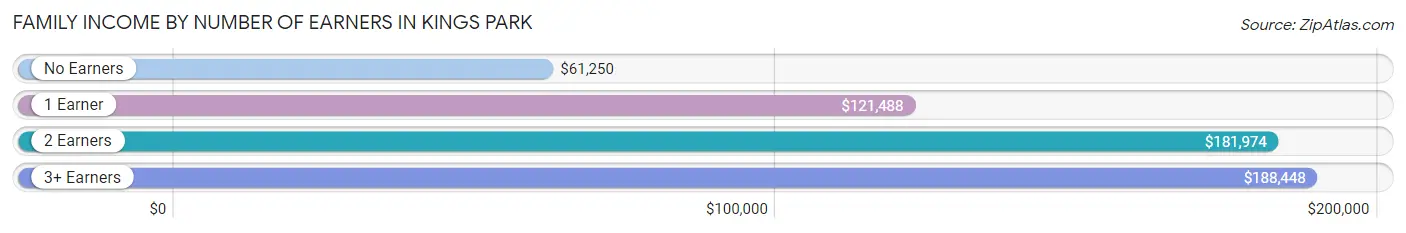
| Number of Earners | # Families | Median Income |
| No Earners | 514 (12.1%) | $61,250 |
| 1 Earner | 1,131 (26.6%) | $121,488 |
| 2 Earners | 1,926 (45.2%) | $181,974 |
| 3+ Earners | 686 (16.1%) | $188,448 |
| Total | 4,257 (100.0%) | $161,089 |
Household Income in Kings Park
Household Income Brackets in Kings Park
With 1,480 households falling in the category, the $200,000+ income range is the most frequent in Kings Park, accounting for 23.4% of all households. In contrast, only 38 households (0.6%) fall into the $10,000 to $14,999 income bracket, making it the least populous group.
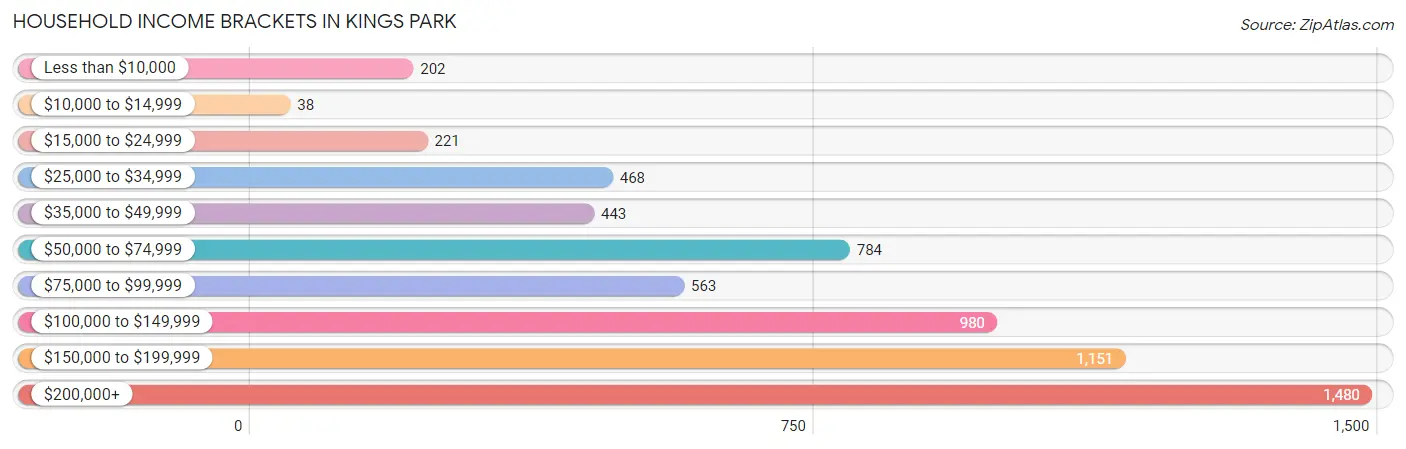
| Income Bracket | # Households | % Households |
| Less than $10,000 | 202 | 3.2% |
| $10,000 to $14,999 | 38 | 0.6% |
| $15,000 to $24,999 | 221 | 3.5% |
| $25,000 to $34,999 | 468 | 7.4% |
| $35,000 to $49,999 | 443 | 7.0% |
| $50,000 to $74,999 | 784 | 12.4% |
| $75,000 to $99,999 | 563 | 8.9% |
| $100,000 to $149,999 | 980 | 15.5% |
| $150,000 to $199,999 | 1,151 | 18.2% |
| $200,000+ | 1,480 | 23.4% |
Household Income by Householder Age in Kings Park
The median household income in Kings Park is $117,869, with the highest median household income of $174,042 found in the 25 to 44 years age bracket for the primary householder. A total of 1,511 households (23.9%) fall into this category. Meanwhile, the 15 to 24 years age bracket for the primary householder has the lowest median household income of $0, with 39 households (0.6%) in this group.
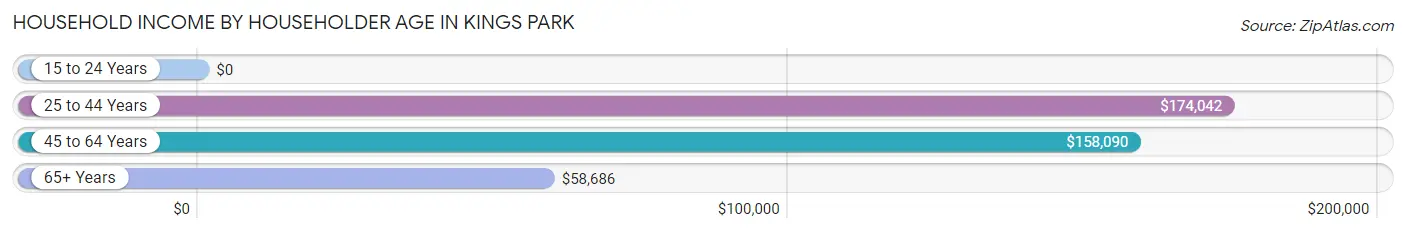
| Income Bracket | # Households | Median Income |
| 15 to 24 Years | 39 (0.6%) | $0 |
| 25 to 44 Years | 1,511 (23.9%) | $174,042 |
| 45 to 64 Years | 2,459 (38.9%) | $158,090 |
| 65+ Years | 2,316 (36.6%) | $58,686 |
| Total | 6,325 (100.0%) | $117,869 |
Poverty in Kings Park
Income Below Poverty by Sex and Age in Kings Park
With 1.1% poverty level for males and 4.0% for females among the residents of Kings Park, 75 year old and over males and 55 to 64 year old females are the most vulnerable to poverty, with 29 males (3.6%) and 99 females (9.3%) in their respective age groups living below the poverty level.
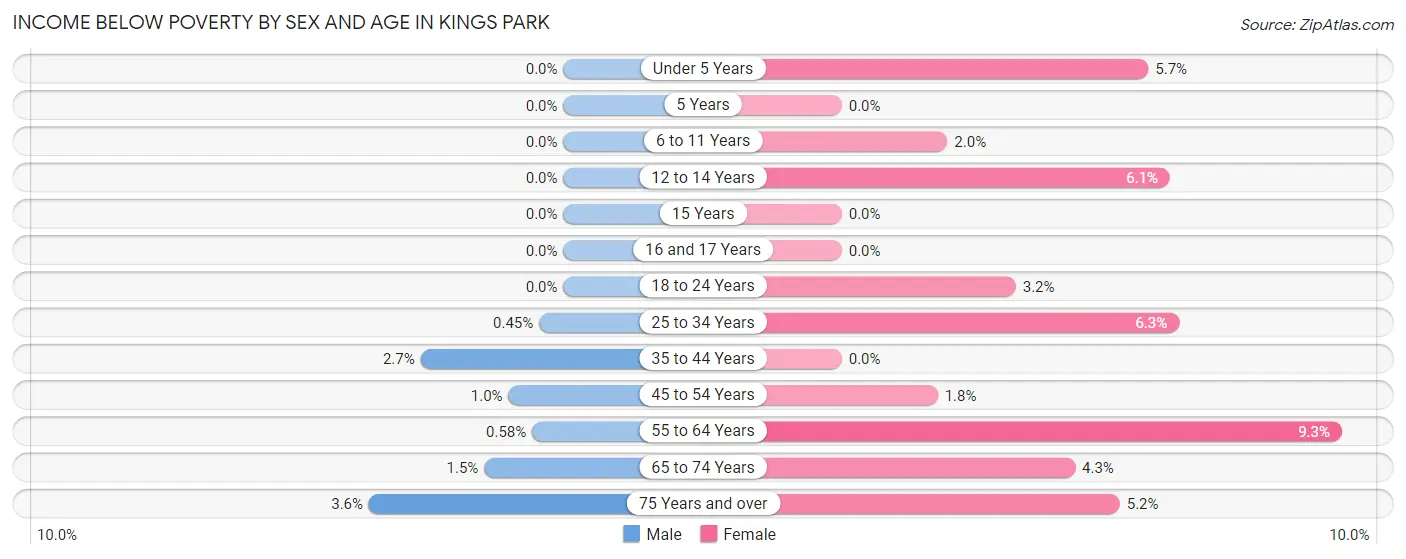
| Age Bracket | Male | Female |
| Under 5 Years | 0 (0.0%) | 17 (5.7%) |
| 5 Years | 0 (0.0%) | 0 (0.0%) |
| 6 to 11 Years | 0 (0.0%) | 12 (2.0%) |
| 12 to 14 Years | 0 (0.0%) | 12 (6.1%) |
| 15 Years | 0 (0.0%) | 0 (0.0%) |
| 16 and 17 Years | 0 (0.0%) | 0 (0.0%) |
| 18 to 24 Years | 0 (0.0%) | 21 (3.2%) |
| 25 to 34 Years | 4 (0.4%) | 65 (6.3%) |
| 35 to 44 Years | 29 (2.6%) | 0 (0.0%) |
| 45 to 54 Years | 12 (1.0%) | 21 (1.8%) |
| 55 to 64 Years | 6 (0.6%) | 99 (9.3%) |
| 65 to 74 Years | 10 (1.5%) | 39 (4.3%) |
| 75 Years and over | 29 (3.6%) | 57 (5.2%) |
| Total | 90 (1.1%) | 343 (4.0%) |
Income Above Poverty by Sex and Age in Kings Park
According to the poverty statistics in Kings Park, males aged under 5 years and females aged 5 years are the age groups that are most secure financially, with 100.0% of males and 100.0% of females in these age groups living above the poverty line.
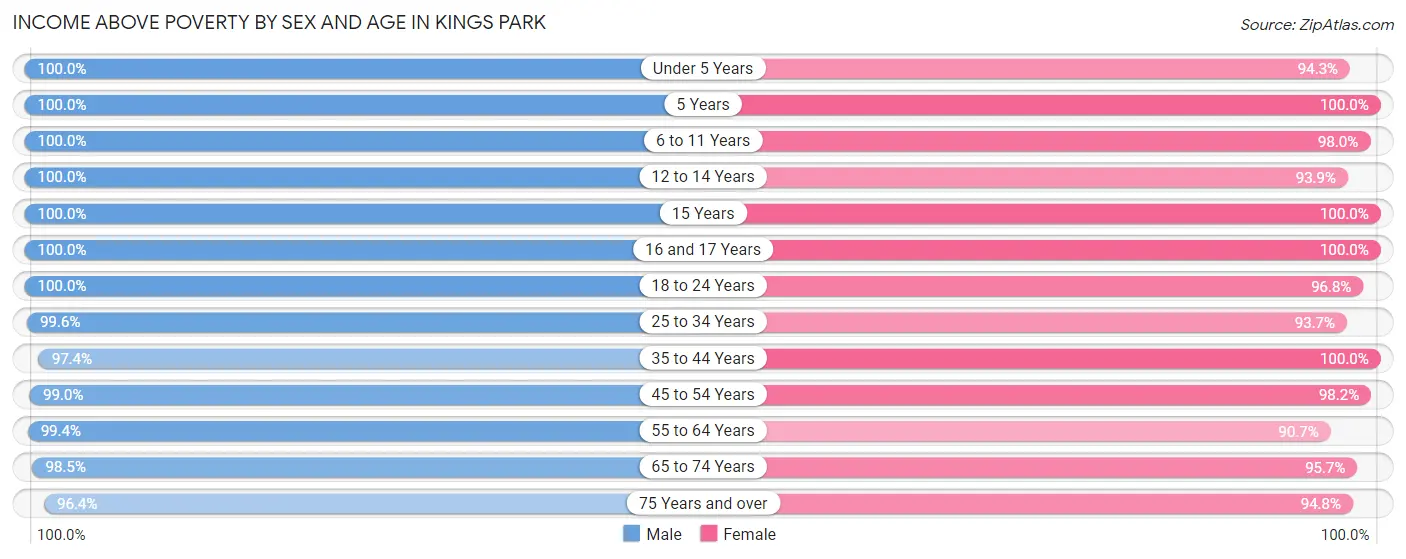
| Age Bracket | Male | Female |
| Under 5 Years | 583 (100.0%) | 282 (94.3%) |
| 5 Years | 19 (100.0%) | 49 (100.0%) |
| 6 to 11 Years | 530 (100.0%) | 600 (98.0%) |
| 12 to 14 Years | 217 (100.0%) | 185 (93.9%) |
| 15 Years | 107 (100.0%) | 194 (100.0%) |
| 16 and 17 Years | 129 (100.0%) | 332 (100.0%) |
| 18 to 24 Years | 705 (100.0%) | 630 (96.8%) |
| 25 to 34 Years | 894 (99.6%) | 973 (93.7%) |
| 35 to 44 Years | 1,064 (97.4%) | 923 (100.0%) |
| 45 to 54 Years | 1,169 (99.0%) | 1,156 (98.2%) |
| 55 to 64 Years | 1,034 (99.4%) | 968 (90.7%) |
| 65 to 74 Years | 669 (98.5%) | 861 (95.7%) |
| 75 Years and over | 774 (96.4%) | 1,047 (94.8%) |
| Total | 7,894 (98.9%) | 8,200 (96.0%) |
Income Below Poverty Among Married-Couple Families in Kings Park
The poverty statistics for married-couple families in Kings Park show that 0.6% or 21 of the total 3,343 families live below the poverty line. Families with 3 or 4 children have the highest poverty rate of 4.7%, comprising of 11 families. On the other hand, families with 1 or 2 children have the lowest poverty rate of 0.0%, which includes 0 families.
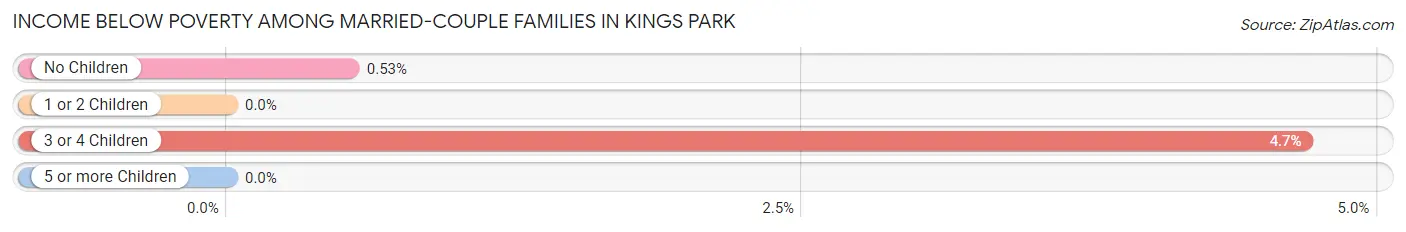
| Children | Above Poverty | Below Poverty |
| No Children | 1,878 (99.5%) | 10 (0.5%) |
| 1 or 2 Children | 1,220 (100.0%) | 0 (0.0%) |
| 3 or 4 Children | 224 (95.3%) | 11 (4.7%) |
| 5 or more Children | 0 (0.0%) | 0 (0.0%) |
| Total | 3,322 (99.4%) | 21 (0.6%) |
Income Below Poverty Among Single-Parent Households in Kings Park
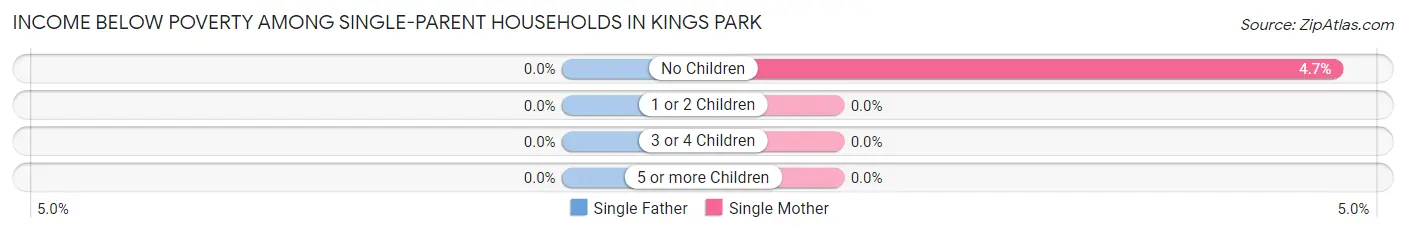
| Children | Single Father | Single Mother |
| No Children | 0 (0.0%) | 22 (4.6%) |
| 1 or 2 Children | 0 (0.0%) | 0 (0.0%) |
| 3 or 4 Children | 0 (0.0%) | 0 (0.0%) |
| 5 or more Children | 0 (0.0%) | 0 (0.0%) |
| Total | 0 (0.0%) | 22 (3.0%) |
Income Below Poverty Among Married-Couple vs Single-Parent Households in Kings Park
The poverty data for Kings Park shows that 21 of the married-couple family households (0.6%) and 22 of the single-parent households (2.4%) are living below the poverty level. Within the married-couple family households, those with 3 or 4 children have the highest poverty rate, with 11 households (4.7%) falling below the poverty line. Among the single-parent households, those with no children have the highest poverty rate, with 22 household (3.6%) living below poverty.
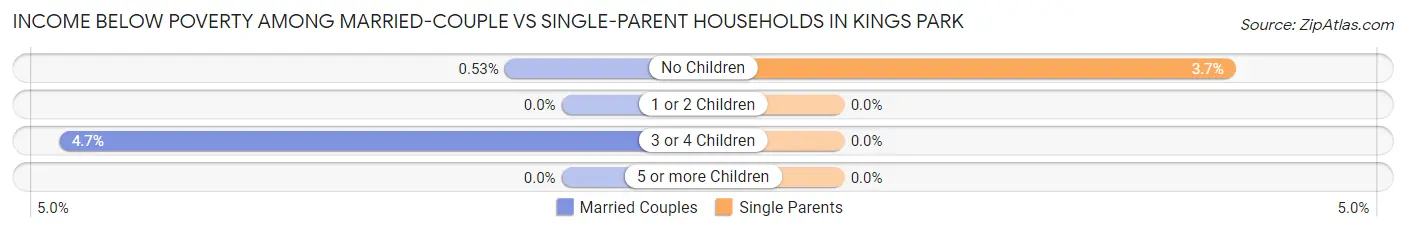
| Children | Married-Couple Families | Single-Parent Households |
| No Children | 10 (0.5%) | 22 (3.6%) |
| 1 or 2 Children | 0 (0.0%) | 0 (0.0%) |
| 3 or 4 Children | 11 (4.7%) | 0 (0.0%) |
| 5 or more Children | 0 (0.0%) | 0 (0.0%) |
| Total | 21 (0.6%) | 22 (2.4%) |
Race in Kings Park
The most populous races in Kings Park are White / Caucasian (15,016 | 89.7%), Hispanic or Latino (1,525 | 9.1%), and Two or more Races (693 | 4.1%).
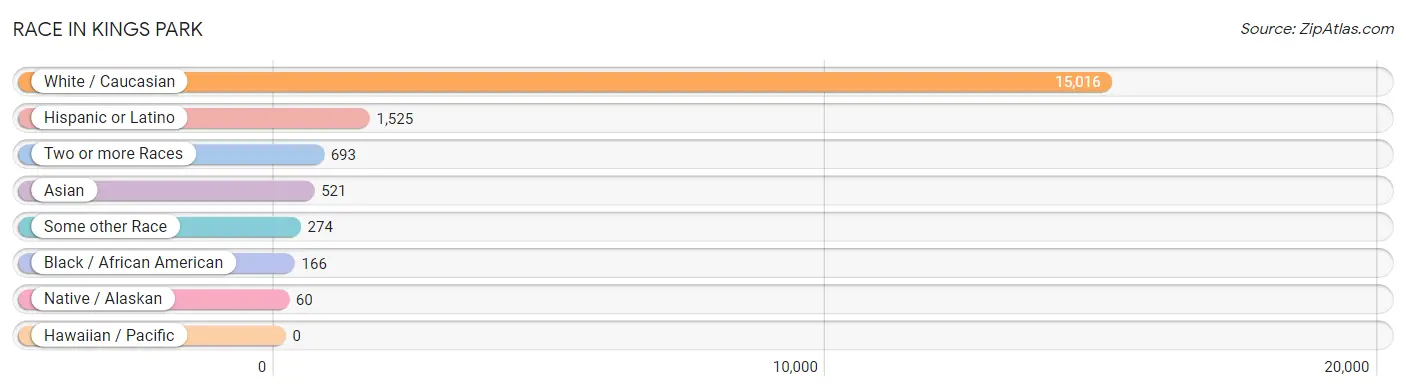
| Race | # Population | % Population |
| Asian | 521 | 3.1% |
| Black / African American | 166 | 1.0% |
| Hawaiian / Pacific | 0 | 0.0% |
| Hispanic or Latino | 1,525 | 9.1% |
| Native / Alaskan | 60 | 0.4% |
| White / Caucasian | 15,016 | 89.7% |
| Two or more Races | 693 | 4.1% |
| Some other Race | 274 | 1.6% |
| Total | 16,730 | 100.0% |
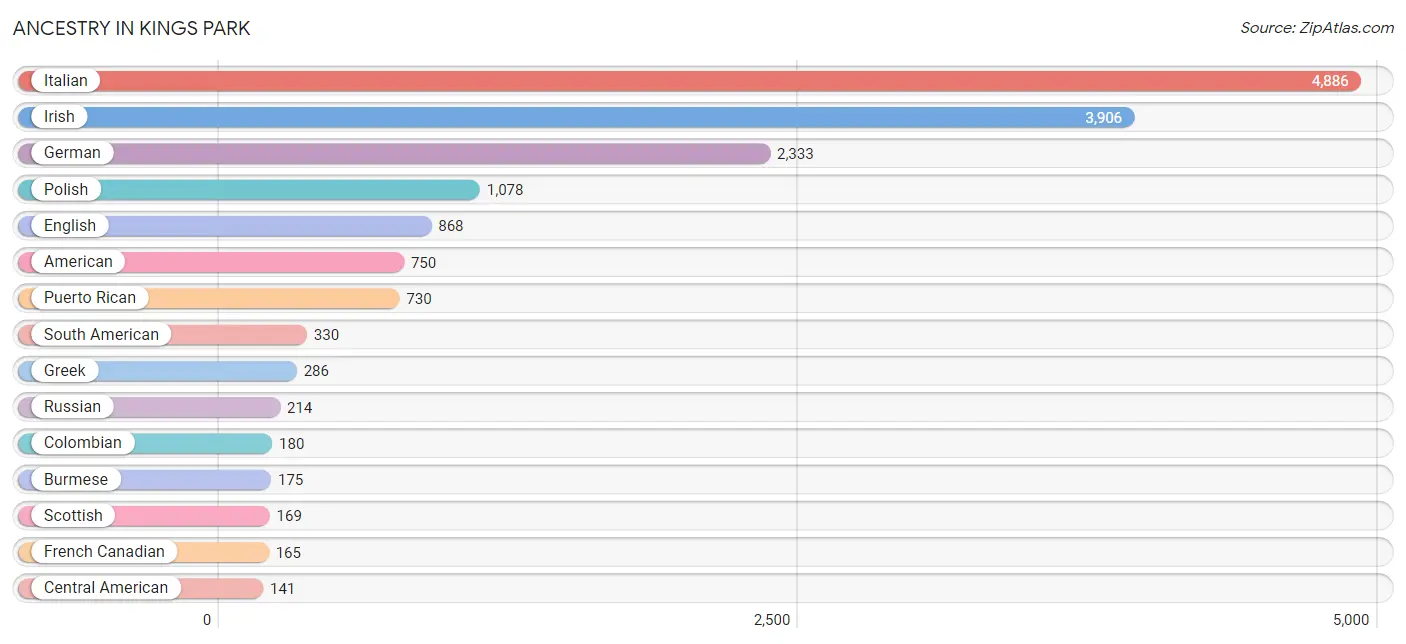
Ancestry in Kings Park
The most populous ancestries reported in Kings Park are Italian (4,886 | 29.2%), Irish (3,906 | 23.4%), German (2,333 | 14.0%), Polish (1,078 | 6.4%), and English (868 | 5.2%), together accounting for 78.1% of all Kings Park residents.
| Ancestry | # Population | % Population |
| Afghan | 42 | 0.3% |
| American | 750 | 4.5% |
| Arab | 61 | 0.4% |
| Armenian | 43 | 0.3% |
| Australian | 2 | 0.0% |
| Austrian | 92 | 0.5% |
| Basque | 24 | 0.1% |
| Belgian | 7 | 0.0% |
| Blackfeet | 7 | 0.0% |
| British | 23 | 0.1% |
| Burmese | 175 | 1.1% |
| Canadian | 32 | 0.2% |
| Central American | 141 | 0.8% |
| Central American Indian | 64 | 0.4% |
| Cherokee | 40 | 0.2% |
| Colombian | 180 | 1.1% |
| Cuban | 60 | 0.4% |
| Czech | 73 | 0.4% |
| Danish | 10 | 0.1% |
| Dominican | 31 | 0.2% |
| Dutch | 115 | 0.7% |
| Eastern European | 102 | 0.6% |
| Ecuadorian | 69 | 0.4% |
| English | 868 | 5.2% |
| European | 139 | 0.8% |
| Finnish | 128 | 0.8% |
| French | 98 | 0.6% |
| French Canadian | 165 | 1.0% |
| German | 2,333 | 14.0% |
| Greek | 286 | 1.7% |
| Guatemalan | 13 | 0.1% |
| Guyanese | 7 | 0.0% |
| Haitian | 60 | 0.4% |
| Hungarian | 78 | 0.5% |
| Indian (Asian) | 112 | 0.7% |
| Irish | 3,906 | 23.4% |
| Italian | 4,886 | 29.2% |
| Jamaican | 114 | 0.7% |
| Korean | 92 | 0.5% |
| Lebanese | 44 | 0.3% |
| Lithuanian | 45 | 0.3% |
| Malaysian | 42 | 0.3% |
| Mexican | 42 | 0.3% |
| Mexican American Indian | 30 | 0.2% |
| Nicaraguan | 14 | 0.1% |
| Norwegian | 66 | 0.4% |
| Panamanian | 3 | 0.0% |
| Peruvian | 9 | 0.1% |
| Polish | 1,078 | 6.4% |
| Portuguese | 31 | 0.2% |
| Puerto Rican | 730 | 4.4% |
| Romanian | 54 | 0.3% |
| Russian | 214 | 1.3% |
| Salvadoran | 111 | 0.7% |
| Scandinavian | 7 | 0.0% |
| Scotch-Irish | 37 | 0.2% |
| Scottish | 169 | 1.0% |
| Slovak | 71 | 0.4% |
| South American | 330 | 2.0% |
| Spaniard | 131 | 0.8% |
| Spanish | 60 | 0.4% |
| Swedish | 64 | 0.4% |
| Swiss | 18 | 0.1% |
| Syrian | 17 | 0.1% |
| Thai | 61 | 0.4% |
| Turkish | 15 | 0.1% |
| Ukrainian | 66 | 0.4% |
| Uruguayan | 44 | 0.3% |
| Venezuelan | 28 | 0.2% |
| Welsh | 16 | 0.1% |
| Yugoslavian | 36 | 0.2% | View All 71 Rows |
Immigrants in Kings Park
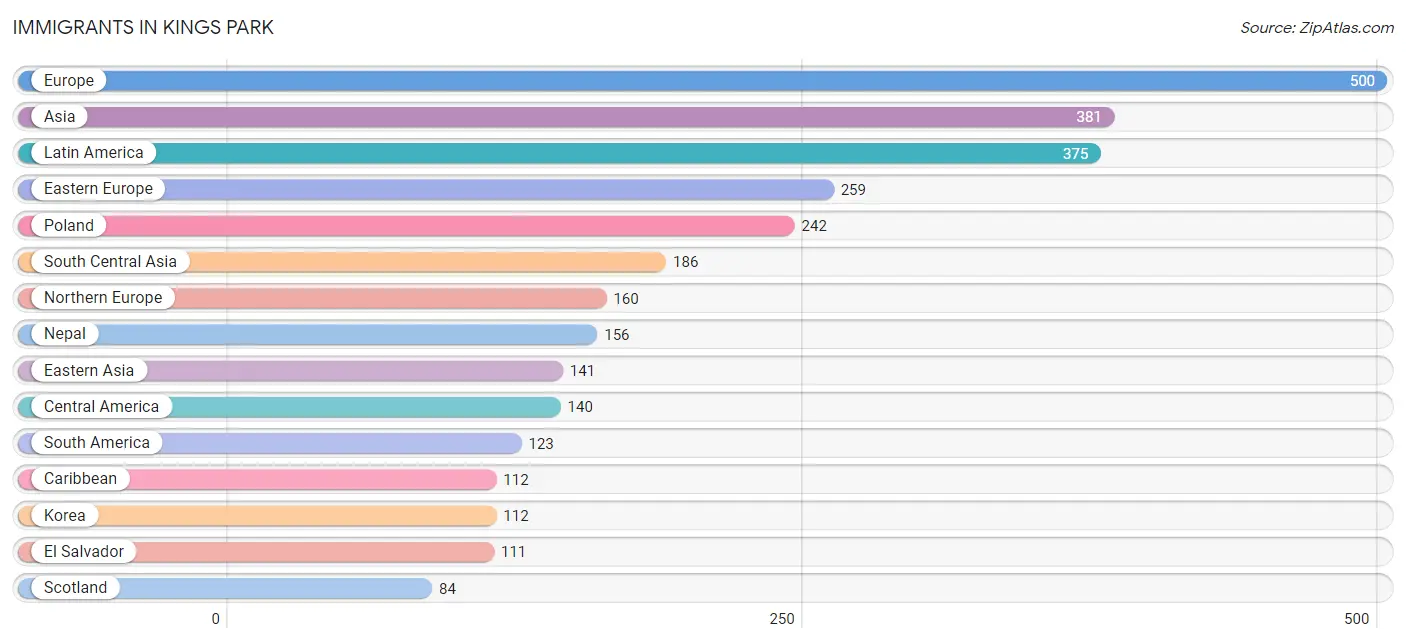
The most numerous immigrant groups reported in Kings Park came from Europe (500 | 3.0%), Asia (381 | 2.3%), Latin America (375 | 2.2%), Eastern Europe (259 | 1.5%), and Poland (242 | 1.5%), together accounting for 10.5% of all Kings Park residents.
| Immigration Origin | # Population | % Population |
| Afghanistan | 30 | 0.2% |
| Asia | 381 | 2.3% |
| Belize | 7 | 0.0% |
| Caribbean | 112 | 0.7% |
| Central America | 140 | 0.8% |
| Chile | 7 | 0.0% |
| China | 29 | 0.2% |
| Colombia | 66 | 0.4% |
| Cuba | 30 | 0.2% |
| Dominican Republic | 34 | 0.2% |
| Eastern Asia | 141 | 0.8% |
| Eastern Europe | 259 | 1.5% |
| Ecuador | 18 | 0.1% |
| El Salvador | 111 | 0.7% |
| England | 8 | 0.1% |
| Europe | 500 | 3.0% |
| France | 7 | 0.0% |
| Guatemala | 13 | 0.1% |
| Guyana | 7 | 0.0% |
| Haiti | 19 | 0.1% |
| Hong Kong | 17 | 0.1% |
| Indonesia | 19 | 0.1% |
| Ireland | 68 | 0.4% |
| Italy | 46 | 0.3% |
| Jamaica | 29 | 0.2% |
| Korea | 112 | 0.7% |
| Latin America | 375 | 2.2% |
| Lithuania | 6 | 0.0% |
| Nepal | 156 | 0.9% |
| Nicaragua | 6 | 0.0% |
| Northern Europe | 160 | 1.0% |
| Panama | 3 | 0.0% |
| Peru | 9 | 0.1% |
| Philippines | 35 | 0.2% |
| Poland | 242 | 1.5% |
| Scotland | 84 | 0.5% |
| South America | 123 | 0.7% |
| South Central Asia | 186 | 1.1% |
| South Eastern Asia | 54 | 0.3% |
| Southern Europe | 74 | 0.4% |
| Spain | 28 | 0.2% |
| Ukraine | 11 | 0.1% |
| Uruguay | 16 | 0.1% |
| Western Europe | 7 | 0.0% | View All 44 Rows |
Sex and Age in Kings Park
Sex and Age in Kings Park
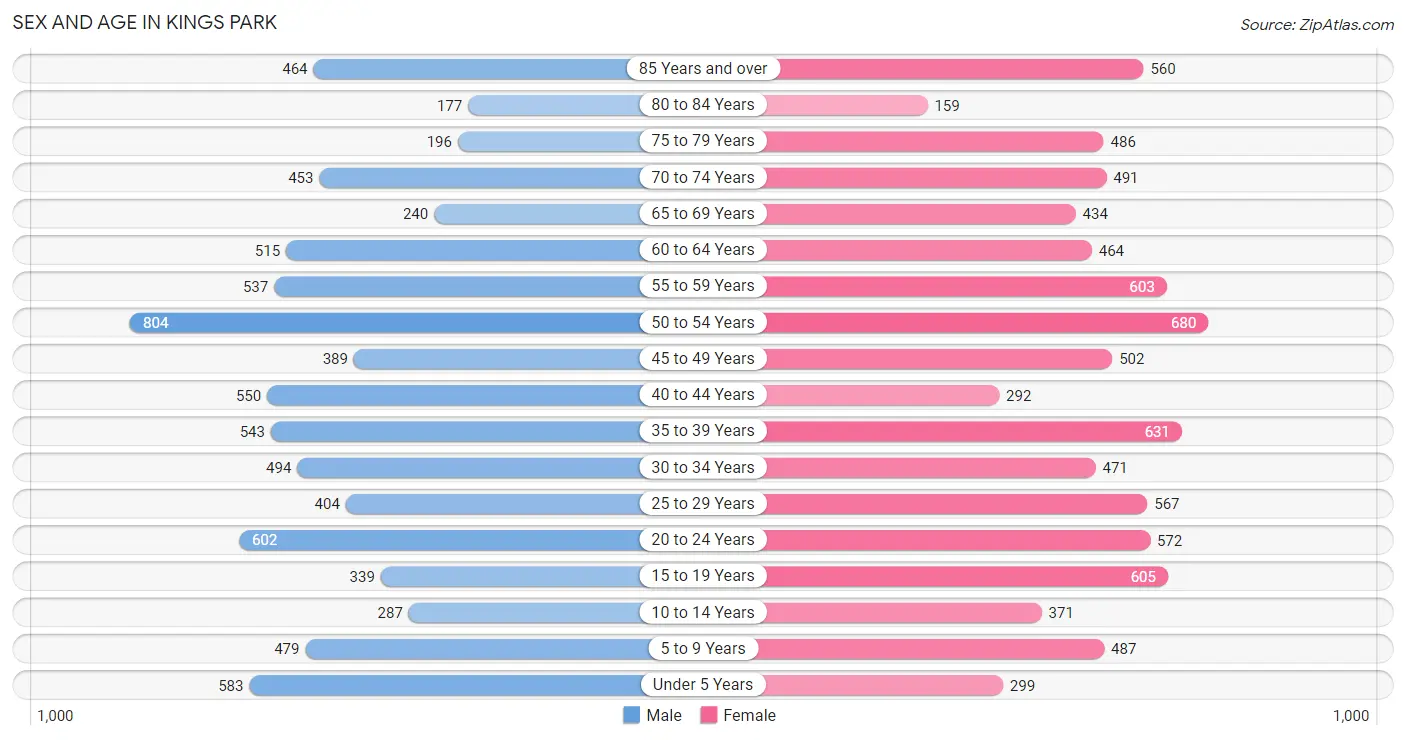
The most populous age groups in Kings Park are 50 to 54 Years (804 | 10.0%) for men and 50 to 54 Years (680 | 7.8%) for women.
| Age Bracket | Male | Female |
| Under 5 Years | 583 (7.2%) | 299 (3.5%) |
| 5 to 9 Years | 479 (5.9%) | 487 (5.6%) |
| 10 to 14 Years | 287 (3.6%) | 371 (4.3%) |
| 15 to 19 Years | 339 (4.2%) | 605 (7.0%) |
| 20 to 24 Years | 602 (7.5%) | 572 (6.6%) |
| 25 to 29 Years | 404 (5.0%) | 567 (6.5%) |
| 30 to 34 Years | 494 (6.1%) | 471 (5.4%) |
| 35 to 39 Years | 543 (6.7%) | 631 (7.3%) |
| 40 to 44 Years | 550 (6.8%) | 292 (3.4%) |
| 45 to 49 Years | 389 (4.8%) | 502 (5.8%) |
| 50 to 54 Years | 804 (10.0%) | 680 (7.8%) |
| 55 to 59 Years | 537 (6.7%) | 603 (7.0%) |
| 60 to 64 Years | 515 (6.4%) | 464 (5.3%) |
| 65 to 69 Years | 240 (3.0%) | 434 (5.0%) |
| 70 to 74 Years | 453 (5.6%) | 491 (5.7%) |
| 75 to 79 Years | 196 (2.4%) | 486 (5.6%) |
| 80 to 84 Years | 177 (2.2%) | 159 (1.8%) |
| 85 Years and over | 464 (5.8%) | 560 (6.5%) |
| Total | 8,056 (100.0%) | 8,674 (100.0%) |
Families and Households in Kings Park
Median Family Size in Kings Park
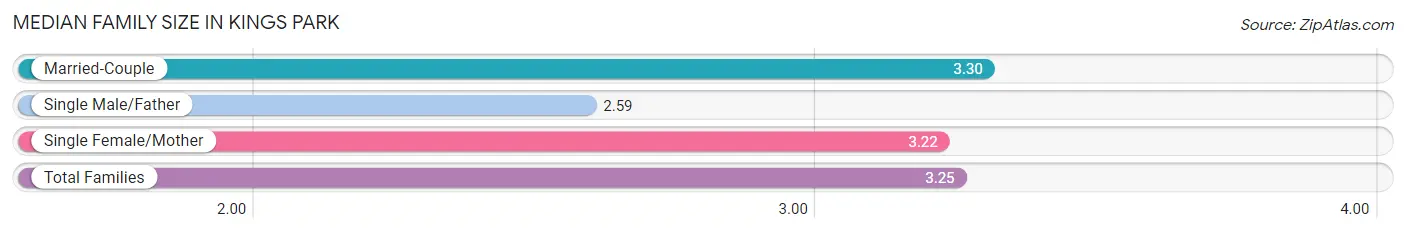
The median family size in Kings Park is 3.25 persons per family, with married-couple families (3,343 | 78.5%) accounting for the largest median family size of 3.3 persons per family. On the other hand, single male/father families (185 | 4.3%) represent the smallest median family size with 2.59 persons per family.
| Family Type | # Families | Family Size |
| Married-Couple | 3,343 (78.5%) | 3.30 |
| Single Male/Father | 185 (4.3%) | 2.59 |
| Single Female/Mother | 729 (17.1%) | 3.22 |
| Total Families | 4,257 (100.0%) | 3.25 |
Median Household Size in Kings Park
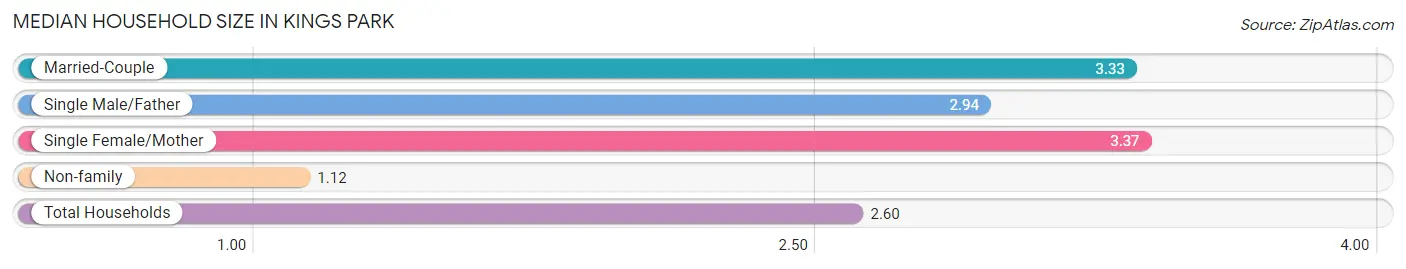
The median household size in Kings Park is 2.60 persons per household, with single female/mother households (729 | 11.5%) accounting for the largest median household size of 3.37 persons per household. non-family households (2,068 | 32.7%) represent the smallest median household size with 1.12 persons per household.
| Household Type | # Households | Household Size |
| Married-Couple | 3,343 (52.8%) | 3.33 |
| Single Male/Father | 185 (2.9%) | 2.94 |
| Single Female/Mother | 729 (11.5%) | 3.37 |
| Non-family | 2,068 (32.7%) | 1.12 |
| Total Households | 6,325 (100.0%) | 2.60 |
Household Size by Marriage Status in Kings Park
Out of a total of 6,325 households in Kings Park, 4,257 (67.3%) are family households, while 2,068 (32.7%) are nonfamily households. The most numerous type of family households are 2-person households, comprising 1,678, and the most common type of nonfamily households are 1-person households, comprising 1,879.
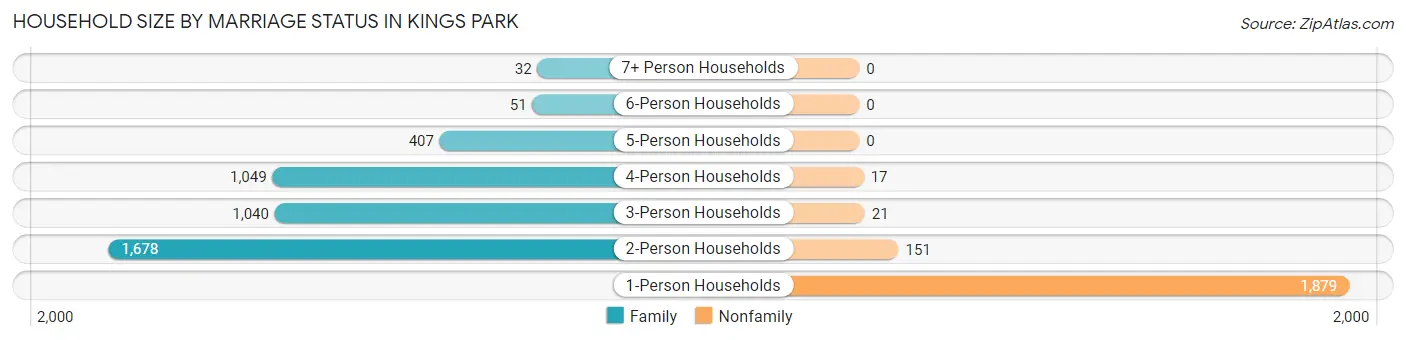
| Household Size | Family Households | Nonfamily Households |
| 1-Person Households | - | 1,879 (29.7%) |
| 2-Person Households | 1,678 (26.5%) | 151 (2.4%) |
| 3-Person Households | 1,040 (16.4%) | 21 (0.3%) |
| 4-Person Households | 1,049 (16.6%) | 17 (0.3%) |
| 5-Person Households | 407 (6.4%) | 0 (0.0%) |
| 6-Person Households | 51 (0.8%) | 0 (0.0%) |
| 7+ Person Households | 32 (0.5%) | 0 (0.0%) |
| Total | 4,257 (67.3%) | 2,068 (32.7%) |
Female Fertility in Kings Park
Fertility by Age in Kings Park
Average fertility rate in Kings Park is 36.0 births per 1,000 women. Women in the age bracket of 15 to 19 years have the highest fertility rate with 43.0 births per 1,000 women. Women in the age bracket of 35 to 50 years acount for 40.6% of all women with births.
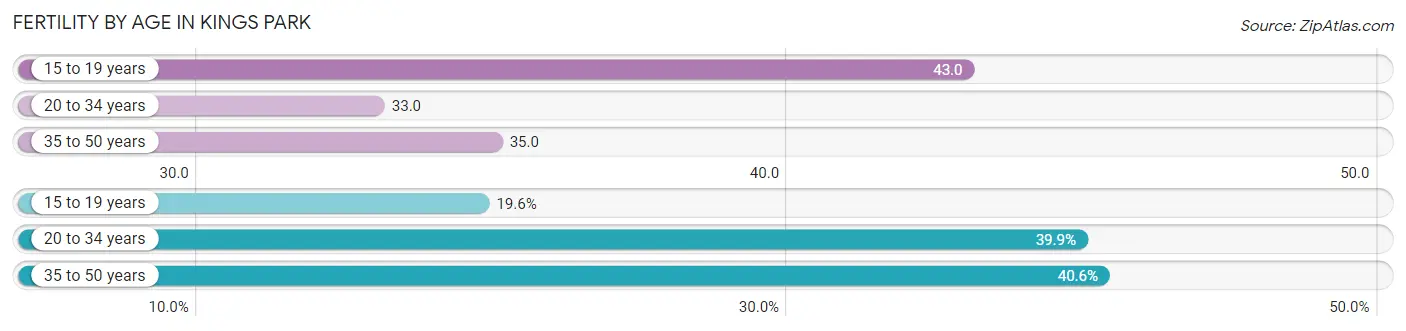
| Age Bracket | Women with Births | Births / 1,000 Women |
| 15 to 19 years | 26 (19.6%) | 43.0 |
| 20 to 34 years | 53 (39.9%) | 33.0 |
| 35 to 50 years | 54 (40.6%) | 35.0 |
| Total | 133 (100.0%) | 36.0 |
Fertility by Age by Marriage Status in Kings Park
80.5% of women with births (133) in Kings Park are married. The highest percentage of unmarried women with births falls into 15 to 19 years age bracket with 100.0% of them unmarried at the time of birth, while the lowest percentage of unmarried women with births belong to 20 to 34 years age bracket with 0.0% of them unmarried.
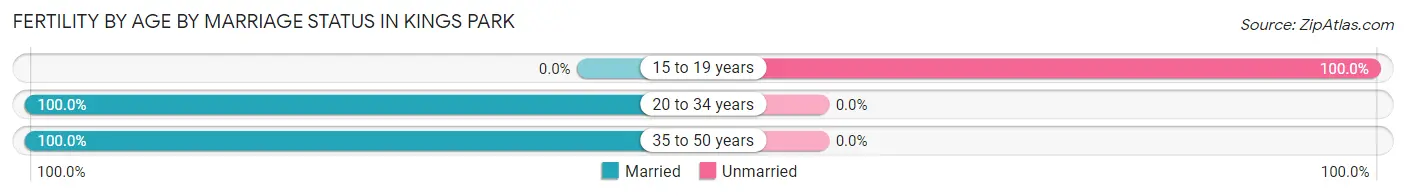
| Age Bracket | Married | Unmarried |
| 15 to 19 years | 0 (0.0%) | 26 (100.0%) |
| 20 to 34 years | 53 (100.0%) | 0 (0.0%) |
| 35 to 50 years | 54 (100.0%) | 0 (0.0%) |
| Total | 107 (80.4%) | 26 (19.6%) |
Fertility by Education in Kings Park
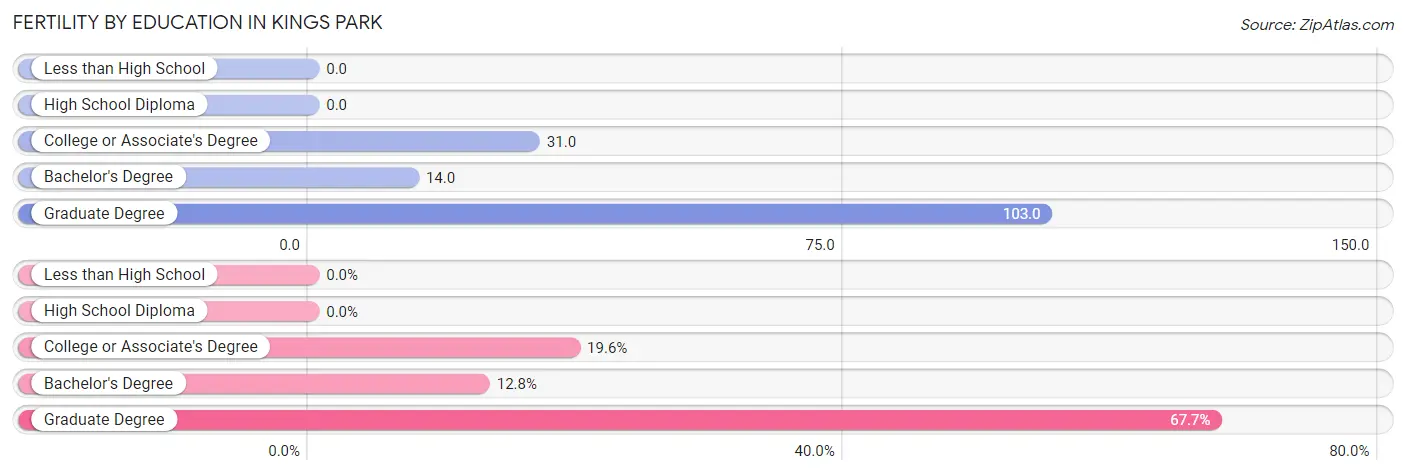
| Educational Attainment | Women with Births | Births / 1,000 Women |
| Less than High School | 0 (0.0%) | 0.0 |
| High School Diploma | 0 (0.0%) | 0.0 |
| College or Associate's Degree | 26 (19.6%) | 31.0 |
| Bachelor's Degree | 17 (12.8%) | 14.0 |
| Graduate Degree | 90 (67.7%) | 103.0 |
| Total | 133 (100.0%) | 36.0 |
Fertility by Education by Marriage Status in Kings Park
19.6% of women with births in Kings Park are unmarried. Women with the educational attainment of bachelor's degree are most likely to be married with 100.0% of them married at childbirth, while women with the educational attainment of college or associate's degree are least likely to be married with 100.0% of them unmarried at childbirth.
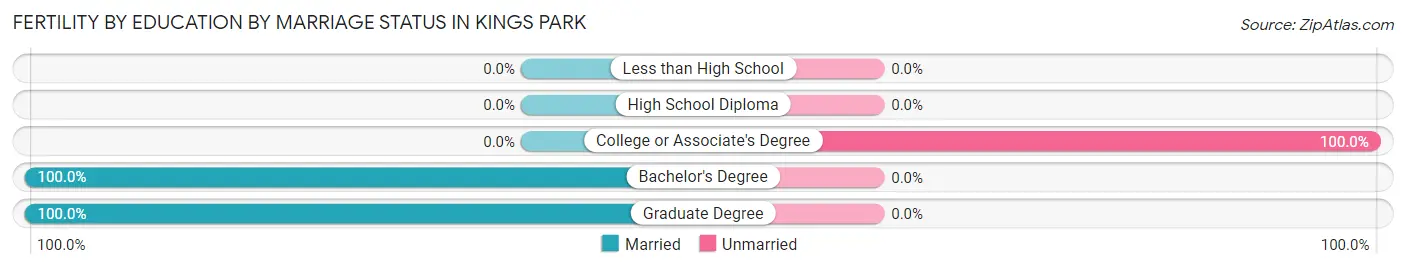
| Educational Attainment | Married | Unmarried |
| Less than High School | 0 (0.0%) | 0 (0.0%) |
| High School Diploma | 0 (0.0%) | 0 (0.0%) |
| College or Associate's Degree | 0 (0.0%) | 26 (100.0%) |
| Bachelor's Degree | 17 (100.0%) | 0 (0.0%) |
| Graduate Degree | 90 (100.0%) | 0 (0.0%) |
| Total | 107 (80.4%) | 26 (19.6%) |
Employment Characteristics in Kings Park
Employment by Class of Employer in Kings Park
Among the 8,450 employed individuals in Kings Park, private company employees (5,194 | 61.5%), local government employees (1,059 | 12.5%), and not-for-profit organizations (623 | 7.4%) make up the most common classes of employment.
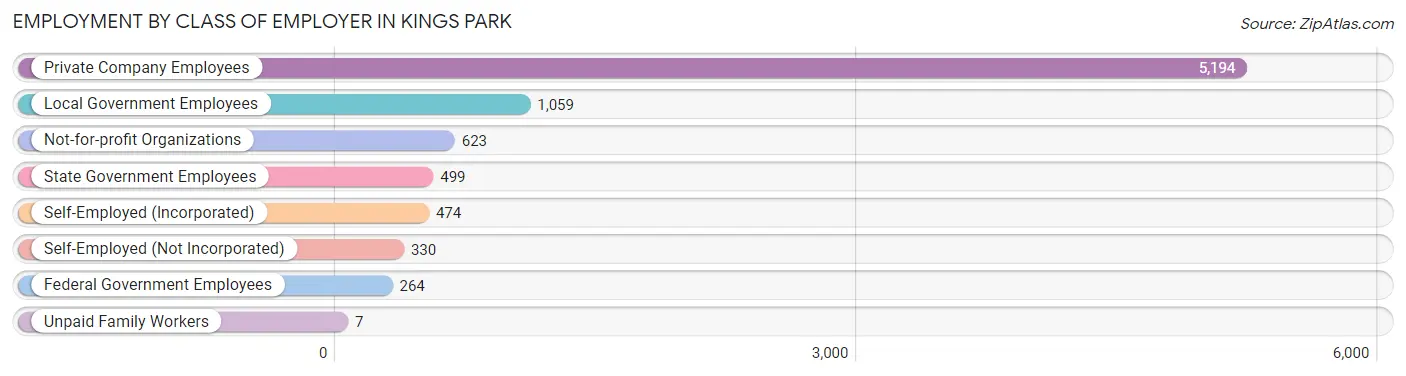
| Employer Class | # Employees | % Employees |
| Private Company Employees | 5,194 | 61.5% |
| Self-Employed (Incorporated) | 474 | 5.6% |
| Self-Employed (Not Incorporated) | 330 | 3.9% |
| Not-for-profit Organizations | 623 | 7.4% |
| Local Government Employees | 1,059 | 12.5% |
| State Government Employees | 499 | 5.9% |
| Federal Government Employees | 264 | 3.1% |
| Unpaid Family Workers | 7 | 0.1% |
| Total | 8,450 | 100.0% |
Employment Status by Age in Kings Park
According to the labor force statistics for Kings Park, out of the total population over 16 years of age (13,923), 65.5% or 9,120 individuals are in the labor force, with 4.5% or 410 of them unemployed. The age group with the highest labor force participation rate is 45 to 54 years, with 91.0% or 2,161 individuals in the labor force. Within the labor force, the 16 to 19 years age range has the highest percentage of unemployed individuals, with 30.0% or 97 of them being unemployed.
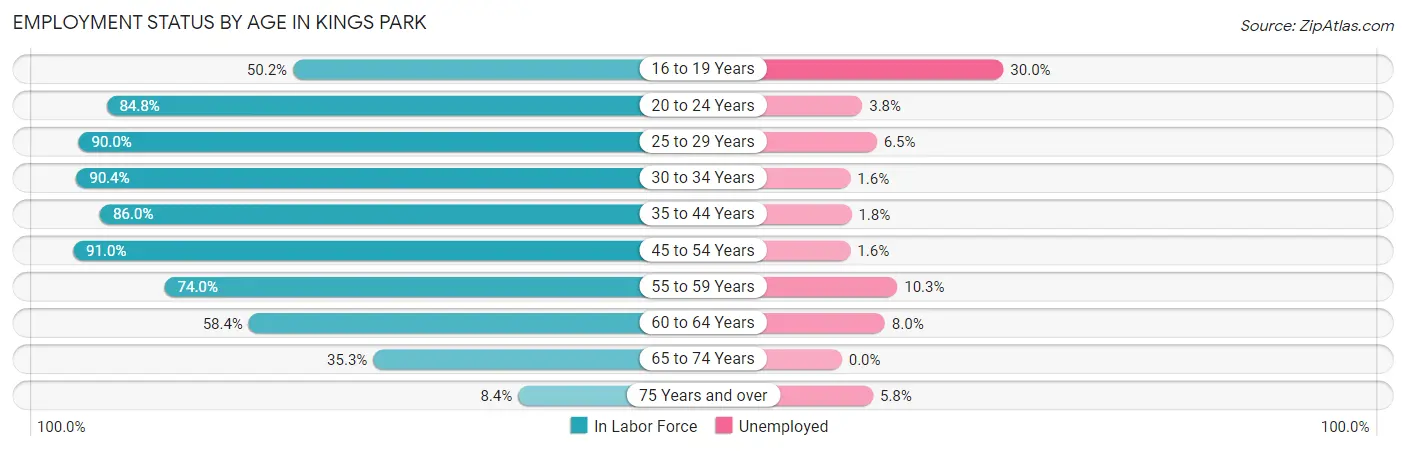
| Age Bracket | In Labor Force | Unemployed |
| 16 to 19 Years | 323 (50.2%) | 97 (30.0%) |
| 20 to 24 Years | 996 (84.8%) | 38 (3.8%) |
| 25 to 29 Years | 874 (90.0%) | 57 (6.5%) |
| 30 to 34 Years | 872 (90.4%) | 14 (1.6%) |
| 35 to 44 Years | 1,734 (86.0%) | 31 (1.8%) |
| 45 to 54 Years | 2,161 (91.0%) | 35 (1.6%) |
| 55 to 59 Years | 844 (74.0%) | 87 (10.3%) |
| 60 to 64 Years | 572 (58.4%) | 46 (8.0%) |
| 65 to 74 Years | 571 (35.3%) | 0 (0.0%) |
| 75 Years and over | 172 (8.4%) | 10 (5.8%) |
| Total | 9,120 (65.5%) | 410 (4.5%) |
Employment Status by Educational Attainment in Kings Park
According to labor force statistics for Kings Park, 83.6% of individuals (7,061) out of the total population between 25 and 64 years of age (8,446) are in the labor force, with 3.8% or 268 of them being unemployed. The group with the highest labor force participation rate are those with the educational attainment of bachelor's degree or higher, with 90.2% or 3,998 individuals in the labor force. Within the labor force, individuals with college / associate degree education have the highest percentage of unemployment, with 7.5% or 156 of them being unemployed.
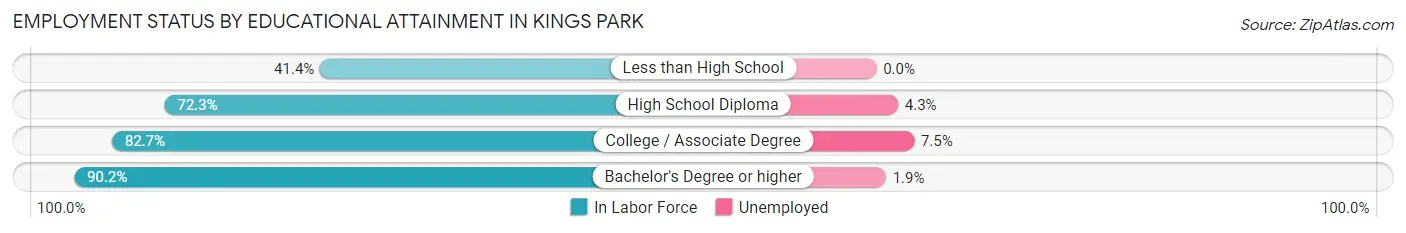
| Educational Attainment | In Labor Force | Unemployed |
| Less than High School | 134 (41.4%) | 0 (0.0%) |
| High School Diploma | 855 (72.3%) | 51 (4.3%) |
| College / Associate Degree | 2,074 (82.7%) | 188 (7.5%) |
| Bachelor's Degree or higher | 3,998 (90.2%) | 84 (1.9%) |
| Total | 7,061 (83.6%) | 321 (3.8%) |
Employment Occupations by Sex in Kings Park
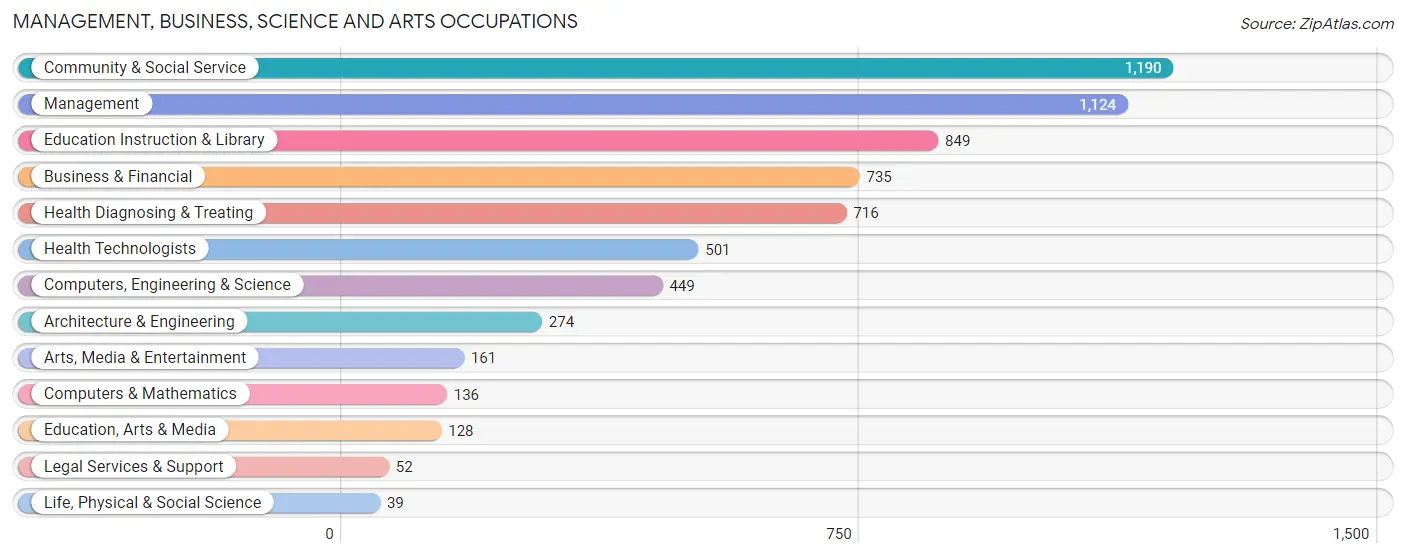
Management, Business, Science and Arts Occupations
The most common Management, Business, Science and Arts occupations in Kings Park are Community & Social Service (1,190 | 13.7%), Management (1,124 | 12.9%), Education Instruction & Library (849 | 9.8%), Business & Financial (735 | 8.4%), and Health Diagnosing & Treating (716 | 8.2%).
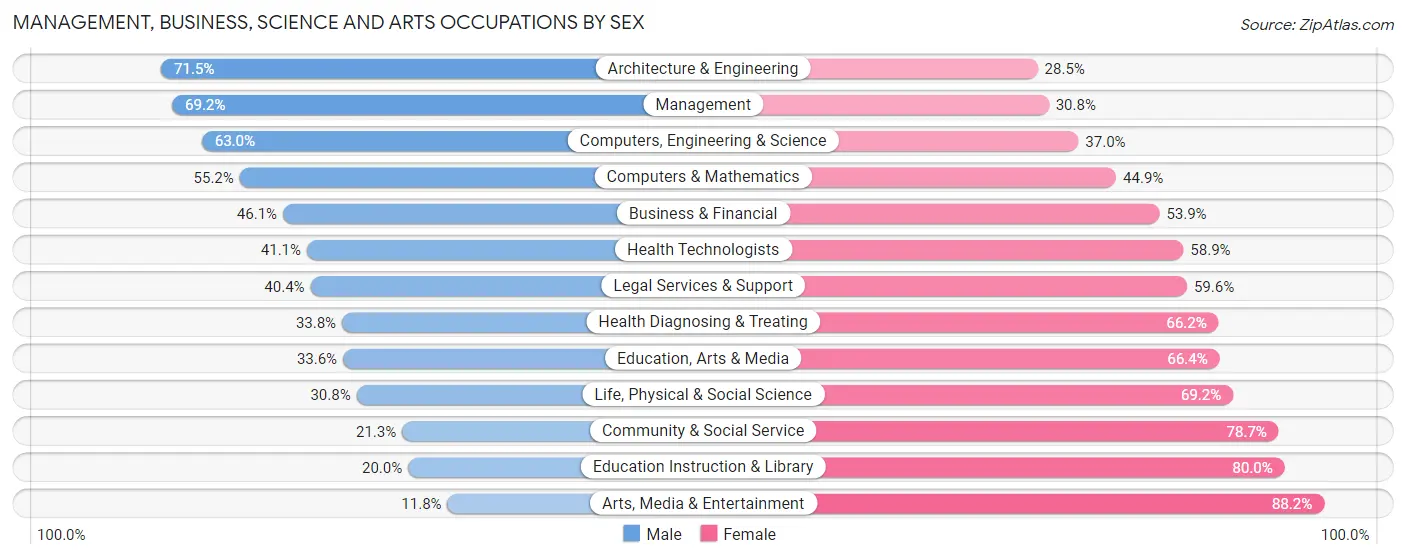
Management, Business, Science and Arts Occupations by Sex
Within the Management, Business, Science and Arts occupations in Kings Park, the most male-oriented occupations are Architecture & Engineering (71.5%), Management (69.2%), and Computers, Engineering & Science (63.0%), while the most female-oriented occupations are Arts, Media & Entertainment (88.2%), Education Instruction & Library (80.0%), and Community & Social Service (78.7%).
| Occupation | Male | Female |
| Management | 778 (69.2%) | 346 (30.8%) |
| Business & Financial | 339 (46.1%) | 396 (53.9%) |
| Computers, Engineering & Science | 283 (63.0%) | 166 (37.0%) |
| Computers & Mathematics | 75 (55.1%) | 61 (44.9%) |
| Architecture & Engineering | 196 (71.5%) | 78 (28.5%) |
| Life, Physical & Social Science | 12 (30.8%) | 27 (69.2%) |
| Community & Social Service | 253 (21.3%) | 937 (78.7%) |
| Education, Arts & Media | 43 (33.6%) | 85 (66.4%) |
| Legal Services & Support | 21 (40.4%) | 31 (59.6%) |
| Education Instruction & Library | 170 (20.0%) | 679 (80.0%) |
| Arts, Media & Entertainment | 19 (11.8%) | 142 (88.2%) |
| Health Diagnosing & Treating | 242 (33.8%) | 474 (66.2%) |
| Health Technologists | 206 (41.1%) | 295 (58.9%) |
| Total (Category) | 1,895 (45.0%) | 2,319 (55.0%) |
| Total (Overall) | 4,479 (51.4%) | 4,226 (48.5%) |
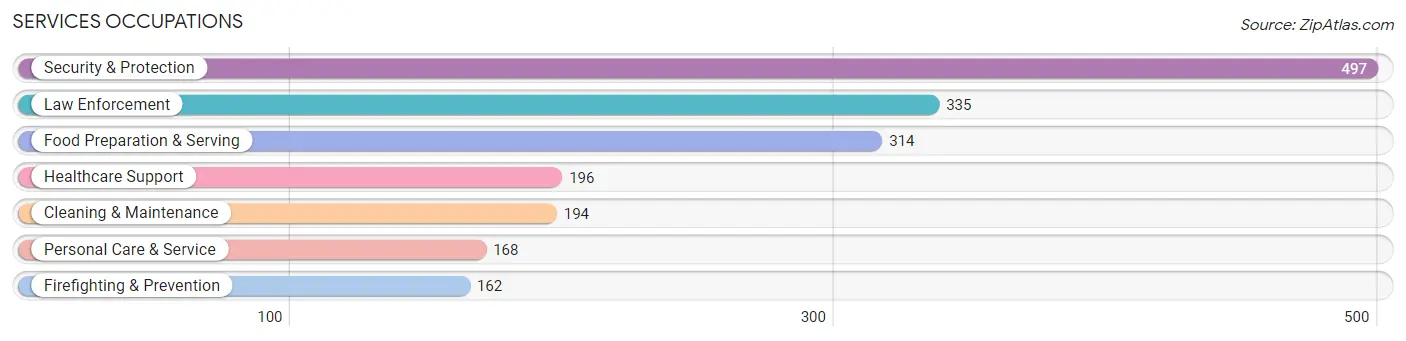
Services Occupations
The most common Services occupations in Kings Park are Security & Protection (497 | 5.7%), Law Enforcement (335 | 3.8%), Food Preparation & Serving (314 | 3.6%), Healthcare Support (196 | 2.2%), and Cleaning & Maintenance (194 | 2.2%).
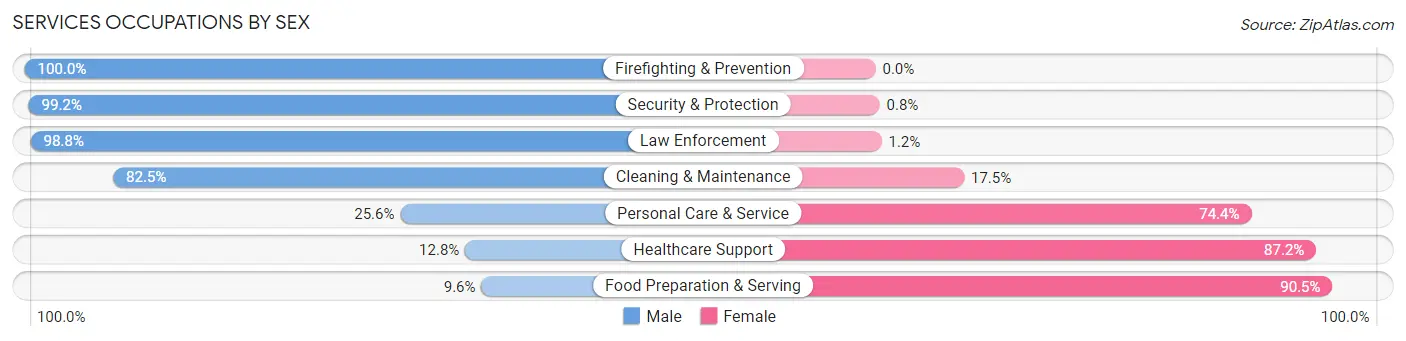
Services Occupations by Sex
Within the Services occupations in Kings Park, the most male-oriented occupations are Firefighting & Prevention (100.0%), Security & Protection (99.2%), and Law Enforcement (98.8%), while the most female-oriented occupations are Food Preparation & Serving (90.4%), Healthcare Support (87.2%), and Personal Care & Service (74.4%).
| Occupation | Male | Female |
| Healthcare Support | 25 (12.8%) | 171 (87.2%) |
| Security & Protection | 493 (99.2%) | 4 (0.8%) |
| Firefighting & Prevention | 162 (100.0%) | 0 (0.0%) |
| Law Enforcement | 331 (98.8%) | 4 (1.2%) |
| Food Preparation & Serving | 30 (9.6%) | 284 (90.4%) |
| Cleaning & Maintenance | 160 (82.5%) | 34 (17.5%) |
| Personal Care & Service | 43 (25.6%) | 125 (74.4%) |
| Total (Category) | 751 (54.9%) | 618 (45.1%) |
| Total (Overall) | 4,479 (51.4%) | 4,226 (48.5%) |
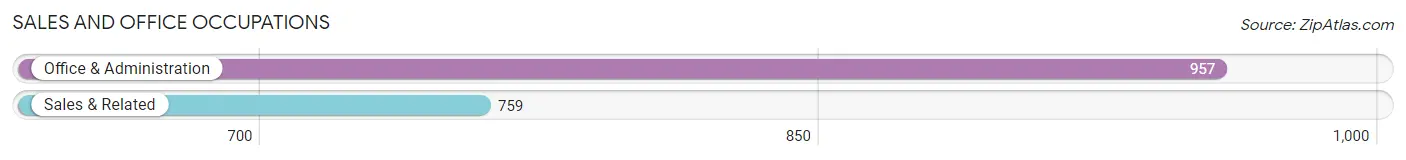
Sales and Office Occupations
The most common Sales and Office occupations in Kings Park are Office & Administration (957 | 11.0%), and Sales & Related (759 | 8.7%).
Sales and Office Occupations by Sex
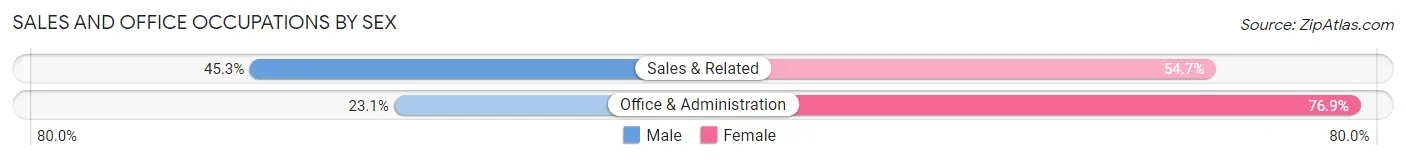
| Occupation | Male | Female |
| Sales & Related | 344 (45.3%) | 415 (54.7%) |
| Office & Administration | 221 (23.1%) | 736 (76.9%) |
| Total (Category) | 565 (32.9%) | 1,151 (67.1%) |
| Total (Overall) | 4,479 (51.4%) | 4,226 (48.5%) |
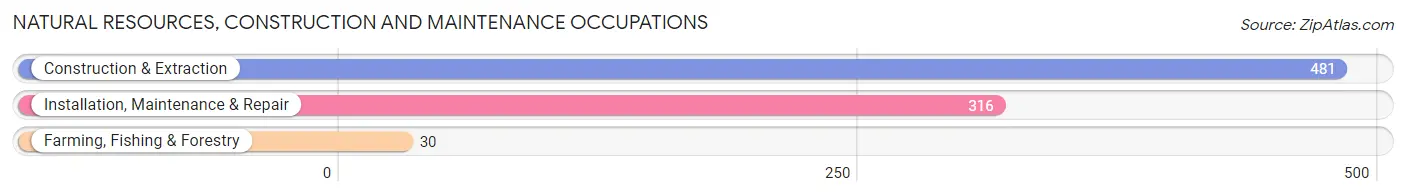
Natural Resources, Construction and Maintenance Occupations
The most common Natural Resources, Construction and Maintenance occupations in Kings Park are Construction & Extraction (481 | 5.5%), Installation, Maintenance & Repair (316 | 3.6%), and Farming, Fishing & Forestry (30 | 0.3%).
Natural Resources, Construction and Maintenance Occupations by Sex
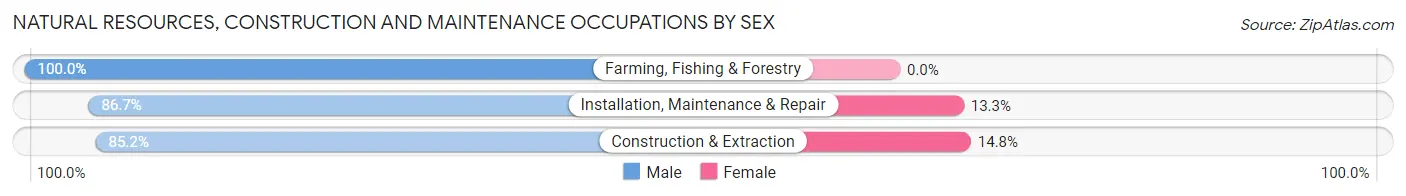
| Occupation | Male | Female |
| Farming, Fishing & Forestry | 30 (100.0%) | 0 (0.0%) |
| Construction & Extraction | 410 (85.2%) | 71 (14.8%) |
| Installation, Maintenance & Repair | 274 (86.7%) | 42 (13.3%) |
| Total (Category) | 714 (86.3%) | 113 (13.7%) |
| Total (Overall) | 4,479 (51.4%) | 4,226 (48.5%) |
Production, Transportation and Moving Occupations
The most common Production, Transportation and Moving occupations in Kings Park are Transportation (348 | 4.0%), Production (146 | 1.7%), and Material Moving (85 | 1.0%).
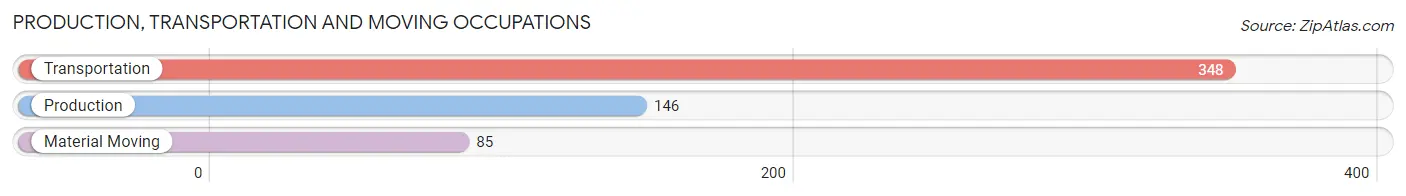
Production, Transportation and Moving Occupations by Sex
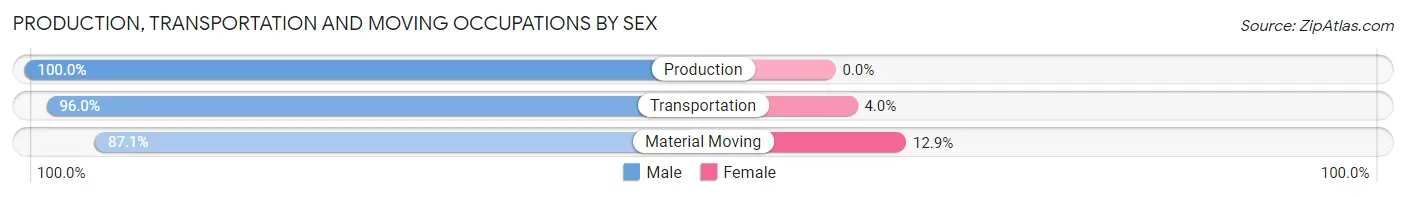
| Occupation | Male | Female |
| Production | 146 (100.0%) | 0 (0.0%) |
| Transportation | 334 (96.0%) | 14 (4.0%) |
| Material Moving | 74 (87.1%) | 11 (12.9%) |
| Total (Category) | 554 (95.7%) | 25 (4.3%) |
| Total (Overall) | 4,479 (51.4%) | 4,226 (48.5%) |
Employment Industries by Sex in Kings Park
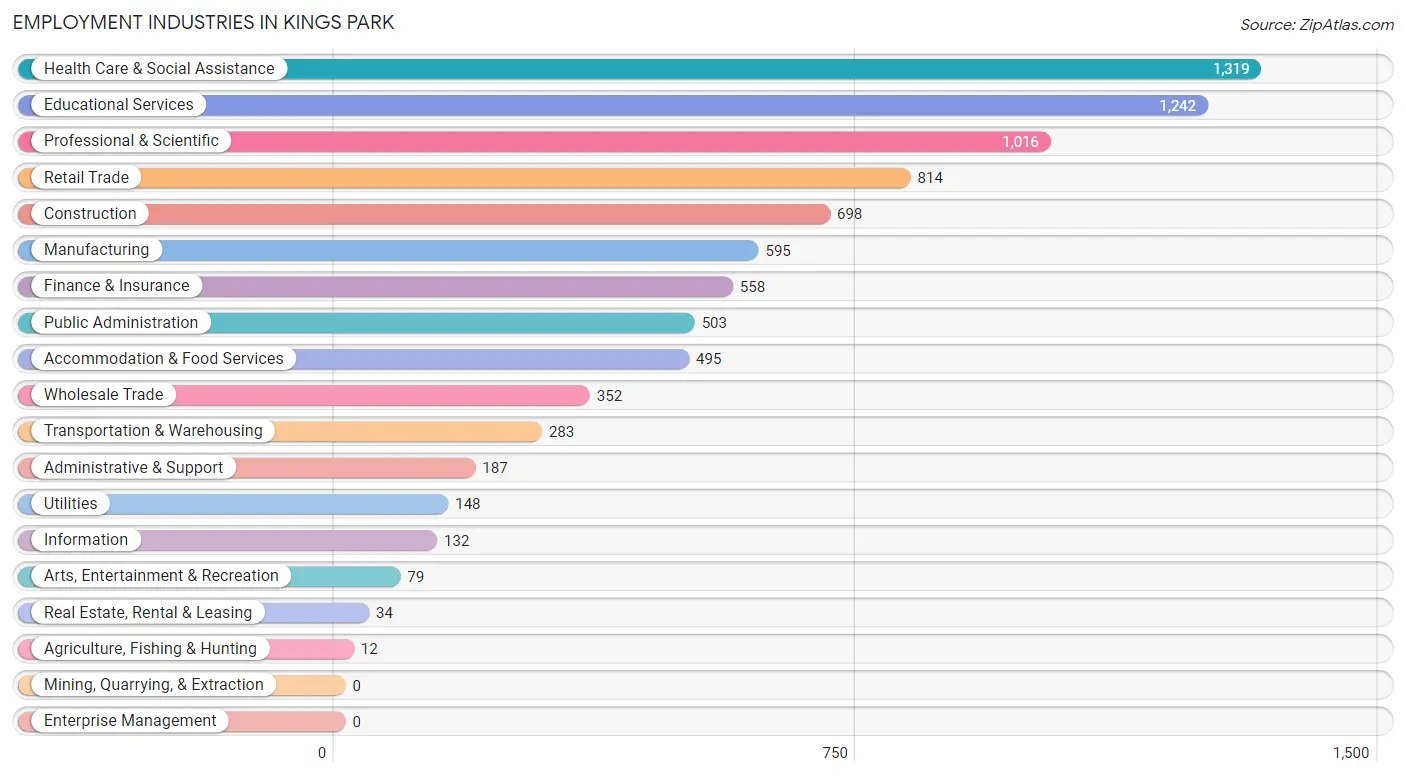
Employment Industries in Kings Park
The major employment industries in Kings Park include Health Care & Social Assistance (1,319 | 15.1%), Educational Services (1,242 | 14.3%), Professional & Scientific (1,016 | 11.7%), Retail Trade (814 | 9.3%), and Construction (698 | 8.0%).
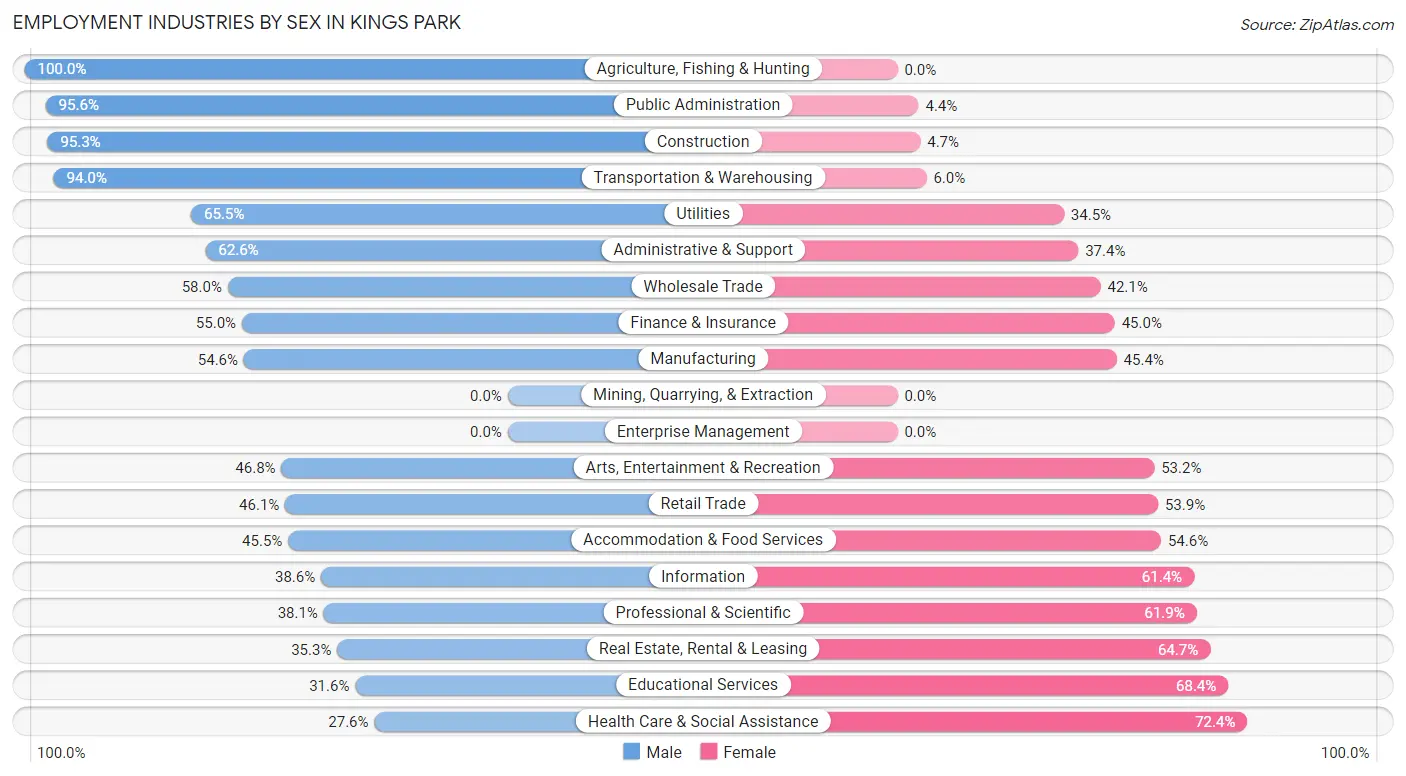
Employment Industries by Sex in Kings Park
The Kings Park industries that see more men than women are Agriculture, Fishing & Hunting (100.0%), Public Administration (95.6%), and Construction (95.3%), whereas the industries that tend to have a higher number of women are Health Care & Social Assistance (72.4%), Educational Services (68.4%), and Real Estate, Rental & Leasing (64.7%).
| Industry | Male | Female |
| Agriculture, Fishing & Hunting | 12 (100.0%) | 0 (0.0%) |
| Mining, Quarrying, & Extraction | 0 (0.0%) | 0 (0.0%) |
| Construction | 665 (95.3%) | 33 (4.7%) |
| Manufacturing | 325 (54.6%) | 270 (45.4%) |
| Wholesale Trade | 204 (58.0%) | 148 (42.0%) |
| Retail Trade | 375 (46.1%) | 439 (53.9%) |
| Transportation & Warehousing | 266 (94.0%) | 17 (6.0%) |
| Utilities | 97 (65.5%) | 51 (34.5%) |
| Information | 51 (38.6%) | 81 (61.4%) |
| Finance & Insurance | 307 (55.0%) | 251 (45.0%) |
| Real Estate, Rental & Leasing | 12 (35.3%) | 22 (64.7%) |
| Professional & Scientific | 387 (38.1%) | 629 (61.9%) |
| Enterprise Management | 0 (0.0%) | 0 (0.0%) |
| Administrative & Support | 117 (62.6%) | 70 (37.4%) |
| Educational Services | 392 (31.6%) | 850 (68.4%) |
| Health Care & Social Assistance | 364 (27.6%) | 955 (72.4%) |
| Arts, Entertainment & Recreation | 37 (46.8%) | 42 (53.2%) |
| Accommodation & Food Services | 225 (45.5%) | 270 (54.5%) |
| Public Administration | 481 (95.6%) | 22 (4.4%) |
| Total | 4,479 (51.4%) | 4,226 (48.5%) |
Education in Kings Park
School Enrollment in Kings Park
The most common levels of schooling among the 3,494 students in Kings Park are high school (978 | 28.0%), elementary school (847 | 24.2%), and college / undergraduate (705 | 20.2%).
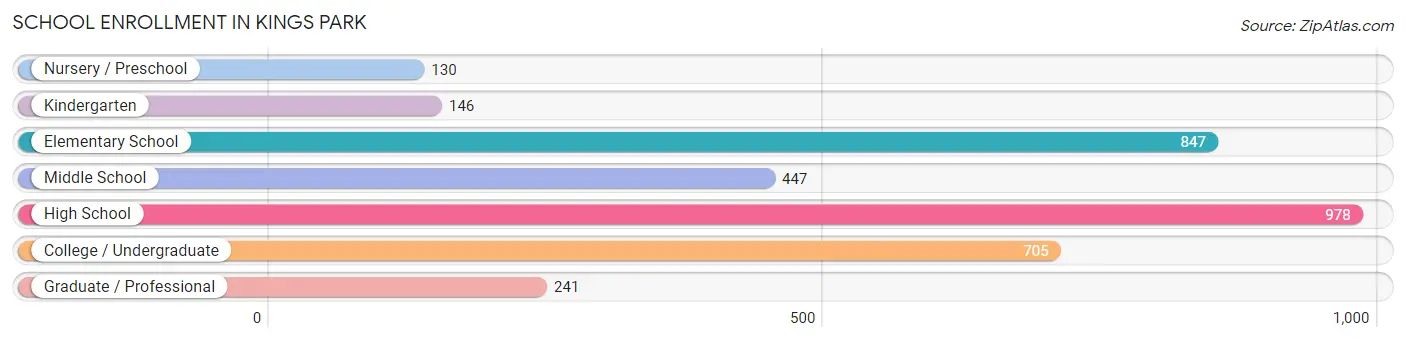
| School Level | # Students | % Students |
| Nursery / Preschool | 130 | 3.7% |
| Kindergarten | 146 | 4.2% |
| Elementary School | 847 | 24.2% |
| Middle School | 447 | 12.8% |
| High School | 978 | 28.0% |
| College / Undergraduate | 705 | 20.2% |
| Graduate / Professional | 241 | 6.9% |
| Total | 3,494 | 100.0% |
School Enrollment by Age by Funding Source in Kings Park
Out of a total of 3,494 students who are enrolled in schools in Kings Park, 458 (13.1%) attend a private institution, while the remaining 3,036 (86.9%) are enrolled in public schools. The age group of 3 to 4 year olds has the highest likelihood of being enrolled in private schools, with 95 (78.5% in the age bracket) enrolled. Conversely, the age group of 18 to 19 year olds has the lowest likelihood of being enrolled in a private school, with 159 (100.0% in the age bracket) attending a public institution.
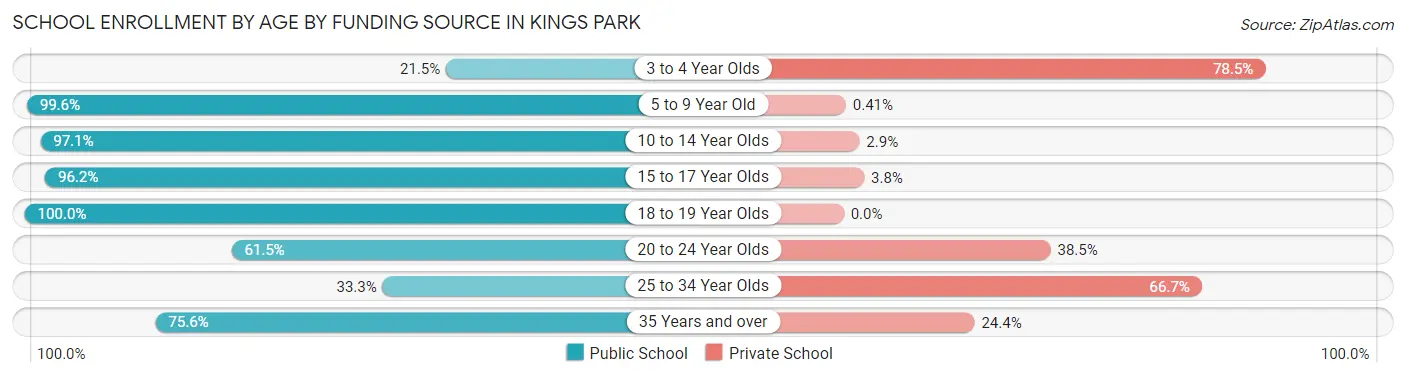
| Age Bracket | Public School | Private School |
| 3 to 4 Year Olds | 26 (21.5%) | 95 (78.5%) |
| 5 to 9 Year Old | 962 (99.6%) | 4 (0.4%) |
| 10 to 14 Year Olds | 629 (97.1%) | 19 (2.9%) |
| 15 to 17 Year Olds | 733 (96.2%) | 29 (3.8%) |
| 18 to 19 Year Olds | 159 (100.0%) | 0 (0.0%) |
| 20 to 24 Year Olds | 359 (61.5%) | 225 (38.5%) |
| 25 to 34 Year Olds | 19 (33.3%) | 38 (66.7%) |
| 35 Years and over | 149 (75.6%) | 48 (24.4%) |
| Total | 3,036 (86.9%) | 458 (13.1%) |
Educational Attainment by Field of Study in Kings Park
Business (1,179 | 20.8%), education (836 | 14.8%), social sciences (578 | 10.2%), science & technology (432 | 7.6%), and psychology (349 | 6.2%) are the most common fields of study among 5,655 individuals in Kings Park who have obtained a bachelor's degree or higher.
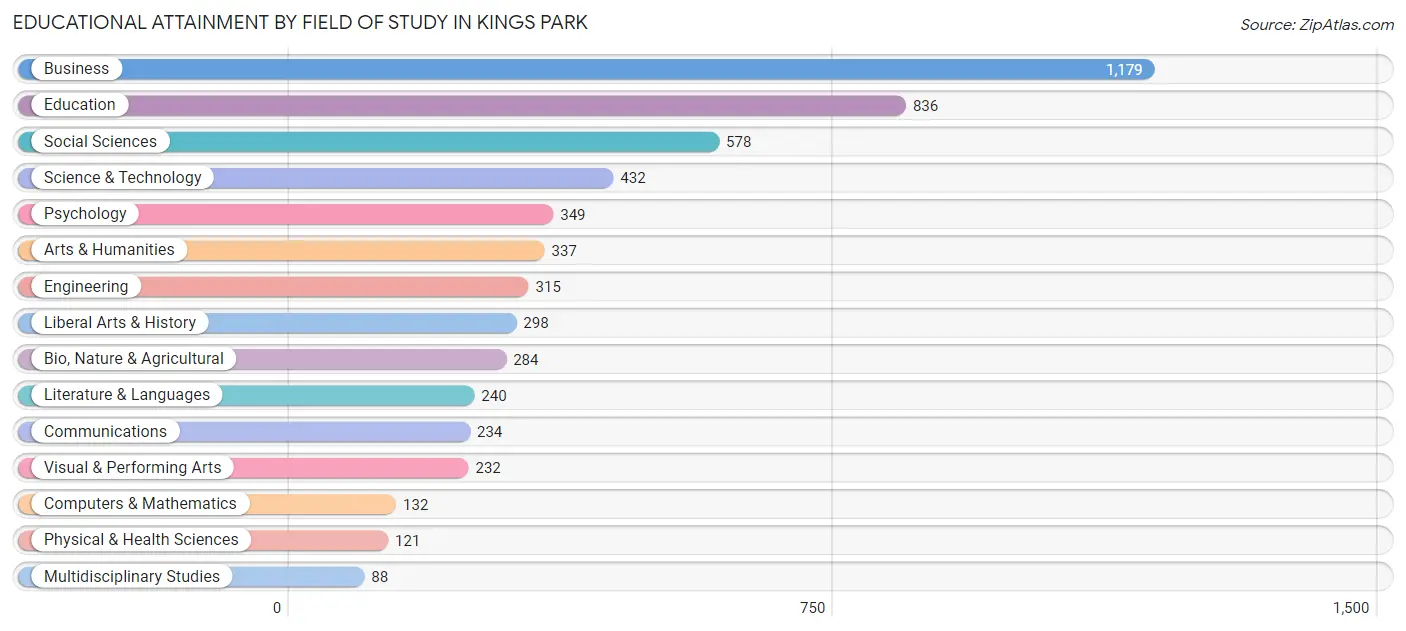
| Field of Study | # Graduates | % Graduates |
| Computers & Mathematics | 132 | 2.3% |
| Bio, Nature & Agricultural | 284 | 5.0% |
| Physical & Health Sciences | 121 | 2.1% |
| Psychology | 349 | 6.2% |
| Social Sciences | 578 | 10.2% |
| Engineering | 315 | 5.6% |
| Multidisciplinary Studies | 88 | 1.6% |
| Science & Technology | 432 | 7.6% |
| Business | 1,179 | 20.8% |
| Education | 836 | 14.8% |
| Literature & Languages | 240 | 4.2% |
| Liberal Arts & History | 298 | 5.3% |
| Visual & Performing Arts | 232 | 4.1% |
| Communications | 234 | 4.1% |
| Arts & Humanities | 337 | 6.0% |
| Total | 5,655 | 100.0% |
Transportation & Commute in Kings Park
Vehicle Availability by Sex in Kings Park
The most prevalent vehicle ownership categories in Kings Park are males with 2 vehicles (1,869, accounting for 43.0%) and females with 2 vehicles (1,472, making up 45.6%).
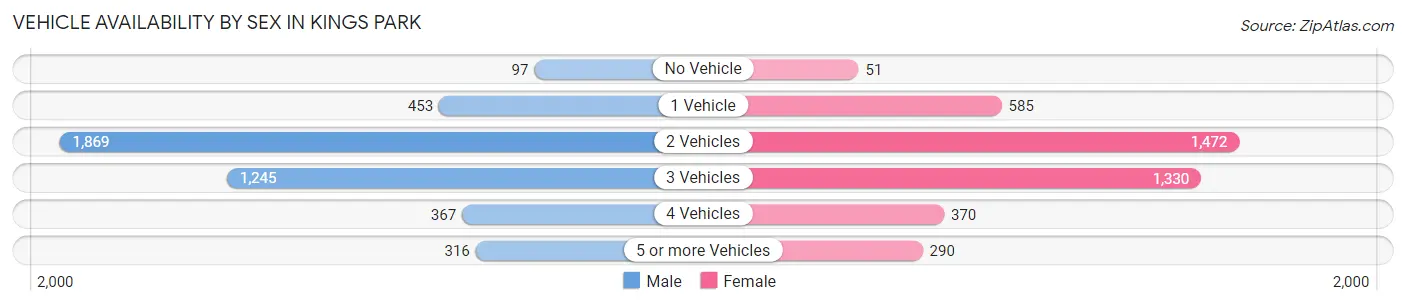
| Vehicles Available | Male | Female |
| No Vehicle | 97 (2.2%) | 51 (1.2%) |
| 1 Vehicle | 453 (10.4%) | 585 (14.3%) |
| 2 Vehicles | 1,869 (43.0%) | 1,472 (35.9%) |
| 3 Vehicles | 1,245 (28.6%) | 1,330 (32.5%) |
| 4 Vehicles | 367 (8.4%) | 370 (9.0%) |
| 5 or more Vehicles | 316 (7.3%) | 290 (7.1%) |
| Total | 4,347 (100.0%) | 4,098 (100.0%) |
Commute Time in Kings Park
The most frequently occuring commute durations in Kings Park are 30 to 34 minutes (1,075 commuters, 14.1%), 15 to 19 minutes (1,039 commuters, 13.6%), and 20 to 24 minutes (932 commuters, 12.2%).
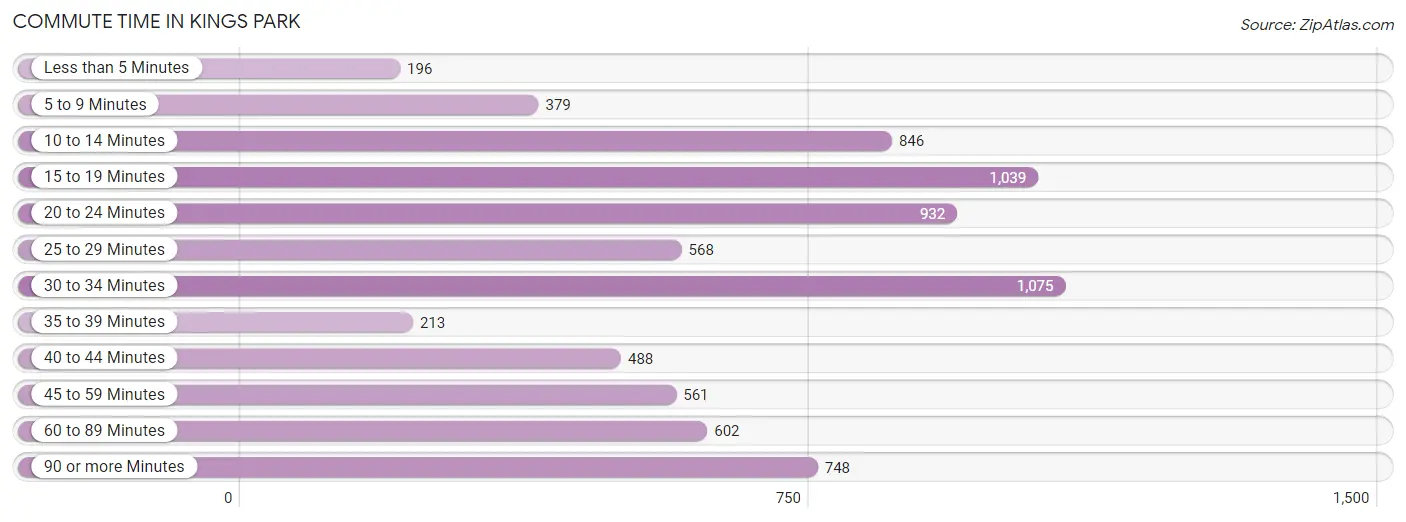
| Commute Time | # Commuters | % Commuters |
| Less than 5 Minutes | 196 | 2.6% |
| 5 to 9 Minutes | 379 | 5.0% |
| 10 to 14 Minutes | 846 | 11.1% |
| 15 to 19 Minutes | 1,039 | 13.6% |
| 20 to 24 Minutes | 932 | 12.2% |
| 25 to 29 Minutes | 568 | 7.4% |
| 30 to 34 Minutes | 1,075 | 14.1% |
| 35 to 39 Minutes | 213 | 2.8% |
| 40 to 44 Minutes | 488 | 6.4% |
| 45 to 59 Minutes | 561 | 7.3% |
| 60 to 89 Minutes | 602 | 7.9% |
| 90 or more Minutes | 748 | 9.8% |
Commute Time by Sex in Kings Park
The most common commute times in Kings Park are 20 to 24 minutes (638 commuters, 15.7%) for males and 15 to 19 minutes (669 commuters, 18.6%) for females.
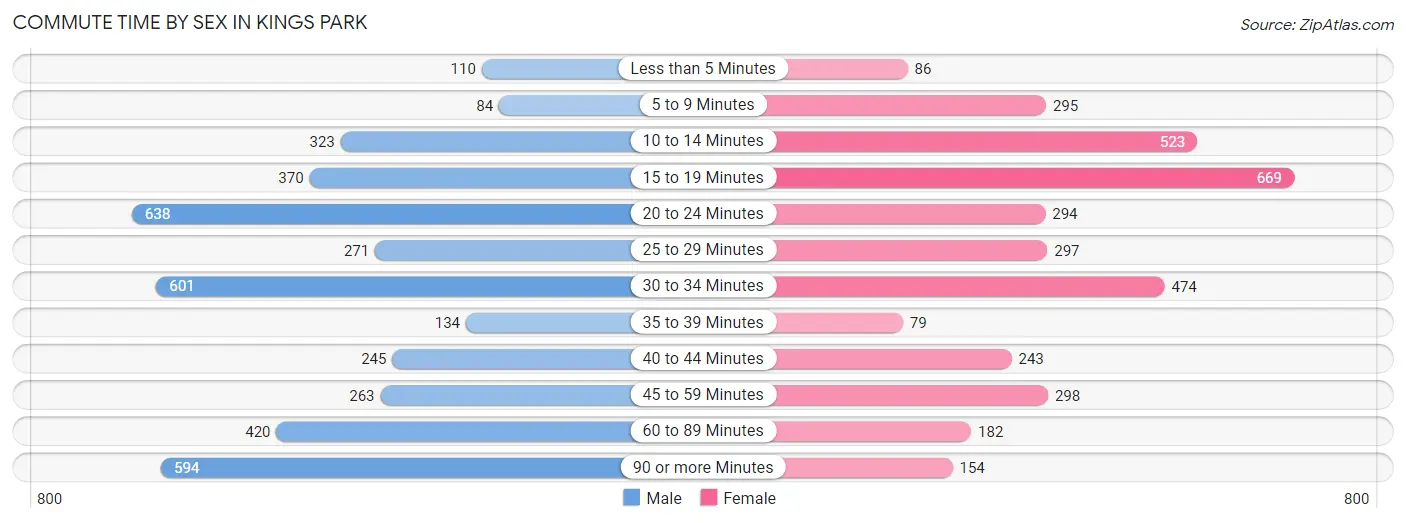
| Commute Time | Male | Female |
| Less than 5 Minutes | 110 (2.7%) | 86 (2.4%) |
| 5 to 9 Minutes | 84 (2.1%) | 295 (8.2%) |
| 10 to 14 Minutes | 323 (8.0%) | 523 (14.5%) |
| 15 to 19 Minutes | 370 (9.1%) | 669 (18.6%) |
| 20 to 24 Minutes | 638 (15.7%) | 294 (8.2%) |
| 25 to 29 Minutes | 271 (6.7%) | 297 (8.3%) |
| 30 to 34 Minutes | 601 (14.8%) | 474 (13.2%) |
| 35 to 39 Minutes | 134 (3.3%) | 79 (2.2%) |
| 40 to 44 Minutes | 245 (6.0%) | 243 (6.8%) |
| 45 to 59 Minutes | 263 (6.5%) | 298 (8.3%) |
| 60 to 89 Minutes | 420 (10.4%) | 182 (5.1%) |
| 90 or more Minutes | 594 (14.7%) | 154 (4.3%) |
Time of Departure to Work by Sex in Kings Park
The most frequent times of departure to work in Kings Park are 7:00 AM to 7:29 AM (711, 17.5%) for males and 7:30 AM to 7:59 AM (842, 23.4%) for females.
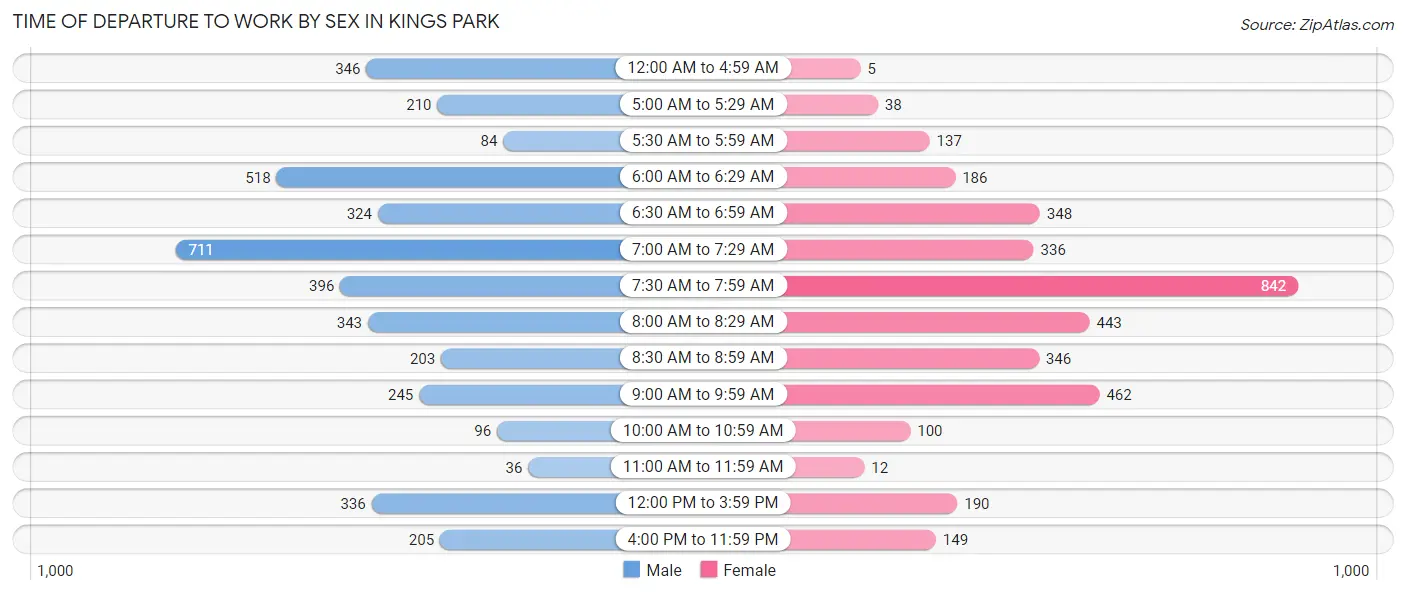
| Time of Departure | Male | Female |
| 12:00 AM to 4:59 AM | 346 (8.5%) | 5 (0.1%) |
| 5:00 AM to 5:29 AM | 210 (5.2%) | 38 (1.1%) |
| 5:30 AM to 5:59 AM | 84 (2.1%) | 137 (3.8%) |
| 6:00 AM to 6:29 AM | 518 (12.8%) | 186 (5.2%) |
| 6:30 AM to 6:59 AM | 324 (8.0%) | 348 (9.7%) |
| 7:00 AM to 7:29 AM | 711 (17.5%) | 336 (9.3%) |
| 7:30 AM to 7:59 AM | 396 (9.8%) | 842 (23.4%) |
| 8:00 AM to 8:29 AM | 343 (8.5%) | 443 (12.3%) |
| 8:30 AM to 8:59 AM | 203 (5.0%) | 346 (9.6%) |
| 9:00 AM to 9:59 AM | 245 (6.0%) | 462 (12.9%) |
| 10:00 AM to 10:59 AM | 96 (2.4%) | 100 (2.8%) |
| 11:00 AM to 11:59 AM | 36 (0.9%) | 12 (0.3%) |
| 12:00 PM to 3:59 PM | 336 (8.3%) | 190 (5.3%) |
| 4:00 PM to 11:59 PM | 205 (5.1%) | 149 (4.2%) |
| Total | 4,053 (100.0%) | 3,594 (100.0%) |
Housing Occupancy in Kings Park
Occupancy by Ownership in Kings Park
Of the total 6,325 dwellings in Kings Park, owner-occupied units account for 5,287 (83.6%), while renter-occupied units make up 1,038 (16.4%).
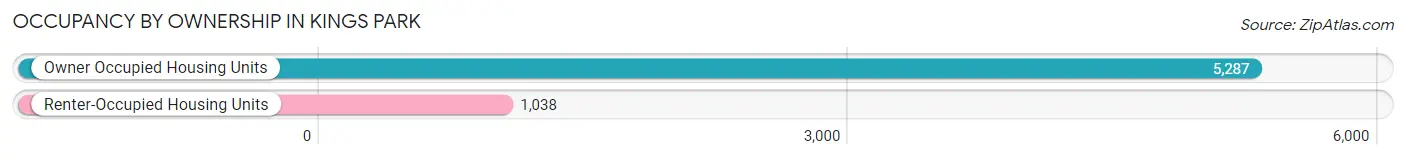
| Occupancy | # Housing Units | % Housing Units |
| Owner Occupied Housing Units | 5,287 | 83.6% |
| Renter-Occupied Housing Units | 1,038 | 16.4% |
| Total Occupied Housing Units | 6,325 | 100.0% |
Occupancy by Household Size in Kings Park
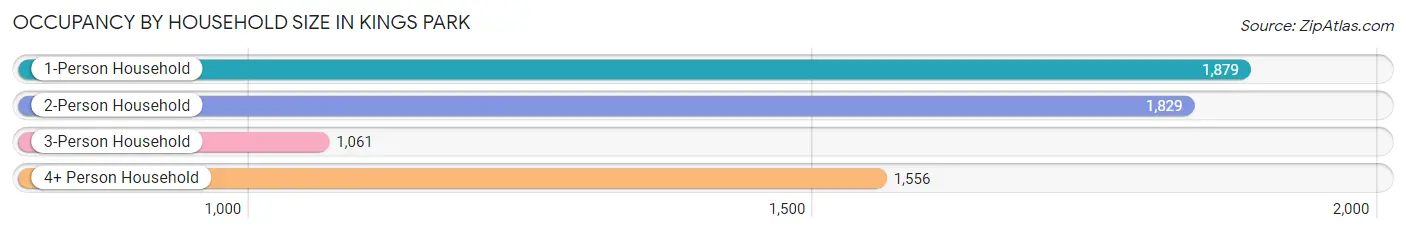
| Household Size | # Housing Units | % Housing Units |
| 1-Person Household | 1,879 | 29.7% |
| 2-Person Household | 1,829 | 28.9% |
| 3-Person Household | 1,061 | 16.8% |
| 4+ Person Household | 1,556 | 24.6% |
| Total Housing Units | 6,325 | 100.0% |
Occupancy by Ownership by Household Size in Kings Park
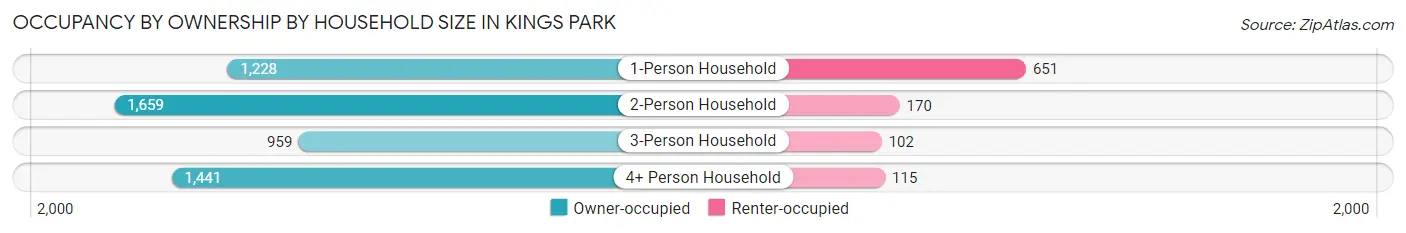
| Household Size | Owner-occupied | Renter-occupied |
| 1-Person Household | 1,228 (65.3%) | 651 (34.6%) |
| 2-Person Household | 1,659 (90.7%) | 170 (9.3%) |
| 3-Person Household | 959 (90.4%) | 102 (9.6%) |
| 4+ Person Household | 1,441 (92.6%) | 115 (7.4%) |
| Total Housing Units | 5,287 (83.6%) | 1,038 (16.4%) |
Occupancy by Educational Attainment in Kings Park
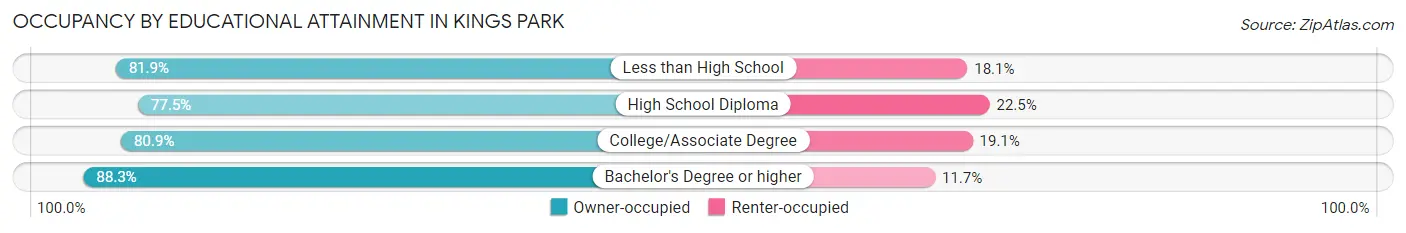
| Household Size | Owner-occupied | Renter-occupied |
| Less than High School | 136 (81.9%) | 30 (18.1%) |
| High School Diploma | 1,155 (77.5%) | 335 (22.5%) |
| College/Associate Degree | 1,392 (80.9%) | 329 (19.1%) |
| Bachelor's Degree or higher | 2,604 (88.3%) | 344 (11.7%) |
Occupancy by Age of Householder in Kings Park
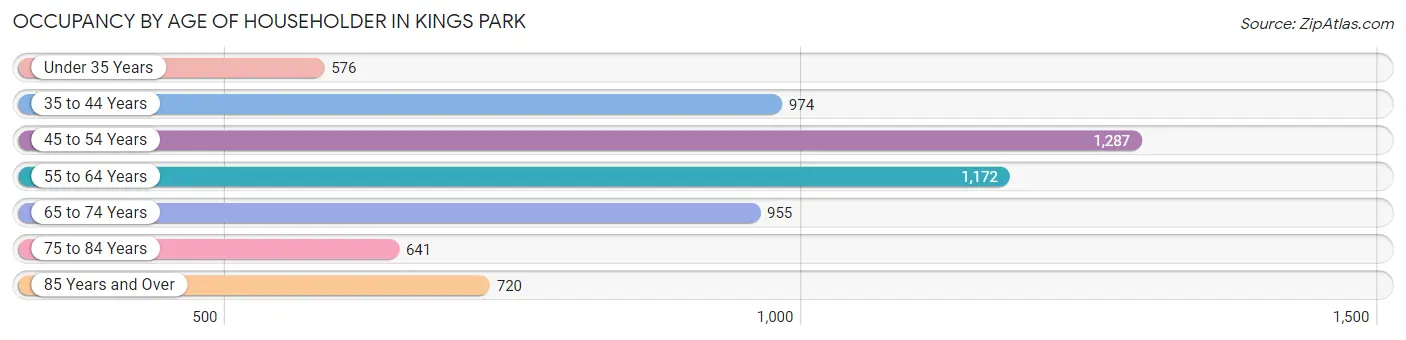
| Age Bracket | # Households | % Households |
| Under 35 Years | 576 | 9.1% |
| 35 to 44 Years | 974 | 15.4% |
| 45 to 54 Years | 1,287 | 20.3% |
| 55 to 64 Years | 1,172 | 18.5% |
| 65 to 74 Years | 955 | 15.1% |
| 75 to 84 Years | 641 | 10.1% |
| 85 Years and Over | 720 | 11.4% |
| Total | 6,325 | 100.0% |
Housing Finances in Kings Park
Median Income by Occupancy in Kings Park
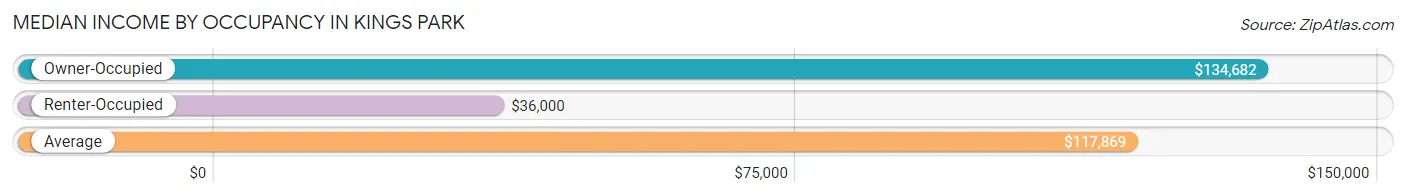
| Occupancy Type | # Households | Median Income |
| Owner-Occupied | 5,287 (83.6%) | $134,682 |
| Renter-Occupied | 1,038 (16.4%) | $36,000 |
| Average | 6,325 (100.0%) | $117,869 |
Occupancy by Householder Income Bracket in Kings Park
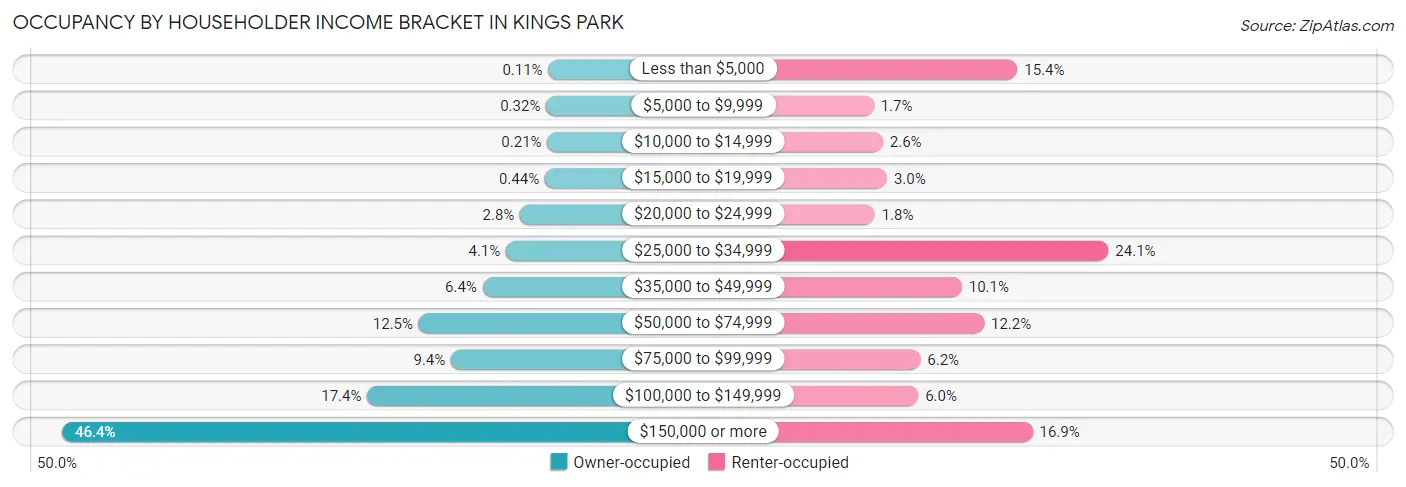
| Income Bracket | Owner-occupied | Renter-occupied |
| Less than $5,000 | 6 (0.1%) | 160 (15.4%) |
| $5,000 to $9,999 | 17 (0.3%) | 18 (1.7%) |
| $10,000 to $14,999 | 11 (0.2%) | 27 (2.6%) |
| $15,000 to $19,999 | 23 (0.4%) | 31 (3.0%) |
| $20,000 to $24,999 | 148 (2.8%) | 19 (1.8%) |
| $25,000 to $34,999 | 219 (4.1%) | 250 (24.1%) |
| $35,000 to $49,999 | 337 (6.4%) | 105 (10.1%) |
| $50,000 to $74,999 | 658 (12.4%) | 127 (12.2%) |
| $75,000 to $99,999 | 496 (9.4%) | 64 (6.2%) |
| $100,000 to $149,999 | 918 (17.4%) | 62 (6.0%) |
| $150,000 or more | 2,454 (46.4%) | 175 (16.9%) |
| Total | 5,287 (100.0%) | 1,038 (100.0%) |
Monthly Housing Cost Tiers in Kings Park
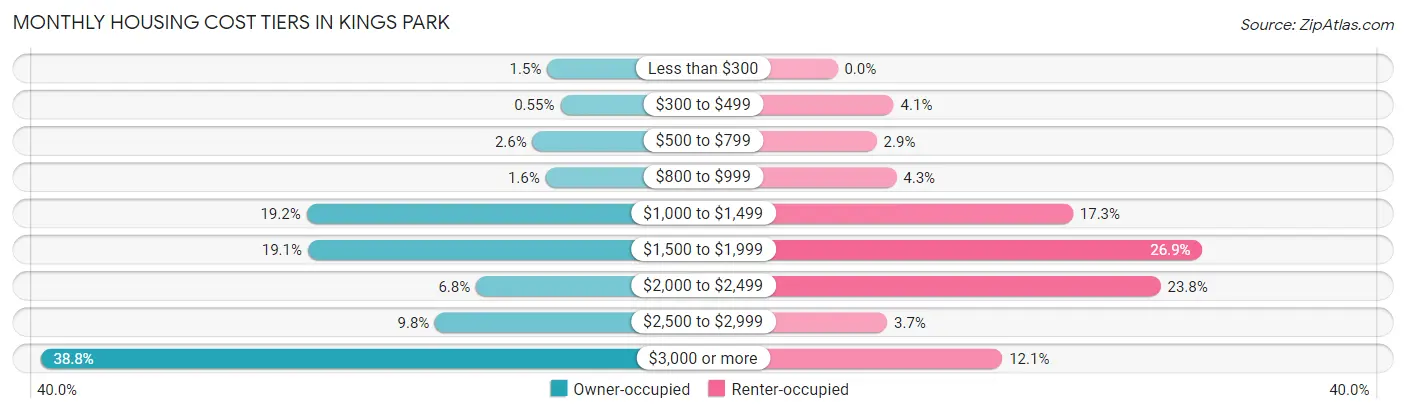
| Monthly Cost | Owner-occupied | Renter-occupied |
| Less than $300 | 80 (1.5%) | 0 (0.0%) |
| $300 to $499 | 29 (0.5%) | 43 (4.1%) |
| $500 to $799 | 137 (2.6%) | 30 (2.9%) |
| $800 to $999 | 86 (1.6%) | 45 (4.3%) |
| $1,000 to $1,499 | 1,017 (19.2%) | 180 (17.3%) |
| $1,500 to $1,999 | 1,012 (19.1%) | 279 (26.9%) |
| $2,000 to $2,499 | 357 (6.8%) | 247 (23.8%) |
| $2,500 to $2,999 | 516 (9.8%) | 38 (3.7%) |
| $3,000 or more | 2,053 (38.8%) | 126 (12.1%) |
| Total | 5,287 (100.0%) | 1,038 (100.0%) |
Physical Housing Characteristics in Kings Park
Housing Structures in Kings Park
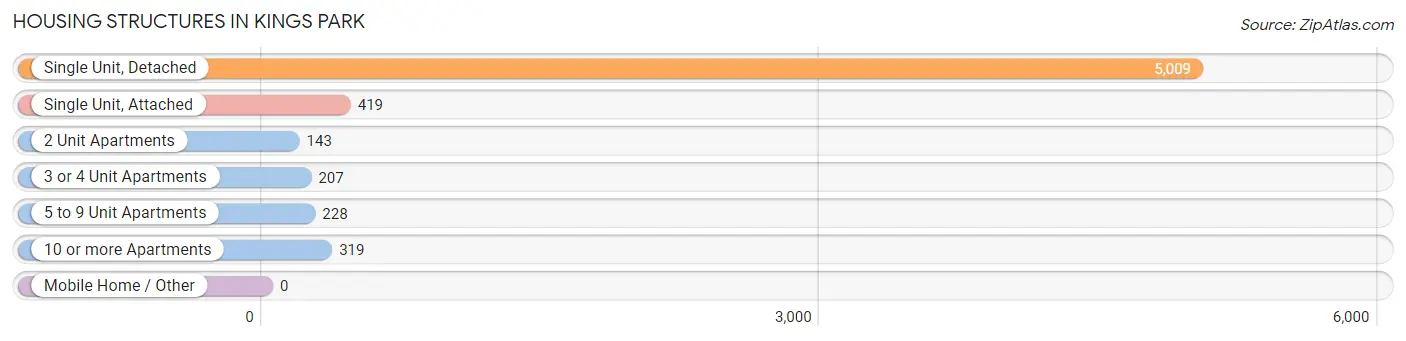
| Structure Type | # Housing Units | % Housing Units |
| Single Unit, Detached | 5,009 | 79.2% |
| Single Unit, Attached | 419 | 6.6% |
| 2 Unit Apartments | 143 | 2.3% |
| 3 or 4 Unit Apartments | 207 | 3.3% |
| 5 to 9 Unit Apartments | 228 | 3.6% |
| 10 or more Apartments | 319 | 5.0% |
| Mobile Home / Other | 0 | 0.0% |
| Total | 6,325 | 100.0% |
Housing Structures by Occupancy in Kings Park
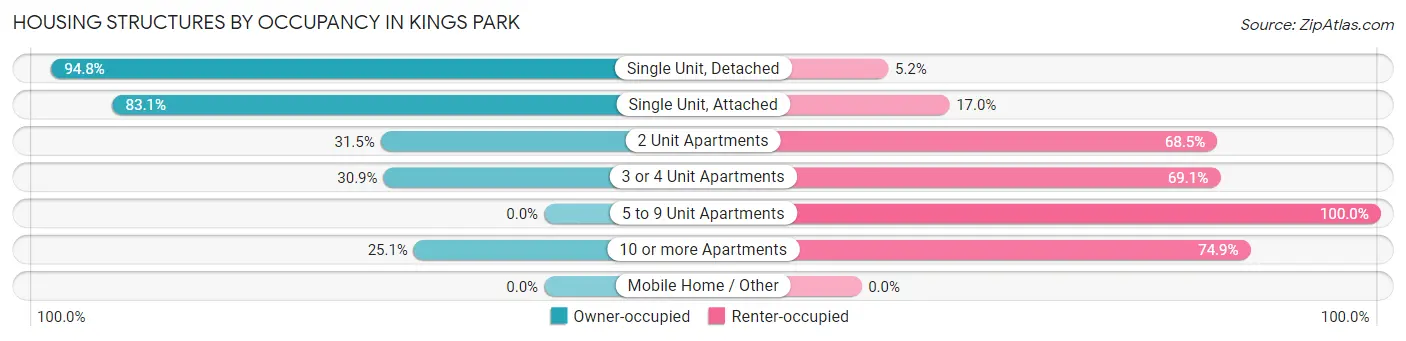
| Structure Type | Owner-occupied | Renter-occupied |
| Single Unit, Detached | 4,750 (94.8%) | 259 (5.2%) |
| Single Unit, Attached | 348 (83.1%) | 71 (17.0%) |
| 2 Unit Apartments | 45 (31.5%) | 98 (68.5%) |
| 3 or 4 Unit Apartments | 64 (30.9%) | 143 (69.1%) |
| 5 to 9 Unit Apartments | 0 (0.0%) | 228 (100.0%) |
| 10 or more Apartments | 80 (25.1%) | 239 (74.9%) |
| Mobile Home / Other | 0 (0.0%) | 0 (0.0%) |
| Total | 5,287 (83.6%) | 1,038 (16.4%) |
Housing Structures by Number of Rooms in Kings Park
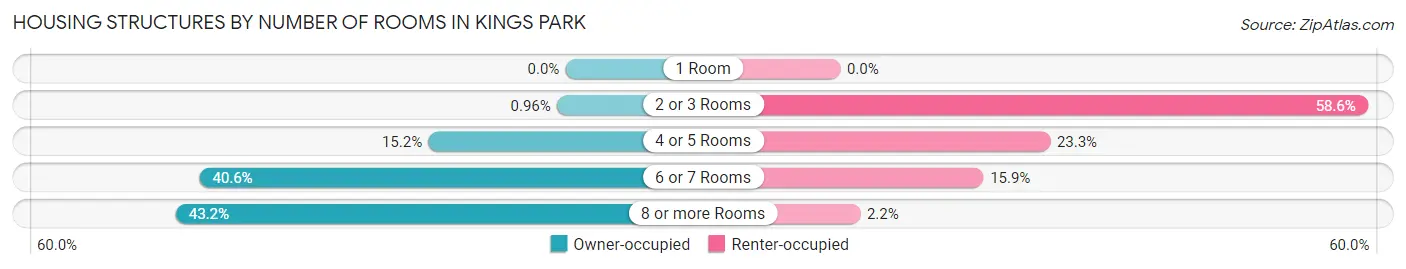
| Number of Rooms | Owner-occupied | Renter-occupied |
| 1 Room | 0 (0.0%) | 0 (0.0%) |
| 2 or 3 Rooms | 51 (1.0%) | 608 (58.6%) |
| 4 or 5 Rooms | 805 (15.2%) | 242 (23.3%) |
| 6 or 7 Rooms | 2,146 (40.6%) | 165 (15.9%) |
| 8 or more Rooms | 2,285 (43.2%) | 23 (2.2%) |
| Total | 5,287 (100.0%) | 1,038 (100.0%) |
Housing Structure by Heating Type in Kings Park
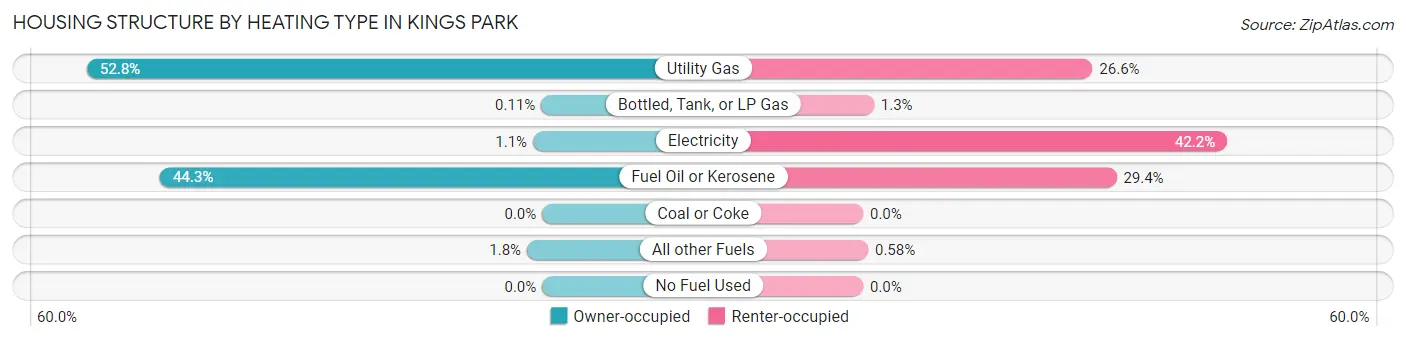
| Heating Type | Owner-occupied | Renter-occupied |
| Utility Gas | 2,790 (52.8%) | 276 (26.6%) |
| Bottled, Tank, or LP Gas | 6 (0.1%) | 13 (1.3%) |
| Electricity | 56 (1.1%) | 438 (42.2%) |
| Fuel Oil or Kerosene | 2,342 (44.3%) | 305 (29.4%) |
| Coal or Coke | 0 (0.0%) | 0 (0.0%) |
| All other Fuels | 93 (1.8%) | 6 (0.6%) |
| No Fuel Used | 0 (0.0%) | 0 (0.0%) |
| Total | 5,287 (100.0%) | 1,038 (100.0%) |
Household Vehicle Usage in Kings Park
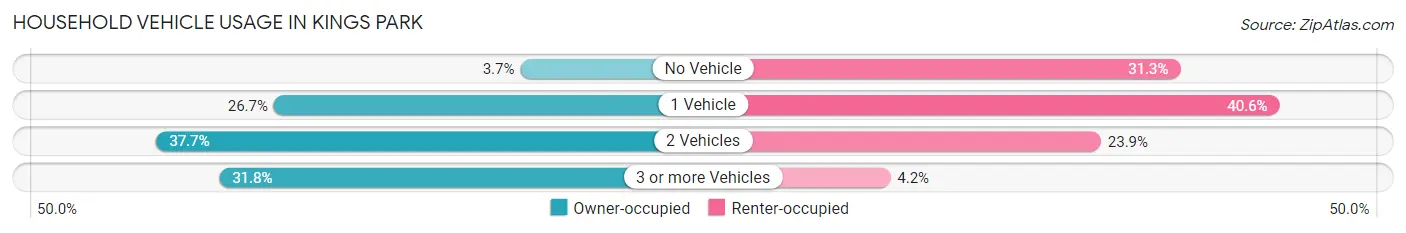
| Vehicles per Household | Owner-occupied | Renter-occupied |
| No Vehicle | 197 (3.7%) | 325 (31.3%) |
| 1 Vehicle | 1,414 (26.7%) | 421 (40.6%) |
| 2 Vehicles | 1,993 (37.7%) | 248 (23.9%) |
| 3 or more Vehicles | 1,683 (31.8%) | 44 (4.2%) |
| Total | 5,287 (100.0%) | 1,038 (100.0%) |
Real Estate & Mortgages in Kings Park
Real Estate and Mortgage Overview in Kings Park
| Characteristic | Without Mortgage | With Mortgage |
| Housing Units | 2,040 | 3,247 |
| Median Property Value | $572,800 | $544,000 |
| Median Household Income | $75,119 | $1,975 |
| Monthly Housing Costs | $1,433 | $2,053 |
| Real Estate Taxes | $10,001 | $28 |
Property Value by Mortgage Status in Kings Park
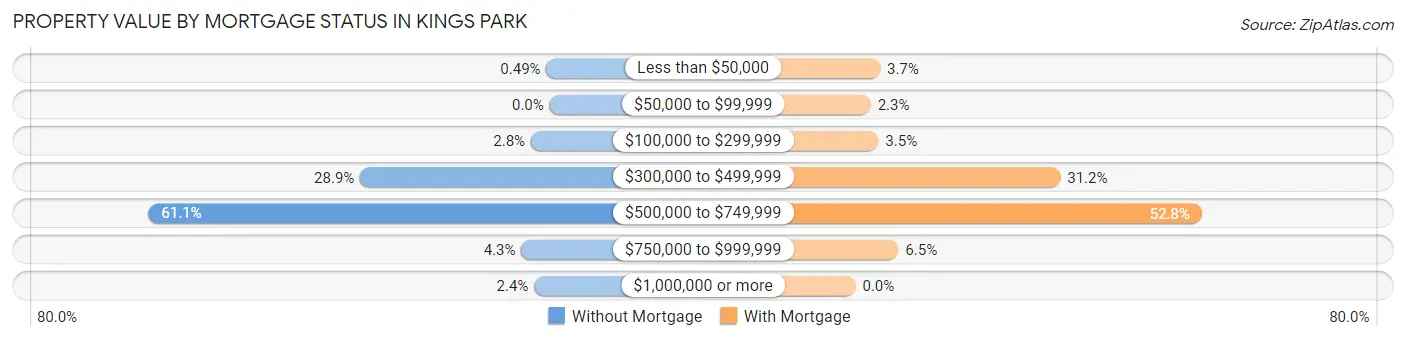
| Property Value | Without Mortgage | With Mortgage |
| Less than $50,000 | 10 (0.5%) | 121 (3.7%) |
| $50,000 to $99,999 | 0 (0.0%) | 75 (2.3%) |
| $100,000 to $299,999 | 58 (2.8%) | 113 (3.5%) |
| $300,000 to $499,999 | 589 (28.9%) | 1,013 (31.2%) |
| $500,000 to $749,999 | 1,247 (61.1%) | 1,713 (52.8%) |
| $750,000 to $999,999 | 88 (4.3%) | 212 (6.5%) |
| $1,000,000 or more | 48 (2.4%) | 0 (0.0%) |
| Total | 2,040 (100.0%) | 3,247 (100.0%) |
Household Income by Mortgage Status in Kings Park
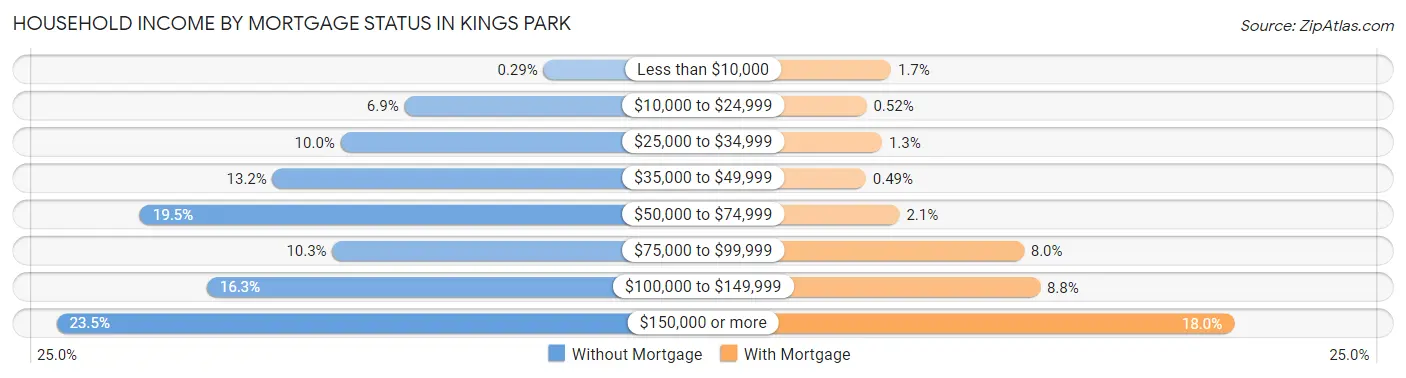
| Household Income | Without Mortgage | With Mortgage |
| Less than $10,000 | 6 (0.3%) | 55 (1.7%) |
| $10,000 to $24,999 | 141 (6.9%) | 17 (0.5%) |
| $25,000 to $34,999 | 203 (10.0%) | 41 (1.3%) |
| $35,000 to $49,999 | 269 (13.2%) | 16 (0.5%) |
| $50,000 to $74,999 | 398 (19.5%) | 68 (2.1%) |
| $75,000 to $99,999 | 211 (10.3%) | 260 (8.0%) |
| $100,000 to $149,999 | 333 (16.3%) | 285 (8.8%) |
| $150,000 or more | 479 (23.5%) | 585 (18.0%) |
| Total | 2,040 (100.0%) | 3,247 (100.0%) |
Property Value to Household Income Ratio in Kings Park
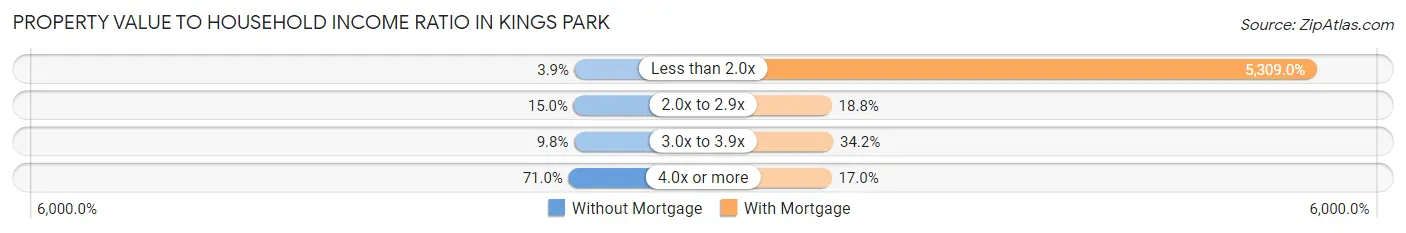
| Value-to-Income Ratio | Without Mortgage | With Mortgage |
| Less than 2.0x | 79 (3.9%) | 172,382 (5,309.0%) |
| 2.0x to 2.9x | 306 (15.0%) | 611 (18.8%) |
| 3.0x to 3.9x | 200 (9.8%) | 1,111 (34.2%) |
| 4.0x or more | 1,449 (71.0%) | 552 (17.0%) |
| Total | 2,040 (100.0%) | 3,247 (100.0%) |
Real Estate Taxes by Mortgage Status in Kings Park
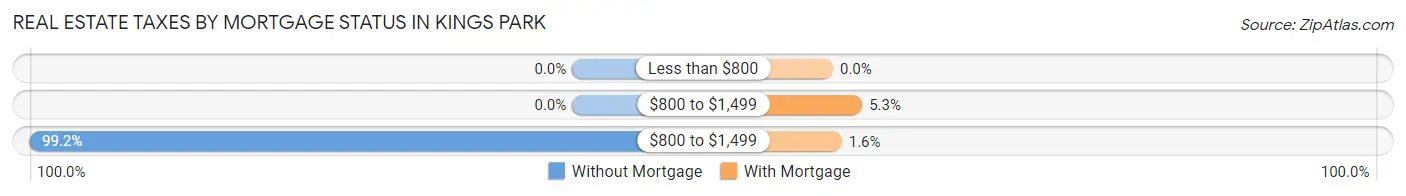
| Property Taxes | Without Mortgage | With Mortgage |
| Less than $800 | 0 (0.0%) | 0 (0.0%) |
| $800 to $1,499 | 0 (0.0%) | 173 (5.3%) |
| $800 to $1,499 | 2,023 (99.2%) | 52 (1.6%) |
| Total | 2,040 (100.0%) | 3,247 (100.0%) |
Health & Disability in Kings Park
Health Insurance Coverage by Age in Kings Park
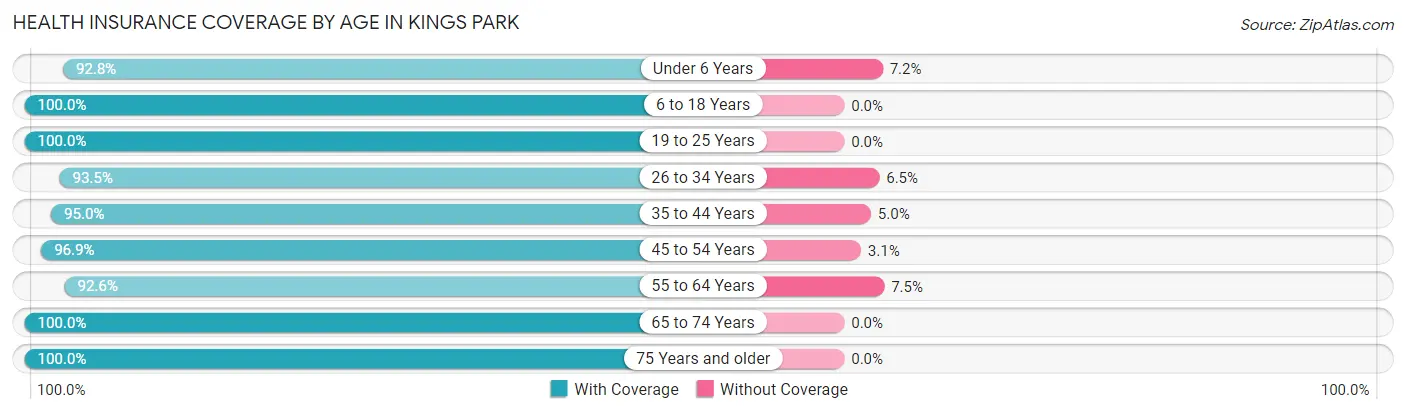
| Age Bracket | With Coverage | Without Coverage |
| Under 6 Years | 882 (92.8%) | 68 (7.2%) |
| 6 to 18 Years | 2,453 (100.0%) | 0 (0.0%) |
| 19 to 25 Years | 1,381 (100.0%) | 0 (0.0%) |
| 26 to 34 Years | 1,660 (93.5%) | 116 (6.5%) |
| 35 to 44 Years | 1,916 (95.0%) | 100 (5.0%) |
| 45 to 54 Years | 2,285 (96.9%) | 73 (3.1%) |
| 55 to 64 Years | 1,950 (92.5%) | 157 (7.4%) |
| 65 to 74 Years | 1,579 (100.0%) | 0 (0.0%) |
| 75 Years and older | 1,907 (100.0%) | 0 (0.0%) |
| Total | 16,013 (96.9%) | 514 (3.1%) |
Health Insurance Coverage by Citizenship Status in Kings Park
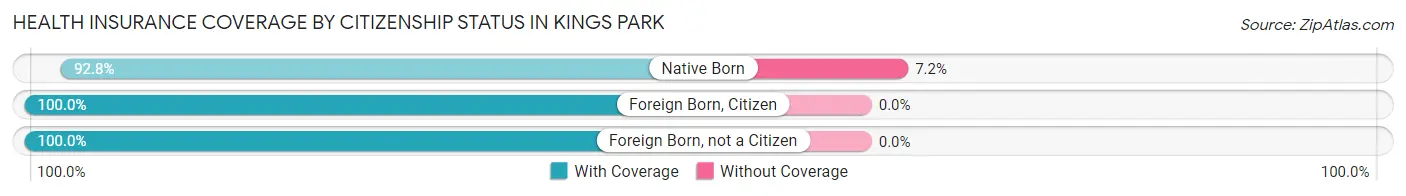
| Citizenship Status | With Coverage | Without Coverage |
| Native Born | 882 (92.8%) | 68 (7.2%) |
| Foreign Born, Citizen | 2,453 (100.0%) | 0 (0.0%) |
| Foreign Born, not a Citizen | 1,381 (100.0%) | 0 (0.0%) |
Health Insurance Coverage by Household Income in Kings Park
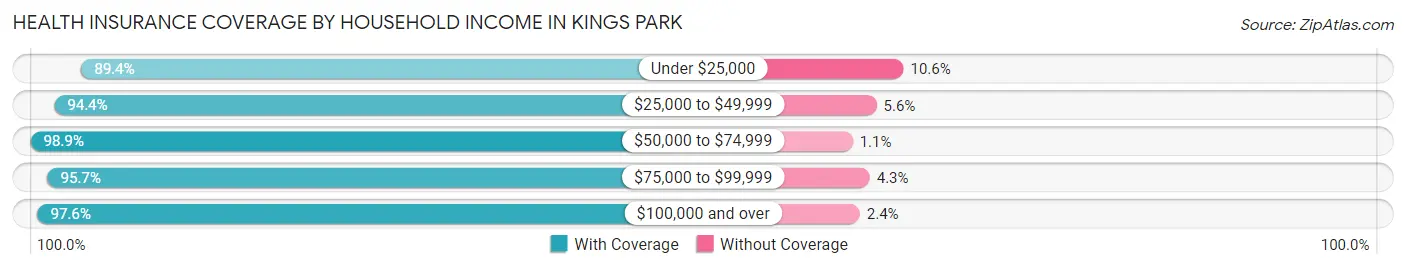
| Household Income | With Coverage | Without Coverage |
| Under $25,000 | 706 (89.4%) | 84 (10.6%) |
| $25,000 to $49,999 | 1,321 (94.4%) | 78 (5.6%) |
| $50,000 to $74,999 | 1,509 (98.9%) | 17 (1.1%) |
| $75,000 to $99,999 | 1,065 (95.7%) | 48 (4.3%) |
| $100,000 and over | 11,333 (97.6%) | 284 (2.4%) |
Public vs Private Health Insurance Coverage by Age in Kings Park
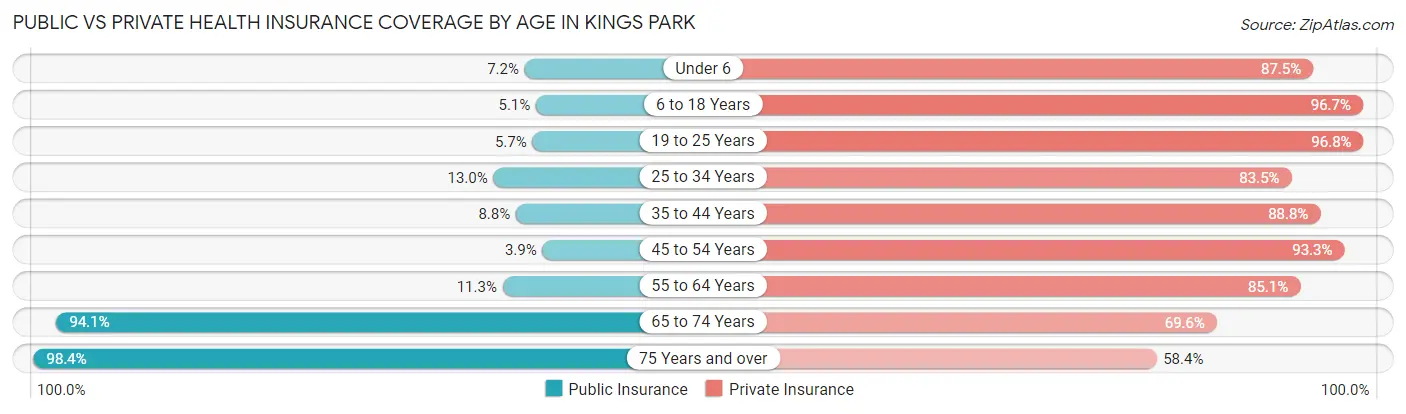
| Age Bracket | Public Insurance | Private Insurance |
| Under 6 | 68 (7.2%) | 831 (87.5%) |
| 6 to 18 Years | 124 (5.1%) | 2,372 (96.7%) |
| 19 to 25 Years | 79 (5.7%) | 1,337 (96.8%) |
| 25 to 34 Years | 230 (13.0%) | 1,482 (83.5%) |
| 35 to 44 Years | 177 (8.8%) | 1,790 (88.8%) |
| 45 to 54 Years | 91 (3.9%) | 2,199 (93.3%) |
| 55 to 64 Years | 237 (11.3%) | 1,792 (85.1%) |
| 65 to 74 Years | 1,486 (94.1%) | 1,099 (69.6%) |
| 75 Years and over | 1,876 (98.4%) | 1,113 (58.4%) |
| Total | 4,368 (26.4%) | 14,015 (84.8%) |
Disability Status by Sex by Age in Kings Park
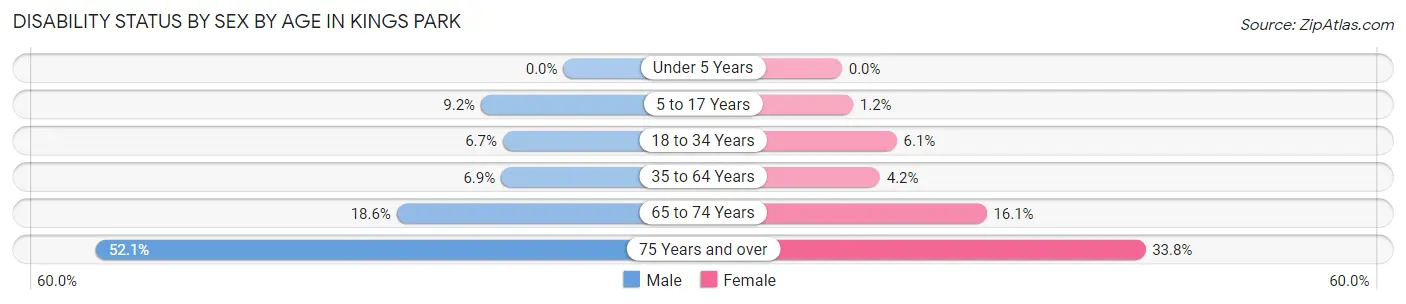
| Age Bracket | Male | Female |
| Under 5 Years | 0 (0.0%) | 0 (0.0%) |
| 5 to 17 Years | 92 (9.2%) | 17 (1.2%) |
| 18 to 34 Years | 108 (6.7%) | 103 (6.1%) |
| 35 to 64 Years | 230 (6.9%) | 134 (4.2%) |
| 65 to 74 Years | 126 (18.6%) | 145 (16.1%) |
| 75 Years and over | 418 (52.0%) | 373 (33.8%) |
Disability Class by Sex by Age in Kings Park
Disability Class: Hearing Difficulty
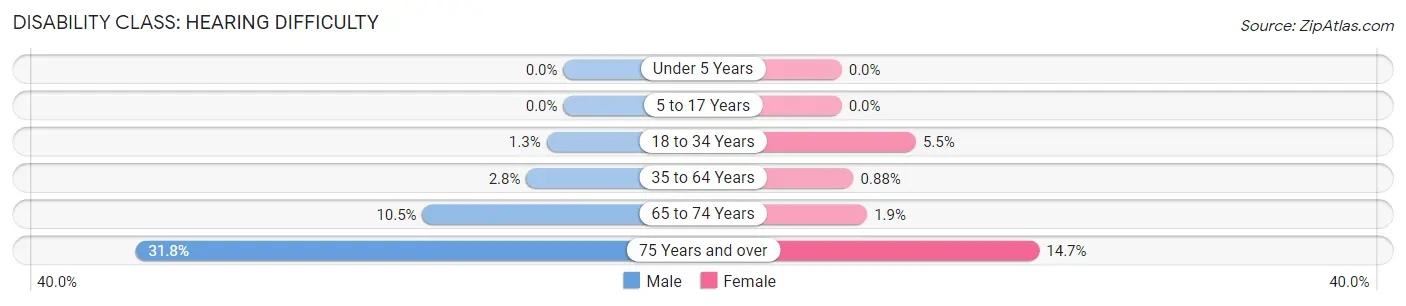
| Age Bracket | Male | Female |
| Under 5 Years | 0 (0.0%) | 0 (0.0%) |
| 5 to 17 Years | 0 (0.0%) | 0 (0.0%) |
| 18 to 34 Years | 20 (1.3%) | 93 (5.5%) |
| 35 to 64 Years | 91 (2.8%) | 28 (0.9%) |
| 65 to 74 Years | 71 (10.5%) | 17 (1.9%) |
| 75 Years and over | 255 (31.8%) | 162 (14.7%) |
Disability Class: Vision Difficulty
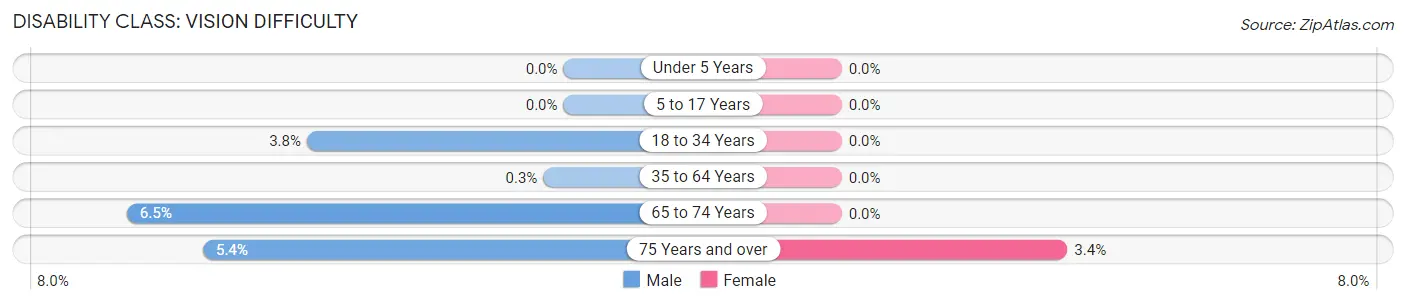
| Age Bracket | Male | Female |
| Under 5 Years | 0 (0.0%) | 0 (0.0%) |
| 5 to 17 Years | 0 (0.0%) | 0 (0.0%) |
| 18 to 34 Years | 61 (3.8%) | 0 (0.0%) |
| 35 to 64 Years | 10 (0.3%) | 0 (0.0%) |
| 65 to 74 Years | 44 (6.5%) | 0 (0.0%) |
| 75 Years and over | 43 (5.3%) | 37 (3.4%) |
Disability Class: Cognitive Difficulty
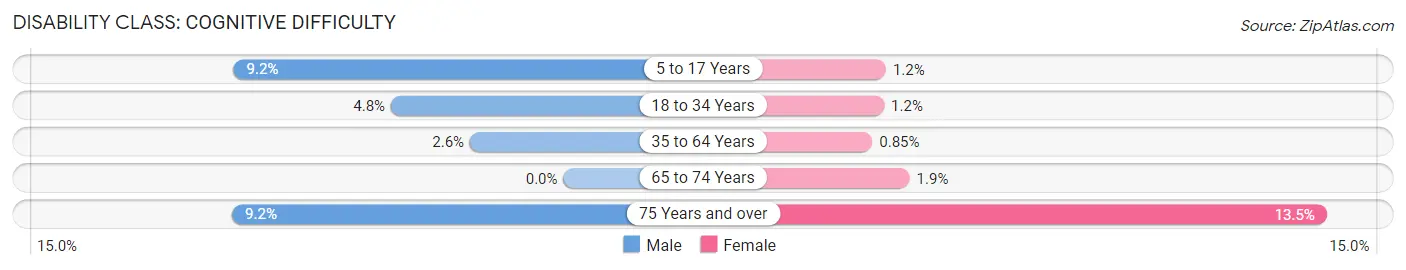
| Age Bracket | Male | Female |
| 5 to 17 Years | 92 (9.2%) | 17 (1.2%) |
| 18 to 34 Years | 77 (4.8%) | 20 (1.2%) |
| 35 to 64 Years | 86 (2.6%) | 27 (0.9%) |
| 65 to 74 Years | 0 (0.0%) | 17 (1.9%) |
| 75 Years and over | 74 (9.2%) | 149 (13.5%) |
Disability Class: Ambulatory Difficulty
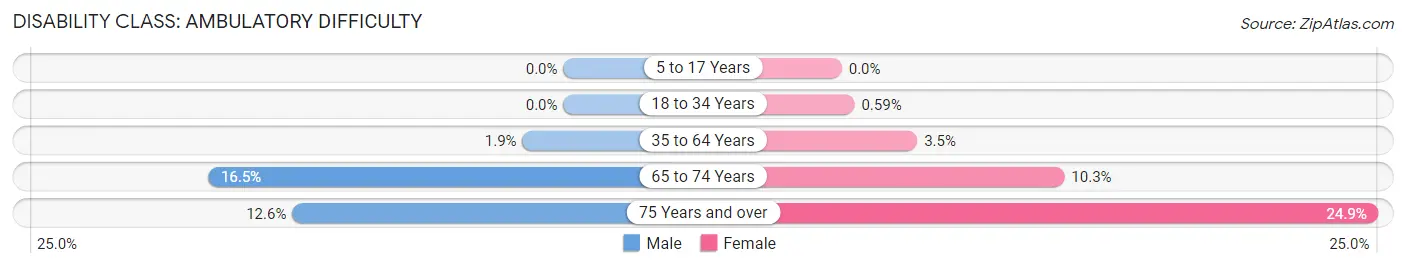
| Age Bracket | Male | Female |
| 5 to 17 Years | 0 (0.0%) | 0 (0.0%) |
| 18 to 34 Years | 0 (0.0%) | 10 (0.6%) |
| 35 to 64 Years | 63 (1.9%) | 111 (3.5%) |
| 65 to 74 Years | 112 (16.5%) | 93 (10.3%) |
| 75 Years and over | 101 (12.6%) | 275 (24.9%) |
Disability Class: Self-Care Difficulty
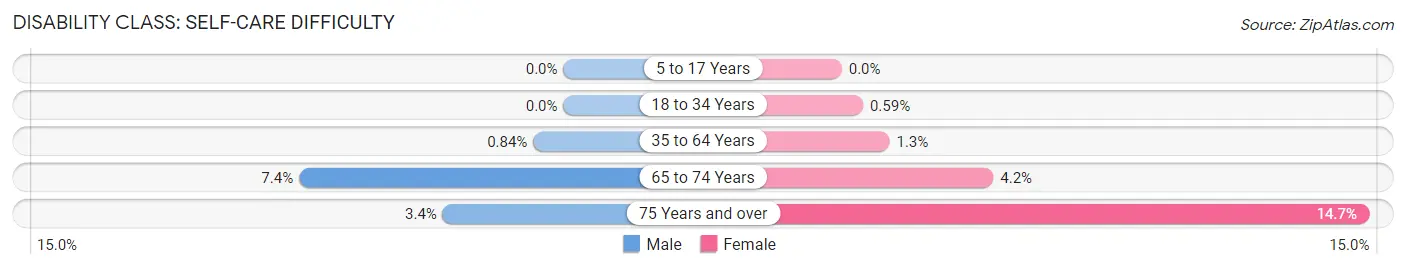
| Age Bracket | Male | Female |
| 5 to 17 Years | 0 (0.0%) | 0 (0.0%) |
| 18 to 34 Years | 0 (0.0%) | 10 (0.6%) |
| 35 to 64 Years | 28 (0.8%) | 42 (1.3%) |
| 65 to 74 Years | 50 (7.4%) | 38 (4.2%) |
| 75 Years and over | 27 (3.4%) | 162 (14.7%) |
Technology Access in Kings Park
Computing Device Access in Kings Park
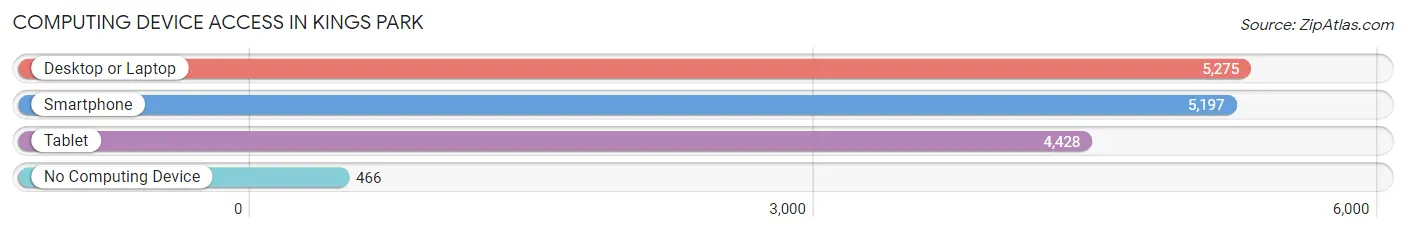
| Device Type | # Households | % Households |
| Desktop or Laptop | 5,275 | 83.4% |
| Smartphone | 5,197 | 82.2% |
| Tablet | 4,428 | 70.0% |
| No Computing Device | 466 | 7.4% |
| Total | 6,325 | 100.0% |
Internet Access in Kings Park
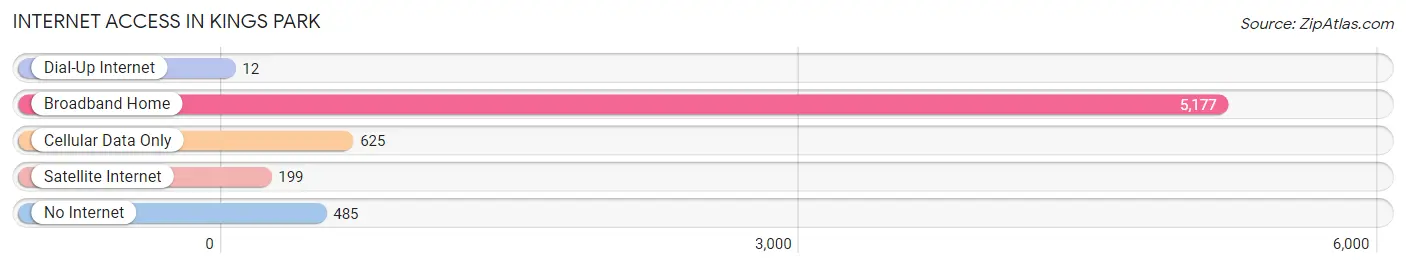
| Internet Type | # Households | % Households |
| Dial-Up Internet | 12 | 0.2% |
| Broadband Home | 5,177 | 81.9% |
| Cellular Data Only | 625 | 9.9% |
| Satellite Internet | 199 | 3.2% |
| No Internet | 485 | 7.7% |
| Total | 6,325 | 100.0% |
Kings Park Summary
Introduction
Kings Park is a hamlet located in the Town of Smithtown in Suffolk County, New York. It is situated on the north shore of Long Island, approximately 60 miles east of New York City. The hamlet is bordered by the Nissequogue River to the north, the Long Island Sound to the south, and the Nissequogue State Park to the east. Kings Park is a suburban community with a population of 17,282 as of the 2010 census.
History
The area that is now Kings Park was originally inhabited by the Matinecock Native American tribe. The first European settlers arrived in the area in the late 1600s. The hamlet was originally known as Indian Head, and was renamed Kings Park in 1873 after the Kings Park Psychiatric Center was established. The center was built on the grounds of the former Kings Park Naval Ammunition Depot, which was established in 1873.
The Kings Park Psychiatric Center was a state-run mental health facility that operated from 1885 to 1996. It was the largest mental health facility in the United States at the time of its closure. The facility was home to over 10,000 patients at its peak.
Geography
Kings Park is located at 40°54'N 73°14'W. It is situated on the north shore of Long Island, approximately 60 miles east of New York City. The hamlet is bordered by the Nissequogue River to the north, the Long Island Sound to the south, and the Nissequogue State Park to the east.
The hamlet is located in the Town of Smithtown in Suffolk County, New York. It is part of the Smithtown Central School District. The hamlet is served by the Kings Park Central School District, which consists of four elementary schools, one middle school, and one high school.
Economy
The economy of Kings Park is largely based on the service industry. The hamlet is home to a variety of restaurants, retail stores, and professional services. The hamlet is also home to a number of corporate offices, including the headquarters of the North Shore-LIJ Health System.
The hamlet is also home to a number of manufacturing companies, including the Kings Park Manufacturing Company, which produces a variety of industrial products. The hamlet is also home to a number of technology companies, including the Kings Park Technology Center, which is a research and development facility.
Demographics
As of the 2010 census, the population of Kings Park was 17,282. The racial makeup of the hamlet was 87.3% White, 5.2% African American, 0.3% Native American, 3.2% Asian, 0.1% Pacific Islander, 1.7% from other races, and 2.4% from two or more races. Hispanic or Latino of any race were 6.2% of the population.
The median household income in Kings Park was $90,945, and the median family income was $103,945. The per capita income for the hamlet was $37,945. About 3.2% of families and 4.3% of the population were below the poverty line, including 5.2% of those under age 18 and 4.2% of those age 65 or over.
Conclusion
Kings Park is a hamlet located in the Town of Smithtown in Suffolk County, New York. It is situated on the north shore of Long Island, approximately 60 miles east of New York City. The hamlet is bordered by the Nissequogue River to the north, the Long Island Sound to the south, and the Nissequogue State Park to the east. Kings Park is a suburban community with a population of 17,282 as of the 2010 census. The economy of Kings Park is largely based on the service industry, and the hamlet is home to a variety of restaurants, retail stores, and professional services. The racial makeup of the hamlet was 87.3% White, 5.2% African American, 0.3% Native American, 3.2% Asian, 0.1% Pacific Islander, 1.7% from other races, and 2.4% from two or more races. The median household income in Kings Park was $90,945, and the median family income was $103,945.
Common Questions
What is Per Capita Income in Kings Park?
Per Capita income in Kings Park is $55,999.
What is the Median Family Income in Kings Park?
Median Family Income in Kings Park is $161,089.
What is the Median Household income in Kings Park?
Median Household Income in Kings Park is $117,869.
What is Income or Wage Gap in Kings Park?
Income or Wage Gap in Kings Park is 30.5%.
Women in Kings Park earn 69.5 cents for every dollar earned by a man.
What is Inequality or Gini Index in Kings Park?
Inequality or Gini Index in Kings Park is 0.42.
What is the Total Population of Kings Park?
Total Population of Kings Park is 16,730.
What is the Total Male Population of Kings Park?
Total Male Population of Kings Park is 8,056.
What is the Total Female Population of Kings Park?
Total Female Population of Kings Park is 8,674.
What is the Ratio of Males per 100 Females in Kings Park?
There are 92.88 Males per 100 Females in Kings Park.
What is the Ratio of Females per 100 Males in Kings Park?
There are 107.67 Females per 100 Males in Kings Park.
What is the Median Population Age in Kings Park?
Median Population Age in Kings Park is 43.5 Years.
What is the Average Family Size in Kings Park
Average Family Size in Kings Park is 3.2 People.
What is the Average Household Size in Kings Park
Average Household Size in Kings Park is 2.6 People.
How Large is the Labor Force in Kings Park?
There are 9,120 People in the Labor Forcein in Kings Park.
What is the Percentage of People in the Labor Force in Kings Park?
65.5% of People are in the Labor Force in Kings Park.
What is the Unemployment Rate in Kings Park?
Unemployment Rate in Kings Park is 4.5%.