North Olmsted, OH Map & Demographics
North Olmsted Map
North Olmsted Overview
$42,502
PER CAPITA INCOME
$97,259
AVG FAMILY INCOME
$81,768
AVG HOUSEHOLD INCOME
29.8%
WAGE / INCOME GAP [ % ]
70.2¢/ $1
WAGE / INCOME GAP [ $ ]
0.43
INEQUALITY / GINI INDEX
32,244
TOTAL POPULATION
16,164
MALE POPULATION
16,080
FEMALE POPULATION
100.52
MALES / 100 FEMALES
99.48
FEMALES / 100 MALES
44.0
MEDIAN AGE
3.1
AVG FAMILY SIZE
2.4
AVG HOUSEHOLD SIZE
17,053
LABOR FORCE [ PEOPLE ]
65.4%
PERCENT IN LABOR FORCE
3.1%
UNEMPLOYMENT RATE
North Olmsted Zip Codes
North Olmsted Area Codes
Income in North Olmsted
Income Overview in North Olmsted
Per Capita Income in North Olmsted is $42,502, while median incomes of families and households are $97,259 and $81,768 respectively.
| Characteristic | Number | Measure |
| Per Capita Income | 32,244 | $42,502 |
| Median Family Income | 8,573 | $97,259 |
| Mean Family Income | 8,573 | $114,433 |
| Median Household Income | 13,140 | $81,768 |
| Mean Household Income | 13,140 | $102,511 |
| Income Deficit | 8,573 | $0 |
| Wage / Income Gap (%) | 32,244 | 29.84% |
| Wage / Income Gap ($) | 32,244 | 70.16¢ per $1 |
| Gini / Inequality Index | 32,244 | 0.43 |
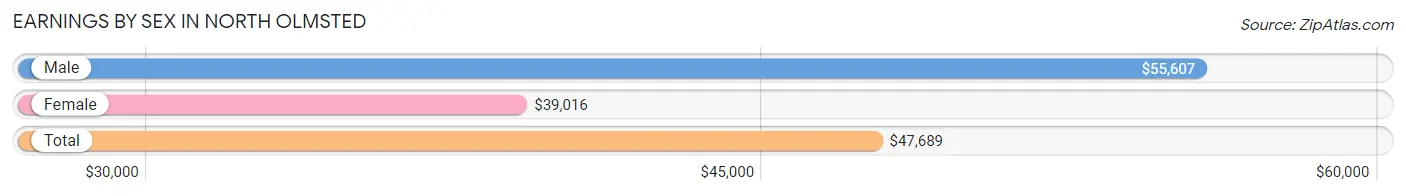
Earnings by Sex in North Olmsted
Average Earnings in North Olmsted are $47,689, $55,607 for men and $39,016 for women, a difference of 29.8%.
| Sex | Number | Average Earnings |
| Male | 9,607 (54.4%) | $55,607 |
| Female | 8,051 (45.6%) | $39,016 |
| Total | 17,658 (100.0%) | $47,689 |
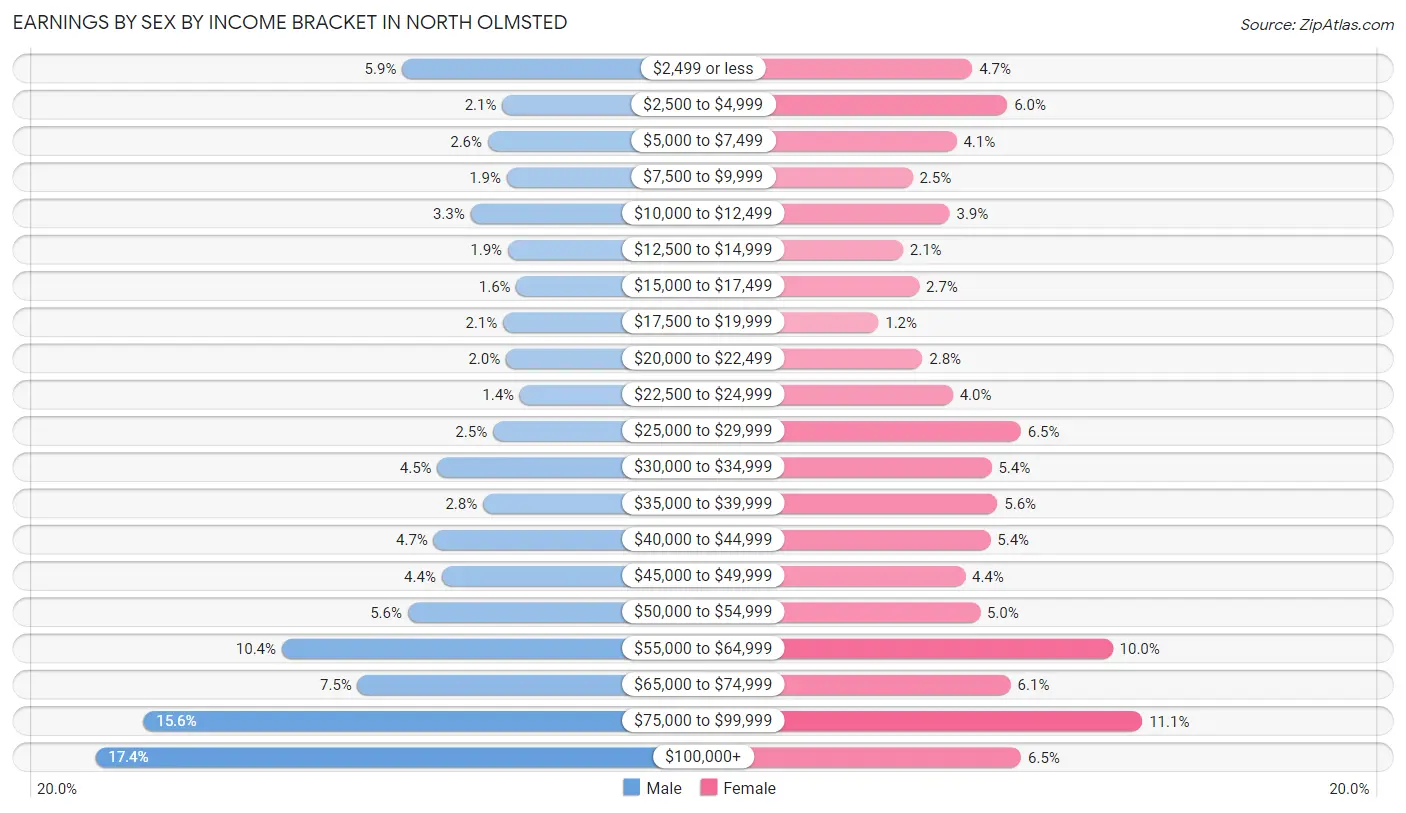
Earnings by Sex by Income Bracket in North Olmsted
The most common earnings brackets in North Olmsted are $100,000+ for men (1,667 | 17.3%) and $75,000 to $99,999 for women (891 | 11.1%).
| Income | Male | Female |
| $2,499 or less | 562 (5.9%) | 378 (4.7%) |
| $2,500 to $4,999 | 202 (2.1%) | 484 (6.0%) |
| $5,000 to $7,499 | 254 (2.6%) | 331 (4.1%) |
| $7,500 to $9,999 | 185 (1.9%) | 198 (2.5%) |
| $10,000 to $12,499 | 316 (3.3%) | 310 (3.8%) |
| $12,500 to $14,999 | 182 (1.9%) | 169 (2.1%) |
| $15,000 to $17,499 | 151 (1.6%) | 218 (2.7%) |
| $17,500 to $19,999 | 199 (2.1%) | 95 (1.2%) |
| $20,000 to $22,499 | 188 (2.0%) | 228 (2.8%) |
| $22,500 to $24,999 | 138 (1.4%) | 320 (4.0%) |
| $25,000 to $29,999 | 235 (2.5%) | 525 (6.5%) |
| $30,000 to $34,999 | 435 (4.5%) | 436 (5.4%) |
| $35,000 to $39,999 | 271 (2.8%) | 454 (5.6%) |
| $40,000 to $44,999 | 449 (4.7%) | 433 (5.4%) |
| $45,000 to $49,999 | 420 (4.4%) | 357 (4.4%) |
| $50,000 to $54,999 | 542 (5.6%) | 402 (5.0%) |
| $55,000 to $64,999 | 995 (10.4%) | 802 (10.0%) |
| $65,000 to $74,999 | 722 (7.5%) | 494 (6.1%) |
| $75,000 to $99,999 | 1,494 (15.5%) | 891 (11.1%) |
| $100,000+ | 1,667 (17.3%) | 526 (6.5%) |
| Total | 9,607 (100.0%) | 8,051 (100.0%) |
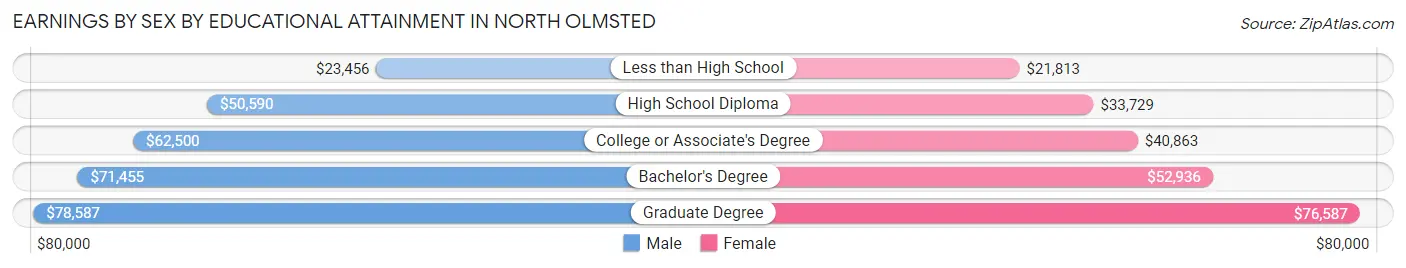
Earnings by Sex by Educational Attainment in North Olmsted
Average earnings in North Olmsted are $59,833 for men and $45,210 for women, a difference of 24.4%. Men with an educational attainment of graduate degree enjoy the highest average annual earnings of $78,587, while those with less than high school education earn the least with $23,456. Women with an educational attainment of graduate degree earn the most with the average annual earnings of $76,587, while those with less than high school education have the smallest earnings of $21,813.
| Educational Attainment | Male Income | Female Income |
| Less than High School | $23,456 | $21,813 |
| High School Diploma | $50,590 | $33,729 |
| College or Associate's Degree | $62,500 | $40,863 |
| Bachelor's Degree | $71,455 | $52,936 |
| Graduate Degree | $78,587 | $76,587 |
| Total | $59,833 | $45,210 |
Family Income in North Olmsted
Family Income Brackets in North Olmsted
According to the North Olmsted family income data, there are 2,092 families falling into the $100,000 to $149,999 income range, which is the most common income bracket and makes up 24.4% of all families. Conversely, the less than $10,000 income bracket is the least frequent group with only 103 families (1.2%) belonging to this category.
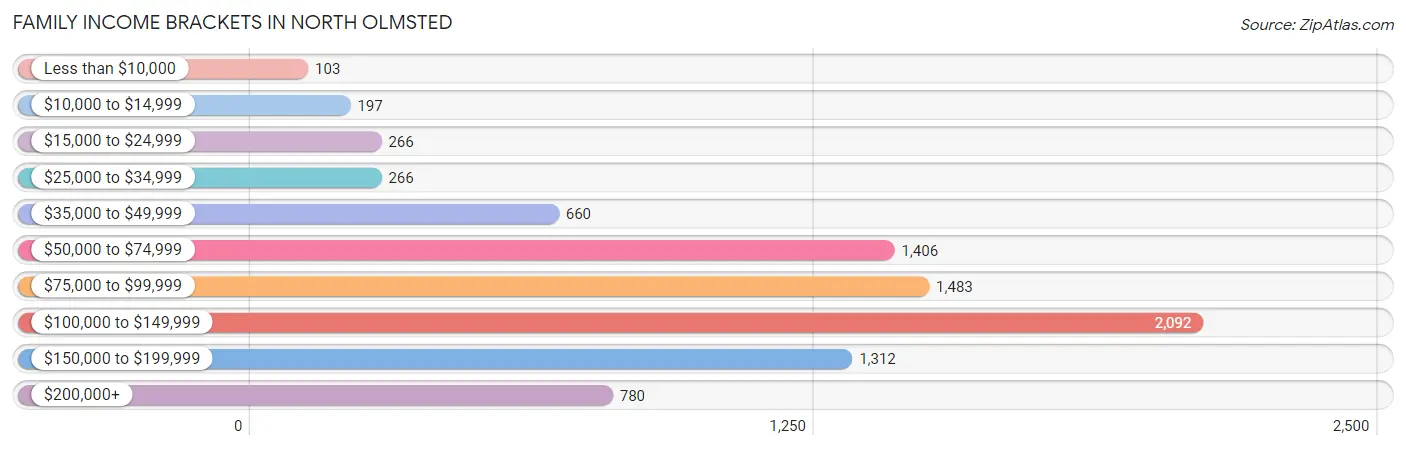
| Income Bracket | # Families | % Families |
| Less than $10,000 | 103 | 1.2% |
| $10,000 to $14,999 | 197 | 2.3% |
| $15,000 to $24,999 | 266 | 3.1% |
| $25,000 to $34,999 | 266 | 3.1% |
| $35,000 to $49,999 | 660 | 7.7% |
| $50,000 to $74,999 | 1,406 | 16.4% |
| $75,000 to $99,999 | 1,483 | 17.3% |
| $100,000 to $149,999 | 2,092 | 24.4% |
| $150,000 to $199,999 | 1,312 | 15.3% |
| $200,000+ | 780 | 9.1% |
Family Income by Famaliy Size in North Olmsted
7+ person families (205 | 2.4%) account for the highest median family income in North Olmsted with $129,221 per family, while 2-person families (4,453 | 51.9%) have the highest median income of $45,054 per family member.
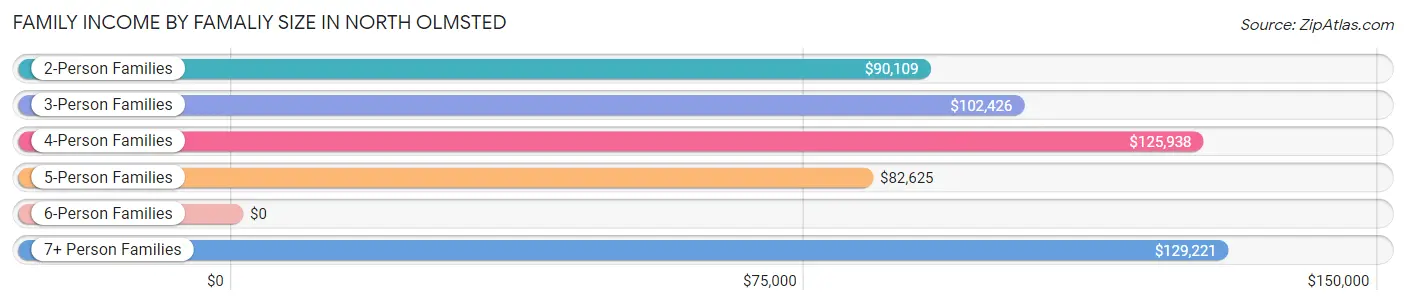
| Income Bracket | # Families | Median Income |
| 2-Person Families | 4,453 (51.9%) | $90,109 |
| 3-Person Families | 1,699 (19.8%) | $102,426 |
| 4-Person Families | 1,334 (15.6%) | $125,938 |
| 5-Person Families | 665 (7.8%) | $82,625 |
| 6-Person Families | 217 (2.5%) | $0 |
| 7+ Person Families | 205 (2.4%) | $129,221 |
| Total | 8,573 (100.0%) | $97,259 |
Family Income by Number of Earners in North Olmsted
The median family income in North Olmsted is $97,259, with families comprising 3+ earners (1,102) having the highest median family income of $143,041, while families with no earners (1,262) have the lowest median family income of $66,736, accounting for 12.9% and 14.7% of families, respectively.
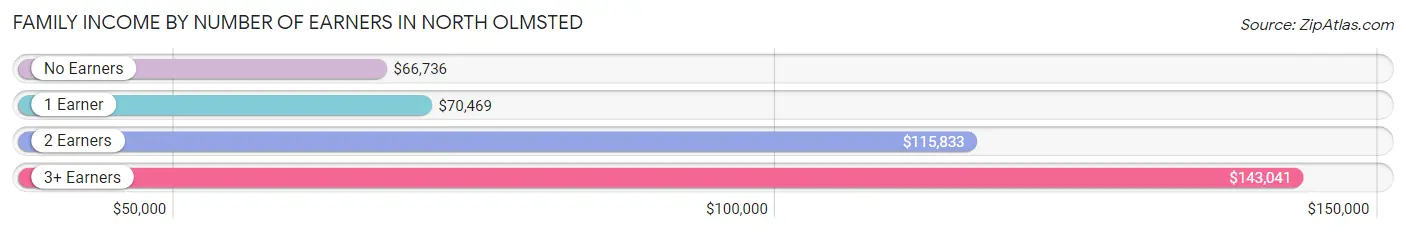
| Number of Earners | # Families | Median Income |
| No Earners | 1,262 (14.7%) | $66,736 |
| 1 Earner | 2,503 (29.2%) | $70,469 |
| 2 Earners | 3,706 (43.2%) | $115,833 |
| 3+ Earners | 1,102 (12.9%) | $143,041 |
| Total | 8,573 (100.0%) | $97,259 |
Household Income in North Olmsted
Household Income Brackets in North Olmsted
With 2,667 households falling in the category, the $100,000 to $149,999 income range is the most frequent in North Olmsted, accounting for 20.3% of all households. In contrast, only 420 households (3.2%) fall into the $10,000 to $14,999 income bracket, making it the least populous group.
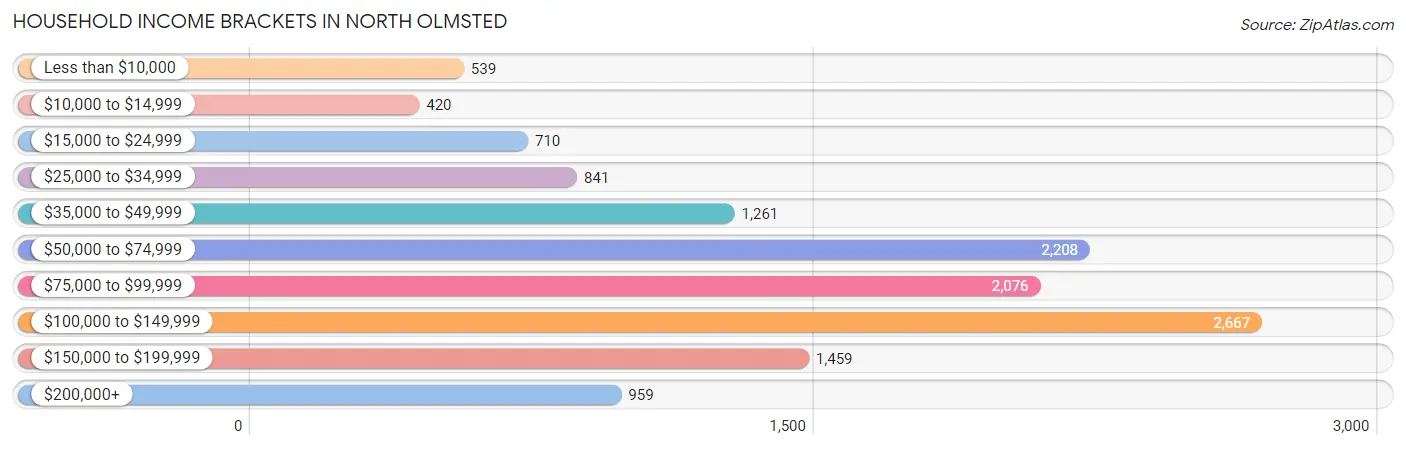
| Income Bracket | # Households | % Households |
| Less than $10,000 | 539 | 4.1% |
| $10,000 to $14,999 | 420 | 3.2% |
| $15,000 to $24,999 | 710 | 5.4% |
| $25,000 to $34,999 | 841 | 6.4% |
| $35,000 to $49,999 | 1,261 | 9.6% |
| $50,000 to $74,999 | 2,208 | 16.8% |
| $75,000 to $99,999 | 2,076 | 15.8% |
| $100,000 to $149,999 | 2,667 | 20.3% |
| $150,000 to $199,999 | 1,459 | 11.1% |
| $200,000+ | 959 | 7.3% |
Household Income by Householder Age in North Olmsted
The median household income in North Olmsted is $81,768, with the highest median household income of $93,377 found in the 45 to 64 years age bracket for the primary householder. A total of 5,221 households (39.7%) fall into this category. Meanwhile, the 15 to 24 years age bracket for the primary householder has the lowest median household income of $40,188, with 245 households (1.9%) in this group.
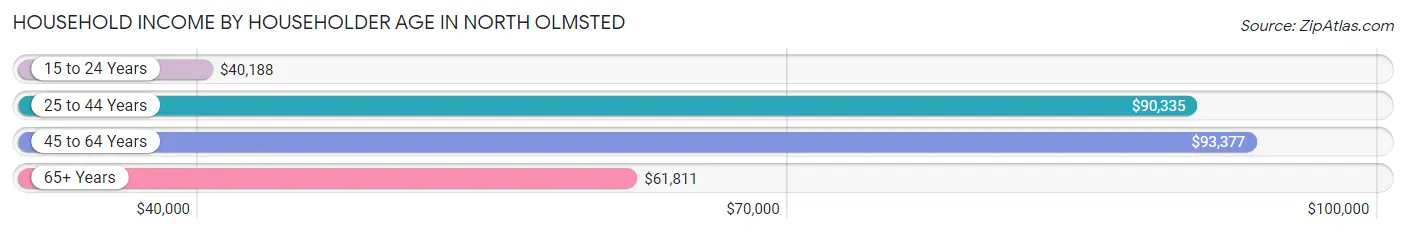
| Income Bracket | # Households | Median Income |
| 15 to 24 Years | 245 (1.9%) | $40,188 |
| 25 to 44 Years | 3,505 (26.7%) | $90,335 |
| 45 to 64 Years | 5,221 (39.7%) | $93,377 |
| 65+ Years | 4,169 (31.7%) | $61,811 |
| Total | 13,140 (100.0%) | $81,768 |
Poverty in North Olmsted
Income Below Poverty by Sex and Age in North Olmsted
With 11.4% poverty level for males and 10.6% for females among the residents of North Olmsted, 12 to 14 year old males and 12 to 14 year old females are the most vulnerable to poverty, with 159 males (30.2%) and 261 females (33.2%) in their respective age groups living below the poverty level.
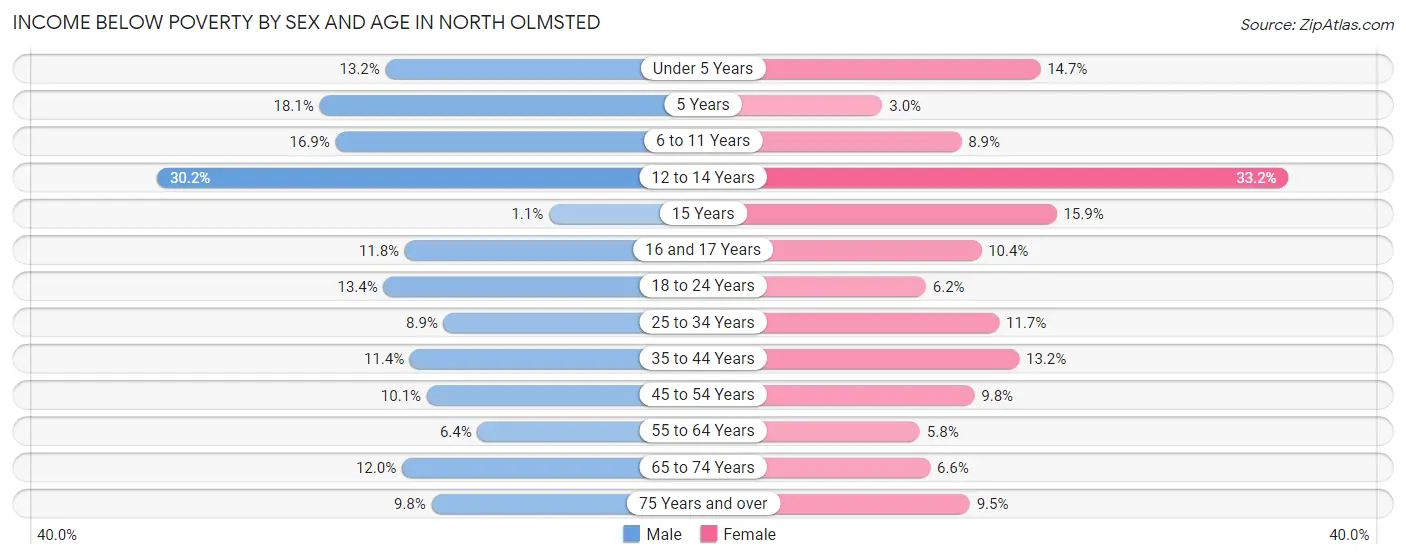
| Age Bracket | Male | Female |
| Under 5 Years | 94 (13.2%) | 104 (14.7%) |
| 5 Years | 19 (18.1%) | 4 (3.0%) |
| 6 to 11 Years | 230 (16.9%) | 104 (8.9%) |
| 12 to 14 Years | 159 (30.2%) | 261 (33.2%) |
| 15 Years | 2 (1.1%) | 73 (15.9%) |
| 16 and 17 Years | 62 (11.8%) | 41 (10.3%) |
| 18 to 24 Years | 167 (13.4%) | 60 (6.2%) |
| 25 to 34 Years | 165 (8.9%) | 196 (11.7%) |
| 35 to 44 Years | 222 (11.4%) | 223 (13.2%) |
| 45 to 54 Years | 235 (10.1%) | 211 (9.8%) |
| 55 to 64 Years | 143 (6.4%) | 143 (5.8%) |
| 65 to 74 Years | 224 (12.0%) | 120 (6.6%) |
| 75 Years and over | 109 (9.8%) | 145 (9.5%) |
| Total | 1,831 (11.4%) | 1,685 (10.6%) |
Income Above Poverty by Sex and Age in North Olmsted
According to the poverty statistics in North Olmsted, males aged 15 years and females aged 5 years are the age groups that are most secure financially, with 98.9% of males and 97.0% of females in these age groups living above the poverty line.
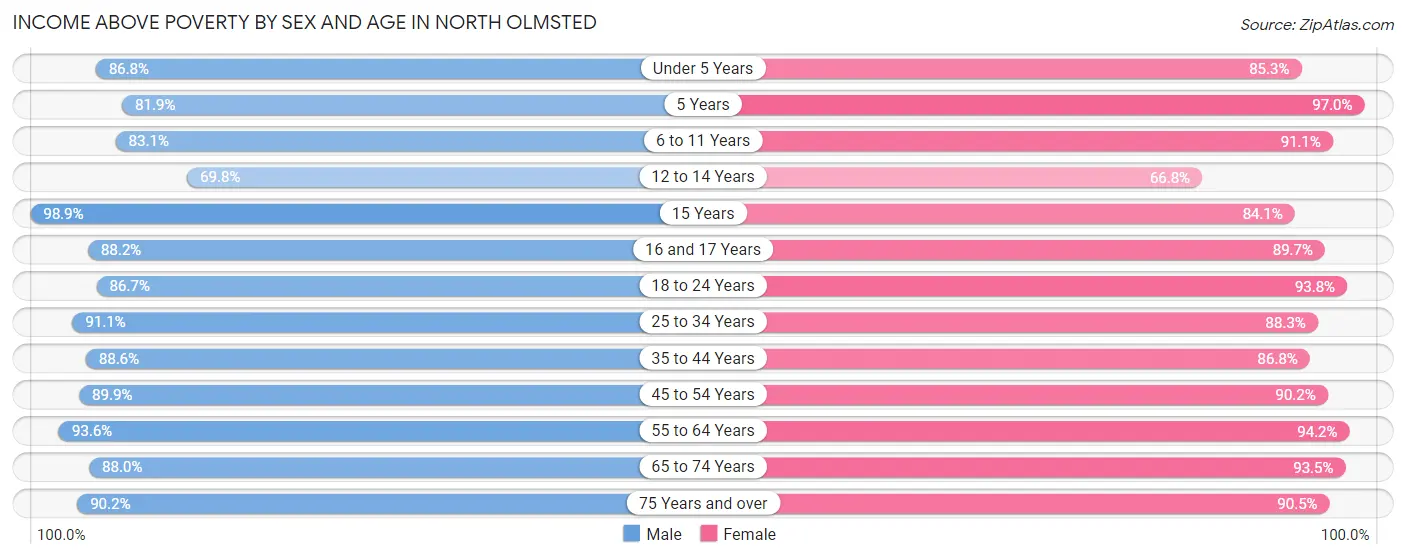
| Age Bracket | Male | Female |
| Under 5 Years | 618 (86.8%) | 602 (85.3%) |
| 5 Years | 86 (81.9%) | 129 (97.0%) |
| 6 to 11 Years | 1,130 (83.1%) | 1,068 (91.1%) |
| 12 to 14 Years | 368 (69.8%) | 526 (66.8%) |
| 15 Years | 187 (98.9%) | 385 (84.1%) |
| 16 and 17 Years | 465 (88.2%) | 355 (89.6%) |
| 18 to 24 Years | 1,084 (86.7%) | 902 (93.8%) |
| 25 to 34 Years | 1,693 (91.1%) | 1,482 (88.3%) |
| 35 to 44 Years | 1,729 (88.6%) | 1,471 (86.8%) |
| 45 to 54 Years | 2,084 (89.9%) | 1,934 (90.2%) |
| 55 to 64 Years | 2,103 (93.6%) | 2,324 (94.2%) |
| 65 to 74 Years | 1,646 (88.0%) | 1,711 (93.4%) |
| 75 Years and over | 1,006 (90.2%) | 1,381 (90.5%) |
| Total | 14,199 (88.6%) | 14,270 (89.4%) |
Income Below Poverty Among Married-Couple Families in North Olmsted
The poverty statistics for married-couple families in North Olmsted show that 6.0% or 410 of the total 6,840 families live below the poverty line. Families with 3 or 4 children have the highest poverty rate of 23.7%, comprising of 143 families. On the other hand, families with no children have the lowest poverty rate of 2.3%, which includes 98 families.
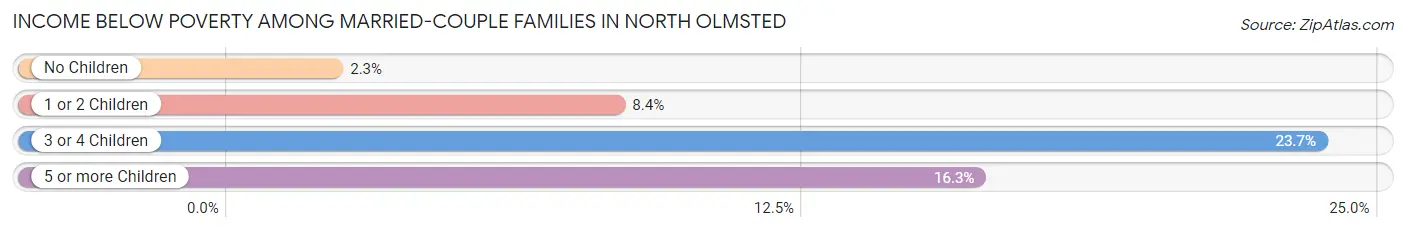
| Children | Above Poverty | Below Poverty |
| No Children | 4,175 (97.7%) | 98 (2.3%) |
| 1 or 2 Children | 1,759 (91.6%) | 162 (8.4%) |
| 3 or 4 Children | 460 (76.3%) | 143 (23.7%) |
| 5 or more Children | 36 (83.7%) | 7 (16.3%) |
| Total | 6,430 (94.0%) | 410 (6.0%) |
Income Below Poverty Among Single-Parent Households in North Olmsted
According to the poverty data in North Olmsted, 7.8% or 34 single-father households and 14.0% or 182 single-mother households are living below the poverty line. Among single-father households, those with 1 or 2 children have the highest poverty rate, with 34 households (13.3%) experiencing poverty. Likewise, among single-mother households, those with 5 or more children have the highest poverty rate, with 1 households (100.0%) falling below the poverty line.
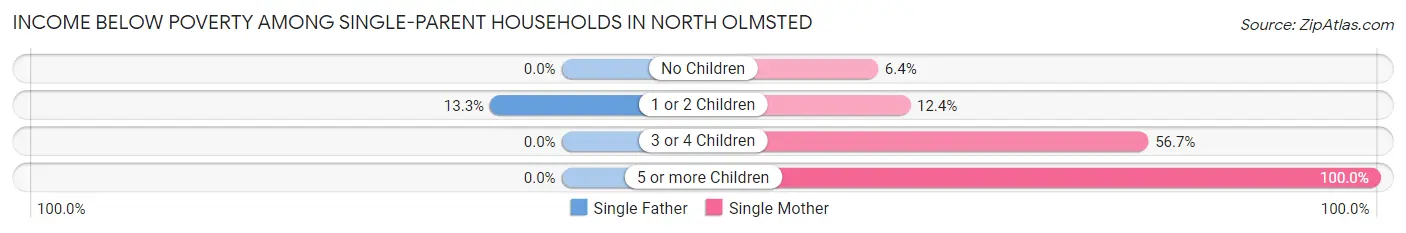
| Children | Single Father | Single Mother |
| No Children | 0 (0.0%) | 41 (6.4%) |
| 1 or 2 Children | 34 (13.3%) | 64 (12.4%) |
| 3 or 4 Children | 0 (0.0%) | 76 (56.7%) |
| 5 or more Children | 0 (0.0%) | 1 (100.0%) |
| Total | 34 (7.8%) | 182 (14.0%) |
Income Below Poverty Among Married-Couple vs Single-Parent Households in North Olmsted
The poverty data for North Olmsted shows that 410 of the married-couple family households (6.0%) and 216 of the single-parent households (12.5%) are living below the poverty level. Within the married-couple family households, those with 3 or 4 children have the highest poverty rate, with 143 households (23.7%) falling below the poverty line. Among the single-parent households, those with 5 or more children have the highest poverty rate, with 1 household (100.0%) living below poverty.
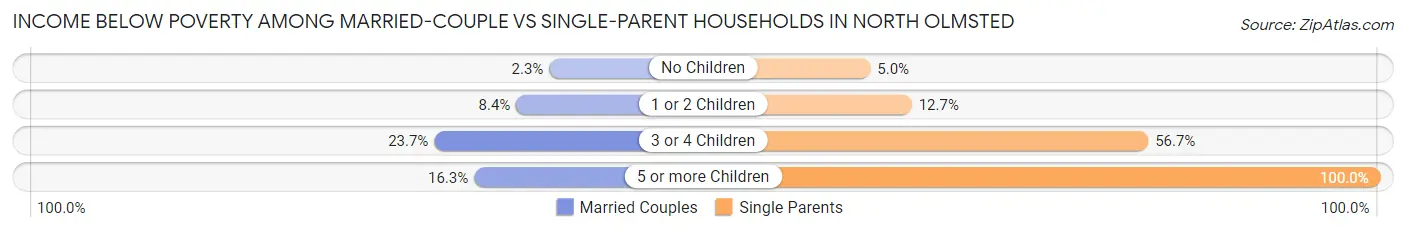
| Children | Married-Couple Families | Single-Parent Households |
| No Children | 98 (2.3%) | 41 (5.0%) |
| 1 or 2 Children | 162 (8.4%) | 98 (12.7%) |
| 3 or 4 Children | 143 (23.7%) | 76 (56.7%) |
| 5 or more Children | 7 (16.3%) | 1 (100.0%) |
| Total | 410 (6.0%) | 216 (12.5%) |
Race in North Olmsted
The most populous races in North Olmsted are White / Caucasian (28,297 | 87.8%), Hispanic or Latino (2,234 | 6.9%), and Two or more Races (1,771 | 5.5%).
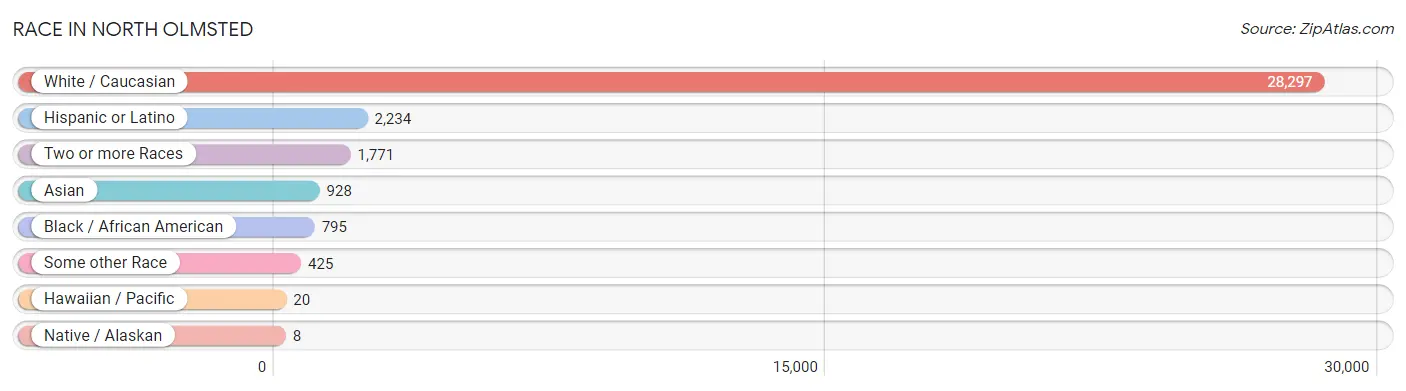
| Race | # Population | % Population |
| Asian | 928 | 2.9% |
| Black / African American | 795 | 2.5% |
| Hawaiian / Pacific | 20 | 0.1% |
| Hispanic or Latino | 2,234 | 6.9% |
| Native / Alaskan | 8 | 0.0% |
| White / Caucasian | 28,297 | 87.8% |
| Two or more Races | 1,771 | 5.5% |
| Some other Race | 425 | 1.3% |
| Total | 32,244 | 100.0% |
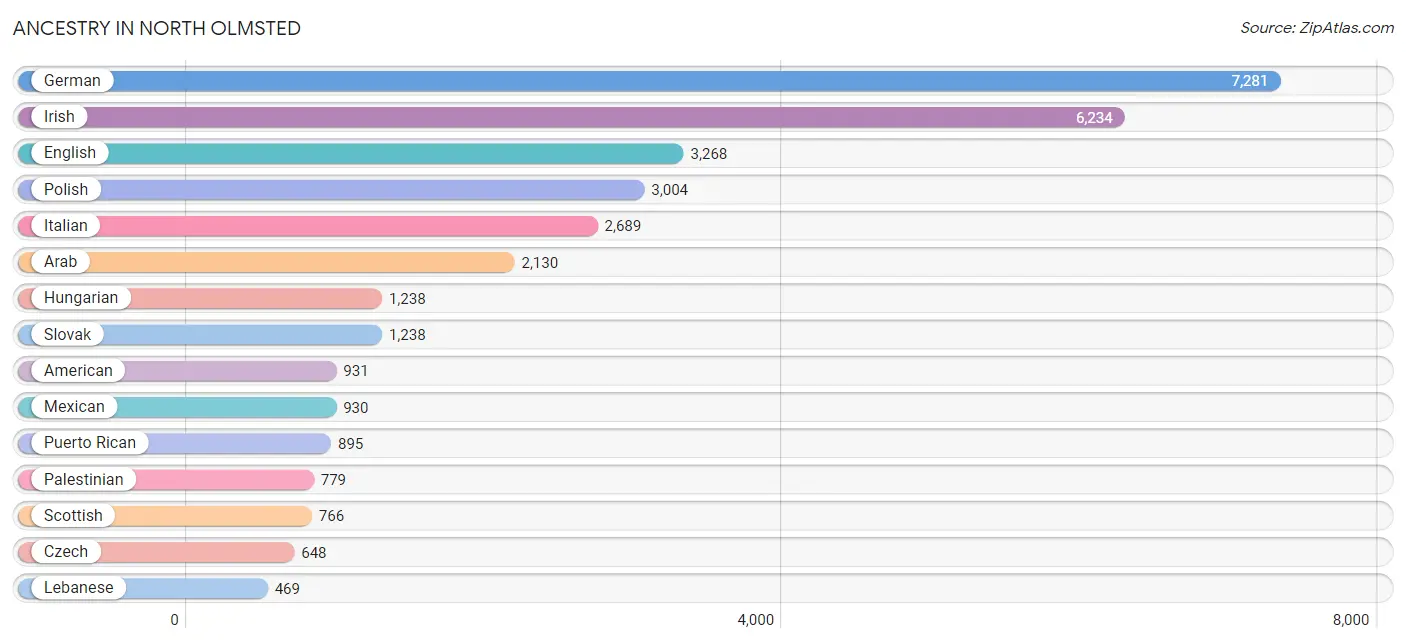
Ancestry in North Olmsted
The most populous ancestries reported in North Olmsted are German (7,281 | 22.6%), Irish (6,234 | 19.3%), English (3,268 | 10.1%), Polish (3,004 | 9.3%), and Italian (2,689 | 8.3%), together accounting for 69.7% of all North Olmsted residents.
| Ancestry | # Population | % Population |
| African | 67 | 0.2% |
| Albanian | 224 | 0.7% |
| American | 931 | 2.9% |
| Arab | 2,130 | 6.6% |
| Armenian | 6 | 0.0% |
| Austrian | 360 | 1.1% |
| Bhutanese | 26 | 0.1% |
| Blackfeet | 9 | 0.0% |
| Brazilian | 67 | 0.2% |
| British | 287 | 0.9% |
| Burmese | 119 | 0.4% |
| Canadian | 57 | 0.2% |
| Celtic | 7 | 0.0% |
| Central American | 128 | 0.4% |
| Cherokee | 24 | 0.1% |
| Chilean | 8 | 0.0% |
| Chippewa | 2 | 0.0% |
| Colombian | 106 | 0.3% |
| Comanche | 4 | 0.0% |
| Croatian | 270 | 0.8% |
| Crow | 4 | 0.0% |
| Cuban | 37 | 0.1% |
| Czech | 648 | 2.0% |
| Czechoslovakian | 77 | 0.2% |
| Danish | 28 | 0.1% |
| Delaware | 8 | 0.0% |
| Dominican | 46 | 0.1% |
| Dutch | 409 | 1.3% |
| Eastern European | 133 | 0.4% |
| Egyptian | 211 | 0.6% |
| English | 3,268 | 10.1% |
| European | 395 | 1.2% |
| Fijian | 8 | 0.0% |
| Finnish | 114 | 0.4% |
| French | 444 | 1.4% |
| French Canadian | 122 | 0.4% |
| German | 7,281 | 22.6% |
| Greek | 232 | 0.7% |
| Guamanian / Chamorro | 6 | 0.0% |
| Guatemalan | 37 | 0.1% |
| Hungarian | 1,238 | 3.8% |
| Indian (Asian) | 273 | 0.9% |
| Iranian | 10 | 0.0% |
| Iraqi | 92 | 0.3% |
| Irish | 6,234 | 19.3% |
| Iroquois | 5 | 0.0% |
| Israeli | 67 | 0.2% |
| Italian | 2,689 | 8.3% |
| Jordanian | 95 | 0.3% |
| Korean | 139 | 0.4% |
| Latvian | 15 | 0.1% |
| Lebanese | 469 | 1.5% |
| Lithuanian | 82 | 0.3% |
| Luxembourger | 6 | 0.0% |
| Macedonian | 58 | 0.2% |
| Malaysian | 37 | 0.1% |
| Mexican | 930 | 2.9% |
| Moroccan | 38 | 0.1% |
| Native Hawaiian | 26 | 0.1% |
| Northern European | 22 | 0.1% |
| Norwegian | 147 | 0.5% |
| Pakistani | 22 | 0.1% |
| Palestinian | 779 | 2.4% |
| Pennsylvania German | 4 | 0.0% |
| Peruvian | 17 | 0.1% |
| Polish | 3,004 | 9.3% |
| Portuguese | 51 | 0.2% |
| Puerto Rican | 895 | 2.8% |
| Romanian | 369 | 1.1% |
| Russian | 219 | 0.7% |
| Salvadoran | 91 | 0.3% |
| Scandinavian | 68 | 0.2% |
| Scotch-Irish | 294 | 0.9% |
| Scottish | 766 | 2.4% |
| Serbian | 25 | 0.1% |
| Slavic | 52 | 0.2% |
| Slovak | 1,238 | 3.8% |
| Slovene | 451 | 1.4% |
| Somali | 164 | 0.5% |
| South American | 157 | 0.5% |
| Spanish | 26 | 0.1% |
| Sri Lankan | 52 | 0.2% |
| Subsaharan African | 233 | 0.7% |
| Swedish | 242 | 0.7% |
| Swiss | 72 | 0.2% |
| Syrian | 4 | 0.0% |
| Thai | 442 | 1.4% |
| Turkish | 6 | 0.0% |
| Ukrainian | 262 | 0.8% |
| Venezuelan | 26 | 0.1% |
| Welsh | 306 | 0.9% |
| Yugoslavian | 77 | 0.2% | View All 92 Rows |
Immigrants in North Olmsted
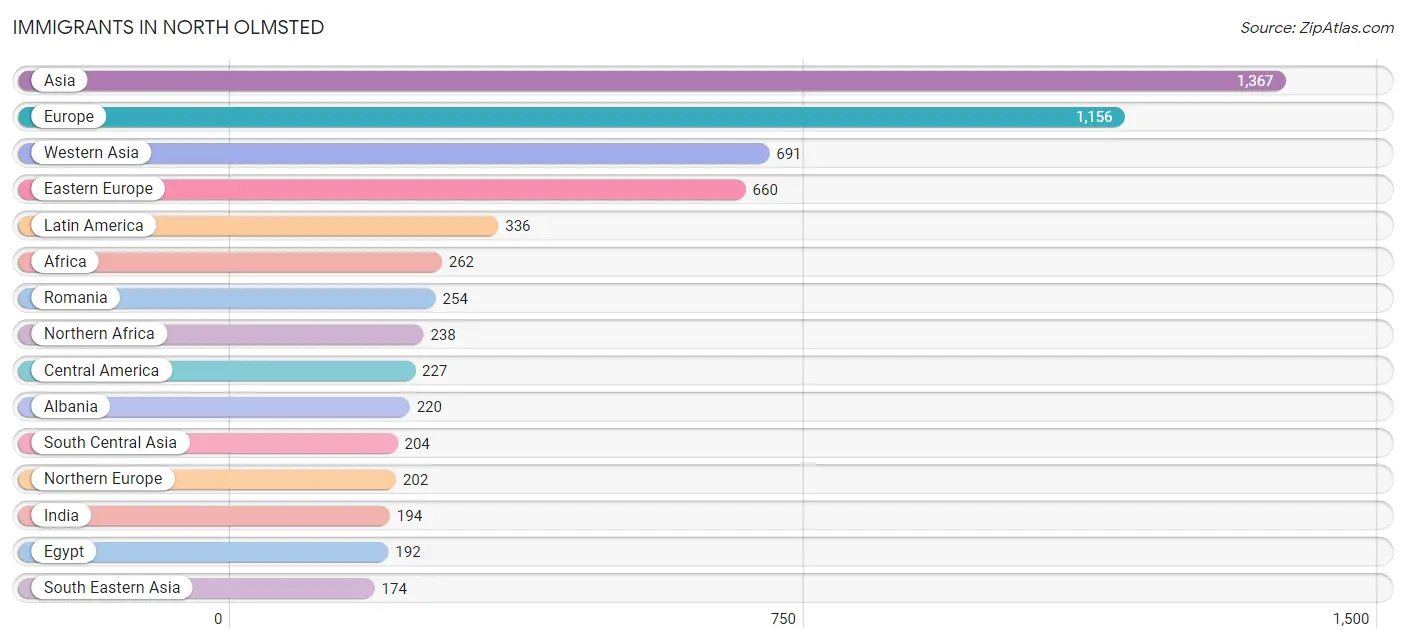
The most numerous immigrant groups reported in North Olmsted came from Asia (1,367 | 4.2%), Europe (1,156 | 3.6%), Western Asia (691 | 2.1%), Eastern Europe (660 | 2.1%), and Latin America (336 | 1.0%), together accounting for 13.1% of all North Olmsted residents.
| Immigration Origin | # Population | % Population |
| Africa | 262 | 0.8% |
| Albania | 220 | 0.7% |
| Asia | 1,367 | 4.2% |
| Austria | 38 | 0.1% |
| Belgium | 5 | 0.0% |
| Bosnia and Herzegovina | 24 | 0.1% |
| Brazil | 29 | 0.1% |
| Canada | 69 | 0.2% |
| Caribbean | 46 | 0.1% |
| Central America | 227 | 0.7% |
| China | 87 | 0.3% |
| Colombia | 2 | 0.0% |
| Croatia | 42 | 0.1% |
| Czechoslovakia | 7 | 0.0% |
| Denmark | 8 | 0.0% |
| Dominican Republic | 23 | 0.1% |
| Eastern Africa | 24 | 0.1% |
| Eastern Asia | 157 | 0.5% |
| Eastern Europe | 660 | 2.1% |
| Egypt | 192 | 0.6% |
| El Salvador | 44 | 0.1% |
| England | 30 | 0.1% |
| Europe | 1,156 | 3.6% |
| Germany | 77 | 0.2% |
| Greece | 32 | 0.1% |
| Guatemala | 31 | 0.1% |
| Haiti | 23 | 0.1% |
| Hungary | 41 | 0.1% |
| India | 194 | 0.6% |
| Iran | 10 | 0.0% |
| Iraq | 67 | 0.2% |
| Ireland | 5 | 0.0% |
| Israel | 45 | 0.1% |
| Italy | 45 | 0.1% |
| Jordan | 96 | 0.3% |
| Korea | 70 | 0.2% |
| Kuwait | 12 | 0.0% |
| Latin America | 336 | 1.0% |
| Latvia | 1 | 0.0% |
| Lebanon | 96 | 0.3% |
| Malaysia | 9 | 0.0% |
| Mexico | 152 | 0.5% |
| Morocco | 46 | 0.1% |
| Netherlands | 17 | 0.1% |
| North Macedonia | 10 | 0.0% |
| Northern Africa | 238 | 0.7% |
| Northern Europe | 202 | 0.6% |
| Peru | 11 | 0.0% |
| Philippines | 72 | 0.2% |
| Poland | 9 | 0.0% |
| Romania | 254 | 0.8% |
| Russia | 3 | 0.0% |
| Scotland | 101 | 0.3% |
| Singapore | 6 | 0.0% |
| Somalia | 24 | 0.1% |
| South America | 63 | 0.2% |
| South Central Asia | 204 | 0.6% |
| South Eastern Asia | 174 | 0.5% |
| Southern Europe | 144 | 0.4% |
| Spain | 67 | 0.2% |
| Syria | 30 | 0.1% |
| Thailand | 22 | 0.1% |
| Turkey | 6 | 0.0% |
| Venezuela | 21 | 0.1% |
| Vietnam | 34 | 0.1% |
| Western Asia | 691 | 2.1% |
| Western Europe | 137 | 0.4% |
| Yemen | 41 | 0.1% | View All 68 Rows |
Sex and Age in North Olmsted
Sex and Age in North Olmsted
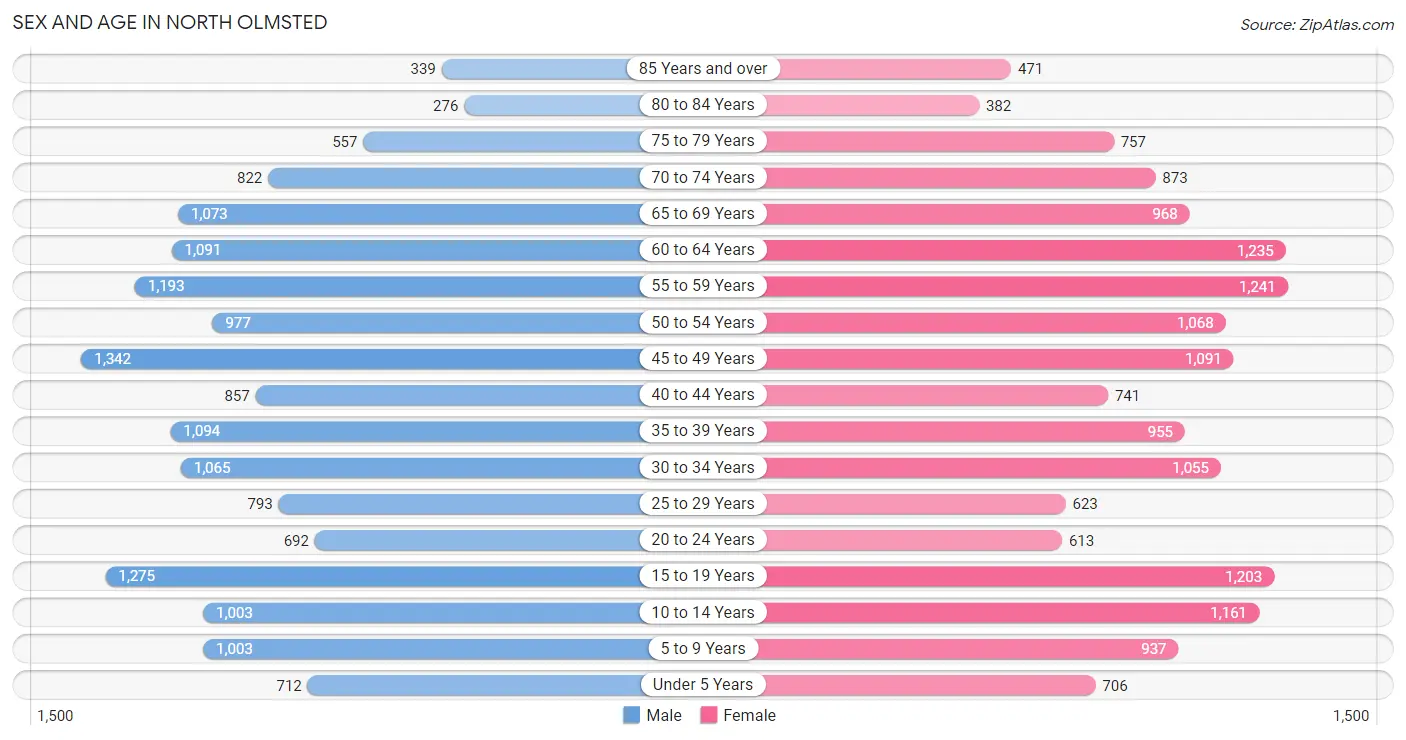
The most populous age groups in North Olmsted are 45 to 49 Years (1,342 | 8.3%) for men and 55 to 59 Years (1,241 | 7.7%) for women.
| Age Bracket | Male | Female |
| Under 5 Years | 712 (4.4%) | 706 (4.4%) |
| 5 to 9 Years | 1,003 (6.2%) | 937 (5.8%) |
| 10 to 14 Years | 1,003 (6.2%) | 1,161 (7.2%) |
| 15 to 19 Years | 1,275 (7.9%) | 1,203 (7.5%) |
| 20 to 24 Years | 692 (4.3%) | 613 (3.8%) |
| 25 to 29 Years | 793 (4.9%) | 623 (3.9%) |
| 30 to 34 Years | 1,065 (6.6%) | 1,055 (6.6%) |
| 35 to 39 Years | 1,094 (6.8%) | 955 (5.9%) |
| 40 to 44 Years | 857 (5.3%) | 741 (4.6%) |
| 45 to 49 Years | 1,342 (8.3%) | 1,091 (6.8%) |
| 50 to 54 Years | 977 (6.0%) | 1,068 (6.6%) |
| 55 to 59 Years | 1,193 (7.4%) | 1,241 (7.7%) |
| 60 to 64 Years | 1,091 (6.8%) | 1,235 (7.7%) |
| 65 to 69 Years | 1,073 (6.6%) | 968 (6.0%) |
| 70 to 74 Years | 822 (5.1%) | 873 (5.4%) |
| 75 to 79 Years | 557 (3.5%) | 757 (4.7%) |
| 80 to 84 Years | 276 (1.7%) | 382 (2.4%) |
| 85 Years and over | 339 (2.1%) | 471 (2.9%) |
| Total | 16,164 (100.0%) | 16,080 (100.0%) |
Families and Households in North Olmsted
Median Family Size in North Olmsted
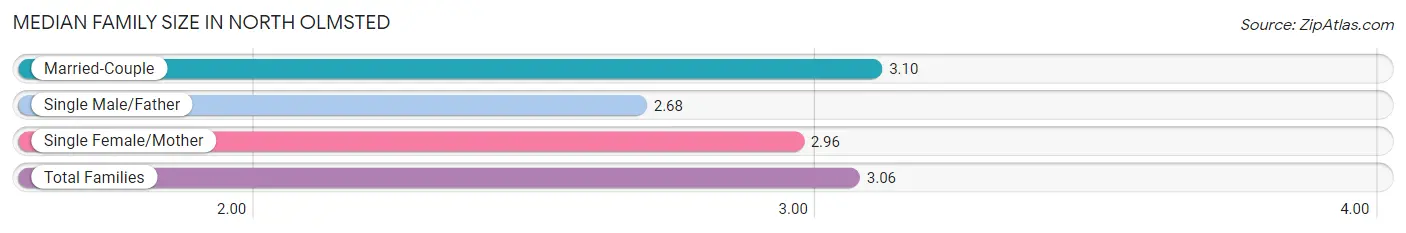
The median family size in North Olmsted is 3.06 persons per family, with married-couple families (6,840 | 79.8%) accounting for the largest median family size of 3.1 persons per family. On the other hand, single male/father families (437 | 5.1%) represent the smallest median family size with 2.68 persons per family.
| Family Type | # Families | Family Size |
| Married-Couple | 6,840 (79.8%) | 3.10 |
| Single Male/Father | 437 (5.1%) | 2.68 |
| Single Female/Mother | 1,296 (15.1%) | 2.96 |
| Total Families | 8,573 (100.0%) | 3.06 |
Median Household Size in North Olmsted
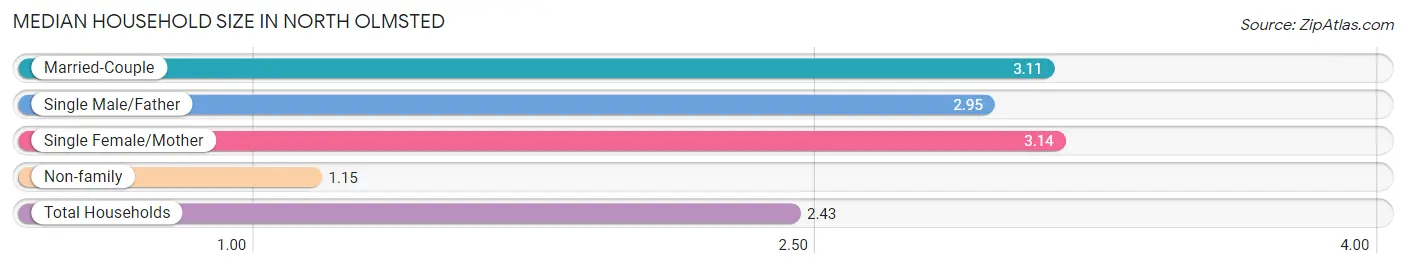
The median household size in North Olmsted is 2.43 persons per household, with single female/mother households (1,296 | 9.9%) accounting for the largest median household size of 3.14 persons per household. non-family households (4,567 | 34.8%) represent the smallest median household size with 1.15 persons per household.
| Household Type | # Households | Household Size |
| Married-Couple | 6,840 (52.0%) | 3.11 |
| Single Male/Father | 437 (3.3%) | 2.95 |
| Single Female/Mother | 1,296 (9.9%) | 3.14 |
| Non-family | 4,567 (34.8%) | 1.15 |
| Total Households | 13,140 (100.0%) | 2.43 |
Household Size by Marriage Status in North Olmsted
Out of a total of 13,140 households in North Olmsted, 8,573 (65.2%) are family households, while 4,567 (34.8%) are nonfamily households. The most numerous type of family households are 2-person households, comprising 4,341, and the most common type of nonfamily households are 1-person households, comprising 4,013.
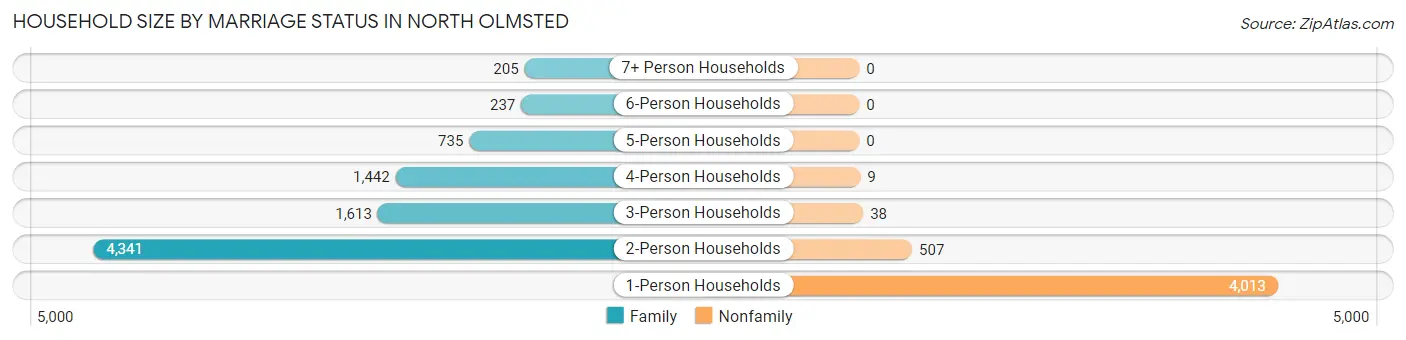
| Household Size | Family Households | Nonfamily Households |
| 1-Person Households | - | 4,013 (30.5%) |
| 2-Person Households | 4,341 (33.0%) | 507 (3.9%) |
| 3-Person Households | 1,613 (12.3%) | 38 (0.3%) |
| 4-Person Households | 1,442 (11.0%) | 9 (0.1%) |
| 5-Person Households | 735 (5.6%) | 0 (0.0%) |
| 6-Person Households | 237 (1.8%) | 0 (0.0%) |
| 7+ Person Households | 205 (1.6%) | 0 (0.0%) |
| Total | 8,573 (65.2%) | 4,567 (34.8%) |
Female Fertility in North Olmsted
Fertility by Age in North Olmsted
Average fertility rate in North Olmsted is 58.0 births per 1,000 women. Women in the age bracket of 20 to 34 years have the highest fertility rate with 112.0 births per 1,000 women. Women in the age bracket of 20 to 34 years acount for 67.9% of all women with births.
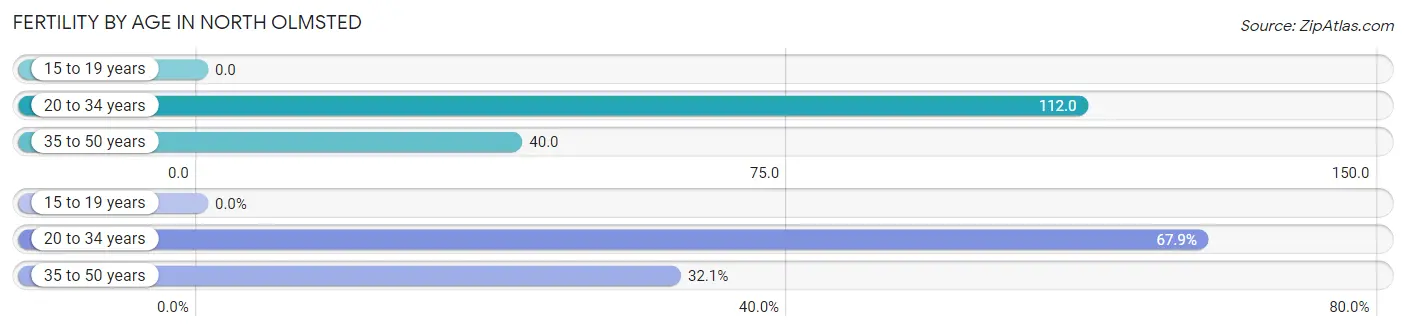
| Age Bracket | Women with Births | Births / 1,000 Women |
| 15 to 19 years | 0 (0.0%) | 0.0 |
| 20 to 34 years | 256 (67.9%) | 112.0 |
| 35 to 50 years | 121 (32.1%) | 40.0 |
| Total | 377 (100.0%) | 58.0 |
Fertility by Age by Marriage Status in North Olmsted
86.7% of women with births (377) in North Olmsted are married. The highest percentage of unmarried women with births falls into 20 to 34 years age bracket with 19.5% of them unmarried at the time of birth, while the lowest percentage of unmarried women with births belong to 35 to 50 years age bracket with 0.0% of them unmarried.
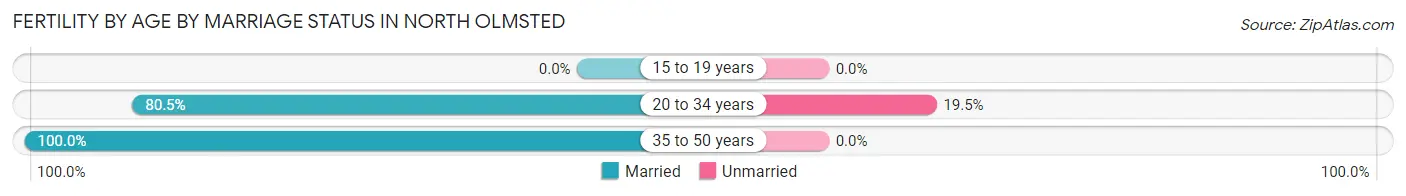
| Age Bracket | Married | Unmarried |
| 15 to 19 years | 0 (0.0%) | 0 (0.0%) |
| 20 to 34 years | 206 (80.5%) | 50 (19.5%) |
| 35 to 50 years | 121 (100.0%) | 0 (0.0%) |
| Total | 327 (86.7%) | 50 (13.3%) |
Fertility by Education in North Olmsted
Average fertility rate in North Olmsted is 58.0 births per 1,000 women. Women with the education attainment of high school diploma have the highest fertility rate of 86.0 births per 1,000 women, while women with the education attainment of less than high school have the lowest fertility at 31.0 births per 1,000 women. Women with the education attainment of college or associate's degree represent 28.6% of all women with births.
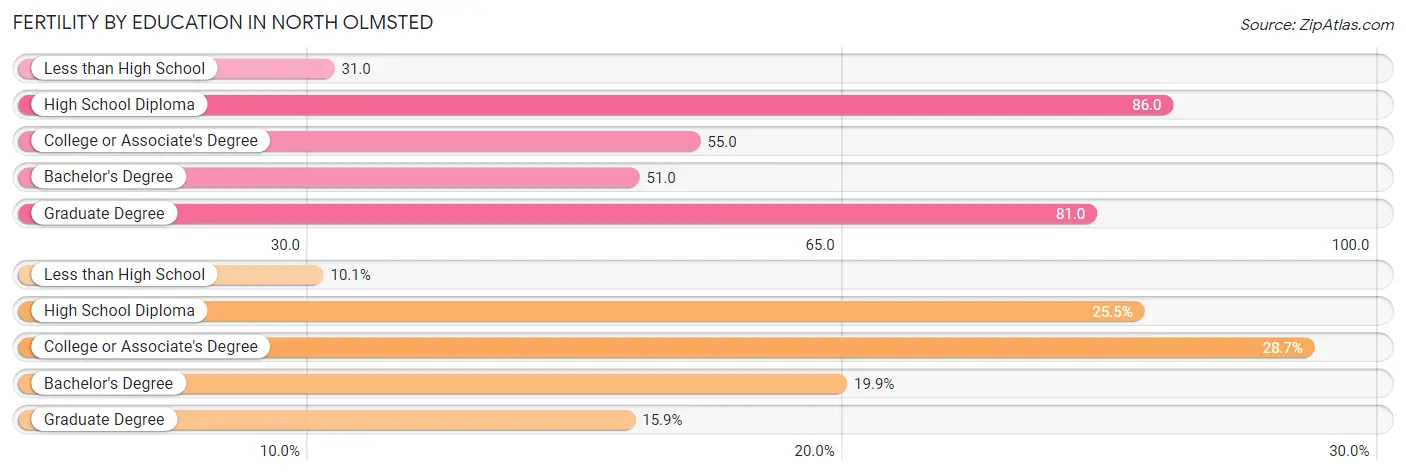
| Educational Attainment | Women with Births | Births / 1,000 Women |
| Less than High School | 38 (10.1%) | 31.0 |
| High School Diploma | 96 (25.5%) | 86.0 |
| College or Associate's Degree | 108 (28.6%) | 55.0 |
| Bachelor's Degree | 75 (19.9%) | 51.0 |
| Graduate Degree | 60 (15.9%) | 81.0 |
| Total | 377 (100.0%) | 58.0 |
Fertility by Education by Marriage Status in North Olmsted
13.3% of women with births in North Olmsted are unmarried. Women with the educational attainment of high school diploma are most likely to be married with 100.0% of them married at childbirth, while women with the educational attainment of less than high school are least likely to be married with 86.8% of them unmarried at childbirth.
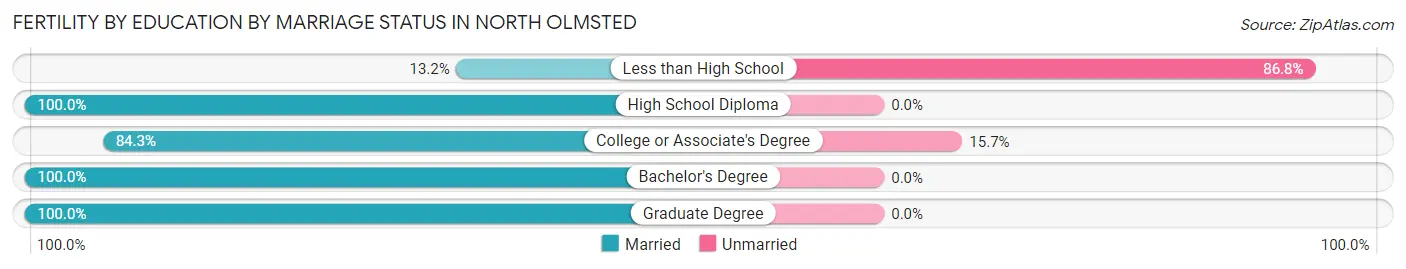
| Educational Attainment | Married | Unmarried |
| Less than High School | 5 (13.2%) | 33 (86.8%) |
| High School Diploma | 96 (100.0%) | 0 (0.0%) |
| College or Associate's Degree | 91 (84.3%) | 17 (15.7%) |
| Bachelor's Degree | 75 (100.0%) | 0 (0.0%) |
| Graduate Degree | 60 (100.0%) | 0 (0.0%) |
| Total | 327 (86.7%) | 50 (13.3%) |
Employment Characteristics in North Olmsted
Employment by Class of Employer in North Olmsted
Among the 16,240 employed individuals in North Olmsted, private company employees (11,270 | 69.4%), not-for-profit organizations (1,504 | 9.3%), and local government employees (1,380 | 8.5%) make up the most common classes of employment.
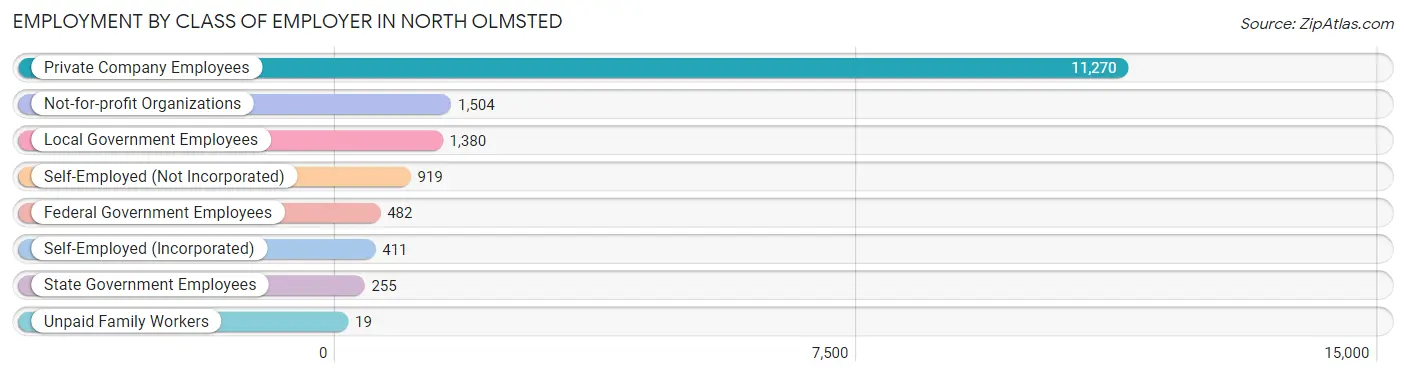
| Employer Class | # Employees | % Employees |
| Private Company Employees | 11,270 | 69.4% |
| Self-Employed (Incorporated) | 411 | 2.5% |
| Self-Employed (Not Incorporated) | 919 | 5.7% |
| Not-for-profit Organizations | 1,504 | 9.3% |
| Local Government Employees | 1,380 | 8.5% |
| State Government Employees | 255 | 1.6% |
| Federal Government Employees | 482 | 3.0% |
| Unpaid Family Workers | 19 | 0.1% |
| Total | 16,240 | 100.0% |
Employment Status by Age in North Olmsted
According to the labor force statistics for North Olmsted, out of the total population over 16 years of age (26,075), 65.4% or 17,053 individuals are in the labor force, with 3.1% or 529 of them unemployed. The age group with the highest labor force participation rate is 30 to 34 years, with 90.9% or 1,927 individuals in the labor force. Within the labor force, the 16 to 19 years age range has the highest percentage of unemployed individuals, with 10.6% or 108 of them being unemployed.
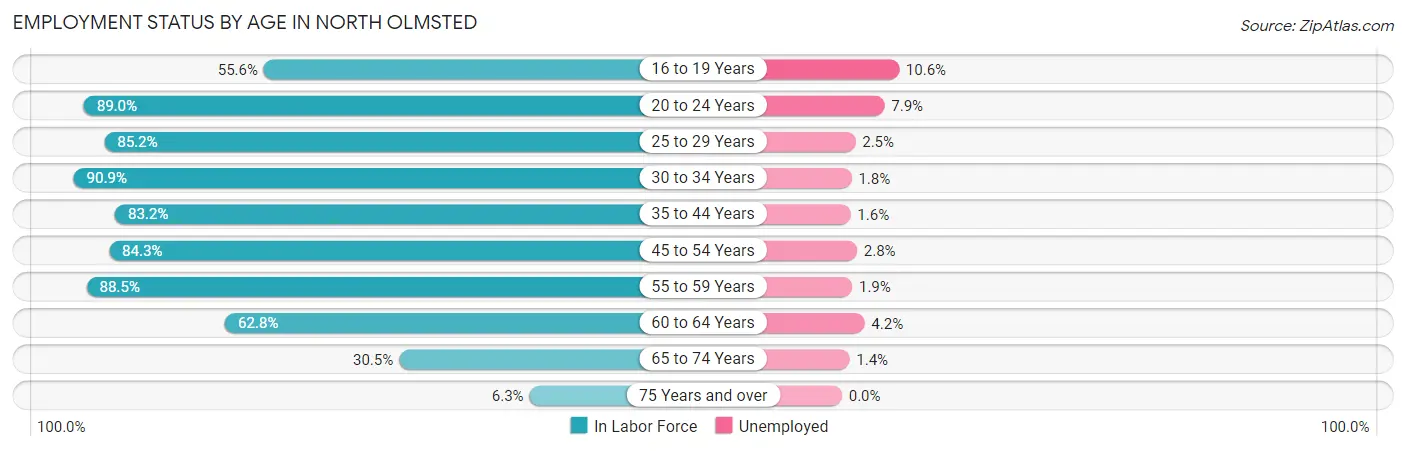
| Age Bracket | In Labor Force | Unemployed |
| 16 to 19 Years | 1,018 (55.6%) | 108 (10.6%) |
| 20 to 24 Years | 1,161 (89.0%) | 92 (7.9%) |
| 25 to 29 Years | 1,206 (85.2%) | 30 (2.5%) |
| 30 to 34 Years | 1,927 (90.9%) | 35 (1.8%) |
| 35 to 44 Years | 3,034 (83.2%) | 49 (1.6%) |
| 45 to 54 Years | 3,775 (84.3%) | 106 (2.8%) |
| 55 to 59 Years | 2,154 (88.5%) | 41 (1.9%) |
| 60 to 64 Years | 1,461 (62.8%) | 61 (4.2%) |
| 65 to 74 Years | 1,139 (30.5%) | 16 (1.4%) |
| 75 Years and over | 175 (6.3%) | 0 (0.0%) |
| Total | 17,053 (65.4%) | 529 (3.1%) |
Employment Status by Educational Attainment in North Olmsted
According to labor force statistics for North Olmsted, 82.6% of individuals (13,564) out of the total population between 25 and 64 years of age (16,421) are in the labor force, with 2.3% or 312 of them being unemployed. The group with the highest labor force participation rate are those with the educational attainment of bachelor's degree or higher, with 90.3% or 5,240 individuals in the labor force. Within the labor force, individuals with less than high school education have the highest percentage of unemployment, with 6.7% or 42 of them being unemployed.
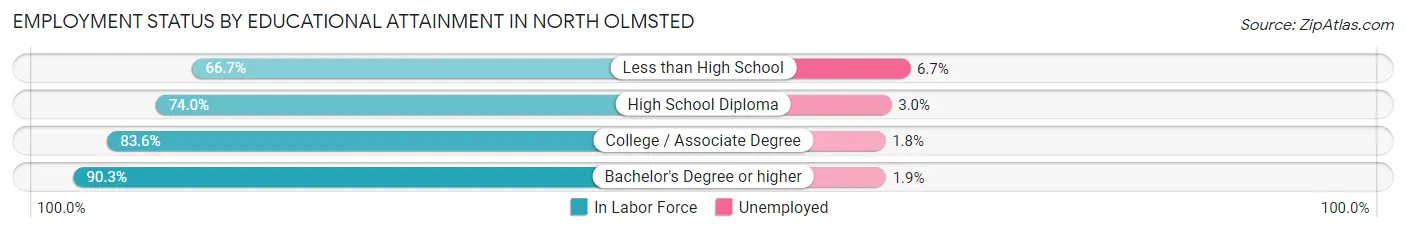
| Educational Attainment | In Labor Force | Unemployed |
| Less than High School | 626 (66.7%) | 63 (6.7%) |
| High School Diploma | 3,127 (74.0%) | 127 (3.0%) |
| College / Associate Degree | 4,559 (83.6%) | 98 (1.8%) |
| Bachelor's Degree or higher | 5,240 (90.3%) | 110 (1.9%) |
| Total | 13,564 (82.6%) | 378 (2.3%) |
Employment Occupations by Sex in North Olmsted
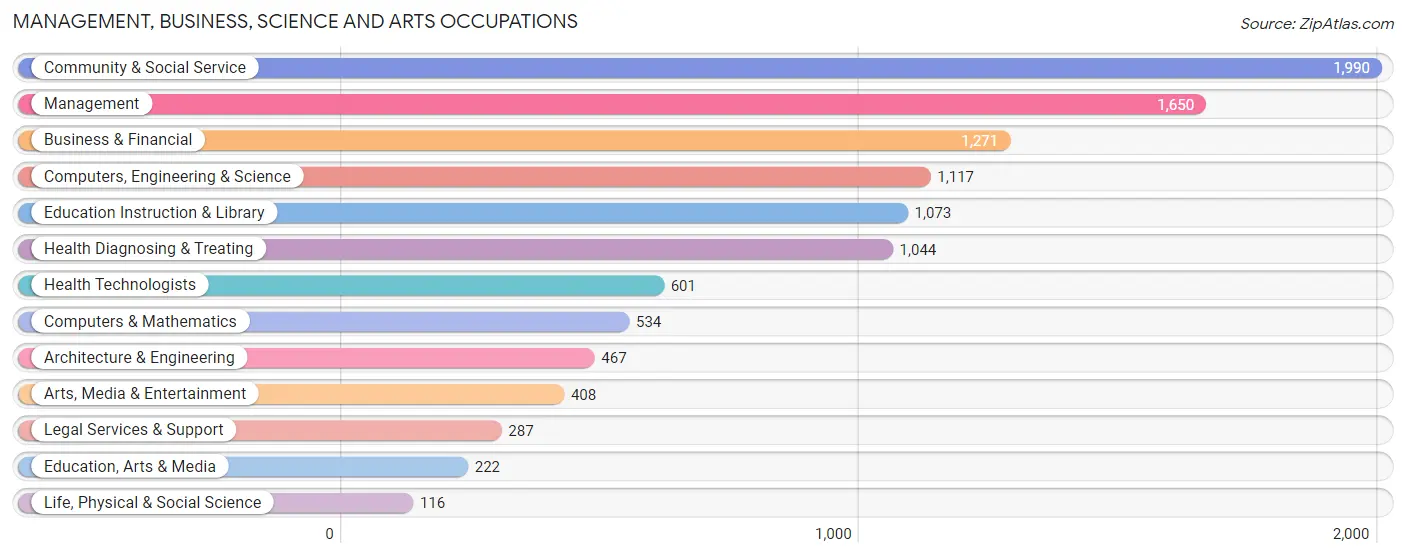
Management, Business, Science and Arts Occupations
The most common Management, Business, Science and Arts occupations in North Olmsted are Community & Social Service (1,990 | 12.0%), Management (1,650 | 10.0%), Business & Financial (1,271 | 7.7%), Computers, Engineering & Science (1,117 | 6.8%), and Education Instruction & Library (1,073 | 6.5%).
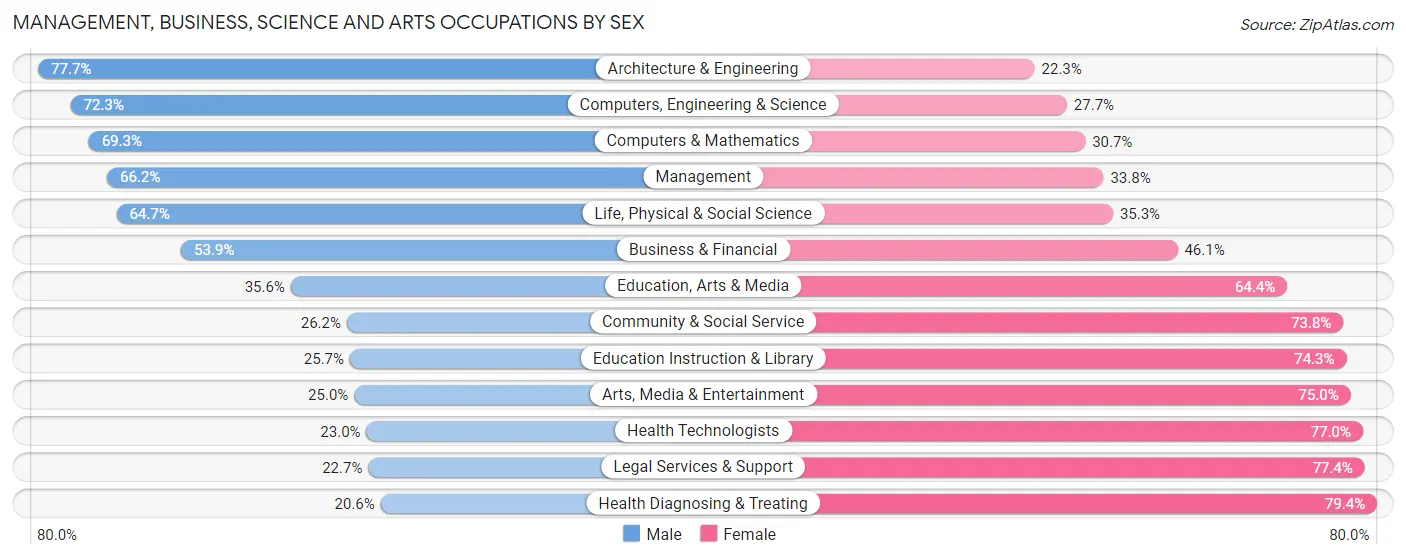
Management, Business, Science and Arts Occupations by Sex
Within the Management, Business, Science and Arts occupations in North Olmsted, the most male-oriented occupations are Architecture & Engineering (77.7%), Computers, Engineering & Science (72.3%), and Computers & Mathematics (69.3%), while the most female-oriented occupations are Health Diagnosing & Treating (79.4%), Legal Services & Support (77.3%), and Health Technologists (77.0%).
| Occupation | Male | Female |
| Management | 1,093 (66.2%) | 557 (33.8%) |
| Business & Financial | 685 (53.9%) | 586 (46.1%) |
| Computers, Engineering & Science | 808 (72.3%) | 309 (27.7%) |
| Computers & Mathematics | 370 (69.3%) | 164 (30.7%) |
| Architecture & Engineering | 363 (77.7%) | 104 (22.3%) |
| Life, Physical & Social Science | 75 (64.7%) | 41 (35.3%) |
| Community & Social Service | 522 (26.2%) | 1,468 (73.8%) |
| Education, Arts & Media | 79 (35.6%) | 143 (64.4%) |
| Legal Services & Support | 65 (22.7%) | 222 (77.3%) |
| Education Instruction & Library | 276 (25.7%) | 797 (74.3%) |
| Arts, Media & Entertainment | 102 (25.0%) | 306 (75.0%) |
| Health Diagnosing & Treating | 215 (20.6%) | 829 (79.4%) |
| Health Technologists | 138 (23.0%) | 463 (77.0%) |
| Total (Category) | 3,323 (47.0%) | 3,749 (53.0%) |
| Total (Overall) | 9,004 (54.5%) | 7,506 (45.5%) |
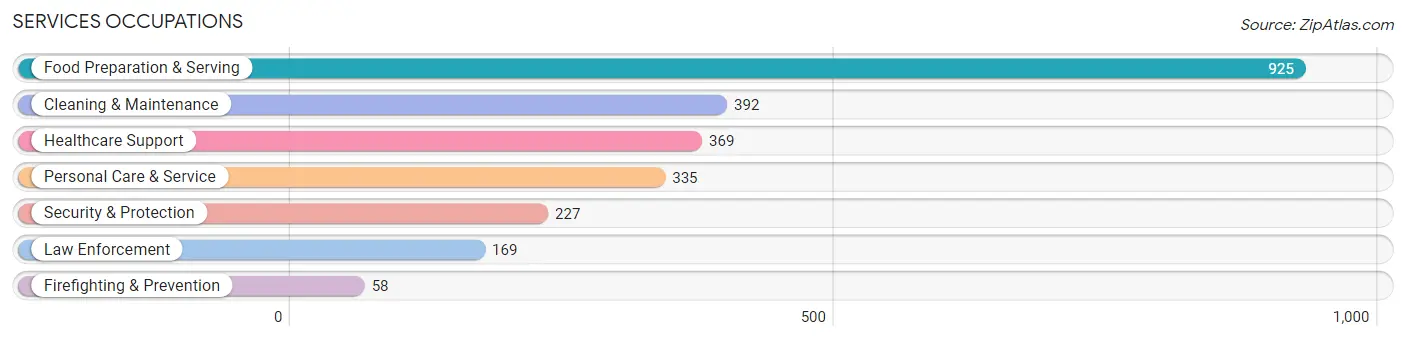
Services Occupations
The most common Services occupations in North Olmsted are Food Preparation & Serving (925 | 5.6%), Cleaning & Maintenance (392 | 2.4%), Healthcare Support (369 | 2.2%), Personal Care & Service (335 | 2.0%), and Security & Protection (227 | 1.4%).
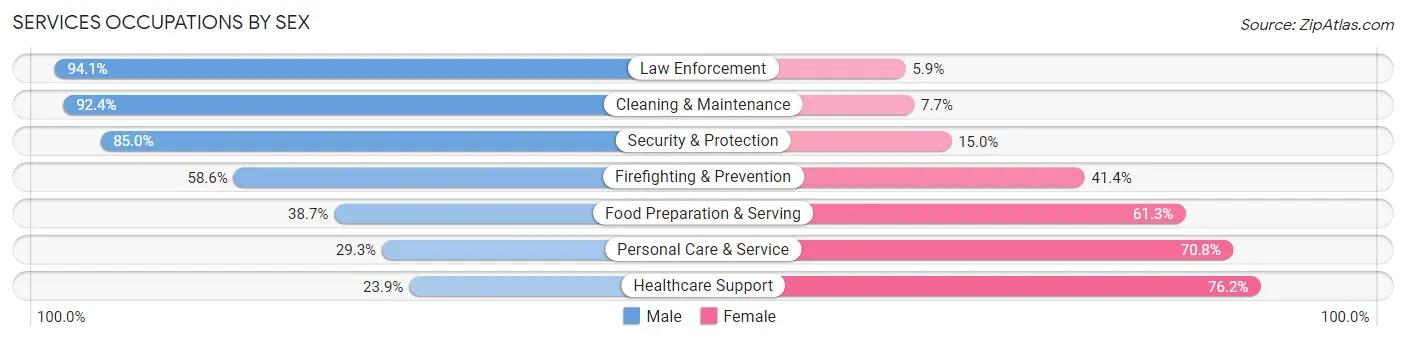
Services Occupations by Sex
Within the Services occupations in North Olmsted, the most male-oriented occupations are Law Enforcement (94.1%), Cleaning & Maintenance (92.3%), and Security & Protection (85.0%), while the most female-oriented occupations are Healthcare Support (76.1%), Personal Care & Service (70.8%), and Food Preparation & Serving (61.3%).
| Occupation | Male | Female |
| Healthcare Support | 88 (23.8%) | 281 (76.1%) |
| Security & Protection | 193 (85.0%) | 34 (15.0%) |
| Firefighting & Prevention | 34 (58.6%) | 24 (41.4%) |
| Law Enforcement | 159 (94.1%) | 10 (5.9%) |
| Food Preparation & Serving | 358 (38.7%) | 567 (61.3%) |
| Cleaning & Maintenance | 362 (92.3%) | 30 (7.6%) |
| Personal Care & Service | 98 (29.2%) | 237 (70.8%) |
| Total (Category) | 1,099 (48.9%) | 1,149 (51.1%) |
| Total (Overall) | 9,004 (54.5%) | 7,506 (45.5%) |
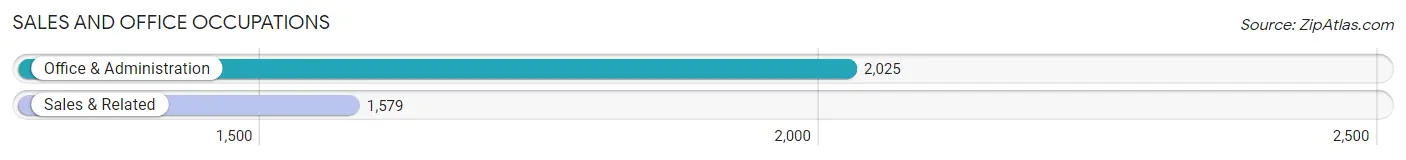
Sales and Office Occupations
The most common Sales and Office occupations in North Olmsted are Office & Administration (2,025 | 12.3%), and Sales & Related (1,579 | 9.6%).
Sales and Office Occupations by Sex
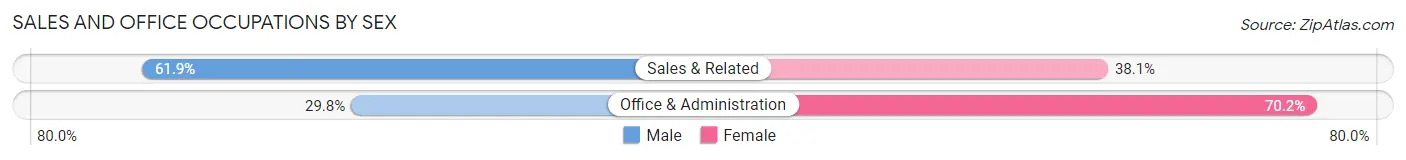
| Occupation | Male | Female |
| Sales & Related | 978 (61.9%) | 601 (38.1%) |
| Office & Administration | 603 (29.8%) | 1,422 (70.2%) |
| Total (Category) | 1,581 (43.9%) | 2,023 (56.1%) |
| Total (Overall) | 9,004 (54.5%) | 7,506 (45.5%) |
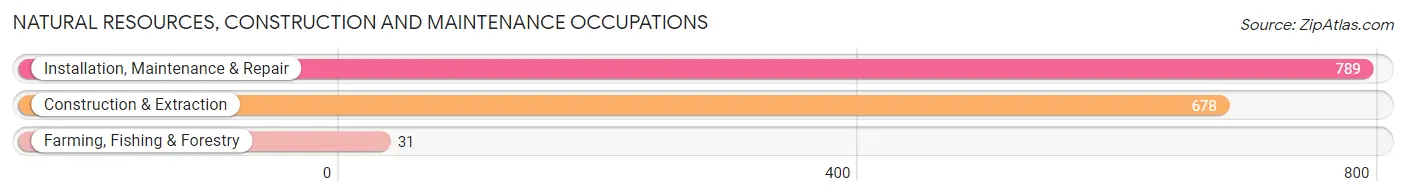
Natural Resources, Construction and Maintenance Occupations
The most common Natural Resources, Construction and Maintenance occupations in North Olmsted are Installation, Maintenance & Repair (789 | 4.8%), Construction & Extraction (678 | 4.1%), and Farming, Fishing & Forestry (31 | 0.2%).
Natural Resources, Construction and Maintenance Occupations by Sex
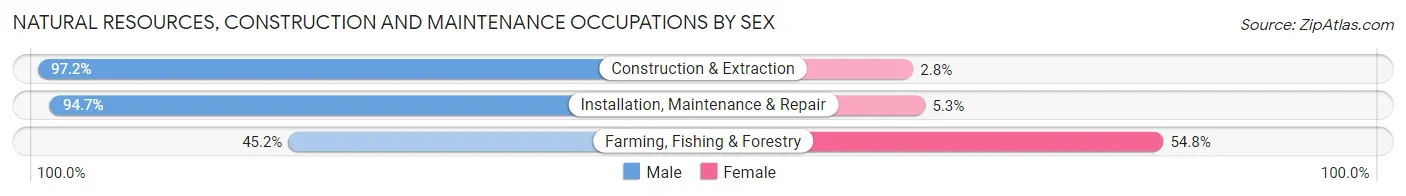
| Occupation | Male | Female |
| Farming, Fishing & Forestry | 14 (45.2%) | 17 (54.8%) |
| Construction & Extraction | 659 (97.2%) | 19 (2.8%) |
| Installation, Maintenance & Repair | 747 (94.7%) | 42 (5.3%) |
| Total (Category) | 1,420 (94.8%) | 78 (5.2%) |
| Total (Overall) | 9,004 (54.5%) | 7,506 (45.5%) |
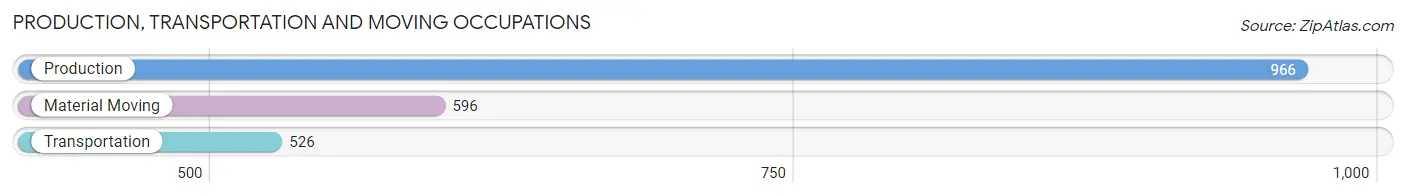
Production, Transportation and Moving Occupations
The most common Production, Transportation and Moving occupations in North Olmsted are Production (966 | 5.9%), Material Moving (596 | 3.6%), and Transportation (526 | 3.2%).
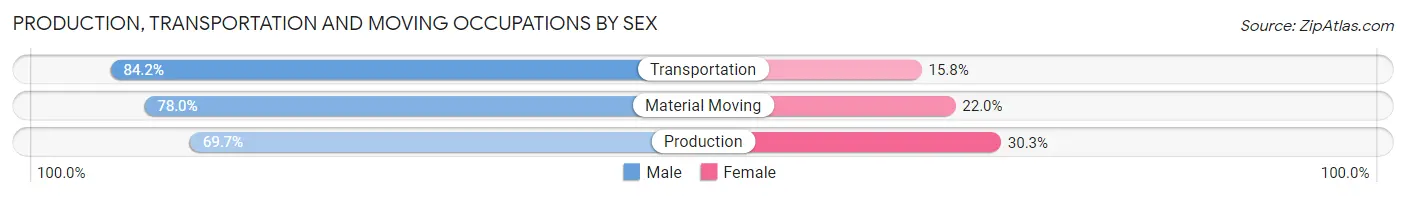
Production, Transportation and Moving Occupations by Sex
| Occupation | Male | Female |
| Production | 673 (69.7%) | 293 (30.3%) |
| Transportation | 443 (84.2%) | 83 (15.8%) |
| Material Moving | 465 (78.0%) | 131 (22.0%) |
| Total (Category) | 1,581 (75.7%) | 507 (24.3%) |
| Total (Overall) | 9,004 (54.5%) | 7,506 (45.5%) |
Employment Industries by Sex in North Olmsted
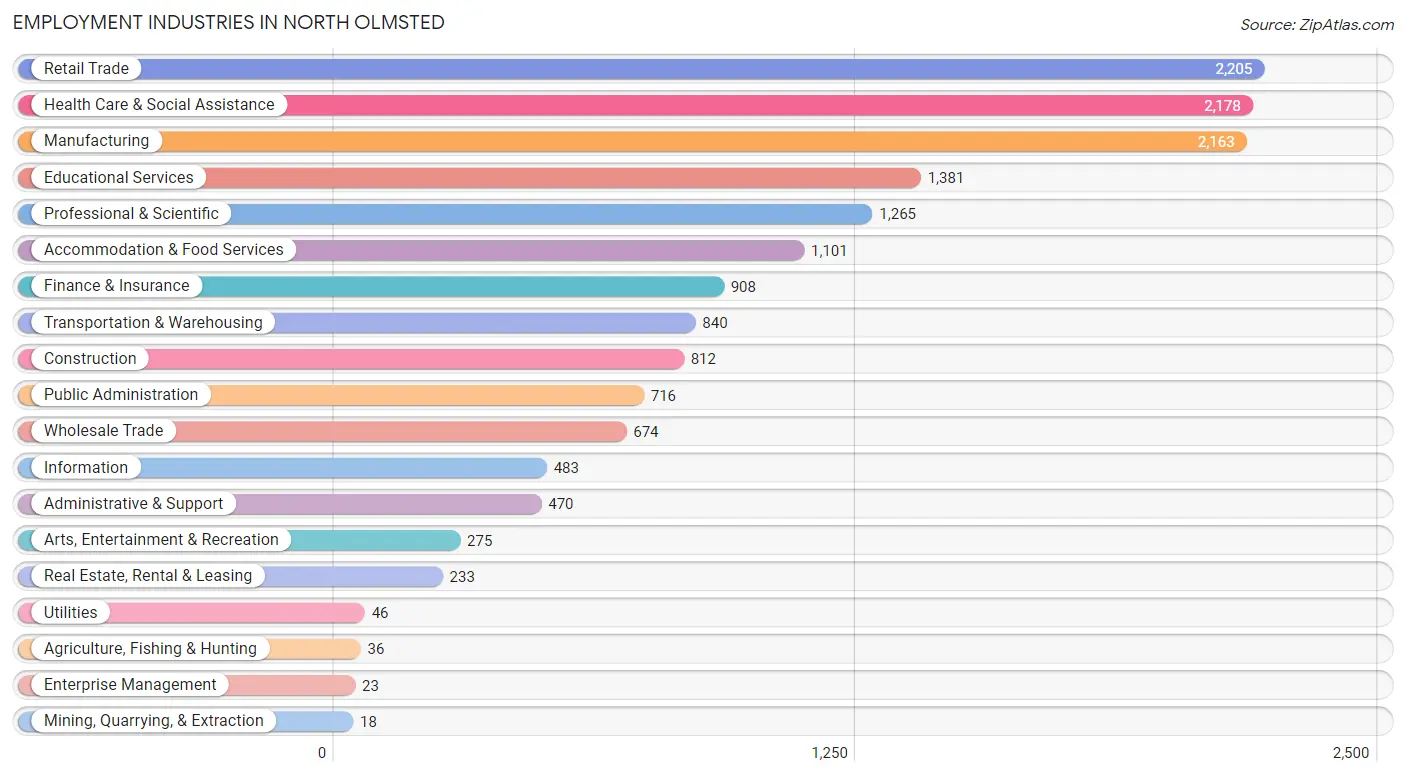
Employment Industries in North Olmsted
The major employment industries in North Olmsted include Retail Trade (2,205 | 13.4%), Health Care & Social Assistance (2,178 | 13.2%), Manufacturing (2,163 | 13.1%), Educational Services (1,381 | 8.4%), and Professional & Scientific (1,265 | 7.7%).
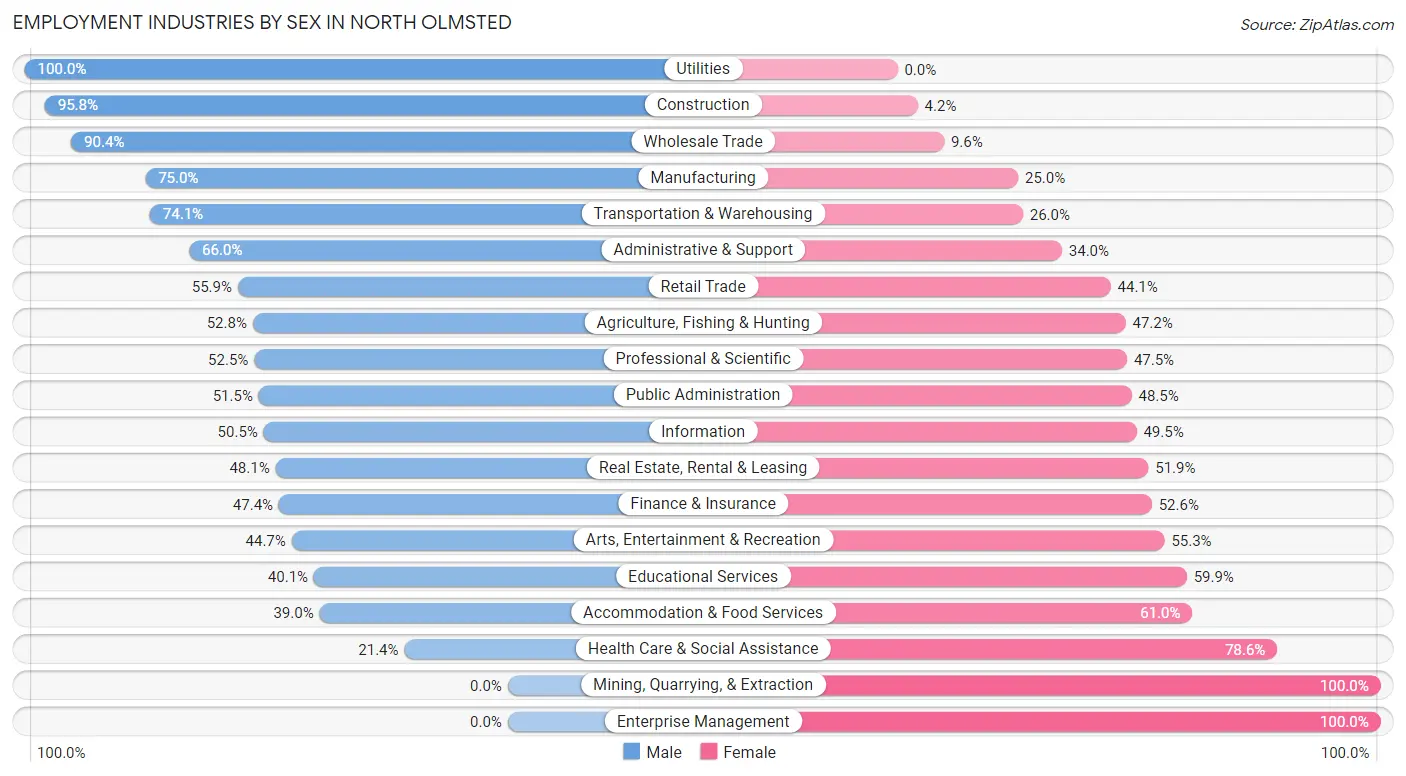
Employment Industries by Sex in North Olmsted
The North Olmsted industries that see more men than women are Utilities (100.0%), Construction (95.8%), and Wholesale Trade (90.4%), whereas the industries that tend to have a higher number of women are Mining, Quarrying, & Extraction (100.0%), Enterprise Management (100.0%), and Health Care & Social Assistance (78.6%).
| Industry | Male | Female |
| Agriculture, Fishing & Hunting | 19 (52.8%) | 17 (47.2%) |
| Mining, Quarrying, & Extraction | 0 (0.0%) | 18 (100.0%) |
| Construction | 778 (95.8%) | 34 (4.2%) |
| Manufacturing | 1,623 (75.0%) | 540 (25.0%) |
| Wholesale Trade | 609 (90.4%) | 65 (9.6%) |
| Retail Trade | 1,232 (55.9%) | 973 (44.1%) |
| Transportation & Warehousing | 622 (74.1%) | 218 (26.0%) |
| Utilities | 46 (100.0%) | 0 (0.0%) |
| Information | 244 (50.5%) | 239 (49.5%) |
| Finance & Insurance | 430 (47.4%) | 478 (52.6%) |
| Real Estate, Rental & Leasing | 112 (48.1%) | 121 (51.9%) |
| Professional & Scientific | 664 (52.5%) | 601 (47.5%) |
| Enterprise Management | 0 (0.0%) | 23 (100.0%) |
| Administrative & Support | 310 (66.0%) | 160 (34.0%) |
| Educational Services | 554 (40.1%) | 827 (59.9%) |
| Health Care & Social Assistance | 466 (21.4%) | 1,712 (78.6%) |
| Arts, Entertainment & Recreation | 123 (44.7%) | 152 (55.3%) |
| Accommodation & Food Services | 429 (39.0%) | 672 (61.0%) |
| Public Administration | 369 (51.5%) | 347 (48.5%) |
| Total | 9,004 (54.5%) | 7,506 (45.5%) |
Education in North Olmsted
School Enrollment in North Olmsted
The most common levels of schooling among the 7,675 students in North Olmsted are high school (1,871 | 24.4%), middle school (1,853 | 24.1%), and elementary school (1,541 | 20.1%).
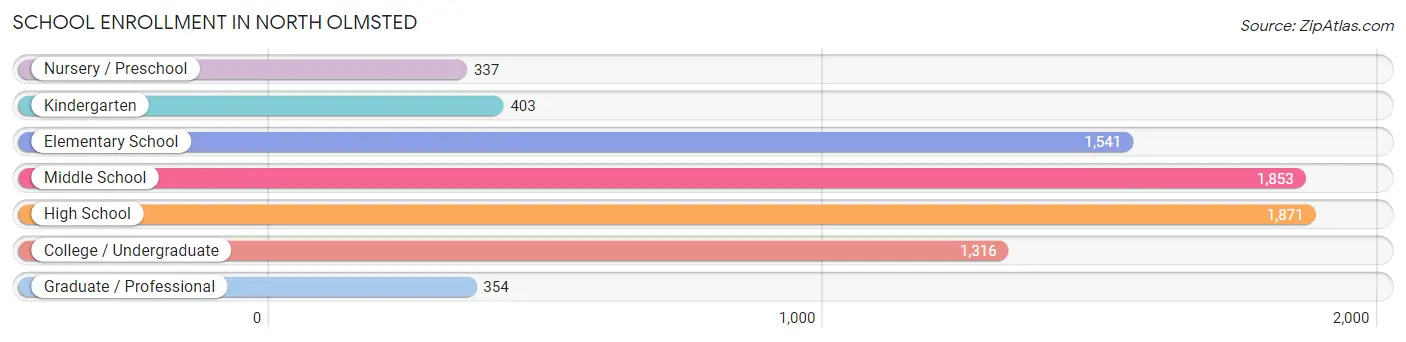
| School Level | # Students | % Students |
| Nursery / Preschool | 337 | 4.4% |
| Kindergarten | 403 | 5.2% |
| Elementary School | 1,541 | 20.1% |
| Middle School | 1,853 | 24.1% |
| High School | 1,871 | 24.4% |
| College / Undergraduate | 1,316 | 17.2% |
| Graduate / Professional | 354 | 4.6% |
| Total | 7,675 | 100.0% |
School Enrollment by Age by Funding Source in North Olmsted
Out of a total of 7,675 students who are enrolled in schools in North Olmsted, 1,642 (21.4%) attend a private institution, while the remaining 6,033 (78.6%) are enrolled in public schools. The age group of 25 to 34 year olds has the highest likelihood of being enrolled in private schools, with 100 (32.9% in the age bracket) enrolled. Conversely, the age group of 18 to 19 year olds has the lowest likelihood of being enrolled in a private school, with 550 (84.0% in the age bracket) attending a public institution.
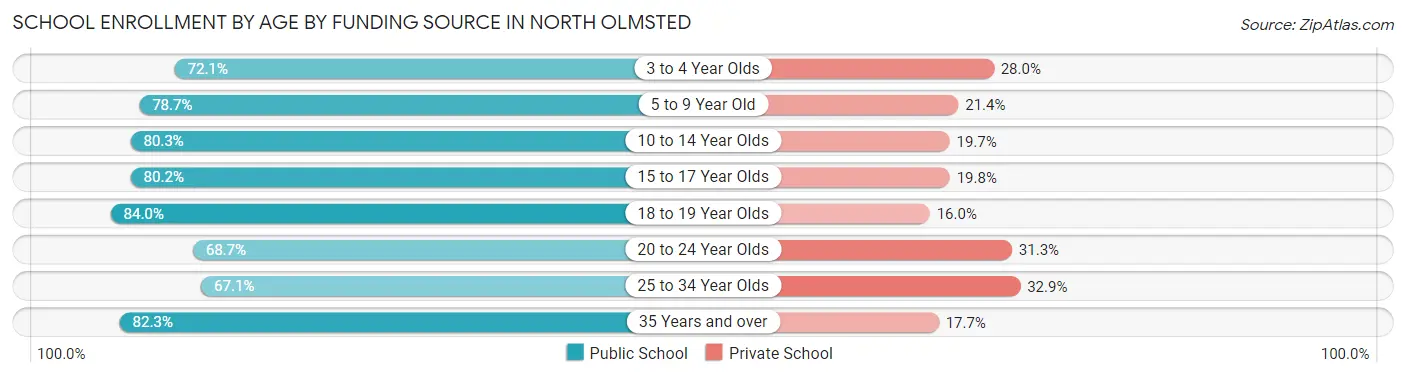
| Age Bracket | Public School | Private School |
| 3 to 4 Year Olds | 165 (72.1%) | 64 (28.0%) |
| 5 to 9 Year Old | 1,485 (78.6%) | 403 (21.3%) |
| 10 to 14 Year Olds | 1,730 (80.3%) | 425 (19.7%) |
| 15 to 17 Year Olds | 1,206 (80.2%) | 297 (19.8%) |
| 18 to 19 Year Olds | 550 (84.0%) | 105 (16.0%) |
| 20 to 24 Year Olds | 425 (68.7%) | 194 (31.3%) |
| 25 to 34 Year Olds | 204 (67.1%) | 100 (32.9%) |
| 35 Years and over | 265 (82.3%) | 57 (17.7%) |
| Total | 6,033 (78.6%) | 1,642 (21.4%) |
Educational Attainment by Field of Study in North Olmsted
Business (1,778 | 22.1%), education (1,087 | 13.5%), engineering (785 | 9.8%), science & technology (762 | 9.5%), and communications (688 | 8.6%) are the most common fields of study among 8,048 individuals in North Olmsted who have obtained a bachelor's degree or higher.
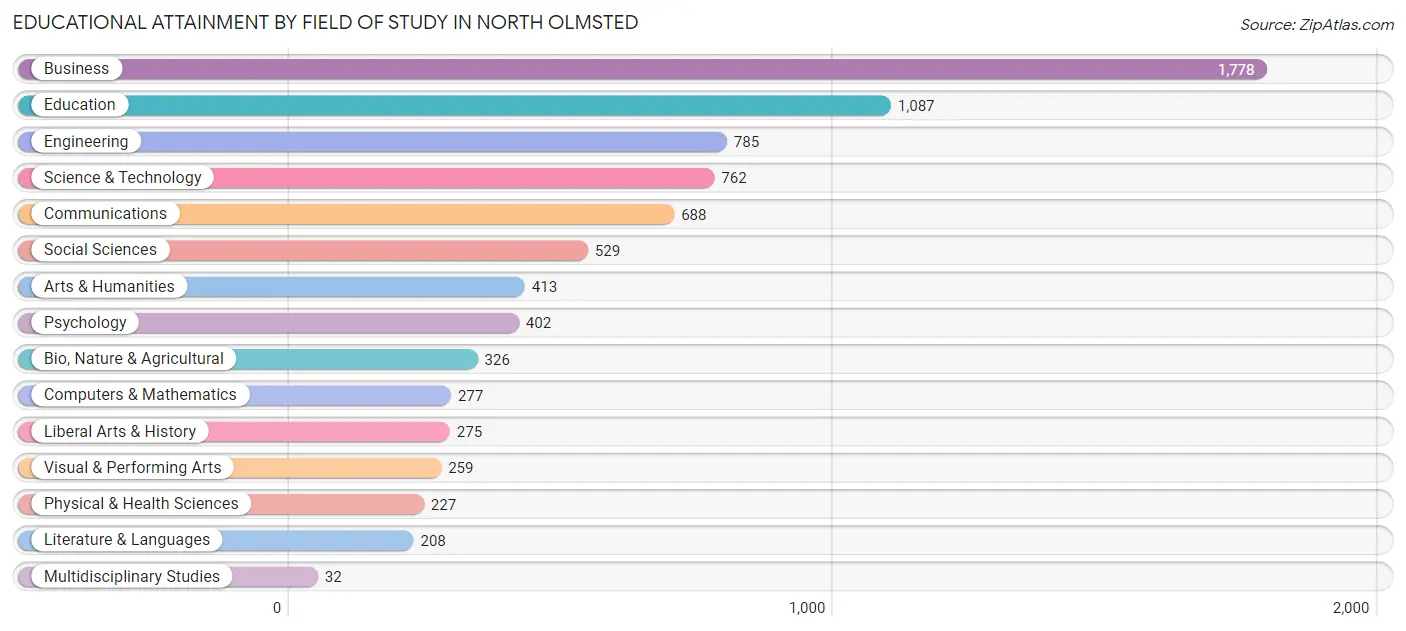
| Field of Study | # Graduates | % Graduates |
| Computers & Mathematics | 277 | 3.4% |
| Bio, Nature & Agricultural | 326 | 4.1% |
| Physical & Health Sciences | 227 | 2.8% |
| Psychology | 402 | 5.0% |
| Social Sciences | 529 | 6.6% |
| Engineering | 785 | 9.8% |
| Multidisciplinary Studies | 32 | 0.4% |
| Science & Technology | 762 | 9.5% |
| Business | 1,778 | 22.1% |
| Education | 1,087 | 13.5% |
| Literature & Languages | 208 | 2.6% |
| Liberal Arts & History | 275 | 3.4% |
| Visual & Performing Arts | 259 | 3.2% |
| Communications | 688 | 8.6% |
| Arts & Humanities | 413 | 5.1% |
| Total | 8,048 | 100.0% |
Transportation & Commute in North Olmsted
Vehicle Availability by Sex in North Olmsted
The most prevalent vehicle ownership categories in North Olmsted are males with 2 vehicles (4,763, accounting for 53.8%) and females with 2 vehicles (3,531, making up 64.8%).
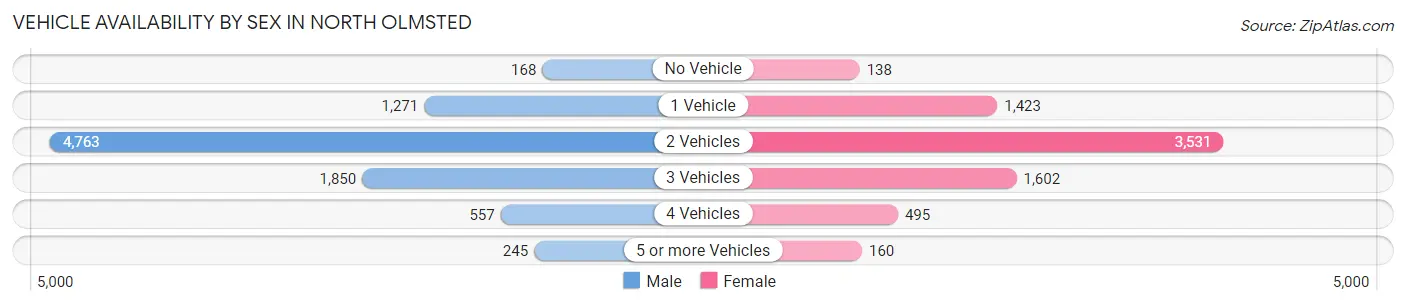
| Vehicles Available | Male | Female |
| No Vehicle | 168 (1.9%) | 138 (1.9%) |
| 1 Vehicle | 1,271 (14.4%) | 1,423 (19.4%) |
| 2 Vehicles | 4,763 (53.8%) | 3,531 (48.0%) |
| 3 Vehicles | 1,850 (20.9%) | 1,602 (21.8%) |
| 4 Vehicles | 557 (6.3%) | 495 (6.7%) |
| 5 or more Vehicles | 245 (2.8%) | 160 (2.2%) |
| Total | 8,854 (100.0%) | 7,349 (100.0%) |
Commute Time in North Olmsted
The most frequently occuring commute durations in North Olmsted are 20 to 24 minutes (2,484 commuters, 17.6%), 15 to 19 minutes (2,297 commuters, 16.3%), and 30 to 34 minutes (2,030 commuters, 14.4%).
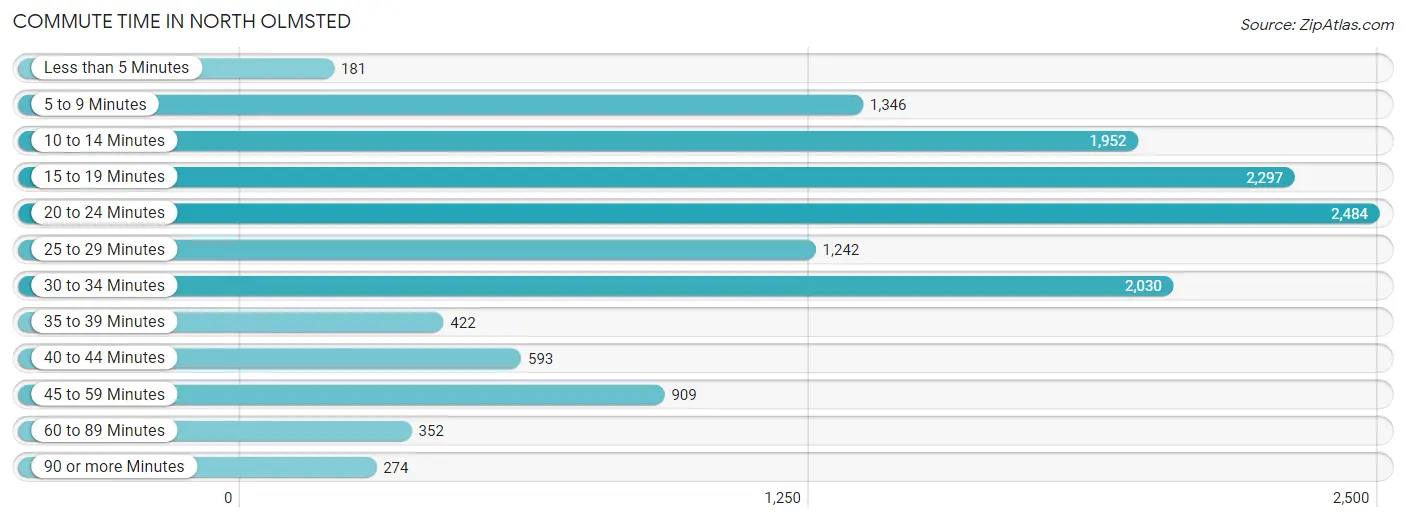
| Commute Time | # Commuters | % Commuters |
| Less than 5 Minutes | 181 | 1.3% |
| 5 to 9 Minutes | 1,346 | 9.6% |
| 10 to 14 Minutes | 1,952 | 13.9% |
| 15 to 19 Minutes | 2,297 | 16.3% |
| 20 to 24 Minutes | 2,484 | 17.6% |
| 25 to 29 Minutes | 1,242 | 8.8% |
| 30 to 34 Minutes | 2,030 | 14.4% |
| 35 to 39 Minutes | 422 | 3.0% |
| 40 to 44 Minutes | 593 | 4.2% |
| 45 to 59 Minutes | 909 | 6.5% |
| 60 to 89 Minutes | 352 | 2.5% |
| 90 or more Minutes | 274 | 1.9% |
Commute Time by Sex in North Olmsted
The most common commute times in North Olmsted are 15 to 19 minutes (1,574 commuters, 20.3%) for males and 20 to 24 minutes (1,108 commuters, 17.5%) for females.
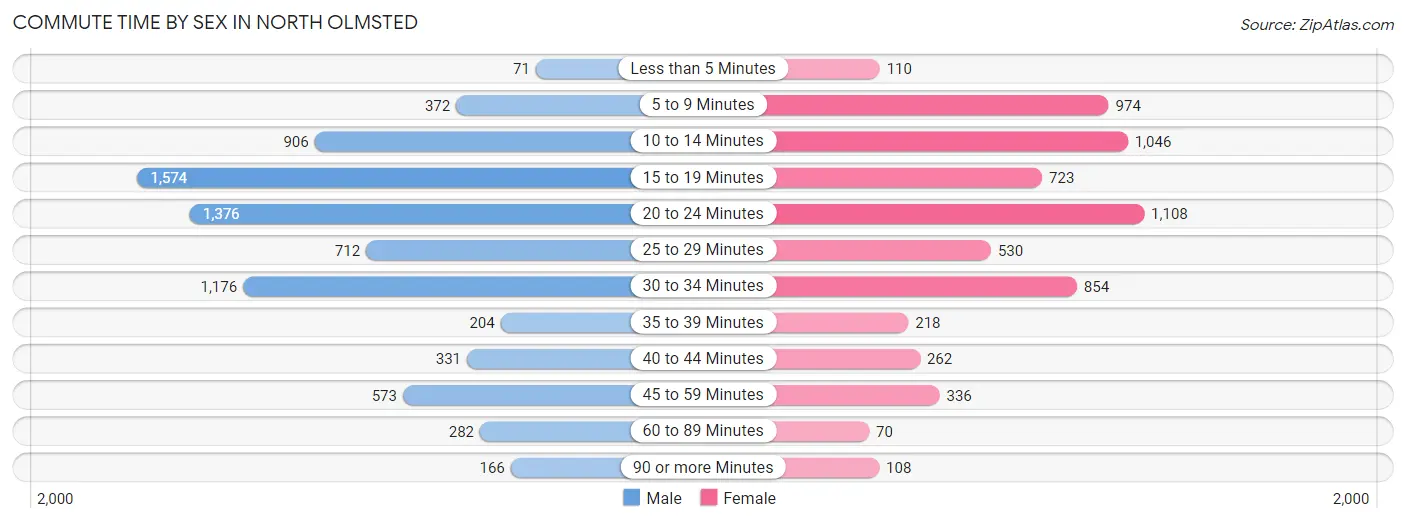
| Commute Time | Male | Female |
| Less than 5 Minutes | 71 (0.9%) | 110 (1.7%) |
| 5 to 9 Minutes | 372 (4.8%) | 974 (15.4%) |
| 10 to 14 Minutes | 906 (11.7%) | 1,046 (16.5%) |
| 15 to 19 Minutes | 1,574 (20.3%) | 723 (11.4%) |
| 20 to 24 Minutes | 1,376 (17.8%) | 1,108 (17.5%) |
| 25 to 29 Minutes | 712 (9.2%) | 530 (8.4%) |
| 30 to 34 Minutes | 1,176 (15.2%) | 854 (13.5%) |
| 35 to 39 Minutes | 204 (2.6%) | 218 (3.4%) |
| 40 to 44 Minutes | 331 (4.3%) | 262 (4.1%) |
| 45 to 59 Minutes | 573 (7.4%) | 336 (5.3%) |
| 60 to 89 Minutes | 282 (3.6%) | 70 (1.1%) |
| 90 or more Minutes | 166 (2.1%) | 108 (1.7%) |
Time of Departure to Work by Sex in North Olmsted
The most frequent times of departure to work in North Olmsted are 7:00 AM to 7:29 AM (1,166, 15.1%) for males and 7:00 AM to 7:29 AM (1,009, 15.9%) for females.
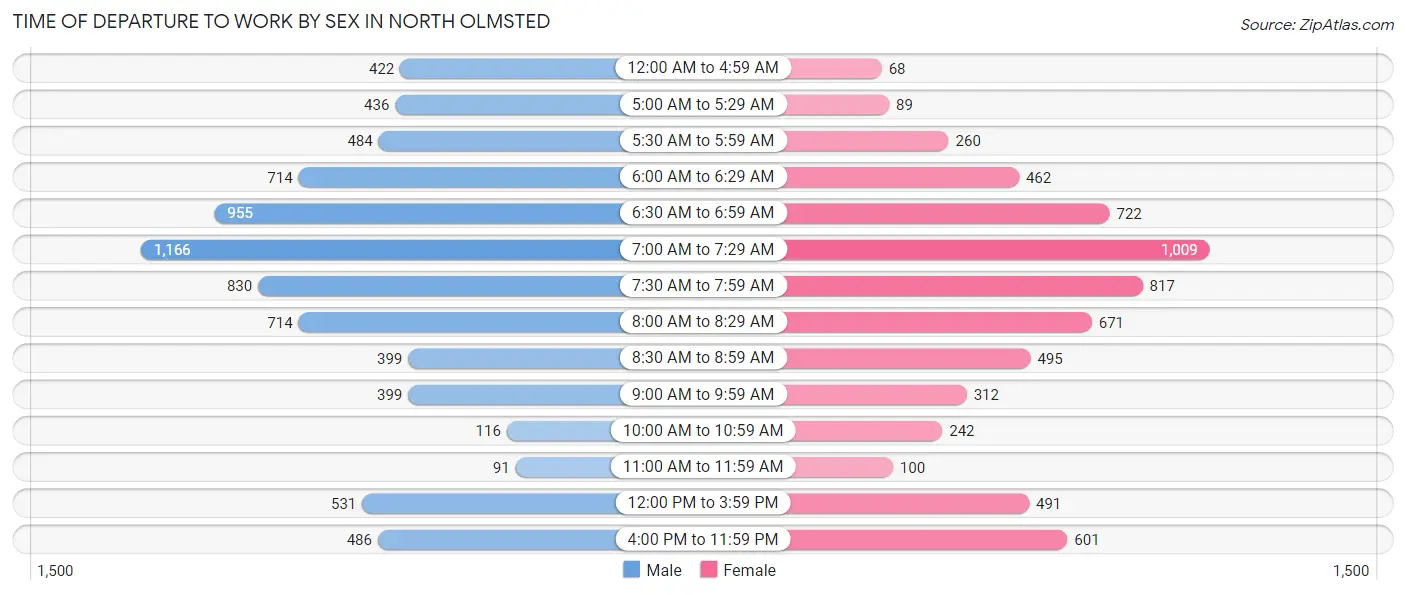
| Time of Departure | Male | Female |
| 12:00 AM to 4:59 AM | 422 (5.4%) | 68 (1.1%) |
| 5:00 AM to 5:29 AM | 436 (5.6%) | 89 (1.4%) |
| 5:30 AM to 5:59 AM | 484 (6.2%) | 260 (4.1%) |
| 6:00 AM to 6:29 AM | 714 (9.2%) | 462 (7.3%) |
| 6:30 AM to 6:59 AM | 955 (12.3%) | 722 (11.4%) |
| 7:00 AM to 7:29 AM | 1,166 (15.1%) | 1,009 (15.9%) |
| 7:30 AM to 7:59 AM | 830 (10.7%) | 817 (12.9%) |
| 8:00 AM to 8:29 AM | 714 (9.2%) | 671 (10.6%) |
| 8:30 AM to 8:59 AM | 399 (5.1%) | 495 (7.8%) |
| 9:00 AM to 9:59 AM | 399 (5.1%) | 312 (4.9%) |
| 10:00 AM to 10:59 AM | 116 (1.5%) | 242 (3.8%) |
| 11:00 AM to 11:59 AM | 91 (1.2%) | 100 (1.6%) |
| 12:00 PM to 3:59 PM | 531 (6.9%) | 491 (7.7%) |
| 4:00 PM to 11:59 PM | 486 (6.3%) | 601 (9.5%) |
| Total | 7,743 (100.0%) | 6,339 (100.0%) |
Housing Occupancy in North Olmsted
Occupancy by Ownership in North Olmsted
Of the total 13,140 dwellings in North Olmsted, owner-occupied units account for 10,146 (77.2%), while renter-occupied units make up 2,994 (22.8%).
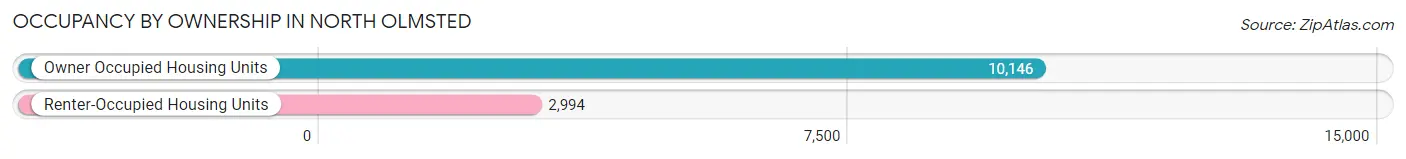
| Occupancy | # Housing Units | % Housing Units |
| Owner Occupied Housing Units | 10,146 | 77.2% |
| Renter-Occupied Housing Units | 2,994 | 22.8% |
| Total Occupied Housing Units | 13,140 | 100.0% |
Occupancy by Household Size in North Olmsted
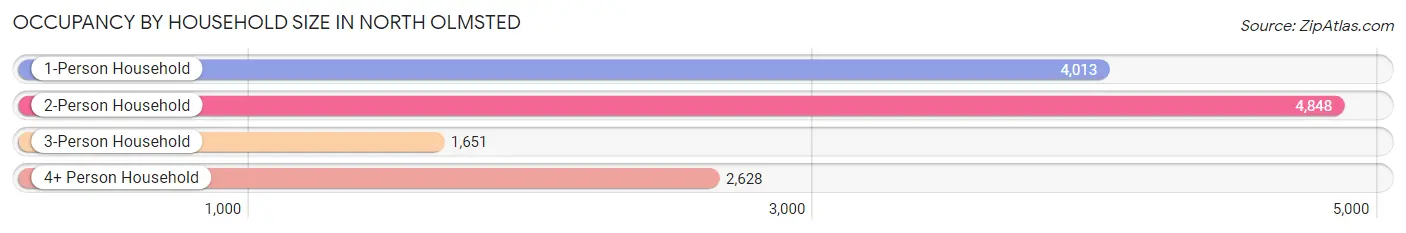
| Household Size | # Housing Units | % Housing Units |
| 1-Person Household | 4,013 | 30.5% |
| 2-Person Household | 4,848 | 36.9% |
| 3-Person Household | 1,651 | 12.6% |
| 4+ Person Household | 2,628 | 20.0% |
| Total Housing Units | 13,140 | 100.0% |
Occupancy by Ownership by Household Size in North Olmsted
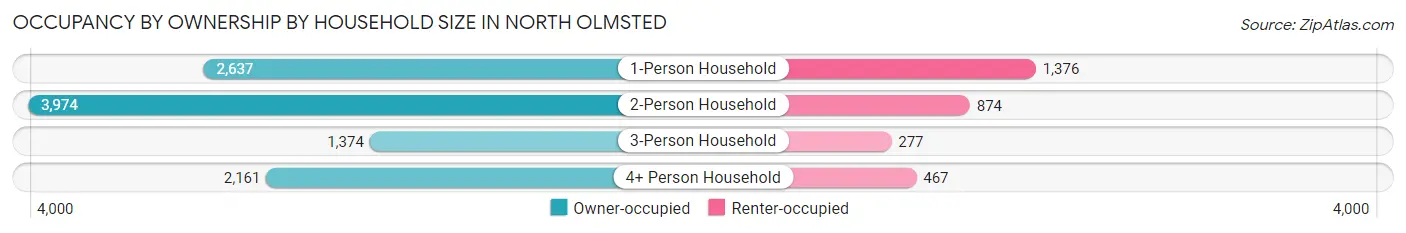
| Household Size | Owner-occupied | Renter-occupied |
| 1-Person Household | 2,637 (65.7%) | 1,376 (34.3%) |
| 2-Person Household | 3,974 (82.0%) | 874 (18.0%) |
| 3-Person Household | 1,374 (83.2%) | 277 (16.8%) |
| 4+ Person Household | 2,161 (82.2%) | 467 (17.8%) |
| Total Housing Units | 10,146 (77.2%) | 2,994 (22.8%) |
Occupancy by Educational Attainment in North Olmsted
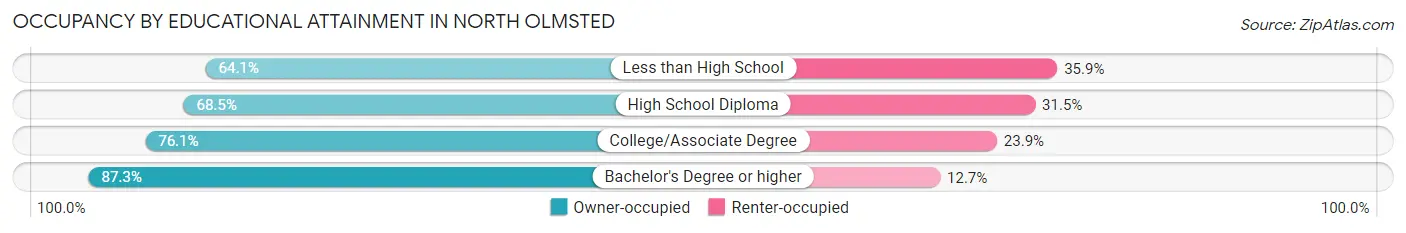
| Household Size | Owner-occupied | Renter-occupied |
| Less than High School | 400 (64.1%) | 224 (35.9%) |
| High School Diploma | 2,520 (68.5%) | 1,160 (31.5%) |
| College/Associate Degree | 3,307 (76.1%) | 1,041 (23.9%) |
| Bachelor's Degree or higher | 3,919 (87.3%) | 569 (12.7%) |
Occupancy by Age of Householder in North Olmsted
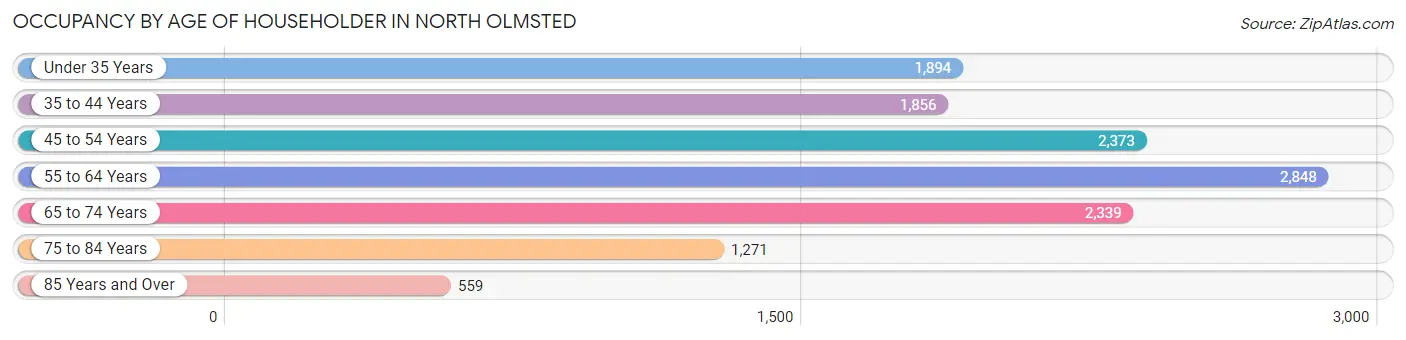
| Age Bracket | # Households | % Households |
| Under 35 Years | 1,894 | 14.4% |
| 35 to 44 Years | 1,856 | 14.1% |
| 45 to 54 Years | 2,373 | 18.1% |
| 55 to 64 Years | 2,848 | 21.7% |
| 65 to 74 Years | 2,339 | 17.8% |
| 75 to 84 Years | 1,271 | 9.7% |
| 85 Years and Over | 559 | 4.3% |
| Total | 13,140 | 100.0% |
Housing Finances in North Olmsted
Median Income by Occupancy in North Olmsted
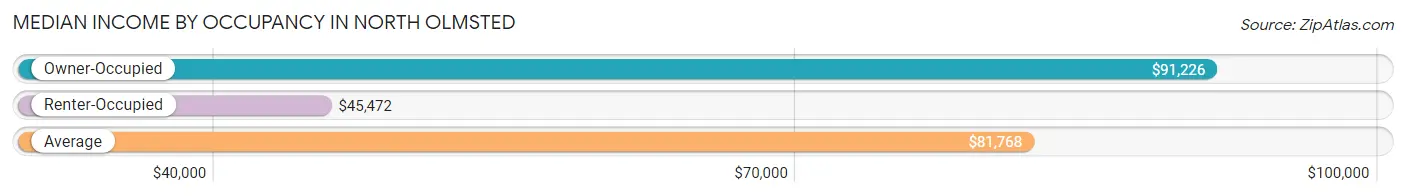
| Occupancy Type | # Households | Median Income |
| Owner-Occupied | 10,146 (77.2%) | $91,226 |
| Renter-Occupied | 2,994 (22.8%) | $45,472 |
| Average | 13,140 (100.0%) | $81,768 |
Occupancy by Householder Income Bracket in North Olmsted
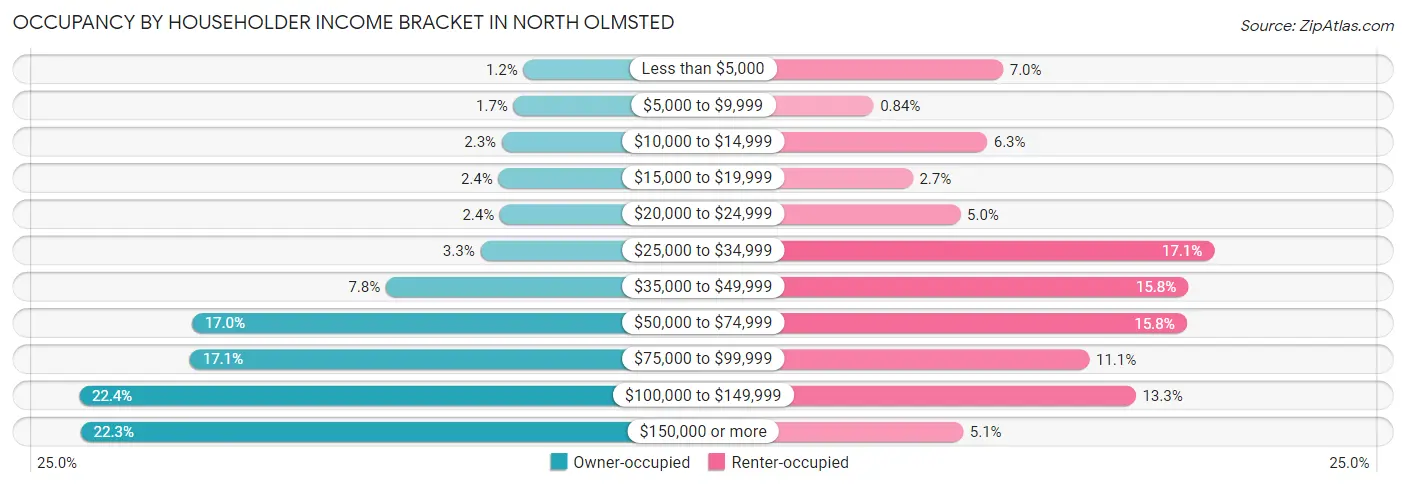
| Income Bracket | Owner-occupied | Renter-occupied |
| Less than $5,000 | 126 (1.2%) | 210 (7.0%) |
| $5,000 to $9,999 | 173 (1.7%) | 25 (0.8%) |
| $10,000 to $14,999 | 230 (2.3%) | 187 (6.2%) |
| $15,000 to $19,999 | 247 (2.4%) | 81 (2.7%) |
| $20,000 to $24,999 | 239 (2.4%) | 149 (5.0%) |
| $25,000 to $34,999 | 334 (3.3%) | 511 (17.1%) |
| $35,000 to $49,999 | 790 (7.8%) | 474 (15.8%) |
| $50,000 to $74,999 | 1,729 (17.0%) | 472 (15.8%) |
| $75,000 to $99,999 | 1,738 (17.1%) | 333 (11.1%) |
| $100,000 to $149,999 | 2,274 (22.4%) | 399 (13.3%) |
| $150,000 or more | 2,266 (22.3%) | 153 (5.1%) |
| Total | 10,146 (100.0%) | 2,994 (100.0%) |
Monthly Housing Cost Tiers in North Olmsted
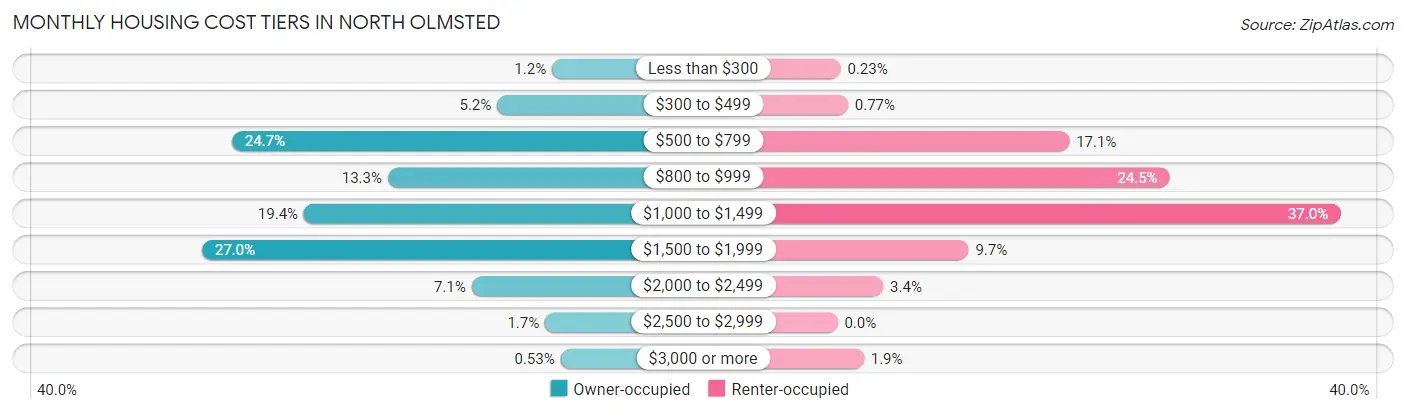
| Monthly Cost | Owner-occupied | Renter-occupied |
| Less than $300 | 118 (1.2%) | 7 (0.2%) |
| $300 to $499 | 528 (5.2%) | 23 (0.8%) |
| $500 to $799 | 2,510 (24.7%) | 511 (17.1%) |
| $800 to $999 | 1,344 (13.3%) | 732 (24.4%) |
| $1,000 to $1,499 | 1,971 (19.4%) | 1,108 (37.0%) |
| $1,500 to $1,999 | 2,734 (27.0%) | 289 (9.7%) |
| $2,000 to $2,499 | 718 (7.1%) | 101 (3.4%) |
| $2,500 to $2,999 | 169 (1.7%) | 0 (0.0%) |
| $3,000 or more | 54 (0.5%) | 58 (1.9%) |
| Total | 10,146 (100.0%) | 2,994 (100.0%) |
Physical Housing Characteristics in North Olmsted
Housing Structures in North Olmsted
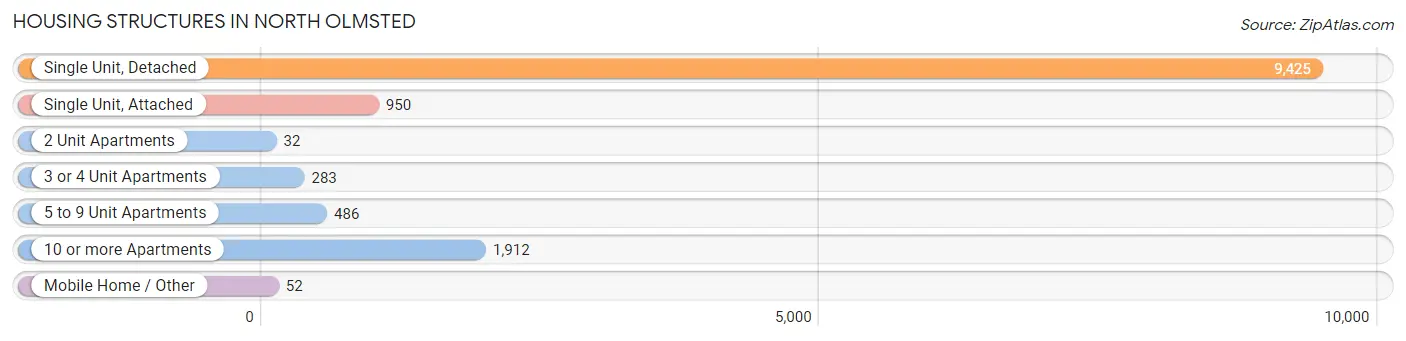
| Structure Type | # Housing Units | % Housing Units |
| Single Unit, Detached | 9,425 | 71.7% |
| Single Unit, Attached | 950 | 7.2% |
| 2 Unit Apartments | 32 | 0.2% |
| 3 or 4 Unit Apartments | 283 | 2.1% |
| 5 to 9 Unit Apartments | 486 | 3.7% |
| 10 or more Apartments | 1,912 | 14.5% |
| Mobile Home / Other | 52 | 0.4% |
| Total | 13,140 | 100.0% |
Housing Structures by Occupancy in North Olmsted
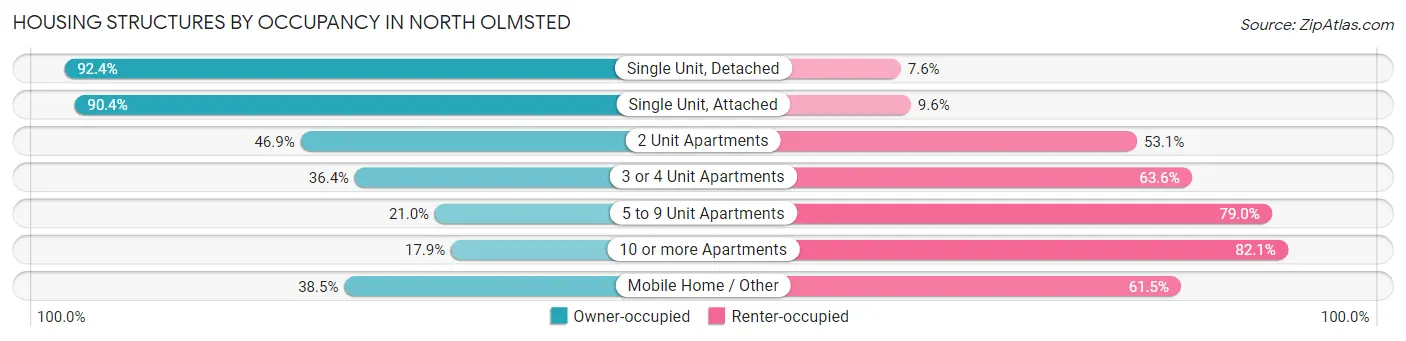
| Structure Type | Owner-occupied | Renter-occupied |
| Single Unit, Detached | 8,705 (92.4%) | 720 (7.6%) |
| Single Unit, Attached | 859 (90.4%) | 91 (9.6%) |
| 2 Unit Apartments | 15 (46.9%) | 17 (53.1%) |
| 3 or 4 Unit Apartments | 103 (36.4%) | 180 (63.6%) |
| 5 to 9 Unit Apartments | 102 (21.0%) | 384 (79.0%) |
| 10 or more Apartments | 342 (17.9%) | 1,570 (82.1%) |
| Mobile Home / Other | 20 (38.5%) | 32 (61.5%) |
| Total | 10,146 (77.2%) | 2,994 (22.8%) |
Housing Structures by Number of Rooms in North Olmsted
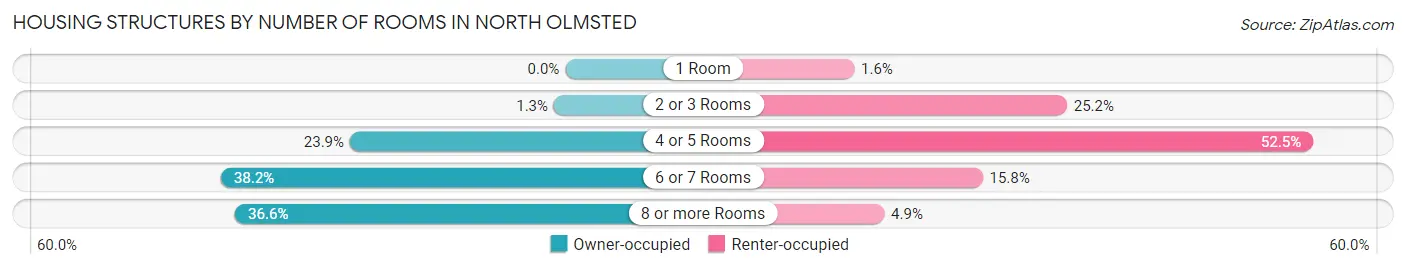
| Number of Rooms | Owner-occupied | Renter-occupied |
| 1 Room | 0 (0.0%) | 47 (1.6%) |
| 2 or 3 Rooms | 128 (1.3%) | 754 (25.2%) |
| 4 or 5 Rooms | 2,425 (23.9%) | 1,572 (52.5%) |
| 6 or 7 Rooms | 3,877 (38.2%) | 474 (15.8%) |
| 8 or more Rooms | 3,716 (36.6%) | 147 (4.9%) |
| Total | 10,146 (100.0%) | 2,994 (100.0%) |
Housing Structure by Heating Type in North Olmsted
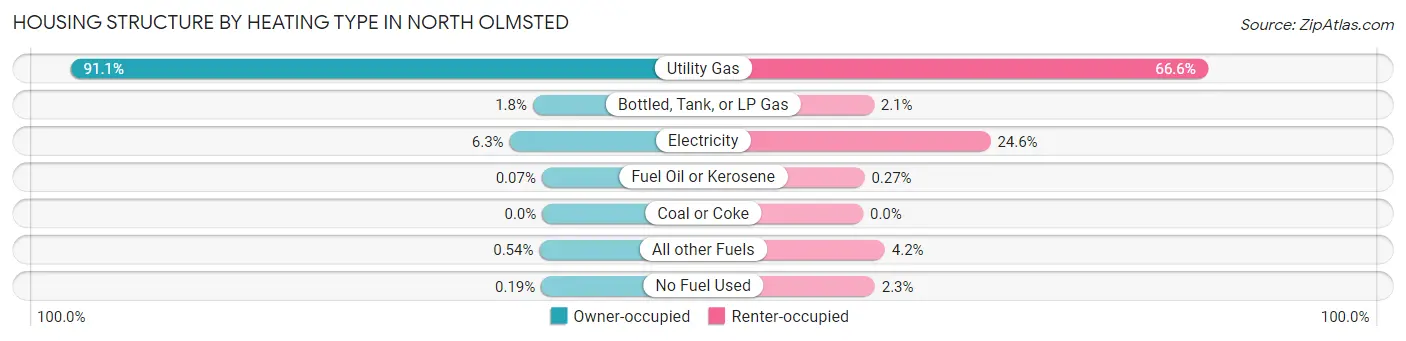
| Heating Type | Owner-occupied | Renter-occupied |
| Utility Gas | 9,243 (91.1%) | 1,993 (66.6%) |
| Bottled, Tank, or LP Gas | 182 (1.8%) | 62 (2.1%) |
| Electricity | 640 (6.3%) | 737 (24.6%) |
| Fuel Oil or Kerosene | 7 (0.1%) | 8 (0.3%) |
| Coal or Coke | 0 (0.0%) | 0 (0.0%) |
| All other Fuels | 55 (0.5%) | 126 (4.2%) |
| No Fuel Used | 19 (0.2%) | 68 (2.3%) |
| Total | 10,146 (100.0%) | 2,994 (100.0%) |
Household Vehicle Usage in North Olmsted
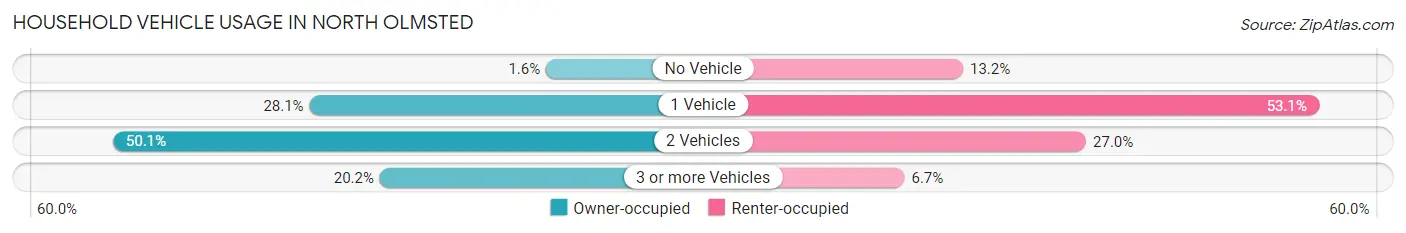
| Vehicles per Household | Owner-occupied | Renter-occupied |
| No Vehicle | 161 (1.6%) | 396 (13.2%) |
| 1 Vehicle | 2,850 (28.1%) | 1,589 (53.1%) |
| 2 Vehicles | 5,084 (50.1%) | 809 (27.0%) |
| 3 or more Vehicles | 2,051 (20.2%) | 200 (6.7%) |
| Total | 10,146 (100.0%) | 2,994 (100.0%) |
Real Estate & Mortgages in North Olmsted
Real Estate and Mortgage Overview in North Olmsted
| Characteristic | Without Mortgage | With Mortgage |
| Housing Units | 3,836 | 6,310 |
| Median Property Value | $183,700 | $196,100 |
| Median Household Income | $83,837 | $1,414 |
| Monthly Housing Costs | $675 | $54 |
| Real Estate Taxes | $4,301 | $62 |
Property Value by Mortgage Status in North Olmsted
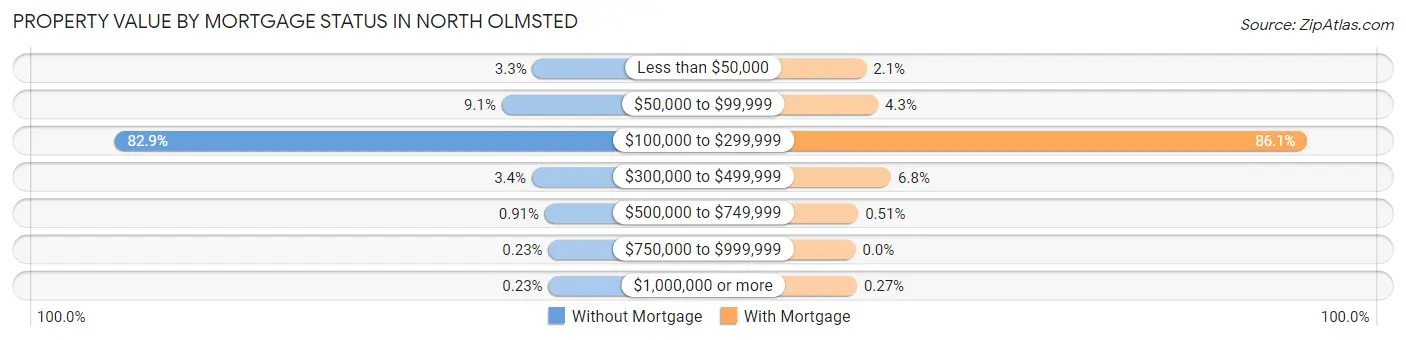
| Property Value | Without Mortgage | With Mortgage |
| Less than $50,000 | 125 (3.3%) | 130 (2.1%) |
| $50,000 to $99,999 | 350 (9.1%) | 272 (4.3%) |
| $100,000 to $299,999 | 3,178 (82.9%) | 5,431 (86.1%) |
| $300,000 to $499,999 | 130 (3.4%) | 428 (6.8%) |
| $500,000 to $749,999 | 35 (0.9%) | 32 (0.5%) |
| $750,000 to $999,999 | 9 (0.2%) | 0 (0.0%) |
| $1,000,000 or more | 9 (0.2%) | 17 (0.3%) |
| Total | 3,836 (100.0%) | 6,310 (100.0%) |
Household Income by Mortgage Status in North Olmsted
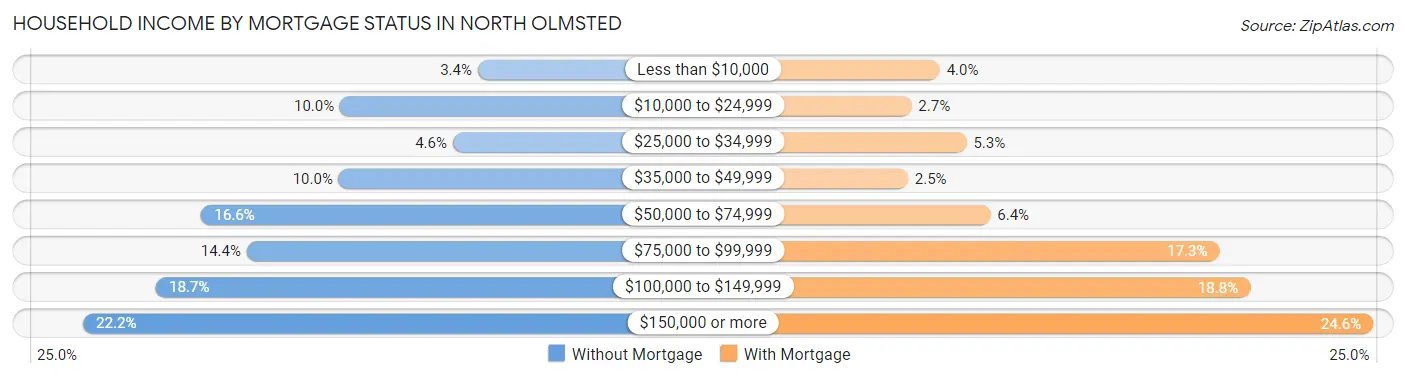
| Household Income | Without Mortgage | With Mortgage |
| Less than $10,000 | 131 (3.4%) | 253 (4.0%) |
| $10,000 to $24,999 | 383 (10.0%) | 168 (2.7%) |
| $25,000 to $34,999 | 177 (4.6%) | 333 (5.3%) |
| $35,000 to $49,999 | 385 (10.0%) | 157 (2.5%) |
| $50,000 to $74,999 | 636 (16.6%) | 405 (6.4%) |
| $75,000 to $99,999 | 553 (14.4%) | 1,093 (17.3%) |
| $100,000 to $149,999 | 719 (18.7%) | 1,185 (18.8%) |
| $150,000 or more | 852 (22.2%) | 1,555 (24.6%) |
| Total | 3,836 (100.0%) | 6,310 (100.0%) |
Property Value to Household Income Ratio in North Olmsted
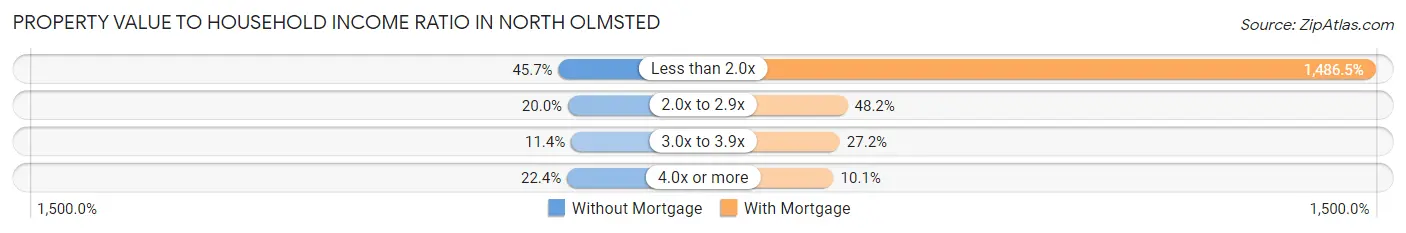
| Value-to-Income Ratio | Without Mortgage | With Mortgage |
| Less than 2.0x | 1,753 (45.7%) | 93,799 (1,486.5%) |
| 2.0x to 2.9x | 766 (20.0%) | 3,044 (48.2%) |
| 3.0x to 3.9x | 439 (11.4%) | 1,716 (27.2%) |
| 4.0x or more | 859 (22.4%) | 638 (10.1%) |
| Total | 3,836 (100.0%) | 6,310 (100.0%) |
Real Estate Taxes by Mortgage Status in North Olmsted
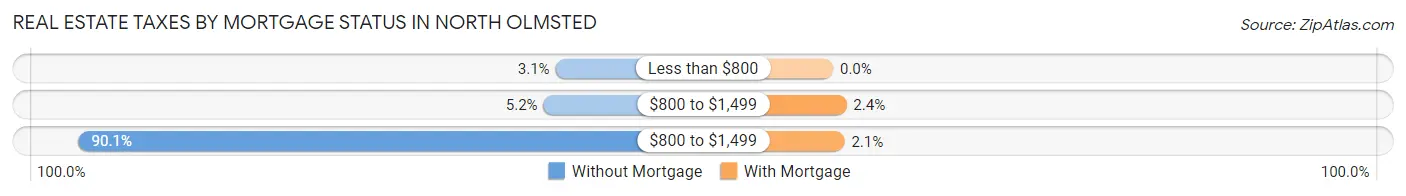
| Property Taxes | Without Mortgage | With Mortgage |
| Less than $800 | 117 (3.0%) | 0 (0.0%) |
| $800 to $1,499 | 201 (5.2%) | 154 (2.4%) |
| $800 to $1,499 | 3,457 (90.1%) | 131 (2.1%) |
| Total | 3,836 (100.0%) | 6,310 (100.0%) |
Health & Disability in North Olmsted
Health Insurance Coverage by Age in North Olmsted
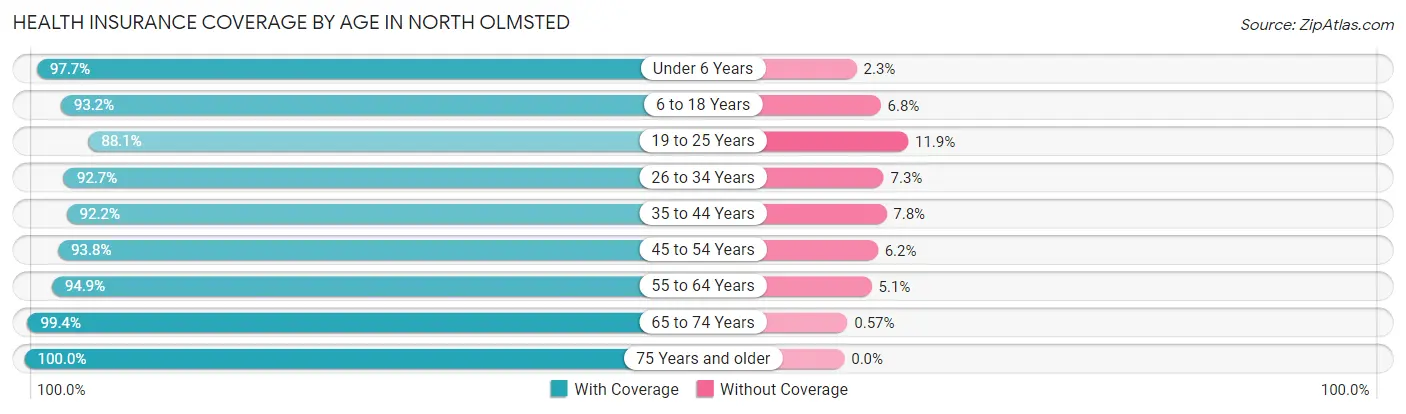
| Age Bracket | With Coverage | Without Coverage |
| Under 6 Years | 1,618 (97.7%) | 38 (2.3%) |
| 6 to 18 Years | 5,469 (93.2%) | 397 (6.8%) |
| 19 to 25 Years | 1,837 (88.1%) | 248 (11.9%) |
| 26 to 34 Years | 2,997 (92.7%) | 237 (7.3%) |
| 35 to 44 Years | 3,350 (92.2%) | 285 (7.8%) |
| 45 to 54 Years | 4,186 (93.8%) | 278 (6.2%) |
| 55 to 64 Years | 4,473 (94.9%) | 240 (5.1%) |
| 65 to 74 Years | 3,680 (99.4%) | 21 (0.6%) |
| 75 Years and older | 2,641 (100.0%) | 0 (0.0%) |
| Total | 30,251 (94.6%) | 1,744 (5.4%) |
Health Insurance Coverage by Citizenship Status in North Olmsted
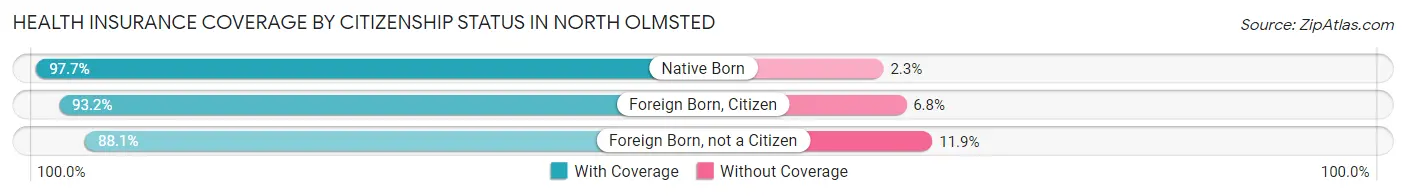
| Citizenship Status | With Coverage | Without Coverage |
| Native Born | 1,618 (97.7%) | 38 (2.3%) |
| Foreign Born, Citizen | 5,469 (93.2%) | 397 (6.8%) |
| Foreign Born, not a Citizen | 1,837 (88.1%) | 248 (11.9%) |
Health Insurance Coverage by Household Income in North Olmsted
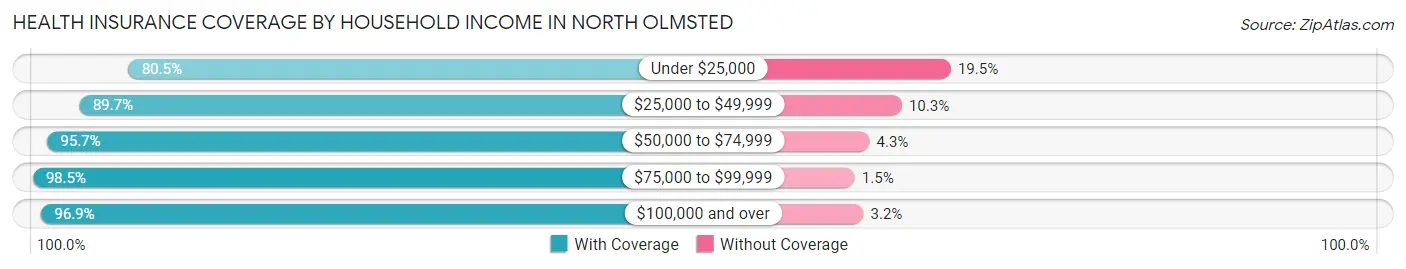
| Household Income | With Coverage | Without Coverage |
| Under $25,000 | 2,465 (80.5%) | 598 (19.5%) |
| $25,000 to $49,999 | 3,337 (89.7%) | 385 (10.3%) |
| $50,000 to $74,999 | 4,825 (95.7%) | 215 (4.3%) |
| $75,000 to $99,999 | 5,257 (98.5%) | 81 (1.5%) |
| $100,000 and over | 14,240 (96.9%) | 463 (3.2%) |
Public vs Private Health Insurance Coverage by Age in North Olmsted
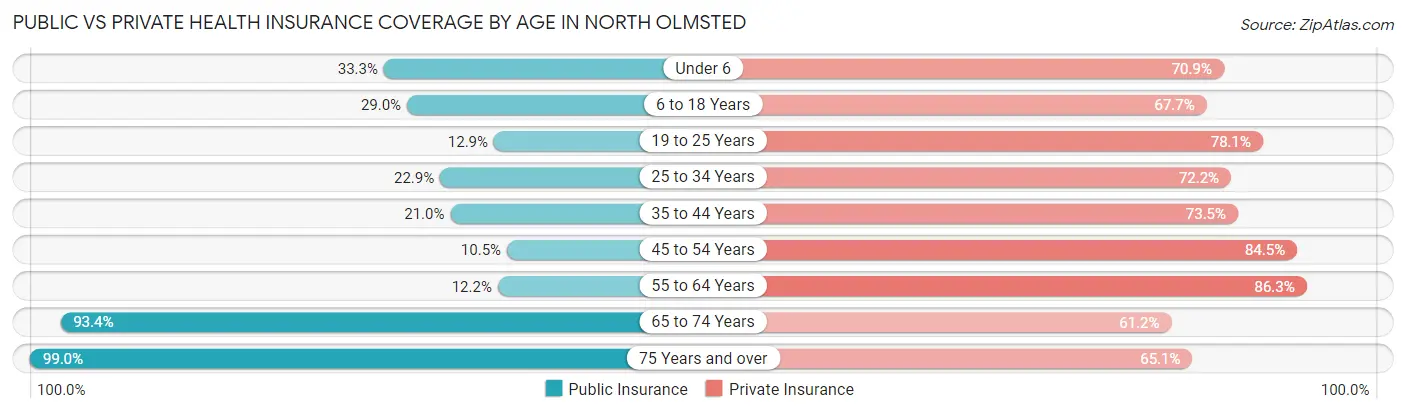
| Age Bracket | Public Insurance | Private Insurance |
| Under 6 | 552 (33.3%) | 1,174 (70.9%) |
| 6 to 18 Years | 1,703 (29.0%) | 3,971 (67.7%) |
| 19 to 25 Years | 269 (12.9%) | 1,629 (78.1%) |
| 25 to 34 Years | 740 (22.9%) | 2,336 (72.2%) |
| 35 to 44 Years | 763 (21.0%) | 2,672 (73.5%) |
| 45 to 54 Years | 468 (10.5%) | 3,772 (84.5%) |
| 55 to 64 Years | 574 (12.2%) | 4,065 (86.3%) |
| 65 to 74 Years | 3,456 (93.4%) | 2,263 (61.2%) |
| 75 Years and over | 2,615 (99.0%) | 1,718 (65.0%) |
| Total | 11,140 (34.8%) | 23,600 (73.8%) |
Disability Status by Sex by Age in North Olmsted
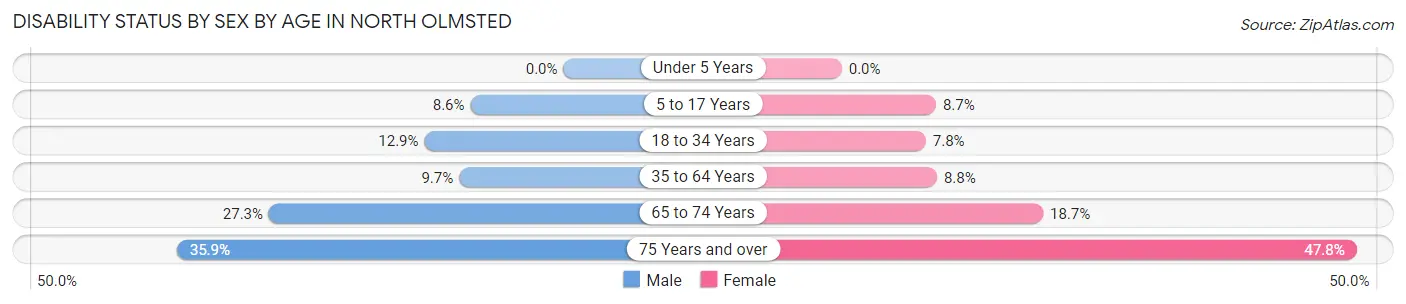
| Age Bracket | Male | Female |
| Under 5 Years | 0 (0.0%) | 0 (0.0%) |
| 5 to 17 Years | 235 (8.6%) | 258 (8.7%) |
| 18 to 34 Years | 401 (12.9%) | 206 (7.8%) |
| 35 to 64 Years | 630 (9.7%) | 557 (8.8%) |
| 65 to 74 Years | 511 (27.3%) | 342 (18.7%) |
| 75 Years and over | 400 (35.9%) | 729 (47.8%) |
Disability Class by Sex by Age in North Olmsted
Disability Class: Hearing Difficulty
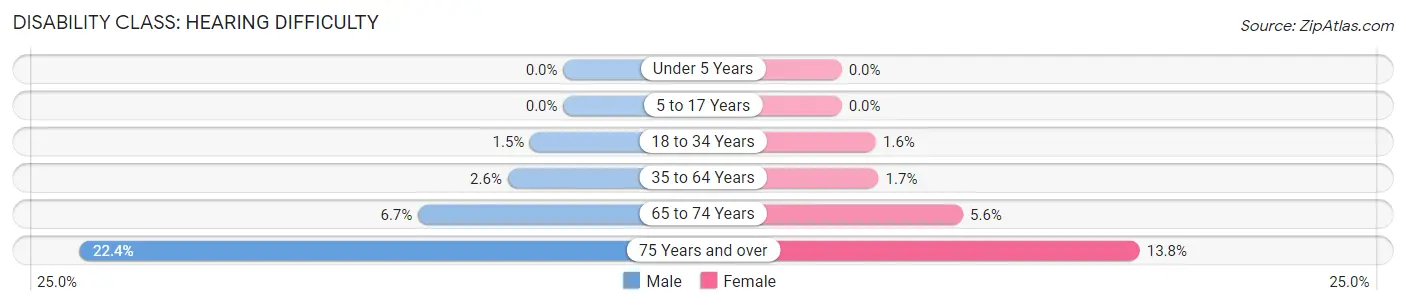
| Age Bracket | Male | Female |
| Under 5 Years | 0 (0.0%) | 0 (0.0%) |
| 5 to 17 Years | 0 (0.0%) | 0 (0.0%) |
| 18 to 34 Years | 48 (1.5%) | 42 (1.6%) |
| 35 to 64 Years | 168 (2.6%) | 108 (1.7%) |
| 65 to 74 Years | 126 (6.7%) | 103 (5.6%) |
| 75 Years and over | 250 (22.4%) | 211 (13.8%) |
Disability Class: Vision Difficulty
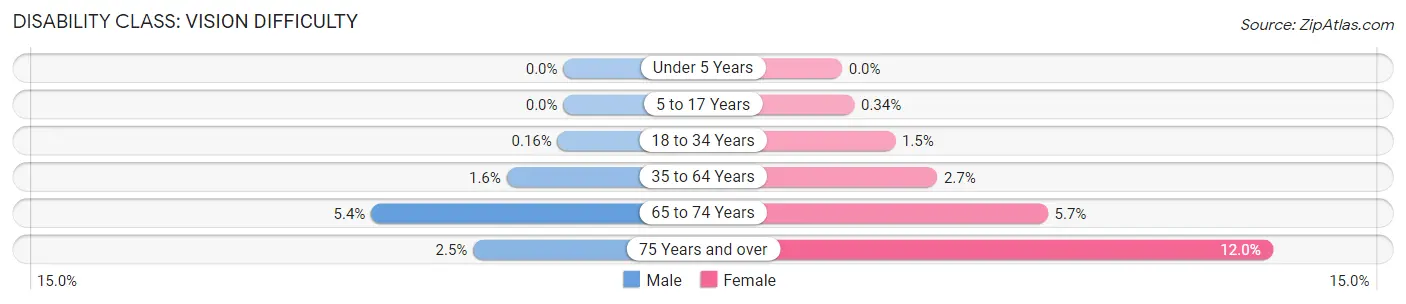
| Age Bracket | Male | Female |
| Under 5 Years | 0 (0.0%) | 0 (0.0%) |
| 5 to 17 Years | 0 (0.0%) | 10 (0.3%) |
| 18 to 34 Years | 5 (0.2%) | 39 (1.5%) |
| 35 to 64 Years | 103 (1.6%) | 167 (2.6%) |
| 65 to 74 Years | 100 (5.3%) | 105 (5.7%) |
| 75 Years and over | 28 (2.5%) | 183 (12.0%) |
Disability Class: Cognitive Difficulty
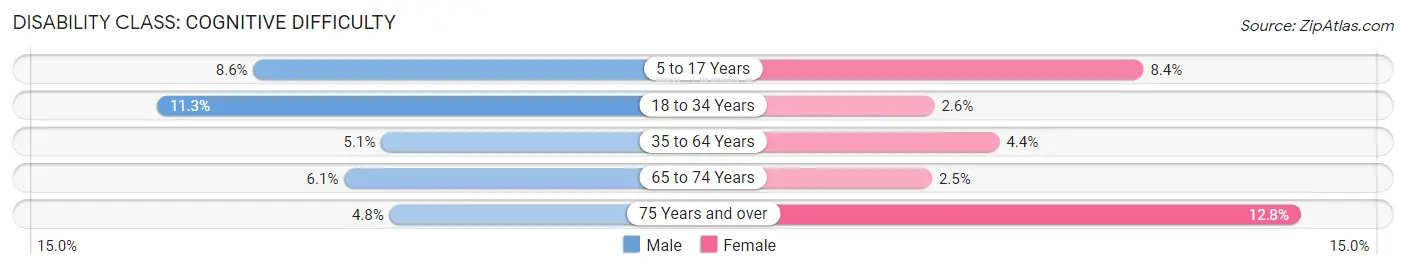
| Age Bracket | Male | Female |
| 5 to 17 Years | 235 (8.6%) | 248 (8.4%) |
| 18 to 34 Years | 352 (11.3%) | 68 (2.6%) |
| 35 to 64 Years | 330 (5.1%) | 277 (4.4%) |
| 65 to 74 Years | 114 (6.1%) | 46 (2.5%) |
| 75 Years and over | 54 (4.8%) | 195 (12.8%) |
Disability Class: Ambulatory Difficulty
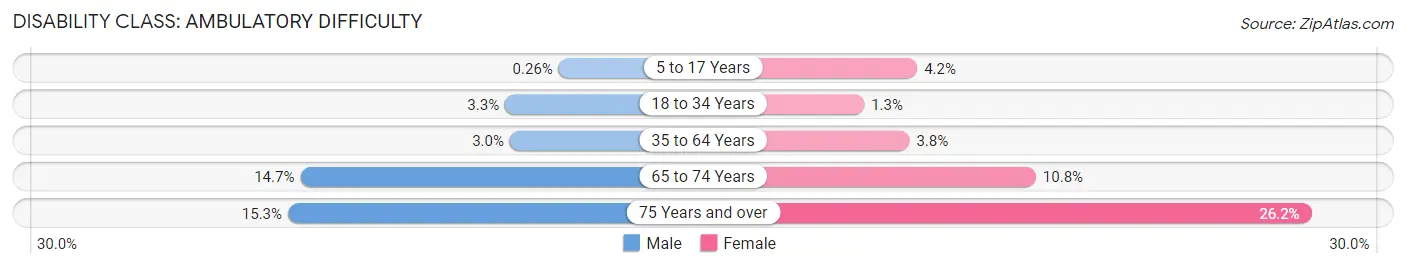
| Age Bracket | Male | Female |
| 5 to 17 Years | 7 (0.3%) | 124 (4.2%) |
| 18 to 34 Years | 101 (3.3%) | 33 (1.3%) |
| 35 to 64 Years | 194 (3.0%) | 238 (3.8%) |
| 65 to 74 Years | 274 (14.6%) | 198 (10.8%) |
| 75 Years and over | 171 (15.3%) | 399 (26.2%) |
Disability Class: Self-Care Difficulty
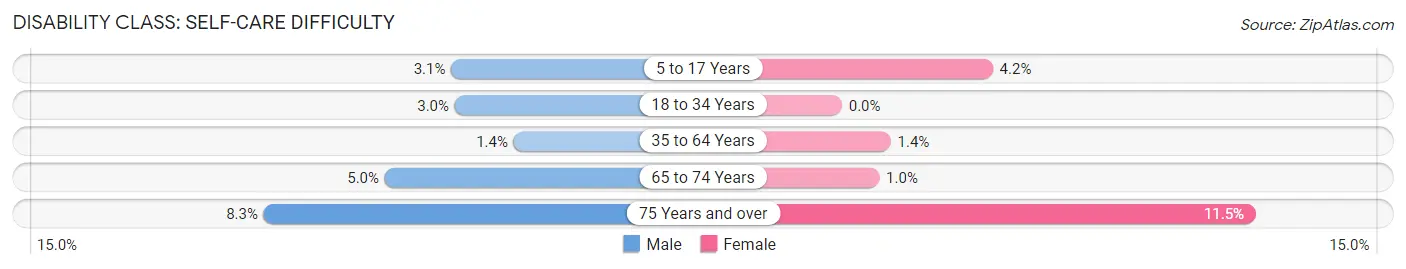
| Age Bracket | Male | Female |
| 5 to 17 Years | 85 (3.1%) | 124 (4.2%) |
| 18 to 34 Years | 94 (3.0%) | 0 (0.0%) |
| 35 to 64 Years | 90 (1.4%) | 86 (1.4%) |
| 65 to 74 Years | 93 (5.0%) | 19 (1.0%) |
| 75 Years and over | 93 (8.3%) | 176 (11.5%) |
Technology Access in North Olmsted
Computing Device Access in North Olmsted
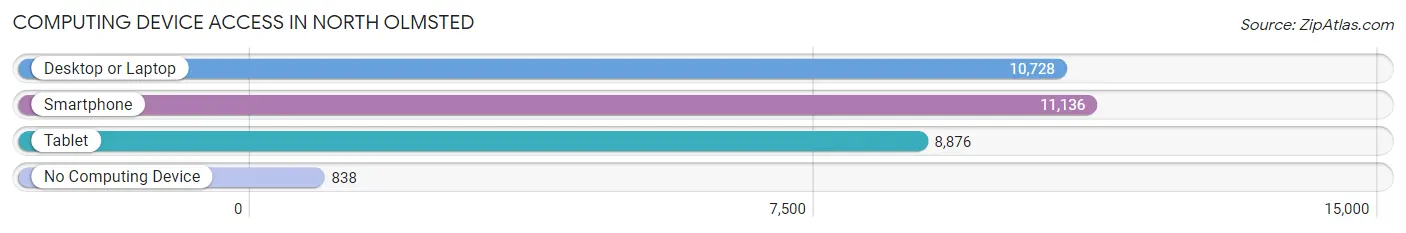
| Device Type | # Households | % Households |
| Desktop or Laptop | 10,728 | 81.6% |
| Smartphone | 11,136 | 84.8% |
| Tablet | 8,876 | 67.5% |
| No Computing Device | 838 | 6.4% |
| Total | 13,140 | 100.0% |
Internet Access in North Olmsted
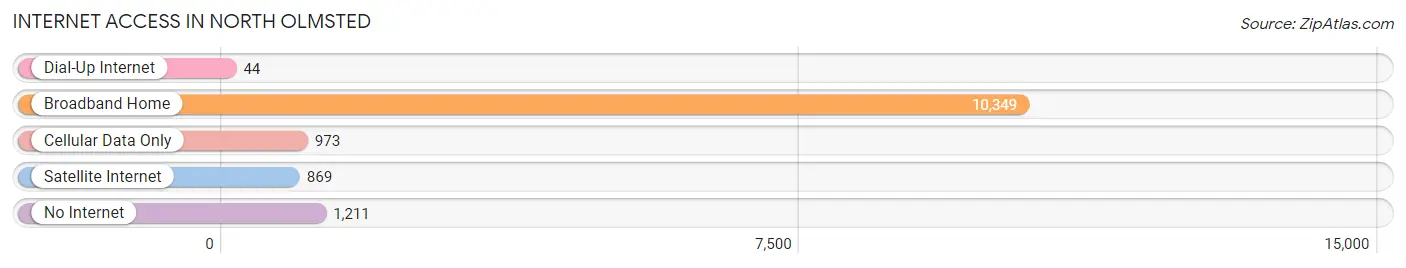
| Internet Type | # Households | % Households |
| Dial-Up Internet | 44 | 0.3% |
| Broadband Home | 10,349 | 78.8% |
| Cellular Data Only | 973 | 7.4% |
| Satellite Internet | 869 | 6.6% |
| No Internet | 1,211 | 9.2% |
| Total | 13,140 | 100.0% |
North Olmsted Summary
History
North Olmsted is a city located in Cuyahoga County, Ohio, United States. It is a suburb of Cleveland and is located on the western edge of the county. The city was founded in 1815 and was originally known as Dover Township. The city was named after its first settler, John North, who arrived in 1810. North Olmsted was incorporated as a village in 1874 and as a city in 1960.
The city has a rich history that dates back to the early 19th century. The first settlers in the area were Native Americans, who lived in the area for thousands of years before the arrival of Europeans. The first Europeans to settle in the area were the French, who established a trading post in the area in 1750. The area was later settled by the British, who established a military post in the area in 1759.
The area was later settled by German immigrants, who established farms and businesses in the area. The city was officially founded in 1815 and was named after its first settler, John North. The city grew rapidly in the late 19th and early 20th centuries, and by the 1950s, it had become a major suburb of Cleveland.
Geography
North Olmsted is located in Cuyahoga County, Ohio, United States. It is a suburb of Cleveland and is located on the western edge of the county. The city is situated on the northern shore of Lake Erie and is bordered by the cities of Westlake, Fairview Park, and Rocky River. The city has a total area of 16.2 square miles, of which 15.9 square miles is land and 0.3 square miles is water.
The city is located in the Great Lakes region and is part of the Great Lakes Megalopolis. The city is located in the humid continental climate zone and has four distinct seasons. Summers are warm and humid, while winters are cold and snowy. The city receives an average of 36 inches of precipitation per year.
Economy
North Olmsted is a major suburb of Cleveland and is home to a variety of businesses and industries. The city is home to a number of large employers, including the Cleveland Clinic, the Cleveland Metroparks Zoo, and the Cleveland Browns. The city is also home to a number of smaller businesses, including restaurants, retail stores, and professional services.
The city is also home to a number of manufacturing companies, including the North Olmsted Manufacturing Company, which produces automotive parts, and the North Olmsted Tool and Die Company, which produces industrial tools and dies. The city is also home to a number of technology companies, including the North Olmsted Technology Center, which provides IT services.
Demographics
North Olmsted is a city located in Cuyahoga County, Ohio, United States. As of the 2010 census, the city had a population of 32,718. The population density was 2,037.2 people per square mile. The racial makeup of the city was 87.2% White, 8.2% African American, 0.3% Native American, 1.7% Asian, 0.1% Pacific Islander, 0.7% from other races, and 1.9% from two or more races. Hispanic or Latino of any race were 2.7% of the population.
The median income for a household in the city was $50,945, and the median income for a family was $60,945. The per capita income for the city was $25,945. About 4.2% of families and 5.7% of the population were below the poverty line, including 7.2% of those under age 18 and 4.2% of those age 65 or over.
Common Questions
What is Per Capita Income in North Olmsted?
Per Capita income in North Olmsted is $42,502.
What is the Median Family Income in North Olmsted?
Median Family Income in North Olmsted is $97,259.
What is the Median Household income in North Olmsted?
Median Household Income in North Olmsted is $81,768.
What is Income or Wage Gap in North Olmsted?
Income or Wage Gap in North Olmsted is 29.8%.
Women in North Olmsted earn 70.2 cents for every dollar earned by a man.
What is Inequality or Gini Index in North Olmsted?
Inequality or Gini Index in North Olmsted is 0.43.
What is the Total Population of North Olmsted?
Total Population of North Olmsted is 32,244.
What is the Total Male Population of North Olmsted?
Total Male Population of North Olmsted is 16,164.
What is the Total Female Population of North Olmsted?
Total Female Population of North Olmsted is 16,080.
What is the Ratio of Males per 100 Females in North Olmsted?
There are 100.52 Males per 100 Females in North Olmsted.
What is the Ratio of Females per 100 Males in North Olmsted?
There are 99.48 Females per 100 Males in North Olmsted.
What is the Median Population Age in North Olmsted?
Median Population Age in North Olmsted is 44.0 Years.
What is the Average Family Size in North Olmsted
Average Family Size in North Olmsted is 3.1 People.
What is the Average Household Size in North Olmsted
Average Household Size in North Olmsted is 2.4 People.
How Large is the Labor Force in North Olmsted?
There are 17,053 People in the Labor Forcein in North Olmsted.
What is the Percentage of People in the Labor Force in North Olmsted?
65.4% of People are in the Labor Force in North Olmsted.
What is the Unemployment Rate in North Olmsted?
Unemployment Rate in North Olmsted is 3.1%.