Conroe, TX Map & Demographics
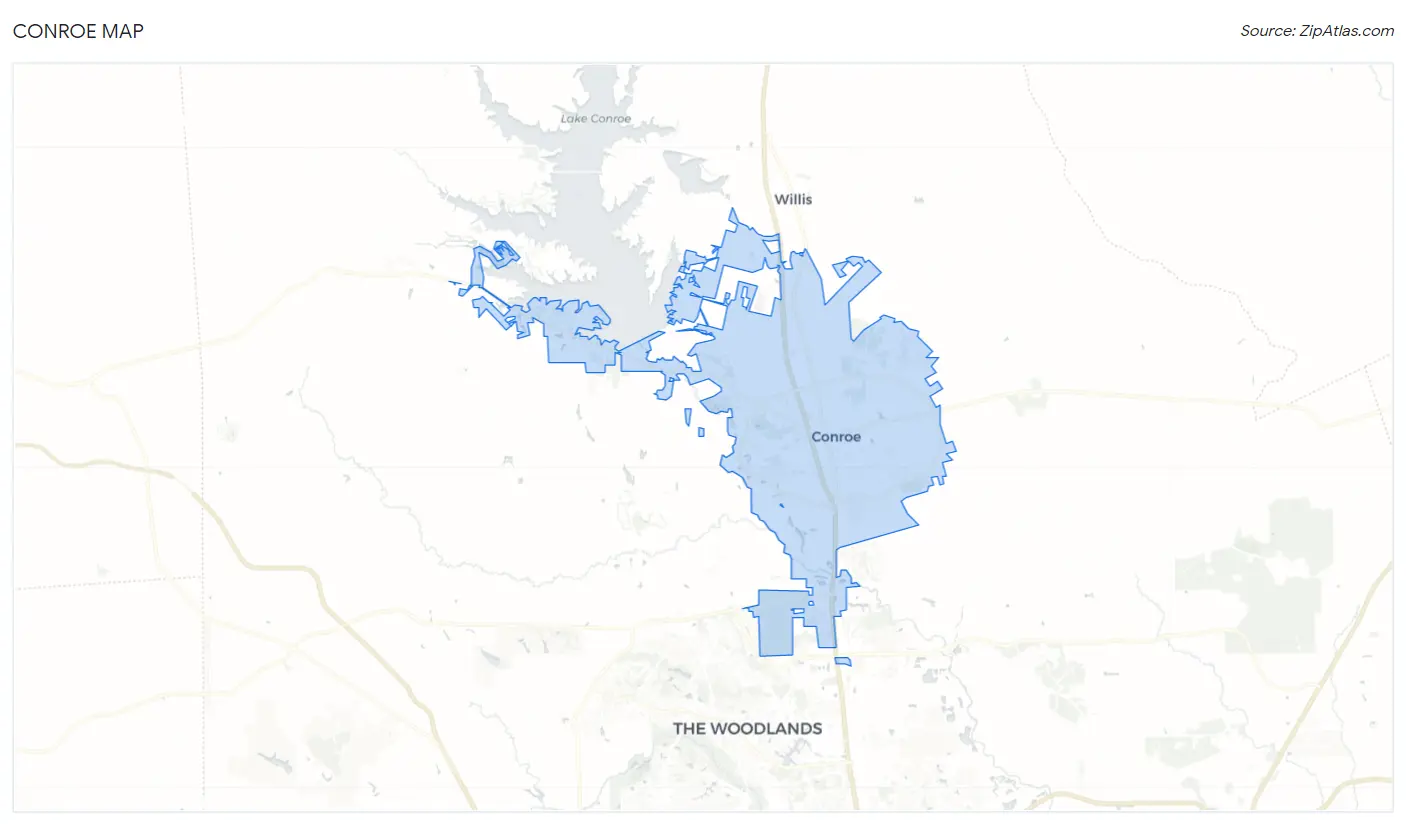
Conroe Map
Conroe Overview
$37,839
PER CAPITA INCOME
$87,122
AVG FAMILY INCOME
$71,630
AVG HOUSEHOLD INCOME
32.2%
WAGE / INCOME GAP [ % ]
67.8¢/ $1
WAGE / INCOME GAP [ $ ]
$9,150
FAMILY INCOME DEFICIT
0.46
INEQUALITY / GINI INDEX
92,475
TOTAL POPULATION
46,386
MALE POPULATION
46,089
FEMALE POPULATION
100.64
MALES / 100 FEMALES
99.36
FEMALES / 100 MALES
33.5
MEDIAN AGE
3.2
AVG FAMILY SIZE
2.6
AVG HOUSEHOLD SIZE
46,480
LABOR FORCE [ PEOPLE ]
64.5%
PERCENT IN LABOR FORCE
3.4%
UNEMPLOYMENT RATE
Income in Conroe
Income Overview in Conroe
Per Capita Income in Conroe is $37,839, while median incomes of families and households are $87,122 and $71,630 respectively.
| Characteristic | Number | Measure |
| Per Capita Income | 92,475 | $37,839 |
| Median Family Income | 23,102 | $87,122 |
| Mean Family Income | 23,102 | $113,865 |
| Median Household Income | 35,433 | $71,630 |
| Mean Household Income | 35,433 | $97,669 |
| Income Deficit | 23,102 | $9,150 |
| Wage / Income Gap (%) | 92,475 | 32.16% |
| Wage / Income Gap ($) | 92,475 | 67.84¢ per $1 |
| Gini / Inequality Index | 92,475 | 0.46 |
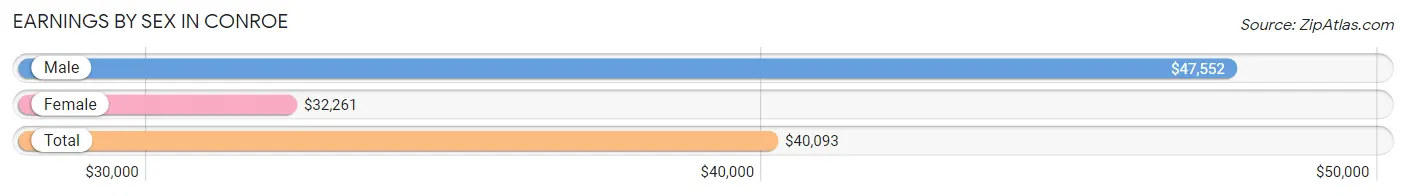
Earnings by Sex in Conroe
Average Earnings in Conroe are $40,093, $47,552 for men and $32,261 for women, a difference of 32.2%.
| Sex | Number | Average Earnings |
| Male | 26,586 (55.0%) | $47,552 |
| Female | 21,783 (45.0%) | $32,261 |
| Total | 48,369 (100.0%) | $40,093 |
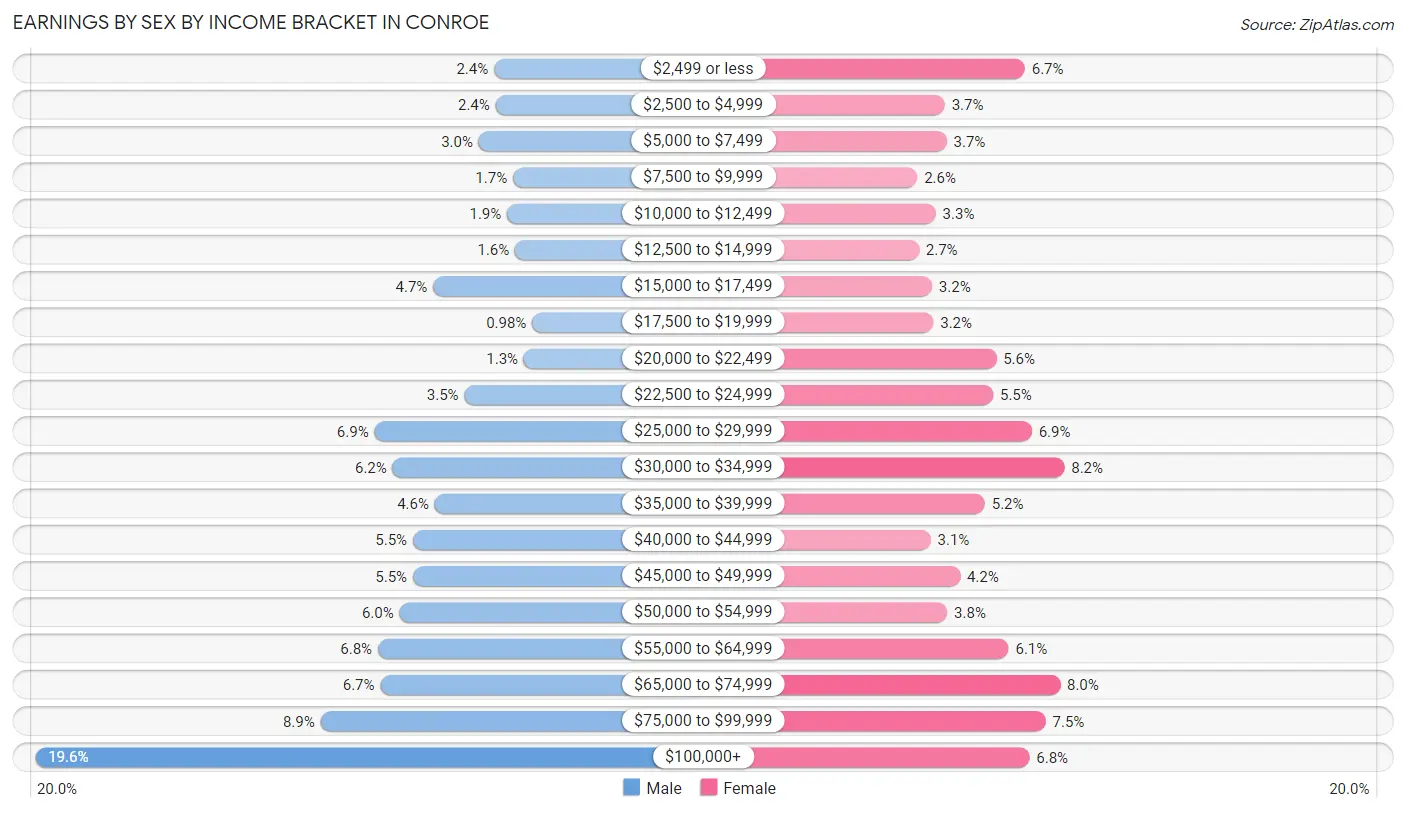
Earnings by Sex by Income Bracket in Conroe
The most common earnings brackets in Conroe are $100,000+ for men (5,212 | 19.6%) and $30,000 to $34,999 for women (1,775 | 8.2%).
| Income | Male | Female |
| $2,499 or less | 642 (2.4%) | 1,452 (6.7%) |
| $2,500 to $4,999 | 625 (2.4%) | 800 (3.7%) |
| $5,000 to $7,499 | 791 (3.0%) | 815 (3.7%) |
| $7,500 to $9,999 | 451 (1.7%) | 576 (2.6%) |
| $10,000 to $12,499 | 510 (1.9%) | 726 (3.3%) |
| $12,500 to $14,999 | 432 (1.6%) | 588 (2.7%) |
| $15,000 to $17,499 | 1,248 (4.7%) | 695 (3.2%) |
| $17,500 to $19,999 | 261 (1.0%) | 705 (3.2%) |
| $20,000 to $22,499 | 342 (1.3%) | 1,220 (5.6%) |
| $22,500 to $24,999 | 937 (3.5%) | 1,194 (5.5%) |
| $25,000 to $29,999 | 1,833 (6.9%) | 1,509 (6.9%) |
| $30,000 to $34,999 | 1,651 (6.2%) | 1,775 (8.2%) |
| $35,000 to $39,999 | 1,232 (4.6%) | 1,126 (5.2%) |
| $40,000 to $44,999 | 1,450 (5.4%) | 684 (3.1%) |
| $45,000 to $49,999 | 1,450 (5.4%) | 923 (4.2%) |
| $50,000 to $54,999 | 1,581 (5.9%) | 820 (3.8%) |
| $55,000 to $64,999 | 1,796 (6.8%) | 1,321 (6.1%) |
| $65,000 to $74,999 | 1,772 (6.7%) | 1,740 (8.0%) |
| $75,000 to $99,999 | 2,370 (8.9%) | 1,623 (7.4%) |
| $100,000+ | 5,212 (19.6%) | 1,491 (6.8%) |
| Total | 26,586 (100.0%) | 21,783 (100.0%) |
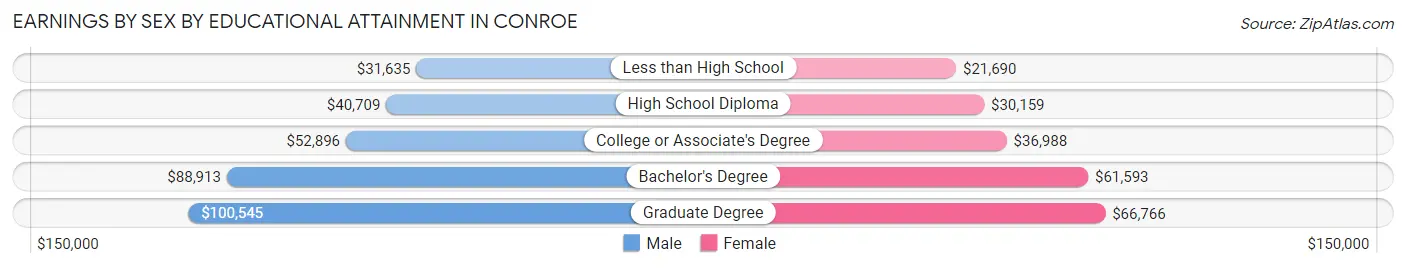
Earnings by Sex by Educational Attainment in Conroe
Average earnings in Conroe are $53,034 for men and $38,620 for women, a difference of 27.2%. Men with an educational attainment of graduate degree enjoy the highest average annual earnings of $100,545, while those with less than high school education earn the least with $31,635. Women with an educational attainment of graduate degree earn the most with the average annual earnings of $66,766, while those with less than high school education have the smallest earnings of $21,690.
| Educational Attainment | Male Income | Female Income |
| Less than High School | $31,635 | $21,690 |
| High School Diploma | $40,709 | $30,159 |
| College or Associate's Degree | $52,896 | $36,988 |
| Bachelor's Degree | $88,913 | $61,593 |
| Graduate Degree | $100,545 | $66,766 |
| Total | $53,034 | $38,620 |
Family Income in Conroe
Family Income Brackets in Conroe
According to the Conroe family income data, there are 4,898 families falling into the $100,000 to $149,999 income range, which is the most common income bracket and makes up 21.2% of all families. Conversely, the $10,000 to $14,999 income bracket is the least frequent group with only 393 families (1.7%) belonging to this category.
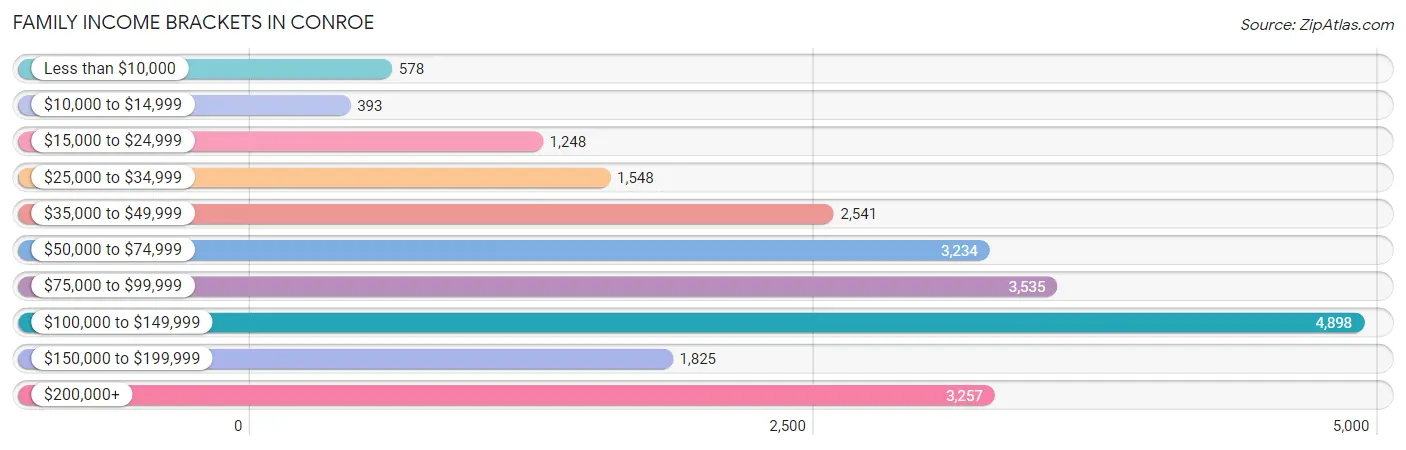
| Income Bracket | # Families | % Families |
| Less than $10,000 | 578 | 2.5% |
| $10,000 to $14,999 | 393 | 1.7% |
| $15,000 to $24,999 | 1,248 | 5.4% |
| $25,000 to $34,999 | 1,548 | 6.7% |
| $35,000 to $49,999 | 2,541 | 11.0% |
| $50,000 to $74,999 | 3,234 | 14.0% |
| $75,000 to $99,999 | 3,535 | 15.3% |
| $100,000 to $149,999 | 4,898 | 21.2% |
| $150,000 to $199,999 | 1,825 | 7.9% |
| $200,000+ | 3,257 | 14.1% |
Family Income by Famaliy Size in Conroe
7+ person families (310 | 1.3%) account for the highest median family income in Conroe with $125,660 per family, while 2-person families (10,042 | 43.5%) have the highest median income of $39,830 per family member.
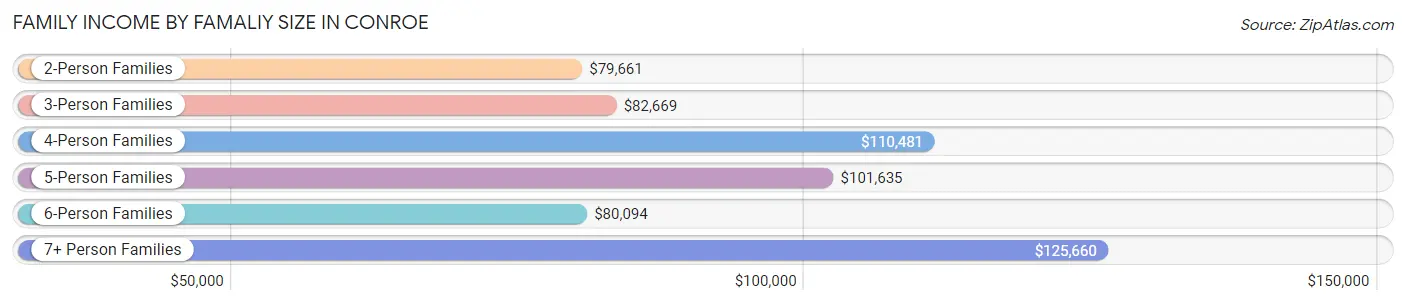
| Income Bracket | # Families | Median Income |
| 2-Person Families | 10,042 (43.5%) | $79,661 |
| 3-Person Families | 5,659 (24.5%) | $82,669 |
| 4-Person Families | 3,876 (16.8%) | $110,481 |
| 5-Person Families | 2,313 (10.0%) | $101,635 |
| 6-Person Families | 902 (3.9%) | $80,094 |
| 7+ Person Families | 310 (1.3%) | $125,660 |
| Total | 23,102 (100.0%) | $87,122 |
Family Income by Number of Earners in Conroe
The median family income in Conroe is $87,122, with families comprising 3+ earners (2,511) having the highest median family income of $115,187, while families with 1 earner (8,466) have the lowest median family income of $58,317, accounting for 10.9% and 36.6% of families, respectively.
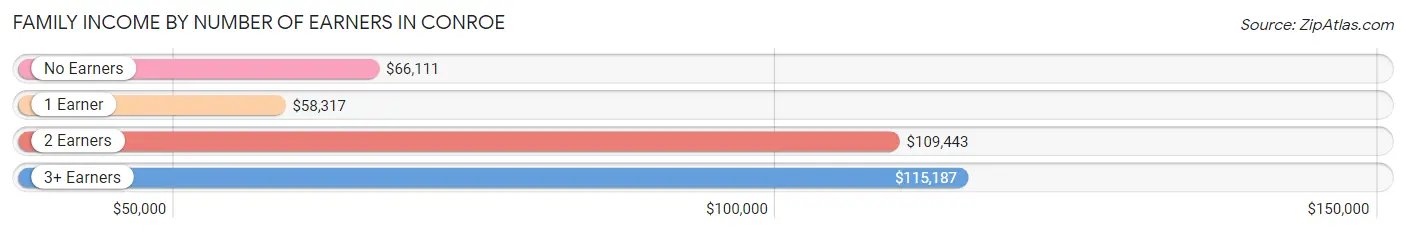
| Number of Earners | # Families | Median Income |
| No Earners | 3,286 (14.2%) | $66,111 |
| 1 Earner | 8,466 (36.6%) | $58,317 |
| 2 Earners | 8,839 (38.3%) | $109,443 |
| 3+ Earners | 2,511 (10.9%) | $115,187 |
| Total | 23,102 (100.0%) | $87,122 |
Household Income in Conroe
Household Income Brackets in Conroe
With 6,165 households falling in the category, the $50,000 to $74,999 income range is the most frequent in Conroe, accounting for 17.4% of all households. In contrast, only 567 households (1.6%) fall into the $10,000 to $14,999 income bracket, making it the least populous group.
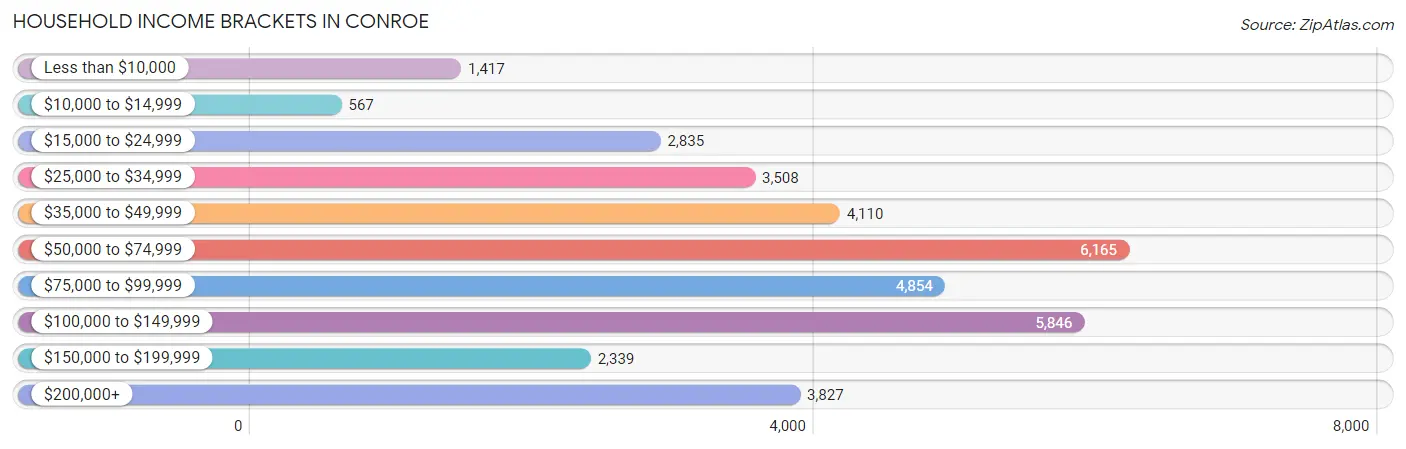
| Income Bracket | # Households | % Households |
| Less than $10,000 | 1,417 | 4.0% |
| $10,000 to $14,999 | 567 | 1.6% |
| $15,000 to $24,999 | 2,835 | 8.0% |
| $25,000 to $34,999 | 3,508 | 9.9% |
| $35,000 to $49,999 | 4,110 | 11.6% |
| $50,000 to $74,999 | 6,165 | 17.4% |
| $75,000 to $99,999 | 4,854 | 13.7% |
| $100,000 to $149,999 | 5,846 | 16.5% |
| $150,000 to $199,999 | 2,339 | 6.6% |
| $200,000+ | 3,827 | 10.8% |
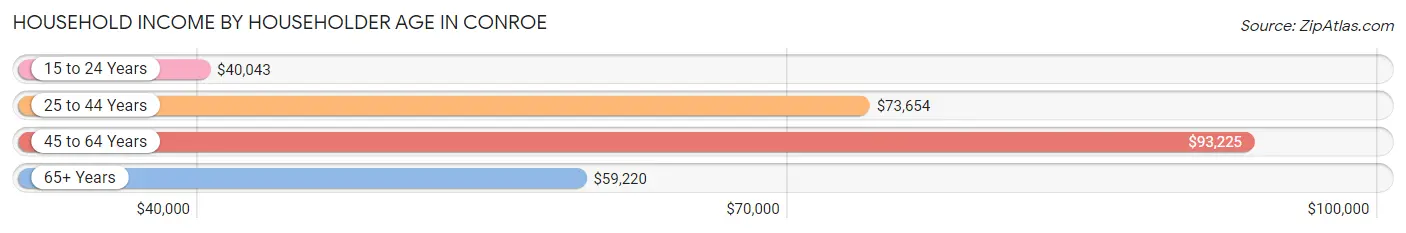
Household Income by Householder Age in Conroe
The median household income in Conroe is $71,630, with the highest median household income of $93,225 found in the 45 to 64 years age bracket for the primary householder. A total of 10,593 households (29.9%) fall into this category. Meanwhile, the 15 to 24 years age bracket for the primary householder has the lowest median household income of $40,043, with 2,937 households (8.3%) in this group.
| Income Bracket | # Households | Median Income |
| 15 to 24 Years | 2,937 (8.3%) | $40,043 |
| 25 to 44 Years | 13,844 (39.1%) | $73,654 |
| 45 to 64 Years | 10,593 (29.9%) | $93,225 |
| 65+ Years | 8,059 (22.7%) | $59,220 |
| Total | 35,433 (100.0%) | $71,630 |
Poverty in Conroe
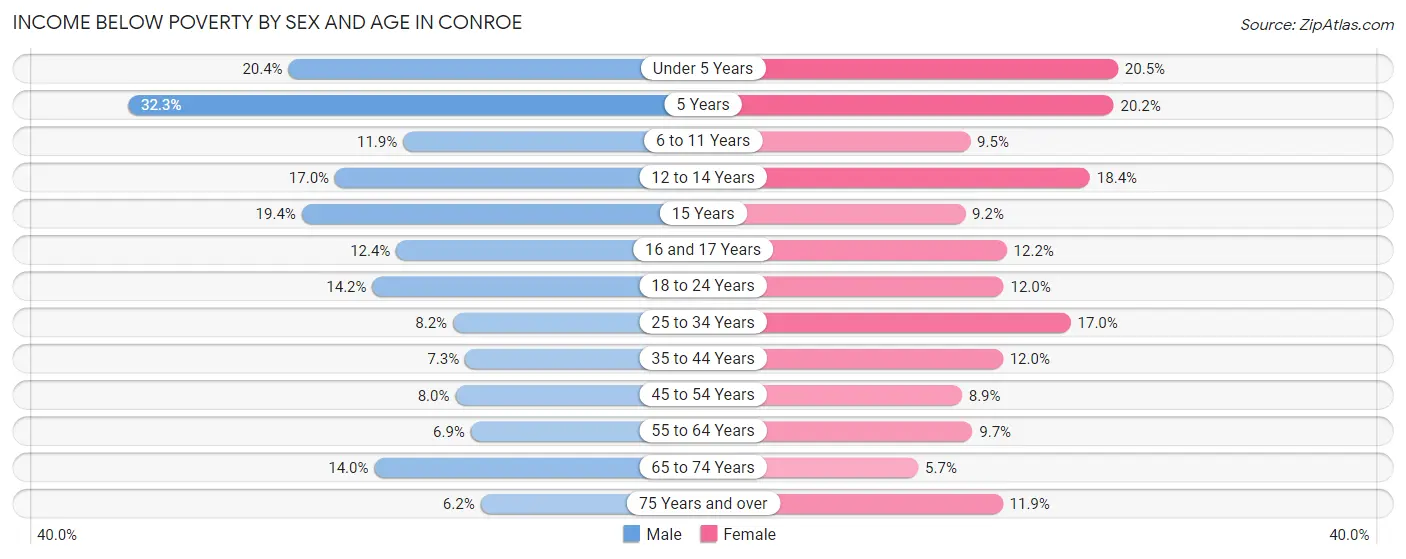
Income Below Poverty by Sex and Age in Conroe
With 11.2% poverty level for males and 12.4% for females among the residents of Conroe, 5 year old males and under 5 year old females are the most vulnerable to poverty, with 191 males (32.3%) and 596 females (20.5%) in their respective age groups living below the poverty level.
| Age Bracket | Male | Female |
| Under 5 Years | 770 (20.4%) | 596 (20.5%) |
| 5 Years | 191 (32.3%) | 178 (20.2%) |
| 6 to 11 Years | 467 (11.9%) | 339 (9.5%) |
| 12 to 14 Years | 313 (17.0%) | 298 (18.4%) |
| 15 Years | 151 (19.4%) | 46 (9.2%) |
| 16 and 17 Years | 140 (12.4%) | 111 (12.2%) |
| 18 to 24 Years | 684 (14.2%) | 665 (12.0%) |
| 25 to 34 Years | 659 (8.2%) | 1,180 (17.0%) |
| 35 to 44 Years | 423 (7.3%) | 715 (11.9%) |
| 45 to 54 Years | 371 (8.0%) | 413 (8.9%) |
| 55 to 64 Years | 309 (6.9%) | 485 (9.7%) |
| 65 to 74 Years | 447 (14.0%) | 210 (5.7%) |
| 75 Years and over | 156 (6.1%) | 408 (11.9%) |
| Total | 5,081 (11.2%) | 5,644 (12.4%) |
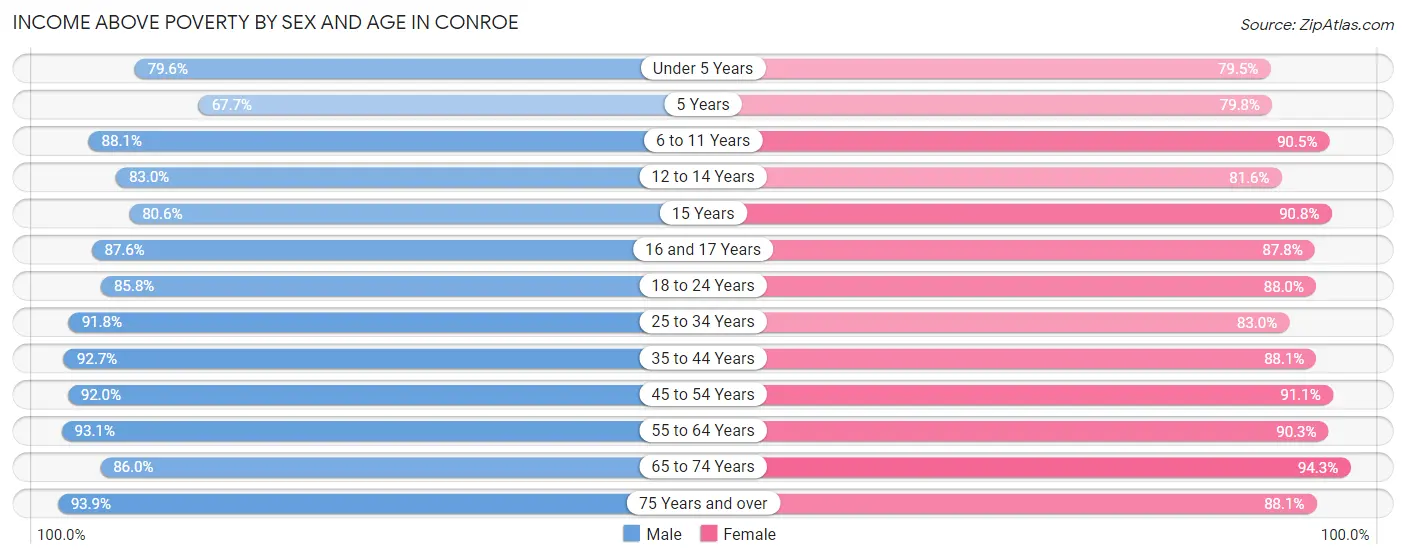
Income Above Poverty by Sex and Age in Conroe
According to the poverty statistics in Conroe, males aged 75 years and over and females aged 65 to 74 years are the age groups that are most secure financially, with 93.9% of males and 94.3% of females in these age groups living above the poverty line.
| Age Bracket | Male | Female |
| Under 5 Years | 3,003 (79.6%) | 2,312 (79.5%) |
| 5 Years | 400 (67.7%) | 704 (79.8%) |
| 6 to 11 Years | 3,457 (88.1%) | 3,218 (90.5%) |
| 12 to 14 Years | 1,533 (83.0%) | 1,320 (81.6%) |
| 15 Years | 626 (80.6%) | 456 (90.8%) |
| 16 and 17 Years | 988 (87.6%) | 796 (87.8%) |
| 18 to 24 Years | 4,140 (85.8%) | 4,870 (88.0%) |
| 25 to 34 Years | 7,379 (91.8%) | 5,766 (83.0%) |
| 35 to 44 Years | 5,369 (92.7%) | 5,266 (88.0%) |
| 45 to 54 Years | 4,255 (92.0%) | 4,224 (91.1%) |
| 55 to 64 Years | 4,185 (93.1%) | 4,522 (90.3%) |
| 65 to 74 Years | 2,736 (86.0%) | 3,496 (94.3%) |
| 75 Years and over | 2,379 (93.9%) | 3,008 (88.1%) |
| Total | 40,450 (88.8%) | 39,958 (87.6%) |
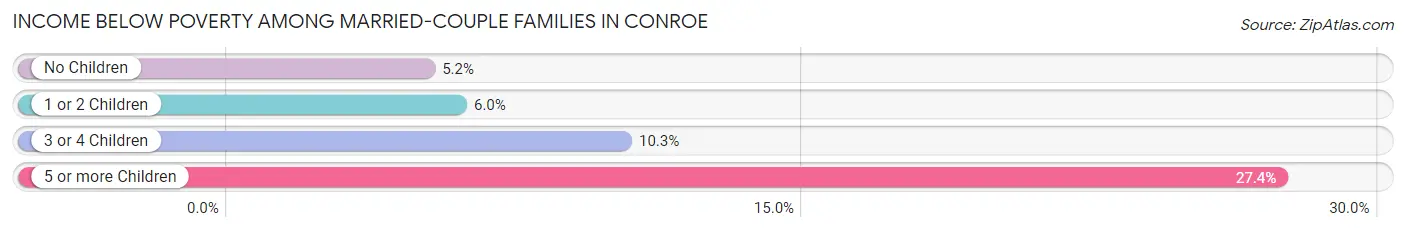
Income Below Poverty Among Married-Couple Families in Conroe
The poverty statistics for married-couple families in Conroe show that 6.1% or 1,058 of the total 17,328 families live below the poverty line. Families with 5 or more children have the highest poverty rate of 27.4%, comprising of 17 families. On the other hand, families with no children have the lowest poverty rate of 5.1%, which includes 476 families.
| Children | Above Poverty | Below Poverty |
| No Children | 8,775 (94.9%) | 476 (5.1%) |
| 1 or 2 Children | 5,672 (94.0%) | 361 (6.0%) |
| 3 or 4 Children | 1,778 (89.7%) | 204 (10.3%) |
| 5 or more Children | 45 (72.6%) | 17 (27.4%) |
| Total | 16,270 (93.9%) | 1,058 (6.1%) |
Income Below Poverty Among Single-Parent Households in Conroe
According to the poverty data in Conroe, 10.6% or 224 single-father households and 26.5% or 969 single-mother households are living below the poverty line. Among single-father households, those with 5 or more children have the highest poverty rate, with 32 households (66.7%) experiencing poverty. Likewise, among single-mother households, those with 5 or more children have the highest poverty rate, with 25 households (100.0%) falling below the poverty line.
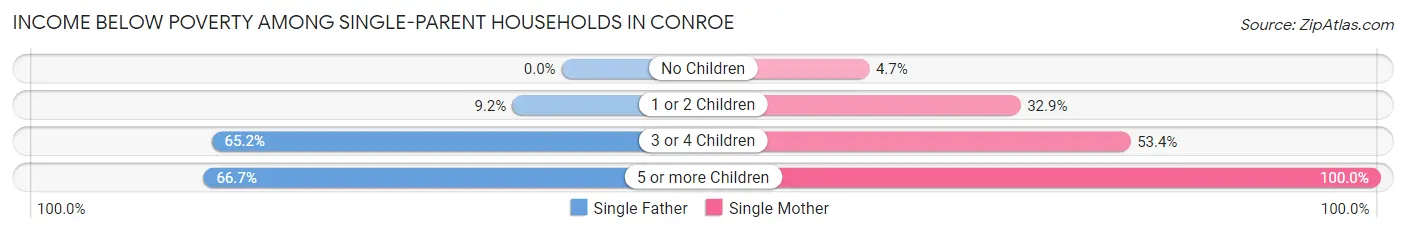
| Children | Single Father | Single Mother |
| No Children | 0 (0.0%) | 56 (4.7%) |
| 1 or 2 Children | 106 (9.2%) | 674 (32.9%) |
| 3 or 4 Children | 86 (65.1%) | 214 (53.4%) |
| 5 or more Children | 32 (66.7%) | 25 (100.0%) |
| Total | 224 (10.6%) | 969 (26.5%) |
Income Below Poverty Among Married-Couple vs Single-Parent Households in Conroe
The poverty data for Conroe shows that 1,058 of the married-couple family households (6.1%) and 1,193 of the single-parent households (20.7%) are living below the poverty level. Within the married-couple family households, those with 5 or more children have the highest poverty rate, with 17 households (27.4%) falling below the poverty line. Among the single-parent households, those with 5 or more children have the highest poverty rate, with 57 household (78.1%) living below poverty.
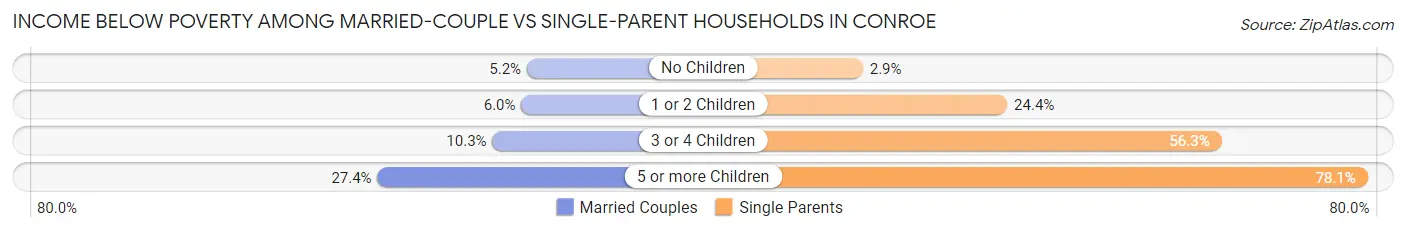
| Children | Married-Couple Families | Single-Parent Households |
| No Children | 476 (5.1%) | 56 (2.9%) |
| 1 or 2 Children | 361 (6.0%) | 780 (24.4%) |
| 3 or 4 Children | 204 (10.3%) | 300 (56.3%) |
| 5 or more Children | 17 (27.4%) | 57 (78.1%) |
| Total | 1,058 (6.1%) | 1,193 (20.7%) |
Race in Conroe
The most populous races in Conroe are White / Caucasian (63,058 | 68.2%), Hispanic or Latino (26,806 | 29.0%), and Black / African American (10,522 | 11.4%).
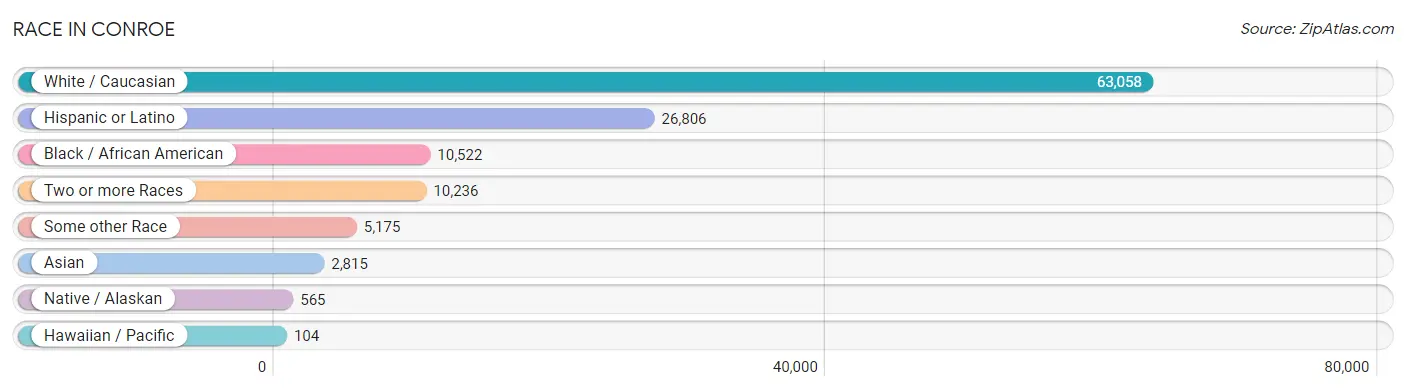
| Race | # Population | % Population |
| Asian | 2,815 | 3.0% |
| Black / African American | 10,522 | 11.4% |
| Hawaiian / Pacific | 104 | 0.1% |
| Hispanic or Latino | 26,806 | 29.0% |
| Native / Alaskan | 565 | 0.6% |
| White / Caucasian | 63,058 | 68.2% |
| Two or more Races | 10,236 | 11.1% |
| Some other Race | 5,175 | 5.6% |
| Total | 92,475 | 100.0% |
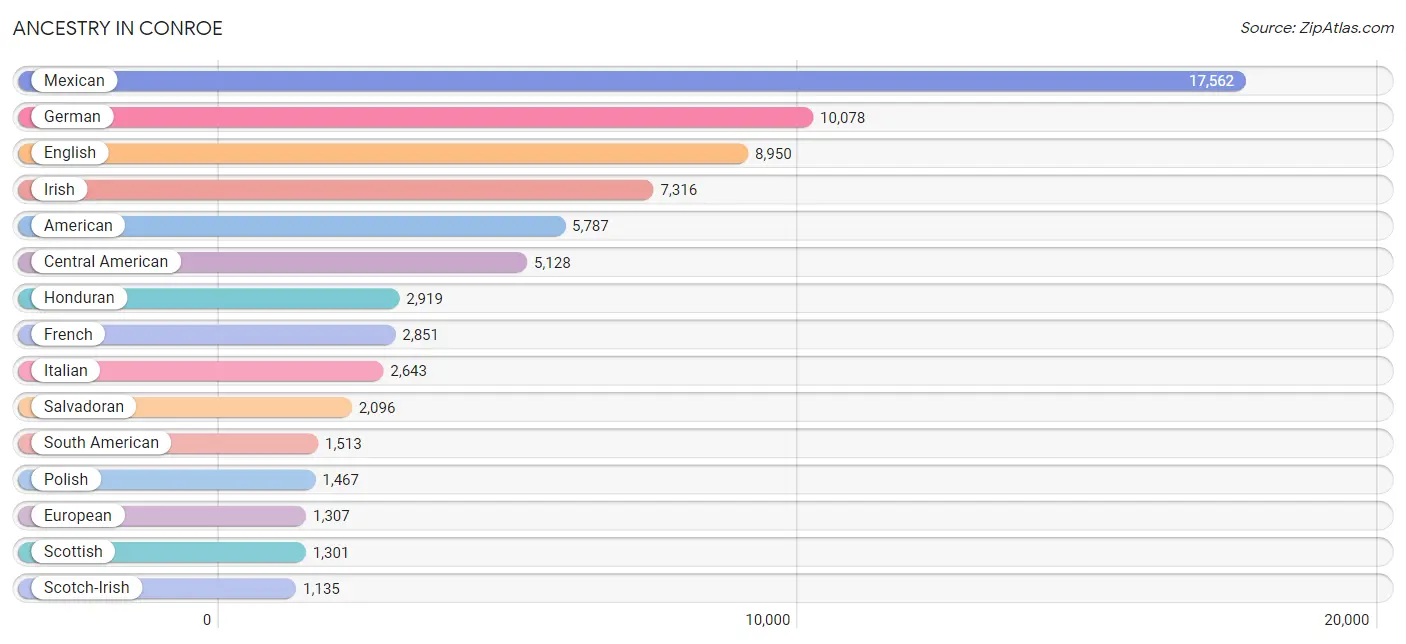
Ancestry in Conroe
The most populous ancestries reported in Conroe are Mexican (17,562 | 19.0%), German (10,078 | 10.9%), English (8,950 | 9.7%), Irish (7,316 | 7.9%), and American (5,787 | 6.3%), together accounting for 53.7% of all Conroe residents.
| Ancestry | # Population | % Population |
| African | 285 | 0.3% |
| Alsatian | 11 | 0.0% |
| American | 5,787 | 6.3% |
| Apache | 68 | 0.1% |
| Arab | 371 | 0.4% |
| Argentinean | 19 | 0.0% |
| Austrian | 101 | 0.1% |
| Basque | 71 | 0.1% |
| Belgian | 22 | 0.0% |
| Belizean | 24 | 0.0% |
| Bhutanese | 270 | 0.3% |
| Brazilian | 43 | 0.1% |
| British | 368 | 0.4% |
| British West Indian | 9 | 0.0% |
| Burmese | 144 | 0.2% |
| Cajun | 41 | 0.0% |
| Canadian | 92 | 0.1% |
| Cape Verdean | 28 | 0.0% |
| Celtic | 24 | 0.0% |
| Central American | 5,128 | 5.6% |
| Central American Indian | 124 | 0.1% |
| Cherokee | 386 | 0.4% |
| Chickasaw | 20 | 0.0% |
| Choctaw | 60 | 0.1% |
| Colombian | 746 | 0.8% |
| Comanche | 9 | 0.0% |
| Creek | 29 | 0.0% |
| Croatian | 22 | 0.0% |
| Cuban | 221 | 0.2% |
| Czech | 530 | 0.6% |
| Czechoslovakian | 93 | 0.1% |
| Danish | 36 | 0.0% |
| Dominican | 94 | 0.1% |
| Dutch | 796 | 0.9% |
| Eastern European | 51 | 0.1% |
| Ecuadorian | 24 | 0.0% |
| Egyptian | 247 | 0.3% |
| English | 8,950 | 9.7% |
| European | 1,307 | 1.4% |
| Fijian | 10 | 0.0% |
| Finnish | 70 | 0.1% |
| French | 2,851 | 3.1% |
| French Canadian | 67 | 0.1% |
| German | 10,078 | 10.9% |
| Greek | 91 | 0.1% |
| Guamanian / Chamorro | 199 | 0.2% |
| Guatemalan | 35 | 0.0% |
| Guyanese | 14 | 0.0% |
| Honduran | 2,919 | 3.2% |
| Hungarian | 181 | 0.2% |
| Icelander | 65 | 0.1% |
| Indian (Asian) | 313 | 0.3% |
| Iranian | 159 | 0.2% |
| Irish | 7,316 | 7.9% |
| Italian | 2,643 | 2.9% |
| Jamaican | 64 | 0.1% |
| Jordanian | 59 | 0.1% |
| Kenyan | 407 | 0.4% |
| Korean | 1,041 | 1.1% |
| Lebanese | 7 | 0.0% |
| Mexican | 17,562 | 19.0% |
| Mexican American Indian | 228 | 0.3% |
| Native Hawaiian | 18 | 0.0% |
| Nigerian | 272 | 0.3% |
| Northern European | 10 | 0.0% |
| Norwegian | 481 | 0.5% |
| Pakistani | 23 | 0.0% |
| Palestinian | 42 | 0.1% |
| Panamanian | 78 | 0.1% |
| Pennsylvania German | 19 | 0.0% |
| Peruvian | 252 | 0.3% |
| Polish | 1,467 | 1.6% |
| Portuguese | 242 | 0.3% |
| Pueblo | 10 | 0.0% |
| Puerto Rican | 696 | 0.7% |
| Romanian | 11 | 0.0% |
| Russian | 311 | 0.3% |
| Salvadoran | 2,096 | 2.3% |
| Samoan | 19 | 0.0% |
| Scandinavian | 149 | 0.2% |
| Scotch-Irish | 1,135 | 1.2% |
| Scottish | 1,301 | 1.4% |
| Slovak | 13 | 0.0% |
| Slovene | 70 | 0.1% |
| South American | 1,513 | 1.6% |
| Spaniard | 136 | 0.2% |
| Spanish | 94 | 0.1% |
| Sri Lankan | 212 | 0.2% |
| Subsaharan African | 1,028 | 1.1% |
| Swedish | 831 | 0.9% |
| Swiss | 143 | 0.2% |
| Thai | 848 | 0.9% |
| Ukrainian | 42 | 0.1% |
| Uruguayan | 13 | 0.0% |
| Venezuelan | 459 | 0.5% |
| Welsh | 547 | 0.6% | View All 96 Rows |
Immigrants in Conroe
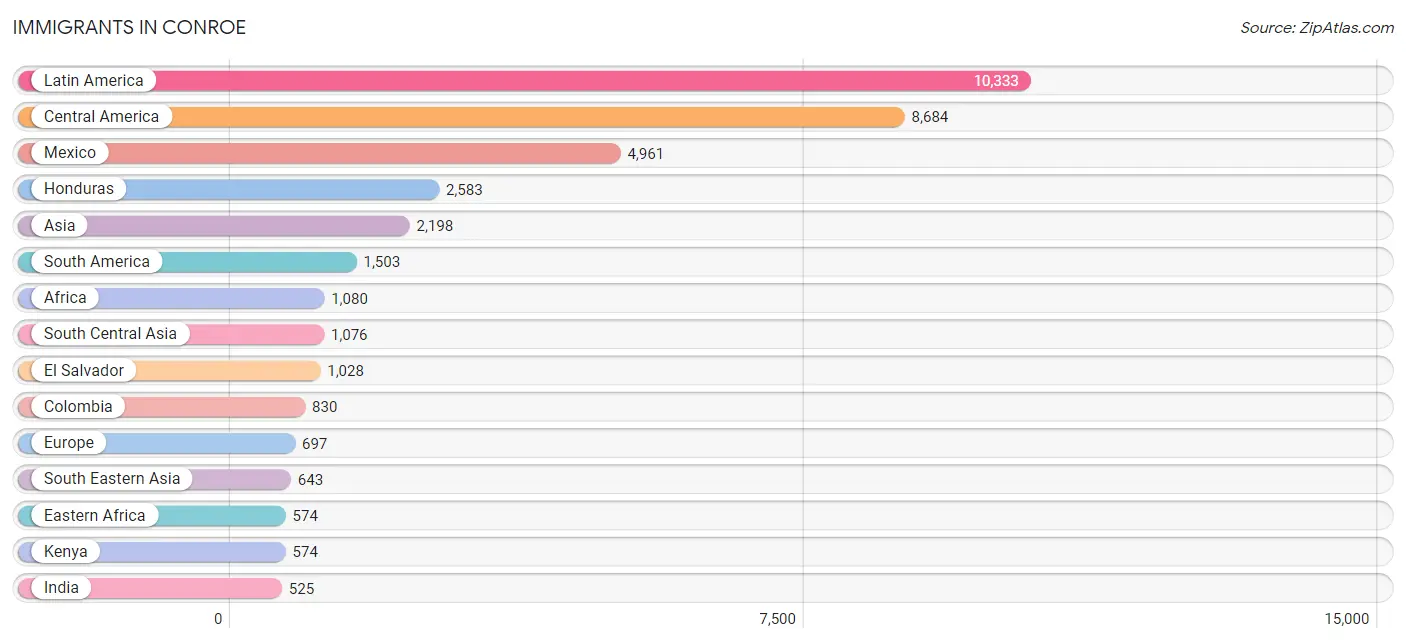
The most numerous immigrant groups reported in Conroe came from Latin America (10,333 | 11.2%), Central America (8,684 | 9.4%), Mexico (4,961 | 5.4%), Honduras (2,583 | 2.8%), and Asia (2,198 | 2.4%), together accounting for 31.1% of all Conroe residents.
| Immigration Origin | # Population | % Population |
| Africa | 1,080 | 1.2% |
| Argentina | 21 | 0.0% |
| Asia | 2,198 | 2.4% |
| Belgium | 22 | 0.0% |
| Belize | 42 | 0.1% |
| Brazil | 58 | 0.1% |
| Canada | 93 | 0.1% |
| Caribbean | 146 | 0.2% |
| Central America | 8,684 | 9.4% |
| China | 156 | 0.2% |
| Colombia | 830 | 0.9% |
| Cuba | 67 | 0.1% |
| Dominica | 23 | 0.0% |
| Dominican Republic | 15 | 0.0% |
| Eastern Africa | 574 | 0.6% |
| Eastern Asia | 437 | 0.5% |
| Eastern Europe | 152 | 0.2% |
| Egypt | 17 | 0.0% |
| El Salvador | 1,028 | 1.1% |
| England | 127 | 0.1% |
| Europe | 697 | 0.7% |
| Germany | 92 | 0.1% |
| Ghana | 79 | 0.1% |
| Guatemala | 35 | 0.0% |
| Honduras | 2,583 | 2.8% |
| Hungary | 7 | 0.0% |
| India | 525 | 0.6% |
| Indonesia | 5 | 0.0% |
| Iran | 82 | 0.1% |
| Ireland | 1 | 0.0% |
| Italy | 12 | 0.0% |
| Japan | 169 | 0.2% |
| Kazakhstan | 45 | 0.1% |
| Kenya | 574 | 0.6% |
| Korea | 112 | 0.1% |
| Latin America | 10,333 | 11.2% |
| Liberia | 43 | 0.1% |
| Mexico | 4,961 | 5.4% |
| Nepal | 84 | 0.1% |
| Netherlands | 12 | 0.0% |
| Nigeria | 367 | 0.4% |
| Northern Africa | 17 | 0.0% |
| Northern Europe | 361 | 0.4% |
| Oceania | 6 | 0.0% |
| Pakistan | 213 | 0.2% |
| Panama | 35 | 0.0% |
| Peru | 186 | 0.2% |
| Philippines | 367 | 0.4% |
| Poland | 16 | 0.0% |
| Portugal | 46 | 0.1% |
| Romania | 15 | 0.0% |
| Russia | 114 | 0.1% |
| Scotland | 192 | 0.2% |
| Singapore | 28 | 0.0% |
| South America | 1,503 | 1.6% |
| South Central Asia | 1,076 | 1.2% |
| South Eastern Asia | 643 | 0.7% |
| Southern Europe | 58 | 0.1% |
| Sri Lanka | 112 | 0.1% |
| Thailand | 66 | 0.1% |
| Uruguay | 13 | 0.0% |
| Uzbekistan | 15 | 0.0% |
| Venezuela | 395 | 0.4% |
| Vietnam | 177 | 0.2% |
| Western Africa | 489 | 0.5% |
| Western Asia | 22 | 0.0% |
| Western Europe | 126 | 0.1% | View All 67 Rows |
Sex and Age in Conroe
Sex and Age in Conroe
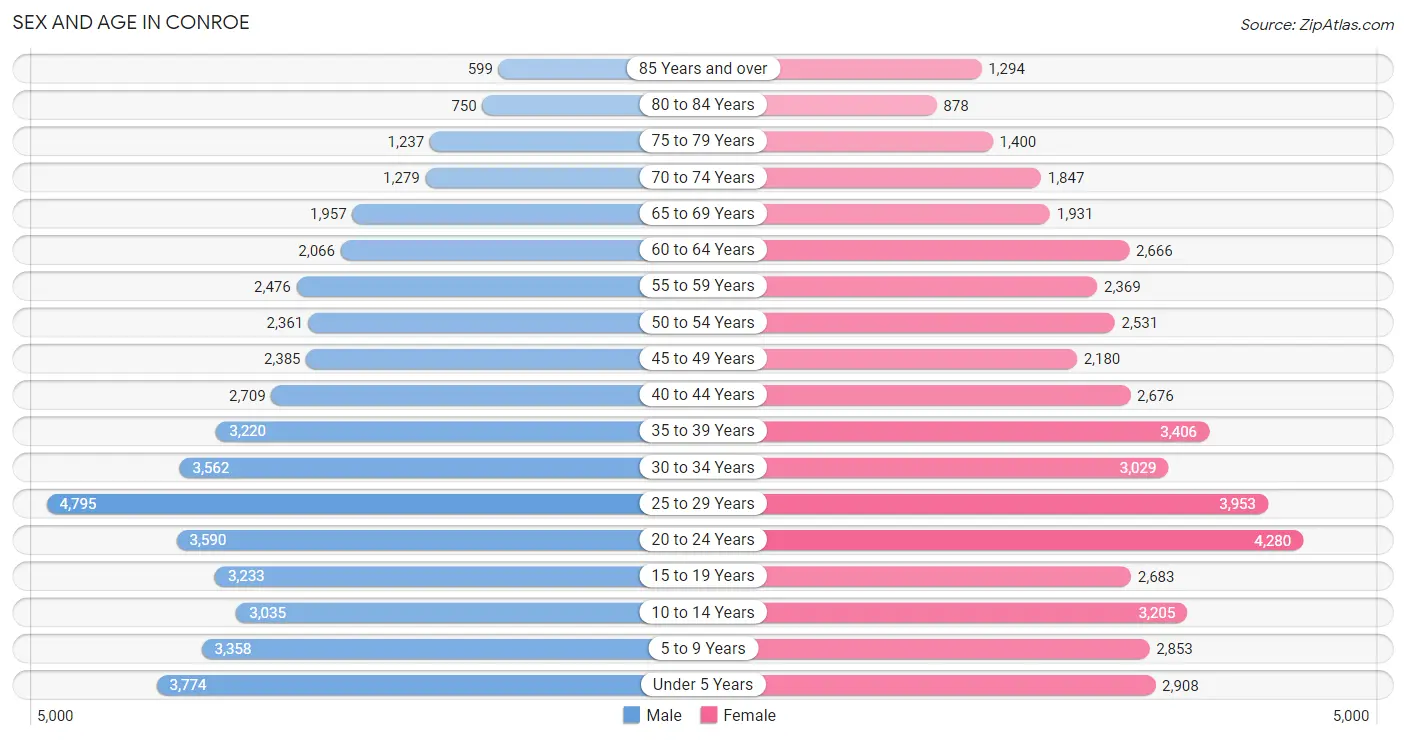
The most populous age groups in Conroe are 25 to 29 Years (4,795 | 10.3%) for men and 20 to 24 Years (4,280 | 9.3%) for women.
| Age Bracket | Male | Female |
| Under 5 Years | 3,774 (8.1%) | 2,908 (6.3%) |
| 5 to 9 Years | 3,358 (7.2%) | 2,853 (6.2%) |
| 10 to 14 Years | 3,035 (6.5%) | 3,205 (7.0%) |
| 15 to 19 Years | 3,233 (7.0%) | 2,683 (5.8%) |
| 20 to 24 Years | 3,590 (7.7%) | 4,280 (9.3%) |
| 25 to 29 Years | 4,795 (10.3%) | 3,953 (8.6%) |
| 30 to 34 Years | 3,562 (7.7%) | 3,029 (6.6%) |
| 35 to 39 Years | 3,220 (6.9%) | 3,406 (7.4%) |
| 40 to 44 Years | 2,709 (5.8%) | 2,676 (5.8%) |
| 45 to 49 Years | 2,385 (5.1%) | 2,180 (4.7%) |
| 50 to 54 Years | 2,361 (5.1%) | 2,531 (5.5%) |
| 55 to 59 Years | 2,476 (5.3%) | 2,369 (5.1%) |
| 60 to 64 Years | 2,066 (4.4%) | 2,666 (5.8%) |
| 65 to 69 Years | 1,957 (4.2%) | 1,931 (4.2%) |
| 70 to 74 Years | 1,279 (2.8%) | 1,847 (4.0%) |
| 75 to 79 Years | 1,237 (2.7%) | 1,400 (3.0%) |
| 80 to 84 Years | 750 (1.6%) | 878 (1.9%) |
| 85 Years and over | 599 (1.3%) | 1,294 (2.8%) |
| Total | 46,386 (100.0%) | 46,089 (100.0%) |
Families and Households in Conroe
Median Family Size in Conroe
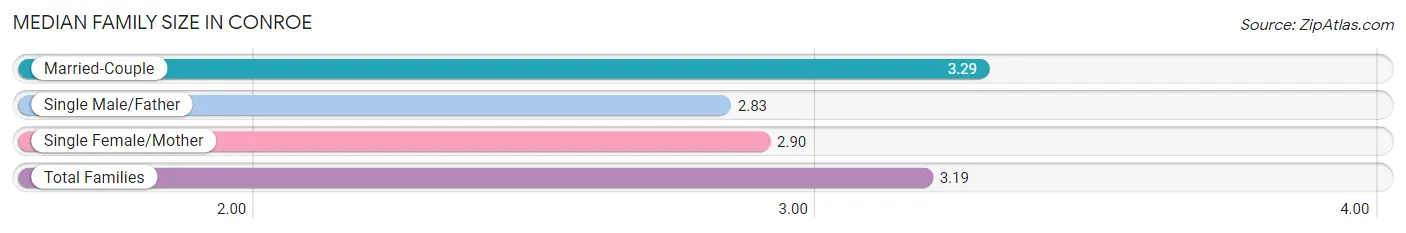
The median family size in Conroe is 3.19 persons per family, with married-couple families (17,328 | 75.0%) accounting for the largest median family size of 3.29 persons per family. On the other hand, single male/father families (2,110 | 9.1%) represent the smallest median family size with 2.83 persons per family.
| Family Type | # Families | Family Size |
| Married-Couple | 17,328 (75.0%) | 3.29 |
| Single Male/Father | 2,110 (9.1%) | 2.83 |
| Single Female/Mother | 3,664 (15.9%) | 2.90 |
| Total Families | 23,102 (100.0%) | 3.19 |
Median Household Size in Conroe
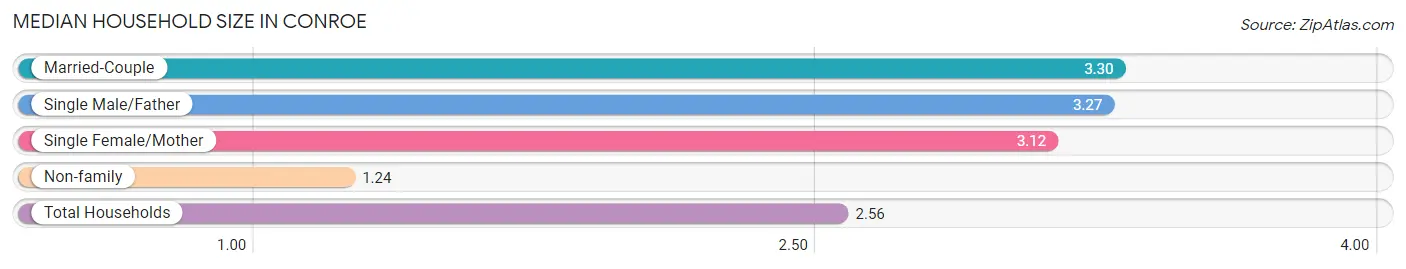
The median household size in Conroe is 2.56 persons per household, with married-couple households (17,328 | 48.9%) accounting for the largest median household size of 3.3 persons per household. non-family households (12,331 | 34.8%) represent the smallest median household size with 1.24 persons per household.
| Household Type | # Households | Household Size |
| Married-Couple | 17,328 (48.9%) | 3.30 |
| Single Male/Father | 2,110 (5.9%) | 3.27 |
| Single Female/Mother | 3,664 (10.3%) | 3.12 |
| Non-family | 12,331 (34.8%) | 1.24 |
| Total Households | 35,433 (100.0%) | 2.56 |
Household Size by Marriage Status in Conroe
Out of a total of 35,433 households in Conroe, 23,102 (65.2%) are family households, while 12,331 (34.8%) are nonfamily households. The most numerous type of family households are 2-person households, comprising 9,327, and the most common type of nonfamily households are 1-person households, comprising 9,902.
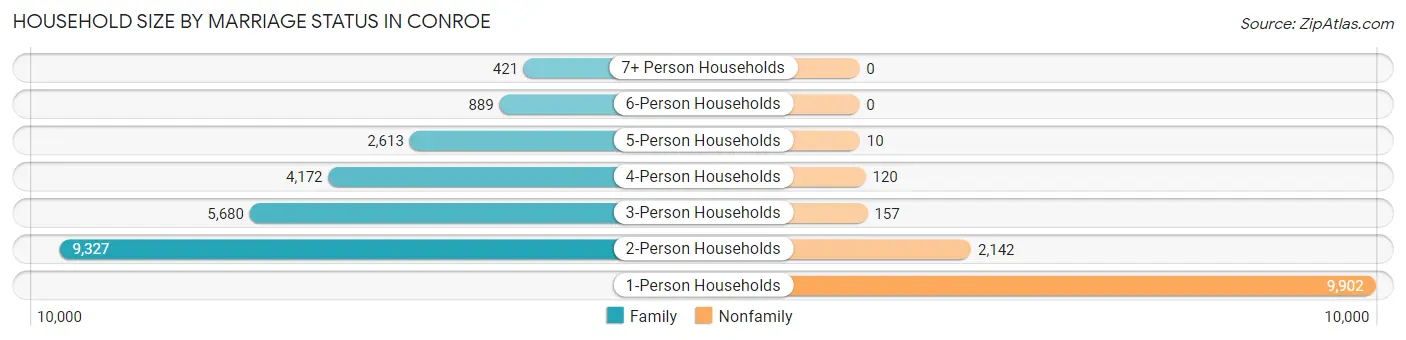
| Household Size | Family Households | Nonfamily Households |
| 1-Person Households | - | 9,902 (28.0%) |
| 2-Person Households | 9,327 (26.3%) | 2,142 (6.0%) |
| 3-Person Households | 5,680 (16.0%) | 157 (0.4%) |
| 4-Person Households | 4,172 (11.8%) | 120 (0.3%) |
| 5-Person Households | 2,613 (7.4%) | 10 (0.0%) |
| 6-Person Households | 889 (2.5%) | 0 (0.0%) |
| 7+ Person Households | 421 (1.2%) | 0 (0.0%) |
| Total | 23,102 (65.2%) | 12,331 (34.8%) |
Female Fertility in Conroe
Fertility by Age in Conroe
Average fertility rate in Conroe is 63.0 births per 1,000 women. Women in the age bracket of 20 to 34 years have the highest fertility rate with 93.0 births per 1,000 women. Women in the age bracket of 20 to 34 years acount for 73.1% of all women with births.
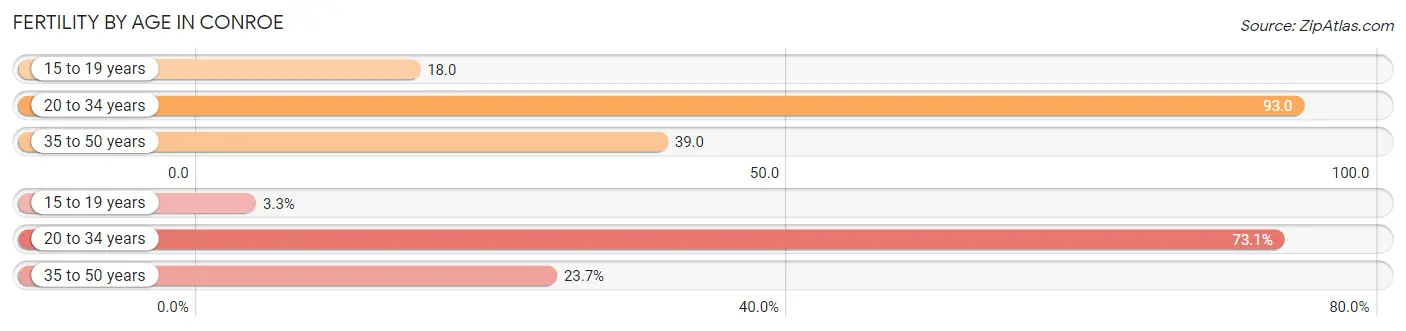
| Age Bracket | Women with Births | Births / 1,000 Women |
| 15 to 19 years | 47 (3.3%) | 18.0 |
| 20 to 34 years | 1,052 (73.1%) | 93.0 |
| 35 to 50 years | 341 (23.7%) | 39.0 |
| Total | 1,440 (100.0%) | 63.0 |
Fertility by Age by Marriage Status in Conroe
73.7% of women with births (1,440) in Conroe are married. The highest percentage of unmarried women with births falls into 35 to 50 years age bracket with 38.7% of them unmarried at the time of birth, while the lowest percentage of unmarried women with births belong to 15 to 19 years age bracket with 0.0% of them unmarried.
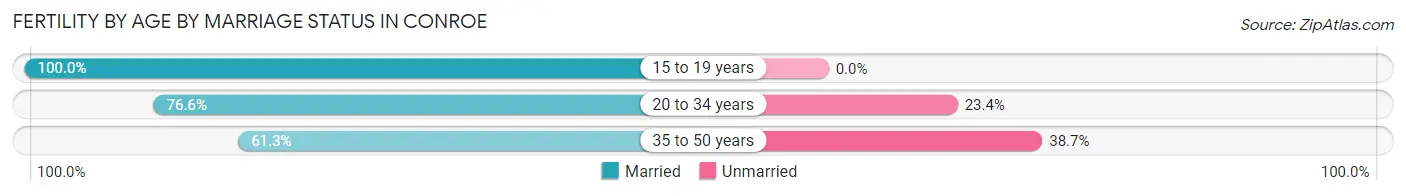
| Age Bracket | Married | Unmarried |
| 15 to 19 years | 47 (100.0%) | 0 (0.0%) |
| 20 to 34 years | 806 (76.6%) | 246 (23.4%) |
| 35 to 50 years | 209 (61.3%) | 132 (38.7%) |
| Total | 1,061 (73.7%) | 379 (26.3%) |
Fertility by Education in Conroe
Average fertility rate in Conroe is 63.0 births per 1,000 women. Women with the education attainment of high school diploma have the highest fertility rate of 109.0 births per 1,000 women, while women with the education attainment of bachelor's degree have the lowest fertility at 27.0 births per 1,000 women. Women with the education attainment of high school diploma represent 38.1% of all women with births.
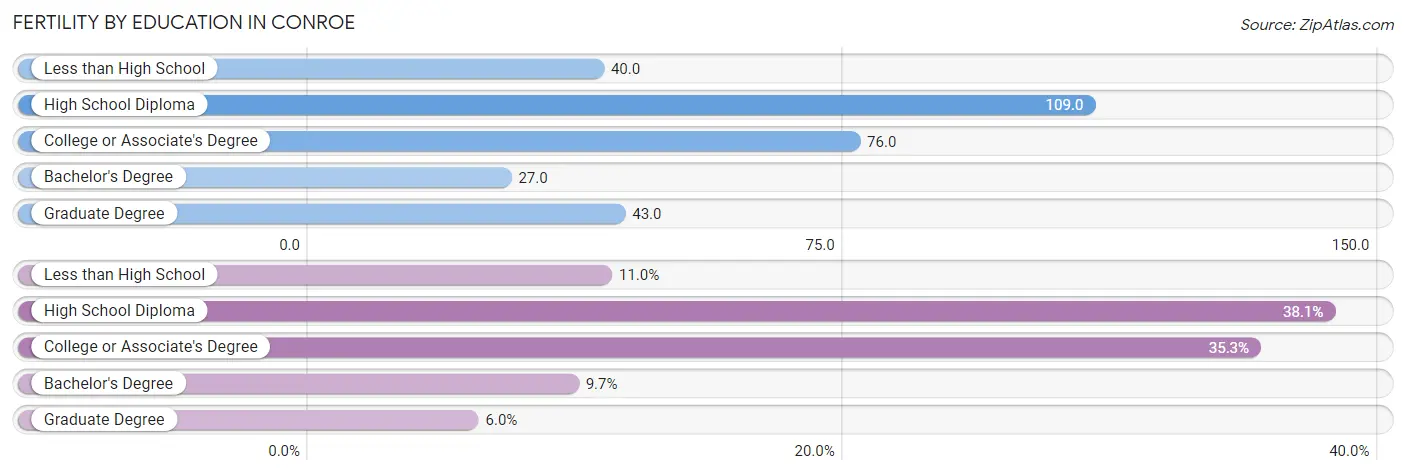
| Educational Attainment | Women with Births | Births / 1,000 Women |
| Less than High School | 158 (11.0%) | 40.0 |
| High School Diploma | 548 (38.1%) | 109.0 |
| College or Associate's Degree | 508 (35.3%) | 76.0 |
| Bachelor's Degree | 140 (9.7%) | 27.0 |
| Graduate Degree | 86 (6.0%) | 43.0 |
| Total | 1,440 (100.0%) | 63.0 |
Fertility by Education by Marriage Status in Conroe
26.3% of women with births in Conroe are unmarried. Women with the educational attainment of bachelor's degree are most likely to be married with 100.0% of them married at childbirth, while women with the educational attainment of less than high school are least likely to be married with 51.9% of them unmarried at childbirth.
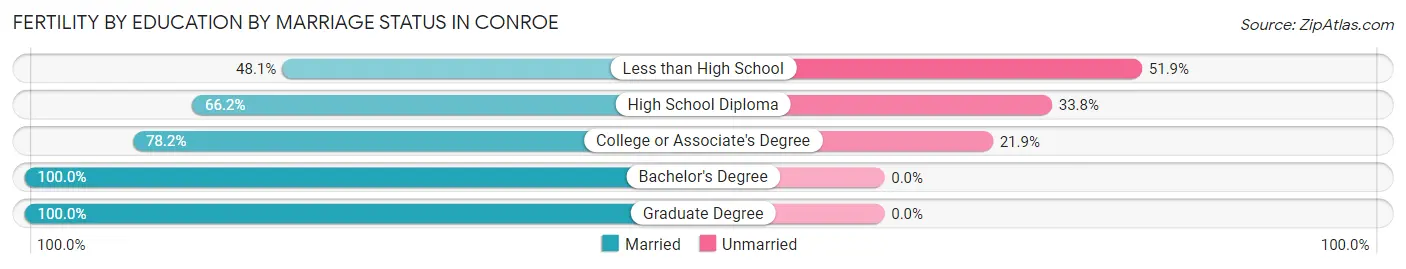
| Educational Attainment | Married | Unmarried |
| Less than High School | 76 (48.1%) | 82 (51.9%) |
| High School Diploma | 363 (66.2%) | 185 (33.8%) |
| College or Associate's Degree | 397 (78.1%) | 111 (21.8%) |
| Bachelor's Degree | 140 (100.0%) | 0 (0.0%) |
| Graduate Degree | 86 (100.0%) | 0 (0.0%) |
| Total | 1,061 (73.7%) | 379 (26.3%) |
Employment Characteristics in Conroe
Employment by Class of Employer in Conroe
Among the 44,222 employed individuals in Conroe, private company employees (29,576 | 66.9%), local government employees (4,516 | 10.2%), and self-employed (not incorporated) (2,831 | 6.4%) make up the most common classes of employment.
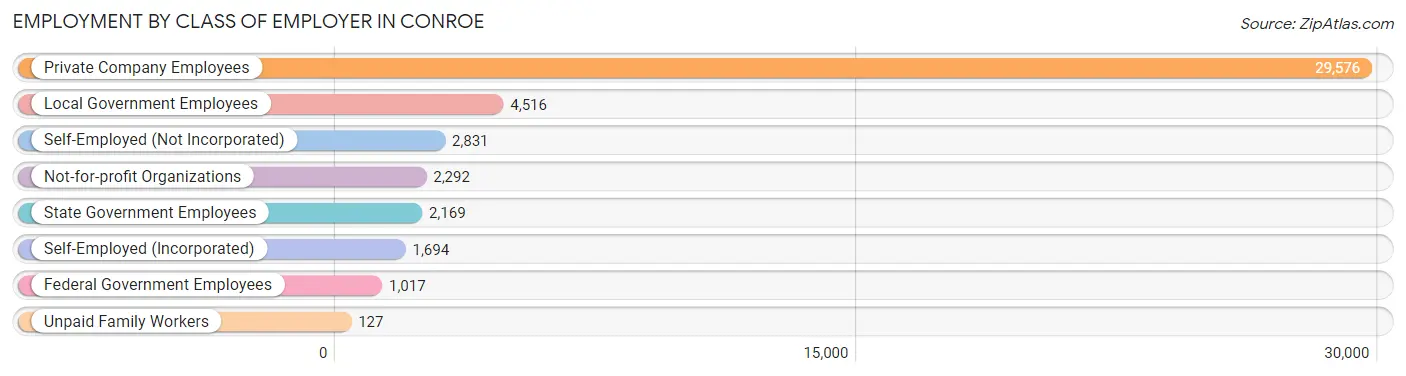
| Employer Class | # Employees | % Employees |
| Private Company Employees | 29,576 | 66.9% |
| Self-Employed (Incorporated) | 1,694 | 3.8% |
| Self-Employed (Not Incorporated) | 2,831 | 6.4% |
| Not-for-profit Organizations | 2,292 | 5.2% |
| Local Government Employees | 4,516 | 10.2% |
| State Government Employees | 2,169 | 4.9% |
| Federal Government Employees | 1,017 | 2.3% |
| Unpaid Family Workers | 127 | 0.3% |
| Total | 44,222 | 100.0% |
Employment Status by Age in Conroe
According to the labor force statistics for Conroe, out of the total population over 16 years of age (72,062), 64.5% or 46,480 individuals are in the labor force, with 3.4% or 1,580 of them unemployed. The age group with the highest labor force participation rate is 25 to 29 years, with 82.5% or 7,217 individuals in the labor force. Within the labor force, the 16 to 19 years age range has the highest percentage of unemployed individuals, with 13.9% or 267 of them being unemployed.
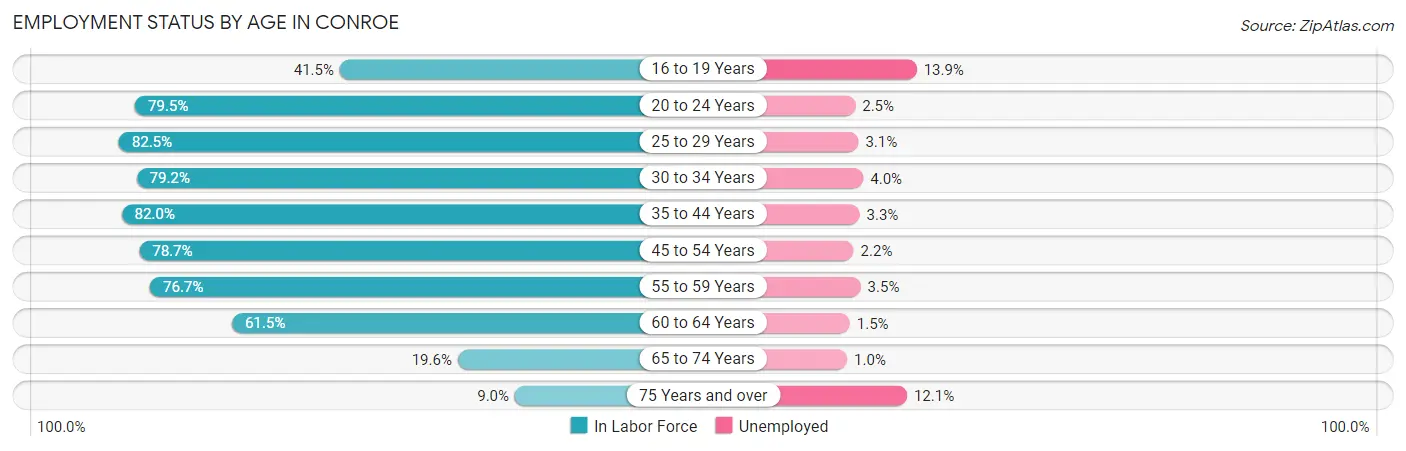
| Age Bracket | In Labor Force | Unemployed |
| 16 to 19 Years | 1,924 (41.5%) | 267 (13.9%) |
| 20 to 24 Years | 6,257 (79.5%) | 156 (2.5%) |
| 25 to 29 Years | 7,217 (82.5%) | 224 (3.1%) |
| 30 to 34 Years | 5,220 (79.2%) | 209 (4.0%) |
| 35 to 44 Years | 9,849 (82.0%) | 325 (3.3%) |
| 45 to 54 Years | 7,443 (78.7%) | 164 (2.2%) |
| 55 to 59 Years | 3,716 (76.7%) | 130 (3.5%) |
| 60 to 64 Years | 2,910 (61.5%) | 44 (1.5%) |
| 65 to 74 Years | 1,375 (19.6%) | 14 (1.0%) |
| 75 Years and over | 554 (9.0%) | 67 (12.1%) |
| Total | 46,480 (64.5%) | 1,580 (3.4%) |
Employment Status by Educational Attainment in Conroe
According to labor force statistics for Conroe, 78.4% of individuals (36,365) out of the total population between 25 and 64 years of age (46,384) are in the labor force, with 3.0% or 1,091 of them being unemployed. The group with the highest labor force participation rate are those with the educational attainment of bachelor's degree or higher, with 85.0% or 12,670 individuals in the labor force. Within the labor force, individuals with less than high school education have the highest percentage of unemployment, with 5.5% or 249 of them being unemployed.
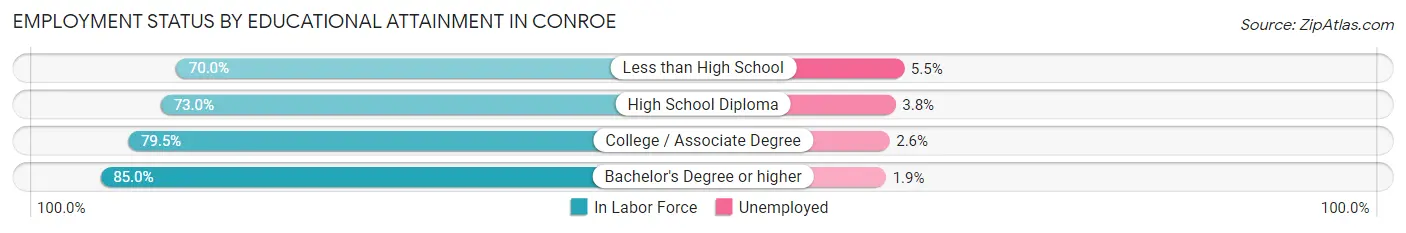
| Educational Attainment | In Labor Force | Unemployed |
| Less than High School | 4,536 (70.0%) | 356 (5.5%) |
| High School Diploma | 8,104 (73.0%) | 422 (3.8%) |
| College / Associate Degree | 11,047 (79.5%) | 361 (2.6%) |
| Bachelor's Degree or higher | 12,670 (85.0%) | 283 (1.9%) |
| Total | 36,365 (78.4%) | 1,392 (3.0%) |
Employment Occupations by Sex in Conroe
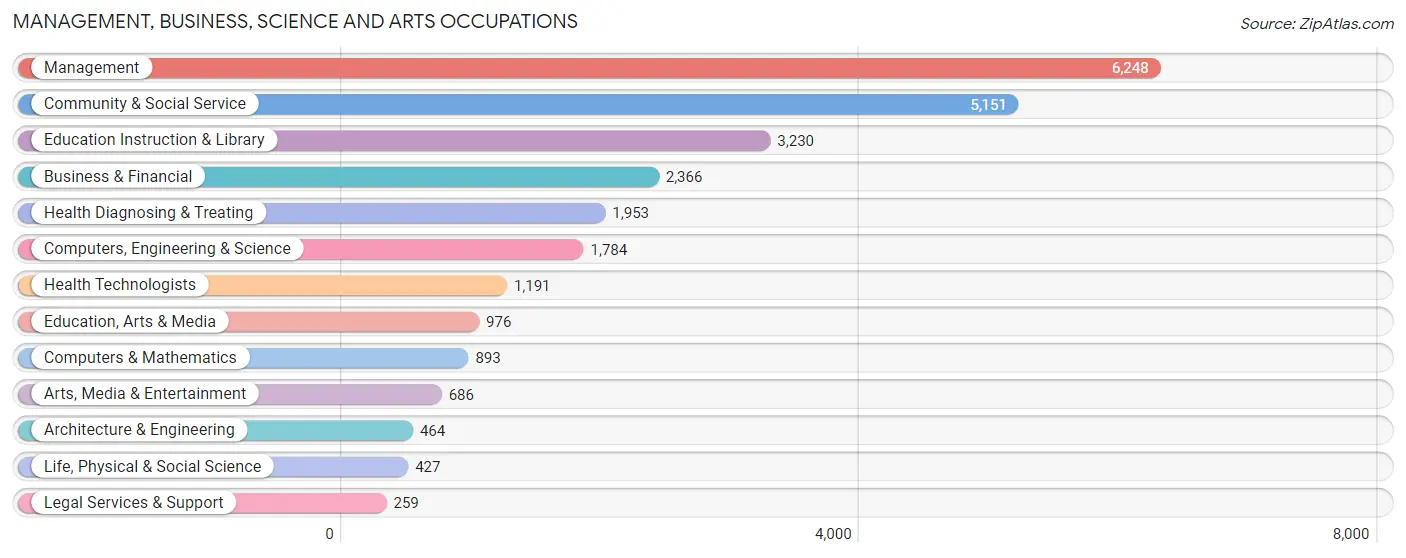
Management, Business, Science and Arts Occupations
The most common Management, Business, Science and Arts occupations in Conroe are Management (6,248 | 14.0%), Community & Social Service (5,151 | 11.5%), Education Instruction & Library (3,230 | 7.2%), Business & Financial (2,366 | 5.3%), and Health Diagnosing & Treating (1,953 | 4.4%).
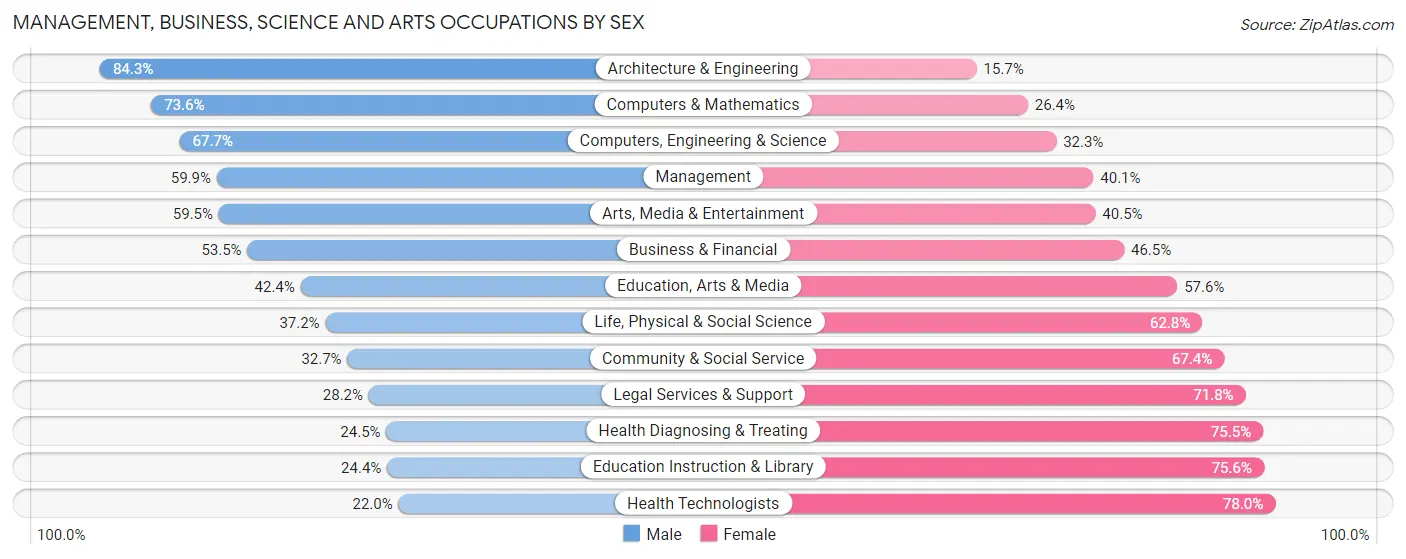
Management, Business, Science and Arts Occupations by Sex
Within the Management, Business, Science and Arts occupations in Conroe, the most male-oriented occupations are Architecture & Engineering (84.3%), Computers & Mathematics (73.6%), and Computers, Engineering & Science (67.7%), while the most female-oriented occupations are Health Technologists (78.0%), Education Instruction & Library (75.6%), and Health Diagnosing & Treating (75.5%).
| Occupation | Male | Female |
| Management | 3,743 (59.9%) | 2,505 (40.1%) |
| Business & Financial | 1,266 (53.5%) | 1,100 (46.5%) |
| Computers, Engineering & Science | 1,207 (67.7%) | 577 (32.3%) |
| Computers & Mathematics | 657 (73.6%) | 236 (26.4%) |
| Architecture & Engineering | 391 (84.3%) | 73 (15.7%) |
| Life, Physical & Social Science | 159 (37.2%) | 268 (62.8%) |
| Community & Social Service | 1,682 (32.7%) | 3,469 (67.3%) |
| Education, Arts & Media | 414 (42.4%) | 562 (57.6%) |
| Legal Services & Support | 73 (28.2%) | 186 (71.8%) |
| Education Instruction & Library | 787 (24.4%) | 2,443 (75.6%) |
| Arts, Media & Entertainment | 408 (59.5%) | 278 (40.5%) |
| Health Diagnosing & Treating | 479 (24.5%) | 1,474 (75.5%) |
| Health Technologists | 262 (22.0%) | 929 (78.0%) |
| Total (Category) | 8,377 (47.9%) | 9,125 (52.1%) |
| Total (Overall) | 24,870 (55.5%) | 19,930 (44.5%) |
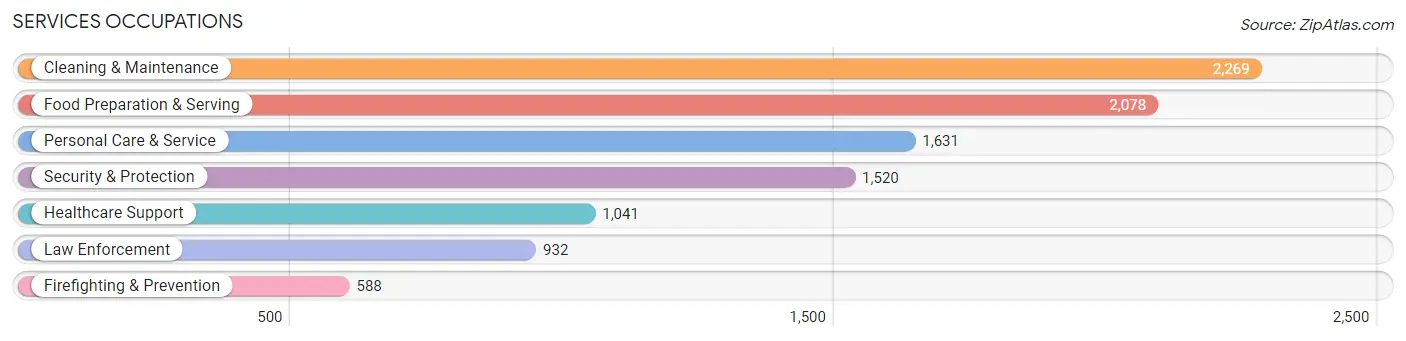
Services Occupations
The most common Services occupations in Conroe are Cleaning & Maintenance (2,269 | 5.1%), Food Preparation & Serving (2,078 | 4.6%), Personal Care & Service (1,631 | 3.6%), Security & Protection (1,520 | 3.4%), and Healthcare Support (1,041 | 2.3%).
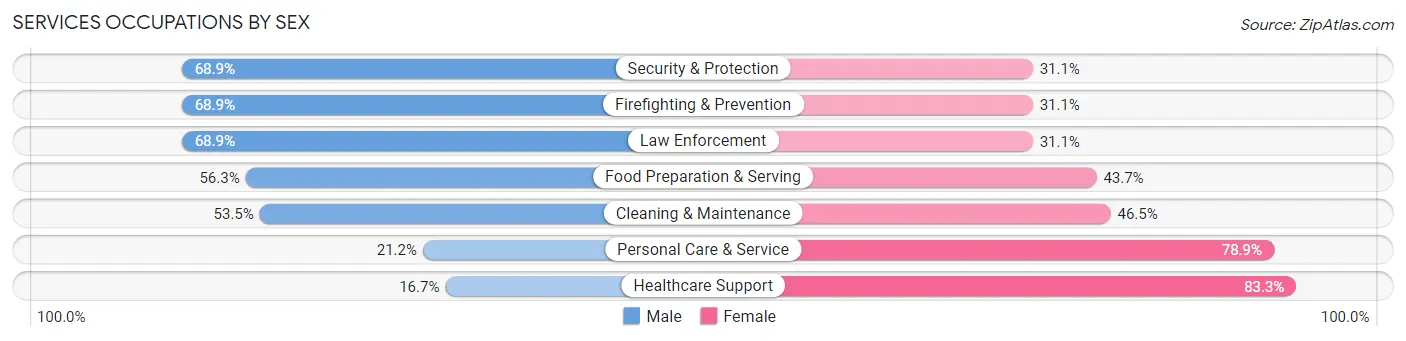
Services Occupations by Sex
Within the Services occupations in Conroe, the most male-oriented occupations are Security & Protection (68.9%), Firefighting & Prevention (68.9%), and Law Enforcement (68.9%), while the most female-oriented occupations are Healthcare Support (83.3%), Personal Care & Service (78.8%), and Cleaning & Maintenance (46.5%).
| Occupation | Male | Female |
| Healthcare Support | 174 (16.7%) | 867 (83.3%) |
| Security & Protection | 1,047 (68.9%) | 473 (31.1%) |
| Firefighting & Prevention | 405 (68.9%) | 183 (31.1%) |
| Law Enforcement | 642 (68.9%) | 290 (31.1%) |
| Food Preparation & Serving | 1,169 (56.3%) | 909 (43.7%) |
| Cleaning & Maintenance | 1,213 (53.5%) | 1,056 (46.5%) |
| Personal Care & Service | 345 (21.1%) | 1,286 (78.8%) |
| Total (Category) | 3,948 (46.2%) | 4,591 (53.8%) |
| Total (Overall) | 24,870 (55.5%) | 19,930 (44.5%) |
Sales and Office Occupations
The most common Sales and Office occupations in Conroe are Sales & Related (4,643 | 10.4%), and Office & Administration (3,792 | 8.5%).

Sales and Office Occupations by Sex
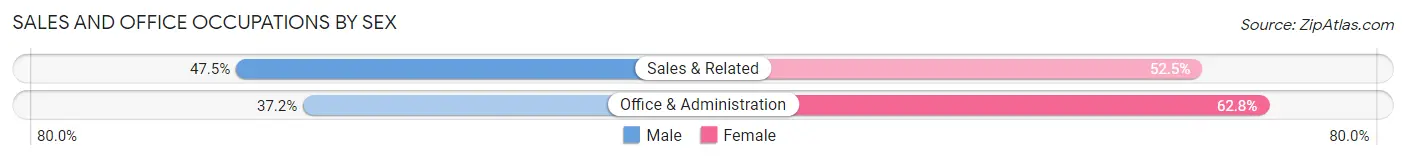
| Occupation | Male | Female |
| Sales & Related | 2,204 (47.5%) | 2,439 (52.5%) |
| Office & Administration | 1,409 (37.2%) | 2,383 (62.8%) |
| Total (Category) | 3,613 (42.8%) | 4,822 (57.2%) |
| Total (Overall) | 24,870 (55.5%) | 19,930 (44.5%) |
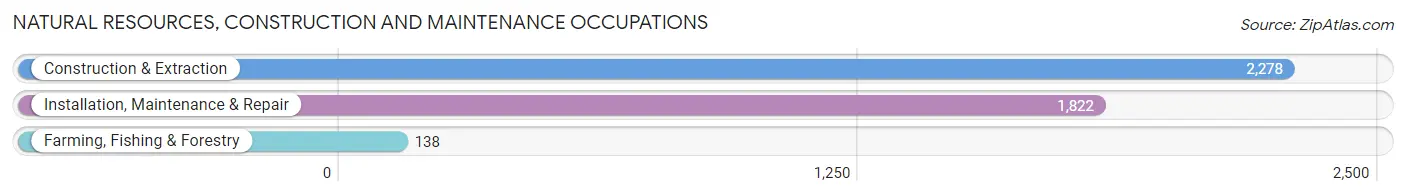
Natural Resources, Construction and Maintenance Occupations
The most common Natural Resources, Construction and Maintenance occupations in Conroe are Construction & Extraction (2,278 | 5.1%), Installation, Maintenance & Repair (1,822 | 4.1%), and Farming, Fishing & Forestry (138 | 0.3%).
Natural Resources, Construction and Maintenance Occupations by Sex
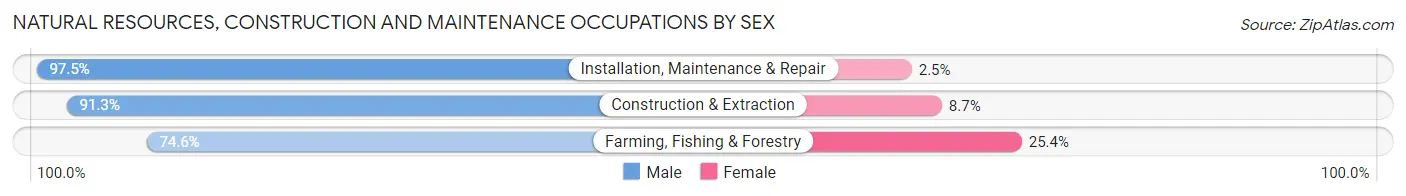
| Occupation | Male | Female |
| Farming, Fishing & Forestry | 103 (74.6%) | 35 (25.4%) |
| Construction & Extraction | 2,079 (91.3%) | 199 (8.7%) |
| Installation, Maintenance & Repair | 1,777 (97.5%) | 45 (2.5%) |
| Total (Category) | 3,959 (93.4%) | 279 (6.6%) |
| Total (Overall) | 24,870 (55.5%) | 19,930 (44.5%) |
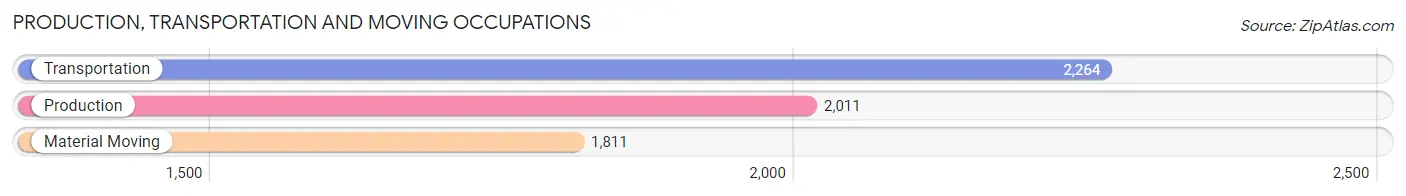
Production, Transportation and Moving Occupations
The most common Production, Transportation and Moving occupations in Conroe are Transportation (2,264 | 5.1%), Production (2,011 | 4.5%), and Material Moving (1,811 | 4.0%).
Production, Transportation and Moving Occupations by Sex
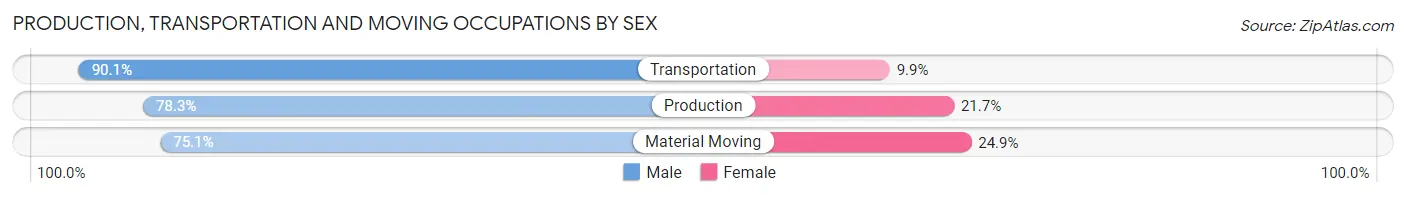
| Occupation | Male | Female |
| Production | 1,574 (78.3%) | 437 (21.7%) |
| Transportation | 2,039 (90.1%) | 225 (9.9%) |
| Material Moving | 1,360 (75.1%) | 451 (24.9%) |
| Total (Category) | 4,973 (81.7%) | 1,113 (18.3%) |
| Total (Overall) | 24,870 (55.5%) | 19,930 (44.5%) |
Employment Industries by Sex in Conroe
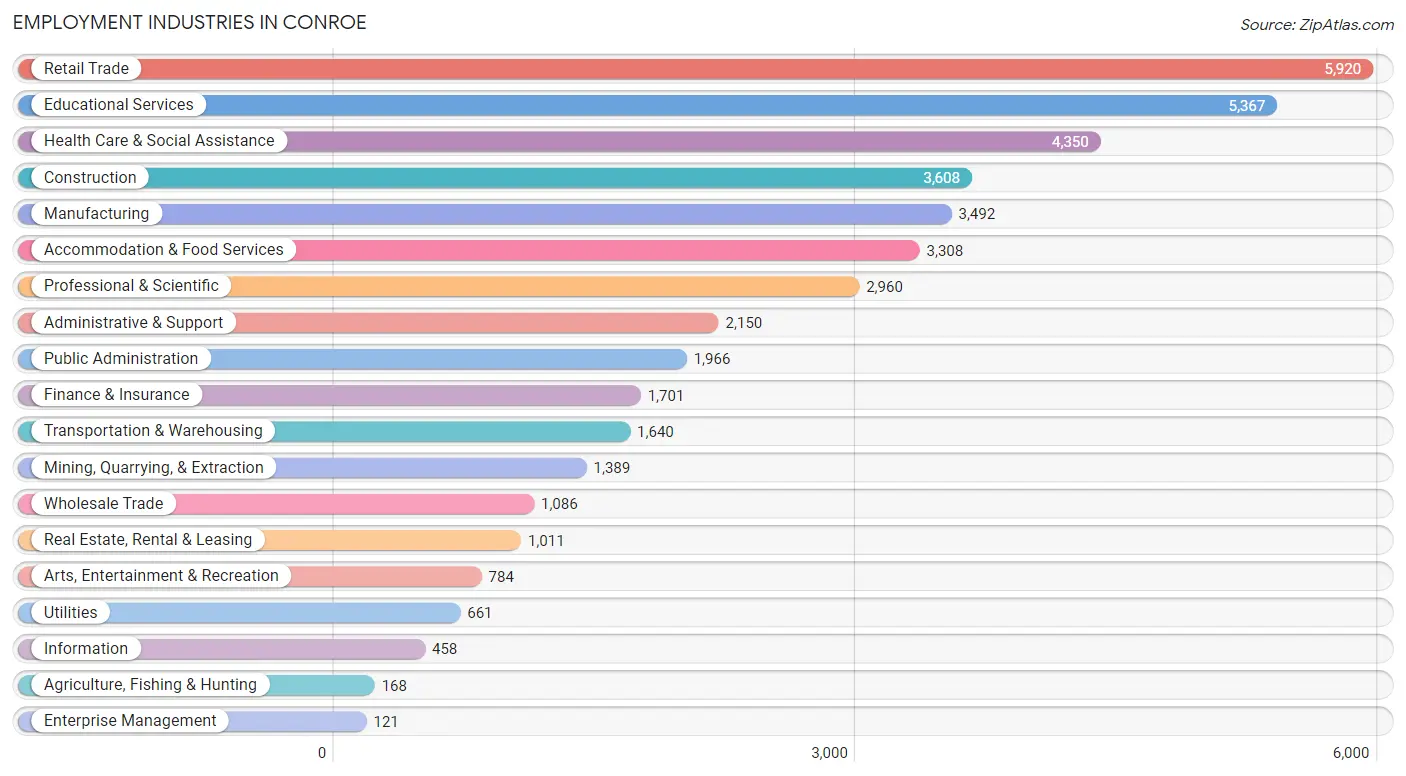
Employment Industries in Conroe
The major employment industries in Conroe include Retail Trade (5,920 | 13.2%), Educational Services (5,367 | 12.0%), Health Care & Social Assistance (4,350 | 9.7%), Construction (3,608 | 8.1%), and Manufacturing (3,492 | 7.8%).
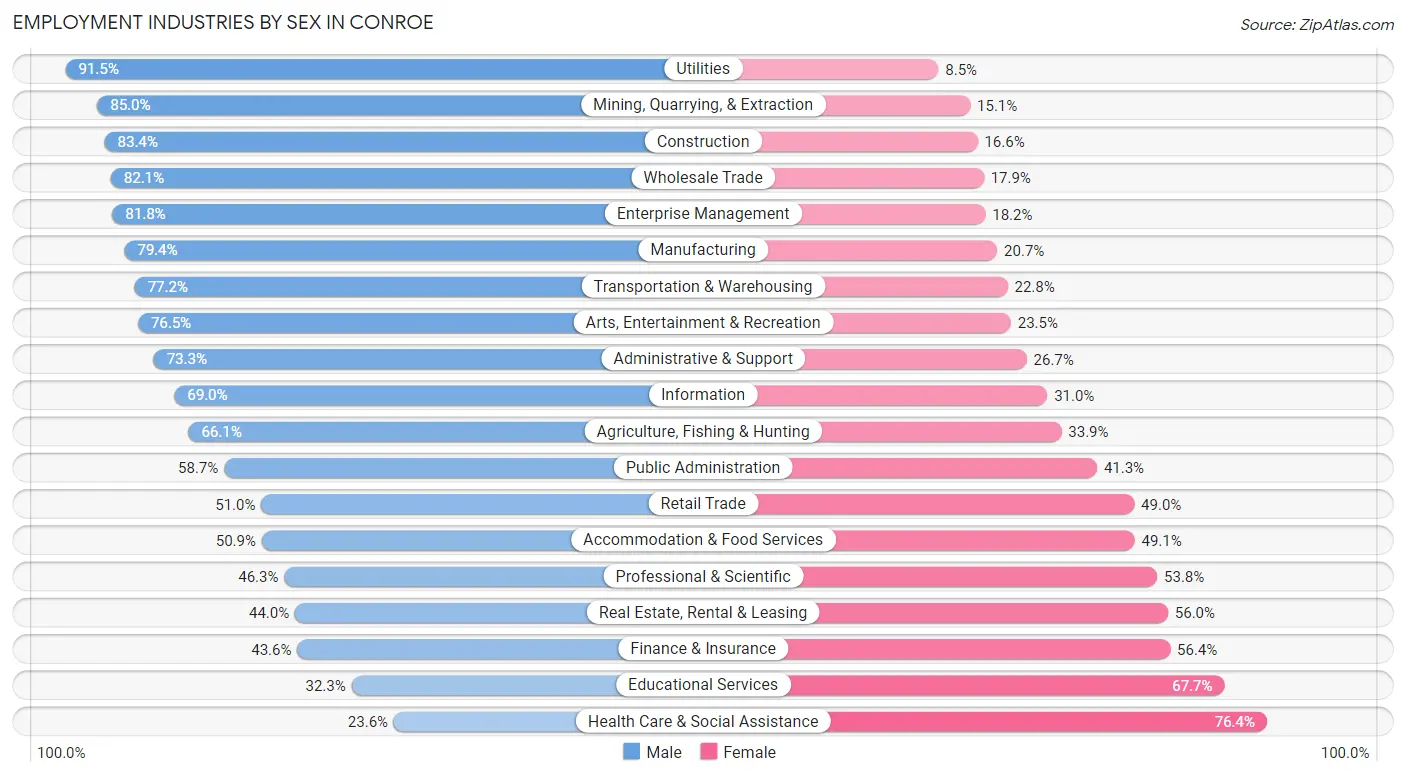
Employment Industries by Sex in Conroe
The Conroe industries that see more men than women are Utilities (91.5%), Mining, Quarrying, & Extraction (85.0%), and Construction (83.4%), whereas the industries that tend to have a higher number of women are Health Care & Social Assistance (76.4%), Educational Services (67.7%), and Finance & Insurance (56.4%).
| Industry | Male | Female |
| Agriculture, Fishing & Hunting | 111 (66.1%) | 57 (33.9%) |
| Mining, Quarrying, & Extraction | 1,180 (85.0%) | 209 (15.0%) |
| Construction | 3,010 (83.4%) | 598 (16.6%) |
| Manufacturing | 2,771 (79.3%) | 721 (20.6%) |
| Wholesale Trade | 892 (82.1%) | 194 (17.9%) |
| Retail Trade | 3,019 (51.0%) | 2,901 (49.0%) |
| Transportation & Warehousing | 1,266 (77.2%) | 374 (22.8%) |
| Utilities | 605 (91.5%) | 56 (8.5%) |
| Information | 316 (69.0%) | 142 (31.0%) |
| Finance & Insurance | 741 (43.6%) | 960 (56.4%) |
| Real Estate, Rental & Leasing | 445 (44.0%) | 566 (56.0%) |
| Professional & Scientific | 1,369 (46.3%) | 1,591 (53.7%) |
| Enterprise Management | 99 (81.8%) | 22 (18.2%) |
| Administrative & Support | 1,575 (73.3%) | 575 (26.7%) |
| Educational Services | 1,735 (32.3%) | 3,632 (67.7%) |
| Health Care & Social Assistance | 1,025 (23.6%) | 3,325 (76.4%) |
| Arts, Entertainment & Recreation | 600 (76.5%) | 184 (23.5%) |
| Accommodation & Food Services | 1,684 (50.9%) | 1,624 (49.1%) |
| Public Administration | 1,154 (58.7%) | 812 (41.3%) |
| Total | 24,870 (55.5%) | 19,930 (44.5%) |
Education in Conroe
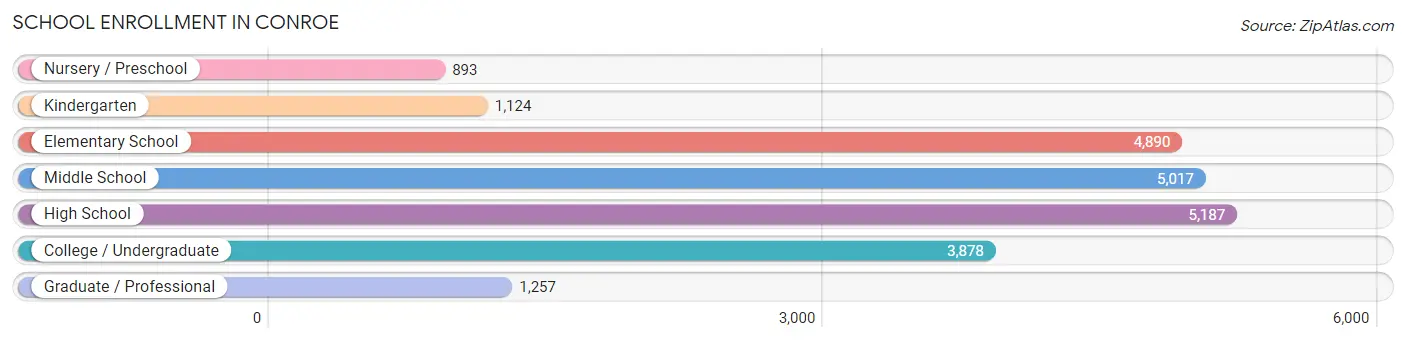
School Enrollment in Conroe
The most common levels of schooling among the 22,246 students in Conroe are high school (5,187 | 23.3%), middle school (5,017 | 22.6%), and elementary school (4,890 | 22.0%).
| School Level | # Students | % Students |
| Nursery / Preschool | 893 | 4.0% |
| Kindergarten | 1,124 | 5.1% |
| Elementary School | 4,890 | 22.0% |
| Middle School | 5,017 | 22.6% |
| High School | 5,187 | 23.3% |
| College / Undergraduate | 3,878 | 17.4% |
| Graduate / Professional | 1,257 | 5.7% |
| Total | 22,246 | 100.0% |
School Enrollment by Age by Funding Source in Conroe
Out of a total of 22,246 students who are enrolled in schools in Conroe, 3,203 (14.4%) attend a private institution, while the remaining 19,043 (85.6%) are enrolled in public schools. The age group of 3 to 4 year olds has the highest likelihood of being enrolled in private schools, with 436 (68.1% in the age bracket) enrolled. Conversely, the age group of 15 to 17 year olds has the lowest likelihood of being enrolled in a private school, with 3,073 (94.0% in the age bracket) attending a public institution.
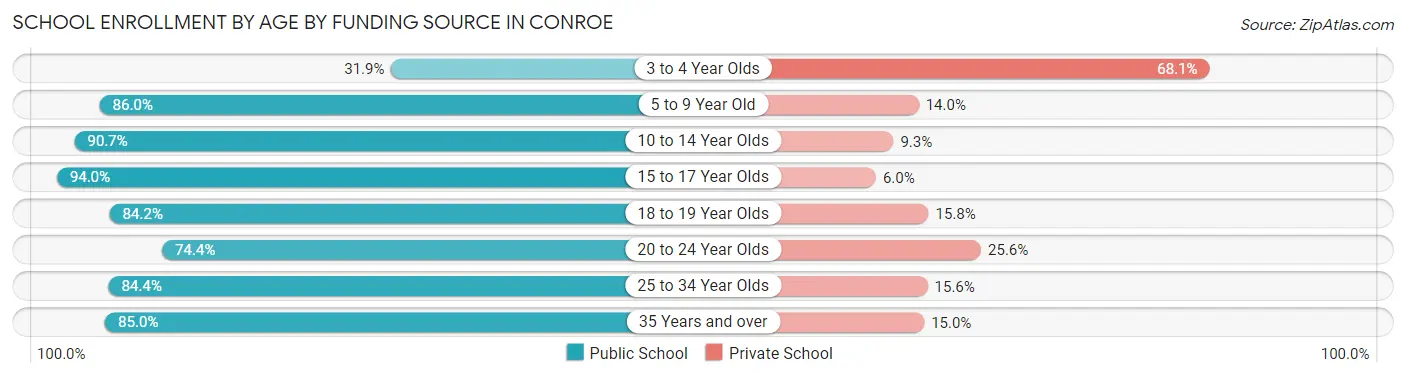
| Age Bracket | Public School | Private School |
| 3 to 4 Year Olds | 204 (31.9%) | 436 (68.1%) |
| 5 to 9 Year Old | 5,071 (86.0%) | 824 (14.0%) |
| 10 to 14 Year Olds | 5,609 (90.7%) | 574 (9.3%) |
| 15 to 17 Year Olds | 3,073 (94.0%) | 197 (6.0%) |
| 18 to 19 Year Olds | 1,330 (84.2%) | 250 (15.8%) |
| 20 to 24 Year Olds | 1,549 (74.4%) | 533 (25.6%) |
| 25 to 34 Year Olds | 1,285 (84.4%) | 238 (15.6%) |
| 35 Years and over | 912 (85.0%) | 161 (15.0%) |
| Total | 19,043 (85.6%) | 3,203 (14.4%) |
Educational Attainment by Field of Study in Conroe
Business (4,457 | 21.9%), education (2,696 | 13.2%), engineering (2,314 | 11.4%), science & technology (1,830 | 9.0%), and arts & humanities (1,737 | 8.5%) are the most common fields of study among 20,386 individuals in Conroe who have obtained a bachelor's degree or higher.
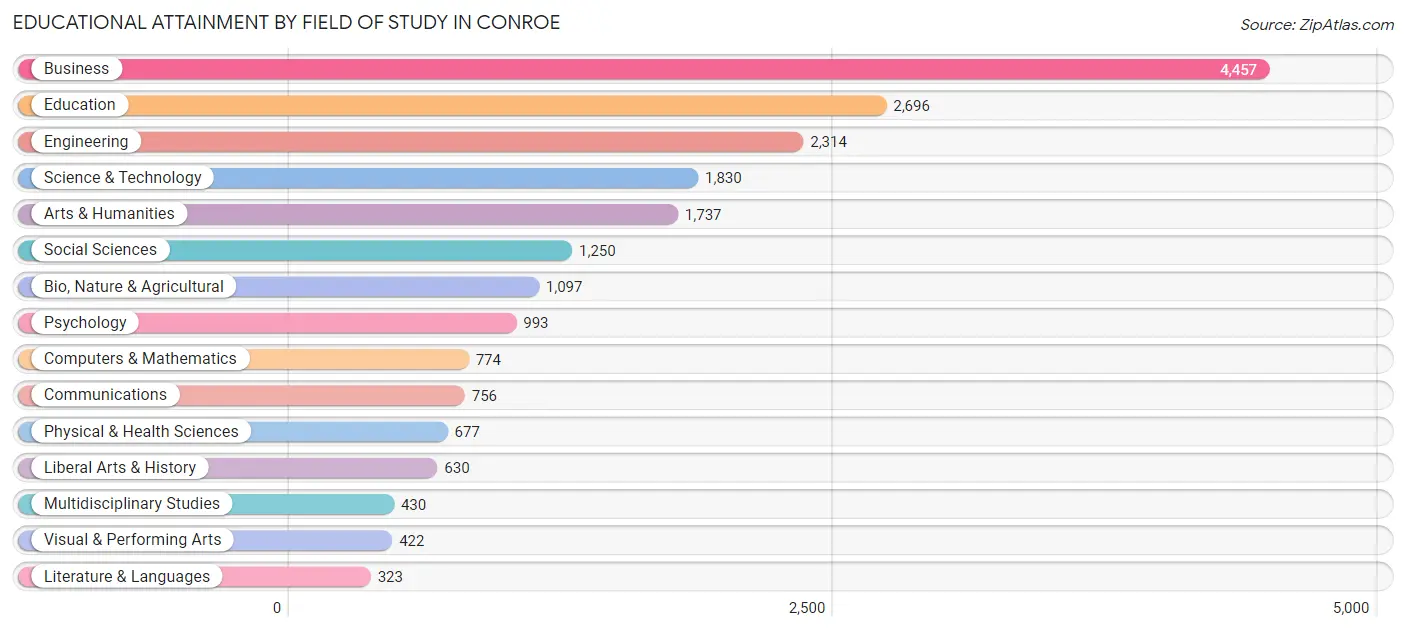
| Field of Study | # Graduates | % Graduates |
| Computers & Mathematics | 774 | 3.8% |
| Bio, Nature & Agricultural | 1,097 | 5.4% |
| Physical & Health Sciences | 677 | 3.3% |
| Psychology | 993 | 4.9% |
| Social Sciences | 1,250 | 6.1% |
| Engineering | 2,314 | 11.4% |
| Multidisciplinary Studies | 430 | 2.1% |
| Science & Technology | 1,830 | 9.0% |
| Business | 4,457 | 21.9% |
| Education | 2,696 | 13.2% |
| Literature & Languages | 323 | 1.6% |
| Liberal Arts & History | 630 | 3.1% |
| Visual & Performing Arts | 422 | 2.1% |
| Communications | 756 | 3.7% |
| Arts & Humanities | 1,737 | 8.5% |
| Total | 20,386 | 100.0% |
Transportation & Commute in Conroe
Vehicle Availability by Sex in Conroe
The most prevalent vehicle ownership categories in Conroe are males with 2 vehicles (11,610, accounting for 47.1%) and females with 2 vehicles (8,744, making up 59.6%).
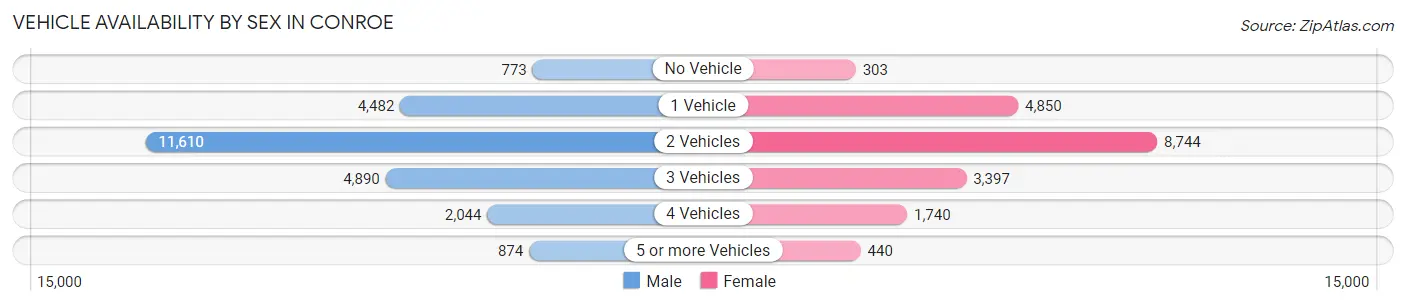
| Vehicles Available | Male | Female |
| No Vehicle | 773 (3.1%) | 303 (1.6%) |
| 1 Vehicle | 4,482 (18.2%) | 4,850 (24.9%) |
| 2 Vehicles | 11,610 (47.1%) | 8,744 (44.9%) |
| 3 Vehicles | 4,890 (19.8%) | 3,397 (17.4%) |
| 4 Vehicles | 2,044 (8.3%) | 1,740 (8.9%) |
| 5 or more Vehicles | 874 (3.5%) | 440 (2.3%) |
| Total | 24,673 (100.0%) | 19,474 (100.0%) |
Commute Time in Conroe
The most frequently occuring commute durations in Conroe are 15 to 19 minutes (6,441 commuters, 16.0%), 30 to 34 minutes (6,333 commuters, 15.7%), and 10 to 14 minutes (5,202 commuters, 12.9%).
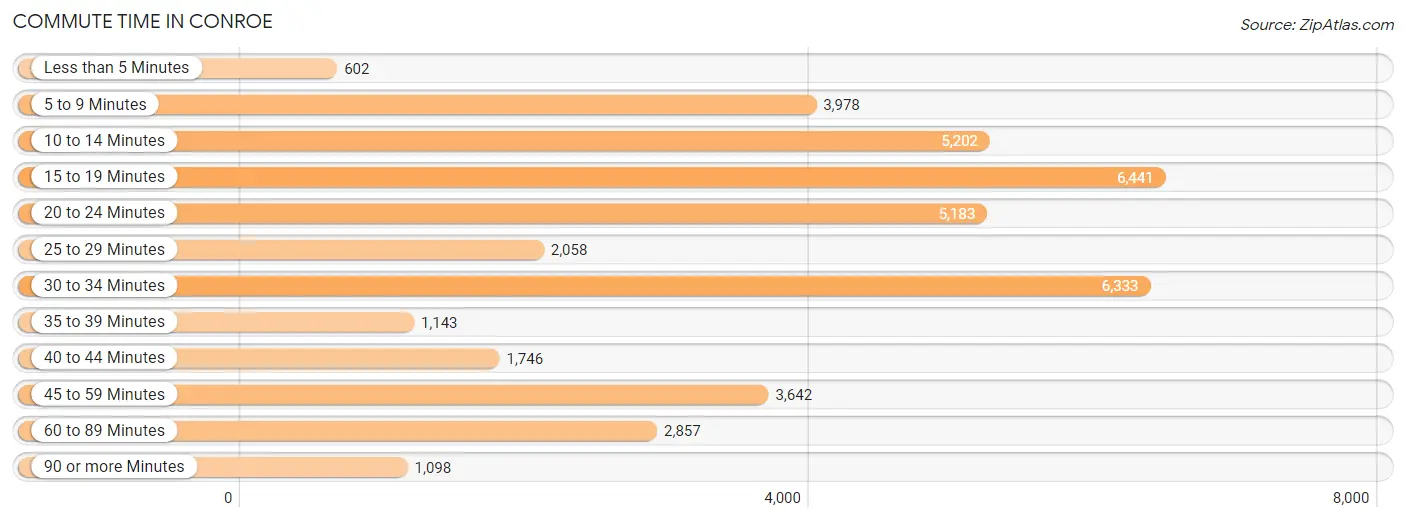
| Commute Time | # Commuters | % Commuters |
| Less than 5 Minutes | 602 | 1.5% |
| 5 to 9 Minutes | 3,978 | 9.9% |
| 10 to 14 Minutes | 5,202 | 12.9% |
| 15 to 19 Minutes | 6,441 | 16.0% |
| 20 to 24 Minutes | 5,183 | 12.9% |
| 25 to 29 Minutes | 2,058 | 5.1% |
| 30 to 34 Minutes | 6,333 | 15.7% |
| 35 to 39 Minutes | 1,143 | 2.8% |
| 40 to 44 Minutes | 1,746 | 4.3% |
| 45 to 59 Minutes | 3,642 | 9.0% |
| 60 to 89 Minutes | 2,857 | 7.1% |
| 90 or more Minutes | 1,098 | 2.7% |
Commute Time by Sex in Conroe
The most common commute times in Conroe are 15 to 19 minutes (3,981 commuters, 17.3%) for males and 20 to 24 minutes (2,914 commuters, 16.8%) for females.
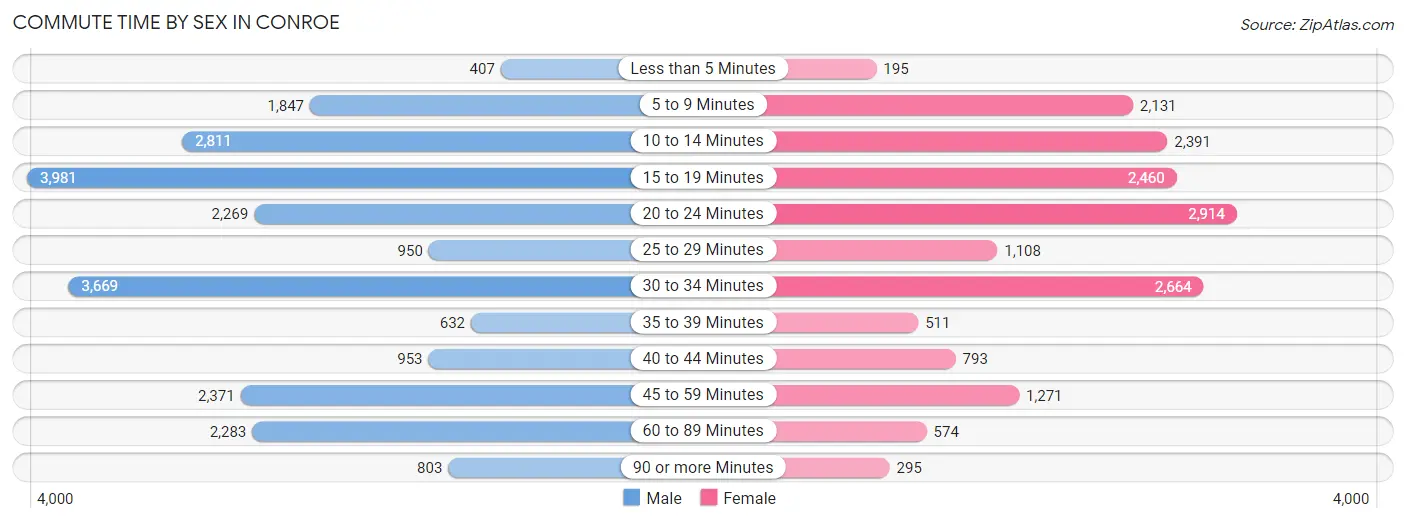
| Commute Time | Male | Female |
| Less than 5 Minutes | 407 (1.8%) | 195 (1.1%) |
| 5 to 9 Minutes | 1,847 (8.0%) | 2,131 (12.3%) |
| 10 to 14 Minutes | 2,811 (12.2%) | 2,391 (13.8%) |
| 15 to 19 Minutes | 3,981 (17.3%) | 2,460 (14.2%) |
| 20 to 24 Minutes | 2,269 (9.9%) | 2,914 (16.8%) |
| 25 to 29 Minutes | 950 (4.1%) | 1,108 (6.4%) |
| 30 to 34 Minutes | 3,669 (16.0%) | 2,664 (15.4%) |
| 35 to 39 Minutes | 632 (2.8%) | 511 (2.9%) |
| 40 to 44 Minutes | 953 (4.2%) | 793 (4.6%) |
| 45 to 59 Minutes | 2,371 (10.3%) | 1,271 (7.3%) |
| 60 to 89 Minutes | 2,283 (9.9%) | 574 (3.3%) |
| 90 or more Minutes | 803 (3.5%) | 295 (1.7%) |
Time of Departure to Work by Sex in Conroe
The most frequent times of departure to work in Conroe are 7:00 AM to 7:29 AM (3,671, 16.0%) for males and 7:00 AM to 7:29 AM (3,131, 18.1%) for females.
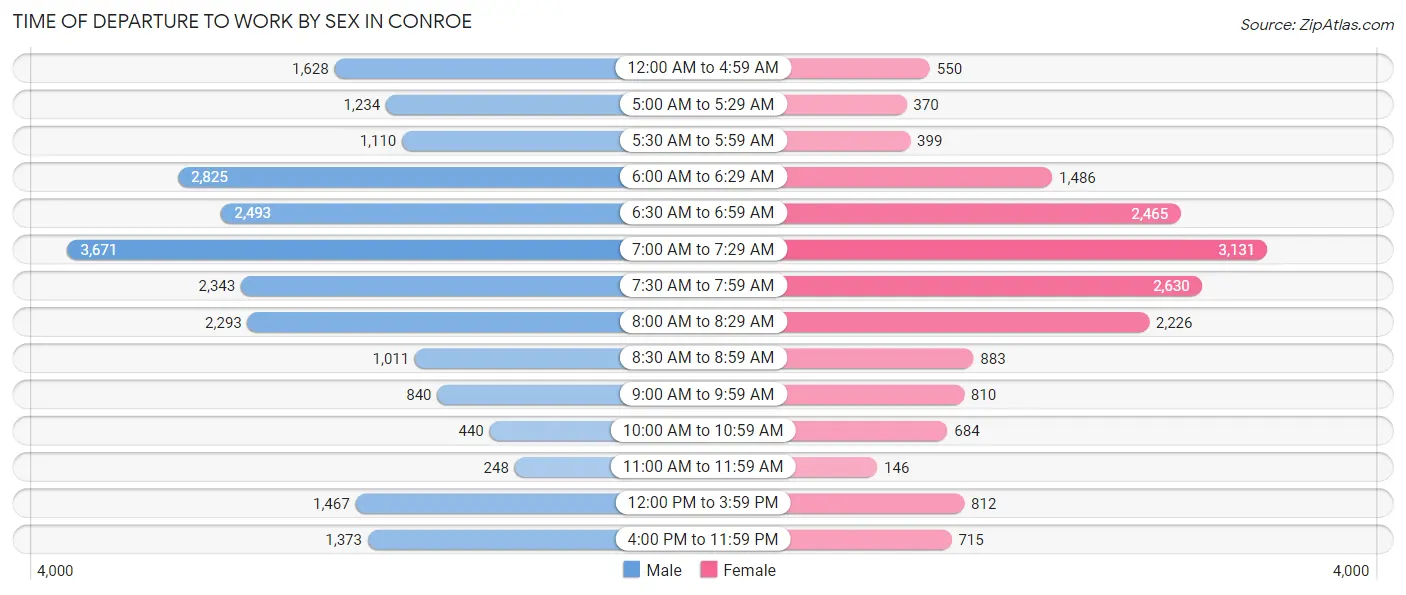
| Time of Departure | Male | Female |
| 12:00 AM to 4:59 AM | 1,628 (7.1%) | 550 (3.2%) |
| 5:00 AM to 5:29 AM | 1,234 (5.4%) | 370 (2.1%) |
| 5:30 AM to 5:59 AM | 1,110 (4.8%) | 399 (2.3%) |
| 6:00 AM to 6:29 AM | 2,825 (12.3%) | 1,486 (8.6%) |
| 6:30 AM to 6:59 AM | 2,493 (10.8%) | 2,465 (14.2%) |
| 7:00 AM to 7:29 AM | 3,671 (16.0%) | 3,131 (18.1%) |
| 7:30 AM to 7:59 AM | 2,343 (10.2%) | 2,630 (15.2%) |
| 8:00 AM to 8:29 AM | 2,293 (10.0%) | 2,226 (12.9%) |
| 8:30 AM to 8:59 AM | 1,011 (4.4%) | 883 (5.1%) |
| 9:00 AM to 9:59 AM | 840 (3.7%) | 810 (4.7%) |
| 10:00 AM to 10:59 AM | 440 (1.9%) | 684 (4.0%) |
| 11:00 AM to 11:59 AM | 248 (1.1%) | 146 (0.8%) |
| 12:00 PM to 3:59 PM | 1,467 (6.4%) | 812 (4.7%) |
| 4:00 PM to 11:59 PM | 1,373 (6.0%) | 715 (4.1%) |
| Total | 22,976 (100.0%) | 17,307 (100.0%) |
Housing Occupancy in Conroe
Occupancy by Ownership in Conroe
Of the total 35,433 dwellings in Conroe, owner-occupied units account for 19,877 (56.1%), while renter-occupied units make up 15,556 (43.9%).
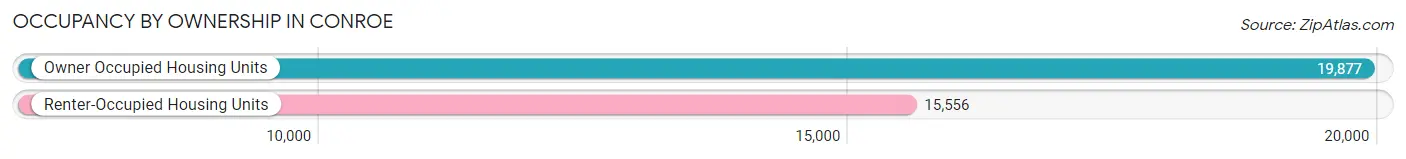
| Occupancy | # Housing Units | % Housing Units |
| Owner Occupied Housing Units | 19,877 | 56.1% |
| Renter-Occupied Housing Units | 15,556 | 43.9% |
| Total Occupied Housing Units | 35,433 | 100.0% |
Occupancy by Household Size in Conroe
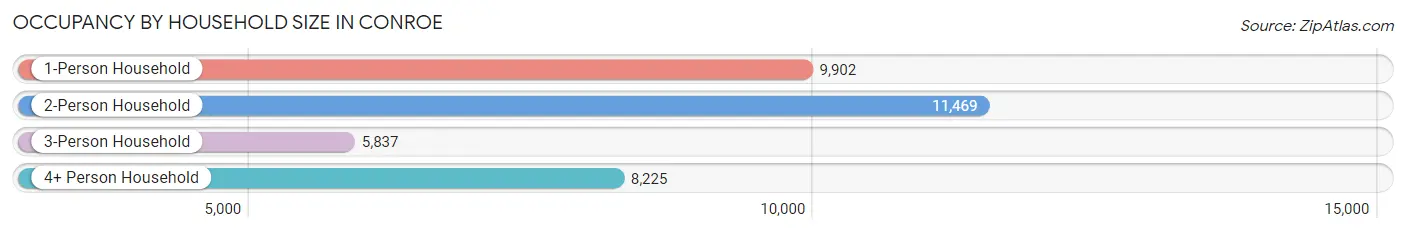
| Household Size | # Housing Units | % Housing Units |
| 1-Person Household | 9,902 | 28.0% |
| 2-Person Household | 11,469 | 32.4% |
| 3-Person Household | 5,837 | 16.5% |
| 4+ Person Household | 8,225 | 23.2% |
| Total Housing Units | 35,433 | 100.0% |
Occupancy by Ownership by Household Size in Conroe
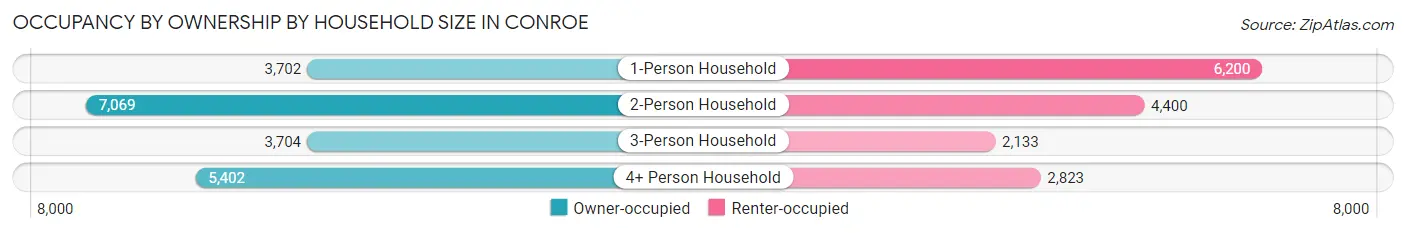
| Household Size | Owner-occupied | Renter-occupied |
| 1-Person Household | 3,702 (37.4%) | 6,200 (62.6%) |
| 2-Person Household | 7,069 (61.6%) | 4,400 (38.4%) |
| 3-Person Household | 3,704 (63.5%) | 2,133 (36.5%) |
| 4+ Person Household | 5,402 (65.7%) | 2,823 (34.3%) |
| Total Housing Units | 19,877 (56.1%) | 15,556 (43.9%) |
Occupancy by Educational Attainment in Conroe
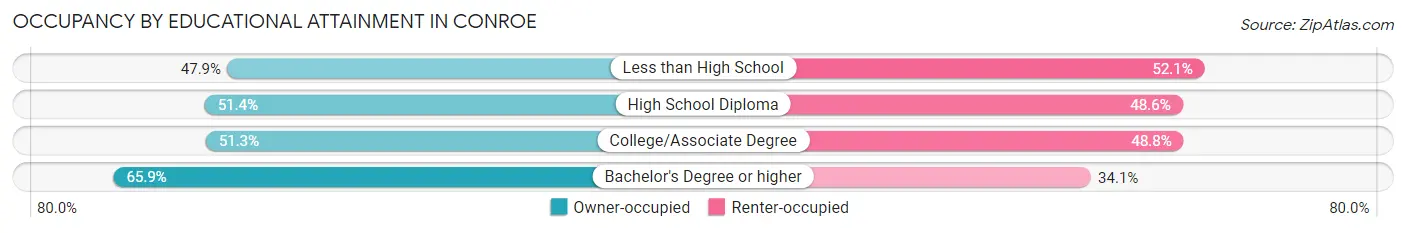
| Household Size | Owner-occupied | Renter-occupied |
| Less than High School | 1,899 (47.9%) | 2,064 (52.1%) |
| High School Diploma | 3,695 (51.4%) | 3,491 (48.6%) |
| College/Associate Degree | 6,016 (51.2%) | 5,723 (48.7%) |
| Bachelor's Degree or higher | 8,267 (65.9%) | 4,278 (34.1%) |
Occupancy by Age of Householder in Conroe
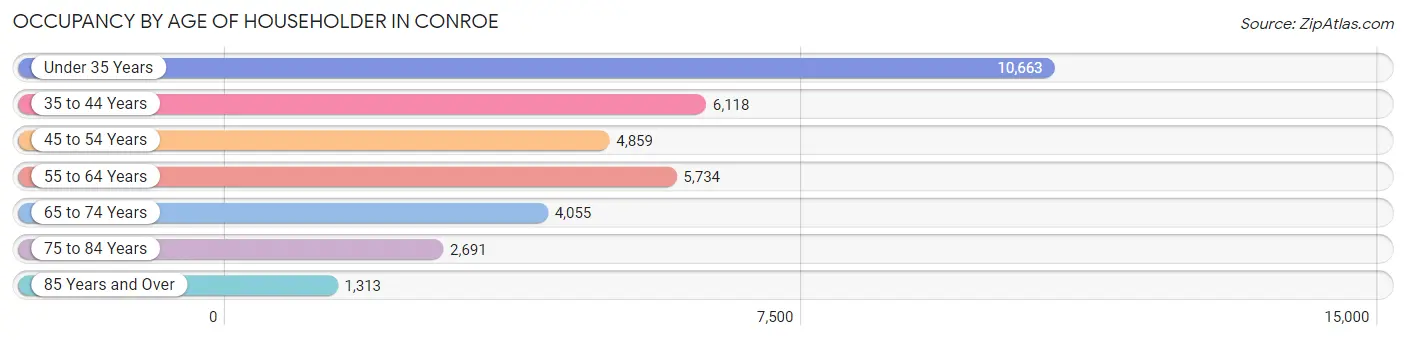
| Age Bracket | # Households | % Households |
| Under 35 Years | 10,663 | 30.1% |
| 35 to 44 Years | 6,118 | 17.3% |
| 45 to 54 Years | 4,859 | 13.7% |
| 55 to 64 Years | 5,734 | 16.2% |
| 65 to 74 Years | 4,055 | 11.4% |
| 75 to 84 Years | 2,691 | 7.6% |
| 85 Years and Over | 1,313 | 3.7% |
| Total | 35,433 | 100.0% |
Housing Finances in Conroe
Median Income by Occupancy in Conroe
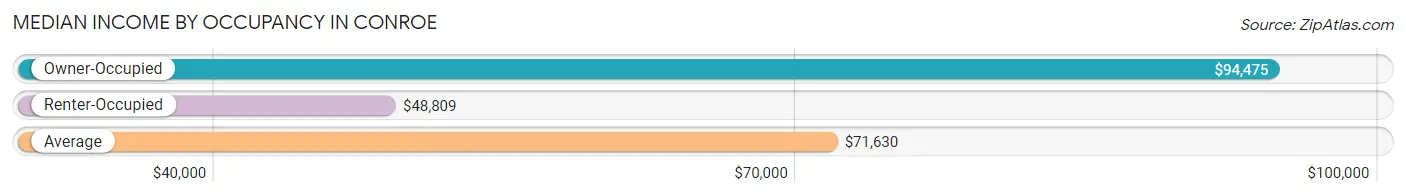
| Occupancy Type | # Households | Median Income |
| Owner-Occupied | 19,877 (56.1%) | $94,475 |
| Renter-Occupied | 15,556 (43.9%) | $48,809 |
| Average | 35,433 (100.0%) | $71,630 |
Occupancy by Householder Income Bracket in Conroe
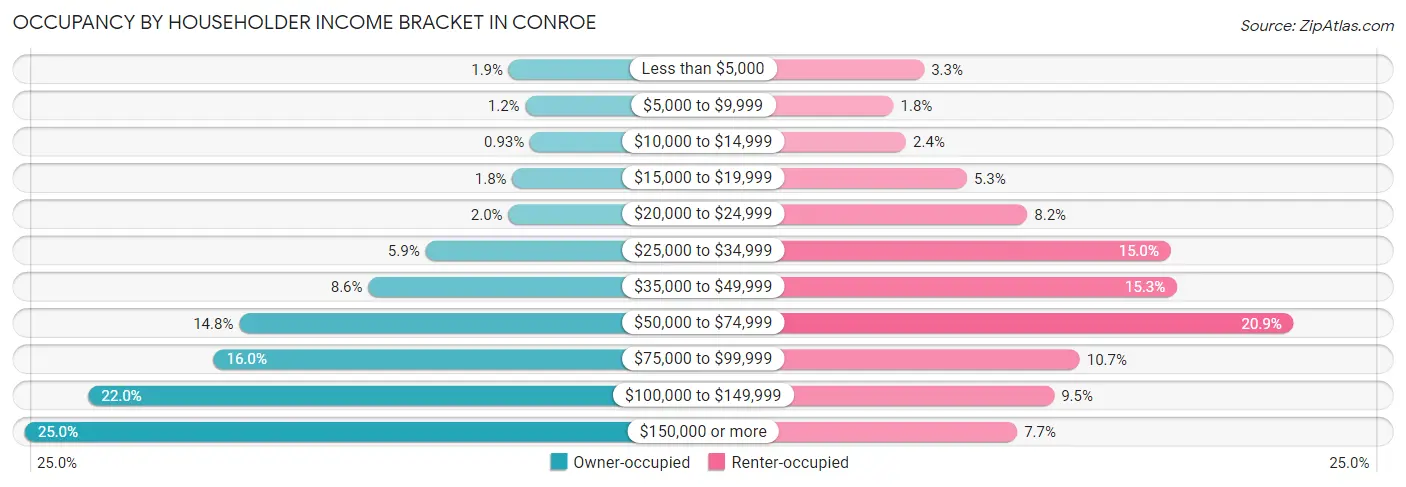
| Income Bracket | Owner-occupied | Renter-occupied |
| Less than $5,000 | 385 (1.9%) | 508 (3.3%) |
| $5,000 to $9,999 | 228 (1.1%) | 282 (1.8%) |
| $10,000 to $14,999 | 184 (0.9%) | 375 (2.4%) |
| $15,000 to $19,999 | 352 (1.8%) | 826 (5.3%) |
| $20,000 to $24,999 | 389 (2.0%) | 1,273 (8.2%) |
| $25,000 to $34,999 | 1,175 (5.9%) | 2,335 (15.0%) |
| $35,000 to $49,999 | 1,716 (8.6%) | 2,381 (15.3%) |
| $50,000 to $74,999 | 2,937 (14.8%) | 3,245 (20.9%) |
| $75,000 to $99,999 | 3,180 (16.0%) | 1,661 (10.7%) |
| $100,000 to $149,999 | 4,364 (22.0%) | 1,472 (9.5%) |
| $150,000 or more | 4,967 (25.0%) | 1,198 (7.7%) |
| Total | 19,877 (100.0%) | 15,556 (100.0%) |
Monthly Housing Cost Tiers in Conroe
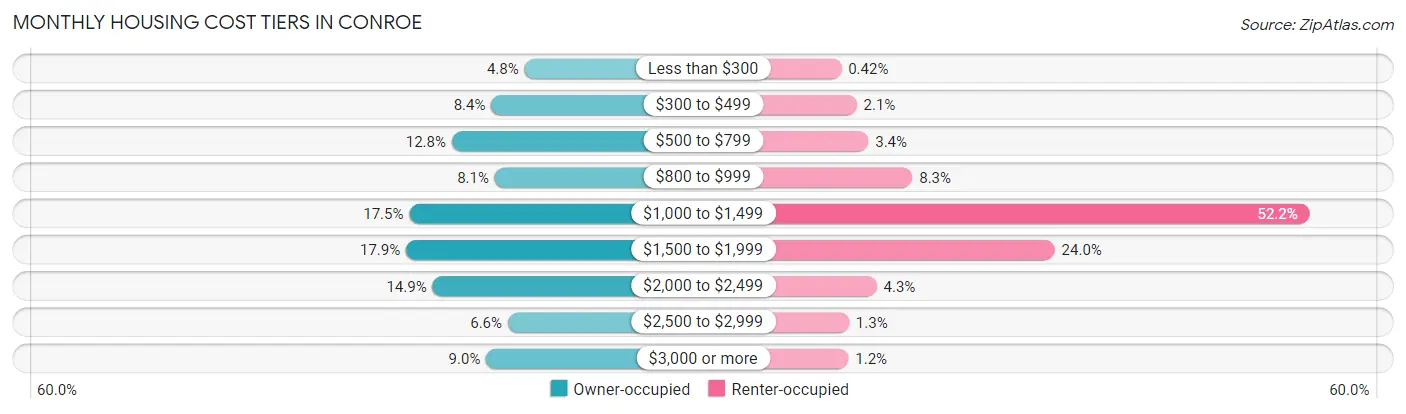
| Monthly Cost | Owner-occupied | Renter-occupied |
| Less than $300 | 948 (4.8%) | 66 (0.4%) |
| $300 to $499 | 1,678 (8.4%) | 330 (2.1%) |
| $500 to $799 | 2,547 (12.8%) | 530 (3.4%) |
| $800 to $999 | 1,603 (8.1%) | 1,287 (8.3%) |
| $1,000 to $1,499 | 3,479 (17.5%) | 8,113 (52.1%) |
| $1,500 to $1,999 | 3,550 (17.9%) | 3,733 (24.0%) |
| $2,000 to $2,499 | 2,970 (14.9%) | 674 (4.3%) |
| $2,500 to $2,999 | 1,314 (6.6%) | 198 (1.3%) |
| $3,000 or more | 1,788 (9.0%) | 188 (1.2%) |
| Total | 19,877 (100.0%) | 15,556 (100.0%) |
Physical Housing Characteristics in Conroe
Housing Structures in Conroe
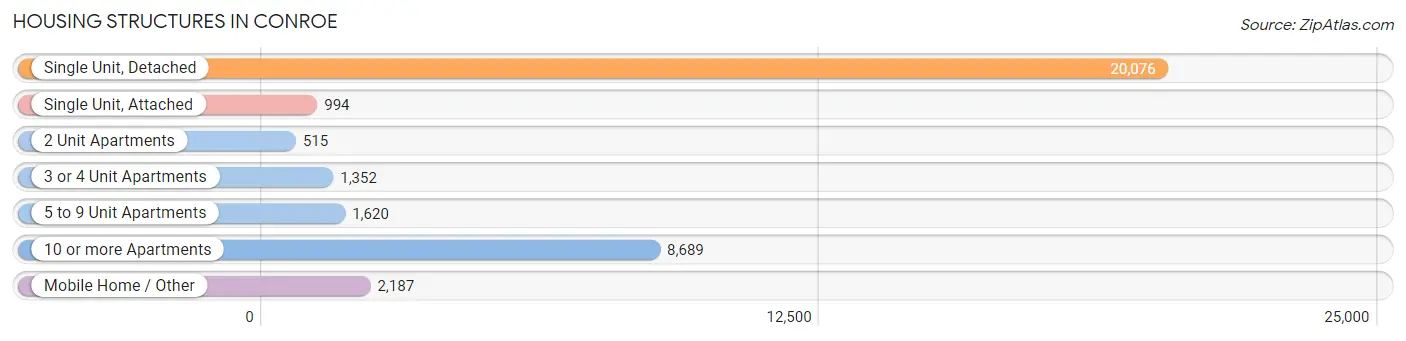
| Structure Type | # Housing Units | % Housing Units |
| Single Unit, Detached | 20,076 | 56.7% |
| Single Unit, Attached | 994 | 2.8% |
| 2 Unit Apartments | 515 | 1.5% |
| 3 or 4 Unit Apartments | 1,352 | 3.8% |
| 5 to 9 Unit Apartments | 1,620 | 4.6% |
| 10 or more Apartments | 8,689 | 24.5% |
| Mobile Home / Other | 2,187 | 6.2% |
| Total | 35,433 | 100.0% |
Housing Structures by Occupancy in Conroe
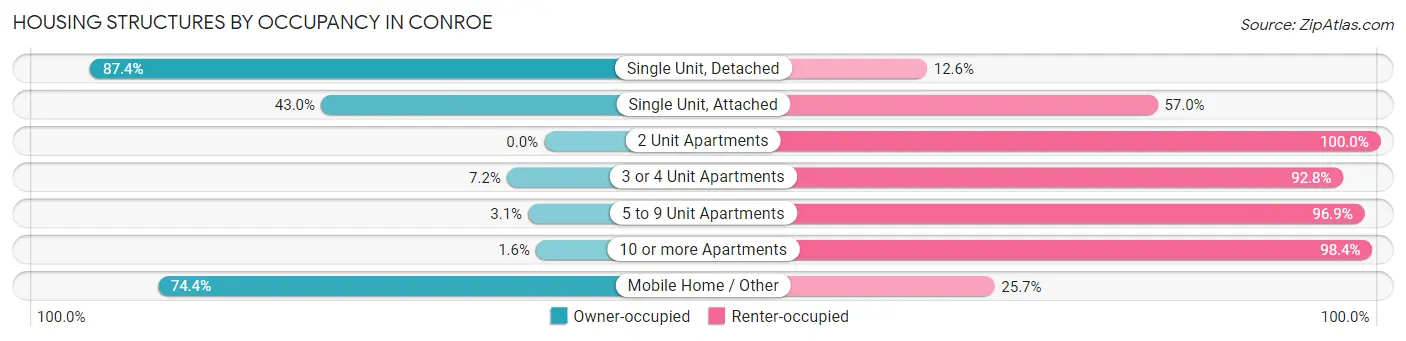
| Structure Type | Owner-occupied | Renter-occupied |
| Single Unit, Detached | 17,541 (87.4%) | 2,535 (12.6%) |
| Single Unit, Attached | 427 (43.0%) | 567 (57.0%) |
| 2 Unit Apartments | 0 (0.0%) | 515 (100.0%) |
| 3 or 4 Unit Apartments | 97 (7.2%) | 1,255 (92.8%) |
| 5 to 9 Unit Apartments | 50 (3.1%) | 1,570 (96.9%) |
| 10 or more Apartments | 136 (1.6%) | 8,553 (98.4%) |
| Mobile Home / Other | 1,626 (74.4%) | 561 (25.7%) |
| Total | 19,877 (56.1%) | 15,556 (43.9%) |
Housing Structures by Number of Rooms in Conroe
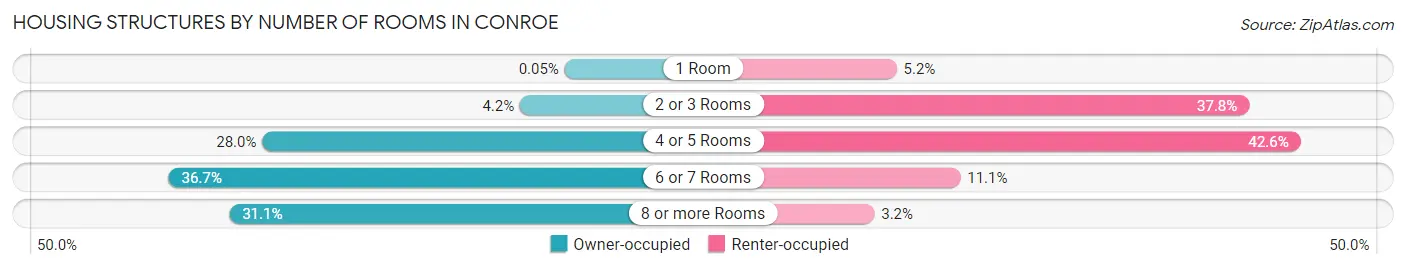
| Number of Rooms | Owner-occupied | Renter-occupied |
| 1 Room | 10 (0.1%) | 815 (5.2%) |
| 2 or 3 Rooms | 831 (4.2%) | 5,887 (37.8%) |
| 4 or 5 Rooms | 5,570 (28.0%) | 6,627 (42.6%) |
| 6 or 7 Rooms | 7,291 (36.7%) | 1,732 (11.1%) |
| 8 or more Rooms | 6,175 (31.1%) | 495 (3.2%) |
| Total | 19,877 (100.0%) | 15,556 (100.0%) |
Housing Structure by Heating Type in Conroe
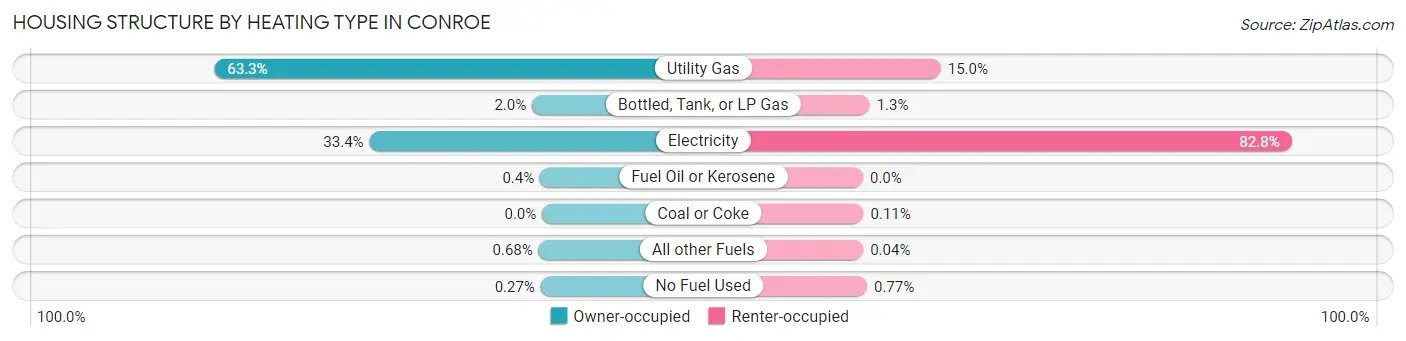
| Heating Type | Owner-occupied | Renter-occupied |
| Utility Gas | 12,587 (63.3%) | 2,336 (15.0%) |
| Bottled, Tank, or LP Gas | 387 (1.9%) | 200 (1.3%) |
| Electricity | 6,633 (33.4%) | 12,877 (82.8%) |
| Fuel Oil or Kerosene | 80 (0.4%) | 0 (0.0%) |
| Coal or Coke | 0 (0.0%) | 17 (0.1%) |
| All other Fuels | 136 (0.7%) | 6 (0.0%) |
| No Fuel Used | 54 (0.3%) | 120 (0.8%) |
| Total | 19,877 (100.0%) | 15,556 (100.0%) |
Household Vehicle Usage in Conroe
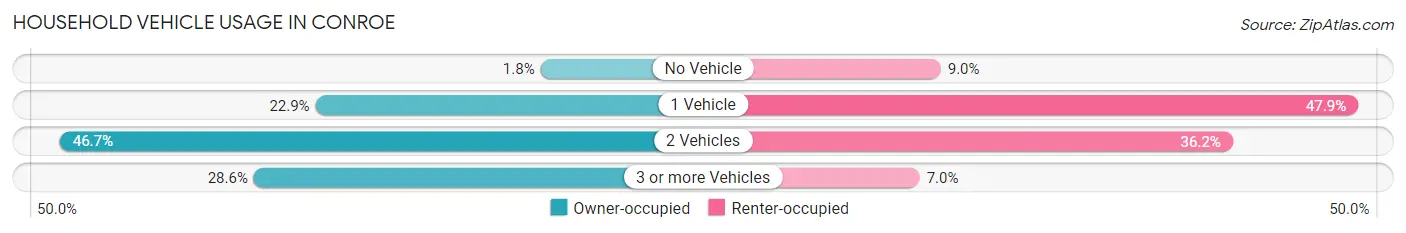
| Vehicles per Household | Owner-occupied | Renter-occupied |
| No Vehicle | 365 (1.8%) | 1,392 (8.9%) |
| 1 Vehicle | 4,541 (22.9%) | 7,449 (47.9%) |
| 2 Vehicles | 9,284 (46.7%) | 5,629 (36.2%) |
| 3 or more Vehicles | 5,687 (28.6%) | 1,086 (7.0%) |
| Total | 19,877 (100.0%) | 15,556 (100.0%) |
Real Estate & Mortgages in Conroe
Real Estate and Mortgage Overview in Conroe
| Characteristic | Without Mortgage | With Mortgage |
| Housing Units | 8,048 | 11,829 |
| Median Property Value | $213,000 | $280,700 |
| Median Household Income | $71,413 | $3,718 |
| Monthly Housing Costs | $654 | $1,746 |
| Real Estate Taxes | $2,980 | $244 |
Property Value by Mortgage Status in Conroe
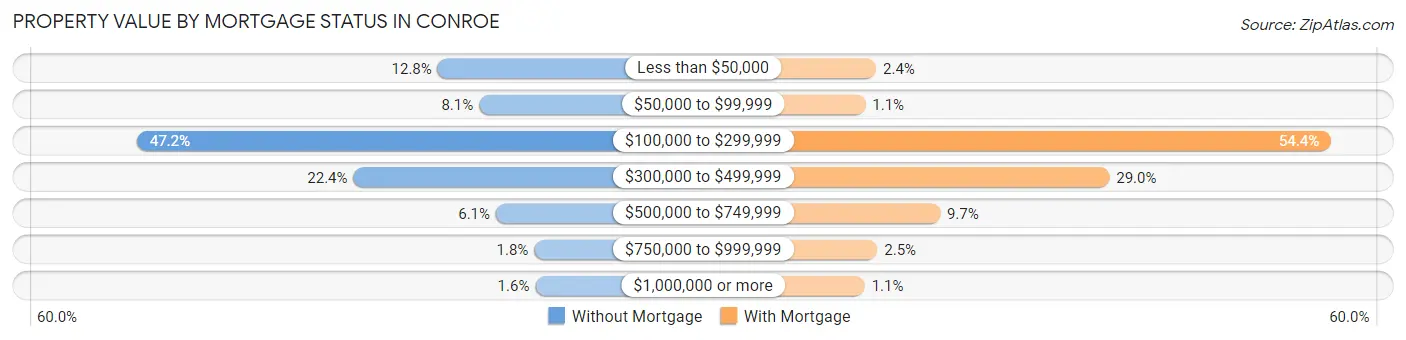
| Property Value | Without Mortgage | With Mortgage |
| Less than $50,000 | 1,030 (12.8%) | 278 (2.4%) |
| $50,000 to $99,999 | 649 (8.1%) | 132 (1.1%) |
| $100,000 to $299,999 | 3,796 (47.2%) | 6,429 (54.3%) |
| $300,000 to $499,999 | 1,805 (22.4%) | 3,431 (29.0%) |
| $500,000 to $749,999 | 494 (6.1%) | 1,141 (9.7%) |
| $750,000 to $999,999 | 142 (1.8%) | 294 (2.5%) |
| $1,000,000 or more | 132 (1.6%) | 124 (1.1%) |
| Total | 8,048 (100.0%) | 11,829 (100.0%) |
Household Income by Mortgage Status in Conroe
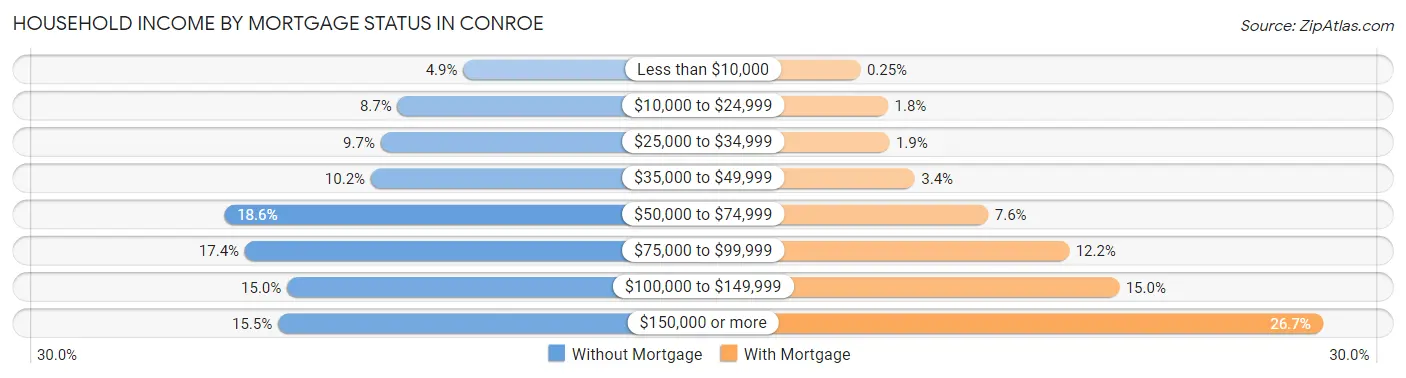
| Household Income | Without Mortgage | With Mortgage |
| Less than $10,000 | 397 (4.9%) | 29 (0.3%) |
| $10,000 to $24,999 | 699 (8.7%) | 216 (1.8%) |
| $25,000 to $34,999 | 777 (9.7%) | 226 (1.9%) |
| $35,000 to $49,999 | 822 (10.2%) | 398 (3.4%) |
| $50,000 to $74,999 | 1,496 (18.6%) | 894 (7.6%) |
| $75,000 to $99,999 | 1,401 (17.4%) | 1,441 (12.2%) |
| $100,000 to $149,999 | 1,207 (15.0%) | 1,779 (15.0%) |
| $150,000 or more | 1,249 (15.5%) | 3,157 (26.7%) |
| Total | 8,048 (100.0%) | 11,829 (100.0%) |
Property Value to Household Income Ratio in Conroe
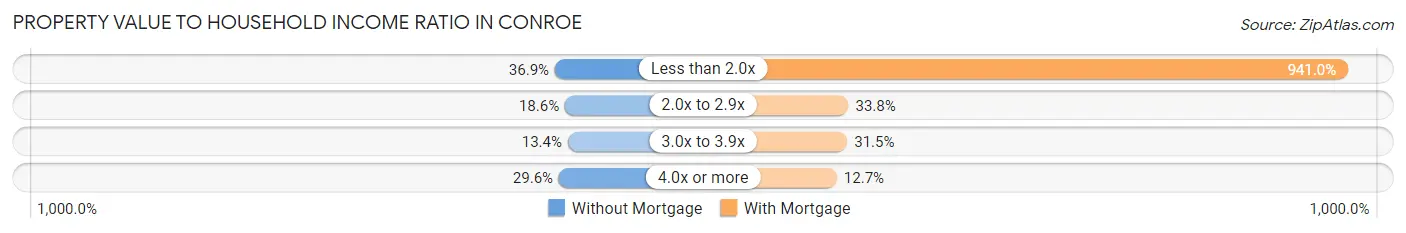
| Value-to-Income Ratio | Without Mortgage | With Mortgage |
| Less than 2.0x | 2,969 (36.9%) | 111,315 (941.0%) |
| 2.0x to 2.9x | 1,496 (18.6%) | 3,998 (33.8%) |
| 3.0x to 3.9x | 1,081 (13.4%) | 3,727 (31.5%) |
| 4.0x or more | 2,382 (29.6%) | 1,499 (12.7%) |
| Total | 8,048 (100.0%) | 11,829 (100.0%) |
Real Estate Taxes by Mortgage Status in Conroe
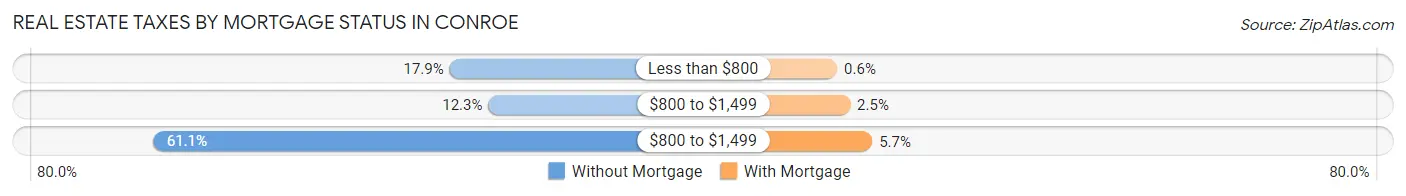
| Property Taxes | Without Mortgage | With Mortgage |
| Less than $800 | 1,441 (17.9%) | 71 (0.6%) |
| $800 to $1,499 | 986 (12.2%) | 296 (2.5%) |
| $800 to $1,499 | 4,919 (61.1%) | 678 (5.7%) |
| Total | 8,048 (100.0%) | 11,829 (100.0%) |
Health & Disability in Conroe
Health Insurance Coverage by Age in Conroe
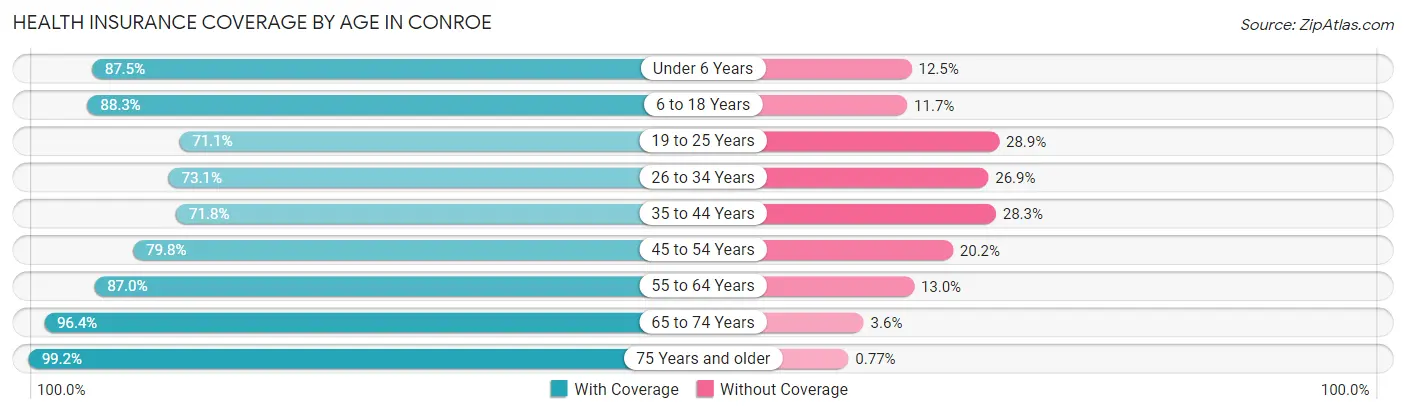
| Age Bracket | With Coverage | Without Coverage |
| Under 6 Years | 7,132 (87.5%) | 1,023 (12.5%) |
| 6 to 18 Years | 13,822 (88.3%) | 1,835 (11.7%) |
| 19 to 25 Years | 7,709 (71.1%) | 3,128 (28.9%) |
| 26 to 34 Years | 9,600 (73.1%) | 3,525 (26.9%) |
| 35 to 44 Years | 8,400 (71.8%) | 3,308 (28.2%) |
| 45 to 54 Years | 7,388 (79.8%) | 1,875 (20.2%) |
| 55 to 64 Years | 8,267 (87.0%) | 1,234 (13.0%) |
| 65 to 74 Years | 6,640 (96.4%) | 249 (3.6%) |
| 75 Years and older | 5,905 (99.2%) | 46 (0.8%) |
| Total | 74,863 (82.2%) | 16,223 (17.8%) |
Health Insurance Coverage by Citizenship Status in Conroe
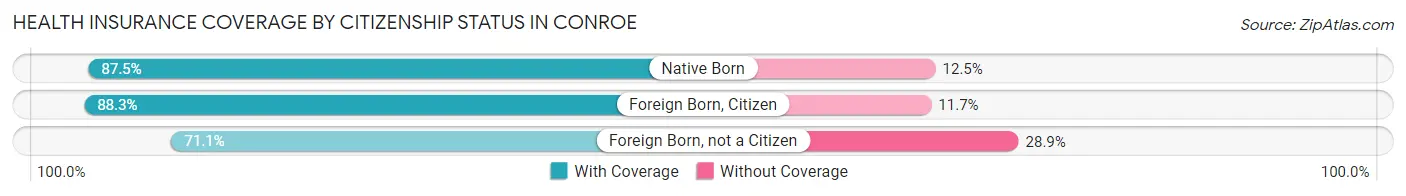
| Citizenship Status | With Coverage | Without Coverage |
| Native Born | 7,132 (87.5%) | 1,023 (12.5%) |
| Foreign Born, Citizen | 13,822 (88.3%) | 1,835 (11.7%) |
| Foreign Born, not a Citizen | 7,709 (71.1%) | 3,128 (28.9%) |
Health Insurance Coverage by Household Income in Conroe
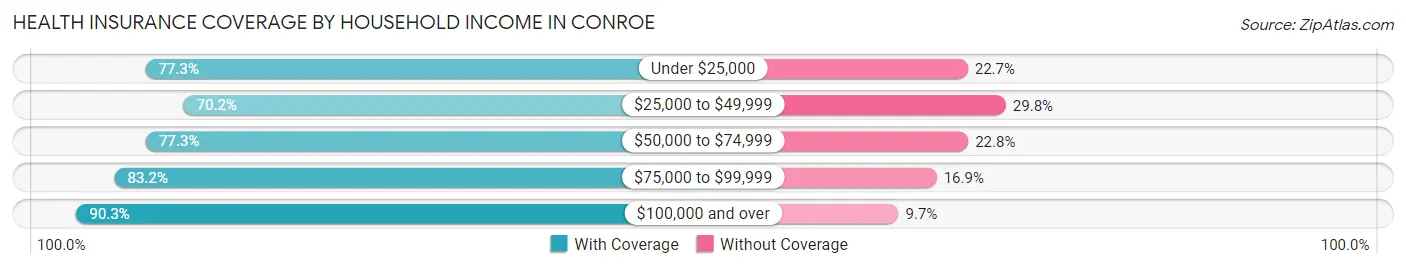
| Household Income | With Coverage | Without Coverage |
| Under $25,000 | 6,125 (77.3%) | 1,796 (22.7%) |
| $25,000 to $49,999 | 11,740 (70.2%) | 4,987 (29.8%) |
| $50,000 to $74,999 | 11,466 (77.2%) | 3,377 (22.8%) |
| $75,000 to $99,999 | 11,619 (83.2%) | 2,355 (16.9%) |
| $100,000 and over | 33,702 (90.3%) | 3,626 (9.7%) |
Public vs Private Health Insurance Coverage by Age in Conroe
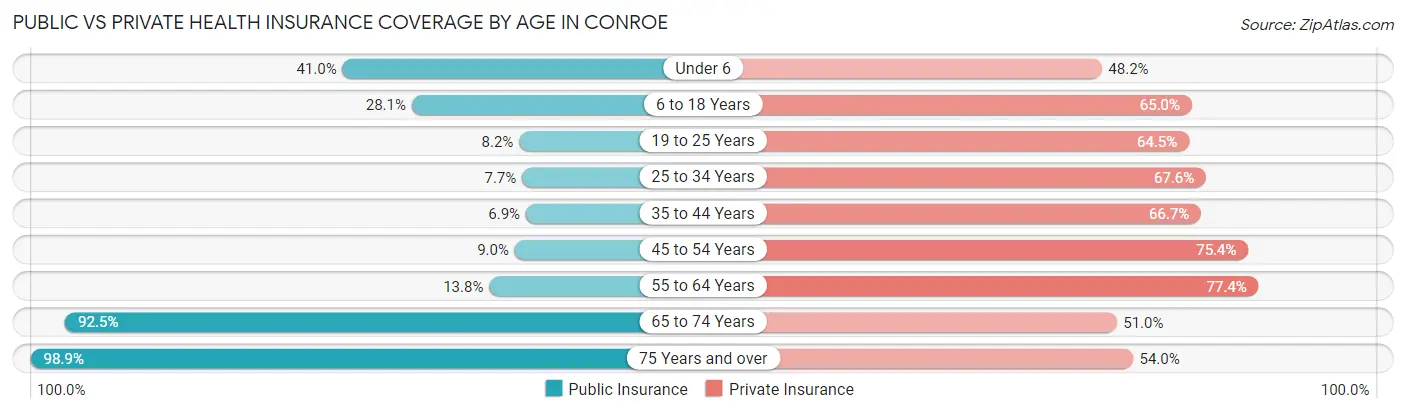
| Age Bracket | Public Insurance | Private Insurance |
| Under 6 | 3,343 (41.0%) | 3,930 (48.2%) |
| 6 to 18 Years | 4,405 (28.1%) | 10,173 (65.0%) |
| 19 to 25 Years | 889 (8.2%) | 6,985 (64.5%) |
| 25 to 34 Years | 1,006 (7.7%) | 8,872 (67.6%) |
| 35 to 44 Years | 813 (6.9%) | 7,809 (66.7%) |
| 45 to 54 Years | 835 (9.0%) | 6,988 (75.4%) |
| 55 to 64 Years | 1,307 (13.8%) | 7,351 (77.4%) |
| 65 to 74 Years | 6,371 (92.5%) | 3,510 (50.9%) |
| 75 Years and over | 5,885 (98.9%) | 3,212 (54.0%) |
| Total | 24,854 (27.3%) | 58,830 (64.6%) |
Disability Status by Sex by Age in Conroe
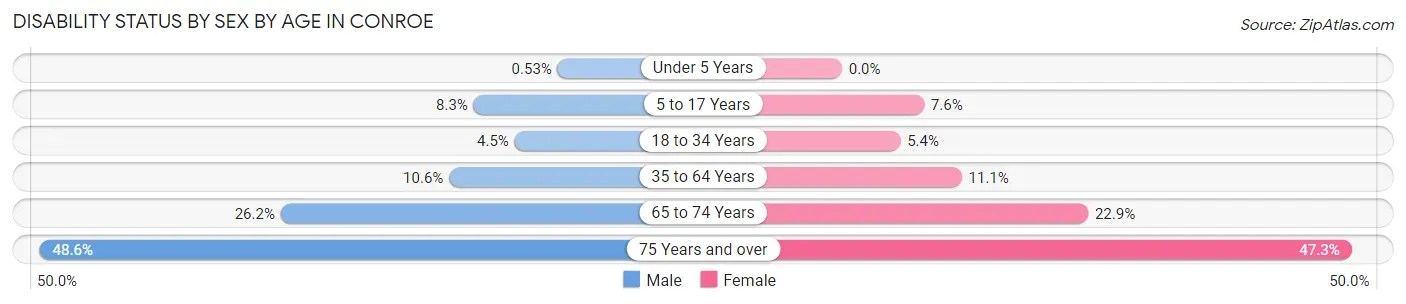
| Age Bracket | Male | Female |
| Under 5 Years | 20 (0.5%) | 0 (0.0%) |
| 5 to 17 Years | 690 (8.3%) | 569 (7.6%) |
| 18 to 34 Years | 581 (4.5%) | 676 (5.4%) |
| 35 to 64 Years | 1,574 (10.6%) | 1,738 (11.1%) |
| 65 to 74 Years | 835 (26.2%) | 847 (22.9%) |
| 75 Years and over | 1,232 (48.6%) | 1,616 (47.3%) |
Disability Class by Sex by Age in Conroe
Disability Class: Hearing Difficulty
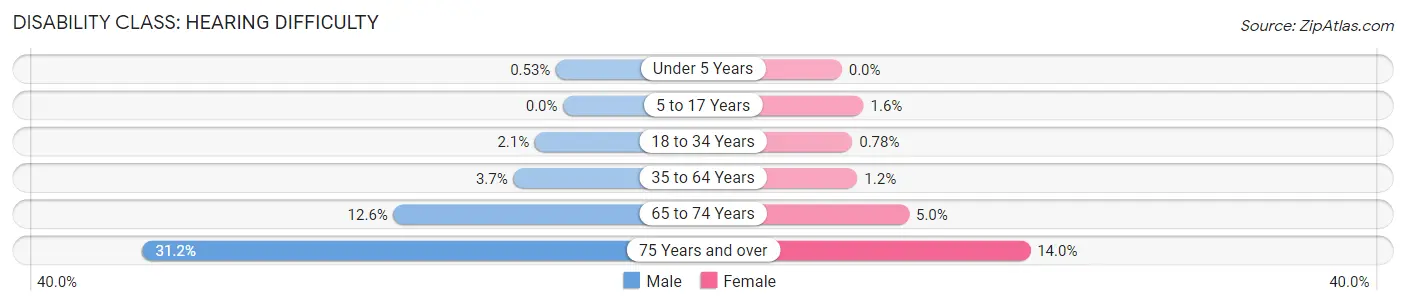
| Age Bracket | Male | Female |
| Under 5 Years | 20 (0.5%) | 0 (0.0%) |
| 5 to 17 Years | 0 (0.0%) | 121 (1.6%) |
| 18 to 34 Years | 270 (2.1%) | 97 (0.8%) |
| 35 to 64 Years | 549 (3.7%) | 181 (1.2%) |
| 65 to 74 Years | 401 (12.6%) | 185 (5.0%) |
| 75 Years and over | 792 (31.2%) | 478 (14.0%) |
Disability Class: Vision Difficulty
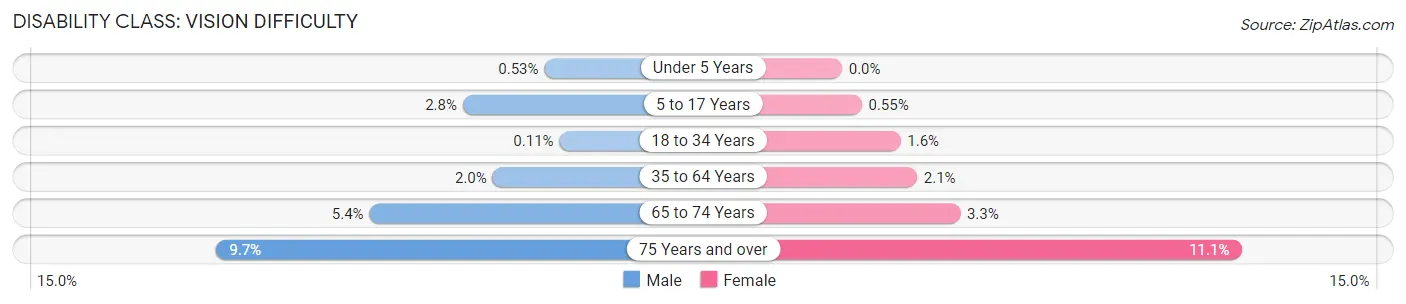
| Age Bracket | Male | Female |
| Under 5 Years | 20 (0.5%) | 0 (0.0%) |
| 5 to 17 Years | 232 (2.8%) | 41 (0.5%) |
| 18 to 34 Years | 14 (0.1%) | 203 (1.6%) |
| 35 to 64 Years | 293 (2.0%) | 327 (2.1%) |
| 65 to 74 Years | 172 (5.4%) | 122 (3.3%) |
| 75 Years and over | 245 (9.7%) | 380 (11.1%) |
Disability Class: Cognitive Difficulty
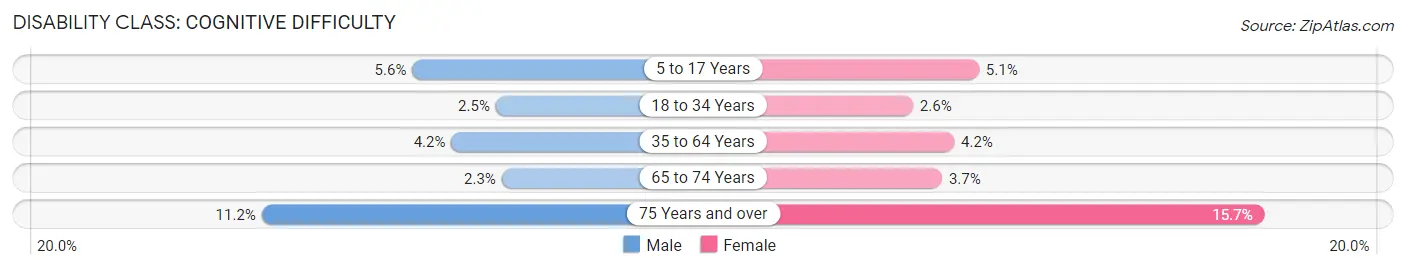
| Age Bracket | Male | Female |
| 5 to 17 Years | 465 (5.6%) | 380 (5.1%) |
| 18 to 34 Years | 322 (2.5%) | 330 (2.6%) |
| 35 to 64 Years | 617 (4.2%) | 651 (4.2%) |
| 65 to 74 Years | 73 (2.3%) | 138 (3.7%) |
| 75 Years and over | 284 (11.2%) | 536 (15.7%) |
Disability Class: Ambulatory Difficulty
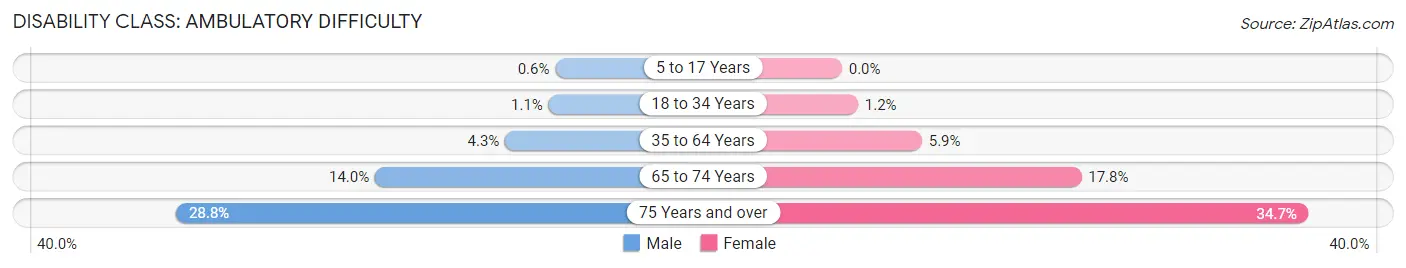
| Age Bracket | Male | Female |
| 5 to 17 Years | 50 (0.6%) | 0 (0.0%) |
| 18 to 34 Years | 140 (1.1%) | 149 (1.2%) |
| 35 to 64 Years | 642 (4.3%) | 928 (5.9%) |
| 65 to 74 Years | 445 (14.0%) | 659 (17.8%) |
| 75 Years and over | 729 (28.8%) | 1,184 (34.7%) |
Disability Class: Self-Care Difficulty
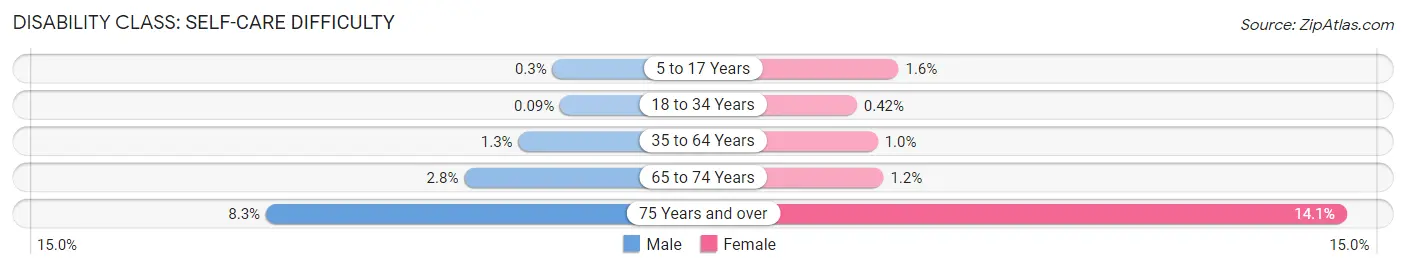
| Age Bracket | Male | Female |
| 5 to 17 Years | 25 (0.3%) | 118 (1.6%) |
| 18 to 34 Years | 11 (0.1%) | 53 (0.4%) |
| 35 to 64 Years | 186 (1.3%) | 157 (1.0%) |
| 65 to 74 Years | 88 (2.8%) | 43 (1.2%) |
| 75 Years and over | 210 (8.3%) | 480 (14.1%) |
Technology Access in Conroe
Computing Device Access in Conroe
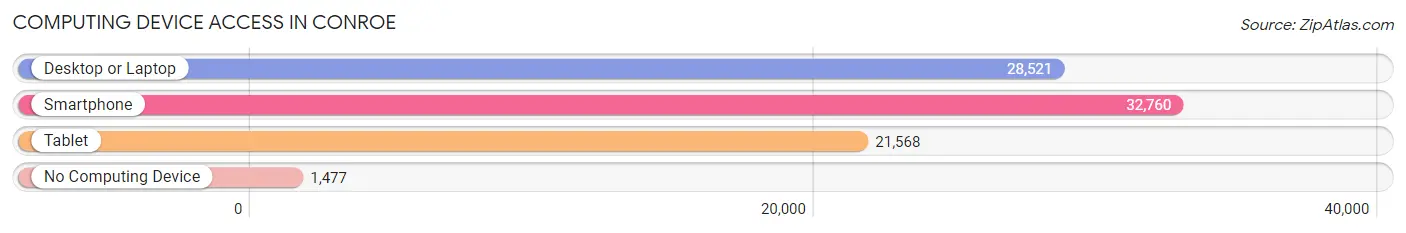
| Device Type | # Households | % Households |
| Desktop or Laptop | 28,521 | 80.5% |
| Smartphone | 32,760 | 92.5% |
| Tablet | 21,568 | 60.9% |
| No Computing Device | 1,477 | 4.2% |
| Total | 35,433 | 100.0% |
Internet Access in Conroe
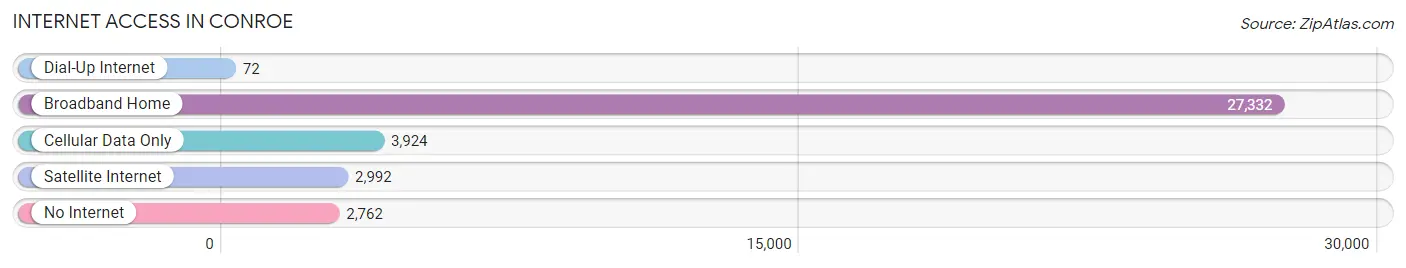
| Internet Type | # Households | % Households |
| Dial-Up Internet | 72 | 0.2% |
| Broadband Home | 27,332 | 77.1% |
| Cellular Data Only | 3,924 | 11.1% |
| Satellite Internet | 2,992 | 8.4% |
| No Internet | 2,762 | 7.8% |
| Total | 35,433 | 100.0% |
Conroe Summary
Conroe, Texas is a city located in Montgomery County, Texas, United States. It is the county seat of Montgomery County and is located about 40 miles north of Houston. The city is part of the Houston–The Woodlands–Sugar Land metropolitan area. As of the 2010 census, the city had a population of 56,207.
History
The area around Conroe was first settled in the 1830s by families from the Southern United States. The town was named after Isaac Conroe, a settler who arrived in the area in 1881. The town was officially incorporated in 1904.
In the early 20th century, Conroe was a small farming community, but it began to grow rapidly after the discovery of oil in the area in 1931. The city experienced a boom in the 1950s and 1960s, as the population grew from 4,000 to over 20,000.
Geography
Conroe is located in southeastern Montgomery County at 30°20'N 95°27'W (30.33, -95.45). It is bordered to the north by the city of Willis, to the east by the city of Shenandoah, to the south by the city of Oak Ridge North, and to the west by the city of The Woodlands.
The city is situated on the western edge of the Houston–The Woodlands–Sugar Land metropolitan area. It is about 40 miles north of downtown Houston and about 20 miles south of downtown The Woodlands.
The city has a total area of 33.3 square miles, of which 33.2 square miles is land and 0.1 square miles (0.3%) is water.
Economy
Conroe is a major economic center for Montgomery County and the Houston–The Woodlands–Sugar Land metropolitan area. The city is home to several major employers, including the Conroe Independent School District, the Conroe Regional Medical Center, and the Lone Star Executive Airport.
The city is also home to several major industrial and manufacturing companies, including Anadarko Petroleum Corporation, Chevron Phillips Chemical Company, and Huntsman Corporation.
Demographics
As of the 2010 census, there were 56,207 people, 19,890 households, and 14,845 families residing in the city. The population density was 1,694.3 people per square mile (653.3/km2). There were 21,845 housing units at an average density of 656.3 per square mile (253.2/km2).
The racial makeup of the city was 73.2% White, 11.3% African American, 0.7% Native American, 2.2% Asian, 0.1% Pacific Islander, 10.2% from other races, and 2.4% from two or more races. Hispanic or Latino of any race were 24.2% of the population.
The median income for a household in the city was $50,902, and the median income for a family was $60,945. Males had a median income of $41,945 versus $31,945 for females. The per capita income for the city was $24,845. About 8.7% of families and 11.2% of the population were below the poverty line, including 15.2% of those under age 18 and 8.2% of those age 65 or over.
Common Questions
What is Per Capita Income in Conroe?
Per Capita income in Conroe is $37,839.
What is the Median Family Income in Conroe?
Median Family Income in Conroe is $87,122.
What is the Median Household income in Conroe?
Median Household Income in Conroe is $71,630.
What is Income or Wage Gap in Conroe?
Income or Wage Gap in Conroe is 32.2%.
Women in Conroe earn 67.8 cents for every dollar earned by a man.
What is Family Income Deficit in Conroe?
Family Income Deficit in Conroe is $9,150.
Families that are below poverty line in Conroe earn $9,150 less on average than the poverty threshold level.
What is Inequality or Gini Index in Conroe?
Inequality or Gini Index in Conroe is 0.46.
What is the Total Population of Conroe?
Total Population of Conroe is 92,475.
What is the Total Male Population of Conroe?
Total Male Population of Conroe is 46,386.
What is the Total Female Population of Conroe?
Total Female Population of Conroe is 46,089.
What is the Ratio of Males per 100 Females in Conroe?
There are 100.64 Males per 100 Females in Conroe.
What is the Ratio of Females per 100 Males in Conroe?
There are 99.36 Females per 100 Males in Conroe.
What is the Median Population Age in Conroe?
Median Population Age in Conroe is 33.5 Years.
What is the Average Family Size in Conroe
Average Family Size in Conroe is 3.2 People.
What is the Average Household Size in Conroe
Average Household Size in Conroe is 2.6 People.
How Large is the Labor Force in Conroe?
There are 46,480 People in the Labor Forcein in Conroe.
What is the Percentage of People in the Labor Force in Conroe?
64.5% of People are in the Labor Force in Conroe.
What is the Unemployment Rate in Conroe?
Unemployment Rate in Conroe is 3.4%.