Hull, MA Map & Demographics
Hull Map
Hull Overview
$69,609
PER CAPITA INCOME
$155,979
AVG FAMILY INCOME
$128,022
AVG HOUSEHOLD INCOME
28.9%
WAGE / INCOME GAP [ % ]
71.1¢/ $1
WAGE / INCOME GAP [ $ ]
0.42
INEQUALITY / GINI INDEX
10,116
TOTAL POPULATION
4,656
MALE POPULATION
5,460
FEMALE POPULATION
85.27
MALES / 100 FEMALES
117.27
FEMALES / 100 MALES
54.2
MEDIAN AGE
3.0
AVG FAMILY SIZE
2.2
AVG HOUSEHOLD SIZE
6,442
LABOR FORCE [ PEOPLE ]
71.4%
PERCENT IN LABOR FORCE
4.0%
UNEMPLOYMENT RATE
Hull Zip Codes
Hull Area Codes
Income in Hull
Income Overview in Hull
Per Capita Income in Hull is $69,609, while median incomes of families and households are $155,979 and $128,022 respectively.
| Characteristic | Number | Measure |
| Per Capita Income | 10,116 | $69,609 |
| Median Family Income | 2,593 | $155,979 |
| Mean Family Income | 2,593 | $189,793 |
| Median Household Income | 4,504 | $128,022 |
| Mean Household Income | 4,504 | $156,247 |
| Income Deficit | 2,593 | $0 |
| Wage / Income Gap (%) | 10,116 | 28.87% |
| Wage / Income Gap ($) | 10,116 | 71.13¢ per $1 |
| Gini / Inequality Index | 10,116 | 0.42 |
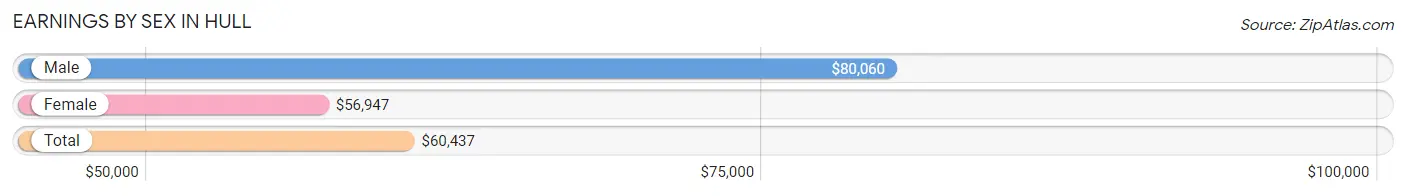
Earnings by Sex in Hull
Average Earnings in Hull are $60,437, $80,060 for men and $56,947 for women, a difference of 28.9%.
| Sex | Number | Average Earnings |
| Male | 2,933 (44.8%) | $80,060 |
| Female | 3,616 (55.2%) | $56,947 |
| Total | 6,549 (100.0%) | $60,437 |
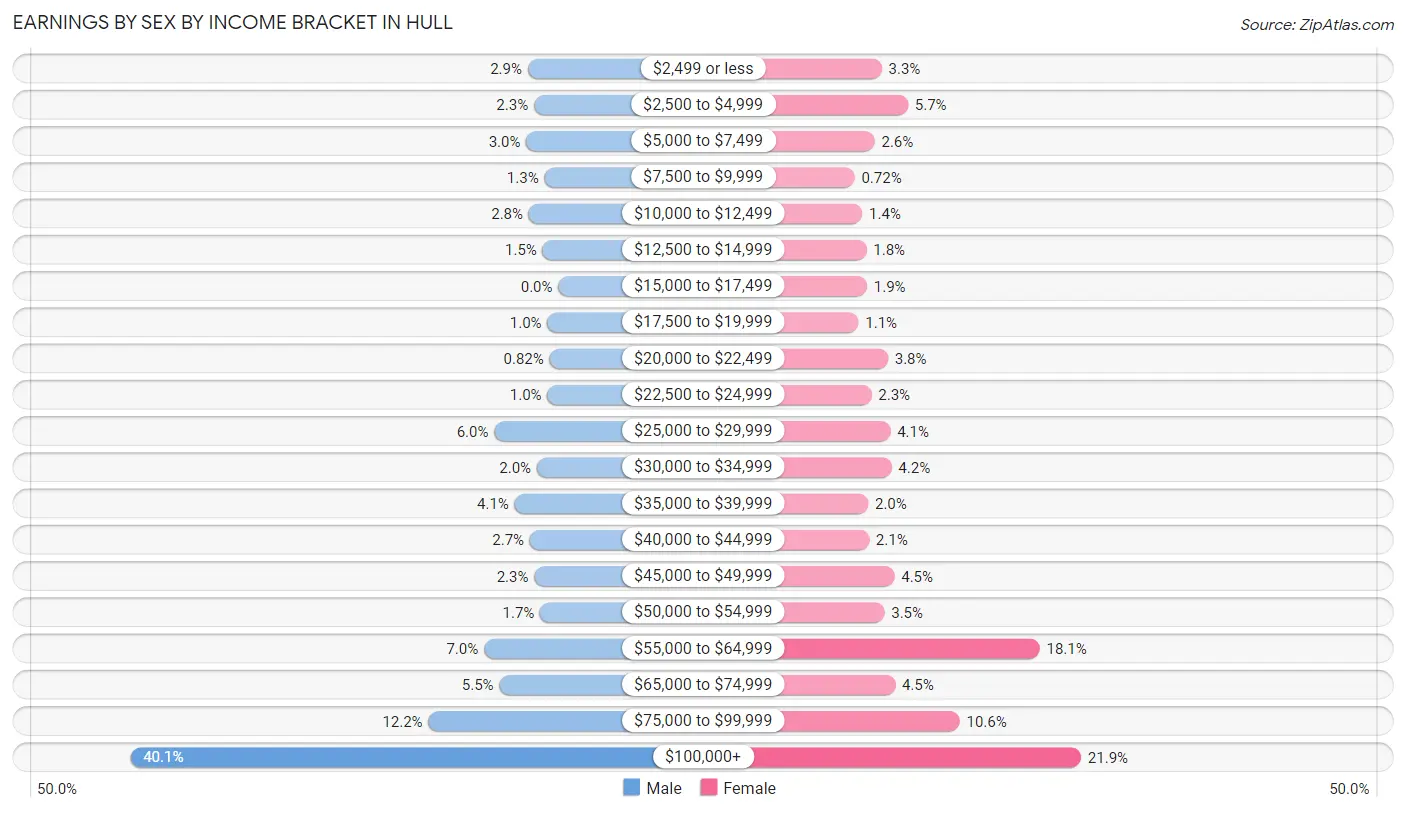
Earnings by Sex by Income Bracket in Hull
The most common earnings brackets in Hull are $100,000+ for men (1,176 | 40.1%) and $100,000+ for women (793 | 21.9%).
| Income | Male | Female |
| $2,499 or less | 84 (2.9%) | 118 (3.3%) |
| $2,500 to $4,999 | 67 (2.3%) | 207 (5.7%) |
| $5,000 to $7,499 | 88 (3.0%) | 94 (2.6%) |
| $7,500 to $9,999 | 38 (1.3%) | 26 (0.7%) |
| $10,000 to $12,499 | 81 (2.8%) | 52 (1.4%) |
| $12,500 to $14,999 | 43 (1.5%) | 66 (1.8%) |
| $15,000 to $17,499 | 0 (0.0%) | 68 (1.9%) |
| $17,500 to $19,999 | 30 (1.0%) | 39 (1.1%) |
| $20,000 to $22,499 | 24 (0.8%) | 139 (3.8%) |
| $22,500 to $24,999 | 30 (1.0%) | 83 (2.3%) |
| $25,000 to $29,999 | 176 (6.0%) | 147 (4.1%) |
| $30,000 to $34,999 | 59 (2.0%) | 151 (4.2%) |
| $35,000 to $39,999 | 120 (4.1%) | 72 (2.0%) |
| $40,000 to $44,999 | 78 (2.7%) | 75 (2.1%) |
| $45,000 to $49,999 | 66 (2.2%) | 161 (4.4%) |
| $50,000 to $54,999 | 50 (1.7%) | 127 (3.5%) |
| $55,000 to $64,999 | 204 (7.0%) | 653 (18.1%) |
| $65,000 to $74,999 | 162 (5.5%) | 163 (4.5%) |
| $75,000 to $99,999 | 357 (12.2%) | 382 (10.6%) |
| $100,000+ | 1,176 (40.1%) | 793 (21.9%) |
| Total | 2,933 (100.0%) | 3,616 (100.0%) |
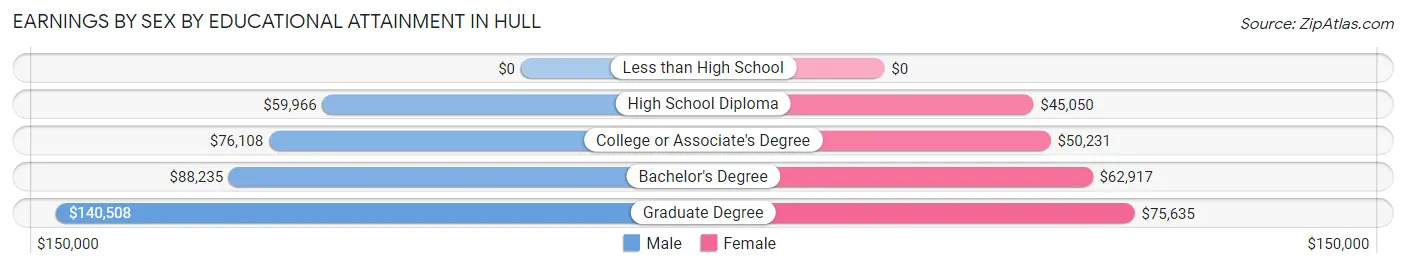
Earnings by Sex by Educational Attainment in Hull
Average earnings in Hull are $87,125 for men and $58,740 for women, a difference of 32.6%. Men with an educational attainment of graduate degree enjoy the highest average annual earnings of $140,508, while those with high school diploma education earn the least with $59,966. Women with an educational attainment of graduate degree earn the most with the average annual earnings of $75,635, while those with high school diploma education have the smallest earnings of $45,050.
| Educational Attainment | Male Income | Female Income |
| Less than High School | - | - |
| High School Diploma | $59,966 | $45,050 |
| College or Associate's Degree | $76,108 | $50,231 |
| Bachelor's Degree | $88,235 | $62,917 |
| Graduate Degree | $140,508 | $75,635 |
| Total | $87,125 | $58,740 |
Family Income in Hull
Family Income Brackets in Hull
According to the Hull family income data, there are 905 families falling into the $200,000+ income range, which is the most common income bracket and makes up 34.9% of all families. Conversely, the less than $10,000 income bracket is the least frequent group with only 13 families (0.5%) belonging to this category.
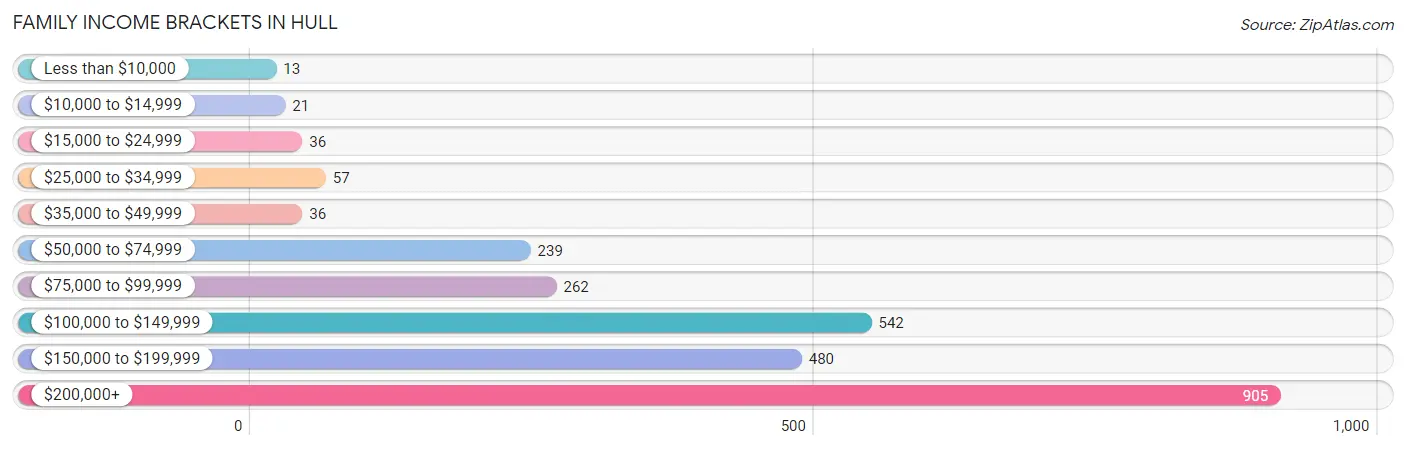
| Income Bracket | # Families | % Families |
| Less than $10,000 | 13 | 0.5% |
| $10,000 to $14,999 | 21 | 0.8% |
| $15,000 to $24,999 | 36 | 1.4% |
| $25,000 to $34,999 | 57 | 2.2% |
| $35,000 to $49,999 | 36 | 1.4% |
| $50,000 to $74,999 | 239 | 9.2% |
| $75,000 to $99,999 | 262 | 10.1% |
| $100,000 to $149,999 | 542 | 20.9% |
| $150,000 to $199,999 | 480 | 18.5% |
| $200,000+ | 905 | 34.9% |
Family Income by Famaliy Size in Hull
4-person families (540 | 20.8%) account for the highest median family income in Hull with $244,750 per family, while 2-person families (1,378 | 53.1%) have the highest median income of $65,232 per family member.
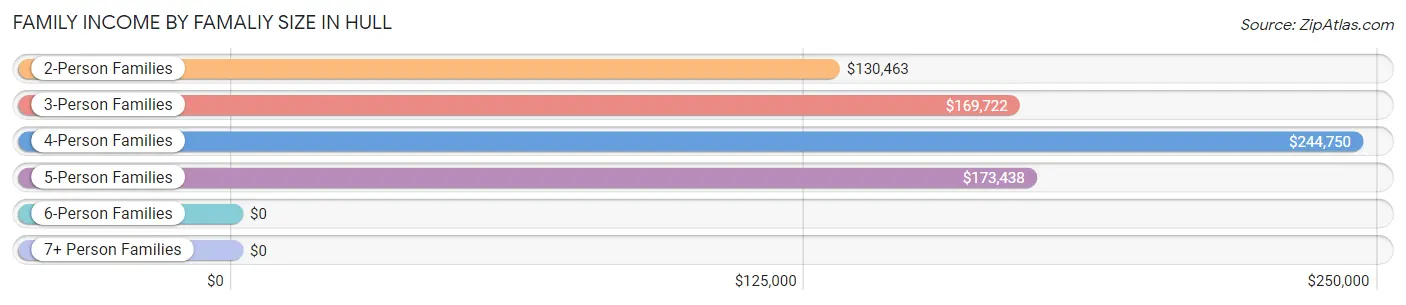
| Income Bracket | # Families | Median Income |
| 2-Person Families | 1,378 (53.1%) | $130,463 |
| 3-Person Families | 494 (19.1%) | $169,722 |
| 4-Person Families | 540 (20.8%) | $244,750 |
| 5-Person Families | 108 (4.2%) | $173,438 |
| 6-Person Families | 39 (1.5%) | $0 |
| 7+ Person Families | 34 (1.3%) | $0 |
| Total | 2,593 (100.0%) | $155,979 |
Family Income by Number of Earners in Hull
The median family income in Hull is $155,979, with families comprising 3+ earners (480) having the highest median family income of $234,674, while families with 1 earner (634) have the lowest median family income of $97,292, accounting for 18.5% and 24.4% of families, respectively.
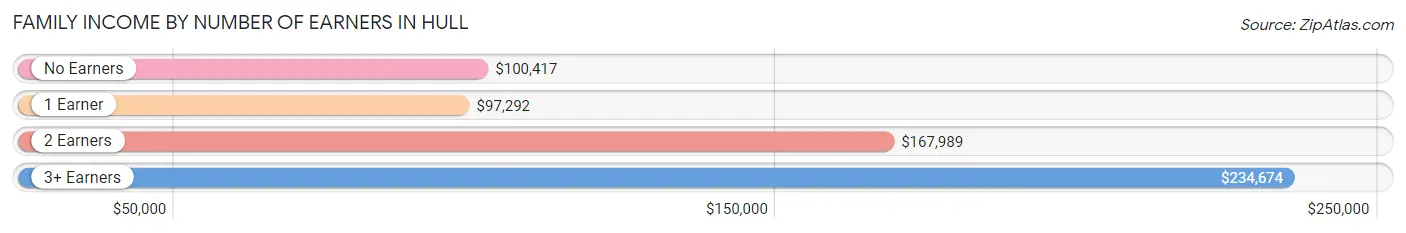
| Number of Earners | # Families | Median Income |
| No Earners | 244 (9.4%) | $100,417 |
| 1 Earner | 634 (24.4%) | $97,292 |
| 2 Earners | 1,235 (47.6%) | $167,989 |
| 3+ Earners | 480 (18.5%) | $234,674 |
| Total | 2,593 (100.0%) | $155,979 |
Household Income in Hull
Household Income Brackets in Hull
With 1,167 households falling in the category, the $200,000+ income range is the most frequent in Hull, accounting for 25.9% of all households. In contrast, only 27 households (0.6%) fall into the $10,000 to $14,999 income bracket, making it the least populous group.
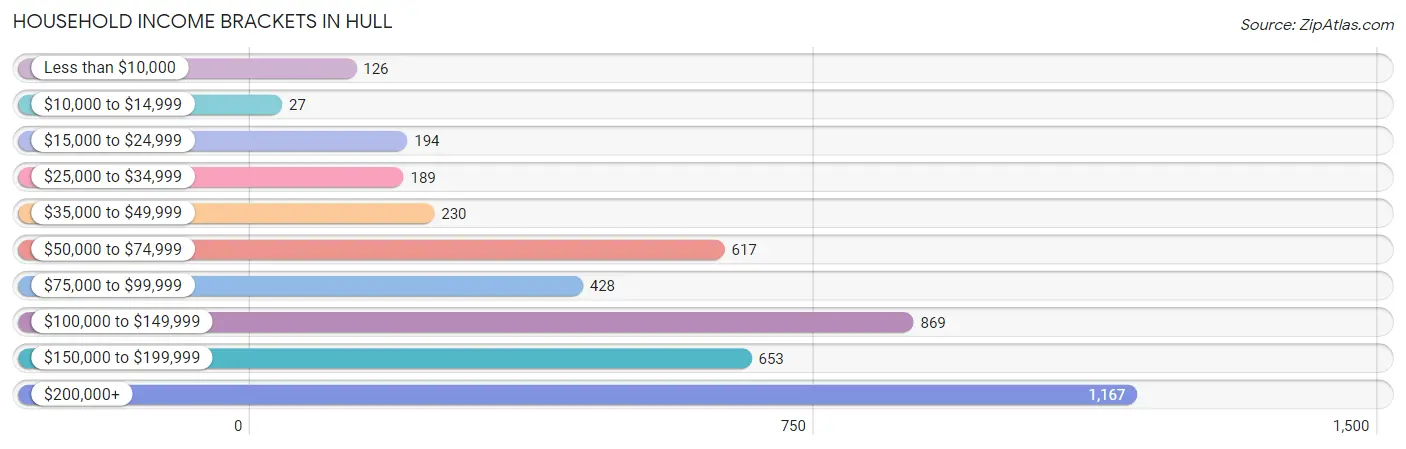
| Income Bracket | # Households | % Households |
| Less than $10,000 | 126 | 2.8% |
| $10,000 to $14,999 | 27 | 0.6% |
| $15,000 to $24,999 | 194 | 4.3% |
| $25,000 to $34,999 | 189 | 4.2% |
| $35,000 to $49,999 | 230 | 5.1% |
| $50,000 to $74,999 | 617 | 13.7% |
| $75,000 to $99,999 | 428 | 9.5% |
| $100,000 to $149,999 | 869 | 19.3% |
| $150,000 to $199,999 | 653 | 14.5% |
| $200,000+ | 1,167 | 25.9% |
Household Income by Householder Age in Hull
The median household income in Hull is $128,022, with the highest median household income of $144,625 found in the 25 to 44 years age bracket for the primary householder. A total of 676 households (15.0%) fall into this category. Meanwhile, the 15 to 24 years age bracket for the primary householder has the lowest median household income of $0, with 17 households (0.4%) in this group.
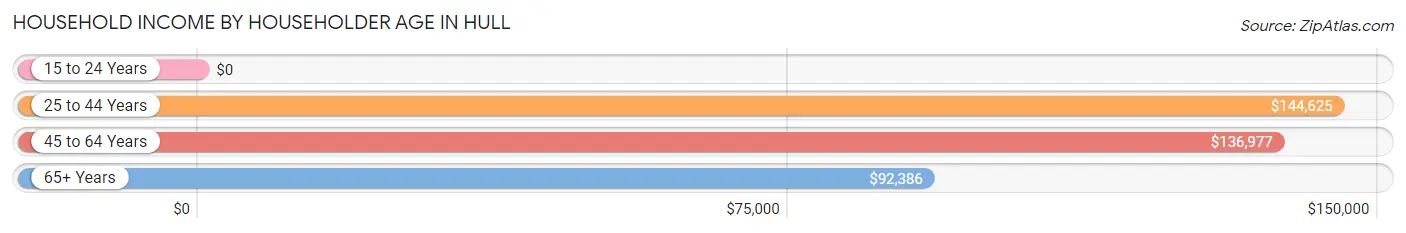
| Income Bracket | # Households | Median Income |
| 15 to 24 Years | 17 (0.4%) | $0 |
| 25 to 44 Years | 676 (15.0%) | $144,625 |
| 45 to 64 Years | 2,222 (49.3%) | $136,977 |
| 65+ Years | 1,589 (35.3%) | $92,386 |
| Total | 4,504 (100.0%) | $128,022 |
Poverty in Hull
Income Below Poverty by Sex and Age in Hull
With 2.9% poverty level for males and 4.2% for females among the residents of Hull, 12 to 14 year old males and 6 to 11 year old females are the most vulnerable to poverty, with 15 males (18.1%) and 14 females (10.2%) in their respective age groups living below the poverty level.
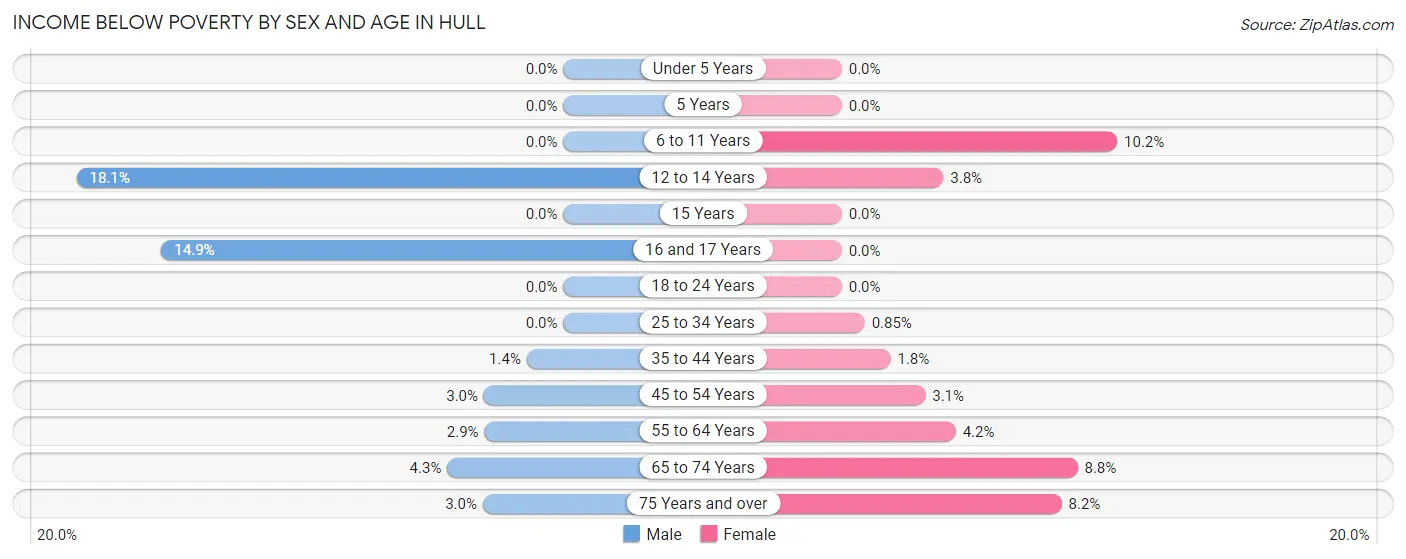
| Age Bracket | Male | Female |
| Under 5 Years | 0 (0.0%) | 0 (0.0%) |
| 5 Years | 0 (0.0%) | 0 (0.0%) |
| 6 to 11 Years | 0 (0.0%) | 14 (10.2%) |
| 12 to 14 Years | 15 (18.1%) | 6 (3.8%) |
| 15 Years | 0 (0.0%) | 0 (0.0%) |
| 16 and 17 Years | 27 (14.9%) | 0 (0.0%) |
| 18 to 24 Years | 0 (0.0%) | 0 (0.0%) |
| 25 to 34 Years | 0 (0.0%) | 6 (0.9%) |
| 35 to 44 Years | 6 (1.4%) | 7 (1.8%) |
| 45 to 54 Years | 14 (2.9%) | 28 (3.1%) |
| 55 to 64 Years | 35 (2.9%) | 54 (4.2%) |
| 65 to 74 Years | 28 (4.3%) | 81 (8.7%) |
| 75 Years and over | 11 (3.0%) | 32 (8.2%) |
| Total | 136 (2.9%) | 228 (4.2%) |
Income Above Poverty by Sex and Age in Hull
According to the poverty statistics in Hull, males aged under 5 years and females aged under 5 years are the age groups that are most secure financially, with 100.0% of males and 100.0% of females in these age groups living above the poverty line.
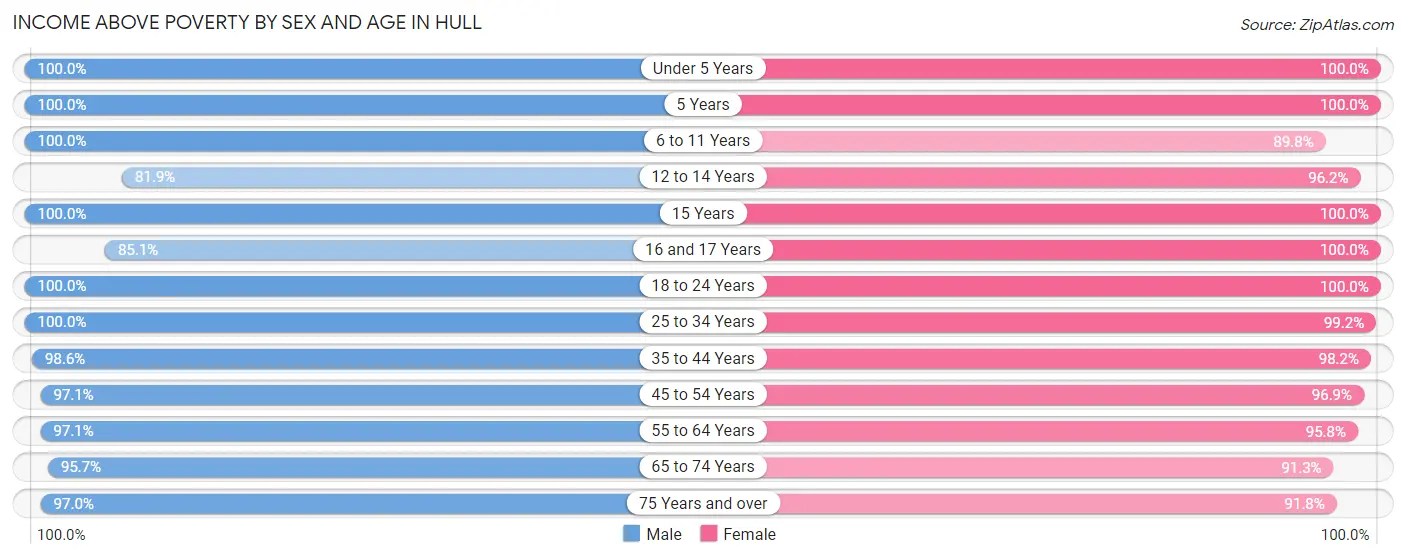
| Age Bracket | Male | Female |
| Under 5 Years | 228 (100.0%) | 103 (100.0%) |
| 5 Years | 35 (100.0%) | 19 (100.0%) |
| 6 to 11 Years | 215 (100.0%) | 123 (89.8%) |
| 12 to 14 Years | 68 (81.9%) | 153 (96.2%) |
| 15 Years | 63 (100.0%) | 42 (100.0%) |
| 16 and 17 Years | 154 (85.1%) | 119 (100.0%) |
| 18 to 24 Years | 233 (100.0%) | 291 (100.0%) |
| 25 to 34 Years | 483 (100.0%) | 701 (99.2%) |
| 35 to 44 Years | 434 (98.6%) | 380 (98.2%) |
| 45 to 54 Years | 460 (97.1%) | 874 (96.9%) |
| 55 to 64 Years | 1,158 (97.1%) | 1,222 (95.8%) |
| 65 to 74 Years | 622 (95.7%) | 845 (91.2%) |
| 75 Years and over | 357 (97.0%) | 360 (91.8%) |
| Total | 4,510 (97.1%) | 5,232 (95.8%) |
Income Below Poverty Among Married-Couple Families in Hull
The poverty statistics for married-couple families in Hull show that 1.4% or 31 of the total 2,156 families live below the poverty line. Families with no children have the highest poverty rate of 1.6%, comprising of 24 families. On the other hand, families with 3 or 4 children have the lowest poverty rate of 0.0%, which includes 0 families.
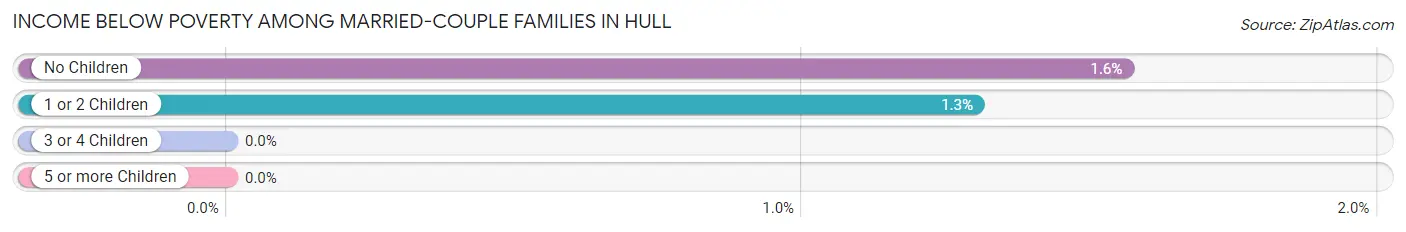
| Children | Above Poverty | Below Poverty |
| No Children | 1,517 (98.4%) | 24 (1.6%) |
| 1 or 2 Children | 533 (98.7%) | 7 (1.3%) |
| 3 or 4 Children | 75 (100.0%) | 0 (0.0%) |
| 5 or more Children | 0 (0.0%) | 0 (0.0%) |
| Total | 2,125 (98.6%) | 31 (1.4%) |
Income Below Poverty Among Single-Parent Households in Hull
According to the poverty data in Hull, 7.3% or 7 single-father households and 4.1% or 14 single-mother households are living below the poverty line. Among single-father households, those with 1 or 2 children have the highest poverty rate, with 7 households (13.7%) experiencing poverty. Likewise, among single-mother households, those with 5 or more children have the highest poverty rate, with 7 households (100.0%) falling below the poverty line.
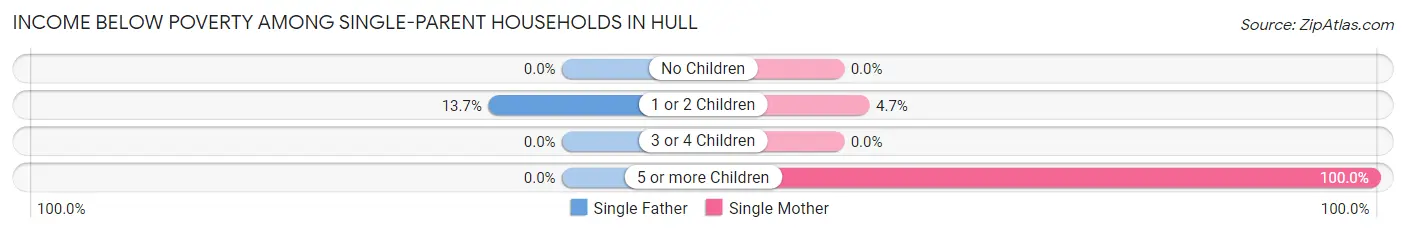
| Children | Single Father | Single Mother |
| No Children | 0 (0.0%) | 0 (0.0%) |
| 1 or 2 Children | 7 (13.7%) | 7 (4.7%) |
| 3 or 4 Children | 0 (0.0%) | 0 (0.0%) |
| 5 or more Children | 0 (0.0%) | 7 (100.0%) |
| Total | 7 (7.3%) | 14 (4.1%) |
Income Below Poverty Among Married-Couple vs Single-Parent Households in Hull
The poverty data for Hull shows that 31 of the married-couple family households (1.4%) and 21 of the single-parent households (4.8%) are living below the poverty level. Within the married-couple family households, those with no children have the highest poverty rate, with 24 households (1.6%) falling below the poverty line. Among the single-parent households, those with 5 or more children have the highest poverty rate, with 7 household (100.0%) living below poverty.
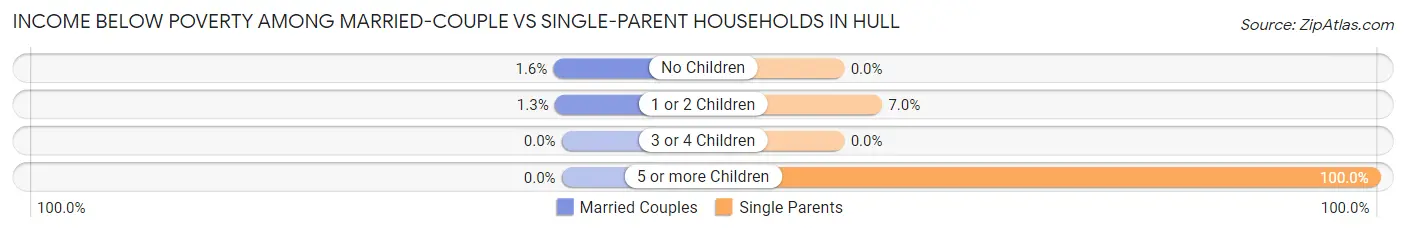
| Children | Married-Couple Families | Single-Parent Households |
| No Children | 24 (1.6%) | 0 (0.0%) |
| 1 or 2 Children | 7 (1.3%) | 14 (7.0%) |
| 3 or 4 Children | 0 (0.0%) | 0 (0.0%) |
| 5 or more Children | 0 (0.0%) | 7 (100.0%) |
| Total | 31 (1.4%) | 21 (4.8%) |
Race in Hull
The most populous races in Hull are White / Caucasian (9,641 | 95.3%), Two or more Races (186 | 1.8%), and Asian (156 | 1.5%).
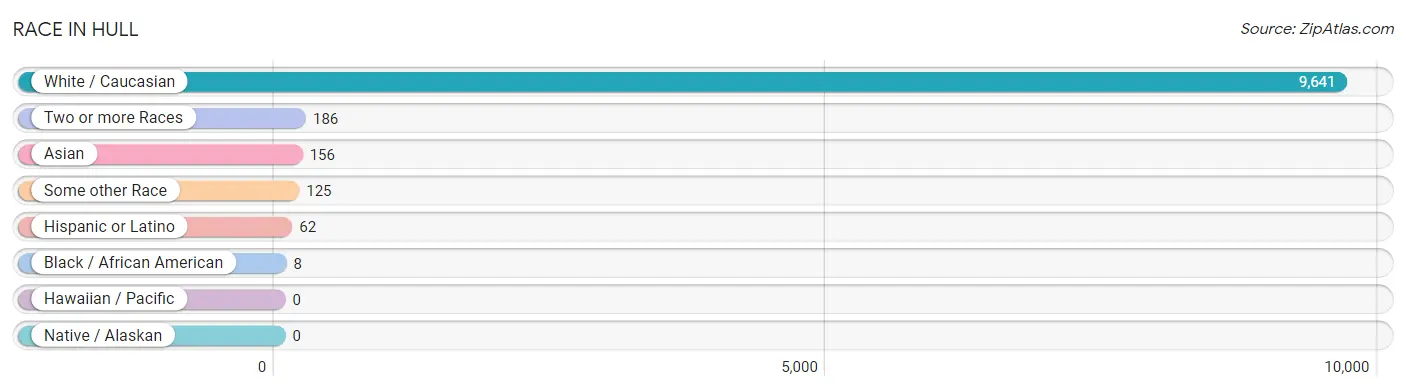
| Race | # Population | % Population |
| Asian | 156 | 1.5% |
| Black / African American | 8 | 0.1% |
| Hawaiian / Pacific | 0 | 0.0% |
| Hispanic or Latino | 62 | 0.6% |
| Native / Alaskan | 0 | 0.0% |
| White / Caucasian | 9,641 | 95.3% |
| Two or more Races | 186 | 1.8% |
| Some other Race | 125 | 1.2% |
| Total | 10,116 | 100.0% |
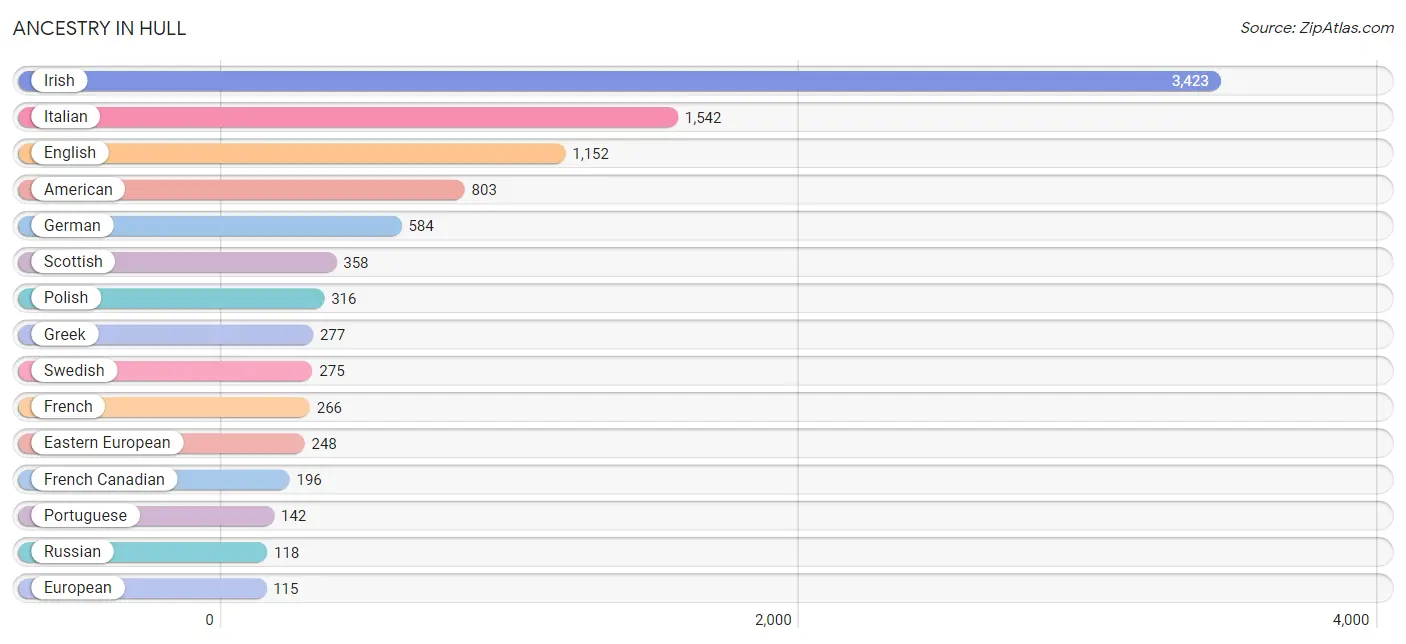
Ancestry in Hull
The most populous ancestries reported in Hull are Irish (3,423 | 33.8%), Italian (1,542 | 15.2%), English (1,152 | 11.4%), American (803 | 7.9%), and German (584 | 5.8%), together accounting for 74.2% of all Hull residents.
| Ancestry | # Population | % Population |
| African | 7 | 0.1% |
| American | 803 | 7.9% |
| Arab | 36 | 0.4% |
| Austrian | 11 | 0.1% |
| Bangladeshi | 34 | 0.3% |
| Belgian | 30 | 0.3% |
| Bhutanese | 12 | 0.1% |
| Brazilian | 10 | 0.1% |
| British | 83 | 0.8% |
| Canadian | 58 | 0.6% |
| Cape Verdean | 94 | 0.9% |
| Carpatho Rusyn | 36 | 0.4% |
| Czech | 95 | 0.9% |
| Danish | 19 | 0.2% |
| Dutch | 76 | 0.7% |
| Eastern European | 248 | 2.5% |
| Egyptian | 10 | 0.1% |
| English | 1,152 | 11.4% |
| European | 115 | 1.1% |
| Filipino | 18 | 0.2% |
| Finnish | 24 | 0.2% |
| French | 266 | 2.6% |
| French American Indian | 11 | 0.1% |
| French Canadian | 196 | 1.9% |
| German | 584 | 5.8% |
| Greek | 277 | 2.7% |
| Hungarian | 42 | 0.4% |
| Indian (Asian) | 76 | 0.7% |
| Irish | 3,423 | 33.8% |
| Italian | 1,542 | 15.2% |
| Japanese | 6 | 0.1% |
| Korean | 10 | 0.1% |
| Lebanese | 15 | 0.2% |
| Lithuanian | 95 | 0.9% |
| Northern European | 39 | 0.4% |
| Norwegian | 43 | 0.4% |
| Polish | 316 | 3.1% |
| Portuguese | 142 | 1.4% |
| Puerto Rican | 15 | 0.2% |
| Russian | 118 | 1.2% |
| Scandinavian | 57 | 0.6% |
| Scotch-Irish | 110 | 1.1% |
| Scottish | 358 | 3.5% |
| Seminole | 10 | 0.1% |
| Sioux | 13 | 0.1% |
| Slavic | 15 | 0.2% |
| Slovak | 7 | 0.1% |
| Slovene | 33 | 0.3% |
| South American | 12 | 0.1% |
| Spanish | 19 | 0.2% |
| Subsaharan African | 101 | 1.0% |
| Swedish | 275 | 2.7% |
| Swiss | 49 | 0.5% |
| Thai | 17 | 0.2% |
| Turkish | 10 | 0.1% |
| Venezuelan | 12 | 0.1% |
| Welsh | 37 | 0.4% | View All 57 Rows |
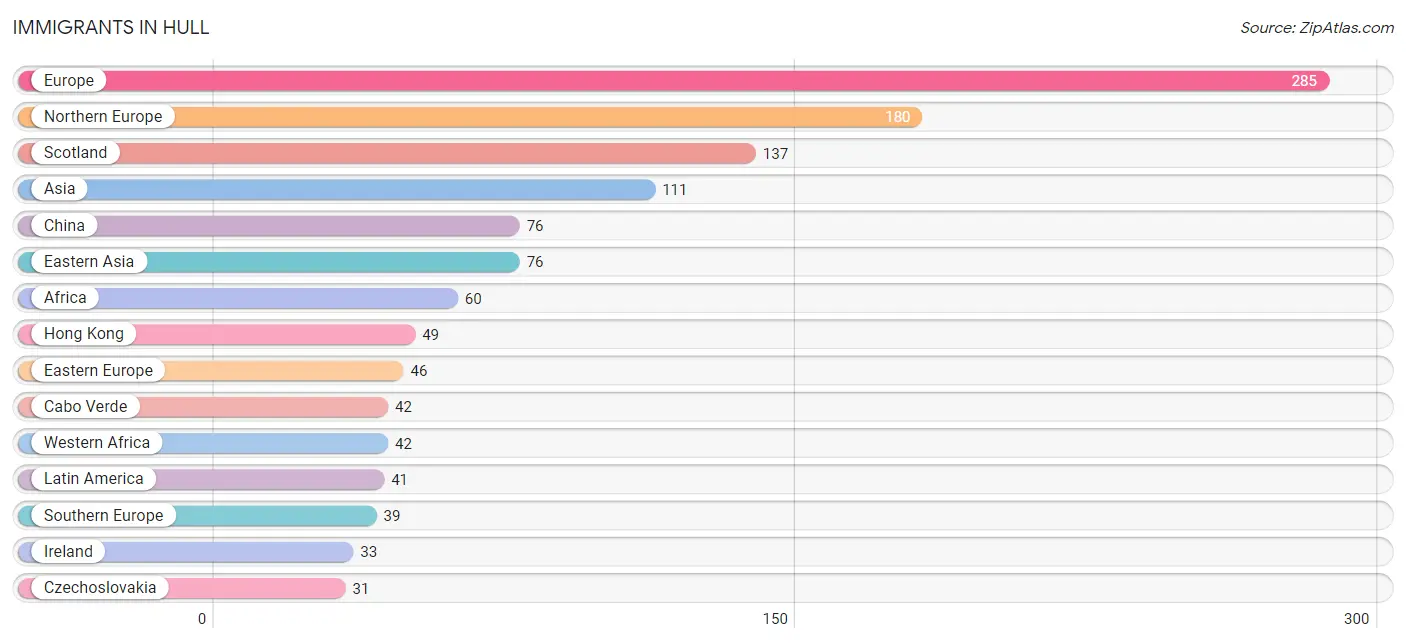
Immigrants in Hull
The most numerous immigrant groups reported in Hull came from Europe (285 | 2.8%), Northern Europe (180 | 1.8%), Scotland (137 | 1.3%), Asia (111 | 1.1%), and China (76 | 0.7%), together accounting for 7.8% of all Hull residents.
| Immigration Origin | # Population | % Population |
| Africa | 60 | 0.6% |
| Asia | 111 | 1.1% |
| Brazil | 13 | 0.1% |
| Cabo Verde | 42 | 0.4% |
| Cambodia | 6 | 0.1% |
| Canada | 10 | 0.1% |
| Caribbean | 16 | 0.2% |
| China | 76 | 0.7% |
| Czechoslovakia | 31 | 0.3% |
| Eastern Africa | 8 | 0.1% |
| Eastern Asia | 76 | 0.7% |
| Eastern Europe | 46 | 0.4% |
| Egypt | 10 | 0.1% |
| Europe | 285 | 2.8% |
| Germany | 20 | 0.2% |
| Greece | 13 | 0.1% |
| Hong Kong | 49 | 0.5% |
| Ireland | 33 | 0.3% |
| Italy | 26 | 0.3% |
| Jamaica | 16 | 0.2% |
| Laos | 9 | 0.1% |
| Latin America | 41 | 0.4% |
| Northern Africa | 10 | 0.1% |
| Northern Europe | 180 | 1.8% |
| Philippines | 10 | 0.1% |
| Poland | 7 | 0.1% |
| Scotland | 137 | 1.3% |
| South America | 25 | 0.3% |
| South Eastern Asia | 25 | 0.3% |
| Southern Europe | 39 | 0.4% |
| Taiwan | 8 | 0.1% |
| Turkey | 10 | 0.1% |
| Venezuela | 12 | 0.1% |
| Western Africa | 42 | 0.4% |
| Western Asia | 10 | 0.1% |
| Western Europe | 20 | 0.2% | View All 36 Rows |
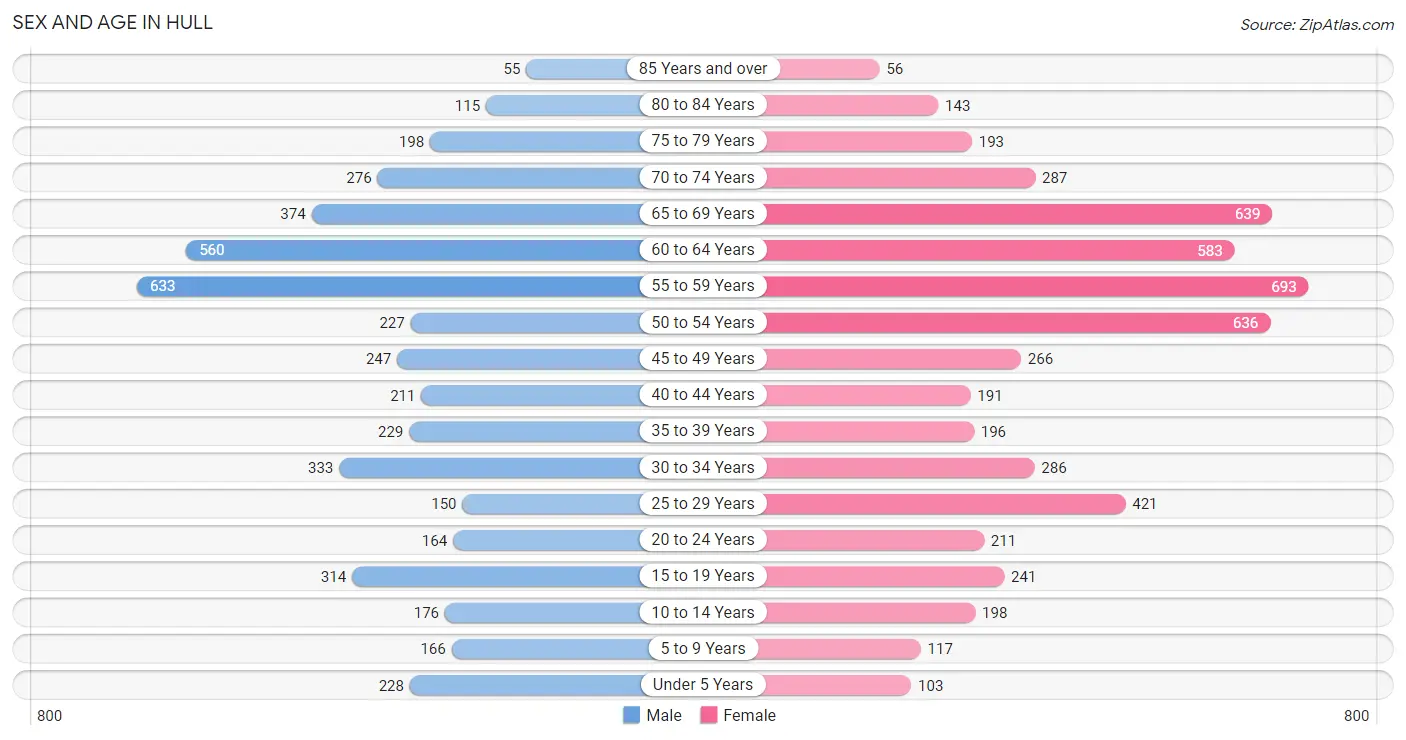
Sex and Age in Hull
Sex and Age in Hull
The most populous age groups in Hull are 55 to 59 Years (633 | 13.6%) for men and 55 to 59 Years (693 | 12.7%) for women.
| Age Bracket | Male | Female |
| Under 5 Years | 228 (4.9%) | 103 (1.9%) |
| 5 to 9 Years | 166 (3.6%) | 117 (2.1%) |
| 10 to 14 Years | 176 (3.8%) | 198 (3.6%) |
| 15 to 19 Years | 314 (6.7%) | 241 (4.4%) |
| 20 to 24 Years | 164 (3.5%) | 211 (3.9%) |
| 25 to 29 Years | 150 (3.2%) | 421 (7.7%) |
| 30 to 34 Years | 333 (7.1%) | 286 (5.2%) |
| 35 to 39 Years | 229 (4.9%) | 196 (3.6%) |
| 40 to 44 Years | 211 (4.5%) | 191 (3.5%) |
| 45 to 49 Years | 247 (5.3%) | 266 (4.9%) |
| 50 to 54 Years | 227 (4.9%) | 636 (11.7%) |
| 55 to 59 Years | 633 (13.6%) | 693 (12.7%) |
| 60 to 64 Years | 560 (12.0%) | 583 (10.7%) |
| 65 to 69 Years | 374 (8.0%) | 639 (11.7%) |
| 70 to 74 Years | 276 (5.9%) | 287 (5.3%) |
| 75 to 79 Years | 198 (4.3%) | 193 (3.5%) |
| 80 to 84 Years | 115 (2.5%) | 143 (2.6%) |
| 85 Years and over | 55 (1.2%) | 56 (1.0%) |
| Total | 4,656 (100.0%) | 5,460 (100.0%) |
Families and Households in Hull
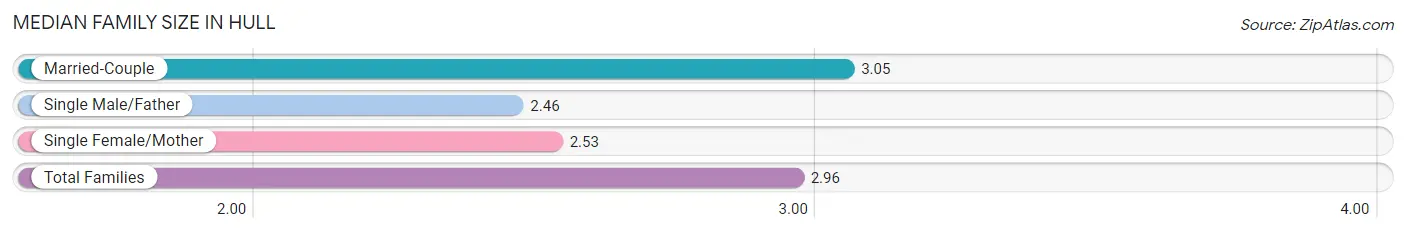
Median Family Size in Hull
The median family size in Hull is 2.96 persons per family, with married-couple families (2,156 | 83.2%) accounting for the largest median family size of 3.05 persons per family. On the other hand, single male/father families (96 | 3.7%) represent the smallest median family size with 2.46 persons per family.
| Family Type | # Families | Family Size |
| Married-Couple | 2,156 (83.2%) | 3.05 |
| Single Male/Father | 96 (3.7%) | 2.46 |
| Single Female/Mother | 341 (13.2%) | 2.53 |
| Total Families | 2,593 (100.0%) | 2.96 |
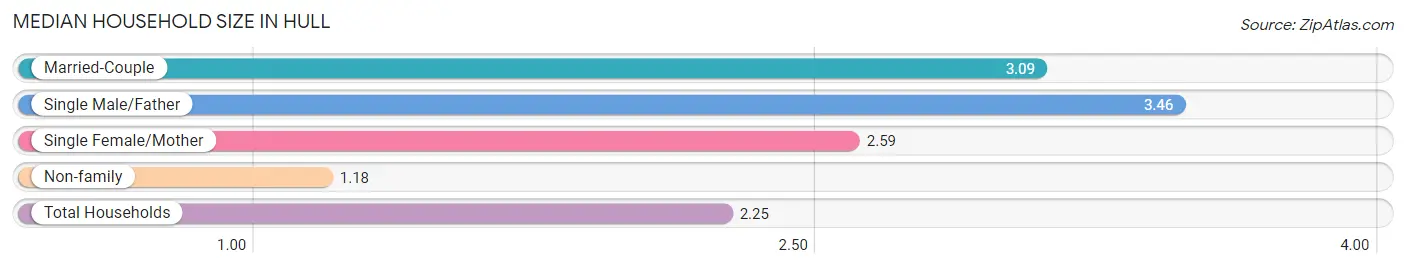
Median Household Size in Hull
The median household size in Hull is 2.25 persons per household, with single male/father households (96 | 2.1%) accounting for the largest median household size of 3.46 persons per household. non-family households (1,911 | 42.4%) represent the smallest median household size with 1.18 persons per household.
| Household Type | # Households | Household Size |
| Married-Couple | 2,156 (47.9%) | 3.09 |
| Single Male/Father | 96 (2.1%) | 3.46 |
| Single Female/Mother | 341 (7.6%) | 2.59 |
| Non-family | 1,911 (42.4%) | 1.18 |
| Total Households | 4,504 (100.0%) | 2.25 |
Household Size by Marriage Status in Hull
Out of a total of 4,504 households in Hull, 2,593 (57.6%) are family households, while 1,911 (42.4%) are nonfamily households. The most numerous type of family households are 2-person households, comprising 1,315, and the most common type of nonfamily households are 1-person households, comprising 1,568.
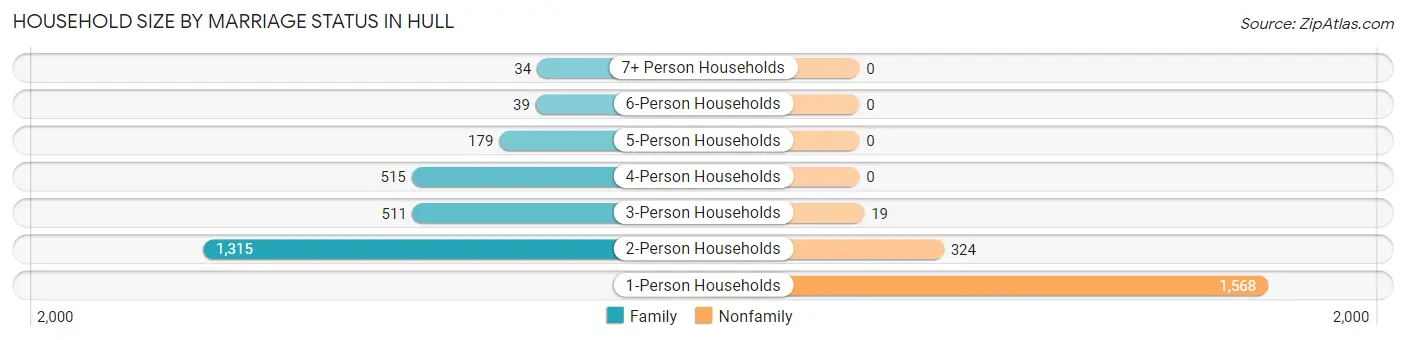
| Household Size | Family Households | Nonfamily Households |
| 1-Person Households | - | 1,568 (34.8%) |
| 2-Person Households | 1,315 (29.2%) | 324 (7.2%) |
| 3-Person Households | 511 (11.4%) | 19 (0.4%) |
| 4-Person Households | 515 (11.4%) | 0 (0.0%) |
| 5-Person Households | 179 (4.0%) | 0 (0.0%) |
| 6-Person Households | 39 (0.9%) | 0 (0.0%) |
| 7+ Person Households | 34 (0.7%) | 0 (0.0%) |
| Total | 2,593 (57.6%) | 1,911 (42.4%) |
Female Fertility in Hull
Fertility by Age in Hull
Average fertility rate in Hull is 25.0 births per 1,000 women. Women in the age bracket of 20 to 34 years have the highest fertility rate with 51.0 births per 1,000 women. Women in the age bracket of 20 to 34 years acount for 100.0% of all women with births.
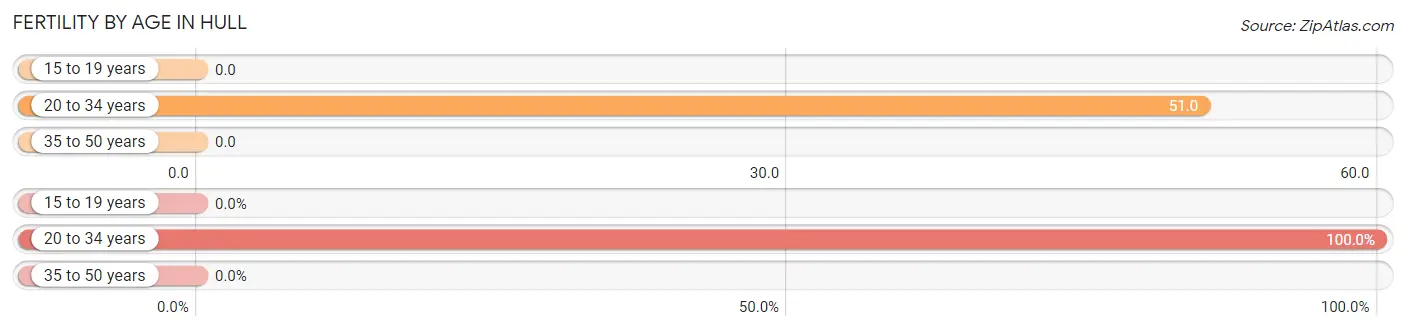
| Age Bracket | Women with Births | Births / 1,000 Women |
| 15 to 19 years | 0 (0.0%) | 0.0 |
| 20 to 34 years | 47 (100.0%) | 51.0 |
| 35 to 50 years | 0 (0.0%) | 0.0 |
| Total | 47 (100.0%) | 25.0 |
Fertility by Age by Marriage Status in Hull
83.0% of women with births (47) in Hull are married. The highest percentage of unmarried women with births falls into 20 to 34 years age bracket with 17.0% of them unmarried at the time of birth, while the lowest percentage of unmarried women with births belong to 20 to 34 years age bracket with 17.0% of them unmarried.
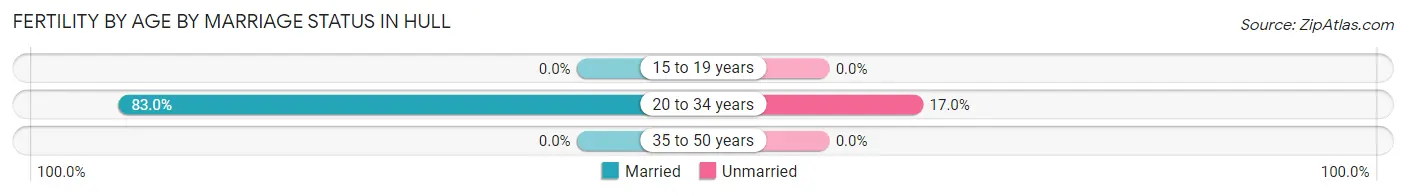
| Age Bracket | Married | Unmarried |
| 15 to 19 years | 0 (0.0%) | 0 (0.0%) |
| 20 to 34 years | 39 (83.0%) | 8 (17.0%) |
| 35 to 50 years | 0 (0.0%) | 0 (0.0%) |
| Total | 39 (83.0%) | 8 (17.0%) |
Fertility by Education in Hull
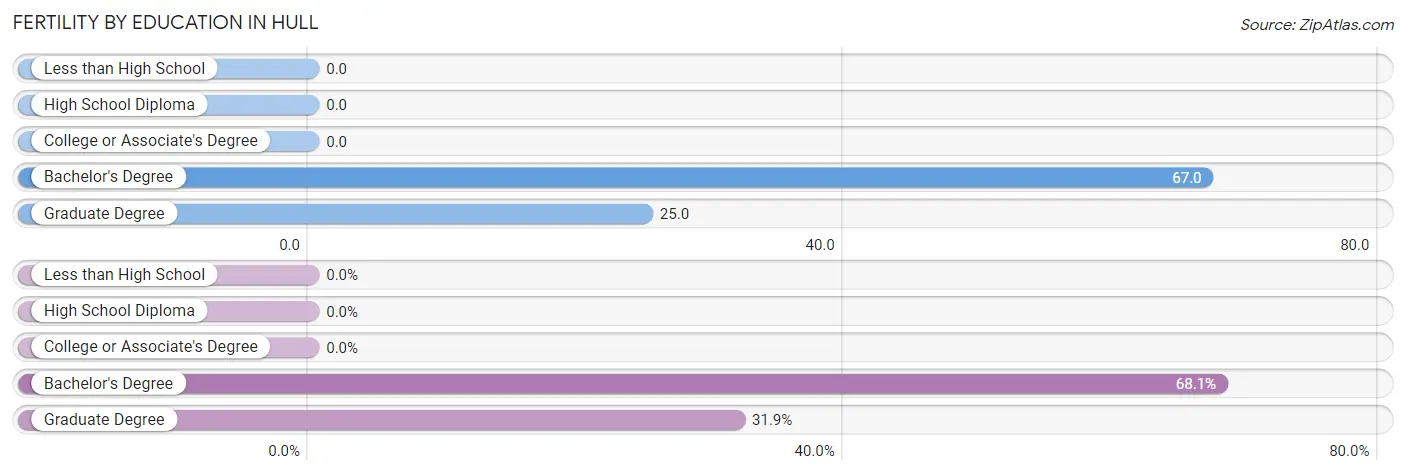
| Educational Attainment | Women with Births | Births / 1,000 Women |
| Less than High School | 0 (0.0%) | 0.0 |
| High School Diploma | 0 (0.0%) | 0.0 |
| College or Associate's Degree | 0 (0.0%) | 0.0 |
| Bachelor's Degree | 32 (68.1%) | 67.0 |
| Graduate Degree | 15 (31.9%) | 25.0 |
| Total | 47 (100.0%) | 25.0 |
Fertility by Education by Marriage Status in Hull
17.0% of women with births in Hull are unmarried. Women with the educational attainment of graduate degree are most likely to be married with 100.0% of them married at childbirth, while women with the educational attainment of bachelor's degree are least likely to be married with 25.0% of them unmarried at childbirth.
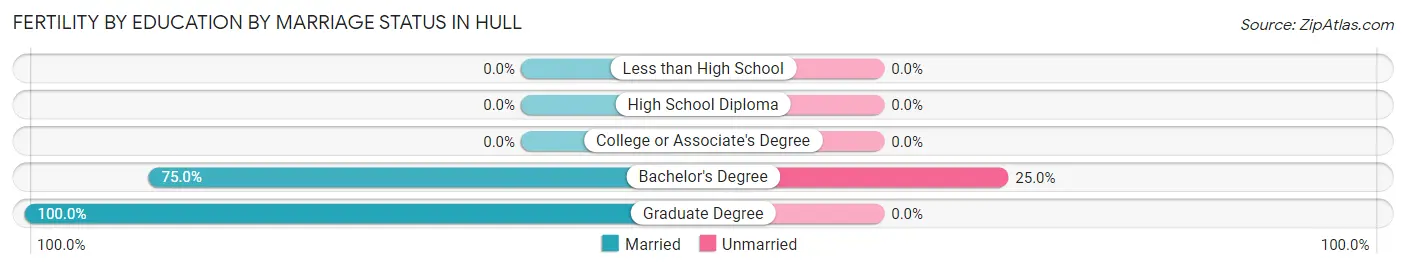
| Educational Attainment | Married | Unmarried |
| Less than High School | 0 (0.0%) | 0 (0.0%) |
| High School Diploma | 0 (0.0%) | 0 (0.0%) |
| College or Associate's Degree | 0 (0.0%) | 0 (0.0%) |
| Bachelor's Degree | 24 (75.0%) | 8 (25.0%) |
| Graduate Degree | 15 (100.0%) | 0 (0.0%) |
| Total | 39 (83.0%) | 8 (17.0%) |
Employment Characteristics in Hull
Employment by Class of Employer in Hull
Among the 6,148 employed individuals in Hull, private company employees (3,569 | 58.1%), local government employees (818 | 13.3%), and not-for-profit organizations (565 | 9.2%) make up the most common classes of employment.
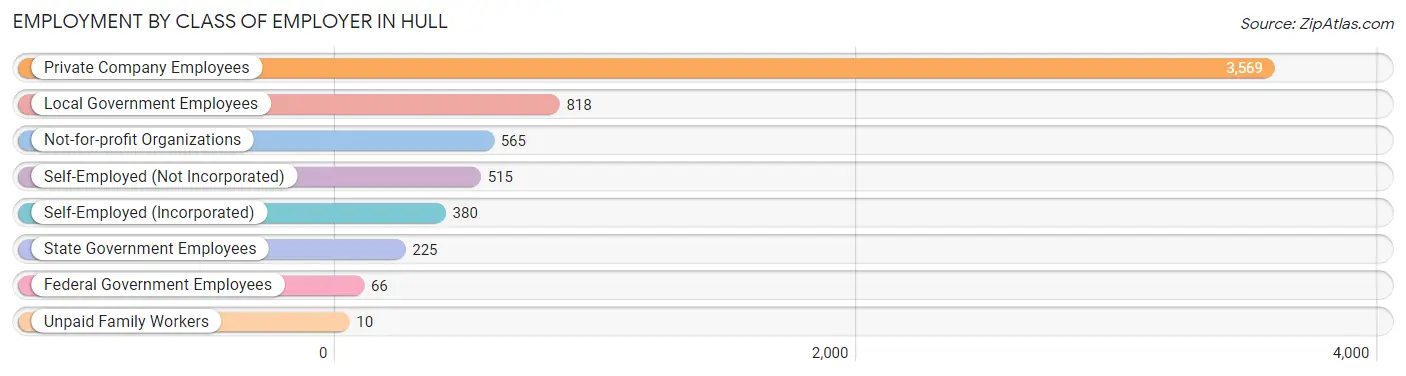
| Employer Class | # Employees | % Employees |
| Private Company Employees | 3,569 | 58.1% |
| Self-Employed (Incorporated) | 380 | 6.2% |
| Self-Employed (Not Incorporated) | 515 | 8.4% |
| Not-for-profit Organizations | 565 | 9.2% |
| Local Government Employees | 818 | 13.3% |
| State Government Employees | 225 | 3.7% |
| Federal Government Employees | 66 | 1.1% |
| Unpaid Family Workers | 10 | 0.2% |
| Total | 6,148 | 100.0% |
Employment Status by Age in Hull
According to the labor force statistics for Hull, out of the total population over 16 years of age (9,023), 71.4% or 6,442 individuals are in the labor force, with 4.0% or 258 of them unemployed. The age group with the highest labor force participation rate is 30 to 34 years, with 96.3% or 596 individuals in the labor force. Within the labor force, the 16 to 19 years age range has the highest percentage of unemployed individuals, with 26.3% or 72 of them being unemployed.
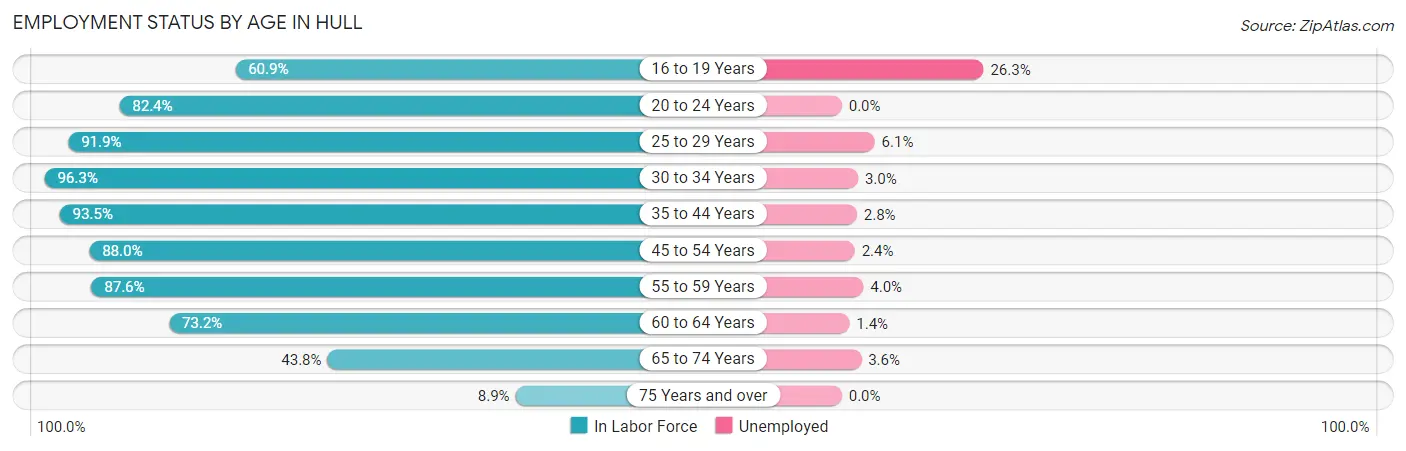
| Age Bracket | In Labor Force | Unemployed |
| 16 to 19 Years | 274 (60.9%) | 72 (26.3%) |
| 20 to 24 Years | 309 (82.4%) | 0 (0.0%) |
| 25 to 29 Years | 525 (91.9%) | 32 (6.1%) |
| 30 to 34 Years | 596 (96.3%) | 18 (3.0%) |
| 35 to 44 Years | 773 (93.5%) | 22 (2.8%) |
| 45 to 54 Years | 1,211 (88.0%) | 29 (2.4%) |
| 55 to 59 Years | 1,162 (87.6%) | 46 (4.0%) |
| 60 to 64 Years | 837 (73.2%) | 12 (1.4%) |
| 65 to 74 Years | 690 (43.8%) | 25 (3.6%) |
| 75 Years and over | 68 (8.9%) | 0 (0.0%) |
| Total | 6,442 (71.4%) | 258 (4.0%) |
Employment Status by Educational Attainment in Hull
According to labor force statistics for Hull, 87.1% of individuals (5,106) out of the total population between 25 and 64 years of age (5,862) are in the labor force, with 3.1% or 158 of them being unemployed. The group with the highest labor force participation rate are those with the educational attainment of bachelor's degree or higher, with 91.8% or 2,836 individuals in the labor force. Within the labor force, individuals with college / associate degree education have the highest percentage of unemployment, with 4.5% or 54 of them being unemployed.
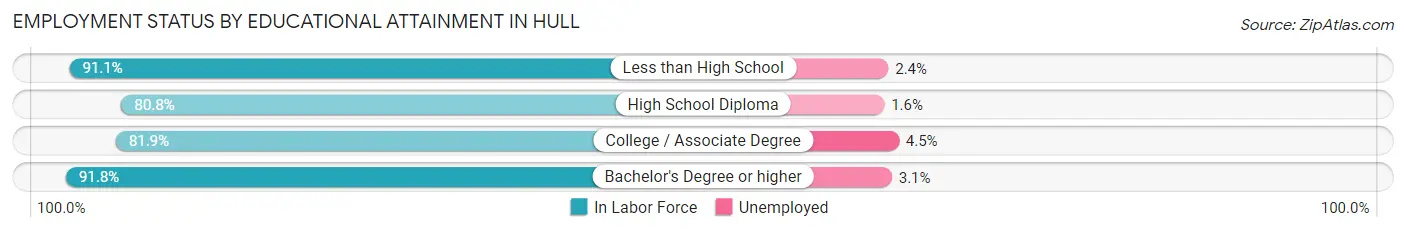
| Educational Attainment | In Labor Force | Unemployed |
| Less than High School | 82 (91.1%) | 2 (2.4%) |
| High School Diploma | 984 (80.8%) | 19 (1.6%) |
| College / Associate Degree | 1,200 (81.9%) | 66 (4.5%) |
| Bachelor's Degree or higher | 2,836 (91.8%) | 96 (3.1%) |
| Total | 5,106 (87.1%) | 182 (3.1%) |
Employment Occupations by Sex in Hull
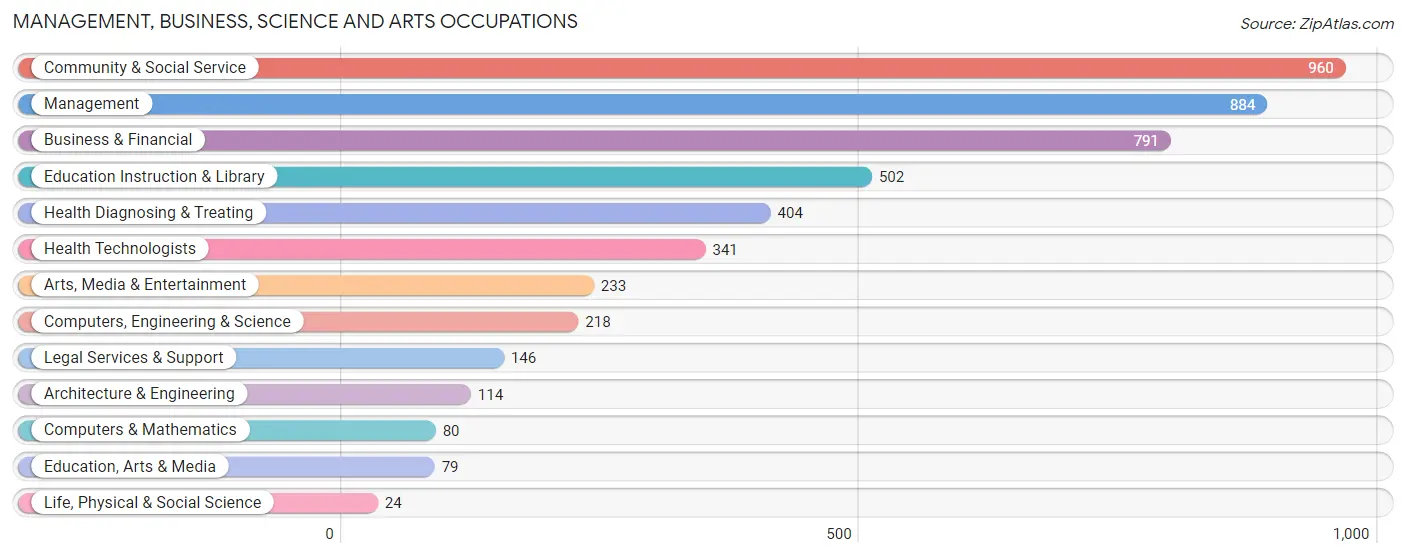
Management, Business, Science and Arts Occupations
The most common Management, Business, Science and Arts occupations in Hull are Community & Social Service (960 | 15.5%), Management (884 | 14.3%), Business & Financial (791 | 12.8%), Education Instruction & Library (502 | 8.1%), and Health Diagnosing & Treating (404 | 6.5%).
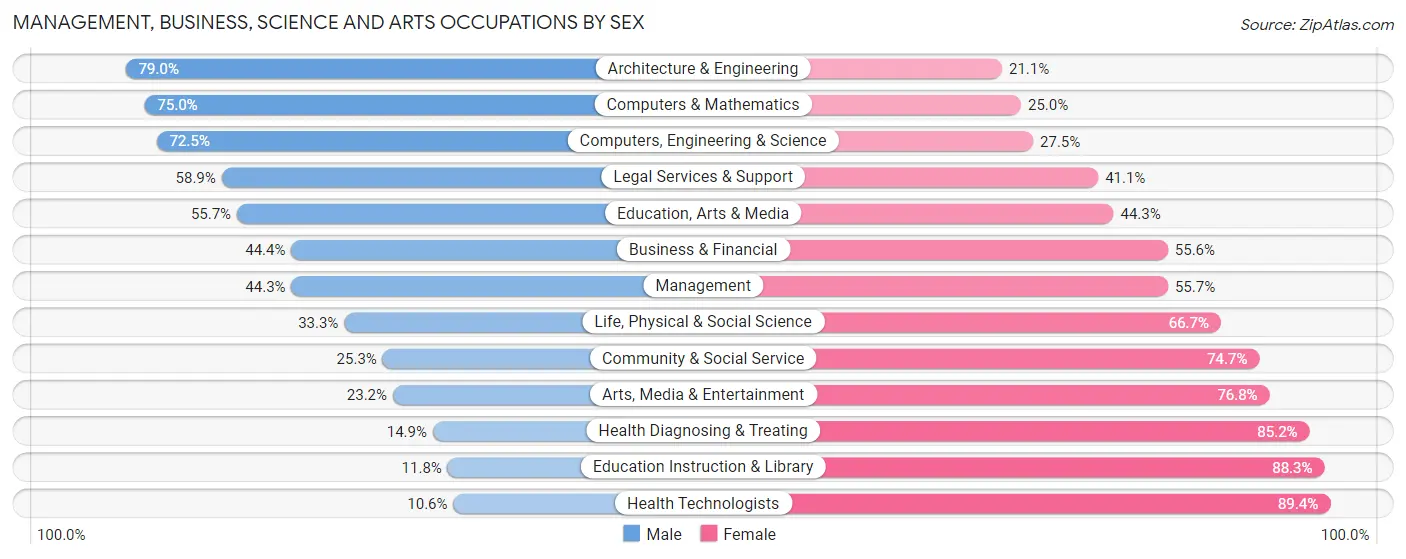
Management, Business, Science and Arts Occupations by Sex
Within the Management, Business, Science and Arts occupations in Hull, the most male-oriented occupations are Architecture & Engineering (78.9%), Computers & Mathematics (75.0%), and Computers, Engineering & Science (72.5%), while the most female-oriented occupations are Health Technologists (89.4%), Education Instruction & Library (88.2%), and Health Diagnosing & Treating (85.2%).
| Occupation | Male | Female |
| Management | 392 (44.3%) | 492 (55.7%) |
| Business & Financial | 351 (44.4%) | 440 (55.6%) |
| Computers, Engineering & Science | 158 (72.5%) | 60 (27.5%) |
| Computers & Mathematics | 60 (75.0%) | 20 (25.0%) |
| Architecture & Engineering | 90 (78.9%) | 24 (21.0%) |
| Life, Physical & Social Science | 8 (33.3%) | 16 (66.7%) |
| Community & Social Service | 243 (25.3%) | 717 (74.7%) |
| Education, Arts & Media | 44 (55.7%) | 35 (44.3%) |
| Legal Services & Support | 86 (58.9%) | 60 (41.1%) |
| Education Instruction & Library | 59 (11.7%) | 443 (88.2%) |
| Arts, Media & Entertainment | 54 (23.2%) | 179 (76.8%) |
| Health Diagnosing & Treating | 60 (14.8%) | 344 (85.2%) |
| Health Technologists | 36 (10.6%) | 305 (89.4%) |
| Total (Category) | 1,204 (37.0%) | 2,053 (63.0%) |
| Total (Overall) | 2,789 (45.1%) | 3,399 (54.9%) |
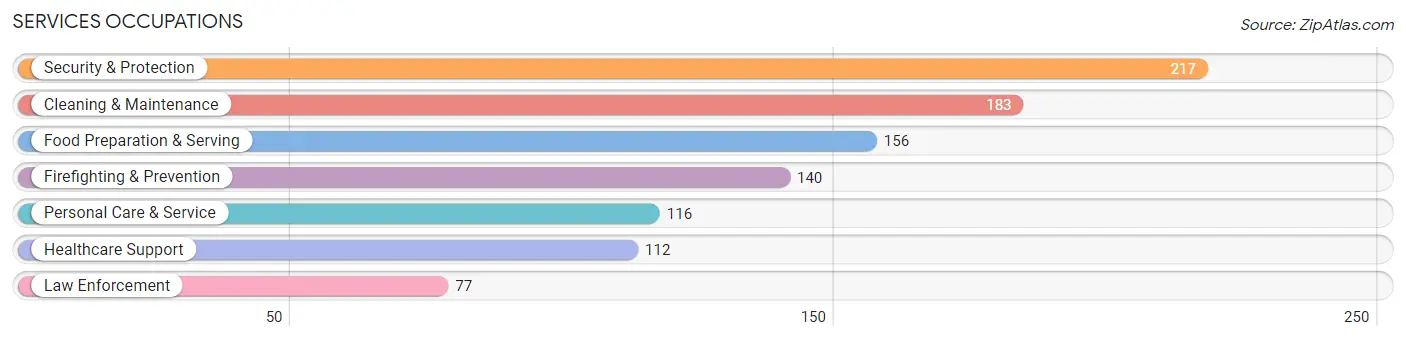
Services Occupations
The most common Services occupations in Hull are Security & Protection (217 | 3.5%), Cleaning & Maintenance (183 | 3.0%), Food Preparation & Serving (156 | 2.5%), Firefighting & Prevention (140 | 2.3%), and Personal Care & Service (116 | 1.9%).
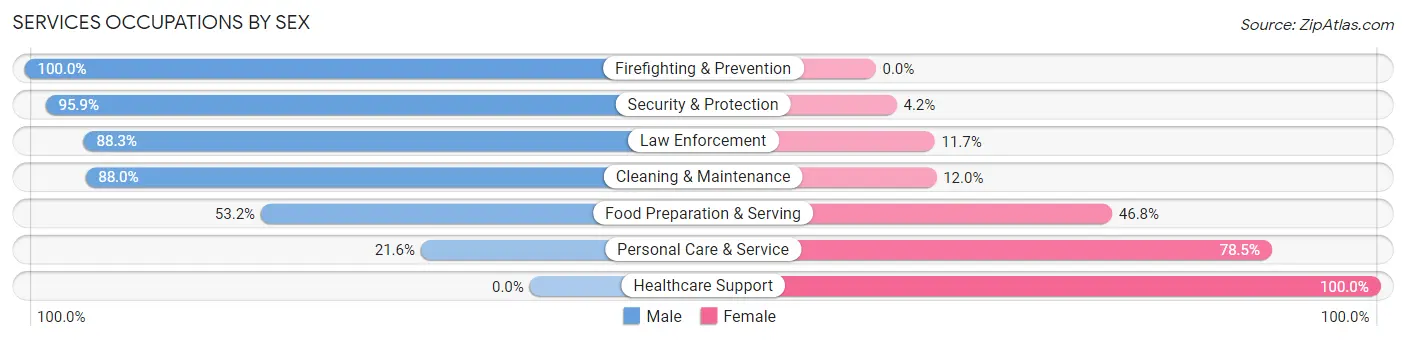
Services Occupations by Sex
Within the Services occupations in Hull, the most male-oriented occupations are Firefighting & Prevention (100.0%), Security & Protection (95.9%), and Law Enforcement (88.3%), while the most female-oriented occupations are Healthcare Support (100.0%), Personal Care & Service (78.4%), and Food Preparation & Serving (46.8%).
| Occupation | Male | Female |
| Healthcare Support | 0 (0.0%) | 112 (100.0%) |
| Security & Protection | 208 (95.9%) | 9 (4.2%) |
| Firefighting & Prevention | 140 (100.0%) | 0 (0.0%) |
| Law Enforcement | 68 (88.3%) | 9 (11.7%) |
| Food Preparation & Serving | 83 (53.2%) | 73 (46.8%) |
| Cleaning & Maintenance | 161 (88.0%) | 22 (12.0%) |
| Personal Care & Service | 25 (21.5%) | 91 (78.4%) |
| Total (Category) | 477 (60.8%) | 307 (39.2%) |
| Total (Overall) | 2,789 (45.1%) | 3,399 (54.9%) |
Sales and Office Occupations
The most common Sales and Office occupations in Hull are Sales & Related (612 | 9.9%), and Office & Administration (581 | 9.4%).
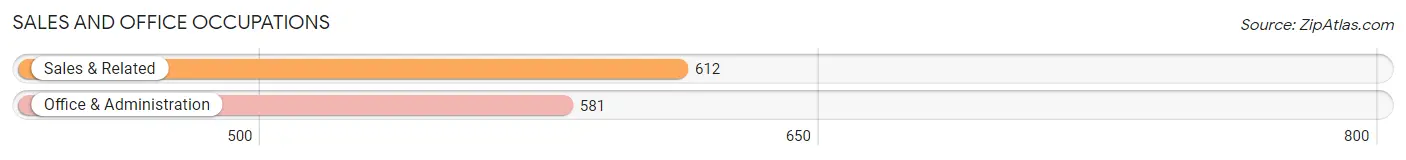
Sales and Office Occupations by Sex

| Occupation | Male | Female |
| Sales & Related | 241 (39.4%) | 371 (60.6%) |
| Office & Administration | 106 (18.2%) | 475 (81.8%) |
| Total (Category) | 347 (29.1%) | 846 (70.9%) |
| Total (Overall) | 2,789 (45.1%) | 3,399 (54.9%) |
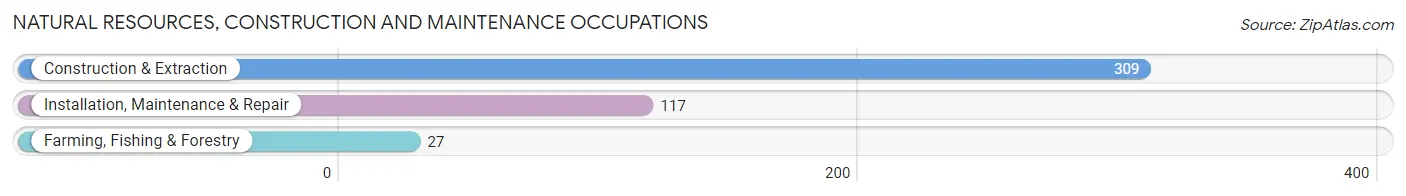
Natural Resources, Construction and Maintenance Occupations
The most common Natural Resources, Construction and Maintenance occupations in Hull are Construction & Extraction (309 | 5.0%), Installation, Maintenance & Repair (117 | 1.9%), and Farming, Fishing & Forestry (27 | 0.4%).
Natural Resources, Construction and Maintenance Occupations by Sex
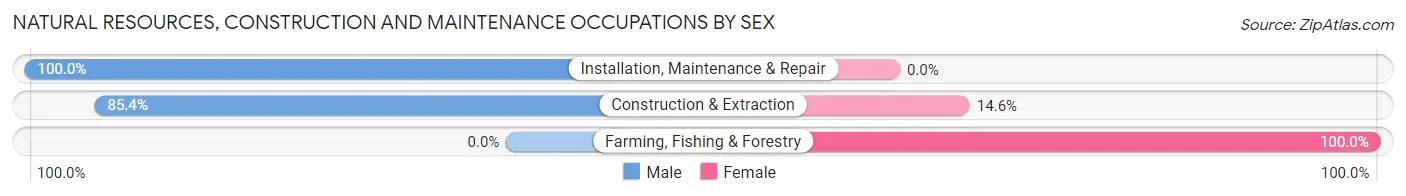
| Occupation | Male | Female |
| Farming, Fishing & Forestry | 0 (0.0%) | 27 (100.0%) |
| Construction & Extraction | 264 (85.4%) | 45 (14.6%) |
| Installation, Maintenance & Repair | 117 (100.0%) | 0 (0.0%) |
| Total (Category) | 381 (84.1%) | 72 (15.9%) |
| Total (Overall) | 2,789 (45.1%) | 3,399 (54.9%) |
Production, Transportation and Moving Occupations
The most common Production, Transportation and Moving occupations in Hull are Material Moving (225 | 3.6%), Transportation (150 | 2.4%), and Production (126 | 2.0%).
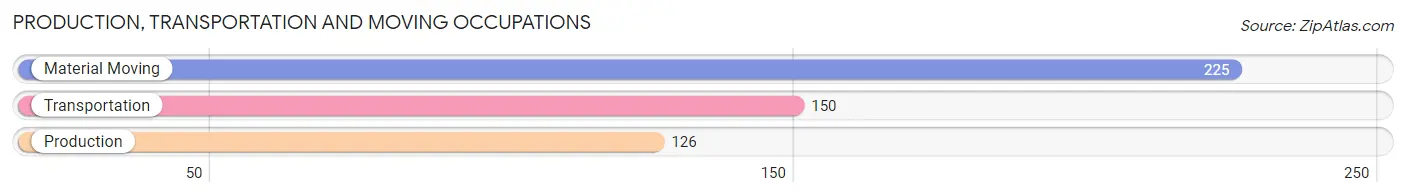
Production, Transportation and Moving Occupations by Sex
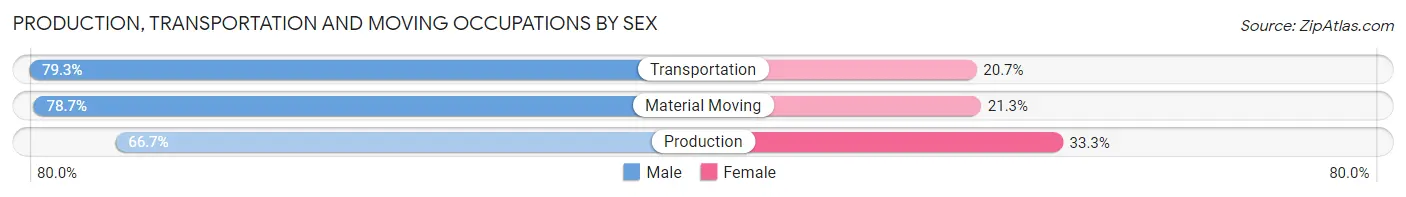
| Occupation | Male | Female |
| Production | 84 (66.7%) | 42 (33.3%) |
| Transportation | 119 (79.3%) | 31 (20.7%) |
| Material Moving | 177 (78.7%) | 48 (21.3%) |
| Total (Category) | 380 (75.8%) | 121 (24.1%) |
| Total (Overall) | 2,789 (45.1%) | 3,399 (54.9%) |
Employment Industries by Sex in Hull
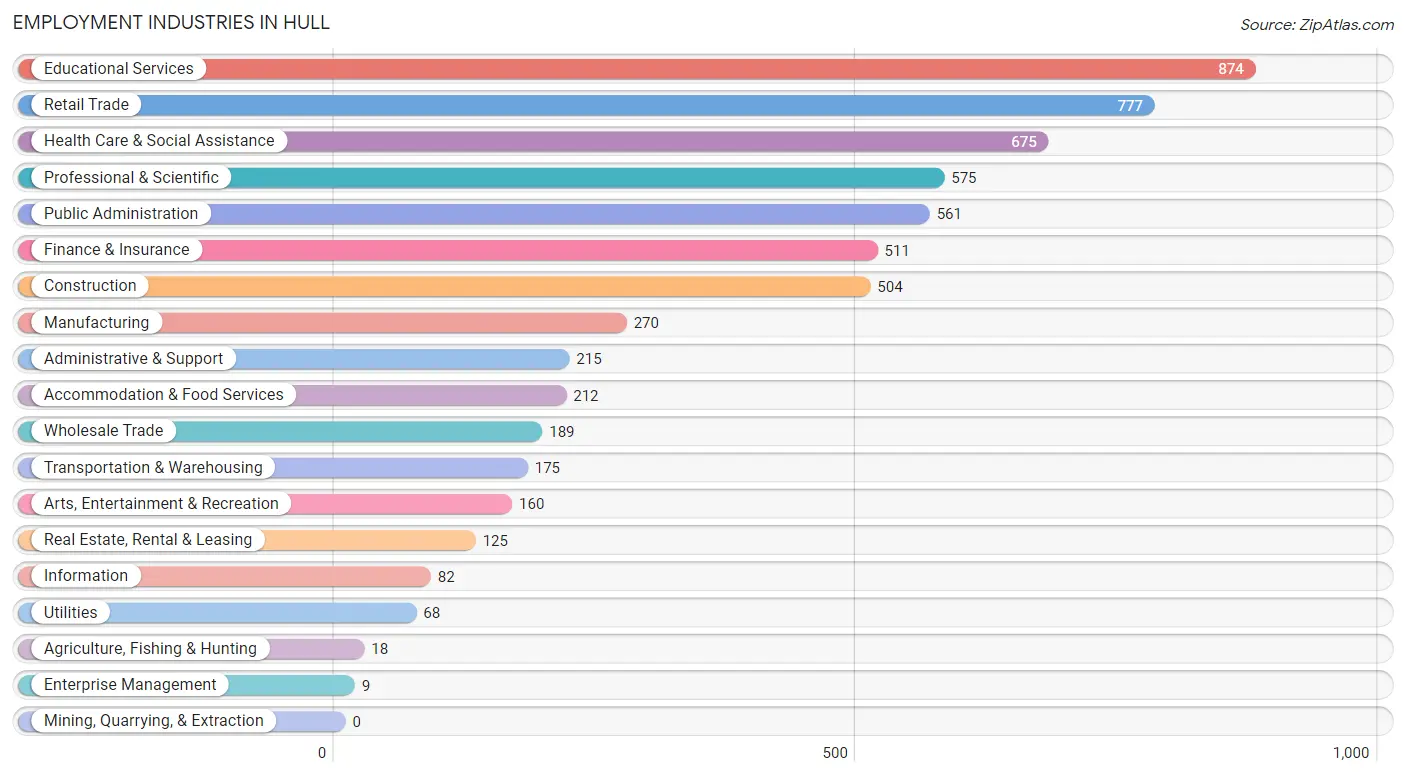
Employment Industries in Hull
The major employment industries in Hull include Educational Services (874 | 14.1%), Retail Trade (777 | 12.6%), Health Care & Social Assistance (675 | 10.9%), Professional & Scientific (575 | 9.3%), and Public Administration (561 | 9.1%).
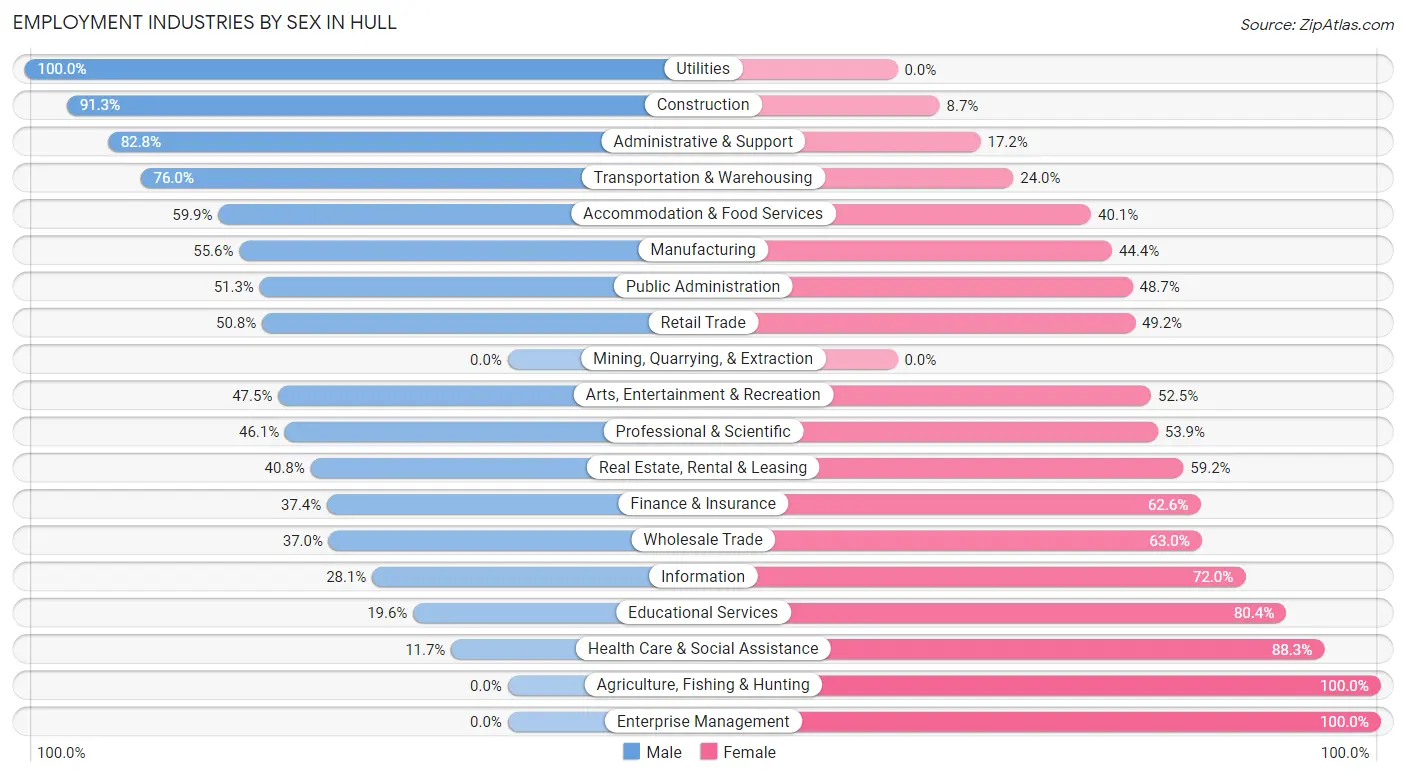
Employment Industries by Sex in Hull
The Hull industries that see more men than women are Utilities (100.0%), Construction (91.3%), and Administrative & Support (82.8%), whereas the industries that tend to have a higher number of women are Agriculture, Fishing & Hunting (100.0%), Enterprise Management (100.0%), and Health Care & Social Assistance (88.3%).
| Industry | Male | Female |
| Agriculture, Fishing & Hunting | 0 (0.0%) | 18 (100.0%) |
| Mining, Quarrying, & Extraction | 0 (0.0%) | 0 (0.0%) |
| Construction | 460 (91.3%) | 44 (8.7%) |
| Manufacturing | 150 (55.6%) | 120 (44.4%) |
| Wholesale Trade | 70 (37.0%) | 119 (63.0%) |
| Retail Trade | 395 (50.8%) | 382 (49.2%) |
| Transportation & Warehousing | 133 (76.0%) | 42 (24.0%) |
| Utilities | 68 (100.0%) | 0 (0.0%) |
| Information | 23 (28.1%) | 59 (72.0%) |
| Finance & Insurance | 191 (37.4%) | 320 (62.6%) |
| Real Estate, Rental & Leasing | 51 (40.8%) | 74 (59.2%) |
| Professional & Scientific | 265 (46.1%) | 310 (53.9%) |
| Enterprise Management | 0 (0.0%) | 9 (100.0%) |
| Administrative & Support | 178 (82.8%) | 37 (17.2%) |
| Educational Services | 171 (19.6%) | 703 (80.4%) |
| Health Care & Social Assistance | 79 (11.7%) | 596 (88.3%) |
| Arts, Entertainment & Recreation | 76 (47.5%) | 84 (52.5%) |
| Accommodation & Food Services | 127 (59.9%) | 85 (40.1%) |
| Public Administration | 288 (51.3%) | 273 (48.7%) |
| Total | 2,789 (45.1%) | 3,399 (54.9%) |
Education in Hull
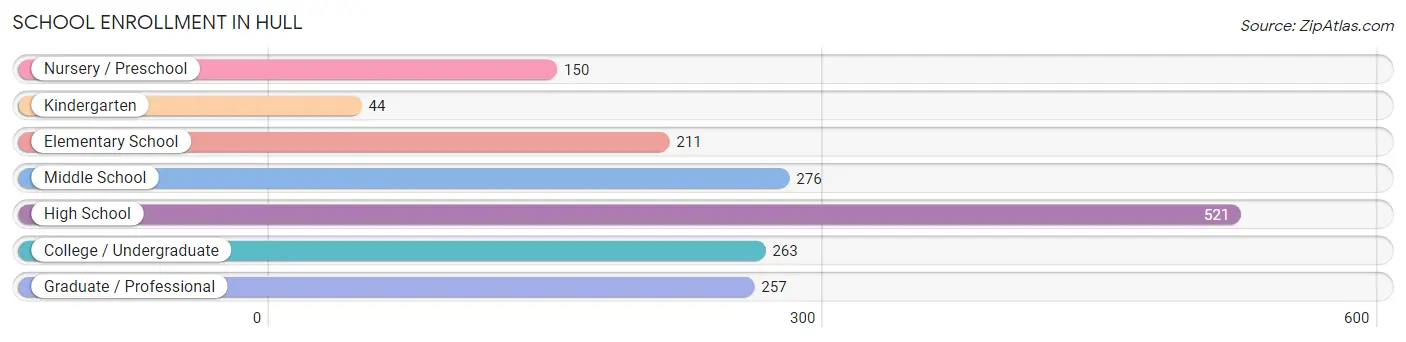
School Enrollment in Hull
The most common levels of schooling among the 1,722 students in Hull are high school (521 | 30.3%), middle school (276 | 16.0%), and college / undergraduate (263 | 15.3%).
| School Level | # Students | % Students |
| Nursery / Preschool | 150 | 8.7% |
| Kindergarten | 44 | 2.6% |
| Elementary School | 211 | 12.2% |
| Middle School | 276 | 16.0% |
| High School | 521 | 30.3% |
| College / Undergraduate | 263 | 15.3% |
| Graduate / Professional | 257 | 14.9% |
| Total | 1,722 | 100.0% |
School Enrollment by Age by Funding Source in Hull
Out of a total of 1,722 students who are enrolled in schools in Hull, 389 (22.6%) attend a private institution, while the remaining 1,333 (77.4%) are enrolled in public schools. The age group of 20 to 24 year olds has the highest likelihood of being enrolled in private schools, with 97 (58.4% in the age bracket) enrolled. Conversely, the age group of 15 to 17 year olds has the lowest likelihood of being enrolled in a private school, with 392 (100.0% in the age bracket) attending a public institution.
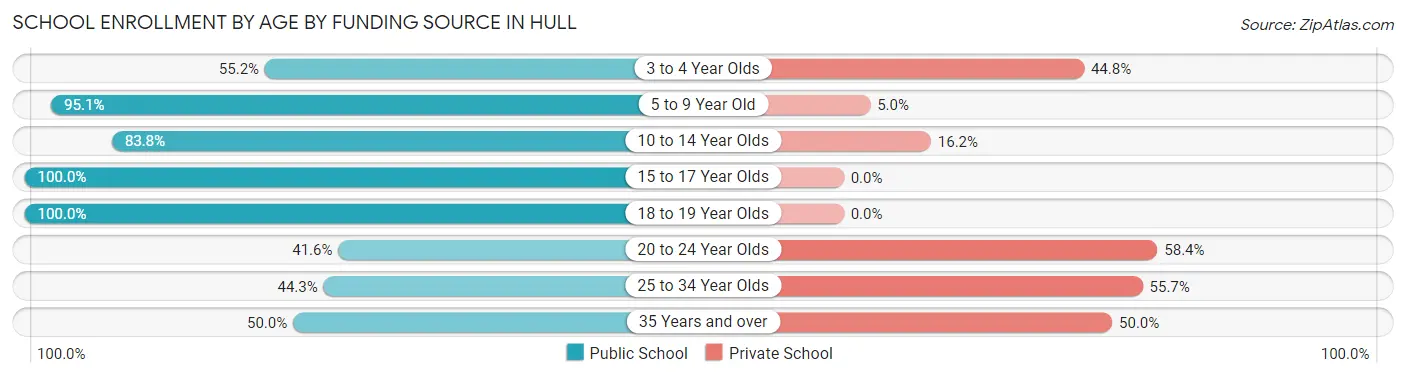
| Age Bracket | Public School | Private School |
| 3 to 4 Year Olds | 58 (55.2%) | 47 (44.8%) |
| 5 to 9 Year Old | 269 (95.1%) | 14 (5.0%) |
| 10 to 14 Year Olds | 263 (83.8%) | 51 (16.2%) |
| 15 to 17 Year Olds | 392 (100.0%) | 0 (0.0%) |
| 18 to 19 Year Olds | 133 (100.0%) | 0 (0.0%) |
| 20 to 24 Year Olds | 69 (41.6%) | 97 (58.4%) |
| 25 to 34 Year Olds | 121 (44.3%) | 152 (55.7%) |
| 35 Years and over | 28 (50.0%) | 28 (50.0%) |
| Total | 1,333 (77.4%) | 389 (22.6%) |
Educational Attainment by Field of Study in Hull
Business (829 | 17.7%), social sciences (594 | 12.7%), education (529 | 11.3%), science & technology (418 | 8.9%), and psychology (417 | 8.9%) are the most common fields of study among 4,672 individuals in Hull who have obtained a bachelor's degree or higher.
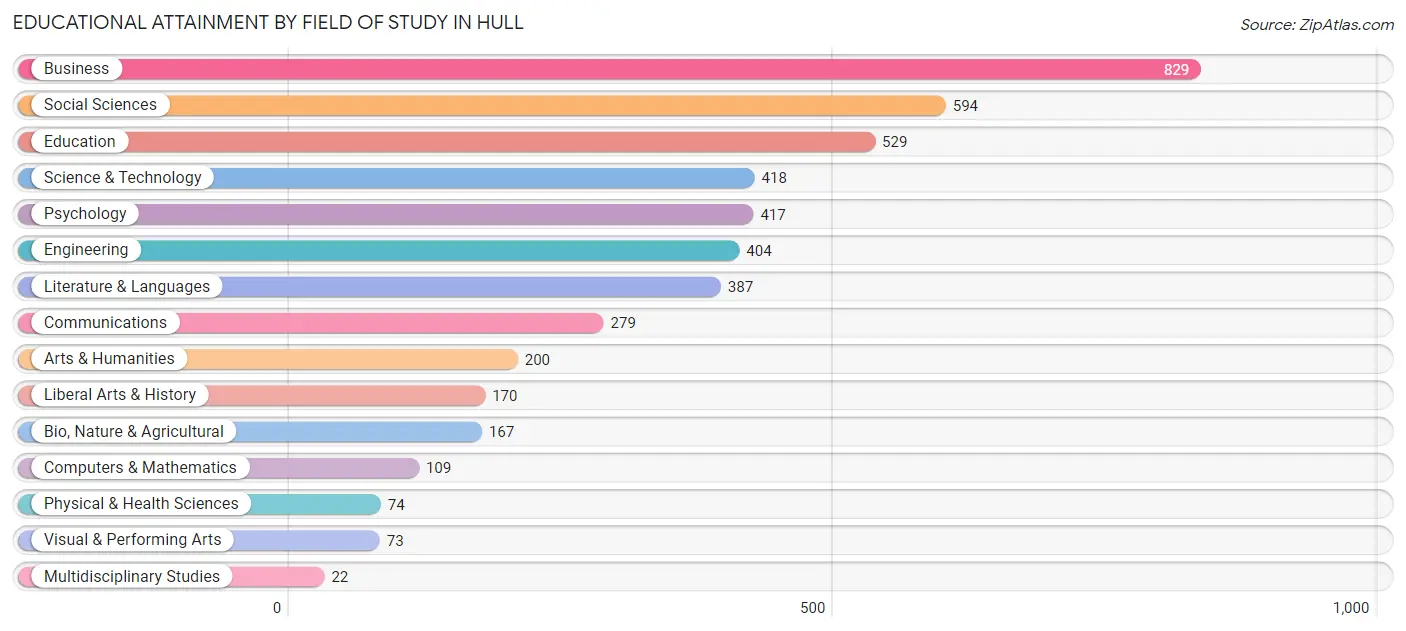
| Field of Study | # Graduates | % Graduates |
| Computers & Mathematics | 109 | 2.3% |
| Bio, Nature & Agricultural | 167 | 3.6% |
| Physical & Health Sciences | 74 | 1.6% |
| Psychology | 417 | 8.9% |
| Social Sciences | 594 | 12.7% |
| Engineering | 404 | 8.6% |
| Multidisciplinary Studies | 22 | 0.5% |
| Science & Technology | 418 | 8.9% |
| Business | 829 | 17.7% |
| Education | 529 | 11.3% |
| Literature & Languages | 387 | 8.3% |
| Liberal Arts & History | 170 | 3.6% |
| Visual & Performing Arts | 73 | 1.6% |
| Communications | 279 | 6.0% |
| Arts & Humanities | 200 | 4.3% |
| Total | 4,672 | 100.0% |
Transportation & Commute in Hull
Vehicle Availability by Sex in Hull
The most prevalent vehicle ownership categories in Hull are males with 2 vehicles (1,252, accounting for 45.1%) and females with 2 vehicles (1,228, making up 37.1%).
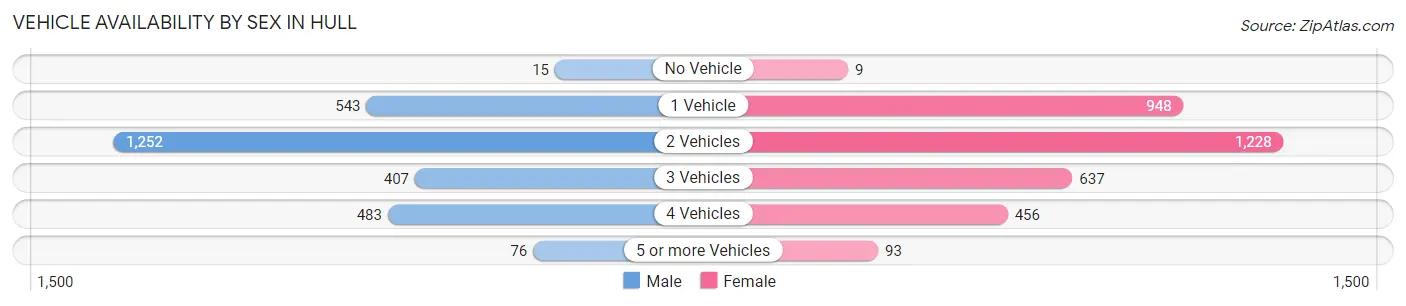
| Vehicles Available | Male | Female |
| No Vehicle | 15 (0.5%) | 9 (0.3%) |
| 1 Vehicle | 543 (19.6%) | 948 (28.1%) |
| 2 Vehicles | 1,252 (45.1%) | 1,228 (36.4%) |
| 3 Vehicles | 407 (14.7%) | 637 (18.9%) |
| 4 Vehicles | 483 (17.4%) | 456 (13.5%) |
| 5 or more Vehicles | 76 (2.7%) | 93 (2.8%) |
| Total | 2,776 (100.0%) | 3,371 (100.0%) |
Commute Time in Hull
The most frequently occuring commute durations in Hull are 60 to 89 minutes (867 commuters, 16.7%), 5 to 9 minutes (630 commuters, 12.2%), and 10 to 14 minutes (502 commuters, 9.7%).
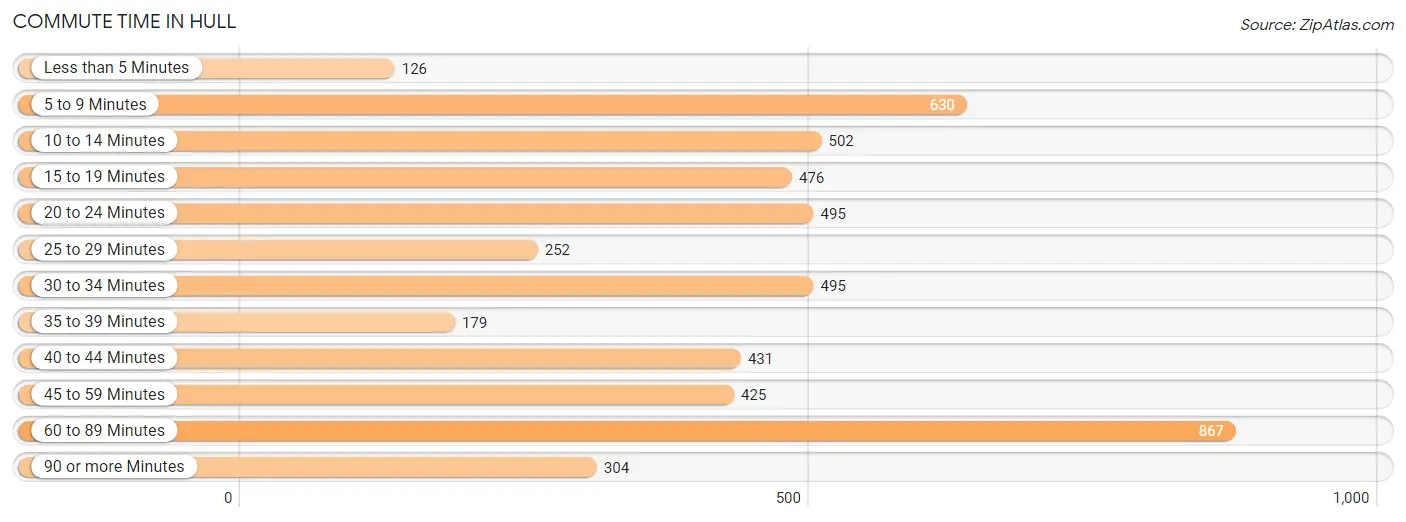
| Commute Time | # Commuters | % Commuters |
| Less than 5 Minutes | 126 | 2.4% |
| 5 to 9 Minutes | 630 | 12.2% |
| 10 to 14 Minutes | 502 | 9.7% |
| 15 to 19 Minutes | 476 | 9.2% |
| 20 to 24 Minutes | 495 | 9.6% |
| 25 to 29 Minutes | 252 | 4.9% |
| 30 to 34 Minutes | 495 | 9.6% |
| 35 to 39 Minutes | 179 | 3.5% |
| 40 to 44 Minutes | 431 | 8.3% |
| 45 to 59 Minutes | 425 | 8.2% |
| 60 to 89 Minutes | 867 | 16.7% |
| 90 or more Minutes | 304 | 5.9% |
Commute Time by Sex in Hull
The most common commute times in Hull are 10 to 14 minutes (315 commuters, 13.8%) for males and 60 to 89 minutes (576 commuters, 19.9%) for females.
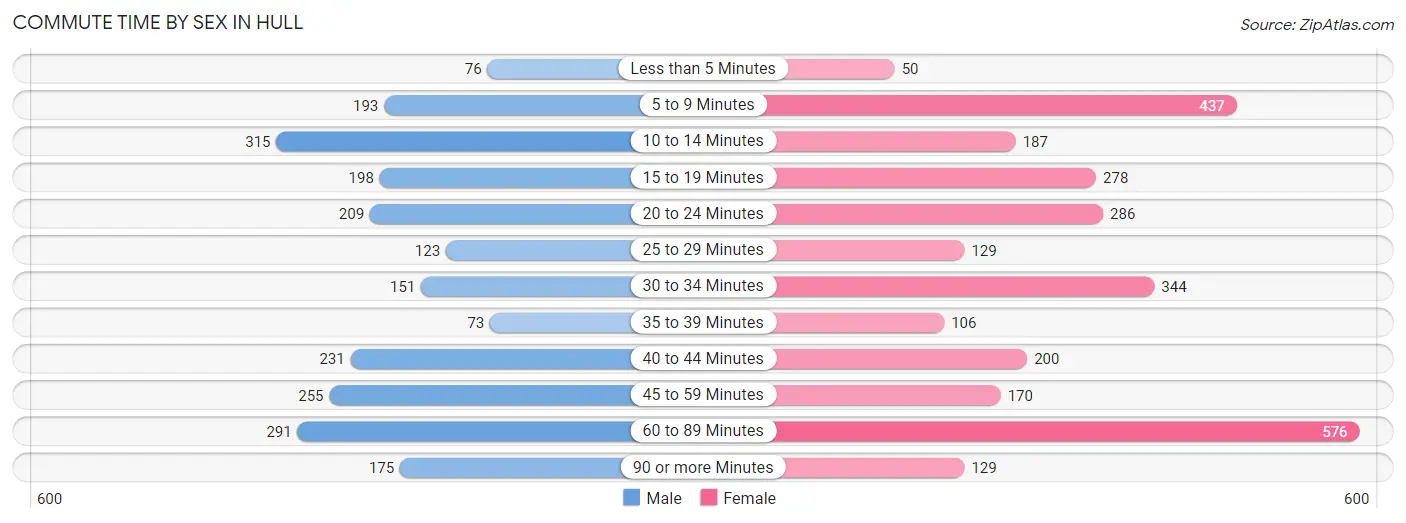
| Commute Time | Male | Female |
| Less than 5 Minutes | 76 (3.3%) | 50 (1.7%) |
| 5 to 9 Minutes | 193 (8.4%) | 437 (15.1%) |
| 10 to 14 Minutes | 315 (13.8%) | 187 (6.5%) |
| 15 to 19 Minutes | 198 (8.6%) | 278 (9.6%) |
| 20 to 24 Minutes | 209 (9.1%) | 286 (9.9%) |
| 25 to 29 Minutes | 123 (5.4%) | 129 (4.5%) |
| 30 to 34 Minutes | 151 (6.6%) | 344 (11.9%) |
| 35 to 39 Minutes | 73 (3.2%) | 106 (3.7%) |
| 40 to 44 Minutes | 231 (10.1%) | 200 (6.9%) |
| 45 to 59 Minutes | 255 (11.1%) | 170 (5.9%) |
| 60 to 89 Minutes | 291 (12.7%) | 576 (19.9%) |
| 90 or more Minutes | 175 (7.6%) | 129 (4.5%) |
Time of Departure to Work by Sex in Hull
The most frequent times of departure to work in Hull are 8:00 AM to 8:29 AM (328, 14.3%) for males and 8:00 AM to 8:29 AM (636, 22.0%) for females.
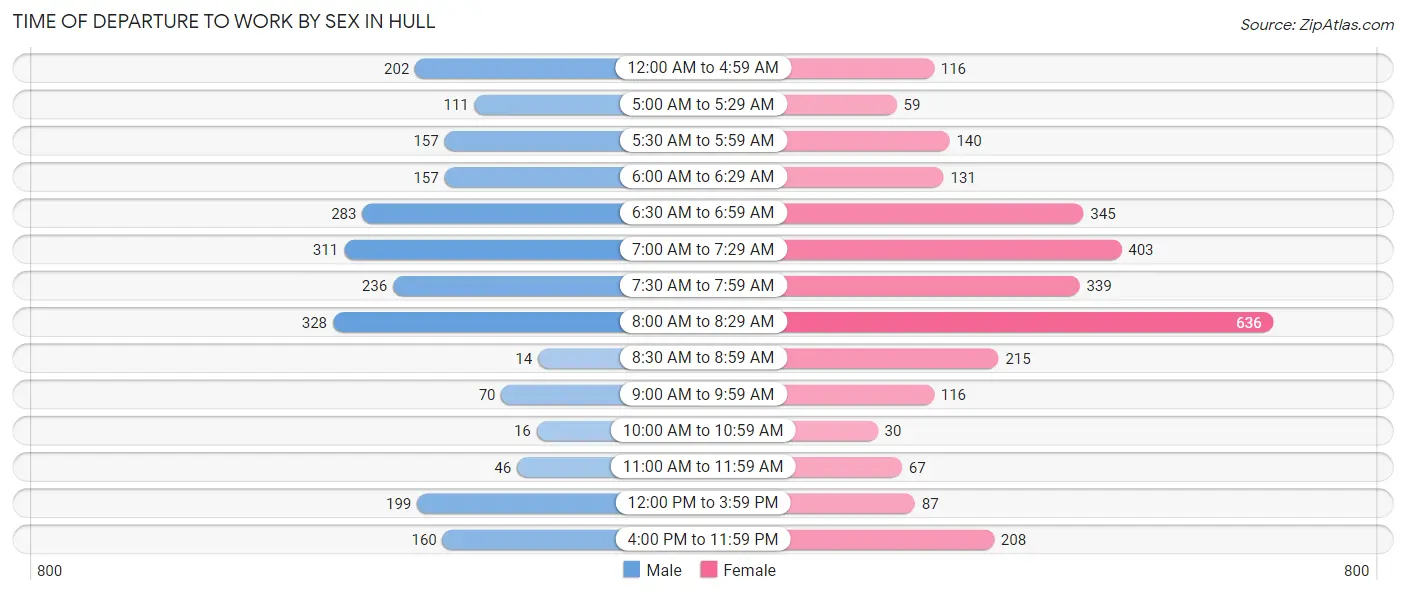
| Time of Departure | Male | Female |
| 12:00 AM to 4:59 AM | 202 (8.8%) | 116 (4.0%) |
| 5:00 AM to 5:29 AM | 111 (4.9%) | 59 (2.0%) |
| 5:30 AM to 5:59 AM | 157 (6.9%) | 140 (4.8%) |
| 6:00 AM to 6:29 AM | 157 (6.9%) | 131 (4.5%) |
| 6:30 AM to 6:59 AM | 283 (12.4%) | 345 (11.9%) |
| 7:00 AM to 7:29 AM | 311 (13.6%) | 403 (13.9%) |
| 7:30 AM to 7:59 AM | 236 (10.3%) | 339 (11.7%) |
| 8:00 AM to 8:29 AM | 328 (14.3%) | 636 (22.0%) |
| 8:30 AM to 8:59 AM | 14 (0.6%) | 215 (7.4%) |
| 9:00 AM to 9:59 AM | 70 (3.1%) | 116 (4.0%) |
| 10:00 AM to 10:59 AM | 16 (0.7%) | 30 (1.0%) |
| 11:00 AM to 11:59 AM | 46 (2.0%) | 67 (2.3%) |
| 12:00 PM to 3:59 PM | 199 (8.7%) | 87 (3.0%) |
| 4:00 PM to 11:59 PM | 160 (7.0%) | 208 (7.2%) |
| Total | 2,290 (100.0%) | 2,892 (100.0%) |
Housing Occupancy in Hull
Occupancy by Ownership in Hull
Of the total 4,504 dwellings in Hull, owner-occupied units account for 3,666 (81.4%), while renter-occupied units make up 838 (18.6%).
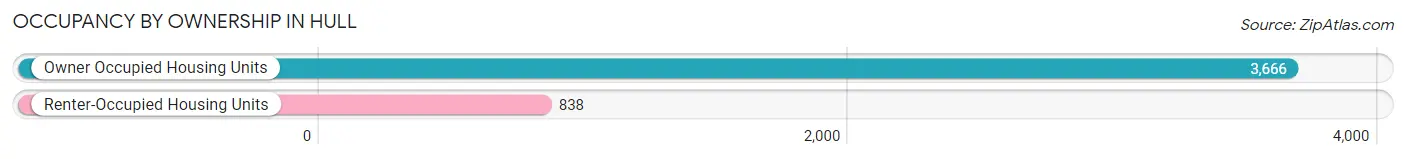
| Occupancy | # Housing Units | % Housing Units |
| Owner Occupied Housing Units | 3,666 | 81.4% |
| Renter-Occupied Housing Units | 838 | 18.6% |
| Total Occupied Housing Units | 4,504 | 100.0% |
Occupancy by Household Size in Hull
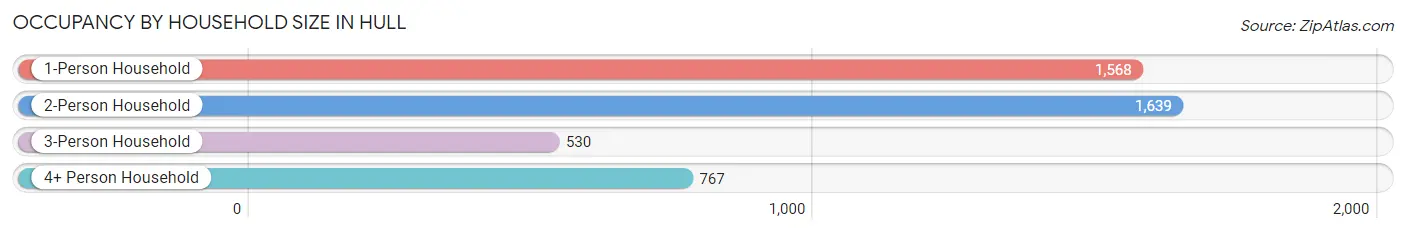
| Household Size | # Housing Units | % Housing Units |
| 1-Person Household | 1,568 | 34.8% |
| 2-Person Household | 1,639 | 36.4% |
| 3-Person Household | 530 | 11.8% |
| 4+ Person Household | 767 | 17.0% |
| Total Housing Units | 4,504 | 100.0% |
Occupancy by Ownership by Household Size in Hull
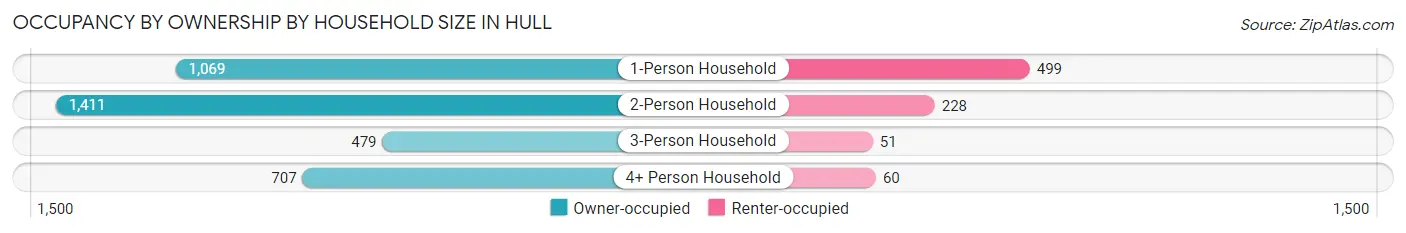
| Household Size | Owner-occupied | Renter-occupied |
| 1-Person Household | 1,069 (68.2%) | 499 (31.8%) |
| 2-Person Household | 1,411 (86.1%) | 228 (13.9%) |
| 3-Person Household | 479 (90.4%) | 51 (9.6%) |
| 4+ Person Household | 707 (92.2%) | 60 (7.8%) |
| Total Housing Units | 3,666 (81.4%) | 838 (18.6%) |
Occupancy by Educational Attainment in Hull
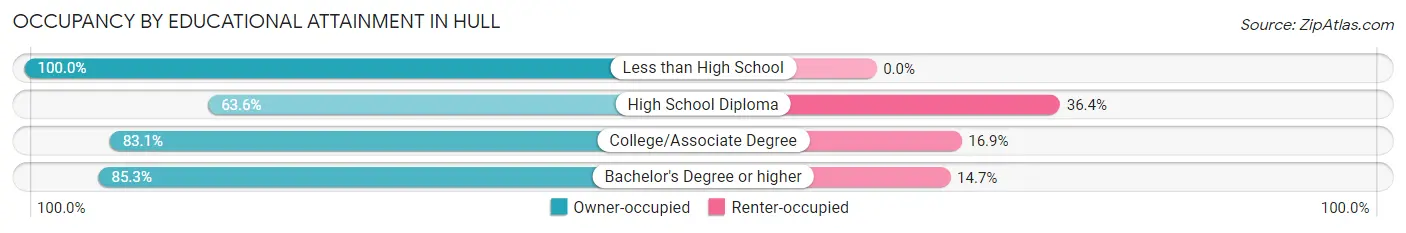
| Household Size | Owner-occupied | Renter-occupied |
| Less than High School | 74 (100.0%) | 0 (0.0%) |
| High School Diploma | 468 (63.6%) | 268 (36.4%) |
| College/Associate Degree | 1,059 (83.1%) | 215 (16.9%) |
| Bachelor's Degree or higher | 2,065 (85.3%) | 355 (14.7%) |
Occupancy by Age of Householder in Hull
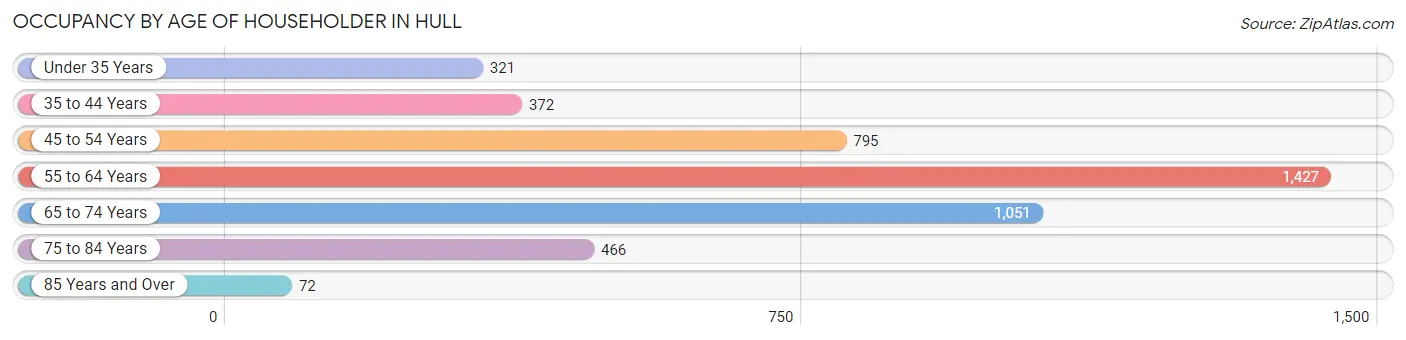
| Age Bracket | # Households | % Households |
| Under 35 Years | 321 | 7.1% |
| 35 to 44 Years | 372 | 8.3% |
| 45 to 54 Years | 795 | 17.6% |
| 55 to 64 Years | 1,427 | 31.7% |
| 65 to 74 Years | 1,051 | 23.3% |
| 75 to 84 Years | 466 | 10.3% |
| 85 Years and Over | 72 | 1.6% |
| Total | 4,504 | 100.0% |
Housing Finances in Hull
Median Income by Occupancy in Hull
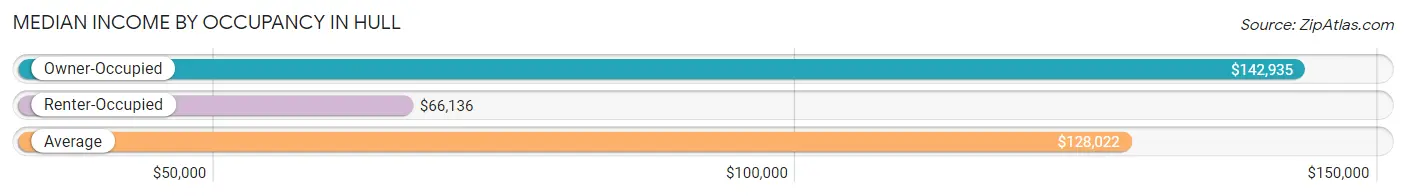
| Occupancy Type | # Households | Median Income |
| Owner-Occupied | 3,666 (81.4%) | $142,935 |
| Renter-Occupied | 838 (18.6%) | $66,136 |
| Average | 4,504 (100.0%) | $128,022 |
Occupancy by Householder Income Bracket in Hull
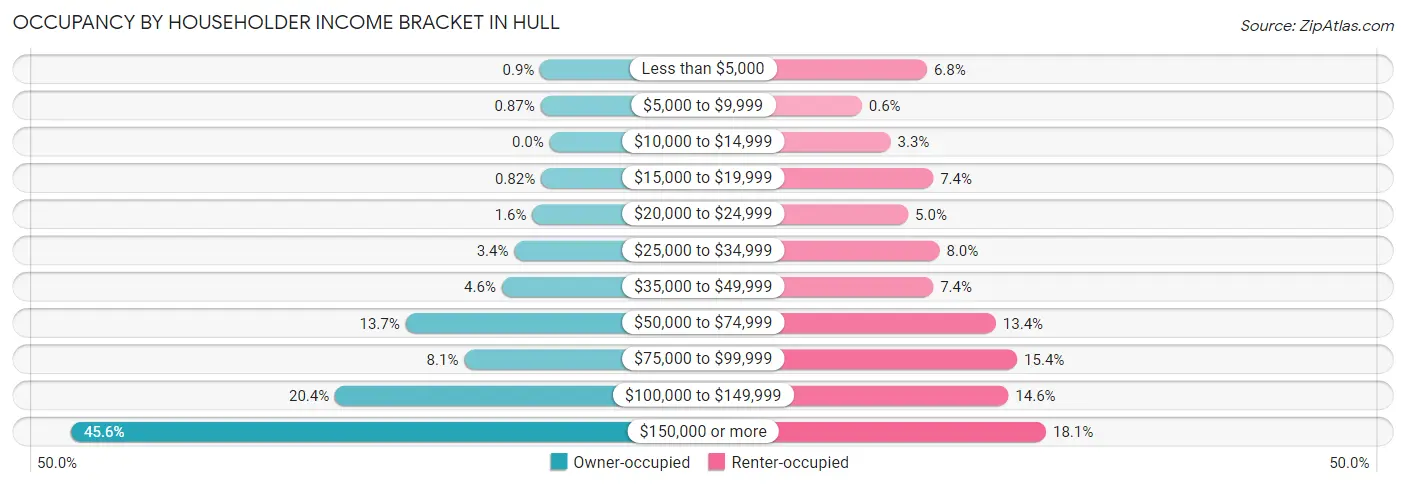
| Income Bracket | Owner-occupied | Renter-occupied |
| Less than $5,000 | 33 (0.9%) | 57 (6.8%) |
| $5,000 to $9,999 | 32 (0.9%) | 5 (0.6%) |
| $10,000 to $14,999 | 0 (0.0%) | 28 (3.3%) |
| $15,000 to $19,999 | 30 (0.8%) | 62 (7.4%) |
| $20,000 to $24,999 | 60 (1.6%) | 42 (5.0%) |
| $25,000 to $34,999 | 123 (3.4%) | 67 (8.0%) |
| $35,000 to $49,999 | 167 (4.6%) | 62 (7.4%) |
| $50,000 to $74,999 | 503 (13.7%) | 112 (13.4%) |
| $75,000 to $99,999 | 298 (8.1%) | 129 (15.4%) |
| $100,000 to $149,999 | 749 (20.4%) | 122 (14.6%) |
| $150,000 or more | 1,671 (45.6%) | 152 (18.1%) |
| Total | 3,666 (100.0%) | 838 (100.0%) |
Monthly Housing Cost Tiers in Hull
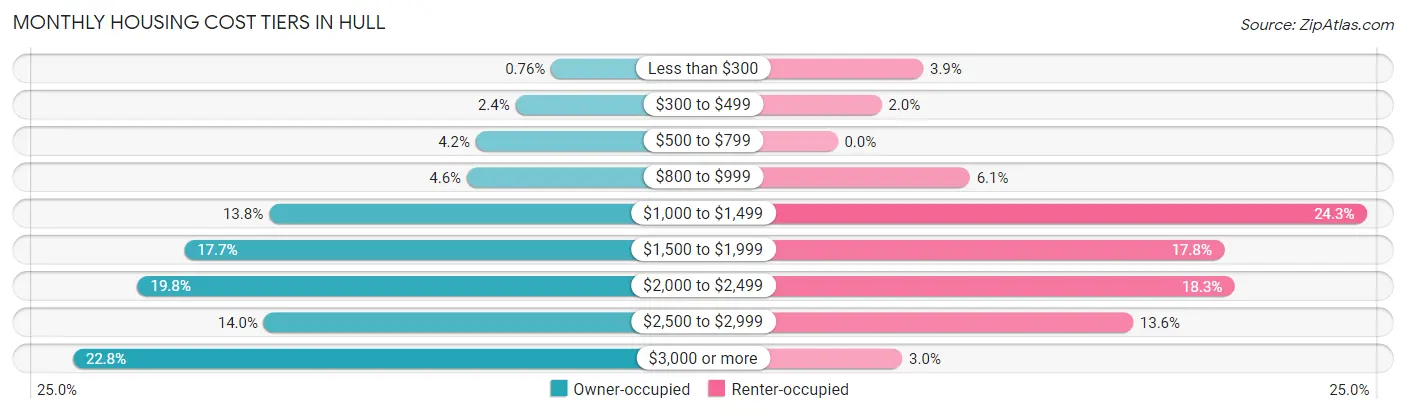
| Monthly Cost | Owner-occupied | Renter-occupied |
| Less than $300 | 28 (0.8%) | 33 (3.9%) |
| $300 to $499 | 88 (2.4%) | 17 (2.0%) |
| $500 to $799 | 155 (4.2%) | 0 (0.0%) |
| $800 to $999 | 170 (4.6%) | 51 (6.1%) |
| $1,000 to $1,499 | 504 (13.8%) | 204 (24.3%) |
| $1,500 to $1,999 | 647 (17.6%) | 149 (17.8%) |
| $2,000 to $2,499 | 726 (19.8%) | 153 (18.3%) |
| $2,500 to $2,999 | 513 (14.0%) | 114 (13.6%) |
| $3,000 or more | 835 (22.8%) | 25 (3.0%) |
| Total | 3,666 (100.0%) | 838 (100.0%) |
Physical Housing Characteristics in Hull
Housing Structures in Hull
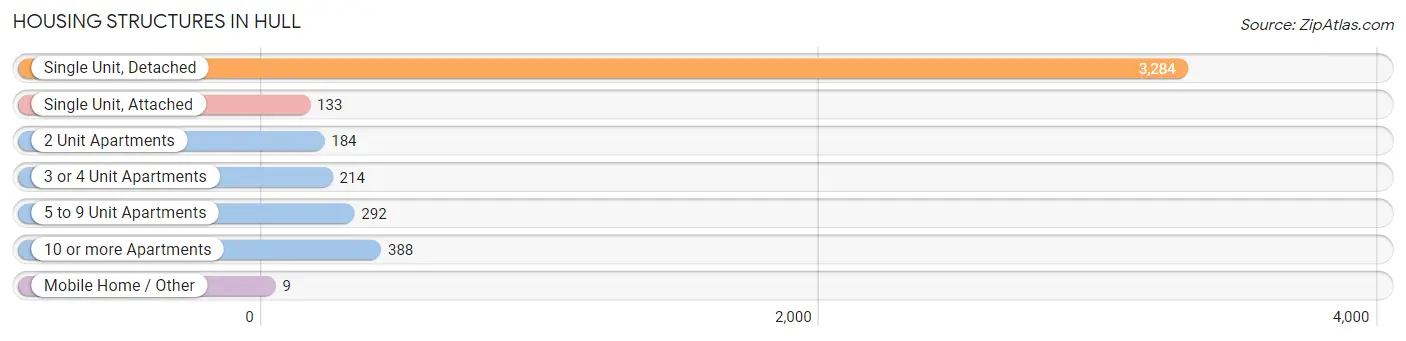
| Structure Type | # Housing Units | % Housing Units |
| Single Unit, Detached | 3,284 | 72.9% |
| Single Unit, Attached | 133 | 2.9% |
| 2 Unit Apartments | 184 | 4.1% |
| 3 or 4 Unit Apartments | 214 | 4.8% |
| 5 to 9 Unit Apartments | 292 | 6.5% |
| 10 or more Apartments | 388 | 8.6% |
| Mobile Home / Other | 9 | 0.2% |
| Total | 4,504 | 100.0% |
Housing Structures by Occupancy in Hull
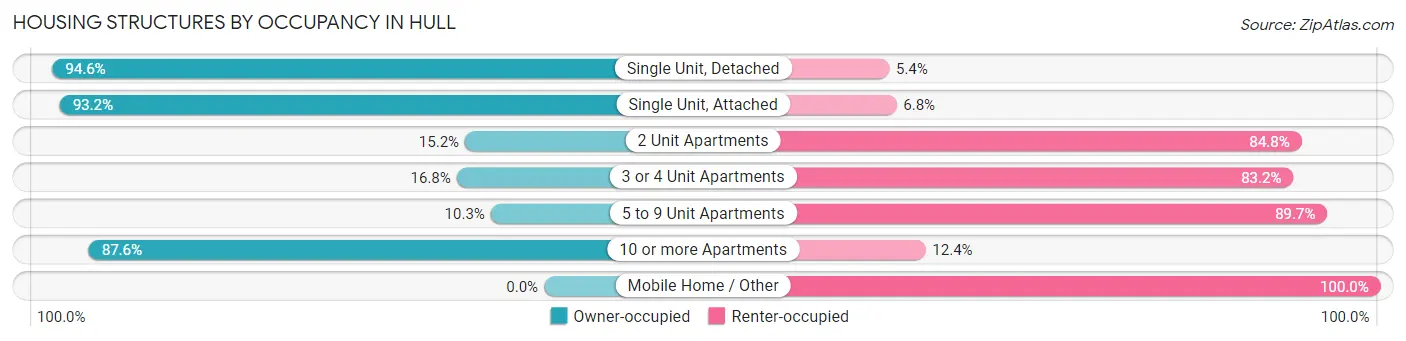
| Structure Type | Owner-occupied | Renter-occupied |
| Single Unit, Detached | 3,108 (94.6%) | 176 (5.4%) |
| Single Unit, Attached | 124 (93.2%) | 9 (6.8%) |
| 2 Unit Apartments | 28 (15.2%) | 156 (84.8%) |
| 3 or 4 Unit Apartments | 36 (16.8%) | 178 (83.2%) |
| 5 to 9 Unit Apartments | 30 (10.3%) | 262 (89.7%) |
| 10 or more Apartments | 340 (87.6%) | 48 (12.4%) |
| Mobile Home / Other | 0 (0.0%) | 9 (100.0%) |
| Total | 3,666 (81.4%) | 838 (18.6%) |
Housing Structures by Number of Rooms in Hull
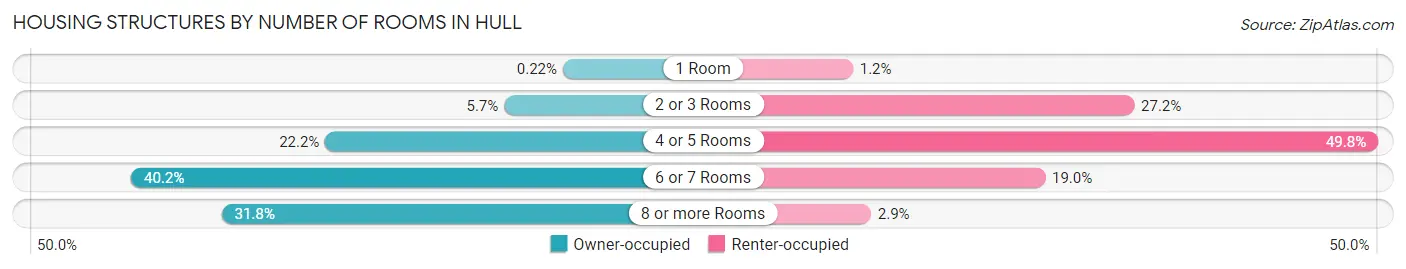
| Number of Rooms | Owner-occupied | Renter-occupied |
| 1 Room | 8 (0.2%) | 10 (1.2%) |
| 2 or 3 Rooms | 207 (5.7%) | 228 (27.2%) |
| 4 or 5 Rooms | 814 (22.2%) | 417 (49.8%) |
| 6 or 7 Rooms | 1,472 (40.2%) | 159 (19.0%) |
| 8 or more Rooms | 1,165 (31.8%) | 24 (2.9%) |
| Total | 3,666 (100.0%) | 838 (100.0%) |
Housing Structure by Heating Type in Hull
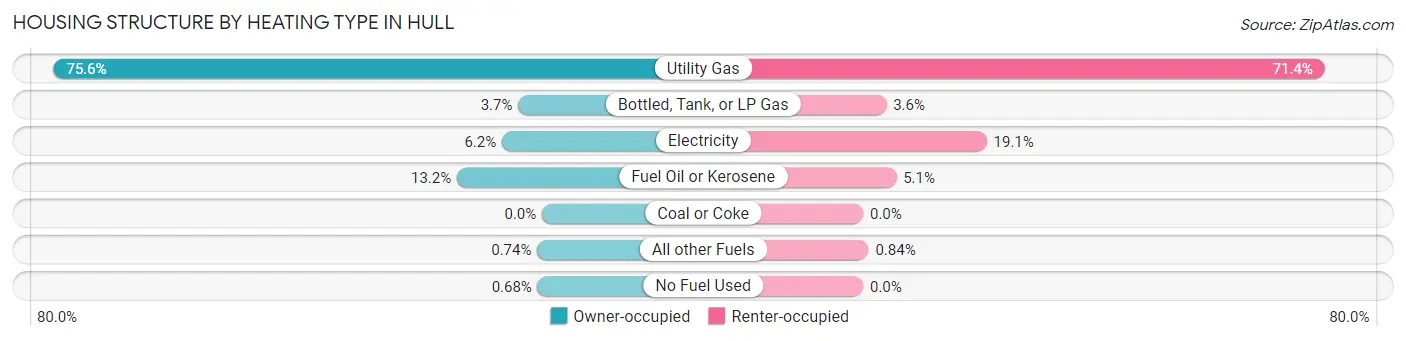
| Heating Type | Owner-occupied | Renter-occupied |
| Utility Gas | 2,770 (75.6%) | 598 (71.4%) |
| Bottled, Tank, or LP Gas | 135 (3.7%) | 30 (3.6%) |
| Electricity | 227 (6.2%) | 160 (19.1%) |
| Fuel Oil or Kerosene | 482 (13.2%) | 43 (5.1%) |
| Coal or Coke | 0 (0.0%) | 0 (0.0%) |
| All other Fuels | 27 (0.7%) | 7 (0.8%) |
| No Fuel Used | 25 (0.7%) | 0 (0.0%) |
| Total | 3,666 (100.0%) | 838 (100.0%) |
Household Vehicle Usage in Hull
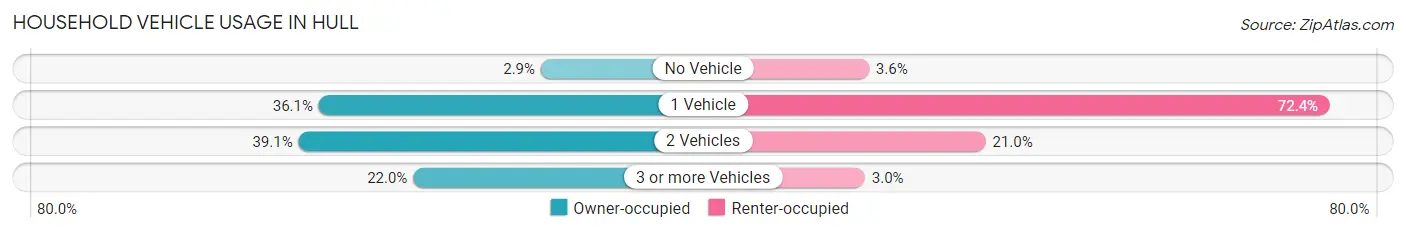
| Vehicles per Household | Owner-occupied | Renter-occupied |
| No Vehicle | 106 (2.9%) | 30 (3.6%) |
| 1 Vehicle | 1,322 (36.1%) | 607 (72.4%) |
| 2 Vehicles | 1,433 (39.1%) | 176 (21.0%) |
| 3 or more Vehicles | 805 (22.0%) | 25 (3.0%) |
| Total | 3,666 (100.0%) | 838 (100.0%) |
Real Estate & Mortgages in Hull
Real Estate and Mortgage Overview in Hull
| Characteristic | Without Mortgage | With Mortgage |
| Housing Units | 1,109 | 2,557 |
| Median Property Value | $568,400 | $562,300 |
| Median Household Income | $84,583 | $1,391 |
| Monthly Housing Costs | $1,147 | $835 |
| Real Estate Taxes | $6,231 | $0 |
Property Value by Mortgage Status in Hull
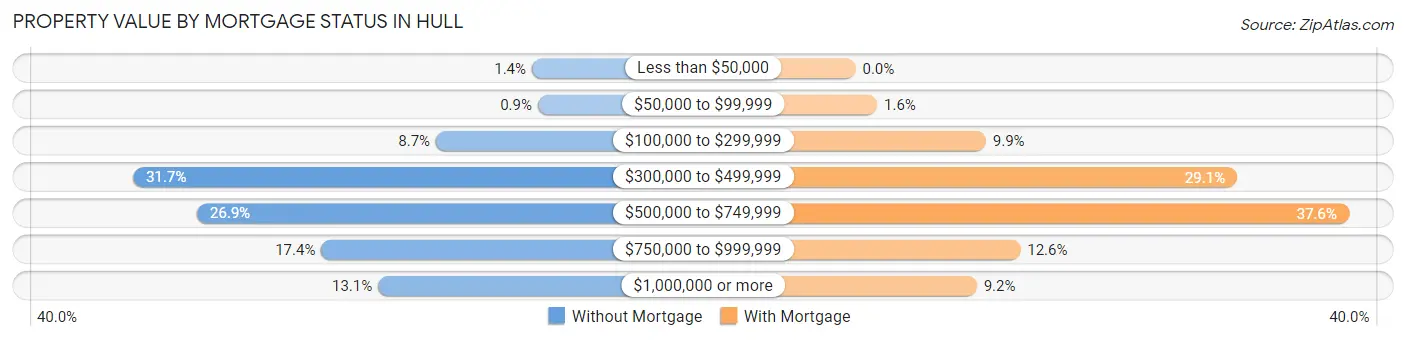
| Property Value | Without Mortgage | With Mortgage |
| Less than $50,000 | 15 (1.3%) | 0 (0.0%) |
| $50,000 to $99,999 | 10 (0.9%) | 42 (1.6%) |
| $100,000 to $299,999 | 96 (8.7%) | 254 (9.9%) |
| $300,000 to $499,999 | 352 (31.7%) | 743 (29.1%) |
| $500,000 to $749,999 | 298 (26.9%) | 961 (37.6%) |
| $750,000 to $999,999 | 193 (17.4%) | 321 (12.6%) |
| $1,000,000 or more | 145 (13.1%) | 236 (9.2%) |
| Total | 1,109 (100.0%) | 2,557 (100.0%) |
Household Income by Mortgage Status in Hull
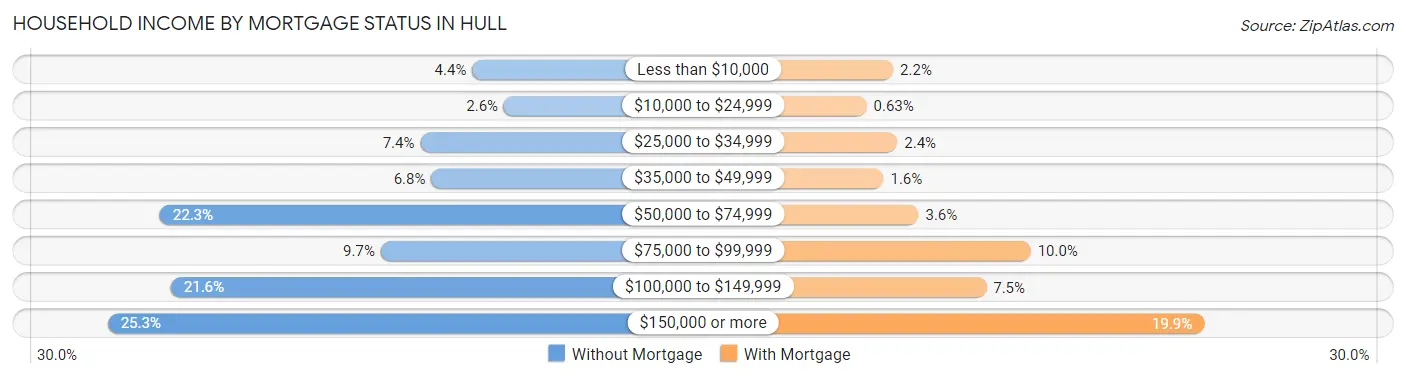
| Household Income | Without Mortgage | With Mortgage |
| Less than $10,000 | 49 (4.4%) | 55 (2.1%) |
| $10,000 to $24,999 | 29 (2.6%) | 16 (0.6%) |
| $25,000 to $34,999 | 82 (7.4%) | 61 (2.4%) |
| $35,000 to $49,999 | 75 (6.8%) | 41 (1.6%) |
| $50,000 to $74,999 | 247 (22.3%) | 92 (3.6%) |
| $75,000 to $99,999 | 107 (9.7%) | 256 (10.0%) |
| $100,000 to $149,999 | 240 (21.6%) | 191 (7.5%) |
| $150,000 or more | 280 (25.3%) | 509 (19.9%) |
| Total | 1,109 (100.0%) | 2,557 (100.0%) |
Property Value to Household Income Ratio in Hull
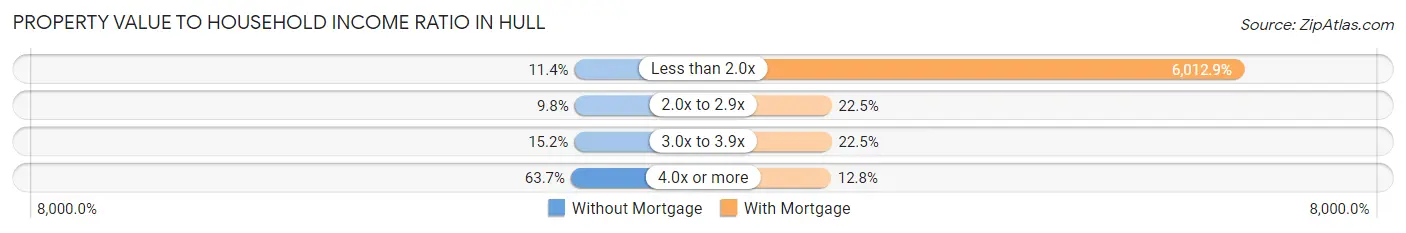
| Value-to-Income Ratio | Without Mortgage | With Mortgage |
| Less than 2.0x | 126 (11.4%) | 153,750 (6,012.9%) |
| 2.0x to 2.9x | 109 (9.8%) | 574 (22.5%) |
| 3.0x to 3.9x | 168 (15.1%) | 575 (22.5%) |
| 4.0x or more | 706 (63.7%) | 328 (12.8%) |
| Total | 1,109 (100.0%) | 2,557 (100.0%) |
Real Estate Taxes by Mortgage Status in Hull
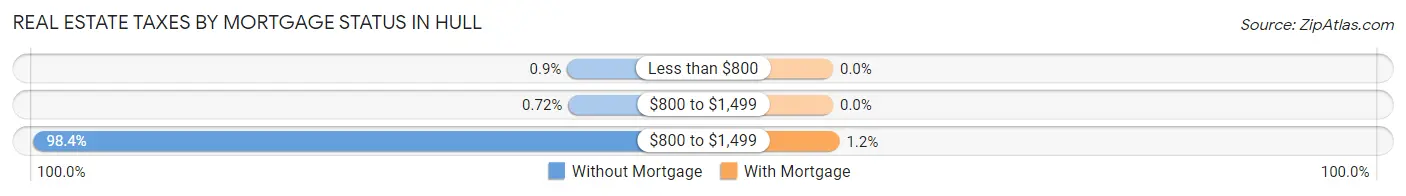
| Property Taxes | Without Mortgage | With Mortgage |
| Less than $800 | 10 (0.9%) | 0 (0.0%) |
| $800 to $1,499 | 8 (0.7%) | 0 (0.0%) |
| $800 to $1,499 | 1,091 (98.4%) | 30 (1.2%) |
| Total | 1,109 (100.0%) | 2,557 (100.0%) |
Health & Disability in Hull
Health Insurance Coverage by Age in Hull
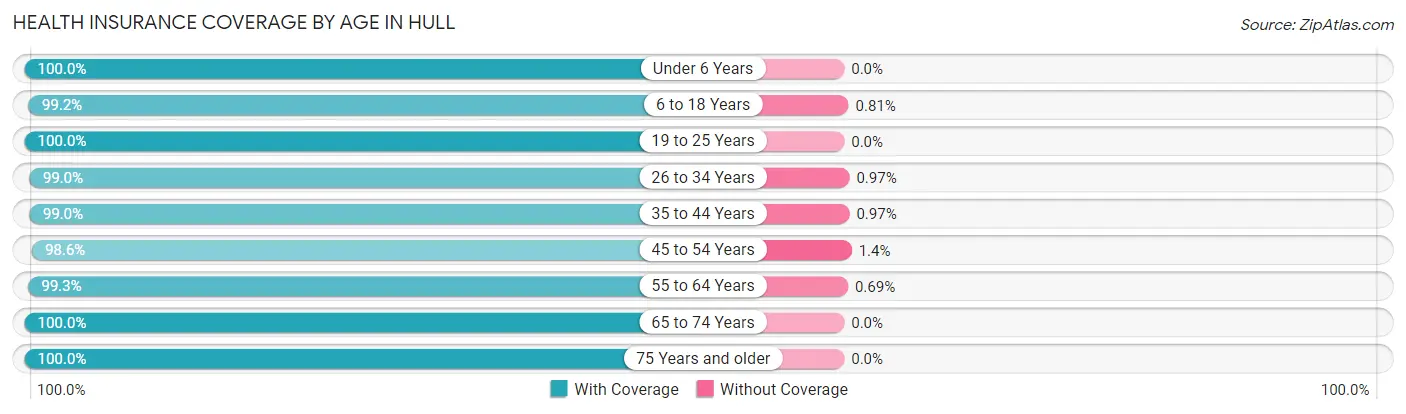
| Age Bracket | With Coverage | Without Coverage |
| Under 6 Years | 385 (100.0%) | 0 (0.0%) |
| 6 to 18 Years | 1,107 (99.2%) | 9 (0.8%) |
| 19 to 25 Years | 570 (100.0%) | 0 (0.0%) |
| 26 to 34 Years | 1,026 (99.0%) | 10 (1.0%) |
| 35 to 44 Years | 819 (99.0%) | 8 (1.0%) |
| 45 to 54 Years | 1,357 (98.6%) | 19 (1.4%) |
| 55 to 64 Years | 2,452 (99.3%) | 17 (0.7%) |
| 65 to 74 Years | 1,576 (100.0%) | 0 (0.0%) |
| 75 Years and older | 760 (100.0%) | 0 (0.0%) |
| Total | 10,052 (99.4%) | 63 (0.6%) |
Health Insurance Coverage by Citizenship Status in Hull
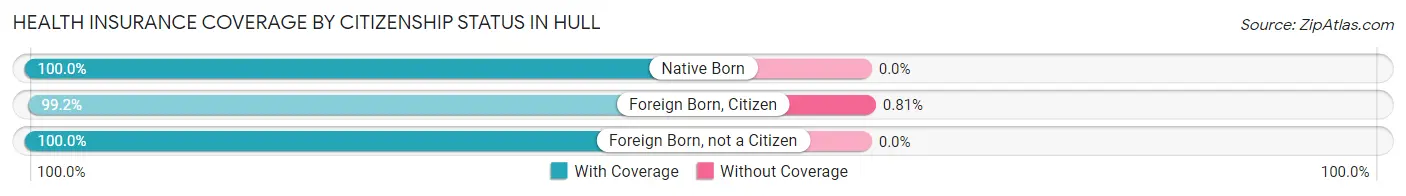
| Citizenship Status | With Coverage | Without Coverage |
| Native Born | 385 (100.0%) | 0 (0.0%) |
| Foreign Born, Citizen | 1,107 (99.2%) | 9 (0.8%) |
| Foreign Born, not a Citizen | 570 (100.0%) | 0 (0.0%) |
Health Insurance Coverage by Household Income in Hull
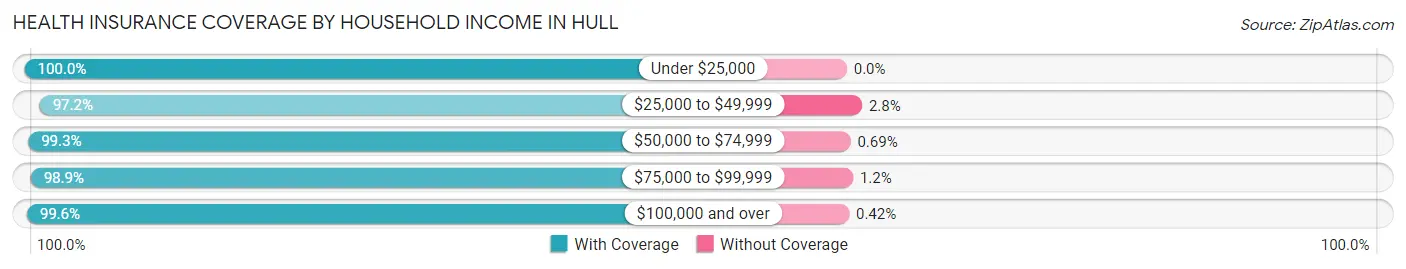
| Household Income | With Coverage | Without Coverage |
| Under $25,000 | 465 (100.0%) | 0 (0.0%) |
| $25,000 to $49,999 | 547 (97.2%) | 16 (2.8%) |
| $50,000 to $74,999 | 1,001 (99.3%) | 7 (0.7%) |
| $75,000 to $99,999 | 772 (98.9%) | 9 (1.1%) |
| $100,000 and over | 7,267 (99.6%) | 31 (0.4%) |
Public vs Private Health Insurance Coverage by Age in Hull
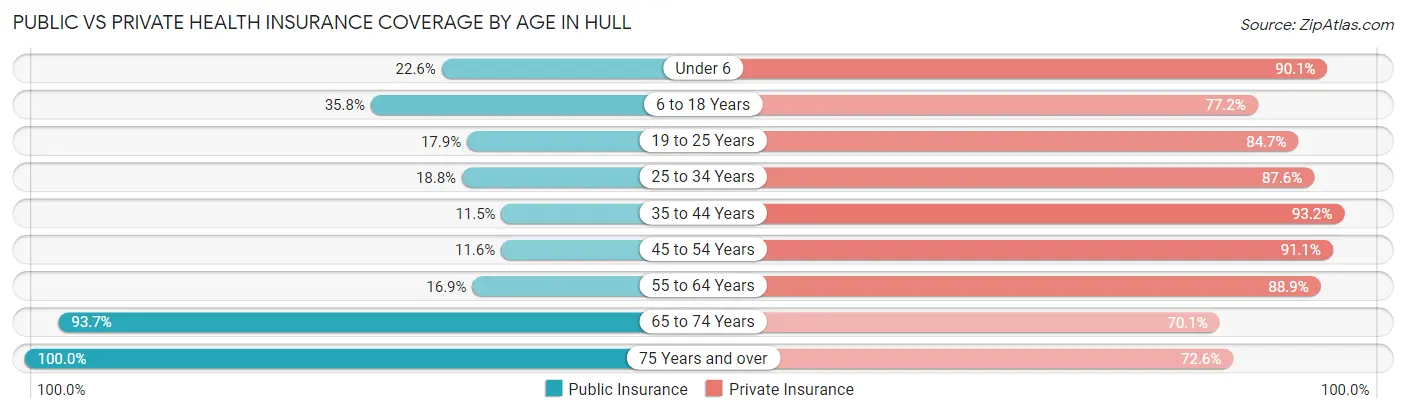
| Age Bracket | Public Insurance | Private Insurance |
| Under 6 | 87 (22.6%) | 347 (90.1%) |
| 6 to 18 Years | 399 (35.7%) | 861 (77.1%) |
| 19 to 25 Years | 102 (17.9%) | 483 (84.7%) |
| 25 to 34 Years | 195 (18.8%) | 908 (87.6%) |
| 35 to 44 Years | 95 (11.5%) | 771 (93.2%) |
| 45 to 54 Years | 159 (11.6%) | 1,254 (91.1%) |
| 55 to 64 Years | 417 (16.9%) | 2,194 (88.9%) |
| 65 to 74 Years | 1,477 (93.7%) | 1,105 (70.1%) |
| 75 Years and over | 760 (100.0%) | 552 (72.6%) |
| Total | 3,691 (36.5%) | 8,475 (83.8%) |
Disability Status by Sex by Age in Hull
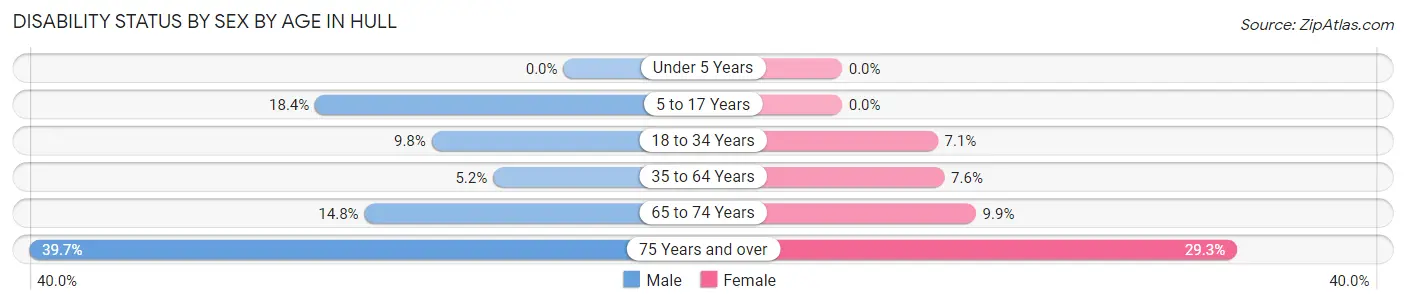
| Age Bracket | Male | Female |
| Under 5 Years | 0 (0.0%) | 0 (0.0%) |
| 5 to 17 Years | 108 (18.4%) | 0 (0.0%) |
| 18 to 34 Years | 70 (9.8%) | 71 (7.1%) |
| 35 to 64 Years | 110 (5.2%) | 195 (7.6%) |
| 65 to 74 Years | 96 (14.8%) | 92 (9.9%) |
| 75 Years and over | 146 (39.7%) | 115 (29.3%) |
Disability Class by Sex by Age in Hull
Disability Class: Hearing Difficulty
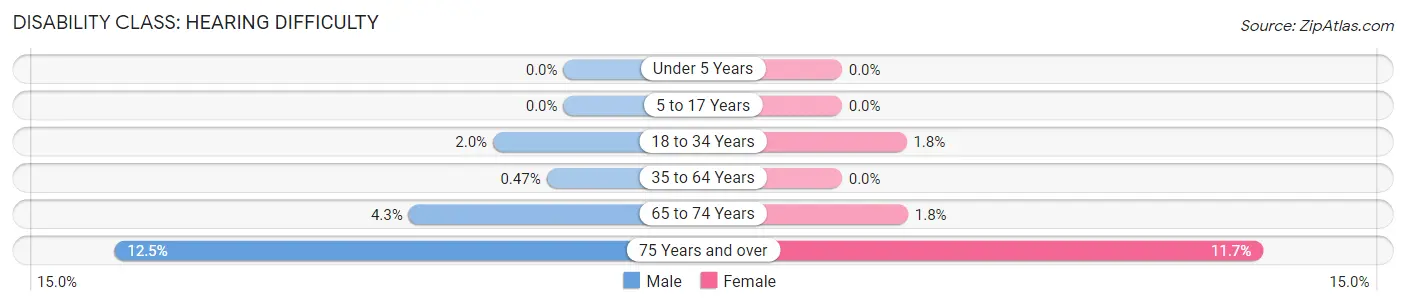
| Age Bracket | Male | Female |
| Under 5 Years | 0 (0.0%) | 0 (0.0%) |
| 5 to 17 Years | 0 (0.0%) | 0 (0.0%) |
| 18 to 34 Years | 14 (2.0%) | 18 (1.8%) |
| 35 to 64 Years | 10 (0.5%) | 0 (0.0%) |
| 65 to 74 Years | 28 (4.3%) | 17 (1.8%) |
| 75 Years and over | 46 (12.5%) | 46 (11.7%) |
Disability Class: Vision Difficulty
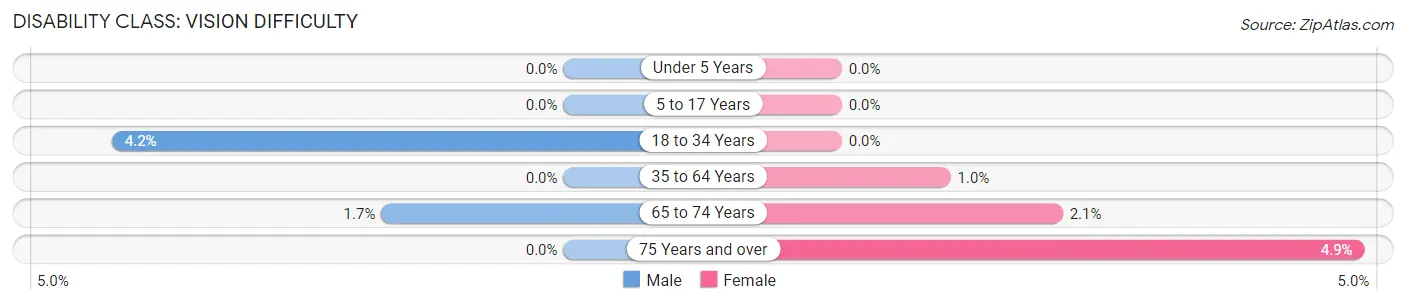
| Age Bracket | Male | Female |
| Under 5 Years | 0 (0.0%) | 0 (0.0%) |
| 5 to 17 Years | 0 (0.0%) | 0 (0.0%) |
| 18 to 34 Years | 30 (4.2%) | 0 (0.0%) |
| 35 to 64 Years | 0 (0.0%) | 26 (1.0%) |
| 65 to 74 Years | 11 (1.7%) | 19 (2.1%) |
| 75 Years and over | 0 (0.0%) | 19 (4.9%) |
Disability Class: Cognitive Difficulty
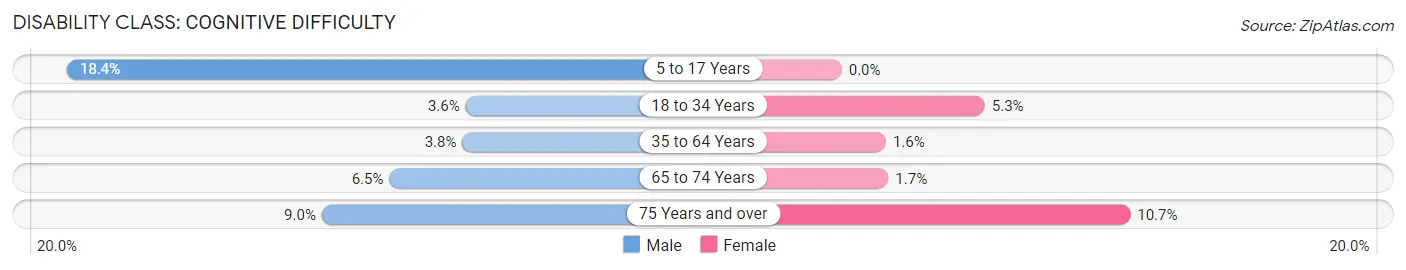
| Age Bracket | Male | Female |
| 5 to 17 Years | 108 (18.4%) | 0 (0.0%) |
| 18 to 34 Years | 26 (3.6%) | 53 (5.3%) |
| 35 to 64 Years | 79 (3.7%) | 42 (1.6%) |
| 65 to 74 Years | 42 (6.5%) | 16 (1.7%) |
| 75 Years and over | 33 (9.0%) | 42 (10.7%) |
Disability Class: Ambulatory Difficulty
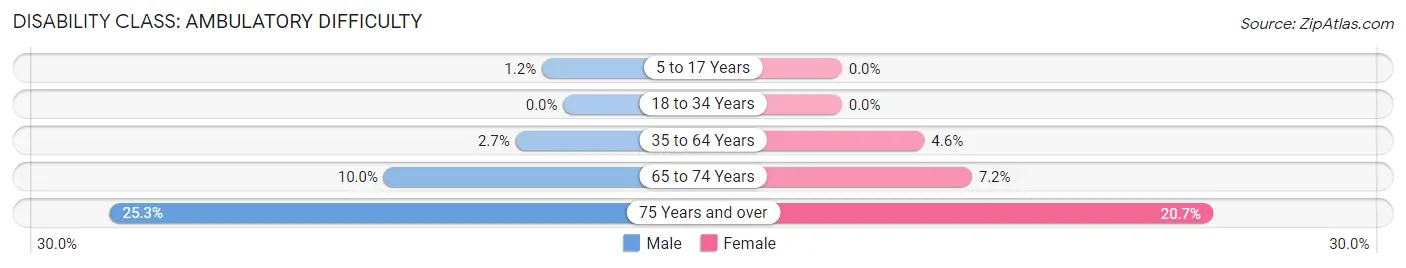
| Age Bracket | Male | Female |
| 5 to 17 Years | 7 (1.2%) | 0 (0.0%) |
| 18 to 34 Years | 0 (0.0%) | 0 (0.0%) |
| 35 to 64 Years | 56 (2.7%) | 118 (4.6%) |
| 65 to 74 Years | 65 (10.0%) | 67 (7.2%) |
| 75 Years and over | 93 (25.3%) | 81 (20.7%) |
Disability Class: Self-Care Difficulty
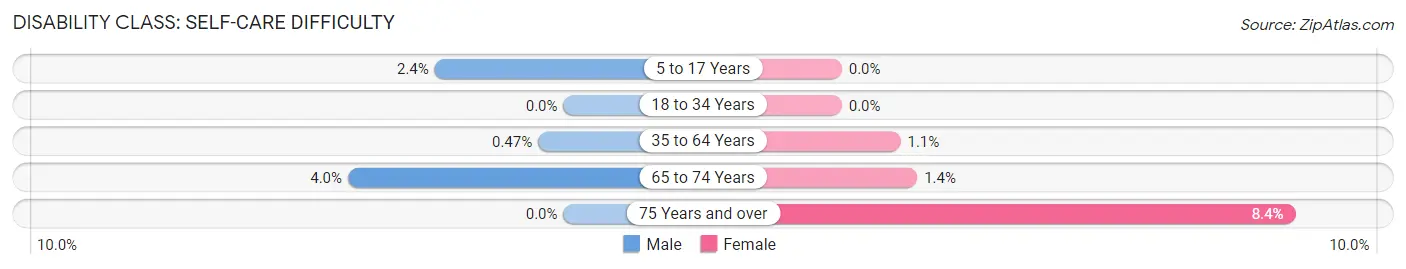
| Age Bracket | Male | Female |
| 5 to 17 Years | 14 (2.4%) | 0 (0.0%) |
| 18 to 34 Years | 0 (0.0%) | 0 (0.0%) |
| 35 to 64 Years | 10 (0.5%) | 28 (1.1%) |
| 65 to 74 Years | 26 (4.0%) | 13 (1.4%) |
| 75 Years and over | 0 (0.0%) | 33 (8.4%) |
Technology Access in Hull
Computing Device Access in Hull
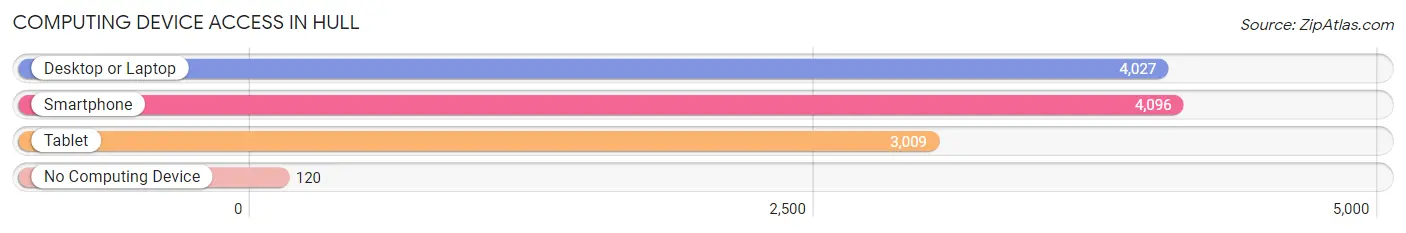
| Device Type | # Households | % Households |
| Desktop or Laptop | 4,027 | 89.4% |
| Smartphone | 4,096 | 90.9% |
| Tablet | 3,009 | 66.8% |
| No Computing Device | 120 | 2.7% |
| Total | 4,504 | 100.0% |
Internet Access in Hull
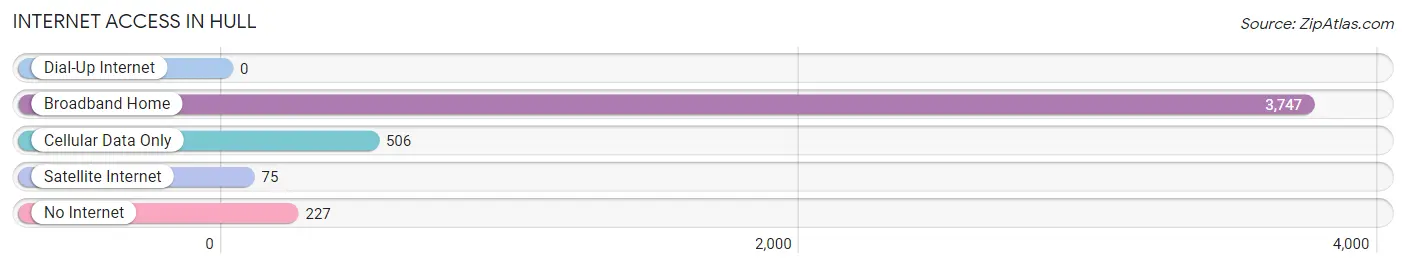
| Internet Type | # Households | % Households |
| Dial-Up Internet | 0 | 0.0% |
| Broadband Home | 3,747 | 83.2% |
| Cellular Data Only | 506 | 11.2% |
| Satellite Internet | 75 | 1.7% |
| No Internet | 227 | 5.0% |
| Total | 4,504 | 100.0% |
Hull Summary
Hull is a town located in Plymouth County, Massachusetts, United States. It is situated on the south shore of Massachusetts Bay, approximately 25 miles south of Boston. The town is known for its beaches, fishing, and recreational activities. As of the 2010 census, the town had a population of 10,293.
History
Hull was first settled in 1622 by Thomas Hull and other settlers from the Plymouth Colony. The town was officially incorporated in 1644 and was named after Thomas Hull. In the early days, Hull was a fishing and farming community. The town was also known for its shipbuilding industry, which flourished in the 19th century.
Geography
Hull is located on the south shore of Massachusetts Bay, approximately 25 miles south of Boston. The town is bordered by Cohasset to the north, Hingham to the east, and Weymouth to the south. The town is situated on a peninsula, with Nantasket Beach to the east and Hull Gut to the west. The town has a total area of 8.2 square miles, of which 5.2 square miles is land and 3.0 square miles is water.
Economy
Hull’s economy is largely based on tourism and recreation. The town is known for its beaches, fishing, and recreational activities. The town also has a number of restaurants, shops, and other businesses that cater to tourists. The town also has a number of marinas and boatyards.
Demographics
As of the 2010 census, there were 10,293 people, 4,072 households, and 2,717 families residing in the town. The population density was 1,976.3 people per square mile. The racial makeup of the town was 94.2% White, 1.7% African American, 0.3% Native American, 1.2% Asian, 0.1% Pacific Islander, 0.7% from other races, and 1.9% from two or more races. Hispanic or Latino of any race were 2.3% of the population.
The median income for a household in the town was $63,917, and the median income for a family was $76,917. Males had a median income of $50,917 versus $41,917 for females. The per capita income for the town was $30,917. About 4.2% of families and 5.7% of the population were below the poverty line, including 6.7% of those under age 18 and 4.2% of those age 65 or over.
Common Questions
What is Per Capita Income in Hull?
Per Capita income in Hull is $69,609.
What is the Median Family Income in Hull?
Median Family Income in Hull is $155,979.
What is the Median Household income in Hull?
Median Household Income in Hull is $128,022.
What is Income or Wage Gap in Hull?
Income or Wage Gap in Hull is 28.9%.
Women in Hull earn 71.1 cents for every dollar earned by a man.
What is Inequality or Gini Index in Hull?
Inequality or Gini Index in Hull is 0.42.
What is the Total Population of Hull?
Total Population of Hull is 10,116.
What is the Total Male Population of Hull?
Total Male Population of Hull is 4,656.
What is the Total Female Population of Hull?
Total Female Population of Hull is 5,460.
What is the Ratio of Males per 100 Females in Hull?
There are 85.27 Males per 100 Females in Hull.
What is the Ratio of Females per 100 Males in Hull?
There are 117.27 Females per 100 Males in Hull.
What is the Median Population Age in Hull?
Median Population Age in Hull is 54.2 Years.
What is the Average Family Size in Hull
Average Family Size in Hull is 3.0 People.
What is the Average Household Size in Hull
Average Household Size in Hull is 2.2 People.
How Large is the Labor Force in Hull?
There are 6,442 People in the Labor Forcein in Hull.
What is the Percentage of People in the Labor Force in Hull?
71.4% of People are in the Labor Force in Hull.
What is the Unemployment Rate in Hull?
Unemployment Rate in Hull is 4.0%.