Ormond Beach, FL Map & Demographics
Ormond Beach Map
Ormond Beach Overview
$42,899
PER CAPITA INCOME
$82,969
AVG FAMILY INCOME
$65,238
AVG HOUSEHOLD INCOME
23.5%
WAGE / INCOME GAP [ % ]
76.5¢/ $1
WAGE / INCOME GAP [ $ ]
$9,951
FAMILY INCOME DEFICIT
0.49
INEQUALITY / GINI INDEX
43,127
TOTAL POPULATION
20,455
MALE POPULATION
22,672
FEMALE POPULATION
90.22
MALES / 100 FEMALES
110.84
FEMALES / 100 MALES
51.9
MEDIAN AGE
2.8
AVG FAMILY SIZE
2.2
AVG HOUSEHOLD SIZE
19,250
LABOR FORCE [ PEOPLE ]
53.3%
PERCENT IN LABOR FORCE
2.4%
UNEMPLOYMENT RATE
Ormond Beach Area Codes
Income in Ormond Beach
Income Overview in Ormond Beach
Per Capita Income in Ormond Beach is $42,899, while median incomes of families and households are $82,969 and $65,238 respectively.
| Characteristic | Number | Measure |
| Per Capita Income | 43,127 | $42,899 |
| Median Family Income | 11,654 | $82,969 |
| Mean Family Income | 11,654 | $121,833 |
| Median Household Income | 18,871 | $65,238 |
| Mean Household Income | 18,871 | $95,997 |
| Income Deficit | 11,654 | $9,951 |
| Wage / Income Gap (%) | 43,127 | 23.54% |
| Wage / Income Gap ($) | 43,127 | 76.46¢ per $1 |
| Gini / Inequality Index | 43,127 | 0.49 |
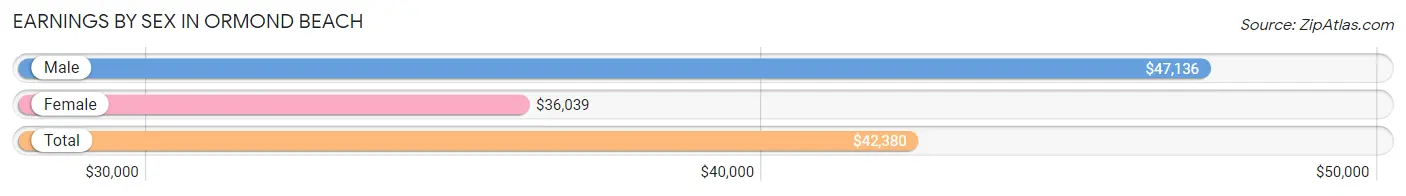
Earnings by Sex in Ormond Beach
Average Earnings in Ormond Beach are $42,380, $47,136 for men and $36,039 for women, a difference of 23.5%.
| Sex | Number | Average Earnings |
| Male | 10,006 (49.7%) | $47,136 |
| Female | 10,121 (50.3%) | $36,039 |
| Total | 20,127 (100.0%) | $42,380 |
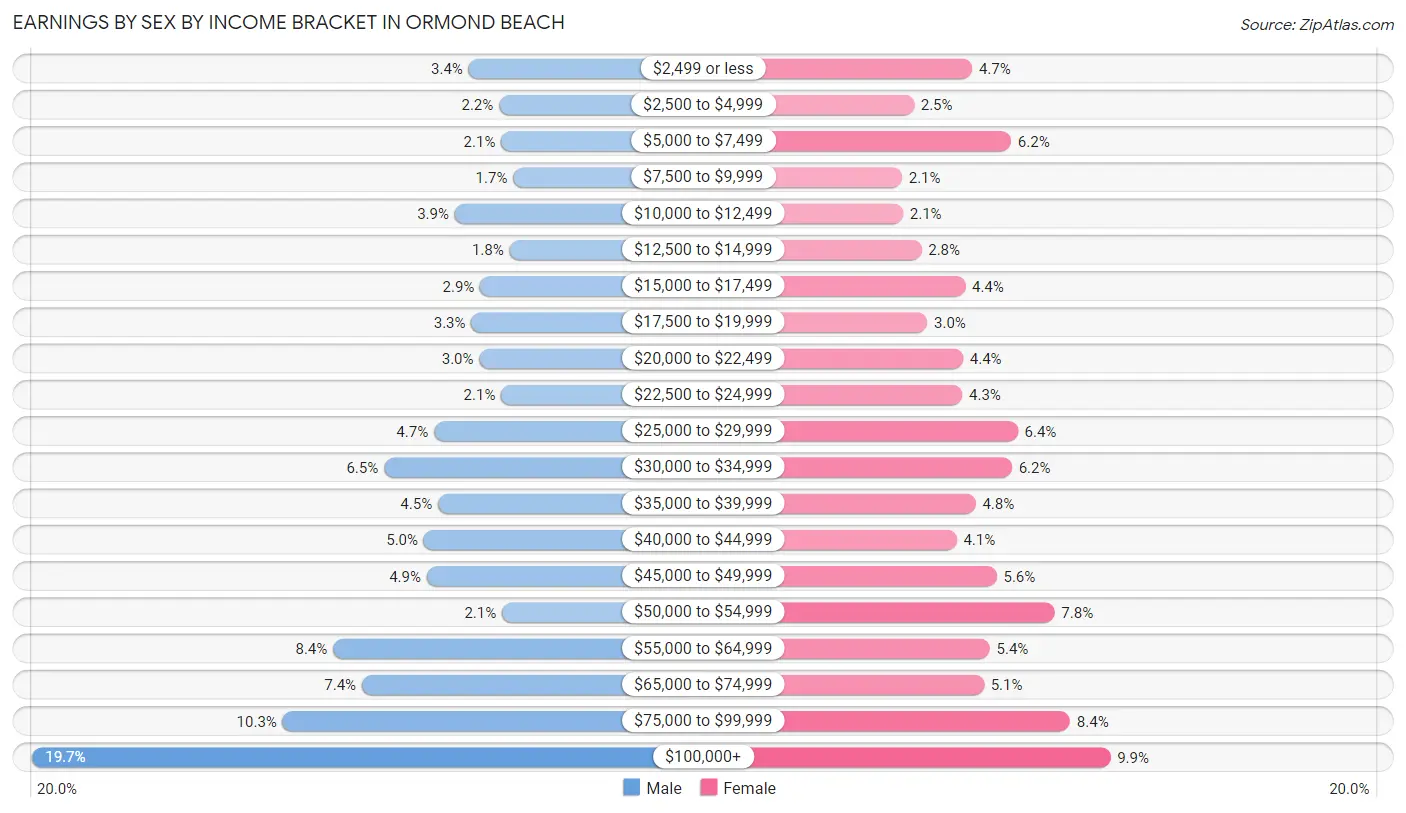
Earnings by Sex by Income Bracket in Ormond Beach
The most common earnings brackets in Ormond Beach are $100,000+ for men (1,972 | 19.7%) and $100,000+ for women (999 | 9.9%).
| Income | Male | Female |
| $2,499 or less | 336 (3.4%) | 475 (4.7%) |
| $2,500 to $4,999 | 222 (2.2%) | 254 (2.5%) |
| $5,000 to $7,499 | 214 (2.1%) | 622 (6.1%) |
| $7,500 to $9,999 | 169 (1.7%) | 208 (2.1%) |
| $10,000 to $12,499 | 388 (3.9%) | 213 (2.1%) |
| $12,500 to $14,999 | 183 (1.8%) | 282 (2.8%) |
| $15,000 to $17,499 | 293 (2.9%) | 448 (4.4%) |
| $17,500 to $19,999 | 326 (3.3%) | 305 (3.0%) |
| $20,000 to $22,499 | 296 (3.0%) | 440 (4.3%) |
| $22,500 to $24,999 | 214 (2.1%) | 437 (4.3%) |
| $25,000 to $29,999 | 466 (4.7%) | 648 (6.4%) |
| $30,000 to $34,999 | 653 (6.5%) | 625 (6.2%) |
| $35,000 to $39,999 | 451 (4.5%) | 488 (4.8%) |
| $40,000 to $44,999 | 504 (5.0%) | 416 (4.1%) |
| $45,000 to $49,999 | 493 (4.9%) | 568 (5.6%) |
| $50,000 to $54,999 | 211 (2.1%) | 787 (7.8%) |
| $55,000 to $64,999 | 845 (8.4%) | 541 (5.3%) |
| $65,000 to $74,999 | 736 (7.4%) | 519 (5.1%) |
| $75,000 to $99,999 | 1,034 (10.3%) | 846 (8.4%) |
| $100,000+ | 1,972 (19.7%) | 999 (9.9%) |
| Total | 10,006 (100.0%) | 10,121 (100.0%) |
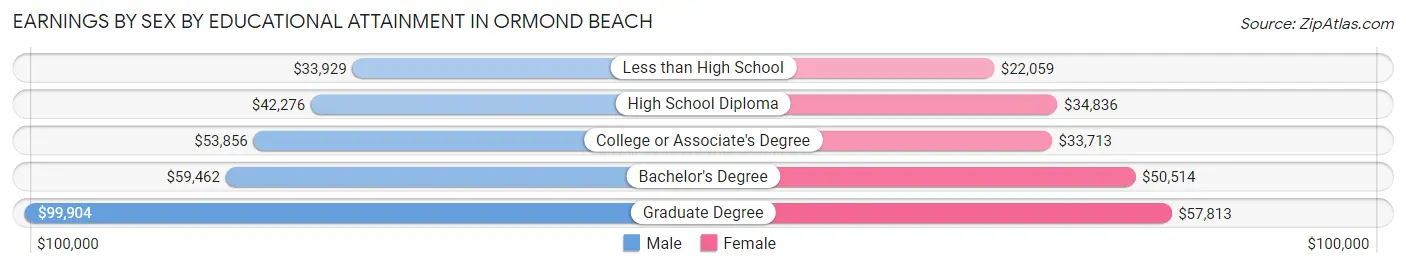
Earnings by Sex by Educational Attainment in Ormond Beach
Average earnings in Ormond Beach are $55,678 for men and $40,004 for women, a difference of 28.1%. Men with an educational attainment of graduate degree enjoy the highest average annual earnings of $99,904, while those with less than high school education earn the least with $33,929. Women with an educational attainment of graduate degree earn the most with the average annual earnings of $57,813, while those with less than high school education have the smallest earnings of $22,059.
| Educational Attainment | Male Income | Female Income |
| Less than High School | $33,929 | $22,059 |
| High School Diploma | $42,276 | $34,836 |
| College or Associate's Degree | $53,856 | $33,713 |
| Bachelor's Degree | $59,462 | $50,514 |
| Graduate Degree | $99,904 | $57,813 |
| Total | $55,678 | $40,004 |
Family Income in Ormond Beach
Family Income Brackets in Ormond Beach
According to the Ormond Beach family income data, there are 2,680 families falling into the $50,000 to $74,999 income range, which is the most common income bracket and makes up 23.0% of all families. Conversely, the $10,000 to $14,999 income bracket is the least frequent group with only 152 families (1.3%) belonging to this category.
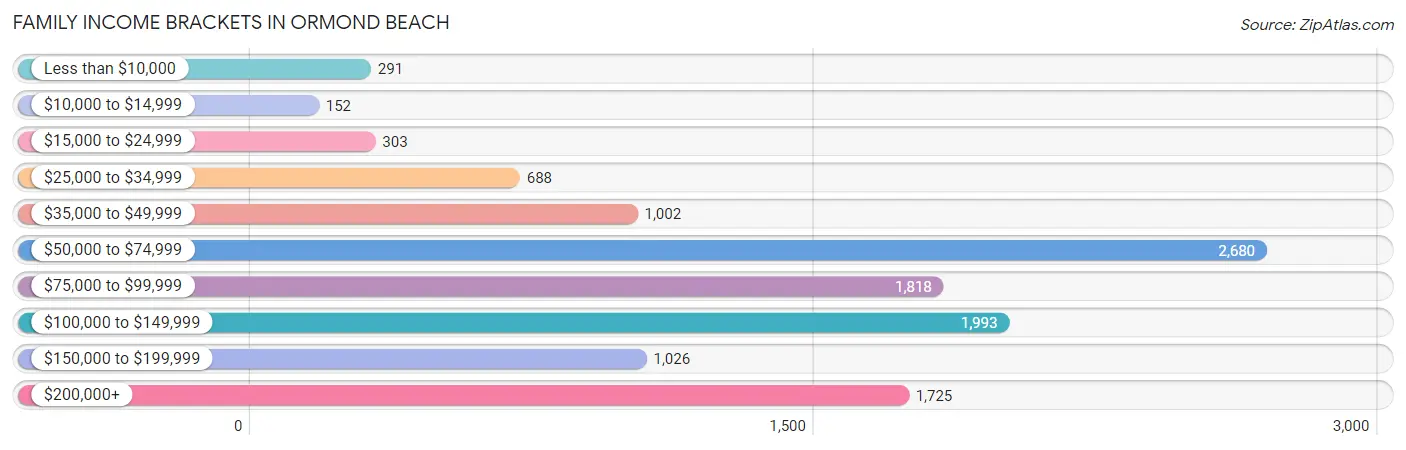
| Income Bracket | # Families | % Families |
| Less than $10,000 | 291 | 2.5% |
| $10,000 to $14,999 | 152 | 1.3% |
| $15,000 to $24,999 | 303 | 2.6% |
| $25,000 to $34,999 | 688 | 5.9% |
| $35,000 to $49,999 | 1,002 | 8.6% |
| $50,000 to $74,999 | 2,680 | 23.0% |
| $75,000 to $99,999 | 1,818 | 15.6% |
| $100,000 to $149,999 | 1,993 | 17.1% |
| $150,000 to $199,999 | 1,026 | 8.8% |
| $200,000+ | 1,725 | 14.8% |
Family Income by Famaliy Size in Ormond Beach
7+ person families (73 | 0.6%) account for the highest median family income in Ormond Beach with $148,618 per family, while 2-person families (7,050 | 60.5%) have the highest median income of $36,450 per family member.
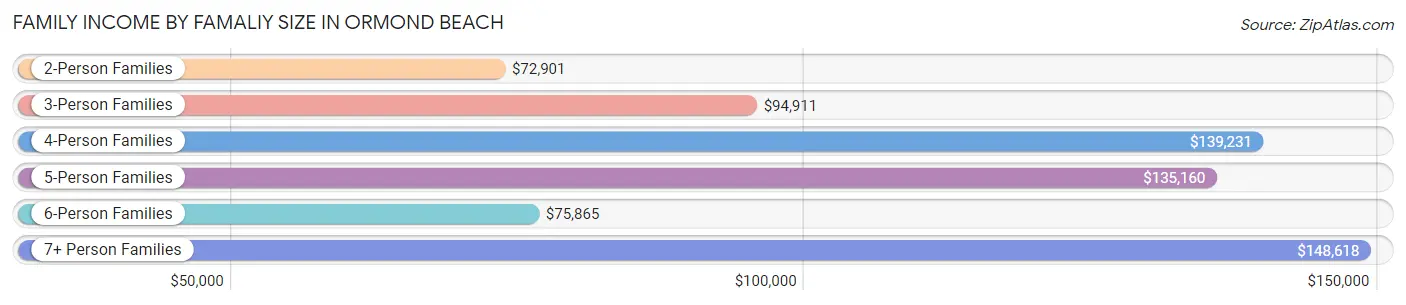
| Income Bracket | # Families | Median Income |
| 2-Person Families | 7,050 (60.5%) | $72,901 |
| 3-Person Families | 2,091 (17.9%) | $94,911 |
| 4-Person Families | 1,654 (14.2%) | $139,231 |
| 5-Person Families | 652 (5.6%) | $135,160 |
| 6-Person Families | 134 (1.1%) | $75,865 |
| 7+ Person Families | 73 (0.6%) | $148,618 |
| Total | 11,654 (100.0%) | $82,969 |
Family Income by Number of Earners in Ormond Beach
The median family income in Ormond Beach is $82,969, with families comprising 3+ earners (804) having the highest median family income of $147,578, while families with no earners (2,729) have the lowest median family income of $59,354, accounting for 6.9% and 23.4% of families, respectively.
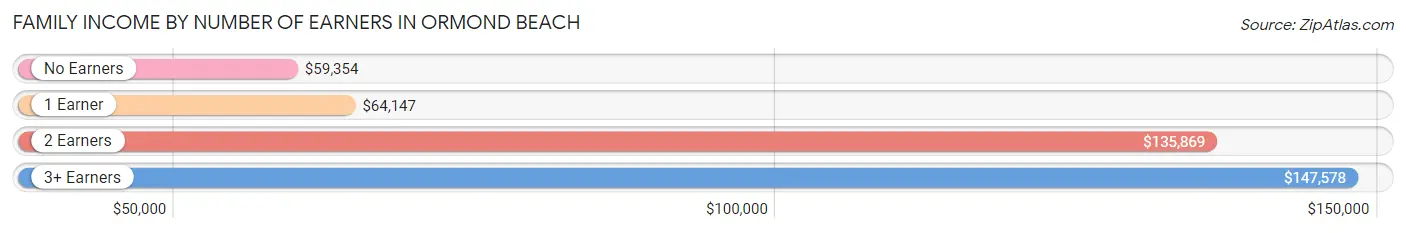
| Number of Earners | # Families | Median Income |
| No Earners | 2,729 (23.4%) | $59,354 |
| 1 Earner | 3,852 (33.1%) | $64,147 |
| 2 Earners | 4,269 (36.6%) | $135,869 |
| 3+ Earners | 804 (6.9%) | $147,578 |
| Total | 11,654 (100.0%) | $82,969 |
Household Income in Ormond Beach
Household Income Brackets in Ormond Beach
With 3,925 households falling in the category, the $50,000 to $74,999 income range is the most frequent in Ormond Beach, accounting for 20.8% of all households. In contrast, only 736 households (3.9%) fall into the $10,000 to $14,999 income bracket, making it the least populous group.
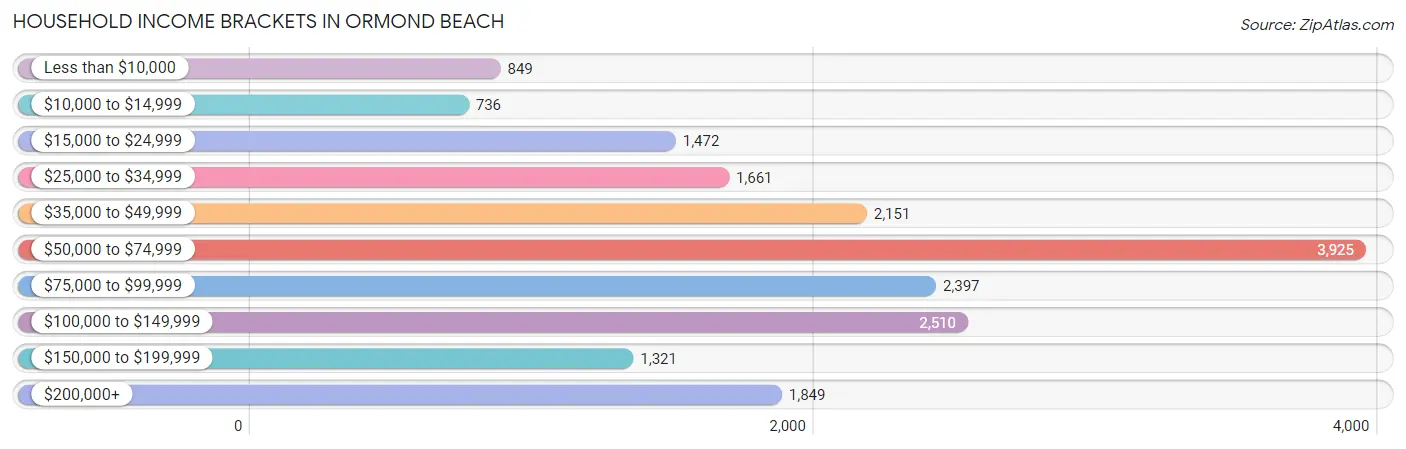
| Income Bracket | # Households | % Households |
| Less than $10,000 | 849 | 4.5% |
| $10,000 to $14,999 | 736 | 3.9% |
| $15,000 to $24,999 | 1,472 | 7.8% |
| $25,000 to $34,999 | 1,661 | 8.8% |
| $35,000 to $49,999 | 2,151 | 11.4% |
| $50,000 to $74,999 | 3,925 | 20.8% |
| $75,000 to $99,999 | 2,397 | 12.7% |
| $100,000 to $149,999 | 2,510 | 13.3% |
| $150,000 to $199,999 | 1,321 | 7.0% |
| $200,000+ | 1,849 | 9.8% |
Household Income by Householder Age in Ormond Beach
The median household income in Ormond Beach is $65,238, with the highest median household income of $79,315 found in the 45 to 64 years age bracket for the primary householder. A total of 6,170 households (32.7%) fall into this category. Meanwhile, the 15 to 24 years age bracket for the primary householder has the lowest median household income of $53,229, with 447 households (2.4%) in this group.
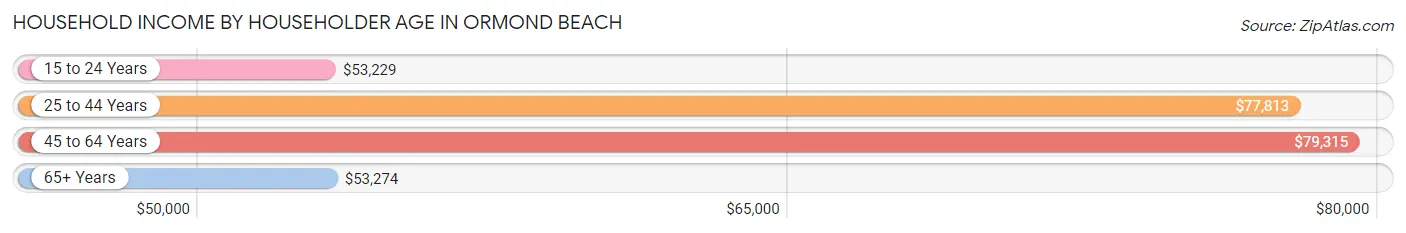
| Income Bracket | # Households | Median Income |
| 15 to 24 Years | 447 (2.4%) | $53,229 |
| 25 to 44 Years | 3,916 (20.7%) | $77,813 |
| 45 to 64 Years | 6,170 (32.7%) | $79,315 |
| 65+ Years | 8,338 (44.2%) | $53,274 |
| Total | 18,871 (100.0%) | $65,238 |
Poverty in Ormond Beach
Income Below Poverty by Sex and Age in Ormond Beach
With 9.5% poverty level for males and 9.6% for females among the residents of Ormond Beach, under 5 year old males and 5 year old females are the most vulnerable to poverty, with 427 males (29.0%) and 44 females (40.7%) in their respective age groups living below the poverty level.
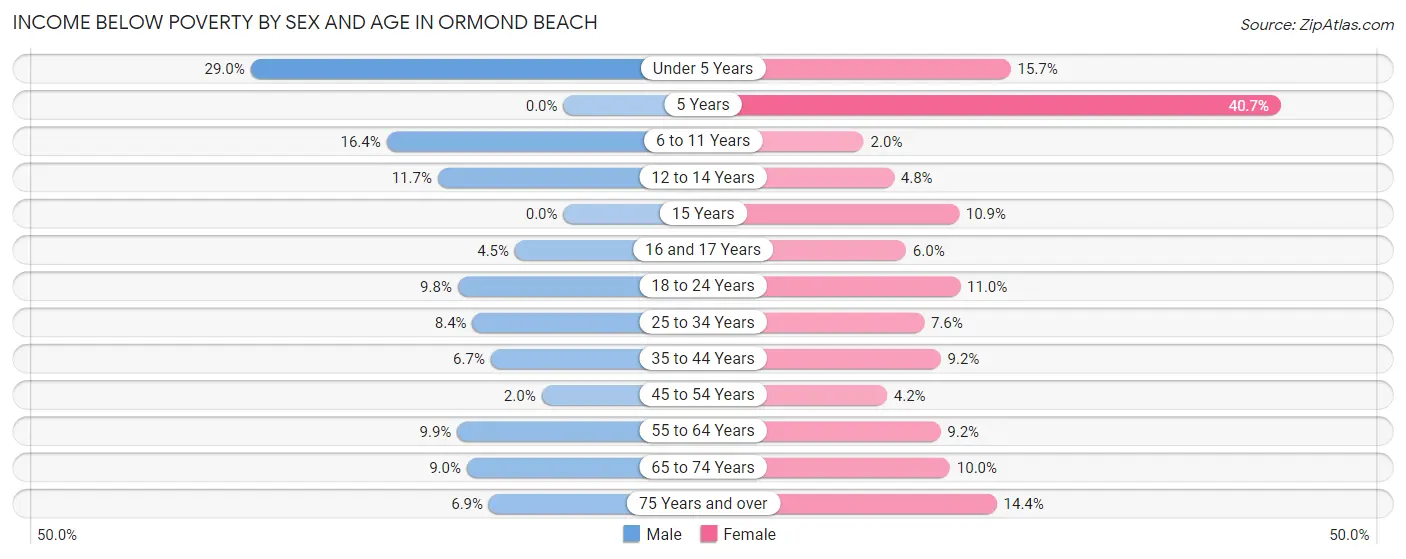
| Age Bracket | Male | Female |
| Under 5 Years | 427 (29.0%) | 207 (15.7%) |
| 5 Years | 0 (0.0%) | 44 (40.7%) |
| 6 to 11 Years | 211 (16.4%) | 20 (2.0%) |
| 12 to 14 Years | 64 (11.7%) | 25 (4.8%) |
| 15 Years | 0 (0.0%) | 24 (10.9%) |
| 16 and 17 Years | 17 (4.5%) | 20 (5.9%) |
| 18 to 24 Years | 121 (9.8%) | 137 (11.0%) |
| 25 to 34 Years | 161 (8.4%) | 161 (7.6%) |
| 35 to 44 Years | 126 (6.7%) | 199 (9.2%) |
| 45 to 54 Years | 55 (2.0%) | 103 (4.2%) |
| 55 to 64 Years | 252 (9.9%) | 315 (9.1%) |
| 65 to 74 Years | 300 (9.0%) | 376 (10.0%) |
| 75 Years and over | 169 (6.9%) | 509 (14.4%) |
| Total | 1,903 (9.5%) | 2,140 (9.6%) |
Income Above Poverty by Sex and Age in Ormond Beach
According to the poverty statistics in Ormond Beach, males aged 5 years and females aged 6 to 11 years are the age groups that are most secure financially, with 100.0% of males and 98.0% of females in these age groups living above the poverty line.
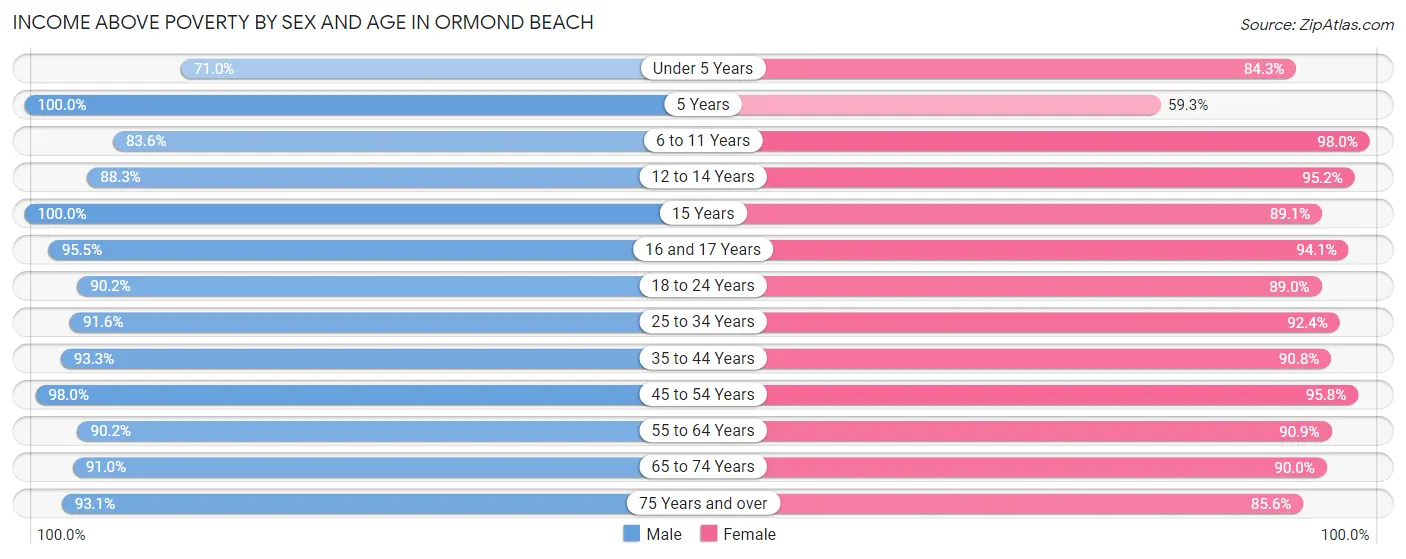
| Age Bracket | Male | Female |
| Under 5 Years | 1,044 (71.0%) | 1,114 (84.3%) |
| 5 Years | 123 (100.0%) | 64 (59.3%) |
| 6 to 11 Years | 1,075 (83.6%) | 967 (98.0%) |
| 12 to 14 Years | 485 (88.3%) | 493 (95.2%) |
| 15 Years | 98 (100.0%) | 197 (89.1%) |
| 16 and 17 Years | 361 (95.5%) | 316 (94.1%) |
| 18 to 24 Years | 1,114 (90.2%) | 1,111 (89.0%) |
| 25 to 34 Years | 1,746 (91.6%) | 1,948 (92.4%) |
| 35 to 44 Years | 1,744 (93.3%) | 1,970 (90.8%) |
| 45 to 54 Years | 2,660 (98.0%) | 2,363 (95.8%) |
| 55 to 64 Years | 2,306 (90.1%) | 3,127 (90.8%) |
| 65 to 74 Years | 3,048 (91.0%) | 3,373 (90.0%) |
| 75 Years and over | 2,278 (93.1%) | 3,033 (85.6%) |
| Total | 18,082 (90.5%) | 20,076 (90.4%) |
Income Below Poverty Among Married-Couple Families in Ormond Beach
The poverty statistics for married-couple families in Ormond Beach show that 2.4% or 213 of the total 8,770 families live below the poverty line. Families with 5 or more children have the highest poverty rate of 100.0%, comprising of 20 families. On the other hand, families with 1 or 2 children have the lowest poverty rate of 0.4%, which includes 10 families.
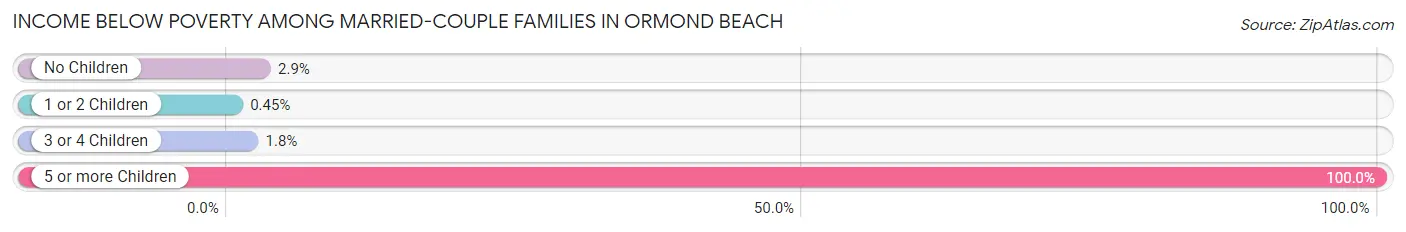
| Children | Above Poverty | Below Poverty |
| No Children | 5,862 (97.1%) | 174 (2.9%) |
| 1 or 2 Children | 2,200 (99.6%) | 10 (0.4%) |
| 3 or 4 Children | 495 (98.2%) | 9 (1.8%) |
| 5 or more Children | 0 (0.0%) | 20 (100.0%) |
| Total | 8,557 (97.6%) | 213 (2.4%) |
Income Below Poverty Among Single-Parent Households in Ormond Beach
According to the poverty data in Ormond Beach, 20.3% or 201 single-father households and 13.0% or 247 single-mother households are living below the poverty line. Among single-father households, those with 1 or 2 children have the highest poverty rate, with 201 households (35.0%) experiencing poverty. Likewise, among single-mother households, those with 3 or 4 children have the highest poverty rate, with 68 households (49.3%) falling below the poverty line.
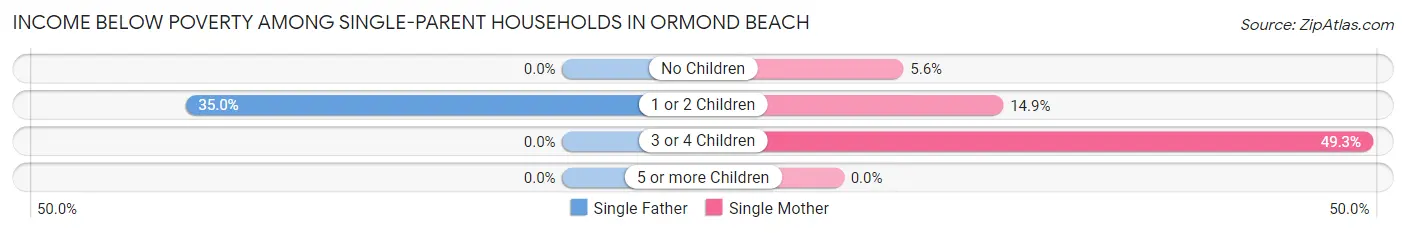
| Children | Single Father | Single Mother |
| No Children | 0 (0.0%) | 49 (5.6%) |
| 1 or 2 Children | 201 (35.0%) | 130 (14.9%) |
| 3 or 4 Children | 0 (0.0%) | 68 (49.3%) |
| 5 or more Children | 0 (0.0%) | 0 (0.0%) |
| Total | 201 (20.3%) | 247 (13.0%) |
Income Below Poverty Among Married-Couple vs Single-Parent Households in Ormond Beach
The poverty data for Ormond Beach shows that 213 of the married-couple family households (2.4%) and 448 of the single-parent households (15.5%) are living below the poverty level. Within the married-couple family households, those with 5 or more children have the highest poverty rate, with 20 households (100.0%) falling below the poverty line. Among the single-parent households, those with 3 or 4 children have the highest poverty rate, with 68 household (47.5%) living below poverty.
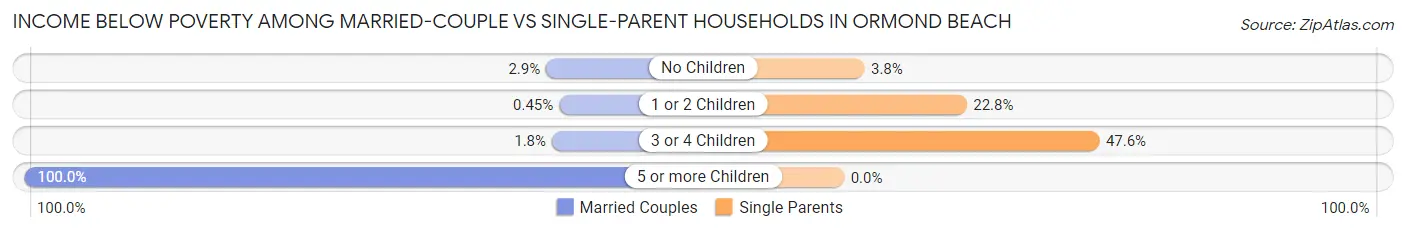
| Children | Married-Couple Families | Single-Parent Households |
| No Children | 174 (2.9%) | 49 (3.8%) |
| 1 or 2 Children | 10 (0.4%) | 331 (22.8%) |
| 3 or 4 Children | 9 (1.8%) | 68 (47.5%) |
| 5 or more Children | 20 (100.0%) | 0 (0.0%) |
| Total | 213 (2.4%) | 448 (15.5%) |
Race in Ormond Beach
The most populous races in Ormond Beach are White / Caucasian (36,863 | 85.5%), Hispanic or Latino (2,872 | 6.7%), and Black / African American (2,600 | 6.0%).
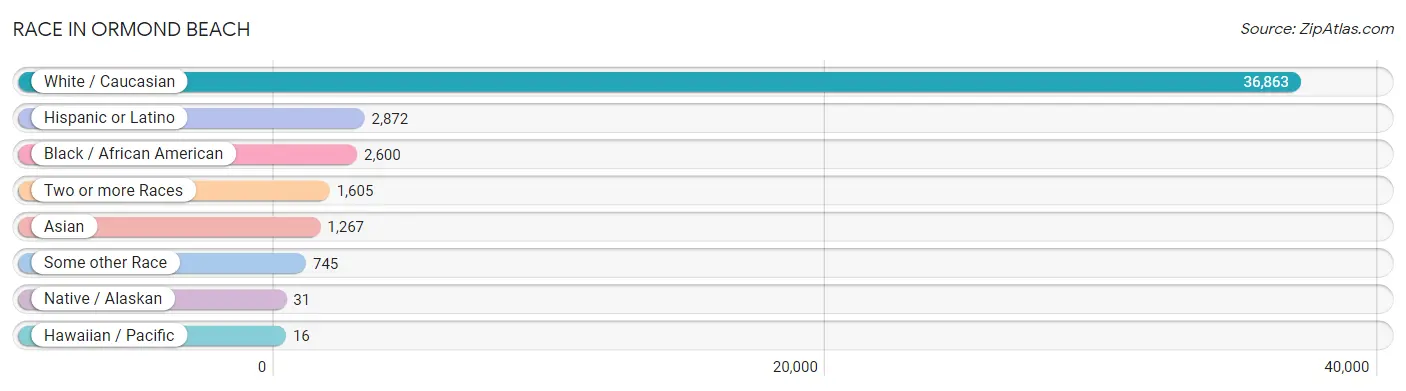
| Race | # Population | % Population |
| Asian | 1,267 | 2.9% |
| Black / African American | 2,600 | 6.0% |
| Hawaiian / Pacific | 16 | 0.0% |
| Hispanic or Latino | 2,872 | 6.7% |
| Native / Alaskan | 31 | 0.1% |
| White / Caucasian | 36,863 | 85.5% |
| Two or more Races | 1,605 | 3.7% |
| Some other Race | 745 | 1.7% |
| Total | 43,127 | 100.0% |
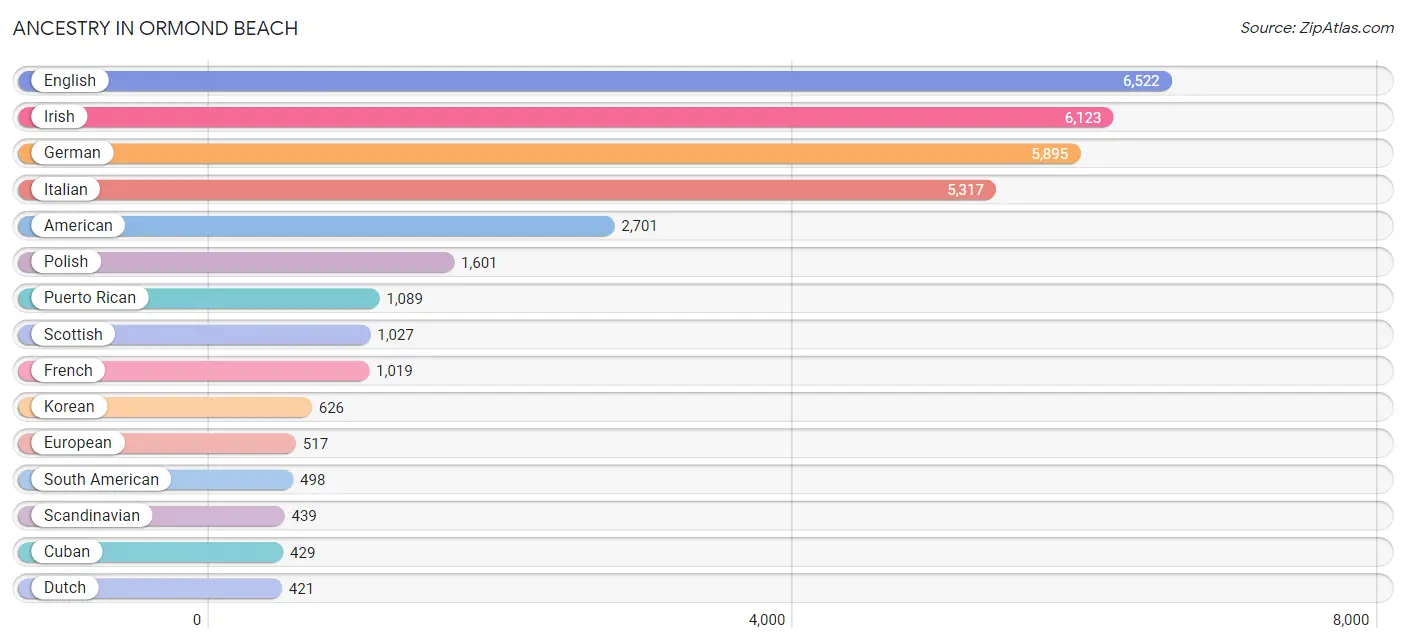
Ancestry in Ormond Beach
The most populous ancestries reported in Ormond Beach are English (6,522 | 15.1%), Irish (6,123 | 14.2%), German (5,895 | 13.7%), Italian (5,317 | 12.3%), and American (2,701 | 6.3%), together accounting for 61.6% of all Ormond Beach residents.
| Ancestry | # Population | % Population |
| African | 199 | 0.5% |
| American | 2,701 | 6.3% |
| Arab | 163 | 0.4% |
| Armenian | 66 | 0.2% |
| Austrian | 360 | 0.8% |
| Belgian | 9 | 0.0% |
| Bhutanese | 12 | 0.0% |
| Bolivian | 24 | 0.1% |
| Brazilian | 68 | 0.2% |
| British | 219 | 0.5% |
| Canadian | 122 | 0.3% |
| Central American | 208 | 0.5% |
| Central American Indian | 17 | 0.0% |
| Cherokee | 96 | 0.2% |
| Chilean | 103 | 0.2% |
| Colombian | 83 | 0.2% |
| Costa Rican | 29 | 0.1% |
| Creek | 4 | 0.0% |
| Croatian | 54 | 0.1% |
| Cuban | 429 | 1.0% |
| Czech | 412 | 1.0% |
| Czechoslovakian | 85 | 0.2% |
| Danish | 130 | 0.3% |
| Dominican | 40 | 0.1% |
| Dutch | 421 | 1.0% |
| Eastern European | 91 | 0.2% |
| Ecuadorian | 127 | 0.3% |
| Egyptian | 28 | 0.1% |
| English | 6,522 | 15.1% |
| European | 517 | 1.2% |
| Finnish | 8 | 0.0% |
| French | 1,019 | 2.4% |
| French Canadian | 366 | 0.9% |
| German | 5,895 | 13.7% |
| Greek | 248 | 0.6% |
| Guamanian / Chamorro | 2 | 0.0% |
| Guatemalan | 100 | 0.2% |
| Guyanese | 5 | 0.0% |
| Haitian | 57 | 0.1% |
| Hungarian | 356 | 0.8% |
| Icelander | 19 | 0.0% |
| Indian (Asian) | 246 | 0.6% |
| Iranian | 57 | 0.1% |
| Irish | 6,123 | 14.2% |
| Italian | 5,317 | 12.3% |
| Jamaican | 216 | 0.5% |
| Korean | 626 | 1.5% |
| Latvian | 8 | 0.0% |
| Lebanese | 61 | 0.1% |
| Lithuanian | 177 | 0.4% |
| Malaysian | 49 | 0.1% |
| Mexican | 218 | 0.5% |
| Mongolian | 13 | 0.0% |
| Moroccan | 23 | 0.1% |
| Nicaraguan | 41 | 0.1% |
| Nigerian | 177 | 0.4% |
| Northern European | 25 | 0.1% |
| Norwegian | 331 | 0.8% |
| Pakistani | 22 | 0.1% |
| Palestinian | 16 | 0.0% |
| Panamanian | 38 | 0.1% |
| Peruvian | 146 | 0.3% |
| Polish | 1,601 | 3.7% |
| Portuguese | 137 | 0.3% |
| Puerto Rican | 1,089 | 2.5% |
| Romanian | 10 | 0.0% |
| Russian | 319 | 0.7% |
| Scandinavian | 439 | 1.0% |
| Scotch-Irish | 331 | 0.8% |
| Scottish | 1,027 | 2.4% |
| Seminole | 20 | 0.1% |
| Slavic | 24 | 0.1% |
| Slovak | 100 | 0.2% |
| Slovene | 16 | 0.0% |
| South African | 20 | 0.1% |
| South American | 498 | 1.1% |
| Spaniard | 47 | 0.1% |
| Spanish | 70 | 0.2% |
| Sri Lankan | 168 | 0.4% |
| Subsaharan African | 221 | 0.5% |
| Swedish | 375 | 0.9% |
| Swiss | 91 | 0.2% |
| Syrian | 17 | 0.0% |
| Thai | 383 | 0.9% |
| Turkish | 17 | 0.0% |
| Ukrainian | 183 | 0.4% |
| Venezuelan | 15 | 0.0% |
| Welsh | 368 | 0.9% |
| Yugoslavian | 23 | 0.1% | View All 89 Rows |
Immigrants in Ormond Beach
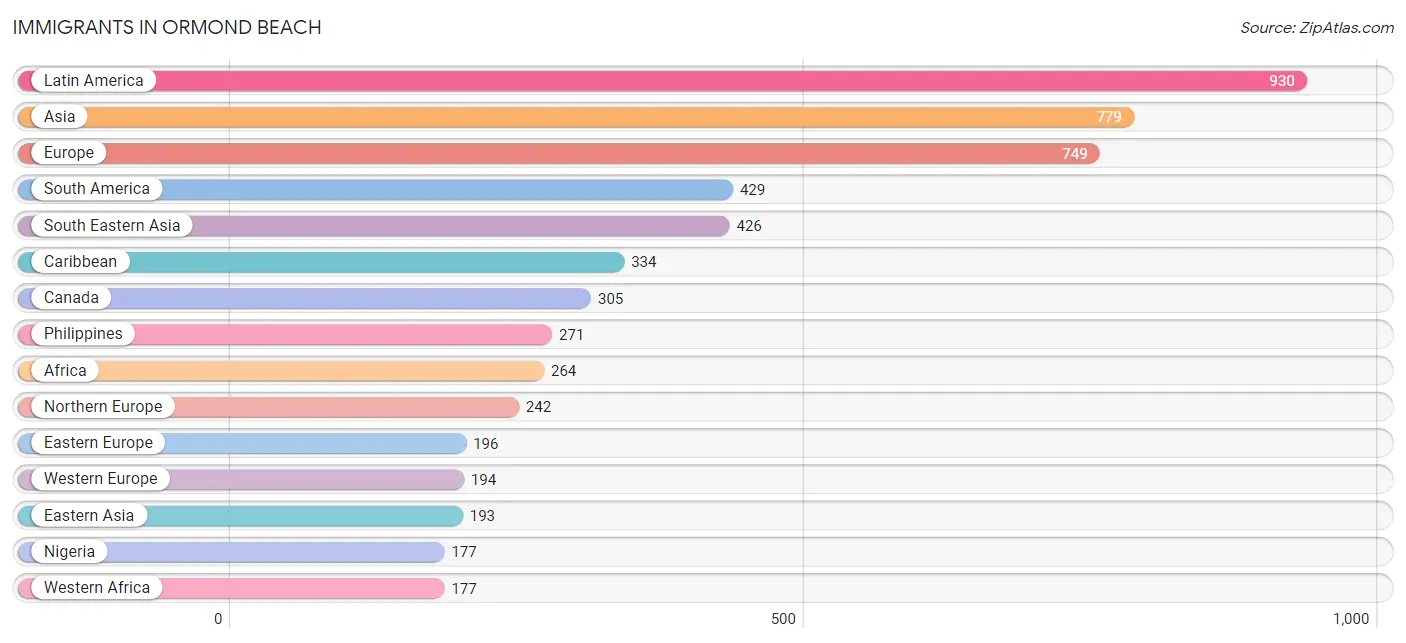
The most numerous immigrant groups reported in Ormond Beach came from Latin America (930 | 2.2%), Asia (779 | 1.8%), Europe (749 | 1.7%), South America (429 | 1.0%), and South Eastern Asia (426 | 1.0%), together accounting for 7.7% of all Ormond Beach residents.
| Immigration Origin | # Population | % Population |
| Africa | 264 | 0.6% |
| Argentina | 19 | 0.0% |
| Asia | 779 | 1.8% |
| Australia | 61 | 0.1% |
| Austria | 21 | 0.1% |
| Bahamas | 5 | 0.0% |
| Bolivia | 24 | 0.1% |
| Brazil | 77 | 0.2% |
| Canada | 305 | 0.7% |
| Caribbean | 334 | 0.8% |
| Central America | 167 | 0.4% |
| Chile | 92 | 0.2% |
| China | 98 | 0.2% |
| Colombia | 83 | 0.2% |
| Costa Rica | 29 | 0.1% |
| Cuba | 159 | 0.4% |
| Czechoslovakia | 45 | 0.1% |
| Dominican Republic | 40 | 0.1% |
| Eastern Africa | 20 | 0.1% |
| Eastern Asia | 193 | 0.4% |
| Eastern Europe | 196 | 0.4% |
| Ecuador | 64 | 0.2% |
| Egypt | 28 | 0.1% |
| England | 34 | 0.1% |
| Europe | 749 | 1.7% |
| France | 18 | 0.0% |
| Germany | 123 | 0.3% |
| Greece | 24 | 0.1% |
| Guatemala | 13 | 0.0% |
| Guyana | 5 | 0.0% |
| Haiti | 34 | 0.1% |
| Hungary | 44 | 0.1% |
| India | 39 | 0.1% |
| Iran | 40 | 0.1% |
| Iraq | 18 | 0.0% |
| Ireland | 19 | 0.0% |
| Israel | 12 | 0.0% |
| Italy | 93 | 0.2% |
| Jamaica | 89 | 0.2% |
| Japan | 12 | 0.0% |
| Kenya | 8 | 0.0% |
| Korea | 83 | 0.2% |
| Kuwait | 16 | 0.0% |
| Laos | 49 | 0.1% |
| Latin America | 930 | 2.2% |
| Malaysia | 13 | 0.0% |
| Mexico | 60 | 0.1% |
| Netherlands | 32 | 0.1% |
| Nicaragua | 41 | 0.1% |
| Nigeria | 177 | 0.4% |
| Northern Africa | 28 | 0.1% |
| Northern Europe | 242 | 0.6% |
| Oceania | 61 | 0.1% |
| Pakistan | 18 | 0.0% |
| Panama | 24 | 0.1% |
| Peru | 11 | 0.0% |
| Philippines | 271 | 0.6% |
| Poland | 42 | 0.1% |
| Russia | 51 | 0.1% |
| Scotland | 121 | 0.3% |
| South Africa | 17 | 0.0% |
| South America | 429 | 1.0% |
| South Central Asia | 97 | 0.2% |
| South Eastern Asia | 426 | 1.0% |
| Southern Europe | 117 | 0.3% |
| Sweden | 10 | 0.0% |
| Turkey | 17 | 0.0% |
| Uganda | 2 | 0.0% |
| Ukraine | 14 | 0.0% |
| Venezuela | 54 | 0.1% |
| Vietnam | 93 | 0.2% |
| Western Africa | 177 | 0.4% |
| Western Asia | 63 | 0.2% |
| Western Europe | 194 | 0.4% | View All 74 Rows |
Sex and Age in Ormond Beach
Sex and Age in Ormond Beach
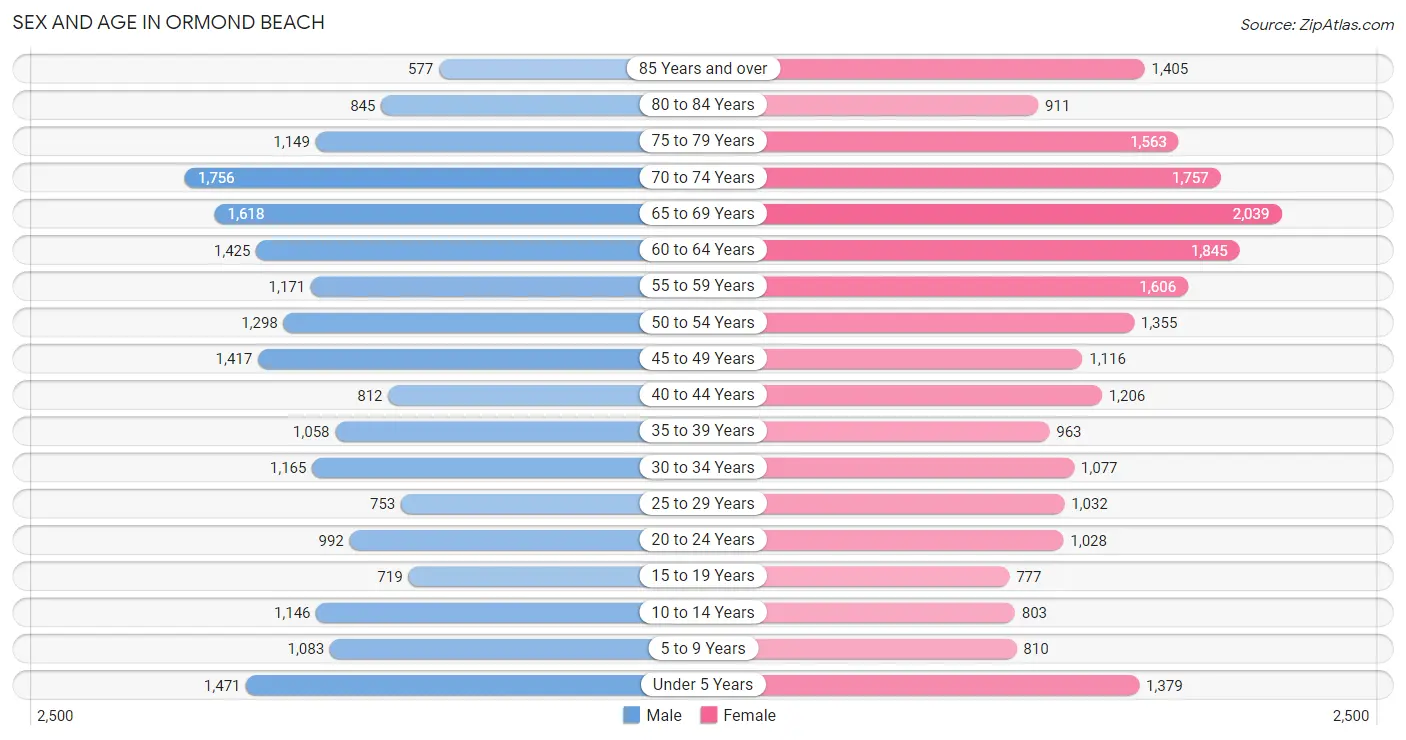
The most populous age groups in Ormond Beach are 70 to 74 Years (1,756 | 8.6%) for men and 65 to 69 Years (2,039 | 9.0%) for women.
| Age Bracket | Male | Female |
| Under 5 Years | 1,471 (7.2%) | 1,379 (6.1%) |
| 5 to 9 Years | 1,083 (5.3%) | 810 (3.6%) |
| 10 to 14 Years | 1,146 (5.6%) | 803 (3.5%) |
| 15 to 19 Years | 719 (3.5%) | 777 (3.4%) |
| 20 to 24 Years | 992 (4.9%) | 1,028 (4.5%) |
| 25 to 29 Years | 753 (3.7%) | 1,032 (4.5%) |
| 30 to 34 Years | 1,165 (5.7%) | 1,077 (4.8%) |
| 35 to 39 Years | 1,058 (5.2%) | 963 (4.3%) |
| 40 to 44 Years | 812 (4.0%) | 1,206 (5.3%) |
| 45 to 49 Years | 1,417 (6.9%) | 1,116 (4.9%) |
| 50 to 54 Years | 1,298 (6.4%) | 1,355 (6.0%) |
| 55 to 59 Years | 1,171 (5.7%) | 1,606 (7.1%) |
| 60 to 64 Years | 1,425 (7.0%) | 1,845 (8.1%) |
| 65 to 69 Years | 1,618 (7.9%) | 2,039 (9.0%) |
| 70 to 74 Years | 1,756 (8.6%) | 1,757 (7.7%) |
| 75 to 79 Years | 1,149 (5.6%) | 1,563 (6.9%) |
| 80 to 84 Years | 845 (4.1%) | 911 (4.0%) |
| 85 Years and over | 577 (2.8%) | 1,405 (6.2%) |
| Total | 20,455 (100.0%) | 22,672 (100.0%) |
Families and Households in Ormond Beach
Median Family Size in Ormond Beach
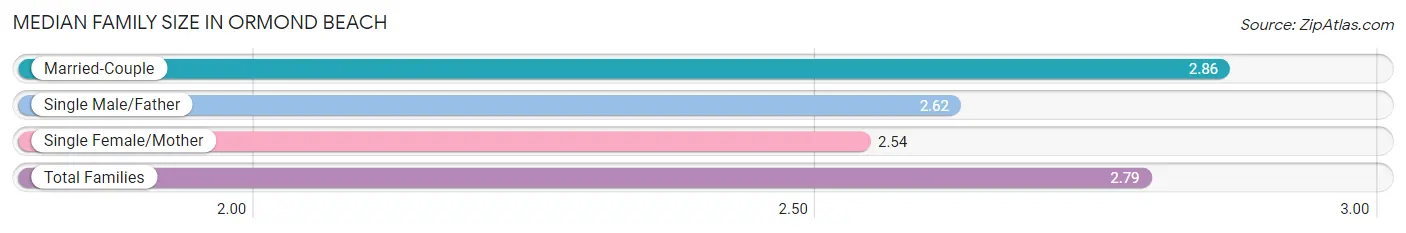
The median family size in Ormond Beach is 2.79 persons per family, with married-couple families (8,770 | 75.2%) accounting for the largest median family size of 2.86 persons per family. On the other hand, single female/mother families (1,895 | 16.3%) represent the smallest median family size with 2.54 persons per family.
| Family Type | # Families | Family Size |
| Married-Couple | 8,770 (75.2%) | 2.86 |
| Single Male/Father | 989 (8.5%) | 2.62 |
| Single Female/Mother | 1,895 (16.3%) | 2.54 |
| Total Families | 11,654 (100.0%) | 2.79 |
Median Household Size in Ormond Beach
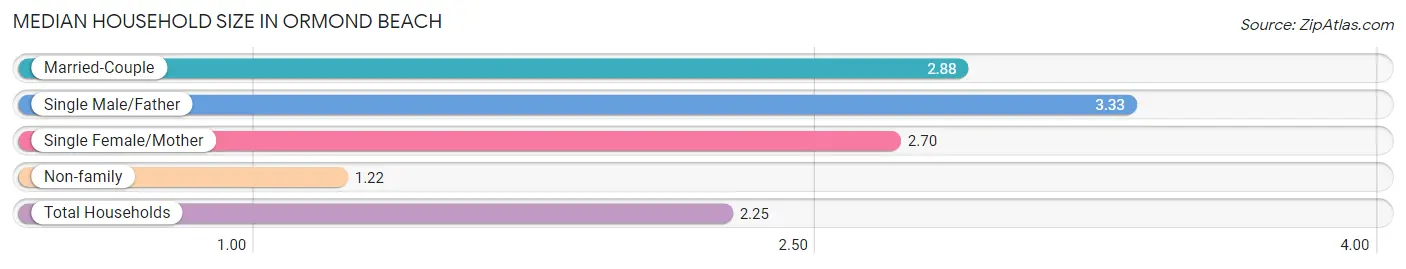
The median household size in Ormond Beach is 2.25 persons per household, with single male/father households (989 | 5.2%) accounting for the largest median household size of 3.33 persons per household. non-family households (7,217 | 38.2%) represent the smallest median household size with 1.22 persons per household.
| Household Type | # Households | Household Size |
| Married-Couple | 8,770 (46.5%) | 2.88 |
| Single Male/Father | 989 (5.2%) | 3.33 |
| Single Female/Mother | 1,895 (10.0%) | 2.70 |
| Non-family | 7,217 (38.2%) | 1.22 |
| Total Households | 18,871 (100.0%) | 2.25 |
Household Size by Marriage Status in Ormond Beach
Out of a total of 18,871 households in Ormond Beach, 11,654 (61.8%) are family households, while 7,217 (38.2%) are nonfamily households. The most numerous type of family households are 2-person households, comprising 6,478, and the most common type of nonfamily households are 1-person households, comprising 5,922.
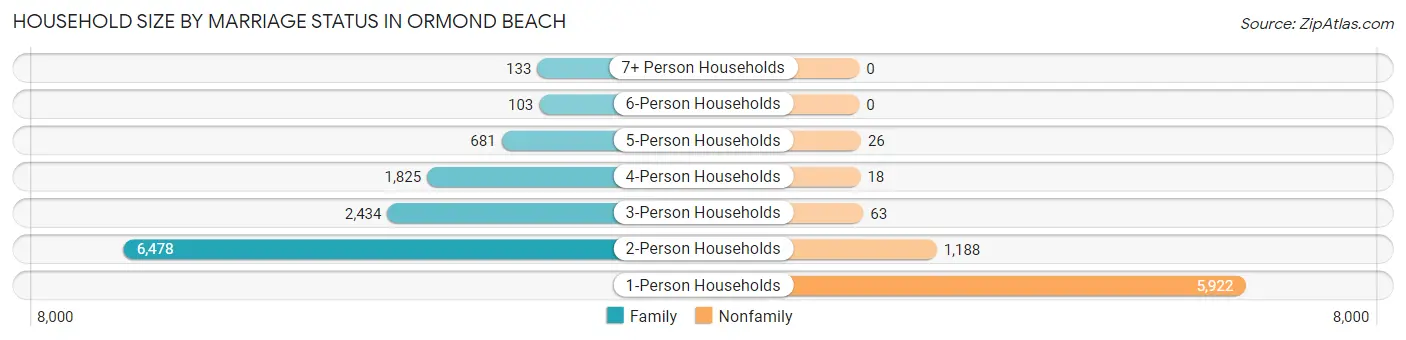
| Household Size | Family Households | Nonfamily Households |
| 1-Person Households | - | 5,922 (31.4%) |
| 2-Person Households | 6,478 (34.3%) | 1,188 (6.3%) |
| 3-Person Households | 2,434 (12.9%) | 63 (0.3%) |
| 4-Person Households | 1,825 (9.7%) | 18 (0.1%) |
| 5-Person Households | 681 (3.6%) | 26 (0.1%) |
| 6-Person Households | 103 (0.5%) | 0 (0.0%) |
| 7+ Person Households | 133 (0.7%) | 0 (0.0%) |
| Total | 11,654 (61.8%) | 7,217 (38.2%) |
Female Fertility in Ormond Beach
Fertility by Age in Ormond Beach
Average fertility rate in Ormond Beach is 45.0 births per 1,000 women. Women in the age bracket of 20 to 34 years have the highest fertility rate with 66.0 births per 1,000 women. Women in the age bracket of 20 to 34 years acount for 63.2% of all women with births.
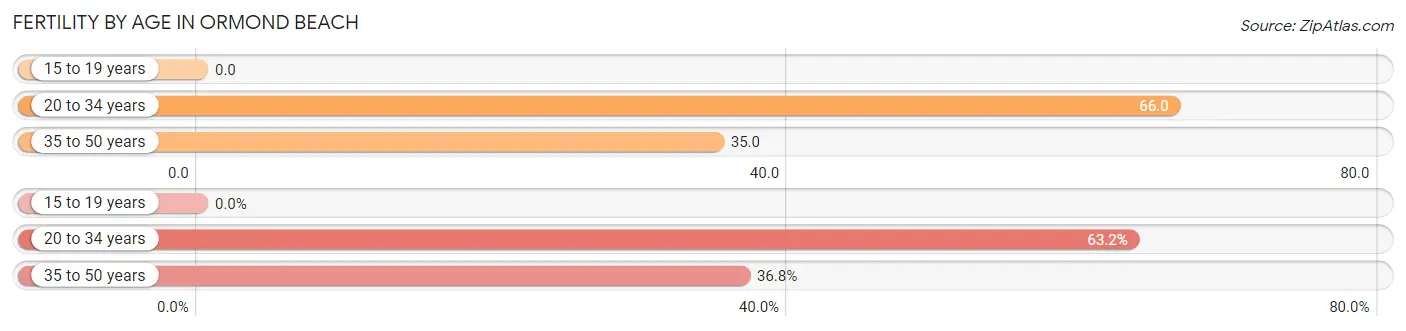
| Age Bracket | Women with Births | Births / 1,000 Women |
| 15 to 19 years | 0 (0.0%) | 0.0 |
| 20 to 34 years | 208 (63.2%) | 66.0 |
| 35 to 50 years | 121 (36.8%) | 35.0 |
| Total | 329 (100.0%) | 45.0 |
Fertility by Age by Marriage Status in Ormond Beach
72.6% of women with births (329) in Ormond Beach are married. The highest percentage of unmarried women with births falls into 20 to 34 years age bracket with 40.4% of them unmarried at the time of birth, while the lowest percentage of unmarried women with births belong to 35 to 50 years age bracket with 5.0% of them unmarried.
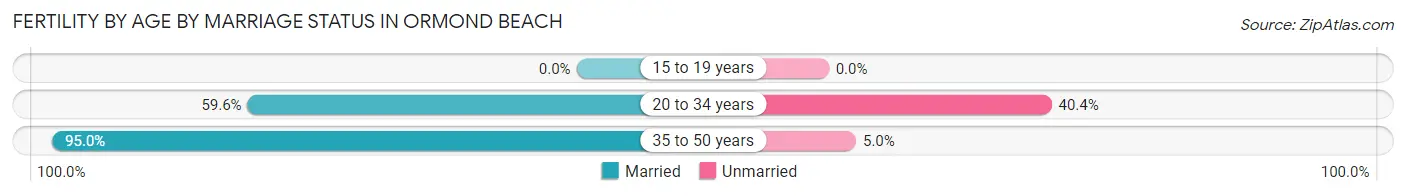
| Age Bracket | Married | Unmarried |
| 15 to 19 years | 0 (0.0%) | 0 (0.0%) |
| 20 to 34 years | 124 (59.6%) | 84 (40.4%) |
| 35 to 50 years | 115 (95.0%) | 6 (5.0%) |
| Total | 239 (72.6%) | 90 (27.4%) |
Fertility by Education in Ormond Beach
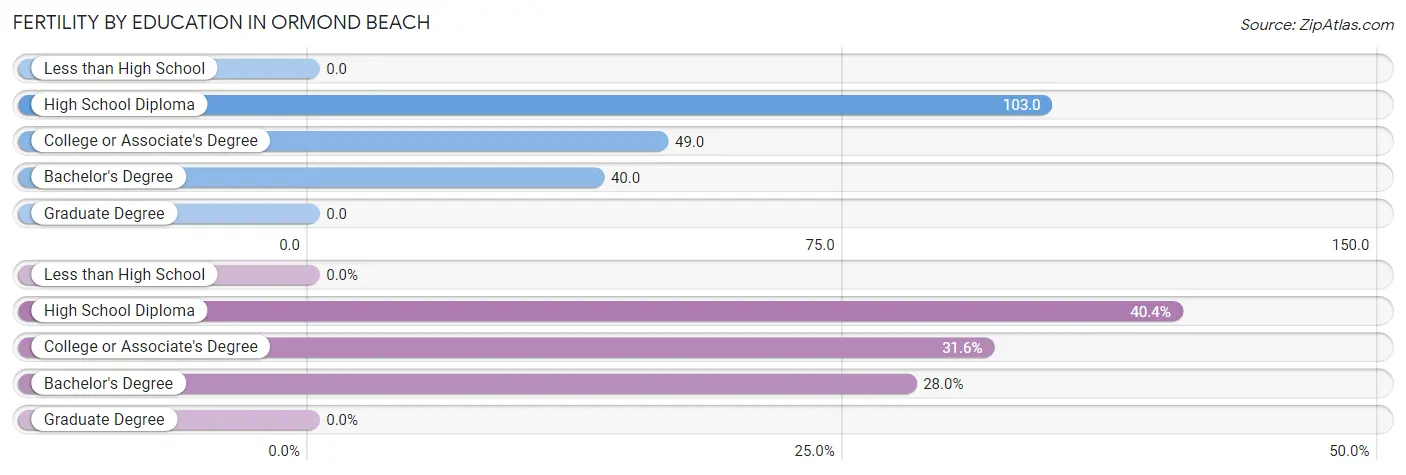
| Educational Attainment | Women with Births | Births / 1,000 Women |
| Less than High School | 0 (0.0%) | 0.0 |
| High School Diploma | 133 (40.4%) | 103.0 |
| College or Associate's Degree | 104 (31.6%) | 49.0 |
| Bachelor's Degree | 92 (28.0%) | 40.0 |
| Graduate Degree | 0 (0.0%) | 0.0 |
| Total | 329 (100.0%) | 45.0 |
Fertility by Education by Marriage Status in Ormond Beach
27.4% of women with births in Ormond Beach are unmarried. Women with the educational attainment of bachelor's degree are most likely to be married with 100.0% of them married at childbirth, while women with the educational attainment of high school diploma are least likely to be married with 50.4% of them unmarried at childbirth.
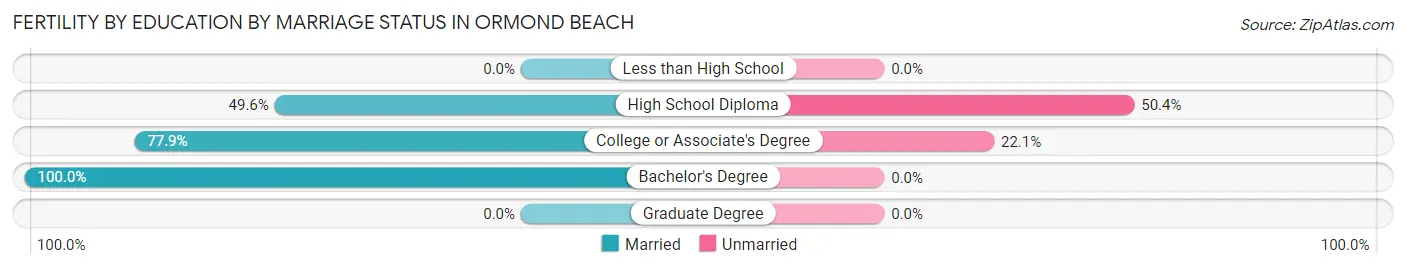
| Educational Attainment | Married | Unmarried |
| Less than High School | 0 (0.0%) | 0 (0.0%) |
| High School Diploma | 66 (49.6%) | 67 (50.4%) |
| College or Associate's Degree | 81 (77.9%) | 23 (22.1%) |
| Bachelor's Degree | 92 (100.0%) | 0 (0.0%) |
| Graduate Degree | 0 (0.0%) | 0 (0.0%) |
| Total | 239 (72.6%) | 90 (27.4%) |
Employment Characteristics in Ormond Beach
Employment by Class of Employer in Ormond Beach
Among the 18,581 employed individuals in Ormond Beach, private company employees (11,667 | 62.8%), self-employed (incorporated) (2,077 | 11.2%), and not-for-profit organizations (1,782 | 9.6%) make up the most common classes of employment.
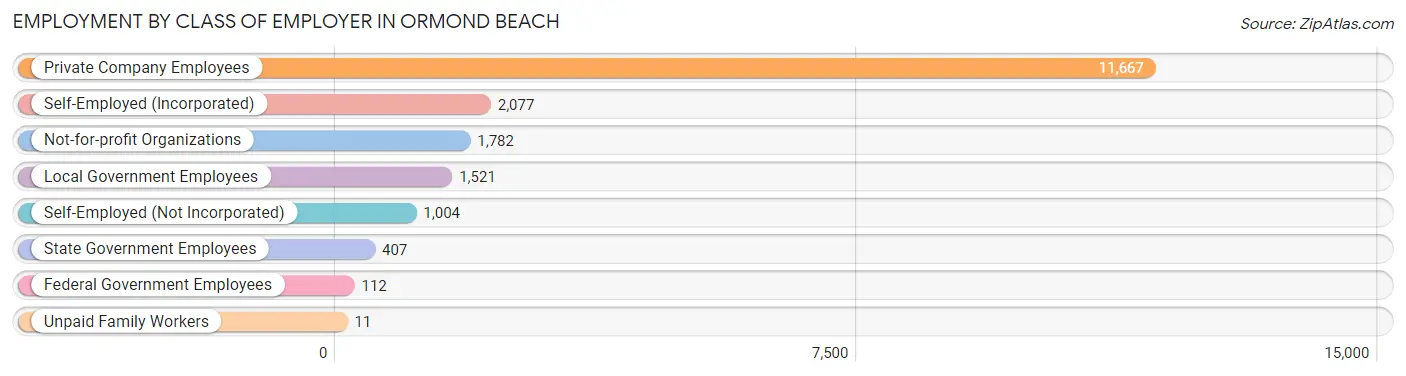
| Employer Class | # Employees | % Employees |
| Private Company Employees | 11,667 | 62.8% |
| Self-Employed (Incorporated) | 2,077 | 11.2% |
| Self-Employed (Not Incorporated) | 1,004 | 5.4% |
| Not-for-profit Organizations | 1,782 | 9.6% |
| Local Government Employees | 1,521 | 8.2% |
| State Government Employees | 407 | 2.2% |
| Federal Government Employees | 112 | 0.6% |
| Unpaid Family Workers | 11 | 0.1% |
| Total | 18,581 | 100.0% |
Employment Status by Age in Ormond Beach
According to the labor force statistics for Ormond Beach, out of the total population over 16 years of age (36,116), 53.3% or 19,250 individuals are in the labor force, with 2.4% or 462 of them unemployed. The age group with the highest labor force participation rate is 45 to 54 years, with 85.7% or 4,444 individuals in the labor force. Within the labor force, the 20 to 24 years age range has the highest percentage of unemployed individuals, with 8.8% or 132 of them being unemployed.
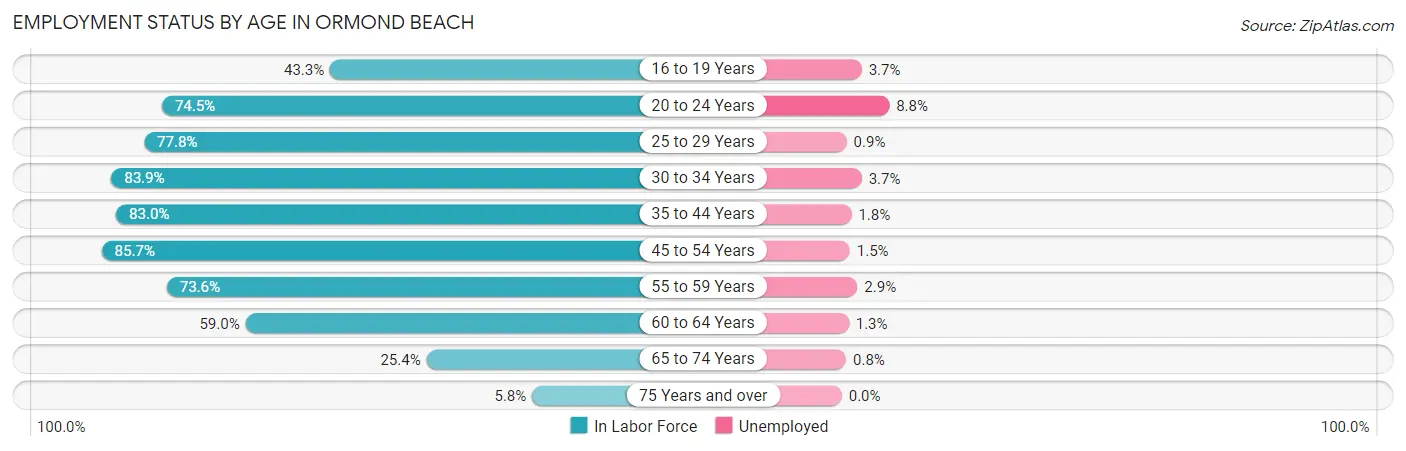
| Age Bracket | In Labor Force | Unemployed |
| 16 to 19 Years | 510 (43.3%) | 19 (3.7%) |
| 20 to 24 Years | 1,505 (74.5%) | 132 (8.8%) |
| 25 to 29 Years | 1,389 (77.8%) | 13 (0.9%) |
| 30 to 34 Years | 1,881 (83.9%) | 70 (3.7%) |
| 35 to 44 Years | 3,352 (83.0%) | 60 (1.8%) |
| 45 to 54 Years | 4,444 (85.7%) | 67 (1.5%) |
| 55 to 59 Years | 2,044 (73.6%) | 59 (2.9%) |
| 60 to 64 Years | 1,929 (59.0%) | 25 (1.3%) |
| 65 to 74 Years | 1,821 (25.4%) | 15 (0.8%) |
| 75 Years and over | 374 (5.8%) | 0 (0.0%) |
| Total | 19,250 (53.3%) | 462 (2.4%) |
Employment Status by Educational Attainment in Ormond Beach
According to labor force statistics for Ormond Beach, 77.9% of individuals (15,034) out of the total population between 25 and 64 years of age (19,299) are in the labor force, with 1.9% or 286 of them being unemployed. The group with the highest labor force participation rate are those with the educational attainment of bachelor's degree or higher, with 84.5% or 6,483 individuals in the labor force. Within the labor force, individuals with less than high school education have the highest percentage of unemployment, with 5.9% or 45 of them being unemployed.
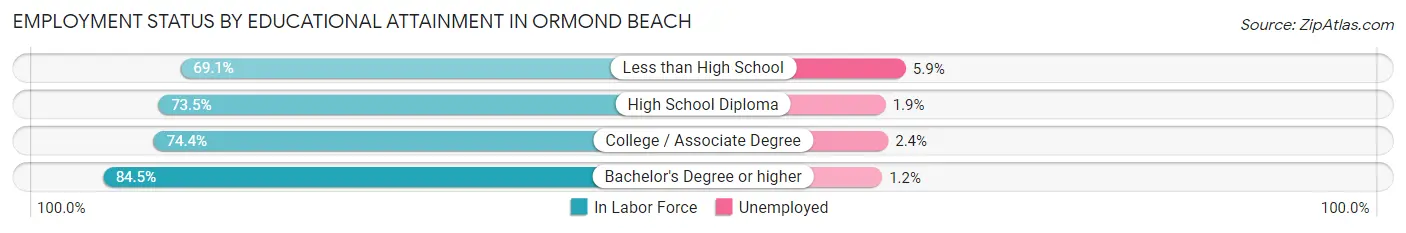
| Educational Attainment | In Labor Force | Unemployed |
| Less than High School | 764 (69.1%) | 65 (5.9%) |
| High School Diploma | 3,001 (73.5%) | 78 (1.9%) |
| College / Associate Degree | 4,791 (74.4%) | 155 (2.4%) |
| Bachelor's Degree or higher | 6,483 (84.5%) | 92 (1.2%) |
| Total | 15,034 (77.9%) | 367 (1.9%) |
Employment Occupations by Sex in Ormond Beach
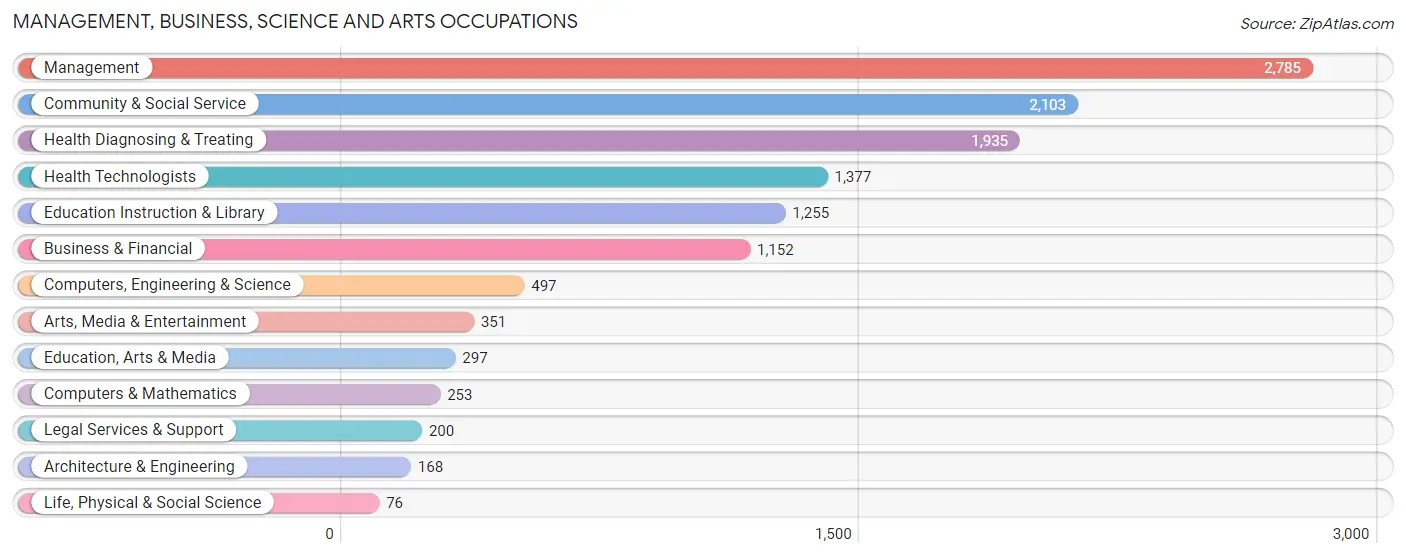
Management, Business, Science and Arts Occupations
The most common Management, Business, Science and Arts occupations in Ormond Beach are Management (2,785 | 14.8%), Community & Social Service (2,103 | 11.2%), Health Diagnosing & Treating (1,935 | 10.3%), Health Technologists (1,377 | 7.3%), and Education Instruction & Library (1,255 | 6.7%).
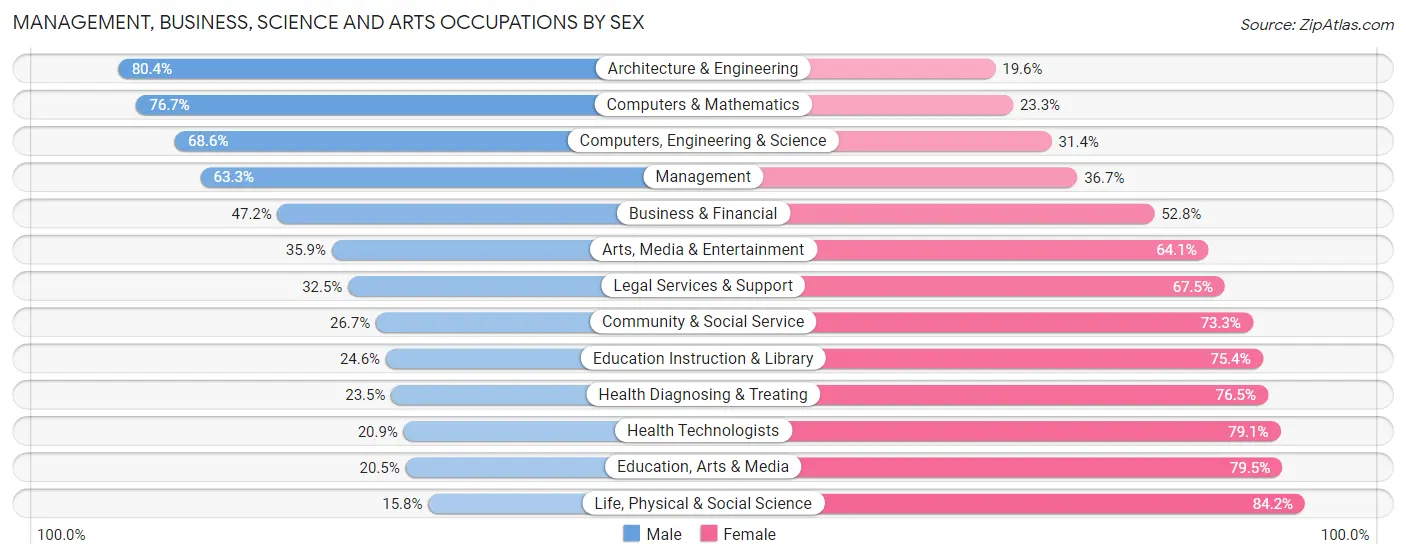
Management, Business, Science and Arts Occupations by Sex
Within the Management, Business, Science and Arts occupations in Ormond Beach, the most male-oriented occupations are Architecture & Engineering (80.4%), Computers & Mathematics (76.7%), and Computers, Engineering & Science (68.6%), while the most female-oriented occupations are Life, Physical & Social Science (84.2%), Education, Arts & Media (79.5%), and Health Technologists (79.1%).
| Occupation | Male | Female |
| Management | 1,762 (63.3%) | 1,023 (36.7%) |
| Business & Financial | 544 (47.2%) | 608 (52.8%) |
| Computers, Engineering & Science | 341 (68.6%) | 156 (31.4%) |
| Computers & Mathematics | 194 (76.7%) | 59 (23.3%) |
| Architecture & Engineering | 135 (80.4%) | 33 (19.6%) |
| Life, Physical & Social Science | 12 (15.8%) | 64 (84.2%) |
| Community & Social Service | 561 (26.7%) | 1,542 (73.3%) |
| Education, Arts & Media | 61 (20.5%) | 236 (79.5%) |
| Legal Services & Support | 65 (32.5%) | 135 (67.5%) |
| Education Instruction & Library | 309 (24.6%) | 946 (75.4%) |
| Arts, Media & Entertainment | 126 (35.9%) | 225 (64.1%) |
| Health Diagnosing & Treating | 455 (23.5%) | 1,480 (76.5%) |
| Health Technologists | 288 (20.9%) | 1,089 (79.1%) |
| Total (Category) | 3,663 (43.2%) | 4,809 (56.8%) |
| Total (Overall) | 9,361 (49.8%) | 9,425 (50.2%) |
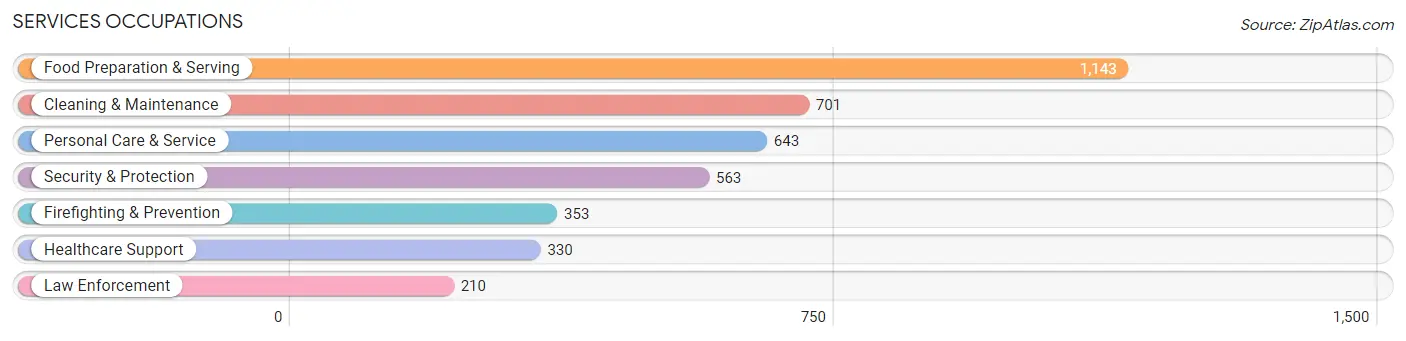
Services Occupations
The most common Services occupations in Ormond Beach are Food Preparation & Serving (1,143 | 6.1%), Cleaning & Maintenance (701 | 3.7%), Personal Care & Service (643 | 3.4%), Security & Protection (563 | 3.0%), and Firefighting & Prevention (353 | 1.9%).
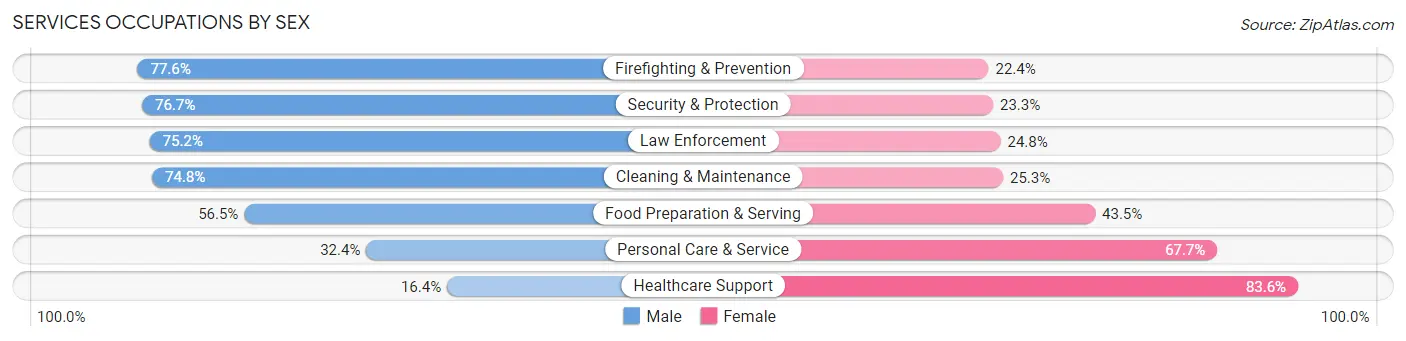
Services Occupations by Sex
Within the Services occupations in Ormond Beach, the most male-oriented occupations are Firefighting & Prevention (77.6%), Security & Protection (76.7%), and Law Enforcement (75.2%), while the most female-oriented occupations are Healthcare Support (83.6%), Personal Care & Service (67.6%), and Food Preparation & Serving (43.5%).
| Occupation | Male | Female |
| Healthcare Support | 54 (16.4%) | 276 (83.6%) |
| Security & Protection | 432 (76.7%) | 131 (23.3%) |
| Firefighting & Prevention | 274 (77.6%) | 79 (22.4%) |
| Law Enforcement | 158 (75.2%) | 52 (24.8%) |
| Food Preparation & Serving | 646 (56.5%) | 497 (43.5%) |
| Cleaning & Maintenance | 524 (74.8%) | 177 (25.3%) |
| Personal Care & Service | 208 (32.4%) | 435 (67.6%) |
| Total (Category) | 1,864 (55.1%) | 1,516 (44.9%) |
| Total (Overall) | 9,361 (49.8%) | 9,425 (50.2%) |
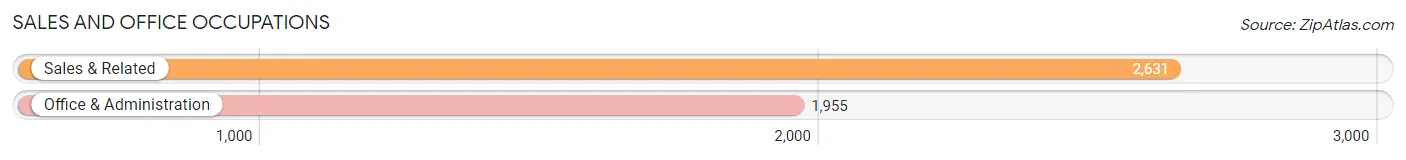
Sales and Office Occupations
The most common Sales and Office occupations in Ormond Beach are Sales & Related (2,631 | 14.0%), and Office & Administration (1,955 | 10.4%).
Sales and Office Occupations by Sex
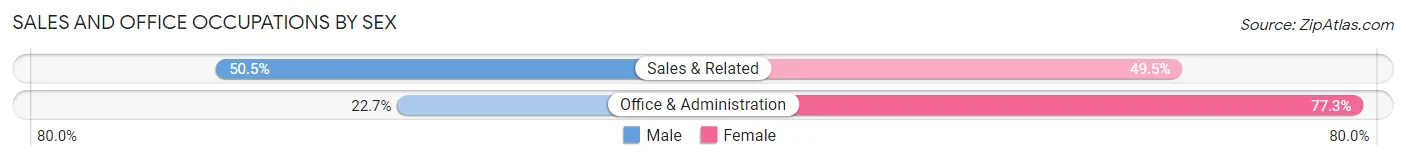
| Occupation | Male | Female |
| Sales & Related | 1,329 (50.5%) | 1,302 (49.5%) |
| Office & Administration | 443 (22.7%) | 1,512 (77.3%) |
| Total (Category) | 1,772 (38.6%) | 2,814 (61.4%) |
| Total (Overall) | 9,361 (49.8%) | 9,425 (50.2%) |
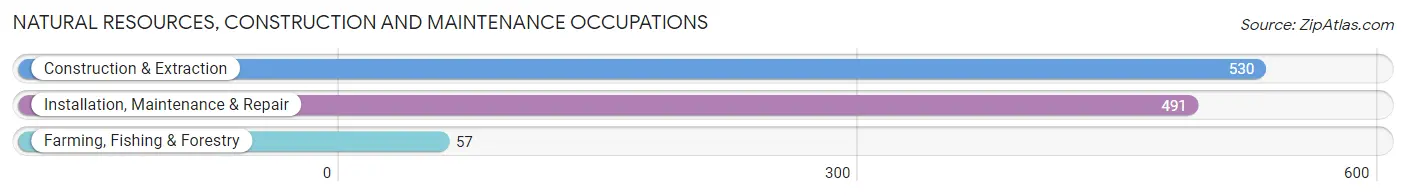
Natural Resources, Construction and Maintenance Occupations
The most common Natural Resources, Construction and Maintenance occupations in Ormond Beach are Construction & Extraction (530 | 2.8%), Installation, Maintenance & Repair (491 | 2.6%), and Farming, Fishing & Forestry (57 | 0.3%).
Natural Resources, Construction and Maintenance Occupations by Sex
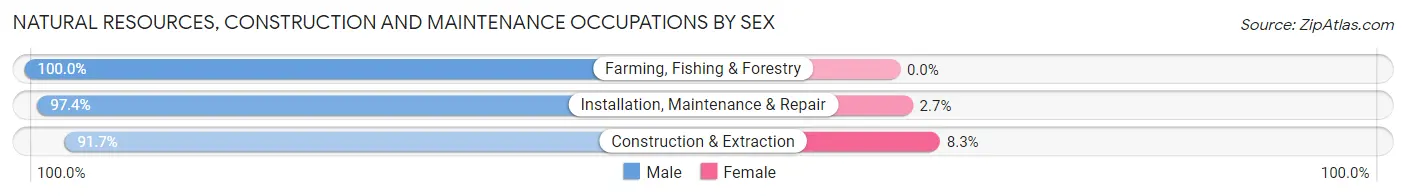
| Occupation | Male | Female |
| Farming, Fishing & Forestry | 57 (100.0%) | 0 (0.0%) |
| Construction & Extraction | 486 (91.7%) | 44 (8.3%) |
| Installation, Maintenance & Repair | 478 (97.4%) | 13 (2.6%) |
| Total (Category) | 1,021 (94.7%) | 57 (5.3%) |
| Total (Overall) | 9,361 (49.8%) | 9,425 (50.2%) |
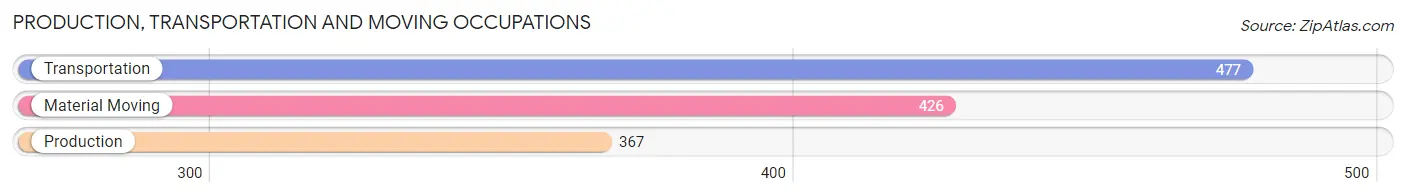
Production, Transportation and Moving Occupations
The most common Production, Transportation and Moving occupations in Ormond Beach are Transportation (477 | 2.5%), Material Moving (426 | 2.3%), and Production (367 | 1.9%).
Production, Transportation and Moving Occupations by Sex
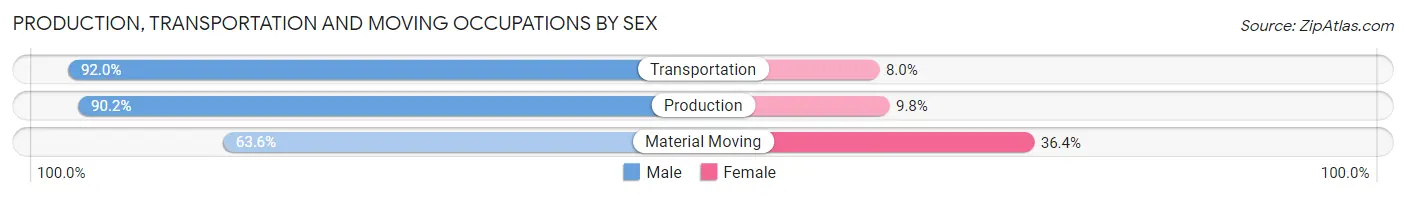
| Occupation | Male | Female |
| Production | 331 (90.2%) | 36 (9.8%) |
| Transportation | 439 (92.0%) | 38 (8.0%) |
| Material Moving | 271 (63.6%) | 155 (36.4%) |
| Total (Category) | 1,041 (82.0%) | 229 (18.0%) |
| Total (Overall) | 9,361 (49.8%) | 9,425 (50.2%) |
Employment Industries by Sex in Ormond Beach
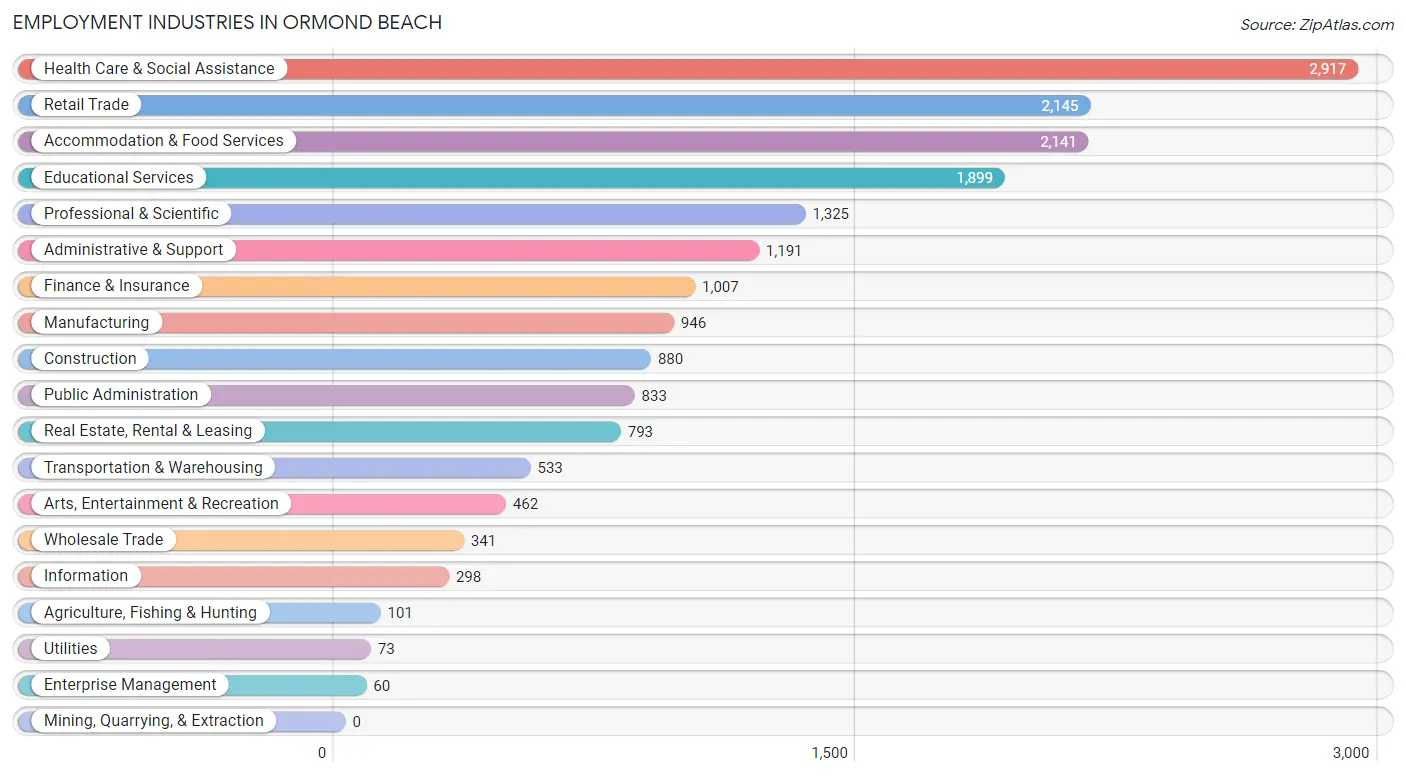
Employment Industries in Ormond Beach
The major employment industries in Ormond Beach include Health Care & Social Assistance (2,917 | 15.5%), Retail Trade (2,145 | 11.4%), Accommodation & Food Services (2,141 | 11.4%), Educational Services (1,899 | 10.1%), and Professional & Scientific (1,325 | 7.0%).
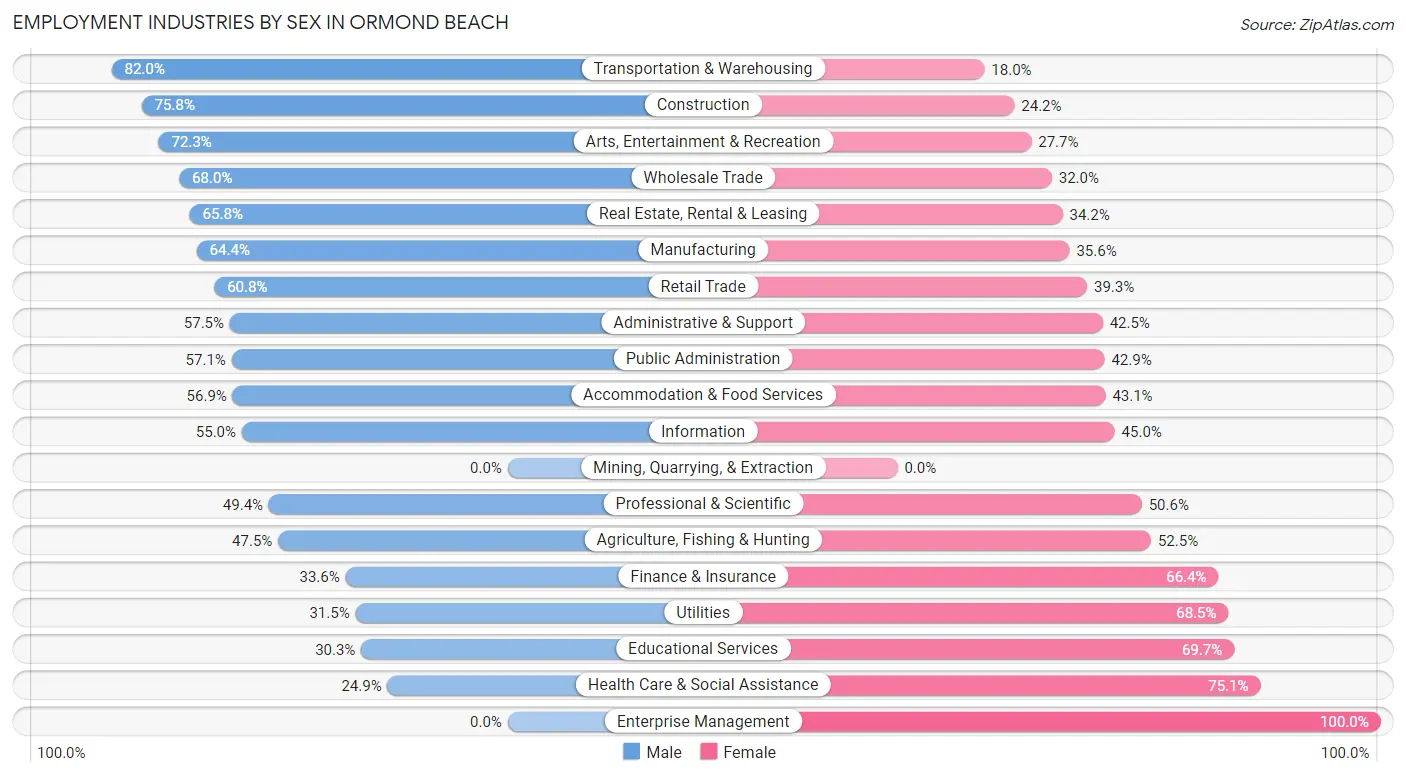
Employment Industries by Sex in Ormond Beach
The Ormond Beach industries that see more men than women are Transportation & Warehousing (82.0%), Construction (75.8%), and Arts, Entertainment & Recreation (72.3%), whereas the industries that tend to have a higher number of women are Enterprise Management (100.0%), Health Care & Social Assistance (75.1%), and Educational Services (69.7%).
| Industry | Male | Female |
| Agriculture, Fishing & Hunting | 48 (47.5%) | 53 (52.5%) |
| Mining, Quarrying, & Extraction | 0 (0.0%) | 0 (0.0%) |
| Construction | 667 (75.8%) | 213 (24.2%) |
| Manufacturing | 609 (64.4%) | 337 (35.6%) |
| Wholesale Trade | 232 (68.0%) | 109 (32.0%) |
| Retail Trade | 1,303 (60.8%) | 842 (39.3%) |
| Transportation & Warehousing | 437 (82.0%) | 96 (18.0%) |
| Utilities | 23 (31.5%) | 50 (68.5%) |
| Information | 164 (55.0%) | 134 (45.0%) |
| Finance & Insurance | 338 (33.6%) | 669 (66.4%) |
| Real Estate, Rental & Leasing | 522 (65.8%) | 271 (34.2%) |
| Professional & Scientific | 655 (49.4%) | 670 (50.6%) |
| Enterprise Management | 0 (0.0%) | 60 (100.0%) |
| Administrative & Support | 685 (57.5%) | 506 (42.5%) |
| Educational Services | 576 (30.3%) | 1,323 (69.7%) |
| Health Care & Social Assistance | 726 (24.9%) | 2,191 (75.1%) |
| Arts, Entertainment & Recreation | 334 (72.3%) | 128 (27.7%) |
| Accommodation & Food Services | 1,219 (56.9%) | 922 (43.1%) |
| Public Administration | 476 (57.1%) | 357 (42.9%) |
| Total | 9,361 (49.8%) | 9,425 (50.2%) |
Education in Ormond Beach
School Enrollment in Ormond Beach
The most common levels of schooling among the 7,617 students in Ormond Beach are elementary school (1,727 | 22.7%), middle school (1,548 | 20.3%), and college / undergraduate (1,363 | 17.9%).
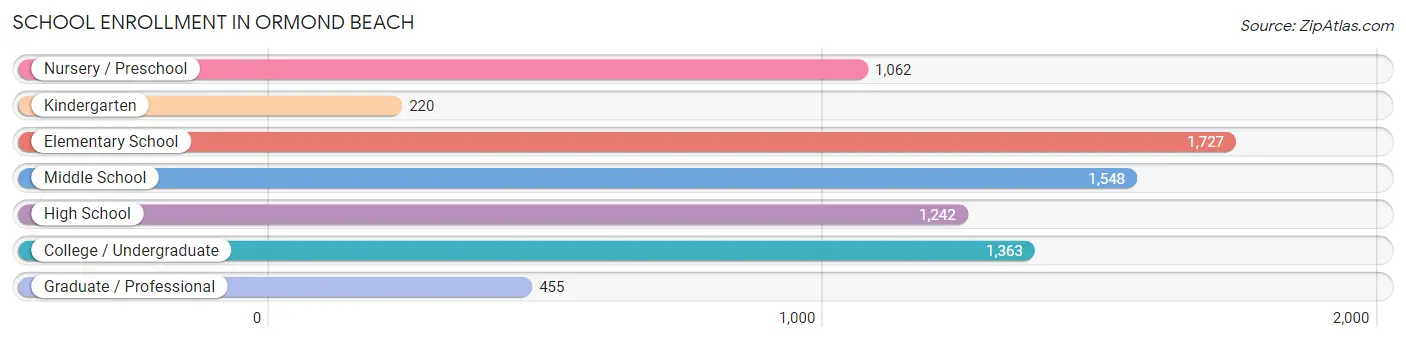
| School Level | # Students | % Students |
| Nursery / Preschool | 1,062 | 13.9% |
| Kindergarten | 220 | 2.9% |
| Elementary School | 1,727 | 22.7% |
| Middle School | 1,548 | 20.3% |
| High School | 1,242 | 16.3% |
| College / Undergraduate | 1,363 | 17.9% |
| Graduate / Professional | 455 | 6.0% |
| Total | 7,617 | 100.0% |
School Enrollment by Age by Funding Source in Ormond Beach
Out of a total of 7,617 students who are enrolled in schools in Ormond Beach, 1,714 (22.5%) attend a private institution, while the remaining 5,903 (77.5%) are enrolled in public schools. The age group of 3 to 4 year olds has the highest likelihood of being enrolled in private schools, with 496 (49.2% in the age bracket) enrolled. Conversely, the age group of 18 to 19 year olds has the lowest likelihood of being enrolled in a private school, with 342 (90.5% in the age bracket) attending a public institution.
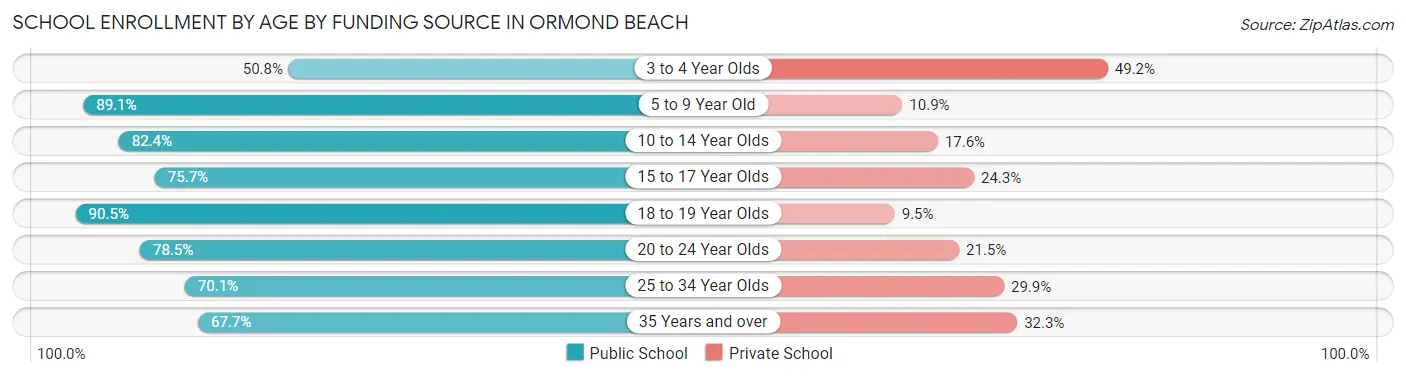
| Age Bracket | Public School | Private School |
| 3 to 4 Year Olds | 512 (50.8%) | 496 (49.2%) |
| 5 to 9 Year Old | 1,604 (89.1%) | 197 (10.9%) |
| 10 to 14 Year Olds | 1,549 (82.4%) | 330 (17.6%) |
| 15 to 17 Year Olds | 761 (75.7%) | 244 (24.3%) |
| 18 to 19 Year Olds | 342 (90.5%) | 36 (9.5%) |
| 20 to 24 Year Olds | 602 (78.5%) | 165 (21.5%) |
| 25 to 34 Year Olds | 223 (70.1%) | 95 (29.9%) |
| 35 Years and over | 312 (67.7%) | 149 (32.3%) |
| Total | 5,903 (77.5%) | 1,714 (22.5%) |
Educational Attainment by Field of Study in Ormond Beach
Business (3,427 | 26.9%), education (1,655 | 13.0%), science & technology (1,463 | 11.5%), social sciences (898 | 7.0%), and arts & humanities (633 | 5.0%) are the most common fields of study among 12,734 individuals in Ormond Beach who have obtained a bachelor's degree or higher.
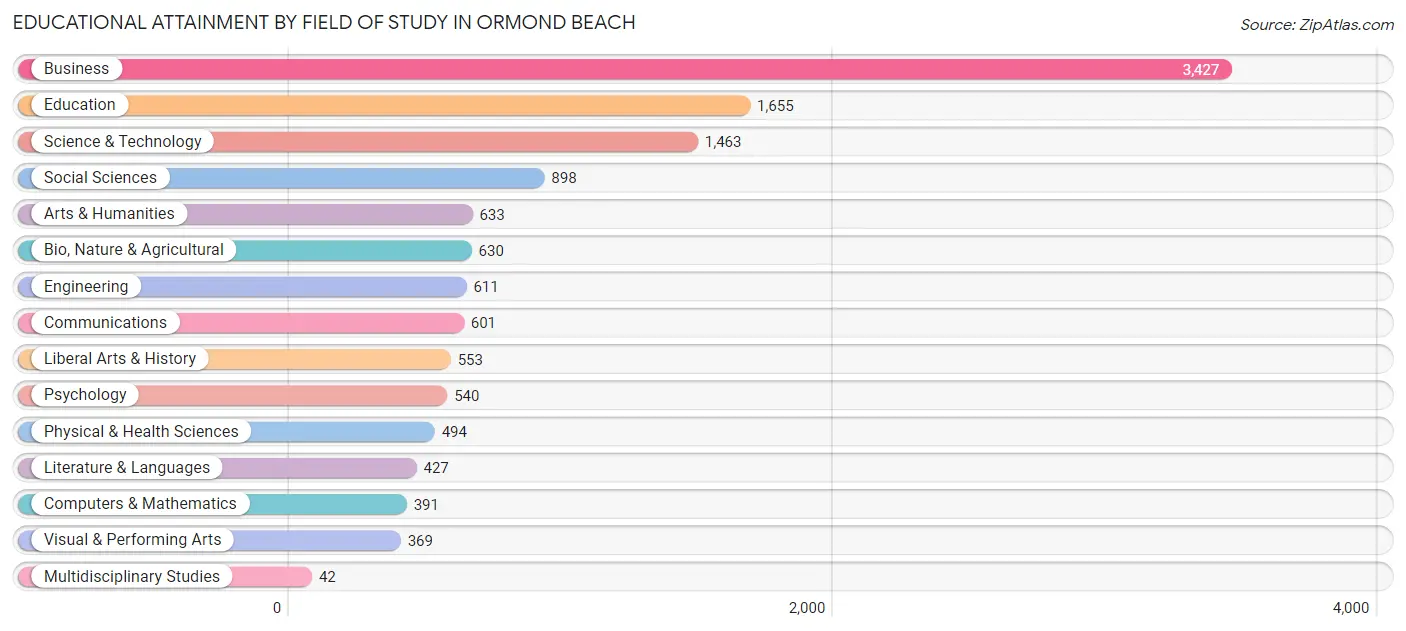
| Field of Study | # Graduates | % Graduates |
| Computers & Mathematics | 391 | 3.1% |
| Bio, Nature & Agricultural | 630 | 5.0% |
| Physical & Health Sciences | 494 | 3.9% |
| Psychology | 540 | 4.2% |
| Social Sciences | 898 | 7.0% |
| Engineering | 611 | 4.8% |
| Multidisciplinary Studies | 42 | 0.3% |
| Science & Technology | 1,463 | 11.5% |
| Business | 3,427 | 26.9% |
| Education | 1,655 | 13.0% |
| Literature & Languages | 427 | 3.4% |
| Liberal Arts & History | 553 | 4.3% |
| Visual & Performing Arts | 369 | 2.9% |
| Communications | 601 | 4.7% |
| Arts & Humanities | 633 | 5.0% |
| Total | 12,734 | 100.0% |
Transportation & Commute in Ormond Beach
Vehicle Availability by Sex in Ormond Beach
The most prevalent vehicle ownership categories in Ormond Beach are males with 2 vehicles (4,712, accounting for 50.9%) and females with 2 vehicles (4,562, making up 50.7%).
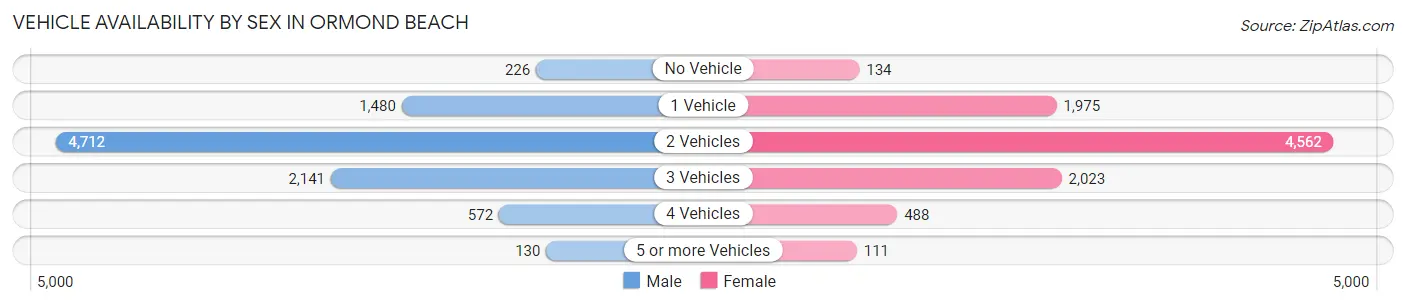
| Vehicles Available | Male | Female |
| No Vehicle | 226 (2.4%) | 134 (1.4%) |
| 1 Vehicle | 1,480 (16.0%) | 1,975 (21.2%) |
| 2 Vehicles | 4,712 (50.9%) | 4,562 (49.1%) |
| 3 Vehicles | 2,141 (23.1%) | 2,023 (21.8%) |
| 4 Vehicles | 572 (6.2%) | 488 (5.2%) |
| 5 or more Vehicles | 130 (1.4%) | 111 (1.2%) |
| Total | 9,261 (100.0%) | 9,293 (100.0%) |
Commute Time in Ormond Beach
The most frequently occuring commute durations in Ormond Beach are 15 to 19 minutes (4,045 commuters, 24.7%), 10 to 14 minutes (3,080 commuters, 18.8%), and 20 to 24 minutes (2,611 commuters, 16.0%).
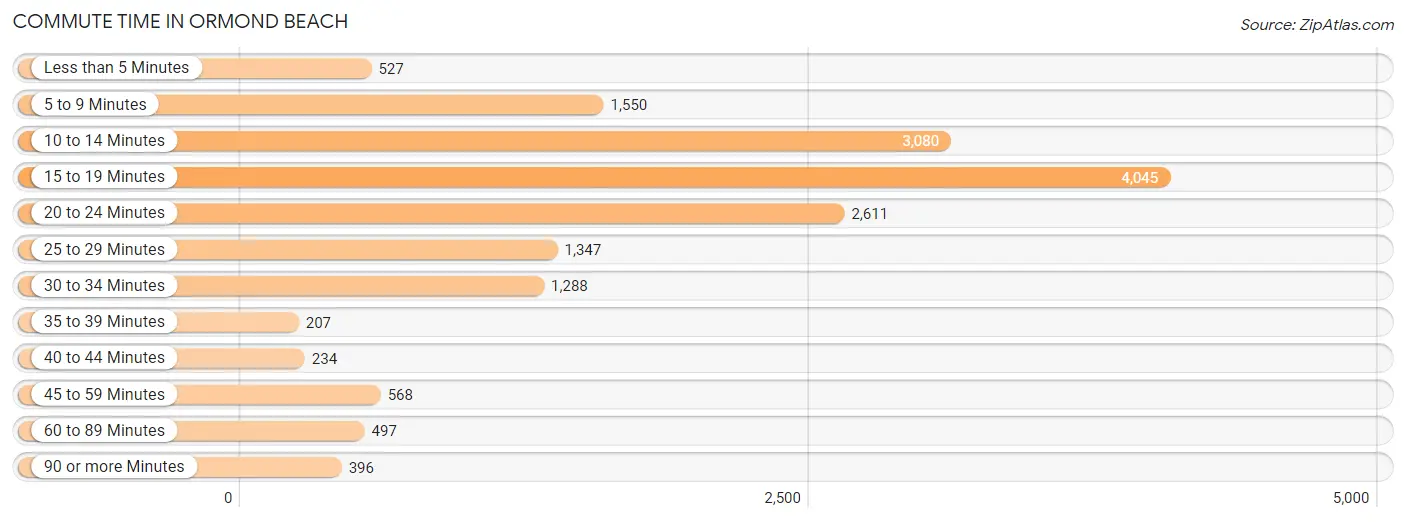
| Commute Time | # Commuters | % Commuters |
| Less than 5 Minutes | 527 | 3.2% |
| 5 to 9 Minutes | 1,550 | 9.5% |
| 10 to 14 Minutes | 3,080 | 18.8% |
| 15 to 19 Minutes | 4,045 | 24.7% |
| 20 to 24 Minutes | 2,611 | 16.0% |
| 25 to 29 Minutes | 1,347 | 8.2% |
| 30 to 34 Minutes | 1,288 | 7.9% |
| 35 to 39 Minutes | 207 | 1.3% |
| 40 to 44 Minutes | 234 | 1.4% |
| 45 to 59 Minutes | 568 | 3.5% |
| 60 to 89 Minutes | 497 | 3.0% |
| 90 or more Minutes | 396 | 2.4% |
Commute Time by Sex in Ormond Beach
The most common commute times in Ormond Beach are 15 to 19 minutes (2,014 commuters, 24.7%) for males and 15 to 19 minutes (2,031 commuters, 24.8%) for females.
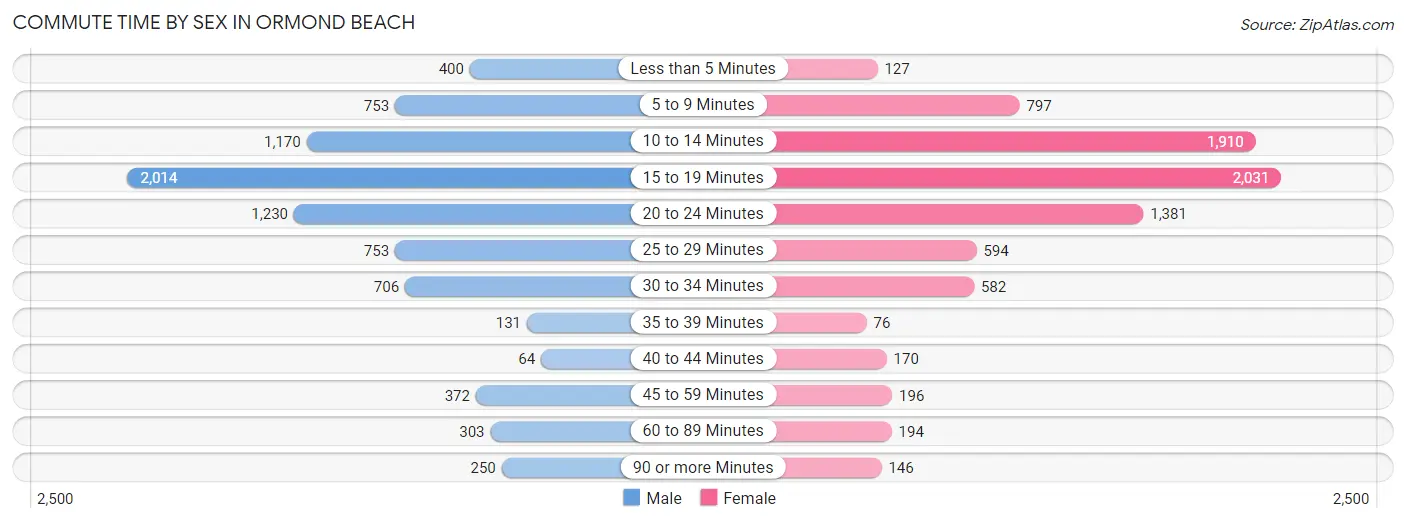
| Commute Time | Male | Female |
| Less than 5 Minutes | 400 (4.9%) | 127 (1.5%) |
| 5 to 9 Minutes | 753 (9.2%) | 797 (9.7%) |
| 10 to 14 Minutes | 1,170 (14.4%) | 1,910 (23.3%) |
| 15 to 19 Minutes | 2,014 (24.7%) | 2,031 (24.8%) |
| 20 to 24 Minutes | 1,230 (15.1%) | 1,381 (16.8%) |
| 25 to 29 Minutes | 753 (9.2%) | 594 (7.2%) |
| 30 to 34 Minutes | 706 (8.7%) | 582 (7.1%) |
| 35 to 39 Minutes | 131 (1.6%) | 76 (0.9%) |
| 40 to 44 Minutes | 64 (0.8%) | 170 (2.1%) |
| 45 to 59 Minutes | 372 (4.6%) | 196 (2.4%) |
| 60 to 89 Minutes | 303 (3.7%) | 194 (2.4%) |
| 90 or more Minutes | 250 (3.1%) | 146 (1.8%) |
Time of Departure to Work by Sex in Ormond Beach
The most frequent times of departure to work in Ormond Beach are 7:30 AM to 7:59 AM (1,399, 17.2%) for males and 7:00 AM to 7:29 AM (1,484, 18.1%) for females.
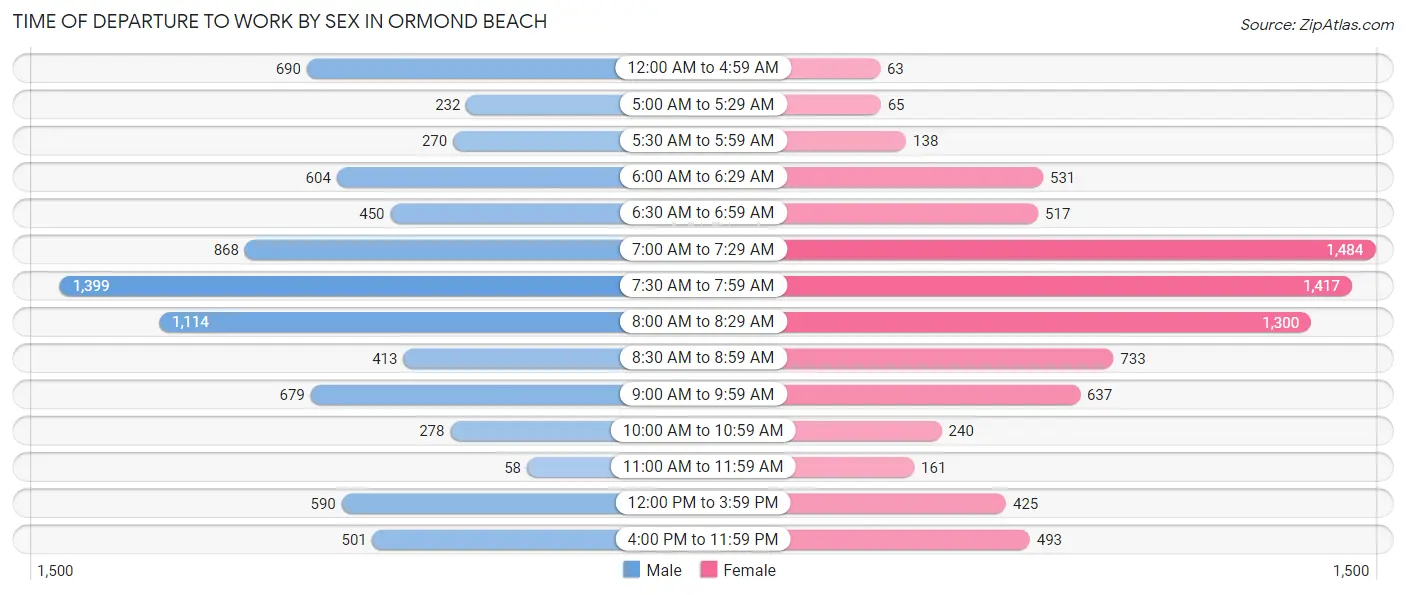
| Time of Departure | Male | Female |
| 12:00 AM to 4:59 AM | 690 (8.5%) | 63 (0.8%) |
| 5:00 AM to 5:29 AM | 232 (2.9%) | 65 (0.8%) |
| 5:30 AM to 5:59 AM | 270 (3.3%) | 138 (1.7%) |
| 6:00 AM to 6:29 AM | 604 (7.4%) | 531 (6.5%) |
| 6:30 AM to 6:59 AM | 450 (5.5%) | 517 (6.3%) |
| 7:00 AM to 7:29 AM | 868 (10.7%) | 1,484 (18.1%) |
| 7:30 AM to 7:59 AM | 1,399 (17.2%) | 1,417 (17.3%) |
| 8:00 AM to 8:29 AM | 1,114 (13.7%) | 1,300 (15.9%) |
| 8:30 AM to 8:59 AM | 413 (5.1%) | 733 (8.9%) |
| 9:00 AM to 9:59 AM | 679 (8.3%) | 637 (7.8%) |
| 10:00 AM to 10:59 AM | 278 (3.4%) | 240 (2.9%) |
| 11:00 AM to 11:59 AM | 58 (0.7%) | 161 (2.0%) |
| 12:00 PM to 3:59 PM | 590 (7.2%) | 425 (5.2%) |
| 4:00 PM to 11:59 PM | 501 (6.1%) | 493 (6.0%) |
| Total | 8,146 (100.0%) | 8,204 (100.0%) |
Housing Occupancy in Ormond Beach
Occupancy by Ownership in Ormond Beach
Of the total 18,871 dwellings in Ormond Beach, owner-occupied units account for 14,351 (76.0%), while renter-occupied units make up 4,520 (23.9%).
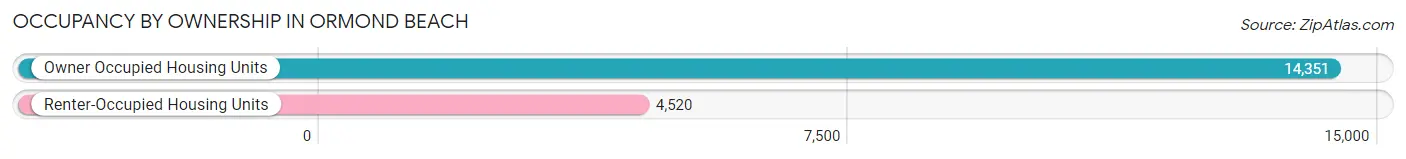
| Occupancy | # Housing Units | % Housing Units |
| Owner Occupied Housing Units | 14,351 | 76.0% |
| Renter-Occupied Housing Units | 4,520 | 23.9% |
| Total Occupied Housing Units | 18,871 | 100.0% |
Occupancy by Household Size in Ormond Beach
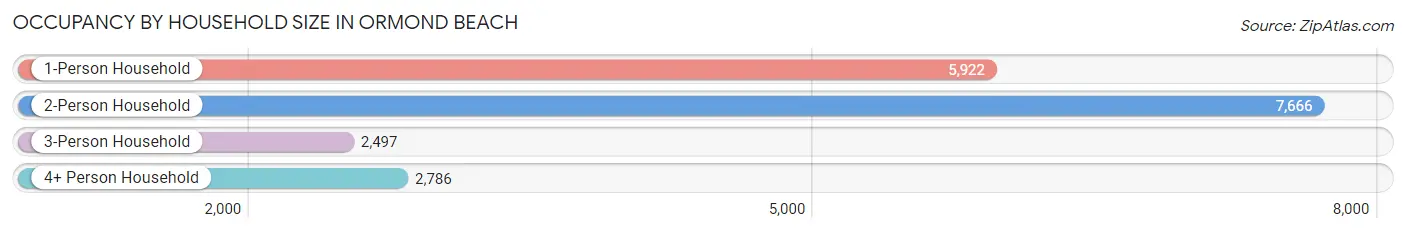
| Household Size | # Housing Units | % Housing Units |
| 1-Person Household | 5,922 | 31.4% |
| 2-Person Household | 7,666 | 40.6% |
| 3-Person Household | 2,497 | 13.2% |
| 4+ Person Household | 2,786 | 14.8% |
| Total Housing Units | 18,871 | 100.0% |
Occupancy by Ownership by Household Size in Ormond Beach
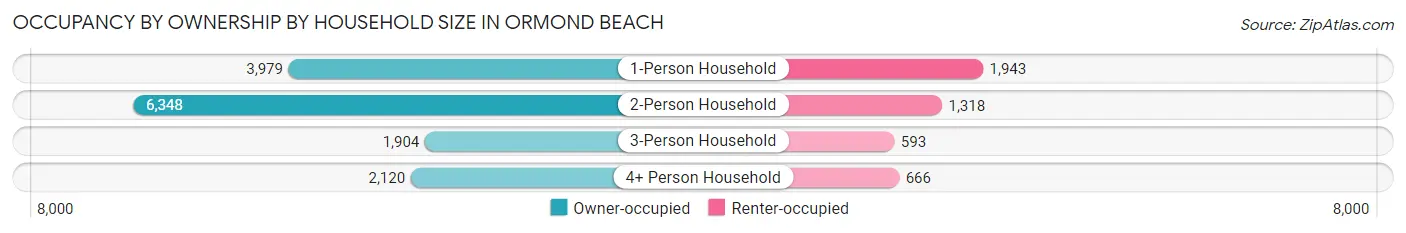
| Household Size | Owner-occupied | Renter-occupied |
| 1-Person Household | 3,979 (67.2%) | 1,943 (32.8%) |
| 2-Person Household | 6,348 (82.8%) | 1,318 (17.2%) |
| 3-Person Household | 1,904 (76.2%) | 593 (23.7%) |
| 4+ Person Household | 2,120 (76.1%) | 666 (23.9%) |
| Total Housing Units | 14,351 (76.0%) | 4,520 (23.9%) |
Occupancy by Educational Attainment in Ormond Beach
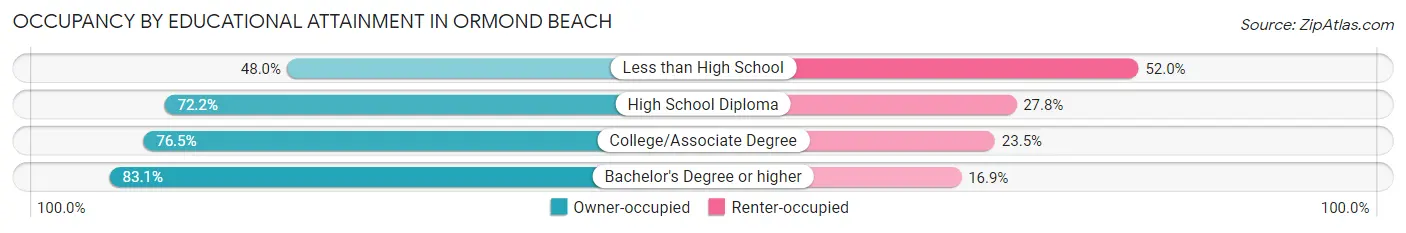
| Household Size | Owner-occupied | Renter-occupied |
| Less than High School | 613 (48.0%) | 664 (52.0%) |
| High School Diploma | 3,050 (72.2%) | 1,172 (27.8%) |
| College/Associate Degree | 4,914 (76.5%) | 1,513 (23.5%) |
| Bachelor's Degree or higher | 5,774 (83.1%) | 1,171 (16.9%) |
Occupancy by Age of Householder in Ormond Beach
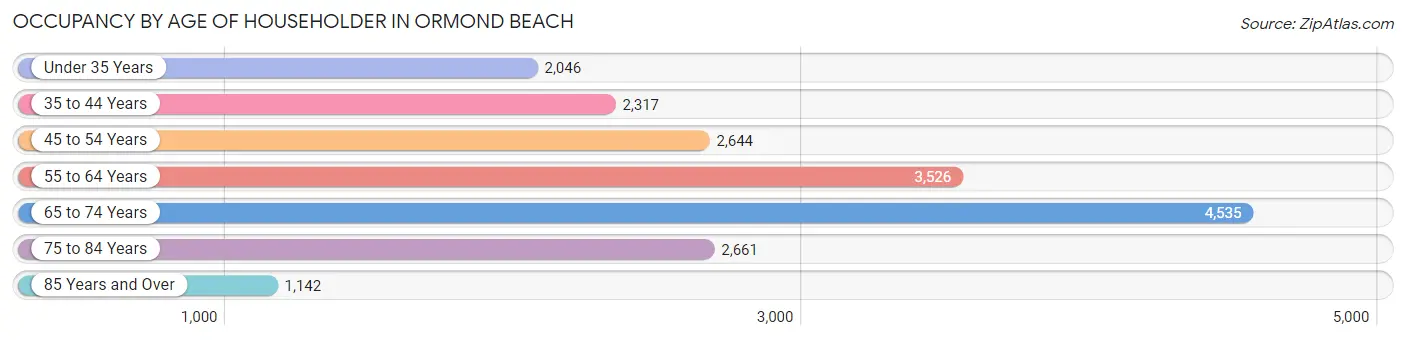
| Age Bracket | # Households | % Households |
| Under 35 Years | 2,046 | 10.8% |
| 35 to 44 Years | 2,317 | 12.3% |
| 45 to 54 Years | 2,644 | 14.0% |
| 55 to 64 Years | 3,526 | 18.7% |
| 65 to 74 Years | 4,535 | 24.0% |
| 75 to 84 Years | 2,661 | 14.1% |
| 85 Years and Over | 1,142 | 6.0% |
| Total | 18,871 | 100.0% |
Housing Finances in Ormond Beach
Median Income by Occupancy in Ormond Beach
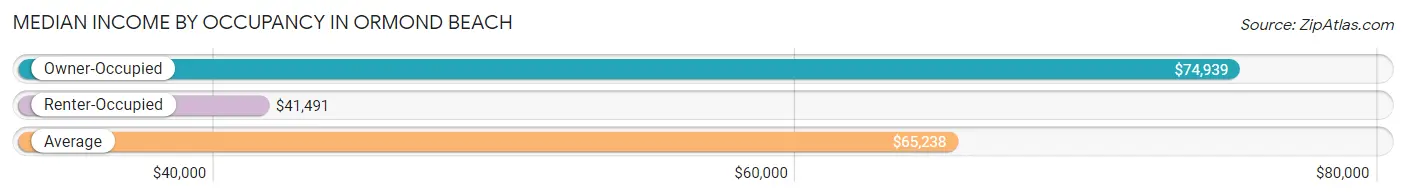
| Occupancy Type | # Households | Median Income |
| Owner-Occupied | 14,351 (76.0%) | $74,939 |
| Renter-Occupied | 4,520 (23.9%) | $41,491 |
| Average | 18,871 (100.0%) | $65,238 |
Occupancy by Householder Income Bracket in Ormond Beach
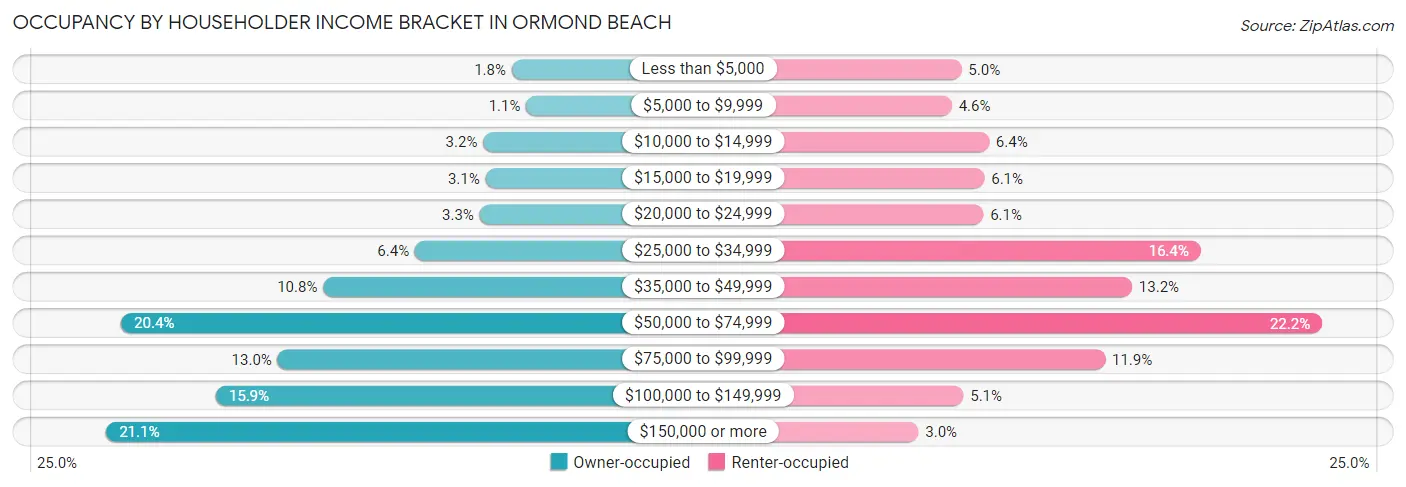
| Income Bracket | Owner-occupied | Renter-occupied |
| Less than $5,000 | 259 (1.8%) | 228 (5.0%) |
| $5,000 to $9,999 | 160 (1.1%) | 207 (4.6%) |
| $10,000 to $14,999 | 454 (3.2%) | 287 (6.4%) |
| $15,000 to $19,999 | 437 (3.0%) | 277 (6.1%) |
| $20,000 to $24,999 | 478 (3.3%) | 275 (6.1%) |
| $25,000 to $34,999 | 920 (6.4%) | 743 (16.4%) |
| $35,000 to $49,999 | 1,547 (10.8%) | 595 (13.2%) |
| $50,000 to $74,999 | 2,928 (20.4%) | 1,004 (22.2%) |
| $75,000 to $99,999 | 1,858 (13.0%) | 537 (11.9%) |
| $100,000 to $149,999 | 2,280 (15.9%) | 232 (5.1%) |
| $150,000 or more | 3,030 (21.1%) | 135 (3.0%) |
| Total | 14,351 (100.0%) | 4,520 (100.0%) |
Monthly Housing Cost Tiers in Ormond Beach
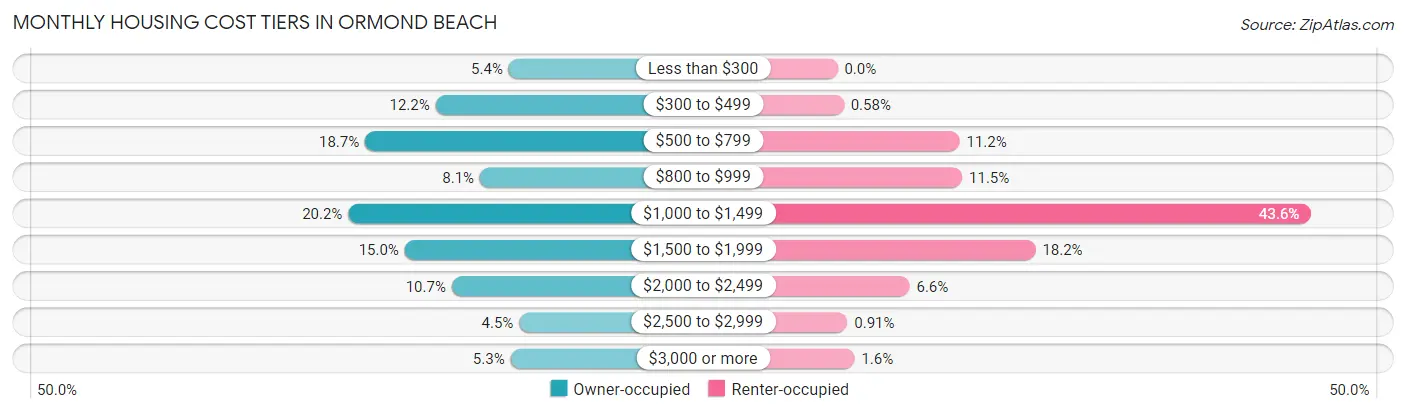
| Monthly Cost | Owner-occupied | Renter-occupied |
| Less than $300 | 779 (5.4%) | 0 (0.0%) |
| $300 to $499 | 1,747 (12.2%) | 26 (0.6%) |
| $500 to $799 | 2,678 (18.7%) | 508 (11.2%) |
| $800 to $999 | 1,160 (8.1%) | 519 (11.5%) |
| $1,000 to $1,499 | 2,901 (20.2%) | 1,971 (43.6%) |
| $1,500 to $1,999 | 2,154 (15.0%) | 824 (18.2%) |
| $2,000 to $2,499 | 1,533 (10.7%) | 300 (6.6%) |
| $2,500 to $2,999 | 642 (4.5%) | 41 (0.9%) |
| $3,000 or more | 757 (5.3%) | 71 (1.6%) |
| Total | 14,351 (100.0%) | 4,520 (100.0%) |
Physical Housing Characteristics in Ormond Beach
Housing Structures in Ormond Beach
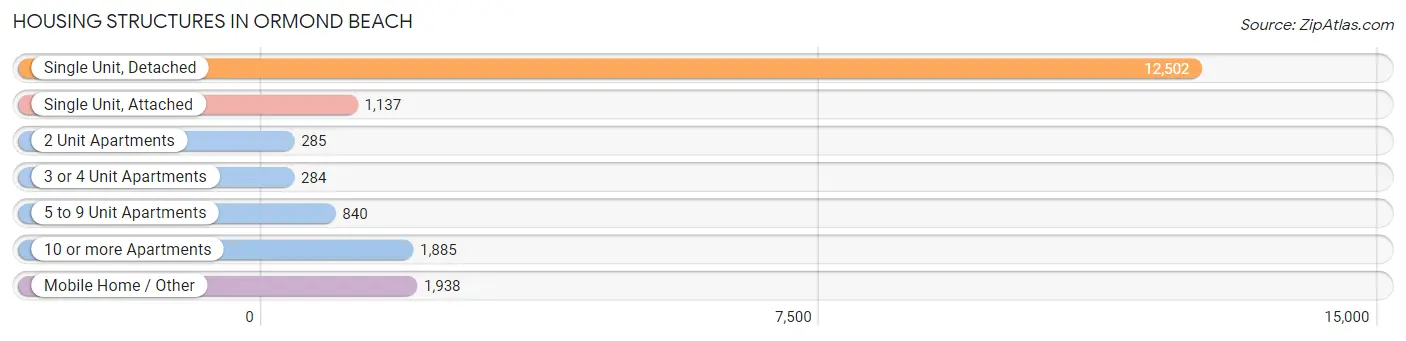
| Structure Type | # Housing Units | % Housing Units |
| Single Unit, Detached | 12,502 | 66.2% |
| Single Unit, Attached | 1,137 | 6.0% |
| 2 Unit Apartments | 285 | 1.5% |
| 3 or 4 Unit Apartments | 284 | 1.5% |
| 5 to 9 Unit Apartments | 840 | 4.4% |
| 10 or more Apartments | 1,885 | 10.0% |
| Mobile Home / Other | 1,938 | 10.3% |
| Total | 18,871 | 100.0% |
Housing Structures by Occupancy in Ormond Beach
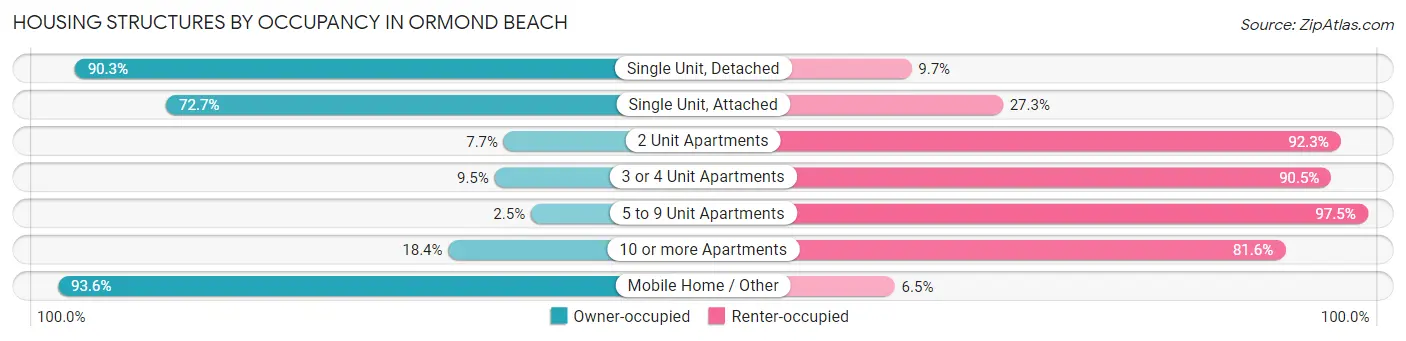
| Structure Type | Owner-occupied | Renter-occupied |
| Single Unit, Detached | 11,294 (90.3%) | 1,208 (9.7%) |
| Single Unit, Attached | 827 (72.7%) | 310 (27.3%) |
| 2 Unit Apartments | 22 (7.7%) | 263 (92.3%) |
| 3 or 4 Unit Apartments | 27 (9.5%) | 257 (90.5%) |
| 5 to 9 Unit Apartments | 21 (2.5%) | 819 (97.5%) |
| 10 or more Apartments | 347 (18.4%) | 1,538 (81.6%) |
| Mobile Home / Other | 1,813 (93.5%) | 125 (6.5%) |
| Total | 14,351 (76.0%) | 4,520 (23.9%) |
Housing Structures by Number of Rooms in Ormond Beach
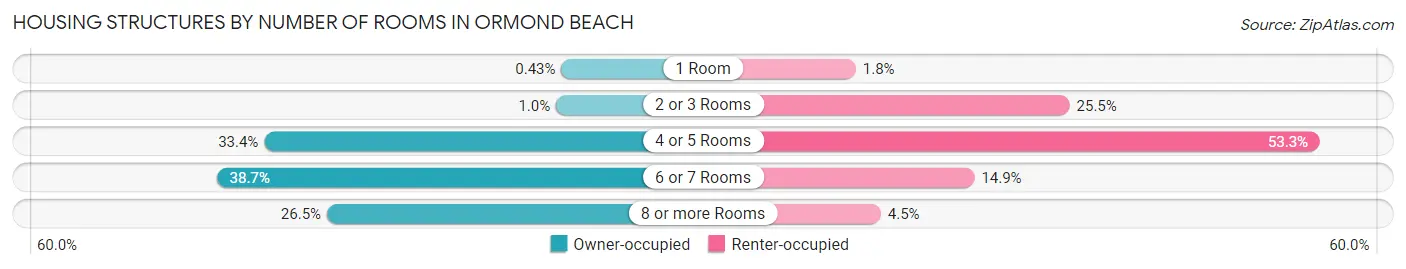
| Number of Rooms | Owner-occupied | Renter-occupied |
| 1 Room | 62 (0.4%) | 80 (1.8%) |
| 2 or 3 Rooms | 147 (1.0%) | 1,152 (25.5%) |
| 4 or 5 Rooms | 4,794 (33.4%) | 2,408 (53.3%) |
| 6 or 7 Rooms | 5,552 (38.7%) | 675 (14.9%) |
| 8 or more Rooms | 3,796 (26.5%) | 205 (4.5%) |
| Total | 14,351 (100.0%) | 4,520 (100.0%) |
Housing Structure by Heating Type in Ormond Beach
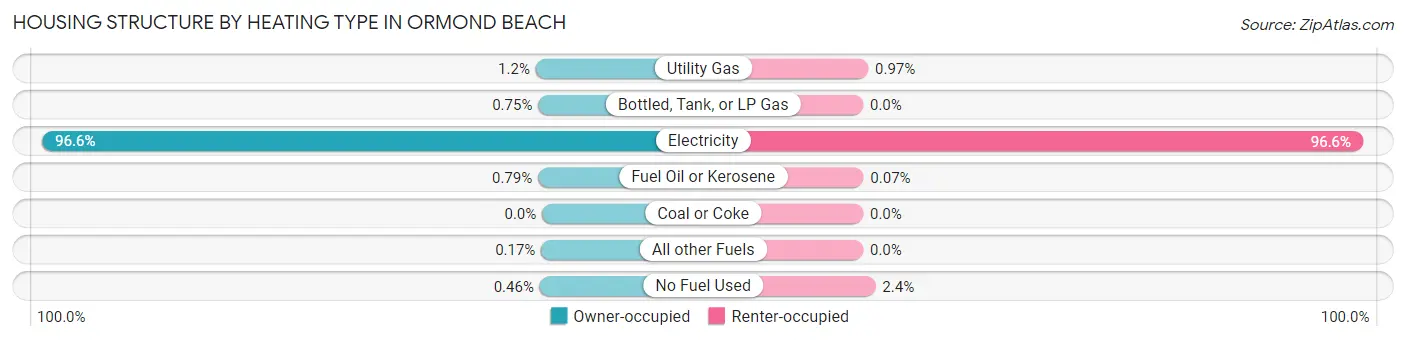
| Heating Type | Owner-occupied | Renter-occupied |
| Utility Gas | 176 (1.2%) | 44 (1.0%) |
| Bottled, Tank, or LP Gas | 107 (0.7%) | 0 (0.0%) |
| Electricity | 13,865 (96.6%) | 4,365 (96.6%) |
| Fuel Oil or Kerosene | 113 (0.8%) | 3 (0.1%) |
| Coal or Coke | 0 (0.0%) | 0 (0.0%) |
| All other Fuels | 24 (0.2%) | 0 (0.0%) |
| No Fuel Used | 66 (0.5%) | 108 (2.4%) |
| Total | 14,351 (100.0%) | 4,520 (100.0%) |
Household Vehicle Usage in Ormond Beach
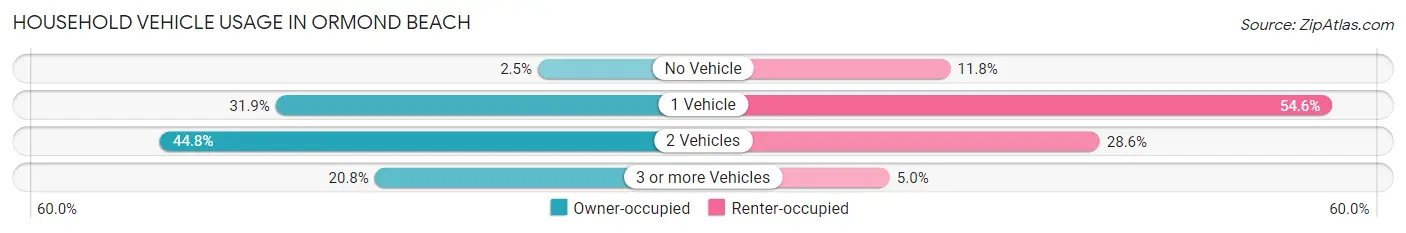
| Vehicles per Household | Owner-occupied | Renter-occupied |
| No Vehicle | 360 (2.5%) | 535 (11.8%) |
| 1 Vehicle | 4,575 (31.9%) | 2,466 (54.6%) |
| 2 Vehicles | 6,432 (44.8%) | 1,291 (28.6%) |
| 3 or more Vehicles | 2,984 (20.8%) | 228 (5.0%) |
| Total | 14,351 (100.0%) | 4,520 (100.0%) |
Real Estate & Mortgages in Ormond Beach
Real Estate and Mortgage Overview in Ormond Beach
| Characteristic | Without Mortgage | With Mortgage |
| Housing Units | 6,823 | 7,528 |
| Median Property Value | $246,900 | $330,500 |
| Median Household Income | $55,644 | $2,126 |
| Monthly Housing Costs | $583 | $704 |
| Real Estate Taxes | $1,983 | $231 |
Property Value by Mortgage Status in Ormond Beach
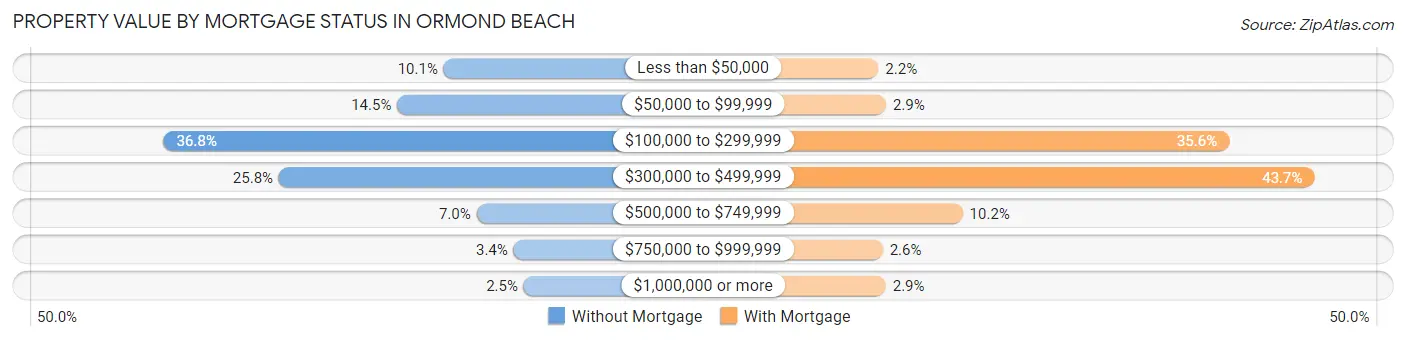
| Property Value | Without Mortgage | With Mortgage |
| Less than $50,000 | 688 (10.1%) | 164 (2.2%) |
| $50,000 to $99,999 | 990 (14.5%) | 218 (2.9%) |
| $100,000 to $299,999 | 2,509 (36.8%) | 2,677 (35.6%) |
| $300,000 to $499,999 | 1,759 (25.8%) | 3,289 (43.7%) |
| $500,000 to $749,999 | 475 (7.0%) | 768 (10.2%) |
| $750,000 to $999,999 | 234 (3.4%) | 195 (2.6%) |
| $1,000,000 or more | 168 (2.5%) | 217 (2.9%) |
| Total | 6,823 (100.0%) | 7,528 (100.0%) |
Household Income by Mortgage Status in Ormond Beach
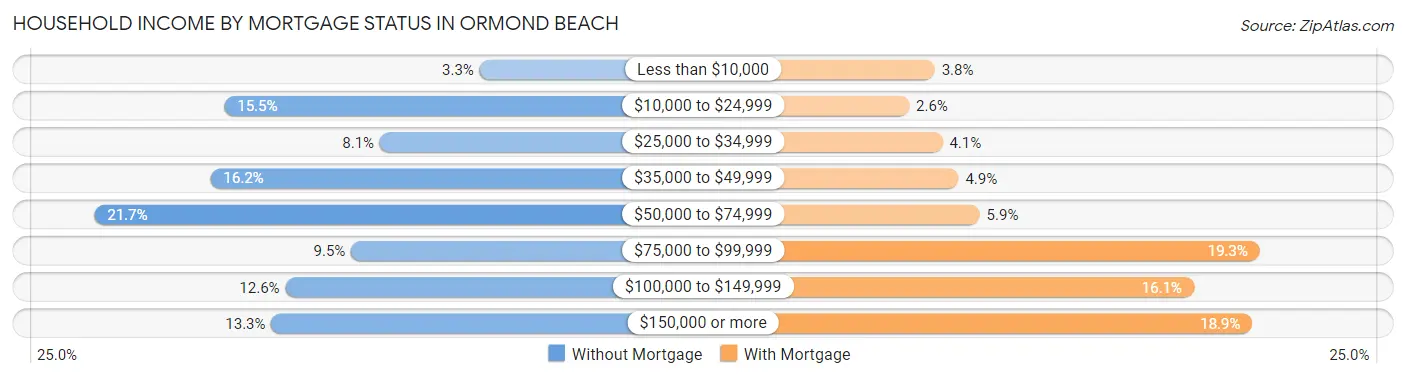
| Household Income | Without Mortgage | With Mortgage |
| Less than $10,000 | 227 (3.3%) | 284 (3.8%) |
| $10,000 to $24,999 | 1,057 (15.5%) | 192 (2.5%) |
| $25,000 to $34,999 | 551 (8.1%) | 312 (4.1%) |
| $35,000 to $49,999 | 1,102 (16.2%) | 369 (4.9%) |
| $50,000 to $74,999 | 1,479 (21.7%) | 445 (5.9%) |
| $75,000 to $99,999 | 645 (9.5%) | 1,449 (19.3%) |
| $100,000 to $149,999 | 858 (12.6%) | 1,213 (16.1%) |
| $150,000 or more | 904 (13.3%) | 1,422 (18.9%) |
| Total | 6,823 (100.0%) | 7,528 (100.0%) |
Property Value to Household Income Ratio in Ormond Beach
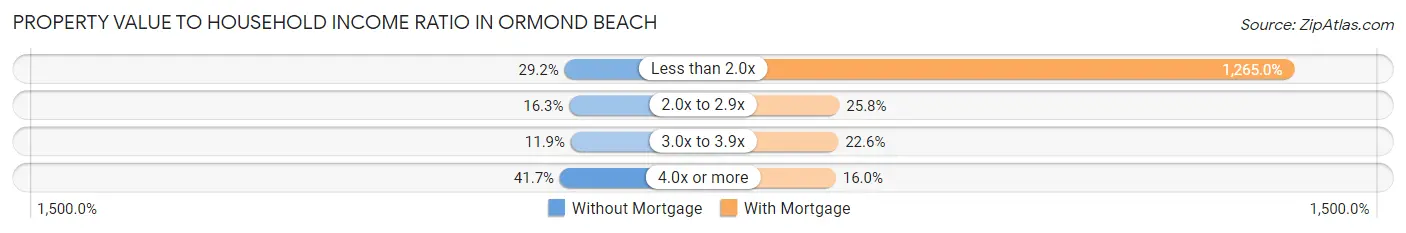
| Value-to-Income Ratio | Without Mortgage | With Mortgage |
| Less than 2.0x | 1,990 (29.2%) | 95,231 (1,265.0%) |
| 2.0x to 2.9x | 1,111 (16.3%) | 1,940 (25.8%) |
| 3.0x to 3.9x | 811 (11.9%) | 1,703 (22.6%) |
| 4.0x or more | 2,848 (41.7%) | 1,207 (16.0%) |
| Total | 6,823 (100.0%) | 7,528 (100.0%) |
Real Estate Taxes by Mortgage Status in Ormond Beach
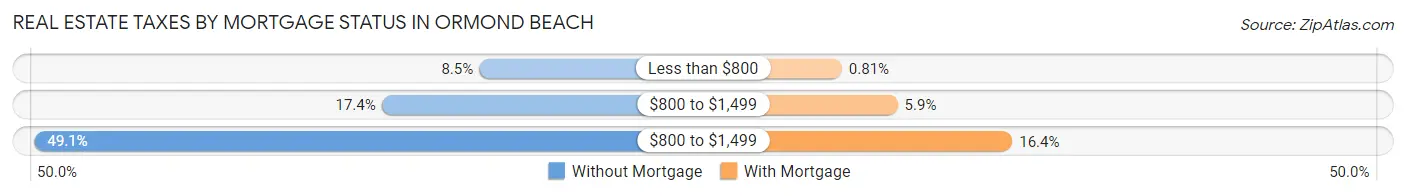
| Property Taxes | Without Mortgage | With Mortgage |
| Less than $800 | 580 (8.5%) | 61 (0.8%) |
| $800 to $1,499 | 1,187 (17.4%) | 444 (5.9%) |
| $800 to $1,499 | 3,350 (49.1%) | 1,232 (16.4%) |
| Total | 6,823 (100.0%) | 7,528 (100.0%) |
Health & Disability in Ormond Beach
Health Insurance Coverage by Age in Ormond Beach
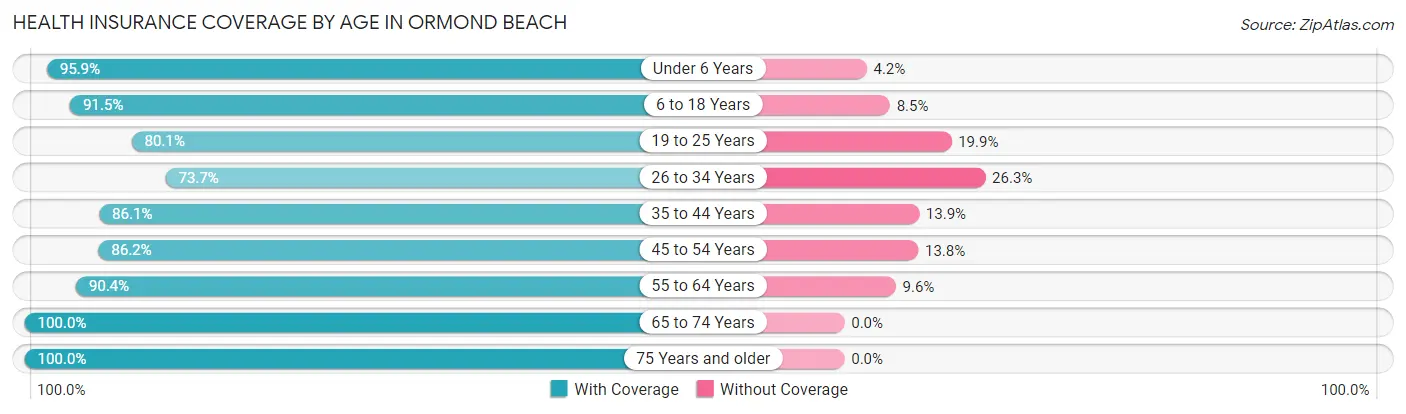
| Age Bracket | With Coverage | Without Coverage |
| Under 6 Years | 2,953 (95.9%) | 128 (4.2%) |
| 6 to 18 Years | 4,442 (91.5%) | 411 (8.5%) |
| 19 to 25 Years | 2,028 (80.1%) | 505 (19.9%) |
| 26 to 34 Years | 2,770 (73.7%) | 987 (26.3%) |
| 35 to 44 Years | 3,477 (86.1%) | 562 (13.9%) |
| 45 to 54 Years | 4,468 (86.2%) | 713 (13.8%) |
| 55 to 64 Years | 5,426 (90.4%) | 574 (9.6%) |
| 65 to 74 Years | 7,097 (100.0%) | 0 (0.0%) |
| 75 Years and older | 5,989 (100.0%) | 0 (0.0%) |
| Total | 38,650 (90.9%) | 3,880 (9.1%) |
Health Insurance Coverage by Citizenship Status in Ormond Beach
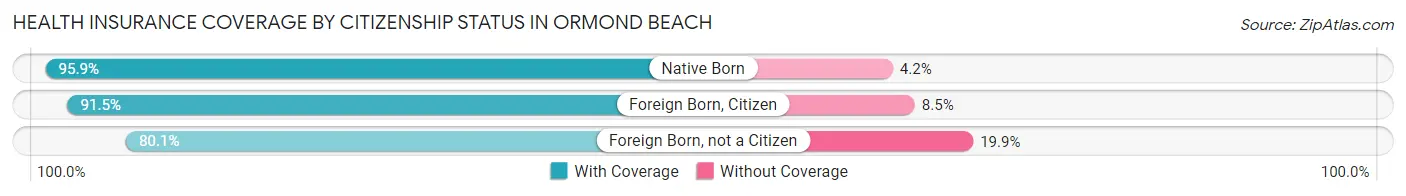
| Citizenship Status | With Coverage | Without Coverage |
| Native Born | 2,953 (95.9%) | 128 (4.2%) |
| Foreign Born, Citizen | 4,442 (91.5%) | 411 (8.5%) |
| Foreign Born, not a Citizen | 2,028 (80.1%) | 505 (19.9%) |
Health Insurance Coverage by Household Income in Ormond Beach
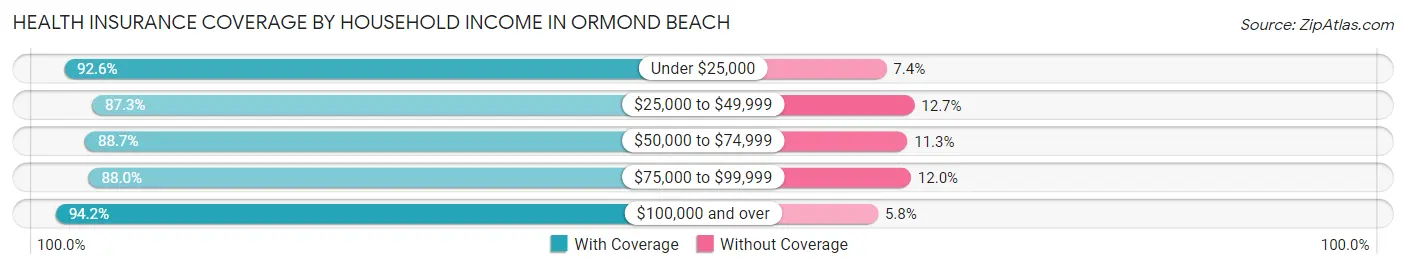
| Household Income | With Coverage | Without Coverage |
| Under $25,000 | 4,377 (92.6%) | 351 (7.4%) |
| $25,000 to $49,999 | 5,965 (87.3%) | 865 (12.7%) |
| $50,000 to $74,999 | 7,427 (88.7%) | 949 (11.3%) |
| $75,000 to $99,999 | 5,284 (88.0%) | 721 (12.0%) |
| $100,000 and over | 15,538 (94.2%) | 963 (5.8%) |
Public vs Private Health Insurance Coverage by Age in Ormond Beach

| Age Bracket | Public Insurance | Private Insurance |
| Under 6 | 1,400 (45.4%) | 1,611 (52.3%) |
| 6 to 18 Years | 1,541 (31.8%) | 3,120 (64.3%) |
| 19 to 25 Years | 196 (7.7%) | 1,858 (73.4%) |
| 25 to 34 Years | 386 (10.3%) | 2,448 (65.2%) |
| 35 to 44 Years | 493 (12.2%) | 3,105 (76.9%) |
| 45 to 54 Years | 515 (9.9%) | 4,297 (82.9%) |
| 55 to 64 Years | 993 (16.6%) | 4,747 (79.1%) |
| 65 to 74 Years | 6,832 (96.3%) | 3,550 (50.0%) |
| 75 Years and over | 5,935 (99.1%) | 3,636 (60.7%) |
| Total | 18,291 (43.0%) | 28,372 (66.7%) |
Disability Status by Sex by Age in Ormond Beach
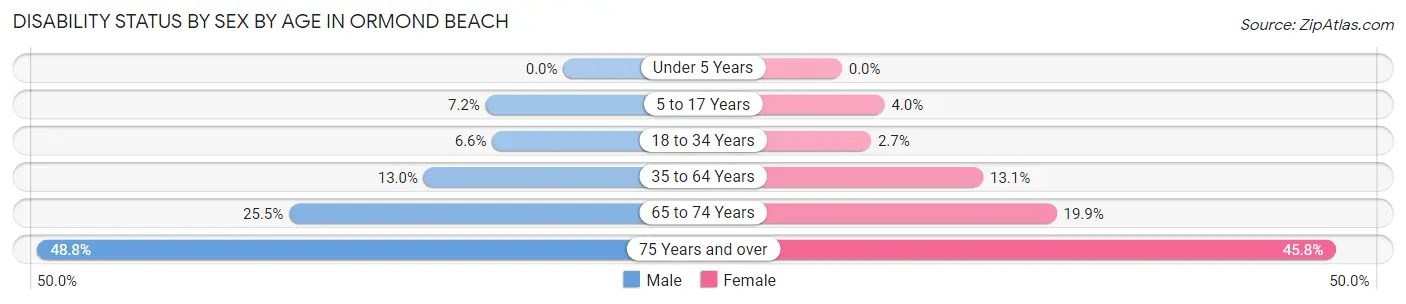
| Age Bracket | Male | Female |
| Under 5 Years | 0 (0.0%) | 0 (0.0%) |
| 5 to 17 Years | 195 (7.2%) | 86 (4.0%) |
| 18 to 34 Years | 207 (6.6%) | 91 (2.7%) |
| 35 to 64 Years | 925 (13.0%) | 1,059 (13.1%) |
| 65 to 74 Years | 852 (25.5%) | 747 (19.9%) |
| 75 Years and over | 1,194 (48.8%) | 1,621 (45.8%) |
Disability Class by Sex by Age in Ormond Beach
Disability Class: Hearing Difficulty
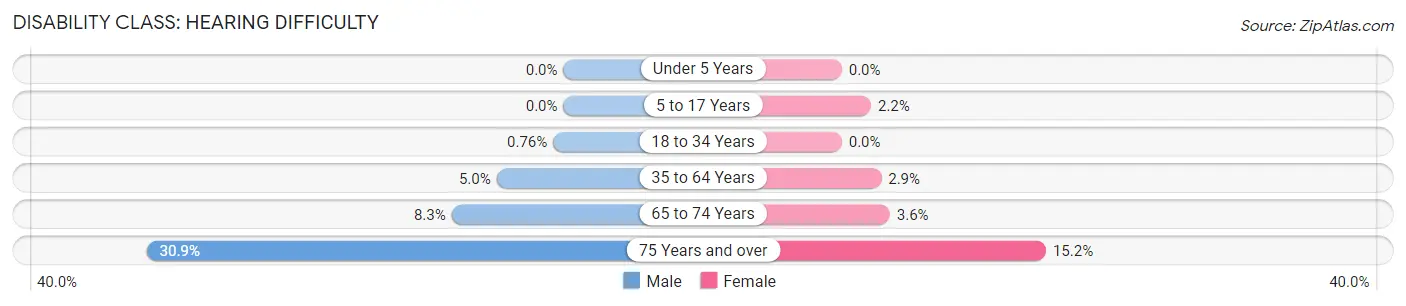
| Age Bracket | Male | Female |
| Under 5 Years | 0 (0.0%) | 0 (0.0%) |
| 5 to 17 Years | 0 (0.0%) | 47 (2.2%) |
| 18 to 34 Years | 24 (0.8%) | 0 (0.0%) |
| 35 to 64 Years | 354 (5.0%) | 237 (2.9%) |
| 65 to 74 Years | 278 (8.3%) | 134 (3.6%) |
| 75 Years and over | 757 (30.9%) | 537 (15.2%) |
Disability Class: Vision Difficulty
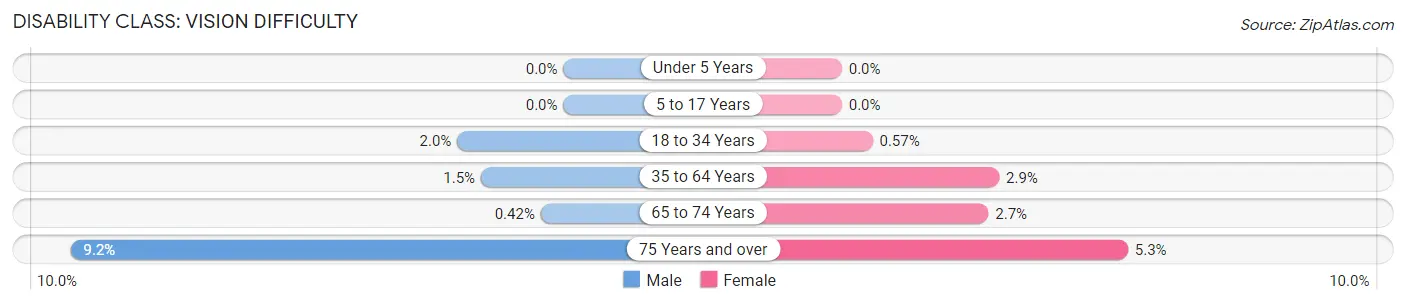
| Age Bracket | Male | Female |
| Under 5 Years | 0 (0.0%) | 0 (0.0%) |
| 5 to 17 Years | 0 (0.0%) | 0 (0.0%) |
| 18 to 34 Years | 62 (2.0%) | 19 (0.6%) |
| 35 to 64 Years | 109 (1.5%) | 236 (2.9%) |
| 65 to 74 Years | 14 (0.4%) | 102 (2.7%) |
| 75 Years and over | 224 (9.1%) | 188 (5.3%) |
Disability Class: Cognitive Difficulty
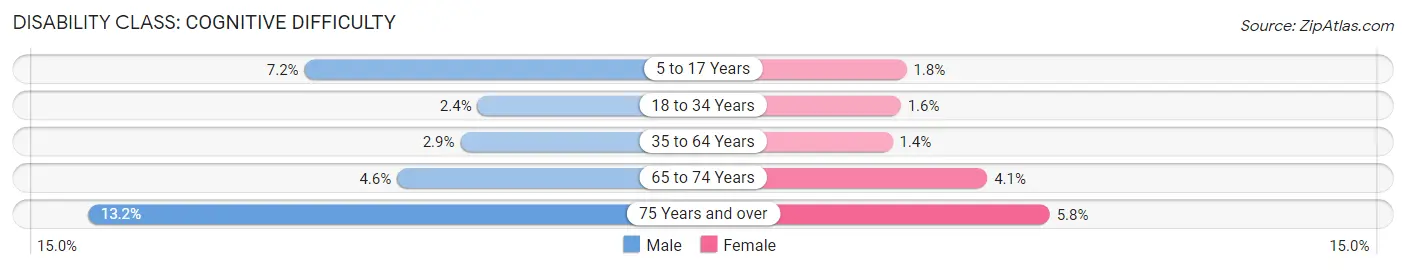
| Age Bracket | Male | Female |
| 5 to 17 Years | 195 (7.2%) | 39 (1.8%) |
| 18 to 34 Years | 75 (2.4%) | 55 (1.6%) |
| 35 to 64 Years | 205 (2.9%) | 114 (1.4%) |
| 65 to 74 Years | 155 (4.6%) | 152 (4.1%) |
| 75 Years and over | 324 (13.2%) | 205 (5.8%) |
Disability Class: Ambulatory Difficulty
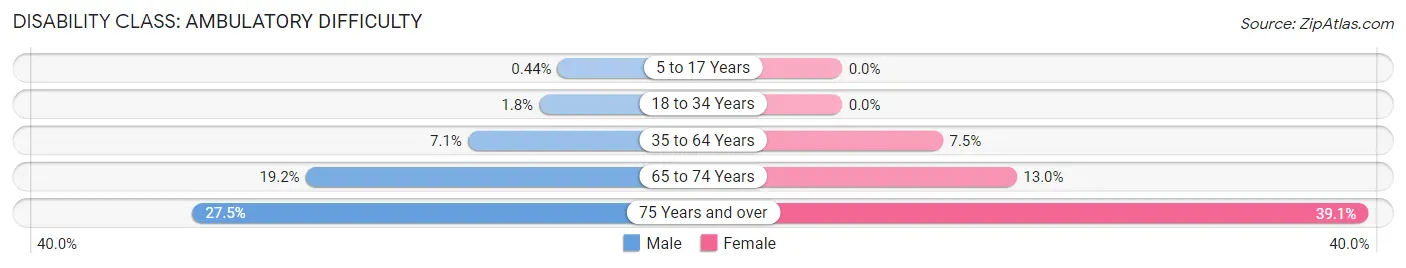
| Age Bracket | Male | Female |
| 5 to 17 Years | 12 (0.4%) | 0 (0.0%) |
| 18 to 34 Years | 57 (1.8%) | 0 (0.0%) |
| 35 to 64 Years | 507 (7.1%) | 604 (7.5%) |
| 65 to 74 Years | 641 (19.2%) | 486 (13.0%) |
| 75 Years and over | 674 (27.5%) | 1,384 (39.1%) |
Disability Class: Self-Care Difficulty
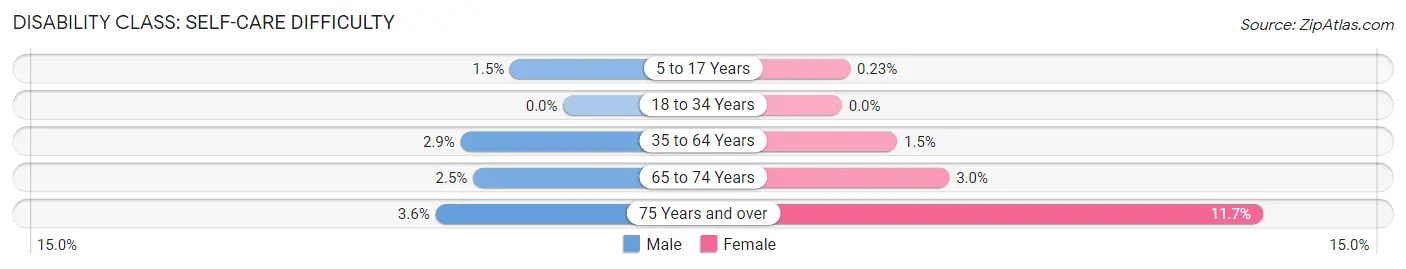
| Age Bracket | Male | Female |
| 5 to 17 Years | 40 (1.5%) | 5 (0.2%) |
| 18 to 34 Years | 0 (0.0%) | 0 (0.0%) |
| 35 to 64 Years | 204 (2.9%) | 124 (1.5%) |
| 65 to 74 Years | 84 (2.5%) | 112 (3.0%) |
| 75 Years and over | 87 (3.6%) | 415 (11.7%) |
Technology Access in Ormond Beach
Computing Device Access in Ormond Beach
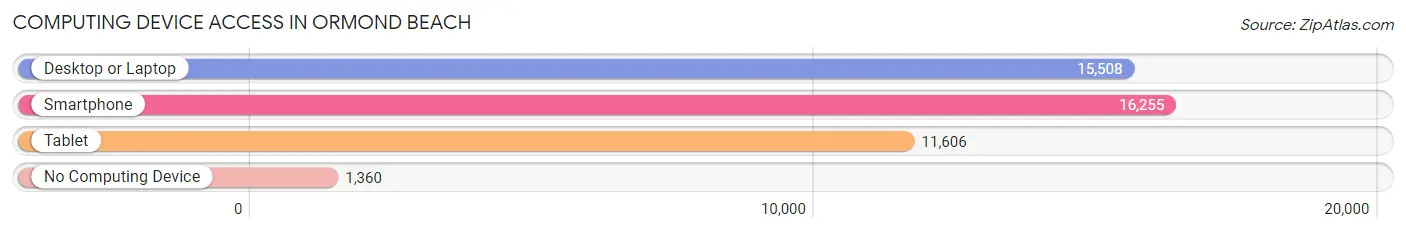
| Device Type | # Households | % Households |
| Desktop or Laptop | 15,508 | 82.2% |
| Smartphone | 16,255 | 86.1% |
| Tablet | 11,606 | 61.5% |
| No Computing Device | 1,360 | 7.2% |
| Total | 18,871 | 100.0% |
Internet Access in Ormond Beach
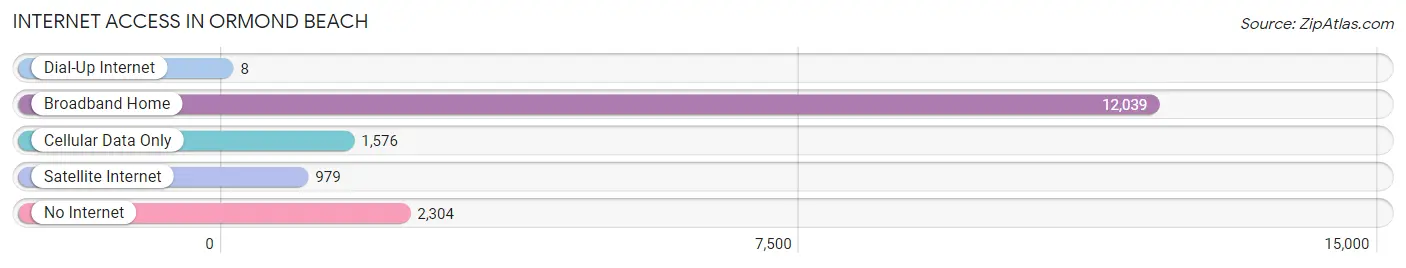
| Internet Type | # Households | % Households |
| Dial-Up Internet | 8 | 0.0% |
| Broadband Home | 12,039 | 63.8% |
| Cellular Data Only | 1,576 | 8.4% |
| Satellite Internet | 979 | 5.2% |
| No Internet | 2,304 | 12.2% |
| Total | 18,871 | 100.0% |
Ormond Beach Summary
Ormond Beach is a city located in Volusia County, Florida, United States. It is situated on the Atlantic Ocean, just north of Daytona Beach. The city is known for its beautiful beaches, historic sites, and its proximity to the Daytona International Speedway. As of the 2010 census, the population of Ormond Beach was 38,137.
Geography
Ormond Beach is located in east-central Florida, approximately 25 miles north of Daytona Beach and about 60 miles northeast of Orlando. The city is situated on the Atlantic Ocean, with the Halifax River forming its western boundary. The city covers an area of approximately 24 square miles, with a population density of 1,567 people per square mile.
Climate
Ormond Beach has a humid subtropical climate, with hot, humid summers and mild winters. The average annual temperature is 73.2°F, with an average high of 81.3°F in July and an average low of 63.2°F in January. The average annual precipitation is 51.2 inches, with the wettest month being August, when an average of 6.7 inches of rain falls.
Demographics
As of the 2010 census, there were 38,137 people, 16,845 households, and 10,845 families residing in the city. The population density was 1,567 people per square mile. The racial makeup of the city was 87.2% White, 8.2% African American, 0.4% Native American, 1.3% Asian, 0.1% Pacific Islander, 1.2% from other races, and 1.6% from two or more races. Hispanic or Latino of any race were 5.2% of the population.
Economy
Ormond Beach is home to a variety of businesses, including retail stores, restaurants, and professional services. The city is also home to several large employers, including Florida Hospital Memorial Medical Center, Halifax Health, and the Daytona International Speedway. The city's economy is also supported by tourism, with visitors coming to the area to enjoy the beaches, historic sites, and other attractions.
History
Ormond Beach was first settled in the late 1800s by settlers from the British Isles. The city was named after James Ormond, a prominent local landowner. In the early 1900s, the city became a popular winter resort destination for wealthy northerners. The city was incorporated in 1920, and in the following decades, the city's population grew steadily. In the 1950s, the city began to develop its tourism industry, and in the 1960s, the city was home to the first Daytona 500 race. Today, Ormond Beach is a popular destination for tourists and locals alike, offering a variety of attractions and activities.
Common Questions
What is Per Capita Income in Ormond Beach?
Per Capita income in Ormond Beach is $42,899.
What is the Median Family Income in Ormond Beach?
Median Family Income in Ormond Beach is $82,969.
What is the Median Household income in Ormond Beach?
Median Household Income in Ormond Beach is $65,238.
What is Income or Wage Gap in Ormond Beach?
Income or Wage Gap in Ormond Beach is 23.5%.
Women in Ormond Beach earn 76.5 cents for every dollar earned by a man.
What is Family Income Deficit in Ormond Beach?
Family Income Deficit in Ormond Beach is $9,951.
Families that are below poverty line in Ormond Beach earn $9,951 less on average than the poverty threshold level.
What is Inequality or Gini Index in Ormond Beach?
Inequality or Gini Index in Ormond Beach is 0.49.
What is the Total Population of Ormond Beach?
Total Population of Ormond Beach is 43,127.
What is the Total Male Population of Ormond Beach?
Total Male Population of Ormond Beach is 20,455.
What is the Total Female Population of Ormond Beach?
Total Female Population of Ormond Beach is 22,672.
What is the Ratio of Males per 100 Females in Ormond Beach?
There are 90.22 Males per 100 Females in Ormond Beach.
What is the Ratio of Females per 100 Males in Ormond Beach?
There are 110.84 Females per 100 Males in Ormond Beach.
What is the Median Population Age in Ormond Beach?
Median Population Age in Ormond Beach is 51.9 Years.
What is the Average Family Size in Ormond Beach
Average Family Size in Ormond Beach is 2.8 People.
What is the Average Household Size in Ormond Beach
Average Household Size in Ormond Beach is 2.2 People.
How Large is the Labor Force in Ormond Beach?
There are 19,250 People in the Labor Forcein in Ormond Beach.
What is the Percentage of People in the Labor Force in Ormond Beach?
53.3% of People are in the Labor Force in Ormond Beach.
What is the Unemployment Rate in Ormond Beach?
Unemployment Rate in Ormond Beach is 2.4%.