Niles, IL Map & Demographics
Niles Map
Niles Overview
$39,419
PER CAPITA INCOME
$95,719
AVG FAMILY INCOME
$75,783
AVG HOUSEHOLD INCOME
20.1%
WAGE / INCOME GAP [ % ]
79.9¢/ $1
WAGE / INCOME GAP [ $ ]
0.47
INEQUALITY / GINI INDEX
30,637
TOTAL POPULATION
15,125
MALE POPULATION
15,512
FEMALE POPULATION
97.51
MALES / 100 FEMALES
102.56
FEMALES / 100 MALES
47.1
MEDIAN AGE
3.2
AVG FAMILY SIZE
2.6
AVG HOUSEHOLD SIZE
15,179
LABOR FORCE [ PEOPLE ]
58.8%
PERCENT IN LABOR FORCE
6.2%
UNEMPLOYMENT RATE
Niles Zip Codes
Income in Niles
Income Overview in Niles
Per Capita Income in Niles is $39,419, while median incomes of families and households are $95,719 and $75,783 respectively.
| Characteristic | Number | Measure |
| Per Capita Income | 30,637 | $39,419 |
| Median Family Income | 7,662 | $95,719 |
| Mean Family Income | 7,662 | $126,956 |
| Median Household Income | 11,332 | $75,783 |
| Mean Household Income | 11,332 | $105,150 |
| Income Deficit | 7,662 | $0 |
| Wage / Income Gap (%) | 30,637 | 20.07% |
| Wage / Income Gap ($) | 30,637 | 79.93¢ per $1 |
| Gini / Inequality Index | 30,637 | 0.47 |
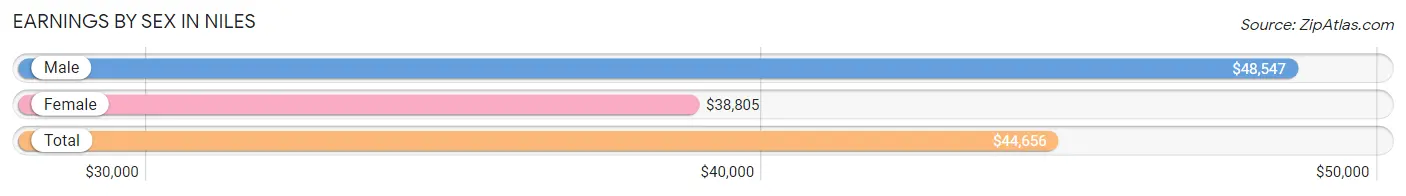
Earnings by Sex in Niles
Average Earnings in Niles are $44,656, $48,547 for men and $38,805 for women, a difference of 20.1%.
| Sex | Number | Average Earnings |
| Male | 8,582 (54.1%) | $48,547 |
| Female | 7,267 (45.9%) | $38,805 |
| Total | 15,849 (100.0%) | $44,656 |
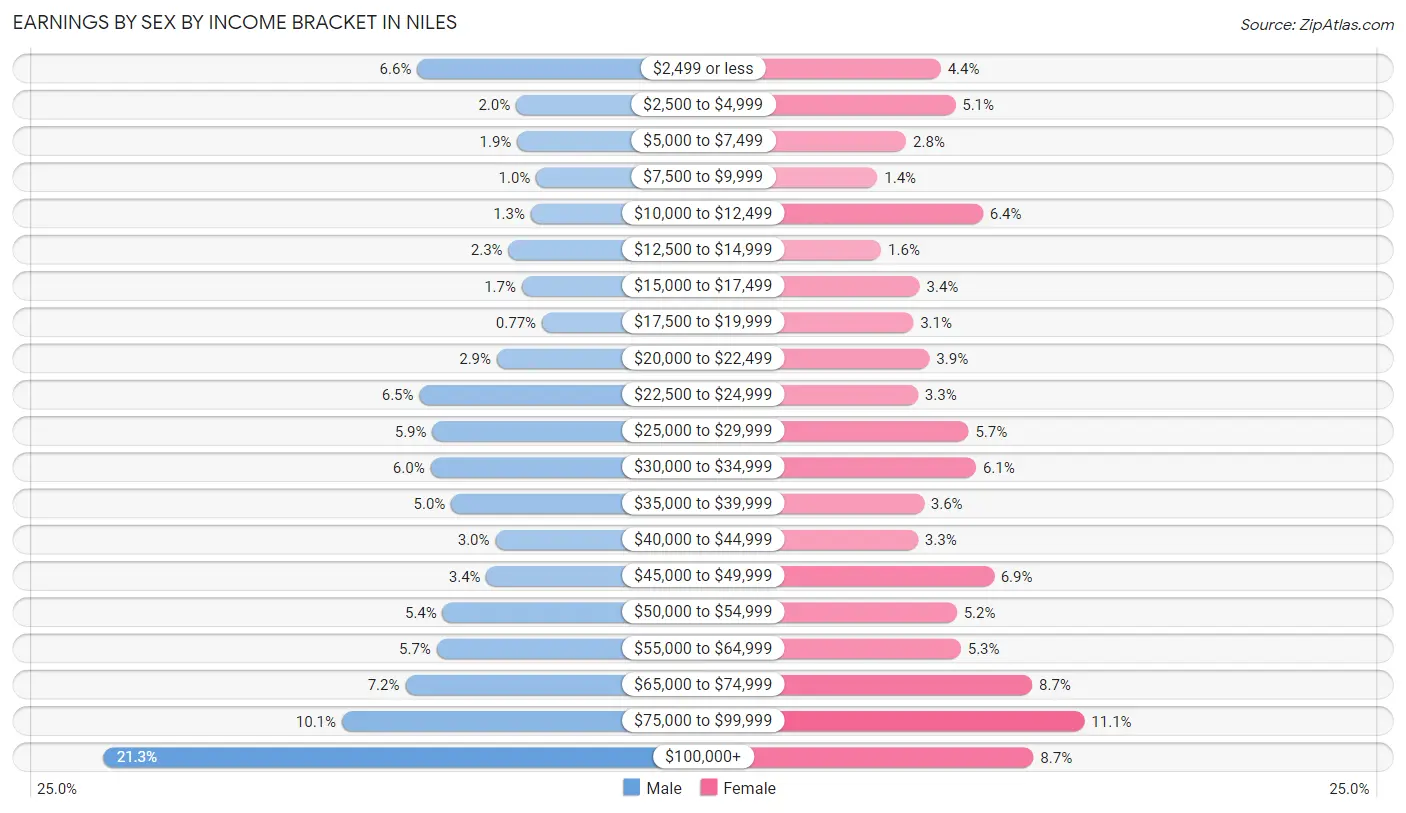
Earnings by Sex by Income Bracket in Niles
The most common earnings brackets in Niles are $100,000+ for men (1,827 | 21.3%) and $75,000 to $99,999 for women (809 | 11.1%).
| Income | Male | Female |
| $2,499 or less | 567 (6.6%) | 320 (4.4%) |
| $2,500 to $4,999 | 170 (2.0%) | 369 (5.1%) |
| $5,000 to $7,499 | 166 (1.9%) | 202 (2.8%) |
| $7,500 to $9,999 | 89 (1.0%) | 104 (1.4%) |
| $10,000 to $12,499 | 111 (1.3%) | 463 (6.4%) |
| $12,500 to $14,999 | 201 (2.3%) | 117 (1.6%) |
| $15,000 to $17,499 | 147 (1.7%) | 248 (3.4%) |
| $17,500 to $19,999 | 66 (0.8%) | 226 (3.1%) |
| $20,000 to $22,499 | 247 (2.9%) | 281 (3.9%) |
| $22,500 to $24,999 | 559 (6.5%) | 242 (3.3%) |
| $25,000 to $29,999 | 506 (5.9%) | 414 (5.7%) |
| $30,000 to $34,999 | 514 (6.0%) | 440 (6.0%) |
| $35,000 to $39,999 | 431 (5.0%) | 262 (3.6%) |
| $40,000 to $44,999 | 253 (2.9%) | 242 (3.3%) |
| $45,000 to $49,999 | 289 (3.4%) | 500 (6.9%) |
| $50,000 to $54,999 | 465 (5.4%) | 374 (5.1%) |
| $55,000 to $64,999 | 489 (5.7%) | 388 (5.3%) |
| $65,000 to $74,999 | 615 (7.2%) | 631 (8.7%) |
| $75,000 to $99,999 | 870 (10.1%) | 809 (11.1%) |
| $100,000+ | 1,827 (21.3%) | 635 (8.7%) |
| Total | 8,582 (100.0%) | 7,267 (100.0%) |
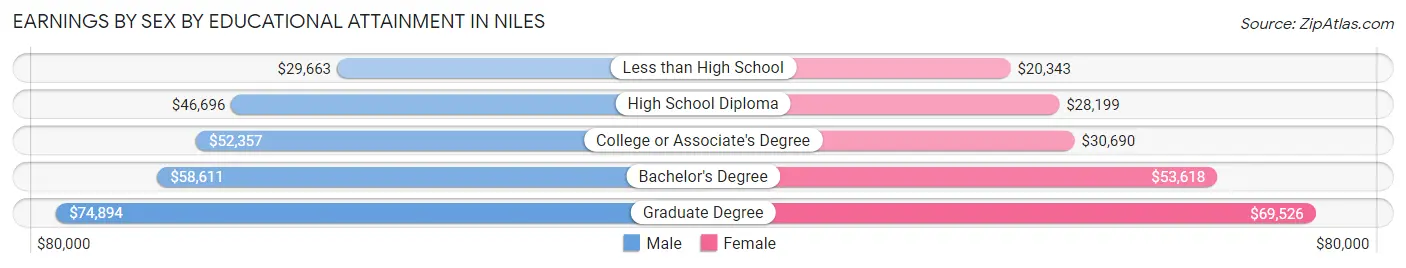
Earnings by Sex by Educational Attainment in Niles
Average earnings in Niles are $53,398 for men and $45,027 for women, a difference of 15.7%. Men with an educational attainment of graduate degree enjoy the highest average annual earnings of $74,894, while those with less than high school education earn the least with $29,663. Women with an educational attainment of graduate degree earn the most with the average annual earnings of $69,526, while those with less than high school education have the smallest earnings of $20,343.
| Educational Attainment | Male Income | Female Income |
| Less than High School | $29,663 | $20,343 |
| High School Diploma | $46,696 | $28,199 |
| College or Associate's Degree | $52,357 | $30,690 |
| Bachelor's Degree | $58,611 | $53,618 |
| Graduate Degree | $74,894 | $69,526 |
| Total | $53,398 | $45,027 |
Family Income in Niles
Family Income Brackets in Niles
According to the Niles family income data, there are 1,433 families falling into the $100,000 to $149,999 income range, which is the most common income bracket and makes up 18.7% of all families. Conversely, the $10,000 to $14,999 income bracket is the least frequent group with only 38 families (0.5%) belonging to this category.
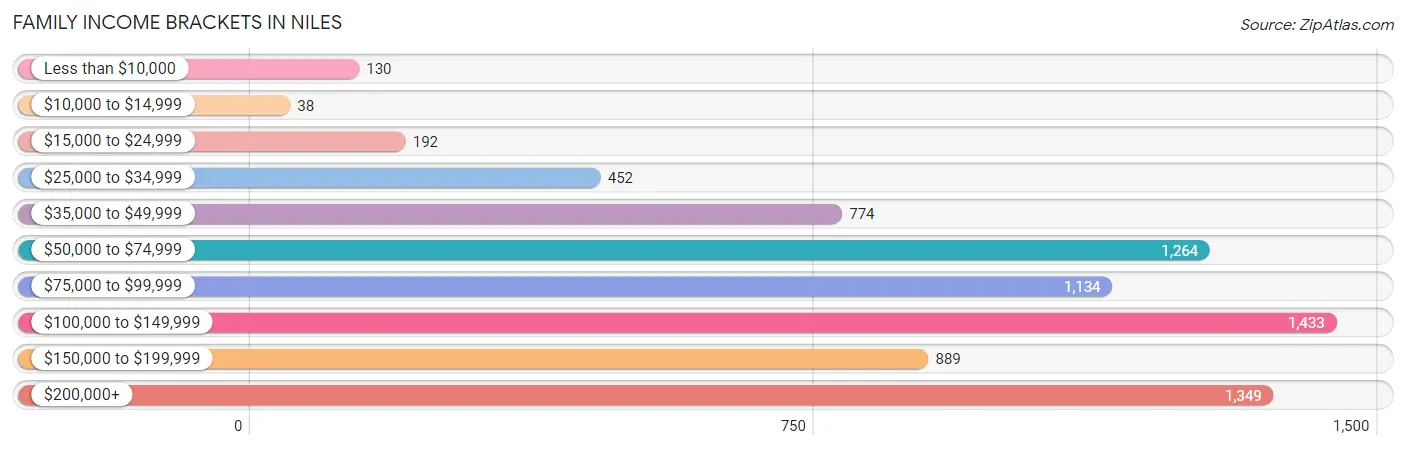
| Income Bracket | # Families | % Families |
| Less than $10,000 | 130 | 1.7% |
| $10,000 to $14,999 | 38 | 0.5% |
| $15,000 to $24,999 | 192 | 2.5% |
| $25,000 to $34,999 | 452 | 5.9% |
| $35,000 to $49,999 | 774 | 10.1% |
| $50,000 to $74,999 | 1,264 | 16.5% |
| $75,000 to $99,999 | 1,134 | 14.8% |
| $100,000 to $149,999 | 1,433 | 18.7% |
| $150,000 to $199,999 | 889 | 11.6% |
| $200,000+ | 1,349 | 17.6% |
Family Income by Famaliy Size in Niles
5-person families (851 | 11.1%) account for the highest median family income in Niles with $176,250 per family, while 2-person families (2,849 | 37.2%) have the highest median income of $40,348 per family member.
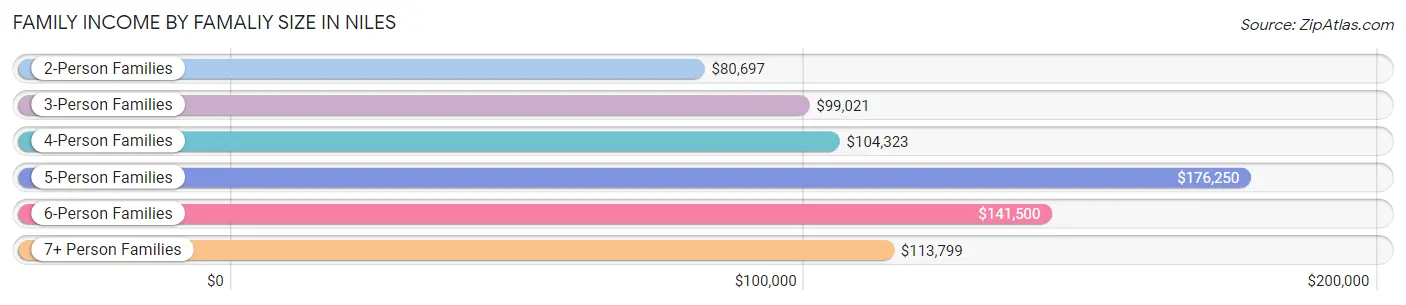
| Income Bracket | # Families | Median Income |
| 2-Person Families | 2,849 (37.2%) | $80,697 |
| 3-Person Families | 1,931 (25.2%) | $99,021 |
| 4-Person Families | 1,601 (20.9%) | $104,323 |
| 5-Person Families | 851 (11.1%) | $176,250 |
| 6-Person Families | 178 (2.3%) | $141,500 |
| 7+ Person Families | 252 (3.3%) | $113,799 |
| Total | 7,662 (100.0%) | $95,719 |
Family Income by Number of Earners in Niles
The median family income in Niles is $95,719, with families comprising 3+ earners (1,456) having the highest median family income of $194,250, while families with no earners (1,096) have the lowest median family income of $50,548, accounting for 19.0% and 14.3% of families, respectively.
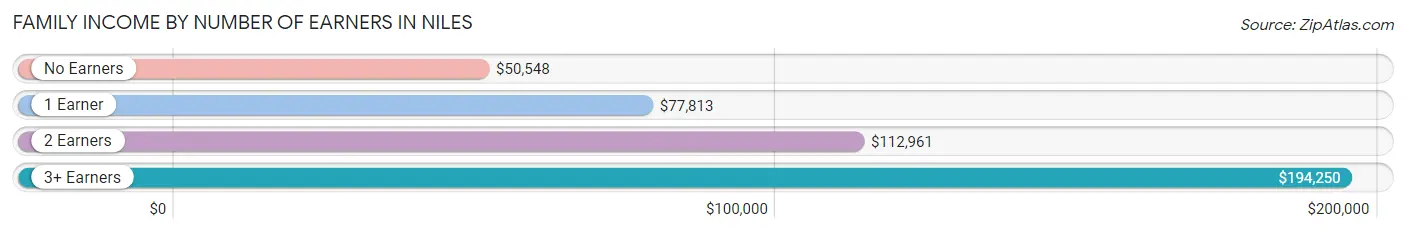
| Number of Earners | # Families | Median Income |
| No Earners | 1,096 (14.3%) | $50,548 |
| 1 Earner | 1,732 (22.6%) | $77,813 |
| 2 Earners | 3,378 (44.1%) | $112,961 |
| 3+ Earners | 1,456 (19.0%) | $194,250 |
| Total | 7,662 (100.0%) | $95,719 |
Household Income in Niles
Household Income Brackets in Niles
With 1,711 households falling in the category, the $50,000 to $74,999 income range is the most frequent in Niles, accounting for 15.1% of all households. In contrast, only 238 households (2.1%) fall into the $10,000 to $14,999 income bracket, making it the least populous group.
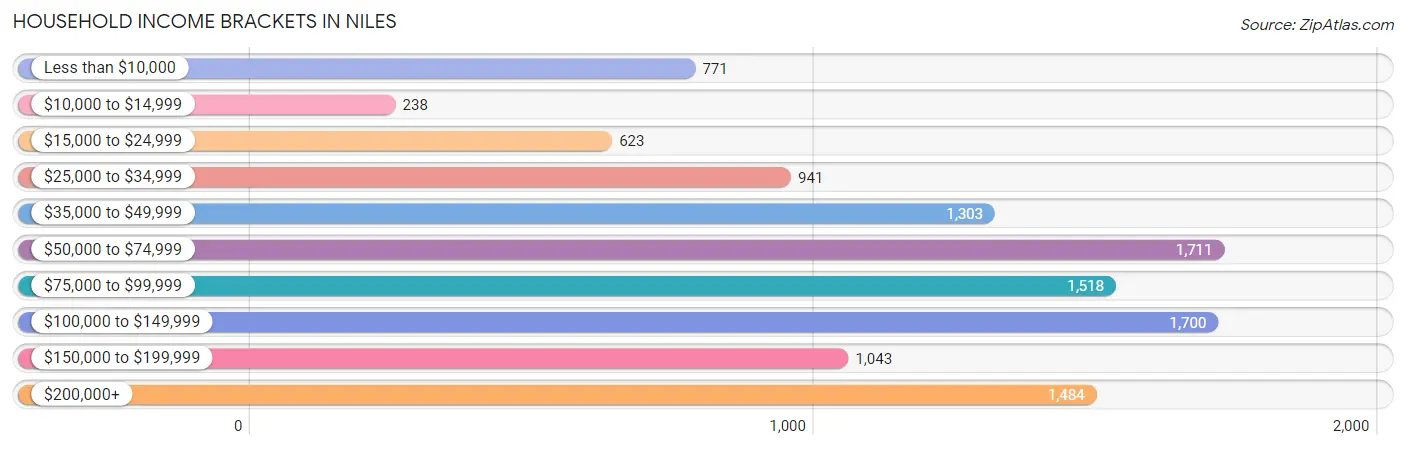
| Income Bracket | # Households | % Households |
| Less than $10,000 | 771 | 6.8% |
| $10,000 to $14,999 | 238 | 2.1% |
| $15,000 to $24,999 | 623 | 5.5% |
| $25,000 to $34,999 | 941 | 8.3% |
| $35,000 to $49,999 | 1,303 | 11.5% |
| $50,000 to $74,999 | 1,711 | 15.1% |
| $75,000 to $99,999 | 1,518 | 13.4% |
| $100,000 to $149,999 | 1,700 | 15.0% |
| $150,000 to $199,999 | 1,043 | 9.2% |
| $200,000+ | 1,484 | 13.1% |
Household Income by Householder Age in Niles
The median household income in Niles is $75,783, with the highest median household income of $91,782 found in the 25 to 44 years age bracket for the primary householder. A total of 2,827 households (24.9%) fall into this category. Meanwhile, the 15 to 24 years age bracket for the primary householder has the lowest median household income of $0, with 138 households (1.2%) in this group.
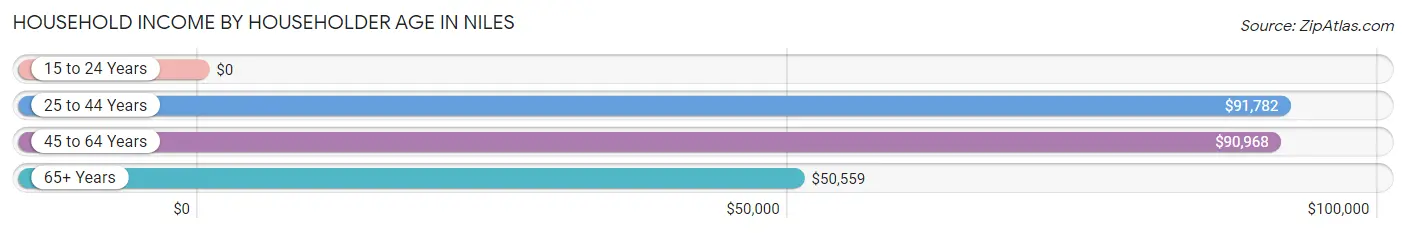
| Income Bracket | # Households | Median Income |
| 15 to 24 Years | 138 (1.2%) | $0 |
| 25 to 44 Years | 2,827 (24.9%) | $91,782 |
| 45 to 64 Years | 3,712 (32.8%) | $90,968 |
| 65+ Years | 4,655 (41.1%) | $50,559 |
| Total | 11,332 (100.0%) | $75,783 |
Poverty in Niles
Income Below Poverty by Sex and Age in Niles
With 6.0% poverty level for males and 9.3% for females among the residents of Niles, 15 year old males and 15 year old females are the most vulnerable to poverty, with 77 males (25.2%) and 64 females (34.0%) in their respective age groups living below the poverty level.
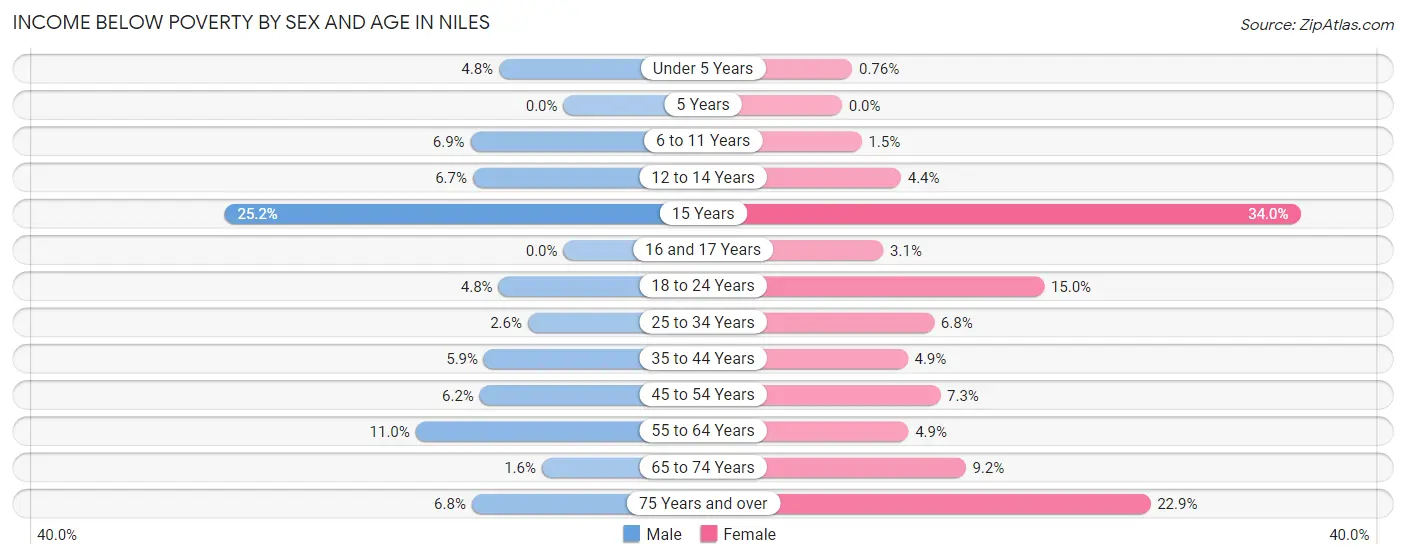
| Age Bracket | Male | Female |
| Under 5 Years | 31 (4.8%) | 6 (0.8%) |
| 5 Years | 0 (0.0%) | 0 (0.0%) |
| 6 to 11 Years | 73 (6.9%) | 13 (1.5%) |
| 12 to 14 Years | 24 (6.7%) | 13 (4.4%) |
| 15 Years | 77 (25.2%) | 64 (34.0%) |
| 16 and 17 Years | 0 (0.0%) | 7 (3.1%) |
| 18 to 24 Years | 50 (4.8%) | 127 (15.0%) |
| 25 to 34 Years | 45 (2.6%) | 119 (6.8%) |
| 35 to 44 Years | 124 (5.9%) | 90 (4.9%) |
| 45 to 54 Years | 124 (6.2%) | 119 (7.3%) |
| 55 to 64 Years | 193 (11.0%) | 110 (4.9%) |
| 65 to 74 Years | 25 (1.6%) | 149 (9.2%) |
| 75 Years and over | 99 (6.8%) | 575 (22.9%) |
| Total | 865 (6.0%) | 1,392 (9.3%) |
Income Above Poverty by Sex and Age in Niles
According to the poverty statistics in Niles, males aged 5 years and females aged 5 years are the age groups that are most secure financially, with 100.0% of males and 100.0% of females in these age groups living above the poverty line.
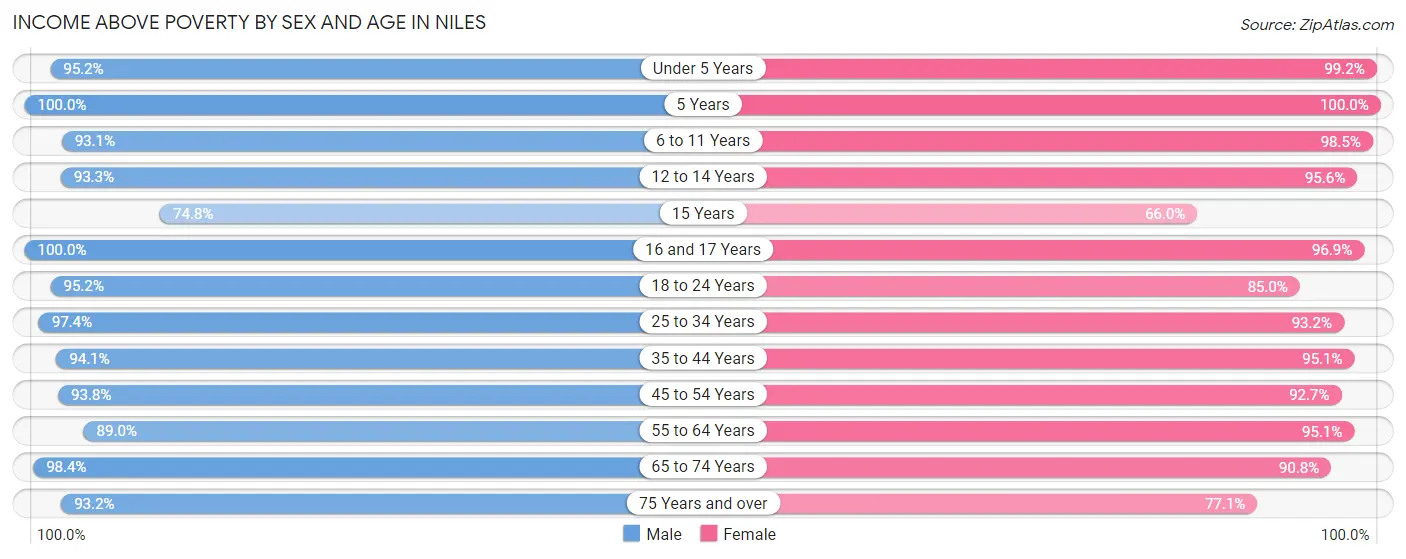
| Age Bracket | Male | Female |
| Under 5 Years | 617 (95.2%) | 785 (99.2%) |
| 5 Years | 198 (100.0%) | 71 (100.0%) |
| 6 to 11 Years | 985 (93.1%) | 878 (98.5%) |
| 12 to 14 Years | 333 (93.3%) | 284 (95.6%) |
| 15 Years | 229 (74.8%) | 124 (66.0%) |
| 16 and 17 Years | 317 (100.0%) | 221 (96.9%) |
| 18 to 24 Years | 987 (95.2%) | 719 (85.0%) |
| 25 to 34 Years | 1,662 (97.4%) | 1,620 (93.2%) |
| 35 to 44 Years | 1,976 (94.1%) | 1,756 (95.1%) |
| 45 to 54 Years | 1,874 (93.8%) | 1,511 (92.7%) |
| 55 to 64 Years | 1,566 (89.0%) | 2,121 (95.1%) |
| 65 to 74 Years | 1,536 (98.4%) | 1,474 (90.8%) |
| 75 Years and over | 1,356 (93.2%) | 1,936 (77.1%) |
| Total | 13,636 (94.0%) | 13,500 (90.6%) |
Income Below Poverty Among Married-Couple Families in Niles
The poverty statistics for married-couple families in Niles show that 5.5% or 334 of the total 6,099 families live below the poverty line. Families with 1 or 2 children have the highest poverty rate of 5.9%, comprising of 145 families. On the other hand, families with 3 or 4 children have the lowest poverty rate of 0.0%, which includes 0 families.
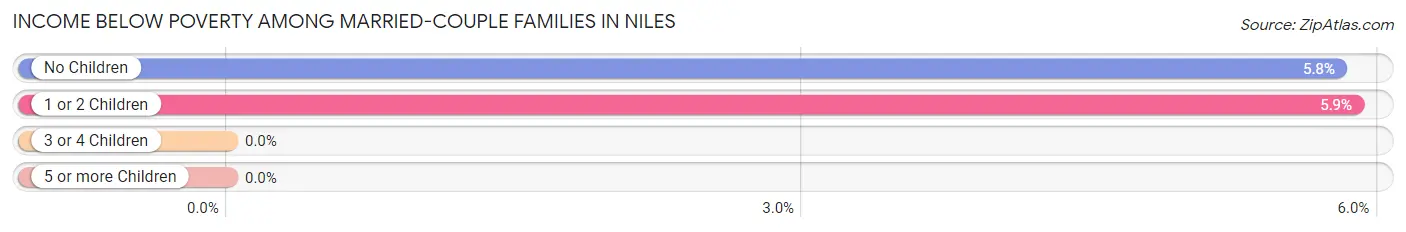
| Children | Above Poverty | Below Poverty |
| No Children | 3,078 (94.2%) | 189 (5.8%) |
| 1 or 2 Children | 2,322 (94.1%) | 145 (5.9%) |
| 3 or 4 Children | 350 (100.0%) | 0 (0.0%) |
| 5 or more Children | 15 (100.0%) | 0 (0.0%) |
| Total | 5,765 (94.5%) | 334 (5.5%) |
Income Below Poverty Among Single-Parent Households in Niles
According to the poverty data in Niles, 3.8% or 21 single-father households and 3.5% or 36 single-mother households are living below the poverty line. Among single-father households, those with 1 or 2 children have the highest poverty rate, with 7 households (4.5%) experiencing poverty. Likewise, among single-mother households, those with 1 or 2 children have the highest poverty rate, with 14 households (5.4%) falling below the poverty line.
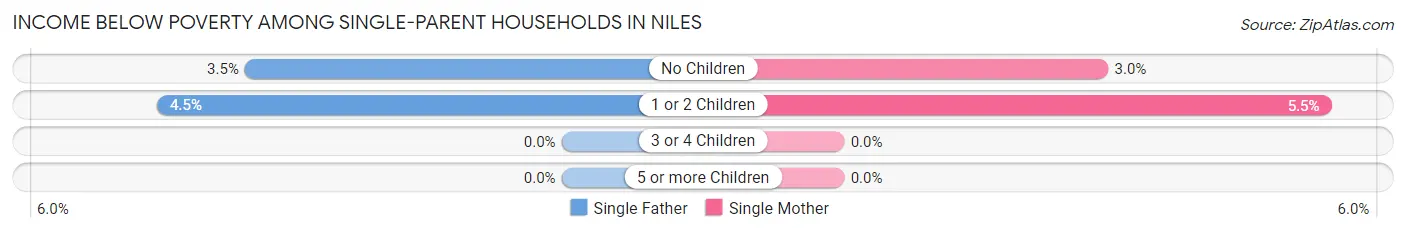
| Children | Single Father | Single Mother |
| No Children | 14 (3.5%) | 22 (2.9%) |
| 1 or 2 Children | 7 (4.5%) | 14 (5.4%) |
| 3 or 4 Children | 0 (0.0%) | 0 (0.0%) |
| 5 or more Children | 0 (0.0%) | 0 (0.0%) |
| Total | 21 (3.8%) | 36 (3.5%) |
Income Below Poverty Among Married-Couple vs Single-Parent Households in Niles
The poverty data for Niles shows that 334 of the married-couple family households (5.5%) and 57 of the single-parent households (3.6%) are living below the poverty level. Within the married-couple family households, those with 1 or 2 children have the highest poverty rate, with 145 households (5.9%) falling below the poverty line. Among the single-parent households, those with 1 or 2 children have the highest poverty rate, with 21 household (5.1%) living below poverty.
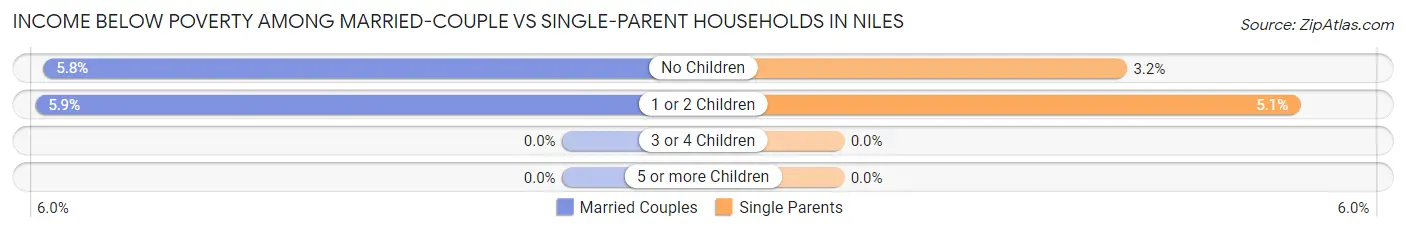
| Children | Married-Couple Families | Single-Parent Households |
| No Children | 189 (5.8%) | 36 (3.2%) |
| 1 or 2 Children | 145 (5.9%) | 21 (5.1%) |
| 3 or 4 Children | 0 (0.0%) | 0 (0.0%) |
| 5 or more Children | 0 (0.0%) | 0 (0.0%) |
| Total | 334 (5.5%) | 57 (3.6%) |
Race in Niles
The most populous races in Niles are White / Caucasian (20,318 | 66.3%), Asian (6,565 | 21.4%), and Hispanic or Latino (3,689 | 12.0%).
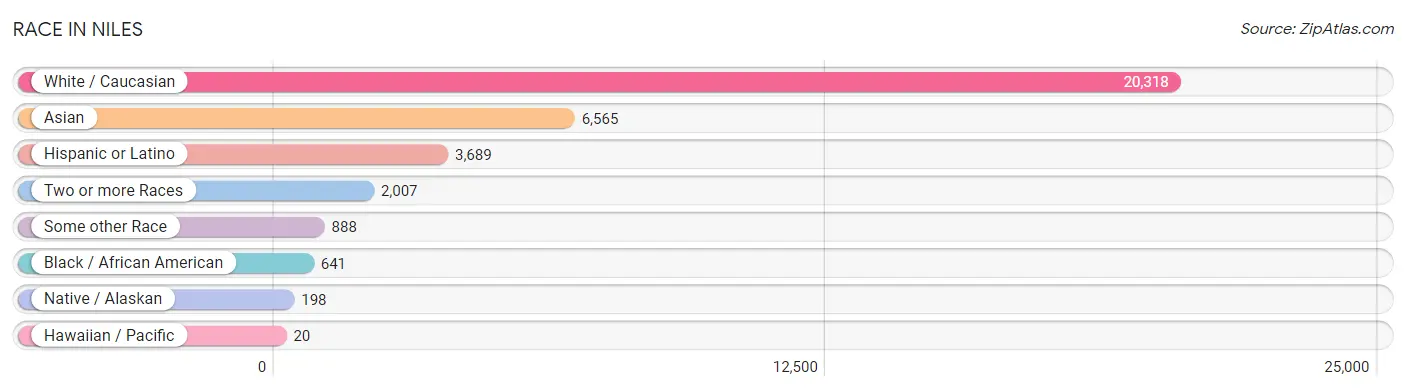
| Race | # Population | % Population |
| Asian | 6,565 | 21.4% |
| Black / African American | 641 | 2.1% |
| Hawaiian / Pacific | 20 | 0.1% |
| Hispanic or Latino | 3,689 | 12.0% |
| Native / Alaskan | 198 | 0.6% |
| White / Caucasian | 20,318 | 66.3% |
| Two or more Races | 2,007 | 6.6% |
| Some other Race | 888 | 2.9% |
| Total | 30,637 | 100.0% |
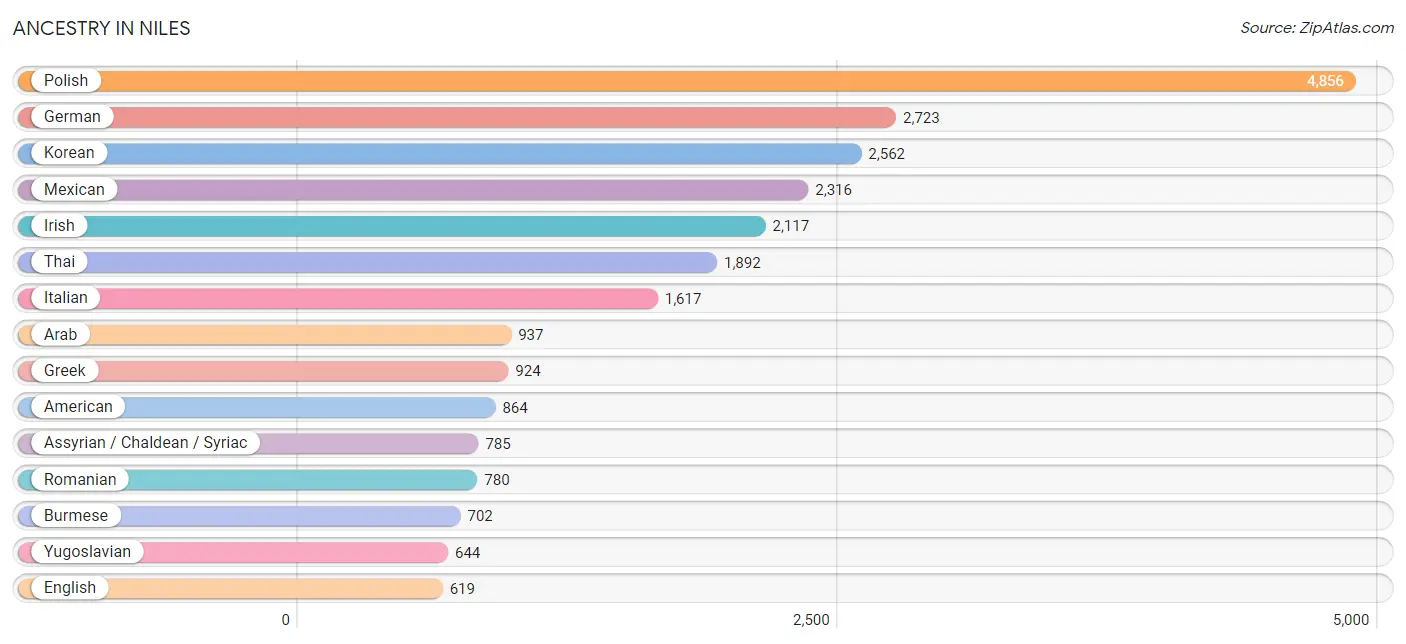
Ancestry in Niles
The most populous ancestries reported in Niles are Polish (4,856 | 15.9%), German (2,723 | 8.9%), Korean (2,562 | 8.4%), Mexican (2,316 | 7.6%), and Irish (2,117 | 6.9%), together accounting for 47.6% of all Niles residents.
| Ancestry | # Population | % Population |
| Afghan | 11 | 0.0% |
| Albanian | 34 | 0.1% |
| American | 864 | 2.8% |
| Arab | 937 | 3.1% |
| Argentinean | 72 | 0.2% |
| Armenian | 10 | 0.0% |
| Assyrian / Chaldean / Syriac | 785 | 2.6% |
| Austrian | 190 | 0.6% |
| Belgian | 13 | 0.0% |
| Bhutanese | 92 | 0.3% |
| Brazilian | 10 | 0.0% |
| British | 33 | 0.1% |
| Bulgarian | 190 | 0.6% |
| Burmese | 702 | 2.3% |
| Cambodian | 193 | 0.6% |
| Canadian | 23 | 0.1% |
| Central American | 94 | 0.3% |
| Cherokee | 52 | 0.2% |
| Chilean | 22 | 0.1% |
| Chippewa | 15 | 0.1% |
| Colombian | 10 | 0.0% |
| Costa Rican | 13 | 0.0% |
| Croatian | 8 | 0.0% |
| Cuban | 297 | 1.0% |
| Czech | 52 | 0.2% |
| Danish | 49 | 0.2% |
| Dominican | 25 | 0.1% |
| Dutch | 58 | 0.2% |
| Eastern European | 64 | 0.2% |
| Ecuadorian | 154 | 0.5% |
| Egyptian | 213 | 0.7% |
| English | 619 | 2.0% |
| European | 192 | 0.6% |
| French | 216 | 0.7% |
| German | 2,723 | 8.9% |
| Greek | 924 | 3.0% |
| Haitian | 71 | 0.2% |
| Honduran | 43 | 0.1% |
| Hungarian | 13 | 0.0% |
| Indian (Asian) | 282 | 0.9% |
| Iraqi | 278 | 0.9% |
| Irish | 2,117 | 6.9% |
| Italian | 1,617 | 5.3% |
| Japanese | 8 | 0.0% |
| Korean | 2,562 | 8.4% |
| Lithuanian | 132 | 0.4% |
| Macedonian | 110 | 0.4% |
| Mexican | 2,316 | 7.6% |
| Mexican American Indian | 127 | 0.4% |
| Moroccan | 168 | 0.5% |
| Native Hawaiian | 37 | 0.1% |
| Norwegian | 161 | 0.5% |
| Pakistani | 8 | 0.0% |
| Palestinian | 11 | 0.0% |
| Polish | 4,856 | 15.9% |
| Puerto Rican | 420 | 1.4% |
| Romanian | 780 | 2.5% |
| Russian | 433 | 1.4% |
| Salvadoran | 38 | 0.1% |
| Scandinavian | 14 | 0.1% |
| Scotch-Irish | 62 | 0.2% |
| Scottish | 181 | 0.6% |
| Serbian | 274 | 0.9% |
| Slovak | 173 | 0.6% |
| Slovene | 7 | 0.0% |
| South American | 258 | 0.8% |
| Spaniard | 173 | 0.6% |
| Spanish | 8 | 0.0% |
| Sri Lankan | 377 | 1.2% |
| Swedish | 259 | 0.9% |
| Swiss | 172 | 0.6% |
| Syrian | 214 | 0.7% |
| Thai | 1,892 | 6.2% |
| Ukrainian | 182 | 0.6% |
| Welsh | 50 | 0.2% |
| Yugoslavian | 644 | 2.1% | View All 76 Rows |
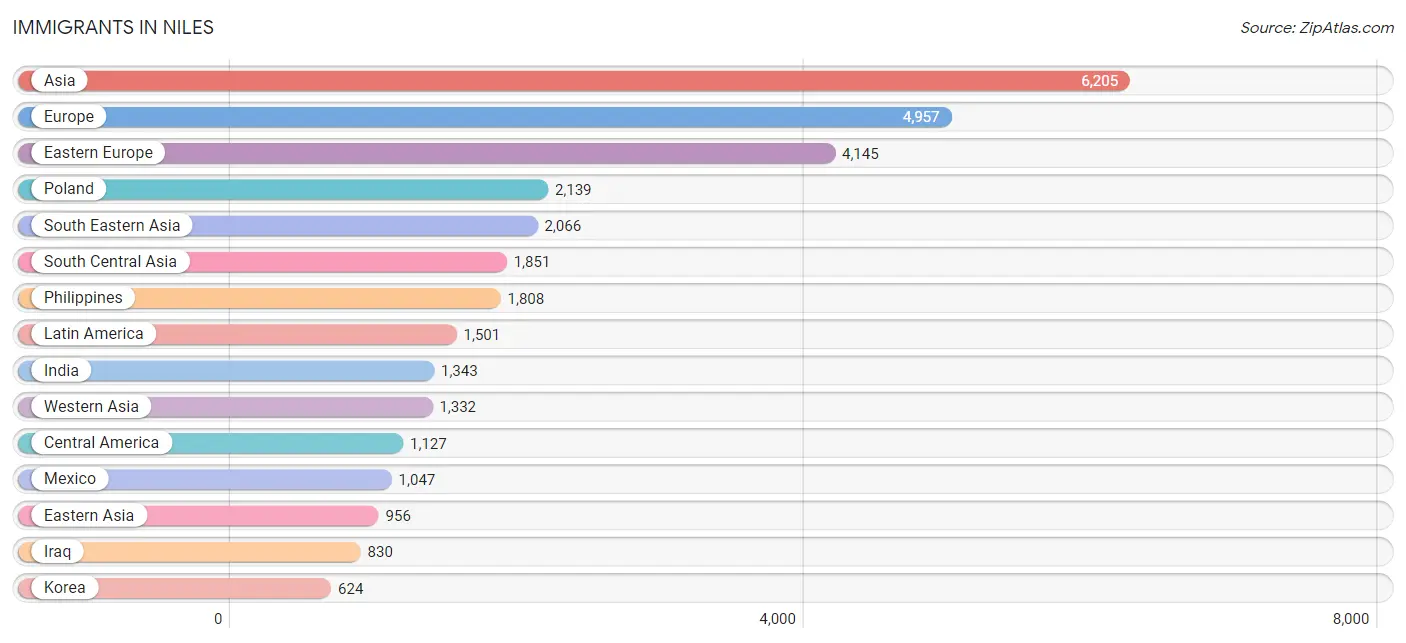
Immigrants in Niles
The most numerous immigrant groups reported in Niles came from Asia (6,205 | 20.3%), Europe (4,957 | 16.2%), Eastern Europe (4,145 | 13.5%), Poland (2,139 | 7.0%), and South Eastern Asia (2,066 | 6.7%), together accounting for 63.7% of all Niles residents.
| Immigration Origin | # Population | % Population |
| Africa | 261 | 0.9% |
| Albania | 47 | 0.2% |
| Argentina | 22 | 0.1% |
| Asia | 6,205 | 20.3% |
| Australia | 22 | 0.1% |
| Austria | 44 | 0.1% |
| Belarus | 47 | 0.2% |
| Bosnia and Herzegovina | 405 | 1.3% |
| Bulgaria | 190 | 0.6% |
| Cambodia | 8 | 0.0% |
| Canada | 66 | 0.2% |
| Caribbean | 220 | 0.7% |
| Central America | 1,127 | 3.7% |
| Chile | 22 | 0.1% |
| China | 139 | 0.4% |
| Colombia | 52 | 0.2% |
| Croatia | 24 | 0.1% |
| Cuba | 143 | 0.5% |
| Czechoslovakia | 11 | 0.0% |
| Dominican Republic | 6 | 0.0% |
| Eastern Africa | 49 | 0.2% |
| Eastern Asia | 956 | 3.1% |
| Eastern Europe | 4,145 | 13.5% |
| Ecuador | 58 | 0.2% |
| Egypt | 77 | 0.3% |
| El Salvador | 26 | 0.1% |
| Ethiopia | 22 | 0.1% |
| Europe | 4,957 | 16.2% |
| Fiji | 24 | 0.1% |
| France | 34 | 0.1% |
| Germany | 124 | 0.4% |
| Greece | 325 | 1.1% |
| Guatemala | 11 | 0.0% |
| Haiti | 71 | 0.2% |
| Honduras | 43 | 0.1% |
| India | 1,343 | 4.4% |
| Iraq | 830 | 2.7% |
| Ireland | 42 | 0.1% |
| Italy | 195 | 0.6% |
| Kenya | 27 | 0.1% |
| Korea | 624 | 2.0% |
| Kuwait | 26 | 0.1% |
| Latin America | 1,501 | 4.9% |
| Lithuania | 53 | 0.2% |
| Mexico | 1,047 | 3.4% |
| Moldova | 63 | 0.2% |
| Morocco | 135 | 0.4% |
| North Macedonia | 29 | 0.1% |
| Northern Africa | 212 | 0.7% |
| Northern Europe | 90 | 0.3% |
| Oceania | 46 | 0.2% |
| Pakistan | 474 | 1.5% |
| Philippines | 1,808 | 5.9% |
| Poland | 2,139 | 7.0% |
| Romania | 541 | 1.8% |
| Russia | 133 | 0.4% |
| Serbia | 241 | 0.8% |
| South America | 154 | 0.5% |
| South Central Asia | 1,851 | 6.0% |
| South Eastern Asia | 2,066 | 6.7% |
| Southern Europe | 520 | 1.7% |
| Syria | 384 | 1.3% |
| Ukraine | 180 | 0.6% |
| Uzbekistan | 13 | 0.0% |
| Vietnam | 250 | 0.8% |
| Western Asia | 1,332 | 4.3% |
| Western Europe | 202 | 0.7% | View All 67 Rows |
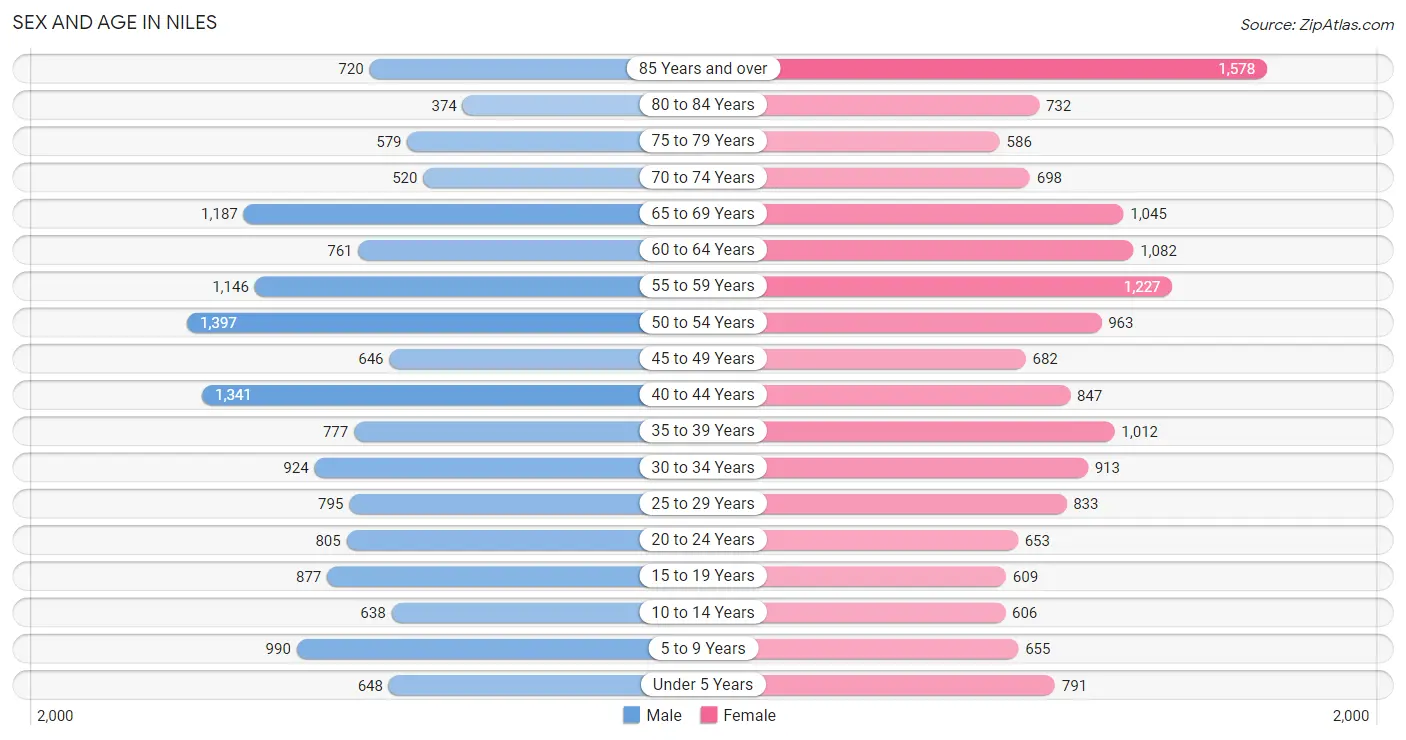
Sex and Age in Niles
Sex and Age in Niles
The most populous age groups in Niles are 50 to 54 Years (1,397 | 9.2%) for men and 85 Years and over (1,578 | 10.2%) for women.
| Age Bracket | Male | Female |
| Under 5 Years | 648 (4.3%) | 791 (5.1%) |
| 5 to 9 Years | 990 (6.6%) | 655 (4.2%) |
| 10 to 14 Years | 638 (4.2%) | 606 (3.9%) |
| 15 to 19 Years | 877 (5.8%) | 609 (3.9%) |
| 20 to 24 Years | 805 (5.3%) | 653 (4.2%) |
| 25 to 29 Years | 795 (5.3%) | 833 (5.4%) |
| 30 to 34 Years | 924 (6.1%) | 913 (5.9%) |
| 35 to 39 Years | 777 (5.1%) | 1,012 (6.5%) |
| 40 to 44 Years | 1,341 (8.9%) | 847 (5.5%) |
| 45 to 49 Years | 646 (4.3%) | 682 (4.4%) |
| 50 to 54 Years | 1,397 (9.2%) | 963 (6.2%) |
| 55 to 59 Years | 1,146 (7.6%) | 1,227 (7.9%) |
| 60 to 64 Years | 761 (5.0%) | 1,082 (7.0%) |
| 65 to 69 Years | 1,187 (7.9%) | 1,045 (6.7%) |
| 70 to 74 Years | 520 (3.4%) | 698 (4.5%) |
| 75 to 79 Years | 579 (3.8%) | 586 (3.8%) |
| 80 to 84 Years | 374 (2.5%) | 732 (4.7%) |
| 85 Years and over | 720 (4.8%) | 1,578 (10.2%) |
| Total | 15,125 (100.0%) | 15,512 (100.0%) |
Families and Households in Niles
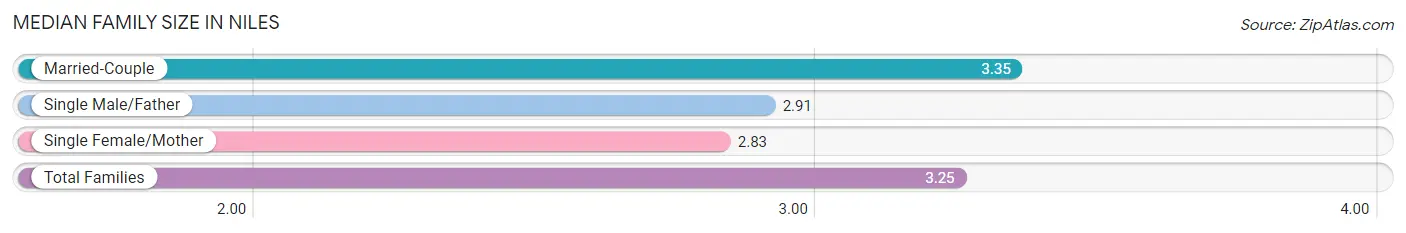
Median Family Size in Niles
The median family size in Niles is 3.25 persons per family, with married-couple families (6,099 | 79.6%) accounting for the largest median family size of 3.35 persons per family. On the other hand, single female/mother families (1,013 | 13.2%) represent the smallest median family size with 2.83 persons per family.
| Family Type | # Families | Family Size |
| Married-Couple | 6,099 (79.6%) | 3.35 |
| Single Male/Father | 550 (7.2%) | 2.91 |
| Single Female/Mother | 1,013 (13.2%) | 2.83 |
| Total Families | 7,662 (100.0%) | 3.25 |
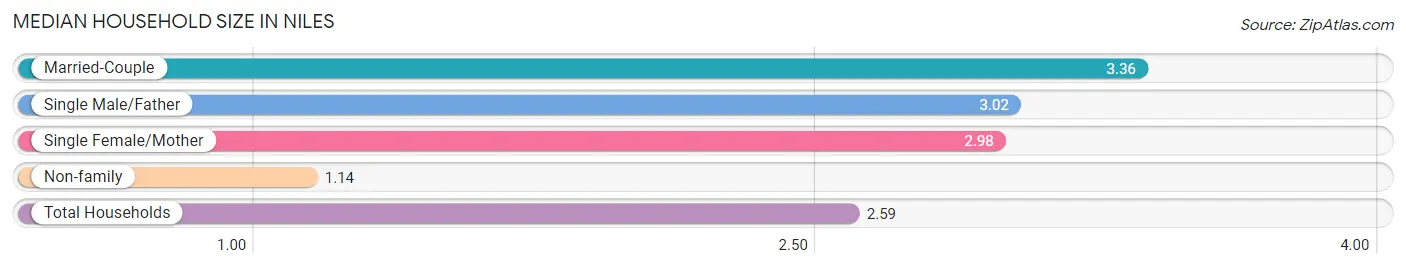
Median Household Size in Niles
The median household size in Niles is 2.59 persons per household, with married-couple households (6,099 | 53.8%) accounting for the largest median household size of 3.36 persons per household. non-family households (3,670 | 32.4%) represent the smallest median household size with 1.14 persons per household.
| Household Type | # Households | Household Size |
| Married-Couple | 6,099 (53.8%) | 3.36 |
| Single Male/Father | 550 (4.9%) | 3.02 |
| Single Female/Mother | 1,013 (8.9%) | 2.98 |
| Non-family | 3,670 (32.4%) | 1.14 |
| Total Households | 11,332 (100.0%) | 2.59 |
Household Size by Marriage Status in Niles
Out of a total of 11,332 households in Niles, 7,662 (67.6%) are family households, while 3,670 (32.4%) are nonfamily households. The most numerous type of family households are 2-person households, comprising 2,688, and the most common type of nonfamily households are 1-person households, comprising 3,185.
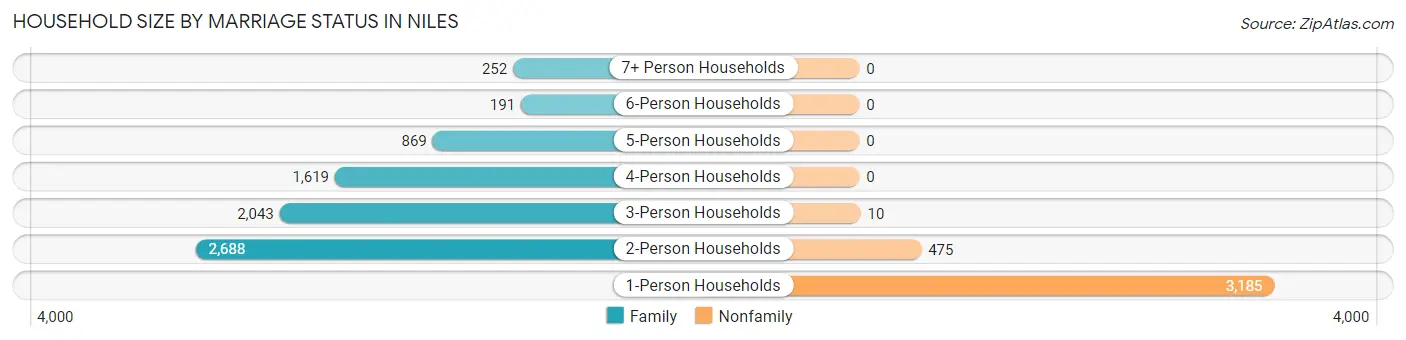
| Household Size | Family Households | Nonfamily Households |
| 1-Person Households | - | 3,185 (28.1%) |
| 2-Person Households | 2,688 (23.7%) | 475 (4.2%) |
| 3-Person Households | 2,043 (18.0%) | 10 (0.1%) |
| 4-Person Households | 1,619 (14.3%) | 0 (0.0%) |
| 5-Person Households | 869 (7.7%) | 0 (0.0%) |
| 6-Person Households | 191 (1.7%) | 0 (0.0%) |
| 7+ Person Households | 252 (2.2%) | 0 (0.0%) |
| Total | 7,662 (67.6%) | 3,670 (32.4%) |
Female Fertility in Niles
Fertility by Age in Niles
Average fertility rate in Niles is 47.0 births per 1,000 women. Women in the age bracket of 20 to 34 years have the highest fertility rate with 81.0 births per 1,000 women. Women in the age bracket of 20 to 34 years acount for 71.3% of all women with births.
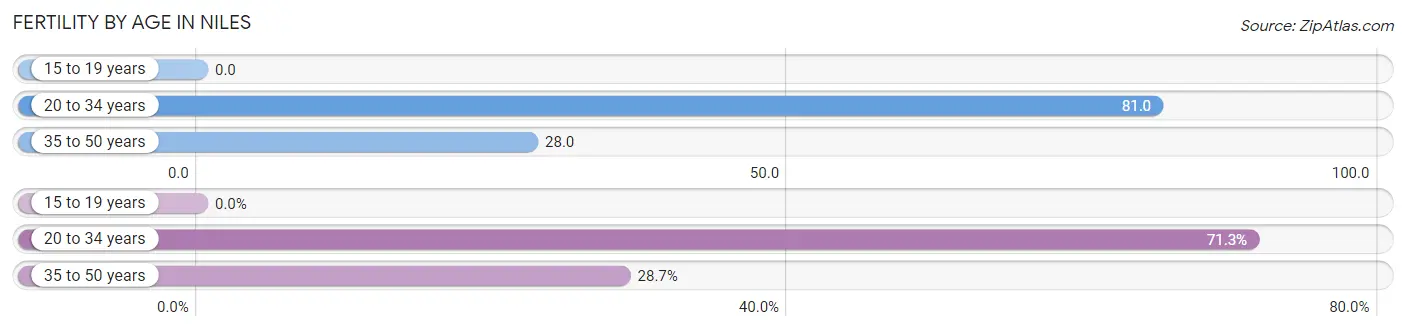
| Age Bracket | Women with Births | Births / 1,000 Women |
| 15 to 19 years | 0 (0.0%) | 0.0 |
| 20 to 34 years | 194 (71.3%) | 81.0 |
| 35 to 50 years | 78 (28.7%) | 28.0 |
| Total | 272 (100.0%) | 47.0 |
Fertility by Age by Marriage Status in Niles
94.9% of women with births (272) in Niles are married. The highest percentage of unmarried women with births falls into 20 to 34 years age bracket with 7.2% of them unmarried at the time of birth, while the lowest percentage of unmarried women with births belong to 35 to 50 years age bracket with 0.0% of them unmarried.
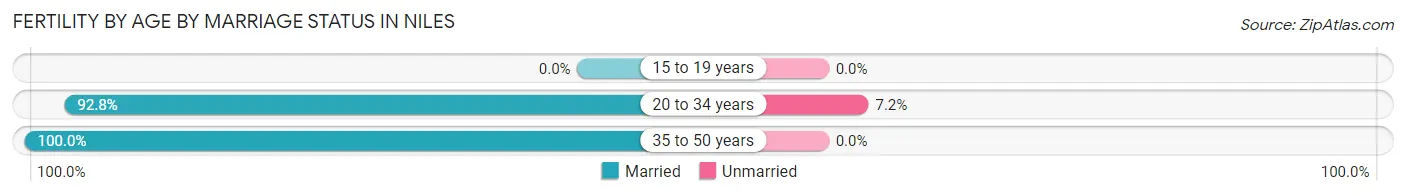
| Age Bracket | Married | Unmarried |
| 15 to 19 years | 0 (0.0%) | 0 (0.0%) |
| 20 to 34 years | 180 (92.8%) | 14 (7.2%) |
| 35 to 50 years | 78 (100.0%) | 0 (0.0%) |
| Total | 258 (94.9%) | 14 (5.1%) |
Fertility by Education in Niles
Average fertility rate in Niles is 47.0 births per 1,000 women. Women with the education attainment of college or associate's degree have the highest fertility rate of 71.0 births per 1,000 women, while women with the education attainment of high school diploma have the lowest fertility at 7.0 births per 1,000 women. Women with the education attainment of college or associate's degree represent 40.1% of all women with births.
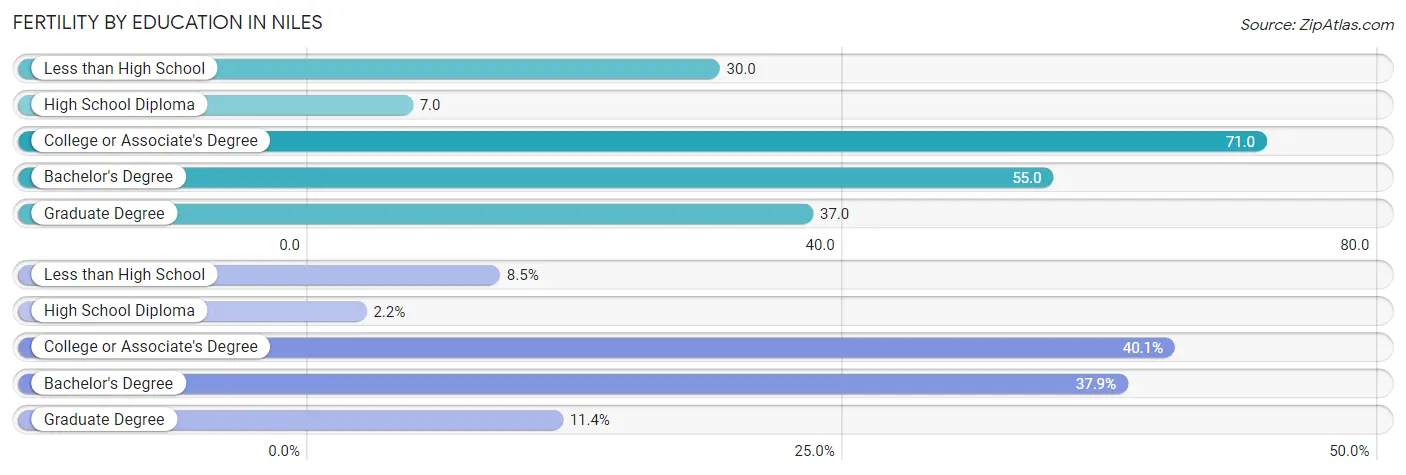
| Educational Attainment | Women with Births | Births / 1,000 Women |
| Less than High School | 23 (8.5%) | 30.0 |
| High School Diploma | 6 (2.2%) | 7.0 |
| College or Associate's Degree | 109 (40.1%) | 71.0 |
| Bachelor's Degree | 103 (37.9%) | 55.0 |
| Graduate Degree | 31 (11.4%) | 37.0 |
| Total | 272 (100.0%) | 47.0 |
Fertility by Education by Marriage Status in Niles
5.1% of women with births in Niles are unmarried. Women with the educational attainment of less than high school are most likely to be married with 100.0% of them married at childbirth, while women with the educational attainment of bachelor's degree are least likely to be married with 13.6% of them unmarried at childbirth.
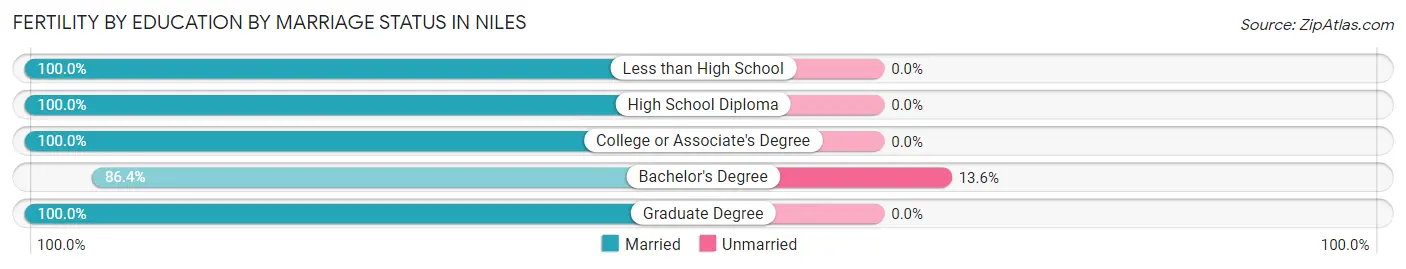
| Educational Attainment | Married | Unmarried |
| Less than High School | 23 (100.0%) | 0 (0.0%) |
| High School Diploma | 6 (100.0%) | 0 (0.0%) |
| College or Associate's Degree | 109 (100.0%) | 0 (0.0%) |
| Bachelor's Degree | 89 (86.4%) | 14 (13.6%) |
| Graduate Degree | 31 (100.0%) | 0 (0.0%) |
| Total | 258 (94.9%) | 14 (5.1%) |
Employment Characteristics in Niles
Employment by Class of Employer in Niles
Among the 13,815 employed individuals in Niles, private company employees (9,534 | 69.0%), not-for-profit organizations (1,506 | 10.9%), and self-employed (incorporated) (877 | 6.4%) make up the most common classes of employment.
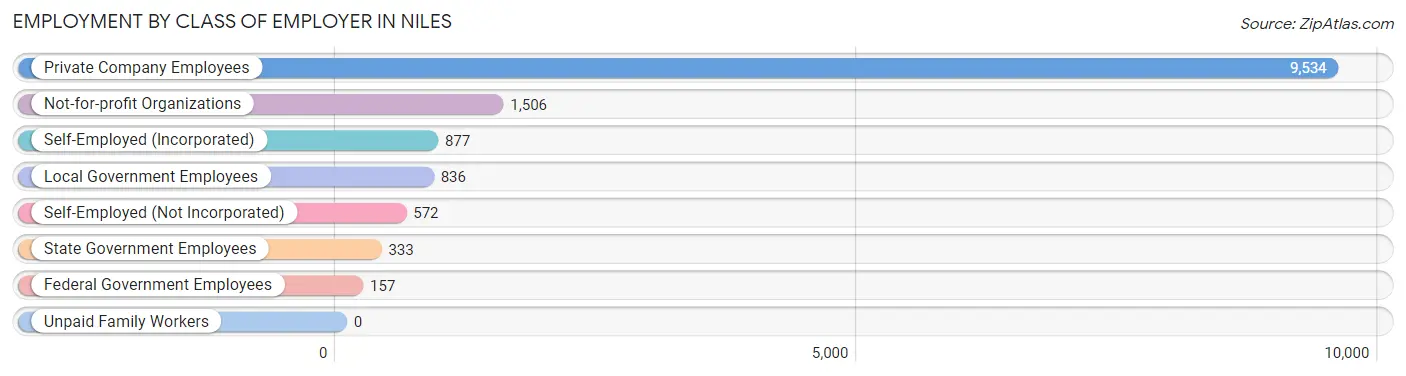
| Employer Class | # Employees | % Employees |
| Private Company Employees | 9,534 | 69.0% |
| Self-Employed (Incorporated) | 877 | 6.4% |
| Self-Employed (Not Incorporated) | 572 | 4.1% |
| Not-for-profit Organizations | 1,506 | 10.9% |
| Local Government Employees | 836 | 6.0% |
| State Government Employees | 333 | 2.4% |
| Federal Government Employees | 157 | 1.1% |
| Unpaid Family Workers | 0 | 0.0% |
| Total | 13,815 | 100.0% |
Employment Status by Age in Niles
According to the labor force statistics for Niles, out of the total population over 16 years of age (25,815), 58.8% or 15,179 individuals are in the labor force, with 6.2% or 941 of them unemployed. The age group with the highest labor force participation rate is 45 to 54 years, with 85.7% or 3,161 individuals in the labor force. Within the labor force, the 75 years and over age range has the highest percentage of unemployed individuals, with 12.3% or 27 of them being unemployed.
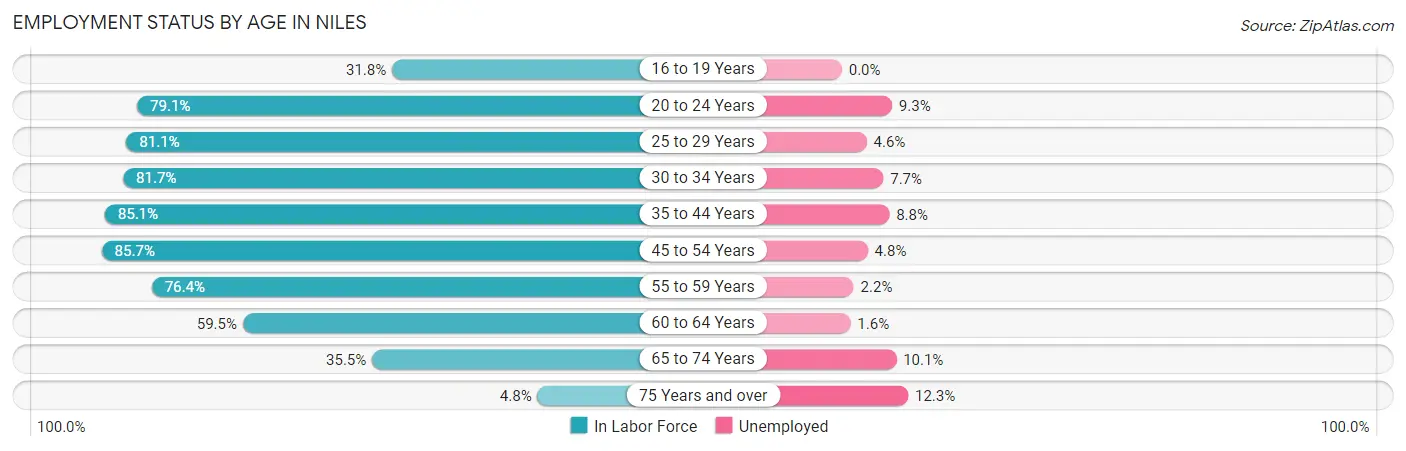
| Age Bracket | In Labor Force | Unemployed |
| 16 to 19 Years | 315 (31.8%) | 0 (0.0%) |
| 20 to 24 Years | 1,153 (79.1%) | 107 (9.3%) |
| 25 to 29 Years | 1,320 (81.1%) | 61 (4.6%) |
| 30 to 34 Years | 1,501 (81.7%) | 116 (7.7%) |
| 35 to 44 Years | 3,384 (85.1%) | 298 (8.8%) |
| 45 to 54 Years | 3,161 (85.7%) | 152 (4.8%) |
| 55 to 59 Years | 1,813 (76.4%) | 40 (2.2%) |
| 60 to 64 Years | 1,097 (59.5%) | 18 (1.6%) |
| 65 to 74 Years | 1,225 (35.5%) | 124 (10.1%) |
| 75 Years and over | 219 (4.8%) | 27 (12.3%) |
| Total | 15,179 (58.8%) | 941 (6.2%) |
Employment Status by Educational Attainment in Niles
According to labor force statistics for Niles, 80.0% of individuals (12,277) out of the total population between 25 and 64 years of age (15,346) are in the labor force, with 5.6% or 688 of them being unemployed. The group with the highest labor force participation rate are those with the educational attainment of bachelor's degree or higher, with 86.8% or 6,125 individuals in the labor force. Within the labor force, individuals with college / associate degree education have the highest percentage of unemployment, with 6.7% or 185 of them being unemployed.
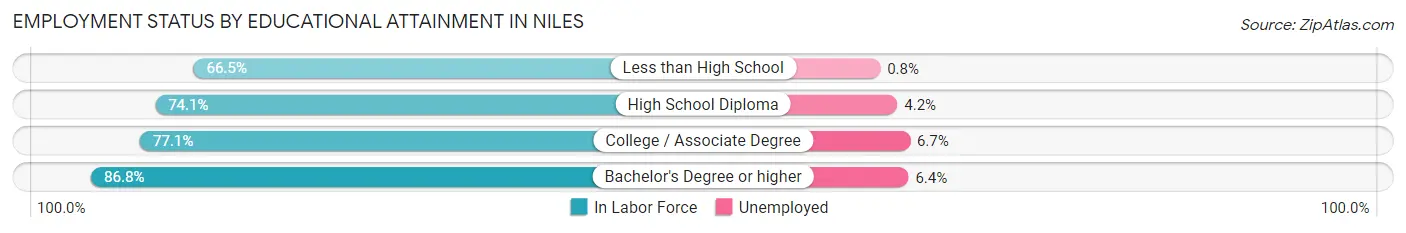
| Educational Attainment | In Labor Force | Unemployed |
| Less than High School | 906 (66.5%) | 11 (0.8%) |
| High School Diploma | 2,482 (74.1%) | 141 (4.2%) |
| College / Associate Degree | 2,759 (77.1%) | 240 (6.7%) |
| Bachelor's Degree or higher | 6,125 (86.8%) | 452 (6.4%) |
| Total | 12,277 (80.0%) | 859 (5.6%) |
Employment Occupations by Sex in Niles
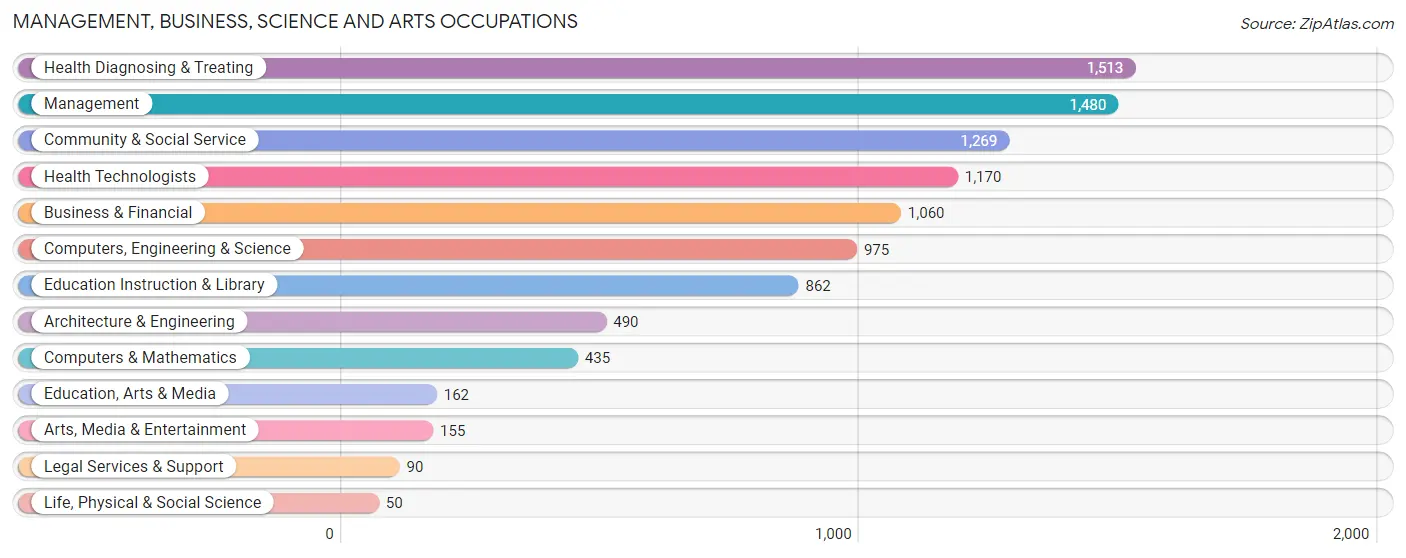
Management, Business, Science and Arts Occupations
The most common Management, Business, Science and Arts occupations in Niles are Health Diagnosing & Treating (1,513 | 10.6%), Management (1,480 | 10.4%), Community & Social Service (1,269 | 8.9%), Health Technologists (1,170 | 8.2%), and Business & Financial (1,060 | 7.4%).
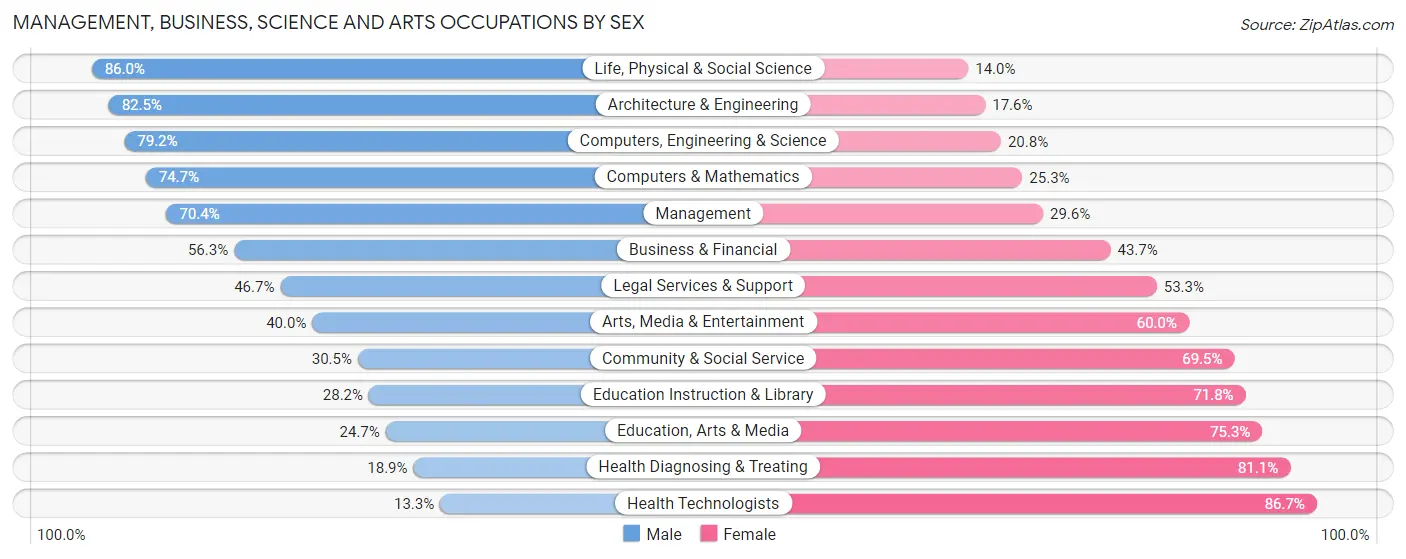
Management, Business, Science and Arts Occupations by Sex
Within the Management, Business, Science and Arts occupations in Niles, the most male-oriented occupations are Life, Physical & Social Science (86.0%), Architecture & Engineering (82.5%), and Computers, Engineering & Science (79.2%), while the most female-oriented occupations are Health Technologists (86.7%), Health Diagnosing & Treating (81.1%), and Education, Arts & Media (75.3%).
| Occupation | Male | Female |
| Management | 1,042 (70.4%) | 438 (29.6%) |
| Business & Financial | 597 (56.3%) | 463 (43.7%) |
| Computers, Engineering & Science | 772 (79.2%) | 203 (20.8%) |
| Computers & Mathematics | 325 (74.7%) | 110 (25.3%) |
| Architecture & Engineering | 404 (82.5%) | 86 (17.5%) |
| Life, Physical & Social Science | 43 (86.0%) | 7 (14.0%) |
| Community & Social Service | 387 (30.5%) | 882 (69.5%) |
| Education, Arts & Media | 40 (24.7%) | 122 (75.3%) |
| Legal Services & Support | 42 (46.7%) | 48 (53.3%) |
| Education Instruction & Library | 243 (28.2%) | 619 (71.8%) |
| Arts, Media & Entertainment | 62 (40.0%) | 93 (60.0%) |
| Health Diagnosing & Treating | 286 (18.9%) | 1,227 (81.1%) |
| Health Technologists | 156 (13.3%) | 1,014 (86.7%) |
| Total (Category) | 3,084 (49.0%) | 3,213 (51.0%) |
| Total (Overall) | 7,537 (52.9%) | 6,706 (47.1%) |
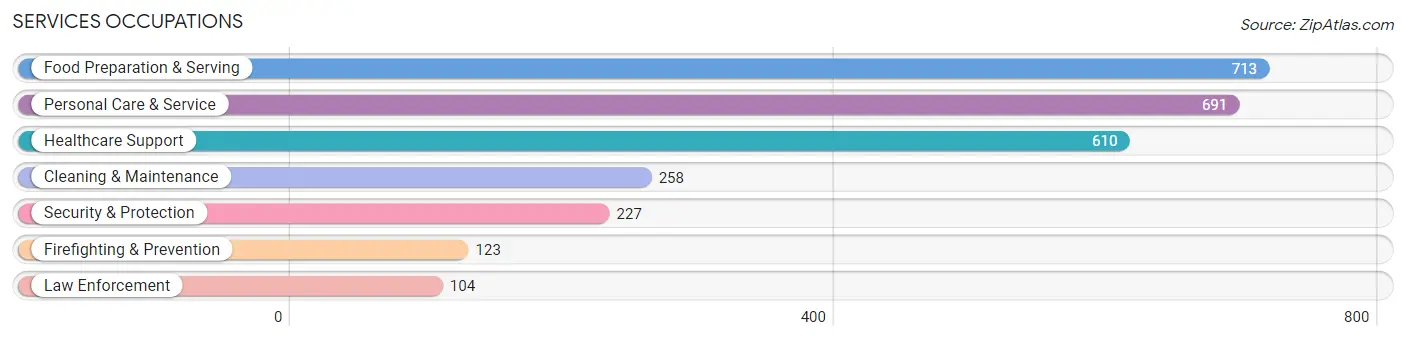
Services Occupations
The most common Services occupations in Niles are Food Preparation & Serving (713 | 5.0%), Personal Care & Service (691 | 4.9%), Healthcare Support (610 | 4.3%), Cleaning & Maintenance (258 | 1.8%), and Security & Protection (227 | 1.6%).
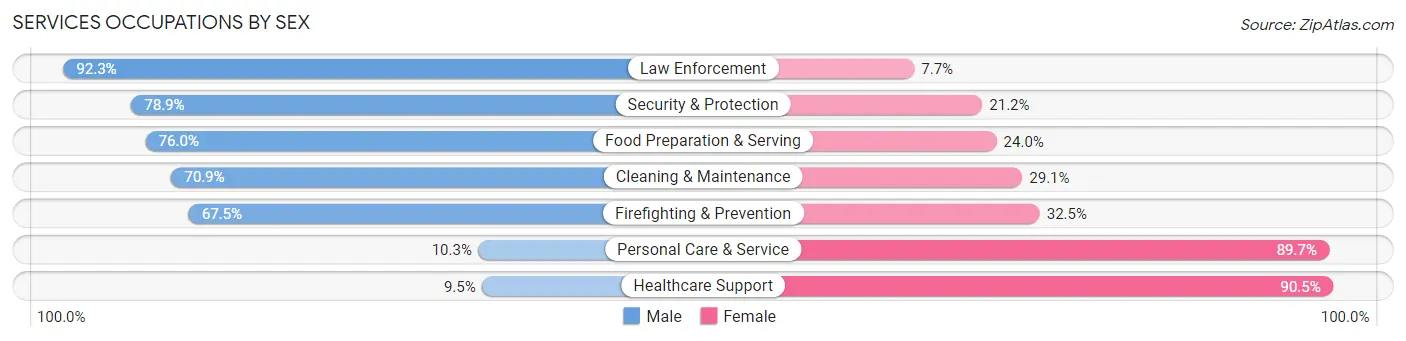
Services Occupations by Sex
Within the Services occupations in Niles, the most male-oriented occupations are Law Enforcement (92.3%), Security & Protection (78.8%), and Food Preparation & Serving (76.0%), while the most female-oriented occupations are Healthcare Support (90.5%), Personal Care & Service (89.7%), and Firefighting & Prevention (32.5%).
| Occupation | Male | Female |
| Healthcare Support | 58 (9.5%) | 552 (90.5%) |
| Security & Protection | 179 (78.8%) | 48 (21.1%) |
| Firefighting & Prevention | 83 (67.5%) | 40 (32.5%) |
| Law Enforcement | 96 (92.3%) | 8 (7.7%) |
| Food Preparation & Serving | 542 (76.0%) | 171 (24.0%) |
| Cleaning & Maintenance | 183 (70.9%) | 75 (29.1%) |
| Personal Care & Service | 71 (10.3%) | 620 (89.7%) |
| Total (Category) | 1,033 (41.3%) | 1,466 (58.7%) |
| Total (Overall) | 7,537 (52.9%) | 6,706 (47.1%) |
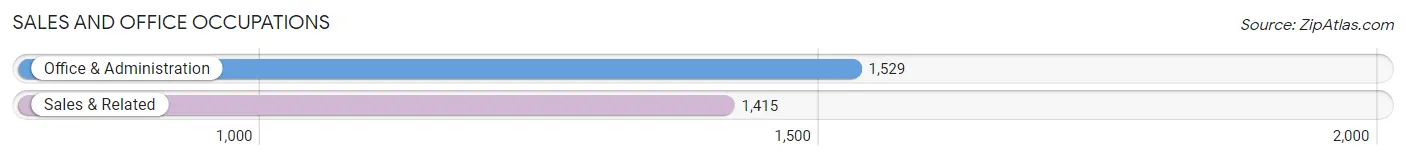
Sales and Office Occupations
The most common Sales and Office occupations in Niles are Office & Administration (1,529 | 10.7%), and Sales & Related (1,415 | 9.9%).
Sales and Office Occupations by Sex
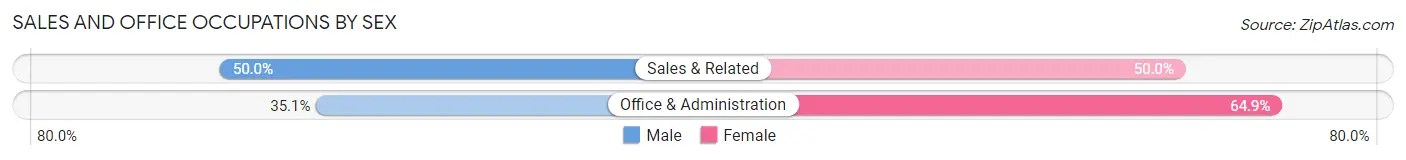
| Occupation | Male | Female |
| Sales & Related | 707 (50.0%) | 708 (50.0%) |
| Office & Administration | 537 (35.1%) | 992 (64.9%) |
| Total (Category) | 1,244 (42.3%) | 1,700 (57.7%) |
| Total (Overall) | 7,537 (52.9%) | 6,706 (47.1%) |
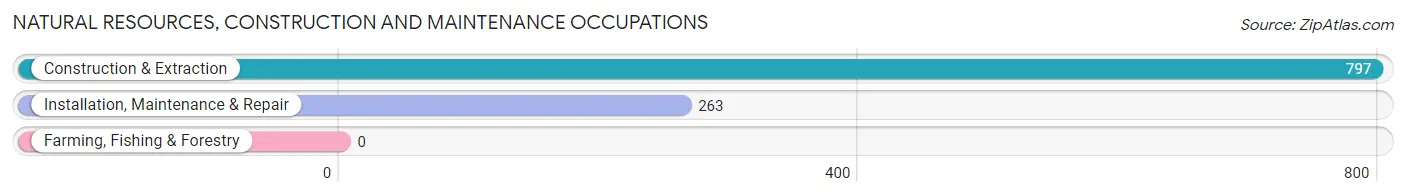
Natural Resources, Construction and Maintenance Occupations
The most common Natural Resources, Construction and Maintenance occupations in Niles are Construction & Extraction (797 | 5.6%), and Installation, Maintenance & Repair (263 | 1.8%).
Natural Resources, Construction and Maintenance Occupations by Sex
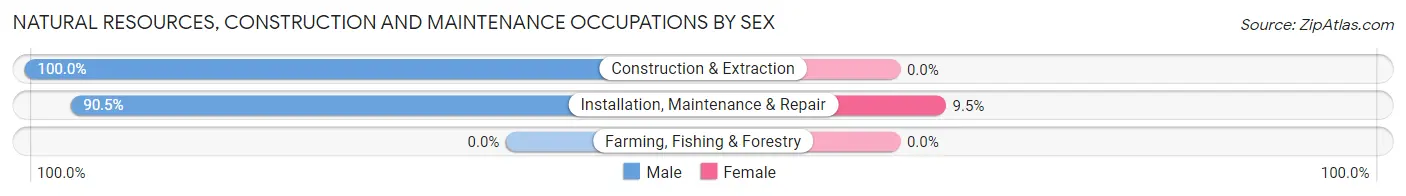
| Occupation | Male | Female |
| Farming, Fishing & Forestry | 0 (0.0%) | 0 (0.0%) |
| Construction & Extraction | 797 (100.0%) | 0 (0.0%) |
| Installation, Maintenance & Repair | 238 (90.5%) | 25 (9.5%) |
| Total (Category) | 1,035 (97.6%) | 25 (2.4%) |
| Total (Overall) | 7,537 (52.9%) | 6,706 (47.1%) |
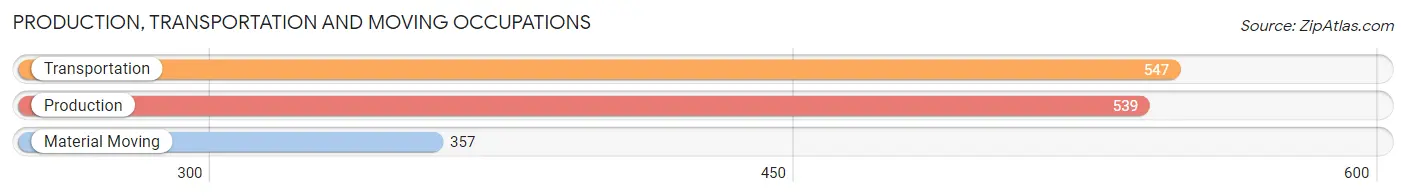
Production, Transportation and Moving Occupations
The most common Production, Transportation and Moving occupations in Niles are Transportation (547 | 3.8%), Production (539 | 3.8%), and Material Moving (357 | 2.5%).
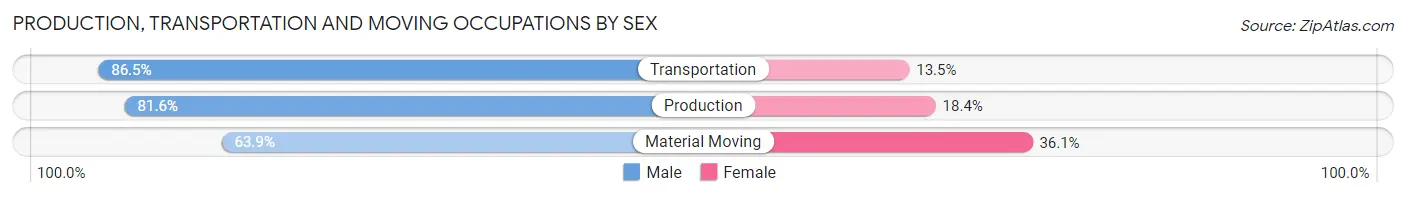
Production, Transportation and Moving Occupations by Sex
| Occupation | Male | Female |
| Production | 440 (81.6%) | 99 (18.4%) |
| Transportation | 473 (86.5%) | 74 (13.5%) |
| Material Moving | 228 (63.9%) | 129 (36.1%) |
| Total (Category) | 1,141 (79.1%) | 302 (20.9%) |
| Total (Overall) | 7,537 (52.9%) | 6,706 (47.1%) |
Employment Industries by Sex in Niles
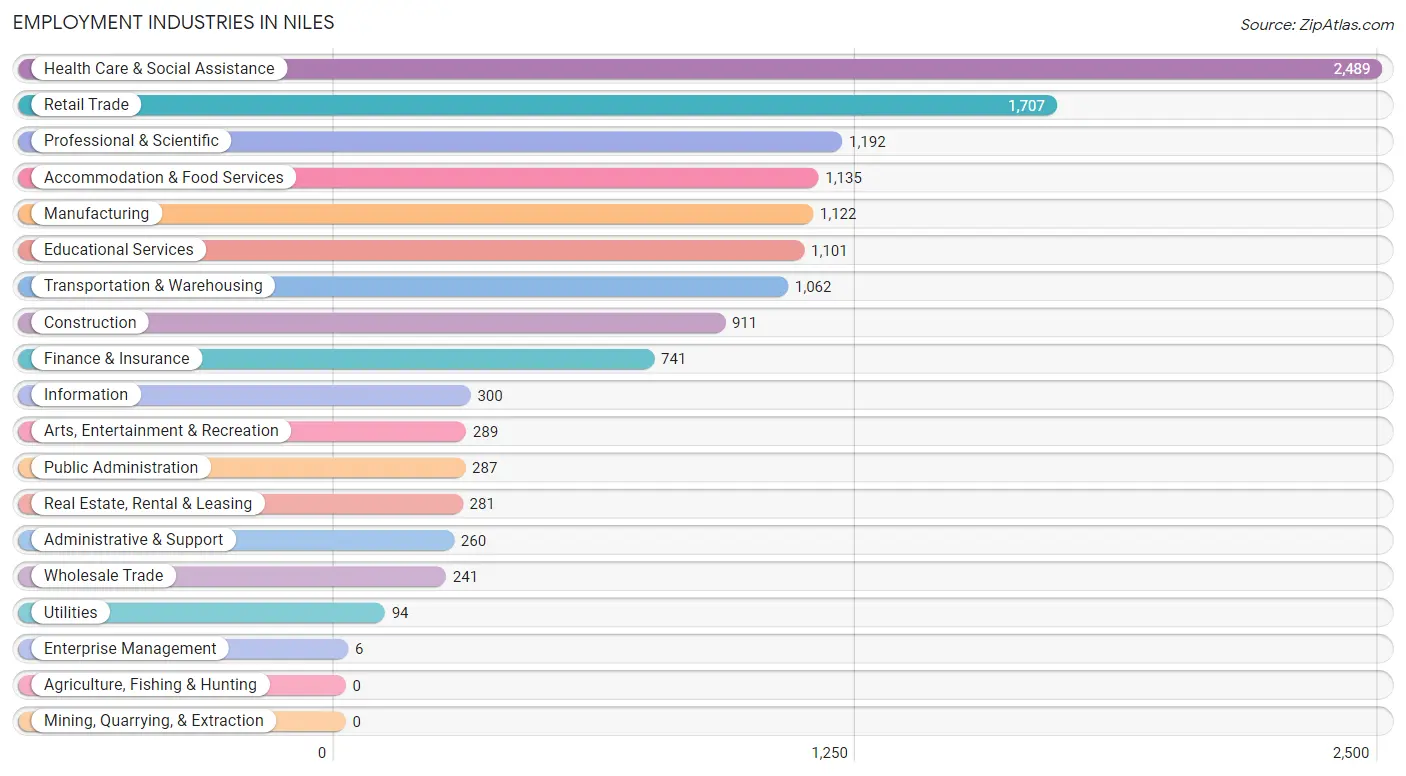
Employment Industries in Niles
The major employment industries in Niles include Health Care & Social Assistance (2,489 | 17.5%), Retail Trade (1,707 | 12.0%), Professional & Scientific (1,192 | 8.4%), Accommodation & Food Services (1,135 | 8.0%), and Manufacturing (1,122 | 7.9%).
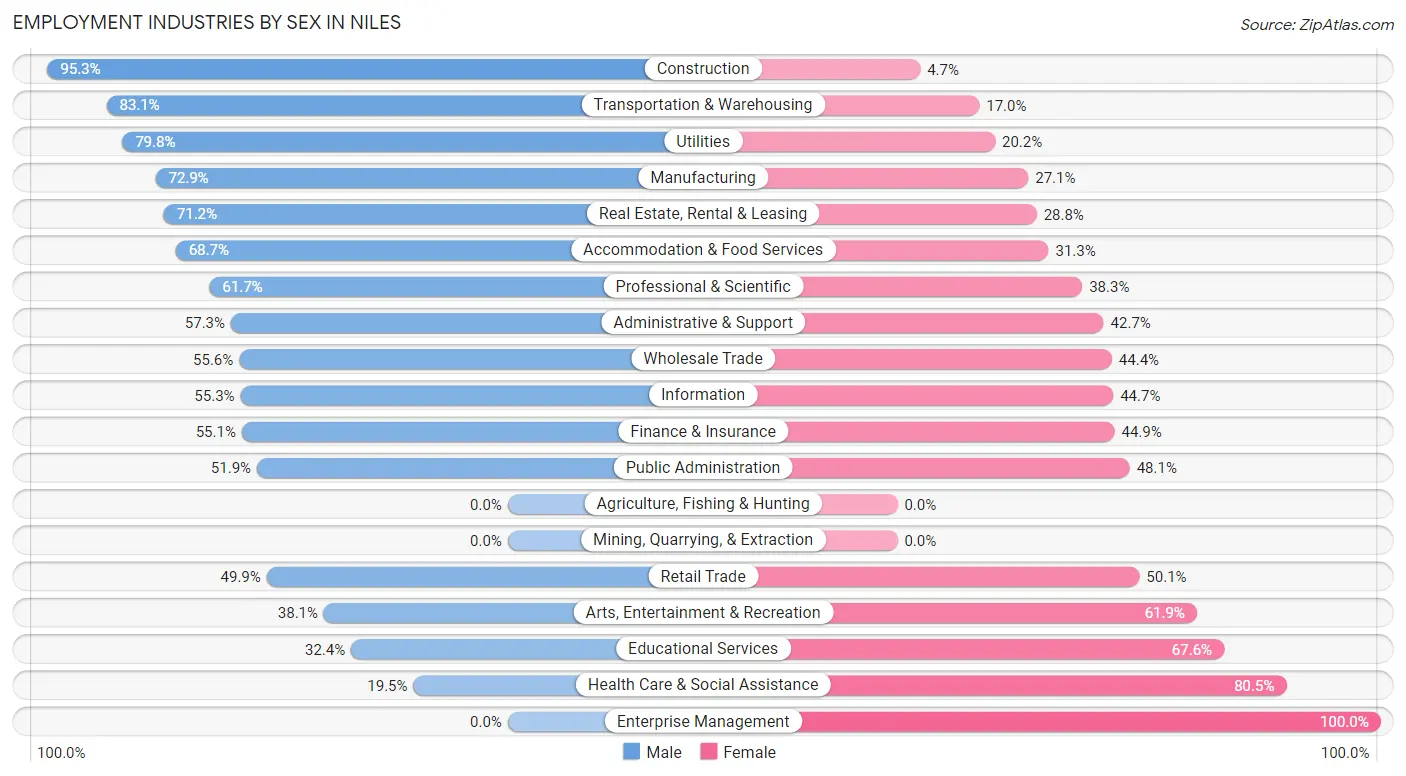
Employment Industries by Sex in Niles
The Niles industries that see more men than women are Construction (95.3%), Transportation & Warehousing (83.1%), and Utilities (79.8%), whereas the industries that tend to have a higher number of women are Enterprise Management (100.0%), Health Care & Social Assistance (80.5%), and Educational Services (67.6%).
| Industry | Male | Female |
| Agriculture, Fishing & Hunting | 0 (0.0%) | 0 (0.0%) |
| Mining, Quarrying, & Extraction | 0 (0.0%) | 0 (0.0%) |
| Construction | 868 (95.3%) | 43 (4.7%) |
| Manufacturing | 818 (72.9%) | 304 (27.1%) |
| Wholesale Trade | 134 (55.6%) | 107 (44.4%) |
| Retail Trade | 852 (49.9%) | 855 (50.1%) |
| Transportation & Warehousing | 882 (83.1%) | 180 (17.0%) |
| Utilities | 75 (79.8%) | 19 (20.2%) |
| Information | 166 (55.3%) | 134 (44.7%) |
| Finance & Insurance | 408 (55.1%) | 333 (44.9%) |
| Real Estate, Rental & Leasing | 200 (71.2%) | 81 (28.8%) |
| Professional & Scientific | 736 (61.7%) | 456 (38.3%) |
| Enterprise Management | 0 (0.0%) | 6 (100.0%) |
| Administrative & Support | 149 (57.3%) | 111 (42.7%) |
| Educational Services | 357 (32.4%) | 744 (67.6%) |
| Health Care & Social Assistance | 486 (19.5%) | 2,003 (80.5%) |
| Arts, Entertainment & Recreation | 110 (38.1%) | 179 (61.9%) |
| Accommodation & Food Services | 780 (68.7%) | 355 (31.3%) |
| Public Administration | 149 (51.9%) | 138 (48.1%) |
| Total | 7,537 (52.9%) | 6,706 (47.1%) |
Education in Niles
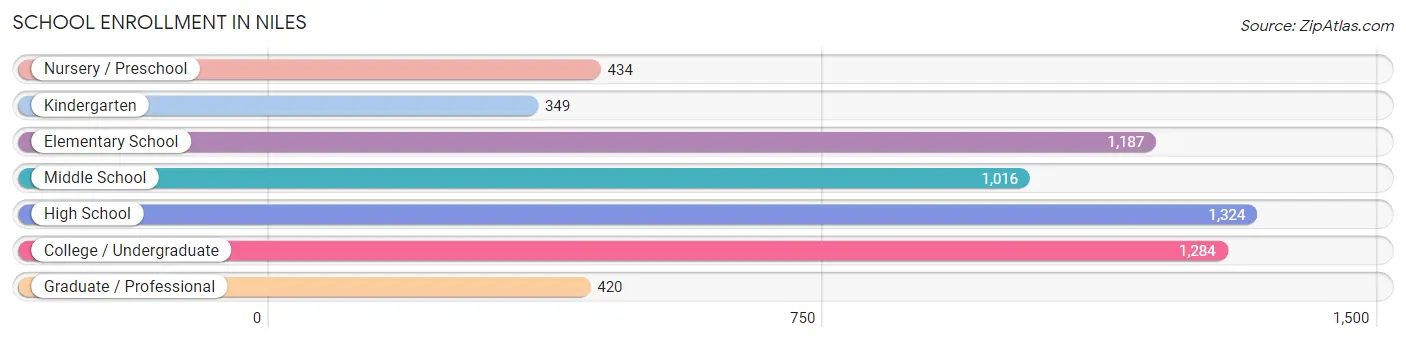
School Enrollment in Niles
The most common levels of schooling among the 6,014 students in Niles are high school (1,324 | 22.0%), college / undergraduate (1,284 | 21.3%), and elementary school (1,187 | 19.7%).
| School Level | # Students | % Students |
| Nursery / Preschool | 434 | 7.2% |
| Kindergarten | 349 | 5.8% |
| Elementary School | 1,187 | 19.7% |
| Middle School | 1,016 | 16.9% |
| High School | 1,324 | 22.0% |
| College / Undergraduate | 1,284 | 21.3% |
| Graduate / Professional | 420 | 7.0% |
| Total | 6,014 | 100.0% |
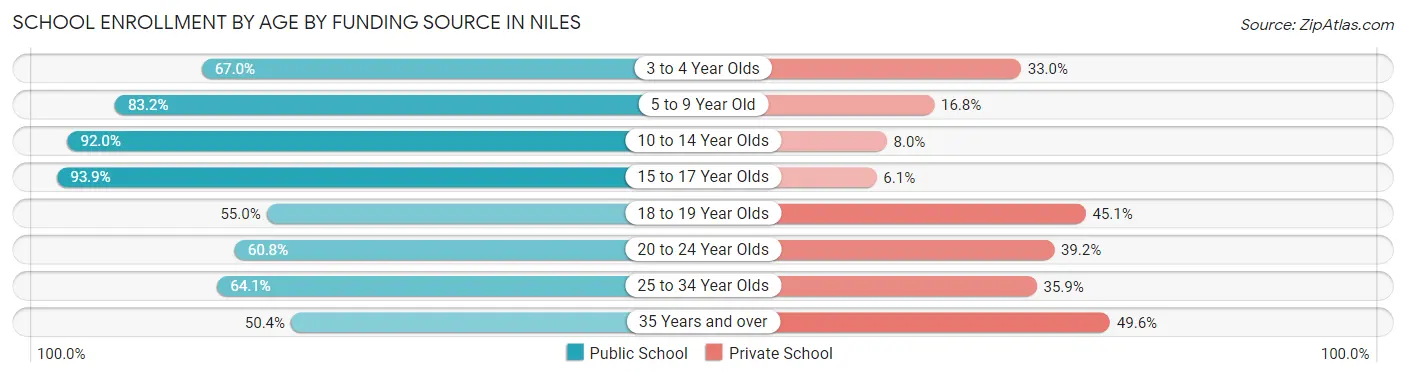
School Enrollment by Age by Funding Source in Niles
Out of a total of 6,014 students who are enrolled in schools in Niles, 1,311 (21.8%) attend a private institution, while the remaining 4,703 (78.2%) are enrolled in public schools. The age group of 35 years and over has the highest likelihood of being enrolled in private schools, with 183 (49.6% in the age bracket) enrolled. Conversely, the age group of 15 to 17 year olds has the lowest likelihood of being enrolled in a private school, with 955 (93.9% in the age bracket) attending a public institution.
| Age Bracket | Public School | Private School |
| 3 to 4 Year Olds | 197 (67.0%) | 97 (33.0%) |
| 5 to 9 Year Old | 1,304 (83.2%) | 264 (16.8%) |
| 10 to 14 Year Olds | 1,139 (92.0%) | 99 (8.0%) |
| 15 to 17 Year Olds | 955 (93.9%) | 62 (6.1%) |
| 18 to 19 Year Olds | 211 (54.9%) | 173 (45.1%) |
| 20 to 24 Year Olds | 469 (60.8%) | 302 (39.2%) |
| 25 to 34 Year Olds | 239 (64.1%) | 134 (35.9%) |
| 35 Years and over | 186 (50.4%) | 183 (49.6%) |
| Total | 4,703 (78.2%) | 1,311 (21.8%) |
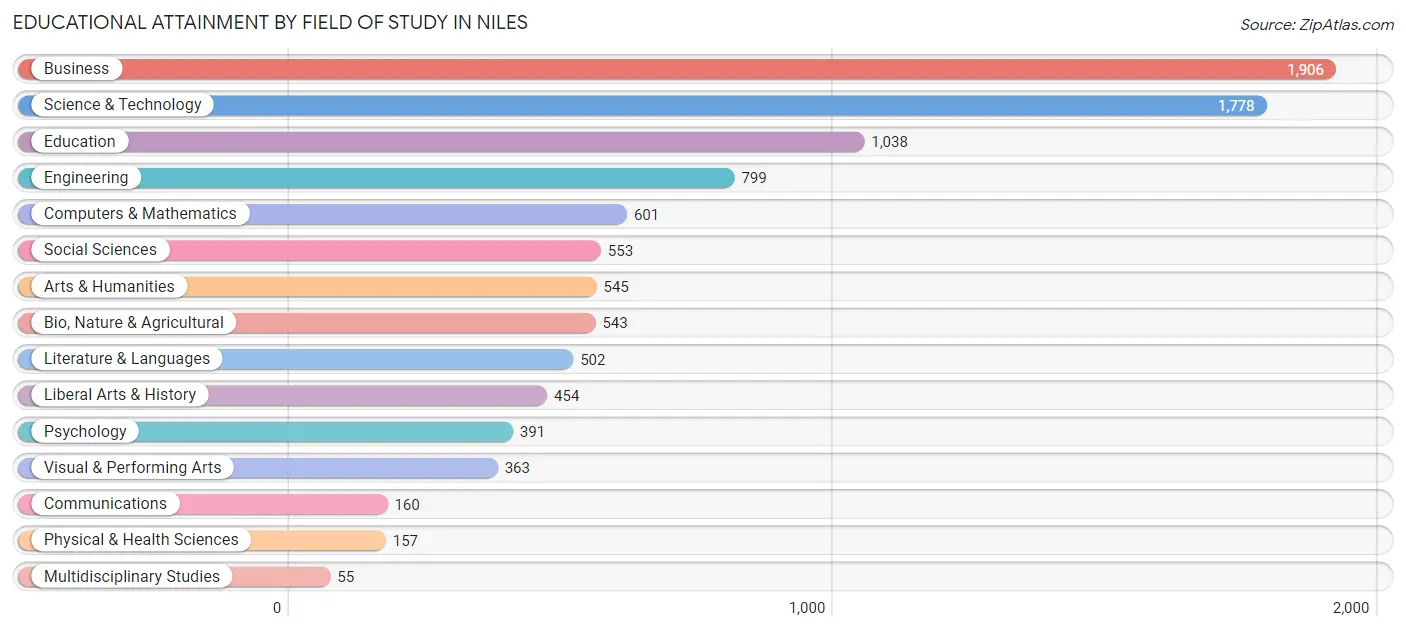
Educational Attainment by Field of Study in Niles
Business (1,906 | 19.4%), science & technology (1,778 | 18.1%), education (1,038 | 10.5%), engineering (799 | 8.1%), and computers & mathematics (601 | 6.1%) are the most common fields of study among 9,845 individuals in Niles who have obtained a bachelor's degree or higher.
| Field of Study | # Graduates | % Graduates |
| Computers & Mathematics | 601 | 6.1% |
| Bio, Nature & Agricultural | 543 | 5.5% |
| Physical & Health Sciences | 157 | 1.6% |
| Psychology | 391 | 4.0% |
| Social Sciences | 553 | 5.6% |
| Engineering | 799 | 8.1% |
| Multidisciplinary Studies | 55 | 0.6% |
| Science & Technology | 1,778 | 18.1% |
| Business | 1,906 | 19.4% |
| Education | 1,038 | 10.5% |
| Literature & Languages | 502 | 5.1% |
| Liberal Arts & History | 454 | 4.6% |
| Visual & Performing Arts | 363 | 3.7% |
| Communications | 160 | 1.6% |
| Arts & Humanities | 545 | 5.5% |
| Total | 9,845 | 100.0% |
Transportation & Commute in Niles
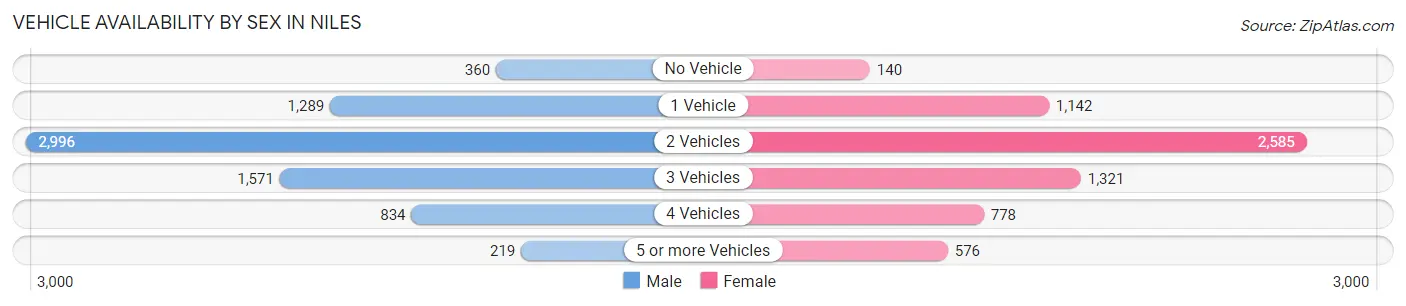
Vehicle Availability by Sex in Niles
The most prevalent vehicle ownership categories in Niles are males with 2 vehicles (2,996, accounting for 41.2%) and females with 2 vehicles (2,585, making up 45.8%).
| Vehicles Available | Male | Female |
| No Vehicle | 360 (5.0%) | 140 (2.1%) |
| 1 Vehicle | 1,289 (17.7%) | 1,142 (17.5%) |
| 2 Vehicles | 2,996 (41.2%) | 2,585 (39.5%) |
| 3 Vehicles | 1,571 (21.6%) | 1,321 (20.2%) |
| 4 Vehicles | 834 (11.5%) | 778 (11.9%) |
| 5 or more Vehicles | 219 (3.0%) | 576 (8.8%) |
| Total | 7,269 (100.0%) | 6,542 (100.0%) |
Commute Time in Niles
The most frequently occuring commute durations in Niles are 30 to 34 minutes (2,309 commuters, 18.2%), 15 to 19 minutes (2,068 commuters, 16.3%), and 20 to 24 minutes (1,736 commuters, 13.7%).

| Commute Time | # Commuters | % Commuters |
| Less than 5 Minutes | 299 | 2.4% |
| 5 to 9 Minutes | 710 | 5.6% |
| 10 to 14 Minutes | 1,361 | 10.7% |
| 15 to 19 Minutes | 2,068 | 16.3% |
| 20 to 24 Minutes | 1,736 | 13.7% |
| 25 to 29 Minutes | 1,088 | 8.6% |
| 30 to 34 Minutes | 2,309 | 18.2% |
| 35 to 39 Minutes | 543 | 4.3% |
| 40 to 44 Minutes | 460 | 3.6% |
| 45 to 59 Minutes | 884 | 7.0% |
| 60 to 89 Minutes | 866 | 6.8% |
| 90 or more Minutes | 385 | 3.0% |
Commute Time by Sex in Niles
The most common commute times in Niles are 30 to 34 minutes (1,296 commuters, 19.6%) for males and 15 to 19 minutes (1,073 commuters, 17.6%) for females.
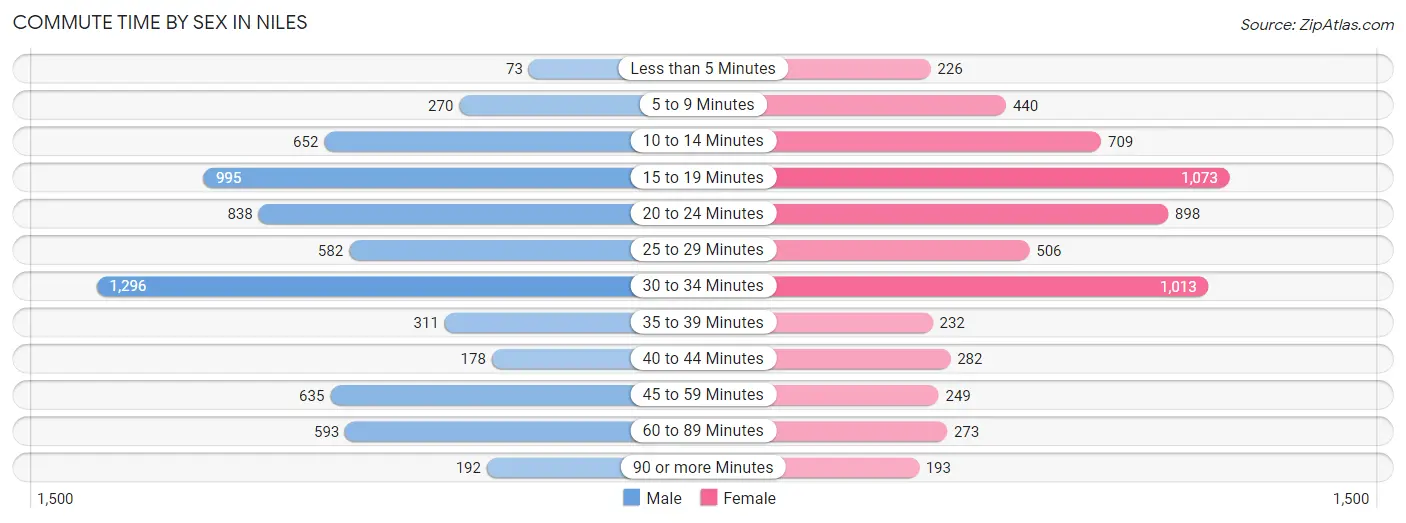
| Commute Time | Male | Female |
| Less than 5 Minutes | 73 (1.1%) | 226 (3.7%) |
| 5 to 9 Minutes | 270 (4.1%) | 440 (7.2%) |
| 10 to 14 Minutes | 652 (9.9%) | 709 (11.6%) |
| 15 to 19 Minutes | 995 (15.0%) | 1,073 (17.6%) |
| 20 to 24 Minutes | 838 (12.7%) | 898 (14.7%) |
| 25 to 29 Minutes | 582 (8.8%) | 506 (8.3%) |
| 30 to 34 Minutes | 1,296 (19.6%) | 1,013 (16.6%) |
| 35 to 39 Minutes | 311 (4.7%) | 232 (3.8%) |
| 40 to 44 Minutes | 178 (2.7%) | 282 (4.6%) |
| 45 to 59 Minutes | 635 (9.6%) | 249 (4.1%) |
| 60 to 89 Minutes | 593 (9.0%) | 273 (4.5%) |
| 90 or more Minutes | 192 (2.9%) | 193 (3.2%) |
Time of Departure to Work by Sex in Niles
The most frequent times of departure to work in Niles are 7:00 AM to 7:29 AM (1,090, 16.5%) for males and 8:00 AM to 8:29 AM (1,083, 17.8%) for females.
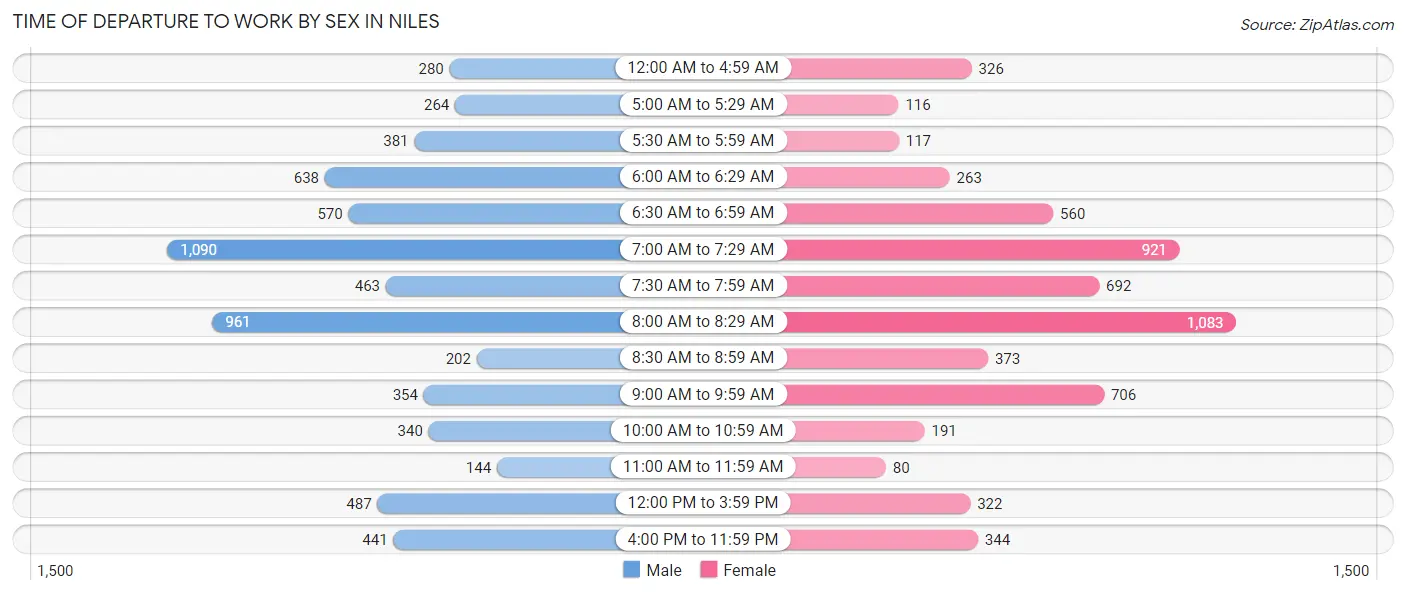
| Time of Departure | Male | Female |
| 12:00 AM to 4:59 AM | 280 (4.2%) | 326 (5.3%) |
| 5:00 AM to 5:29 AM | 264 (4.0%) | 116 (1.9%) |
| 5:30 AM to 5:59 AM | 381 (5.8%) | 117 (1.9%) |
| 6:00 AM to 6:29 AM | 638 (9.6%) | 263 (4.3%) |
| 6:30 AM to 6:59 AM | 570 (8.6%) | 560 (9.2%) |
| 7:00 AM to 7:29 AM | 1,090 (16.5%) | 921 (15.1%) |
| 7:30 AM to 7:59 AM | 463 (7.0%) | 692 (11.4%) |
| 8:00 AM to 8:29 AM | 961 (14.5%) | 1,083 (17.8%) |
| 8:30 AM to 8:59 AM | 202 (3.0%) | 373 (6.1%) |
| 9:00 AM to 9:59 AM | 354 (5.3%) | 706 (11.6%) |
| 10:00 AM to 10:59 AM | 340 (5.1%) | 191 (3.1%) |
| 11:00 AM to 11:59 AM | 144 (2.2%) | 80 (1.3%) |
| 12:00 PM to 3:59 PM | 487 (7.4%) | 322 (5.3%) |
| 4:00 PM to 11:59 PM | 441 (6.7%) | 344 (5.6%) |
| Total | 6,615 (100.0%) | 6,094 (100.0%) |
Housing Occupancy in Niles
Occupancy by Ownership in Niles
Of the total 11,332 dwellings in Niles, owner-occupied units account for 8,666 (76.5%), while renter-occupied units make up 2,666 (23.5%).
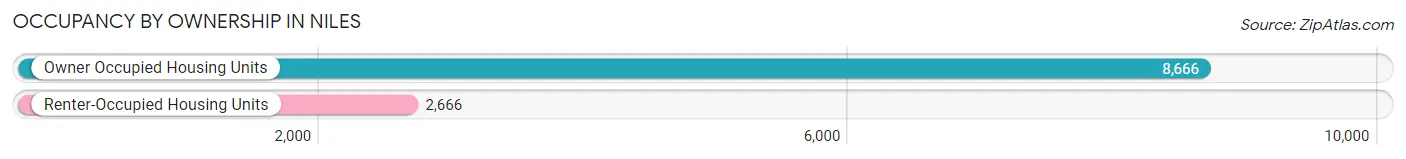
| Occupancy | # Housing Units | % Housing Units |
| Owner Occupied Housing Units | 8,666 | 76.5% |
| Renter-Occupied Housing Units | 2,666 | 23.5% |
| Total Occupied Housing Units | 11,332 | 100.0% |
Occupancy by Household Size in Niles
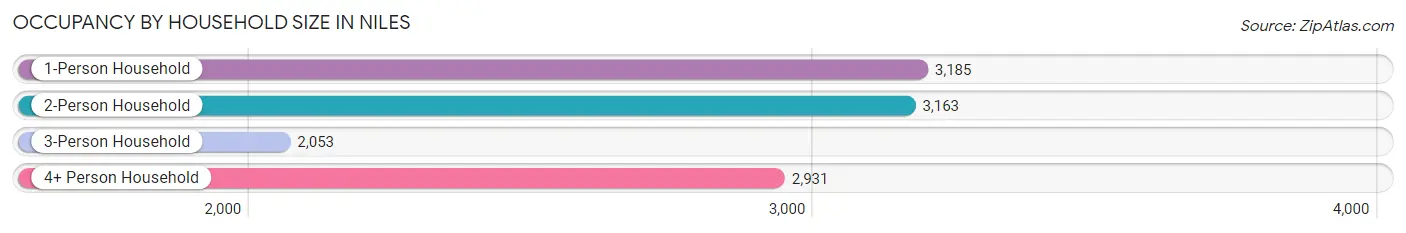
| Household Size | # Housing Units | % Housing Units |
| 1-Person Household | 3,185 | 28.1% |
| 2-Person Household | 3,163 | 27.9% |
| 3-Person Household | 2,053 | 18.1% |
| 4+ Person Household | 2,931 | 25.9% |
| Total Housing Units | 11,332 | 100.0% |
Occupancy by Ownership by Household Size in Niles
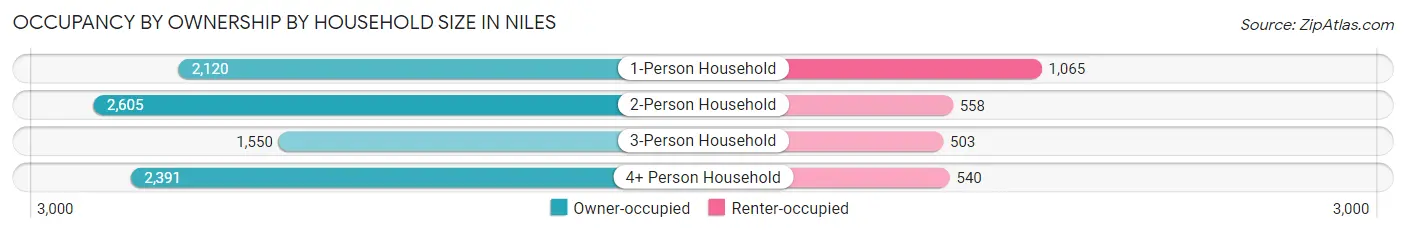
| Household Size | Owner-occupied | Renter-occupied |
| 1-Person Household | 2,120 (66.6%) | 1,065 (33.4%) |
| 2-Person Household | 2,605 (82.4%) | 558 (17.6%) |
| 3-Person Household | 1,550 (75.5%) | 503 (24.5%) |
| 4+ Person Household | 2,391 (81.6%) | 540 (18.4%) |
| Total Housing Units | 8,666 (76.5%) | 2,666 (23.5%) |
Occupancy by Educational Attainment in Niles
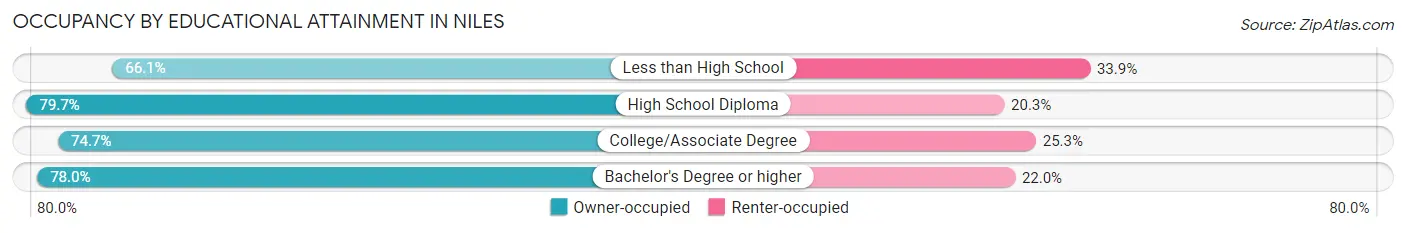
| Household Size | Owner-occupied | Renter-occupied |
| Less than High School | 727 (66.1%) | 373 (33.9%) |
| High School Diploma | 2,236 (79.7%) | 569 (20.3%) |
| College/Associate Degree | 2,011 (74.7%) | 682 (25.3%) |
| Bachelor's Degree or higher | 3,692 (78.0%) | 1,042 (22.0%) |
Occupancy by Age of Householder in Niles
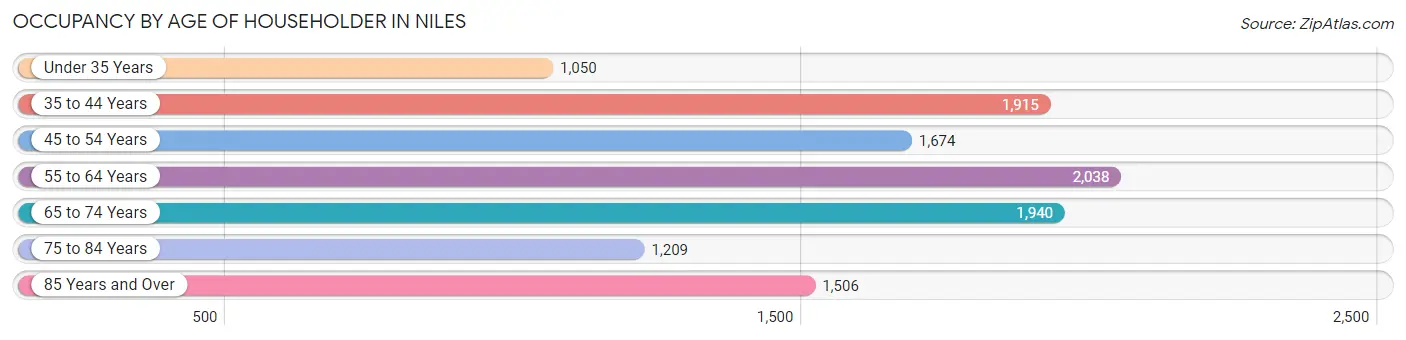
| Age Bracket | # Households | % Households |
| Under 35 Years | 1,050 | 9.3% |
| 35 to 44 Years | 1,915 | 16.9% |
| 45 to 54 Years | 1,674 | 14.8% |
| 55 to 64 Years | 2,038 | 18.0% |
| 65 to 74 Years | 1,940 | 17.1% |
| 75 to 84 Years | 1,209 | 10.7% |
| 85 Years and Over | 1,506 | 13.3% |
| Total | 11,332 | 100.0% |
Housing Finances in Niles
Median Income by Occupancy in Niles
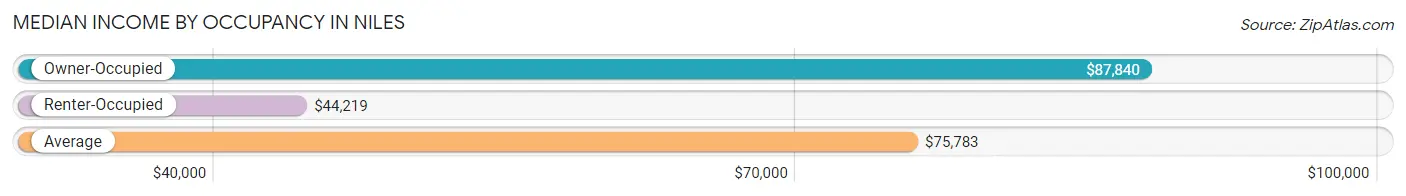
| Occupancy Type | # Households | Median Income |
| Owner-Occupied | 8,666 (76.5%) | $87,840 |
| Renter-Occupied | 2,666 (23.5%) | $44,219 |
| Average | 11,332 (100.0%) | $75,783 |
Occupancy by Householder Income Bracket in Niles
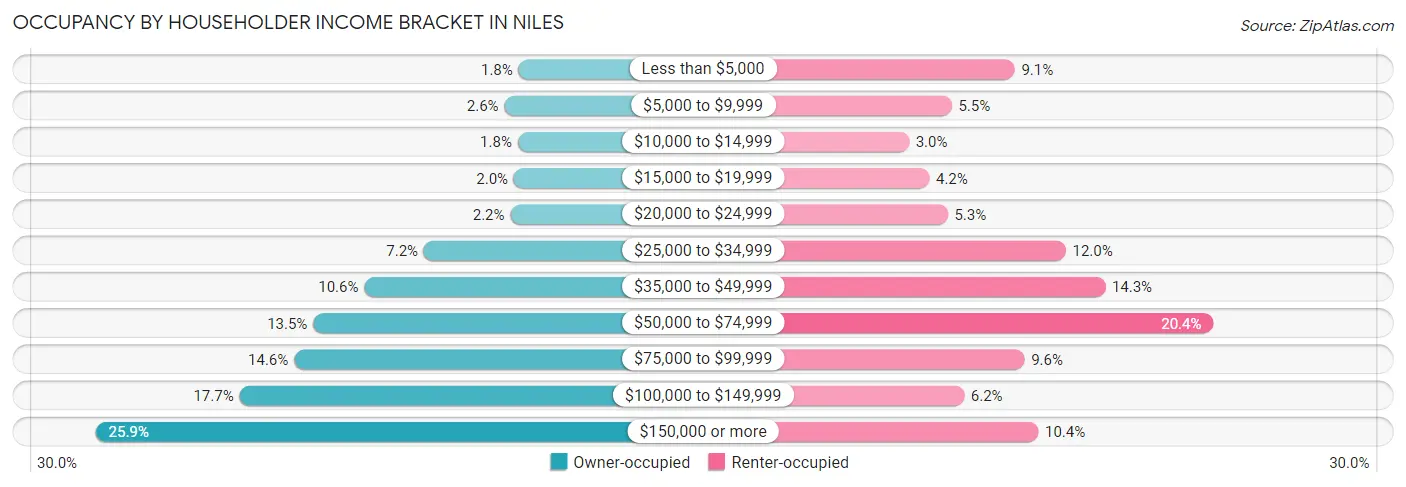
| Income Bracket | Owner-occupied | Renter-occupied |
| Less than $5,000 | 153 (1.8%) | 242 (9.1%) |
| $5,000 to $9,999 | 224 (2.6%) | 146 (5.5%) |
| $10,000 to $14,999 | 158 (1.8%) | 81 (3.0%) |
| $15,000 to $19,999 | 177 (2.0%) | 112 (4.2%) |
| $20,000 to $24,999 | 194 (2.2%) | 140 (5.2%) |
| $25,000 to $34,999 | 622 (7.2%) | 320 (12.0%) |
| $35,000 to $49,999 | 918 (10.6%) | 380 (14.2%) |
| $50,000 to $74,999 | 1,171 (13.5%) | 545 (20.4%) |
| $75,000 to $99,999 | 1,265 (14.6%) | 257 (9.6%) |
| $100,000 to $149,999 | 1,536 (17.7%) | 165 (6.2%) |
| $150,000 or more | 2,248 (25.9%) | 278 (10.4%) |
| Total | 8,666 (100.0%) | 2,666 (100.0%) |
Monthly Housing Cost Tiers in Niles
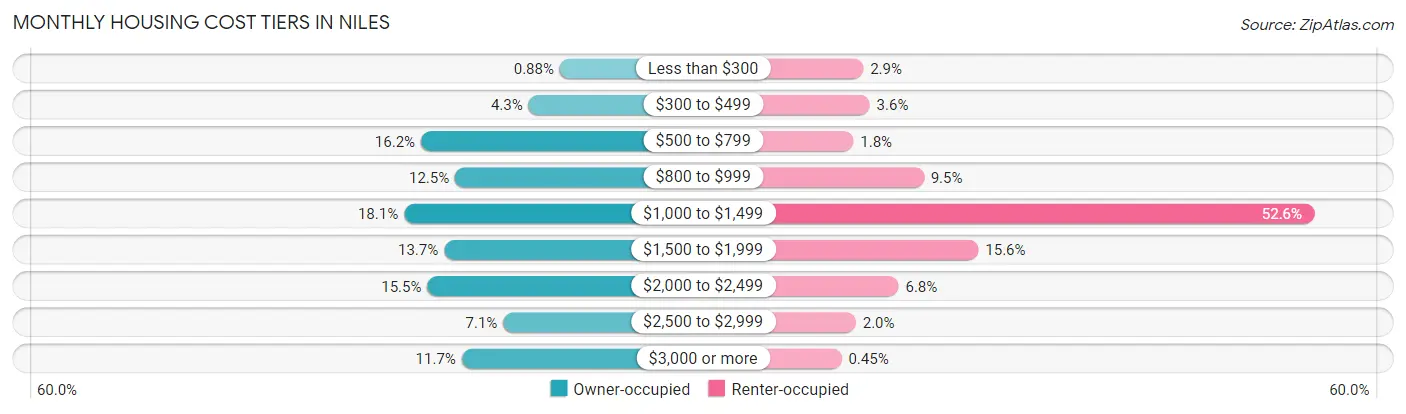
| Monthly Cost | Owner-occupied | Renter-occupied |
| Less than $300 | 76 (0.9%) | 76 (2.9%) |
| $300 to $499 | 375 (4.3%) | 95 (3.6%) |
| $500 to $799 | 1,406 (16.2%) | 47 (1.8%) |
| $800 to $999 | 1,079 (12.4%) | 254 (9.5%) |
| $1,000 to $1,499 | 1,568 (18.1%) | 1,403 (52.6%) |
| $1,500 to $1,999 | 1,184 (13.7%) | 415 (15.6%) |
| $2,000 to $2,499 | 1,344 (15.5%) | 180 (6.8%) |
| $2,500 to $2,999 | 618 (7.1%) | 54 (2.0%) |
| $3,000 or more | 1,016 (11.7%) | 12 (0.4%) |
| Total | 8,666 (100.0%) | 2,666 (100.0%) |
Physical Housing Characteristics in Niles
Housing Structures in Niles
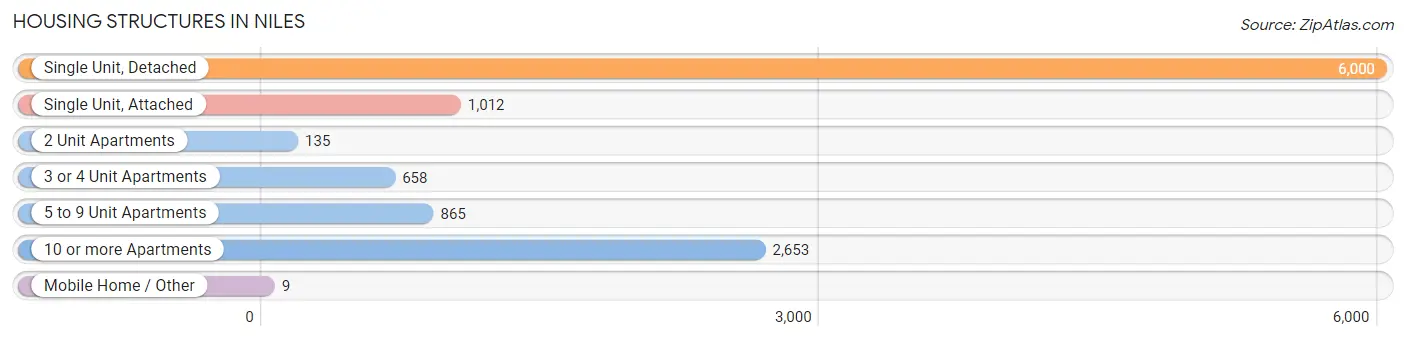
| Structure Type | # Housing Units | % Housing Units |
| Single Unit, Detached | 6,000 | 52.9% |
| Single Unit, Attached | 1,012 | 8.9% |
| 2 Unit Apartments | 135 | 1.2% |
| 3 or 4 Unit Apartments | 658 | 5.8% |
| 5 to 9 Unit Apartments | 865 | 7.6% |
| 10 or more Apartments | 2,653 | 23.4% |
| Mobile Home / Other | 9 | 0.1% |
| Total | 11,332 | 100.0% |
Housing Structures by Occupancy in Niles
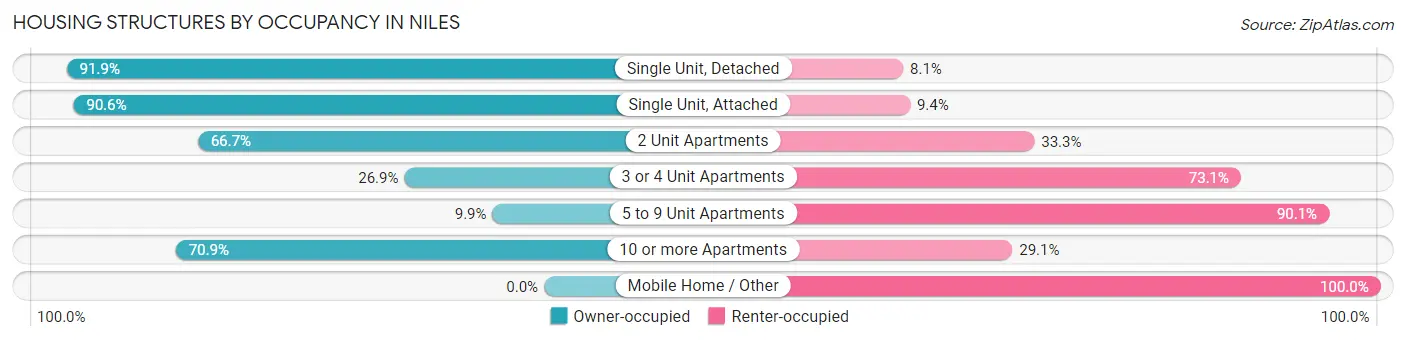
| Structure Type | Owner-occupied | Renter-occupied |
| Single Unit, Detached | 5,515 (91.9%) | 485 (8.1%) |
| Single Unit, Attached | 917 (90.6%) | 95 (9.4%) |
| 2 Unit Apartments | 90 (66.7%) | 45 (33.3%) |
| 3 or 4 Unit Apartments | 177 (26.9%) | 481 (73.1%) |
| 5 to 9 Unit Apartments | 86 (9.9%) | 779 (90.1%) |
| 10 or more Apartments | 1,881 (70.9%) | 772 (29.1%) |
| Mobile Home / Other | 0 (0.0%) | 9 (100.0%) |
| Total | 8,666 (76.5%) | 2,666 (23.5%) |
Housing Structures by Number of Rooms in Niles
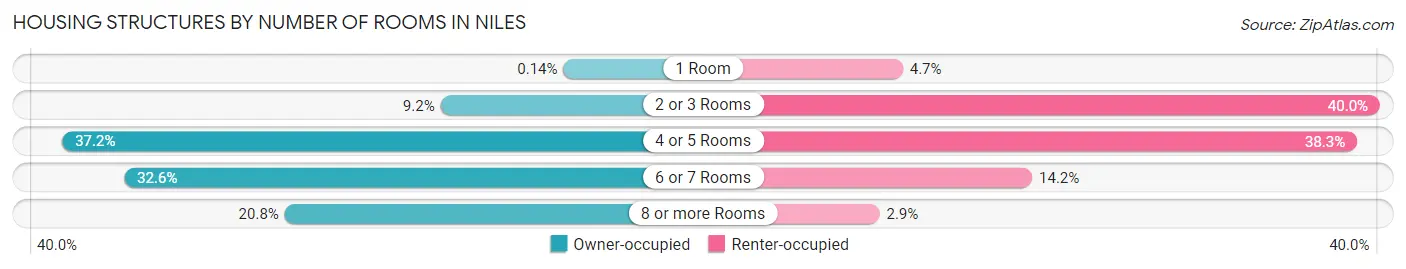
| Number of Rooms | Owner-occupied | Renter-occupied |
| 1 Room | 12 (0.1%) | 124 (4.6%) |
| 2 or 3 Rooms | 800 (9.2%) | 1,065 (40.0%) |
| 4 or 5 Rooms | 3,226 (37.2%) | 1,020 (38.3%) |
| 6 or 7 Rooms | 2,829 (32.6%) | 379 (14.2%) |
| 8 or more Rooms | 1,799 (20.8%) | 78 (2.9%) |
| Total | 8,666 (100.0%) | 2,666 (100.0%) |
Housing Structure by Heating Type in Niles
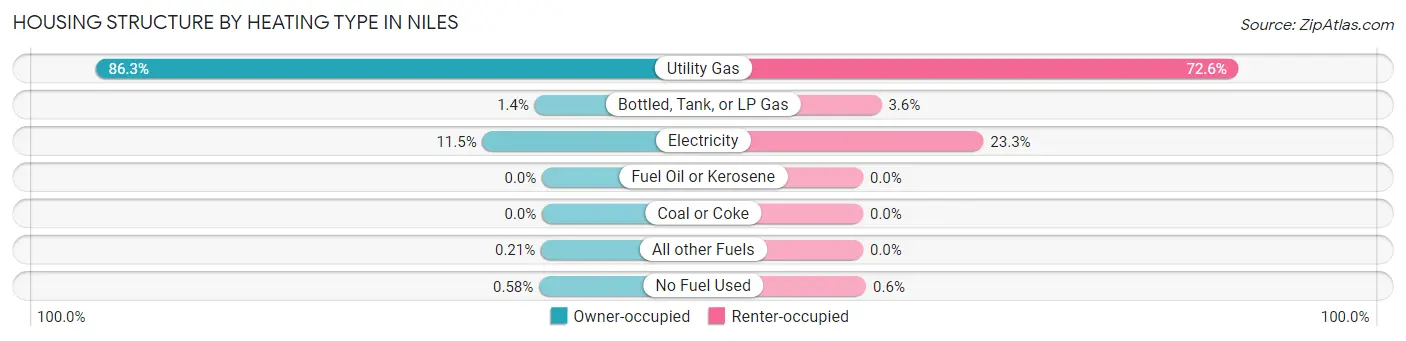
| Heating Type | Owner-occupied | Renter-occupied |
| Utility Gas | 7,478 (86.3%) | 1,935 (72.6%) |
| Bottled, Tank, or LP Gas | 122 (1.4%) | 95 (3.6%) |
| Electricity | 998 (11.5%) | 620 (23.3%) |
| Fuel Oil or Kerosene | 0 (0.0%) | 0 (0.0%) |
| Coal or Coke | 0 (0.0%) | 0 (0.0%) |
| All other Fuels | 18 (0.2%) | 0 (0.0%) |
| No Fuel Used | 50 (0.6%) | 16 (0.6%) |
| Total | 8,666 (100.0%) | 2,666 (100.0%) |
Household Vehicle Usage in Niles
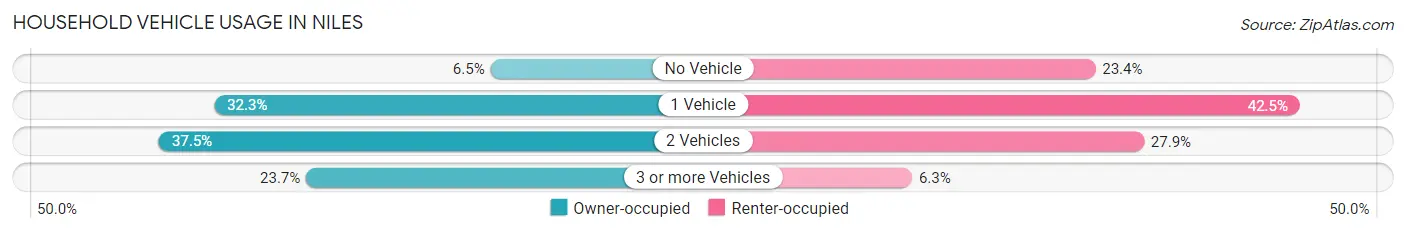
| Vehicles per Household | Owner-occupied | Renter-occupied |
| No Vehicle | 564 (6.5%) | 623 (23.4%) |
| 1 Vehicle | 2,800 (32.3%) | 1,132 (42.5%) |
| 2 Vehicles | 3,246 (37.5%) | 744 (27.9%) |
| 3 or more Vehicles | 2,056 (23.7%) | 167 (6.3%) |
| Total | 8,666 (100.0%) | 2,666 (100.0%) |
Real Estate & Mortgages in Niles
Real Estate and Mortgage Overview in Niles
| Characteristic | Without Mortgage | With Mortgage |
| Housing Units | 3,732 | 4,934 |
| Median Property Value | $309,500 | $354,100 |
| Median Household Income | $55,900 | $1,816 |
| Monthly Housing Costs | $807 | $1,016 |
| Real Estate Taxes | $5,211 | $12 |
Property Value by Mortgage Status in Niles
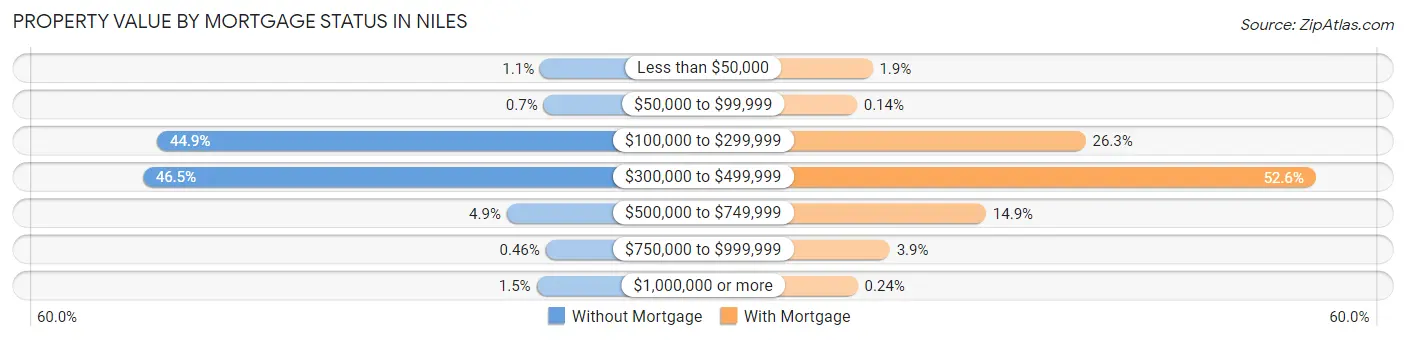
| Property Value | Without Mortgage | With Mortgage |
| Less than $50,000 | 41 (1.1%) | 95 (1.9%) |
| $50,000 to $99,999 | 26 (0.7%) | 7 (0.1%) |
| $100,000 to $299,999 | 1,674 (44.9%) | 1,297 (26.3%) |
| $300,000 to $499,999 | 1,735 (46.5%) | 2,595 (52.6%) |
| $500,000 to $749,999 | 183 (4.9%) | 735 (14.9%) |
| $750,000 to $999,999 | 17 (0.5%) | 193 (3.9%) |
| $1,000,000 or more | 56 (1.5%) | 12 (0.2%) |
| Total | 3,732 (100.0%) | 4,934 (100.0%) |
Household Income by Mortgage Status in Niles
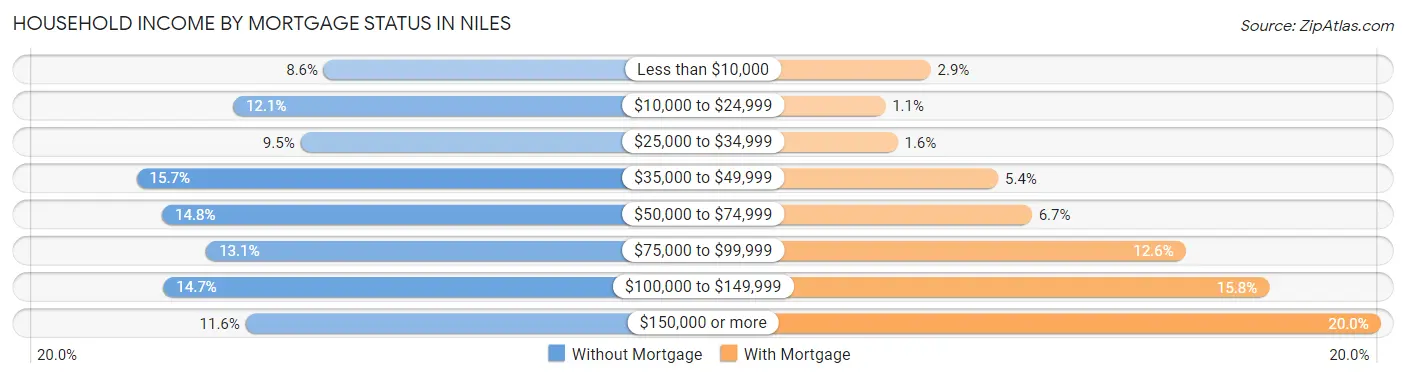
| Household Income | Without Mortgage | With Mortgage |
| Less than $10,000 | 321 (8.6%) | 141 (2.9%) |
| $10,000 to $24,999 | 450 (12.1%) | 56 (1.1%) |
| $25,000 to $34,999 | 354 (9.5%) | 79 (1.6%) |
| $35,000 to $49,999 | 587 (15.7%) | 268 (5.4%) |
| $50,000 to $74,999 | 551 (14.8%) | 331 (6.7%) |
| $75,000 to $99,999 | 488 (13.1%) | 620 (12.6%) |
| $100,000 to $149,999 | 549 (14.7%) | 777 (15.8%) |
| $150,000 or more | 432 (11.6%) | 987 (20.0%) |
| Total | 3,732 (100.0%) | 4,934 (100.0%) |
Property Value to Household Income Ratio in Niles
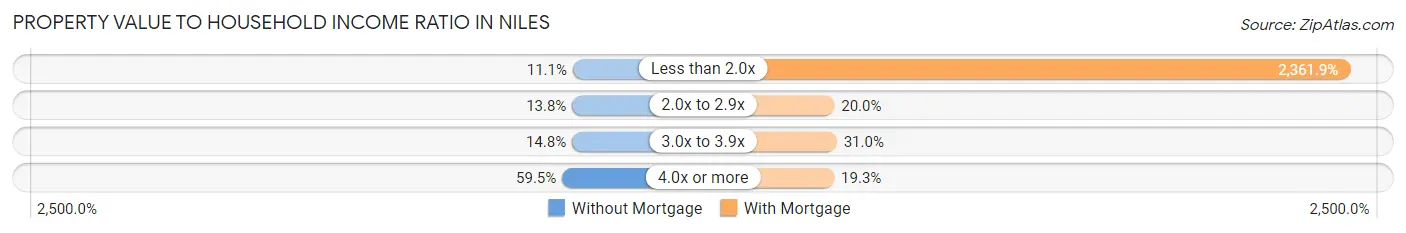
| Value-to-Income Ratio | Without Mortgage | With Mortgage |
| Less than 2.0x | 415 (11.1%) | 116,538 (2,361.9%) |
| 2.0x to 2.9x | 513 (13.8%) | 989 (20.0%) |
| 3.0x to 3.9x | 552 (14.8%) | 1,527 (30.9%) |
| 4.0x or more | 2,220 (59.5%) | 950 (19.3%) |
| Total | 3,732 (100.0%) | 4,934 (100.0%) |
Real Estate Taxes by Mortgage Status in Niles
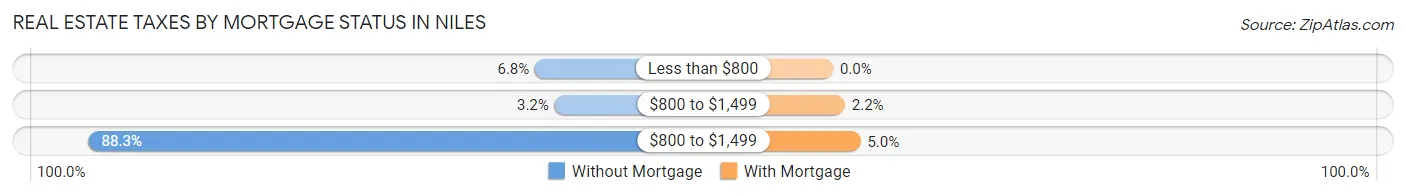
| Property Taxes | Without Mortgage | With Mortgage |
| Less than $800 | 252 (6.8%) | 0 (0.0%) |
| $800 to $1,499 | 119 (3.2%) | 106 (2.1%) |
| $800 to $1,499 | 3,295 (88.3%) | 247 (5.0%) |
| Total | 3,732 (100.0%) | 4,934 (100.0%) |
Health & Disability in Niles
Health Insurance Coverage by Age in Niles
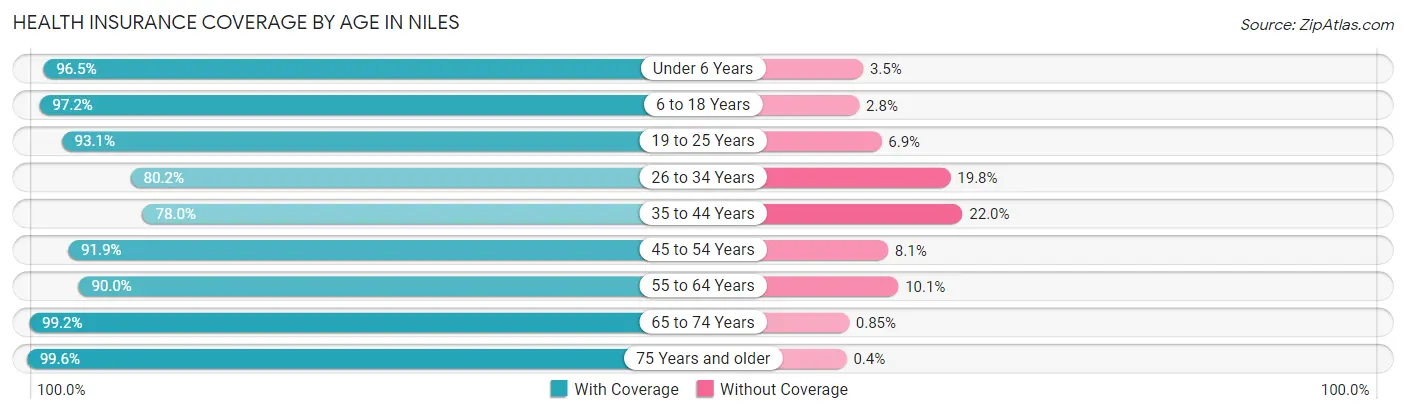
| Age Bracket | With Coverage | Without Coverage |
| Under 6 Years | 1,663 (96.5%) | 60 (3.5%) |
| 6 to 18 Years | 3,787 (97.2%) | 108 (2.8%) |
| 19 to 25 Years | 1,804 (93.1%) | 134 (6.9%) |
| 26 to 34 Years | 2,519 (80.2%) | 621 (19.8%) |
| 35 to 44 Years | 3,077 (78.0%) | 869 (22.0%) |
| 45 to 54 Years | 3,333 (91.9%) | 295 (8.1%) |
| 55 to 64 Years | 3,589 (89.9%) | 401 (10.1%) |
| 65 to 74 Years | 3,157 (99.2%) | 27 (0.9%) |
| 75 Years and older | 3,950 (99.6%) | 16 (0.4%) |
| Total | 26,879 (91.4%) | 2,531 (8.6%) |
Health Insurance Coverage by Citizenship Status in Niles
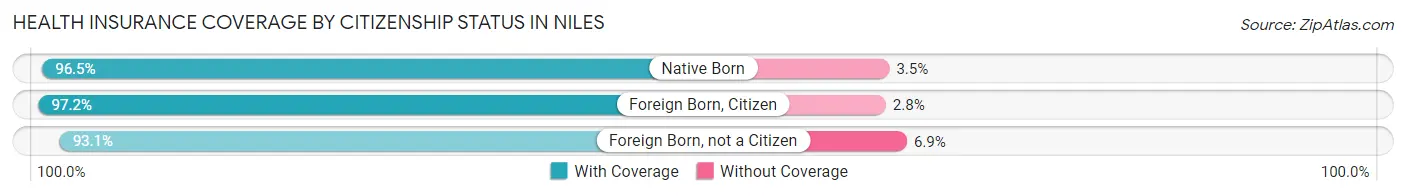
| Citizenship Status | With Coverage | Without Coverage |
| Native Born | 1,663 (96.5%) | 60 (3.5%) |
| Foreign Born, Citizen | 3,787 (97.2%) | 108 (2.8%) |
| Foreign Born, not a Citizen | 1,804 (93.1%) | 134 (6.9%) |
Health Insurance Coverage by Household Income in Niles
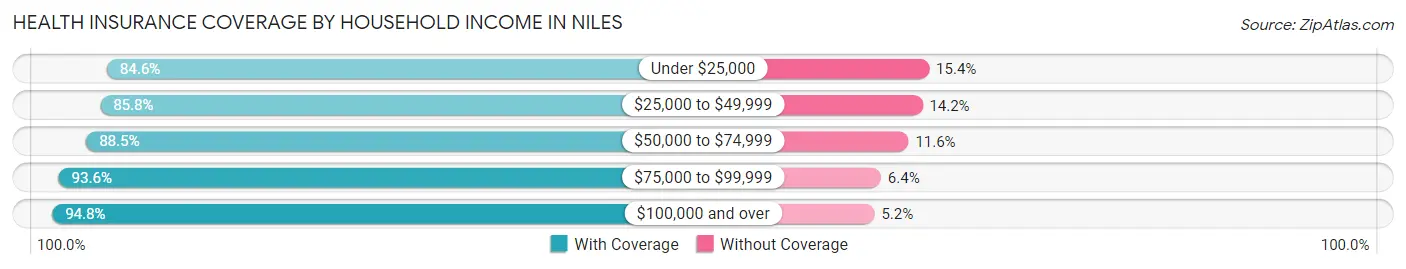
| Household Income | With Coverage | Without Coverage |
| Under $25,000 | 1,989 (84.6%) | 363 (15.4%) |
| $25,000 to $49,999 | 4,174 (85.8%) | 689 (14.2%) |
| $50,000 to $74,999 | 3,905 (88.4%) | 510 (11.6%) |
| $75,000 to $99,999 | 3,822 (93.6%) | 261 (6.4%) |
| $100,000 and over | 12,954 (94.8%) | 707 (5.2%) |
Public vs Private Health Insurance Coverage by Age in Niles
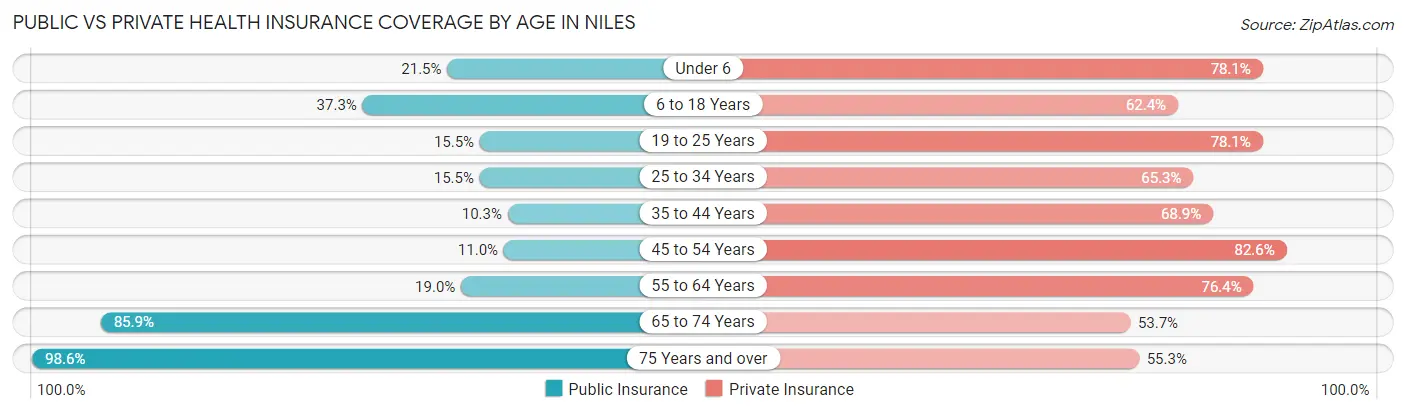
| Age Bracket | Public Insurance | Private Insurance |
| Under 6 | 371 (21.5%) | 1,346 (78.1%) |
| 6 to 18 Years | 1,451 (37.2%) | 2,430 (62.4%) |
| 19 to 25 Years | 300 (15.5%) | 1,514 (78.1%) |
| 25 to 34 Years | 487 (15.5%) | 2,049 (65.2%) |
| 35 to 44 Years | 407 (10.3%) | 2,719 (68.9%) |
| 45 to 54 Years | 400 (11.0%) | 2,995 (82.6%) |
| 55 to 64 Years | 757 (19.0%) | 3,049 (76.4%) |
| 65 to 74 Years | 2,734 (85.9%) | 1,709 (53.7%) |
| 75 Years and over | 3,910 (98.6%) | 2,193 (55.3%) |
| Total | 10,817 (36.8%) | 20,004 (68.0%) |
Disability Status by Sex by Age in Niles
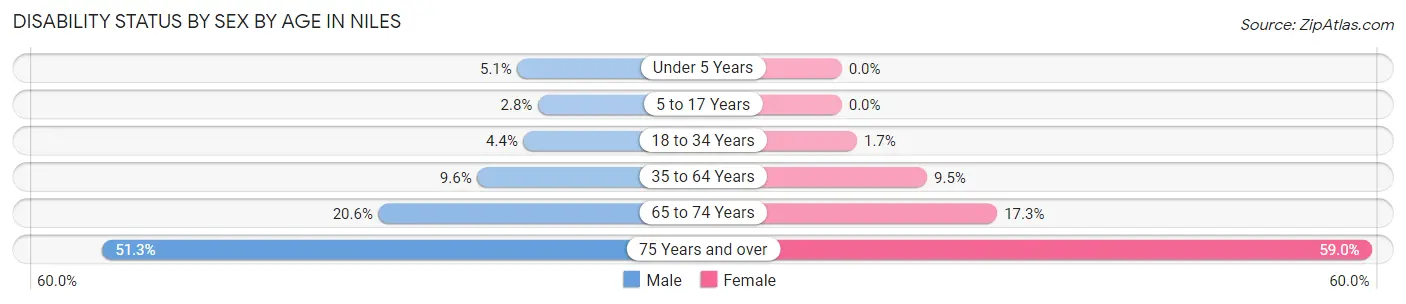
| Age Bracket | Male | Female |
| Under 5 Years | 33 (5.1%) | 0 (0.0%) |
| 5 to 17 Years | 63 (2.8%) | 0 (0.0%) |
| 18 to 34 Years | 121 (4.4%) | 44 (1.7%) |
| 35 to 64 Years | 560 (9.6%) | 542 (9.5%) |
| 65 to 74 Years | 321 (20.6%) | 281 (17.3%) |
| 75 Years and over | 747 (51.3%) | 1,481 (59.0%) |
Disability Class by Sex by Age in Niles
Disability Class: Hearing Difficulty
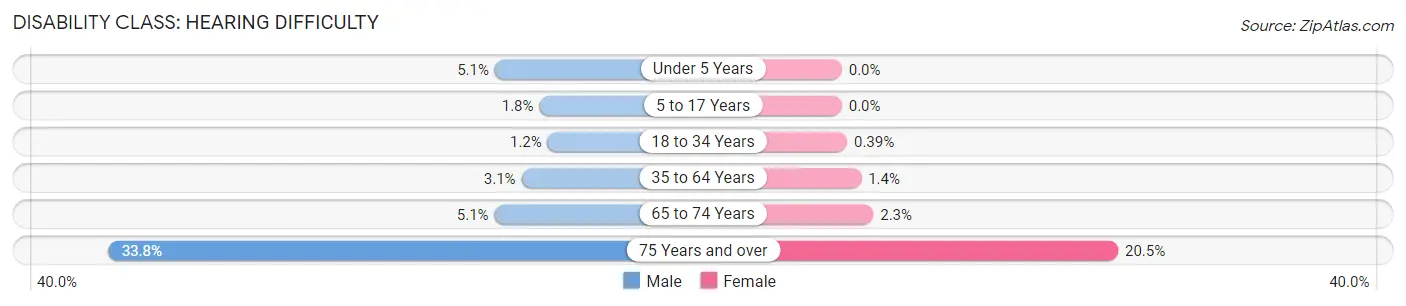
| Age Bracket | Male | Female |
| Under 5 Years | 33 (5.1%) | 0 (0.0%) |
| 5 to 17 Years | 40 (1.8%) | 0 (0.0%) |
| 18 to 34 Years | 32 (1.2%) | 10 (0.4%) |
| 35 to 64 Years | 182 (3.1%) | 82 (1.4%) |
| 65 to 74 Years | 80 (5.1%) | 38 (2.3%) |
| 75 Years and over | 491 (33.8%) | 515 (20.5%) |
Disability Class: Vision Difficulty
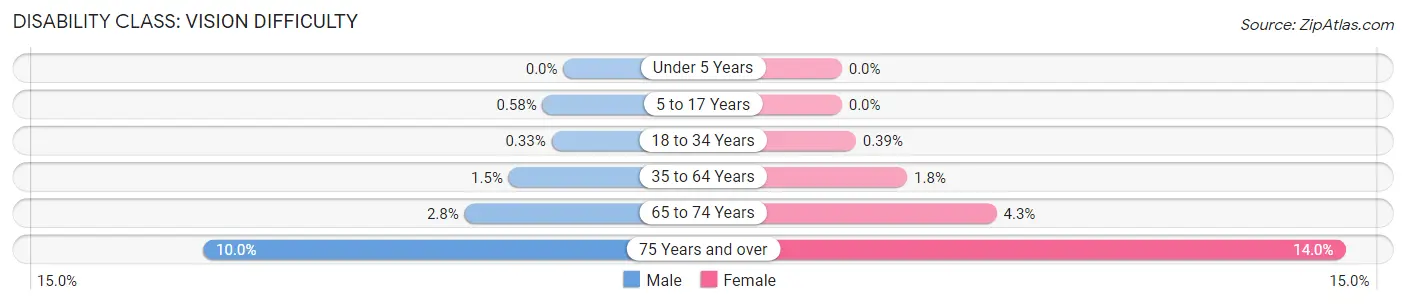
| Age Bracket | Male | Female |
| Under 5 Years | 0 (0.0%) | 0 (0.0%) |
| 5 to 17 Years | 13 (0.6%) | 0 (0.0%) |
| 18 to 34 Years | 9 (0.3%) | 10 (0.4%) |
| 35 to 64 Years | 89 (1.5%) | 104 (1.8%) |
| 65 to 74 Years | 43 (2.8%) | 70 (4.3%) |
| 75 Years and over | 146 (10.0%) | 352 (14.0%) |
Disability Class: Cognitive Difficulty
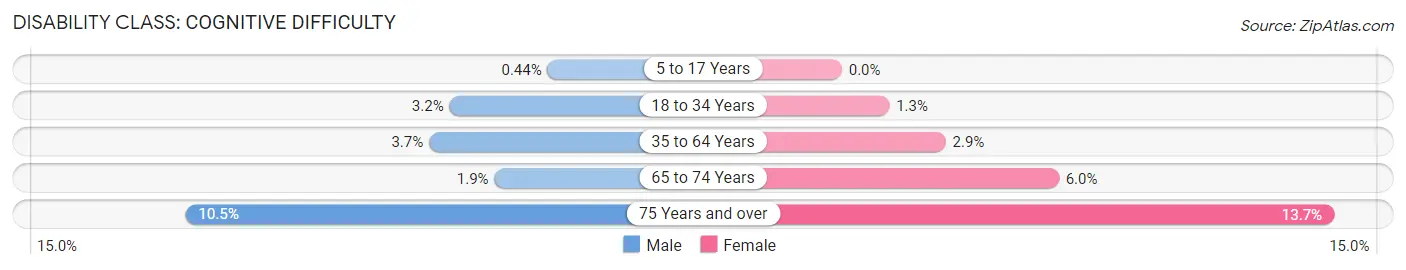
| Age Bracket | Male | Female |
| 5 to 17 Years | 10 (0.4%) | 0 (0.0%) |
| 18 to 34 Years | 87 (3.2%) | 34 (1.3%) |
| 35 to 64 Years | 219 (3.7%) | 165 (2.9%) |
| 65 to 74 Years | 30 (1.9%) | 98 (6.0%) |
| 75 Years and over | 153 (10.5%) | 344 (13.7%) |
Disability Class: Ambulatory Difficulty
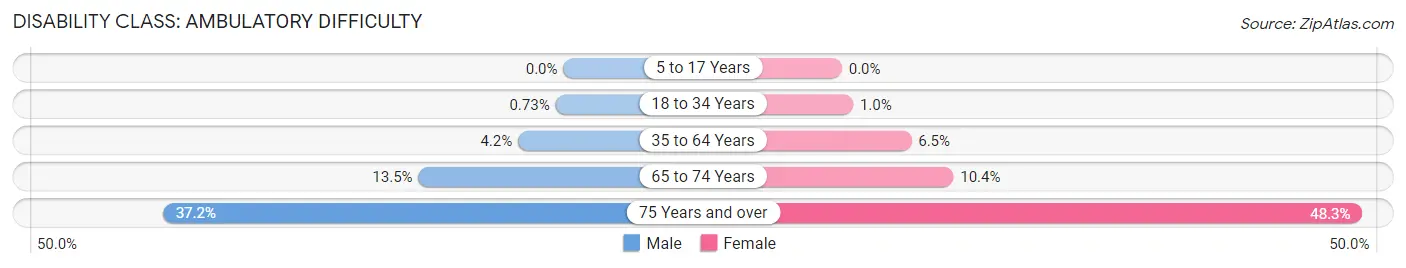
| Age Bracket | Male | Female |
| 5 to 17 Years | 0 (0.0%) | 0 (0.0%) |
| 18 to 34 Years | 20 (0.7%) | 27 (1.0%) |
| 35 to 64 Years | 246 (4.2%) | 368 (6.5%) |
| 65 to 74 Years | 210 (13.5%) | 168 (10.3%) |
| 75 Years and over | 541 (37.2%) | 1,213 (48.3%) |
Disability Class: Self-Care Difficulty
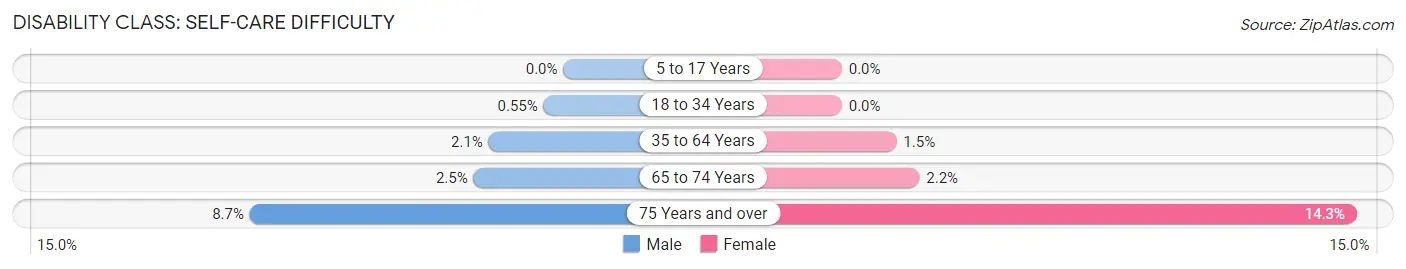
| Age Bracket | Male | Female |
| 5 to 17 Years | 0 (0.0%) | 0 (0.0%) |
| 18 to 34 Years | 15 (0.5%) | 0 (0.0%) |
| 35 to 64 Years | 122 (2.1%) | 87 (1.5%) |
| 65 to 74 Years | 39 (2.5%) | 35 (2.2%) |
| 75 Years and over | 127 (8.7%) | 360 (14.3%) |
Technology Access in Niles
Computing Device Access in Niles
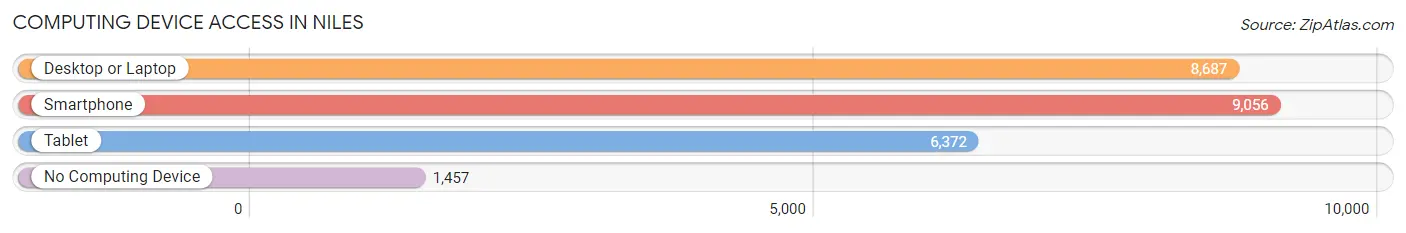
| Device Type | # Households | % Households |
| Desktop or Laptop | 8,687 | 76.7% |
| Smartphone | 9,056 | 79.9% |
| Tablet | 6,372 | 56.2% |
| No Computing Device | 1,457 | 12.9% |
| Total | 11,332 | 100.0% |
Internet Access in Niles
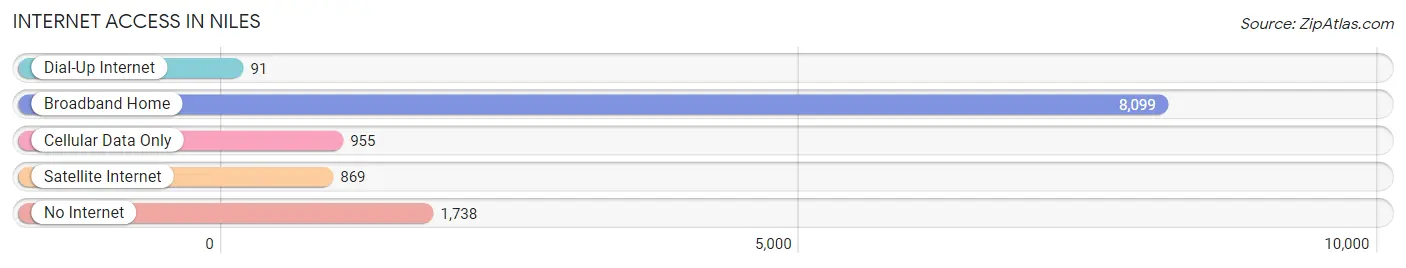
| Internet Type | # Households | % Households |
| Dial-Up Internet | 91 | 0.8% |
| Broadband Home | 8,099 | 71.5% |
| Cellular Data Only | 955 | 8.4% |
| Satellite Internet | 869 | 7.7% |
| No Internet | 1,738 | 15.3% |
| Total | 11,332 | 100.0% |
Niles Summary
Niles, Illinois is a village located in Cook and Lake counties in the state of Illinois. It is a part of the Chicago metropolitan area and is located approximately 15 miles northwest of downtown Chicago. The population of Niles was 29,803 at the 2010 census.
History
Niles was first settled in 1827 by George and Elizabeth Niles, who were originally from New York. The village was incorporated in 1899 and was named after the Niles family. The village was originally a farming community, but it soon developed into a manufacturing center. In the early 1900s, Niles was home to several factories, including the Niles Tool Works, which produced tools and machinery.
In the 1950s, Niles began to experience rapid growth due to its proximity to Chicago. The population of the village increased from 4,000 in 1950 to over 30,000 by the end of the decade. This growth was largely due to the construction of the Edens Expressway, which connected Niles to Chicago.
Geography
Niles is located in Cook and Lake counties in the state of Illinois. It is a part of the Chicago metropolitan area and is located approximately 15 miles northwest of downtown Chicago. The village is bordered by the Des Plaines River to the east and the North Branch of the Chicago River to the west.
The village has a total area of 5.2 square miles, of which 5.1 square miles is land and 0.1 square miles is water. The village is located at an elevation of 645 feet above sea level.
Economy
Niles is a primarily residential community, but it also has a strong industrial base. The village is home to several large companies, including the Niles Tool Works, which produces tools and machinery, and the Niles Manufacturing Company, which produces automotive parts.
The village also has a thriving retail sector, with several shopping centers and malls located in the area. The village is also home to several restaurants, bars, and other entertainment venues.
Demographics
As of the 2010 census, the population of Niles was 29,803. The racial makeup of the village was 79.2% White, 5.3% African American, 0.3% Native American, 6.2% Asian, 0.1% Pacific Islander, 5.2% from other races, and 3.7% from two or more races. Hispanic or Latino of any race were 13.3% of the population.
The median income for a household in the village was $50,945, and the median income for a family was $60,945. The per capita income for the village was $25,945. About 5.2% of families and 7.2% of the population were below the poverty line, including 8.2% of those under age 18 and 5.2% of those age 65 or over.
Common Questions
What is Per Capita Income in Niles?
Per Capita income in Niles is $39,419.
What is the Median Family Income in Niles?
Median Family Income in Niles is $95,719.
What is the Median Household income in Niles?
Median Household Income in Niles is $75,783.
What is Income or Wage Gap in Niles?
Income or Wage Gap in Niles is 20.1%.
Women in Niles earn 79.9 cents for every dollar earned by a man.
What is Inequality or Gini Index in Niles?
Inequality or Gini Index in Niles is 0.47.
What is the Total Population of Niles?
Total Population of Niles is 30,637.
What is the Total Male Population of Niles?
Total Male Population of Niles is 15,125.
What is the Total Female Population of Niles?
Total Female Population of Niles is 15,512.
What is the Ratio of Males per 100 Females in Niles?
There are 97.51 Males per 100 Females in Niles.
What is the Ratio of Females per 100 Males in Niles?
There are 102.56 Females per 100 Males in Niles.
What is the Median Population Age in Niles?
Median Population Age in Niles is 47.1 Years.
What is the Average Family Size in Niles
Average Family Size in Niles is 3.2 People.
What is the Average Household Size in Niles
Average Household Size in Niles is 2.6 People.
How Large is the Labor Force in Niles?
There are 15,179 People in the Labor Forcein in Niles.
What is the Percentage of People in the Labor Force in Niles?
58.8% of People are in the Labor Force in Niles.
What is the Unemployment Rate in Niles?
Unemployment Rate in Niles is 6.2%.