Gresham, OR Map & Demographics
Gresham Map
Gresham Overview
$33,931
PER CAPITA INCOME
$81,414
AVG FAMILY INCOME
$69,437
AVG HOUSEHOLD INCOME
20.2%
WAGE / INCOME GAP [ % ]
79.8¢/ $1
WAGE / INCOME GAP [ $ ]
$11,452
FAMILY INCOME DEFICIT
0.43
INEQUALITY / GINI INDEX
113,525
TOTAL POPULATION
56,956
MALE POPULATION
56,569
FEMALE POPULATION
100.68
MALES / 100 FEMALES
99.32
FEMALES / 100 MALES
37.3
MEDIAN AGE
3.2
AVG FAMILY SIZE
2.6
AVG HOUSEHOLD SIZE
59,540
LABOR FORCE [ PEOPLE ]
65.5%
PERCENT IN LABOR FORCE
5.8%
UNEMPLOYMENT RATE
Income in Gresham
Income Overview in Gresham
Per Capita Income in Gresham is $33,931, while median incomes of families and households are $81,414 and $69,437 respectively.
| Characteristic | Number | Measure |
| Per Capita Income | 113,525 | $33,931 |
| Median Family Income | 27,912 | $81,414 |
| Mean Family Income | 27,912 | $101,646 |
| Median Household Income | 42,243 | $69,437 |
| Mean Household Income | 42,243 | $89,152 |
| Income Deficit | 27,912 | $11,452 |
| Wage / Income Gap (%) | 113,525 | 20.17% |
| Wage / Income Gap ($) | 113,525 | 79.83¢ per $1 |
| Gini / Inequality Index | 113,525 | 0.43 |
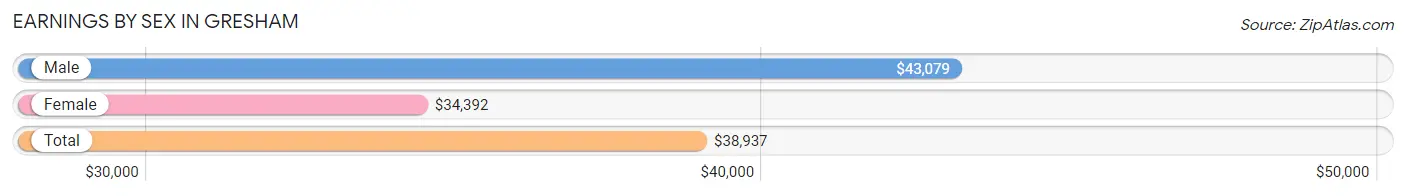
Earnings by Sex in Gresham
Average Earnings in Gresham are $38,937, $43,079 for men and $34,392 for women, a difference of 20.2%.
| Sex | Number | Average Earnings |
| Male | 32,816 (53.4%) | $43,079 |
| Female | 28,631 (46.6%) | $34,392 |
| Total | 61,447 (100.0%) | $38,937 |
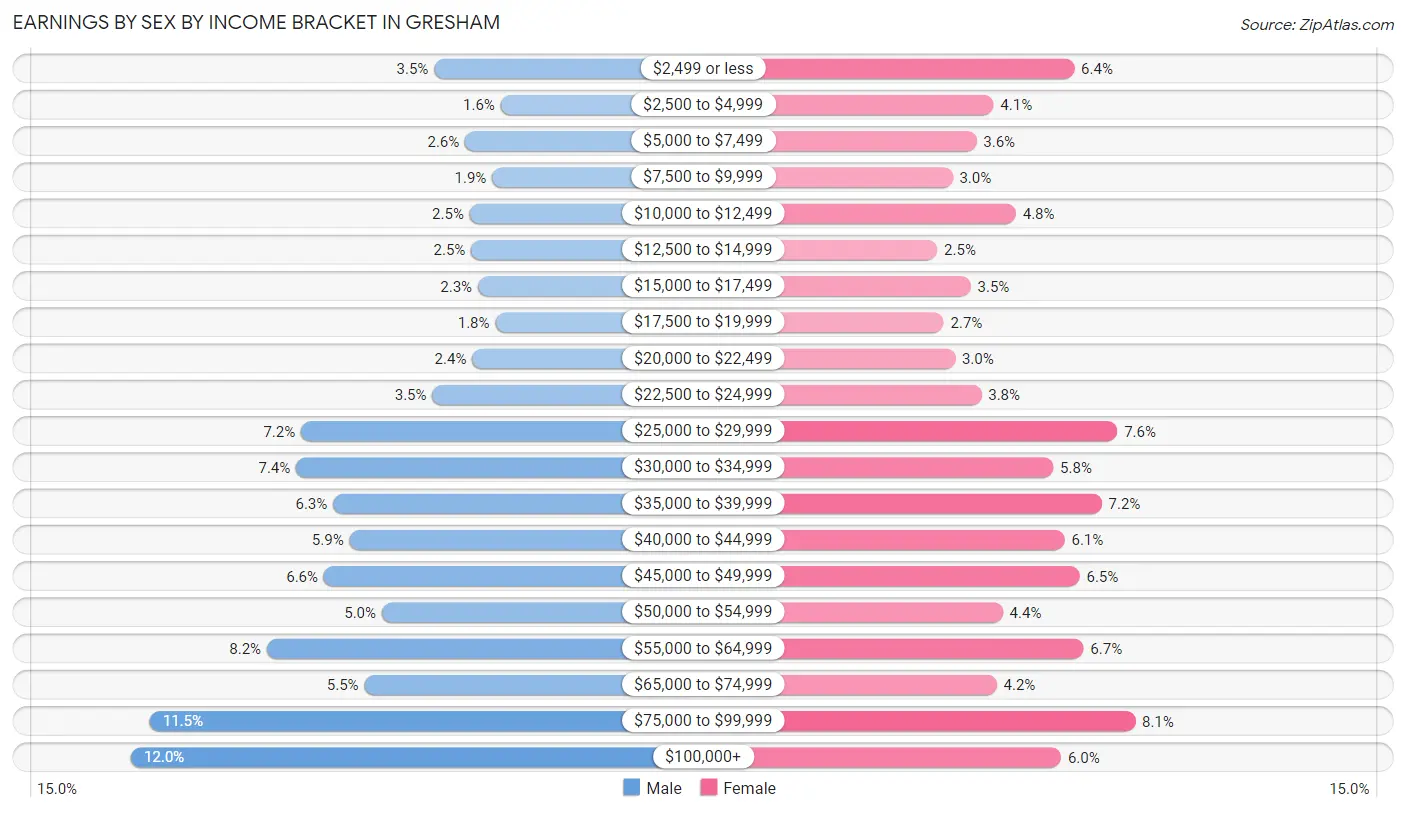
Earnings by Sex by Income Bracket in Gresham
The most common earnings brackets in Gresham are $100,000+ for men (3,940 | 12.0%) and $75,000 to $99,999 for women (2,319 | 8.1%).
| Income | Male | Female |
| $2,499 or less | 1,144 (3.5%) | 1,829 (6.4%) |
| $2,500 to $4,999 | 533 (1.6%) | 1,181 (4.1%) |
| $5,000 to $7,499 | 861 (2.6%) | 1,043 (3.6%) |
| $7,500 to $9,999 | 611 (1.9%) | 851 (3.0%) |
| $10,000 to $12,499 | 818 (2.5%) | 1,360 (4.8%) |
| $12,500 to $14,999 | 805 (2.5%) | 726 (2.5%) |
| $15,000 to $17,499 | 743 (2.3%) | 997 (3.5%) |
| $17,500 to $19,999 | 582 (1.8%) | 780 (2.7%) |
| $20,000 to $22,499 | 794 (2.4%) | 869 (3.0%) |
| $22,500 to $24,999 | 1,163 (3.5%) | 1,082 (3.8%) |
| $25,000 to $29,999 | 2,371 (7.2%) | 2,175 (7.6%) |
| $30,000 to $34,999 | 2,417 (7.4%) | 1,661 (5.8%) |
| $35,000 to $39,999 | 2,076 (6.3%) | 2,050 (7.2%) |
| $40,000 to $44,999 | 1,925 (5.9%) | 1,753 (6.1%) |
| $45,000 to $49,999 | 2,163 (6.6%) | 1,872 (6.5%) |
| $50,000 to $54,999 | 1,628 (5.0%) | 1,253 (4.4%) |
| $55,000 to $64,999 | 2,686 (8.2%) | 1,903 (6.7%) |
| $65,000 to $74,999 | 1,790 (5.4%) | 1,204 (4.2%) |
| $75,000 to $99,999 | 3,766 (11.5%) | 2,319 (8.1%) |
| $100,000+ | 3,940 (12.0%) | 1,723 (6.0%) |
| Total | 32,816 (100.0%) | 28,631 (100.0%) |
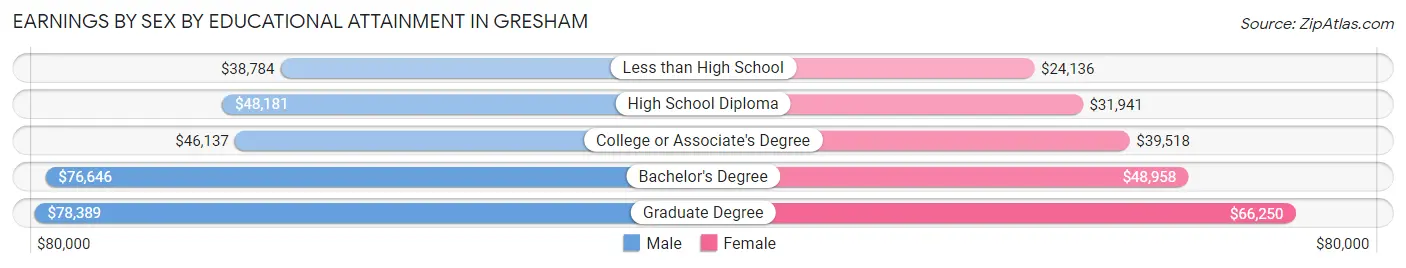
Earnings by Sex by Educational Attainment in Gresham
Average earnings in Gresham are $48,683 for men and $38,348 for women, a difference of 21.2%. Men with an educational attainment of graduate degree enjoy the highest average annual earnings of $78,389, while those with less than high school education earn the least with $38,784. Women with an educational attainment of graduate degree earn the most with the average annual earnings of $66,250, while those with less than high school education have the smallest earnings of $24,136.
| Educational Attainment | Male Income | Female Income |
| Less than High School | $38,784 | $24,136 |
| High School Diploma | $48,181 | $31,941 |
| College or Associate's Degree | $46,137 | $39,518 |
| Bachelor's Degree | $76,646 | $48,958 |
| Graduate Degree | $78,389 | $66,250 |
| Total | $48,683 | $38,348 |
Family Income in Gresham
Family Income Brackets in Gresham
According to the Gresham family income data, there are 6,029 families falling into the $100,000 to $149,999 income range, which is the most common income bracket and makes up 21.6% of all families. Conversely, the $10,000 to $14,999 income bracket is the least frequent group with only 642 families (2.3%) belonging to this category.
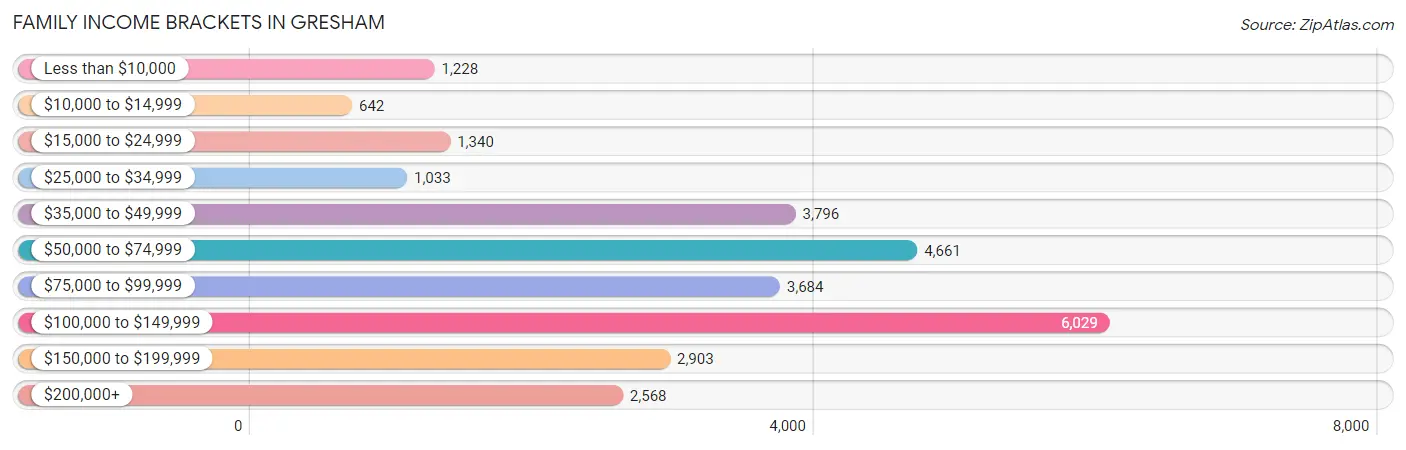
| Income Bracket | # Families | % Families |
| Less than $10,000 | 1,228 | 4.4% |
| $10,000 to $14,999 | 642 | 2.3% |
| $15,000 to $24,999 | 1,340 | 4.8% |
| $25,000 to $34,999 | 1,033 | 3.7% |
| $35,000 to $49,999 | 3,796 | 13.6% |
| $50,000 to $74,999 | 4,661 | 16.7% |
| $75,000 to $99,999 | 3,684 | 13.2% |
| $100,000 to $149,999 | 6,029 | 21.6% |
| $150,000 to $199,999 | 2,903 | 10.4% |
| $200,000+ | 2,568 | 9.2% |
Family Income by Famaliy Size in Gresham
4-person families (4,896 | 17.5%) account for the highest median family income in Gresham with $110,625 per family, while 2-person families (12,647 | 45.3%) have the highest median income of $36,530 per family member.
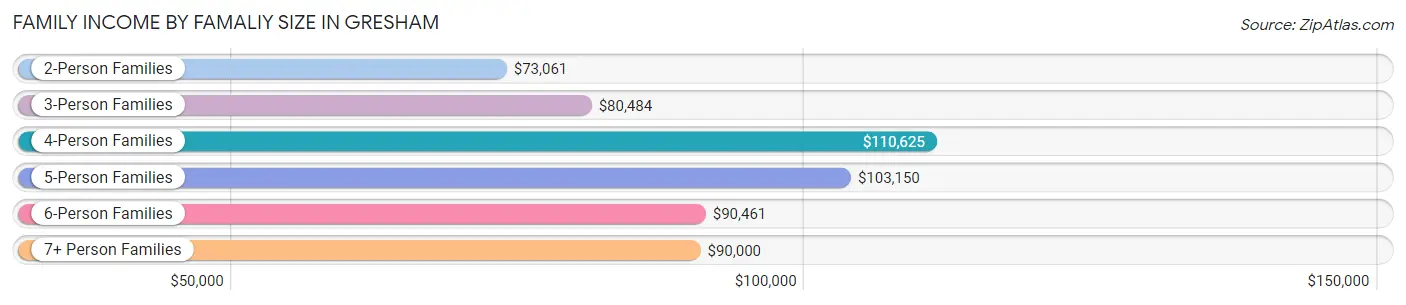
| Income Bracket | # Families | Median Income |
| 2-Person Families | 12,647 (45.3%) | $73,061 |
| 3-Person Families | 6,793 (24.3%) | $80,484 |
| 4-Person Families | 4,896 (17.5%) | $110,625 |
| 5-Person Families | 1,847 (6.6%) | $103,150 |
| 6-Person Families | 1,163 (4.2%) | $90,461 |
| 7+ Person Families | 566 (2.0%) | $90,000 |
| Total | 27,912 (100.0%) | $81,414 |
Family Income by Number of Earners in Gresham
The median family income in Gresham is $81,414, with families comprising 3+ earners (4,240) having the highest median family income of $148,291, while families with no earners (3,994) have the lowest median family income of $48,500, accounting for 15.2% and 14.3% of families, respectively.
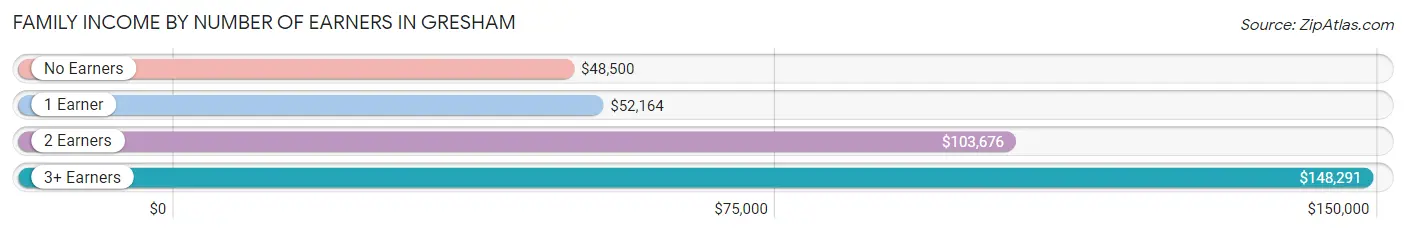
| Number of Earners | # Families | Median Income |
| No Earners | 3,994 (14.3%) | $48,500 |
| 1 Earner | 9,168 (32.9%) | $52,164 |
| 2 Earners | 10,510 (37.7%) | $103,676 |
| 3+ Earners | 4,240 (15.2%) | $148,291 |
| Total | 27,912 (100.0%) | $81,414 |
Household Income in Gresham
Household Income Brackets in Gresham
With 7,815 households falling in the category, the $100,000 to $149,999 income range is the most frequent in Gresham, accounting for 18.5% of all households. In contrast, only 1,605 households (3.8%) fall into the $10,000 to $14,999 income bracket, making it the least populous group.
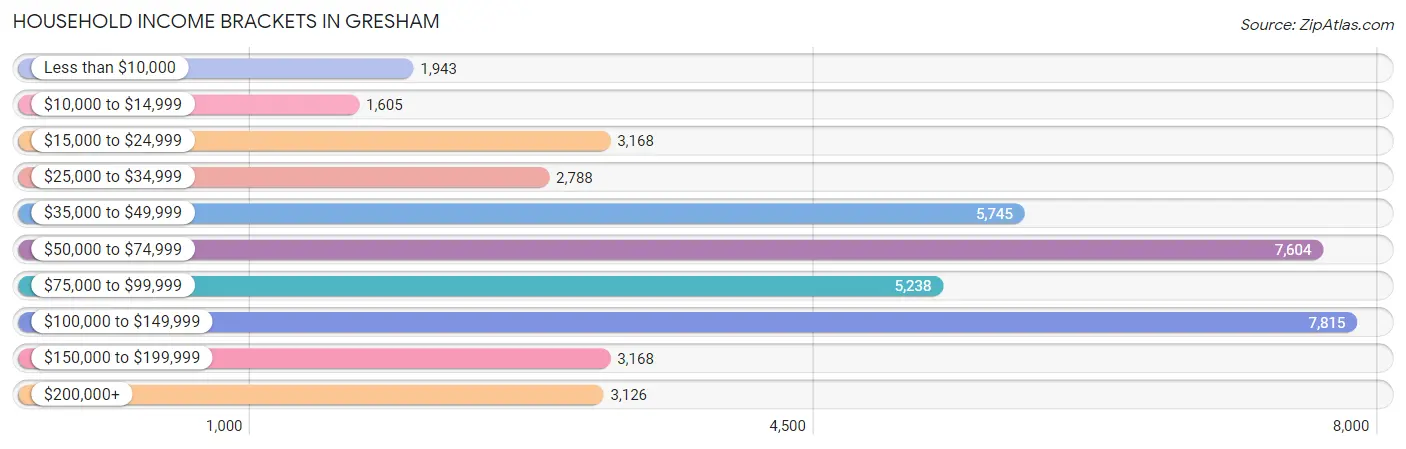
| Income Bracket | # Households | % Households |
| Less than $10,000 | 1,943 | 4.6% |
| $10,000 to $14,999 | 1,605 | 3.8% |
| $15,000 to $24,999 | 3,168 | 7.5% |
| $25,000 to $34,999 | 2,788 | 6.6% |
| $35,000 to $49,999 | 5,745 | 13.6% |
| $50,000 to $74,999 | 7,604 | 18.0% |
| $75,000 to $99,999 | 5,238 | 12.4% |
| $100,000 to $149,999 | 7,815 | 18.5% |
| $150,000 to $199,999 | 3,168 | 7.5% |
| $200,000+ | 3,126 | 7.4% |
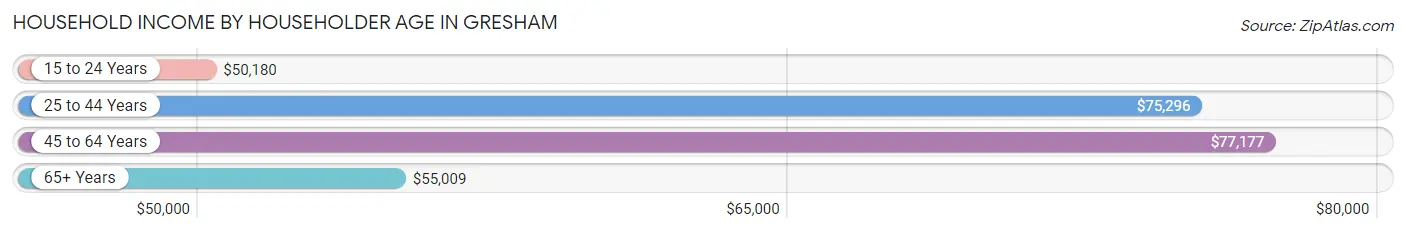
Household Income by Householder Age in Gresham
The median household income in Gresham is $69,437, with the highest median household income of $77,177 found in the 45 to 64 years age bracket for the primary householder. A total of 16,080 households (38.1%) fall into this category. Meanwhile, the 15 to 24 years age bracket for the primary householder has the lowest median household income of $50,180, with 1,663 households (3.9%) in this group.
| Income Bracket | # Households | Median Income |
| 15 to 24 Years | 1,663 (3.9%) | $50,180 |
| 25 to 44 Years | 14,385 (34.1%) | $75,296 |
| 45 to 64 Years | 16,080 (38.1%) | $77,177 |
| 65+ Years | 10,115 (23.9%) | $55,009 |
| Total | 42,243 (100.0%) | $69,437 |
Poverty in Gresham
Income Below Poverty by Sex and Age in Gresham
With 11.6% poverty level for males and 16.0% for females among the residents of Gresham, 16 and 17 year old males and 15 year old females are the most vulnerable to poverty, with 291 males (24.4%) and 226 females (28.2%) in their respective age groups living below the poverty level.
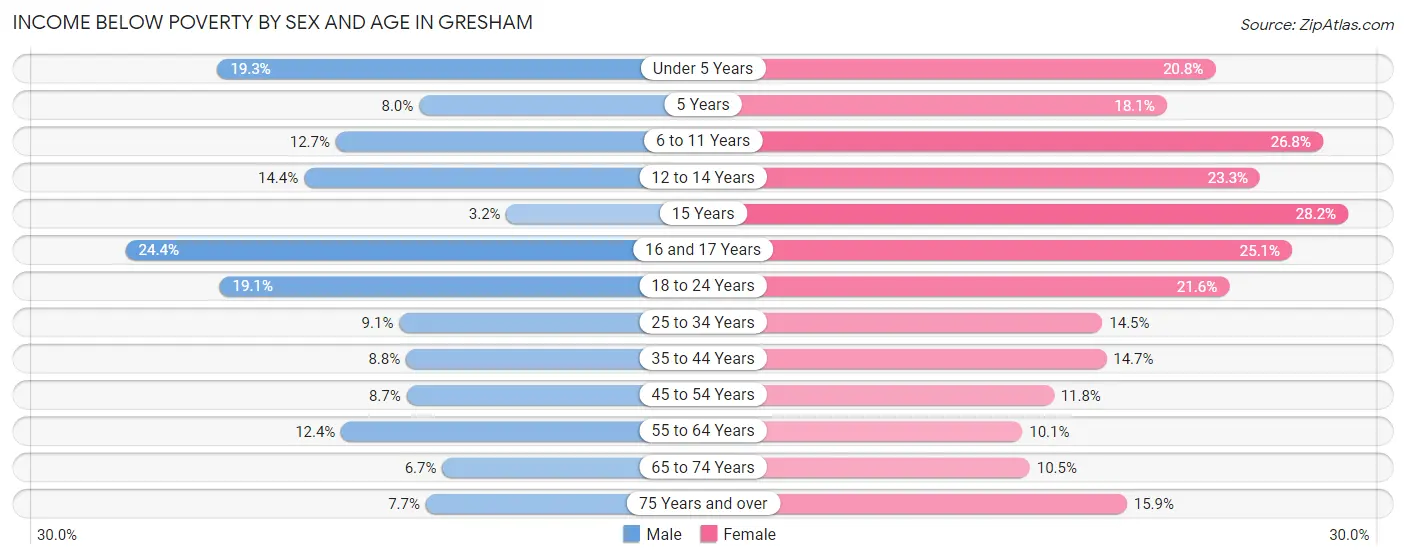
| Age Bracket | Male | Female |
| Under 5 Years | 694 (19.3%) | 674 (20.8%) |
| 5 Years | 42 (8.0%) | 100 (18.1%) |
| 6 to 11 Years | 555 (12.7%) | 1,043 (26.8%) |
| 12 to 14 Years | 345 (14.4%) | 509 (23.3%) |
| 15 Years | 25 (3.2%) | 226 (28.2%) |
| 16 and 17 Years | 291 (24.4%) | 397 (25.1%) |
| 18 to 24 Years | 1,070 (19.1%) | 1,010 (21.6%) |
| 25 to 34 Years | 838 (9.1%) | 1,173 (14.5%) |
| 35 to 44 Years | 657 (8.8%) | 1,133 (14.7%) |
| 45 to 54 Years | 614 (8.7%) | 813 (11.8%) |
| 55 to 64 Years | 911 (12.4%) | 716 (10.1%) |
| 65 to 74 Years | 316 (6.7%) | 567 (10.5%) |
| 75 Years and over | 183 (7.7%) | 603 (15.9%) |
| Total | 6,541 (11.6%) | 8,964 (16.0%) |
Income Above Poverty by Sex and Age in Gresham
According to the poverty statistics in Gresham, males aged 15 years and females aged 55 to 64 years are the age groups that are most secure financially, with 96.8% of males and 89.9% of females in these age groups living above the poverty line.
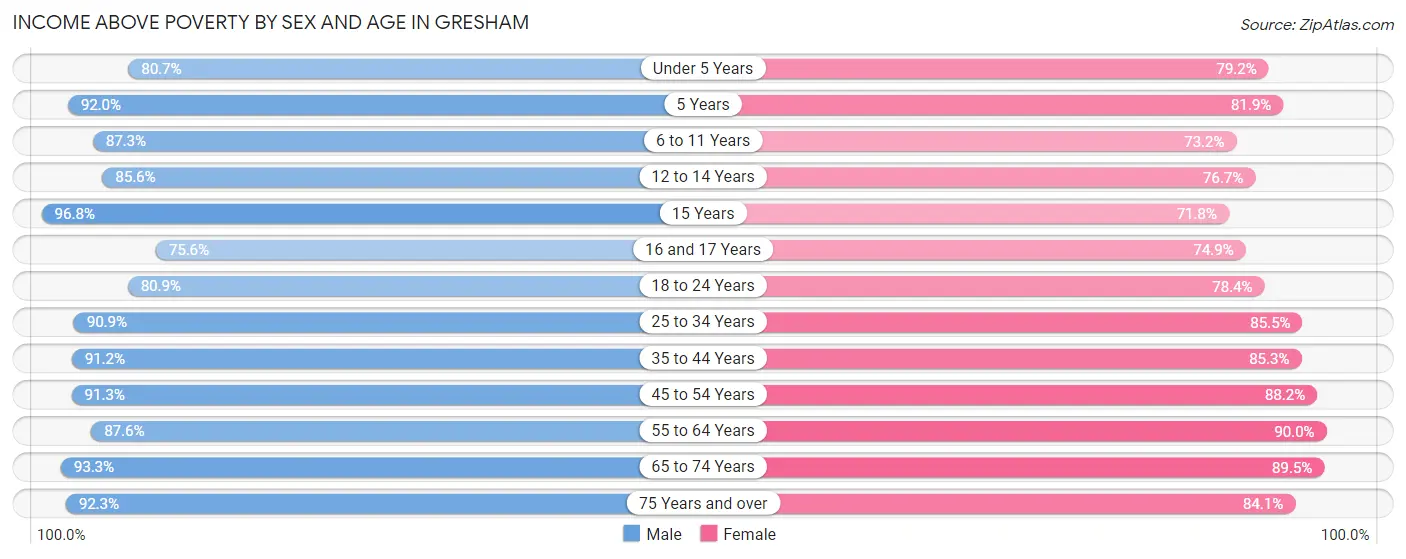
| Age Bracket | Male | Female |
| Under 5 Years | 2,909 (80.7%) | 2,568 (79.2%) |
| 5 Years | 481 (92.0%) | 453 (81.9%) |
| 6 to 11 Years | 3,827 (87.3%) | 2,852 (73.2%) |
| 12 to 14 Years | 2,044 (85.6%) | 1,677 (76.7%) |
| 15 Years | 763 (96.8%) | 576 (71.8%) |
| 16 and 17 Years | 903 (75.6%) | 1,187 (74.9%) |
| 18 to 24 Years | 4,520 (80.9%) | 3,674 (78.4%) |
| 25 to 34 Years | 8,333 (90.9%) | 6,910 (85.5%) |
| 35 to 44 Years | 6,845 (91.2%) | 6,557 (85.3%) |
| 45 to 54 Years | 6,423 (91.3%) | 6,079 (88.2%) |
| 55 to 64 Years | 6,451 (87.6%) | 6,405 (89.9%) |
| 65 to 74 Years | 4,374 (93.3%) | 4,849 (89.5%) |
| 75 Years and over | 2,206 (92.3%) | 3,197 (84.1%) |
| Total | 50,079 (88.4%) | 46,984 (84.0%) |
Income Below Poverty Among Married-Couple Families in Gresham
The poverty statistics for married-couple families in Gresham show that 5.2% or 984 of the total 18,864 families live below the poverty line. Families with 3 or 4 children have the highest poverty rate of 11.3%, comprising of 163 families. On the other hand, families with 5 or more children have the lowest poverty rate of 0.0%, which includes 0 families.
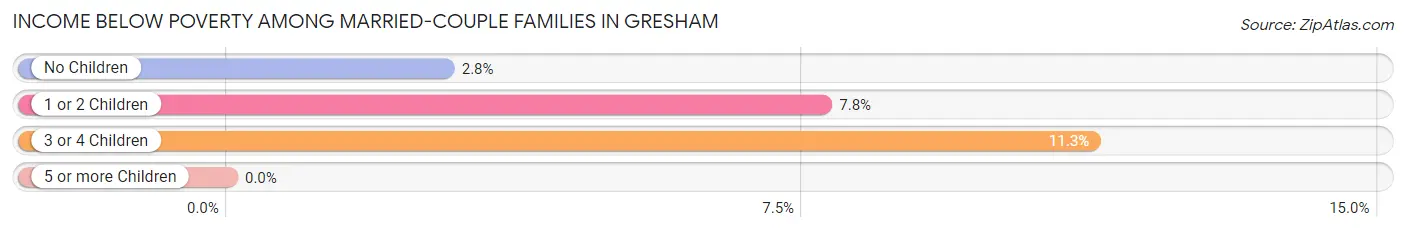
| Children | Above Poverty | Below Poverty |
| No Children | 10,424 (97.2%) | 304 (2.8%) |
| 1 or 2 Children | 6,142 (92.2%) | 517 (7.8%) |
| 3 or 4 Children | 1,283 (88.7%) | 163 (11.3%) |
| 5 or more Children | 31 (100.0%) | 0 (0.0%) |
| Total | 17,880 (94.8%) | 984 (5.2%) |
Income Below Poverty Among Single-Parent Households in Gresham
According to the poverty data in Gresham, 7.5% or 202 single-father households and 26.3% or 1,668 single-mother households are living below the poverty line. Among single-father households, those with 1 or 2 children have the highest poverty rate, with 164 households (13.0%) experiencing poverty. Likewise, among single-mother households, those with 5 or more children have the highest poverty rate, with 75 households (39.3%) falling below the poverty line.
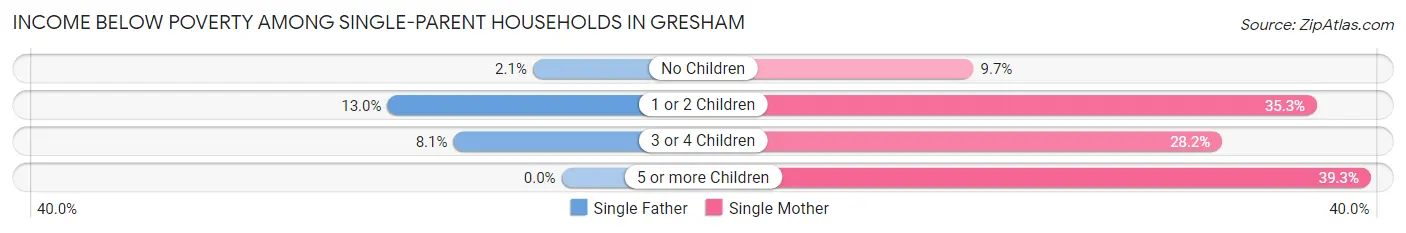
| Children | Single Father | Single Mother |
| No Children | 28 (2.1%) | 205 (9.7%) |
| 1 or 2 Children | 164 (13.0%) | 1,236 (35.3%) |
| 3 or 4 Children | 10 (8.1%) | 152 (28.2%) |
| 5 or more Children | 0 (0.0%) | 75 (39.3%) |
| Total | 202 (7.5%) | 1,668 (26.3%) |
Income Below Poverty Among Married-Couple vs Single-Parent Households in Gresham
The poverty data for Gresham shows that 984 of the married-couple family households (5.2%) and 1,870 of the single-parent households (20.7%) are living below the poverty level. Within the married-couple family households, those with 3 or 4 children have the highest poverty rate, with 163 households (11.3%) falling below the poverty line. Among the single-parent households, those with 5 or more children have the highest poverty rate, with 75 household (39.3%) living below poverty.
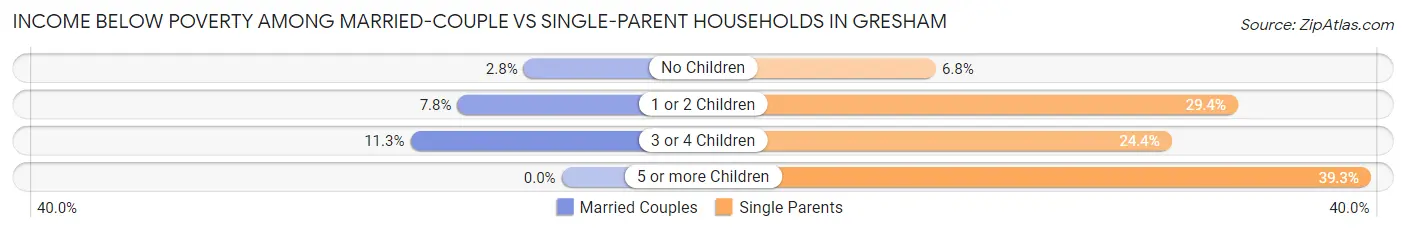
| Children | Married-Couple Families | Single-Parent Households |
| No Children | 304 (2.8%) | 233 (6.8%) |
| 1 or 2 Children | 517 (7.8%) | 1,400 (29.4%) |
| 3 or 4 Children | 163 (11.3%) | 162 (24.4%) |
| 5 or more Children | 0 (0.0%) | 75 (39.3%) |
| Total | 984 (5.2%) | 1,870 (20.7%) |
Race in Gresham
The most populous races in Gresham are White / Caucasian (81,877 | 72.1%), Hispanic or Latino (24,433 | 21.5%), and Two or more Races (13,995 | 12.3%).
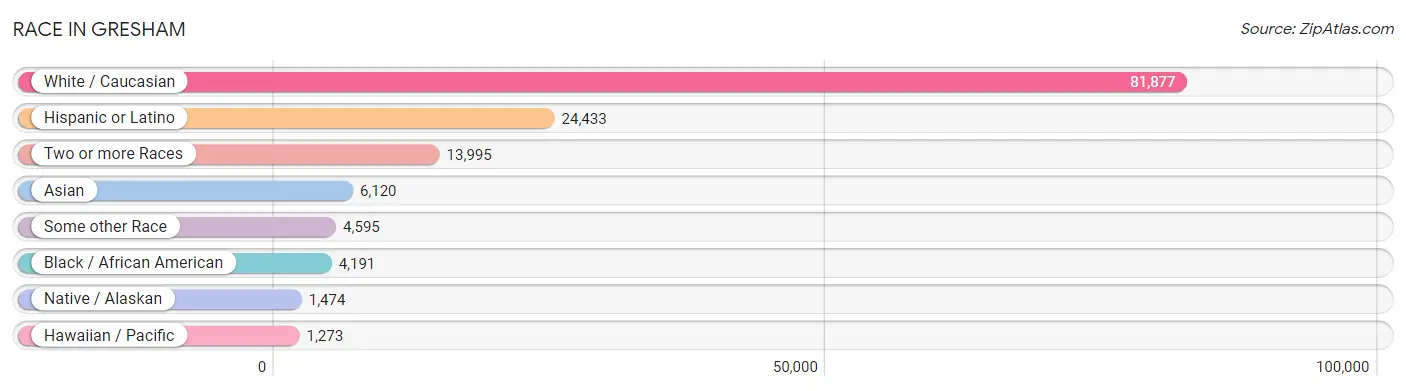
| Race | # Population | % Population |
| Asian | 6,120 | 5.4% |
| Black / African American | 4,191 | 3.7% |
| Hawaiian / Pacific | 1,273 | 1.1% |
| Hispanic or Latino | 24,433 | 21.5% |
| Native / Alaskan | 1,474 | 1.3% |
| White / Caucasian | 81,877 | 72.1% |
| Two or more Races | 13,995 | 12.3% |
| Some other Race | 4,595 | 4.1% |
| Total | 113,525 | 100.0% |
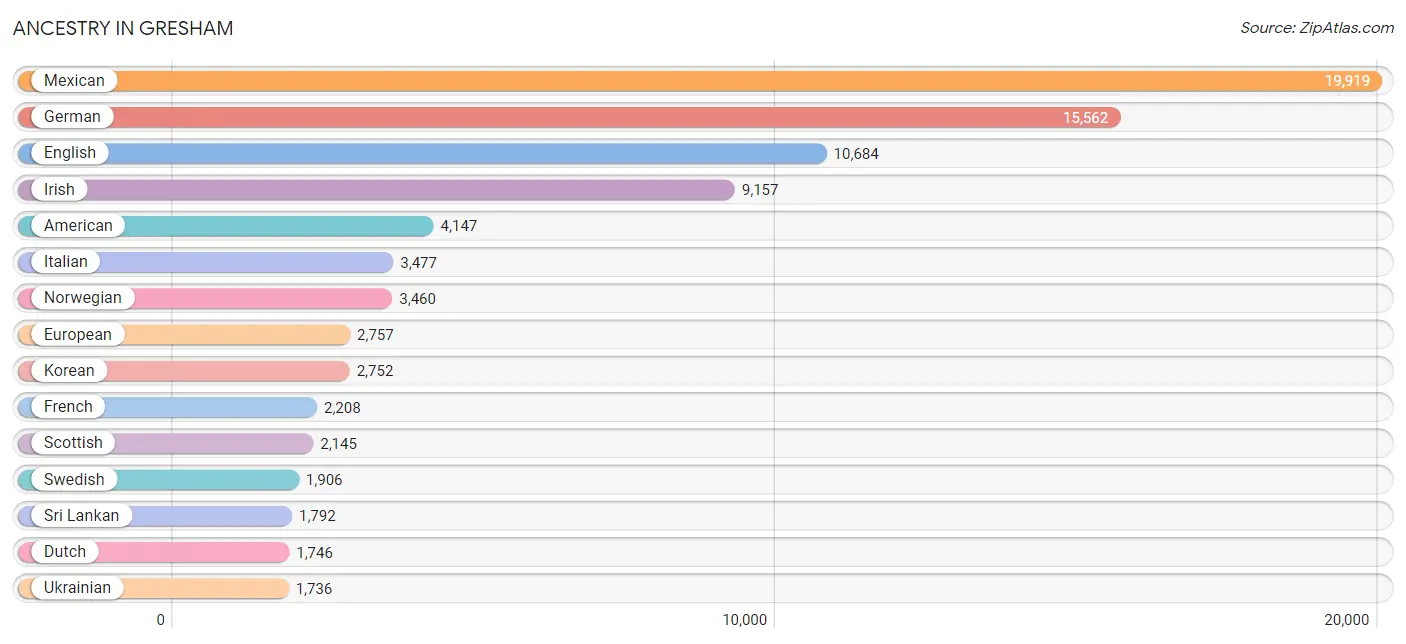
Ancestry in Gresham
The most populous ancestries reported in Gresham are Mexican (19,919 | 17.5%), German (15,562 | 13.7%), English (10,684 | 9.4%), Irish (9,157 | 8.1%), and American (4,147 | 3.6%), together accounting for 52.4% of all Gresham residents.
| Ancestry | # Population | % Population |
| Afghan | 7 | 0.0% |
| African | 533 | 0.5% |
| Alaska Native | 12 | 0.0% |
| Albanian | 4 | 0.0% |
| American | 4,147 | 3.6% |
| Apache | 71 | 0.1% |
| Arab | 1,469 | 1.3% |
| Argentinean | 111 | 0.1% |
| Armenian | 11 | 0.0% |
| Australian | 17 | 0.0% |
| Austrian | 137 | 0.1% |
| Bangladeshi | 410 | 0.4% |
| Basque | 7 | 0.0% |
| Belgian | 146 | 0.1% |
| Bhutanese | 896 | 0.8% |
| Blackfeet | 256 | 0.2% |
| Bolivian | 126 | 0.1% |
| Brazilian | 33 | 0.0% |
| British | 464 | 0.4% |
| Bulgarian | 24 | 0.0% |
| Burmese | 225 | 0.2% |
| Canadian | 145 | 0.1% |
| Cape Verdean | 23 | 0.0% |
| Celtic | 73 | 0.1% |
| Central American | 1,309 | 1.1% |
| Central American Indian | 141 | 0.1% |
| Cherokee | 702 | 0.6% |
| Cheyenne | 4 | 0.0% |
| Chilean | 101 | 0.1% |
| Chippewa | 85 | 0.1% |
| Choctaw | 28 | 0.0% |
| Colombian | 114 | 0.1% |
| Colville | 17 | 0.0% |
| Comanche | 86 | 0.1% |
| Costa Rican | 107 | 0.1% |
| Cree | 11 | 0.0% |
| Creek | 35 | 0.0% |
| Croatian | 56 | 0.1% |
| Cuban | 479 | 0.4% |
| Czech | 178 | 0.2% |
| Czechoslovakian | 58 | 0.1% |
| Danish | 865 | 0.8% |
| Dutch | 1,746 | 1.5% |
| Dutch West Indian | 17 | 0.0% |
| Eastern European | 391 | 0.3% |
| Egyptian | 766 | 0.7% |
| English | 10,684 | 9.4% |
| Estonian | 39 | 0.0% |
| Ethiopian | 602 | 0.5% |
| European | 2,757 | 2.4% |
| Fijian | 45 | 0.0% |
| Finnish | 494 | 0.4% |
| French | 2,208 | 1.9% |
| French Canadian | 671 | 0.6% |
| German | 15,562 | 13.7% |
| Ghanaian | 17 | 0.0% |
| Greek | 193 | 0.2% |
| Guamanian / Chamorro | 218 | 0.2% |
| Guatemalan | 450 | 0.4% |
| Guyanese | 20 | 0.0% |
| Honduran | 79 | 0.1% |
| Hopi | 1 | 0.0% |
| Hungarian | 428 | 0.4% |
| Icelander | 64 | 0.1% |
| Indian (Asian) | 1,170 | 1.0% |
| Indonesian | 61 | 0.1% |
| Inupiat | 64 | 0.1% |
| Irish | 9,157 | 8.1% |
| Iroquois | 14 | 0.0% |
| Italian | 3,477 | 3.1% |
| Jamaican | 99 | 0.1% |
| Japanese | 228 | 0.2% |
| Kenyan | 103 | 0.1% |
| Korean | 2,752 | 2.4% |
| Laotian | 130 | 0.1% |
| Latvian | 34 | 0.0% |
| Lebanese | 74 | 0.1% |
| Lithuanian | 7 | 0.0% |
| Luxembourger | 30 | 0.0% |
| Malaysian | 504 | 0.4% |
| Maltese | 85 | 0.1% |
| Mexican | 19,919 | 17.5% |
| Mexican American Indian | 421 | 0.4% |
| Moroccan | 72 | 0.1% |
| Native Hawaiian | 694 | 0.6% |
| Navajo | 35 | 0.0% |
| Nepalese | 208 | 0.2% |
| New Zealander | 32 | 0.0% |
| Nicaraguan | 38 | 0.0% |
| Northern European | 331 | 0.3% |
| Norwegian | 3,460 | 3.0% |
| Osage | 19 | 0.0% |
| Paiute | 98 | 0.1% |
| Pakistani | 186 | 0.2% |
| Palestinian | 55 | 0.1% |
| Panamanian | 8 | 0.0% |
| Pennsylvania German | 40 | 0.0% |
| Peruvian | 69 | 0.1% |
| Polish | 1,114 | 1.0% |
| Portuguese | 442 | 0.4% |
| Pueblo | 8 | 0.0% |
| Puerto Rican | 581 | 0.5% |
| Romanian | 722 | 0.6% |
| Russian | 1,233 | 1.1% |
| Salvadoran | 627 | 0.5% |
| Samoan | 445 | 0.4% |
| Scandinavian | 867 | 0.8% |
| Scotch-Irish | 1,026 | 0.9% |
| Scottish | 2,145 | 1.9% |
| Seminole | 13 | 0.0% |
| Sioux | 85 | 0.1% |
| Slavic | 151 | 0.1% |
| Slovak | 106 | 0.1% |
| Slovene | 36 | 0.0% |
| Somali | 79 | 0.1% |
| South African | 64 | 0.1% |
| South American | 542 | 0.5% |
| Spaniard | 347 | 0.3% |
| Spanish | 313 | 0.3% |
| Spanish American Indian | 43 | 0.0% |
| Sri Lankan | 1,792 | 1.6% |
| Subsaharan African | 1,344 | 1.2% |
| Swedish | 1,906 | 1.7% |
| Swiss | 362 | 0.3% |
| Syrian | 94 | 0.1% |
| Thai | 229 | 0.2% |
| Tlingit-Haida | 39 | 0.0% |
| Tongan | 208 | 0.2% |
| Trinidadian and Tobagonian | 34 | 0.0% |
| Turkish | 116 | 0.1% |
| Ukrainian | 1,736 | 1.5% |
| Welsh | 946 | 0.8% |
| West Indian | 12 | 0.0% |
| Yakama | 41 | 0.0% |
| Yugoslavian | 88 | 0.1% | View All 135 Rows |
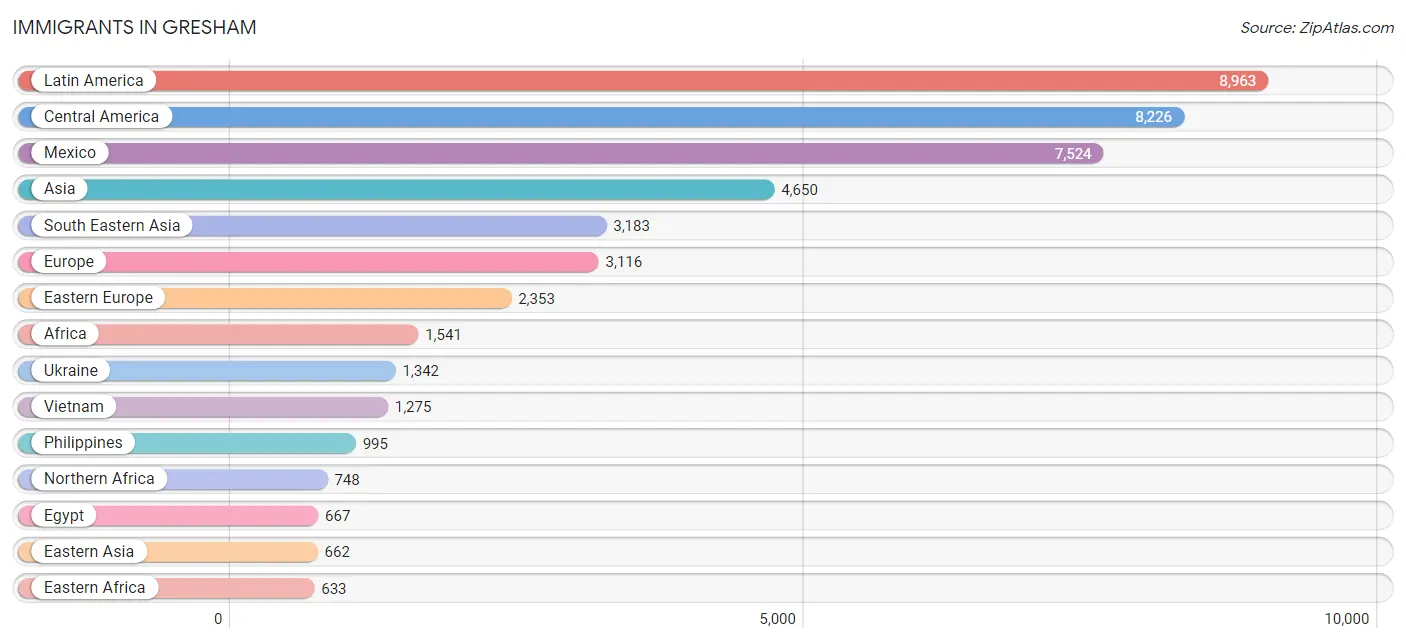
Immigrants in Gresham
The most numerous immigrant groups reported in Gresham came from Latin America (8,963 | 7.9%), Central America (8,226 | 7.2%), Mexico (7,524 | 6.6%), Asia (4,650 | 4.1%), and South Eastern Asia (3,183 | 2.8%), together accounting for 28.7% of all Gresham residents.
| Immigration Origin | # Population | % Population |
| Afghanistan | 29 | 0.0% |
| Africa | 1,541 | 1.4% |
| Asia | 4,650 | 4.1% |
| Austria | 7 | 0.0% |
| Bolivia | 59 | 0.1% |
| Bosnia and Herzegovina | 58 | 0.1% |
| Brazil | 68 | 0.1% |
| Bulgaria | 5 | 0.0% |
| Cambodia | 146 | 0.1% |
| Canada | 196 | 0.2% |
| Caribbean | 392 | 0.4% |
| Central America | 8,226 | 7.2% |
| Chile | 68 | 0.1% |
| China | 418 | 0.4% |
| Colombia | 73 | 0.1% |
| Costa Rica | 33 | 0.0% |
| Croatia | 20 | 0.0% |
| Cuba | 380 | 0.3% |
| Czechoslovakia | 29 | 0.0% |
| Eastern Africa | 633 | 0.6% |
| Eastern Asia | 662 | 0.6% |
| Eastern Europe | 2,353 | 2.1% |
| Egypt | 667 | 0.6% |
| El Salvador | 295 | 0.3% |
| England | 144 | 0.1% |
| Eritrea | 33 | 0.0% |
| Ethiopia | 375 | 0.3% |
| Europe | 3,116 | 2.7% |
| Fiji | 17 | 0.0% |
| France | 63 | 0.1% |
| Germany | 169 | 0.2% |
| Ghana | 71 | 0.1% |
| Guatemala | 257 | 0.2% |
| Guyana | 11 | 0.0% |
| Honduras | 79 | 0.1% |
| Hong Kong | 36 | 0.0% |
| Hungary | 29 | 0.0% |
| India | 99 | 0.1% |
| Indonesia | 101 | 0.1% |
| Ireland | 13 | 0.0% |
| Italy | 75 | 0.1% |
| Jordan | 13 | 0.0% |
| Kazakhstan | 52 | 0.1% |
| Kenya | 103 | 0.1% |
| Korea | 244 | 0.2% |
| Laos | 372 | 0.3% |
| Latin America | 8,963 | 7.9% |
| Lebanon | 9 | 0.0% |
| Liberia | 25 | 0.0% |
| Mexico | 7,524 | 6.6% |
| Micronesia | 140 | 0.1% |
| Moldova | 127 | 0.1% |
| Morocco | 42 | 0.0% |
| Nepal | 125 | 0.1% |
| Netherlands | 55 | 0.1% |
| Nicaragua | 38 | 0.0% |
| Northern Africa | 748 | 0.7% |
| Northern Europe | 264 | 0.2% |
| Oceania | 438 | 0.4% |
| Pakistan | 19 | 0.0% |
| Peru | 66 | 0.1% |
| Philippines | 995 | 0.9% |
| Poland | 23 | 0.0% |
| Portugal | 66 | 0.1% |
| Romania | 256 | 0.2% |
| Russia | 293 | 0.3% |
| Scotland | 53 | 0.1% |
| Somalia | 41 | 0.0% |
| South Africa | 5 | 0.0% |
| South America | 345 | 0.3% |
| South Central Asia | 434 | 0.4% |
| South Eastern Asia | 3,183 | 2.8% |
| Southern Europe | 165 | 0.2% |
| Spain | 24 | 0.0% |
| Sudan | 11 | 0.0% |
| Sweden | 19 | 0.0% |
| Syria | 181 | 0.2% |
| Taiwan | 9 | 0.0% |
| Thailand | 164 | 0.1% |
| Trinidad and Tobago | 10 | 0.0% |
| Turkey | 67 | 0.1% |
| Ukraine | 1,342 | 1.2% |
| Uzbekistan | 22 | 0.0% |
| Vietnam | 1,275 | 1.1% |
| Western Africa | 96 | 0.1% |
| Western Asia | 343 | 0.3% |
| Western Europe | 294 | 0.3% |
| Yemen | 1 | 0.0% |
| Zimbabwe | 81 | 0.1% | View All 89 Rows |
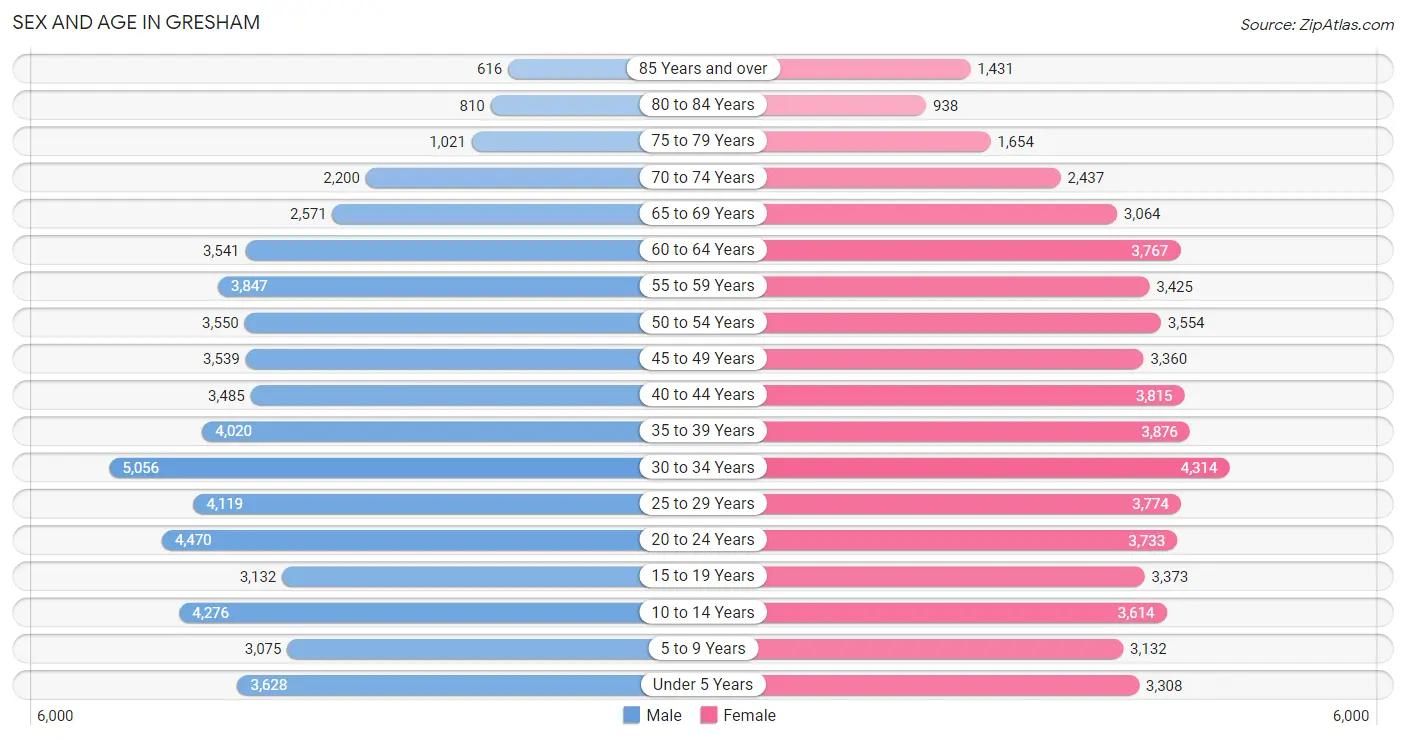
Sex and Age in Gresham
Sex and Age in Gresham
The most populous age groups in Gresham are 30 to 34 Years (5,056 | 8.9%) for men and 30 to 34 Years (4,314 | 7.6%) for women.
| Age Bracket | Male | Female |
| Under 5 Years | 3,628 (6.4%) | 3,308 (5.9%) |
| 5 to 9 Years | 3,075 (5.4%) | 3,132 (5.5%) |
| 10 to 14 Years | 4,276 (7.5%) | 3,614 (6.4%) |
| 15 to 19 Years | 3,132 (5.5%) | 3,373 (6.0%) |
| 20 to 24 Years | 4,470 (7.9%) | 3,733 (6.6%) |
| 25 to 29 Years | 4,119 (7.2%) | 3,774 (6.7%) |
| 30 to 34 Years | 5,056 (8.9%) | 4,314 (7.6%) |
| 35 to 39 Years | 4,020 (7.1%) | 3,876 (6.9%) |
| 40 to 44 Years | 3,485 (6.1%) | 3,815 (6.7%) |
| 45 to 49 Years | 3,539 (6.2%) | 3,360 (5.9%) |
| 50 to 54 Years | 3,550 (6.2%) | 3,554 (6.3%) |
| 55 to 59 Years | 3,847 (6.8%) | 3,425 (6.0%) |
| 60 to 64 Years | 3,541 (6.2%) | 3,767 (6.7%) |
| 65 to 69 Years | 2,571 (4.5%) | 3,064 (5.4%) |
| 70 to 74 Years | 2,200 (3.9%) | 2,437 (4.3%) |
| 75 to 79 Years | 1,021 (1.8%) | 1,654 (2.9%) |
| 80 to 84 Years | 810 (1.4%) | 938 (1.7%) |
| 85 Years and over | 616 (1.1%) | 1,431 (2.5%) |
| Total | 56,956 (100.0%) | 56,569 (100.0%) |
Families and Households in Gresham
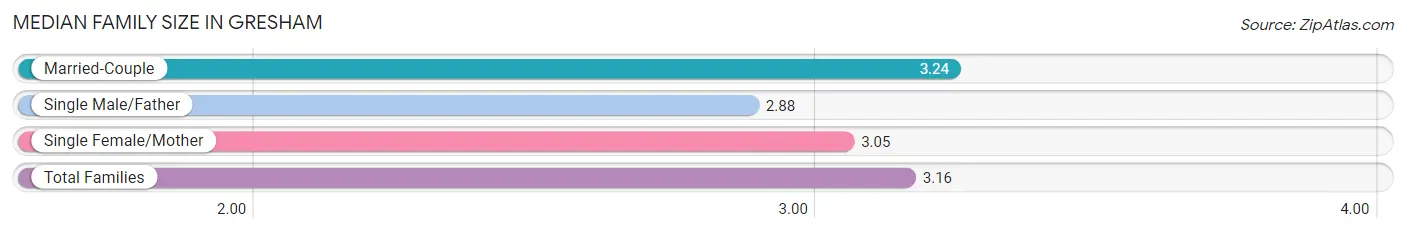
Median Family Size in Gresham
The median family size in Gresham is 3.16 persons per family, with married-couple families (18,864 | 67.6%) accounting for the largest median family size of 3.24 persons per family. On the other hand, single male/father families (2,696 | 9.7%) represent the smallest median family size with 2.88 persons per family.
| Family Type | # Families | Family Size |
| Married-Couple | 18,864 (67.6%) | 3.24 |
| Single Male/Father | 2,696 (9.7%) | 2.88 |
| Single Female/Mother | 6,352 (22.8%) | 3.05 |
| Total Families | 27,912 (100.0%) | 3.16 |
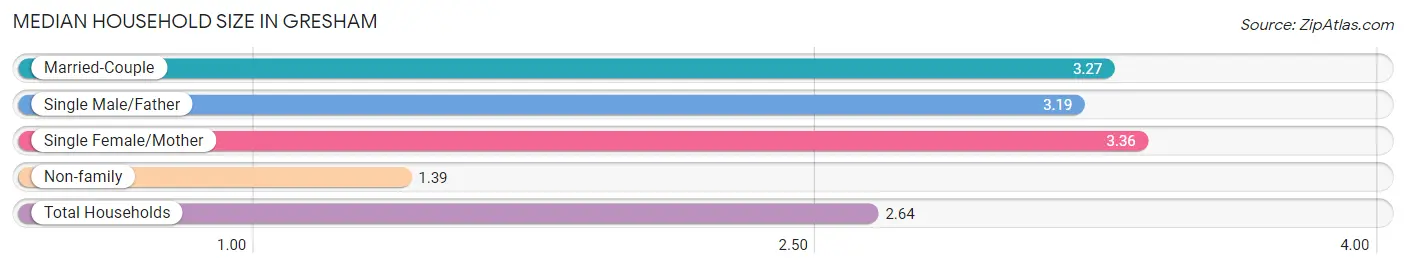
Median Household Size in Gresham
The median household size in Gresham is 2.64 persons per household, with single female/mother households (6,352 | 15.0%) accounting for the largest median household size of 3.36 persons per household. non-family households (14,331 | 33.9%) represent the smallest median household size with 1.39 persons per household.
| Household Type | # Households | Household Size |
| Married-Couple | 18,864 (44.7%) | 3.27 |
| Single Male/Father | 2,696 (6.4%) | 3.19 |
| Single Female/Mother | 6,352 (15.0%) | 3.36 |
| Non-family | 14,331 (33.9%) | 1.39 |
| Total Households | 42,243 (100.0%) | 2.64 |
Household Size by Marriage Status in Gresham
Out of a total of 42,243 households in Gresham, 27,912 (66.1%) are family households, while 14,331 (33.9%) are nonfamily households. The most numerous type of family households are 2-person households, comprising 11,572, and the most common type of nonfamily households are 1-person households, comprising 10,738.
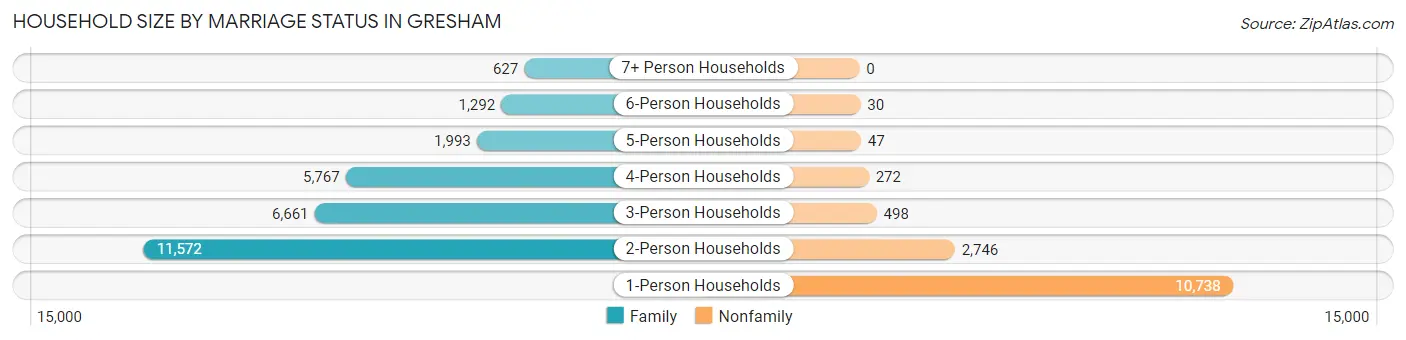
| Household Size | Family Households | Nonfamily Households |
| 1-Person Households | - | 10,738 (25.4%) |
| 2-Person Households | 11,572 (27.4%) | 2,746 (6.5%) |
| 3-Person Households | 6,661 (15.8%) | 498 (1.2%) |
| 4-Person Households | 5,767 (13.7%) | 272 (0.6%) |
| 5-Person Households | 1,993 (4.7%) | 47 (0.1%) |
| 6-Person Households | 1,292 (3.1%) | 30 (0.1%) |
| 7+ Person Households | 627 (1.5%) | 0 (0.0%) |
| Total | 27,912 (66.1%) | 14,331 (33.9%) |
Female Fertility in Gresham
Fertility by Age in Gresham
Average fertility rate in Gresham is 53.0 births per 1,000 women. Women in the age bracket of 20 to 34 years have the highest fertility rate with 73.0 births per 1,000 women. Women in the age bracket of 20 to 34 years acount for 60.6% of all women with births.
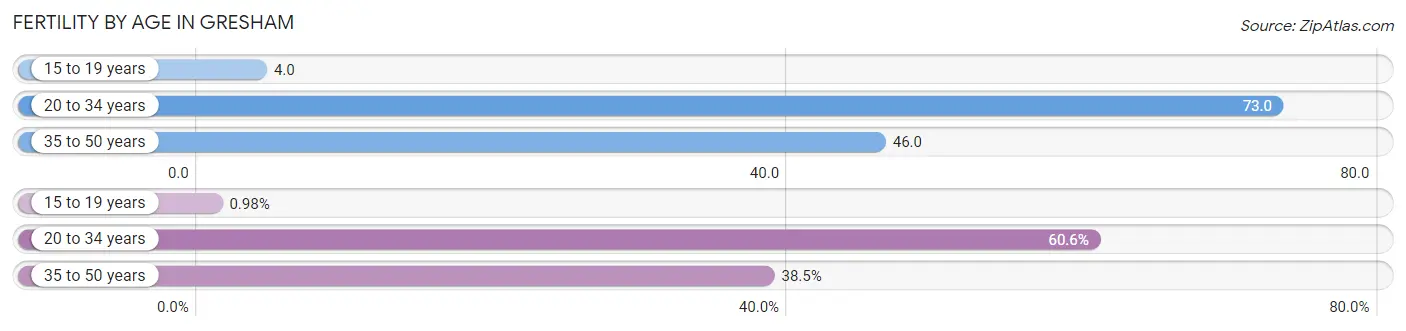
| Age Bracket | Women with Births | Births / 1,000 Women |
| 15 to 19 years | 14 (1.0%) | 4.0 |
| 20 to 34 years | 865 (60.6%) | 73.0 |
| 35 to 50 years | 549 (38.5%) | 46.0 |
| Total | 1,428 (100.0%) | 53.0 |
Fertility by Age by Marriage Status in Gresham
70.6% of women with births (1,428) in Gresham are married. The highest percentage of unmarried women with births falls into 15 to 19 years age bracket with 100.0% of them unmarried at the time of birth, while the lowest percentage of unmarried women with births belong to 35 to 50 years age bracket with 25.9% of them unmarried.
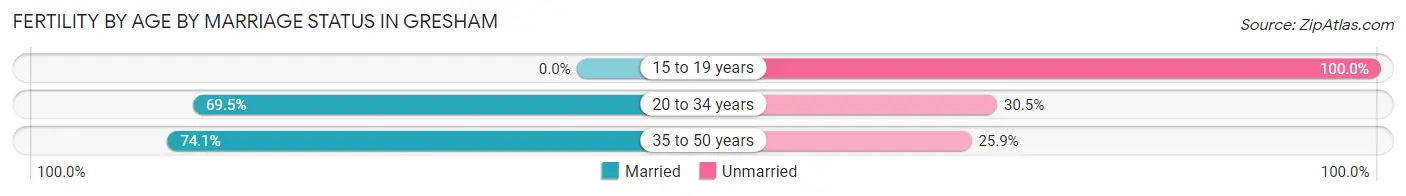
| Age Bracket | Married | Unmarried |
| 15 to 19 years | 0 (0.0%) | 14 (100.0%) |
| 20 to 34 years | 601 (69.5%) | 264 (30.5%) |
| 35 to 50 years | 407 (74.1%) | 142 (25.9%) |
| Total | 1,008 (70.6%) | 420 (29.4%) |
Fertility by Education in Gresham
Average fertility rate in Gresham is 53.0 births per 1,000 women. Women with the education attainment of graduate degree have the highest fertility rate of 65.0 births per 1,000 women, while women with the education attainment of less than high school have the lowest fertility at 48.0 births per 1,000 women. Women with the education attainment of college or associate's degree represent 37.0% of all women with births.
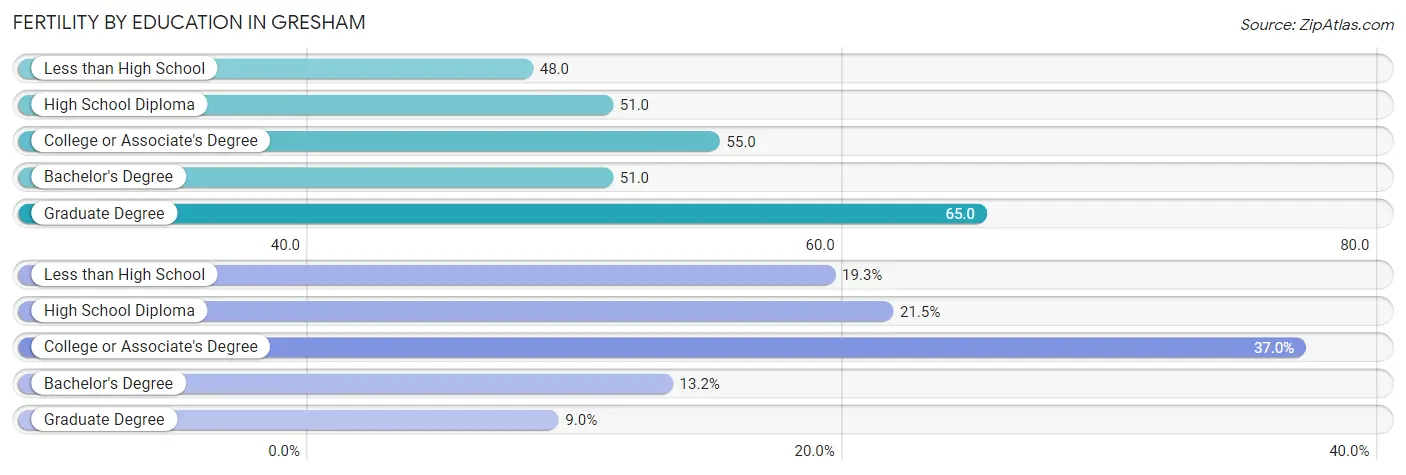
| Educational Attainment | Women with Births | Births / 1,000 Women |
| Less than High School | 276 (19.3%) | 48.0 |
| High School Diploma | 307 (21.5%) | 51.0 |
| College or Associate's Degree | 528 (37.0%) | 55.0 |
| Bachelor's Degree | 189 (13.2%) | 51.0 |
| Graduate Degree | 128 (9.0%) | 65.0 |
| Total | 1,428 (100.0%) | 53.0 |
Fertility by Education by Marriage Status in Gresham
29.4% of women with births in Gresham are unmarried. Women with the educational attainment of graduate degree are most likely to be married with 100.0% of them married at childbirth, while women with the educational attainment of less than high school are least likely to be married with 51.8% of them unmarried at childbirth.
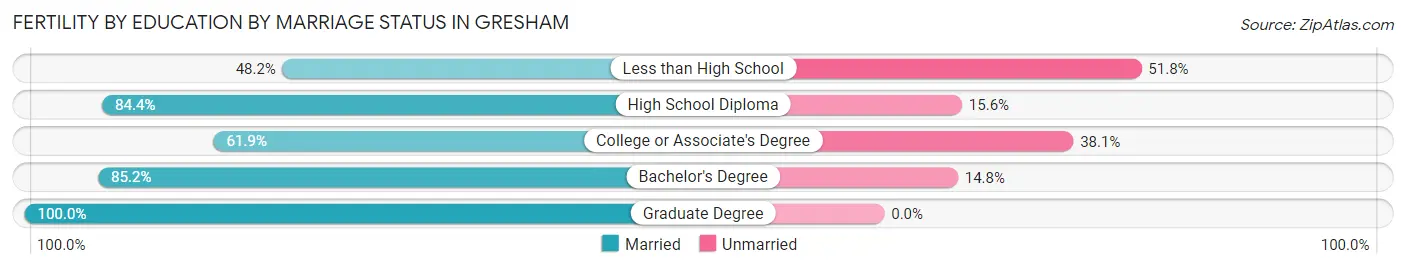
| Educational Attainment | Married | Unmarried |
| Less than High School | 133 (48.2%) | 143 (51.8%) |
| High School Diploma | 259 (84.4%) | 48 (15.6%) |
| College or Associate's Degree | 327 (61.9%) | 201 (38.1%) |
| Bachelor's Degree | 161 (85.2%) | 28 (14.8%) |
| Graduate Degree | 128 (100.0%) | 0 (0.0%) |
| Total | 1,008 (70.6%) | 420 (29.4%) |
Employment Characteristics in Gresham
Employment by Class of Employer in Gresham
Among the 54,132 employed individuals in Gresham, private company employees (37,902 | 70.0%), not-for-profit organizations (5,406 | 10.0%), and local government employees (3,542 | 6.5%) make up the most common classes of employment.
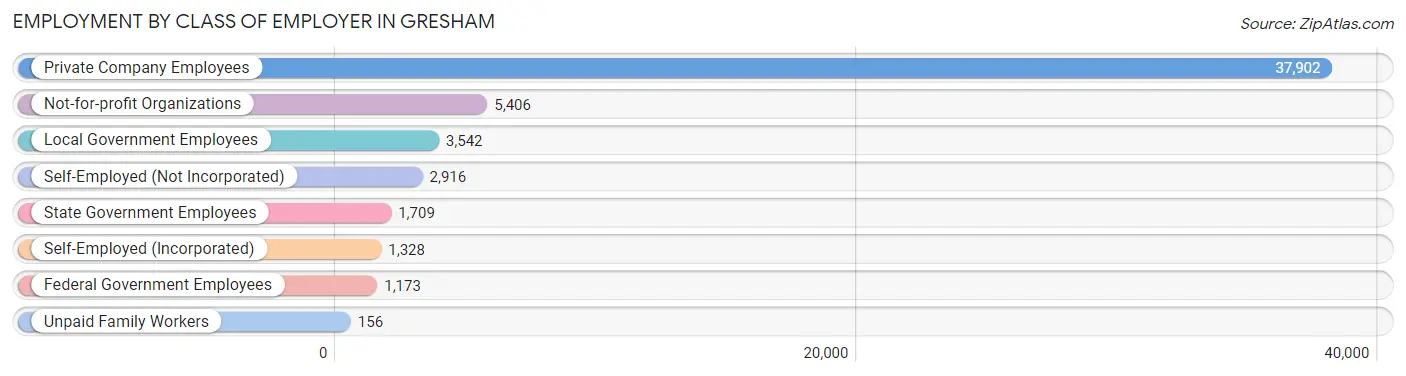
| Employer Class | # Employees | % Employees |
| Private Company Employees | 37,902 | 70.0% |
| Self-Employed (Incorporated) | 1,328 | 2.5% |
| Self-Employed (Not Incorporated) | 2,916 | 5.4% |
| Not-for-profit Organizations | 5,406 | 10.0% |
| Local Government Employees | 3,542 | 6.5% |
| State Government Employees | 1,709 | 3.2% |
| Federal Government Employees | 1,173 | 2.2% |
| Unpaid Family Workers | 156 | 0.3% |
| Total | 54,132 | 100.0% |
Employment Status by Age in Gresham
According to the labor force statistics for Gresham, out of the total population over 16 years of age (90,901), 65.5% or 59,540 individuals are in the labor force, with 5.8% or 3,453 of them unemployed. The age group with the highest labor force participation rate is 25 to 29 years, with 83.1% or 6,559 individuals in the labor force. Within the labor force, the 16 to 19 years age range has the highest percentage of unemployed individuals, with 15.8% or 335 of them being unemployed.
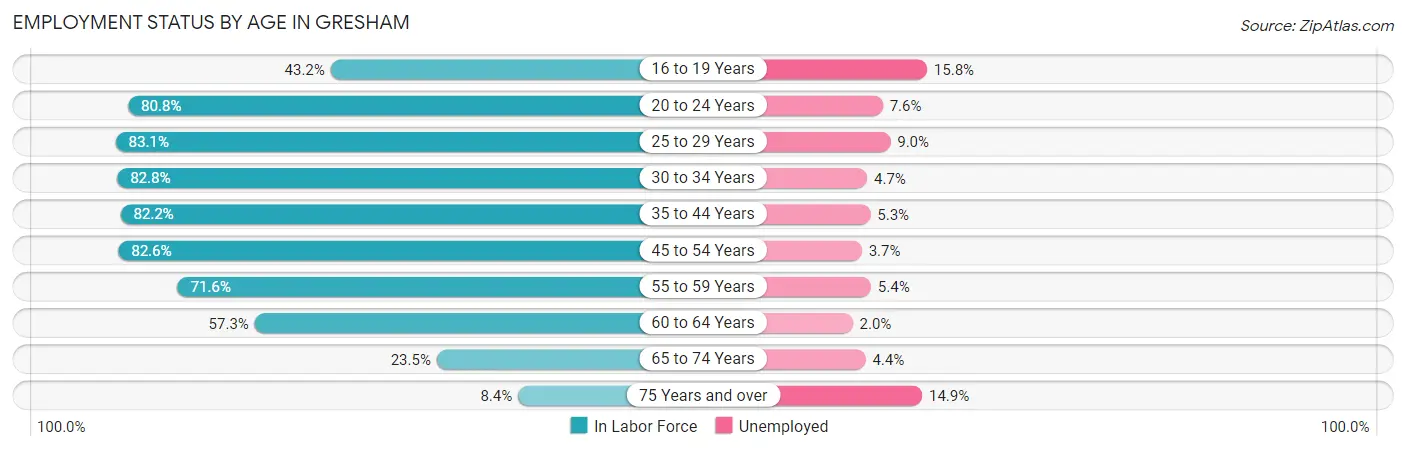
| Age Bracket | In Labor Force | Unemployed |
| 16 to 19 Years | 2,123 (43.2%) | 335 (15.8%) |
| 20 to 24 Years | 6,628 (80.8%) | 504 (7.6%) |
| 25 to 29 Years | 6,559 (83.1%) | 590 (9.0%) |
| 30 to 34 Years | 7,758 (82.8%) | 365 (4.7%) |
| 35 to 44 Years | 12,491 (82.2%) | 662 (5.3%) |
| 45 to 54 Years | 11,566 (82.6%) | 428 (3.7%) |
| 55 to 59 Years | 5,207 (71.6%) | 281 (5.4%) |
| 60 to 64 Years | 4,187 (57.3%) | 84 (2.0%) |
| 65 to 74 Years | 2,414 (23.5%) | 106 (4.4%) |
| 75 Years and over | 543 (8.4%) | 81 (14.9%) |
| Total | 59,540 (65.5%) | 3,453 (5.8%) |
Employment Status by Educational Attainment in Gresham
According to labor force statistics for Gresham, 78.3% of individuals (47,796) out of the total population between 25 and 64 years of age (61,042) are in the labor force, with 5.1% or 2,438 of them being unemployed. The group with the highest labor force participation rate are those with the educational attainment of bachelor's degree or higher, with 88.9% or 12,266 individuals in the labor force. Within the labor force, individuals with less than high school education have the highest percentage of unemployment, with 7.2% or 401 of them being unemployed.
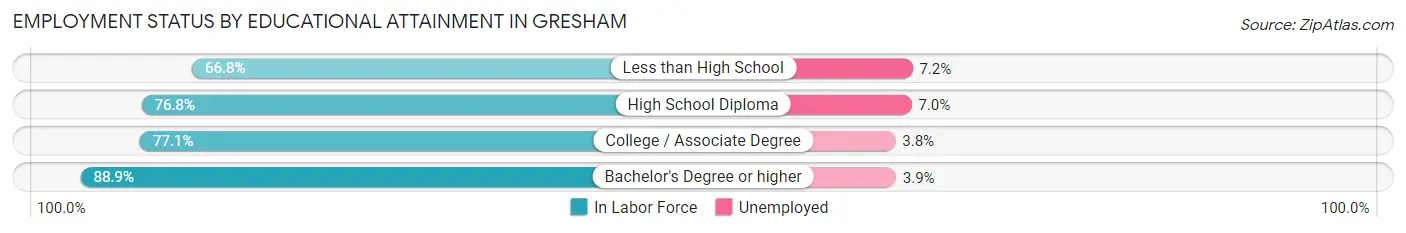
| Educational Attainment | In Labor Force | Unemployed |
| Less than High School | 5,563 (66.8%) | 600 (7.2%) |
| High School Diploma | 12,570 (76.8%) | 1,146 (7.0%) |
| College / Associate Degree | 17,386 (77.1%) | 857 (3.8%) |
| Bachelor's Degree or higher | 12,266 (88.9%) | 538 (3.9%) |
| Total | 47,796 (78.3%) | 3,113 (5.1%) |
Employment Occupations by Sex in Gresham
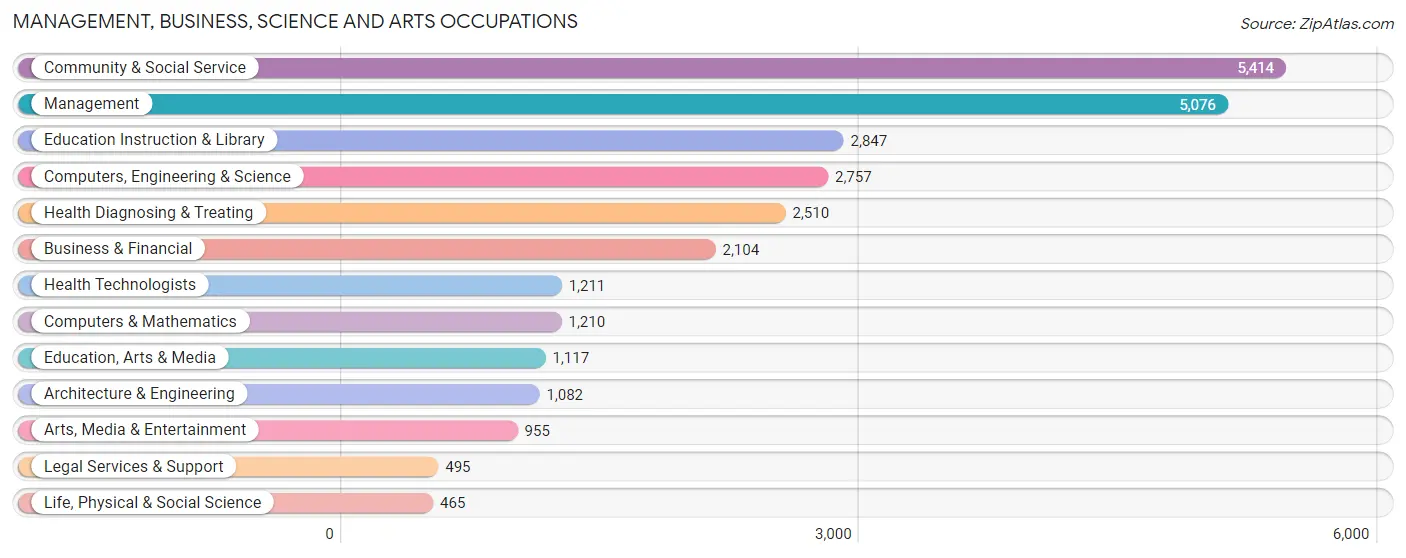
Management, Business, Science and Arts Occupations
The most common Management, Business, Science and Arts occupations in Gresham are Community & Social Service (5,414 | 9.7%), Management (5,076 | 9.1%), Education Instruction & Library (2,847 | 5.1%), Computers, Engineering & Science (2,757 | 4.9%), and Health Diagnosing & Treating (2,510 | 4.5%).
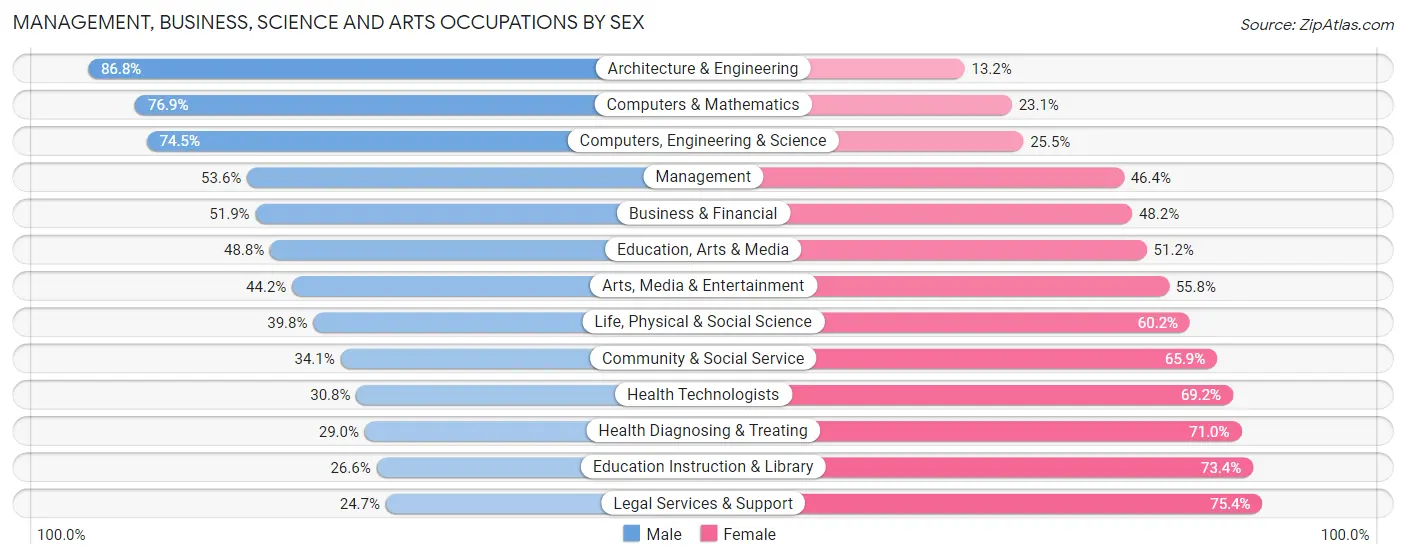
Management, Business, Science and Arts Occupations by Sex
Within the Management, Business, Science and Arts occupations in Gresham, the most male-oriented occupations are Architecture & Engineering (86.8%), Computers & Mathematics (76.9%), and Computers, Engineering & Science (74.5%), while the most female-oriented occupations are Legal Services & Support (75.3%), Education Instruction & Library (73.4%), and Health Diagnosing & Treating (71.0%).
| Occupation | Male | Female |
| Management | 2,719 (53.6%) | 2,357 (46.4%) |
| Business & Financial | 1,091 (51.8%) | 1,013 (48.1%) |
| Computers, Engineering & Science | 2,055 (74.5%) | 702 (25.5%) |
| Computers & Mathematics | 931 (76.9%) | 279 (23.1%) |
| Architecture & Engineering | 939 (86.8%) | 143 (13.2%) |
| Life, Physical & Social Science | 185 (39.8%) | 280 (60.2%) |
| Community & Social Service | 1,846 (34.1%) | 3,568 (65.9%) |
| Education, Arts & Media | 545 (48.8%) | 572 (51.2%) |
| Legal Services & Support | 122 (24.6%) | 373 (75.3%) |
| Education Instruction & Library | 757 (26.6%) | 2,090 (73.4%) |
| Arts, Media & Entertainment | 422 (44.2%) | 533 (55.8%) |
| Health Diagnosing & Treating | 729 (29.0%) | 1,781 (71.0%) |
| Health Technologists | 373 (30.8%) | 838 (69.2%) |
| Total (Category) | 8,440 (47.2%) | 9,421 (52.7%) |
| Total (Overall) | 30,110 (53.7%) | 25,905 (46.3%) |
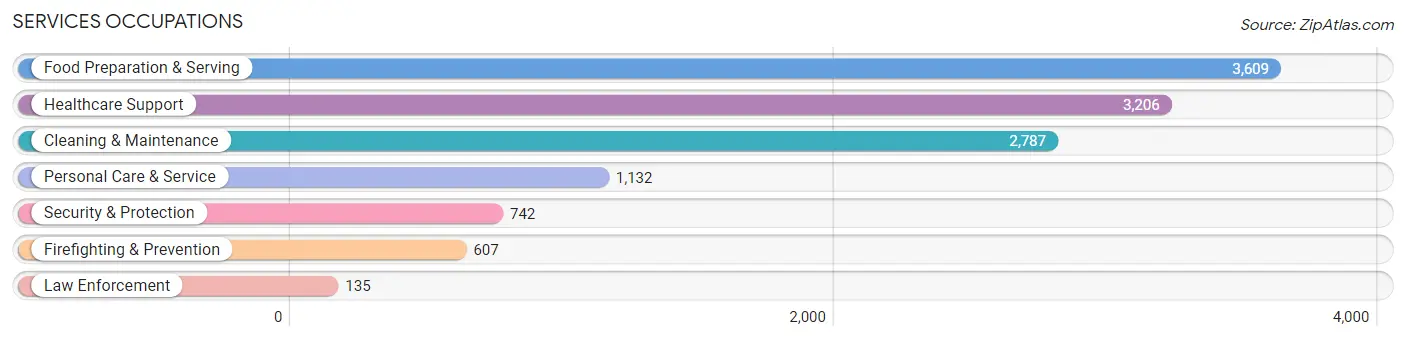
Services Occupations
The most common Services occupations in Gresham are Food Preparation & Serving (3,609 | 6.4%), Healthcare Support (3,206 | 5.7%), Cleaning & Maintenance (2,787 | 5.0%), Personal Care & Service (1,132 | 2.0%), and Security & Protection (742 | 1.3%).
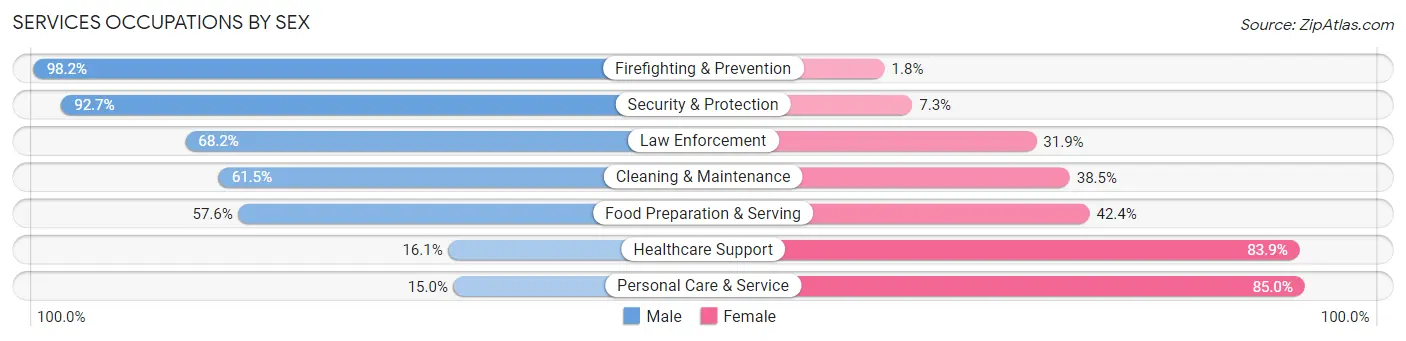
Services Occupations by Sex
Within the Services occupations in Gresham, the most male-oriented occupations are Firefighting & Prevention (98.2%), Security & Protection (92.7%), and Law Enforcement (68.1%), while the most female-oriented occupations are Personal Care & Service (85.0%), Healthcare Support (83.9%), and Food Preparation & Serving (42.4%).
| Occupation | Male | Female |
| Healthcare Support | 515 (16.1%) | 2,691 (83.9%) |
| Security & Protection | 688 (92.7%) | 54 (7.3%) |
| Firefighting & Prevention | 596 (98.2%) | 11 (1.8%) |
| Law Enforcement | 92 (68.1%) | 43 (31.9%) |
| Food Preparation & Serving | 2,080 (57.6%) | 1,529 (42.4%) |
| Cleaning & Maintenance | 1,715 (61.5%) | 1,072 (38.5%) |
| Personal Care & Service | 170 (15.0%) | 962 (85.0%) |
| Total (Category) | 5,168 (45.0%) | 6,308 (55.0%) |
| Total (Overall) | 30,110 (53.7%) | 25,905 (46.3%) |
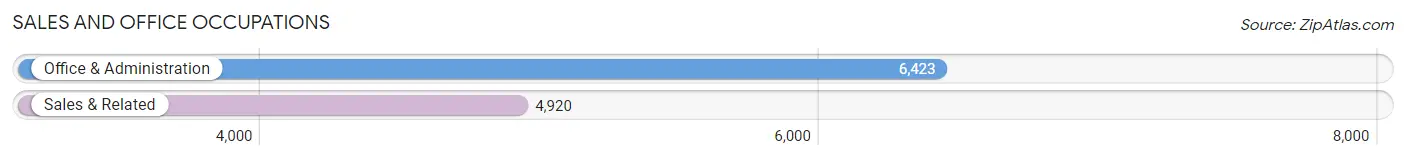
Sales and Office Occupations
The most common Sales and Office occupations in Gresham are Office & Administration (6,423 | 11.5%), and Sales & Related (4,920 | 8.8%).
Sales and Office Occupations by Sex
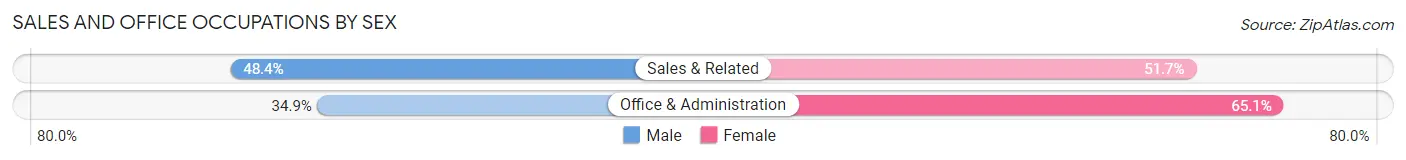
| Occupation | Male | Female |
| Sales & Related | 2,379 (48.3%) | 2,541 (51.6%) |
| Office & Administration | 2,242 (34.9%) | 4,181 (65.1%) |
| Total (Category) | 4,621 (40.7%) | 6,722 (59.3%) |
| Total (Overall) | 30,110 (53.7%) | 25,905 (46.3%) |
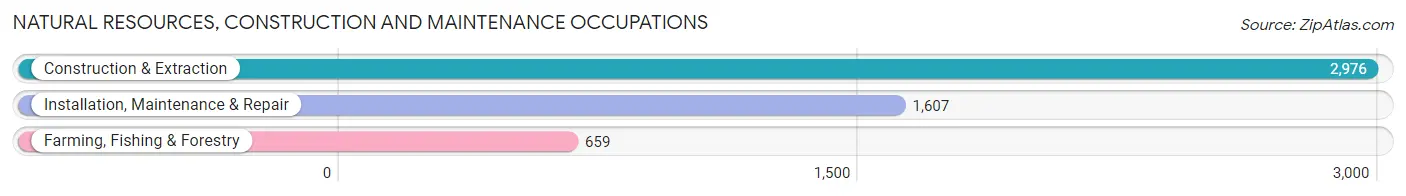
Natural Resources, Construction and Maintenance Occupations
The most common Natural Resources, Construction and Maintenance occupations in Gresham are Construction & Extraction (2,976 | 5.3%), Installation, Maintenance & Repair (1,607 | 2.9%), and Farming, Fishing & Forestry (659 | 1.2%).
Natural Resources, Construction and Maintenance Occupations by Sex
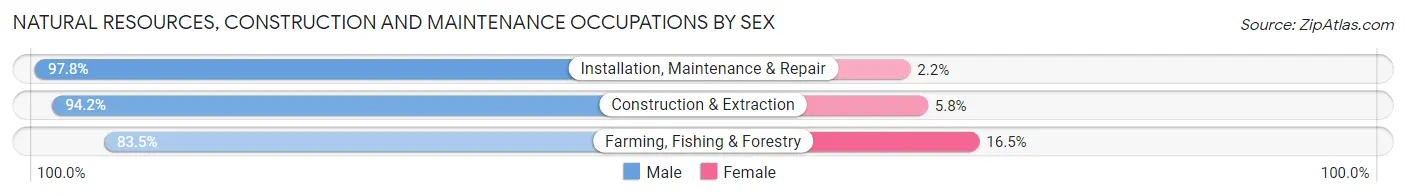
| Occupation | Male | Female |
| Farming, Fishing & Forestry | 550 (83.5%) | 109 (16.5%) |
| Construction & Extraction | 2,803 (94.2%) | 173 (5.8%) |
| Installation, Maintenance & Repair | 1,572 (97.8%) | 35 (2.2%) |
| Total (Category) | 4,925 (94.0%) | 317 (6.0%) |
| Total (Overall) | 30,110 (53.7%) | 25,905 (46.3%) |
Production, Transportation and Moving Occupations
The most common Production, Transportation and Moving occupations in Gresham are Production (4,188 | 7.5%), Material Moving (3,333 | 5.9%), and Transportation (2,572 | 4.6%).
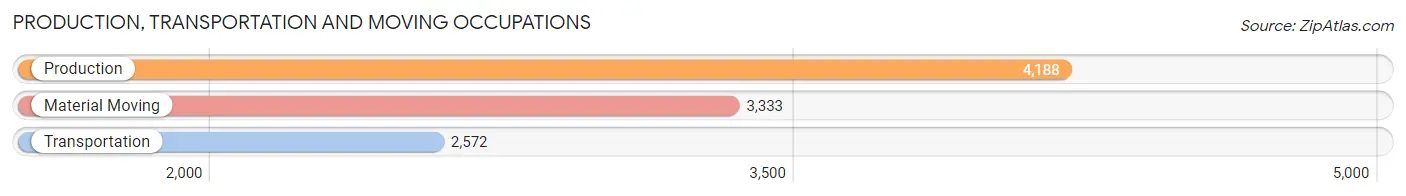
Production, Transportation and Moving Occupations by Sex
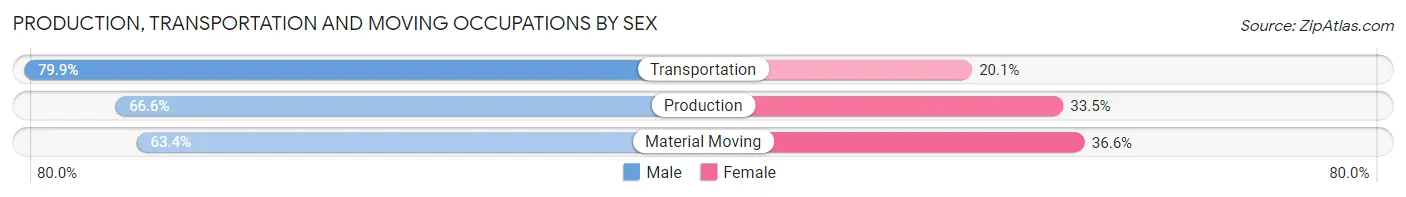
| Occupation | Male | Female |
| Production | 2,787 (66.5%) | 1,401 (33.5%) |
| Transportation | 2,056 (79.9%) | 516 (20.1%) |
| Material Moving | 2,113 (63.4%) | 1,220 (36.6%) |
| Total (Category) | 6,956 (68.9%) | 3,137 (31.1%) |
| Total (Overall) | 30,110 (53.7%) | 25,905 (46.3%) |
Employment Industries by Sex in Gresham
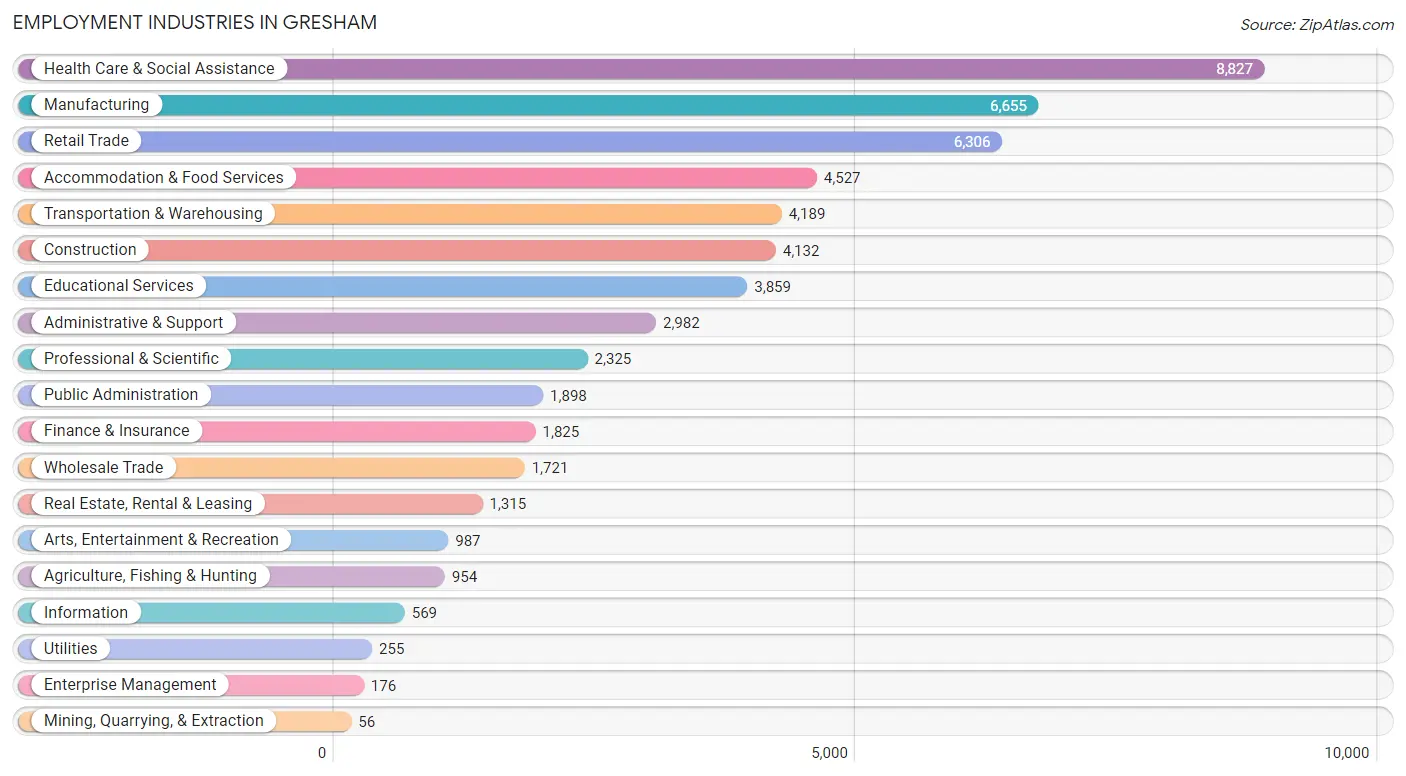
Employment Industries in Gresham
The major employment industries in Gresham include Health Care & Social Assistance (8,827 | 15.8%), Manufacturing (6,655 | 11.9%), Retail Trade (6,306 | 11.3%), Accommodation & Food Services (4,527 | 8.1%), and Transportation & Warehousing (4,189 | 7.5%).
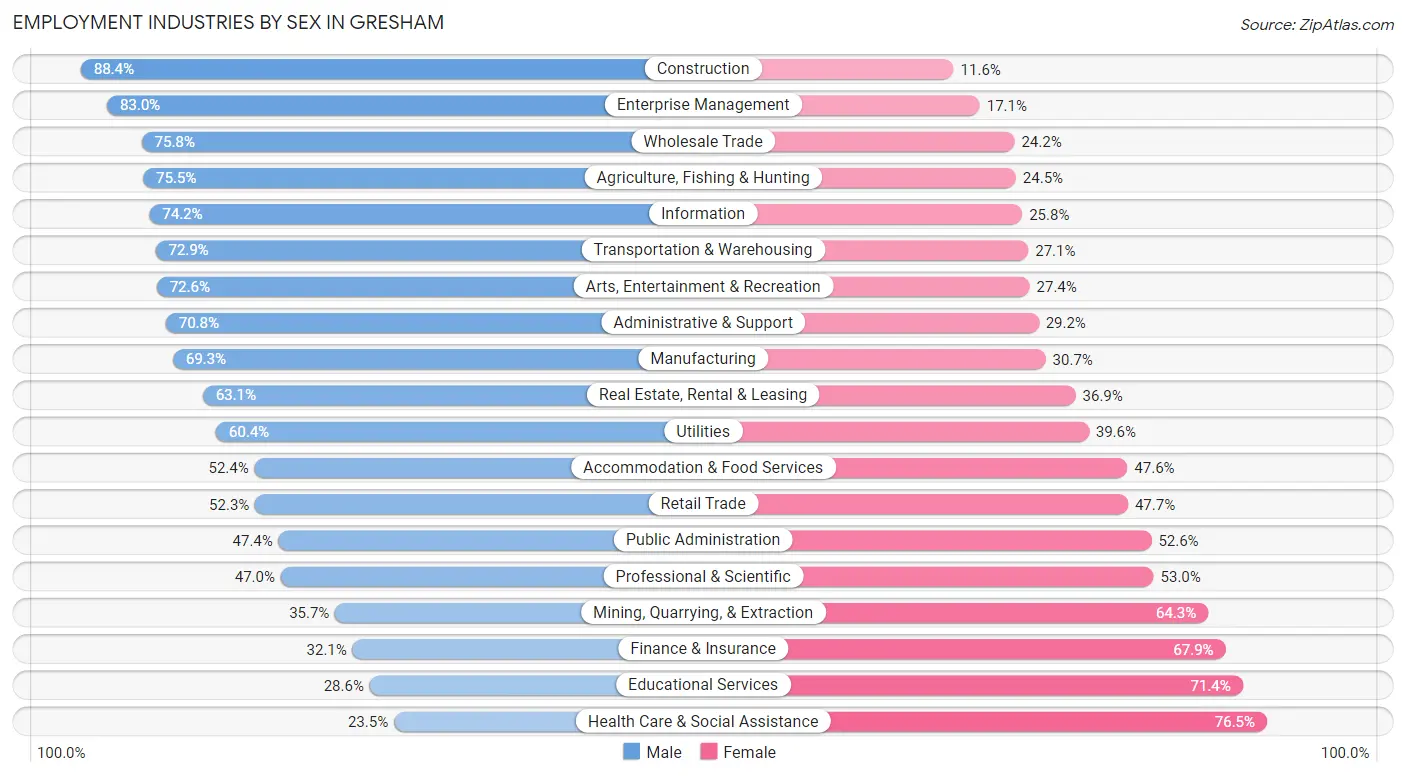
Employment Industries by Sex in Gresham
The Gresham industries that see more men than women are Construction (88.4%), Enterprise Management (83.0%), and Wholesale Trade (75.8%), whereas the industries that tend to have a higher number of women are Health Care & Social Assistance (76.5%), Educational Services (71.4%), and Finance & Insurance (67.9%).
| Industry | Male | Female |
| Agriculture, Fishing & Hunting | 720 (75.5%) | 234 (24.5%) |
| Mining, Quarrying, & Extraction | 20 (35.7%) | 36 (64.3%) |
| Construction | 3,651 (88.4%) | 481 (11.6%) |
| Manufacturing | 4,613 (69.3%) | 2,042 (30.7%) |
| Wholesale Trade | 1,304 (75.8%) | 417 (24.2%) |
| Retail Trade | 3,297 (52.3%) | 3,009 (47.7%) |
| Transportation & Warehousing | 3,054 (72.9%) | 1,135 (27.1%) |
| Utilities | 154 (60.4%) | 101 (39.6%) |
| Information | 422 (74.2%) | 147 (25.8%) |
| Finance & Insurance | 586 (32.1%) | 1,239 (67.9%) |
| Real Estate, Rental & Leasing | 830 (63.1%) | 485 (36.9%) |
| Professional & Scientific | 1,092 (47.0%) | 1,233 (53.0%) |
| Enterprise Management | 146 (83.0%) | 30 (17.1%) |
| Administrative & Support | 2,110 (70.8%) | 872 (29.2%) |
| Educational Services | 1,102 (28.6%) | 2,757 (71.4%) |
| Health Care & Social Assistance | 2,078 (23.5%) | 6,749 (76.5%) |
| Arts, Entertainment & Recreation | 717 (72.6%) | 270 (27.4%) |
| Accommodation & Food Services | 2,372 (52.4%) | 2,155 (47.6%) |
| Public Administration | 900 (47.4%) | 998 (52.6%) |
| Total | 30,110 (53.7%) | 25,905 (46.3%) |
Education in Gresham
School Enrollment in Gresham
The most common levels of schooling among the 26,528 students in Gresham are middle school (6,291 | 23.7%), college / undergraduate (5,839 | 22.0%), and high school (5,567 | 21.0%).
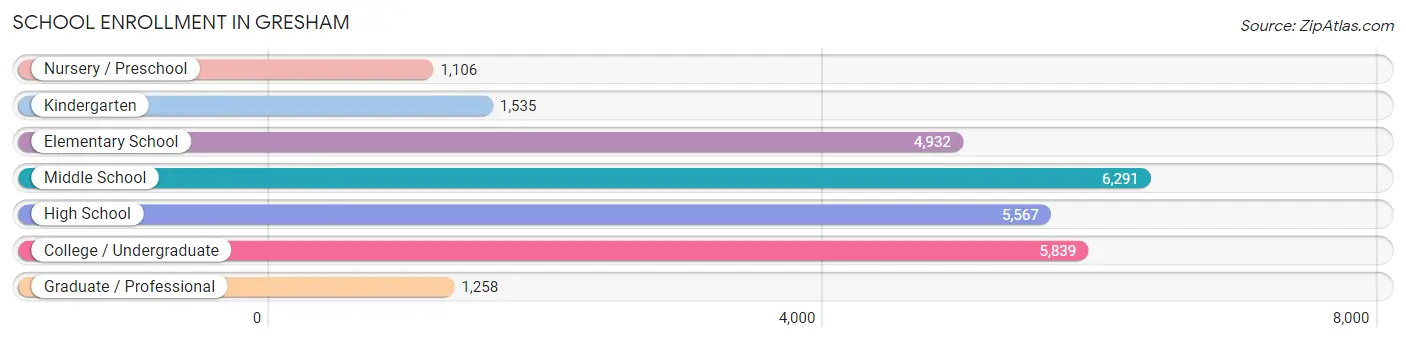
| School Level | # Students | % Students |
| Nursery / Preschool | 1,106 | 4.2% |
| Kindergarten | 1,535 | 5.8% |
| Elementary School | 4,932 | 18.6% |
| Middle School | 6,291 | 23.7% |
| High School | 5,567 | 21.0% |
| College / Undergraduate | 5,839 | 22.0% |
| Graduate / Professional | 1,258 | 4.7% |
| Total | 26,528 | 100.0% |
School Enrollment by Age by Funding Source in Gresham
Out of a total of 26,528 students who are enrolled in schools in Gresham, 4,271 (16.1%) attend a private institution, while the remaining 22,257 (83.9%) are enrolled in public schools. The age group of 20 to 24 year olds has the highest likelihood of being enrolled in private schools, with 1,331 (50.3% in the age bracket) enrolled. Conversely, the age group of 15 to 17 year olds has the lowest likelihood of being enrolled in a private school, with 3,976 (94.0% in the age bracket) attending a public institution.
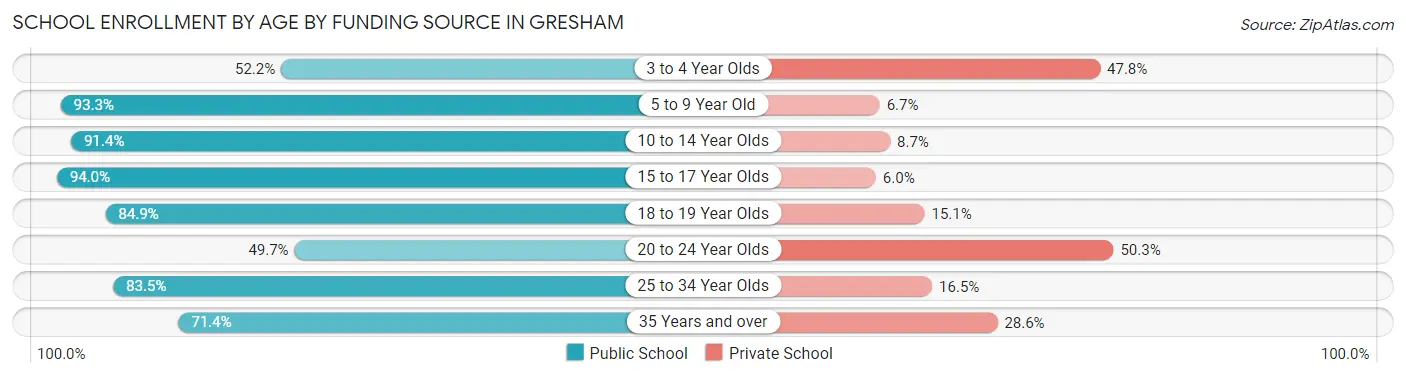
| Age Bracket | Public School | Private School |
| 3 to 4 Year Olds | 594 (52.2%) | 543 (47.8%) |
| 5 to 9 Year Old | 5,291 (93.3%) | 381 (6.7%) |
| 10 to 14 Year Olds | 7,010 (91.3%) | 664 (8.6%) |
| 15 to 17 Year Olds | 3,976 (94.0%) | 254 (6.0%) |
| 18 to 19 Year Olds | 1,049 (84.9%) | 186 (15.1%) |
| 20 to 24 Year Olds | 1,317 (49.7%) | 1,331 (50.3%) |
| 25 to 34 Year Olds | 1,485 (83.5%) | 293 (16.5%) |
| 35 Years and over | 1,537 (71.4%) | 617 (28.6%) |
| Total | 22,257 (83.9%) | 4,271 (16.1%) |
Educational Attainment by Field of Study in Gresham
Business (3,371 | 17.0%), education (2,984 | 15.0%), science & technology (1,586 | 8.0%), liberal arts & history (1,445 | 7.3%), and social sciences (1,329 | 6.7%) are the most common fields of study among 19,835 individuals in Gresham who have obtained a bachelor's degree or higher.
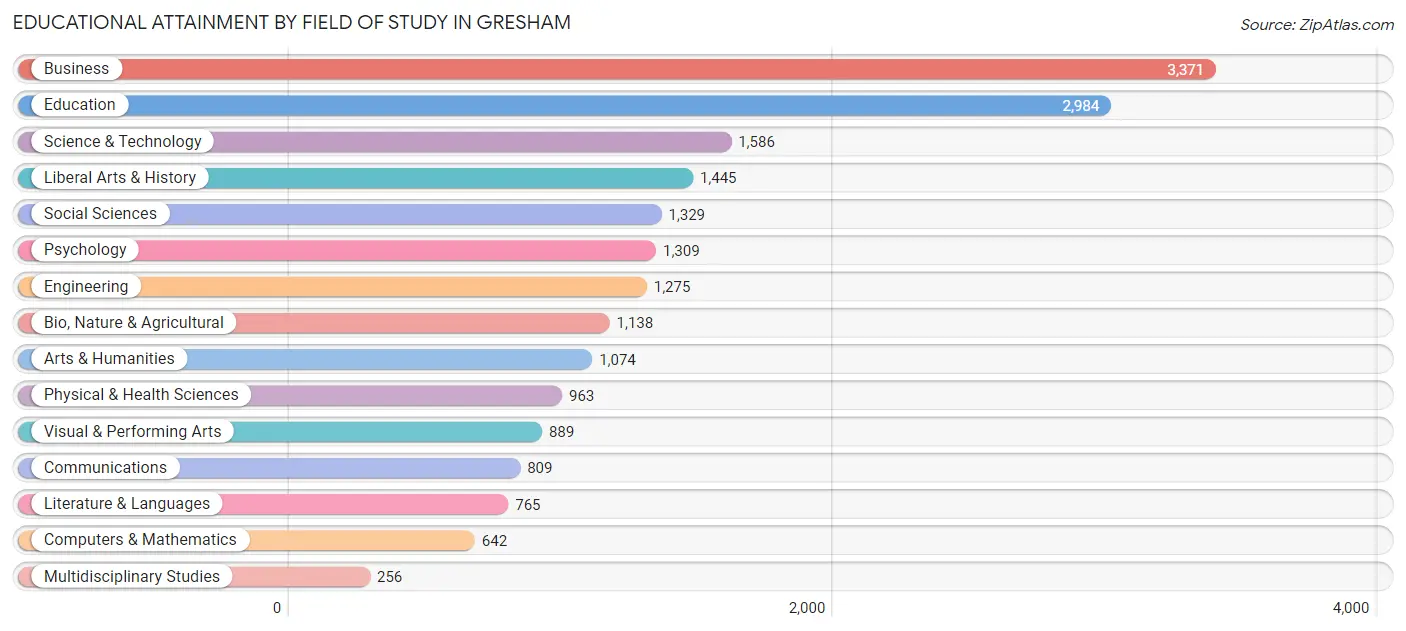
| Field of Study | # Graduates | % Graduates |
| Computers & Mathematics | 642 | 3.2% |
| Bio, Nature & Agricultural | 1,138 | 5.7% |
| Physical & Health Sciences | 963 | 4.9% |
| Psychology | 1,309 | 6.6% |
| Social Sciences | 1,329 | 6.7% |
| Engineering | 1,275 | 6.4% |
| Multidisciplinary Studies | 256 | 1.3% |
| Science & Technology | 1,586 | 8.0% |
| Business | 3,371 | 17.0% |
| Education | 2,984 | 15.0% |
| Literature & Languages | 765 | 3.9% |
| Liberal Arts & History | 1,445 | 7.3% |
| Visual & Performing Arts | 889 | 4.5% |
| Communications | 809 | 4.1% |
| Arts & Humanities | 1,074 | 5.4% |
| Total | 19,835 | 100.0% |
Transportation & Commute in Gresham
Vehicle Availability by Sex in Gresham
The most prevalent vehicle ownership categories in Gresham are males with 2 vehicles (11,474, accounting for 39.7%) and females with 2 vehicles (8,849, making up 45.9%).
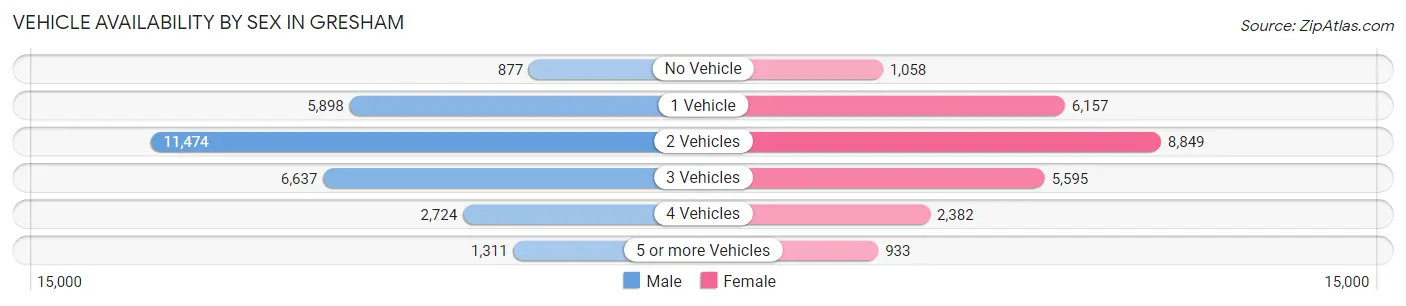
| Vehicles Available | Male | Female |
| No Vehicle | 877 (3.0%) | 1,058 (4.2%) |
| 1 Vehicle | 5,898 (20.4%) | 6,157 (24.6%) |
| 2 Vehicles | 11,474 (39.7%) | 8,849 (35.4%) |
| 3 Vehicles | 6,637 (23.0%) | 5,595 (22.4%) |
| 4 Vehicles | 2,724 (9.4%) | 2,382 (9.5%) |
| 5 or more Vehicles | 1,311 (4.5%) | 933 (3.7%) |
| Total | 28,921 (100.0%) | 24,974 (100.0%) |
Commute Time in Gresham
The most frequently occuring commute durations in Gresham are 30 to 34 minutes (8,146 commuters, 16.8%), 20 to 24 minutes (7,230 commuters, 14.9%), and 15 to 19 minutes (6,990 commuters, 14.4%).
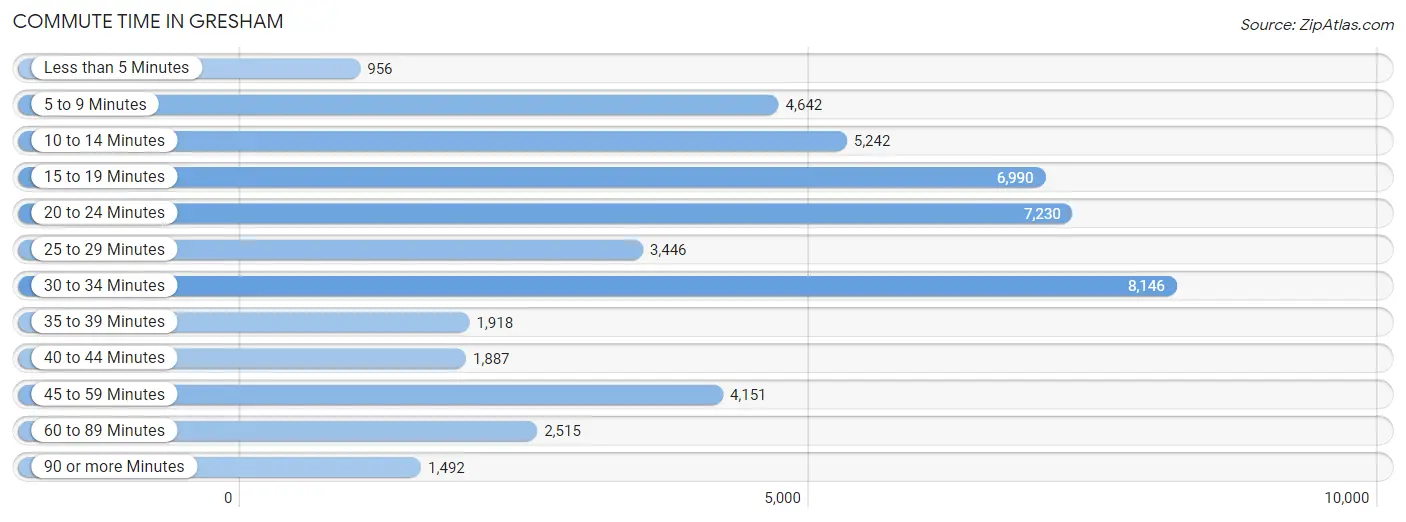
| Commute Time | # Commuters | % Commuters |
| Less than 5 Minutes | 956 | 2.0% |
| 5 to 9 Minutes | 4,642 | 9.6% |
| 10 to 14 Minutes | 5,242 | 10.8% |
| 15 to 19 Minutes | 6,990 | 14.4% |
| 20 to 24 Minutes | 7,230 | 14.9% |
| 25 to 29 Minutes | 3,446 | 7.1% |
| 30 to 34 Minutes | 8,146 | 16.8% |
| 35 to 39 Minutes | 1,918 | 4.0% |
| 40 to 44 Minutes | 1,887 | 3.9% |
| 45 to 59 Minutes | 4,151 | 8.5% |
| 60 to 89 Minutes | 2,515 | 5.2% |
| 90 or more Minutes | 1,492 | 3.1% |
Commute Time by Sex in Gresham
The most common commute times in Gresham are 30 to 34 minutes (5,223 commuters, 19.5%) for males and 15 to 19 minutes (3,249 commuters, 14.9%) for females.
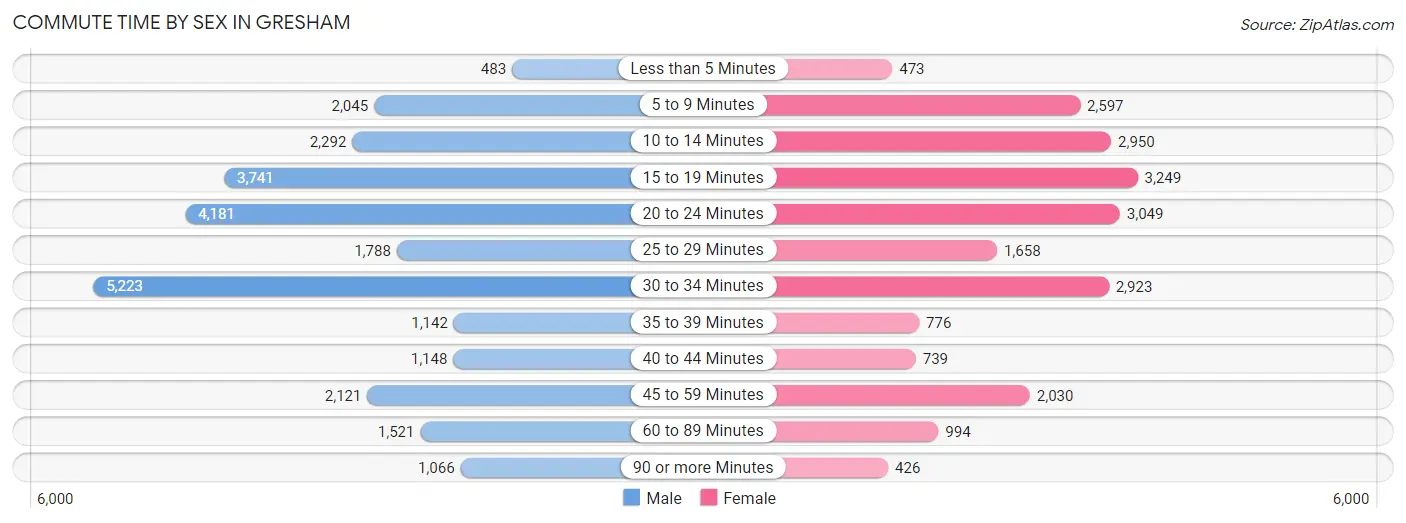
| Commute Time | Male | Female |
| Less than 5 Minutes | 483 (1.8%) | 473 (2.2%) |
| 5 to 9 Minutes | 2,045 (7.6%) | 2,597 (11.9%) |
| 10 to 14 Minutes | 2,292 (8.6%) | 2,950 (13.5%) |
| 15 to 19 Minutes | 3,741 (14.0%) | 3,249 (14.9%) |
| 20 to 24 Minutes | 4,181 (15.6%) | 3,049 (14.0%) |
| 25 to 29 Minutes | 1,788 (6.7%) | 1,658 (7.6%) |
| 30 to 34 Minutes | 5,223 (19.5%) | 2,923 (13.4%) |
| 35 to 39 Minutes | 1,142 (4.3%) | 776 (3.5%) |
| 40 to 44 Minutes | 1,148 (4.3%) | 739 (3.4%) |
| 45 to 59 Minutes | 2,121 (7.9%) | 2,030 (9.3%) |
| 60 to 89 Minutes | 1,521 (5.7%) | 994 (4.5%) |
| 90 or more Minutes | 1,066 (4.0%) | 426 (1.9%) |
Time of Departure to Work by Sex in Gresham
The most frequent times of departure to work in Gresham are 7:00 AM to 7:29 AM (3,277, 12.2%) for males and 7:00 AM to 7:29 AM (2,443, 11.2%) for females.
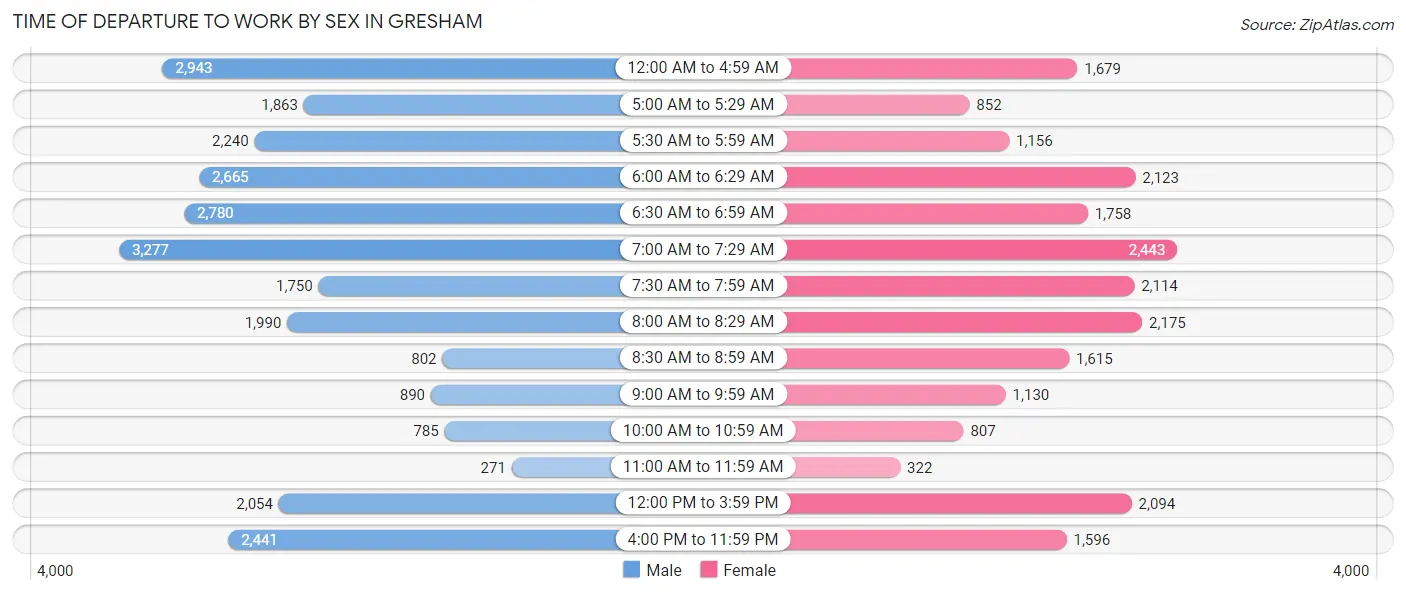
| Time of Departure | Male | Female |
| 12:00 AM to 4:59 AM | 2,943 (11.0%) | 1,679 (7.7%) |
| 5:00 AM to 5:29 AM | 1,863 (7.0%) | 852 (3.9%) |
| 5:30 AM to 5:59 AM | 2,240 (8.4%) | 1,156 (5.3%) |
| 6:00 AM to 6:29 AM | 2,665 (10.0%) | 2,123 (9.7%) |
| 6:30 AM to 6:59 AM | 2,780 (10.4%) | 1,758 (8.0%) |
| 7:00 AM to 7:29 AM | 3,277 (12.2%) | 2,443 (11.2%) |
| 7:30 AM to 7:59 AM | 1,750 (6.5%) | 2,114 (9.7%) |
| 8:00 AM to 8:29 AM | 1,990 (7.4%) | 2,175 (10.0%) |
| 8:30 AM to 8:59 AM | 802 (3.0%) | 1,615 (7.4%) |
| 9:00 AM to 9:59 AM | 890 (3.3%) | 1,130 (5.2%) |
| 10:00 AM to 10:59 AM | 785 (2.9%) | 807 (3.7%) |
| 11:00 AM to 11:59 AM | 271 (1.0%) | 322 (1.5%) |
| 12:00 PM to 3:59 PM | 2,054 (7.7%) | 2,094 (9.6%) |
| 4:00 PM to 11:59 PM | 2,441 (9.1%) | 1,596 (7.3%) |
| Total | 26,751 (100.0%) | 21,864 (100.0%) |
Housing Occupancy in Gresham
Occupancy by Ownership in Gresham
Of the total 42,243 dwellings in Gresham, owner-occupied units account for 23,373 (55.3%), while renter-occupied units make up 18,870 (44.7%).
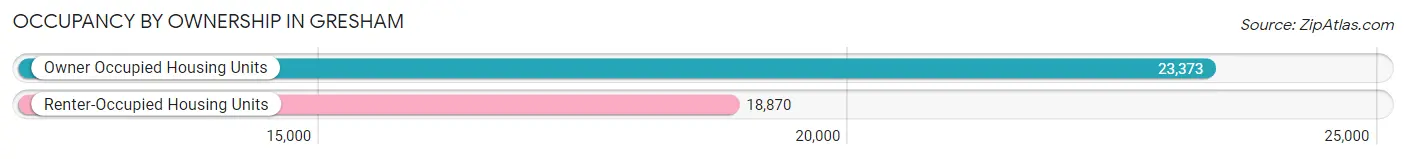
| Occupancy | # Housing Units | % Housing Units |
| Owner Occupied Housing Units | 23,373 | 55.3% |
| Renter-Occupied Housing Units | 18,870 | 44.7% |
| Total Occupied Housing Units | 42,243 | 100.0% |
Occupancy by Household Size in Gresham
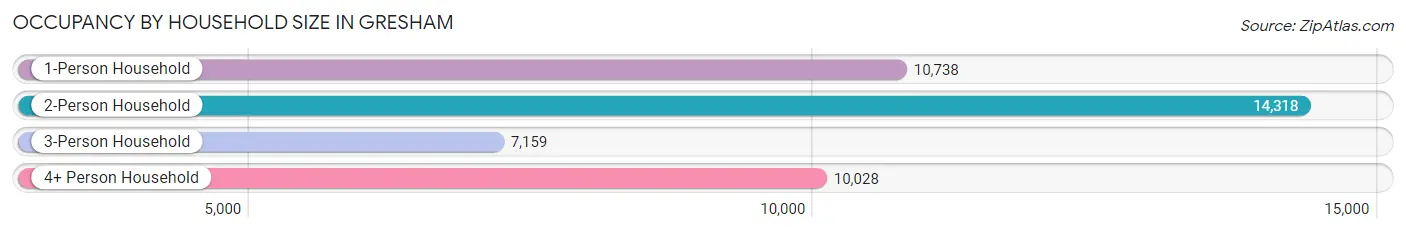
| Household Size | # Housing Units | % Housing Units |
| 1-Person Household | 10,738 | 25.4% |
| 2-Person Household | 14,318 | 33.9% |
| 3-Person Household | 7,159 | 17.0% |
| 4+ Person Household | 10,028 | 23.7% |
| Total Housing Units | 42,243 | 100.0% |
Occupancy by Ownership by Household Size in Gresham
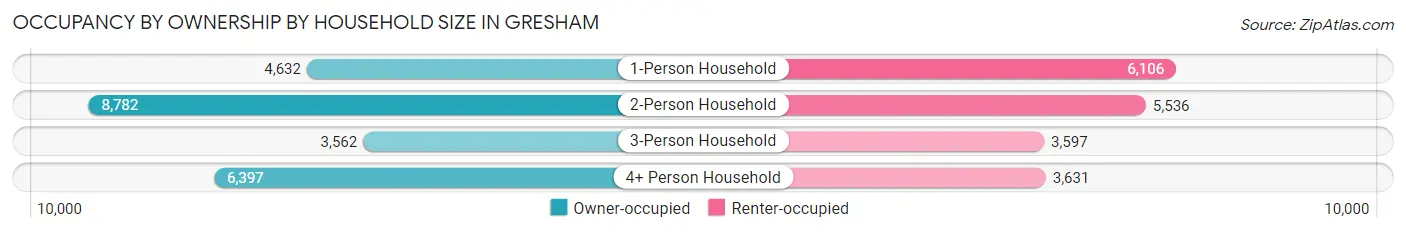
| Household Size | Owner-occupied | Renter-occupied |
| 1-Person Household | 4,632 (43.1%) | 6,106 (56.9%) |
| 2-Person Household | 8,782 (61.3%) | 5,536 (38.7%) |
| 3-Person Household | 3,562 (49.8%) | 3,597 (50.2%) |
| 4+ Person Household | 6,397 (63.8%) | 3,631 (36.2%) |
| Total Housing Units | 23,373 (55.3%) | 18,870 (44.7%) |
Occupancy by Educational Attainment in Gresham
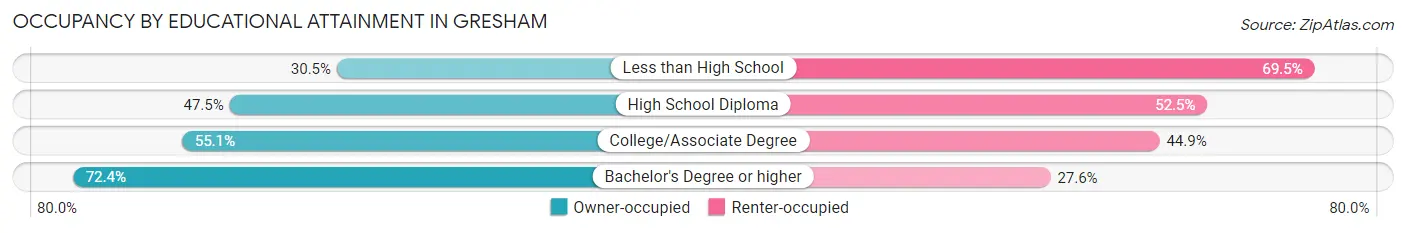
| Household Size | Owner-occupied | Renter-occupied |
| Less than High School | 1,279 (30.5%) | 2,918 (69.5%) |
| High School Diploma | 4,658 (47.5%) | 5,150 (52.5%) |
| College/Associate Degree | 9,534 (55.1%) | 7,783 (44.9%) |
| Bachelor's Degree or higher | 7,902 (72.4%) | 3,019 (27.6%) |
Occupancy by Age of Householder in Gresham
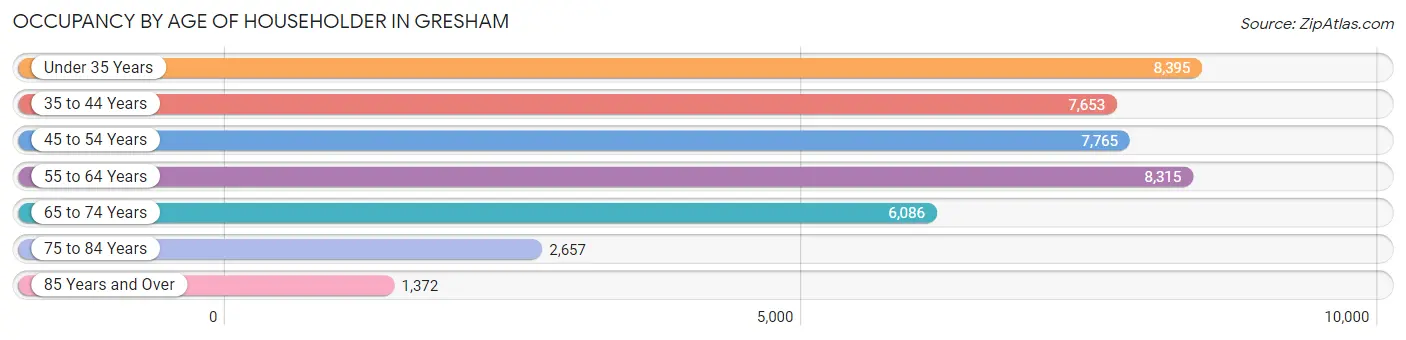
| Age Bracket | # Households | % Households |
| Under 35 Years | 8,395 | 19.9% |
| 35 to 44 Years | 7,653 | 18.1% |
| 45 to 54 Years | 7,765 | 18.4% |
| 55 to 64 Years | 8,315 | 19.7% |
| 65 to 74 Years | 6,086 | 14.4% |
| 75 to 84 Years | 2,657 | 6.3% |
| 85 Years and Over | 1,372 | 3.3% |
| Total | 42,243 | 100.0% |
Housing Finances in Gresham
Median Income by Occupancy in Gresham
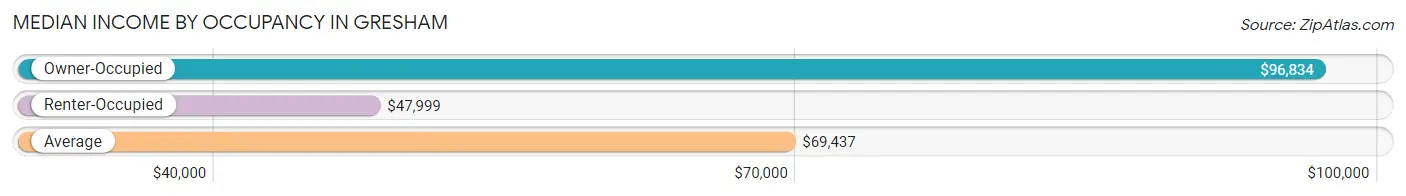
| Occupancy Type | # Households | Median Income |
| Owner-Occupied | 23,373 (55.3%) | $96,834 |
| Renter-Occupied | 18,870 (44.7%) | $47,999 |
| Average | 42,243 (100.0%) | $69,437 |
Occupancy by Householder Income Bracket in Gresham
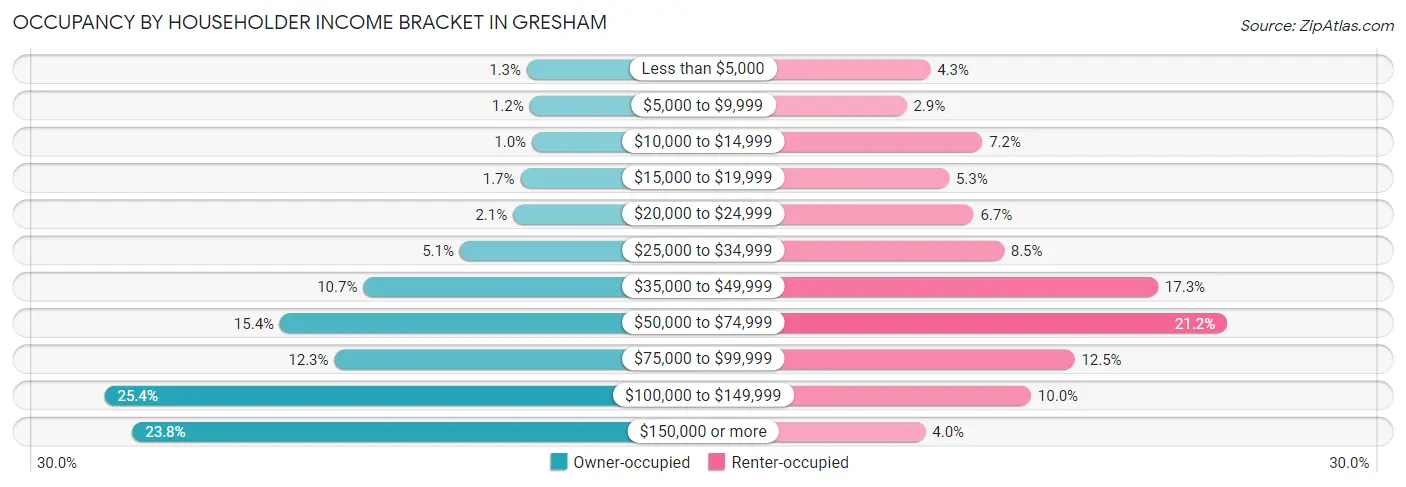
| Income Bracket | Owner-occupied | Renter-occupied |
| Less than $5,000 | 305 (1.3%) | 805 (4.3%) |
| $5,000 to $9,999 | 269 (1.1%) | 549 (2.9%) |
| $10,000 to $14,999 | 235 (1.0%) | 1,366 (7.2%) |
| $15,000 to $19,999 | 391 (1.7%) | 1,008 (5.3%) |
| $20,000 to $24,999 | 489 (2.1%) | 1,272 (6.7%) |
| $25,000 to $34,999 | 1,200 (5.1%) | 1,599 (8.5%) |
| $35,000 to $49,999 | 2,490 (10.6%) | 3,261 (17.3%) |
| $50,000 to $74,999 | 3,601 (15.4%) | 4,007 (21.2%) |
| $75,000 to $99,999 | 2,876 (12.3%) | 2,361 (12.5%) |
| $100,000 to $149,999 | 5,944 (25.4%) | 1,890 (10.0%) |
| $150,000 or more | 5,573 (23.8%) | 752 (4.0%) |
| Total | 23,373 (100.0%) | 18,870 (100.0%) |
Monthly Housing Cost Tiers in Gresham
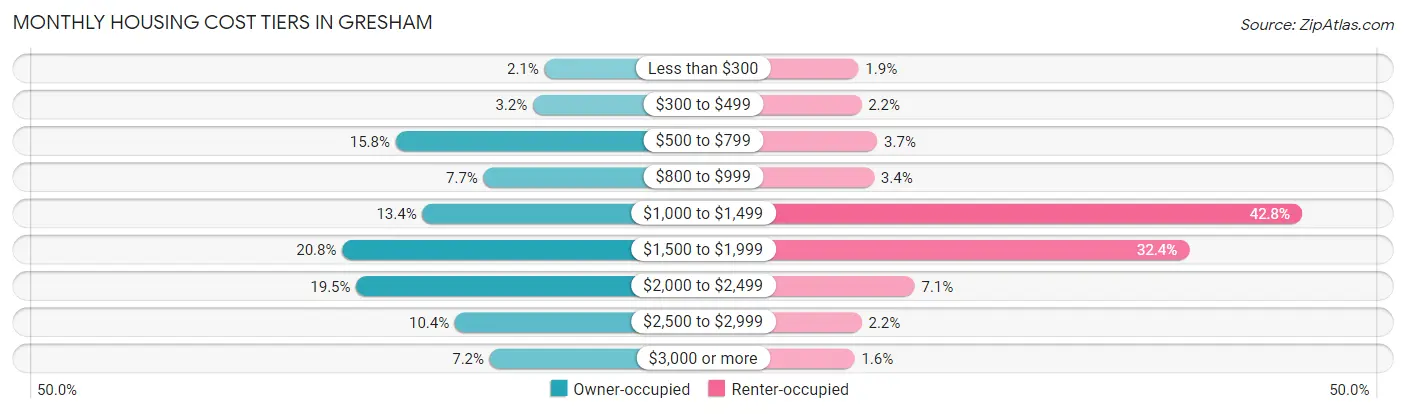
| Monthly Cost | Owner-occupied | Renter-occupied |
| Less than $300 | 498 (2.1%) | 365 (1.9%) |
| $300 to $499 | 746 (3.2%) | 413 (2.2%) |
| $500 to $799 | 3,699 (15.8%) | 690 (3.7%) |
| $800 to $999 | 1,808 (7.7%) | 634 (3.4%) |
| $1,000 to $1,499 | 3,124 (13.4%) | 8,066 (42.7%) |
| $1,500 to $1,999 | 4,850 (20.7%) | 6,109 (32.4%) |
| $2,000 to $2,499 | 4,548 (19.5%) | 1,339 (7.1%) |
| $2,500 to $2,999 | 2,424 (10.4%) | 418 (2.2%) |
| $3,000 or more | 1,676 (7.2%) | 296 (1.6%) |
| Total | 23,373 (100.0%) | 18,870 (100.0%) |
Physical Housing Characteristics in Gresham
Housing Structures in Gresham
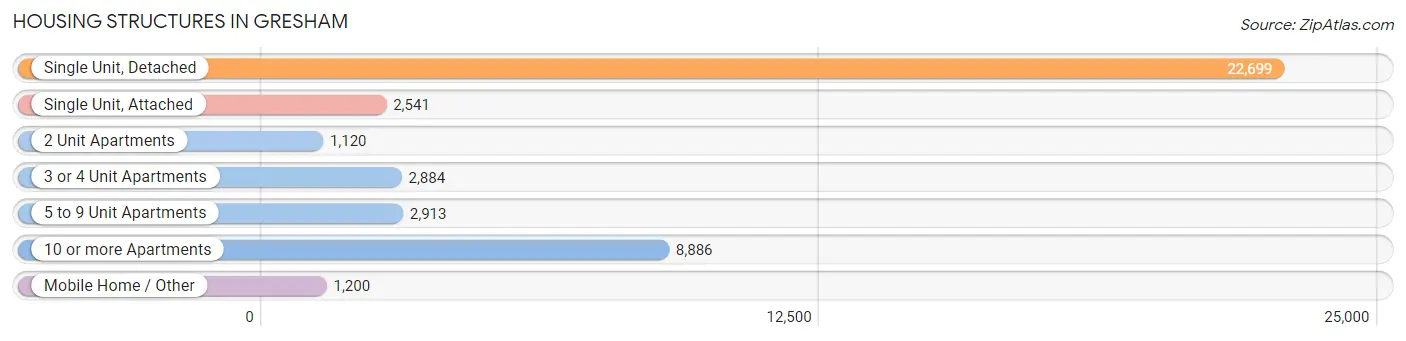
| Structure Type | # Housing Units | % Housing Units |
| Single Unit, Detached | 22,699 | 53.7% |
| Single Unit, Attached | 2,541 | 6.0% |
| 2 Unit Apartments | 1,120 | 2.6% |
| 3 or 4 Unit Apartments | 2,884 | 6.8% |
| 5 to 9 Unit Apartments | 2,913 | 6.9% |
| 10 or more Apartments | 8,886 | 21.0% |
| Mobile Home / Other | 1,200 | 2.8% |
| Total | 42,243 | 100.0% |
Housing Structures by Occupancy in Gresham
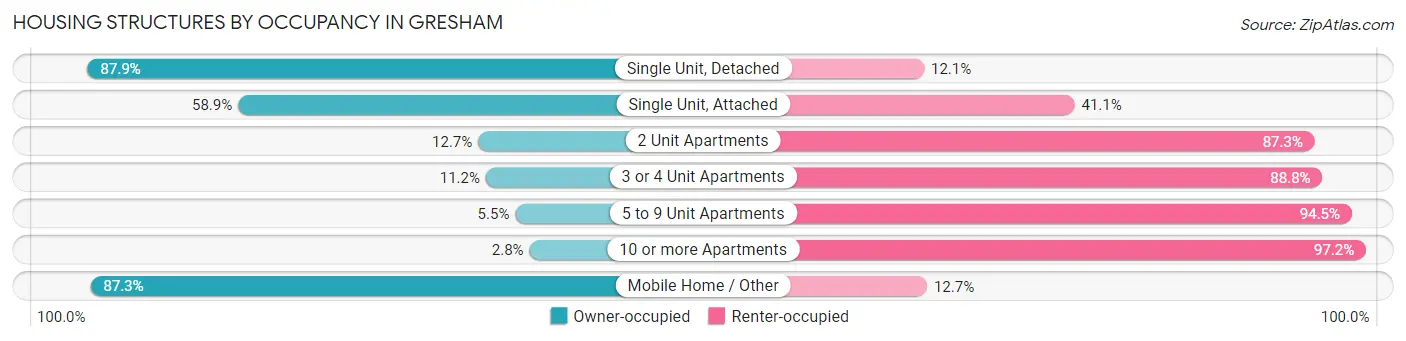
| Structure Type | Owner-occupied | Renter-occupied |
| Single Unit, Detached | 19,953 (87.9%) | 2,746 (12.1%) |
| Single Unit, Attached | 1,497 (58.9%) | 1,044 (41.1%) |
| 2 Unit Apartments | 142 (12.7%) | 978 (87.3%) |
| 3 or 4 Unit Apartments | 323 (11.2%) | 2,561 (88.8%) |
| 5 to 9 Unit Apartments | 161 (5.5%) | 2,752 (94.5%) |
| 10 or more Apartments | 249 (2.8%) | 8,637 (97.2%) |
| Mobile Home / Other | 1,048 (87.3%) | 152 (12.7%) |
| Total | 23,373 (55.3%) | 18,870 (44.7%) |
Housing Structures by Number of Rooms in Gresham
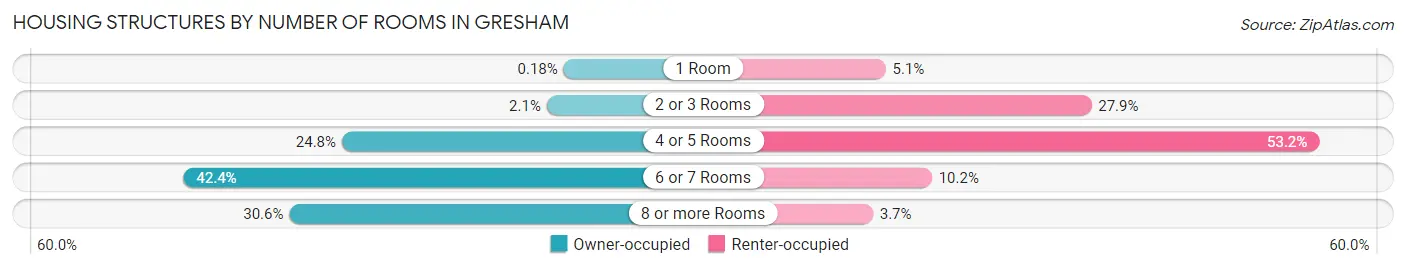
| Number of Rooms | Owner-occupied | Renter-occupied |
| 1 Room | 41 (0.2%) | 957 (5.1%) |
| 2 or 3 Rooms | 479 (2.1%) | 5,265 (27.9%) |
| 4 or 5 Rooms | 5,794 (24.8%) | 10,036 (53.2%) |
| 6 or 7 Rooms | 9,902 (42.4%) | 1,923 (10.2%) |
| 8 or more Rooms | 7,157 (30.6%) | 689 (3.6%) |
| Total | 23,373 (100.0%) | 18,870 (100.0%) |
Housing Structure by Heating Type in Gresham
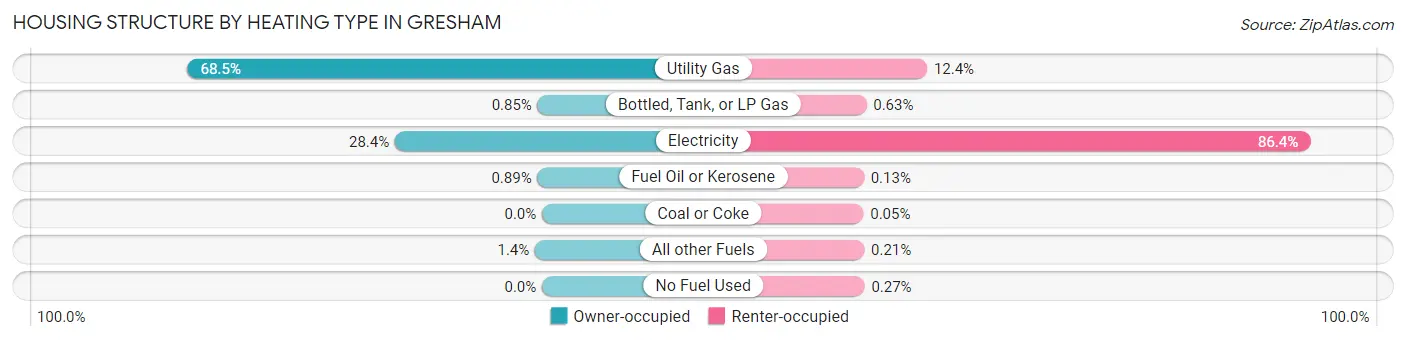
| Heating Type | Owner-occupied | Renter-occupied |
| Utility Gas | 16,011 (68.5%) | 2,330 (12.3%) |
| Bottled, Tank, or LP Gas | 199 (0.9%) | 119 (0.6%) |
| Electricity | 6,640 (28.4%) | 16,298 (86.4%) |
| Fuel Oil or Kerosene | 208 (0.9%) | 24 (0.1%) |
| Coal or Coke | 0 (0.0%) | 9 (0.1%) |
| All other Fuels | 315 (1.3%) | 39 (0.2%) |
| No Fuel Used | 0 (0.0%) | 51 (0.3%) |
| Total | 23,373 (100.0%) | 18,870 (100.0%) |
Household Vehicle Usage in Gresham
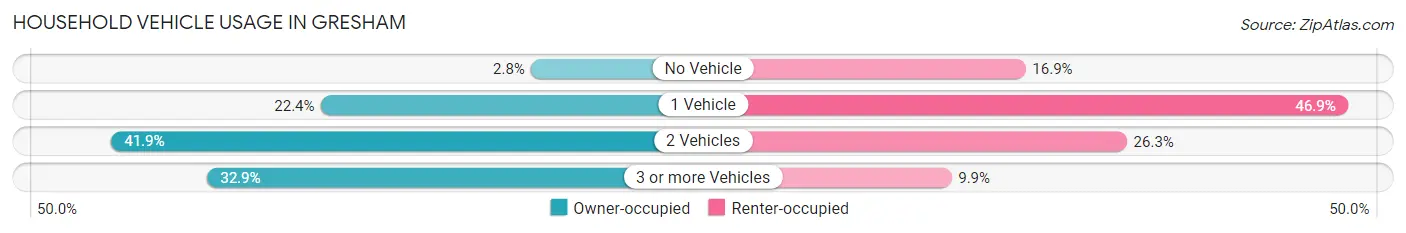
| Vehicles per Household | Owner-occupied | Renter-occupied |
| No Vehicle | 646 (2.8%) | 3,180 (16.9%) |
| 1 Vehicle | 5,233 (22.4%) | 8,853 (46.9%) |
| 2 Vehicles | 9,794 (41.9%) | 4,963 (26.3%) |
| 3 or more Vehicles | 7,700 (32.9%) | 1,874 (9.9%) |
| Total | 23,373 (100.0%) | 18,870 (100.0%) |
Real Estate & Mortgages in Gresham
Real Estate and Mortgage Overview in Gresham
| Characteristic | Without Mortgage | With Mortgage |
| Housing Units | 6,681 | 16,692 |
| Median Property Value | $383,400 | $419,300 |
| Median Household Income | $64,226 | $4,843 |
| Monthly Housing Costs | $677 | $1,676 |
| Real Estate Taxes | $3,897 | $228 |
Property Value by Mortgage Status in Gresham
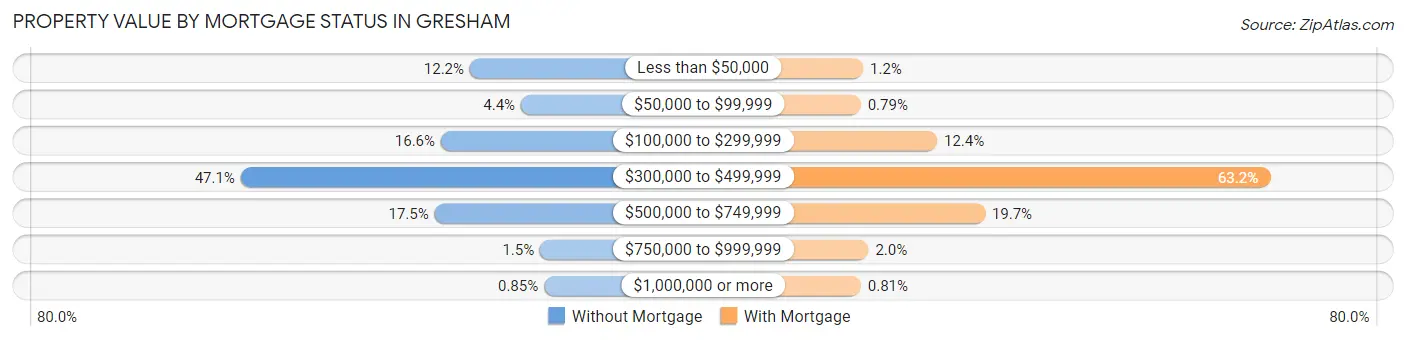
| Property Value | Without Mortgage | With Mortgage |
| Less than $50,000 | 812 (12.1%) | 192 (1.1%) |
| $50,000 to $99,999 | 292 (4.4%) | 132 (0.8%) |
| $100,000 to $299,999 | 1,107 (16.6%) | 2,073 (12.4%) |
| $300,000 to $499,999 | 3,145 (47.1%) | 10,541 (63.1%) |
| $500,000 to $749,999 | 1,171 (17.5%) | 3,291 (19.7%) |
| $750,000 to $999,999 | 97 (1.5%) | 328 (2.0%) |
| $1,000,000 or more | 57 (0.9%) | 135 (0.8%) |
| Total | 6,681 (100.0%) | 16,692 (100.0%) |
Household Income by Mortgage Status in Gresham
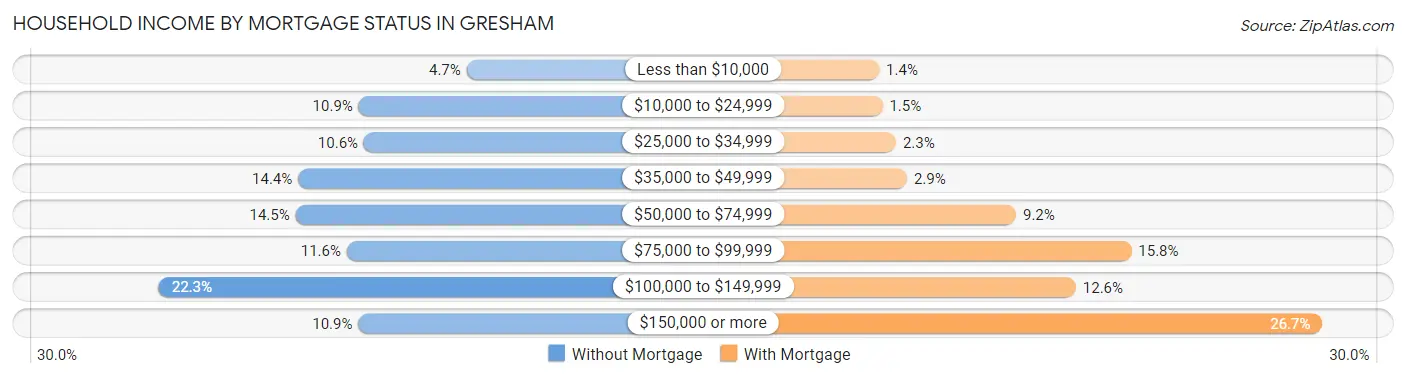
| Household Income | Without Mortgage | With Mortgage |
| Less than $10,000 | 317 (4.7%) | 225 (1.3%) |
| $10,000 to $24,999 | 729 (10.9%) | 257 (1.5%) |
| $25,000 to $34,999 | 709 (10.6%) | 386 (2.3%) |
| $35,000 to $49,999 | 960 (14.4%) | 491 (2.9%) |
| $50,000 to $74,999 | 970 (14.5%) | 1,530 (9.2%) |
| $75,000 to $99,999 | 774 (11.6%) | 2,631 (15.8%) |
| $100,000 to $149,999 | 1,492 (22.3%) | 2,102 (12.6%) |
| $150,000 or more | 730 (10.9%) | 4,452 (26.7%) |
| Total | 6,681 (100.0%) | 16,692 (100.0%) |
Property Value to Household Income Ratio in Gresham
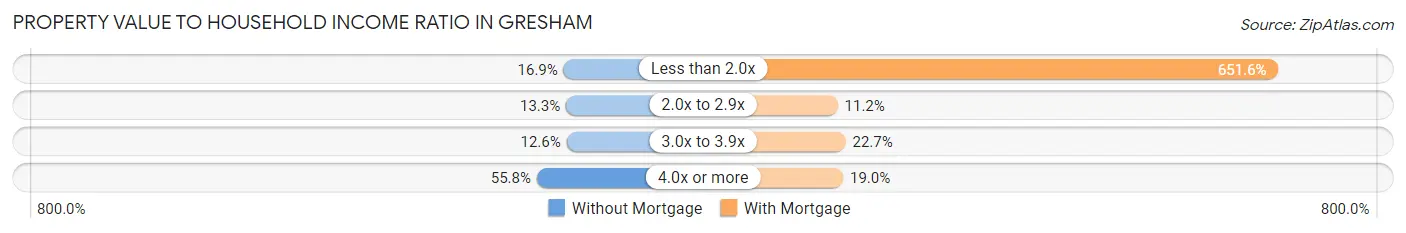
| Value-to-Income Ratio | Without Mortgage | With Mortgage |
| Less than 2.0x | 1,126 (16.9%) | 108,761 (651.6%) |
| 2.0x to 2.9x | 891 (13.3%) | 1,867 (11.2%) |
| 3.0x to 3.9x | 841 (12.6%) | 3,784 (22.7%) |
| 4.0x or more | 3,728 (55.8%) | 3,178 (19.0%) |
| Total | 6,681 (100.0%) | 16,692 (100.0%) |
Real Estate Taxes by Mortgage Status in Gresham
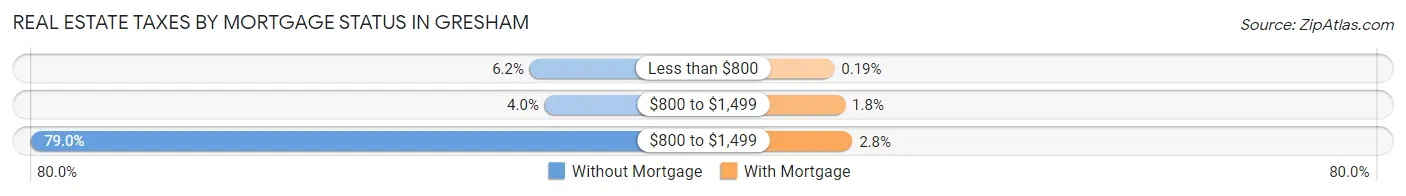
| Property Taxes | Without Mortgage | With Mortgage |
| Less than $800 | 413 (6.2%) | 31 (0.2%) |
| $800 to $1,499 | 267 (4.0%) | 295 (1.8%) |
| $800 to $1,499 | 5,280 (79.0%) | 468 (2.8%) |
| Total | 6,681 (100.0%) | 16,692 (100.0%) |
Health & Disability in Gresham
Health Insurance Coverage by Age in Gresham
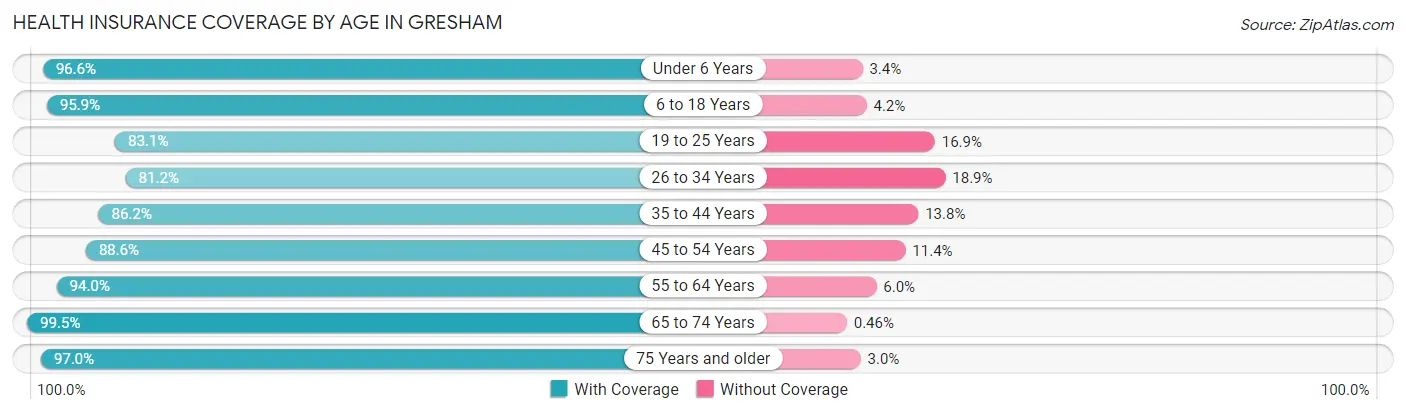
| Age Bracket | With Coverage | Without Coverage |
| Under 6 Years | 7,741 (96.6%) | 271 (3.4%) |
| 6 to 18 Years | 17,705 (95.9%) | 766 (4.2%) |
| 19 to 25 Years | 9,036 (83.1%) | 1,835 (16.9%) |
| 26 to 34 Years | 12,669 (81.1%) | 2,942 (18.9%) |
| 35 to 44 Years | 13,063 (86.2%) | 2,089 (13.8%) |
| 45 to 54 Years | 12,341 (88.6%) | 1,588 (11.4%) |
| 55 to 64 Years | 13,618 (94.0%) | 865 (6.0%) |
| 65 to 74 Years | 10,060 (99.5%) | 46 (0.5%) |
| 75 Years and older | 6,001 (97.0%) | 188 (3.0%) |
| Total | 102,234 (90.6%) | 10,590 (9.4%) |
Health Insurance Coverage by Citizenship Status in Gresham
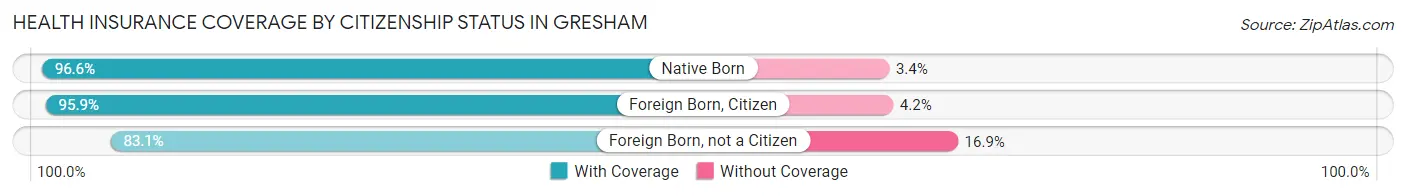
| Citizenship Status | With Coverage | Without Coverage |
| Native Born | 7,741 (96.6%) | 271 (3.4%) |
| Foreign Born, Citizen | 17,705 (95.9%) | 766 (4.2%) |
| Foreign Born, not a Citizen | 9,036 (83.1%) | 1,835 (16.9%) |
Health Insurance Coverage by Household Income in Gresham
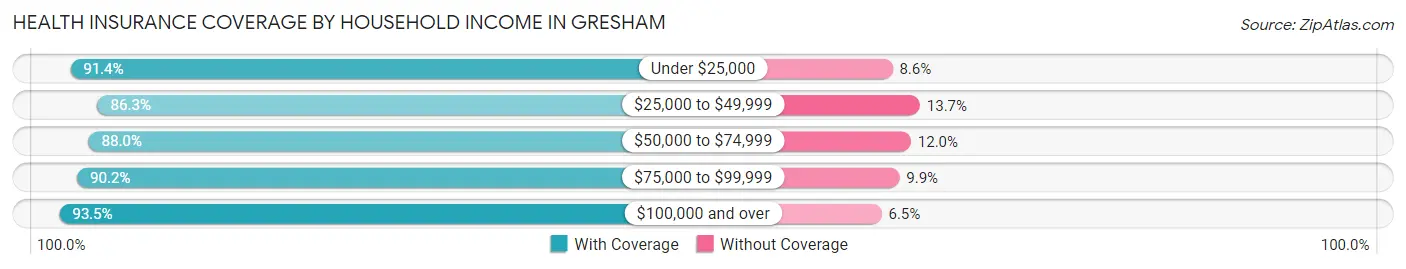
| Household Income | With Coverage | Without Coverage |
| Under $25,000 | 10,658 (91.4%) | 998 (8.6%) |
| $25,000 to $49,999 | 18,125 (86.3%) | 2,875 (13.7%) |
| $50,000 to $74,999 | 17,170 (88.0%) | 2,342 (12.0%) |
| $75,000 to $99,999 | 12,919 (90.1%) | 1,412 (9.9%) |
| $100,000 and over | 42,045 (93.5%) | 2,926 (6.5%) |
Public vs Private Health Insurance Coverage by Age in Gresham
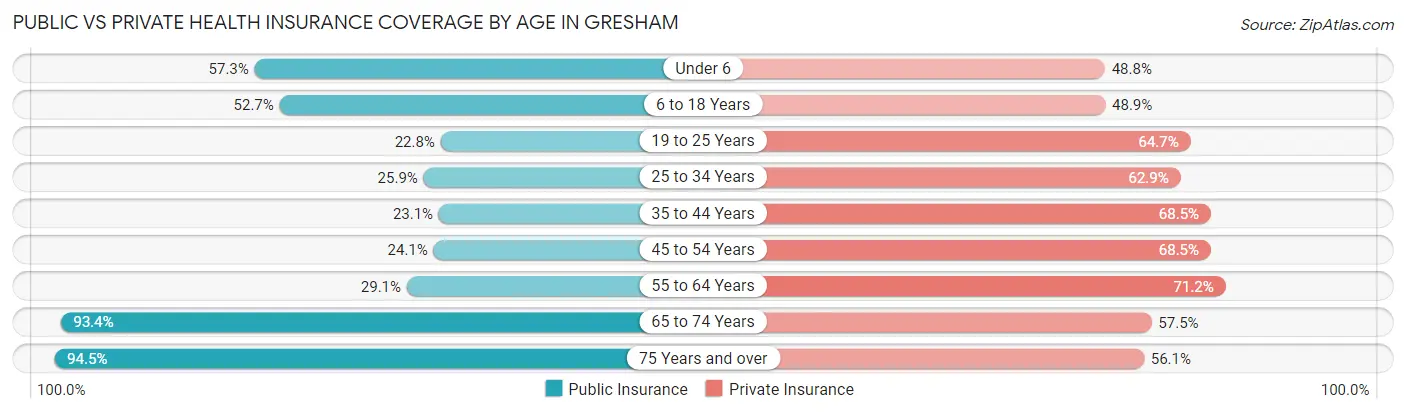
| Age Bracket | Public Insurance | Private Insurance |
| Under 6 | 4,592 (57.3%) | 3,911 (48.8%) |
| 6 to 18 Years | 9,729 (52.7%) | 9,027 (48.9%) |
| 19 to 25 Years | 2,475 (22.8%) | 7,037 (64.7%) |
| 25 to 34 Years | 4,048 (25.9%) | 9,815 (62.9%) |
| 35 to 44 Years | 3,498 (23.1%) | 10,381 (68.5%) |
| 45 to 54 Years | 3,354 (24.1%) | 9,542 (68.5%) |
| 55 to 64 Years | 4,208 (29.0%) | 10,316 (71.2%) |
| 65 to 74 Years | 9,436 (93.4%) | 5,808 (57.5%) |
| 75 Years and over | 5,849 (94.5%) | 3,469 (56.0%) |
| Total | 47,189 (41.8%) | 69,306 (61.4%) |
Disability Status by Sex by Age in Gresham
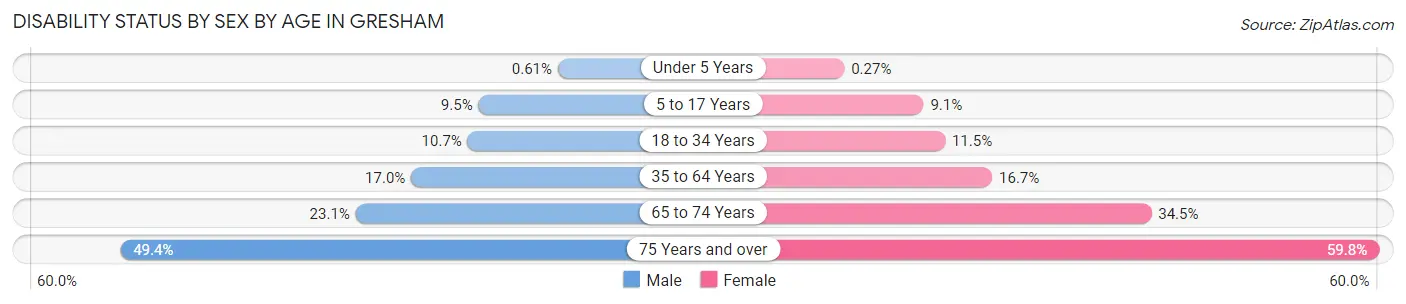
| Age Bracket | Male | Female |
| Under 5 Years | 22 (0.6%) | 9 (0.3%) |
| 5 to 17 Years | 882 (9.5%) | 831 (9.1%) |
| 18 to 34 Years | 1,574 (10.7%) | 1,471 (11.5%) |
| 35 to 64 Years | 3,705 (17.0%) | 3,633 (16.7%) |
| 65 to 74 Years | 1,085 (23.1%) | 1,867 (34.5%) |
| 75 Years and over | 1,179 (49.3%) | 2,273 (59.8%) |
Disability Class by Sex by Age in Gresham
Disability Class: Hearing Difficulty
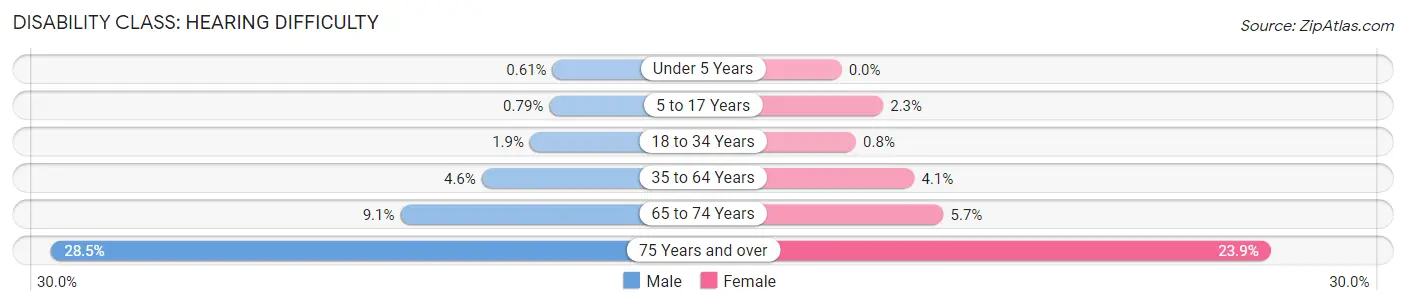
| Age Bracket | Male | Female |
| Under 5 Years | 22 (0.6%) | 0 (0.0%) |
| 5 to 17 Years | 74 (0.8%) | 211 (2.3%) |
| 18 to 34 Years | 276 (1.9%) | 102 (0.8%) |
| 35 to 64 Years | 995 (4.5%) | 880 (4.1%) |
| 65 to 74 Years | 426 (9.1%) | 307 (5.7%) |
| 75 Years and over | 681 (28.5%) | 907 (23.9%) |
Disability Class: Vision Difficulty
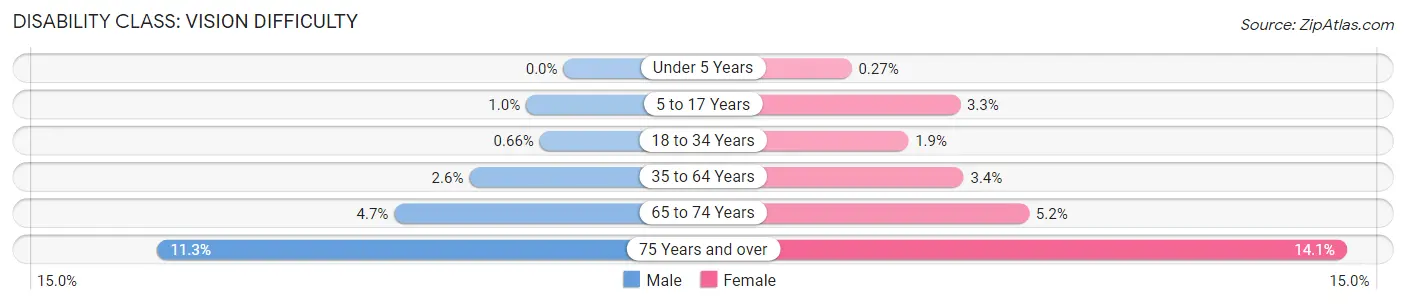
| Age Bracket | Male | Female |
| Under 5 Years | 0 (0.0%) | 9 (0.3%) |
| 5 to 17 Years | 97 (1.0%) | 300 (3.3%) |
| 18 to 34 Years | 97 (0.7%) | 237 (1.8%) |
| 35 to 64 Years | 573 (2.6%) | 735 (3.4%) |
| 65 to 74 Years | 221 (4.7%) | 282 (5.2%) |
| 75 Years and over | 270 (11.3%) | 534 (14.1%) |
Disability Class: Cognitive Difficulty
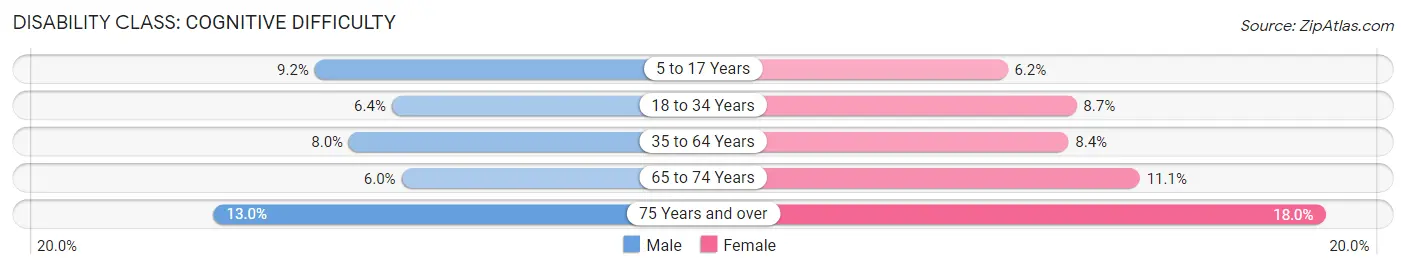
| Age Bracket | Male | Female |
| 5 to 17 Years | 861 (9.2%) | 562 (6.1%) |
| 18 to 34 Years | 940 (6.4%) | 1,115 (8.7%) |
| 35 to 64 Years | 1,740 (8.0%) | 1,826 (8.4%) |
| 65 to 74 Years | 282 (6.0%) | 599 (11.1%) |
| 75 Years and over | 310 (13.0%) | 682 (17.9%) |
Disability Class: Ambulatory Difficulty
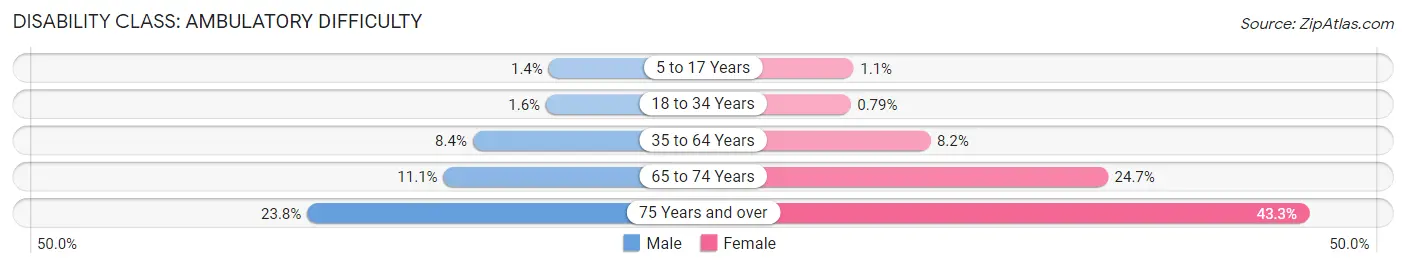
| Age Bracket | Male | Female |
| 5 to 17 Years | 128 (1.4%) | 98 (1.1%) |
| 18 to 34 Years | 239 (1.6%) | 101 (0.8%) |
| 35 to 64 Years | 1,838 (8.4%) | 1,775 (8.2%) |
| 65 to 74 Years | 522 (11.1%) | 1,336 (24.7%) |
| 75 Years and over | 568 (23.8%) | 1,647 (43.3%) |
Disability Class: Self-Care Difficulty
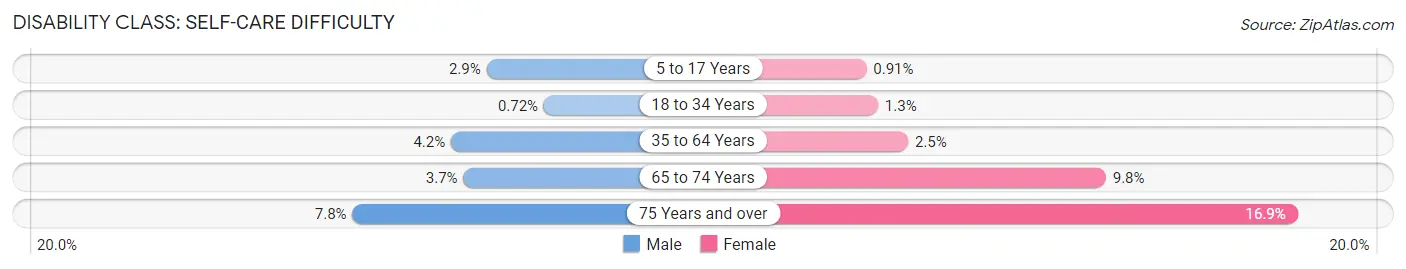
| Age Bracket | Male | Female |
| 5 to 17 Years | 266 (2.9%) | 83 (0.9%) |
| 18 to 34 Years | 106 (0.7%) | 171 (1.3%) |
| 35 to 64 Years | 911 (4.2%) | 534 (2.5%) |
| 65 to 74 Years | 174 (3.7%) | 531 (9.8%) |
| 75 Years and over | 187 (7.8%) | 643 (16.9%) |
Technology Access in Gresham
Computing Device Access in Gresham
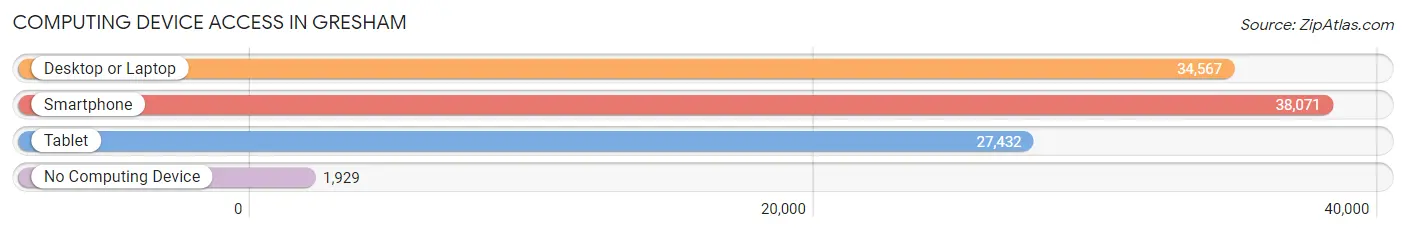
| Device Type | # Households | % Households |
| Desktop or Laptop | 34,567 | 81.8% |
| Smartphone | 38,071 | 90.1% |
| Tablet | 27,432 | 64.9% |
| No Computing Device | 1,929 | 4.6% |
| Total | 42,243 | 100.0% |
Internet Access in Gresham
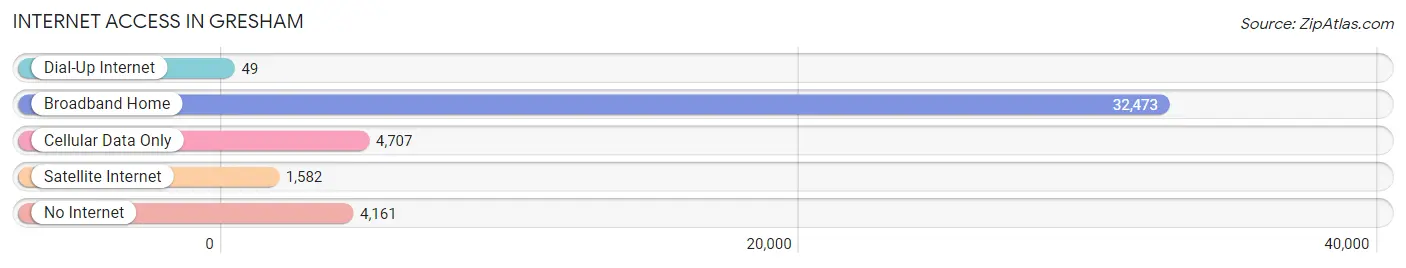
| Internet Type | # Households | % Households |
| Dial-Up Internet | 49 | 0.1% |
| Broadband Home | 32,473 | 76.9% |
| Cellular Data Only | 4,707 | 11.1% |
| Satellite Internet | 1,582 | 3.7% |
| No Internet | 4,161 | 9.9% |
| Total | 42,243 | 100.0% |
Gresham Summary
Gresham, Oregon is a city located in Multnomah County, Oregon, United States, east of Portland. It is the fourth-largest city in the state, with a population of 105,594 as of the 2010 census. Gresham is located in the foothills of the Cascade Mountains and is part of the Portland metropolitan area.
History
Gresham was founded in 1884 by brothers George and William Powell, who named the city after their hometown of Gresham, Wisconsin. The city was incorporated in 1905 and was originally a farming community. In the early 1900s, Gresham was a popular destination for people seeking to escape the hustle and bustle of Portland.
In the 1950s, Gresham began to experience rapid growth as the Portland metropolitan area expanded. The city was transformed from a rural farming community to a suburban bedroom community. In the 1980s, Gresham experienced a period of rapid growth as the city became a popular destination for people seeking affordable housing.
Geography
Gresham is located in the foothills of the Cascade Mountains, about 20 miles east of Portland. The city is situated at an elevation of about 500 feet above sea level. The city is bordered by Troutdale to the north, Fairview to the east, Boring to the south, and Portland to the west.
Gresham is located in the Tualatin Valley, which is part of the Willamette Valley. The city is located on the banks of the Sandy River, which flows through the city. The city is also home to several lakes, including Gresham Lake, Blue Lake, and Oxbow Lake.
Economy
Gresham’s economy is largely based on retail, manufacturing, and services. The city is home to several large employers, including Intel, Nike, and Columbia Sportswear. Gresham is also home to several smaller businesses, including restaurants, shops, and other services.
Gresham is also home to several educational institutions, including Mt. Hood Community College, Portland Community College, and the University of Portland.
Demographics
As of the 2010 census, Gresham had a population of 105,594. The racial makeup of the city was 77.3% White, 8.2% Hispanic or Latino, 6.2% Asian, 4.3% African American, and 3.0% Native American.
The median household income in Gresham was $50,945 in 2019. The median home value was $322,400 in 2019. The median age in Gresham was 36.7 in 2019.
Conclusion
Gresham, Oregon is a city located in Multnomah County, Oregon, east of Portland. It is the fourth-largest city in the state, with a population of 105,594 as of the 2010 census. Gresham was founded in 1884 and was originally a farming community. In the 1950s, Gresham began to experience rapid growth as the Portland metropolitan area expanded. The city is located in the foothills of the Cascade Mountains and is part of the Portland metropolitan area. Gresham’s economy is largely based on retail, manufacturing, and services. As of the 2010 census, Gresham had a population of 105,594. The median household income in Gresham was $50,945 in 2019.
Common Questions
What is Per Capita Income in Gresham?
Per Capita income in Gresham is $33,931.
What is the Median Family Income in Gresham?
Median Family Income in Gresham is $81,414.
What is the Median Household income in Gresham?
Median Household Income in Gresham is $69,437.
What is Income or Wage Gap in Gresham?
Income or Wage Gap in Gresham is 20.2%.
Women in Gresham earn 79.8 cents for every dollar earned by a man.
What is Family Income Deficit in Gresham?
Family Income Deficit in Gresham is $11,452.
Families that are below poverty line in Gresham earn $11,452 less on average than the poverty threshold level.
What is Inequality or Gini Index in Gresham?
Inequality or Gini Index in Gresham is 0.43.
What is the Total Population of Gresham?
Total Population of Gresham is 113,525.
What is the Total Male Population of Gresham?
Total Male Population of Gresham is 56,956.
What is the Total Female Population of Gresham?
Total Female Population of Gresham is 56,569.
What is the Ratio of Males per 100 Females in Gresham?
There are 100.68 Males per 100 Females in Gresham.
What is the Ratio of Females per 100 Males in Gresham?
There are 99.32 Females per 100 Males in Gresham.
What is the Median Population Age in Gresham?
Median Population Age in Gresham is 37.3 Years.
What is the Average Family Size in Gresham
Average Family Size in Gresham is 3.2 People.
What is the Average Household Size in Gresham
Average Household Size in Gresham is 2.6 People.
How Large is the Labor Force in Gresham?
There are 59,540 People in the Labor Forcein in Gresham.
What is the Percentage of People in the Labor Force in Gresham?
65.5% of People are in the Labor Force in Gresham.
What is the Unemployment Rate in Gresham?
Unemployment Rate in Gresham is 5.8%.