Visalia, CA Map & Demographics
Visalia Map
Visalia Overview
$32,788
PER CAPITA INCOME
$80,428
AVG FAMILY INCOME
$75,658
AVG HOUSEHOLD INCOME
29.8%
WAGE / INCOME GAP [ % ]
70.2¢/ $1
WAGE / INCOME GAP [ $ ]
$12,838
FAMILY INCOME DEFICIT
0.43
INEQUALITY / GINI INDEX
141,466
TOTAL POPULATION
70,297
MALE POPULATION
71,169
FEMALE POPULATION
98.77
MALES / 100 FEMALES
101.24
FEMALES / 100 MALES
33.0
MEDIAN AGE
3.5
AVG FAMILY SIZE
3.0
AVG HOUSEHOLD SIZE
66,743
LABOR FORCE [ PEOPLE ]
63.4%
PERCENT IN LABOR FORCE
5.6%
UNEMPLOYMENT RATE
Visalia Area Codes
Income in Visalia
Income Overview in Visalia
Per Capita Income in Visalia is $32,788, while median incomes of families and households are $80,428 and $75,658 respectively.
| Characteristic | Number | Measure |
| Per Capita Income | 141,466 | $32,788 |
| Median Family Income | 33,906 | $80,428 |
| Mean Family Income | 33,906 | $105,563 |
| Median Household Income | 45,757 | $75,658 |
| Mean Household Income | 45,757 | $98,973 |
| Income Deficit | 33,906 | $12,838 |
| Wage / Income Gap (%) | 141,466 | 29.76% |
| Wage / Income Gap ($) | 141,466 | 70.24¢ per $1 |
| Gini / Inequality Index | 141,466 | 0.43 |
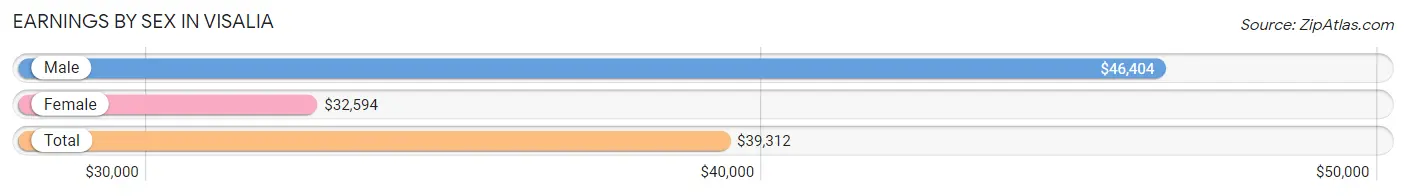
Earnings by Sex in Visalia
Average Earnings in Visalia are $39,312, $46,404 for men and $32,594 for women, a difference of 29.8%.
| Sex | Number | Average Earnings |
| Male | 37,056 (54.3%) | $46,404 |
| Female | 31,121 (45.7%) | $32,594 |
| Total | 68,177 (100.0%) | $39,312 |
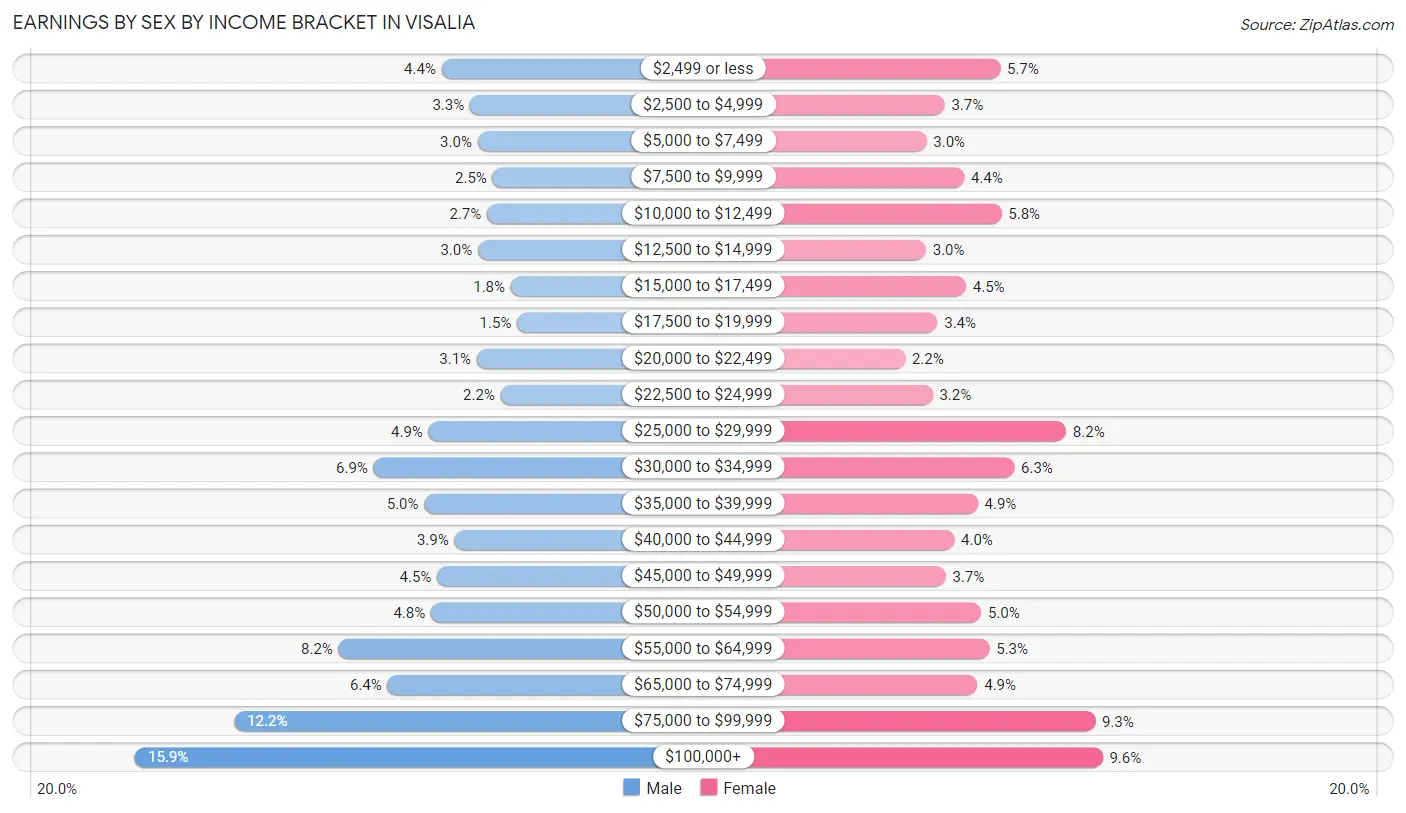
Earnings by Sex by Income Bracket in Visalia
The most common earnings brackets in Visalia are $100,000+ for men (5,877 | 15.9%) and $100,000+ for women (2,981 | 9.6%).
| Income | Male | Female |
| $2,499 or less | 1,618 (4.4%) | 1,786 (5.7%) |
| $2,500 to $4,999 | 1,227 (3.3%) | 1,138 (3.7%) |
| $5,000 to $7,499 | 1,118 (3.0%) | 927 (3.0%) |
| $7,500 to $9,999 | 912 (2.5%) | 1,366 (4.4%) |
| $10,000 to $12,499 | 989 (2.7%) | 1,802 (5.8%) |
| $12,500 to $14,999 | 1,115 (3.0%) | 922 (3.0%) |
| $15,000 to $17,499 | 658 (1.8%) | 1,387 (4.5%) |
| $17,500 to $19,999 | 569 (1.5%) | 1,056 (3.4%) |
| $20,000 to $22,499 | 1,132 (3.0%) | 679 (2.2%) |
| $22,500 to $24,999 | 800 (2.2%) | 1,000 (3.2%) |
| $25,000 to $29,999 | 1,800 (4.9%) | 2,556 (8.2%) |
| $30,000 to $34,999 | 2,563 (6.9%) | 1,950 (6.3%) |
| $35,000 to $39,999 | 1,861 (5.0%) | 1,524 (4.9%) |
| $40,000 to $44,999 | 1,440 (3.9%) | 1,251 (4.0%) |
| $45,000 to $49,999 | 1,684 (4.5%) | 1,153 (3.7%) |
| $50,000 to $54,999 | 1,769 (4.8%) | 1,565 (5.0%) |
| $55,000 to $64,999 | 3,051 (8.2%) | 1,663 (5.3%) |
| $65,000 to $74,999 | 2,370 (6.4%) | 1,522 (4.9%) |
| $75,000 to $99,999 | 4,503 (12.1%) | 2,893 (9.3%) |
| $100,000+ | 5,877 (15.9%) | 2,981 (9.6%) |
| Total | 37,056 (100.0%) | 31,121 (100.0%) |
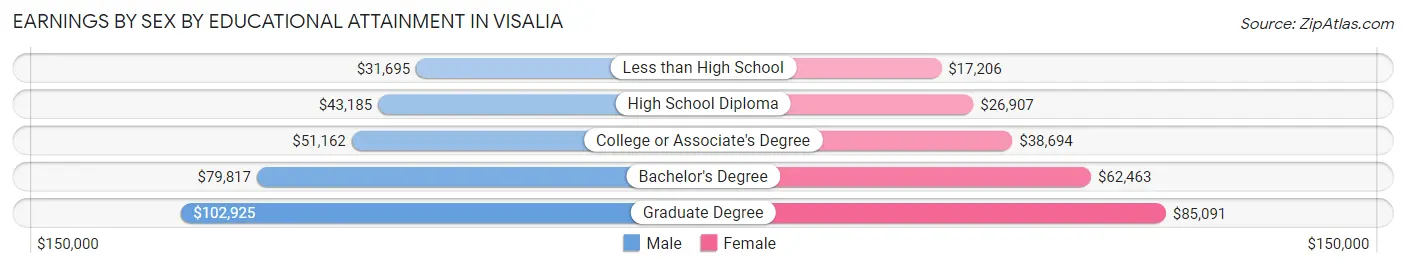
Earnings by Sex by Educational Attainment in Visalia
Average earnings in Visalia are $52,399 for men and $39,173 for women, a difference of 25.2%. Men with an educational attainment of graduate degree enjoy the highest average annual earnings of $102,925, while those with less than high school education earn the least with $31,695. Women with an educational attainment of graduate degree earn the most with the average annual earnings of $85,091, while those with less than high school education have the smallest earnings of $17,206.
| Educational Attainment | Male Income | Female Income |
| Less than High School | $31,695 | $17,206 |
| High School Diploma | $43,185 | $26,907 |
| College or Associate's Degree | $51,162 | $38,694 |
| Bachelor's Degree | $79,817 | $62,463 |
| Graduate Degree | $102,925 | $85,091 |
| Total | $52,399 | $39,173 |
Family Income in Visalia
Family Income Brackets in Visalia
According to the Visalia family income data, there are 6,713 families falling into the $50,000 to $74,999 income range, which is the most common income bracket and makes up 19.8% of all families. Conversely, the $10,000 to $14,999 income bracket is the least frequent group with only 542 families (1.6%) belonging to this category.
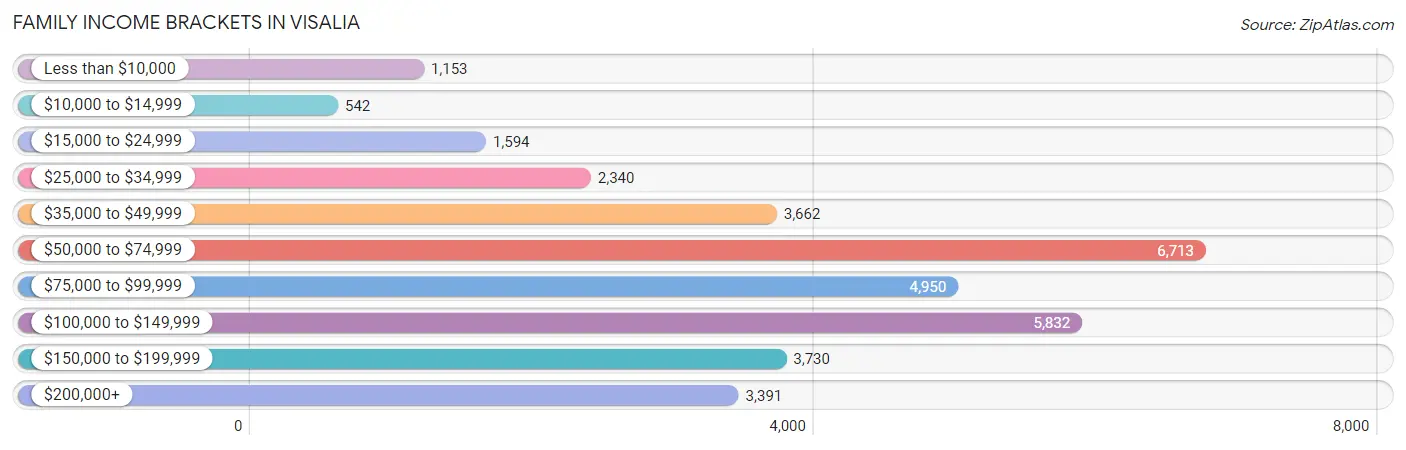
| Income Bracket | # Families | % Families |
| Less than $10,000 | 1,153 | 3.4% |
| $10,000 to $14,999 | 542 | 1.6% |
| $15,000 to $24,999 | 1,594 | 4.7% |
| $25,000 to $34,999 | 2,340 | 6.9% |
| $35,000 to $49,999 | 3,662 | 10.8% |
| $50,000 to $74,999 | 6,713 | 19.8% |
| $75,000 to $99,999 | 4,950 | 14.6% |
| $100,000 to $149,999 | 5,832 | 17.2% |
| $150,000 to $199,999 | 3,730 | 11.0% |
| $200,000+ | 3,391 | 10.0% |
Family Income by Famaliy Size in Visalia
5-person families (4,022 | 11.9%) account for the highest median family income in Visalia with $100,083 per family, while 2-person families (12,944 | 38.2%) have the highest median income of $35,598 per family member.
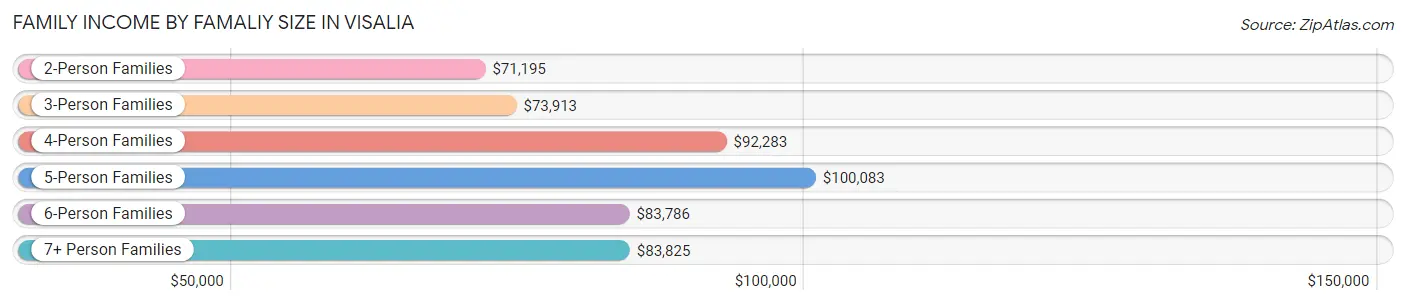
| Income Bracket | # Families | Median Income |
| 2-Person Families | 12,944 (38.2%) | $71,195 |
| 3-Person Families | 7,442 (22.0%) | $73,913 |
| 4-Person Families | 6,626 (19.5%) | $92,283 |
| 5-Person Families | 4,022 (11.9%) | $100,083 |
| 6-Person Families | 2,042 (6.0%) | $83,786 |
| 7+ Person Families | 830 (2.5%) | $83,825 |
| Total | 33,906 (100.0%) | $80,428 |
Family Income by Number of Earners in Visalia
The median family income in Visalia is $80,428, with families comprising 3+ earners (4,140) having the highest median family income of $114,932, while families with no earners (3,889) have the lowest median family income of $43,561, accounting for 12.2% and 11.5% of families, respectively.
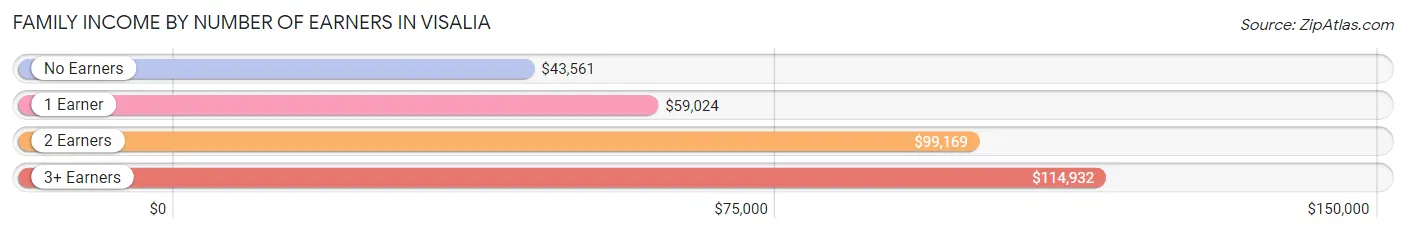
| Number of Earners | # Families | Median Income |
| No Earners | 3,889 (11.5%) | $43,561 |
| 1 Earner | 12,042 (35.5%) | $59,024 |
| 2 Earners | 13,835 (40.8%) | $99,169 |
| 3+ Earners | 4,140 (12.2%) | $114,932 |
| Total | 33,906 (100.0%) | $80,428 |
Household Income in Visalia
Household Income Brackets in Visalia
With 8,694 households falling in the category, the $50,000 to $74,999 income range is the most frequent in Visalia, accounting for 19.0% of all households. In contrast, only 1,052 households (2.3%) fall into the $10,000 to $14,999 income bracket, making it the least populous group.
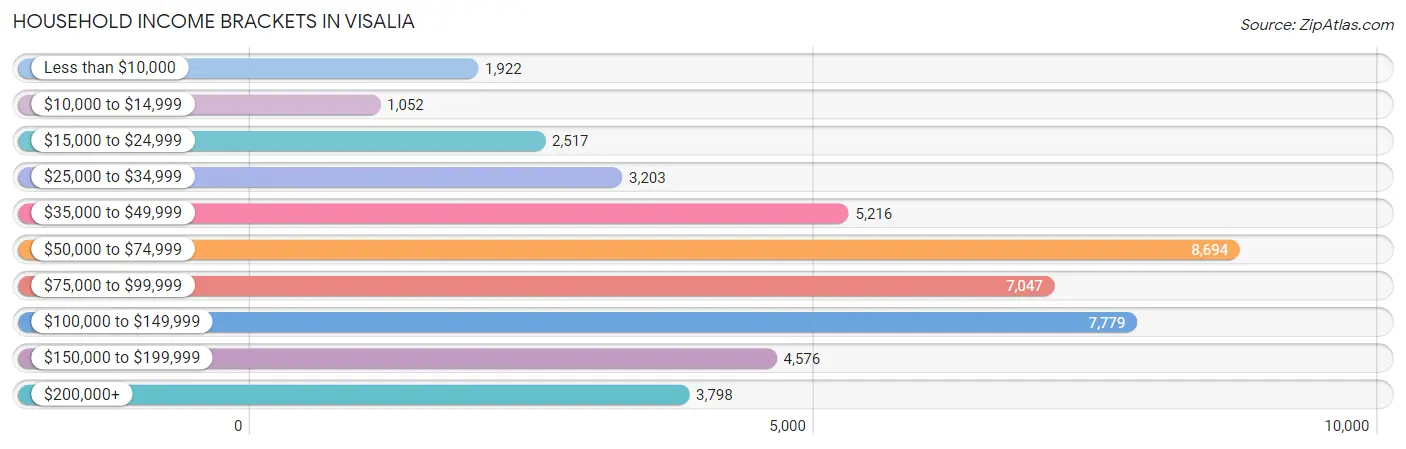
| Income Bracket | # Households | % Households |
| Less than $10,000 | 1,922 | 4.2% |
| $10,000 to $14,999 | 1,052 | 2.3% |
| $15,000 to $24,999 | 2,517 | 5.5% |
| $25,000 to $34,999 | 3,203 | 7.0% |
| $35,000 to $49,999 | 5,216 | 11.4% |
| $50,000 to $74,999 | 8,694 | 19.0% |
| $75,000 to $99,999 | 7,047 | 15.4% |
| $100,000 to $149,999 | 7,779 | 17.0% |
| $150,000 to $199,999 | 4,576 | 10.0% |
| $200,000+ | 3,798 | 8.3% |
Household Income by Householder Age in Visalia
The median household income in Visalia is $75,658, with the highest median household income of $85,829 found in the 25 to 44 years age bracket for the primary householder. A total of 17,915 households (39.2%) fall into this category. Meanwhile, the 15 to 24 years age bracket for the primary householder has the lowest median household income of $48,724, with 1,669 households (3.6%) in this group.
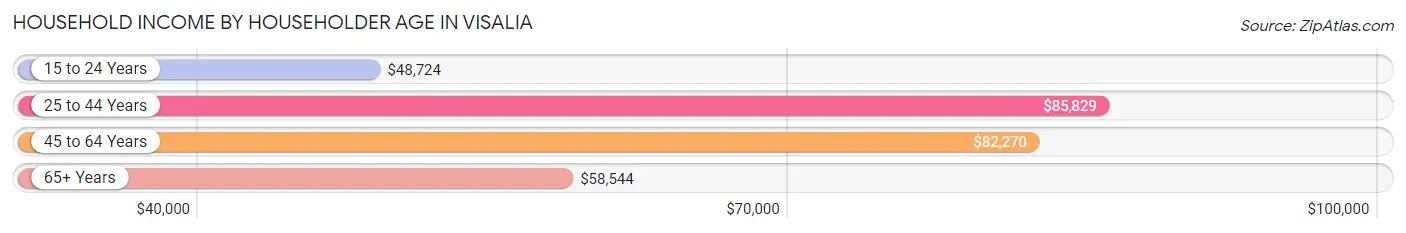
| Income Bracket | # Households | Median Income |
| 15 to 24 Years | 1,669 (3.6%) | $48,724 |
| 25 to 44 Years | 17,915 (39.2%) | $85,829 |
| 45 to 64 Years | 15,532 (33.9%) | $82,270 |
| 65+ Years | 10,641 (23.3%) | $58,544 |
| Total | 45,757 (100.0%) | $75,658 |
Poverty in Visalia
Income Below Poverty by Sex and Age in Visalia
With 12.5% poverty level for males and 12.8% for females among the residents of Visalia, 16 and 17 year old males and 6 to 11 year old females are the most vulnerable to poverty, with 582 males (24.3%) and 1,310 females (18.2%) in their respective age groups living below the poverty level.
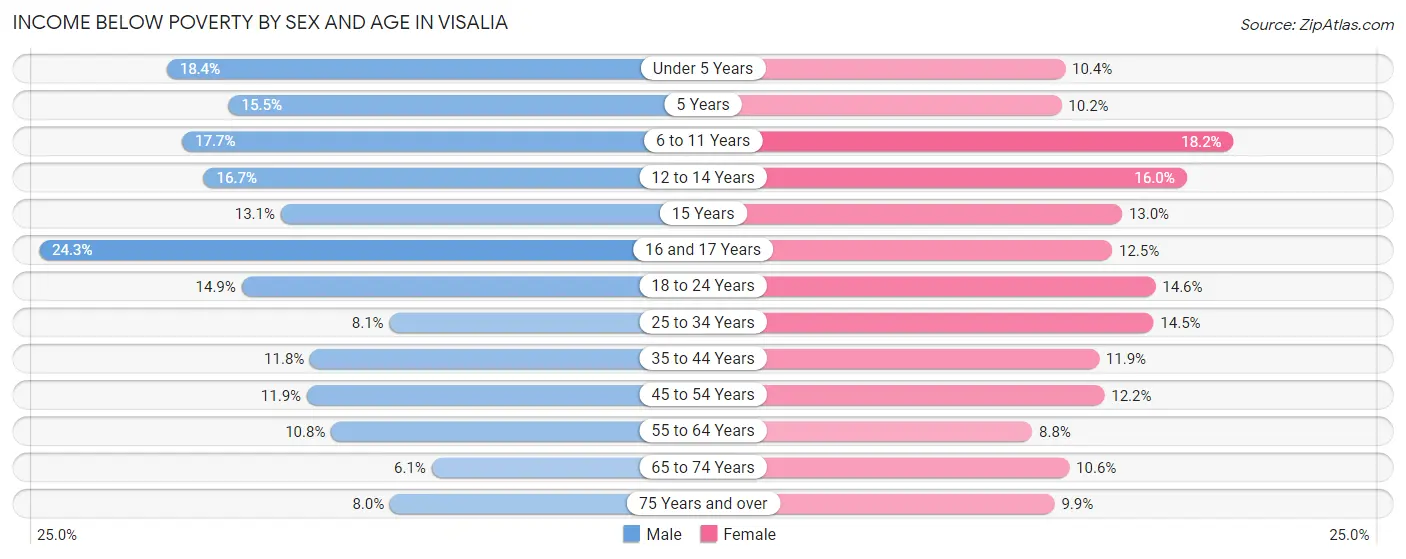
| Age Bracket | Male | Female |
| Under 5 Years | 1,032 (18.4%) | 530 (10.4%) |
| 5 Years | 228 (15.5%) | 115 (10.2%) |
| 6 to 11 Years | 1,091 (17.7%) | 1,310 (18.2%) |
| 12 to 14 Years | 455 (16.7%) | 591 (16.0%) |
| 15 Years | 119 (13.1%) | 177 (13.0%) |
| 16 and 17 Years | 582 (24.3%) | 160 (12.5%) |
| 18 to 24 Years | 926 (14.9%) | 935 (14.5%) |
| 25 to 34 Years | 945 (8.1%) | 1,528 (14.5%) |
| 35 to 44 Years | 1,124 (11.7%) | 1,042 (11.9%) |
| 45 to 54 Years | 880 (11.9%) | 934 (12.2%) |
| 55 to 64 Years | 747 (10.8%) | 648 (8.8%) |
| 65 to 74 Years | 324 (6.1%) | 631 (10.5%) |
| 75 Years and over | 228 (8.0%) | 407 (9.9%) |
| Total | 8,681 (12.5%) | 9,008 (12.8%) |
Income Above Poverty by Sex and Age in Visalia
According to the poverty statistics in Visalia, males aged 65 to 74 years and females aged 55 to 64 years are the age groups that are most secure financially, with 93.9% of males and 91.2% of females in these age groups living above the poverty line.
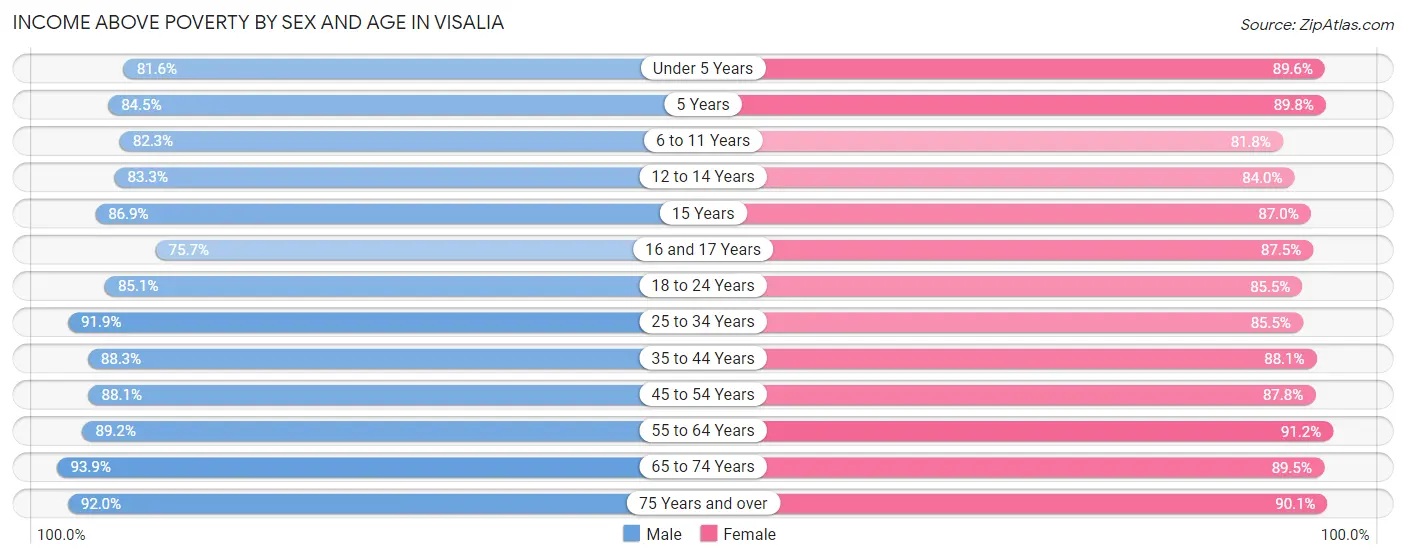
| Age Bracket | Male | Female |
| Under 5 Years | 4,576 (81.6%) | 4,584 (89.6%) |
| 5 Years | 1,240 (84.5%) | 1,014 (89.8%) |
| 6 to 11 Years | 5,076 (82.3%) | 5,900 (81.8%) |
| 12 to 14 Years | 2,272 (83.3%) | 3,102 (84.0%) |
| 15 Years | 789 (86.9%) | 1,185 (87.0%) |
| 16 and 17 Years | 1,810 (75.7%) | 1,116 (87.5%) |
| 18 to 24 Years | 5,278 (85.1%) | 5,493 (85.5%) |
| 25 to 34 Years | 10,763 (91.9%) | 9,042 (85.5%) |
| 35 to 44 Years | 8,444 (88.2%) | 7,690 (88.1%) |
| 45 to 54 Years | 6,517 (88.1%) | 6,736 (87.8%) |
| 55 to 64 Years | 6,188 (89.2%) | 6,688 (91.2%) |
| 65 to 74 Years | 4,983 (93.9%) | 5,352 (89.4%) |
| 75 Years and over | 2,609 (92.0%) | 3,717 (90.1%) |
| Total | 60,545 (87.5%) | 61,619 (87.3%) |
Income Below Poverty Among Married-Couple Families in Visalia
The poverty statistics for married-couple families in Visalia show that 5.7% or 1,314 of the total 23,111 families live below the poverty line. Families with 5 or more children have the highest poverty rate of 48.5%, comprising of 95 families. On the other hand, families with no children have the lowest poverty rate of 3.2%, which includes 373 families.
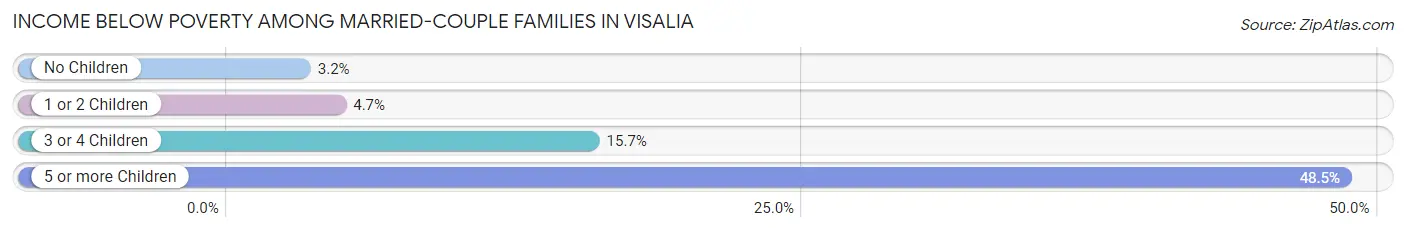
| Children | Above Poverty | Below Poverty |
| No Children | 11,396 (96.8%) | 373 (3.2%) |
| 1 or 2 Children | 7,849 (95.3%) | 388 (4.7%) |
| 3 or 4 Children | 2,451 (84.3%) | 458 (15.7%) |
| 5 or more Children | 101 (51.5%) | 95 (48.5%) |
| Total | 21,797 (94.3%) | 1,314 (5.7%) |
Income Below Poverty Among Single-Parent Households in Visalia
According to the poverty data in Visalia, 9.3% or 323 single-father households and 19.6% or 1,434 single-mother households are living below the poverty line. Among single-father households, those with 3 or 4 children have the highest poverty rate, with 155 households (39.2%) experiencing poverty. Likewise, among single-mother households, those with 5 or more children have the highest poverty rate, with 87 households (100.0%) falling below the poverty line.
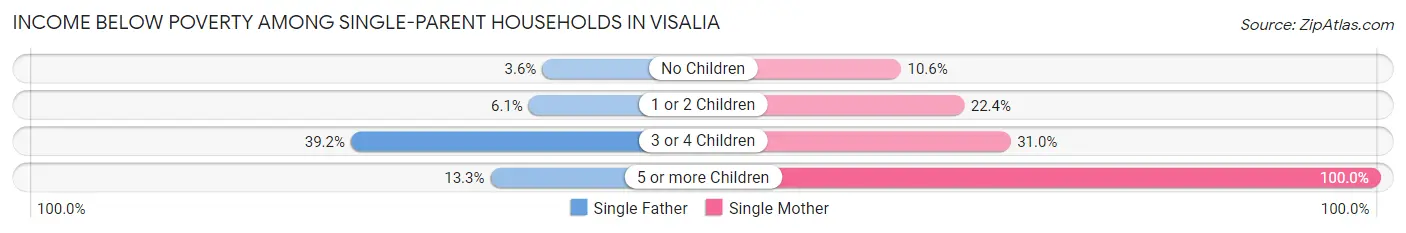
| Children | Single Father | Single Mother |
| No Children | 44 (3.6%) | 318 (10.6%) |
| 1 or 2 Children | 104 (6.1%) | 739 (22.4%) |
| 3 or 4 Children | 155 (39.2%) | 290 (31.0%) |
| 5 or more Children | 20 (13.3%) | 87 (100.0%) |
| Total | 323 (9.3%) | 1,434 (19.6%) |
Income Below Poverty Among Married-Couple vs Single-Parent Households in Visalia
The poverty data for Visalia shows that 1,314 of the married-couple family households (5.7%) and 1,757 of the single-parent households (16.3%) are living below the poverty level. Within the married-couple family households, those with 5 or more children have the highest poverty rate, with 95 households (48.5%) falling below the poverty line. Among the single-parent households, those with 5 or more children have the highest poverty rate, with 107 household (45.0%) living below poverty.
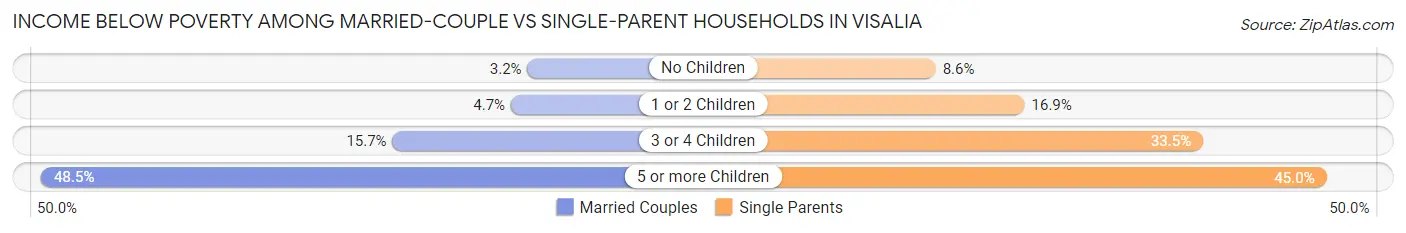
| Children | Married-Couple Families | Single-Parent Households |
| No Children | 373 (3.2%) | 362 (8.6%) |
| 1 or 2 Children | 388 (4.7%) | 843 (16.9%) |
| 3 or 4 Children | 458 (15.7%) | 445 (33.5%) |
| 5 or more Children | 95 (48.5%) | 107 (45.0%) |
| Total | 1,314 (5.7%) | 1,757 (16.3%) |
Race in Visalia
The most populous races in Visalia are White / Caucasian (76,171 | 53.8%), Hispanic or Latino (74,253 | 52.5%), and Some other Race (29,944 | 21.2%).
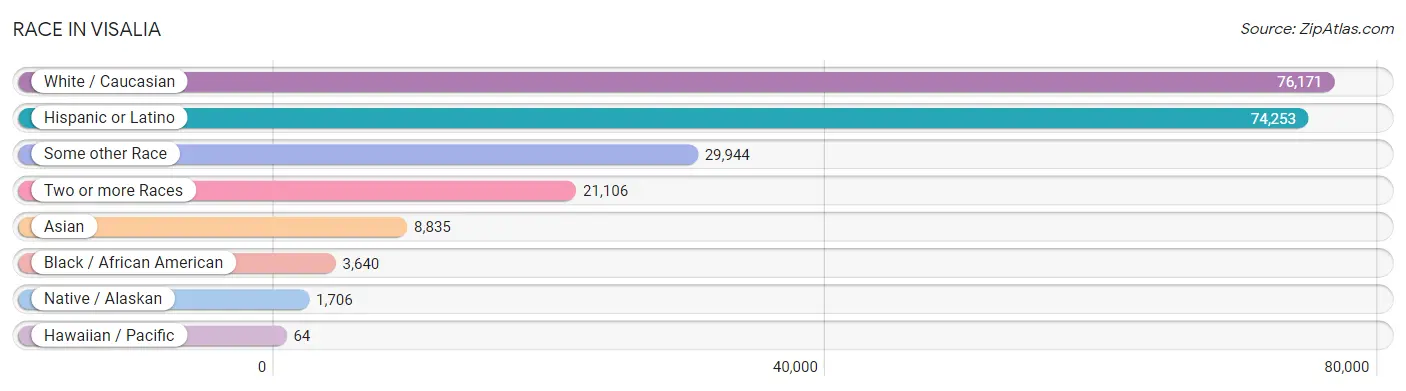
| Race | # Population | % Population |
| Asian | 8,835 | 6.2% |
| Black / African American | 3,640 | 2.6% |
| Hawaiian / Pacific | 64 | 0.1% |
| Hispanic or Latino | 74,253 | 52.5% |
| Native / Alaskan | 1,706 | 1.2% |
| White / Caucasian | 76,171 | 53.8% |
| Two or more Races | 21,106 | 14.9% |
| Some other Race | 29,944 | 21.2% |
| Total | 141,466 | 100.0% |
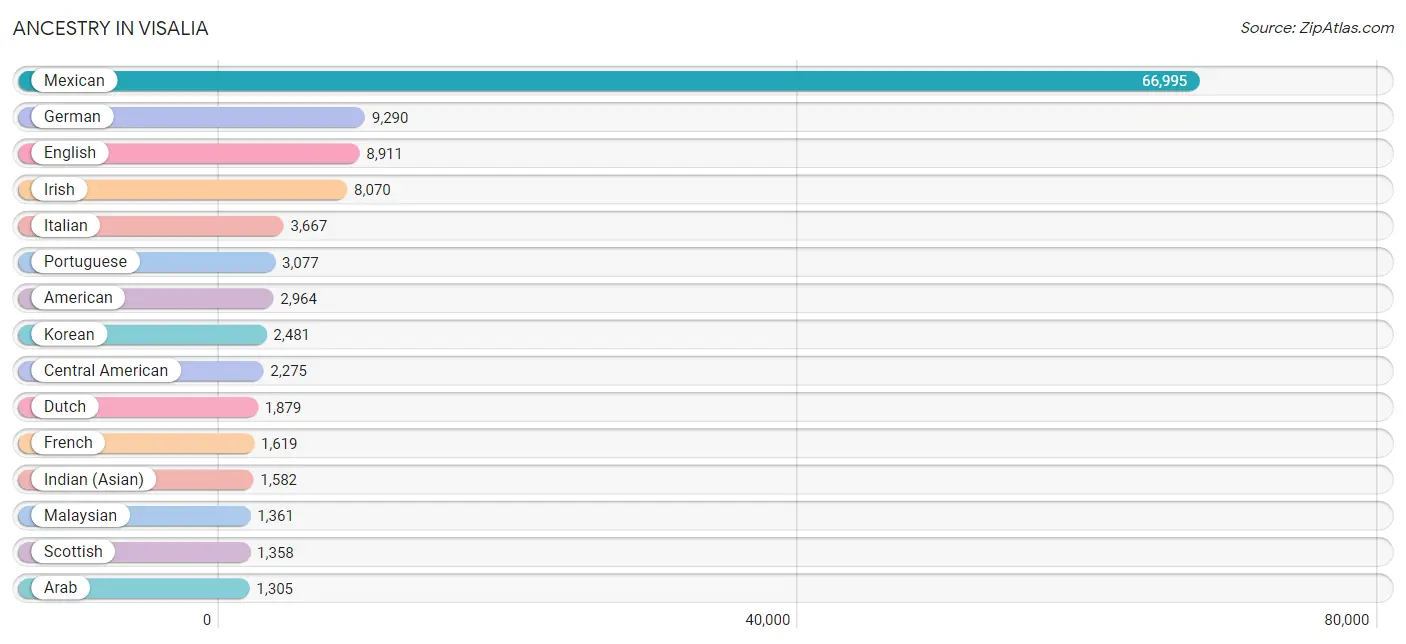
Ancestry in Visalia
The most populous ancestries reported in Visalia are Mexican (66,995 | 47.4%), German (9,290 | 6.6%), English (8,911 | 6.3%), Irish (8,070 | 5.7%), and Italian (3,667 | 2.6%), together accounting for 68.5% of all Visalia residents.
| Ancestry | # Population | % Population |
| African | 175 | 0.1% |
| Alsatian | 5 | 0.0% |
| American | 2,964 | 2.1% |
| Apache | 398 | 0.3% |
| Arab | 1,305 | 0.9% |
| Argentinean | 244 | 0.2% |
| Armenian | 248 | 0.2% |
| Australian | 25 | 0.0% |
| Austrian | 118 | 0.1% |
| Bangladeshi | 1,153 | 0.8% |
| Basque | 329 | 0.2% |
| Belgian | 90 | 0.1% |
| Belizean | 142 | 0.1% |
| Bhutanese | 620 | 0.4% |
| Blackfeet | 117 | 0.1% |
| Bolivian | 13 | 0.0% |
| Brazilian | 49 | 0.0% |
| British | 477 | 0.3% |
| Burmese | 776 | 0.5% |
| Canadian | 82 | 0.1% |
| Celtic | 15 | 0.0% |
| Central American | 2,275 | 1.6% |
| Central American Indian | 205 | 0.1% |
| Cherokee | 383 | 0.3% |
| Cheyenne | 8 | 0.0% |
| Chickasaw | 43 | 0.0% |
| Chilean | 39 | 0.0% |
| Choctaw | 81 | 0.1% |
| Colombian | 151 | 0.1% |
| Comanche | 19 | 0.0% |
| Costa Rican | 92 | 0.1% |
| Creek | 5 | 0.0% |
| Croatian | 28 | 0.0% |
| Cuban | 222 | 0.2% |
| Czech | 73 | 0.1% |
| Czechoslovakian | 49 | 0.0% |
| Danish | 301 | 0.2% |
| Dominican | 56 | 0.0% |
| Dutch | 1,879 | 1.3% |
| Dutch West Indian | 8 | 0.0% |
| Eastern European | 122 | 0.1% |
| Ecuadorian | 8 | 0.0% |
| Egyptian | 93 | 0.1% |
| English | 8,911 | 6.3% |
| Ethiopian | 134 | 0.1% |
| European | 1,123 | 0.8% |
| Fijian | 11 | 0.0% |
| Filipino | 12 | 0.0% |
| Finnish | 189 | 0.1% |
| French | 1,619 | 1.1% |
| French Canadian | 129 | 0.1% |
| German | 9,290 | 6.6% |
| Greek | 81 | 0.1% |
| Guamanian / Chamorro | 55 | 0.0% |
| Guatemalan | 1,183 | 0.8% |
| Guyanese | 17 | 0.0% |
| Haitian | 13 | 0.0% |
| Honduran | 93 | 0.1% |
| Hopi | 91 | 0.1% |
| Hungarian | 121 | 0.1% |
| Indian (Asian) | 1,582 | 1.1% |
| Iranian | 229 | 0.2% |
| Irish | 8,070 | 5.7% |
| Iroquois | 54 | 0.0% |
| Israeli | 31 | 0.0% |
| Italian | 3,667 | 2.6% |
| Jamaican | 2 | 0.0% |
| Japanese | 83 | 0.1% |
| Jordanian | 187 | 0.1% |
| Korean | 2,481 | 1.8% |
| Lebanese | 64 | 0.1% |
| Lithuanian | 31 | 0.0% |
| Malaysian | 1,361 | 1.0% |
| Marshallese | 11 | 0.0% |
| Mexican | 66,995 | 47.4% |
| Mexican American Indian | 648 | 0.5% |
| Moroccan | 32 | 0.0% |
| Native Hawaiian | 10 | 0.0% |
| Navajo | 123 | 0.1% |
| Nepalese | 356 | 0.3% |
| New Zealander | 7 | 0.0% |
| Nicaraguan | 253 | 0.2% |
| Nigerian | 49 | 0.0% |
| Northern European | 131 | 0.1% |
| Norwegian | 810 | 0.6% |
| Paiute | 83 | 0.1% |
| Pakistani | 68 | 0.1% |
| Palestinian | 709 | 0.5% |
| Panamanian | 9 | 0.0% |
| Peruvian | 616 | 0.4% |
| Pima | 28 | 0.0% |
| Polish | 811 | 0.6% |
| Portuguese | 3,077 | 2.2% |
| Potawatomi | 15 | 0.0% |
| Puerto Rican | 641 | 0.4% |
| Romanian | 205 | 0.1% |
| Russian | 303 | 0.2% |
| Salvadoran | 645 | 0.5% |
| Samoan | 24 | 0.0% |
| Scandinavian | 373 | 0.3% |
| Scotch-Irish | 787 | 0.6% |
| Scottish | 1,358 | 1.0% |
| Seminole | 161 | 0.1% |
| Serbian | 60 | 0.0% |
| Sioux | 140 | 0.1% |
| Slavic | 31 | 0.0% |
| South American | 1,116 | 0.8% |
| South American Indian | 386 | 0.3% |
| Spaniard | 664 | 0.5% |
| Spanish | 438 | 0.3% |
| Spanish American | 74 | 0.1% |
| Sri Lankan | 138 | 0.1% |
| Subsaharan African | 371 | 0.3% |
| Swedish | 1,287 | 0.9% |
| Swiss | 211 | 0.2% |
| Thai | 452 | 0.3% |
| Ukrainian | 237 | 0.2% |
| Ute | 10 | 0.0% |
| Venezuelan | 21 | 0.0% |
| Vietnamese | 70 | 0.1% |
| Welsh | 478 | 0.3% |
| Yaqui | 74 | 0.1% |
| Yugoslavian | 13 | 0.0% |
| Yuman | 10 | 0.0% | View All 124 Rows |
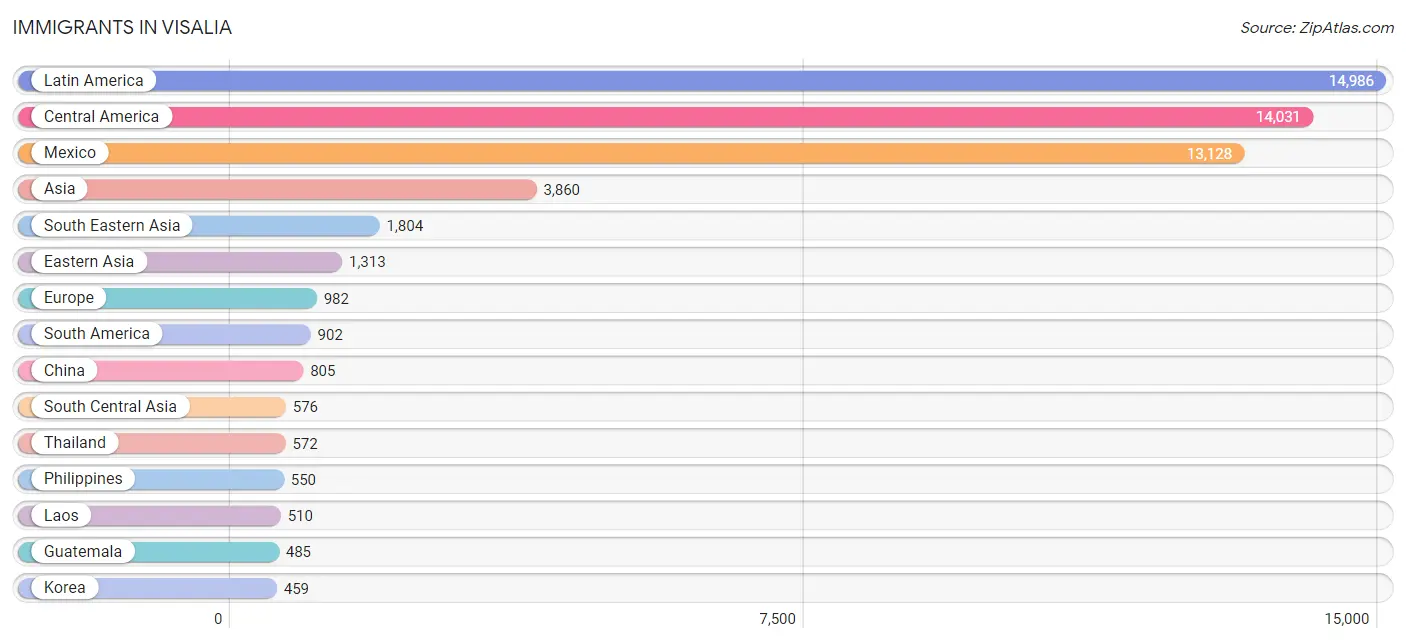
Immigrants in Visalia
The most numerous immigrant groups reported in Visalia came from Latin America (14,986 | 10.6%), Central America (14,031 | 9.9%), Mexico (13,128 | 9.3%), Asia (3,860 | 2.7%), and South Eastern Asia (1,804 | 1.3%), together accounting for 33.8% of all Visalia residents.
| Immigration Origin | # Population | % Population |
| Africa | 262 | 0.2% |
| Argentina | 185 | 0.1% |
| Asia | 3,860 | 2.7% |
| Azores | 13 | 0.0% |
| Bangladesh | 34 | 0.0% |
| Belgium | 23 | 0.0% |
| Bolivia | 22 | 0.0% |
| Brazil | 59 | 0.0% |
| Cambodia | 36 | 0.0% |
| Canada | 104 | 0.1% |
| Caribbean | 53 | 0.0% |
| Central America | 14,031 | 9.9% |
| China | 805 | 0.6% |
| Colombia | 135 | 0.1% |
| Congo | 3 | 0.0% |
| Costa Rica | 55 | 0.0% |
| Cuba | 19 | 0.0% |
| Dominican Republic | 21 | 0.0% |
| Eastern Africa | 103 | 0.1% |
| Eastern Asia | 1,313 | 0.9% |
| Eastern Europe | 265 | 0.2% |
| Ecuador | 25 | 0.0% |
| Egypt | 76 | 0.1% |
| El Salvador | 219 | 0.2% |
| England | 22 | 0.0% |
| Eritrea | 15 | 0.0% |
| Ethiopia | 78 | 0.1% |
| Europe | 982 | 0.7% |
| France | 14 | 0.0% |
| Germany | 108 | 0.1% |
| Ghana | 8 | 0.0% |
| Guatemala | 485 | 0.3% |
| Guyana | 27 | 0.0% |
| Haiti | 13 | 0.0% |
| Honduras | 27 | 0.0% |
| Hong Kong | 46 | 0.0% |
| India | 414 | 0.3% |
| Indonesia | 14 | 0.0% |
| Iran | 35 | 0.0% |
| Israel | 46 | 0.0% |
| Italy | 33 | 0.0% |
| Japan | 49 | 0.0% |
| Jordan | 82 | 0.1% |
| Kenya | 10 | 0.0% |
| Korea | 459 | 0.3% |
| Laos | 510 | 0.4% |
| Latin America | 14,986 | 10.6% |
| Lebanon | 28 | 0.0% |
| Mexico | 13,128 | 9.3% |
| Middle Africa | 3 | 0.0% |
| Netherlands | 112 | 0.1% |
| Nicaragua | 108 | 0.1% |
| Nigeria | 46 | 0.0% |
| Northern Africa | 95 | 0.1% |
| Northern Europe | 314 | 0.2% |
| Norway | 16 | 0.0% |
| Oceania | 17 | 0.0% |
| Pakistan | 66 | 0.1% |
| Panama | 9 | 0.0% |
| Peru | 414 | 0.3% |
| Philippines | 550 | 0.4% |
| Poland | 34 | 0.0% |
| Portugal | 90 | 0.1% |
| Romania | 119 | 0.1% |
| Russia | 70 | 0.1% |
| Serbia | 23 | 0.0% |
| Singapore | 9 | 0.0% |
| South America | 902 | 0.6% |
| South Central Asia | 576 | 0.4% |
| South Eastern Asia | 1,804 | 1.3% |
| Southern Europe | 146 | 0.1% |
| Spain | 23 | 0.0% |
| Sri Lanka | 27 | 0.0% |
| Taiwan | 72 | 0.1% |
| Thailand | 572 | 0.4% |
| Ukraine | 12 | 0.0% |
| Venezuela | 35 | 0.0% |
| Vietnam | 113 | 0.1% |
| Western Africa | 54 | 0.0% |
| Western Asia | 167 | 0.1% |
| Western Europe | 257 | 0.2% |
| Yemen | 11 | 0.0% | View All 82 Rows |
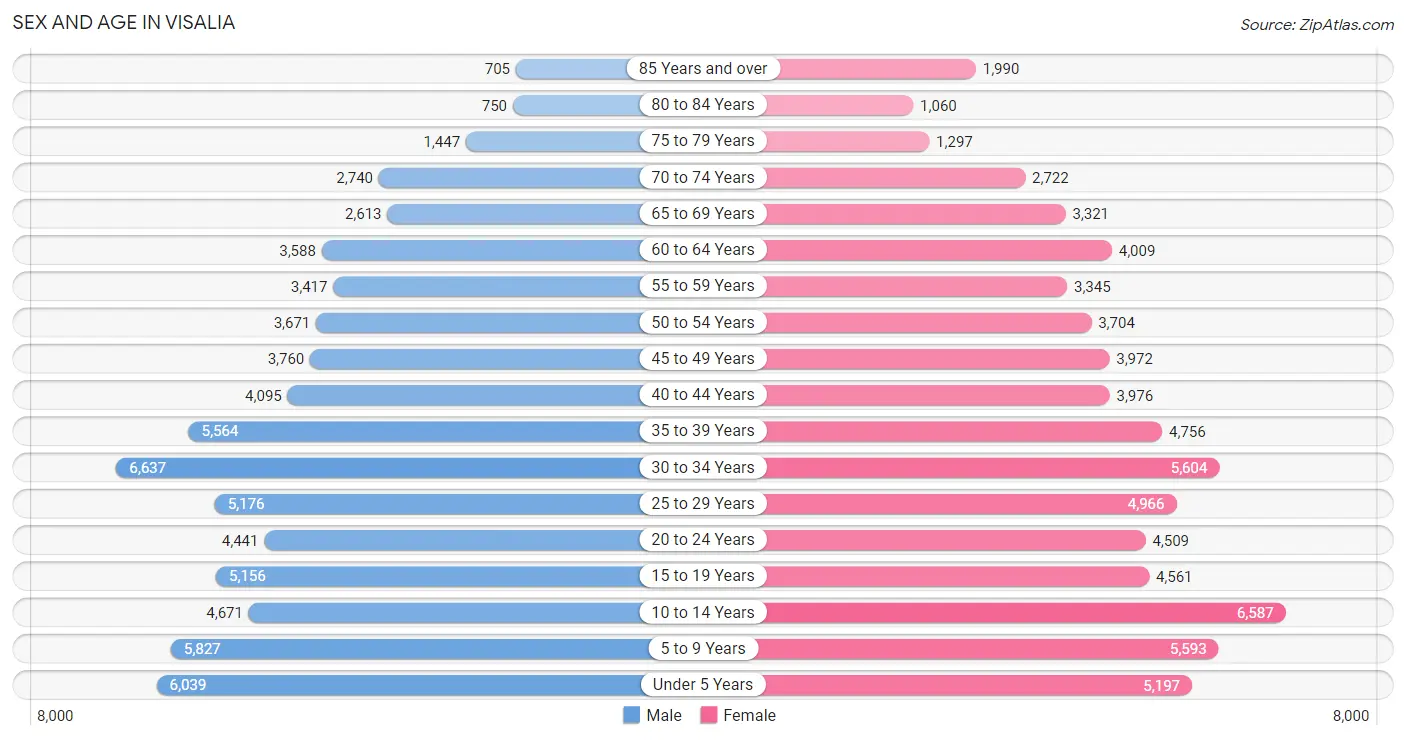
Sex and Age in Visalia
Sex and Age in Visalia
The most populous age groups in Visalia are 30 to 34 Years (6,637 | 9.4%) for men and 10 to 14 Years (6,587 | 9.3%) for women.
| Age Bracket | Male | Female |
| Under 5 Years | 6,039 (8.6%) | 5,197 (7.3%) |
| 5 to 9 Years | 5,827 (8.3%) | 5,593 (7.9%) |
| 10 to 14 Years | 4,671 (6.6%) | 6,587 (9.3%) |
| 15 to 19 Years | 5,156 (7.3%) | 4,561 (6.4%) |
| 20 to 24 Years | 4,441 (6.3%) | 4,509 (6.3%) |
| 25 to 29 Years | 5,176 (7.4%) | 4,966 (7.0%) |
| 30 to 34 Years | 6,637 (9.4%) | 5,604 (7.9%) |
| 35 to 39 Years | 5,564 (7.9%) | 4,756 (6.7%) |
| 40 to 44 Years | 4,095 (5.8%) | 3,976 (5.6%) |
| 45 to 49 Years | 3,760 (5.3%) | 3,972 (5.6%) |
| 50 to 54 Years | 3,671 (5.2%) | 3,704 (5.2%) |
| 55 to 59 Years | 3,417 (4.9%) | 3,345 (4.7%) |
| 60 to 64 Years | 3,588 (5.1%) | 4,009 (5.6%) |
| 65 to 69 Years | 2,613 (3.7%) | 3,321 (4.7%) |
| 70 to 74 Years | 2,740 (3.9%) | 2,722 (3.8%) |
| 75 to 79 Years | 1,447 (2.1%) | 1,297 (1.8%) |
| 80 to 84 Years | 750 (1.1%) | 1,060 (1.5%) |
| 85 Years and over | 705 (1.0%) | 1,990 (2.8%) |
| Total | 70,297 (100.0%) | 71,169 (100.0%) |
Families and Households in Visalia
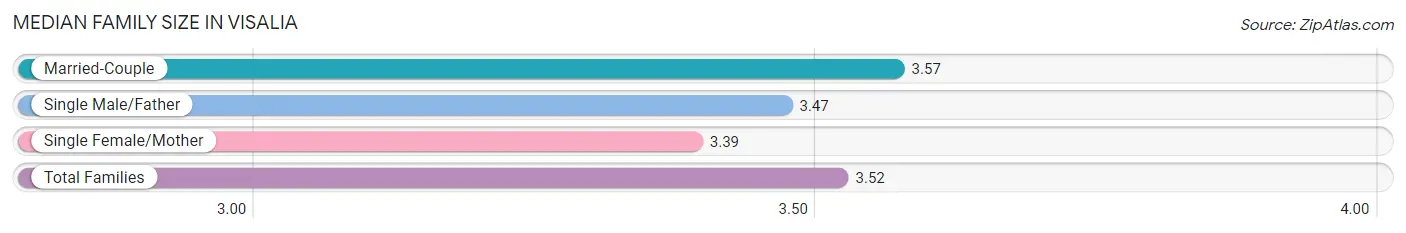
Median Family Size in Visalia
The median family size in Visalia is 3.52 persons per family, with married-couple families (23,111 | 68.2%) accounting for the largest median family size of 3.57 persons per family. On the other hand, single female/mother families (7,324 | 21.6%) represent the smallest median family size with 3.39 persons per family.
| Family Type | # Families | Family Size |
| Married-Couple | 23,111 (68.2%) | 3.57 |
| Single Male/Father | 3,471 (10.2%) | 3.47 |
| Single Female/Mother | 7,324 (21.6%) | 3.39 |
| Total Families | 33,906 (100.0%) | 3.52 |
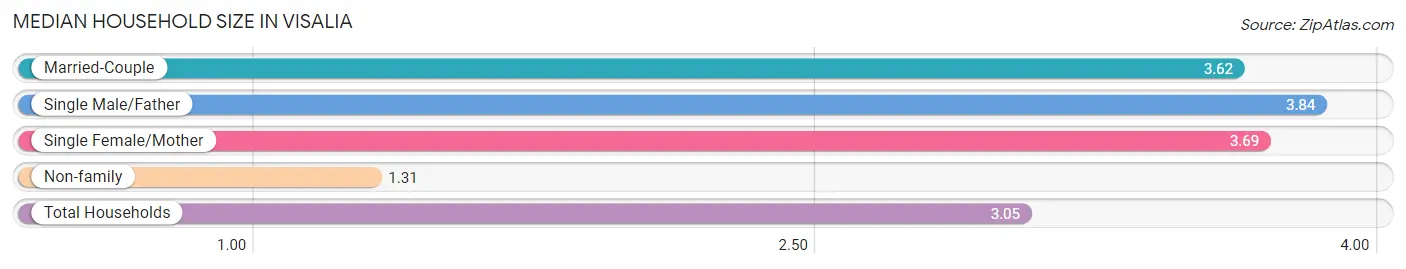
Median Household Size in Visalia
The median household size in Visalia is 3.05 persons per household, with single male/father households (3,471 | 7.6%) accounting for the largest median household size of 3.84 persons per household. non-family households (11,851 | 25.9%) represent the smallest median household size with 1.31 persons per household.
| Household Type | # Households | Household Size |
| Married-Couple | 23,111 (50.5%) | 3.62 |
| Single Male/Father | 3,471 (7.6%) | 3.84 |
| Single Female/Mother | 7,324 (16.0%) | 3.69 |
| Non-family | 11,851 (25.9%) | 1.31 |
| Total Households | 45,757 (100.0%) | 3.05 |
Household Size by Marriage Status in Visalia
Out of a total of 45,757 households in Visalia, 33,906 (74.1%) are family households, while 11,851 (25.9%) are nonfamily households. The most numerous type of family households are 2-person households, comprising 11,374, and the most common type of nonfamily households are 1-person households, comprising 9,301.
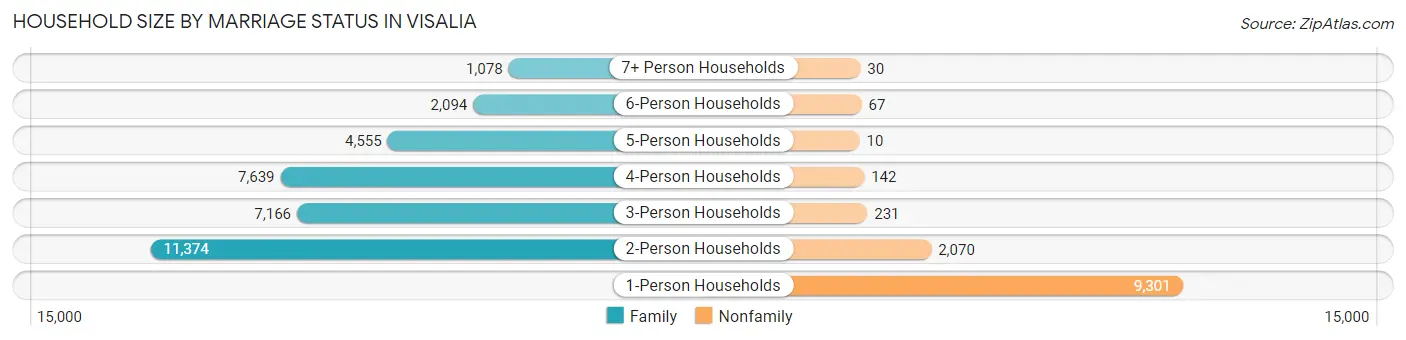
| Household Size | Family Households | Nonfamily Households |
| 1-Person Households | - | 9,301 (20.3%) |
| 2-Person Households | 11,374 (24.9%) | 2,070 (4.5%) |
| 3-Person Households | 7,166 (15.7%) | 231 (0.5%) |
| 4-Person Households | 7,639 (16.7%) | 142 (0.3%) |
| 5-Person Households | 4,555 (10.0%) | 10 (0.0%) |
| 6-Person Households | 2,094 (4.6%) | 67 (0.2%) |
| 7+ Person Households | 1,078 (2.4%) | 30 (0.1%) |
| Total | 33,906 (74.1%) | 11,851 (25.9%) |
Female Fertility in Visalia
Fertility by Age in Visalia
Average fertility rate in Visalia is 71.0 births per 1,000 women. Women in the age bracket of 20 to 34 years have the highest fertility rate with 104.0 births per 1,000 women. Women in the age bracket of 20 to 34 years acount for 66.5% of all women with births.
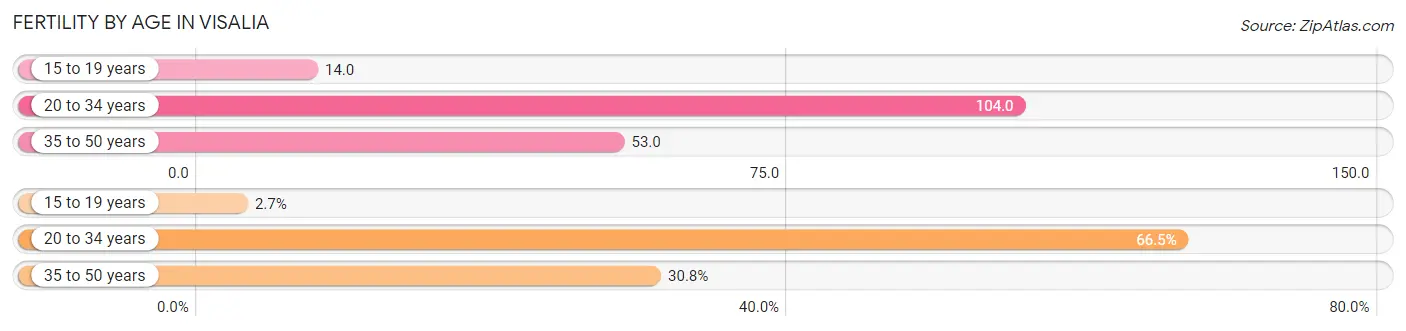
| Age Bracket | Women with Births | Births / 1,000 Women |
| 15 to 19 years | 64 (2.7%) | 14.0 |
| 20 to 34 years | 1,569 (66.5%) | 104.0 |
| 35 to 50 years | 725 (30.7%) | 53.0 |
| Total | 2,358 (100.0%) | 71.0 |
Fertility by Age by Marriage Status in Visalia
59.5% of women with births (2,358) in Visalia are married. The highest percentage of unmarried women with births falls into 20 to 34 years age bracket with 46.3% of them unmarried at the time of birth, while the lowest percentage of unmarried women with births belong to 35 to 50 years age bracket with 28.5% of them unmarried.
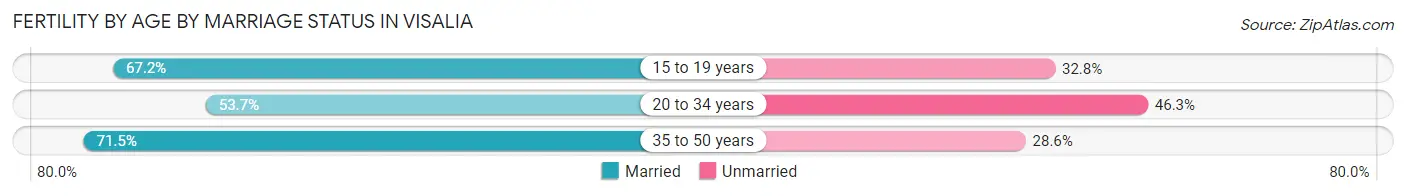
| Age Bracket | Married | Unmarried |
| 15 to 19 years | 43 (67.2%) | 21 (32.8%) |
| 20 to 34 years | 843 (53.7%) | 726 (46.3%) |
| 35 to 50 years | 518 (71.5%) | 207 (28.5%) |
| Total | 1,403 (59.5%) | 955 (40.5%) |
Fertility by Education in Visalia
Average fertility rate in Visalia is 71.0 births per 1,000 women. Women with the education attainment of bachelor's degree have the highest fertility rate of 98.0 births per 1,000 women, while women with the education attainment of less than high school have the lowest fertility at 36.0 births per 1,000 women. Women with the education attainment of college or associate's degree represent 42.8% of all women with births.
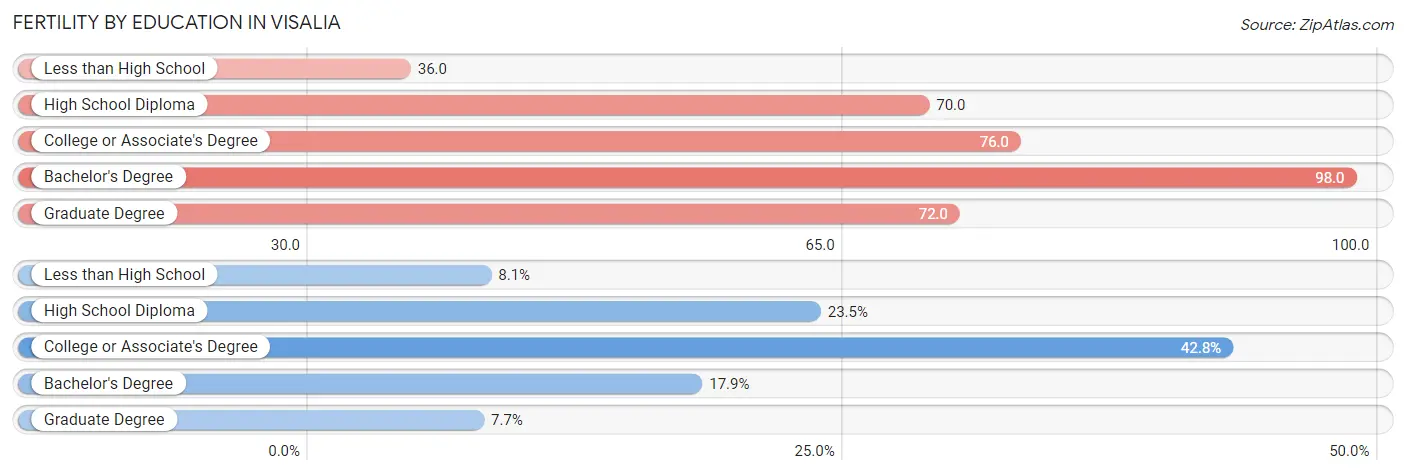
| Educational Attainment | Women with Births | Births / 1,000 Women |
| Less than High School | 190 (8.1%) | 36.0 |
| High School Diploma | 554 (23.5%) | 70.0 |
| College or Associate's Degree | 1,009 (42.8%) | 76.0 |
| Bachelor's Degree | 423 (17.9%) | 98.0 |
| Graduate Degree | 182 (7.7%) | 72.0 |
| Total | 2,358 (100.0%) | 71.0 |
Fertility by Education by Marriage Status in Visalia
40.5% of women with births in Visalia are unmarried. Women with the educational attainment of graduate degree are most likely to be married with 87.4% of them married at childbirth, while women with the educational attainment of college or associate's degree are least likely to be married with 48.5% of them unmarried at childbirth.
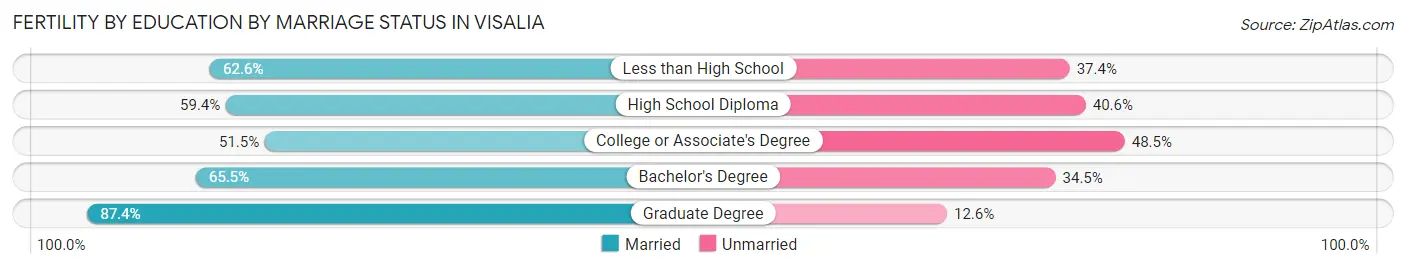
| Educational Attainment | Married | Unmarried |
| Less than High School | 119 (62.6%) | 71 (37.4%) |
| High School Diploma | 329 (59.4%) | 225 (40.6%) |
| College or Associate's Degree | 520 (51.5%) | 489 (48.5%) |
| Bachelor's Degree | 277 (65.5%) | 146 (34.5%) |
| Graduate Degree | 159 (87.4%) | 23 (12.6%) |
| Total | 1,403 (59.5%) | 955 (40.5%) |
Employment Characteristics in Visalia
Employment by Class of Employer in Visalia
Among the 60,824 employed individuals in Visalia, private company employees (37,747 | 62.1%), local government employees (7,374 | 12.1%), and not-for-profit organizations (4,969 | 8.2%) make up the most common classes of employment.
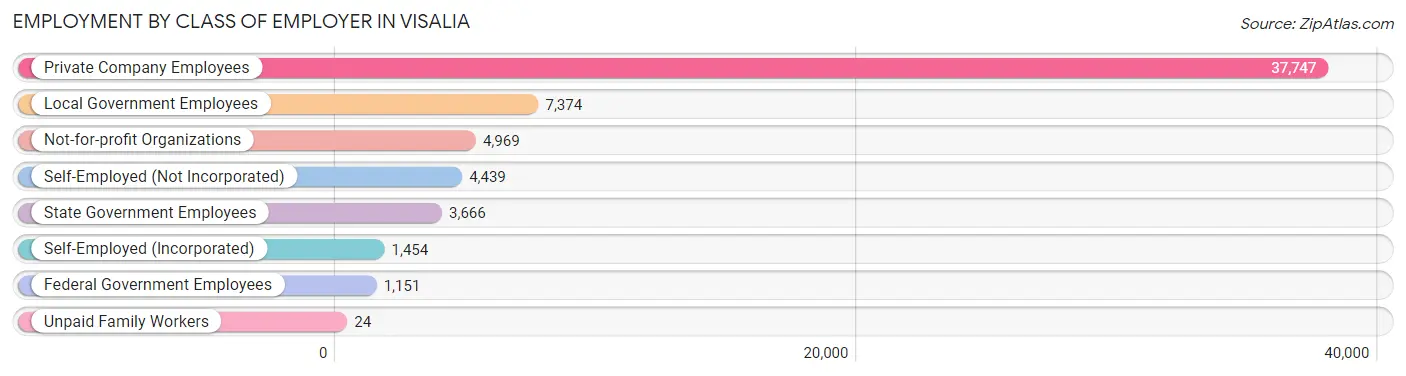
| Employer Class | # Employees | % Employees |
| Private Company Employees | 37,747 | 62.1% |
| Self-Employed (Incorporated) | 1,454 | 2.4% |
| Self-Employed (Not Incorporated) | 4,439 | 7.3% |
| Not-for-profit Organizations | 4,969 | 8.2% |
| Local Government Employees | 7,374 | 12.1% |
| State Government Employees | 3,666 | 6.0% |
| Federal Government Employees | 1,151 | 1.9% |
| Unpaid Family Workers | 24 | 0.0% |
| Total | 60,824 | 100.0% |
Employment Status by Age in Visalia
According to the labor force statistics for Visalia, out of the total population over 16 years of age (105,273), 63.4% or 66,743 individuals are in the labor force, with 5.6% or 3,738 of them unemployed. The age group with the highest labor force participation rate is 25 to 29 years, with 83.9% or 8,509 individuals in the labor force. Within the labor force, the 16 to 19 years age range has the highest percentage of unemployed individuals, with 11.1% or 282 of them being unemployed.
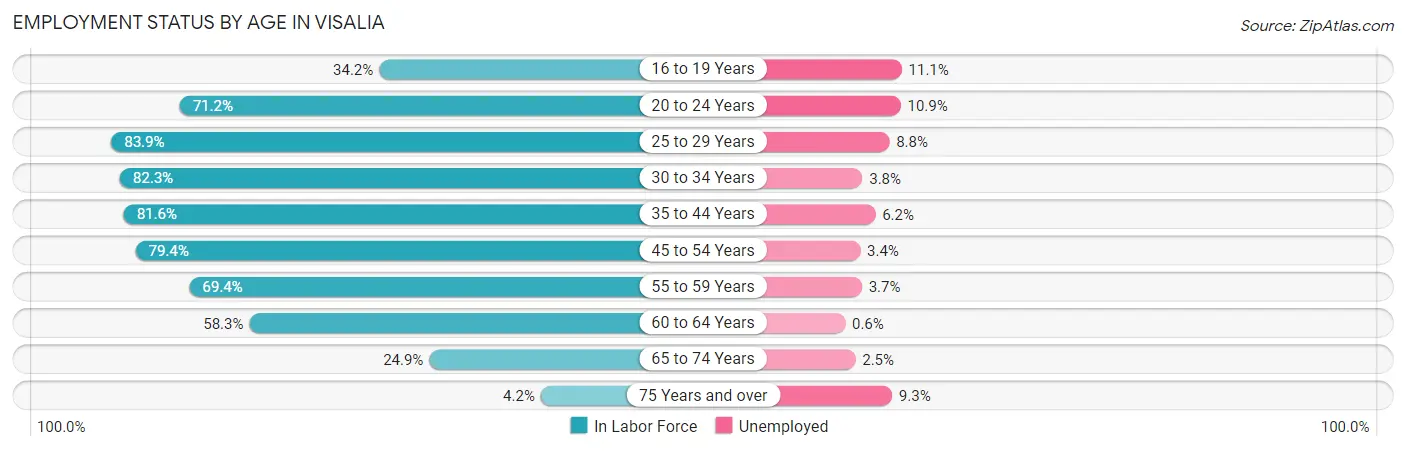
| Age Bracket | In Labor Force | Unemployed |
| 16 to 19 Years | 2,544 (34.2%) | 282 (11.1%) |
| 20 to 24 Years | 6,372 (71.2%) | 695 (10.9%) |
| 25 to 29 Years | 8,509 (83.9%) | 749 (8.8%) |
| 30 to 34 Years | 10,074 (82.3%) | 383 (3.8%) |
| 35 to 44 Years | 15,007 (81.6%) | 930 (6.2%) |
| 45 to 54 Years | 11,995 (79.4%) | 408 (3.4%) |
| 55 to 59 Years | 4,693 (69.4%) | 174 (3.7%) |
| 60 to 64 Years | 4,429 (58.3%) | 27 (0.6%) |
| 65 to 74 Years | 2,838 (24.9%) | 71 (2.5%) |
| 75 Years and over | 304 (4.2%) | 28 (9.3%) |
| Total | 66,743 (63.4%) | 3,738 (5.6%) |
Employment Status by Educational Attainment in Visalia
According to labor force statistics for Visalia, 77.9% of individuals (54,717) out of the total population between 25 and 64 years of age (70,240) are in the labor force, with 4.9% or 2,681 of them being unemployed. The group with the highest labor force participation rate are those with the educational attainment of bachelor's degree or higher, with 89.5% or 14,616 individuals in the labor force. Within the labor force, individuals with high school diploma education have the highest percentage of unemployment, with 6.9% or 879 of them being unemployed.
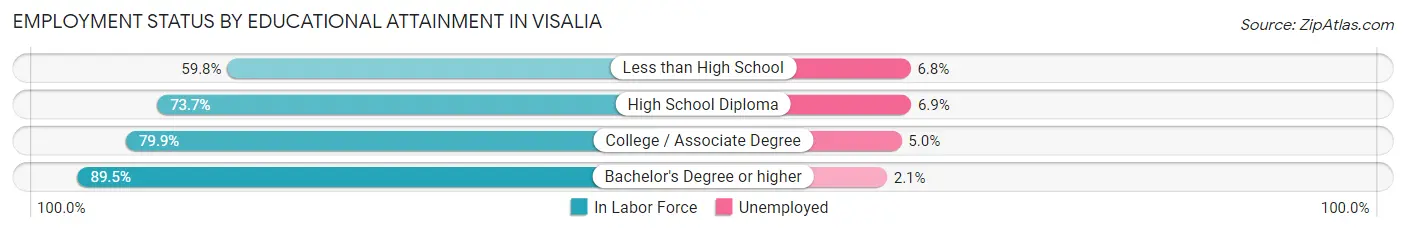
| Educational Attainment | In Labor Force | Unemployed |
| Less than High School | 5,629 (59.8%) | 640 (6.8%) |
| High School Diploma | 12,733 (73.7%) | 1,192 (6.9%) |
| College / Associate Degree | 21,748 (79.9%) | 1,361 (5.0%) |
| Bachelor's Degree or higher | 14,616 (89.5%) | 343 (2.1%) |
| Total | 54,717 (77.9%) | 3,442 (4.9%) |
Employment Occupations by Sex in Visalia
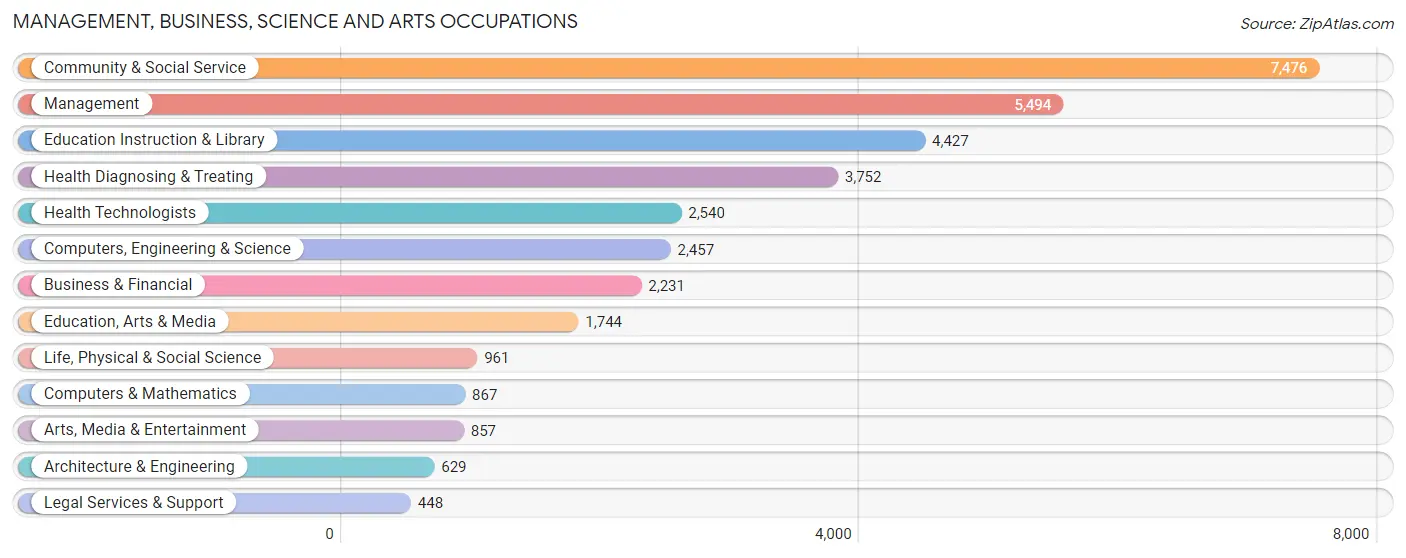
Management, Business, Science and Arts Occupations
The most common Management, Business, Science and Arts occupations in Visalia are Community & Social Service (7,476 | 11.9%), Management (5,494 | 8.8%), Education Instruction & Library (4,427 | 7.1%), Health Diagnosing & Treating (3,752 | 6.0%), and Health Technologists (2,540 | 4.1%).
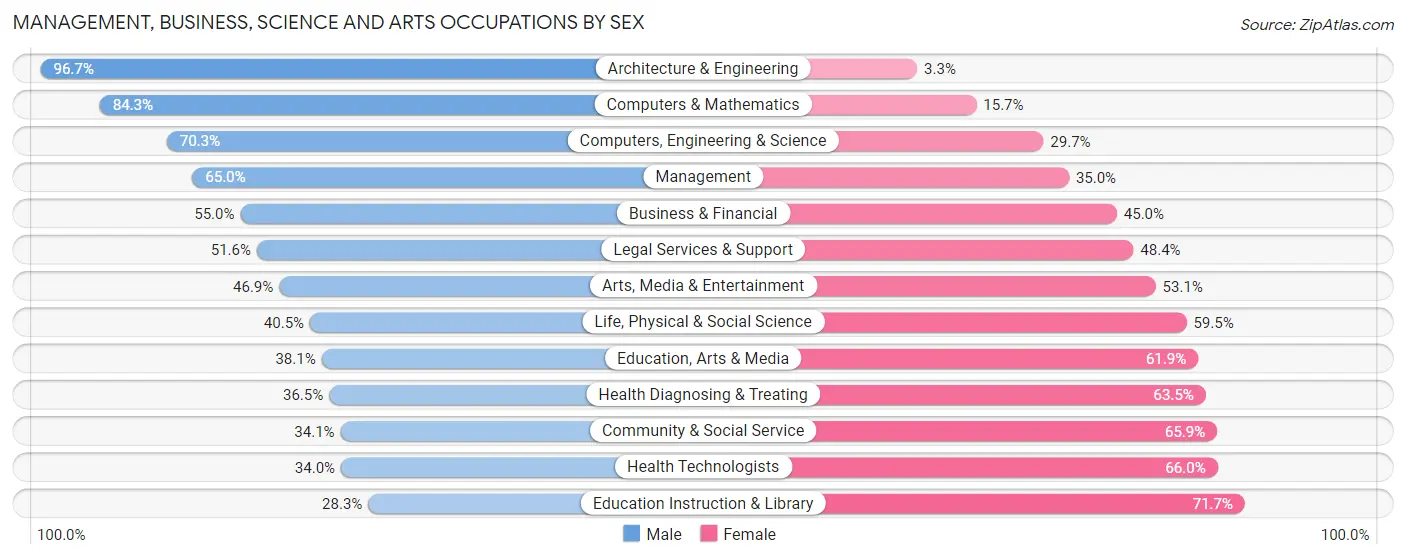
Management, Business, Science and Arts Occupations by Sex
Within the Management, Business, Science and Arts occupations in Visalia, the most male-oriented occupations are Architecture & Engineering (96.7%), Computers & Mathematics (84.3%), and Computers, Engineering & Science (70.3%), while the most female-oriented occupations are Education Instruction & Library (71.7%), Health Technologists (66.0%), and Community & Social Service (65.9%).
| Occupation | Male | Female |
| Management | 3,571 (65.0%) | 1,923 (35.0%) |
| Business & Financial | 1,227 (55.0%) | 1,004 (45.0%) |
| Computers, Engineering & Science | 1,728 (70.3%) | 729 (29.7%) |
| Computers & Mathematics | 731 (84.3%) | 136 (15.7%) |
| Architecture & Engineering | 608 (96.7%) | 21 (3.3%) |
| Life, Physical & Social Science | 389 (40.5%) | 572 (59.5%) |
| Community & Social Service | 2,551 (34.1%) | 4,925 (65.9%) |
| Education, Arts & Media | 664 (38.1%) | 1,080 (61.9%) |
| Legal Services & Support | 231 (51.6%) | 217 (48.4%) |
| Education Instruction & Library | 1,254 (28.3%) | 3,173 (71.7%) |
| Arts, Media & Entertainment | 402 (46.9%) | 455 (53.1%) |
| Health Diagnosing & Treating | 1,369 (36.5%) | 2,383 (63.5%) |
| Health Technologists | 864 (34.0%) | 1,676 (66.0%) |
| Total (Category) | 10,446 (48.8%) | 10,964 (51.2%) |
| Total (Overall) | 34,350 (54.7%) | 28,392 (45.3%) |
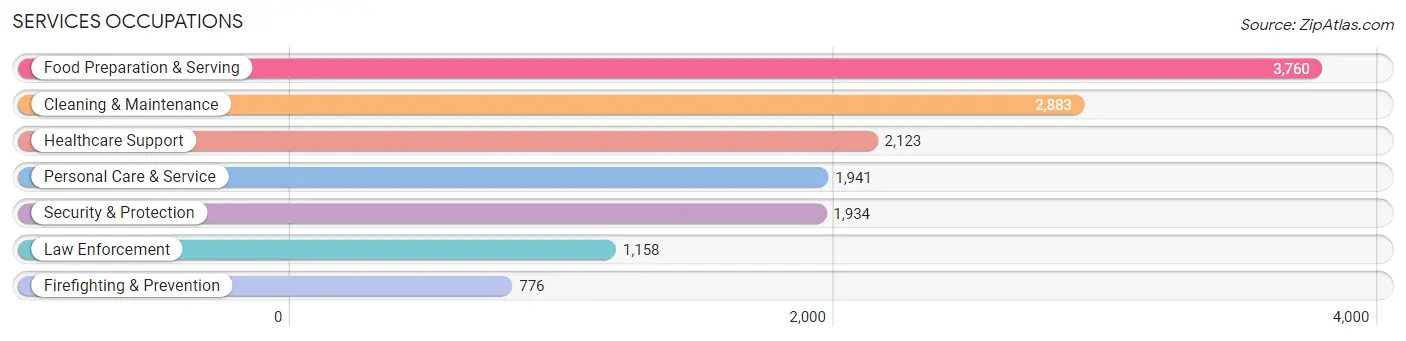
Services Occupations
The most common Services occupations in Visalia are Food Preparation & Serving (3,760 | 6.0%), Cleaning & Maintenance (2,883 | 4.6%), Healthcare Support (2,123 | 3.4%), Personal Care & Service (1,941 | 3.1%), and Security & Protection (1,934 | 3.1%).
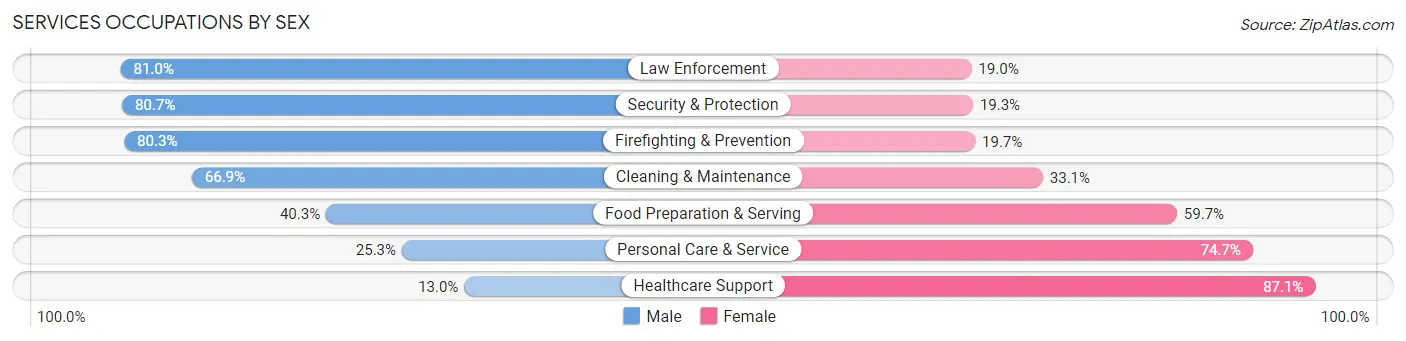
Services Occupations by Sex
Within the Services occupations in Visalia, the most male-oriented occupations are Law Enforcement (81.0%), Security & Protection (80.7%), and Firefighting & Prevention (80.3%), while the most female-oriented occupations are Healthcare Support (87.1%), Personal Care & Service (74.7%), and Food Preparation & Serving (59.7%).
| Occupation | Male | Female |
| Healthcare Support | 275 (13.0%) | 1,848 (87.1%) |
| Security & Protection | 1,561 (80.7%) | 373 (19.3%) |
| Firefighting & Prevention | 623 (80.3%) | 153 (19.7%) |
| Law Enforcement | 938 (81.0%) | 220 (19.0%) |
| Food Preparation & Serving | 1,516 (40.3%) | 2,244 (59.7%) |
| Cleaning & Maintenance | 1,928 (66.9%) | 955 (33.1%) |
| Personal Care & Service | 491 (25.3%) | 1,450 (74.7%) |
| Total (Category) | 5,771 (45.7%) | 6,870 (54.3%) |
| Total (Overall) | 34,350 (54.7%) | 28,392 (45.3%) |
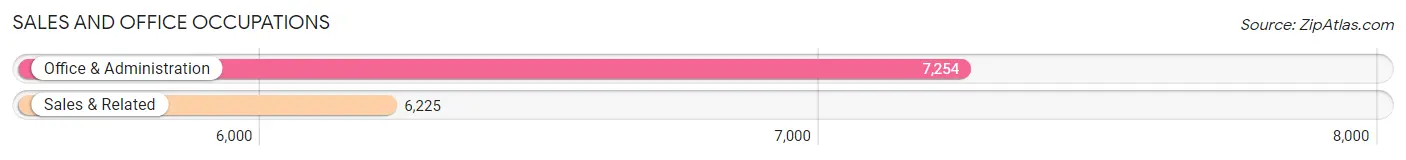
Sales and Office Occupations
The most common Sales and Office occupations in Visalia are Office & Administration (7,254 | 11.6%), and Sales & Related (6,225 | 9.9%).
Sales and Office Occupations by Sex
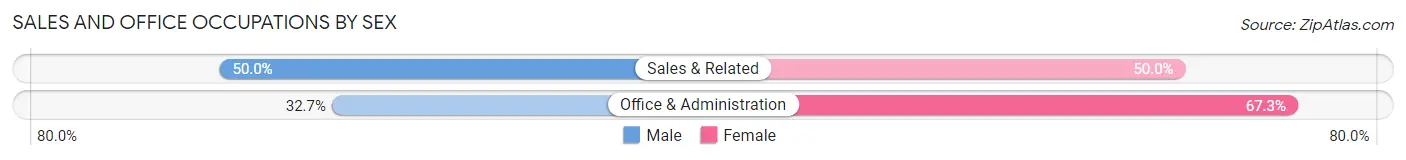
| Occupation | Male | Female |
| Sales & Related | 3,114 (50.0%) | 3,111 (50.0%) |
| Office & Administration | 2,375 (32.7%) | 4,879 (67.3%) |
| Total (Category) | 5,489 (40.7%) | 7,990 (59.3%) |
| Total (Overall) | 34,350 (54.7%) | 28,392 (45.3%) |
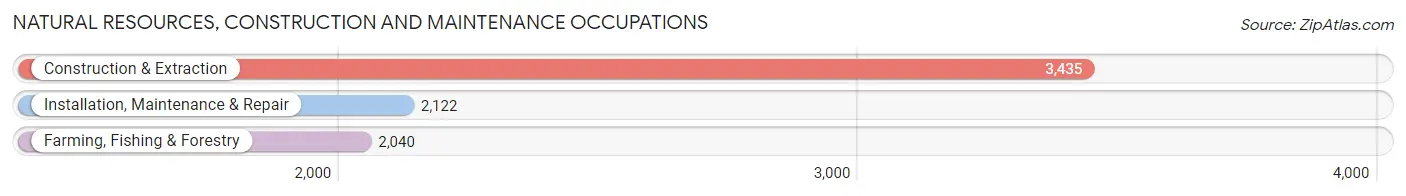
Natural Resources, Construction and Maintenance Occupations
The most common Natural Resources, Construction and Maintenance occupations in Visalia are Construction & Extraction (3,435 | 5.5%), Installation, Maintenance & Repair (2,122 | 3.4%), and Farming, Fishing & Forestry (2,040 | 3.3%).
Natural Resources, Construction and Maintenance Occupations by Sex
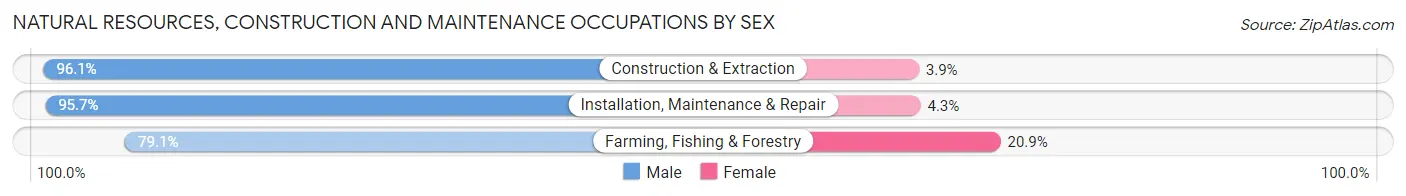
| Occupation | Male | Female |
| Farming, Fishing & Forestry | 1,613 (79.1%) | 427 (20.9%) |
| Construction & Extraction | 3,300 (96.1%) | 135 (3.9%) |
| Installation, Maintenance & Repair | 2,031 (95.7%) | 91 (4.3%) |
| Total (Category) | 6,944 (91.4%) | 653 (8.6%) |
| Total (Overall) | 34,350 (54.7%) | 28,392 (45.3%) |
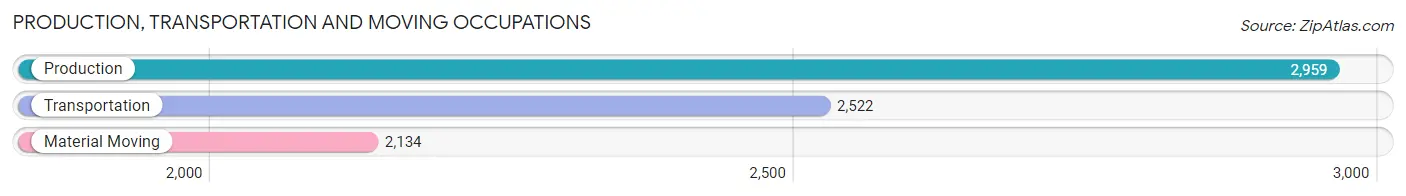
Production, Transportation and Moving Occupations
The most common Production, Transportation and Moving occupations in Visalia are Production (2,959 | 4.7%), Transportation (2,522 | 4.0%), and Material Moving (2,134 | 3.4%).
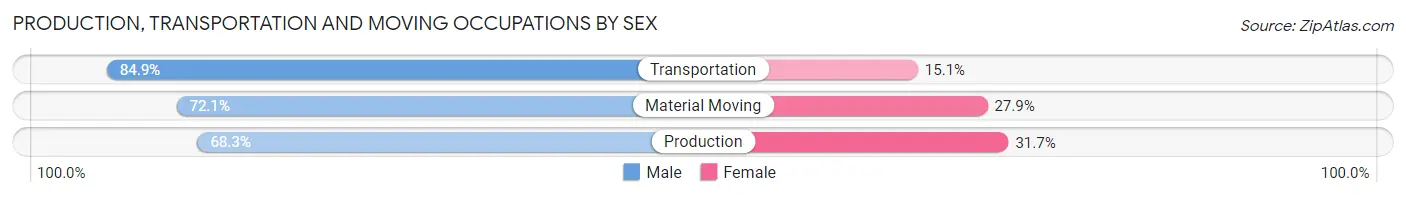
Production, Transportation and Moving Occupations by Sex
| Occupation | Male | Female |
| Production | 2,020 (68.3%) | 939 (31.7%) |
| Transportation | 2,141 (84.9%) | 381 (15.1%) |
| Material Moving | 1,539 (72.1%) | 595 (27.9%) |
| Total (Category) | 5,700 (74.9%) | 1,915 (25.2%) |
| Total (Overall) | 34,350 (54.7%) | 28,392 (45.3%) |
Employment Industries by Sex in Visalia
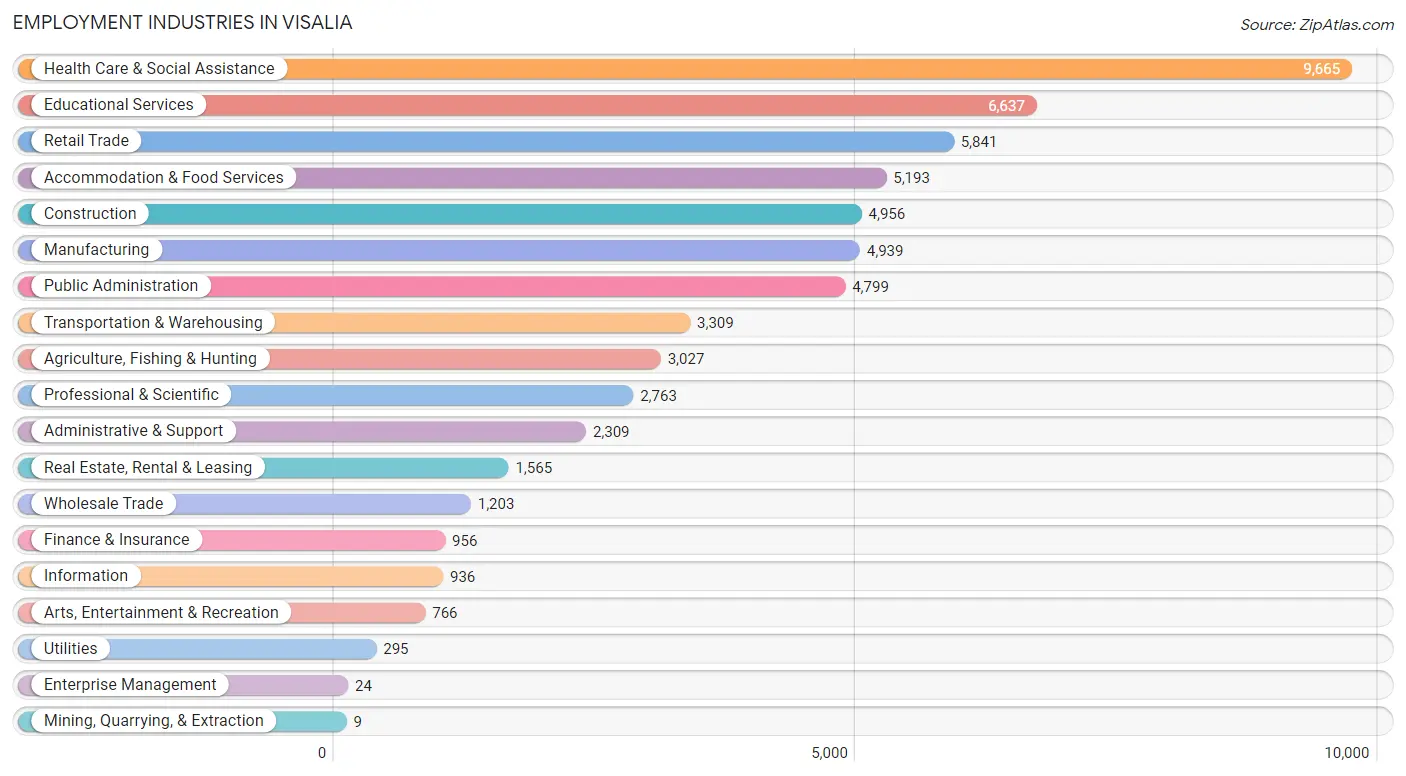
Employment Industries in Visalia
The major employment industries in Visalia include Health Care & Social Assistance (9,665 | 15.4%), Educational Services (6,637 | 10.6%), Retail Trade (5,841 | 9.3%), Accommodation & Food Services (5,193 | 8.3%), and Construction (4,956 | 7.9%).
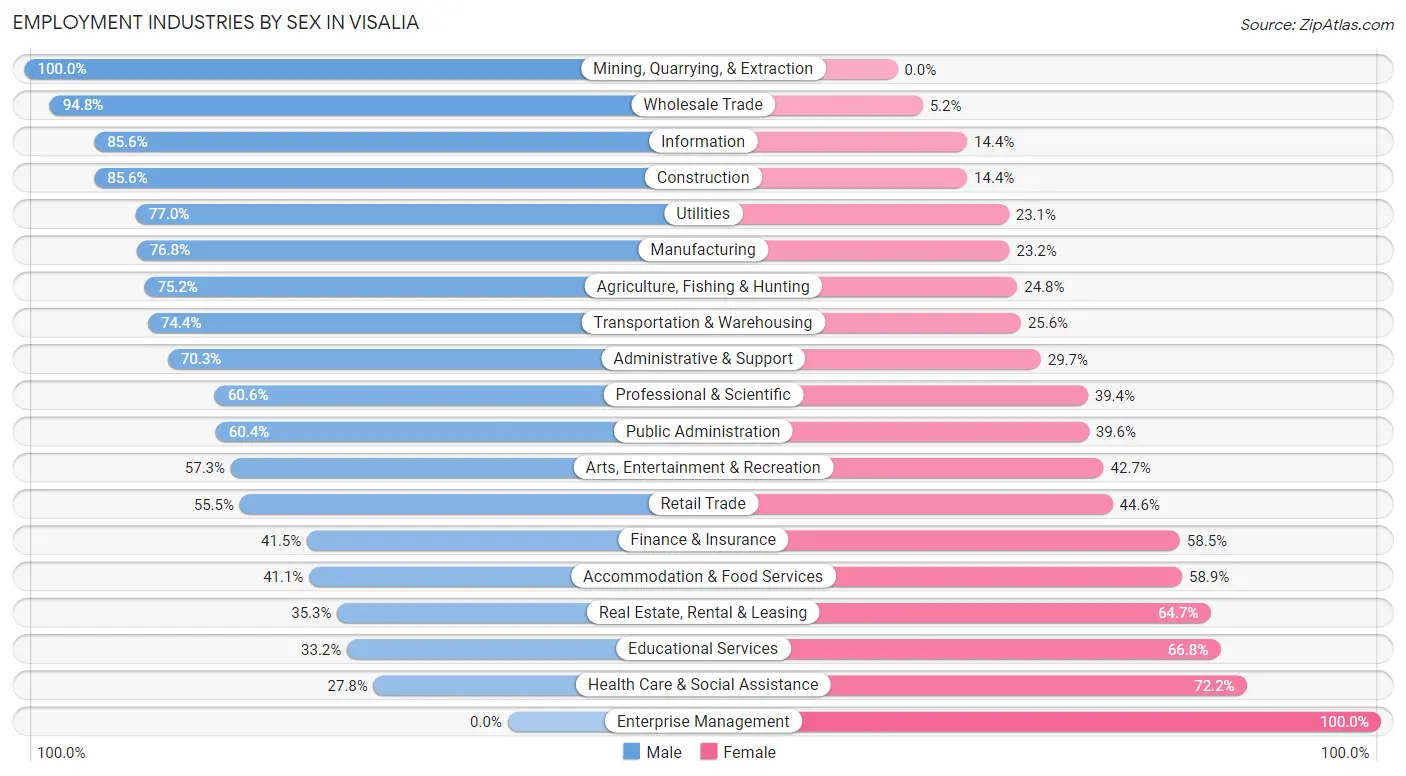
Employment Industries by Sex in Visalia
The Visalia industries that see more men than women are Mining, Quarrying, & Extraction (100.0%), Wholesale Trade (94.8%), and Information (85.6%), whereas the industries that tend to have a higher number of women are Enterprise Management (100.0%), Health Care & Social Assistance (72.2%), and Educational Services (66.8%).
| Industry | Male | Female |
| Agriculture, Fishing & Hunting | 2,276 (75.2%) | 751 (24.8%) |
| Mining, Quarrying, & Extraction | 9 (100.0%) | 0 (0.0%) |
| Construction | 4,241 (85.6%) | 715 (14.4%) |
| Manufacturing | 3,792 (76.8%) | 1,147 (23.2%) |
| Wholesale Trade | 1,140 (94.8%) | 63 (5.2%) |
| Retail Trade | 3,239 (55.4%) | 2,602 (44.6%) |
| Transportation & Warehousing | 2,463 (74.4%) | 846 (25.6%) |
| Utilities | 227 (76.9%) | 68 (23.1%) |
| Information | 801 (85.6%) | 135 (14.4%) |
| Finance & Insurance | 397 (41.5%) | 559 (58.5%) |
| Real Estate, Rental & Leasing | 552 (35.3%) | 1,013 (64.7%) |
| Professional & Scientific | 1,674 (60.6%) | 1,089 (39.4%) |
| Enterprise Management | 0 (0.0%) | 24 (100.0%) |
| Administrative & Support | 1,624 (70.3%) | 685 (29.7%) |
| Educational Services | 2,206 (33.2%) | 4,431 (66.8%) |
| Health Care & Social Assistance | 2,684 (27.8%) | 6,981 (72.2%) |
| Arts, Entertainment & Recreation | 439 (57.3%) | 327 (42.7%) |
| Accommodation & Food Services | 2,134 (41.1%) | 3,059 (58.9%) |
| Public Administration | 2,898 (60.4%) | 1,901 (39.6%) |
| Total | 34,350 (54.7%) | 28,392 (45.3%) |
Education in Visalia
School Enrollment in Visalia
The most common levels of schooling among the 39,305 students in Visalia are middle school (8,622 | 21.9%), high school (8,579 | 21.8%), and elementary school (8,406 | 21.4%).
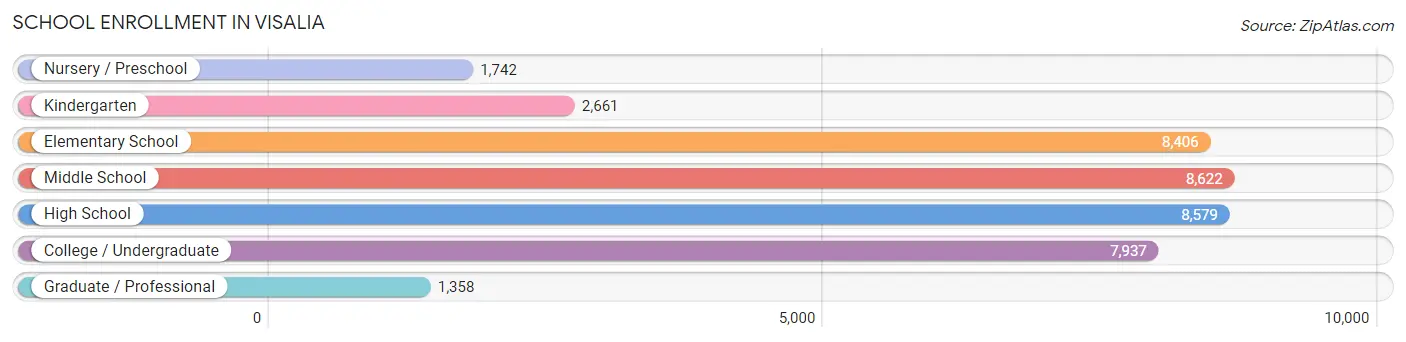
| School Level | # Students | % Students |
| Nursery / Preschool | 1,742 | 4.4% |
| Kindergarten | 2,661 | 6.8% |
| Elementary School | 8,406 | 21.4% |
| Middle School | 8,622 | 21.9% |
| High School | 8,579 | 21.8% |
| College / Undergraduate | 7,937 | 20.2% |
| Graduate / Professional | 1,358 | 3.5% |
| Total | 39,305 | 100.0% |
School Enrollment by Age by Funding Source in Visalia
Out of a total of 39,305 students who are enrolled in schools in Visalia, 5,345 (13.6%) attend a private institution, while the remaining 33,960 (86.4%) are enrolled in public schools. The age group of 25 to 34 year olds has the highest likelihood of being enrolled in private schools, with 887 (31.9% in the age bracket) enrolled. Conversely, the age group of 18 to 19 year olds has the lowest likelihood of being enrolled in a private school, with 2,536 (92.4% in the age bracket) attending a public institution.
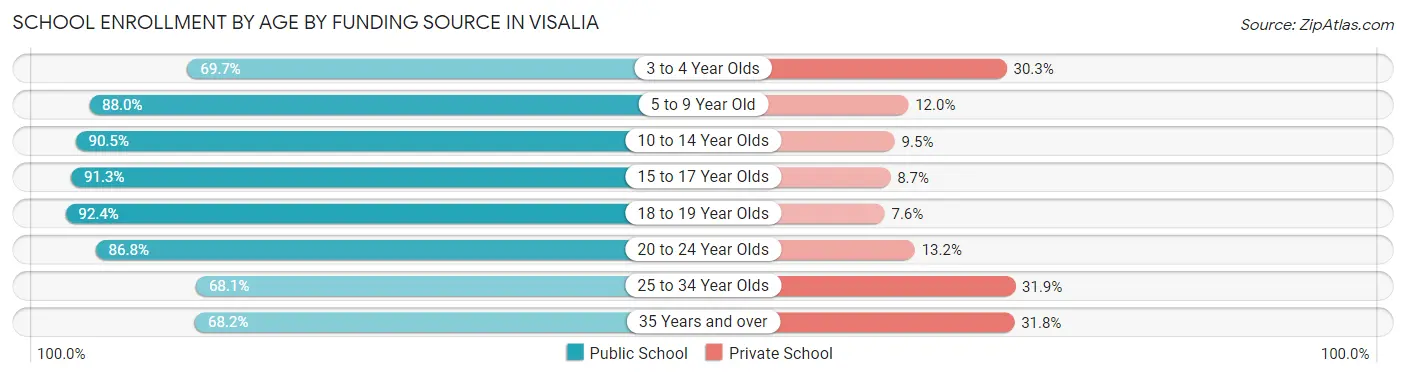
| Age Bracket | Public School | Private School |
| 3 to 4 Year Olds | 990 (69.7%) | 431 (30.3%) |
| 5 to 9 Year Old | 9,410 (88.0%) | 1,287 (12.0%) |
| 10 to 14 Year Olds | 9,817 (90.5%) | 1,030 (9.5%) |
| 15 to 17 Year Olds | 5,341 (91.3%) | 507 (8.7%) |
| 18 to 19 Year Olds | 2,536 (92.4%) | 209 (7.6%) |
| 20 to 24 Year Olds | 2,694 (86.8%) | 411 (13.2%) |
| 25 to 34 Year Olds | 1,891 (68.1%) | 887 (31.9%) |
| 35 Years and over | 1,272 (68.2%) | 592 (31.8%) |
| Total | 33,960 (86.4%) | 5,345 (13.6%) |
Educational Attainment by Field of Study in Visalia
Business (3,460 | 15.5%), education (2,404 | 10.8%), science & technology (2,254 | 10.1%), arts & humanities (2,178 | 9.8%), and bio, nature & agricultural (2,120 | 9.5%) are the most common fields of study among 22,319 individuals in Visalia who have obtained a bachelor's degree or higher.
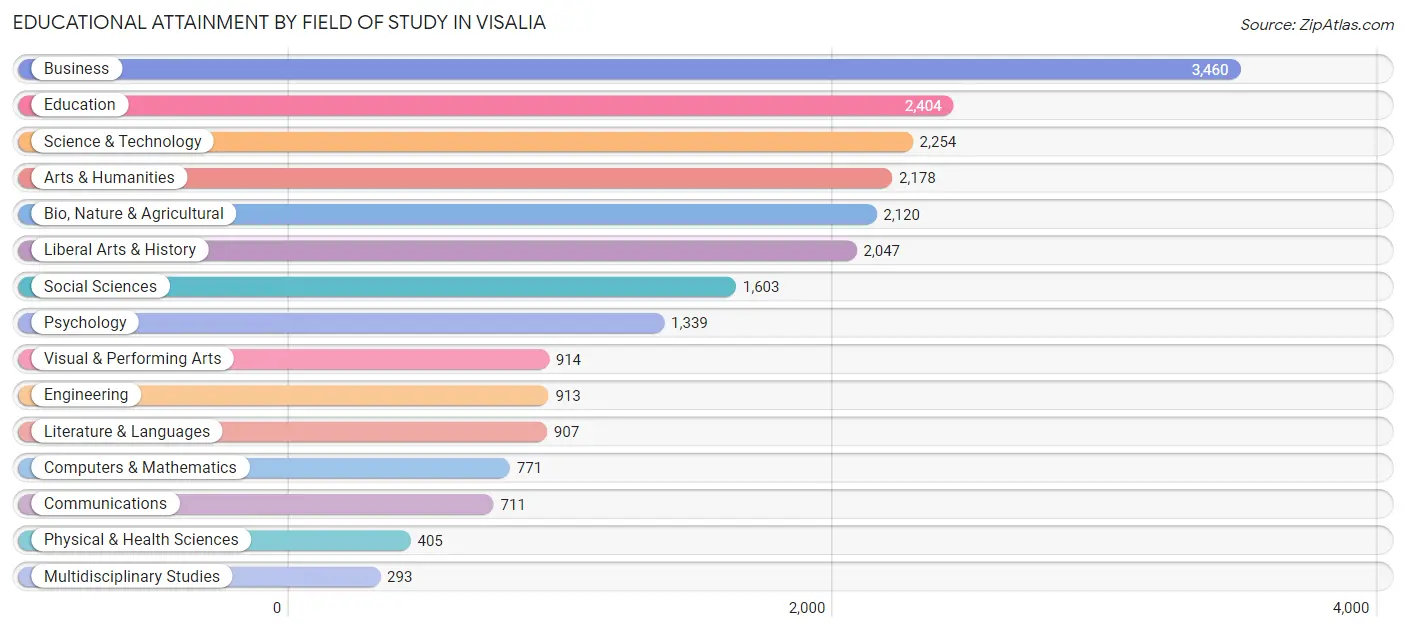
| Field of Study | # Graduates | % Graduates |
| Computers & Mathematics | 771 | 3.5% |
| Bio, Nature & Agricultural | 2,120 | 9.5% |
| Physical & Health Sciences | 405 | 1.8% |
| Psychology | 1,339 | 6.0% |
| Social Sciences | 1,603 | 7.2% |
| Engineering | 913 | 4.1% |
| Multidisciplinary Studies | 293 | 1.3% |
| Science & Technology | 2,254 | 10.1% |
| Business | 3,460 | 15.5% |
| Education | 2,404 | 10.8% |
| Literature & Languages | 907 | 4.1% |
| Liberal Arts & History | 2,047 | 9.2% |
| Visual & Performing Arts | 914 | 4.1% |
| Communications | 711 | 3.2% |
| Arts & Humanities | 2,178 | 9.8% |
| Total | 22,319 | 100.0% |
Transportation & Commute in Visalia
Vehicle Availability by Sex in Visalia
The most prevalent vehicle ownership categories in Visalia are males with 2 vehicles (15,045, accounting for 45.1%) and females with 2 vehicles (11,784, making up 55.0%).
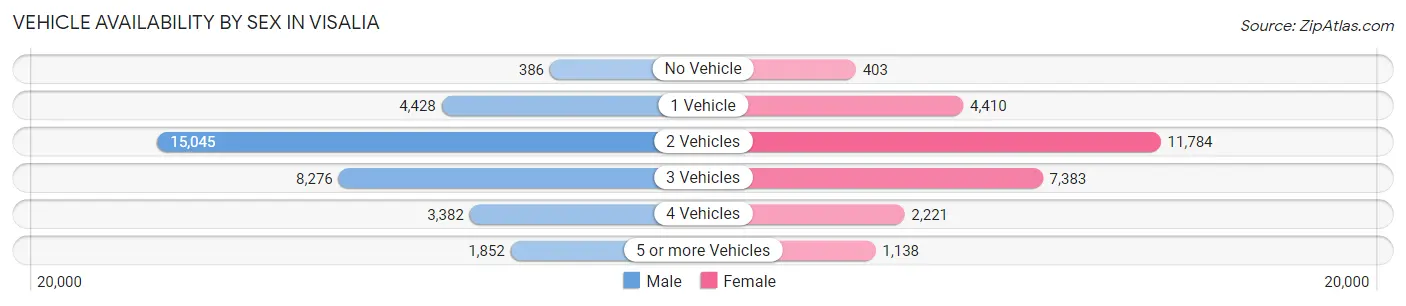
| Vehicles Available | Male | Female |
| No Vehicle | 386 (1.2%) | 403 (1.5%) |
| 1 Vehicle | 4,428 (13.3%) | 4,410 (16.1%) |
| 2 Vehicles | 15,045 (45.1%) | 11,784 (43.1%) |
| 3 Vehicles | 8,276 (24.8%) | 7,383 (27.0%) |
| 4 Vehicles | 3,382 (10.1%) | 2,221 (8.1%) |
| 5 or more Vehicles | 1,852 (5.6%) | 1,138 (4.2%) |
| Total | 33,369 (100.0%) | 27,339 (100.0%) |
Commute Time in Visalia
The most frequently occuring commute durations in Visalia are 10 to 14 minutes (13,931 commuters, 24.5%), 15 to 19 minutes (9,974 commuters, 17.5%), and 5 to 9 minutes (8,310 commuters, 14.6%).
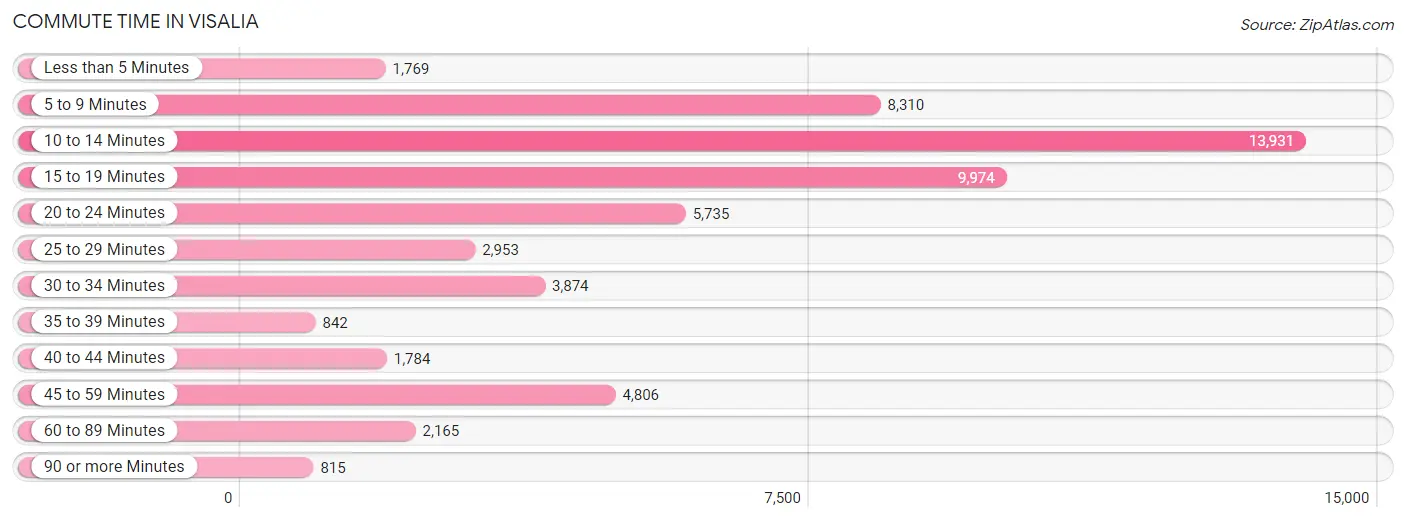
| Commute Time | # Commuters | % Commuters |
| Less than 5 Minutes | 1,769 | 3.1% |
| 5 to 9 Minutes | 8,310 | 14.6% |
| 10 to 14 Minutes | 13,931 | 24.5% |
| 15 to 19 Minutes | 9,974 | 17.5% |
| 20 to 24 Minutes | 5,735 | 10.1% |
| 25 to 29 Minutes | 2,953 | 5.2% |
| 30 to 34 Minutes | 3,874 | 6.8% |
| 35 to 39 Minutes | 842 | 1.5% |
| 40 to 44 Minutes | 1,784 | 3.1% |
| 45 to 59 Minutes | 4,806 | 8.4% |
| 60 to 89 Minutes | 2,165 | 3.8% |
| 90 or more Minutes | 815 | 1.4% |
Commute Time by Sex in Visalia
The most common commute times in Visalia are 10 to 14 minutes (7,145 commuters, 22.7%) for males and 10 to 14 minutes (6,786 commuters, 26.6%) for females.
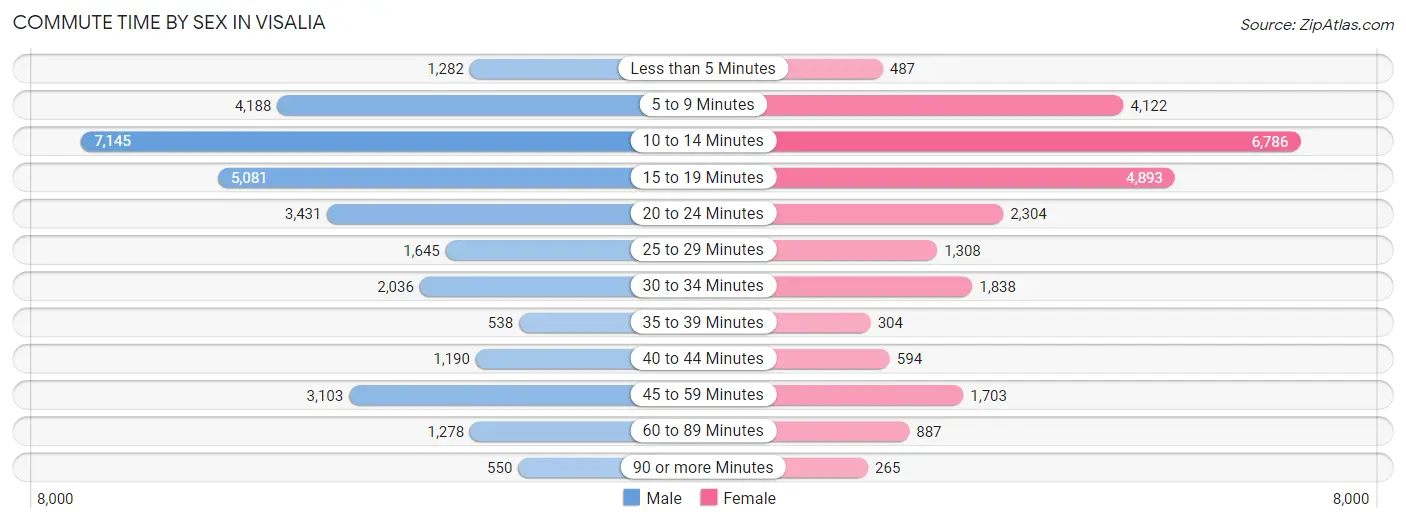
| Commute Time | Male | Female |
| Less than 5 Minutes | 1,282 (4.1%) | 487 (1.9%) |
| 5 to 9 Minutes | 4,188 (13.3%) | 4,122 (16.2%) |
| 10 to 14 Minutes | 7,145 (22.7%) | 6,786 (26.6%) |
| 15 to 19 Minutes | 5,081 (16.2%) | 4,893 (19.2%) |
| 20 to 24 Minutes | 3,431 (10.9%) | 2,304 (9.0%) |
| 25 to 29 Minutes | 1,645 (5.2%) | 1,308 (5.1%) |
| 30 to 34 Minutes | 2,036 (6.5%) | 1,838 (7.2%) |
| 35 to 39 Minutes | 538 (1.7%) | 304 (1.2%) |
| 40 to 44 Minutes | 1,190 (3.8%) | 594 (2.3%) |
| 45 to 59 Minutes | 3,103 (9.9%) | 1,703 (6.7%) |
| 60 to 89 Minutes | 1,278 (4.1%) | 887 (3.5%) |
| 90 or more Minutes | 550 (1.8%) | 265 (1.0%) |
Time of Departure to Work by Sex in Visalia
The most frequent times of departure to work in Visalia are 7:30 AM to 7:59 AM (3,816, 12.1%) for males and 7:30 AM to 7:59 AM (4,821, 18.9%) for females.
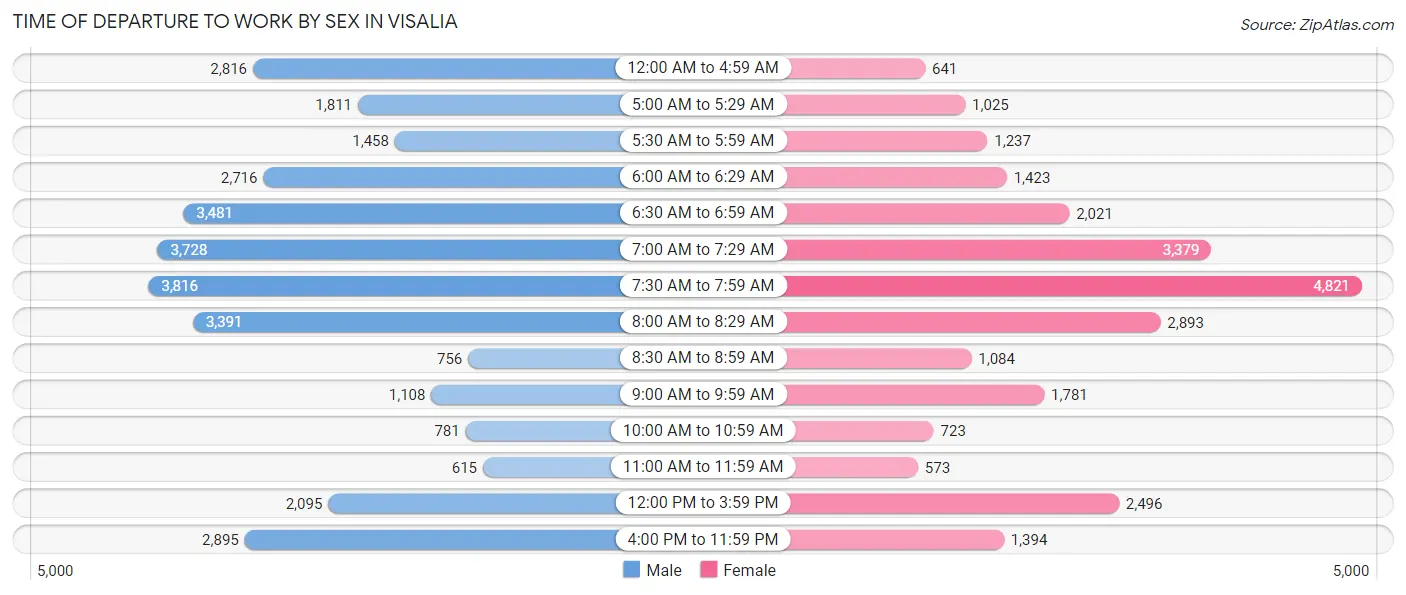
| Time of Departure | Male | Female |
| 12:00 AM to 4:59 AM | 2,816 (8.9%) | 641 (2.5%) |
| 5:00 AM to 5:29 AM | 1,811 (5.8%) | 1,025 (4.0%) |
| 5:30 AM to 5:59 AM | 1,458 (4.6%) | 1,237 (4.9%) |
| 6:00 AM to 6:29 AM | 2,716 (8.6%) | 1,423 (5.6%) |
| 6:30 AM to 6:59 AM | 3,481 (11.1%) | 2,021 (7.9%) |
| 7:00 AM to 7:29 AM | 3,728 (11.8%) | 3,379 (13.3%) |
| 7:30 AM to 7:59 AM | 3,816 (12.1%) | 4,821 (18.9%) |
| 8:00 AM to 8:29 AM | 3,391 (10.8%) | 2,893 (11.4%) |
| 8:30 AM to 8:59 AM | 756 (2.4%) | 1,084 (4.3%) |
| 9:00 AM to 9:59 AM | 1,108 (3.5%) | 1,781 (7.0%) |
| 10:00 AM to 10:59 AM | 781 (2.5%) | 723 (2.8%) |
| 11:00 AM to 11:59 AM | 615 (1.9%) | 573 (2.2%) |
| 12:00 PM to 3:59 PM | 2,095 (6.7%) | 2,496 (9.8%) |
| 4:00 PM to 11:59 PM | 2,895 (9.2%) | 1,394 (5.5%) |
| Total | 31,467 (100.0%) | 25,491 (100.0%) |
Housing Occupancy in Visalia
Occupancy by Ownership in Visalia
Of the total 45,757 dwellings in Visalia, owner-occupied units account for 27,443 (60.0%), while renter-occupied units make up 18,314 (40.0%).
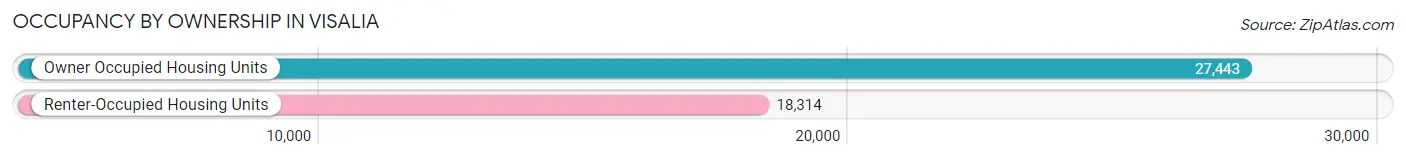
| Occupancy | # Housing Units | % Housing Units |
| Owner Occupied Housing Units | 27,443 | 60.0% |
| Renter-Occupied Housing Units | 18,314 | 40.0% |
| Total Occupied Housing Units | 45,757 | 100.0% |
Occupancy by Household Size in Visalia
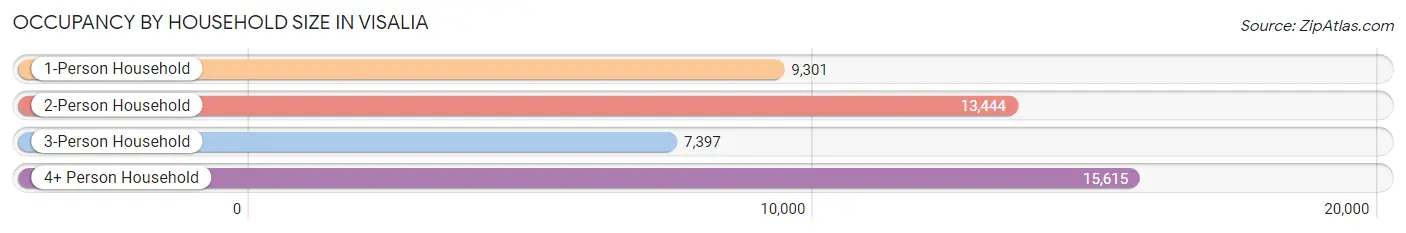
| Household Size | # Housing Units | % Housing Units |
| 1-Person Household | 9,301 | 20.3% |
| 2-Person Household | 13,444 | 29.4% |
| 3-Person Household | 7,397 | 16.2% |
| 4+ Person Household | 15,615 | 34.1% |
| Total Housing Units | 45,757 | 100.0% |
Occupancy by Ownership by Household Size in Visalia
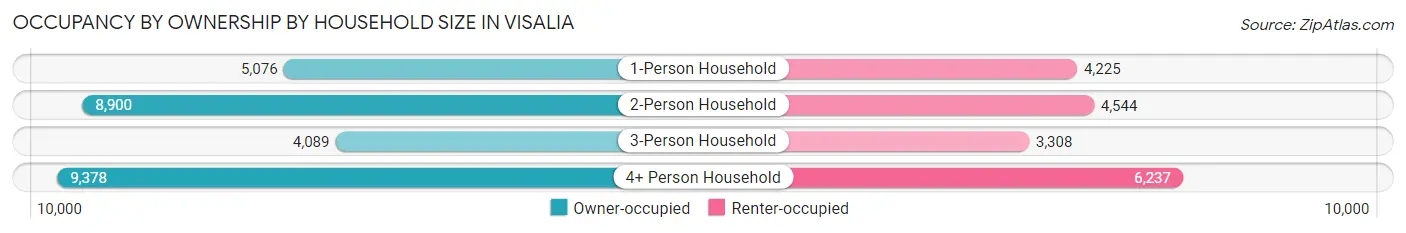
| Household Size | Owner-occupied | Renter-occupied |
| 1-Person Household | 5,076 (54.6%) | 4,225 (45.4%) |
| 2-Person Household | 8,900 (66.2%) | 4,544 (33.8%) |
| 3-Person Household | 4,089 (55.3%) | 3,308 (44.7%) |
| 4+ Person Household | 9,378 (60.1%) | 6,237 (39.9%) |
| Total Housing Units | 27,443 (60.0%) | 18,314 (40.0%) |
Occupancy by Educational Attainment in Visalia
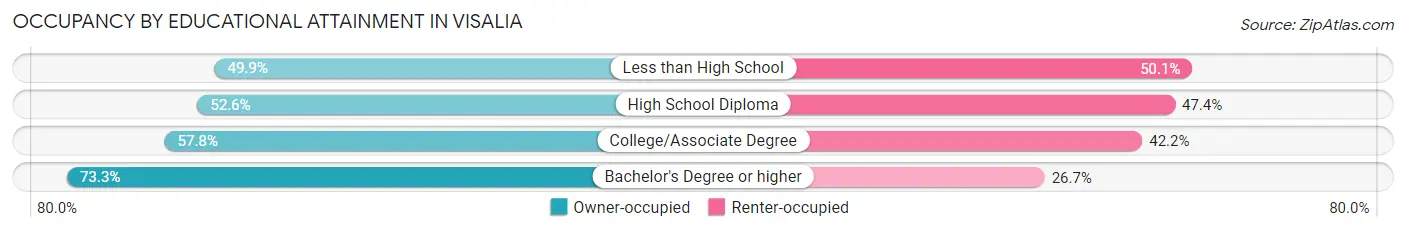
| Household Size | Owner-occupied | Renter-occupied |
| Less than High School | 2,513 (49.9%) | 2,526 (50.1%) |
| High School Diploma | 5,174 (52.6%) | 4,664 (47.4%) |
| College/Associate Degree | 10,710 (57.8%) | 7,824 (42.2%) |
| Bachelor's Degree or higher | 9,046 (73.3%) | 3,300 (26.7%) |
Occupancy by Age of Householder in Visalia
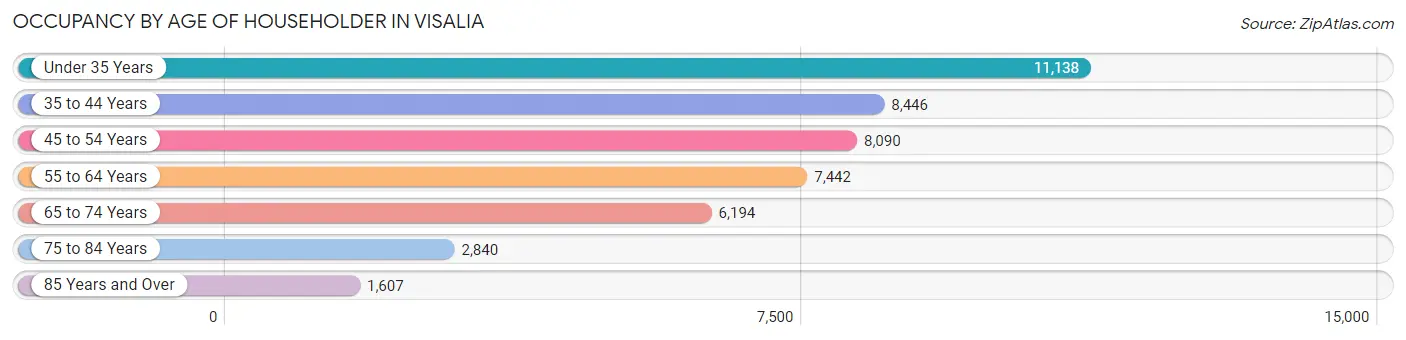
| Age Bracket | # Households | % Households |
| Under 35 Years | 11,138 | 24.3% |
| 35 to 44 Years | 8,446 | 18.5% |
| 45 to 54 Years | 8,090 | 17.7% |
| 55 to 64 Years | 7,442 | 16.3% |
| 65 to 74 Years | 6,194 | 13.5% |
| 75 to 84 Years | 2,840 | 6.2% |
| 85 Years and Over | 1,607 | 3.5% |
| Total | 45,757 | 100.0% |
Housing Finances in Visalia
Median Income by Occupancy in Visalia
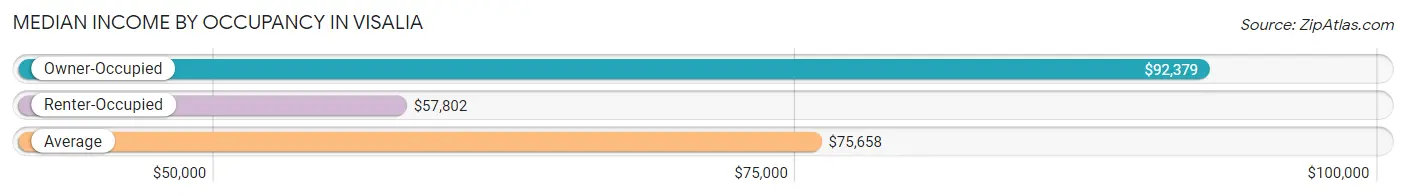
| Occupancy Type | # Households | Median Income |
| Owner-Occupied | 27,443 (60.0%) | $92,379 |
| Renter-Occupied | 18,314 (40.0%) | $57,802 |
| Average | 45,757 (100.0%) | $75,658 |
Occupancy by Householder Income Bracket in Visalia
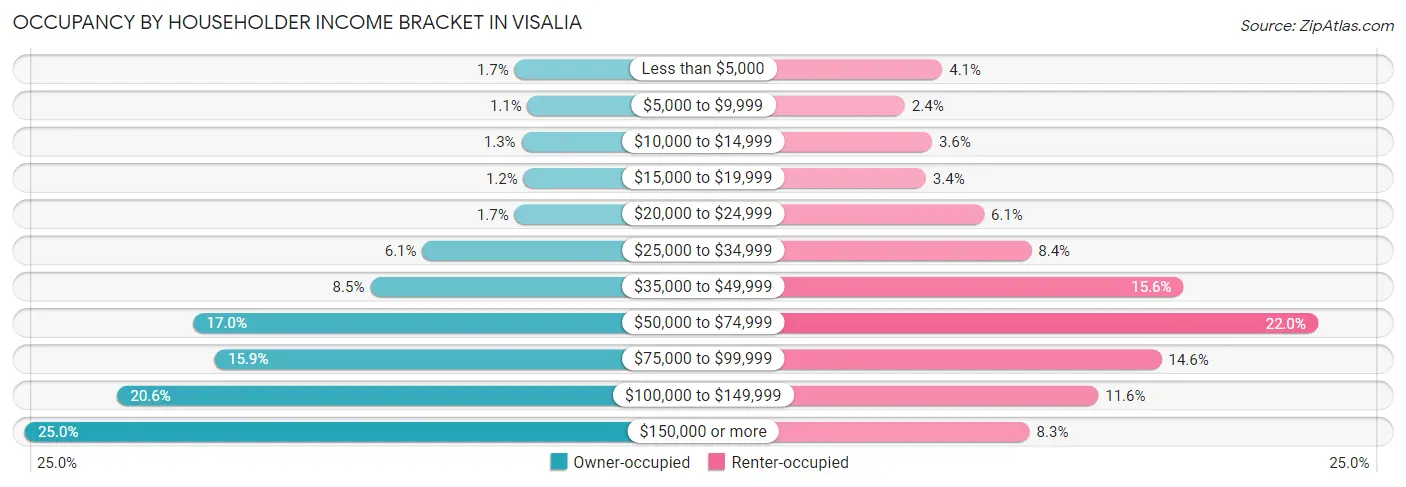
| Income Bracket | Owner-occupied | Renter-occupied |
| Less than $5,000 | 457 (1.7%) | 756 (4.1%) |
| $5,000 to $9,999 | 287 (1.1%) | 431 (2.4%) |
| $10,000 to $14,999 | 369 (1.3%) | 666 (3.6%) |
| $15,000 to $19,999 | 340 (1.2%) | 614 (3.4%) |
| $20,000 to $24,999 | 457 (1.7%) | 1,121 (6.1%) |
| $25,000 to $34,999 | 1,662 (6.1%) | 1,533 (8.4%) |
| $35,000 to $49,999 | 2,345 (8.5%) | 2,859 (15.6%) |
| $50,000 to $74,999 | 4,652 (17.0%) | 4,031 (22.0%) |
| $75,000 to $99,999 | 4,371 (15.9%) | 2,668 (14.6%) |
| $100,000 to $149,999 | 5,647 (20.6%) | 2,117 (11.6%) |
| $150,000 or more | 6,856 (25.0%) | 1,518 (8.3%) |
| Total | 27,443 (100.0%) | 18,314 (100.0%) |
Monthly Housing Cost Tiers in Visalia
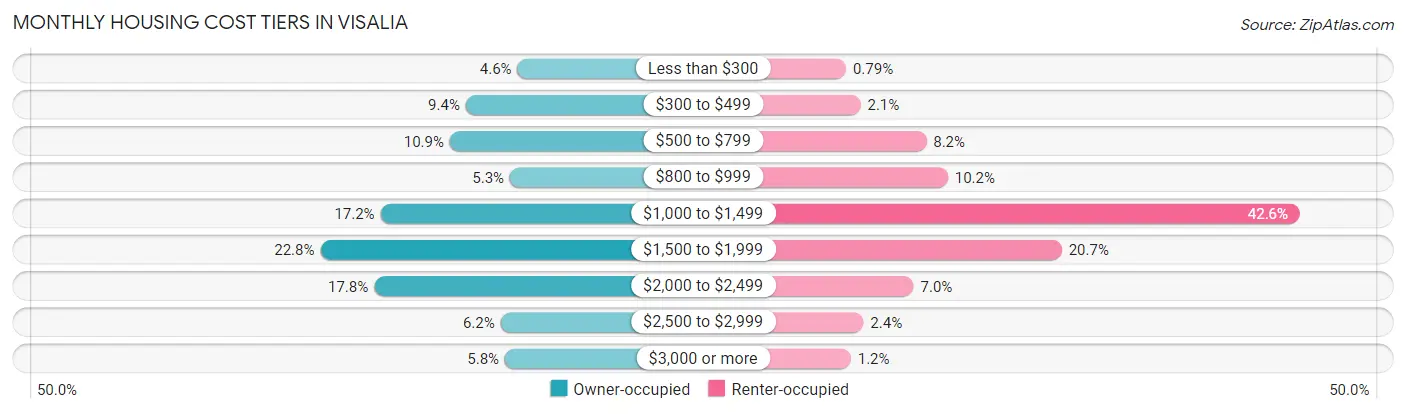
| Monthly Cost | Owner-occupied | Renter-occupied |
| Less than $300 | 1,270 (4.6%) | 144 (0.8%) |
| $300 to $499 | 2,576 (9.4%) | 390 (2.1%) |
| $500 to $799 | 2,980 (10.9%) | 1,499 (8.2%) |
| $800 to $999 | 1,459 (5.3%) | 1,861 (10.2%) |
| $1,000 to $1,499 | 4,731 (17.2%) | 7,797 (42.6%) |
| $1,500 to $1,999 | 6,251 (22.8%) | 3,781 (20.6%) |
| $2,000 to $2,499 | 4,892 (17.8%) | 1,283 (7.0%) |
| $2,500 to $2,999 | 1,697 (6.2%) | 438 (2.4%) |
| $3,000 or more | 1,587 (5.8%) | 225 (1.2%) |
| Total | 27,443 (100.0%) | 18,314 (100.0%) |
Physical Housing Characteristics in Visalia
Housing Structures in Visalia
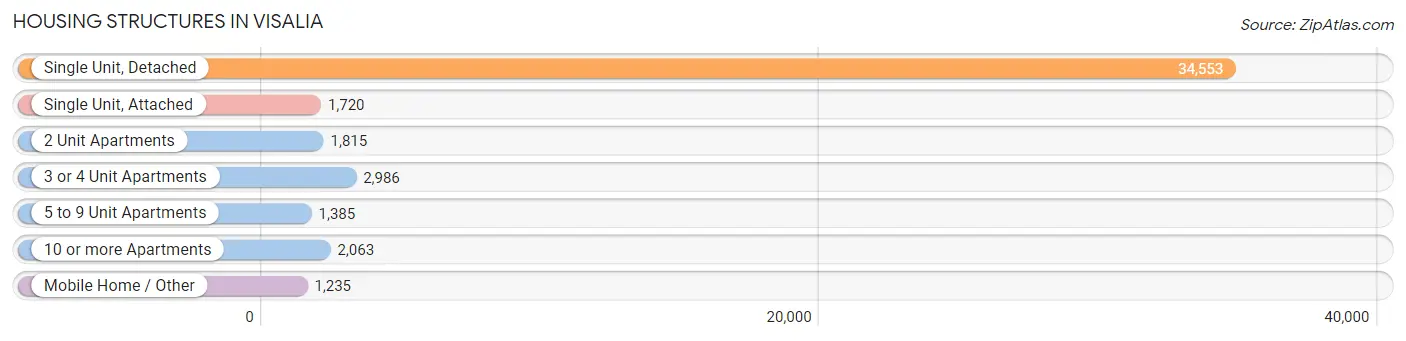
| Structure Type | # Housing Units | % Housing Units |
| Single Unit, Detached | 34,553 | 75.5% |
| Single Unit, Attached | 1,720 | 3.8% |
| 2 Unit Apartments | 1,815 | 4.0% |
| 3 or 4 Unit Apartments | 2,986 | 6.5% |
| 5 to 9 Unit Apartments | 1,385 | 3.0% |
| 10 or more Apartments | 2,063 | 4.5% |
| Mobile Home / Other | 1,235 | 2.7% |
| Total | 45,757 | 100.0% |
Housing Structures by Occupancy in Visalia
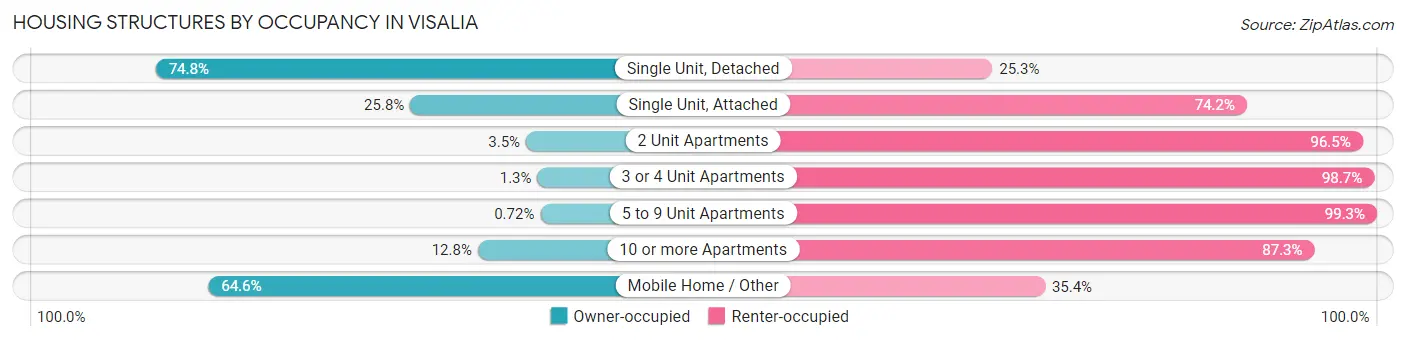
| Structure Type | Owner-occupied | Renter-occupied |
| Single Unit, Detached | 25,828 (74.8%) | 8,725 (25.3%) |
| Single Unit, Attached | 443 (25.8%) | 1,277 (74.2%) |
| 2 Unit Apartments | 63 (3.5%) | 1,752 (96.5%) |
| 3 or 4 Unit Apartments | 38 (1.3%) | 2,948 (98.7%) |
| 5 to 9 Unit Apartments | 10 (0.7%) | 1,375 (99.3%) |
| 10 or more Apartments | 263 (12.8%) | 1,800 (87.3%) |
| Mobile Home / Other | 798 (64.6%) | 437 (35.4%) |
| Total | 27,443 (60.0%) | 18,314 (40.0%) |
Housing Structures by Number of Rooms in Visalia
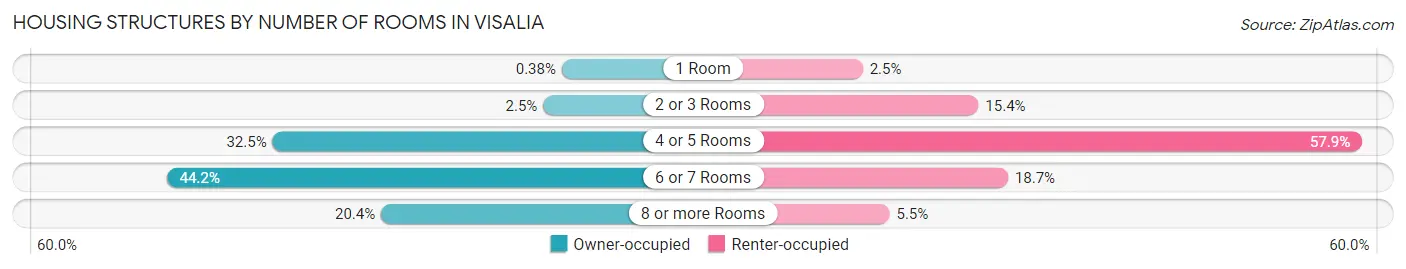
| Number of Rooms | Owner-occupied | Renter-occupied |
| 1 Room | 104 (0.4%) | 464 (2.5%) |
| 2 or 3 Rooms | 671 (2.5%) | 2,814 (15.4%) |
| 4 or 5 Rooms | 8,917 (32.5%) | 10,611 (57.9%) |
| 6 or 7 Rooms | 12,142 (44.2%) | 3,415 (18.6%) |
| 8 or more Rooms | 5,609 (20.4%) | 1,010 (5.5%) |
| Total | 27,443 (100.0%) | 18,314 (100.0%) |
Housing Structure by Heating Type in Visalia
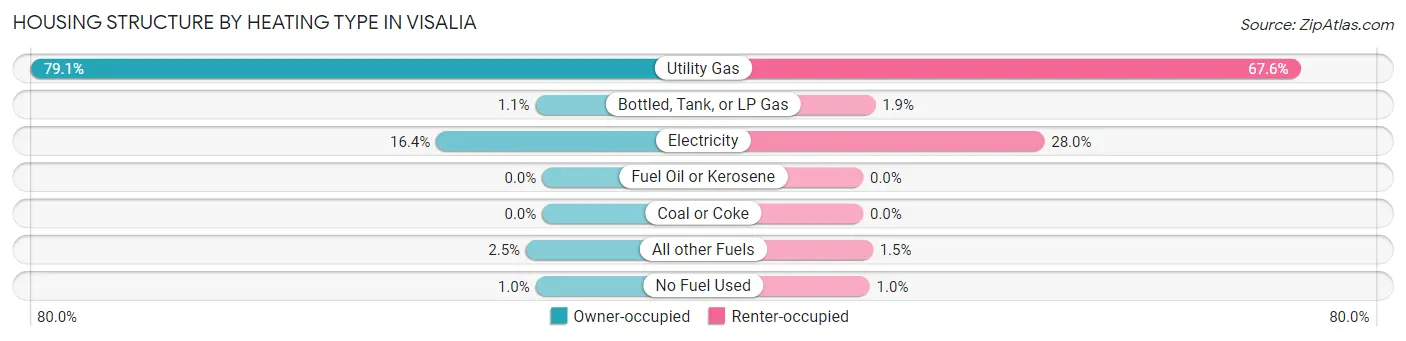
| Heating Type | Owner-occupied | Renter-occupied |
| Utility Gas | 21,693 (79.0%) | 12,378 (67.6%) |
| Bottled, Tank, or LP Gas | 287 (1.1%) | 346 (1.9%) |
| Electricity | 4,495 (16.4%) | 5,131 (28.0%) |
| Fuel Oil or Kerosene | 0 (0.0%) | 0 (0.0%) |
| Coal or Coke | 0 (0.0%) | 0 (0.0%) |
| All other Fuels | 687 (2.5%) | 273 (1.5%) |
| No Fuel Used | 281 (1.0%) | 186 (1.0%) |
| Total | 27,443 (100.0%) | 18,314 (100.0%) |
Household Vehicle Usage in Visalia
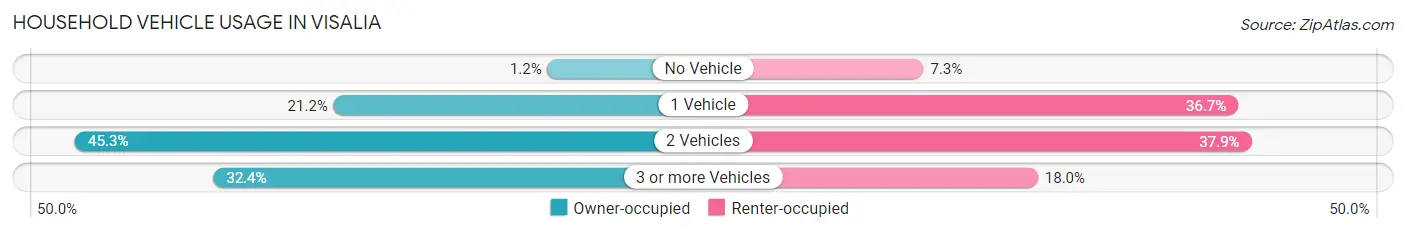
| Vehicles per Household | Owner-occupied | Renter-occupied |
| No Vehicle | 324 (1.2%) | 1,344 (7.3%) |
| 1 Vehicle | 5,804 (21.1%) | 6,722 (36.7%) |
| 2 Vehicles | 12,429 (45.3%) | 6,949 (37.9%) |
| 3 or more Vehicles | 8,886 (32.4%) | 3,299 (18.0%) |
| Total | 27,443 (100.0%) | 18,314 (100.0%) |
Real Estate & Mortgages in Visalia
Real Estate and Mortgage Overview in Visalia
| Characteristic | Without Mortgage | With Mortgage |
| Housing Units | 7,664 | 19,779 |
| Median Property Value | $284,500 | $329,700 |
| Median Household Income | $73,410 | $5,384 |
| Monthly Housing Costs | $514 | $1,581 |
| Real Estate Taxes | $2,012 | $465 |
Property Value by Mortgage Status in Visalia
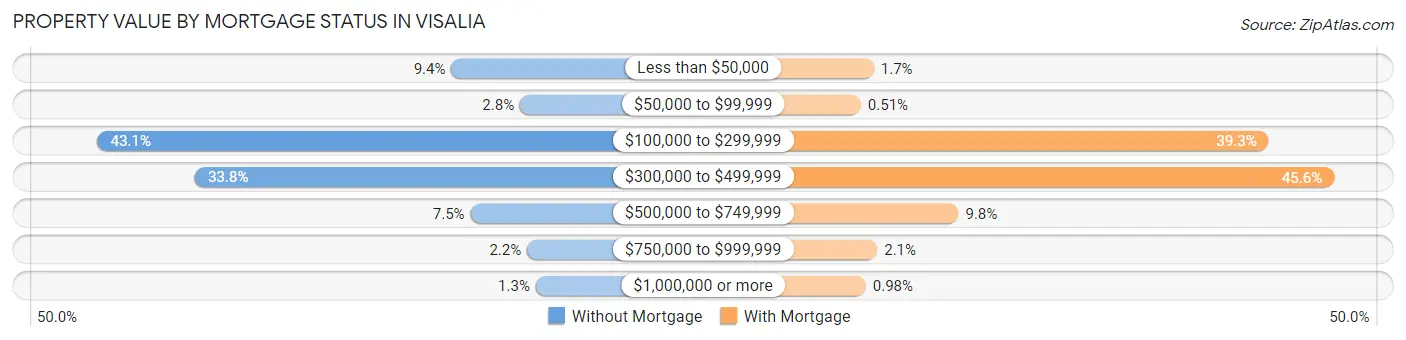
| Property Value | Without Mortgage | With Mortgage |
| Less than $50,000 | 717 (9.4%) | 345 (1.7%) |
| $50,000 to $99,999 | 216 (2.8%) | 100 (0.5%) |
| $100,000 to $299,999 | 3,299 (43.0%) | 7,779 (39.3%) |
| $300,000 to $499,999 | 2,588 (33.8%) | 9,012 (45.6%) |
| $500,000 to $749,999 | 578 (7.5%) | 1,940 (9.8%) |
| $750,000 to $999,999 | 165 (2.1%) | 409 (2.1%) |
| $1,000,000 or more | 101 (1.3%) | 194 (1.0%) |
| Total | 7,664 (100.0%) | 19,779 (100.0%) |
Household Income by Mortgage Status in Visalia
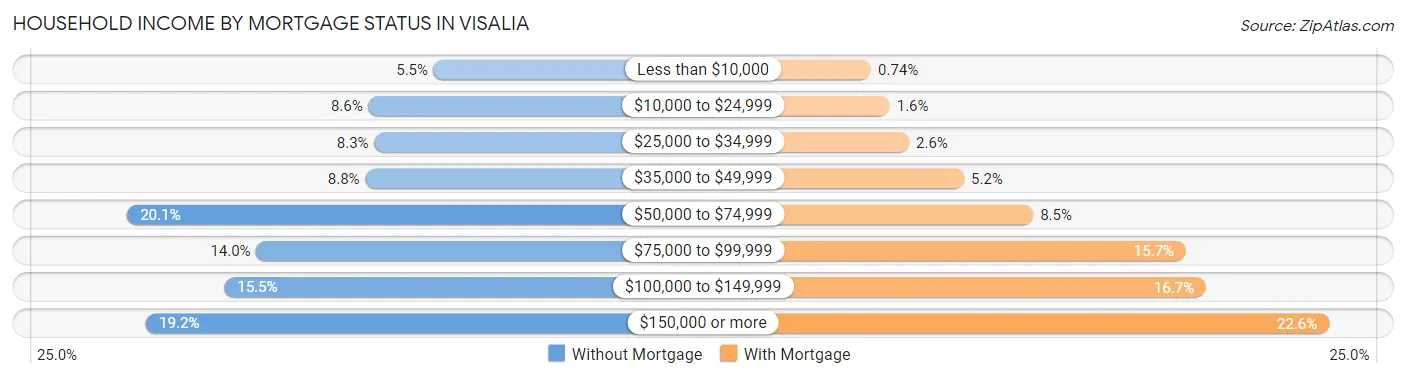
| Household Income | Without Mortgage | With Mortgage |
| Less than $10,000 | 422 (5.5%) | 146 (0.7%) |
| $10,000 to $24,999 | 661 (8.6%) | 322 (1.6%) |
| $25,000 to $34,999 | 639 (8.3%) | 505 (2.5%) |
| $35,000 to $49,999 | 672 (8.8%) | 1,023 (5.2%) |
| $50,000 to $74,999 | 1,541 (20.1%) | 1,673 (8.5%) |
| $75,000 to $99,999 | 1,070 (14.0%) | 3,111 (15.7%) |
| $100,000 to $149,999 | 1,187 (15.5%) | 3,301 (16.7%) |
| $150,000 or more | 1,472 (19.2%) | 4,460 (22.6%) |
| Total | 7,664 (100.0%) | 19,779 (100.0%) |
Property Value to Household Income Ratio in Visalia
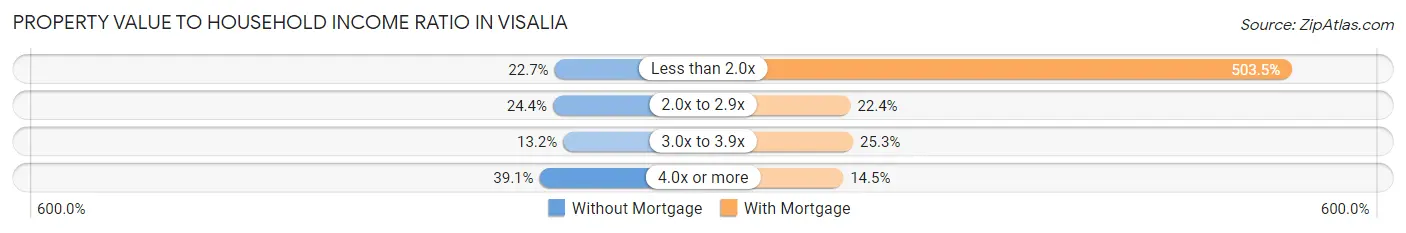
| Value-to-Income Ratio | Without Mortgage | With Mortgage |
| Less than 2.0x | 1,738 (22.7%) | 99,586 (503.5%) |
| 2.0x to 2.9x | 1,872 (24.4%) | 4,427 (22.4%) |
| 3.0x to 3.9x | 1,015 (13.2%) | 5,006 (25.3%) |
| 4.0x or more | 2,997 (39.1%) | 2,871 (14.5%) |
| Total | 7,664 (100.0%) | 19,779 (100.0%) |
Real Estate Taxes by Mortgage Status in Visalia
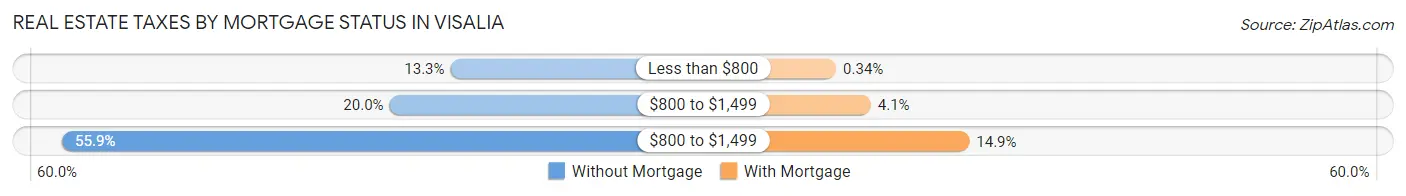
| Property Taxes | Without Mortgage | With Mortgage |
| Less than $800 | 1,022 (13.3%) | 68 (0.3%) |
| $800 to $1,499 | 1,534 (20.0%) | 818 (4.1%) |
| $800 to $1,499 | 4,283 (55.9%) | 2,955 (14.9%) |
| Total | 7,664 (100.0%) | 19,779 (100.0%) |
Health & Disability in Visalia
Health Insurance Coverage by Age in Visalia
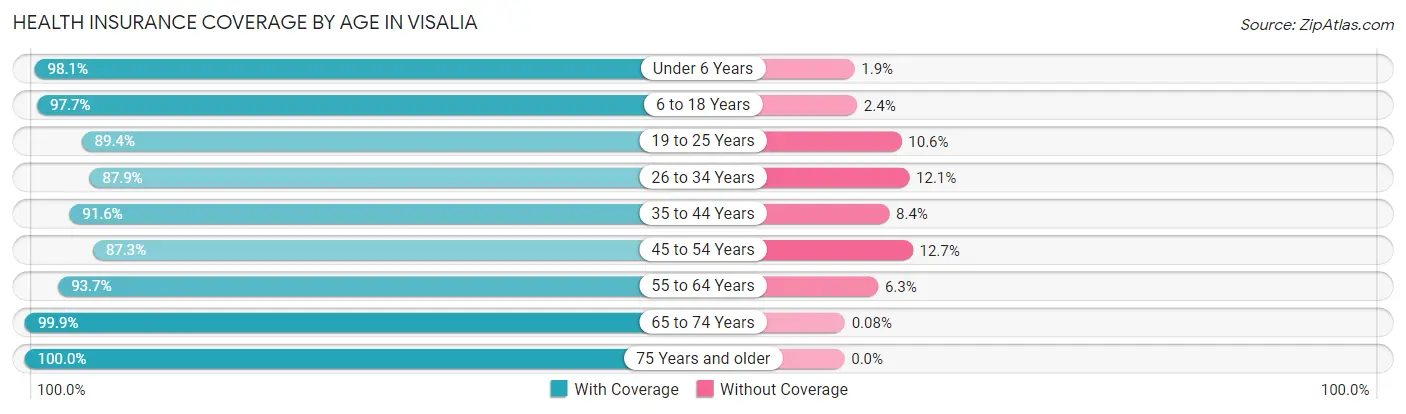
| Age Bracket | With Coverage | Without Coverage |
| Under 6 Years | 13,574 (98.1%) | 259 (1.9%) |
| 6 to 18 Years | 27,490 (97.7%) | 661 (2.4%) |
| 19 to 25 Years | 11,182 (89.4%) | 1,331 (10.6%) |
| 26 to 34 Years | 17,600 (87.9%) | 2,420 (12.1%) |
| 35 to 44 Years | 16,748 (91.6%) | 1,527 (8.4%) |
| 45 to 54 Years | 13,130 (87.3%) | 1,913 (12.7%) |
| 55 to 64 Years | 13,351 (93.7%) | 894 (6.3%) |
| 65 to 74 Years | 11,281 (99.9%) | 9 (0.1%) |
| 75 Years and older | 6,961 (100.0%) | 0 (0.0%) |
| Total | 131,317 (93.6%) | 9,014 (6.4%) |
Health Insurance Coverage by Citizenship Status in Visalia
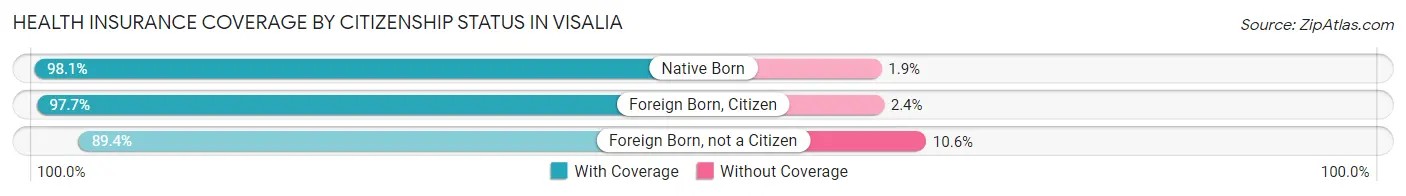
| Citizenship Status | With Coverage | Without Coverage |
| Native Born | 13,574 (98.1%) | 259 (1.9%) |
| Foreign Born, Citizen | 27,490 (97.7%) | 661 (2.4%) |
| Foreign Born, not a Citizen | 11,182 (89.4%) | 1,331 (10.6%) |
Health Insurance Coverage by Household Income in Visalia
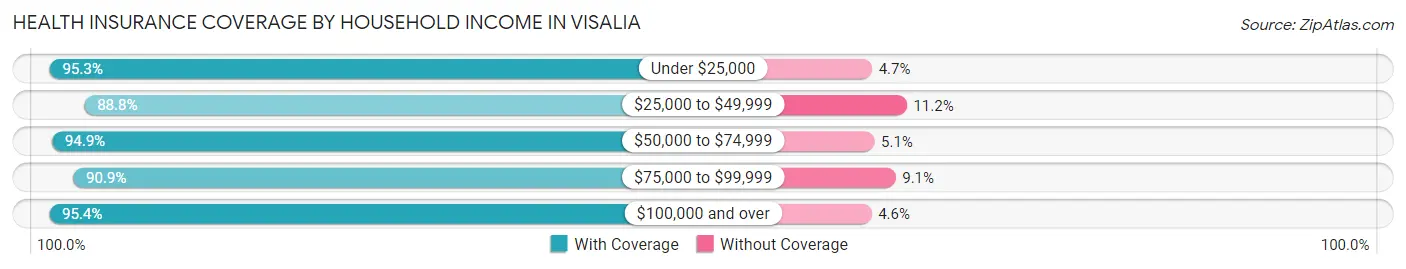
| Household Income | With Coverage | Without Coverage |
| Under $25,000 | 12,018 (95.3%) | 589 (4.7%) |
| $25,000 to $49,999 | 19,759 (88.8%) | 2,488 (11.2%) |
| $50,000 to $74,999 | 24,257 (94.9%) | 1,308 (5.1%) |
| $75,000 to $99,999 | 19,867 (90.9%) | 1,984 (9.1%) |
| $100,000 and over | 54,501 (95.4%) | 2,613 (4.6%) |
Public vs Private Health Insurance Coverage by Age in Visalia
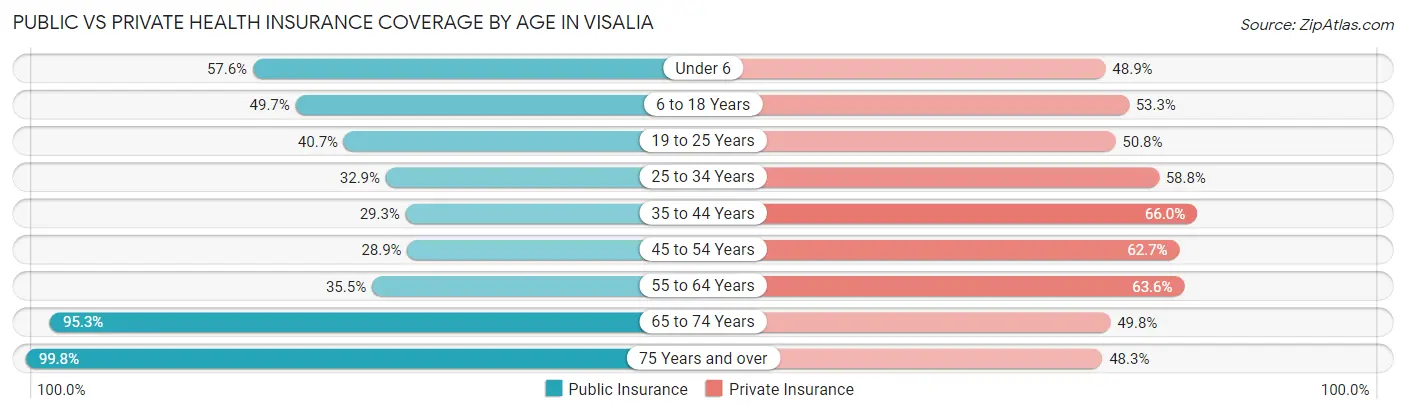
| Age Bracket | Public Insurance | Private Insurance |
| Under 6 | 7,971 (57.6%) | 6,768 (48.9%) |
| 6 to 18 Years | 13,990 (49.7%) | 14,990 (53.2%) |
| 19 to 25 Years | 5,096 (40.7%) | 6,354 (50.8%) |
| 25 to 34 Years | 6,595 (32.9%) | 11,776 (58.8%) |
| 35 to 44 Years | 5,348 (29.3%) | 12,052 (65.9%) |
| 45 to 54 Years | 4,354 (28.9%) | 9,427 (62.7%) |
| 55 to 64 Years | 5,060 (35.5%) | 9,054 (63.6%) |
| 65 to 74 Years | 10,758 (95.3%) | 5,625 (49.8%) |
| 75 Years and over | 6,945 (99.8%) | 3,365 (48.3%) |
| Total | 66,117 (47.1%) | 79,411 (56.6%) |
Disability Status by Sex by Age in Visalia
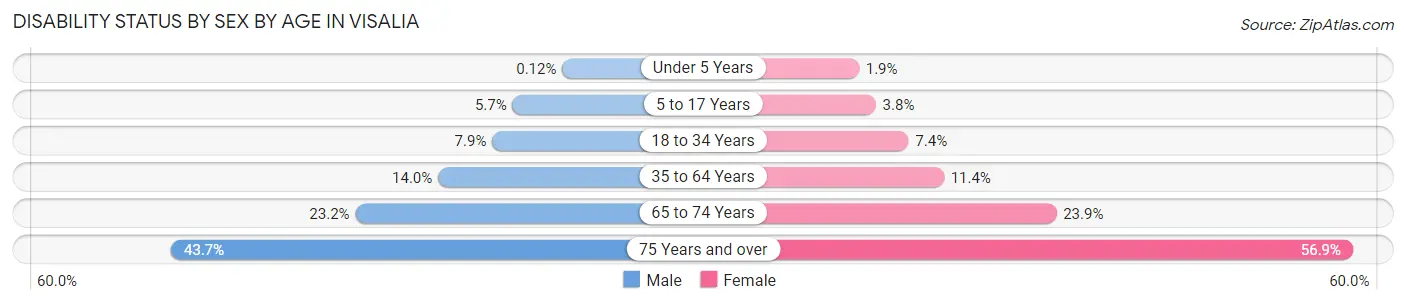
| Age Bracket | Male | Female |
| Under 5 Years | 7 (0.1%) | 98 (1.9%) |
| 5 to 17 Years | 781 (5.7%) | 559 (3.8%) |
| 18 to 34 Years | 1,407 (7.9%) | 1,254 (7.4%) |
| 35 to 64 Years | 3,324 (14.0%) | 2,695 (11.4%) |
| 65 to 74 Years | 1,229 (23.2%) | 1,429 (23.9%) |
| 75 Years and over | 1,240 (43.7%) | 2,347 (56.9%) |
Disability Class by Sex by Age in Visalia
Disability Class: Hearing Difficulty
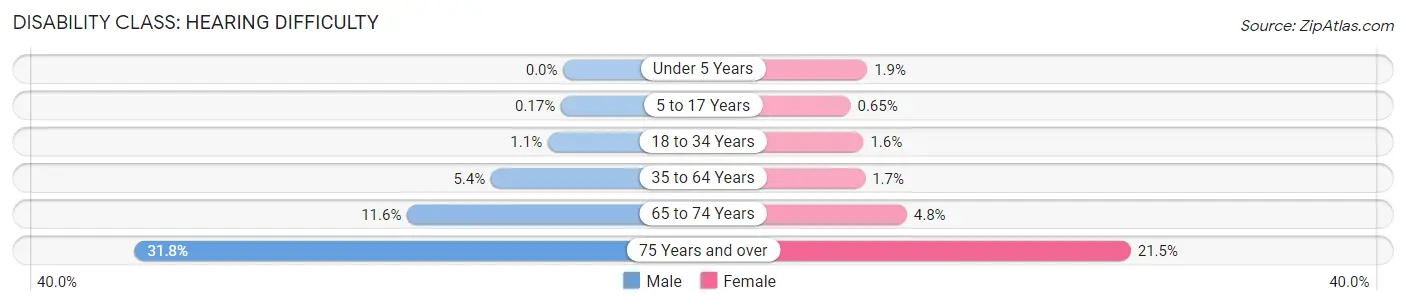
| Age Bracket | Male | Female |
| Under 5 Years | 0 (0.0%) | 98 (1.9%) |
| 5 to 17 Years | 24 (0.2%) | 97 (0.6%) |
| 18 to 34 Years | 202 (1.1%) | 273 (1.6%) |
| 35 to 64 Years | 1,280 (5.4%) | 413 (1.7%) |
| 65 to 74 Years | 615 (11.6%) | 289 (4.8%) |
| 75 Years and over | 903 (31.8%) | 885 (21.5%) |
Disability Class: Vision Difficulty
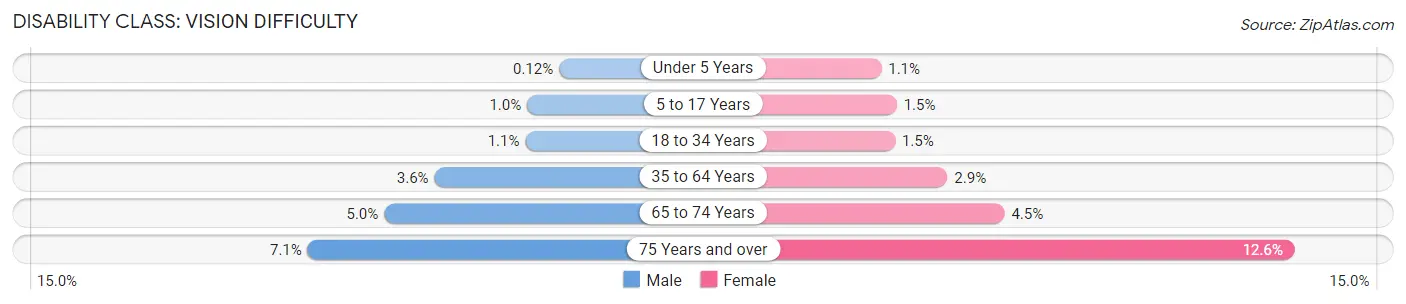
| Age Bracket | Male | Female |
| Under 5 Years | 7 (0.1%) | 57 (1.1%) |
| 5 to 17 Years | 139 (1.0%) | 226 (1.5%) |
| 18 to 34 Years | 188 (1.1%) | 250 (1.5%) |
| 35 to 64 Years | 855 (3.6%) | 699 (2.9%) |
| 65 to 74 Years | 265 (5.0%) | 271 (4.5%) |
| 75 Years and over | 202 (7.1%) | 520 (12.6%) |
Disability Class: Cognitive Difficulty
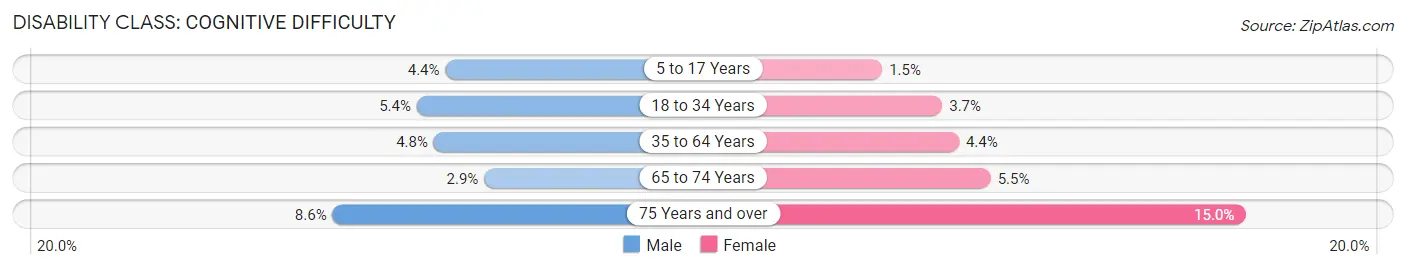
| Age Bracket | Male | Female |
| 5 to 17 Years | 604 (4.4%) | 222 (1.5%) |
| 18 to 34 Years | 966 (5.4%) | 631 (3.7%) |
| 35 to 64 Years | 1,147 (4.8%) | 1,033 (4.3%) |
| 65 to 74 Years | 156 (2.9%) | 331 (5.5%) |
| 75 Years and over | 243 (8.6%) | 619 (15.0%) |
Disability Class: Ambulatory Difficulty
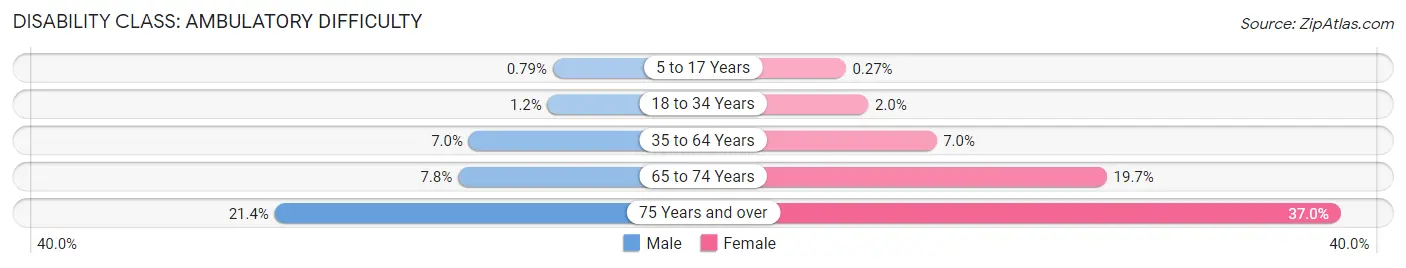
| Age Bracket | Male | Female |
| 5 to 17 Years | 109 (0.8%) | 40 (0.3%) |
| 18 to 34 Years | 208 (1.2%) | 330 (1.9%) |
| 35 to 64 Years | 1,673 (7.0%) | 1,665 (7.0%) |
| 65 to 74 Years | 415 (7.8%) | 1,176 (19.7%) |
| 75 Years and over | 608 (21.4%) | 1,527 (37.0%) |
Disability Class: Self-Care Difficulty
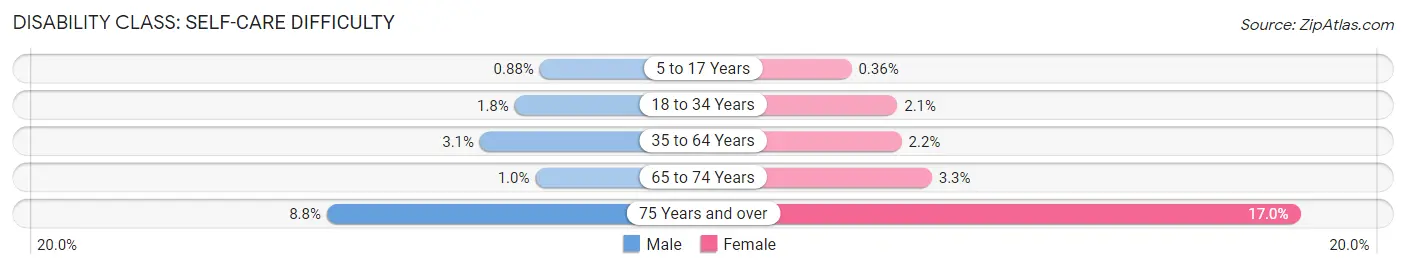
| Age Bracket | Male | Female |
| 5 to 17 Years | 121 (0.9%) | 53 (0.4%) |
| 18 to 34 Years | 321 (1.8%) | 349 (2.1%) |
| 35 to 64 Years | 739 (3.1%) | 527 (2.2%) |
| 65 to 74 Years | 55 (1.0%) | 200 (3.3%) |
| 75 Years and over | 249 (8.8%) | 702 (17.0%) |
Technology Access in Visalia
Computing Device Access in Visalia
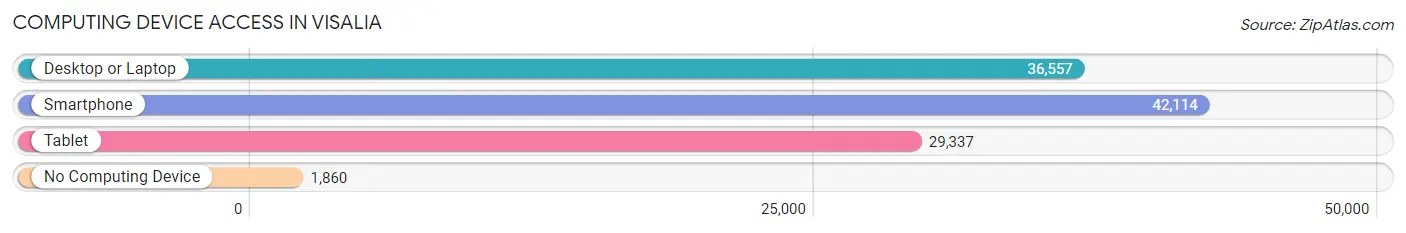
| Device Type | # Households | % Households |
| Desktop or Laptop | 36,557 | 79.9% |
| Smartphone | 42,114 | 92.0% |
| Tablet | 29,337 | 64.1% |
| No Computing Device | 1,860 | 4.1% |
| Total | 45,757 | 100.0% |
Internet Access in Visalia
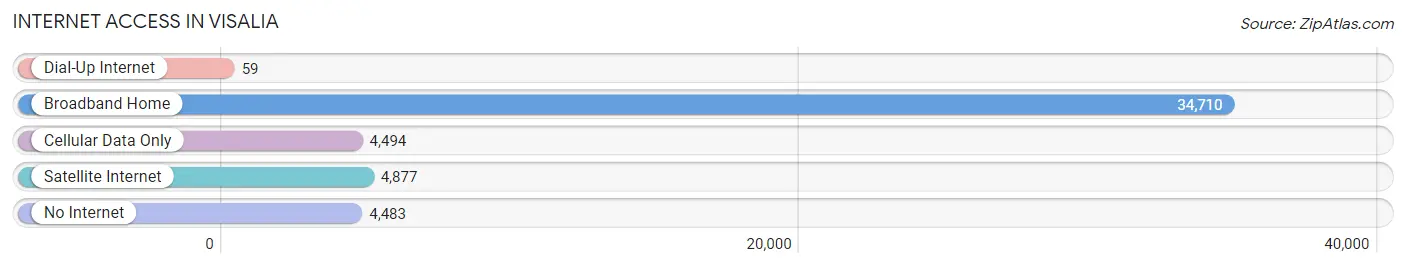
| Internet Type | # Households | % Households |
| Dial-Up Internet | 59 | 0.1% |
| Broadband Home | 34,710 | 75.9% |
| Cellular Data Only | 4,494 | 9.8% |
| Satellite Internet | 4,877 | 10.7% |
| No Internet | 4,483 | 9.8% |
| Total | 45,757 | 100.0% |
Visalia Summary
Visalia, California is a city located in the San Joaquin Valley of California, approximately 230 miles southeast of San Francisco and 190 miles north of Los Angeles. It is the county seat of Tulare County and the largest city in the county. As of the 2010 census, the population of Visalia was 122,087, making it the fifth largest city in the Central Valley.
History
Visalia was founded in 1852 by Nathaniel Vise, a former Texas Ranger. Vise named the city after his hometown of Visalia, Kentucky. The city was incorporated in 1874 and quickly became a major agricultural center in the San Joaquin Valley. The city was known for its production of cotton, wheat, and fruit. In the late 19th century, Visalia was a major stop on the Butterfield Overland Mail stagecoach route.
Geography
Visalia is located in the San Joaquin Valley of California, approximately 230 miles southeast of San Francisco and 190 miles north of Los Angeles. The city is situated at the base of the Sierra Nevada mountain range and is surrounded by agricultural land. The city has a total area of 28.3 square miles, of which 28.2 square miles is land and 0.1 square miles is water.
Economy
Visalia’s economy is largely based on agriculture. The city is home to a number of large agricultural companies, including Grimmway Farms, Sun-Maid Growers of California, and Chiquita Brands International. The city is also home to a number of manufacturing companies, including Visalia Manufacturing, Inc., and Visalia Machine Works. In addition, the city is home to a number of retail stores, restaurants, and other businesses.
Demographics
As of the 2010 census, the population of Visalia was 122,087, making it the fifth largest city in the Central Valley. The population is composed of 54.3% White, 3.2% African American, 1.2% Native American, 1.7% Asian, 0.2% Pacific Islander, and 37.2% from other races. The median household income is $45,837 and the median family income is $51,817. The per capita income is $20,845. The city has a poverty rate of 22.3%.
Visalia is home to a number of educational institutions, including College of the Sequoias, California State University, Fresno, and University of California, Merced. The city is also home to a number of cultural attractions, including the Fox Theatre, the Visalia Fox Theatre, and the Visalia Convention Center.
Common Questions
What is Per Capita Income in Visalia?
Per Capita income in Visalia is $32,788.
What is the Median Family Income in Visalia?
Median Family Income in Visalia is $80,428.
What is the Median Household income in Visalia?
Median Household Income in Visalia is $75,658.
What is Income or Wage Gap in Visalia?
Income or Wage Gap in Visalia is 29.8%.
Women in Visalia earn 70.2 cents for every dollar earned by a man.
What is Family Income Deficit in Visalia?
Family Income Deficit in Visalia is $12,838.
Families that are below poverty line in Visalia earn $12,838 less on average than the poverty threshold level.
What is Inequality or Gini Index in Visalia?
Inequality or Gini Index in Visalia is 0.43.
What is the Total Population of Visalia?
Total Population of Visalia is 141,466.
What is the Total Male Population of Visalia?
Total Male Population of Visalia is 70,297.
What is the Total Female Population of Visalia?
Total Female Population of Visalia is 71,169.
What is the Ratio of Males per 100 Females in Visalia?
There are 98.77 Males per 100 Females in Visalia.
What is the Ratio of Females per 100 Males in Visalia?
There are 101.24 Females per 100 Males in Visalia.
What is the Median Population Age in Visalia?
Median Population Age in Visalia is 33.0 Years.
What is the Average Family Size in Visalia
Average Family Size in Visalia is 3.5 People.
What is the Average Household Size in Visalia
Average Household Size in Visalia is 3.0 People.
How Large is the Labor Force in Visalia?
There are 66,743 People in the Labor Forcein in Visalia.
What is the Percentage of People in the Labor Force in Visalia?
63.4% of People are in the Labor Force in Visalia.
What is the Unemployment Rate in Visalia?
Unemployment Rate in Visalia is 5.6%.