Salem, OR Map & Demographics
Salem Map
Salem Overview
$35,469
PER CAPITA INCOME
$83,692
AVG FAMILY INCOME
$67,540
AVG HOUSEHOLD INCOME
17.5%
WAGE / INCOME GAP [ % ]
82.5¢/ $1
WAGE / INCOME GAP [ $ ]
$10,057
FAMILY INCOME DEFICIT
0.45
INEQUALITY / GINI INDEX
175,754
TOTAL POPULATION
88,963
MALE POPULATION
86,791
FEMALE POPULATION
102.50
MALES / 100 FEMALES
97.56
FEMALES / 100 MALES
35.9
MEDIAN AGE
3.1
AVG FAMILY SIZE
2.5
AVG HOUSEHOLD SIZE
85,738
LABOR FORCE [ PEOPLE ]
61.3%
PERCENT IN LABOR FORCE
6.1%
UNEMPLOYMENT RATE
Income in Salem
Income Overview in Salem
Per Capita Income in Salem is $35,469, while median incomes of families and households are $83,692 and $67,540 respectively.
| Characteristic | Number | Measure |
| Per Capita Income | 175,754 | $35,469 |
| Median Family Income | 40,964 | $83,692 |
| Mean Family Income | 40,964 | $106,073 |
| Median Household Income | 66,283 | $67,540 |
| Mean Household Income | 66,283 | $91,240 |
| Income Deficit | 40,964 | $10,057 |
| Wage / Income Gap (%) | 175,754 | 17.49% |
| Wage / Income Gap ($) | 175,754 | 82.51¢ per $1 |
| Gini / Inequality Index | 175,754 | 0.45 |
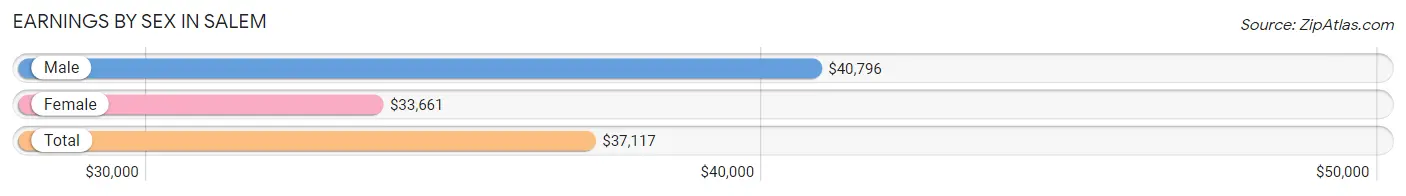
Earnings by Sex in Salem
Average Earnings in Salem are $37,117, $40,796 for men and $33,661 for women, a difference of 17.5%.
| Sex | Number | Average Earnings |
| Male | 48,515 (52.7%) | $40,796 |
| Female | 43,601 (47.3%) | $33,661 |
| Total | 92,116 (100.0%) | $37,117 |
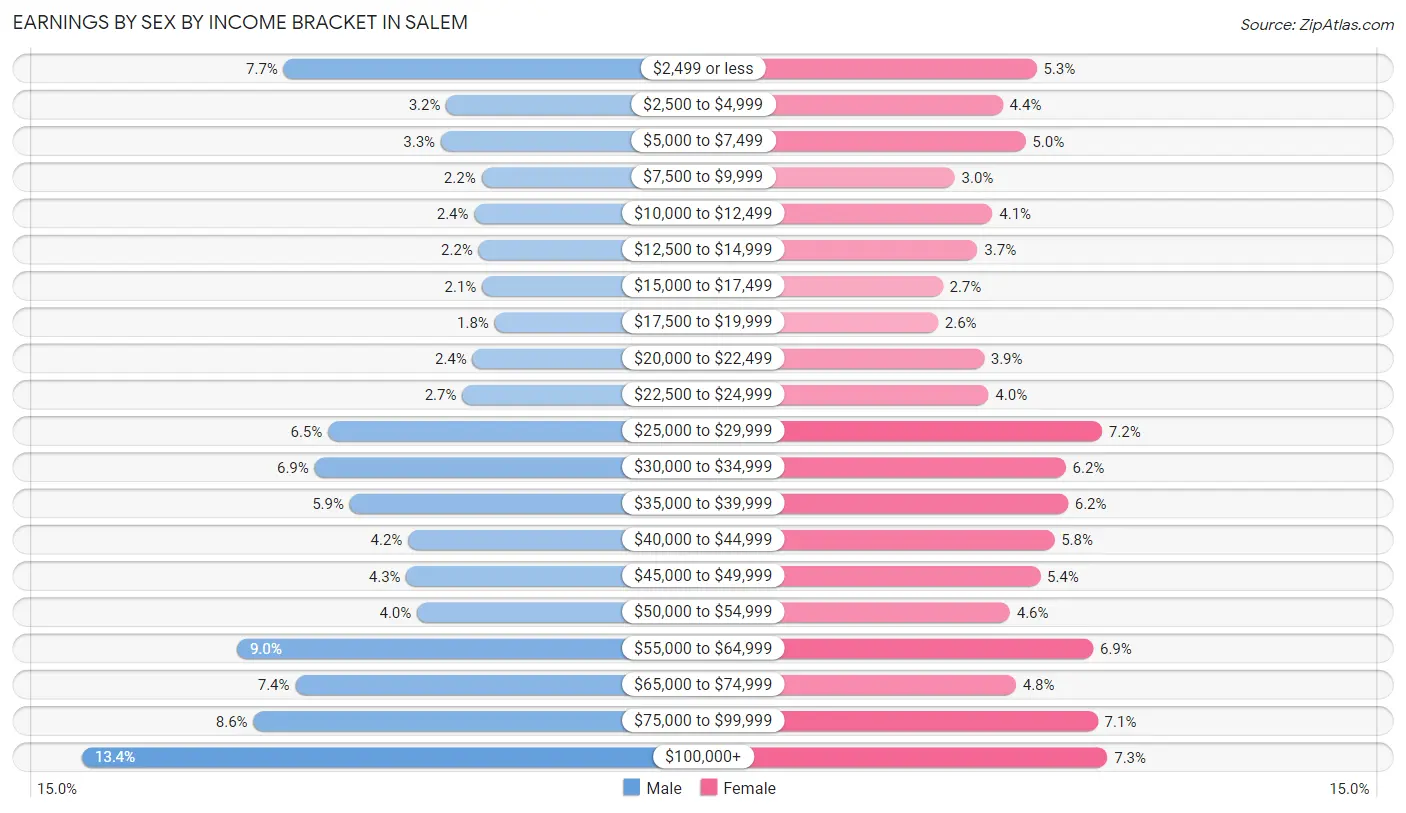
Earnings by Sex by Income Bracket in Salem
The most common earnings brackets in Salem are $100,000+ for men (6,495 | 13.4%) and $100,000+ for women (3,191 | 7.3%).
| Income | Male | Female |
| $2,499 or less | 3,747 (7.7%) | 2,324 (5.3%) |
| $2,500 to $4,999 | 1,529 (3.2%) | 1,909 (4.4%) |
| $5,000 to $7,499 | 1,601 (3.3%) | 2,188 (5.0%) |
| $7,500 to $9,999 | 1,049 (2.2%) | 1,322 (3.0%) |
| $10,000 to $12,499 | 1,145 (2.4%) | 1,784 (4.1%) |
| $12,500 to $14,999 | 1,088 (2.2%) | 1,601 (3.7%) |
| $15,000 to $17,499 | 1,038 (2.1%) | 1,175 (2.7%) |
| $17,500 to $19,999 | 867 (1.8%) | 1,115 (2.6%) |
| $20,000 to $22,499 | 1,168 (2.4%) | 1,677 (3.8%) |
| $22,500 to $24,999 | 1,308 (2.7%) | 1,735 (4.0%) |
| $25,000 to $29,999 | 3,141 (6.5%) | 3,127 (7.2%) |
| $30,000 to $34,999 | 3,322 (6.9%) | 2,680 (6.1%) |
| $35,000 to $39,999 | 2,843 (5.9%) | 2,707 (6.2%) |
| $40,000 to $44,999 | 2,047 (4.2%) | 2,542 (5.8%) |
| $45,000 to $49,999 | 2,073 (4.3%) | 2,368 (5.4%) |
| $50,000 to $54,999 | 1,924 (4.0%) | 1,995 (4.6%) |
| $55,000 to $64,999 | 4,383 (9.0%) | 3,016 (6.9%) |
| $65,000 to $74,999 | 3,587 (7.4%) | 2,072 (4.8%) |
| $75,000 to $99,999 | 4,160 (8.6%) | 3,073 (7.0%) |
| $100,000+ | 6,495 (13.4%) | 3,191 (7.3%) |
| Total | 48,515 (100.0%) | 43,601 (100.0%) |
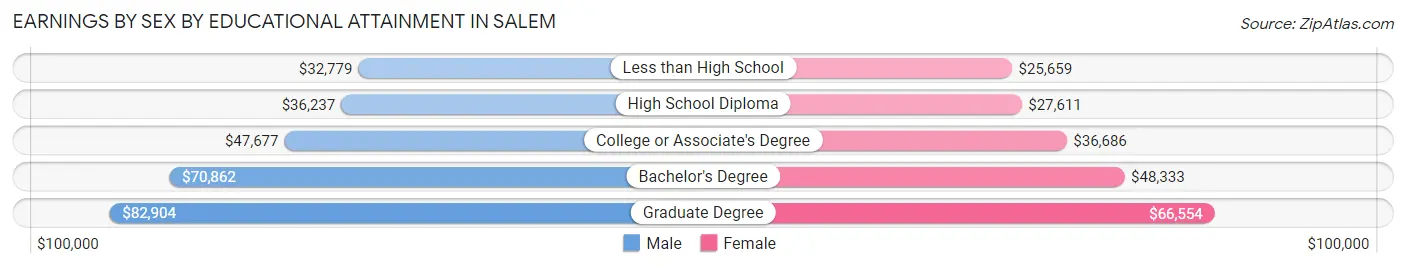
Earnings by Sex by Educational Attainment in Salem
Average earnings in Salem are $47,937 for men and $39,287 for women, a difference of 18.0%. Men with an educational attainment of graduate degree enjoy the highest average annual earnings of $82,904, while those with less than high school education earn the least with $32,779. Women with an educational attainment of graduate degree earn the most with the average annual earnings of $66,554, while those with less than high school education have the smallest earnings of $25,659.
| Educational Attainment | Male Income | Female Income |
| Less than High School | $32,779 | $25,659 |
| High School Diploma | $36,237 | $27,611 |
| College or Associate's Degree | $47,677 | $36,686 |
| Bachelor's Degree | $70,862 | $48,333 |
| Graduate Degree | $82,904 | $66,554 |
| Total | $47,937 | $39,287 |
Family Income in Salem
Family Income Brackets in Salem
According to the Salem family income data, there are 8,807 families falling into the $100,000 to $149,999 income range, which is the most common income bracket and makes up 21.5% of all families. Conversely, the $10,000 to $14,999 income bracket is the least frequent group with only 819 families (2.0%) belonging to this category.
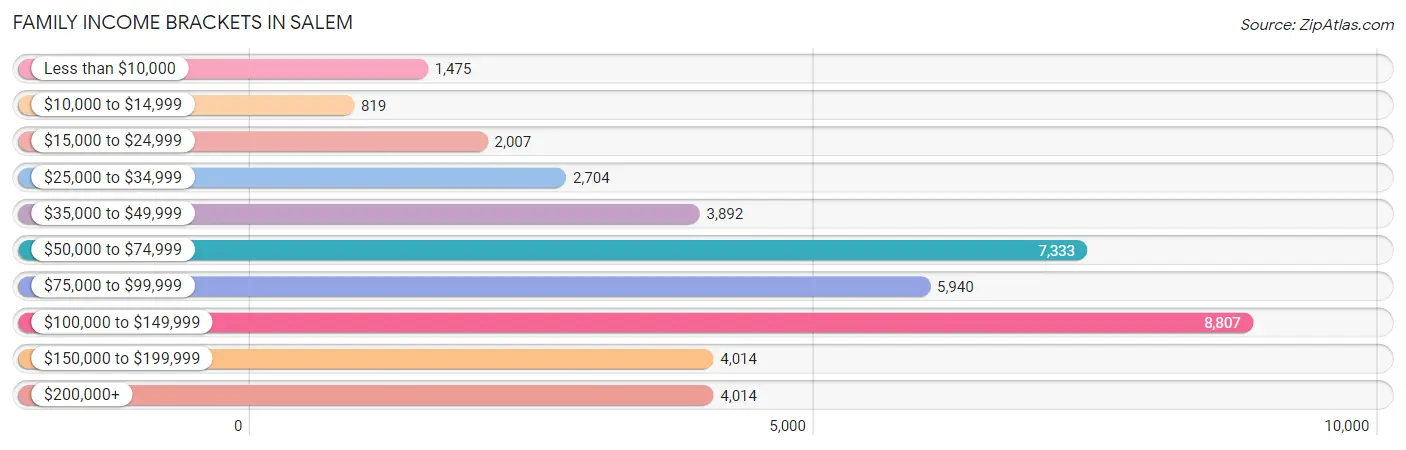
| Income Bracket | # Families | % Families |
| Less than $10,000 | 1,475 | 3.6% |
| $10,000 to $14,999 | 819 | 2.0% |
| $15,000 to $24,999 | 2,007 | 4.9% |
| $25,000 to $34,999 | 2,704 | 6.6% |
| $35,000 to $49,999 | 3,892 | 9.5% |
| $50,000 to $74,999 | 7,333 | 17.9% |
| $75,000 to $99,999 | 5,940 | 14.5% |
| $100,000 to $149,999 | 8,807 | 21.5% |
| $150,000 to $199,999 | 4,014 | 9.8% |
| $200,000+ | 4,014 | 9.8% |
Family Income by Famaliy Size in Salem
4-person families (6,689 | 16.3%) account for the highest median family income in Salem with $110,074 per family, while 2-person families (19,883 | 48.5%) have the highest median income of $38,151 per family member.
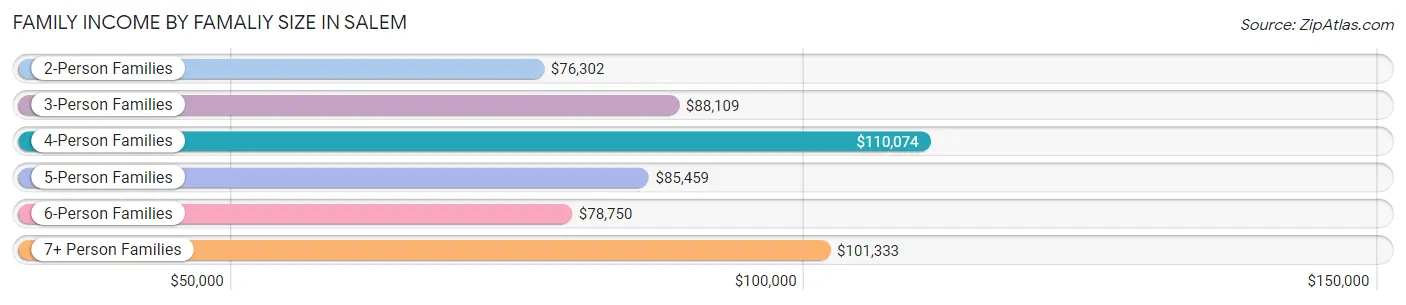
| Income Bracket | # Families | Median Income |
| 2-Person Families | 19,883 (48.5%) | $76,302 |
| 3-Person Families | 8,444 (20.6%) | $88,109 |
| 4-Person Families | 6,689 (16.3%) | $110,074 |
| 5-Person Families | 3,400 (8.3%) | $85,459 |
| 6-Person Families | 1,636 (4.0%) | $78,750 |
| 7+ Person Families | 912 (2.2%) | $101,333 |
| Total | 40,964 (100.0%) | $83,692 |
Family Income by Number of Earners in Salem
The median family income in Salem is $83,692, with families comprising 3+ earners (4,145) having the highest median family income of $118,817, while families with no earners (6,224) have the lowest median family income of $54,728, accounting for 10.1% and 15.2% of families, respectively.
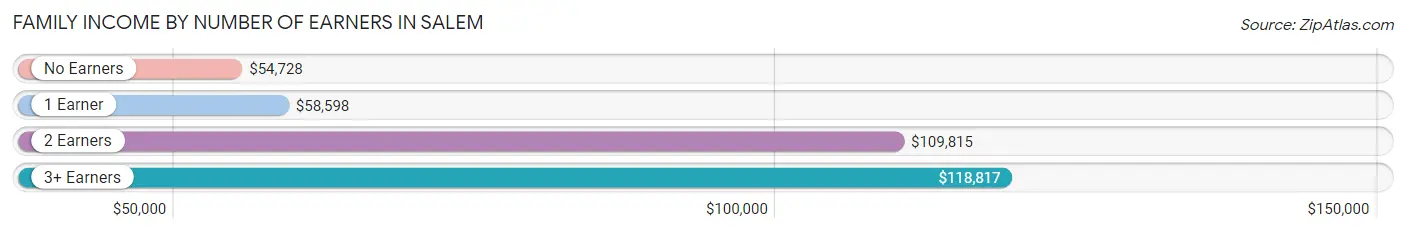
| Number of Earners | # Families | Median Income |
| No Earners | 6,224 (15.2%) | $54,728 |
| 1 Earner | 13,873 (33.9%) | $58,598 |
| 2 Earners | 16,722 (40.8%) | $109,815 |
| 3+ Earners | 4,145 (10.1%) | $118,817 |
| Total | 40,964 (100.0%) | $83,692 |
Household Income in Salem
Household Income Brackets in Salem
With 12,527 households falling in the category, the $50,000 to $74,999 income range is the most frequent in Salem, accounting for 18.9% of all households. In contrast, only 2,718 households (4.1%) fall into the $10,000 to $14,999 income bracket, making it the least populous group.
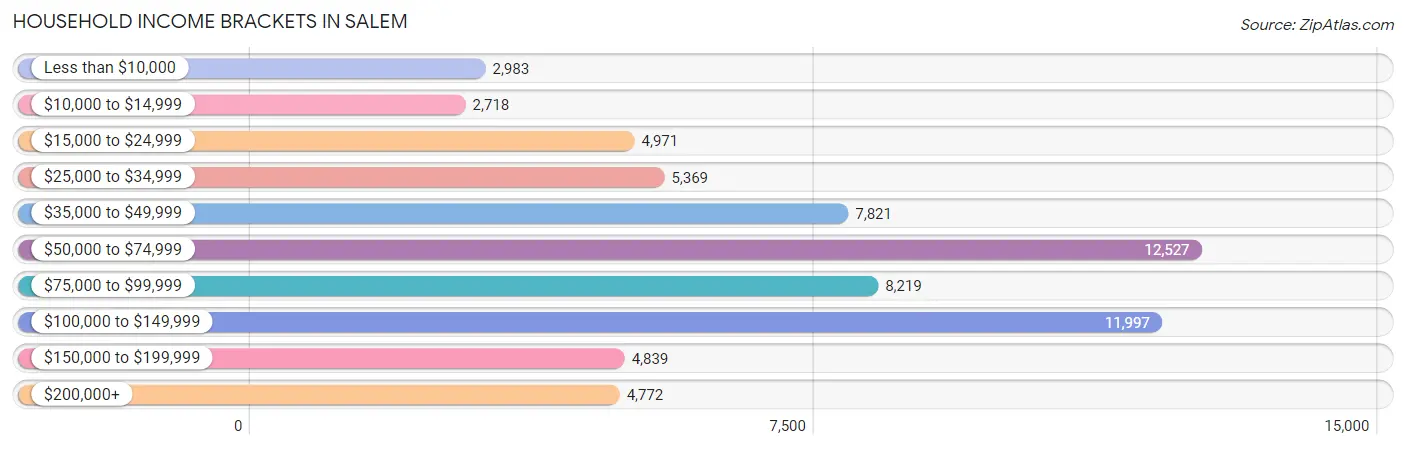
| Income Bracket | # Households | % Households |
| Less than $10,000 | 2,983 | 4.5% |
| $10,000 to $14,999 | 2,718 | 4.1% |
| $15,000 to $24,999 | 4,971 | 7.5% |
| $25,000 to $34,999 | 5,369 | 8.1% |
| $35,000 to $49,999 | 7,821 | 11.8% |
| $50,000 to $74,999 | 12,527 | 18.9% |
| $75,000 to $99,999 | 8,219 | 12.4% |
| $100,000 to $149,999 | 11,997 | 18.1% |
| $150,000 to $199,999 | 4,839 | 7.3% |
| $200,000+ | 4,772 | 7.2% |
Household Income by Householder Age in Salem
The median household income in Salem is $67,540, with the highest median household income of $80,663 found in the 45 to 64 years age bracket for the primary householder. A total of 21,849 households (33.0%) fall into this category. Meanwhile, the 15 to 24 years age bracket for the primary householder has the lowest median household income of $41,801, with 3,735 households (5.6%) in this group.
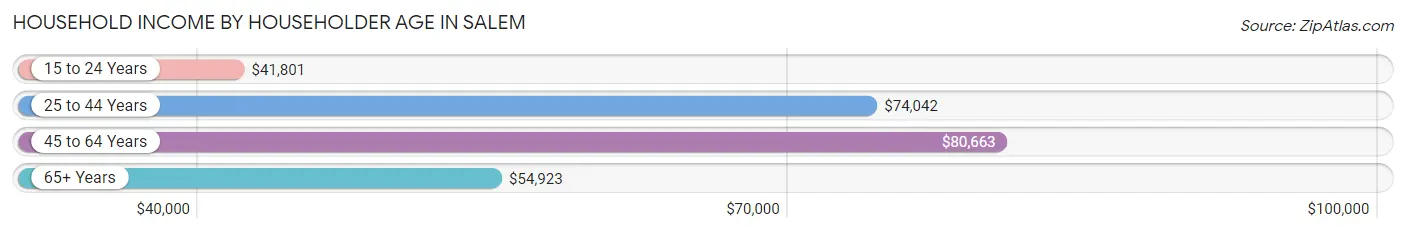
| Income Bracket | # Households | Median Income |
| 15 to 24 Years | 3,735 (5.6%) | $41,801 |
| 25 to 44 Years | 23,644 (35.7%) | $74,042 |
| 45 to 64 Years | 21,849 (33.0%) | $80,663 |
| 65+ Years | 17,055 (25.7%) | $54,923 |
| Total | 66,283 (100.0%) | $67,540 |
Poverty in Salem
Income Below Poverty by Sex and Age in Salem
With 13.7% poverty level for males and 15.5% for females among the residents of Salem, 18 to 24 year old males and under 5 year old females are the most vulnerable to poverty, with 1,714 males (22.8%) and 1,208 females (27.0%) in their respective age groups living below the poverty level.
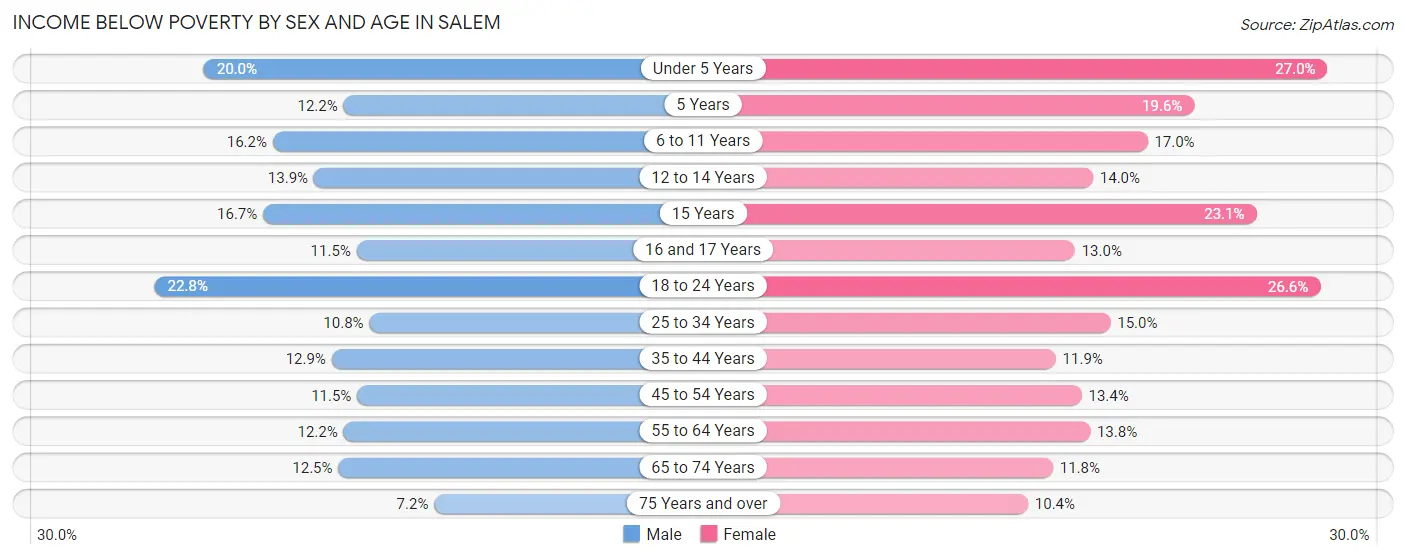
| Age Bracket | Male | Female |
| Under 5 Years | 1,172 (20.0%) | 1,208 (27.0%) |
| 5 Years | 159 (12.2%) | 176 (19.6%) |
| 6 to 11 Years | 1,187 (16.2%) | 991 (17.0%) |
| 12 to 14 Years | 434 (13.9%) | 515 (14.0%) |
| 15 Years | 229 (16.7%) | 237 (23.1%) |
| 16 and 17 Years | 292 (11.5%) | 303 (13.0%) |
| 18 to 24 Years | 1,714 (22.8%) | 2,047 (26.6%) |
| 25 to 34 Years | 1,422 (10.8%) | 1,963 (14.9%) |
| 35 to 44 Years | 1,466 (12.9%) | 1,362 (11.9%) |
| 45 to 54 Years | 1,099 (11.5%) | 1,245 (13.4%) |
| 55 to 64 Years | 1,102 (12.2%) | 1,360 (13.8%) |
| 65 to 74 Years | 858 (12.5%) | 1,039 (11.7%) |
| 75 Years and over | 307 (7.2%) | 631 (10.4%) |
| Total | 11,441 (13.7%) | 13,077 (15.5%) |
Income Above Poverty by Sex and Age in Salem
According to the poverty statistics in Salem, males aged 75 years and over and females aged 75 years and over are the age groups that are most secure financially, with 92.8% of males and 89.6% of females in these age groups living above the poverty line.
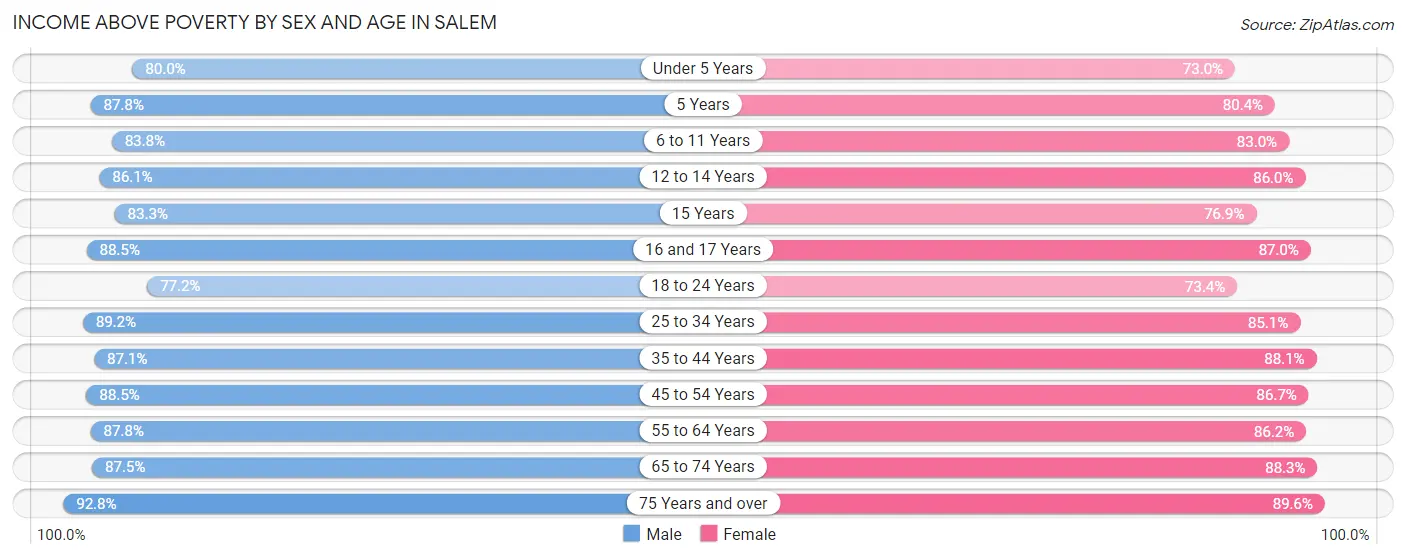
| Age Bracket | Male | Female |
| Under 5 Years | 4,681 (80.0%) | 3,260 (73.0%) |
| 5 Years | 1,140 (87.8%) | 721 (80.4%) |
| 6 to 11 Years | 6,148 (83.8%) | 4,831 (83.0%) |
| 12 to 14 Years | 2,690 (86.1%) | 3,170 (86.0%) |
| 15 Years | 1,141 (83.3%) | 790 (76.9%) |
| 16 and 17 Years | 2,244 (88.5%) | 2,034 (87.0%) |
| 18 to 24 Years | 5,818 (77.2%) | 5,641 (73.4%) |
| 25 to 34 Years | 11,745 (89.2%) | 11,167 (85.1%) |
| 35 to 44 Years | 9,902 (87.1%) | 10,070 (88.1%) |
| 45 to 54 Years | 8,477 (88.5%) | 8,083 (86.7%) |
| 55 to 64 Years | 7,901 (87.8%) | 8,478 (86.2%) |
| 65 to 74 Years | 5,990 (87.5%) | 7,805 (88.2%) |
| 75 Years and over | 3,961 (92.8%) | 5,462 (89.6%) |
| Total | 71,838 (86.3%) | 71,512 (84.5%) |
Income Below Poverty Among Married-Couple Families in Salem
The poverty statistics for married-couple families in Salem show that 5.3% or 1,517 of the total 28,607 families live below the poverty line. Families with 3 or 4 children have the highest poverty rate of 18.5%, comprising of 560 families. On the other hand, families with 5 or more children have the lowest poverty rate of 0.0%, which includes 0 families.
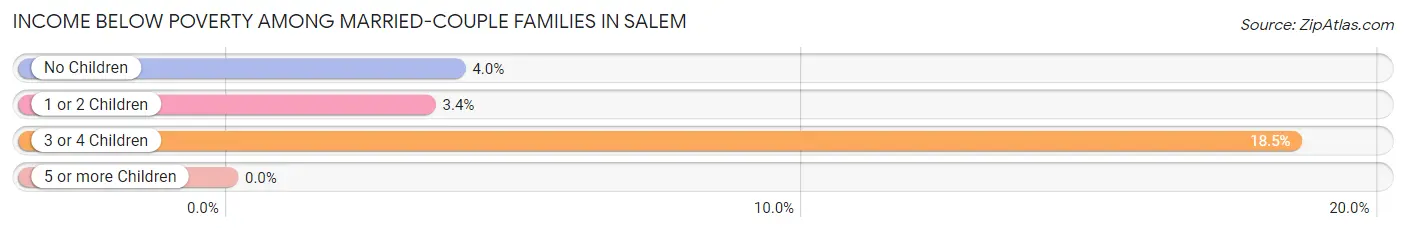
| Children | Above Poverty | Below Poverty |
| No Children | 15,701 (96.0%) | 648 (4.0%) |
| 1 or 2 Children | 8,662 (96.6%) | 309 (3.4%) |
| 3 or 4 Children | 2,462 (81.5%) | 560 (18.5%) |
| 5 or more Children | 265 (100.0%) | 0 (0.0%) |
| Total | 27,090 (94.7%) | 1,517 (5.3%) |
Income Below Poverty Among Single-Parent Households in Salem
According to the poverty data in Salem, 16.5% or 545 single-father households and 24.9% or 2,252 single-mother households are living below the poverty line. Among single-father households, those with 5 or more children have the highest poverty rate, with 26 households (100.0%) experiencing poverty. Likewise, among single-mother households, those with 1 or 2 children have the highest poverty rate, with 1,701 households (34.7%) falling below the poverty line.
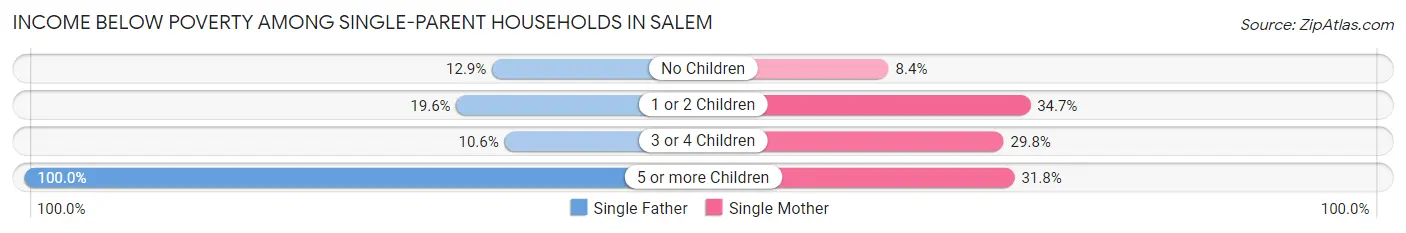
| Children | Single Father | Single Mother |
| No Children | 127 (12.9%) | 270 (8.4%) |
| 1 or 2 Children | 326 (19.6%) | 1,701 (34.7%) |
| 3 or 4 Children | 66 (10.6%) | 267 (29.8%) |
| 5 or more Children | 26 (100.0%) | 14 (31.8%) |
| Total | 545 (16.5%) | 2,252 (24.9%) |
Income Below Poverty Among Married-Couple vs Single-Parent Households in Salem
The poverty data for Salem shows that 1,517 of the married-couple family households (5.3%) and 2,797 of the single-parent households (22.6%) are living below the poverty level. Within the married-couple family households, those with 3 or 4 children have the highest poverty rate, with 560 households (18.5%) falling below the poverty line. Among the single-parent households, those with 5 or more children have the highest poverty rate, with 40 household (57.1%) living below poverty.
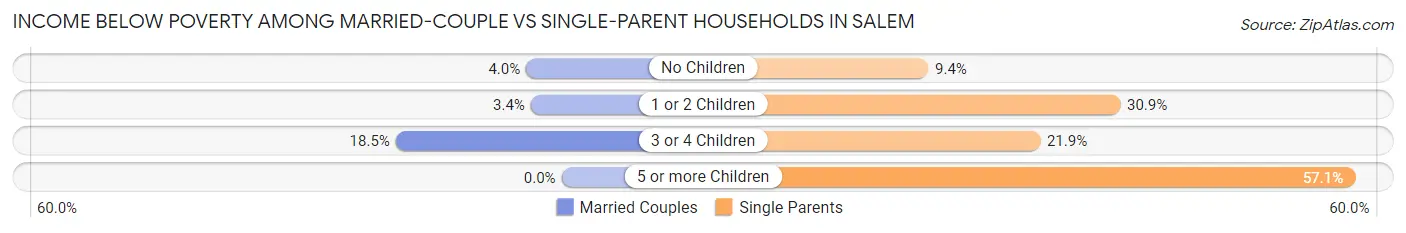
| Children | Married-Couple Families | Single-Parent Households |
| No Children | 648 (4.0%) | 397 (9.4%) |
| 1 or 2 Children | 309 (3.4%) | 2,027 (30.9%) |
| 3 or 4 Children | 560 (18.5%) | 333 (21.9%) |
| 5 or more Children | 0 (0.0%) | 40 (57.1%) |
| Total | 1,517 (5.3%) | 2,797 (22.6%) |
Race in Salem
The most populous races in Salem are White / Caucasian (126,854 | 72.2%), Hispanic or Latino (40,150 | 22.8%), and Two or more Races (21,509 | 12.2%).
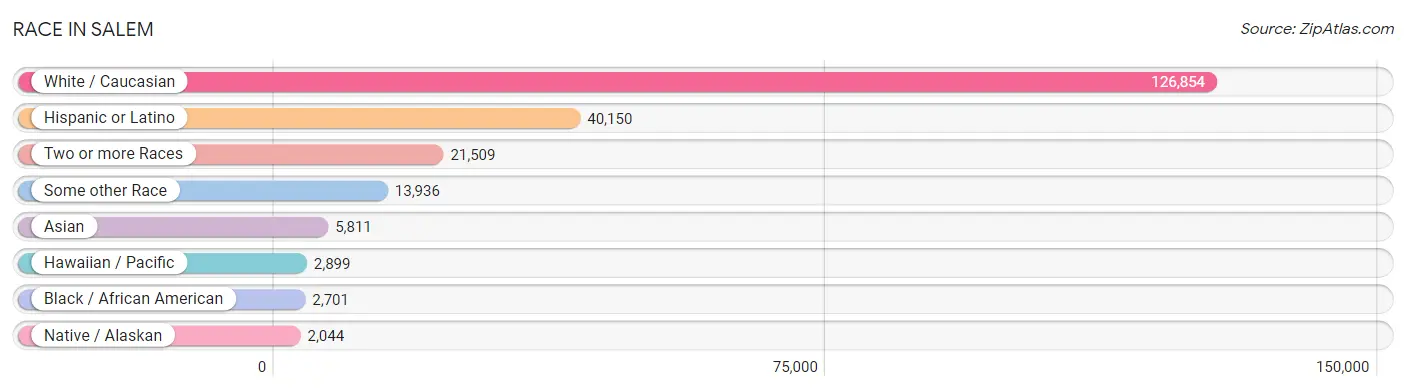
| Race | # Population | % Population |
| Asian | 5,811 | 3.3% |
| Black / African American | 2,701 | 1.5% |
| Hawaiian / Pacific | 2,899 | 1.7% |
| Hispanic or Latino | 40,150 | 22.8% |
| Native / Alaskan | 2,044 | 1.2% |
| White / Caucasian | 126,854 | 72.2% |
| Two or more Races | 21,509 | 12.2% |
| Some other Race | 13,936 | 7.9% |
| Total | 175,754 | 100.0% |
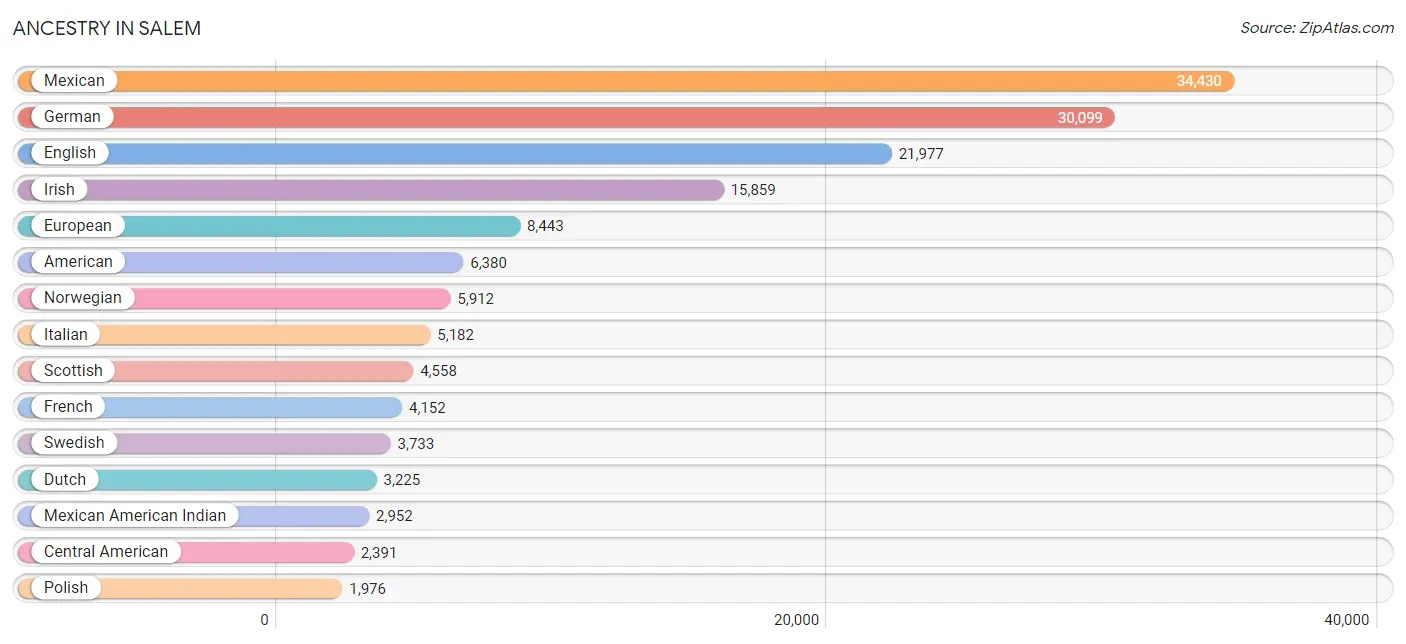
Ancestry in Salem
The most populous ancestries reported in Salem are Mexican (34,430 | 19.6%), German (30,099 | 17.1%), English (21,977 | 12.5%), Irish (15,859 | 9.0%), and European (8,443 | 4.8%), together accounting for 63.0% of all Salem residents.
| Ancestry | # Population | % Population |
| Afghan | 38 | 0.0% |
| African | 606 | 0.3% |
| Alaska Native | 49 | 0.0% |
| Alaskan Athabascan | 16 | 0.0% |
| Albanian | 13 | 0.0% |
| American | 6,380 | 3.6% |
| Apache | 313 | 0.2% |
| Arab | 271 | 0.2% |
| Arapaho | 13 | 0.0% |
| Argentinean | 39 | 0.0% |
| Armenian | 36 | 0.0% |
| Assyrian / Chaldean / Syriac | 8 | 0.0% |
| Australian | 47 | 0.0% |
| Austrian | 679 | 0.4% |
| Basque | 57 | 0.0% |
| Belgian | 177 | 0.1% |
| Bhutanese | 1,014 | 0.6% |
| Blackfeet | 382 | 0.2% |
| Bolivian | 65 | 0.0% |
| Brazilian | 77 | 0.0% |
| British | 1,085 | 0.6% |
| Bulgarian | 71 | 0.0% |
| Burmese | 700 | 0.4% |
| Canadian | 373 | 0.2% |
| Celtic | 113 | 0.1% |
| Central American | 2,391 | 1.4% |
| Central American Indian | 358 | 0.2% |
| Cherokee | 907 | 0.5% |
| Cheyenne | 9 | 0.0% |
| Chickasaw | 102 | 0.1% |
| Chinese | 29 | 0.0% |
| Chippewa | 49 | 0.0% |
| Choctaw | 271 | 0.2% |
| Colombian | 230 | 0.1% |
| Comanche | 24 | 0.0% |
| Costa Rican | 7 | 0.0% |
| Cree | 5 | 0.0% |
| Creek | 70 | 0.0% |
| Croatian | 77 | 0.0% |
| Cuban | 121 | 0.1% |
| Czech | 346 | 0.2% |
| Czechoslovakian | 193 | 0.1% |
| Danish | 1,695 | 1.0% |
| Delaware | 50 | 0.0% |
| Dominican | 131 | 0.1% |
| Dutch | 3,225 | 1.8% |
| Eastern European | 722 | 0.4% |
| Ecuadorian | 51 | 0.0% |
| Egyptian | 35 | 0.0% |
| English | 21,977 | 12.5% |
| Estonian | 24 | 0.0% |
| Ethiopian | 110 | 0.1% |
| European | 8,443 | 4.8% |
| Fijian | 1,435 | 0.8% |
| Filipino | 10 | 0.0% |
| Finnish | 455 | 0.3% |
| French | 4,152 | 2.4% |
| French American Indian | 160 | 0.1% |
| French Canadian | 771 | 0.4% |
| German | 30,099 | 17.1% |
| Ghanaian | 30 | 0.0% |
| Greek | 495 | 0.3% |
| Guamanian / Chamorro | 238 | 0.1% |
| Guatemalan | 888 | 0.5% |
| Haitian | 7 | 0.0% |
| Honduran | 308 | 0.2% |
| Hungarian | 653 | 0.4% |
| Icelander | 125 | 0.1% |
| Indian (Asian) | 1,929 | 1.1% |
| Indonesian | 119 | 0.1% |
| Inupiat | 45 | 0.0% |
| Iranian | 121 | 0.1% |
| Iraqi | 1 | 0.0% |
| Irish | 15,859 | 9.0% |
| Iroquois | 24 | 0.0% |
| Israeli | 54 | 0.0% |
| Italian | 5,182 | 2.9% |
| Jamaican | 53 | 0.0% |
| Japanese | 126 | 0.1% |
| Jordanian | 17 | 0.0% |
| Kenyan | 23 | 0.0% |
| Korean | 1,881 | 1.1% |
| Laotian | 134 | 0.1% |
| Latvian | 48 | 0.0% |
| Lebanese | 51 | 0.0% |
| Liberian | 189 | 0.1% |
| Lithuanian | 167 | 0.1% |
| Luxembourger | 13 | 0.0% |
| Malaysian | 116 | 0.1% |
| Maltese | 9 | 0.0% |
| Mexican | 34,430 | 19.6% |
| Mexican American Indian | 2,952 | 1.7% |
| Moroccan | 22 | 0.0% |
| Native Hawaiian | 604 | 0.3% |
| Navajo | 39 | 0.0% |
| Nepalese | 45 | 0.0% |
| Nicaraguan | 51 | 0.0% |
| Nigerian | 49 | 0.0% |
| Northern European | 739 | 0.4% |
| Norwegian | 5,912 | 3.4% |
| Okinawan | 13 | 0.0% |
| Osage | 53 | 0.0% |
| Paiute | 50 | 0.0% |
| Pakistani | 140 | 0.1% |
| Palestinian | 74 | 0.0% |
| Panamanian | 72 | 0.0% |
| Paraguayan | 15 | 0.0% |
| Pennsylvania German | 80 | 0.1% |
| Peruvian | 77 | 0.0% |
| Polish | 1,976 | 1.1% |
| Portuguese | 1,006 | 0.6% |
| Potawatomi | 13 | 0.0% |
| Pueblo | 31 | 0.0% |
| Puerto Rican | 711 | 0.4% |
| Romanian | 411 | 0.2% |
| Russian | 1,624 | 0.9% |
| Salvadoran | 1,065 | 0.6% |
| Samoan | 159 | 0.1% |
| Scandinavian | 1,495 | 0.9% |
| Scotch-Irish | 1,695 | 1.0% |
| Scottish | 4,558 | 2.6% |
| Seminole | 13 | 0.0% |
| Serbian | 66 | 0.0% |
| Shoshone | 19 | 0.0% |
| Sierra Leonean | 1 | 0.0% |
| Sioux | 216 | 0.1% |
| Slavic | 91 | 0.1% |
| Slovak | 212 | 0.1% |
| Slovene | 33 | 0.0% |
| South African | 14 | 0.0% |
| South American | 621 | 0.4% |
| South American Indian | 51 | 0.0% |
| Spaniard | 579 | 0.3% |
| Spanish | 507 | 0.3% |
| Sri Lankan | 1,086 | 0.6% |
| Subsaharan African | 1,069 | 0.6% |
| Swedish | 3,733 | 2.1% |
| Swiss | 720 | 0.4% |
| Syrian | 6 | 0.0% |
| Thai | 969 | 0.5% |
| Tlingit-Haida | 5 | 0.0% |
| Tohono O'Odham | 5 | 0.0% |
| Turkish | 71 | 0.0% |
| Ugandan | 29 | 0.0% |
| Ukrainian | 999 | 0.6% |
| Uruguayan | 12 | 0.0% |
| Venezuelan | 132 | 0.1% |
| Welsh | 1,518 | 0.9% |
| West Indian | 10 | 0.0% |
| Yaqui | 54 | 0.0% |
| Yugoslavian | 78 | 0.0% |
| Yuman | 47 | 0.0% |
| Yup'ik | 19 | 0.0% | View All 153 Rows |
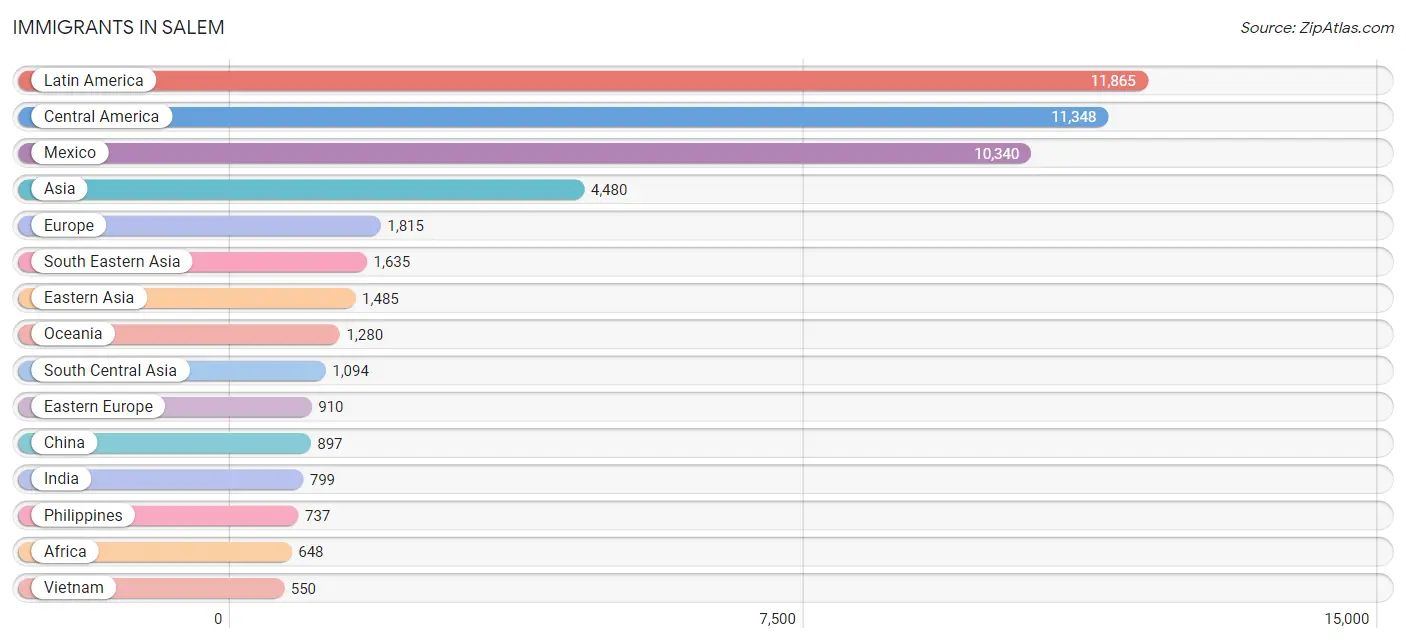
Immigrants in Salem
The most numerous immigrant groups reported in Salem came from Latin America (11,865 | 6.8%), Central America (11,348 | 6.5%), Mexico (10,340 | 5.9%), Asia (4,480 | 2.5%), and Europe (1,815 | 1.0%), together accounting for 22.7% of all Salem residents.
| Immigration Origin | # Population | % Population |
| Afghanistan | 38 | 0.0% |
| Africa | 648 | 0.4% |
| Argentina | 31 | 0.0% |
| Asia | 4,480 | 2.5% |
| Australia | 35 | 0.0% |
| Austria | 180 | 0.1% |
| Belarus | 12 | 0.0% |
| Bolivia | 65 | 0.0% |
| Brazil | 83 | 0.1% |
| Cambodia | 84 | 0.1% |
| Canada | 258 | 0.2% |
| Caribbean | 108 | 0.1% |
| Central America | 11,348 | 6.5% |
| Chile | 12 | 0.0% |
| China | 897 | 0.5% |
| Colombia | 91 | 0.1% |
| Congo | 86 | 0.1% |
| Cuba | 14 | 0.0% |
| Czechoslovakia | 20 | 0.0% |
| Dominican Republic | 63 | 0.0% |
| Eastern Africa | 132 | 0.1% |
| Eastern Asia | 1,485 | 0.8% |
| Eastern Europe | 910 | 0.5% |
| Ecuador | 13 | 0.0% |
| El Salvador | 337 | 0.2% |
| England | 222 | 0.1% |
| Ethiopia | 100 | 0.1% |
| Europe | 1,815 | 1.0% |
| Fiji | 15 | 0.0% |
| France | 37 | 0.0% |
| Germany | 162 | 0.1% |
| Ghana | 63 | 0.0% |
| Guatemala | 447 | 0.3% |
| Honduras | 212 | 0.1% |
| Hong Kong | 50 | 0.0% |
| Hungary | 167 | 0.1% |
| India | 799 | 0.4% |
| Indonesia | 14 | 0.0% |
| Iran | 56 | 0.0% |
| Iraq | 1 | 0.0% |
| Israel | 82 | 0.1% |
| Jamaica | 31 | 0.0% |
| Japan | 200 | 0.1% |
| Jordan | 9 | 0.0% |
| Kazakhstan | 33 | 0.0% |
| Korea | 388 | 0.2% |
| Laos | 57 | 0.0% |
| Latin America | 11,865 | 6.8% |
| Latvia | 29 | 0.0% |
| Lebanon | 8 | 0.0% |
| Liberia | 169 | 0.1% |
| Malaysia | 14 | 0.0% |
| Mexico | 10,340 | 5.9% |
| Micronesia | 296 | 0.2% |
| Middle Africa | 86 | 0.1% |
| Moldova | 52 | 0.0% |
| Morocco | 12 | 0.0% |
| Nepal | 77 | 0.0% |
| Netherlands | 109 | 0.1% |
| Nicaragua | 12 | 0.0% |
| Nigeria | 52 | 0.0% |
| Northern Africa | 12 | 0.0% |
| Northern Europe | 417 | 0.2% |
| Oceania | 1,280 | 0.7% |
| Peru | 51 | 0.0% |
| Philippines | 737 | 0.4% |
| Romania | 24 | 0.0% |
| Russia | 175 | 0.1% |
| Senegal | 36 | 0.0% |
| Sierra Leone | 1 | 0.0% |
| South Africa | 33 | 0.0% |
| South America | 409 | 0.2% |
| South Central Asia | 1,094 | 0.6% |
| South Eastern Asia | 1,635 | 0.9% |
| Sri Lanka | 11 | 0.0% |
| Taiwan | 76 | 0.0% |
| Thailand | 60 | 0.0% |
| Turkey | 54 | 0.0% |
| Uganda | 17 | 0.0% |
| Ukraine | 394 | 0.2% |
| Uruguay | 12 | 0.0% |
| Uzbekistan | 64 | 0.0% |
| Venezuela | 36 | 0.0% |
| Vietnam | 550 | 0.3% |
| Western Africa | 321 | 0.2% |
| Western Asia | 222 | 0.1% |
| Western Europe | 488 | 0.3% | View All 87 Rows |
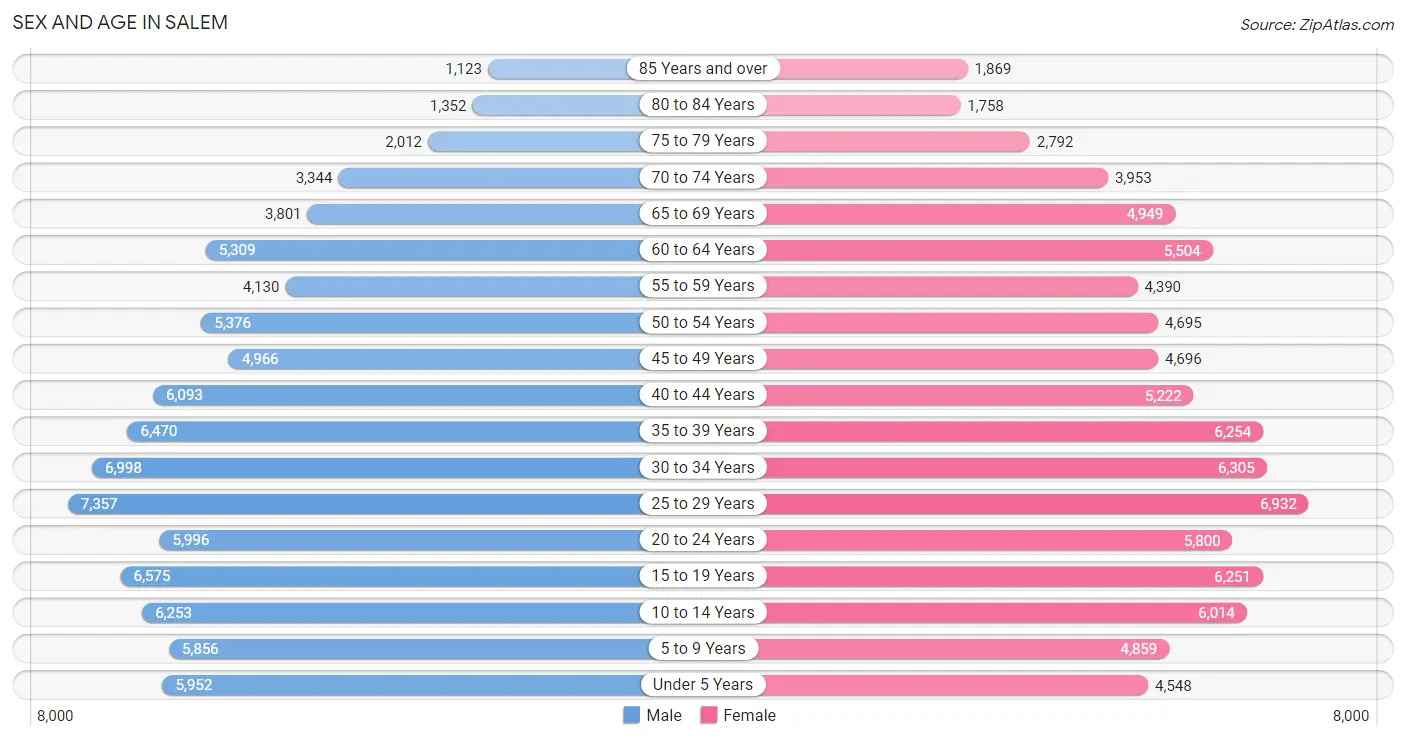
Sex and Age in Salem
Sex and Age in Salem
The most populous age groups in Salem are 25 to 29 Years (7,357 | 8.3%) for men and 25 to 29 Years (6,932 | 8.0%) for women.
| Age Bracket | Male | Female |
| Under 5 Years | 5,952 (6.7%) | 4,548 (5.2%) |
| 5 to 9 Years | 5,856 (6.6%) | 4,859 (5.6%) |
| 10 to 14 Years | 6,253 (7.0%) | 6,014 (6.9%) |
| 15 to 19 Years | 6,575 (7.4%) | 6,251 (7.2%) |
| 20 to 24 Years | 5,996 (6.7%) | 5,800 (6.7%) |
| 25 to 29 Years | 7,357 (8.3%) | 6,932 (8.0%) |
| 30 to 34 Years | 6,998 (7.9%) | 6,305 (7.3%) |
| 35 to 39 Years | 6,470 (7.3%) | 6,254 (7.2%) |
| 40 to 44 Years | 6,093 (6.9%) | 5,222 (6.0%) |
| 45 to 49 Years | 4,966 (5.6%) | 4,696 (5.4%) |
| 50 to 54 Years | 5,376 (6.0%) | 4,695 (5.4%) |
| 55 to 59 Years | 4,130 (4.6%) | 4,390 (5.1%) |
| 60 to 64 Years | 5,309 (6.0%) | 5,504 (6.3%) |
| 65 to 69 Years | 3,801 (4.3%) | 4,949 (5.7%) |
| 70 to 74 Years | 3,344 (3.8%) | 3,953 (4.5%) |
| 75 to 79 Years | 2,012 (2.3%) | 2,792 (3.2%) |
| 80 to 84 Years | 1,352 (1.5%) | 1,758 (2.0%) |
| 85 Years and over | 1,123 (1.3%) | 1,869 (2.1%) |
| Total | 88,963 (100.0%) | 86,791 (100.0%) |
Families and Households in Salem
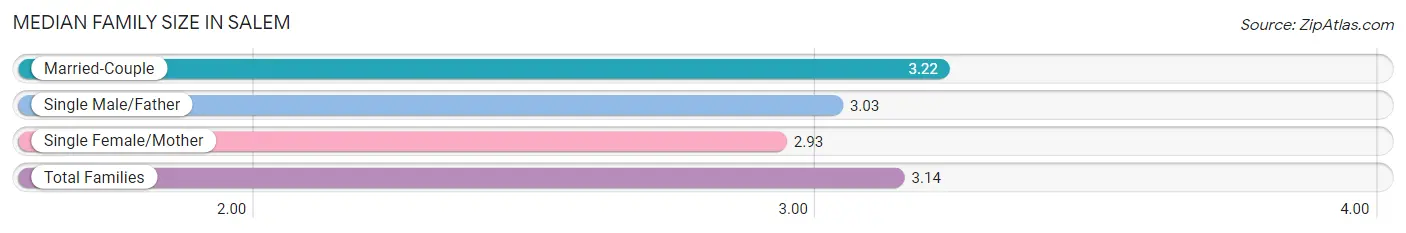
Median Family Size in Salem
The median family size in Salem is 3.14 persons per family, with married-couple families (28,607 | 69.8%) accounting for the largest median family size of 3.22 persons per family. On the other hand, single female/mother families (9,060 | 22.1%) represent the smallest median family size with 2.93 persons per family.
| Family Type | # Families | Family Size |
| Married-Couple | 28,607 (69.8%) | 3.22 |
| Single Male/Father | 3,297 (8.1%) | 3.03 |
| Single Female/Mother | 9,060 (22.1%) | 2.93 |
| Total Families | 40,964 (100.0%) | 3.14 |
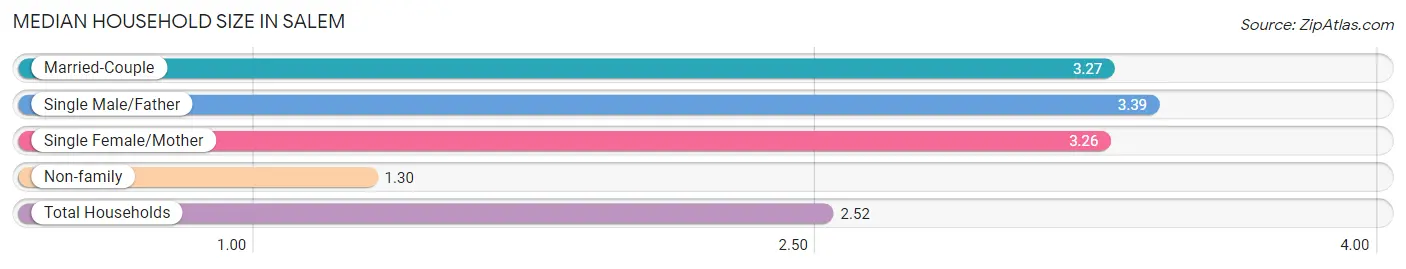
Median Household Size in Salem
The median household size in Salem is 2.52 persons per household, with single male/father households (3,297 | 5.0%) accounting for the largest median household size of 3.39 persons per household. non-family households (25,319 | 38.2%) represent the smallest median household size with 1.30 persons per household.
| Household Type | # Households | Household Size |
| Married-Couple | 28,607 (43.2%) | 3.27 |
| Single Male/Father | 3,297 (5.0%) | 3.39 |
| Single Female/Mother | 9,060 (13.7%) | 3.26 |
| Non-family | 25,319 (38.2%) | 1.30 |
| Total Households | 66,283 (100.0%) | 2.52 |
Household Size by Marriage Status in Salem
Out of a total of 66,283 households in Salem, 40,964 (61.8%) are family households, while 25,319 (38.2%) are nonfamily households. The most numerous type of family households are 2-person households, comprising 18,175, and the most common type of nonfamily households are 1-person households, comprising 19,758.
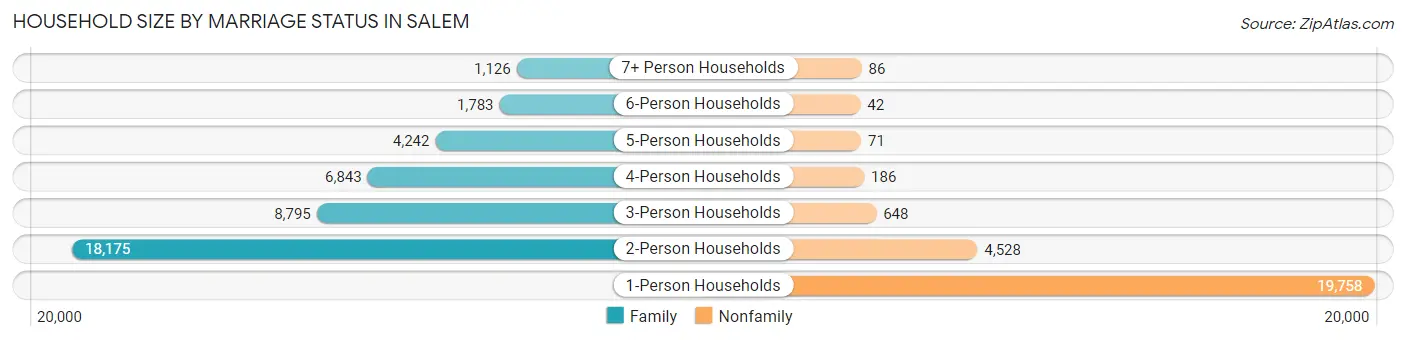
| Household Size | Family Households | Nonfamily Households |
| 1-Person Households | - | 19,758 (29.8%) |
| 2-Person Households | 18,175 (27.4%) | 4,528 (6.8%) |
| 3-Person Households | 8,795 (13.3%) | 648 (1.0%) |
| 4-Person Households | 6,843 (10.3%) | 186 (0.3%) |
| 5-Person Households | 4,242 (6.4%) | 71 (0.1%) |
| 6-Person Households | 1,783 (2.7%) | 42 (0.1%) |
| 7+ Person Households | 1,126 (1.7%) | 86 (0.1%) |
| Total | 40,964 (61.8%) | 25,319 (38.2%) |
Female Fertility in Salem
Fertility by Age in Salem
Average fertility rate in Salem is 40.0 births per 1,000 women. Women in the age bracket of 20 to 34 years have the highest fertility rate with 69.0 births per 1,000 women. Women in the age bracket of 20 to 34 years acount for 78.3% of all women with births.
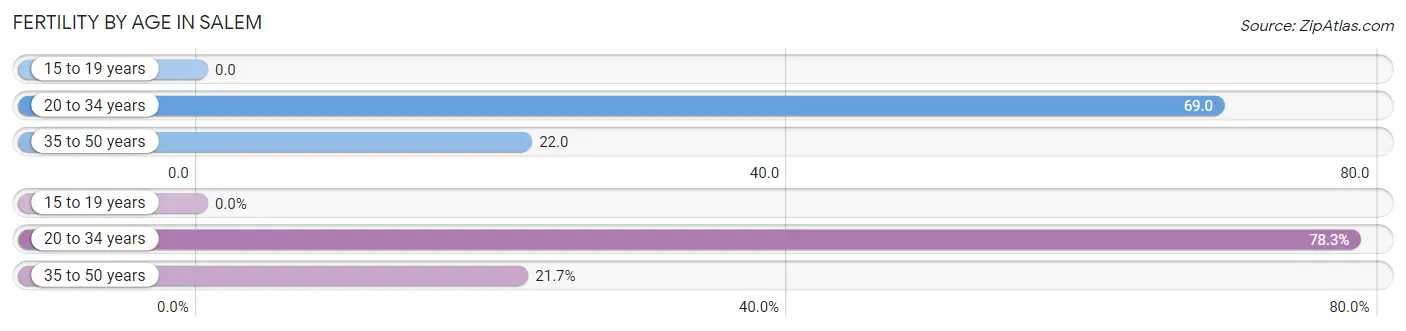
| Age Bracket | Women with Births | Births / 1,000 Women |
| 15 to 19 years | 0 (0.0%) | 0.0 |
| 20 to 34 years | 1,321 (78.3%) | 69.0 |
| 35 to 50 years | 367 (21.7%) | 22.0 |
| Total | 1,688 (100.0%) | 40.0 |
Fertility by Age by Marriage Status in Salem
75.9% of women with births (1,688) in Salem are married. The highest percentage of unmarried women with births falls into 20 to 34 years age bracket with 26.9% of them unmarried at the time of birth, while the lowest percentage of unmarried women with births belong to 35 to 50 years age bracket with 13.9% of them unmarried.
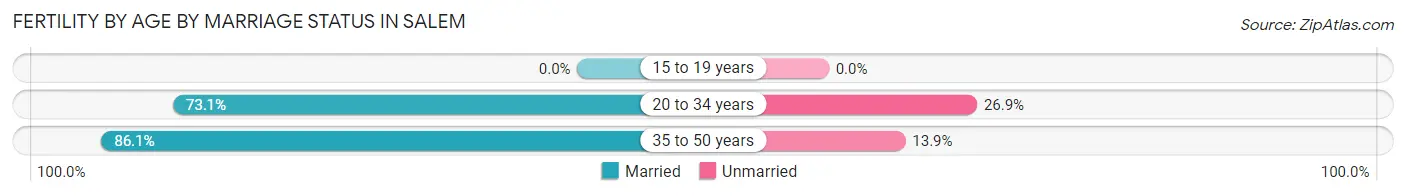
| Age Bracket | Married | Unmarried |
| 15 to 19 years | 0 (0.0%) | 0 (0.0%) |
| 20 to 34 years | 966 (73.1%) | 355 (26.9%) |
| 35 to 50 years | 316 (86.1%) | 51 (13.9%) |
| Total | 1,281 (75.9%) | 407 (24.1%) |
Fertility by Education in Salem
Average fertility rate in Salem is 40.0 births per 1,000 women. Women with the education attainment of bachelor's degree have the highest fertility rate of 49.0 births per 1,000 women, while women with the education attainment of high school diploma have the lowest fertility at 30.0 births per 1,000 women. Women with the education attainment of college or associate's degree represent 34.3% of all women with births.
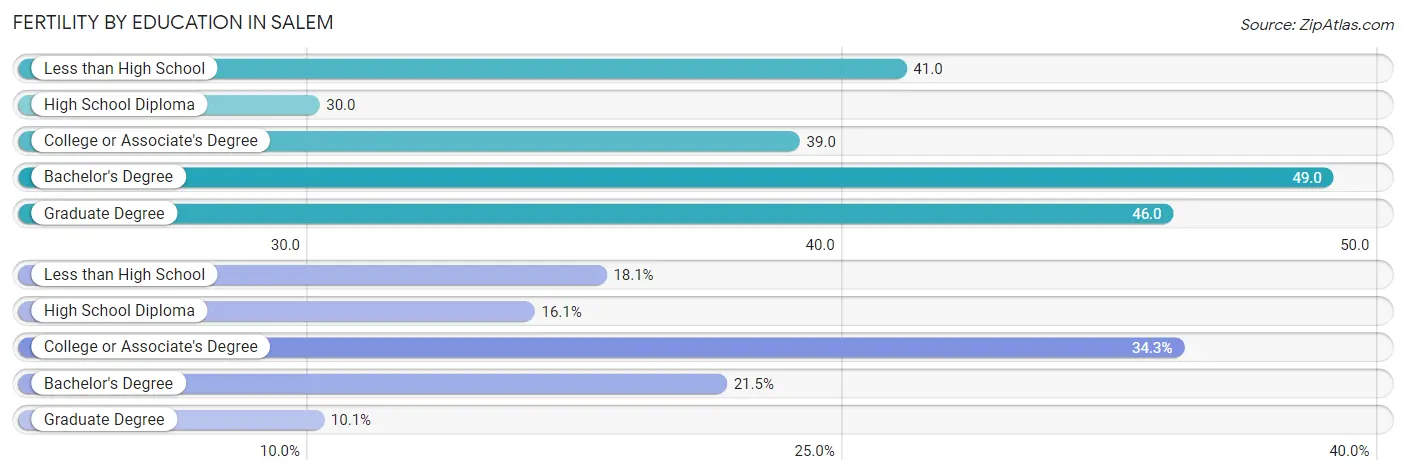
| Educational Attainment | Women with Births | Births / 1,000 Women |
| Less than High School | 305 (18.1%) | 41.0 |
| High School Diploma | 271 (16.1%) | 30.0 |
| College or Associate's Degree | 579 (34.3%) | 39.0 |
| Bachelor's Degree | 362 (21.4%) | 49.0 |
| Graduate Degree | 171 (10.1%) | 46.0 |
| Total | 1,688 (100.0%) | 40.0 |
Fertility by Education by Marriage Status in Salem
24.1% of women with births in Salem are unmarried. Women with the educational attainment of graduate degree are most likely to be married with 90.1% of them married at childbirth, while women with the educational attainment of less than high school are least likely to be married with 46.6% of them unmarried at childbirth.
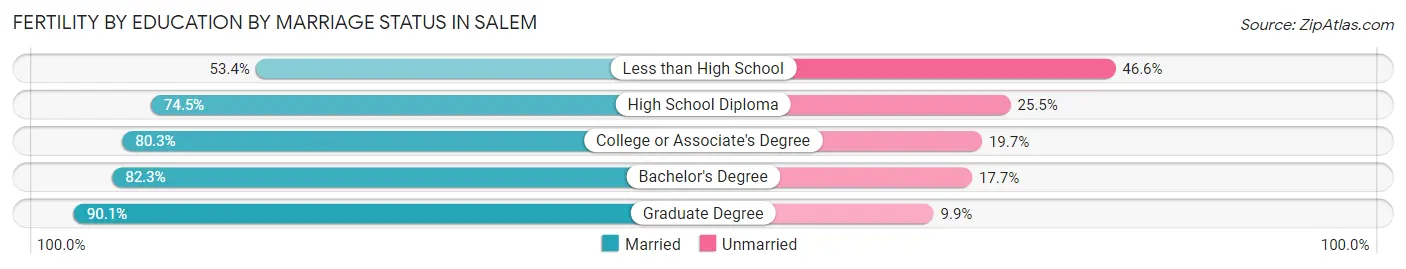
| Educational Attainment | Married | Unmarried |
| Less than High School | 163 (53.4%) | 142 (46.6%) |
| High School Diploma | 202 (74.5%) | 69 (25.5%) |
| College or Associate's Degree | 465 (80.3%) | 114 (19.7%) |
| Bachelor's Degree | 298 (82.3%) | 64 (17.7%) |
| Graduate Degree | 154 (90.1%) | 17 (9.9%) |
| Total | 1,281 (75.9%) | 407 (24.1%) |
Employment Characteristics in Salem
Employment by Class of Employer in Salem
Among the 79,200 employed individuals in Salem, private company employees (48,888 | 61.7%), state government employees (9,672 | 12.2%), and not-for-profit organizations (7,050 | 8.9%) make up the most common classes of employment.
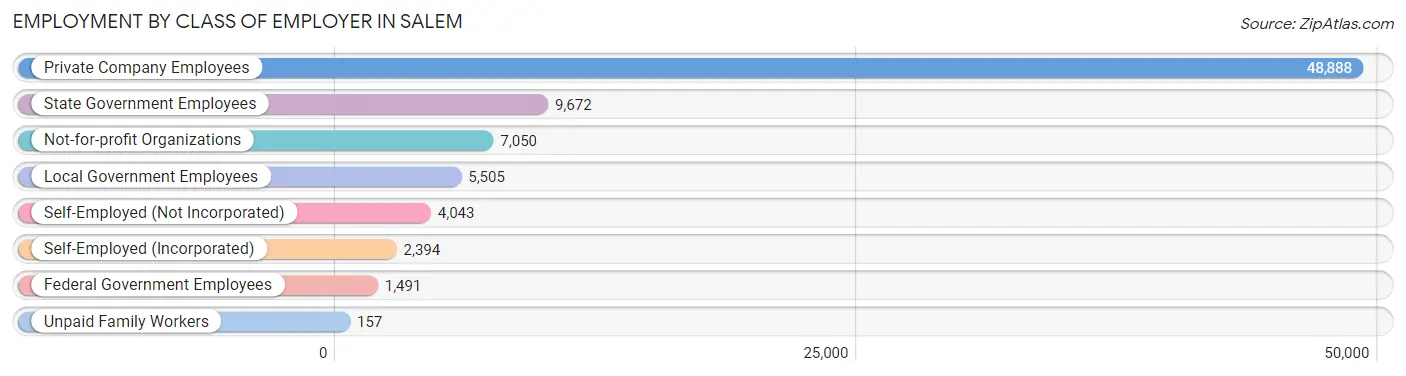
| Employer Class | # Employees | % Employees |
| Private Company Employees | 48,888 | 61.7% |
| Self-Employed (Incorporated) | 2,394 | 3.0% |
| Self-Employed (Not Incorporated) | 4,043 | 5.1% |
| Not-for-profit Organizations | 7,050 | 8.9% |
| Local Government Employees | 5,505 | 7.0% |
| State Government Employees | 9,672 | 12.2% |
| Federal Government Employees | 1,491 | 1.9% |
| Unpaid Family Workers | 157 | 0.2% |
| Total | 79,200 | 100.0% |
Employment Status by Age in Salem
According to the labor force statistics for Salem, out of the total population over 16 years of age (139,866), 61.3% or 85,738 individuals are in the labor force, with 6.1% or 5,230 of them unemployed. The age group with the highest labor force participation rate is 25 to 29 years, with 79.7% or 11,388 individuals in the labor force. Within the labor force, the 16 to 19 years age range has the highest percentage of unemployed individuals, with 22.2% or 895 of them being unemployed.
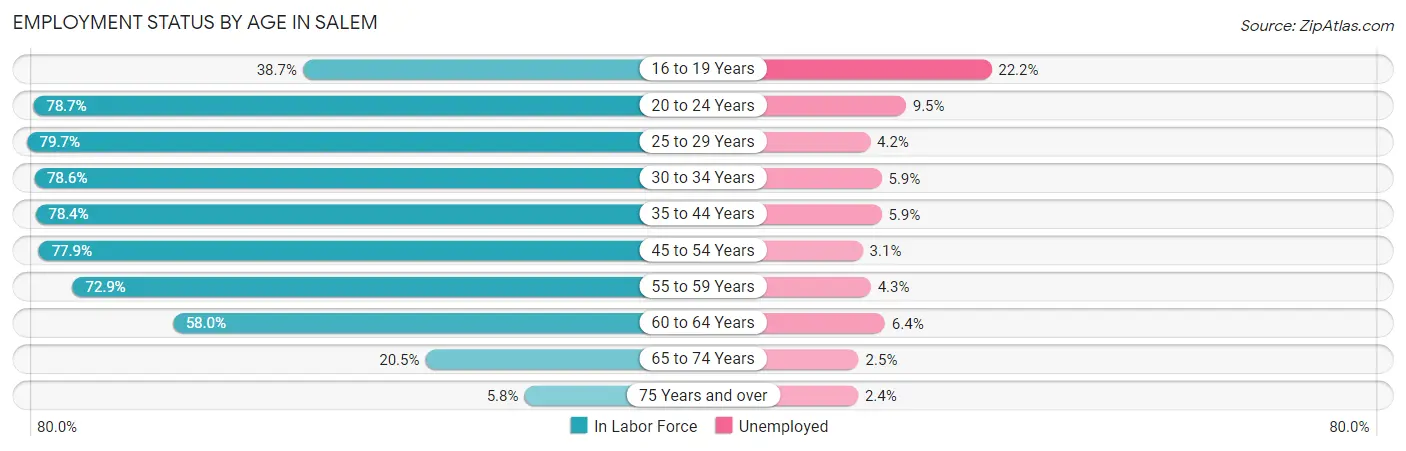
| Age Bracket | In Labor Force | Unemployed |
| 16 to 19 Years | 4,033 (38.7%) | 895 (22.2%) |
| 20 to 24 Years | 9,283 (78.7%) | 882 (9.5%) |
| 25 to 29 Years | 11,388 (79.7%) | 478 (4.2%) |
| 30 to 34 Years | 10,456 (78.6%) | 617 (5.9%) |
| 35 to 44 Years | 18,847 (78.4%) | 1,112 (5.9%) |
| 45 to 54 Years | 15,372 (77.9%) | 477 (3.1%) |
| 55 to 59 Years | 6,211 (72.9%) | 267 (4.3%) |
| 60 to 64 Years | 6,272 (58.0%) | 401 (6.4%) |
| 65 to 74 Years | 3,290 (20.5%) | 82 (2.5%) |
| 75 Years and over | 633 (5.8%) | 15 (2.4%) |
| Total | 85,738 (61.3%) | 5,230 (6.1%) |
Employment Status by Educational Attainment in Salem
According to labor force statistics for Salem, 75.6% of individuals (68,567) out of the total population between 25 and 64 years of age (90,697) are in the labor force, with 4.9% or 3,360 of them being unemployed. The group with the highest labor force participation rate are those with the educational attainment of bachelor's degree or higher, with 87.0% or 23,185 individuals in the labor force. Within the labor force, individuals with high school diploma education have the highest percentage of unemployment, with 6.4% or 897 of them being unemployed.
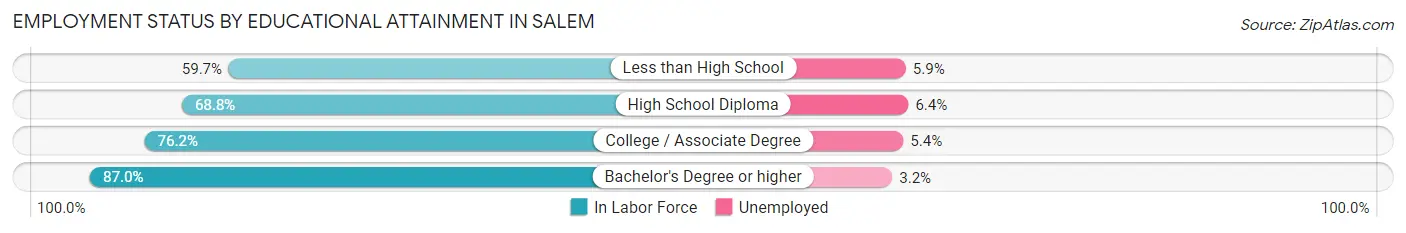
| Educational Attainment | In Labor Force | Unemployed |
| Less than High School | 6,922 (59.7%) | 684 (5.9%) |
| High School Diploma | 14,023 (68.8%) | 1,304 (6.4%) |
| College / Associate Degree | 24,438 (76.2%) | 1,732 (5.4%) |
| Bachelor's Degree or higher | 23,185 (87.0%) | 853 (3.2%) |
| Total | 68,567 (75.6%) | 4,444 (4.9%) |
Employment Occupations by Sex in Salem
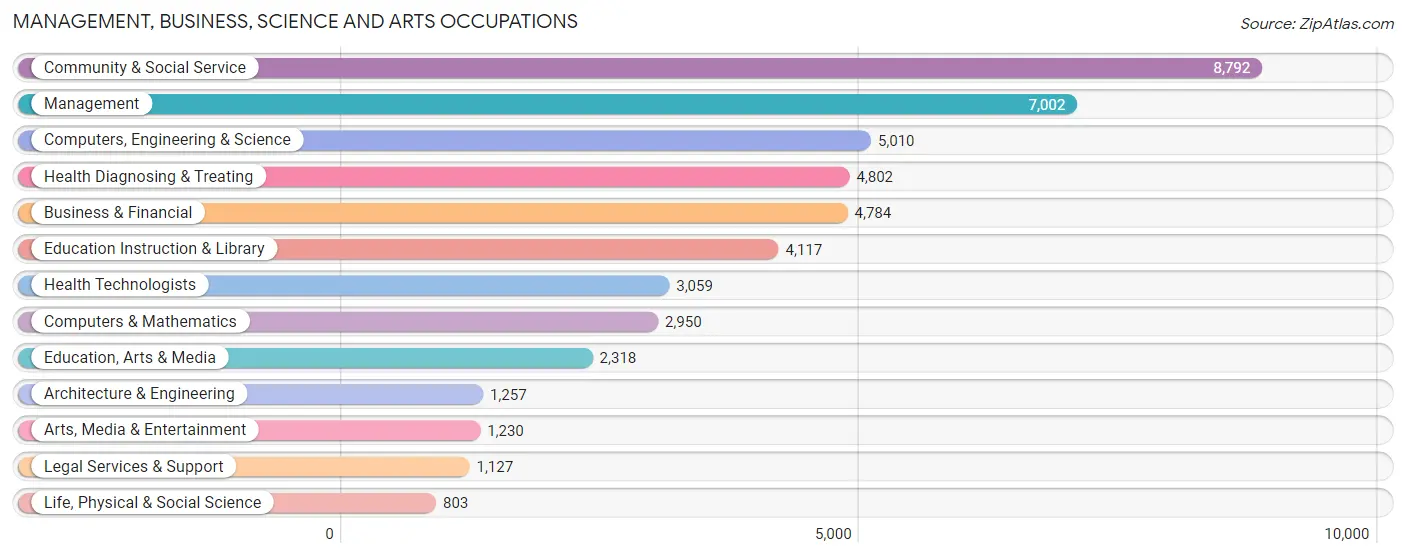
Management, Business, Science and Arts Occupations
The most common Management, Business, Science and Arts occupations in Salem are Community & Social Service (8,792 | 11.0%), Management (7,002 | 8.7%), Computers, Engineering & Science (5,010 | 6.2%), Health Diagnosing & Treating (4,802 | 6.0%), and Business & Financial (4,784 | 6.0%).
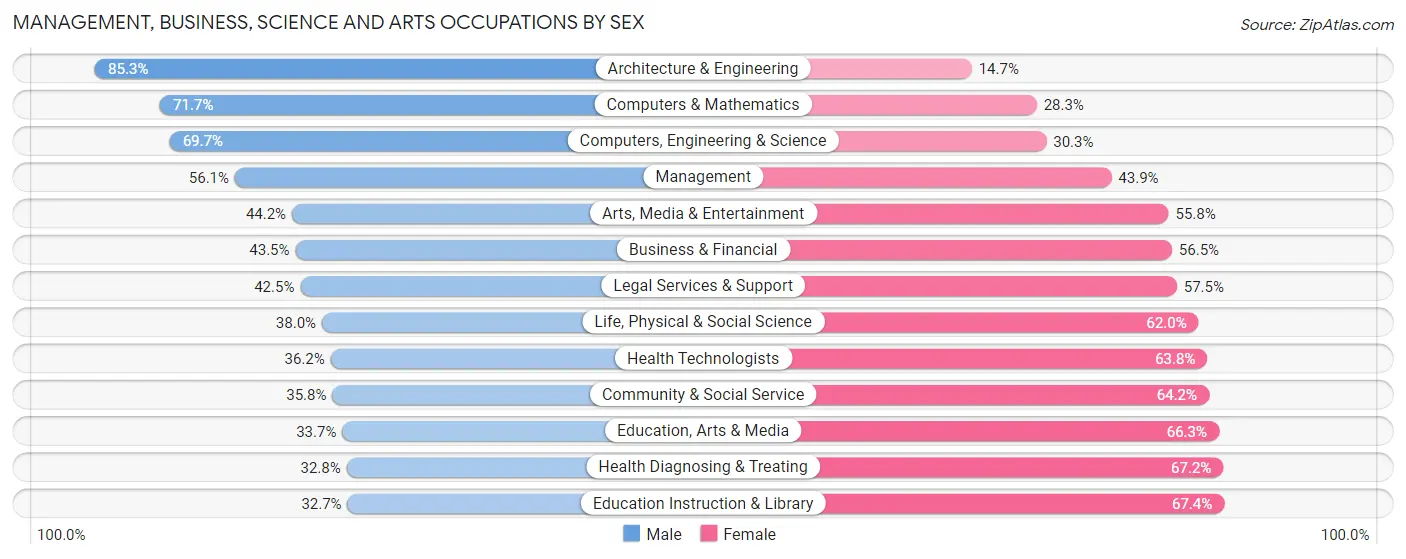
Management, Business, Science and Arts Occupations by Sex
Within the Management, Business, Science and Arts occupations in Salem, the most male-oriented occupations are Architecture & Engineering (85.3%), Computers & Mathematics (71.7%), and Computers, Engineering & Science (69.7%), while the most female-oriented occupations are Education Instruction & Library (67.3%), Health Diagnosing & Treating (67.2%), and Education, Arts & Media (66.3%).
| Occupation | Male | Female |
| Management | 3,931 (56.1%) | 3,071 (43.9%) |
| Business & Financial | 2,082 (43.5%) | 2,702 (56.5%) |
| Computers, Engineering & Science | 3,493 (69.7%) | 1,517 (30.3%) |
| Computers & Mathematics | 2,116 (71.7%) | 834 (28.3%) |
| Architecture & Engineering | 1,072 (85.3%) | 185 (14.7%) |
| Life, Physical & Social Science | 305 (38.0%) | 498 (62.0%) |
| Community & Social Service | 3,149 (35.8%) | 5,643 (64.2%) |
| Education, Arts & Media | 782 (33.7%) | 1,536 (66.3%) |
| Legal Services & Support | 479 (42.5%) | 648 (57.5%) |
| Education Instruction & Library | 1,344 (32.7%) | 2,773 (67.3%) |
| Arts, Media & Entertainment | 544 (44.2%) | 686 (55.8%) |
| Health Diagnosing & Treating | 1,577 (32.8%) | 3,225 (67.2%) |
| Health Technologists | 1,106 (36.2%) | 1,953 (63.8%) |
| Total (Category) | 14,232 (46.8%) | 16,158 (53.2%) |
| Total (Overall) | 41,353 (51.6%) | 38,815 (48.4%) |
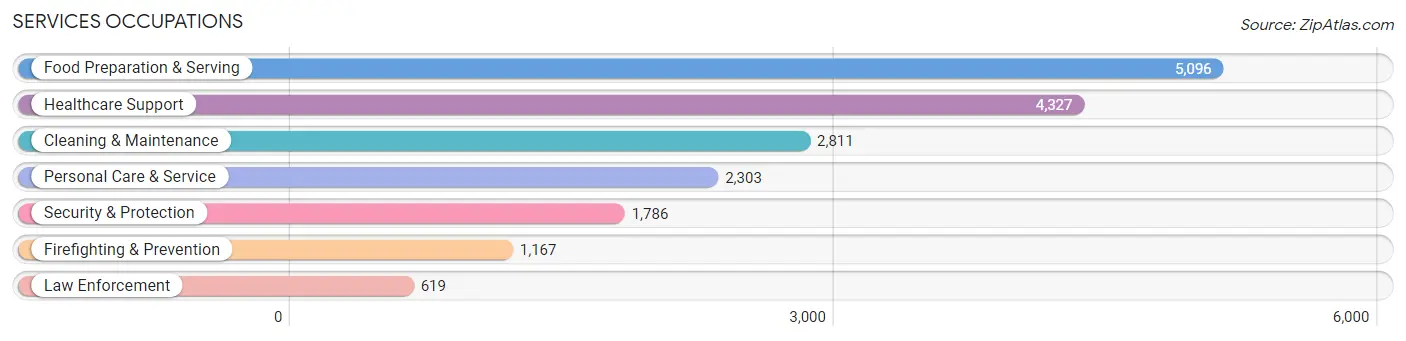
Services Occupations
The most common Services occupations in Salem are Food Preparation & Serving (5,096 | 6.4%), Healthcare Support (4,327 | 5.4%), Cleaning & Maintenance (2,811 | 3.5%), Personal Care & Service (2,303 | 2.9%), and Security & Protection (1,786 | 2.2%).
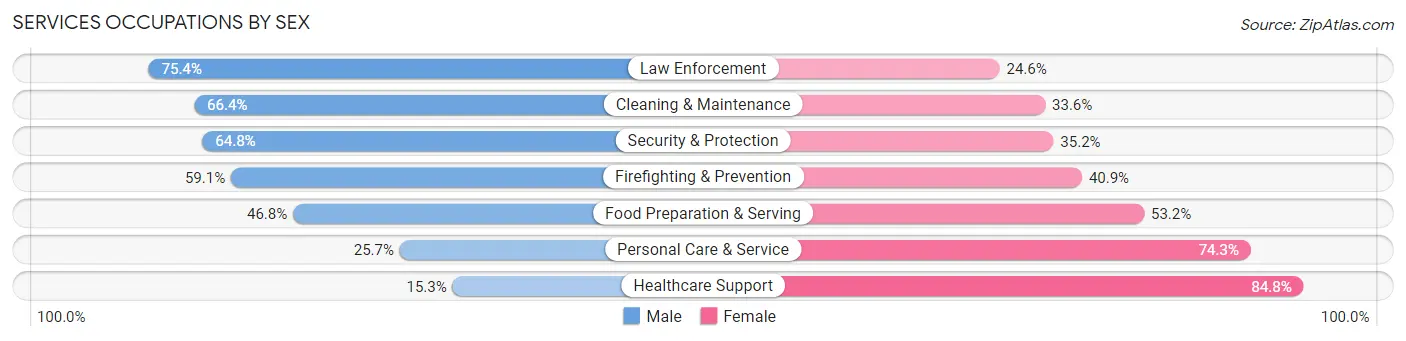
Services Occupations by Sex
Within the Services occupations in Salem, the most male-oriented occupations are Law Enforcement (75.4%), Cleaning & Maintenance (66.4%), and Security & Protection (64.8%), while the most female-oriented occupations are Healthcare Support (84.8%), Personal Care & Service (74.3%), and Food Preparation & Serving (53.2%).
| Occupation | Male | Female |
| Healthcare Support | 660 (15.2%) | 3,667 (84.8%) |
| Security & Protection | 1,157 (64.8%) | 629 (35.2%) |
| Firefighting & Prevention | 690 (59.1%) | 477 (40.9%) |
| Law Enforcement | 467 (75.4%) | 152 (24.6%) |
| Food Preparation & Serving | 2,387 (46.8%) | 2,709 (53.2%) |
| Cleaning & Maintenance | 1,867 (66.4%) | 944 (33.6%) |
| Personal Care & Service | 592 (25.7%) | 1,711 (74.3%) |
| Total (Category) | 6,663 (40.8%) | 9,660 (59.2%) |
| Total (Overall) | 41,353 (51.6%) | 38,815 (48.4%) |
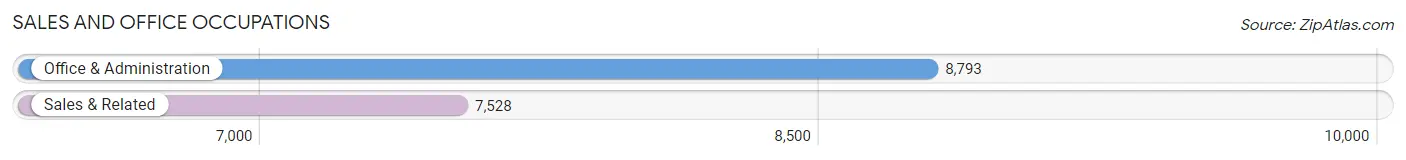
Sales and Office Occupations
The most common Sales and Office occupations in Salem are Office & Administration (8,793 | 11.0%), and Sales & Related (7,528 | 9.4%).
Sales and Office Occupations by Sex
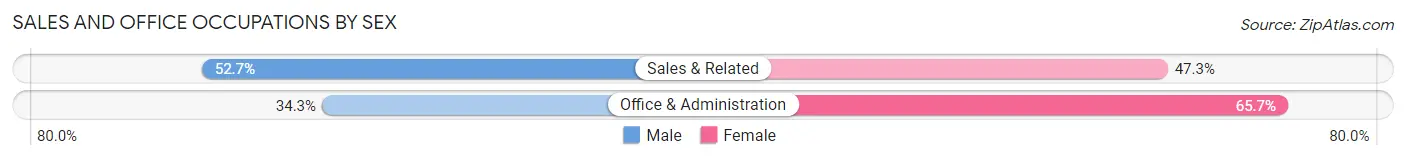
| Occupation | Male | Female |
| Sales & Related | 3,970 (52.7%) | 3,558 (47.3%) |
| Office & Administration | 3,013 (34.3%) | 5,780 (65.7%) |
| Total (Category) | 6,983 (42.8%) | 9,338 (57.2%) |
| Total (Overall) | 41,353 (51.6%) | 38,815 (48.4%) |
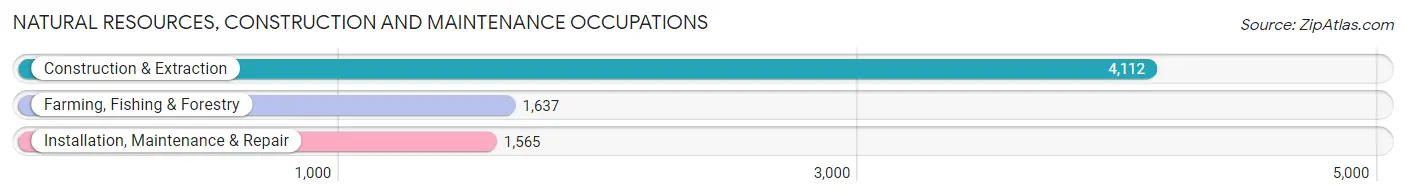
Natural Resources, Construction and Maintenance Occupations
The most common Natural Resources, Construction and Maintenance occupations in Salem are Construction & Extraction (4,112 | 5.1%), Farming, Fishing & Forestry (1,637 | 2.0%), and Installation, Maintenance & Repair (1,565 | 1.9%).
Natural Resources, Construction and Maintenance Occupations by Sex
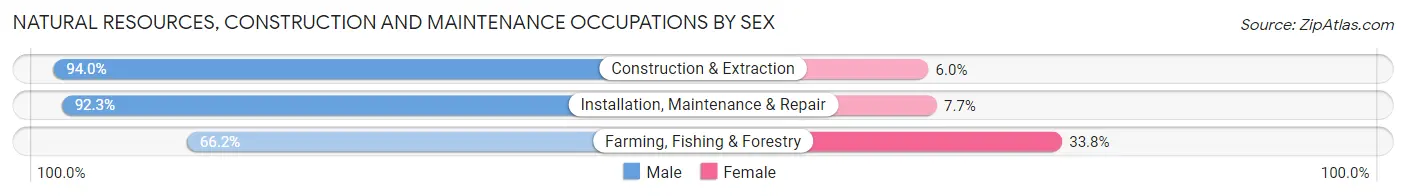
| Occupation | Male | Female |
| Farming, Fishing & Forestry | 1,084 (66.2%) | 553 (33.8%) |
| Construction & Extraction | 3,866 (94.0%) | 246 (6.0%) |
| Installation, Maintenance & Repair | 1,444 (92.3%) | 121 (7.7%) |
| Total (Category) | 6,394 (87.4%) | 920 (12.6%) |
| Total (Overall) | 41,353 (51.6%) | 38,815 (48.4%) |
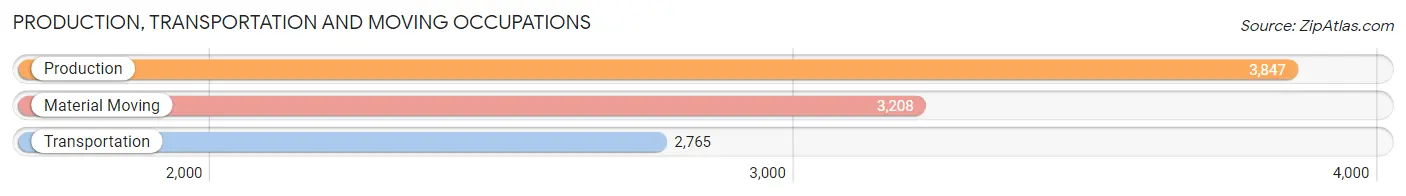
Production, Transportation and Moving Occupations
The most common Production, Transportation and Moving occupations in Salem are Production (3,847 | 4.8%), Material Moving (3,208 | 4.0%), and Transportation (2,765 | 3.5%).
Production, Transportation and Moving Occupations by Sex
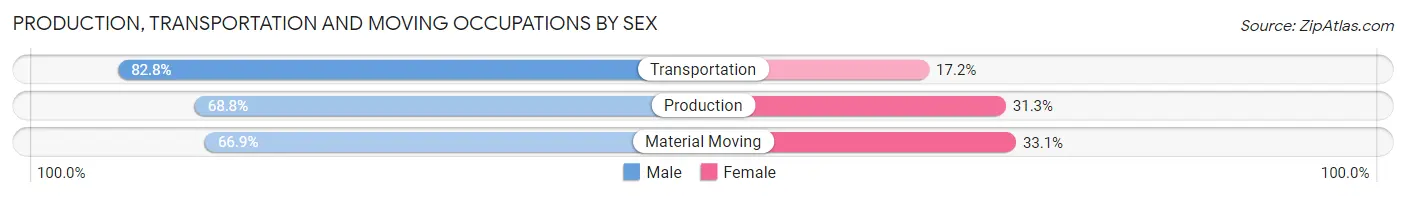
| Occupation | Male | Female |
| Production | 2,645 (68.8%) | 1,202 (31.2%) |
| Transportation | 2,290 (82.8%) | 475 (17.2%) |
| Material Moving | 2,146 (66.9%) | 1,062 (33.1%) |
| Total (Category) | 7,081 (72.1%) | 2,739 (27.9%) |
| Total (Overall) | 41,353 (51.6%) | 38,815 (48.4%) |
Employment Industries by Sex in Salem
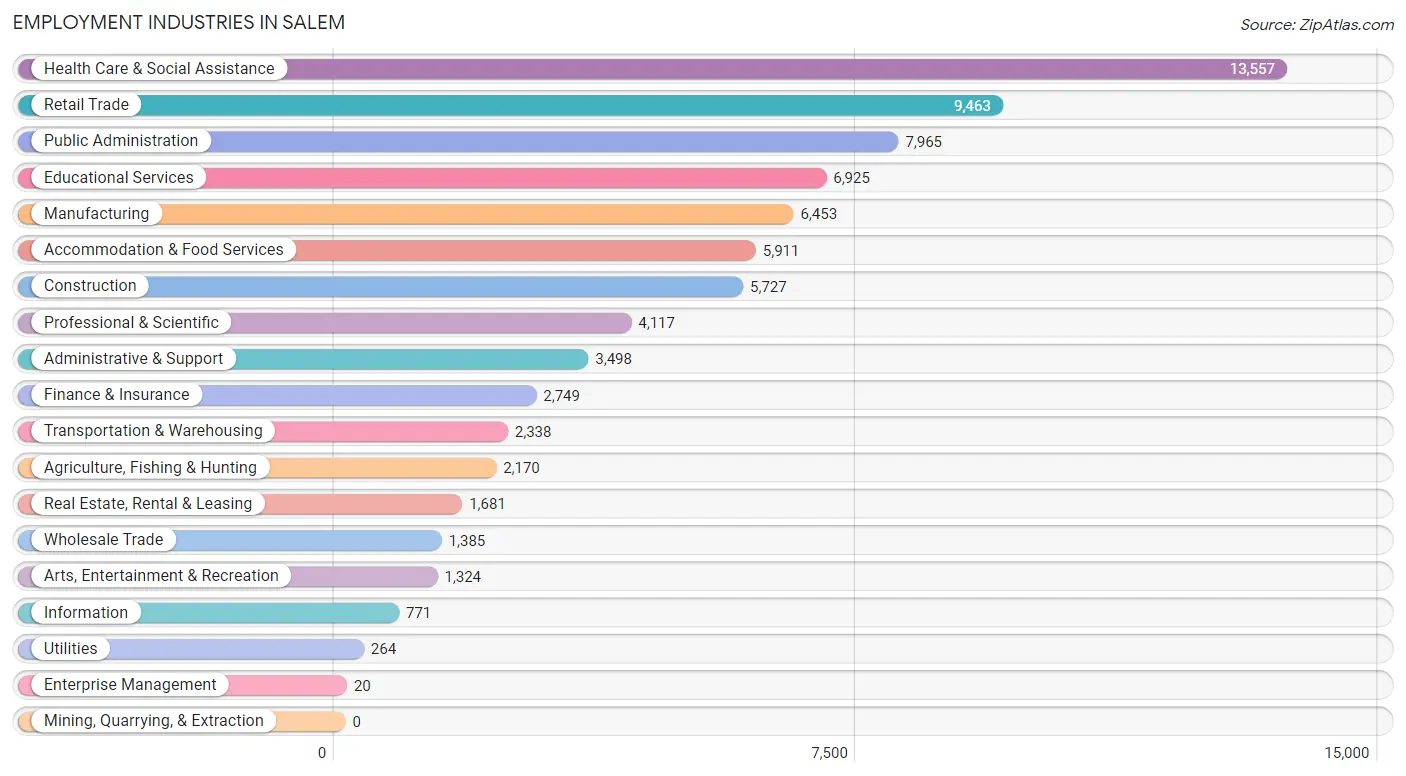
Employment Industries in Salem
The major employment industries in Salem include Health Care & Social Assistance (13,557 | 16.9%), Retail Trade (9,463 | 11.8%), Public Administration (7,965 | 9.9%), Educational Services (6,925 | 8.6%), and Manufacturing (6,453 | 8.1%).
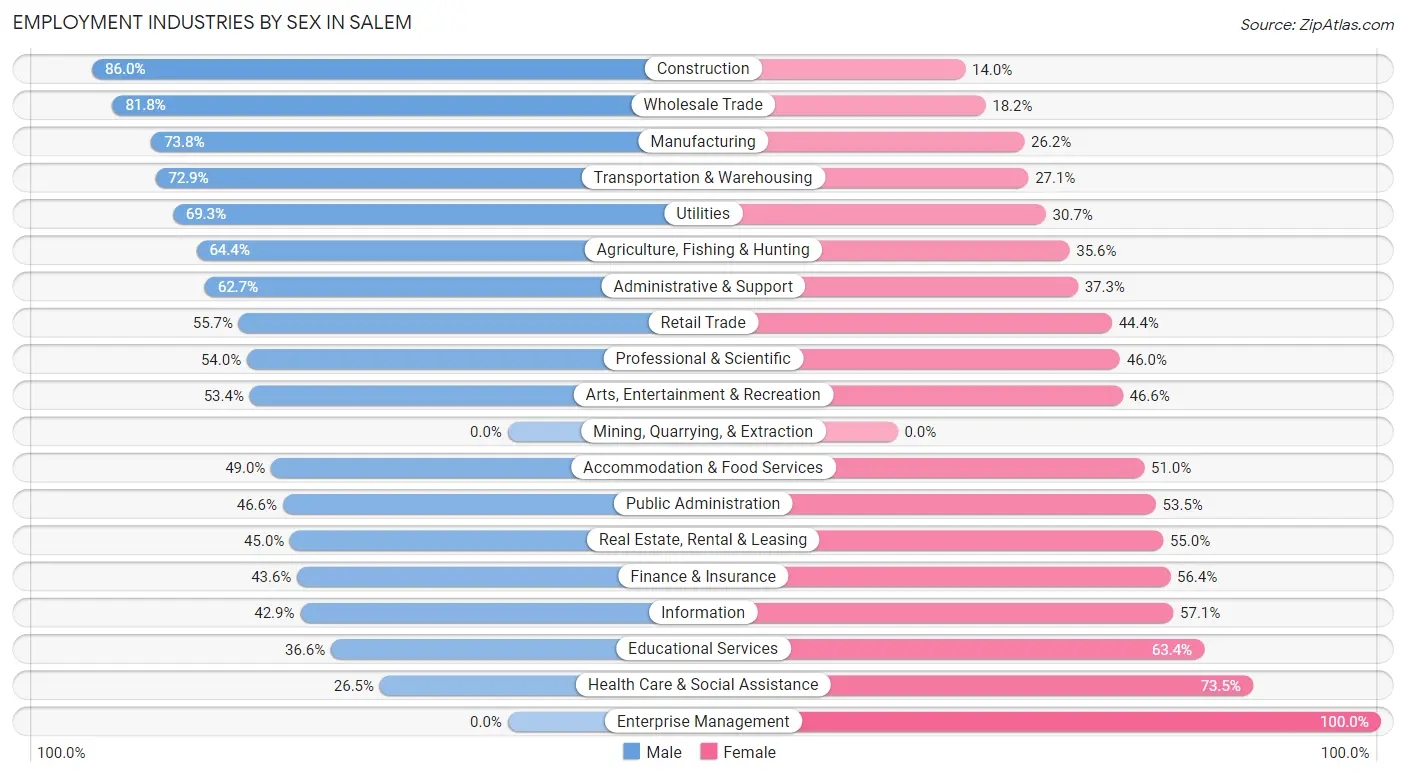
Employment Industries by Sex in Salem
The Salem industries that see more men than women are Construction (86.0%), Wholesale Trade (81.8%), and Manufacturing (73.8%), whereas the industries that tend to have a higher number of women are Enterprise Management (100.0%), Health Care & Social Assistance (73.5%), and Educational Services (63.4%).
| Industry | Male | Female |
| Agriculture, Fishing & Hunting | 1,398 (64.4%) | 772 (35.6%) |
| Mining, Quarrying, & Extraction | 0 (0.0%) | 0 (0.0%) |
| Construction | 4,926 (86.0%) | 801 (14.0%) |
| Manufacturing | 4,761 (73.8%) | 1,692 (26.2%) |
| Wholesale Trade | 1,133 (81.8%) | 252 (18.2%) |
| Retail Trade | 5,266 (55.6%) | 4,197 (44.4%) |
| Transportation & Warehousing | 1,705 (72.9%) | 633 (27.1%) |
| Utilities | 183 (69.3%) | 81 (30.7%) |
| Information | 331 (42.9%) | 440 (57.1%) |
| Finance & Insurance | 1,198 (43.6%) | 1,551 (56.4%) |
| Real Estate, Rental & Leasing | 757 (45.0%) | 924 (55.0%) |
| Professional & Scientific | 2,222 (54.0%) | 1,895 (46.0%) |
| Enterprise Management | 0 (0.0%) | 20 (100.0%) |
| Administrative & Support | 2,193 (62.7%) | 1,305 (37.3%) |
| Educational Services | 2,532 (36.6%) | 4,393 (63.4%) |
| Health Care & Social Assistance | 3,589 (26.5%) | 9,968 (73.5%) |
| Arts, Entertainment & Recreation | 707 (53.4%) | 617 (46.6%) |
| Accommodation & Food Services | 2,894 (49.0%) | 3,017 (51.0%) |
| Public Administration | 3,708 (46.6%) | 4,257 (53.4%) |
| Total | 41,353 (51.6%) | 38,815 (48.4%) |
Education in Salem
School Enrollment in Salem
The most common levels of schooling among the 39,894 students in Salem are middle school (9,104 | 22.8%), high school (9,060 | 22.7%), and elementary school (8,392 | 21.0%).
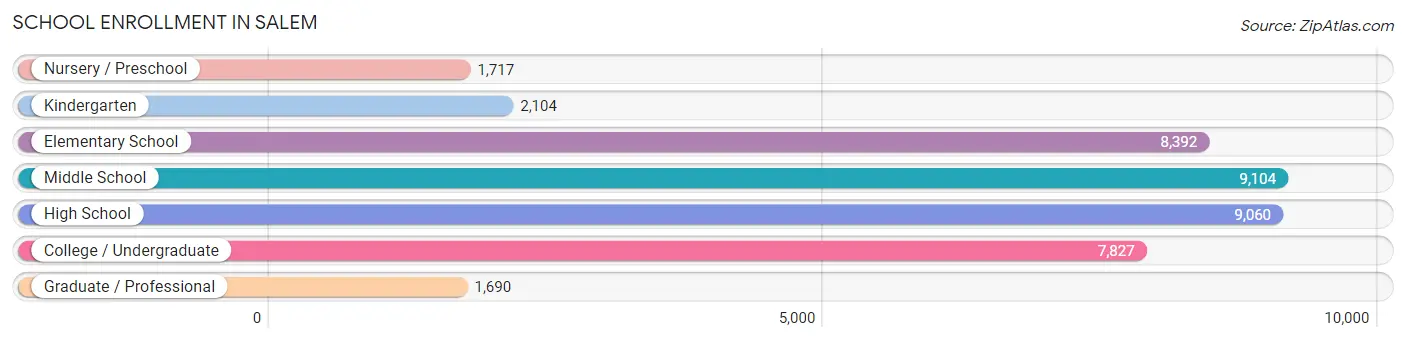
| School Level | # Students | % Students |
| Nursery / Preschool | 1,717 | 4.3% |
| Kindergarten | 2,104 | 5.3% |
| Elementary School | 8,392 | 21.0% |
| Middle School | 9,104 | 22.8% |
| High School | 9,060 | 22.7% |
| College / Undergraduate | 7,827 | 19.6% |
| Graduate / Professional | 1,690 | 4.2% |
| Total | 39,894 | 100.0% |
School Enrollment by Age by Funding Source in Salem
Out of a total of 39,894 students who are enrolled in schools in Salem, 5,984 (15.0%) attend a private institution, while the remaining 33,910 (85.0%) are enrolled in public schools. The age group of 20 to 24 year olds has the highest likelihood of being enrolled in private schools, with 1,234 (38.9% in the age bracket) enrolled. Conversely, the age group of 15 to 17 year olds has the lowest likelihood of being enrolled in a private school, with 6,406 (96.7% in the age bracket) attending a public institution.
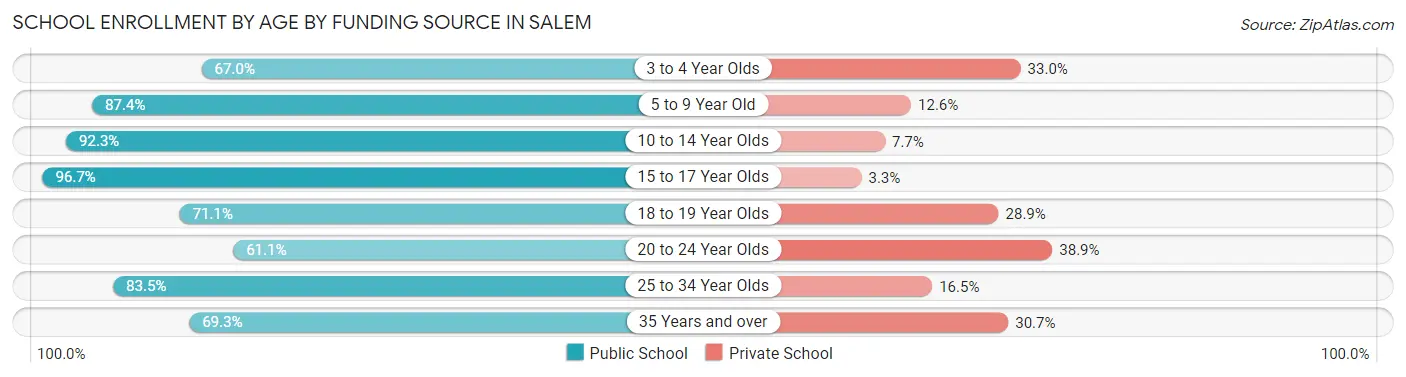
| Age Bracket | Public School | Private School |
| 3 to 4 Year Olds | 744 (67.0%) | 366 (33.0%) |
| 5 to 9 Year Old | 8,559 (87.4%) | 1,229 (12.6%) |
| 10 to 14 Year Olds | 10,436 (92.3%) | 870 (7.7%) |
| 15 to 17 Year Olds | 6,406 (96.7%) | 221 (3.3%) |
| 18 to 19 Year Olds | 2,436 (71.1%) | 988 (28.9%) |
| 20 to 24 Year Olds | 1,941 (61.1%) | 1,234 (38.9%) |
| 25 to 34 Year Olds | 1,797 (83.5%) | 355 (16.5%) |
| 35 Years and over | 1,603 (69.3%) | 709 (30.7%) |
| Total | 33,910 (85.0%) | 5,984 (15.0%) |
Educational Attainment by Field of Study in Salem
Business (5,888 | 14.6%), education (4,477 | 11.1%), social sciences (4,230 | 10.5%), science & technology (3,919 | 9.7%), and bio, nature & agricultural (3,297 | 8.2%) are the most common fields of study among 40,216 individuals in Salem who have obtained a bachelor's degree or higher.
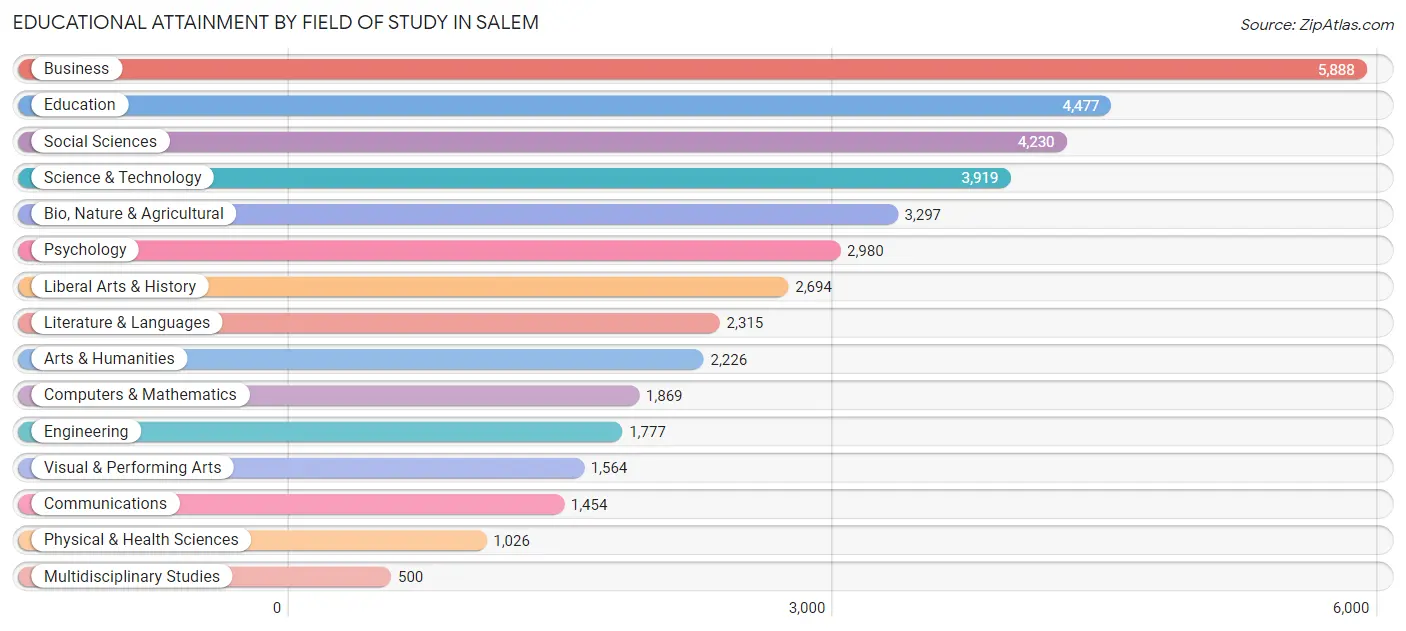
| Field of Study | # Graduates | % Graduates |
| Computers & Mathematics | 1,869 | 4.6% |
| Bio, Nature & Agricultural | 3,297 | 8.2% |
| Physical & Health Sciences | 1,026 | 2.5% |
| Psychology | 2,980 | 7.4% |
| Social Sciences | 4,230 | 10.5% |
| Engineering | 1,777 | 4.4% |
| Multidisciplinary Studies | 500 | 1.2% |
| Science & Technology | 3,919 | 9.7% |
| Business | 5,888 | 14.6% |
| Education | 4,477 | 11.1% |
| Literature & Languages | 2,315 | 5.8% |
| Liberal Arts & History | 2,694 | 6.7% |
| Visual & Performing Arts | 1,564 | 3.9% |
| Communications | 1,454 | 3.6% |
| Arts & Humanities | 2,226 | 5.5% |
| Total | 40,216 | 100.0% |
Transportation & Commute in Salem
Vehicle Availability by Sex in Salem
The most prevalent vehicle ownership categories in Salem are males with 2 vehicles (17,785, accounting for 43.6%) and females with 2 vehicles (16,540, making up 47.3%).
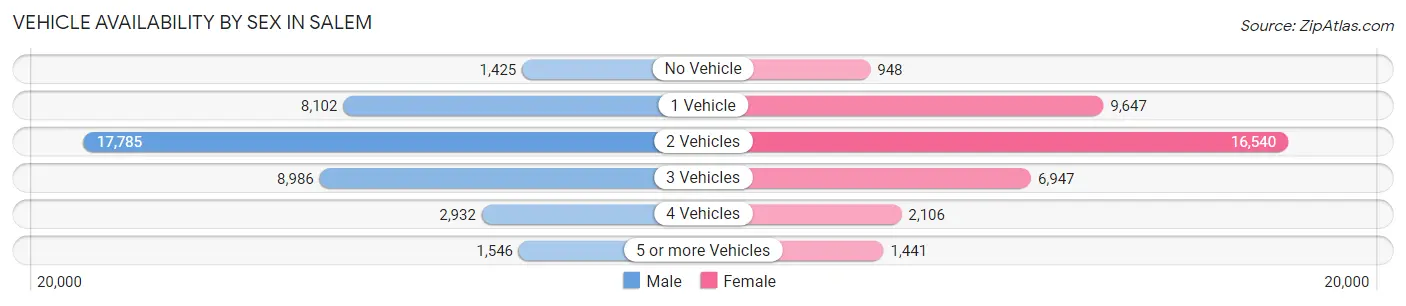
| Vehicles Available | Male | Female |
| No Vehicle | 1,425 (3.5%) | 948 (2.5%) |
| 1 Vehicle | 8,102 (19.9%) | 9,647 (25.6%) |
| 2 Vehicles | 17,785 (43.6%) | 16,540 (44.0%) |
| 3 Vehicles | 8,986 (22.0%) | 6,947 (18.5%) |
| 4 Vehicles | 2,932 (7.2%) | 2,106 (5.6%) |
| 5 or more Vehicles | 1,546 (3.8%) | 1,441 (3.8%) |
| Total | 40,776 (100.0%) | 37,629 (100.0%) |
Commute Time in Salem
The most frequently occuring commute durations in Salem are 15 to 19 minutes (14,830 commuters, 21.3%), 10 to 14 minutes (12,816 commuters, 18.4%), and 20 to 24 minutes (10,324 commuters, 14.9%).
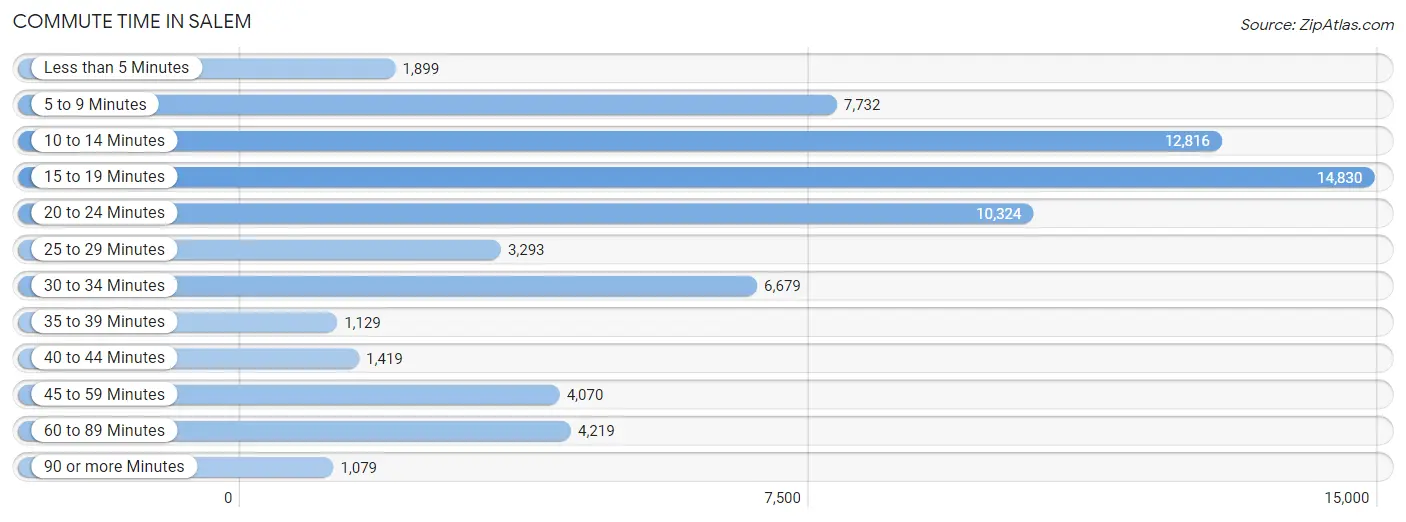
| Commute Time | # Commuters | % Commuters |
| Less than 5 Minutes | 1,899 | 2.7% |
| 5 to 9 Minutes | 7,732 | 11.1% |
| 10 to 14 Minutes | 12,816 | 18.4% |
| 15 to 19 Minutes | 14,830 | 21.3% |
| 20 to 24 Minutes | 10,324 | 14.9% |
| 25 to 29 Minutes | 3,293 | 4.7% |
| 30 to 34 Minutes | 6,679 | 9.6% |
| 35 to 39 Minutes | 1,129 | 1.6% |
| 40 to 44 Minutes | 1,419 | 2.0% |
| 45 to 59 Minutes | 4,070 | 5.9% |
| 60 to 89 Minutes | 4,219 | 6.1% |
| 90 or more Minutes | 1,079 | 1.5% |
Commute Time by Sex in Salem
The most common commute times in Salem are 15 to 19 minutes (7,676 commuters, 21.0%) for males and 15 to 19 minutes (7,154 commuters, 21.7%) for females.
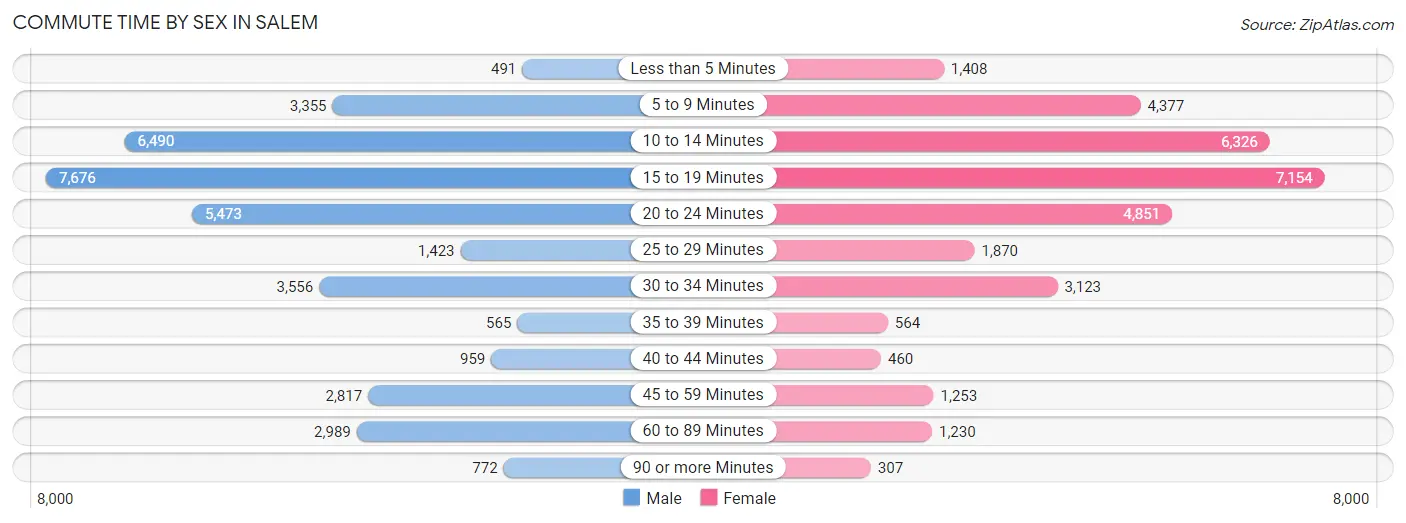
| Commute Time | Male | Female |
| Less than 5 Minutes | 491 (1.3%) | 1,408 (4.3%) |
| 5 to 9 Minutes | 3,355 (9.2%) | 4,377 (13.3%) |
| 10 to 14 Minutes | 6,490 (17.7%) | 6,326 (19.2%) |
| 15 to 19 Minutes | 7,676 (21.0%) | 7,154 (21.7%) |
| 20 to 24 Minutes | 5,473 (15.0%) | 4,851 (14.7%) |
| 25 to 29 Minutes | 1,423 (3.9%) | 1,870 (5.7%) |
| 30 to 34 Minutes | 3,556 (9.7%) | 3,123 (9.5%) |
| 35 to 39 Minutes | 565 (1.5%) | 564 (1.7%) |
| 40 to 44 Minutes | 959 (2.6%) | 460 (1.4%) |
| 45 to 59 Minutes | 2,817 (7.7%) | 1,253 (3.8%) |
| 60 to 89 Minutes | 2,989 (8.2%) | 1,230 (3.7%) |
| 90 or more Minutes | 772 (2.1%) | 307 (0.9%) |
Time of Departure to Work by Sex in Salem
The most frequent times of departure to work in Salem are 7:00 AM to 7:29 AM (4,752, 13.0%) for males and 7:30 AM to 7:59 AM (5,620, 17.1%) for females.
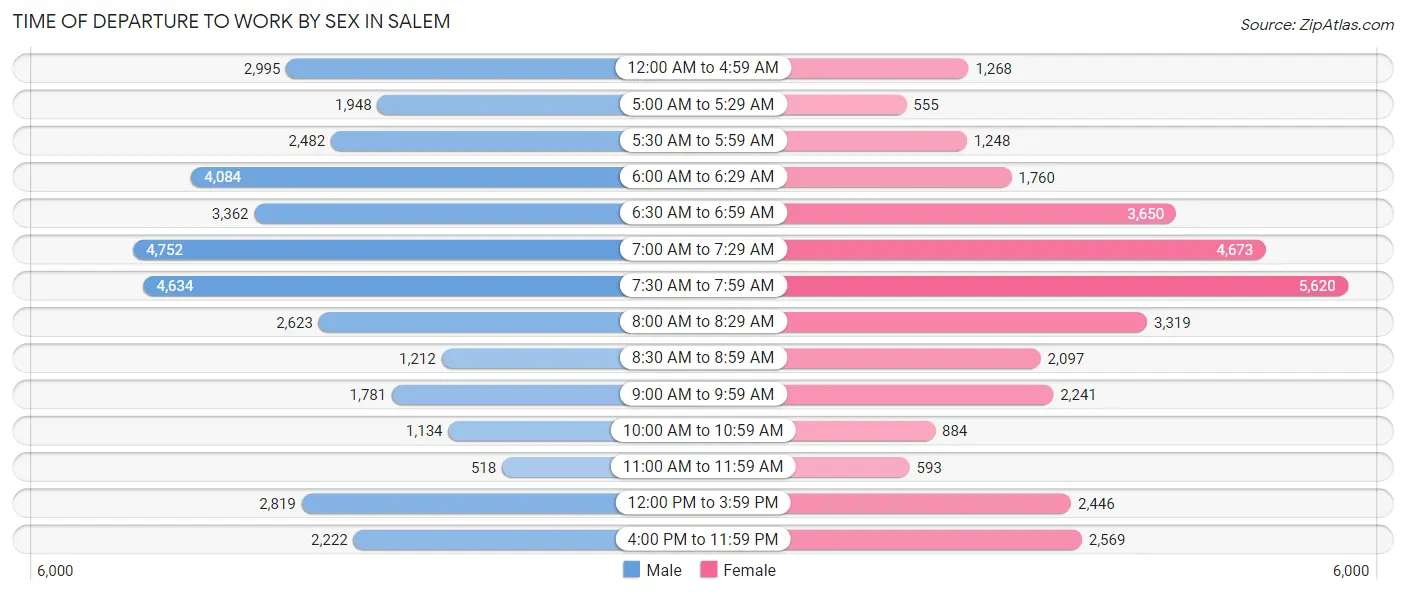
| Time of Departure | Male | Female |
| 12:00 AM to 4:59 AM | 2,995 (8.2%) | 1,268 (3.8%) |
| 5:00 AM to 5:29 AM | 1,948 (5.3%) | 555 (1.7%) |
| 5:30 AM to 5:59 AM | 2,482 (6.8%) | 1,248 (3.8%) |
| 6:00 AM to 6:29 AM | 4,084 (11.2%) | 1,760 (5.3%) |
| 6:30 AM to 6:59 AM | 3,362 (9.2%) | 3,650 (11.1%) |
| 7:00 AM to 7:29 AM | 4,752 (13.0%) | 4,673 (14.2%) |
| 7:30 AM to 7:59 AM | 4,634 (12.7%) | 5,620 (17.1%) |
| 8:00 AM to 8:29 AM | 2,623 (7.2%) | 3,319 (10.1%) |
| 8:30 AM to 8:59 AM | 1,212 (3.3%) | 2,097 (6.4%) |
| 9:00 AM to 9:59 AM | 1,781 (4.9%) | 2,241 (6.8%) |
| 10:00 AM to 10:59 AM | 1,134 (3.1%) | 884 (2.7%) |
| 11:00 AM to 11:59 AM | 518 (1.4%) | 593 (1.8%) |
| 12:00 PM to 3:59 PM | 2,819 (7.7%) | 2,446 (7.4%) |
| 4:00 PM to 11:59 PM | 2,222 (6.1%) | 2,569 (7.8%) |
| Total | 36,566 (100.0%) | 32,923 (100.0%) |
Housing Occupancy in Salem
Occupancy by Ownership in Salem
Of the total 66,283 dwellings in Salem, owner-occupied units account for 36,397 (54.9%), while renter-occupied units make up 29,886 (45.1%).
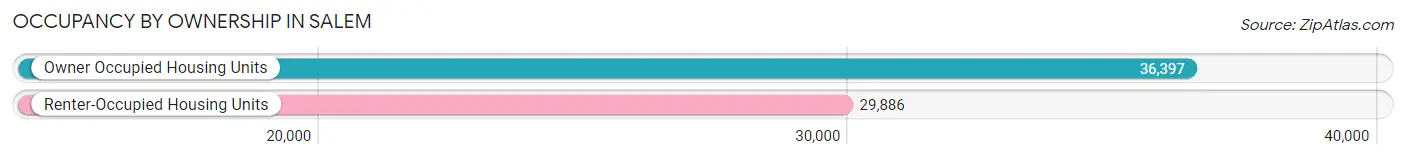
| Occupancy | # Housing Units | % Housing Units |
| Owner Occupied Housing Units | 36,397 | 54.9% |
| Renter-Occupied Housing Units | 29,886 | 45.1% |
| Total Occupied Housing Units | 66,283 | 100.0% |
Occupancy by Household Size in Salem
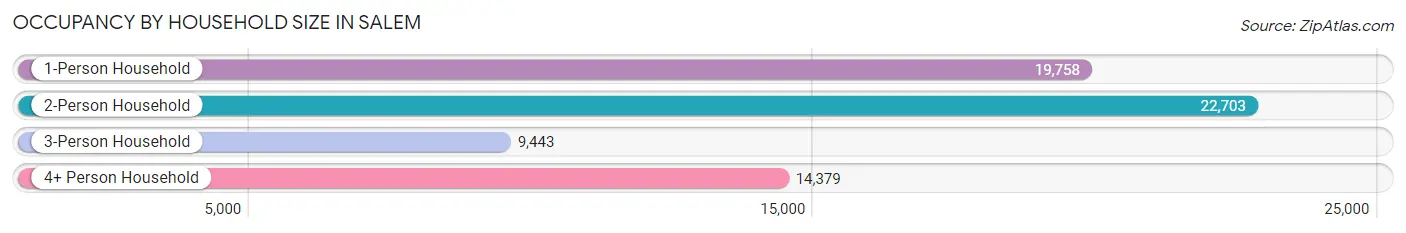
| Household Size | # Housing Units | % Housing Units |
| 1-Person Household | 19,758 | 29.8% |
| 2-Person Household | 22,703 | 34.3% |
| 3-Person Household | 9,443 | 14.2% |
| 4+ Person Household | 14,379 | 21.7% |
| Total Housing Units | 66,283 | 100.0% |
Occupancy by Ownership by Household Size in Salem
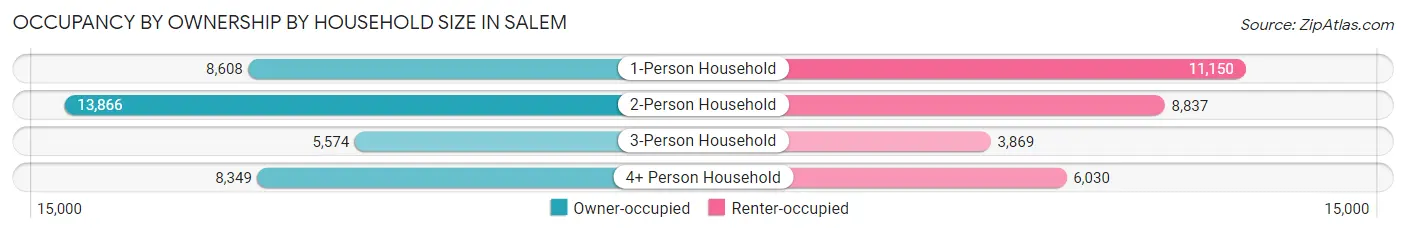
| Household Size | Owner-occupied | Renter-occupied |
| 1-Person Household | 8,608 (43.6%) | 11,150 (56.4%) |
| 2-Person Household | 13,866 (61.1%) | 8,837 (38.9%) |
| 3-Person Household | 5,574 (59.0%) | 3,869 (41.0%) |
| 4+ Person Household | 8,349 (58.1%) | 6,030 (41.9%) |
| Total Housing Units | 36,397 (54.9%) | 29,886 (45.1%) |
Occupancy by Educational Attainment in Salem
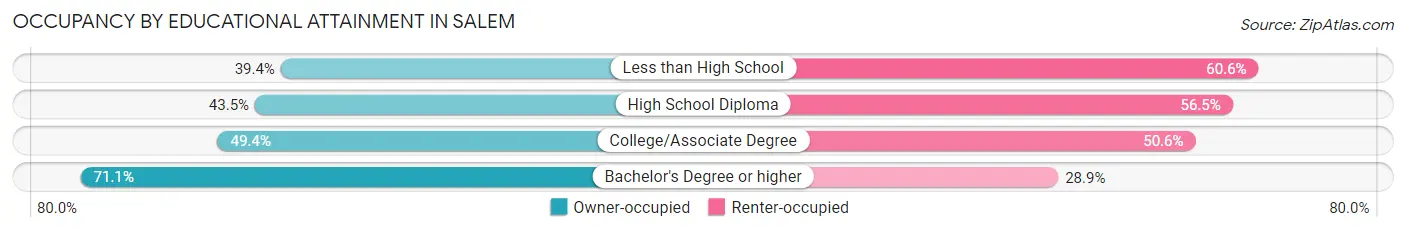
| Household Size | Owner-occupied | Renter-occupied |
| Less than High School | 2,161 (39.4%) | 3,327 (60.6%) |
| High School Diploma | 5,514 (43.5%) | 7,170 (56.5%) |
| College/Associate Degree | 12,485 (49.4%) | 12,794 (50.6%) |
| Bachelor's Degree or higher | 16,237 (71.1%) | 6,595 (28.9%) |
Occupancy by Age of Householder in Salem
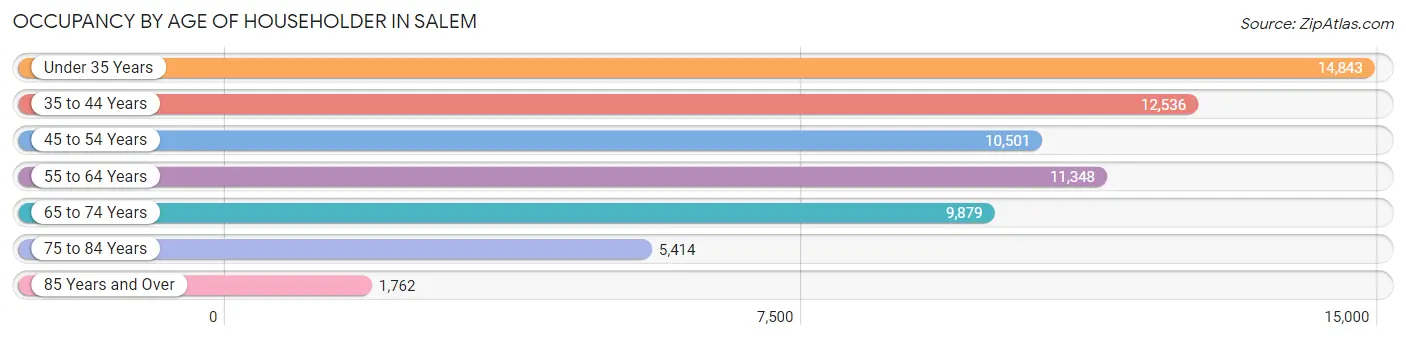
| Age Bracket | # Households | % Households |
| Under 35 Years | 14,843 | 22.4% |
| 35 to 44 Years | 12,536 | 18.9% |
| 45 to 54 Years | 10,501 | 15.8% |
| 55 to 64 Years | 11,348 | 17.1% |
| 65 to 74 Years | 9,879 | 14.9% |
| 75 to 84 Years | 5,414 | 8.2% |
| 85 Years and Over | 1,762 | 2.7% |
| Total | 66,283 | 100.0% |
Housing Finances in Salem
Median Income by Occupancy in Salem
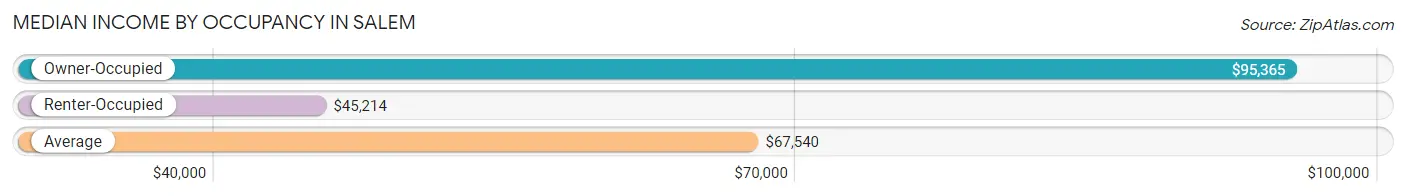
| Occupancy Type | # Households | Median Income |
| Owner-Occupied | 36,397 (54.9%) | $95,365 |
| Renter-Occupied | 29,886 (45.1%) | $45,214 |
| Average | 66,283 (100.0%) | $67,540 |
Occupancy by Householder Income Bracket in Salem
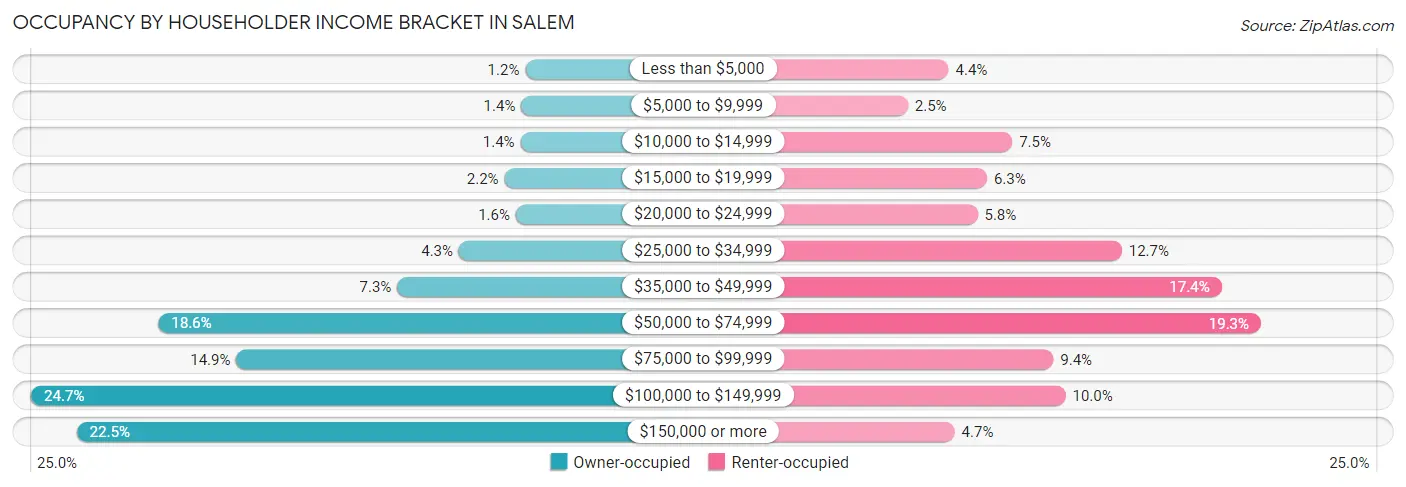
| Income Bracket | Owner-occupied | Renter-occupied |
| Less than $5,000 | 423 (1.2%) | 1,323 (4.4%) |
| $5,000 to $9,999 | 492 (1.3%) | 743 (2.5%) |
| $10,000 to $14,999 | 505 (1.4%) | 2,229 (7.5%) |
| $15,000 to $19,999 | 782 (2.1%) | 1,871 (6.3%) |
| $20,000 to $24,999 | 586 (1.6%) | 1,736 (5.8%) |
| $25,000 to $34,999 | 1,574 (4.3%) | 3,790 (12.7%) |
| $35,000 to $49,999 | 2,643 (7.3%) | 5,209 (17.4%) |
| $50,000 to $74,999 | 6,779 (18.6%) | 5,769 (19.3%) |
| $75,000 to $99,999 | 5,429 (14.9%) | 2,814 (9.4%) |
| $100,000 to $149,999 | 8,986 (24.7%) | 2,990 (10.0%) |
| $150,000 or more | 8,198 (22.5%) | 1,412 (4.7%) |
| Total | 36,397 (100.0%) | 29,886 (100.0%) |
Monthly Housing Cost Tiers in Salem
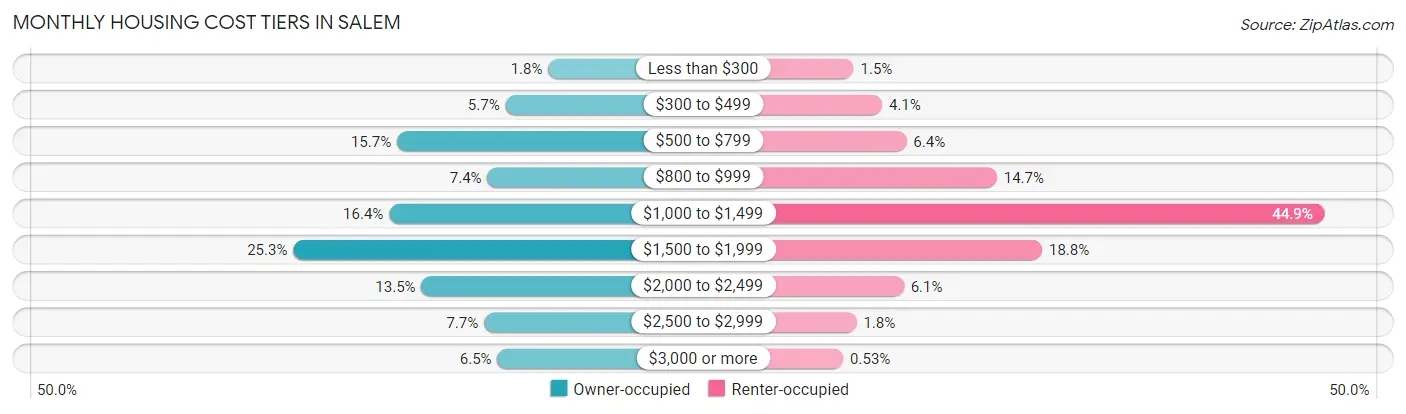
| Monthly Cost | Owner-occupied | Renter-occupied |
| Less than $300 | 652 (1.8%) | 446 (1.5%) |
| $300 to $499 | 2,085 (5.7%) | 1,228 (4.1%) |
| $500 to $799 | 5,723 (15.7%) | 1,898 (6.4%) |
| $800 to $999 | 2,690 (7.4%) | 4,383 (14.7%) |
| $1,000 to $1,499 | 5,985 (16.4%) | 13,403 (44.9%) |
| $1,500 to $1,999 | 9,199 (25.3%) | 5,631 (18.8%) |
| $2,000 to $2,499 | 4,904 (13.5%) | 1,822 (6.1%) |
| $2,500 to $2,999 | 2,803 (7.7%) | 522 (1.8%) |
| $3,000 or more | 2,356 (6.5%) | 159 (0.5%) |
| Total | 36,397 (100.0%) | 29,886 (100.0%) |
Physical Housing Characteristics in Salem
Housing Structures in Salem
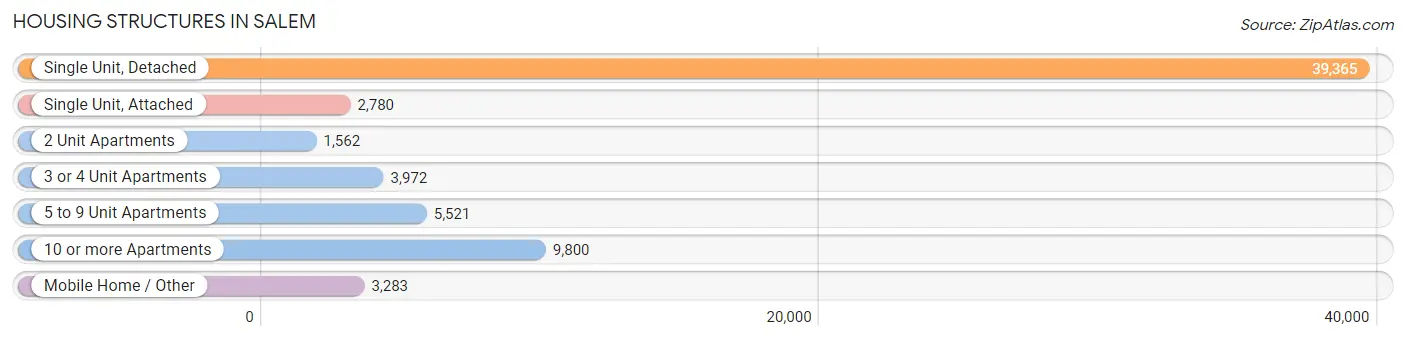
| Structure Type | # Housing Units | % Housing Units |
| Single Unit, Detached | 39,365 | 59.4% |
| Single Unit, Attached | 2,780 | 4.2% |
| 2 Unit Apartments | 1,562 | 2.4% |
| 3 or 4 Unit Apartments | 3,972 | 6.0% |
| 5 to 9 Unit Apartments | 5,521 | 8.3% |
| 10 or more Apartments | 9,800 | 14.8% |
| Mobile Home / Other | 3,283 | 5.0% |
| Total | 66,283 | 100.0% |
Housing Structures by Occupancy in Salem
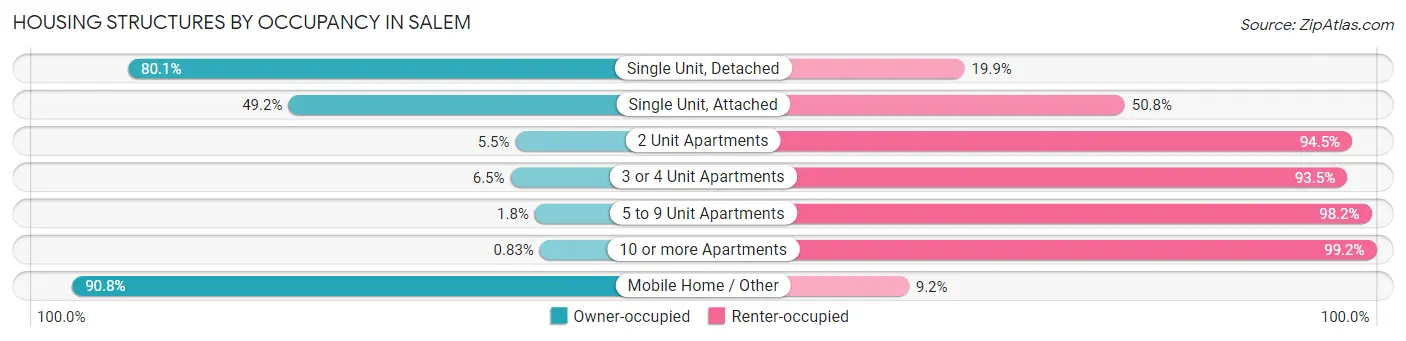
| Structure Type | Owner-occupied | Renter-occupied |
| Single Unit, Detached | 31,524 (80.1%) | 7,841 (19.9%) |
| Single Unit, Attached | 1,369 (49.2%) | 1,411 (50.8%) |
| 2 Unit Apartments | 86 (5.5%) | 1,476 (94.5%) |
| 3 or 4 Unit Apartments | 257 (6.5%) | 3,715 (93.5%) |
| 5 to 9 Unit Apartments | 98 (1.8%) | 5,423 (98.2%) |
| 10 or more Apartments | 81 (0.8%) | 9,719 (99.2%) |
| Mobile Home / Other | 2,982 (90.8%) | 301 (9.2%) |
| Total | 36,397 (54.9%) | 29,886 (45.1%) |
Housing Structures by Number of Rooms in Salem
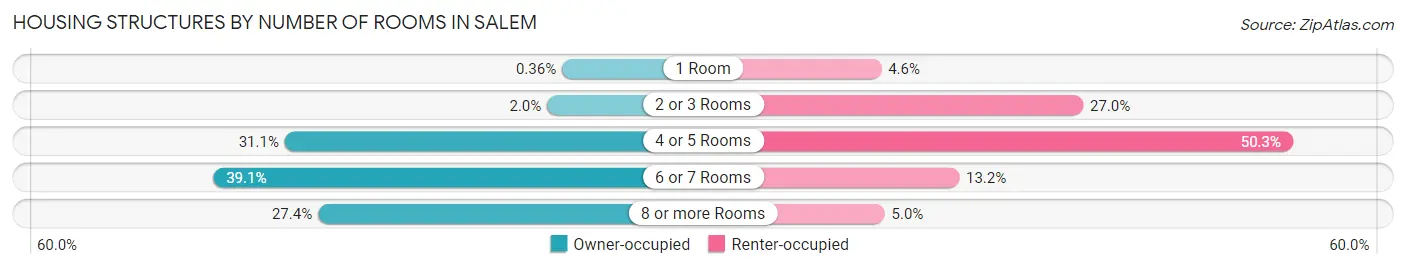
| Number of Rooms | Owner-occupied | Renter-occupied |
| 1 Room | 130 (0.4%) | 1,368 (4.6%) |
| 2 or 3 Rooms | 733 (2.0%) | 8,064 (27.0%) |
| 4 or 5 Rooms | 11,330 (31.1%) | 15,021 (50.3%) |
| 6 or 7 Rooms | 14,218 (39.1%) | 3,950 (13.2%) |
| 8 or more Rooms | 9,986 (27.4%) | 1,483 (5.0%) |
| Total | 36,397 (100.0%) | 29,886 (100.0%) |
Housing Structure by Heating Type in Salem
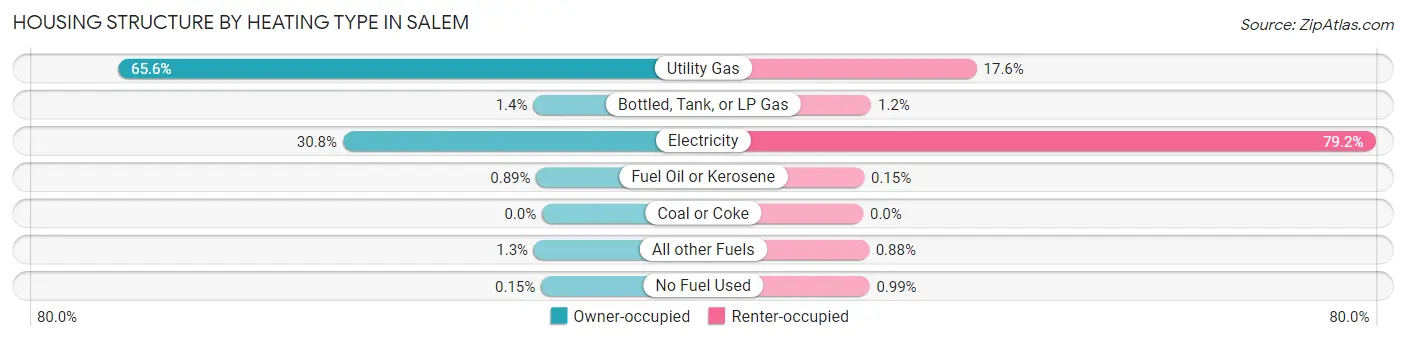
| Heating Type | Owner-occupied | Renter-occupied |
| Utility Gas | 23,858 (65.5%) | 5,249 (17.6%) |
| Bottled, Tank, or LP Gas | 494 (1.4%) | 372 (1.2%) |
| Electricity | 11,211 (30.8%) | 23,662 (79.2%) |
| Fuel Oil or Kerosene | 324 (0.9%) | 44 (0.2%) |
| Coal or Coke | 0 (0.0%) | 0 (0.0%) |
| All other Fuels | 457 (1.3%) | 264 (0.9%) |
| No Fuel Used | 53 (0.2%) | 295 (1.0%) |
| Total | 36,397 (100.0%) | 29,886 (100.0%) |
Household Vehicle Usage in Salem
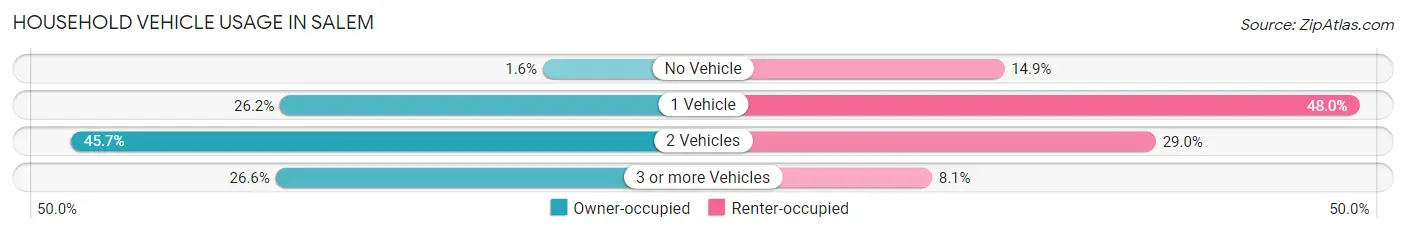
| Vehicles per Household | Owner-occupied | Renter-occupied |
| No Vehicle | 588 (1.6%) | 4,443 (14.9%) |
| 1 Vehicle | 9,519 (26.2%) | 14,351 (48.0%) |
| 2 Vehicles | 16,620 (45.7%) | 8,669 (29.0%) |
| 3 or more Vehicles | 9,670 (26.6%) | 2,423 (8.1%) |
| Total | 36,397 (100.0%) | 29,886 (100.0%) |
Real Estate & Mortgages in Salem
Real Estate and Mortgage Overview in Salem
| Characteristic | Without Mortgage | With Mortgage |
| Housing Units | 11,020 | 25,377 |
| Median Property Value | $321,600 | $358,600 |
| Median Household Income | $70,426 | $6,478 |
| Monthly Housing Costs | $661 | $2,329 |
| Real Estate Taxes | $3,481 | $288 |
Property Value by Mortgage Status in Salem
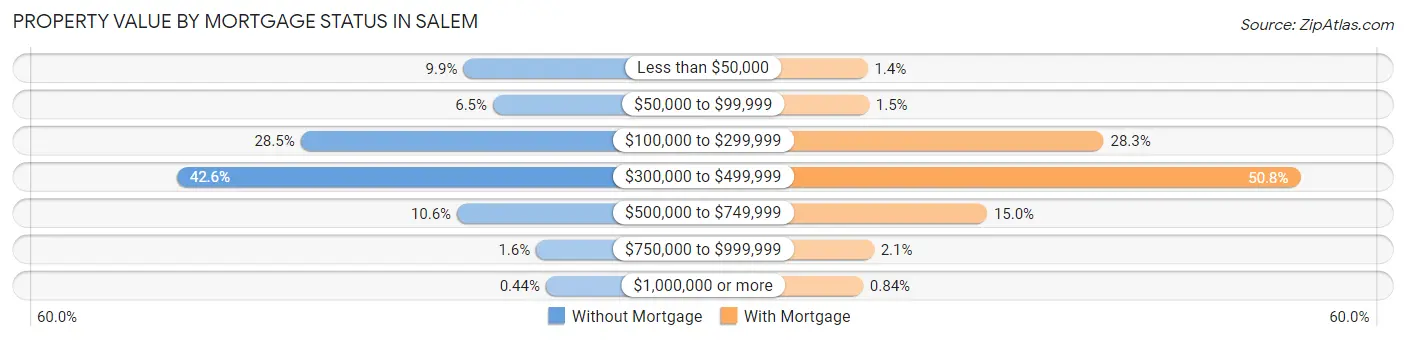
| Property Value | Without Mortgage | With Mortgage |
| Less than $50,000 | 1,088 (9.9%) | 346 (1.4%) |
| $50,000 to $99,999 | 714 (6.5%) | 386 (1.5%) |
| $100,000 to $299,999 | 3,137 (28.5%) | 7,191 (28.3%) |
| $300,000 to $499,999 | 4,694 (42.6%) | 12,899 (50.8%) |
| $500,000 to $749,999 | 1,167 (10.6%) | 3,812 (15.0%) |
| $750,000 to $999,999 | 171 (1.5%) | 529 (2.1%) |
| $1,000,000 or more | 49 (0.4%) | 214 (0.8%) |
| Total | 11,020 (100.0%) | 25,377 (100.0%) |
Household Income by Mortgage Status in Salem
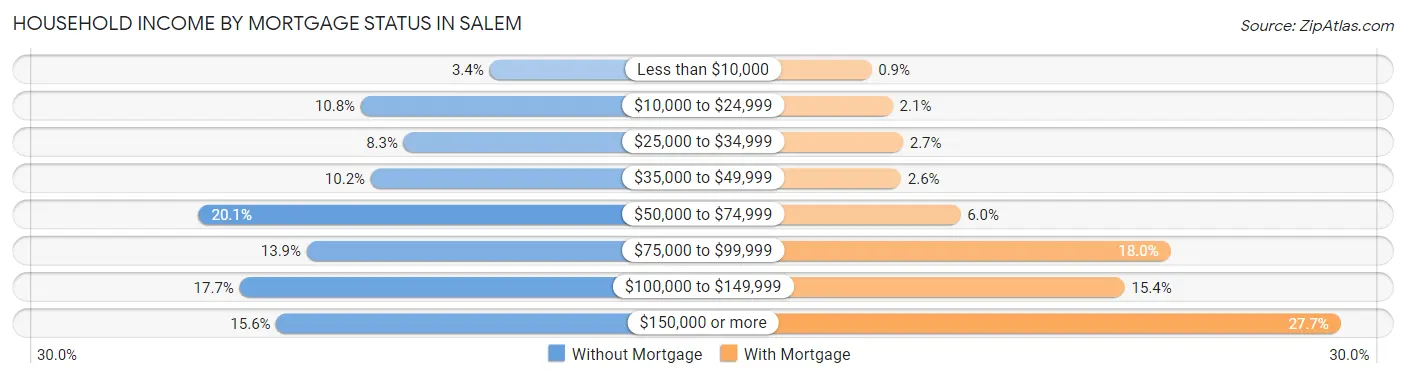
| Household Income | Without Mortgage | With Mortgage |
| Less than $10,000 | 378 (3.4%) | 229 (0.9%) |
| $10,000 to $24,999 | 1,188 (10.8%) | 537 (2.1%) |
| $25,000 to $34,999 | 918 (8.3%) | 685 (2.7%) |
| $35,000 to $49,999 | 1,125 (10.2%) | 656 (2.6%) |
| $50,000 to $74,999 | 2,211 (20.1%) | 1,518 (6.0%) |
| $75,000 to $99,999 | 1,528 (13.9%) | 4,568 (18.0%) |
| $100,000 to $149,999 | 1,952 (17.7%) | 3,901 (15.4%) |
| $150,000 or more | 1,720 (15.6%) | 7,034 (27.7%) |
| Total | 11,020 (100.0%) | 25,377 (100.0%) |
Property Value to Household Income Ratio in Salem
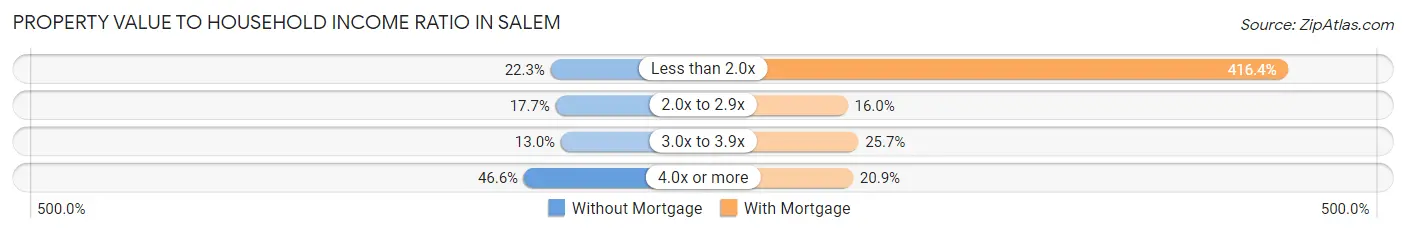
| Value-to-Income Ratio | Without Mortgage | With Mortgage |
| Less than 2.0x | 2,456 (22.3%) | 105,659 (416.4%) |
| 2.0x to 2.9x | 1,955 (17.7%) | 4,053 (16.0%) |
| 3.0x to 3.9x | 1,433 (13.0%) | 6,515 (25.7%) |
| 4.0x or more | 5,132 (46.6%) | 5,293 (20.9%) |
| Total | 11,020 (100.0%) | 25,377 (100.0%) |
Real Estate Taxes by Mortgage Status in Salem
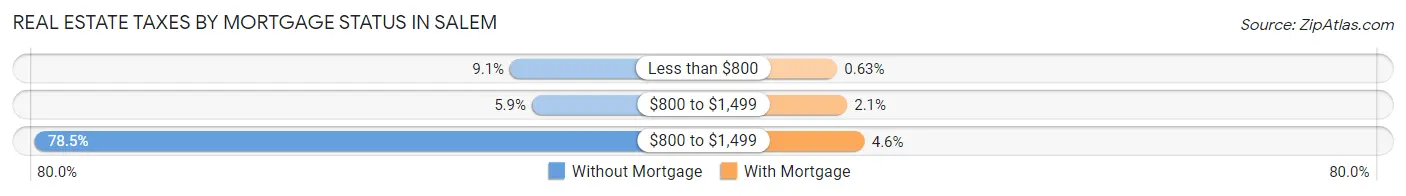
| Property Taxes | Without Mortgage | With Mortgage |
| Less than $800 | 1,001 (9.1%) | 159 (0.6%) |
| $800 to $1,499 | 649 (5.9%) | 528 (2.1%) |
| $800 to $1,499 | 8,649 (78.5%) | 1,177 (4.6%) |
| Total | 11,020 (100.0%) | 25,377 (100.0%) |
Health & Disability in Salem
Health Insurance Coverage by Age in Salem
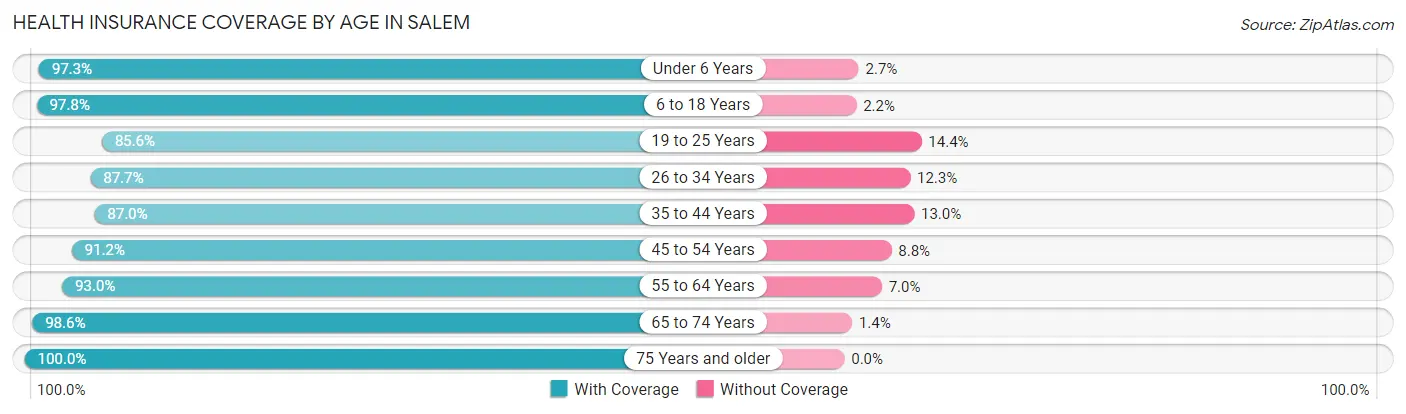
| Age Bracket | With Coverage | Without Coverage |
| Under 6 Years | 12,375 (97.3%) | 338 (2.7%) |
| 6 to 18 Years | 30,271 (97.8%) | 687 (2.2%) |
| 19 to 25 Years | 13,962 (85.6%) | 2,345 (14.4%) |
| 26 to 34 Years | 20,753 (87.7%) | 2,901 (12.3%) |
| 35 to 44 Years | 19,814 (87.0%) | 2,964 (13.0%) |
| 45 to 54 Years | 17,243 (91.2%) | 1,657 (8.8%) |
| 55 to 64 Years | 17,526 (93.0%) | 1,315 (7.0%) |
| 65 to 74 Years | 15,468 (98.6%) | 224 (1.4%) |
| 75 Years and older | 10,361 (100.0%) | 0 (0.0%) |
| Total | 157,773 (92.7%) | 12,431 (7.3%) |
Health Insurance Coverage by Citizenship Status in Salem
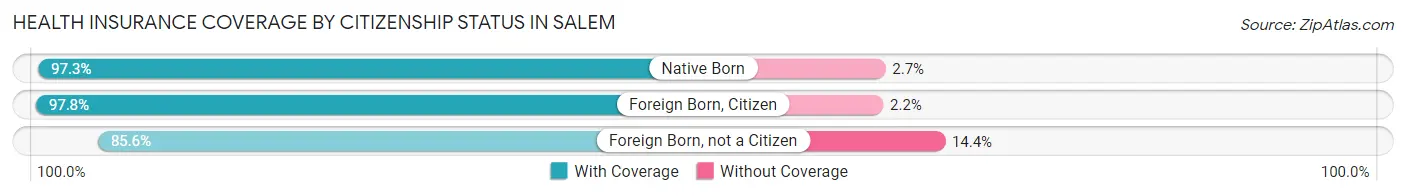
| Citizenship Status | With Coverage | Without Coverage |
| Native Born | 12,375 (97.3%) | 338 (2.7%) |
| Foreign Born, Citizen | 30,271 (97.8%) | 687 (2.2%) |
| Foreign Born, not a Citizen | 13,962 (85.6%) | 2,345 (14.4%) |
Health Insurance Coverage by Household Income in Salem
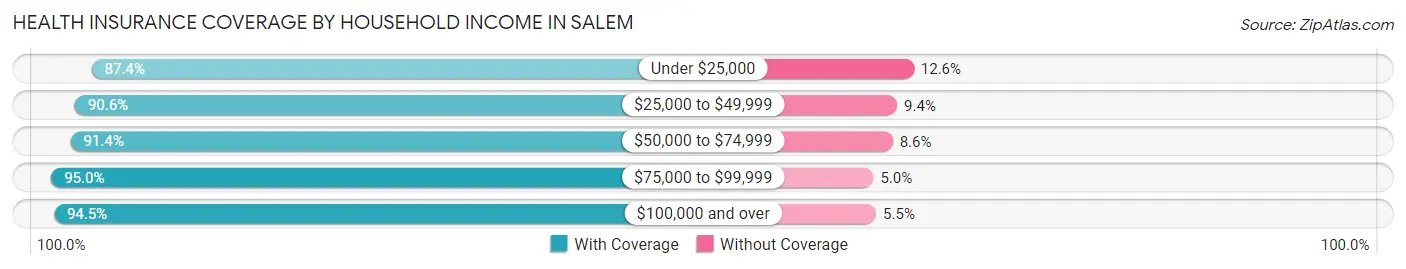
| Household Income | With Coverage | Without Coverage |
| Under $25,000 | 16,154 (87.4%) | 2,321 (12.6%) |
| $25,000 to $49,999 | 25,904 (90.6%) | 2,697 (9.4%) |
| $50,000 to $74,999 | 26,518 (91.4%) | 2,495 (8.6%) |
| $75,000 to $99,999 | 22,097 (95.0%) | 1,163 (5.0%) |
| $100,000 and over | 63,777 (94.5%) | 3,711 (5.5%) |
Public vs Private Health Insurance Coverage by Age in Salem
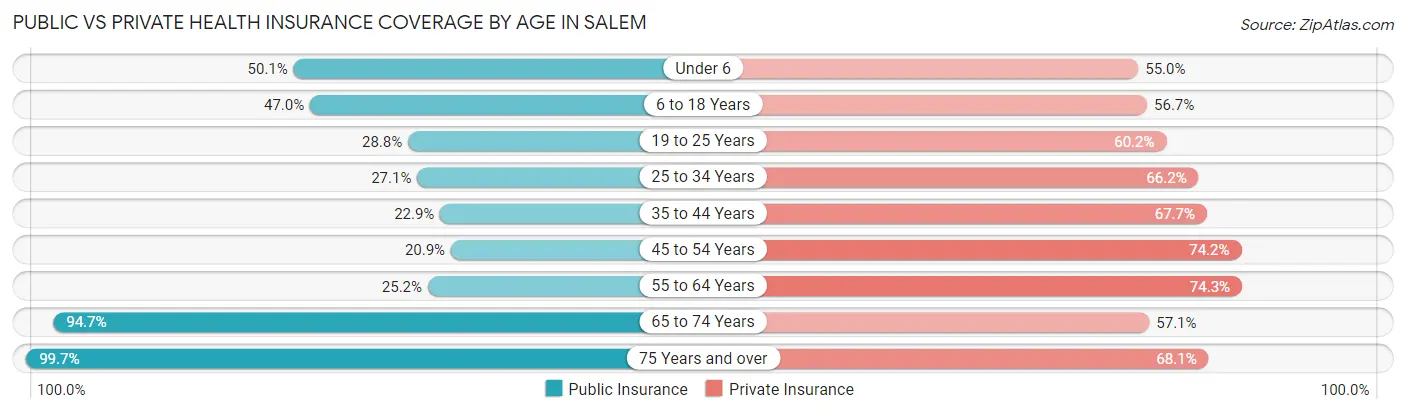
| Age Bracket | Public Insurance | Private Insurance |
| Under 6 | 6,365 (50.1%) | 6,997 (55.0%) |
| 6 to 18 Years | 14,552 (47.0%) | 17,544 (56.7%) |
| 19 to 25 Years | 4,701 (28.8%) | 9,821 (60.2%) |
| 25 to 34 Years | 6,414 (27.1%) | 15,660 (66.2%) |
| 35 to 44 Years | 5,208 (22.9%) | 15,429 (67.7%) |
| 45 to 54 Years | 3,942 (20.9%) | 14,014 (74.2%) |
| 55 to 64 Years | 4,738 (25.2%) | 13,991 (74.3%) |
| 65 to 74 Years | 14,854 (94.7%) | 8,958 (57.1%) |
| 75 Years and over | 10,329 (99.7%) | 7,052 (68.1%) |
| Total | 71,103 (41.8%) | 109,466 (64.3%) |
Disability Status by Sex by Age in Salem
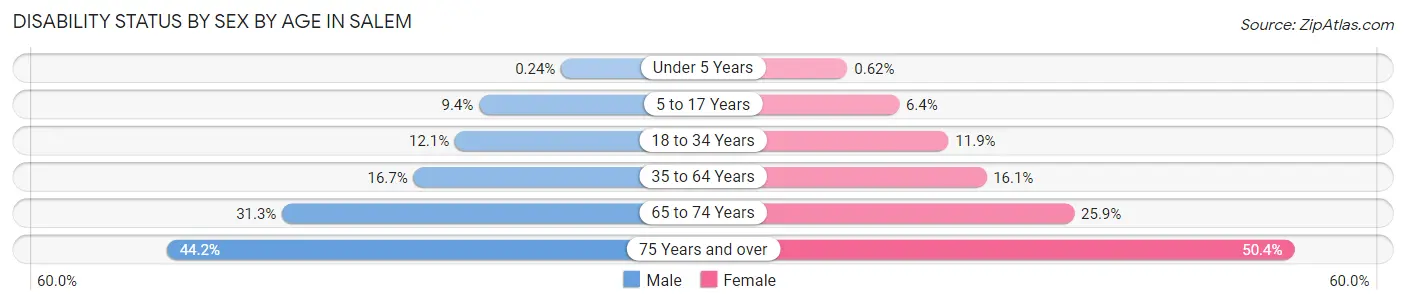
| Age Bracket | Male | Female |
| Under 5 Years | 14 (0.2%) | 28 (0.6%) |
| 5 to 17 Years | 1,502 (9.4%) | 907 (6.4%) |
| 18 to 34 Years | 2,547 (12.1%) | 2,585 (11.9%) |
| 35 to 64 Years | 4,990 (16.7%) | 4,921 (16.1%) |
| 65 to 74 Years | 2,144 (31.3%) | 2,288 (25.9%) |
| 75 Years and over | 1,885 (44.2%) | 3,070 (50.4%) |
Disability Class by Sex by Age in Salem
Disability Class: Hearing Difficulty
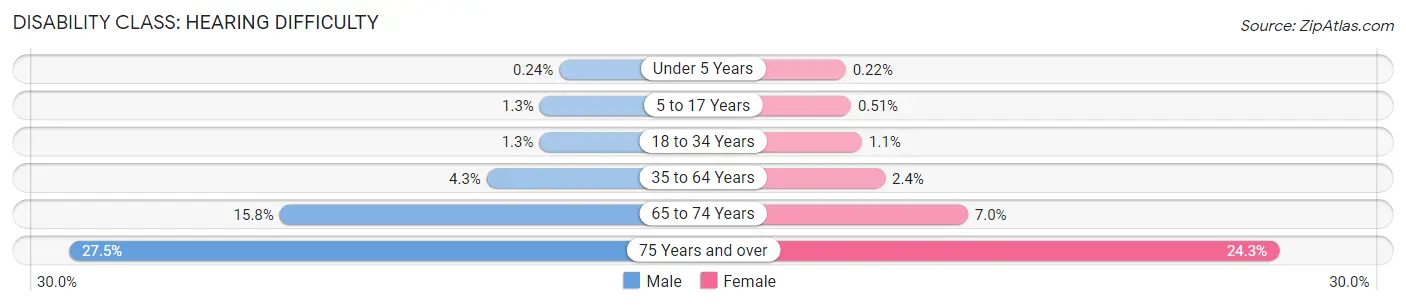
| Age Bracket | Male | Female |
| Under 5 Years | 14 (0.2%) | 10 (0.2%) |
| 5 to 17 Years | 211 (1.3%) | 72 (0.5%) |
| 18 to 34 Years | 282 (1.3%) | 246 (1.1%) |
| 35 to 64 Years | 1,276 (4.3%) | 738 (2.4%) |
| 65 to 74 Years | 1,082 (15.8%) | 621 (7.0%) |
| 75 Years and over | 1,175 (27.5%) | 1,483 (24.3%) |
Disability Class: Vision Difficulty
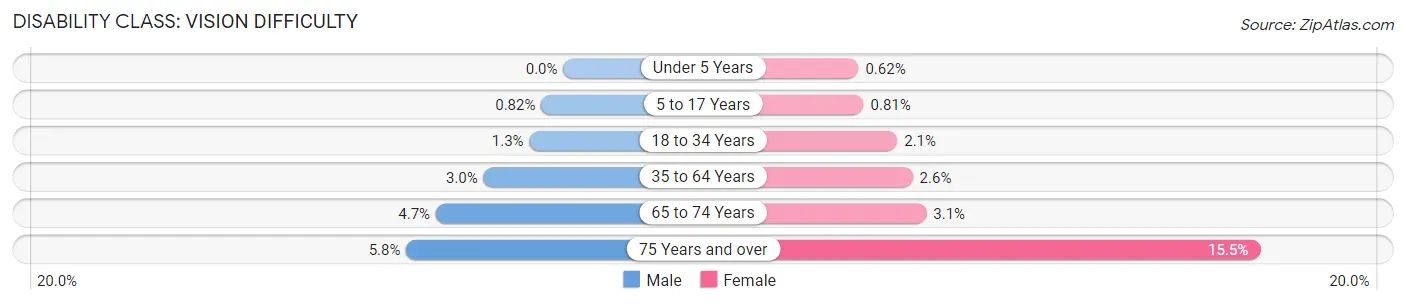
| Age Bracket | Male | Female |
| Under 5 Years | 0 (0.0%) | 28 (0.6%) |
| 5 to 17 Years | 132 (0.8%) | 115 (0.8%) |
| 18 to 34 Years | 267 (1.3%) | 449 (2.1%) |
| 35 to 64 Years | 885 (3.0%) | 805 (2.6%) |
| 65 to 74 Years | 324 (4.7%) | 278 (3.1%) |
| 75 Years and over | 249 (5.8%) | 946 (15.5%) |
Disability Class: Cognitive Difficulty
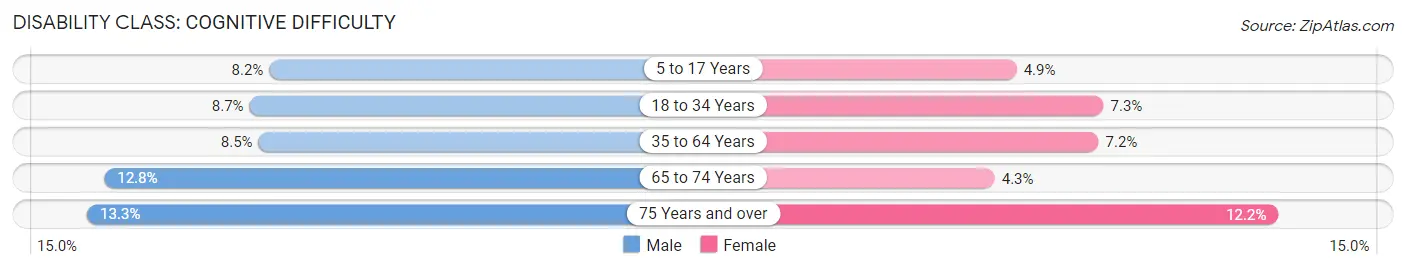
| Age Bracket | Male | Female |
| 5 to 17 Years | 1,312 (8.2%) | 694 (4.9%) |
| 18 to 34 Years | 1,845 (8.7%) | 1,586 (7.3%) |
| 35 to 64 Years | 2,540 (8.5%) | 2,187 (7.1%) |
| 65 to 74 Years | 875 (12.8%) | 377 (4.3%) |
| 75 Years and over | 566 (13.3%) | 740 (12.1%) |
Disability Class: Ambulatory Difficulty
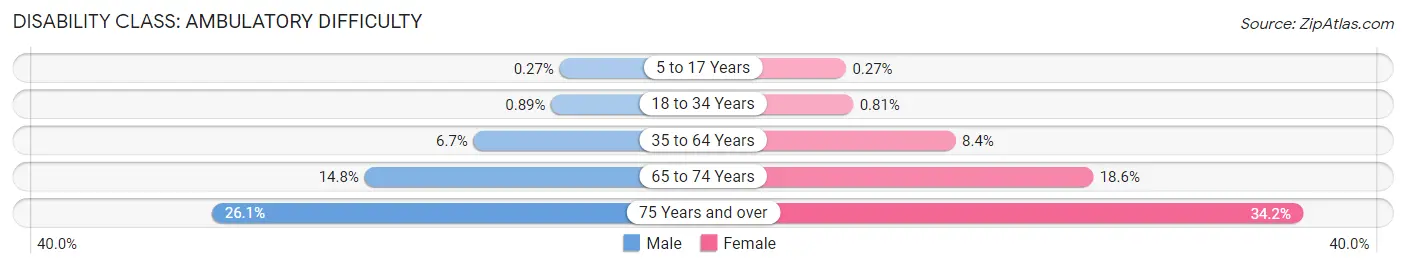
| Age Bracket | Male | Female |
| 5 to 17 Years | 44 (0.3%) | 38 (0.3%) |
| 18 to 34 Years | 188 (0.9%) | 177 (0.8%) |
| 35 to 64 Years | 1,992 (6.7%) | 2,574 (8.4%) |
| 65 to 74 Years | 1,010 (14.7%) | 1,648 (18.6%) |
| 75 Years and over | 1,114 (26.1%) | 2,085 (34.2%) |
Disability Class: Self-Care Difficulty
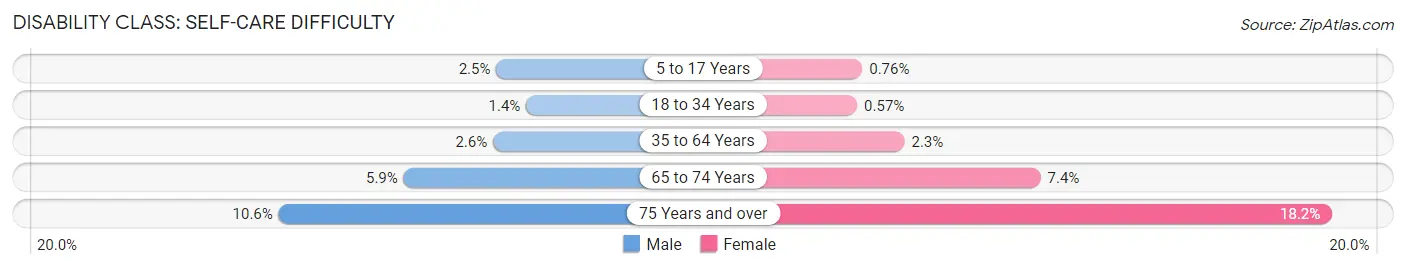
| Age Bracket | Male | Female |
| 5 to 17 Years | 398 (2.5%) | 108 (0.8%) |
| 18 to 34 Years | 292 (1.4%) | 124 (0.6%) |
| 35 to 64 Years | 782 (2.6%) | 713 (2.3%) |
| 65 to 74 Years | 406 (5.9%) | 653 (7.4%) |
| 75 Years and over | 451 (10.6%) | 1,109 (18.2%) |
Technology Access in Salem
Computing Device Access in Salem
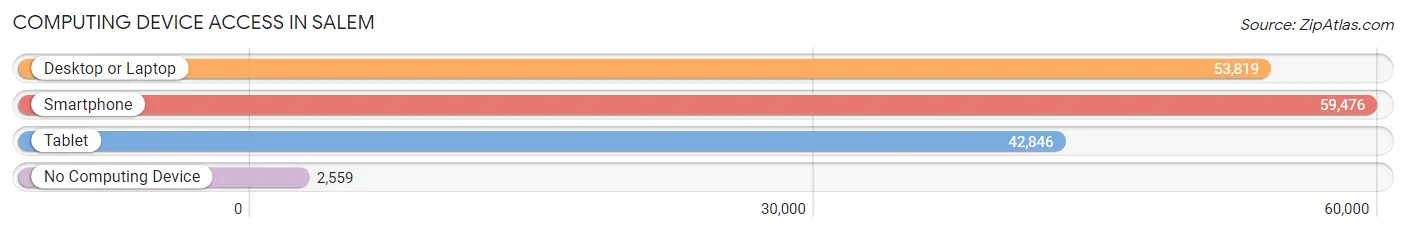
| Device Type | # Households | % Households |
| Desktop or Laptop | 53,819 | 81.2% |
| Smartphone | 59,476 | 89.7% |
| Tablet | 42,846 | 64.6% |
| No Computing Device | 2,559 | 3.9% |
| Total | 66,283 | 100.0% |
Internet Access in Salem
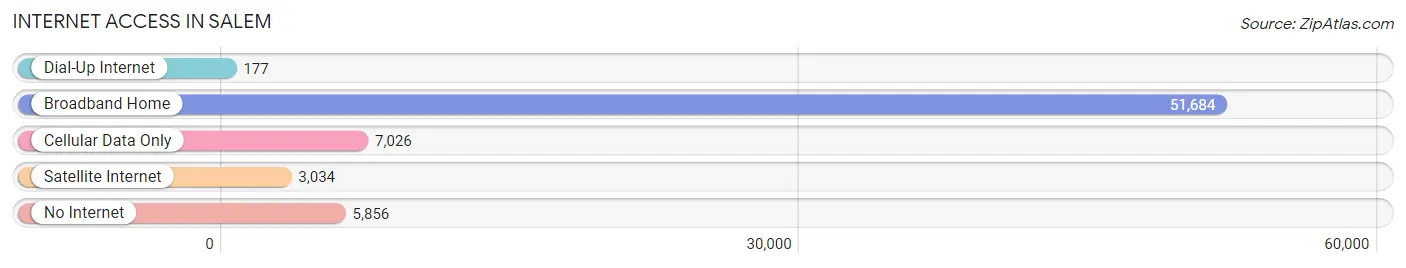
| Internet Type | # Households | % Households |
| Dial-Up Internet | 177 | 0.3% |
| Broadband Home | 51,684 | 78.0% |
| Cellular Data Only | 7,026 | 10.6% |
| Satellite Internet | 3,034 | 4.6% |
| No Internet | 5,856 | 8.8% |
| Total | 66,283 | 100.0% |
Salem Summary
Salem, Oregon is the capital of the state of Oregon and the county seat of Marion County. It is located in the center of the Willamette Valley, a fertile agricultural region in the Pacific Northwest. The city has a population of approximately 170,000 people, making it the second-largest city in the state after Portland.
Geography
Salem is located in the Willamette Valley, a fertile agricultural region in the Pacific Northwest. The city is situated at the confluence of the Willamette and Santiam Rivers, and is surrounded by rolling hills and mountains. The city is located approximately 45 miles south of Portland, and is the closest major city to the Oregon Coast.
The climate in Salem is mild and temperate, with warm summers and cool winters. The average annual temperature is around 50 degrees Fahrenheit, and the average annual precipitation is around 40 inches.
Economy
Salem has a diverse economy, with a mix of manufacturing, agriculture, and services. The city is home to several large employers, including the state government, the Oregon State Hospital, and the Oregon State Penitentiary. The city is also home to several large companies, including the Oregon Department of Corrections, the Oregon Department of Human Services, and the Oregon Department of Transportation.
Agriculture is an important part of the economy in Salem, with the city being home to several large farms and agricultural processing plants. The city is also home to several wineries, breweries, and distilleries.
Demographics
As of the 2020 census, the population of Salem was 170,000 people. The racial makeup of the city was 79.3% White, 8.2% Hispanic or Latino, 6.2% Asian, 4.2% African American, and 2.1% Native American. The median household income in Salem was $50,000, and the median home value was $250,000.
The city is home to several large universities, including Willamette University, Corban University, and Western Oregon University. The city is also home to several museums, including the Hallie Ford Museum of Art, the Oregon State Capitol Museum, and the Oregon State Fairgrounds.
Conclusion
Salem, Oregon is the capital of the state of Oregon and the county seat of Marion County. It is located in the center of the Willamette Valley, a fertile agricultural region in the Pacific Northwest. The city has a population of approximately 170,000 people, making it the second-largest city in the state after Portland. The city has a diverse economy, with a mix of manufacturing, agriculture, and services. The racial makeup of the city is 79.3% White, 8.2% Hispanic or Latino, 6.2% Asian, 4.2% African American, and 2.1% Native American. The city is home to several large universities, museums, and other attractions.
Common Questions
What is Per Capita Income in Salem?
Per Capita income in Salem is $35,469.
What is the Median Family Income in Salem?
Median Family Income in Salem is $83,692.
What is the Median Household income in Salem?
Median Household Income in Salem is $67,540.
What is Income or Wage Gap in Salem?
Income or Wage Gap in Salem is 17.5%.
Women in Salem earn 82.5 cents for every dollar earned by a man.
What is Family Income Deficit in Salem?
Family Income Deficit in Salem is $10,057.
Families that are below poverty line in Salem earn $10,057 less on average than the poverty threshold level.
What is Inequality or Gini Index in Salem?
Inequality or Gini Index in Salem is 0.45.
What is the Total Population of Salem?
Total Population of Salem is 175,754.
What is the Total Male Population of Salem?
Total Male Population of Salem is 88,963.
What is the Total Female Population of Salem?
Total Female Population of Salem is 86,791.
What is the Ratio of Males per 100 Females in Salem?
There are 102.50 Males per 100 Females in Salem.
What is the Ratio of Females per 100 Males in Salem?
There are 97.56 Females per 100 Males in Salem.
What is the Median Population Age in Salem?
Median Population Age in Salem is 35.9 Years.
What is the Average Family Size in Salem
Average Family Size in Salem is 3.1 People.
What is the Average Household Size in Salem
Average Household Size in Salem is 2.5 People.
How Large is the Labor Force in Salem?
There are 85,738 People in the Labor Forcein in Salem.
What is the Percentage of People in the Labor Force in Salem?
61.3% of People are in the Labor Force in Salem.
What is the Unemployment Rate in Salem?
Unemployment Rate in Salem is 6.1%.