Carmel By The Sea, CA Map & Demographics
Carmel By The Sea Map
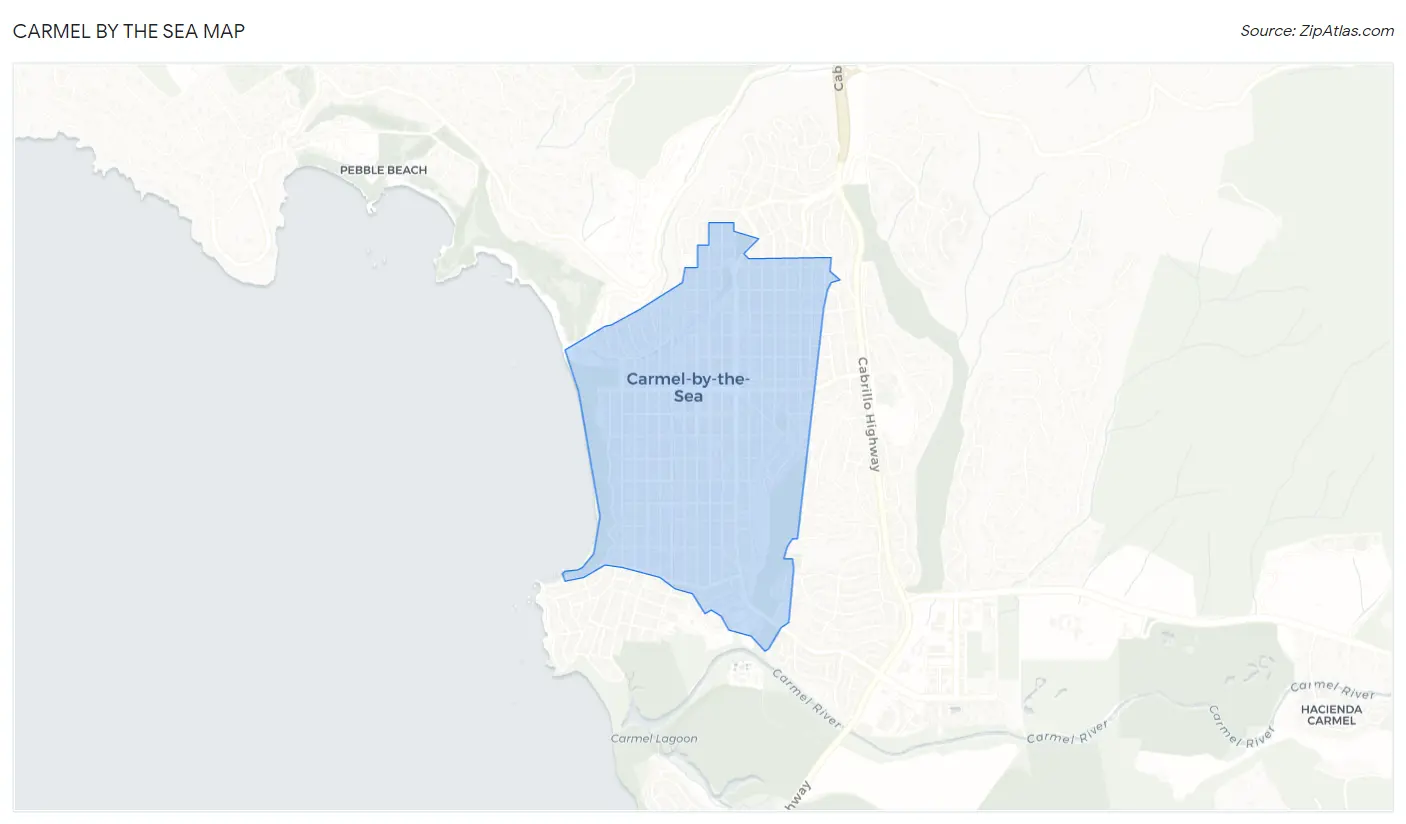
Carmel By The Sea Overview
$84,508
PER CAPITA INCOME
$183,607
AVG FAMILY INCOME
$126,406
AVG HOUSEHOLD INCOME
49.1%
WAGE / INCOME GAP [ % ]
50.9¢/ $1
WAGE / INCOME GAP [ $ ]
0.47
INEQUALITY / GINI INDEX
3,239
TOTAL POPULATION
1,521
MALE POPULATION
1,718
FEMALE POPULATION
88.53
MALES / 100 FEMALES
112.95
FEMALES / 100 MALES
65.0
MEDIAN AGE
2.3
AVG FAMILY SIZE
2.0
AVG HOUSEHOLD SIZE
1,579
LABOR FORCE [ PEOPLE ]
53.3%
PERCENT IN LABOR FORCE
1.0%
UNEMPLOYMENT RATE
Carmel By The Sea Zip Codes
Carmel By The Sea Area Codes
Income in Carmel By The Sea
Income Overview in Carmel By The Sea
Per Capita Income in Carmel By The Sea is $84,508, while median incomes of families and households are $183,607 and $126,406 respectively.
| Characteristic | Number | Measure |
| Per Capita Income | 3,239 | $84,508 |
| Median Family Income | 1,005 | $183,607 |
| Mean Family Income | 1,005 | $218,927 |
| Median Household Income | 1,587 | $126,406 |
| Mean Household Income | 1,587 | $179,911 |
| Income Deficit | 1,005 | $0 |
| Wage / Income Gap (%) | 3,239 | 49.06% |
| Wage / Income Gap ($) | 3,239 | 50.94¢ per $1 |
| Gini / Inequality Index | 3,239 | 0.47 |
Earnings by Sex in Carmel By The Sea
Average Earnings in Carmel By The Sea are $83,750, $101,670 for men and $51,786 for women, a difference of 49.1%.
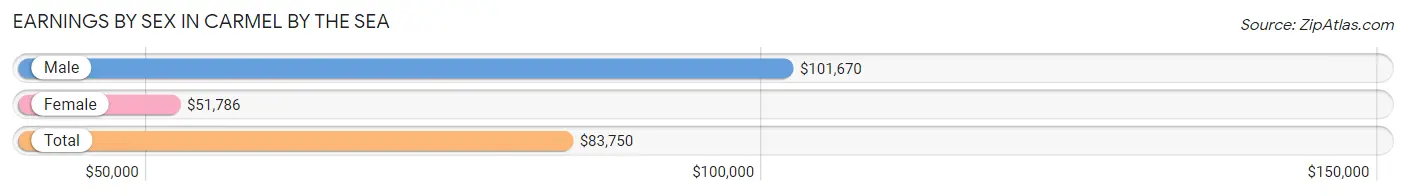
| Sex | Number | Average Earnings |
| Male | 777 (45.8%) | $101,670 |
| Female | 920 (54.2%) | $51,786 |
| Total | 1,697 (100.0%) | $83,750 |
Earnings by Sex by Income Bracket in Carmel By The Sea
The most common earnings brackets in Carmel By The Sea are $100,000+ for men (464 | 59.7%) and $100,000+ for women (229 | 24.9%).
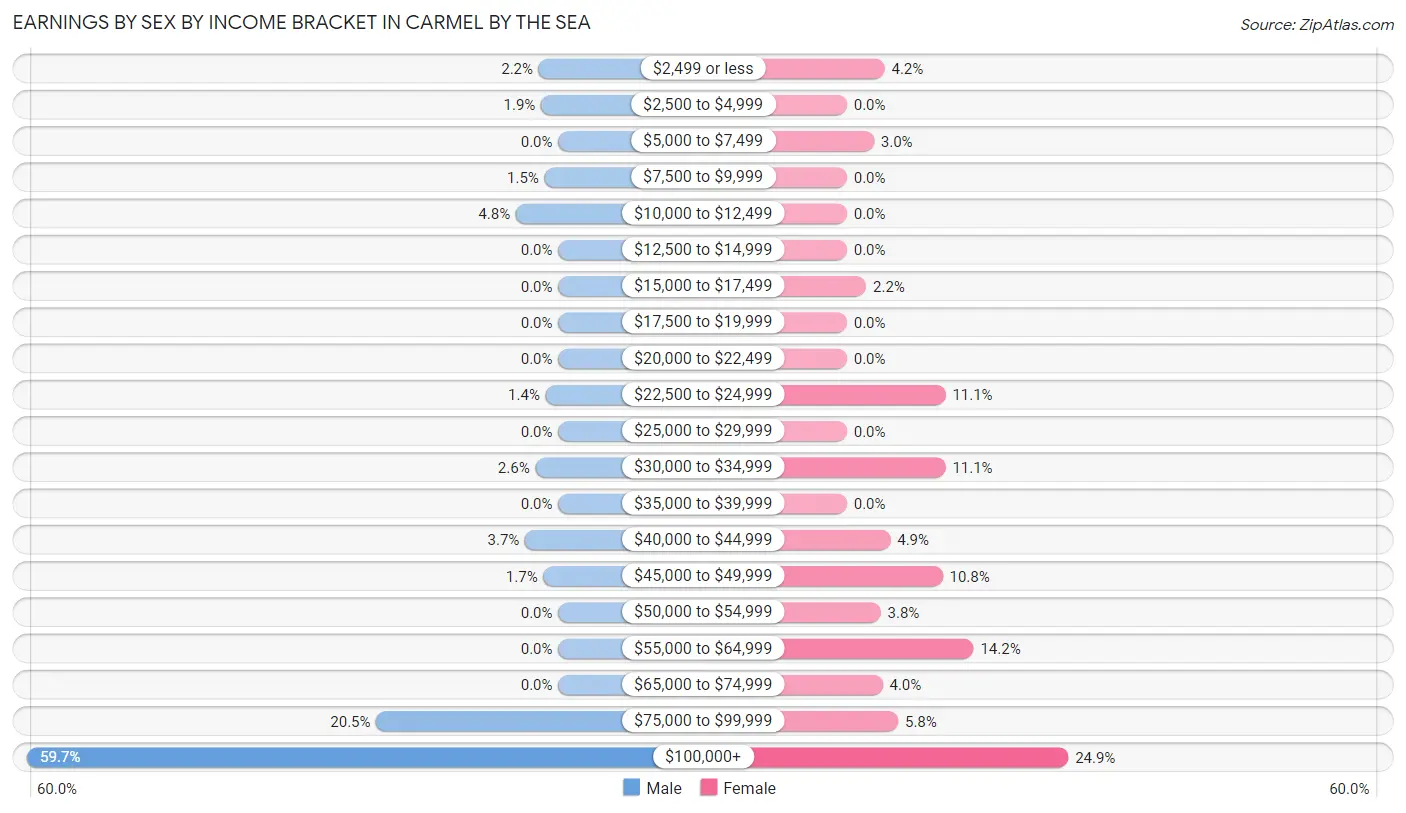
| Income | Male | Female |
| $2,499 or less | 17 (2.2%) | 39 (4.2%) |
| $2,500 to $4,999 | 15 (1.9%) | 0 (0.0%) |
| $5,000 to $7,499 | 0 (0.0%) | 28 (3.0%) |
| $7,500 to $9,999 | 12 (1.5%) | 0 (0.0%) |
| $10,000 to $12,499 | 37 (4.8%) | 0 (0.0%) |
| $12,500 to $14,999 | 0 (0.0%) | 0 (0.0%) |
| $15,000 to $17,499 | 0 (0.0%) | 20 (2.2%) |
| $17,500 to $19,999 | 0 (0.0%) | 0 (0.0%) |
| $20,000 to $22,499 | 0 (0.0%) | 0 (0.0%) |
| $22,500 to $24,999 | 11 (1.4%) | 102 (11.1%) |
| $25,000 to $29,999 | 0 (0.0%) | 0 (0.0%) |
| $30,000 to $34,999 | 20 (2.6%) | 102 (11.1%) |
| $35,000 to $39,999 | 0 (0.0%) | 0 (0.0%) |
| $40,000 to $44,999 | 29 (3.7%) | 45 (4.9%) |
| $45,000 to $49,999 | 13 (1.7%) | 99 (10.8%) |
| $50,000 to $54,999 | 0 (0.0%) | 35 (3.8%) |
| $55,000 to $64,999 | 0 (0.0%) | 131 (14.2%) |
| $65,000 to $74,999 | 0 (0.0%) | 37 (4.0%) |
| $75,000 to $99,999 | 159 (20.5%) | 53 (5.8%) |
| $100,000+ | 464 (59.7%) | 229 (24.9%) |
| Total | 777 (100.0%) | 920 (100.0%) |
Earnings by Sex by Educational Attainment in Carmel By The Sea
Average earnings in Carmel By The Sea are $101,836 for men and $51,786 for women, a difference of 49.1%. Men with an educational attainment of bachelor's degree enjoy the highest average annual earnings of $184,375, while those with graduate degree education earn the least with $87,152. Women with an educational attainment of bachelor's degree earn the most with the average annual earnings of $55,630, while those with college or associate's degree education have the smallest earnings of $50,393.
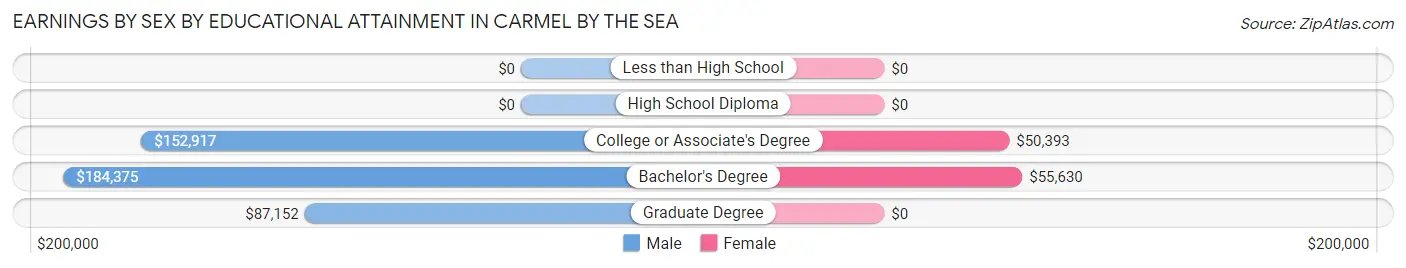
| Educational Attainment | Male Income | Female Income |
| Less than High School | - | - |
| High School Diploma | - | - |
| College or Associate's Degree | $152,917 | $50,393 |
| Bachelor's Degree | $184,375 | $55,630 |
| Graduate Degree | $87,152 | $0 |
| Total | $101,836 | $51,786 |
Family Income in Carmel By The Sea
Family Income Brackets in Carmel By The Sea
According to the Carmel By The Sea family income data, there are 483 families falling into the $200,000+ income range, which is the most common income bracket and makes up 48.1% of all families.
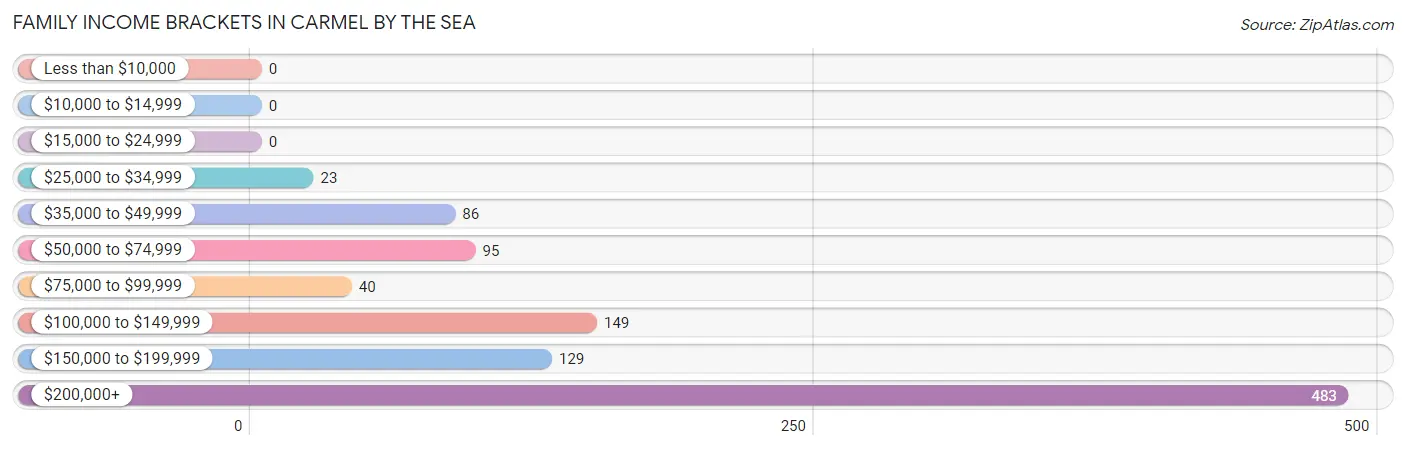
| Income Bracket | # Families | % Families |
| Less than $10,000 | 0 | 0.0% |
| $10,000 to $14,999 | 0 | 0.0% |
| $15,000 to $24,999 | 0 | 0.0% |
| $25,000 to $34,999 | 23 | 2.3% |
| $35,000 to $49,999 | 86 | 8.6% |
| $50,000 to $74,999 | 95 | 9.5% |
| $75,000 to $99,999 | 40 | 4.0% |
| $100,000 to $149,999 | 149 | 14.8% |
| $150,000 to $199,999 | 129 | 12.8% |
| $200,000+ | 483 | 48.1% |
Family Income by Famaliy Size in Carmel By The Sea
3-person families (198 | 19.7%) account for the highest median family income in Carmel By The Sea with $204,057 per family, while 2-person families (737 | 73.3%) have the highest median income of $69,438 per family member.
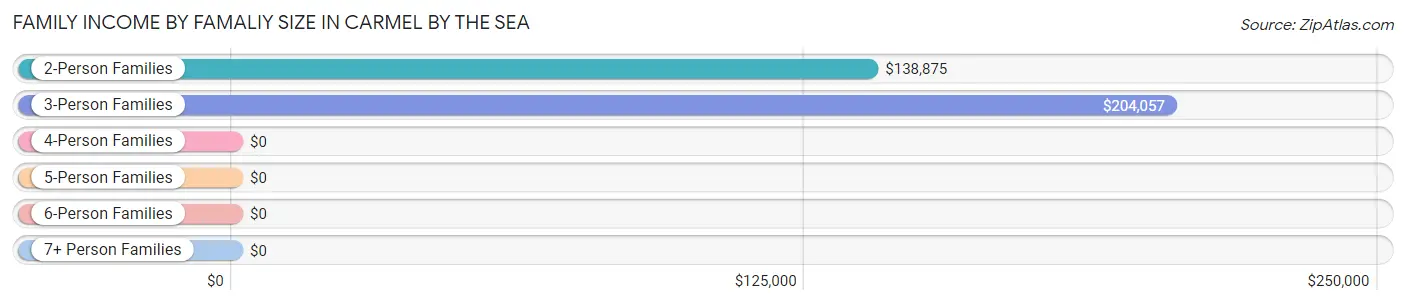
| Income Bracket | # Families | Median Income |
| 2-Person Families | 737 (73.3%) | $138,875 |
| 3-Person Families | 198 (19.7%) | $204,057 |
| 4-Person Families | 24 (2.4%) | $0 |
| 5-Person Families | 35 (3.5%) | $0 |
| 6-Person Families | 11 (1.1%) | $0 |
| 7+ Person Families | 0 (0.0%) | $0 |
| Total | 1,005 (100.0%) | $183,607 |
Family Income by Number of Earners in Carmel By The Sea
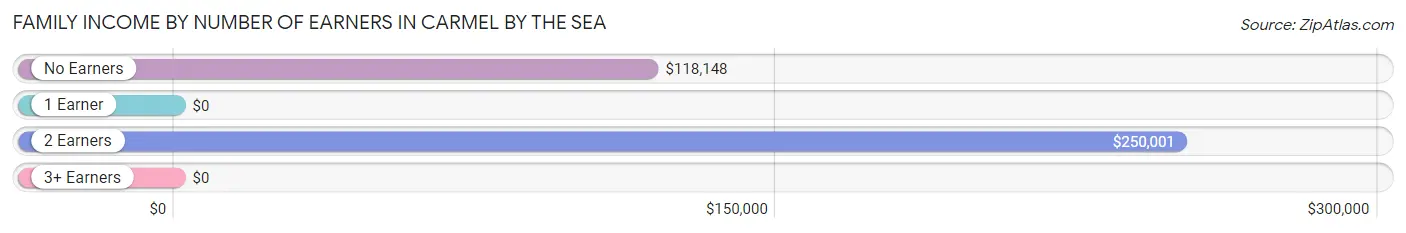
| Number of Earners | # Families | Median Income |
| No Earners | 270 (26.9%) | $118,148 |
| 1 Earner | 289 (28.8%) | $0 |
| 2 Earners | 416 (41.4%) | $250,001 |
| 3+ Earners | 30 (3.0%) | $0 |
| Total | 1,005 (100.0%) | $183,607 |
Household Income in Carmel By The Sea
Household Income Brackets in Carmel By The Sea
With 532 households falling in the category, the $200,000+ income range is the most frequent in Carmel By The Sea, accounting for 33.5% of all households.
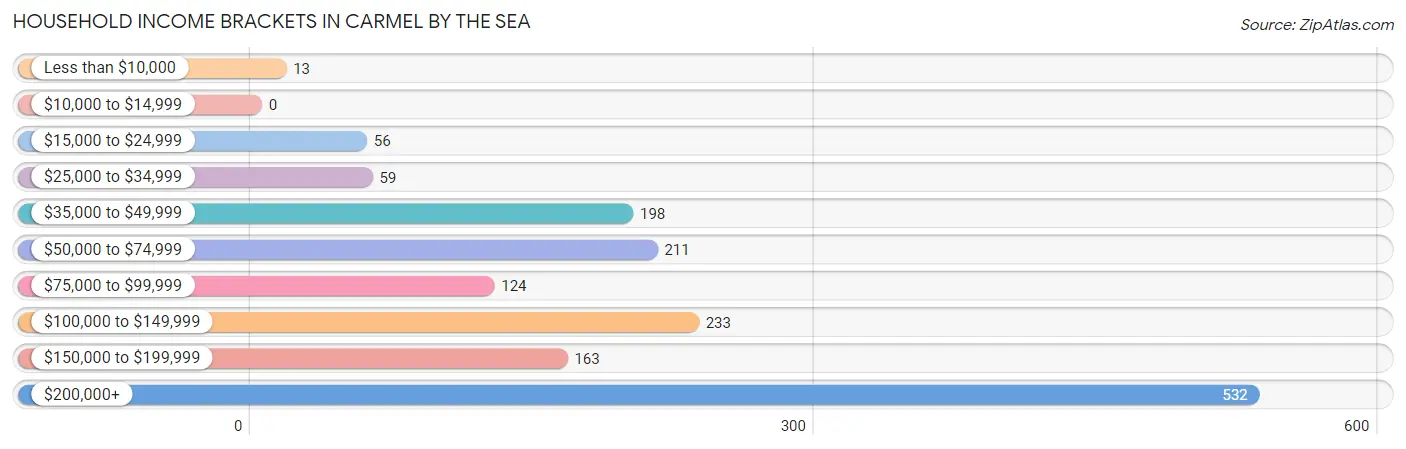
| Income Bracket | # Households | % Households |
| Less than $10,000 | 13 | 0.8% |
| $10,000 to $14,999 | 0 | 0.0% |
| $15,000 to $24,999 | 56 | 3.5% |
| $25,000 to $34,999 | 59 | 3.7% |
| $35,000 to $49,999 | 198 | 12.5% |
| $50,000 to $74,999 | 211 | 13.3% |
| $75,000 to $99,999 | 124 | 7.8% |
| $100,000 to $149,999 | 233 | 14.7% |
| $150,000 to $199,999 | 163 | 10.3% |
| $200,000+ | 532 | 33.5% |
Household Income by Householder Age in Carmel By The Sea
The median household income in Carmel By The Sea is $126,406, with the highest median household income of $209,250 found in the 45 to 64 years age bracket for the primary householder. A total of 335 households (21.1%) fall into this category.
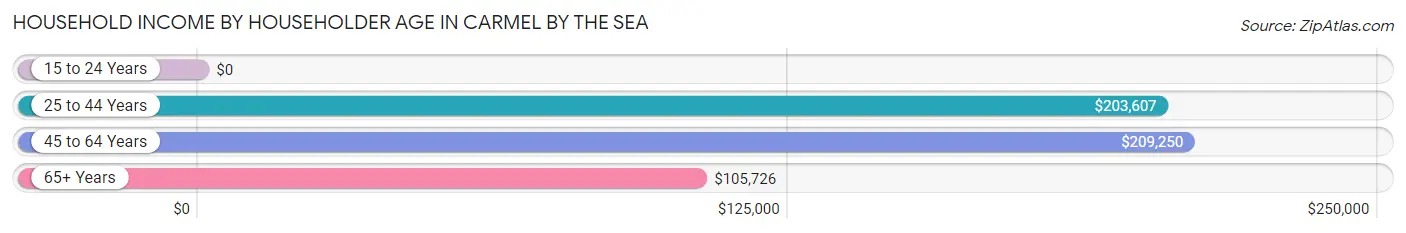
| Income Bracket | # Households | Median Income |
| 15 to 24 Years | 0 (0.0%) | $0 |
| 25 to 44 Years | 188 (11.8%) | $203,607 |
| 45 to 64 Years | 335 (21.1%) | $209,250 |
| 65+ Years | 1,064 (67.0%) | $105,726 |
| Total | 1,587 (100.0%) | $126,406 |
Poverty in Carmel By The Sea
Income Below Poverty by Sex and Age in Carmel By The Sea
With 0.5% poverty level for males and 0.9% for females among the residents of Carmel By The Sea, 55 to 64 year old males and 75 year old and over females are the most vulnerable to poverty, with 4 males (1.7%) and 15 females (3.4%) in their respective age groups living below the poverty level.
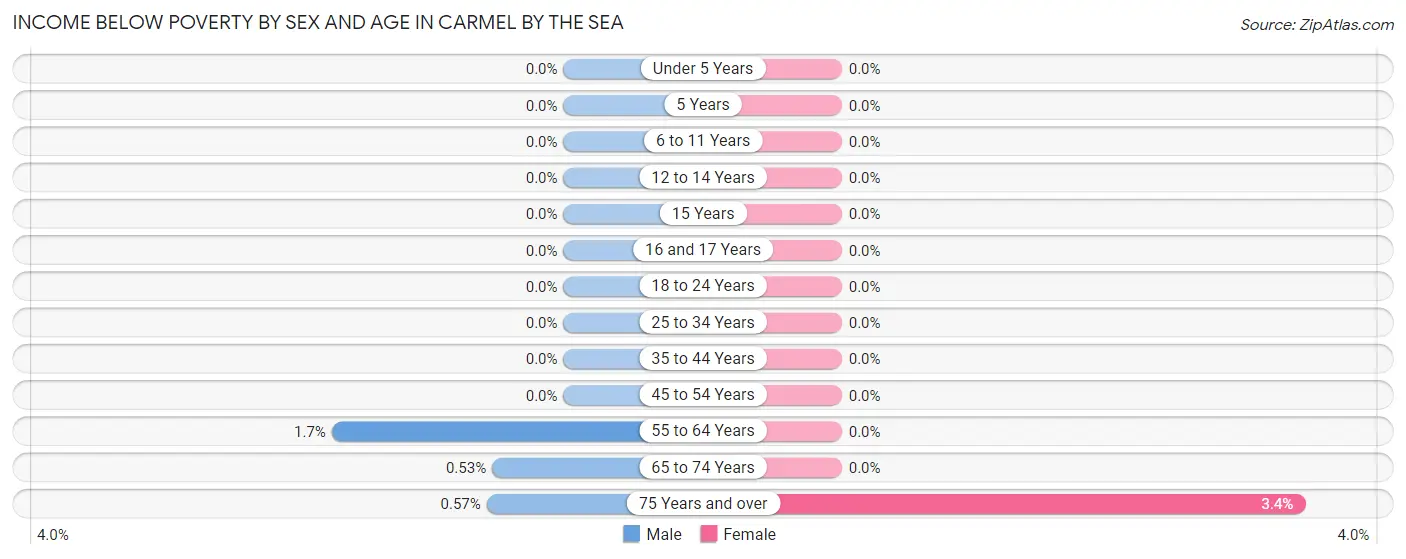
| Age Bracket | Male | Female |
| Under 5 Years | 0 (0.0%) | 0 (0.0%) |
| 5 Years | 0 (0.0%) | 0 (0.0%) |
| 6 to 11 Years | 0 (0.0%) | 0 (0.0%) |
| 12 to 14 Years | 0 (0.0%) | 0 (0.0%) |
| 15 Years | 0 (0.0%) | 0 (0.0%) |
| 16 and 17 Years | 0 (0.0%) | 0 (0.0%) |
| 18 to 24 Years | 0 (0.0%) | 0 (0.0%) |
| 25 to 34 Years | 0 (0.0%) | 0 (0.0%) |
| 35 to 44 Years | 0 (0.0%) | 0 (0.0%) |
| 45 to 54 Years | 0 (0.0%) | 0 (0.0%) |
| 55 to 64 Years | 4 (1.7%) | 0 (0.0%) |
| 65 to 74 Years | 2 (0.5%) | 0 (0.0%) |
| 75 Years and over | 2 (0.6%) | 15 (3.4%) |
| Total | 8 (0.5%) | 15 (0.9%) |
Income Above Poverty by Sex and Age in Carmel By The Sea
According to the poverty statistics in Carmel By The Sea, males aged 5 years and females aged under 5 years are the age groups that are most secure financially, with 100.0% of males and 100.0% of females in these age groups living above the poverty line.
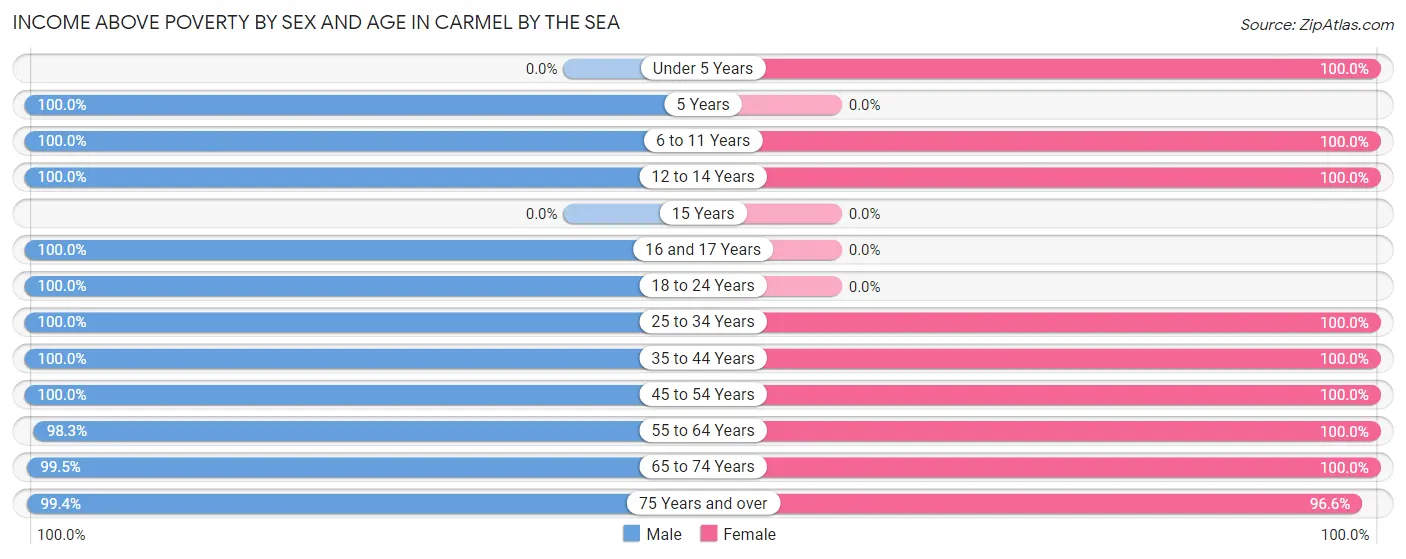
| Age Bracket | Male | Female |
| Under 5 Years | 0 (0.0%) | 54 (100.0%) |
| 5 Years | 13 (100.0%) | 0 (0.0%) |
| 6 to 11 Years | 27 (100.0%) | 22 (100.0%) |
| 12 to 14 Years | 88 (100.0%) | 73 (100.0%) |
| 15 Years | 0 (0.0%) | 0 (0.0%) |
| 16 and 17 Years | 16 (100.0%) | 0 (0.0%) |
| 18 to 24 Years | 15 (100.0%) | 0 (0.0%) |
| 25 to 34 Years | 113 (100.0%) | 158 (100.0%) |
| 35 to 44 Years | 138 (100.0%) | 95 (100.0%) |
| 45 to 54 Years | 150 (100.0%) | 172 (100.0%) |
| 55 to 64 Years | 228 (98.3%) | 252 (100.0%) |
| 65 to 74 Years | 378 (99.5%) | 455 (100.0%) |
| 75 Years and over | 347 (99.4%) | 421 (96.6%) |
| Total | 1,513 (99.5%) | 1,702 (99.1%) |
Income Below Poverty Among Married-Couple Families in Carmel By The Sea
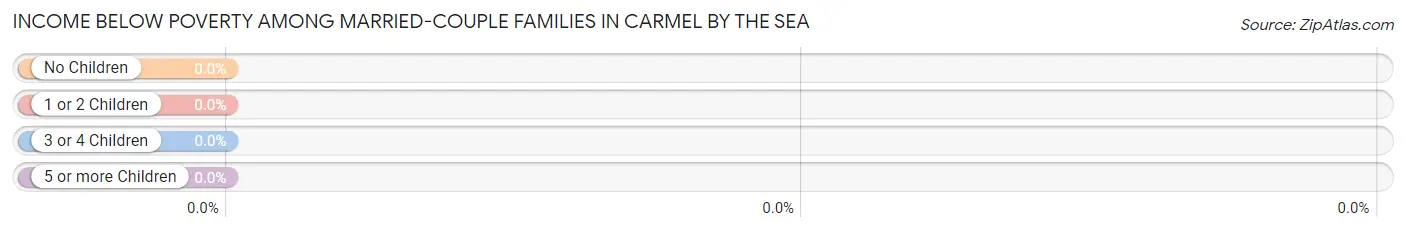
| Children | Above Poverty | Below Poverty |
| No Children | 700 (100.0%) | 0 (0.0%) |
| 1 or 2 Children | 197 (100.0%) | 0 (0.0%) |
| 3 or 4 Children | 20 (100.0%) | 0 (0.0%) |
| 5 or more Children | 0 (0.0%) | 0 (0.0%) |
| Total | 917 (100.0%) | 0 (0.0%) |
Income Below Poverty Among Single-Parent Households in Carmel By The Sea
| Children | Single Father | Single Mother |
| No Children | 0 (0.0%) | 0 (0.0%) |
| 1 or 2 Children | 0 (0.0%) | 0 (0.0%) |
| 3 or 4 Children | 0 (0.0%) | 0 (0.0%) |
| 5 or more Children | 0 (0.0%) | 0 (0.0%) |
| Total | 0 (0.0%) | 0 (0.0%) |
Income Below Poverty Among Married-Couple vs Single-Parent Households in Carmel By The Sea
| Children | Married-Couple Families | Single-Parent Households |
| No Children | 0 (0.0%) | 0 (0.0%) |
| 1 or 2 Children | 0 (0.0%) | 0 (0.0%) |
| 3 or 4 Children | 0 (0.0%) | 0 (0.0%) |
| 5 or more Children | 0 (0.0%) | 0 (0.0%) |
| Total | 0 (0.0%) | 0 (0.0%) |
Race in Carmel By The Sea
The most populous races in Carmel By The Sea are White / Caucasian (2,924 | 90.3%), Two or more Races (227 | 7.0%), and Hispanic or Latino (154 | 4.8%).
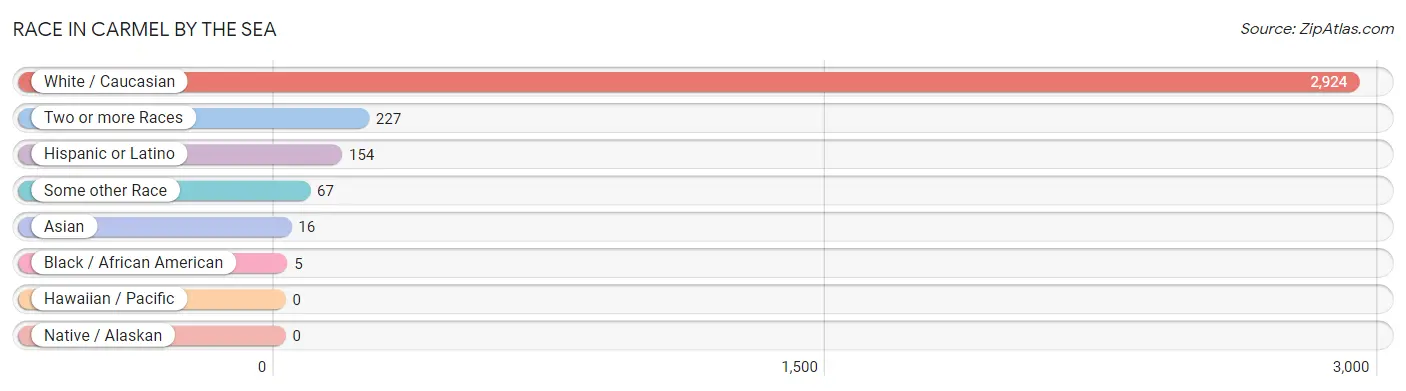
| Race | # Population | % Population |
| Asian | 16 | 0.5% |
| Black / African American | 5 | 0.2% |
| Hawaiian / Pacific | 0 | 0.0% |
| Hispanic or Latino | 154 | 4.8% |
| Native / Alaskan | 0 | 0.0% |
| White / Caucasian | 2,924 | 90.3% |
| Two or more Races | 227 | 7.0% |
| Some other Race | 67 | 2.1% |
| Total | 3,239 | 100.0% |
Ancestry in Carmel By The Sea
The most populous ancestries reported in Carmel By The Sea are German (598 | 18.5%), English (593 | 18.3%), Irish (470 | 14.5%), Scottish (199 | 6.1%), and Norwegian (198 | 6.1%), together accounting for 63.5% of all Carmel By The Sea residents.
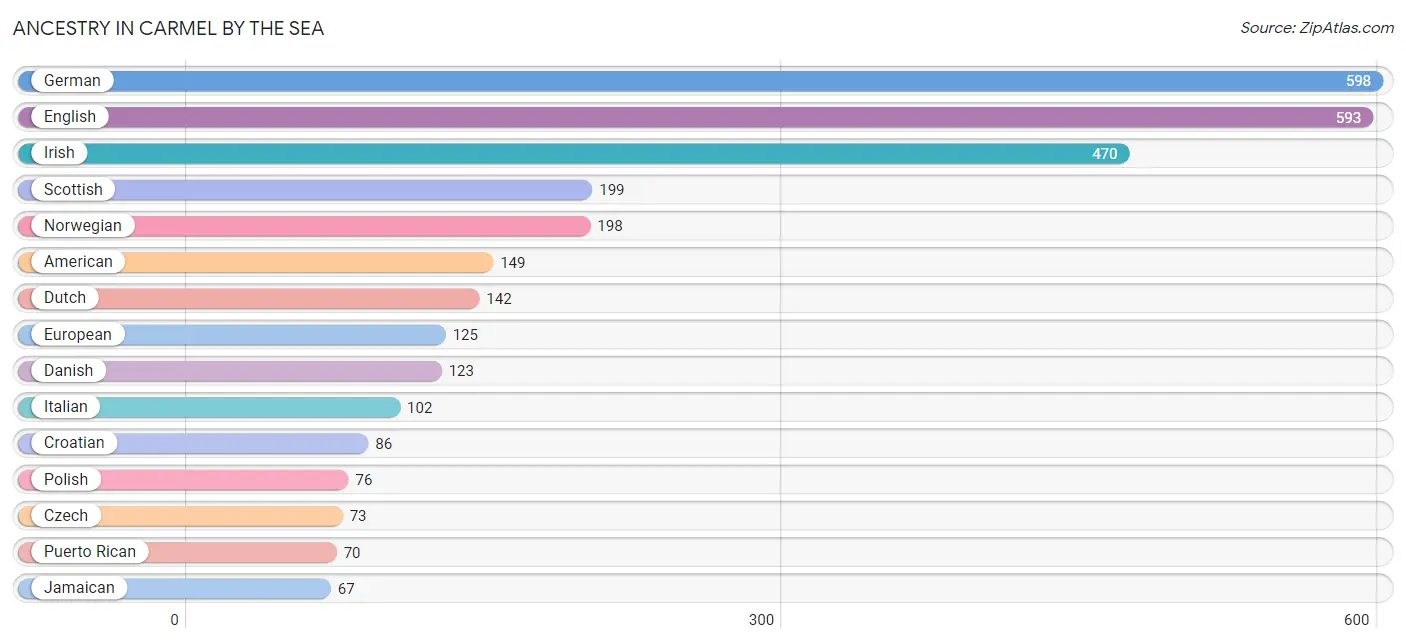
| Ancestry | # Population | % Population |
| African | 2 | 0.1% |
| American | 149 | 4.6% |
| Arab | 18 | 0.6% |
| Austrian | 18 | 0.6% |
| Bhutanese | 16 | 0.5% |
| Blackfeet | 45 | 1.4% |
| British | 26 | 0.8% |
| Canadian | 24 | 0.7% |
| Celtic | 24 | 0.7% |
| Central American | 43 | 1.3% |
| Cherokee | 61 | 1.9% |
| Croatian | 86 | 2.7% |
| Czech | 73 | 2.2% |
| Danish | 123 | 3.8% |
| Dutch | 142 | 4.4% |
| English | 593 | 18.3% |
| European | 125 | 3.9% |
| French | 32 | 1.0% |
| German | 598 | 18.5% |
| Indian (Asian) | 26 | 0.8% |
| Irish | 470 | 14.5% |
| Italian | 102 | 3.2% |
| Jamaican | 67 | 2.1% |
| Mexican | 20 | 0.6% |
| Northern European | 30 | 0.9% |
| Norwegian | 198 | 6.1% |
| Polish | 76 | 2.4% |
| Puerto Rican | 70 | 2.2% |
| Russian | 35 | 1.1% |
| Salvadoran | 43 | 1.3% |
| Scandinavian | 41 | 1.3% |
| Scotch-Irish | 15 | 0.5% |
| Scottish | 199 | 6.1% |
| Slovene | 20 | 0.6% |
| Subsaharan African | 2 | 0.1% |
| Swedish | 39 | 1.2% |
| Swiss | 13 | 0.4% |
| Turkish | 14 | 0.4% |
| Welsh | 30 | 0.9% | View All 39 Rows |
Immigrants in Carmel By The Sea
The most numerous immigrant groups reported in Carmel By The Sea came from Europe (186 | 5.7%), Western Europe (130 | 4.0%), Latin America (110 | 3.4%), Netherlands (99 | 3.1%), and Canada (94 | 2.9%), together accounting for 19.1% of all Carmel By The Sea residents.
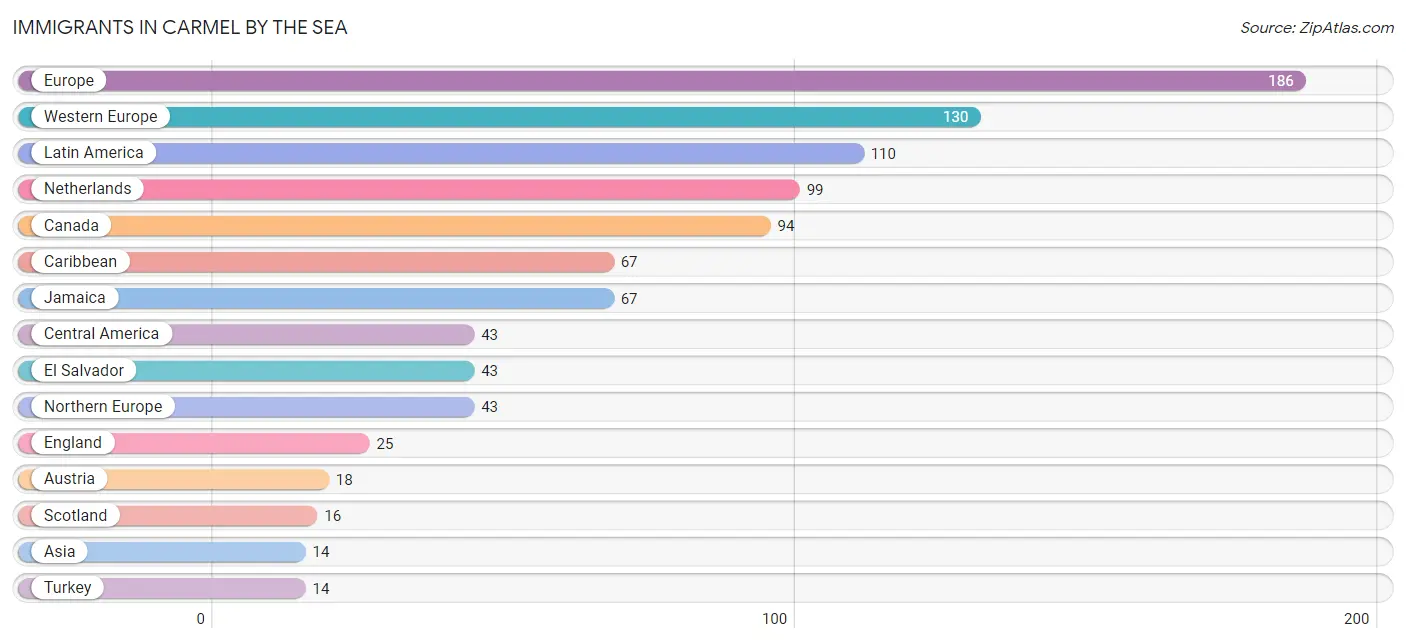
| Immigration Origin | # Population | % Population |
| Asia | 14 | 0.4% |
| Austria | 18 | 0.6% |
| Canada | 94 | 2.9% |
| Caribbean | 67 | 2.1% |
| Central America | 43 | 1.3% |
| Eastern Europe | 13 | 0.4% |
| El Salvador | 43 | 1.3% |
| England | 25 | 0.8% |
| Europe | 186 | 5.7% |
| Germany | 13 | 0.4% |
| Jamaica | 67 | 2.1% |
| Latin America | 110 | 3.4% |
| Netherlands | 99 | 3.1% |
| Northern Europe | 43 | 1.3% |
| Russia | 13 | 0.4% |
| Scotland | 16 | 0.5% |
| Turkey | 14 | 0.4% |
| Western Asia | 14 | 0.4% |
| Western Europe | 130 | 4.0% | View All 19 Rows |
Sex and Age in Carmel By The Sea
Sex and Age in Carmel By The Sea
The most populous age groups in Carmel By The Sea are 65 to 69 Years (247 | 16.2%) for men and 65 to 69 Years (256 | 14.9%) for women.
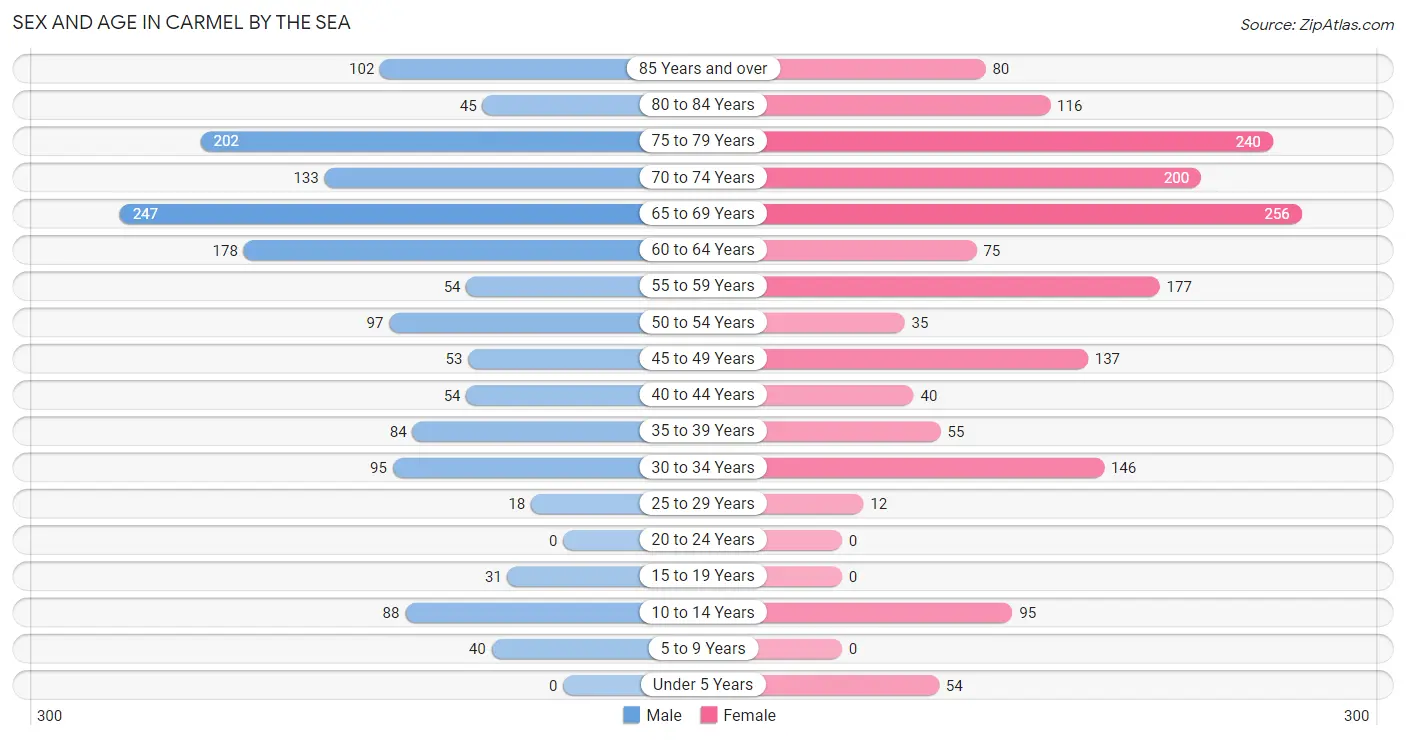
| Age Bracket | Male | Female |
| Under 5 Years | 0 (0.0%) | 54 (3.1%) |
| 5 to 9 Years | 40 (2.6%) | 0 (0.0%) |
| 10 to 14 Years | 88 (5.8%) | 95 (5.5%) |
| 15 to 19 Years | 31 (2.0%) | 0 (0.0%) |
| 20 to 24 Years | 0 (0.0%) | 0 (0.0%) |
| 25 to 29 Years | 18 (1.2%) | 12 (0.7%) |
| 30 to 34 Years | 95 (6.2%) | 146 (8.5%) |
| 35 to 39 Years | 84 (5.5%) | 55 (3.2%) |
| 40 to 44 Years | 54 (3.5%) | 40 (2.3%) |
| 45 to 49 Years | 53 (3.5%) | 137 (8.0%) |
| 50 to 54 Years | 97 (6.4%) | 35 (2.0%) |
| 55 to 59 Years | 54 (3.5%) | 177 (10.3%) |
| 60 to 64 Years | 178 (11.7%) | 75 (4.4%) |
| 65 to 69 Years | 247 (16.2%) | 256 (14.9%) |
| 70 to 74 Years | 133 (8.7%) | 200 (11.6%) |
| 75 to 79 Years | 202 (13.3%) | 240 (14.0%) |
| 80 to 84 Years | 45 (3.0%) | 116 (6.8%) |
| 85 Years and over | 102 (6.7%) | 80 (4.7%) |
| Total | 1,521 (100.0%) | 1,718 (100.0%) |
Families and Households in Carmel By The Sea
Median Family Size in Carmel By The Sea
The median family size in Carmel By The Sea is 2.34 persons per family, with single female/mother families (68 | 6.8%) accounting for the largest median family size of 2.47 persons per family. On the other hand, single male/father families (20 | 2.0%) represent the smallest median family size with 1.95 persons per family.
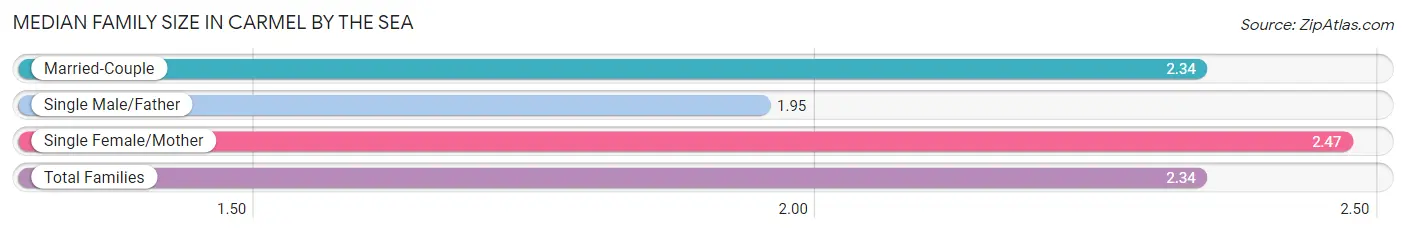
| Family Type | # Families | Family Size |
| Married-Couple | 917 (91.2%) | 2.34 |
| Single Male/Father | 20 (2.0%) | 1.95 |
| Single Female/Mother | 68 (6.8%) | 2.47 |
| Total Families | 1,005 (100.0%) | 2.34 |
Median Household Size in Carmel By The Sea
The median household size in Carmel By The Sea is 2.01 persons per household, with married-couple households (917 | 57.8%) accounting for the largest median household size of 2.58 persons per household. non-family households (582 | 36.7%) represent the smallest median household size with 1.07 persons per household.
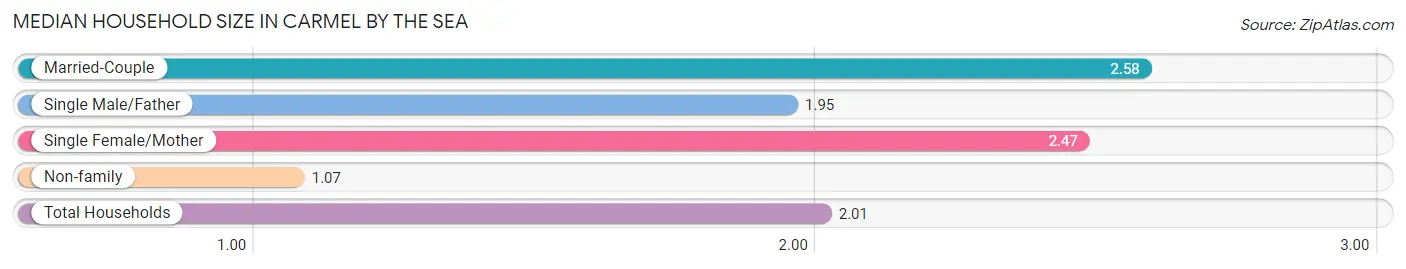
| Household Type | # Households | Household Size |
| Married-Couple | 917 (57.8%) | 2.58 |
| Single Male/Father | 20 (1.3%) | 1.95 |
| Single Female/Mother | 68 (4.3%) | 2.47 |
| Non-family | 582 (36.7%) | 1.07 |
| Total Households | 1,587 (100.0%) | 2.01 |
Household Size by Marriage Status in Carmel By The Sea
Out of a total of 1,587 households in Carmel By The Sea, 1,005 (63.3%) are family households, while 582 (36.7%) are nonfamily households. The most numerous type of family households are 2-person households, comprising 628, and the most common type of nonfamily households are 1-person households, comprising 539.
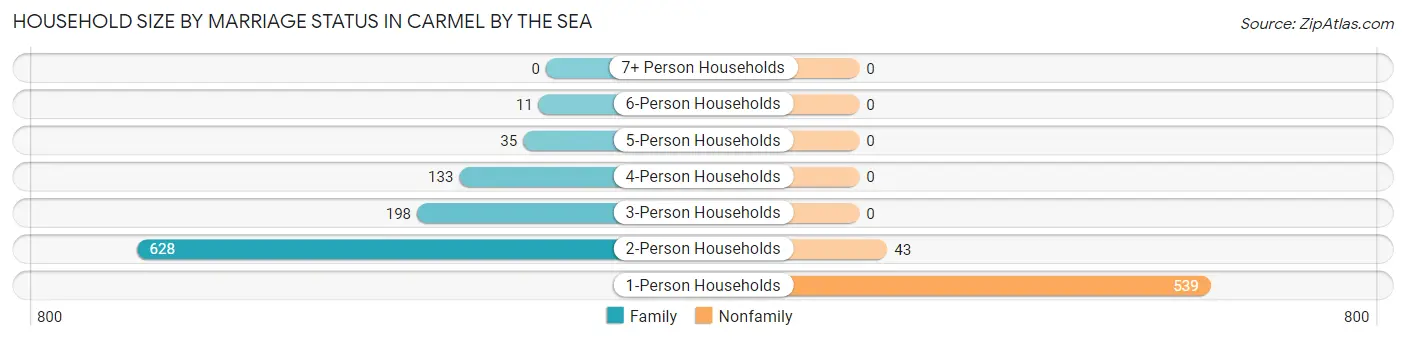
| Household Size | Family Households | Nonfamily Households |
| 1-Person Households | - | 539 (34.0%) |
| 2-Person Households | 628 (39.6%) | 43 (2.7%) |
| 3-Person Households | 198 (12.5%) | 0 (0.0%) |
| 4-Person Households | 133 (8.4%) | 0 (0.0%) |
| 5-Person Households | 35 (2.2%) | 0 (0.0%) |
| 6-Person Households | 11 (0.7%) | 0 (0.0%) |
| 7+ Person Households | 0 (0.0%) | 0 (0.0%) |
| Total | 1,005 (63.3%) | 582 (36.7%) |
Female Fertility in Carmel By The Sea
Fertility by Age in Carmel By The Sea
| Age Bracket | Women with Births | Births / 1,000 Women |
| 15 to 19 years | 0 (0.0%) | 0.0 |
| 20 to 34 years | 0 (0.0%) | 0.0 |
| 35 to 50 years | 0 (0.0%) | 0.0 |
| Total | 0 (0.0%) | 0.0 |
Fertility by Age by Marriage Status in Carmel By The Sea
| Age Bracket | Married | Unmarried |
| 15 to 19 years | 0 (0.0%) | 0 (0.0%) |
| 20 to 34 years | 0 (0.0%) | 0 (0.0%) |
| 35 to 50 years | 0 (0.0%) | 0 (0.0%) |
| Total | 0 (0.0%) | 0 (0.0%) |
Fertility by Education in Carmel By The Sea
| Educational Attainment | Women with Births | Births / 1,000 Women |
| Less than High School | 0 (0.0%) | 0.0 |
| High School Diploma | 0 (0.0%) | 0.0 |
| College or Associate's Degree | 0 (0.0%) | 0.0 |
| Bachelor's Degree | 0 (0.0%) | 0.0 |
| Graduate Degree | 0 (0.0%) | 0.0 |
| Total | 0 (0.0%) | 0.0 |
Fertility by Education by Marriage Status in Carmel By The Sea
| Educational Attainment | Married | Unmarried |
| Less than High School | 0 (0.0%) | 0 (0.0%) |
| High School Diploma | 0 (0.0%) | 0 (0.0%) |
| College or Associate's Degree | 0 (0.0%) | 0 (0.0%) |
| Bachelor's Degree | 0 (0.0%) | 0 (0.0%) |
| Graduate Degree | 0 (0.0%) | 0 (0.0%) |
| Total | 0 (0.0%) | 0 (0.0%) |
Employment Characteristics in Carmel By The Sea
Employment by Class of Employer in Carmel By The Sea
Among the 1,539 employed individuals in Carmel By The Sea, private company employees (510 | 33.1%), self-employed (not incorporated) (366 | 23.8%), and not-for-profit organizations (288 | 18.7%) make up the most common classes of employment.
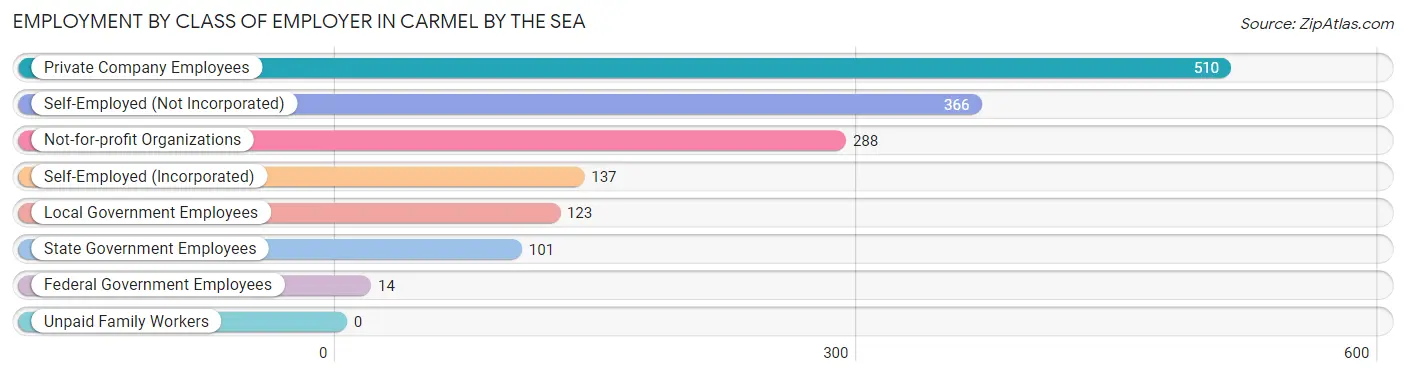
| Employer Class | # Employees | % Employees |
| Private Company Employees | 510 | 33.1% |
| Self-Employed (Incorporated) | 137 | 8.9% |
| Self-Employed (Not Incorporated) | 366 | 23.8% |
| Not-for-profit Organizations | 288 | 18.7% |
| Local Government Employees | 123 | 8.0% |
| State Government Employees | 101 | 6.6% |
| Federal Government Employees | 14 | 0.9% |
| Unpaid Family Workers | 0 | 0.0% |
| Total | 1,539 | 100.0% |
Employment Status by Age in Carmel By The Sea
According to the labor force statistics for Carmel By The Sea, out of the total population over 16 years of age (2,962), 53.3% or 1,579 individuals are in the labor force, with 1.0% or 16 of them unemployed. The age group with the highest labor force participation rate is 25 to 29 years, with 100.0% or 30 individuals in the labor force. Within the labor force, the 35 to 44 years age range has the highest percentage of unemployed individuals, with 6.6% or 13 of them being unemployed.
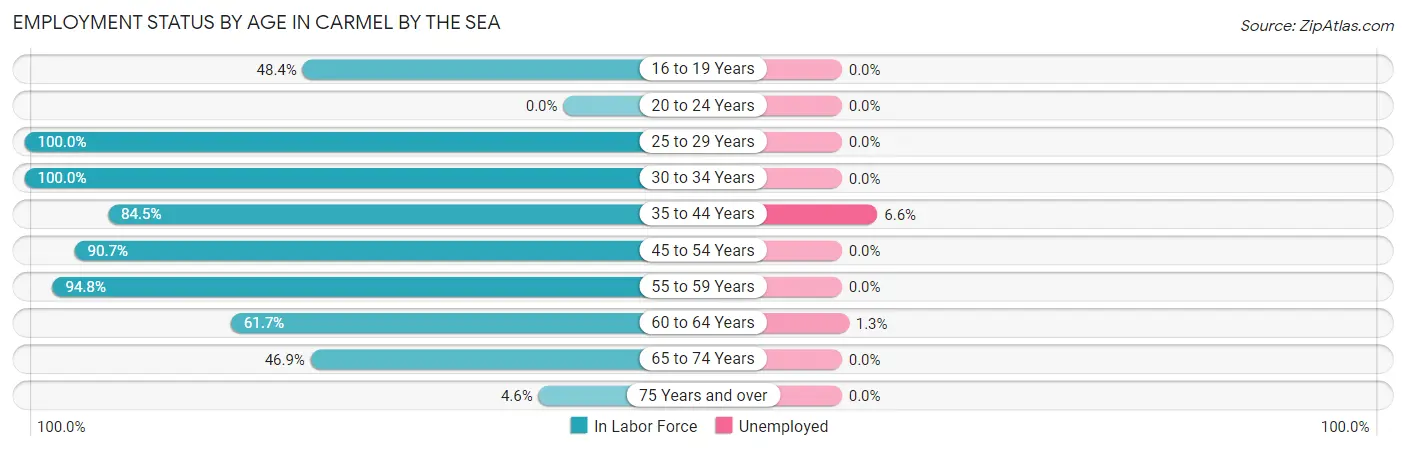
| Age Bracket | In Labor Force | Unemployed |
| 16 to 19 Years | 15 (48.4%) | 0 (0.0%) |
| 20 to 24 Years | 0 (0.0%) | 0 (0.0%) |
| 25 to 29 Years | 30 (100.0%) | 0 (0.0%) |
| 30 to 34 Years | 241 (100.0%) | 0 (0.0%) |
| 35 to 44 Years | 197 (84.5%) | 13 (6.6%) |
| 45 to 54 Years | 292 (90.7%) | 0 (0.0%) |
| 55 to 59 Years | 219 (94.8%) | 0 (0.0%) |
| 60 to 64 Years | 156 (61.7%) | 2 (1.3%) |
| 65 to 74 Years | 392 (46.9%) | 0 (0.0%) |
| 75 Years and over | 36 (4.6%) | 0 (0.0%) |
| Total | 1,579 (53.3%) | 16 (1.0%) |
Employment Status by Educational Attainment in Carmel By The Sea
According to labor force statistics for Carmel By The Sea, 86.6% of individuals (1,134) out of the total population between 25 and 64 years of age (1,310) are in the labor force, with 1.3% or 15 of them being unemployed. The group with the highest labor force participation rate are those with the educational attainment of bachelor's degree or higher, with 91.9% or 826 individuals in the labor force. Within the labor force, individuals with bachelor's degree or higher education have the highest percentage of unemployment, with 1.6% or 13 of them being unemployed.
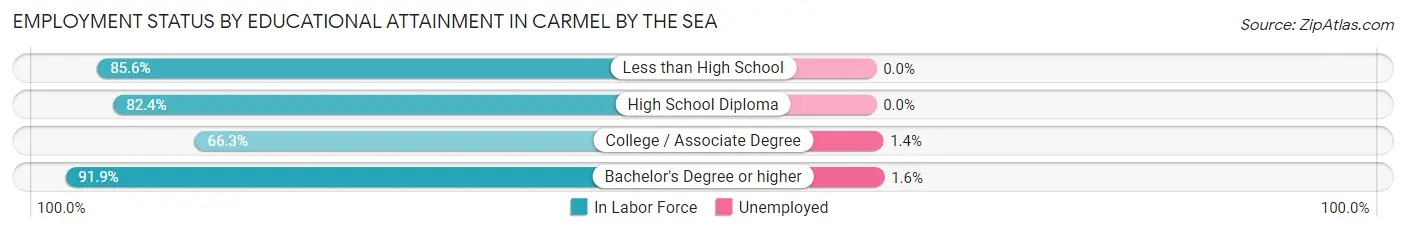
| Educational Attainment | In Labor Force | Unemployed |
| Less than High School | 101 (85.6%) | 0 (0.0%) |
| High School Diploma | 70 (82.4%) | 0 (0.0%) |
| College / Associate Degree | 138 (66.3%) | 3 (1.4%) |
| Bachelor's Degree or higher | 826 (91.9%) | 14 (1.6%) |
| Total | 1,134 (86.6%) | 17 (1.3%) |
Employment Occupations by Sex in Carmel By The Sea
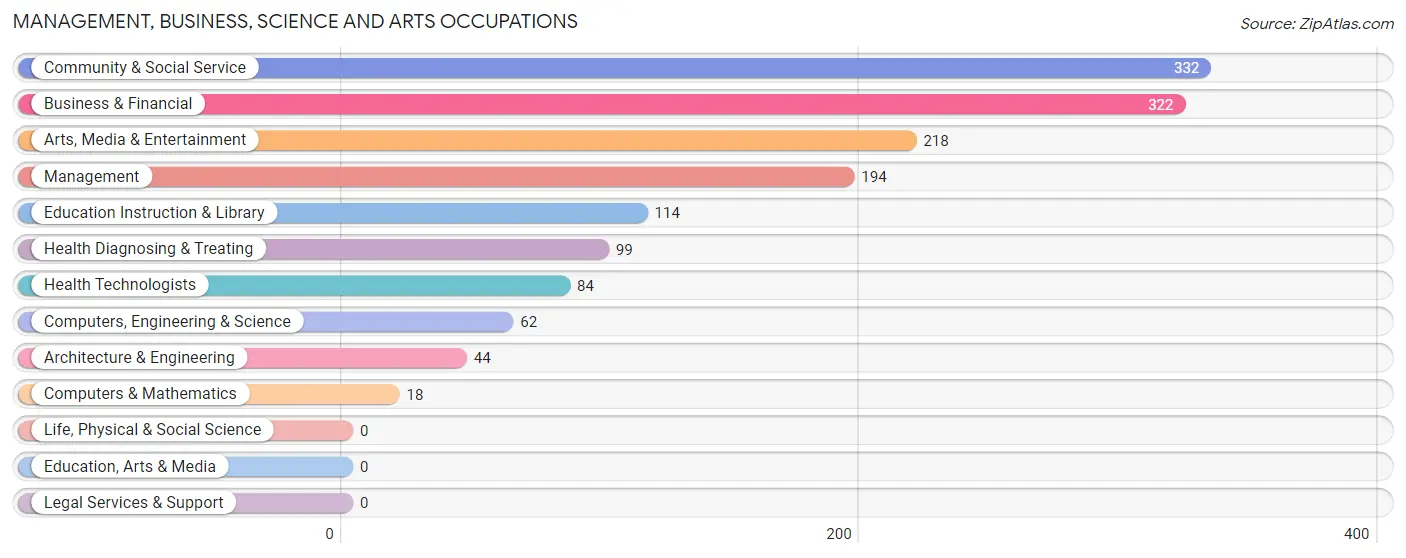
Management, Business, Science and Arts Occupations
The most common Management, Business, Science and Arts occupations in Carmel By The Sea are Community & Social Service (332 | 21.2%), Business & Financial (322 | 20.6%), Arts, Media & Entertainment (218 | 14.0%), Management (194 | 12.4%), and Education Instruction & Library (114 | 7.3%).
Management, Business, Science and Arts Occupations by Sex
Within the Management, Business, Science and Arts occupations in Carmel By The Sea, the most male-oriented occupations are Computers & Mathematics (100.0%), Computers, Engineering & Science (80.6%), and Architecture & Engineering (72.7%), while the most female-oriented occupations are Education Instruction & Library (71.1%), Management (51.0%), and Health Technologists (48.8%).
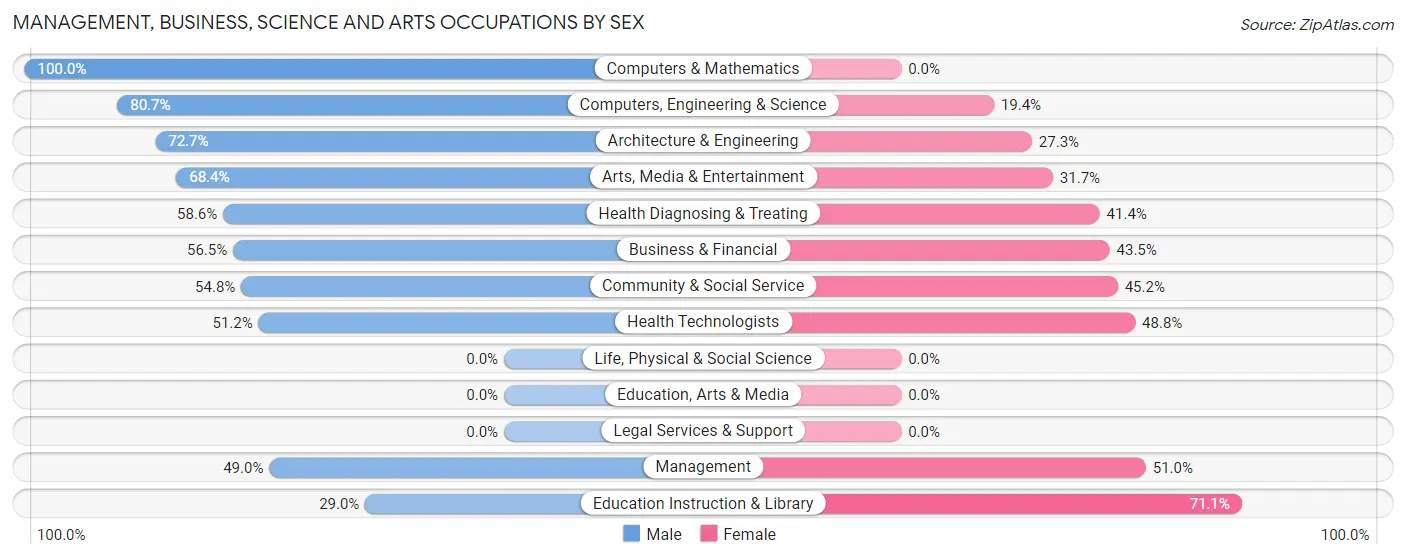
| Occupation | Male | Female |
| Management | 95 (49.0%) | 99 (51.0%) |
| Business & Financial | 182 (56.5%) | 140 (43.5%) |
| Computers, Engineering & Science | 50 (80.6%) | 12 (19.4%) |
| Computers & Mathematics | 18 (100.0%) | 0 (0.0%) |
| Architecture & Engineering | 32 (72.7%) | 12 (27.3%) |
| Life, Physical & Social Science | 0 (0.0%) | 0 (0.0%) |
| Community & Social Service | 182 (54.8%) | 150 (45.2%) |
| Education, Arts & Media | 0 (0.0%) | 0 (0.0%) |
| Legal Services & Support | 0 (0.0%) | 0 (0.0%) |
| Education Instruction & Library | 33 (28.9%) | 81 (71.1%) |
| Arts, Media & Entertainment | 149 (68.3%) | 69 (31.7%) |
| Health Diagnosing & Treating | 58 (58.6%) | 41 (41.4%) |
| Health Technologists | 43 (51.2%) | 41 (48.8%) |
| Total (Category) | 567 (56.2%) | 442 (43.8%) |
| Total (Overall) | 726 (46.5%) | 837 (53.5%) |
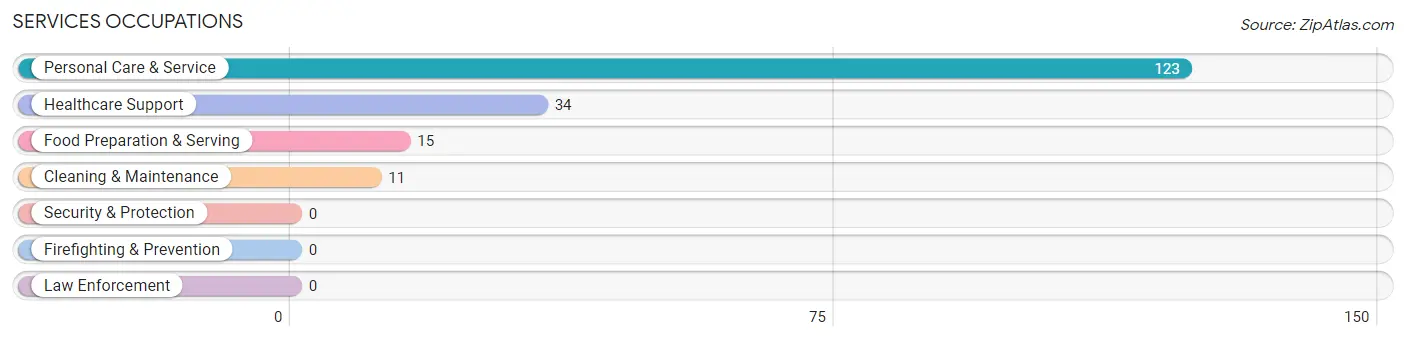
Services Occupations
The most common Services occupations in Carmel By The Sea are Personal Care & Service (123 | 7.9%), Healthcare Support (34 | 2.2%), Food Preparation & Serving (15 | 1.0%), and Cleaning & Maintenance (11 | 0.7%).
Services Occupations by Sex
Within the Services occupations in Carmel By The Sea, the most male-oriented occupations are Food Preparation & Serving (100.0%), and Cleaning & Maintenance (100.0%), while the most female-oriented occupations are Healthcare Support (100.0%), and Personal Care & Service (100.0%).
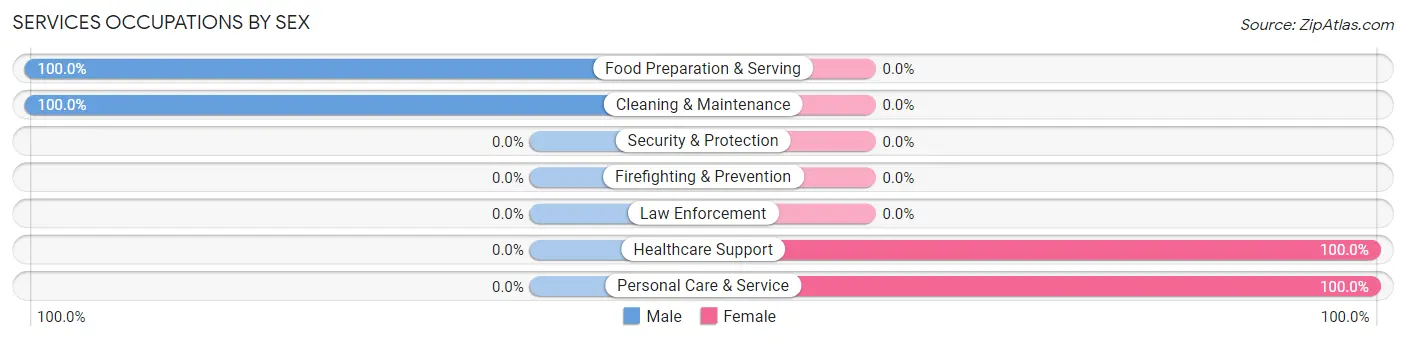
| Occupation | Male | Female |
| Healthcare Support | 0 (0.0%) | 34 (100.0%) |
| Security & Protection | 0 (0.0%) | 0 (0.0%) |
| Firefighting & Prevention | 0 (0.0%) | 0 (0.0%) |
| Law Enforcement | 0 (0.0%) | 0 (0.0%) |
| Food Preparation & Serving | 15 (100.0%) | 0 (0.0%) |
| Cleaning & Maintenance | 11 (100.0%) | 0 (0.0%) |
| Personal Care & Service | 0 (0.0%) | 123 (100.0%) |
| Total (Category) | 26 (14.2%) | 157 (85.8%) |
| Total (Overall) | 726 (46.5%) | 837 (53.5%) |
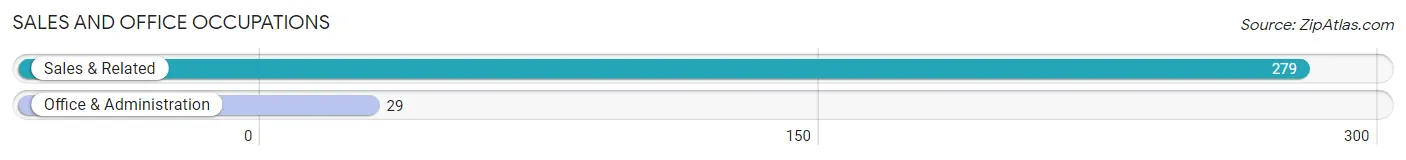
Sales and Office Occupations
The most common Sales and Office occupations in Carmel By The Sea are Sales & Related (279 | 17.8%), and Office & Administration (29 | 1.9%).
Sales and Office Occupations by Sex
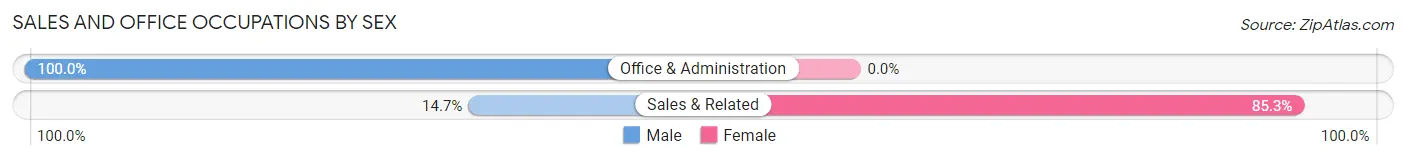
| Occupation | Male | Female |
| Sales & Related | 41 (14.7%) | 238 (85.3%) |
| Office & Administration | 29 (100.0%) | 0 (0.0%) |
| Total (Category) | 70 (22.7%) | 238 (77.3%) |
| Total (Overall) | 726 (46.5%) | 837 (53.5%) |
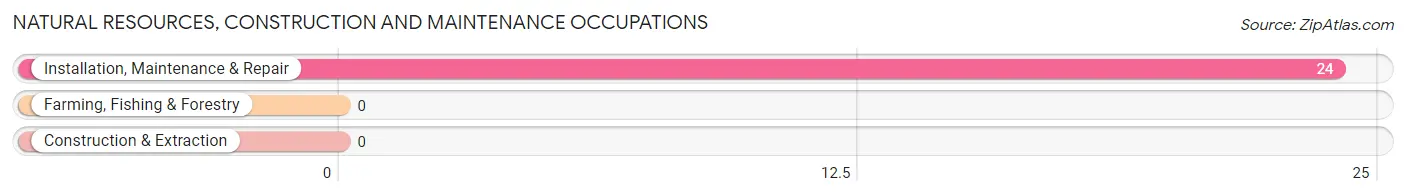
Natural Resources, Construction and Maintenance Occupations
The most common Natural Resources, Construction and Maintenance occupations in Carmel By The Sea are , and Installation, Maintenance & Repair (24 | 1.5%).
Natural Resources, Construction and Maintenance Occupations by Sex
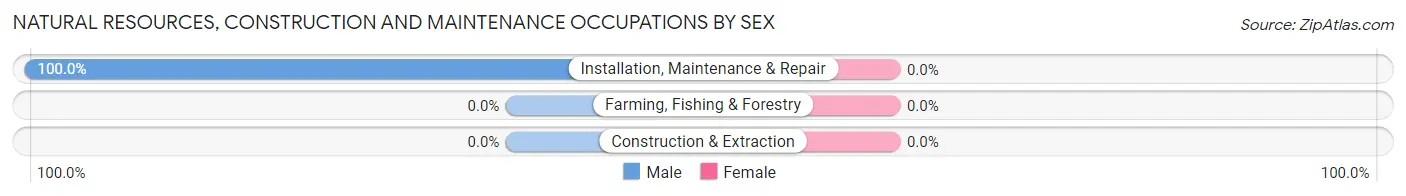
| Occupation | Male | Female |
| Farming, Fishing & Forestry | 0 (0.0%) | 0 (0.0%) |
| Construction & Extraction | 0 (0.0%) | 0 (0.0%) |
| Installation, Maintenance & Repair | 24 (100.0%) | 0 (0.0%) |
| Total (Category) | 24 (100.0%) | 0 (0.0%) |
| Total (Overall) | 726 (46.5%) | 837 (53.5%) |
Production, Transportation and Moving Occupations
The most common Production, Transportation and Moving occupations in Carmel By The Sea are , and Material Moving (39 | 2.5%).
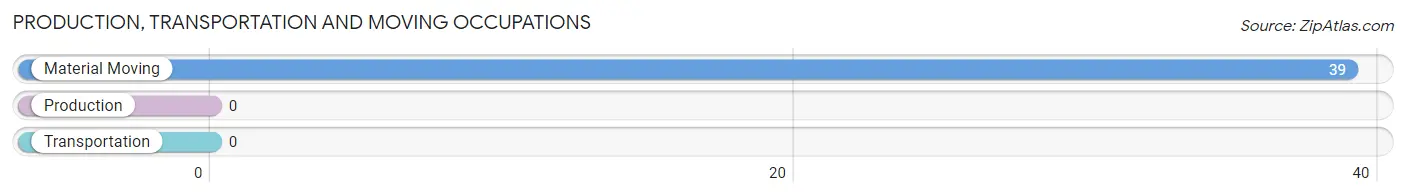
Production, Transportation and Moving Occupations by Sex
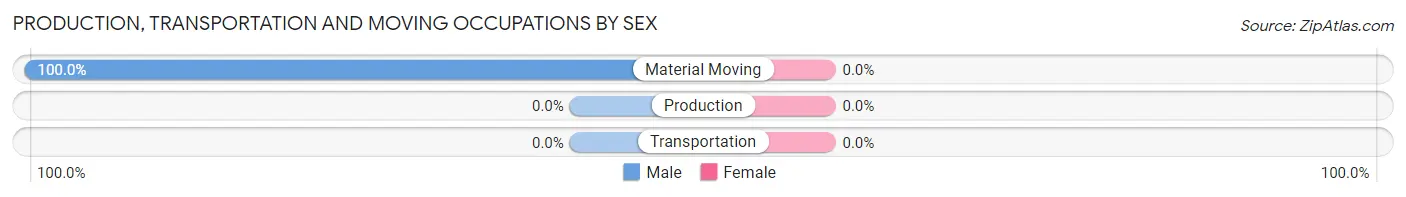
| Occupation | Male | Female |
| Production | 0 (0.0%) | 0 (0.0%) |
| Transportation | 0 (0.0%) | 0 (0.0%) |
| Material Moving | 39 (100.0%) | 0 (0.0%) |
| Total (Category) | 39 (100.0%) | 0 (0.0%) |
| Total (Overall) | 726 (46.5%) | 837 (53.5%) |
Employment Industries by Sex in Carmel By The Sea
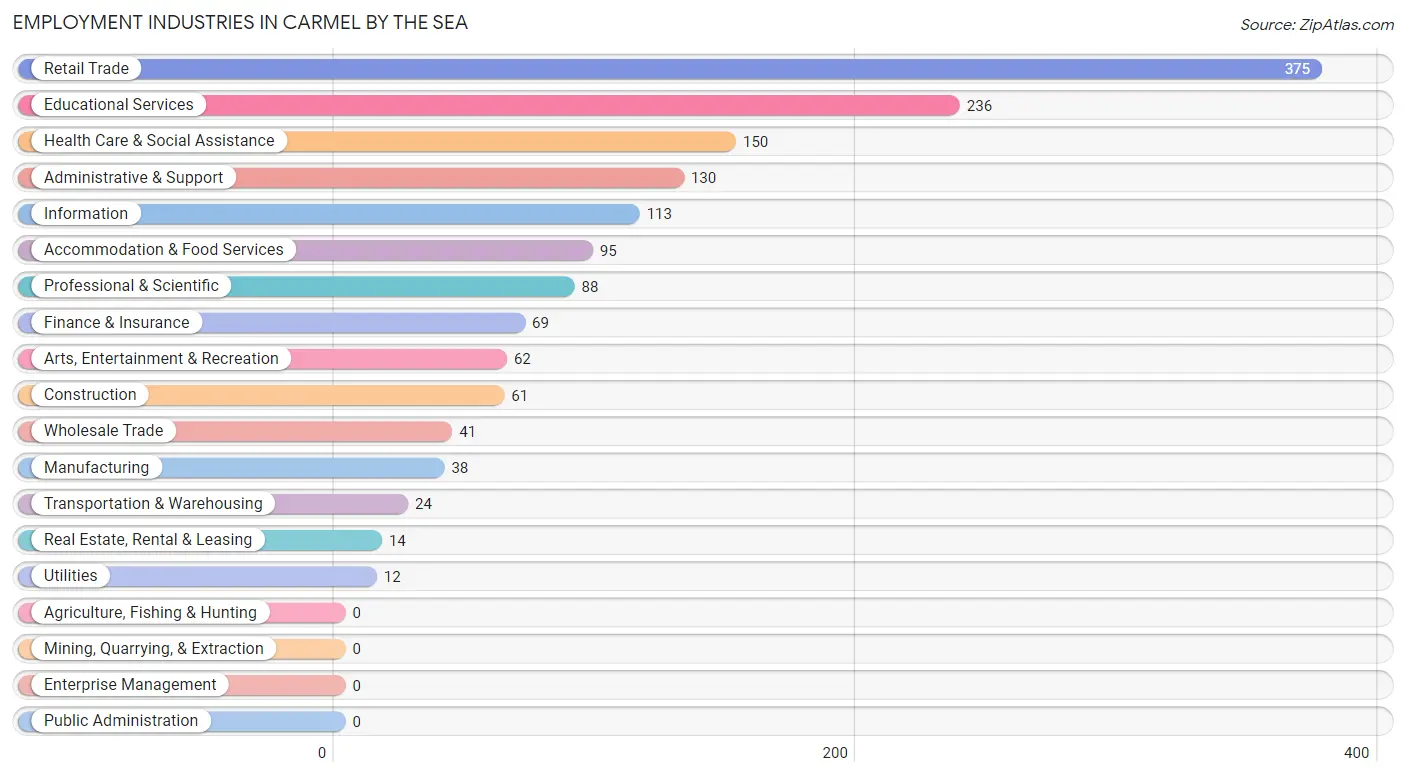
Employment Industries in Carmel By The Sea
The major employment industries in Carmel By The Sea include Retail Trade (375 | 24.0%), Educational Services (236 | 15.1%), Health Care & Social Assistance (150 | 9.6%), Administrative & Support (130 | 8.3%), and Information (113 | 7.2%).
Employment Industries by Sex in Carmel By The Sea
The Carmel By The Sea industries that see more men than women are Construction (100.0%), Manufacturing (100.0%), and Wholesale Trade (100.0%), whereas the industries that tend to have a higher number of women are Administrative & Support (91.5%), Retail Trade (72.0%), and Accommodation & Food Services (70.5%).
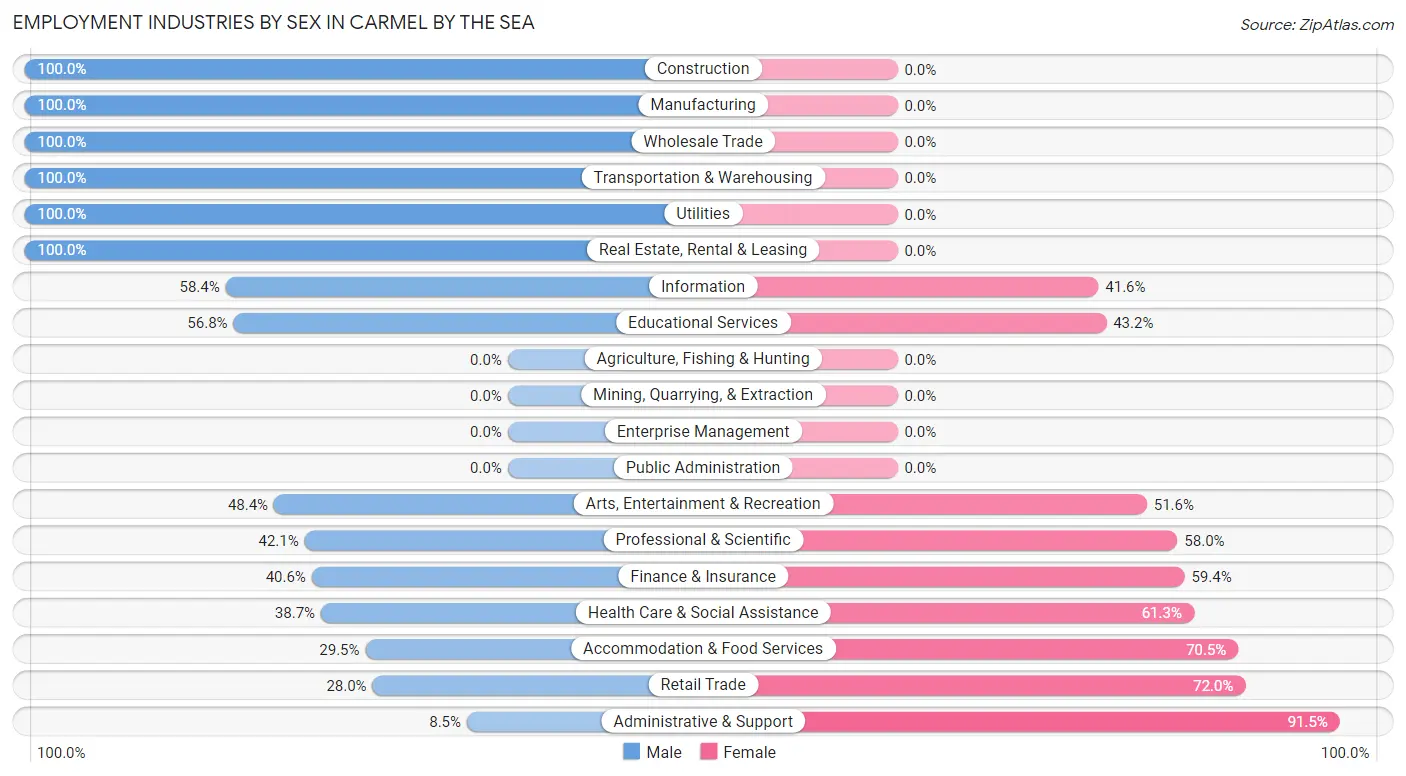
| Industry | Male | Female |
| Agriculture, Fishing & Hunting | 0 (0.0%) | 0 (0.0%) |
| Mining, Quarrying, & Extraction | 0 (0.0%) | 0 (0.0%) |
| Construction | 61 (100.0%) | 0 (0.0%) |
| Manufacturing | 38 (100.0%) | 0 (0.0%) |
| Wholesale Trade | 41 (100.0%) | 0 (0.0%) |
| Retail Trade | 105 (28.0%) | 270 (72.0%) |
| Transportation & Warehousing | 24 (100.0%) | 0 (0.0%) |
| Utilities | 12 (100.0%) | 0 (0.0%) |
| Information | 66 (58.4%) | 47 (41.6%) |
| Finance & Insurance | 28 (40.6%) | 41 (59.4%) |
| Real Estate, Rental & Leasing | 14 (100.0%) | 0 (0.0%) |
| Professional & Scientific | 37 (42.0%) | 51 (58.0%) |
| Enterprise Management | 0 (0.0%) | 0 (0.0%) |
| Administrative & Support | 11 (8.5%) | 119 (91.5%) |
| Educational Services | 134 (56.8%) | 102 (43.2%) |
| Health Care & Social Assistance | 58 (38.7%) | 92 (61.3%) |
| Arts, Entertainment & Recreation | 30 (48.4%) | 32 (51.6%) |
| Accommodation & Food Services | 28 (29.5%) | 67 (70.5%) |
| Public Administration | 0 (0.0%) | 0 (0.0%) |
| Total | 726 (46.5%) | 837 (53.5%) |
Education in Carmel By The Sea
School Enrollment in Carmel By The Sea
The most common levels of schooling among the 240 students in Carmel By The Sea are middle school (120 | 50.0%), high school (57 | 23.7%), and nursery / preschool (27 | 11.3%).
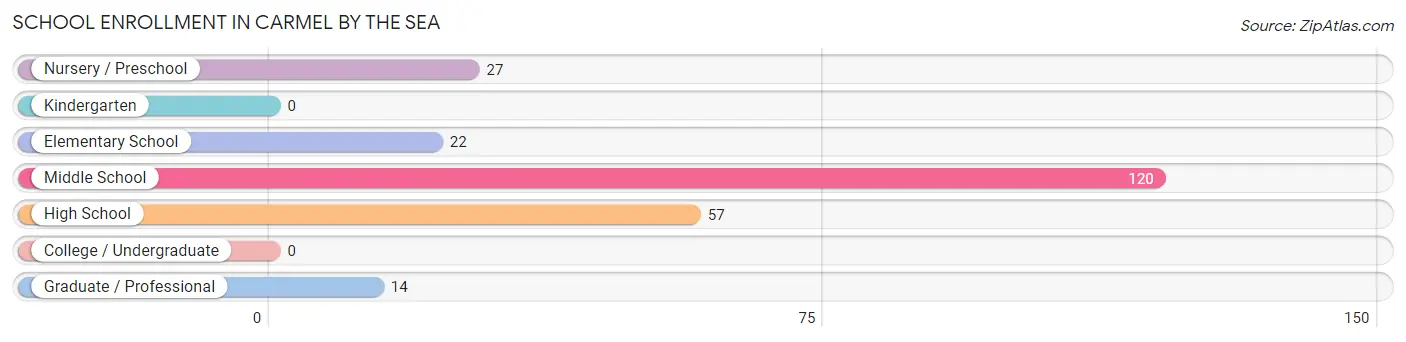
| School Level | # Students | % Students |
| Nursery / Preschool | 27 | 11.3% |
| Kindergarten | 0 | 0.0% |
| Elementary School | 22 | 9.2% |
| Middle School | 120 | 50.0% |
| High School | 57 | 23.7% |
| College / Undergraduate | 0 | 0.0% |
| Graduate / Professional | 14 | 5.8% |
| Total | 240 | 100.0% |
School Enrollment by Age by Funding Source in Carmel By The Sea
Out of a total of 240 students who are enrolled in schools in Carmel By The Sea, 41 (17.1%) attend a private institution, while the remaining 199 (82.9%) are enrolled in public schools. The age group of 5 to 9 year old has the highest likelihood of being enrolled in private schools, with 27 (100.0% in the age bracket) enrolled. Conversely, the age group of 10 to 14 year olds has the lowest likelihood of being enrolled in a private school, with 183 (100.0% in the age bracket) attending a public institution.
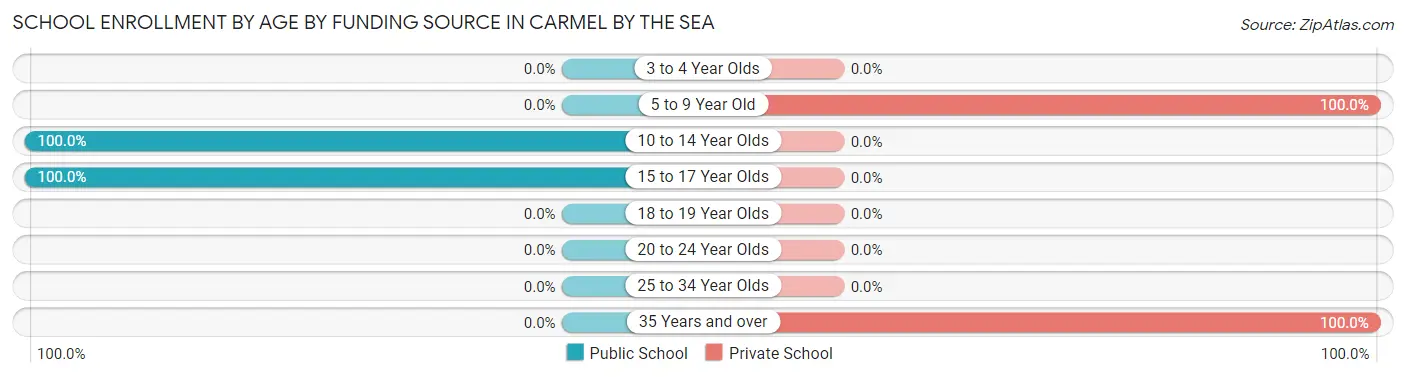
| Age Bracket | Public School | Private School |
| 3 to 4 Year Olds | 0 (0.0%) | 0 (0.0%) |
| 5 to 9 Year Old | 0 (0.0%) | 27 (100.0%) |
| 10 to 14 Year Olds | 183 (100.0%) | 0 (0.0%) |
| 15 to 17 Year Olds | 16 (100.0%) | 0 (0.0%) |
| 18 to 19 Year Olds | 0 (0.0%) | 0 (0.0%) |
| 20 to 24 Year Olds | 0 (0.0%) | 0 (0.0%) |
| 25 to 34 Year Olds | 0 (0.0%) | 0 (0.0%) |
| 35 Years and over | 0 (0.0%) | 14 (100.0%) |
| Total | 199 (82.9%) | 41 (17.1%) |
Educational Attainment by Field of Study in Carmel By The Sea
Business (408 | 17.5%), social sciences (374 | 16.0%), liberal arts & history (281 | 12.0%), visual & performing arts (219 | 9.4%), and bio, nature & agricultural (198 | 8.5%) are the most common fields of study among 2,331 individuals in Carmel By The Sea who have obtained a bachelor's degree or higher.
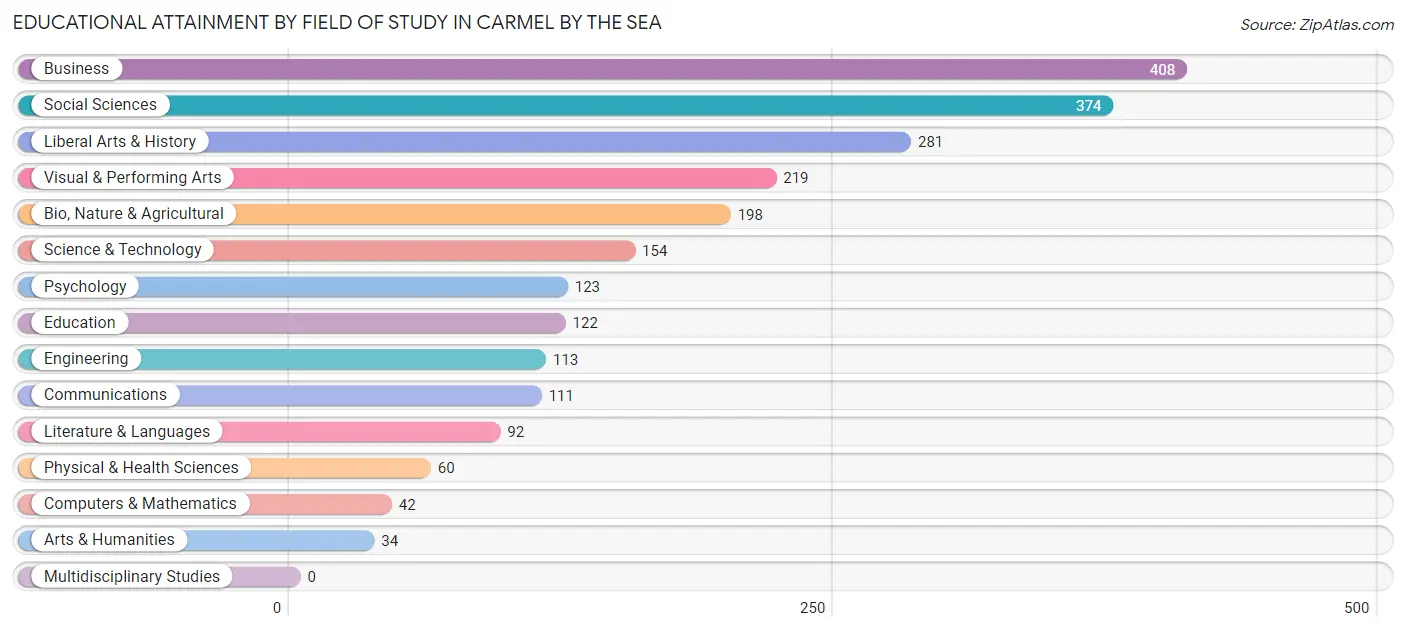
| Field of Study | # Graduates | % Graduates |
| Computers & Mathematics | 42 | 1.8% |
| Bio, Nature & Agricultural | 198 | 8.5% |
| Physical & Health Sciences | 60 | 2.6% |
| Psychology | 123 | 5.3% |
| Social Sciences | 374 | 16.0% |
| Engineering | 113 | 4.9% |
| Multidisciplinary Studies | 0 | 0.0% |
| Science & Technology | 154 | 6.6% |
| Business | 408 | 17.5% |
| Education | 122 | 5.2% |
| Literature & Languages | 92 | 4.0% |
| Liberal Arts & History | 281 | 12.0% |
| Visual & Performing Arts | 219 | 9.4% |
| Communications | 111 | 4.8% |
| Arts & Humanities | 34 | 1.5% |
| Total | 2,331 | 100.0% |
Transportation & Commute in Carmel By The Sea
Vehicle Availability by Sex in Carmel By The Sea
The most prevalent vehicle ownership categories in Carmel By The Sea are males with 2 vehicles (313, accounting for 43.1%) and females with 2 vehicles (312, making up 38.5%).
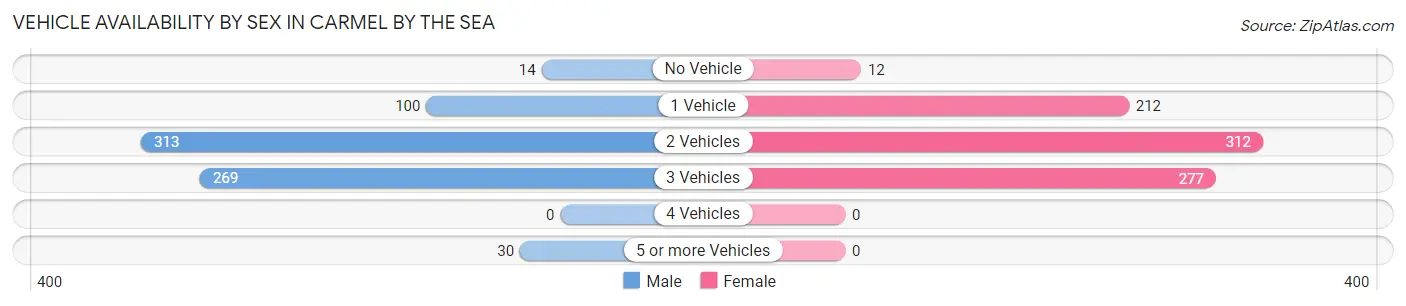
| Vehicles Available | Male | Female |
| No Vehicle | 14 (1.9%) | 12 (1.5%) |
| 1 Vehicle | 100 (13.8%) | 212 (26.1%) |
| 2 Vehicles | 313 (43.1%) | 312 (38.4%) |
| 3 Vehicles | 269 (37.0%) | 277 (34.1%) |
| 4 Vehicles | 0 (0.0%) | 0 (0.0%) |
| 5 or more Vehicles | 30 (4.1%) | 0 (0.0%) |
| Total | 726 (100.0%) | 813 (100.0%) |
Commute Time in Carmel By The Sea
The most frequently occuring commute durations in Carmel By The Sea are less than 5 minutes (459 commuters, 36.5%), 5 to 9 minutes (202 commuters, 16.1%), and 15 to 19 minutes (152 commuters, 12.1%).
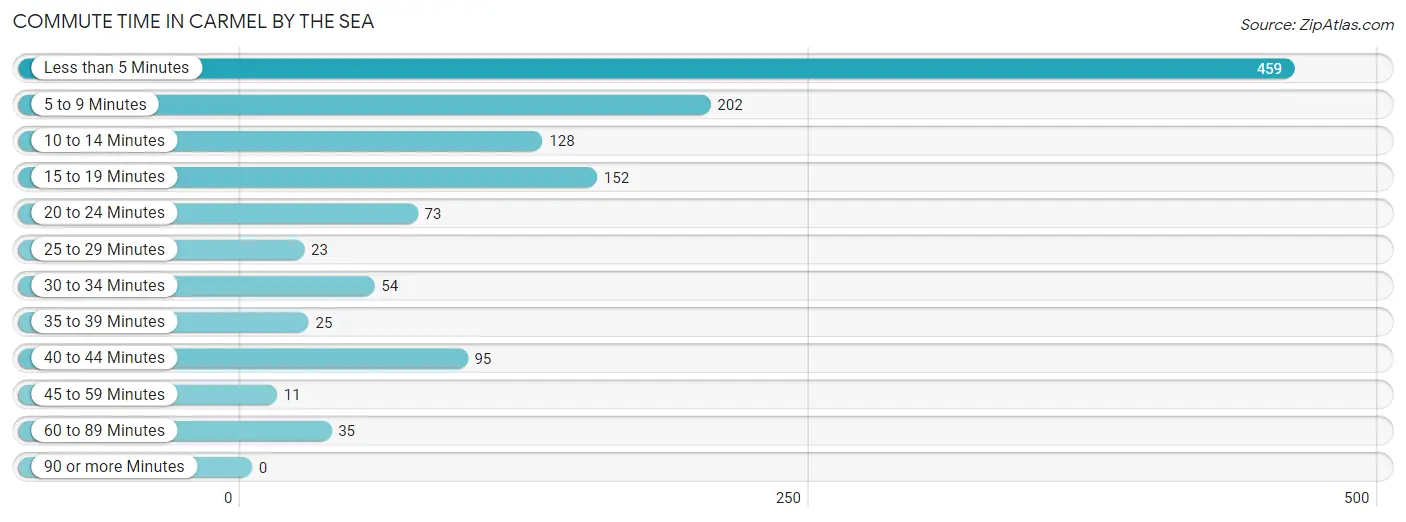
| Commute Time | # Commuters | % Commuters |
| Less than 5 Minutes | 459 | 36.5% |
| 5 to 9 Minutes | 202 | 16.1% |
| 10 to 14 Minutes | 128 | 10.2% |
| 15 to 19 Minutes | 152 | 12.1% |
| 20 to 24 Minutes | 73 | 5.8% |
| 25 to 29 Minutes | 23 | 1.8% |
| 30 to 34 Minutes | 54 | 4.3% |
| 35 to 39 Minutes | 25 | 2.0% |
| 40 to 44 Minutes | 95 | 7.6% |
| 45 to 59 Minutes | 11 | 0.9% |
| 60 to 89 Minutes | 35 | 2.8% |
| 90 or more Minutes | 0 | 0.0% |
Commute Time by Sex in Carmel By The Sea
The most common commute times in Carmel By The Sea are less than 5 minutes (208 commuters, 40.6%) for males and less than 5 minutes (251 commuters, 33.7%) for females.
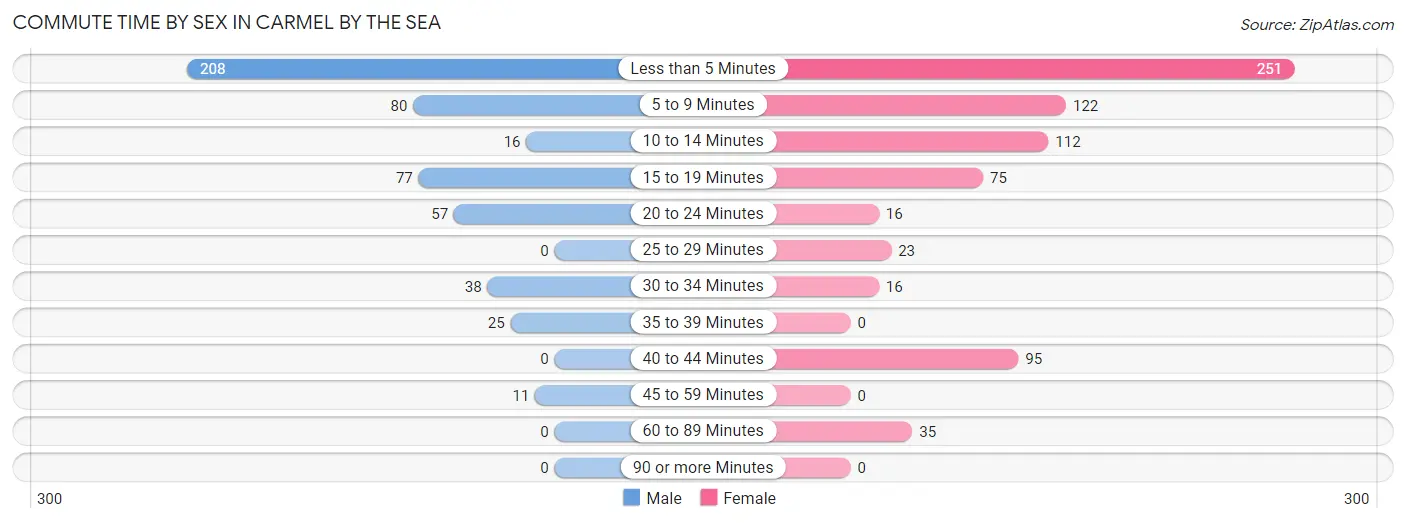
| Commute Time | Male | Female |
| Less than 5 Minutes | 208 (40.6%) | 251 (33.7%) |
| 5 to 9 Minutes | 80 (15.6%) | 122 (16.4%) |
| 10 to 14 Minutes | 16 (3.1%) | 112 (15.0%) |
| 15 to 19 Minutes | 77 (15.0%) | 75 (10.1%) |
| 20 to 24 Minutes | 57 (11.1%) | 16 (2.1%) |
| 25 to 29 Minutes | 0 (0.0%) | 23 (3.1%) |
| 30 to 34 Minutes | 38 (7.4%) | 16 (2.1%) |
| 35 to 39 Minutes | 25 (4.9%) | 0 (0.0%) |
| 40 to 44 Minutes | 0 (0.0%) | 95 (12.8%) |
| 45 to 59 Minutes | 11 (2.1%) | 0 (0.0%) |
| 60 to 89 Minutes | 0 (0.0%) | 35 (4.7%) |
| 90 or more Minutes | 0 (0.0%) | 0 (0.0%) |
Time of Departure to Work by Sex in Carmel By The Sea
The most frequent times of departure to work in Carmel By The Sea are 9:00 AM to 9:59 AM (233, 45.5%) for males and 9:00 AM to 9:59 AM (280, 37.6%) for females.
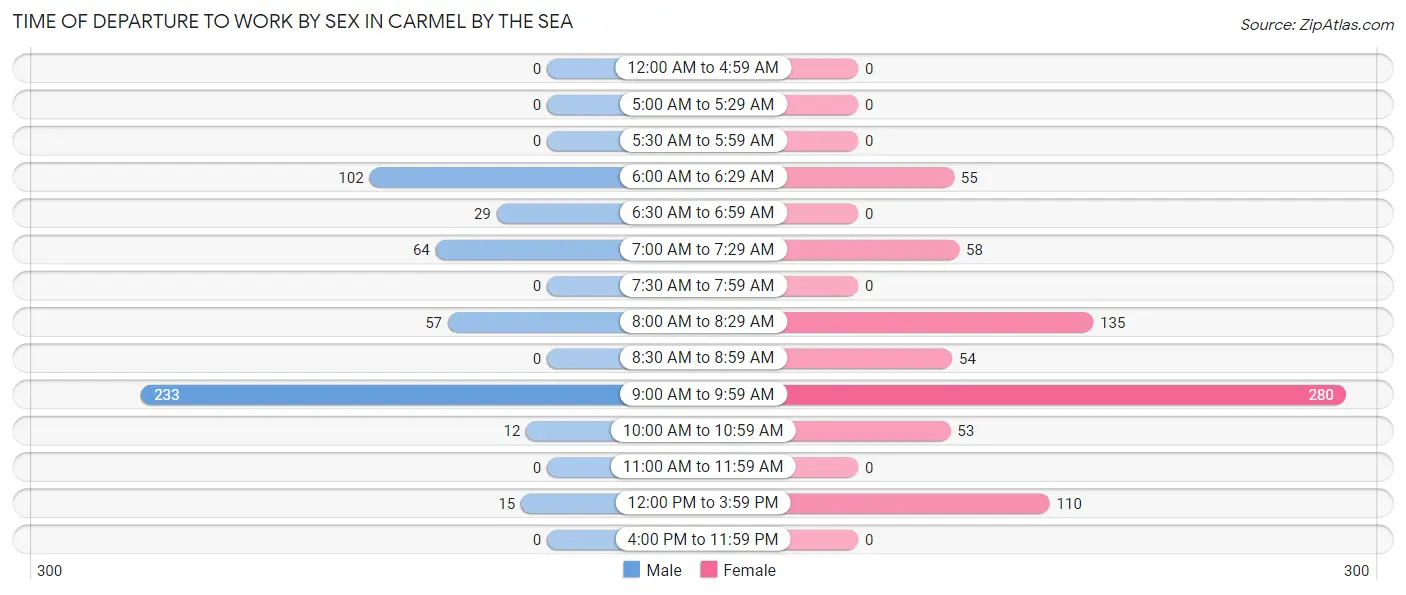
| Time of Departure | Male | Female |
| 12:00 AM to 4:59 AM | 0 (0.0%) | 0 (0.0%) |
| 5:00 AM to 5:29 AM | 0 (0.0%) | 0 (0.0%) |
| 5:30 AM to 5:59 AM | 0 (0.0%) | 0 (0.0%) |
| 6:00 AM to 6:29 AM | 102 (19.9%) | 55 (7.4%) |
| 6:30 AM to 6:59 AM | 29 (5.7%) | 0 (0.0%) |
| 7:00 AM to 7:29 AM | 64 (12.5%) | 58 (7.8%) |
| 7:30 AM to 7:59 AM | 0 (0.0%) | 0 (0.0%) |
| 8:00 AM to 8:29 AM | 57 (11.1%) | 135 (18.1%) |
| 8:30 AM to 8:59 AM | 0 (0.0%) | 54 (7.2%) |
| 9:00 AM to 9:59 AM | 233 (45.5%) | 280 (37.6%) |
| 10:00 AM to 10:59 AM | 12 (2.3%) | 53 (7.1%) |
| 11:00 AM to 11:59 AM | 0 (0.0%) | 0 (0.0%) |
| 12:00 PM to 3:59 PM | 15 (2.9%) | 110 (14.8%) |
| 4:00 PM to 11:59 PM | 0 (0.0%) | 0 (0.0%) |
| Total | 512 (100.0%) | 745 (100.0%) |
Housing Occupancy in Carmel By The Sea
Occupancy by Ownership in Carmel By The Sea
Of the total 1,587 dwellings in Carmel By The Sea, owner-occupied units account for 905 (57.0%), while renter-occupied units make up 682 (43.0%).
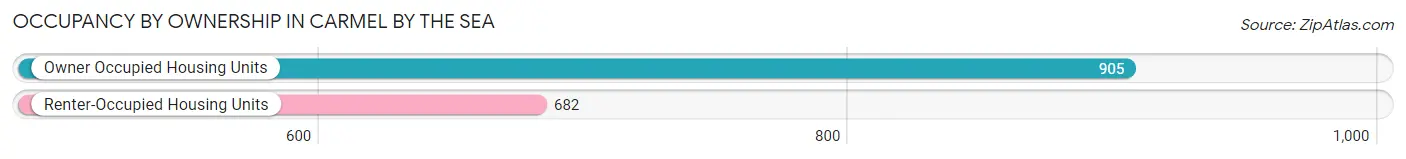
| Occupancy | # Housing Units | % Housing Units |
| Owner Occupied Housing Units | 905 | 57.0% |
| Renter-Occupied Housing Units | 682 | 43.0% |
| Total Occupied Housing Units | 1,587 | 100.0% |
Occupancy by Household Size in Carmel By The Sea
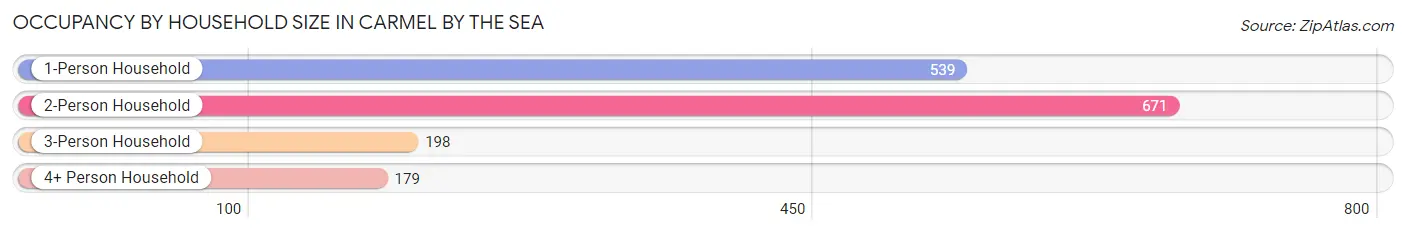
| Household Size | # Housing Units | % Housing Units |
| 1-Person Household | 539 | 34.0% |
| 2-Person Household | 671 | 42.3% |
| 3-Person Household | 198 | 12.5% |
| 4+ Person Household | 179 | 11.3% |
| Total Housing Units | 1,587 | 100.0% |
Occupancy by Ownership by Household Size in Carmel By The Sea
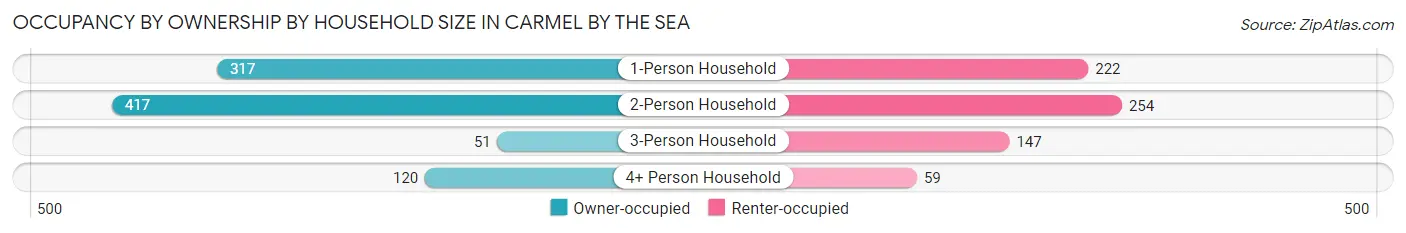
| Household Size | Owner-occupied | Renter-occupied |
| 1-Person Household | 317 (58.8%) | 222 (41.2%) |
| 2-Person Household | 417 (62.2%) | 254 (37.9%) |
| 3-Person Household | 51 (25.8%) | 147 (74.2%) |
| 4+ Person Household | 120 (67.0%) | 59 (33.0%) |
| Total Housing Units | 905 (57.0%) | 682 (43.0%) |
Occupancy by Educational Attainment in Carmel By The Sea
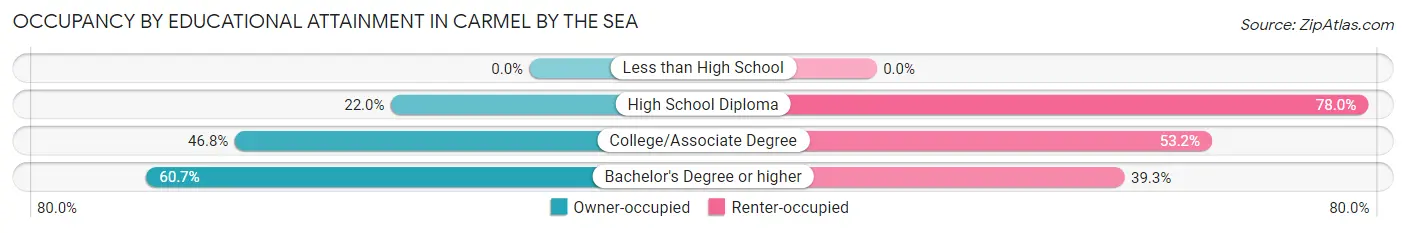
| Household Size | Owner-occupied | Renter-occupied |
| Less than High School | 0 (0.0%) | 0 (0.0%) |
| High School Diploma | 11 (22.0%) | 39 (78.0%) |
| College/Associate Degree | 130 (46.8%) | 148 (53.2%) |
| Bachelor's Degree or higher | 764 (60.7%) | 495 (39.3%) |
Occupancy by Age of Householder in Carmel By The Sea
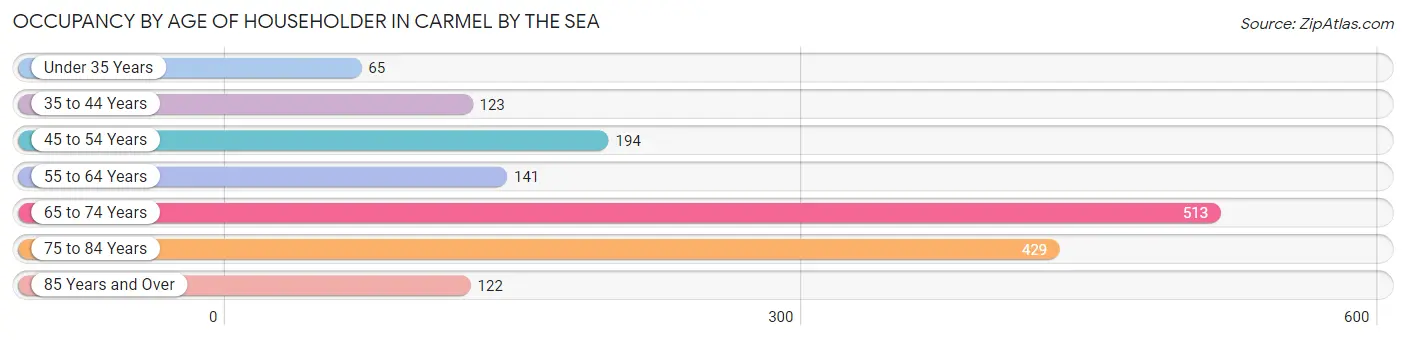
| Age Bracket | # Households | % Households |
| Under 35 Years | 65 | 4.1% |
| 35 to 44 Years | 123 | 7.7% |
| 45 to 54 Years | 194 | 12.2% |
| 55 to 64 Years | 141 | 8.9% |
| 65 to 74 Years | 513 | 32.3% |
| 75 to 84 Years | 429 | 27.0% |
| 85 Years and Over | 122 | 7.7% |
| Total | 1,587 | 100.0% |
Housing Finances in Carmel By The Sea
Median Income by Occupancy in Carmel By The Sea
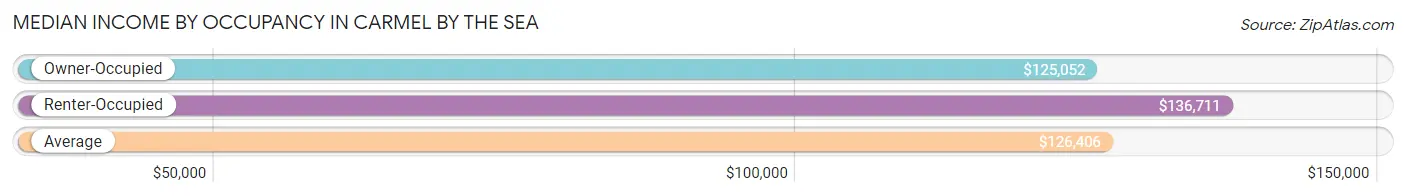
| Occupancy Type | # Households | Median Income |
| Owner-Occupied | 905 (57.0%) | $125,052 |
| Renter-Occupied | 682 (43.0%) | $136,711 |
| Average | 1,587 (100.0%) | $126,406 |
Occupancy by Householder Income Bracket in Carmel By The Sea
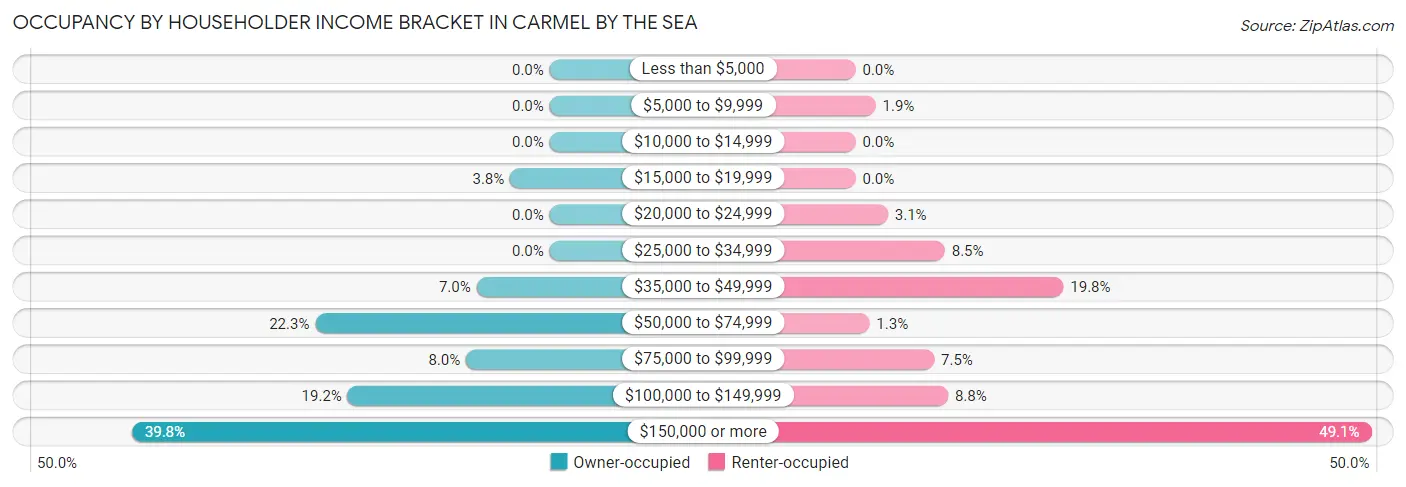
| Income Bracket | Owner-occupied | Renter-occupied |
| Less than $5,000 | 0 (0.0%) | 0 (0.0%) |
| $5,000 to $9,999 | 0 (0.0%) | 13 (1.9%) |
| $10,000 to $14,999 | 0 (0.0%) | 0 (0.0%) |
| $15,000 to $19,999 | 34 (3.8%) | 0 (0.0%) |
| $20,000 to $24,999 | 0 (0.0%) | 21 (3.1%) |
| $25,000 to $34,999 | 0 (0.0%) | 58 (8.5%) |
| $35,000 to $49,999 | 63 (7.0%) | 135 (19.8%) |
| $50,000 to $74,999 | 202 (22.3%) | 9 (1.3%) |
| $75,000 to $99,999 | 72 (8.0%) | 51 (7.5%) |
| $100,000 to $149,999 | 174 (19.2%) | 60 (8.8%) |
| $150,000 or more | 360 (39.8%) | 335 (49.1%) |
| Total | 905 (100.0%) | 682 (100.0%) |
Monthly Housing Cost Tiers in Carmel By The Sea
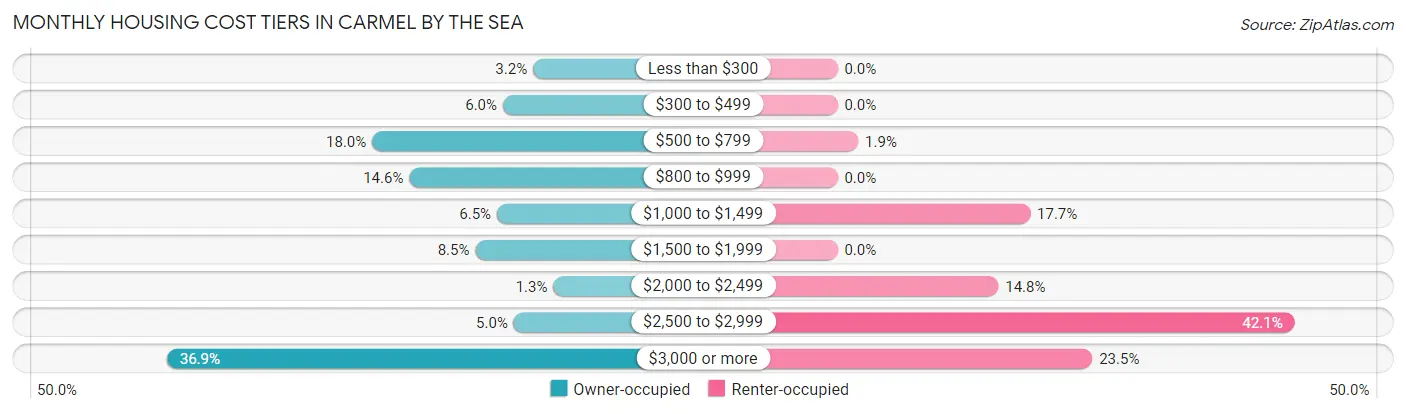
| Monthly Cost | Owner-occupied | Renter-occupied |
| Less than $300 | 29 (3.2%) | 0 (0.0%) |
| $300 to $499 | 54 (6.0%) | 0 (0.0%) |
| $500 to $799 | 163 (18.0%) | 13 (1.9%) |
| $800 to $999 | 132 (14.6%) | 0 (0.0%) |
| $1,000 to $1,499 | 59 (6.5%) | 121 (17.7%) |
| $1,500 to $1,999 | 77 (8.5%) | 0 (0.0%) |
| $2,000 to $2,499 | 12 (1.3%) | 101 (14.8%) |
| $2,500 to $2,999 | 45 (5.0%) | 287 (42.1%) |
| $3,000 or more | 334 (36.9%) | 160 (23.5%) |
| Total | 905 (100.0%) | 682 (100.0%) |
Physical Housing Characteristics in Carmel By The Sea
Housing Structures in Carmel By The Sea
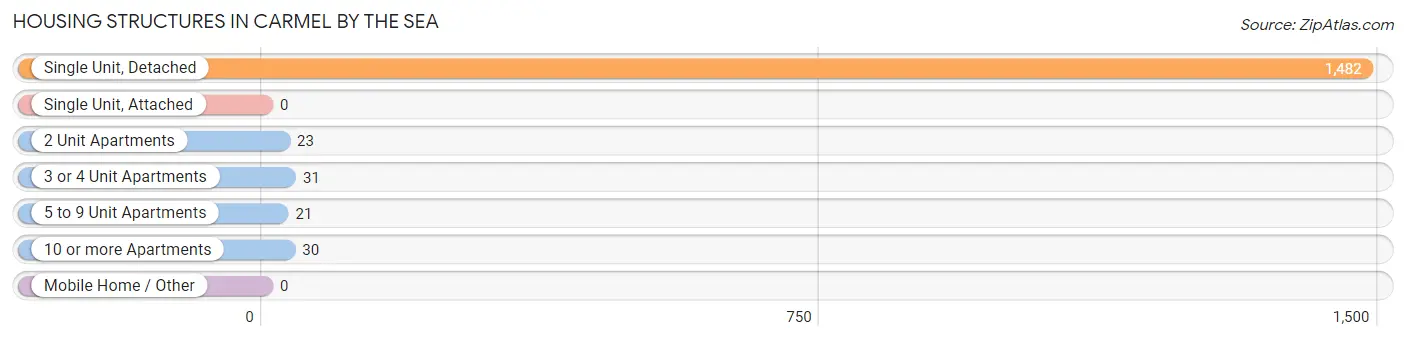
| Structure Type | # Housing Units | % Housing Units |
| Single Unit, Detached | 1,482 | 93.4% |
| Single Unit, Attached | 0 | 0.0% |
| 2 Unit Apartments | 23 | 1.5% |
| 3 or 4 Unit Apartments | 31 | 1.9% |
| 5 to 9 Unit Apartments | 21 | 1.3% |
| 10 or more Apartments | 30 | 1.9% |
| Mobile Home / Other | 0 | 0.0% |
| Total | 1,587 | 100.0% |
Housing Structures by Occupancy in Carmel By The Sea
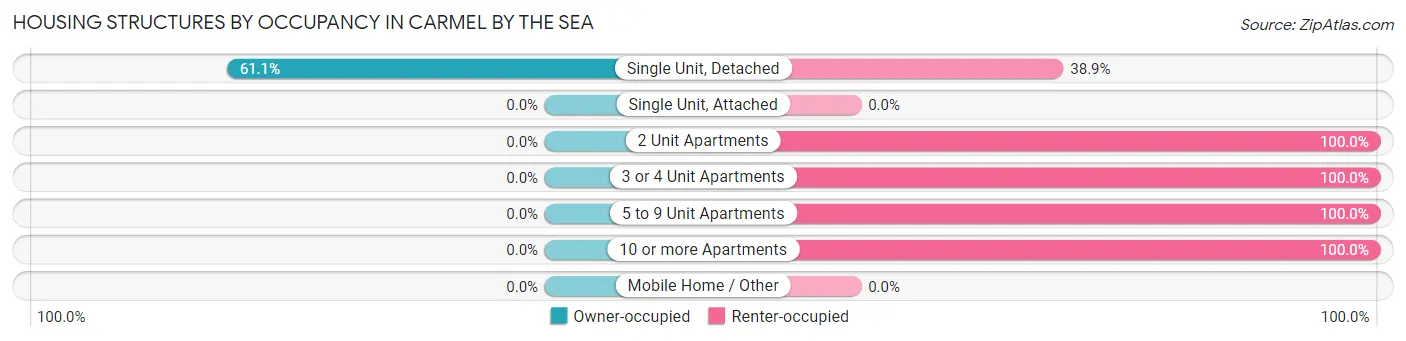
| Structure Type | Owner-occupied | Renter-occupied |
| Single Unit, Detached | 905 (61.1%) | 577 (38.9%) |
| Single Unit, Attached | 0 (0.0%) | 0 (0.0%) |
| 2 Unit Apartments | 0 (0.0%) | 23 (100.0%) |
| 3 or 4 Unit Apartments | 0 (0.0%) | 31 (100.0%) |
| 5 to 9 Unit Apartments | 0 (0.0%) | 21 (100.0%) |
| 10 or more Apartments | 0 (0.0%) | 30 (100.0%) |
| Mobile Home / Other | 0 (0.0%) | 0 (0.0%) |
| Total | 905 (57.0%) | 682 (43.0%) |
Housing Structures by Number of Rooms in Carmel By The Sea
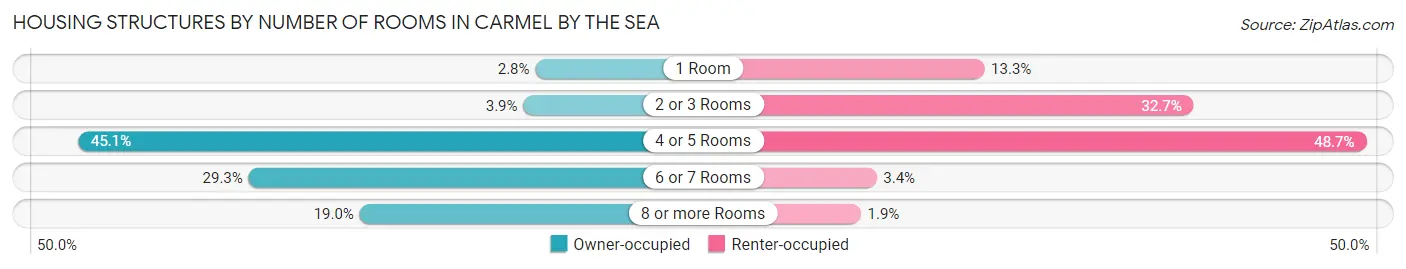
| Number of Rooms | Owner-occupied | Renter-occupied |
| 1 Room | 25 (2.8%) | 91 (13.3%) |
| 2 or 3 Rooms | 35 (3.9%) | 223 (32.7%) |
| 4 or 5 Rooms | 408 (45.1%) | 332 (48.7%) |
| 6 or 7 Rooms | 265 (29.3%) | 23 (3.4%) |
| 8 or more Rooms | 172 (19.0%) | 13 (1.9%) |
| Total | 905 (100.0%) | 682 (100.0%) |
Housing Structure by Heating Type in Carmel By The Sea
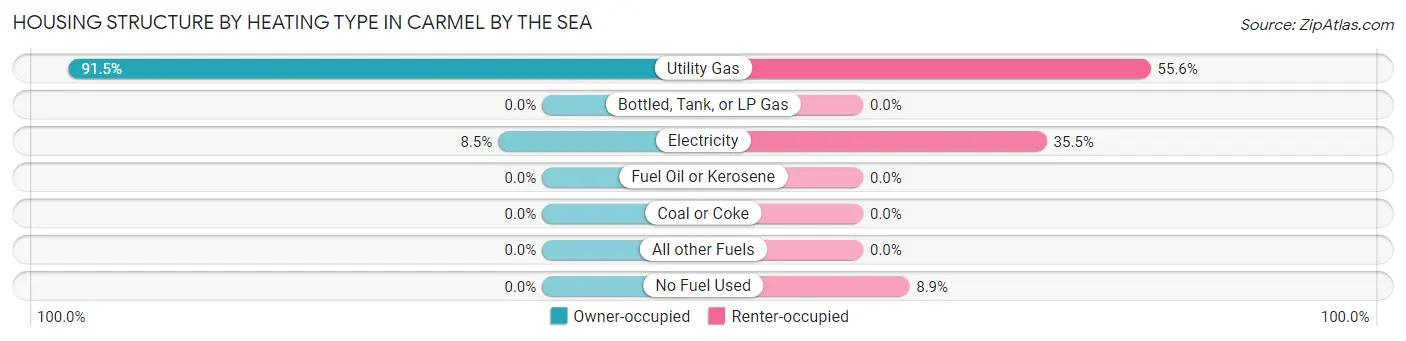
| Heating Type | Owner-occupied | Renter-occupied |
| Utility Gas | 828 (91.5%) | 379 (55.6%) |
| Bottled, Tank, or LP Gas | 0 (0.0%) | 0 (0.0%) |
| Electricity | 77 (8.5%) | 242 (35.5%) |
| Fuel Oil or Kerosene | 0 (0.0%) | 0 (0.0%) |
| Coal or Coke | 0 (0.0%) | 0 (0.0%) |
| All other Fuels | 0 (0.0%) | 0 (0.0%) |
| No Fuel Used | 0 (0.0%) | 61 (8.9%) |
| Total | 905 (100.0%) | 682 (100.0%) |
Household Vehicle Usage in Carmel By The Sea
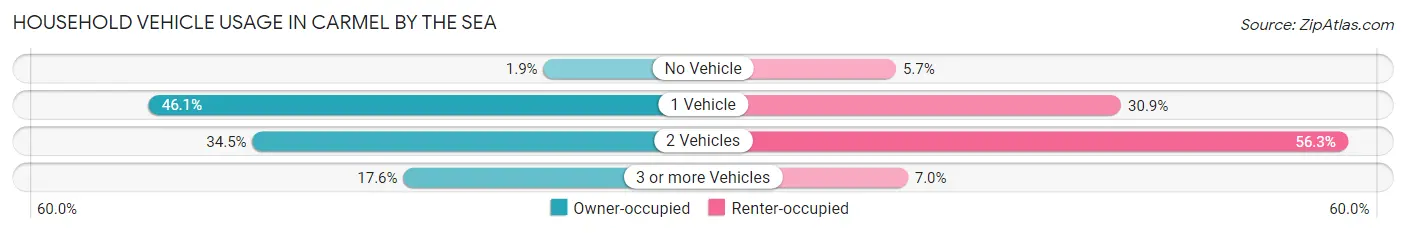
| Vehicles per Household | Owner-occupied | Renter-occupied |
| No Vehicle | 17 (1.9%) | 39 (5.7%) |
| 1 Vehicle | 417 (46.1%) | 211 (30.9%) |
| 2 Vehicles | 312 (34.5%) | 384 (56.3%) |
| 3 or more Vehicles | 159 (17.6%) | 48 (7.0%) |
| Total | 905 (100.0%) | 682 (100.0%) |
Real Estate & Mortgages in Carmel By The Sea
Real Estate and Mortgage Overview in Carmel By The Sea
| Characteristic | Without Mortgage | With Mortgage |
| Housing Units | 530 | 375 |
| Median Property Value | $1,844,500 | $1,616,800 |
| Median Household Income | $82,386 | $193 |
| Monthly Housing Costs | $828 | $298 |
| Real Estate Taxes | $5,879 | $11 |
Property Value by Mortgage Status in Carmel By The Sea
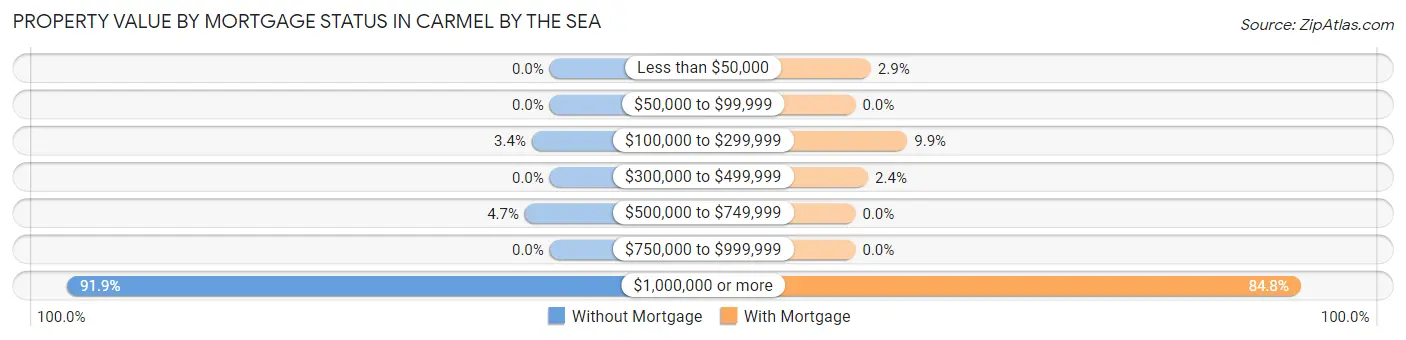
| Property Value | Without Mortgage | With Mortgage |
| Less than $50,000 | 0 (0.0%) | 11 (2.9%) |
| $50,000 to $99,999 | 0 (0.0%) | 0 (0.0%) |
| $100,000 to $299,999 | 18 (3.4%) | 37 (9.9%) |
| $300,000 to $499,999 | 0 (0.0%) | 9 (2.4%) |
| $500,000 to $749,999 | 25 (4.7%) | 0 (0.0%) |
| $750,000 to $999,999 | 0 (0.0%) | 0 (0.0%) |
| $1,000,000 or more | 487 (91.9%) | 318 (84.8%) |
| Total | 530 (100.0%) | 375 (100.0%) |
Household Income by Mortgage Status in Carmel By The Sea
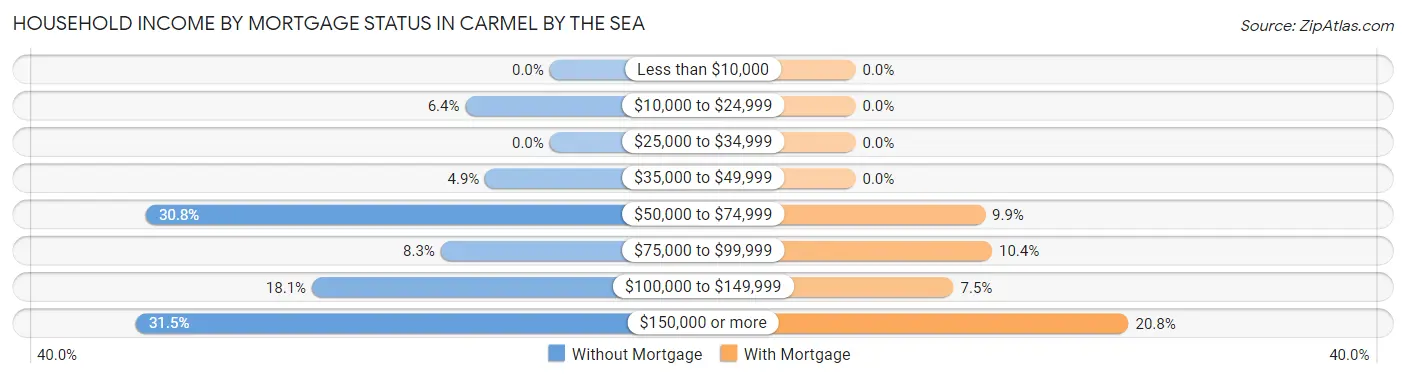
| Household Income | Without Mortgage | With Mortgage |
| Less than $10,000 | 0 (0.0%) | 0 (0.0%) |
| $10,000 to $24,999 | 34 (6.4%) | 0 (0.0%) |
| $25,000 to $34,999 | 0 (0.0%) | 0 (0.0%) |
| $35,000 to $49,999 | 26 (4.9%) | 0 (0.0%) |
| $50,000 to $74,999 | 163 (30.7%) | 37 (9.9%) |
| $75,000 to $99,999 | 44 (8.3%) | 39 (10.4%) |
| $100,000 to $149,999 | 96 (18.1%) | 28 (7.5%) |
| $150,000 or more | 167 (31.5%) | 78 (20.8%) |
| Total | 530 (100.0%) | 375 (100.0%) |
Property Value to Household Income Ratio in Carmel By The Sea
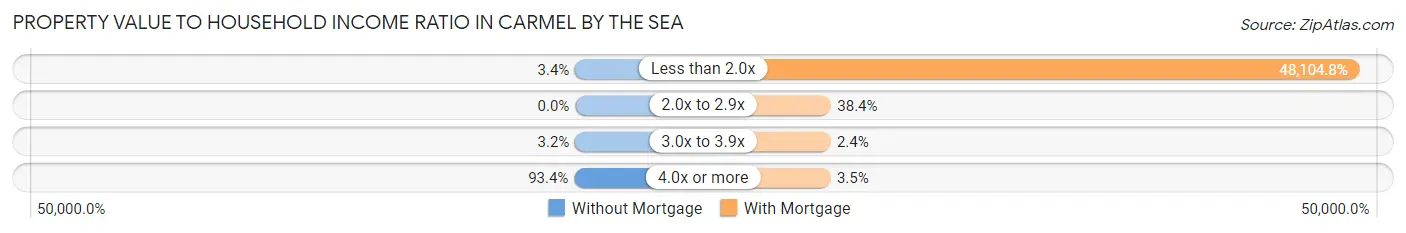
| Value-to-Income Ratio | Without Mortgage | With Mortgage |
| Less than 2.0x | 18 (3.4%) | 180,393 (48,104.8%) |
| 2.0x to 2.9x | 0 (0.0%) | 144 (38.4%) |
| 3.0x to 3.9x | 17 (3.2%) | 9 (2.4%) |
| 4.0x or more | 495 (93.4%) | 13 (3.5%) |
| Total | 530 (100.0%) | 375 (100.0%) |
Real Estate Taxes by Mortgage Status in Carmel By The Sea
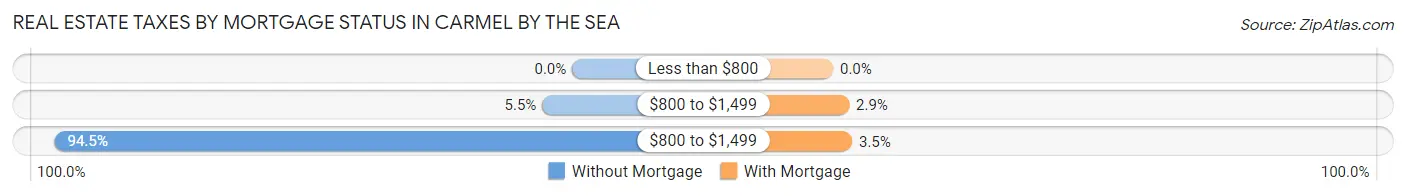
| Property Taxes | Without Mortgage | With Mortgage |
| Less than $800 | 0 (0.0%) | 0 (0.0%) |
| $800 to $1,499 | 29 (5.5%) | 11 (2.9%) |
| $800 to $1,499 | 501 (94.5%) | 13 (3.5%) |
| Total | 530 (100.0%) | 375 (100.0%) |
Health & Disability in Carmel By The Sea
Health Insurance Coverage by Age in Carmel By The Sea
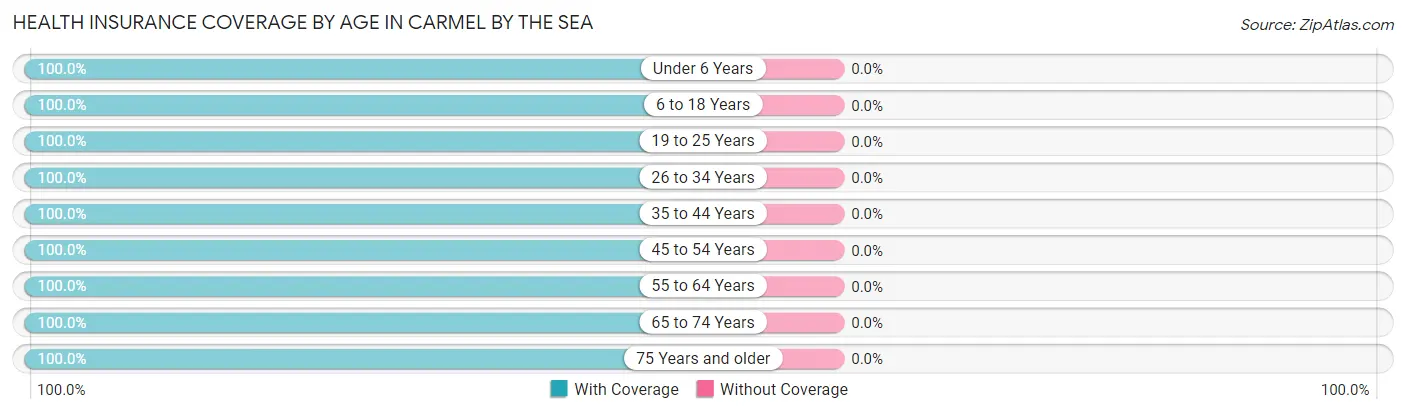
| Age Bracket | With Coverage | Without Coverage |
| Under 6 Years | 67 (100.0%) | 0 (0.0%) |
| 6 to 18 Years | 241 (100.0%) | 0 (0.0%) |
| 19 to 25 Years | 18 (100.0%) | 0 (0.0%) |
| 26 to 34 Years | 253 (100.0%) | 0 (0.0%) |
| 35 to 44 Years | 233 (100.0%) | 0 (0.0%) |
| 45 to 54 Years | 322 (100.0%) | 0 (0.0%) |
| 55 to 64 Years | 484 (100.0%) | 0 (0.0%) |
| 65 to 74 Years | 835 (100.0%) | 0 (0.0%) |
| 75 Years and older | 785 (100.0%) | 0 (0.0%) |
| Total | 3,238 (100.0%) | 0 (0.0%) |
Health Insurance Coverage by Citizenship Status in Carmel By The Sea
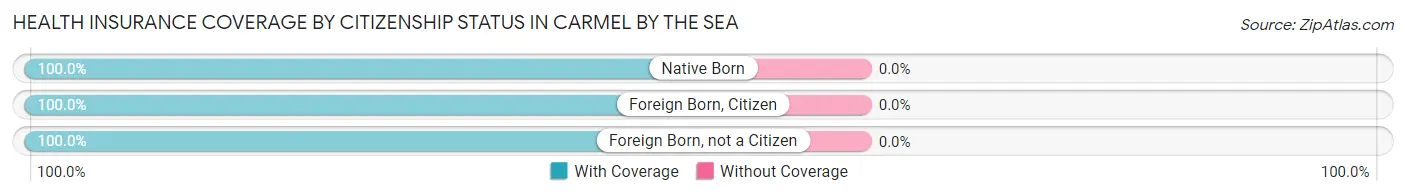
| Citizenship Status | With Coverage | Without Coverage |
| Native Born | 67 (100.0%) | 0 (0.0%) |
| Foreign Born, Citizen | 241 (100.0%) | 0 (0.0%) |
| Foreign Born, not a Citizen | 18 (100.0%) | 0 (0.0%) |
Health Insurance Coverage by Household Income in Carmel By The Sea
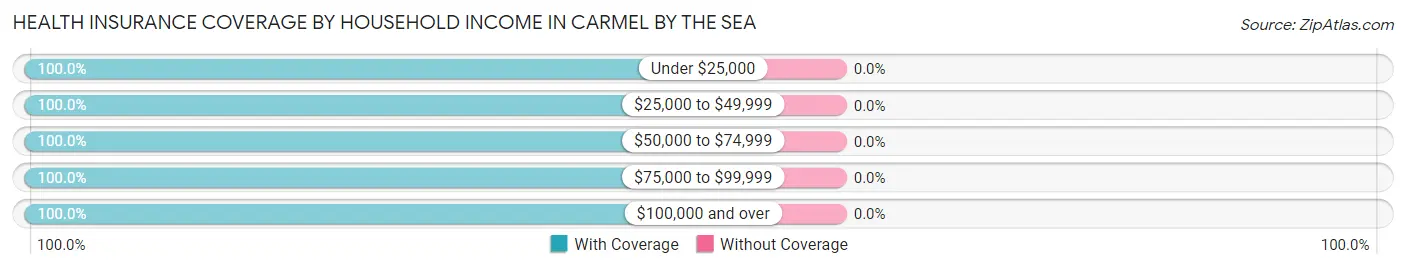
| Household Income | With Coverage | Without Coverage |
| Under $25,000 | 68 (100.0%) | 0 (0.0%) |
| $25,000 to $49,999 | 380 (100.0%) | 0 (0.0%) |
| $50,000 to $74,999 | 315 (100.0%) | 0 (0.0%) |
| $75,000 to $99,999 | 203 (100.0%) | 0 (0.0%) |
| $100,000 and over | 2,231 (100.0%) | 0 (0.0%) |
Public vs Private Health Insurance Coverage by Age in Carmel By The Sea
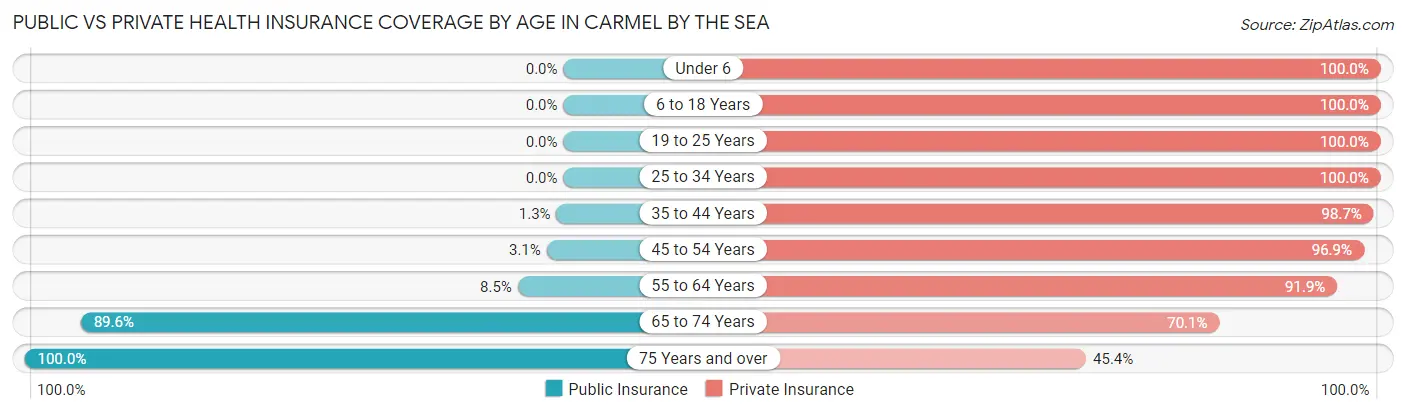
| Age Bracket | Public Insurance | Private Insurance |
| Under 6 | 0 (0.0%) | 67 (100.0%) |
| 6 to 18 Years | 0 (0.0%) | 241 (100.0%) |
| 19 to 25 Years | 0 (0.0%) | 18 (100.0%) |
| 25 to 34 Years | 0 (0.0%) | 253 (100.0%) |
| 35 to 44 Years | 3 (1.3%) | 230 (98.7%) |
| 45 to 54 Years | 10 (3.1%) | 312 (96.9%) |
| 55 to 64 Years | 41 (8.5%) | 445 (91.9%) |
| 65 to 74 Years | 748 (89.6%) | 585 (70.1%) |
| 75 Years and over | 785 (100.0%) | 356 (45.4%) |
| Total | 1,587 (49.0%) | 2,507 (77.4%) |
Disability Status by Sex by Age in Carmel By The Sea
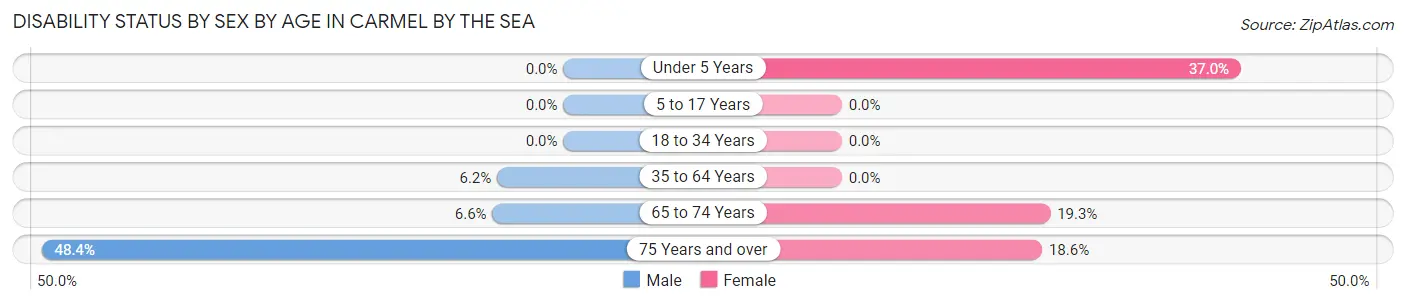
| Age Bracket | Male | Female |
| Under 5 Years | 0 (0.0%) | 20 (37.0%) |
| 5 to 17 Years | 0 (0.0%) | 0 (0.0%) |
| 18 to 34 Years | 0 (0.0%) | 0 (0.0%) |
| 35 to 64 Years | 32 (6.1%) | 0 (0.0%) |
| 65 to 74 Years | 25 (6.6%) | 88 (19.3%) |
| 75 Years and over | 169 (48.4%) | 81 (18.6%) |
Disability Class by Sex by Age in Carmel By The Sea
Disability Class: Hearing Difficulty
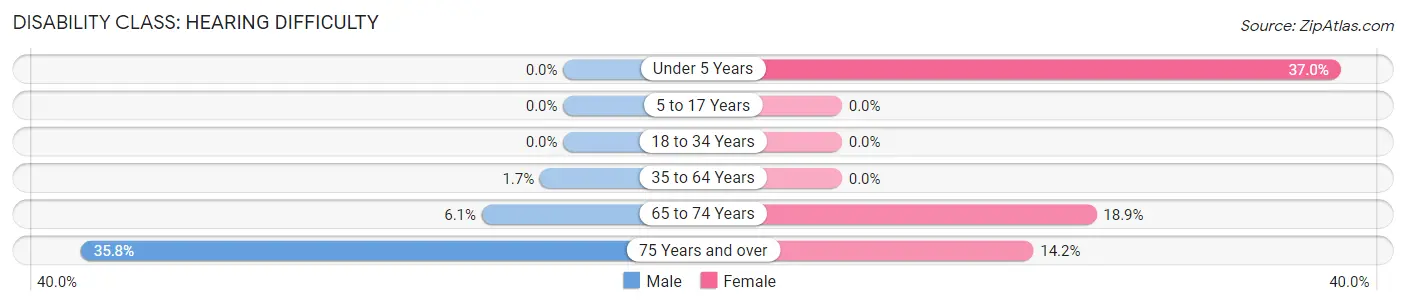
| Age Bracket | Male | Female |
| Under 5 Years | 0 (0.0%) | 20 (37.0%) |
| 5 to 17 Years | 0 (0.0%) | 0 (0.0%) |
| 18 to 34 Years | 0 (0.0%) | 0 (0.0%) |
| 35 to 64 Years | 9 (1.7%) | 0 (0.0%) |
| 65 to 74 Years | 23 (6.0%) | 86 (18.9%) |
| 75 Years and over | 125 (35.8%) | 62 (14.2%) |
Disability Class: Vision Difficulty
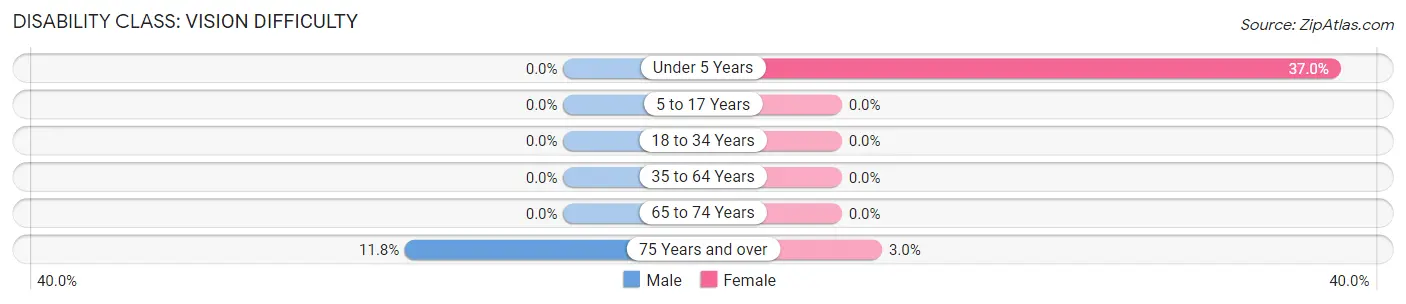
| Age Bracket | Male | Female |
| Under 5 Years | 0 (0.0%) | 20 (37.0%) |
| 5 to 17 Years | 0 (0.0%) | 0 (0.0%) |
| 18 to 34 Years | 0 (0.0%) | 0 (0.0%) |
| 35 to 64 Years | 0 (0.0%) | 0 (0.0%) |
| 65 to 74 Years | 0 (0.0%) | 0 (0.0%) |
| 75 Years and over | 41 (11.7%) | 13 (3.0%) |
Disability Class: Cognitive Difficulty
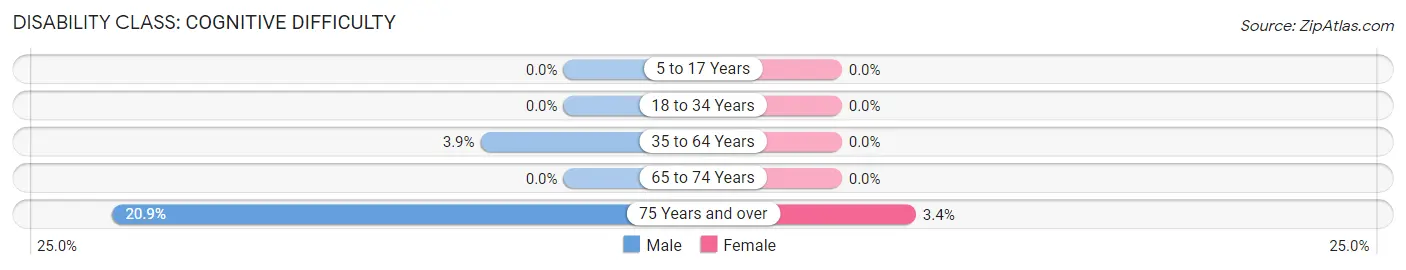
| Age Bracket | Male | Female |
| 5 to 17 Years | 0 (0.0%) | 0 (0.0%) |
| 18 to 34 Years | 0 (0.0%) | 0 (0.0%) |
| 35 to 64 Years | 20 (3.8%) | 0 (0.0%) |
| 65 to 74 Years | 0 (0.0%) | 0 (0.0%) |
| 75 Years and over | 73 (20.9%) | 15 (3.4%) |
Disability Class: Ambulatory Difficulty
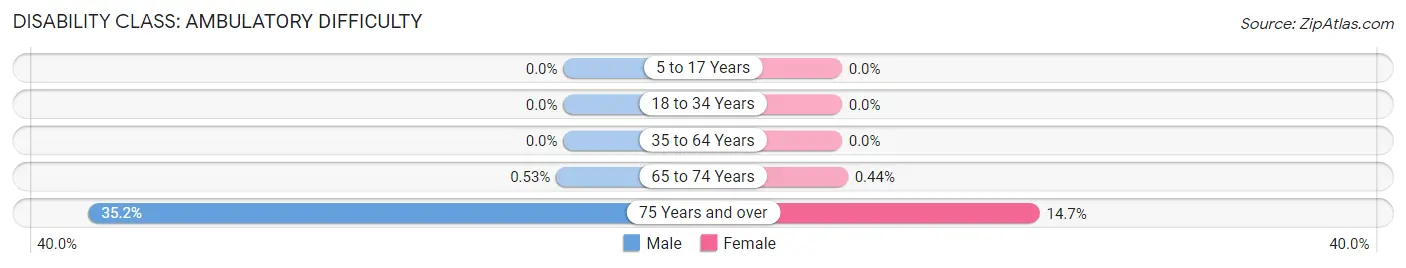
| Age Bracket | Male | Female |
| 5 to 17 Years | 0 (0.0%) | 0 (0.0%) |
| 18 to 34 Years | 0 (0.0%) | 0 (0.0%) |
| 35 to 64 Years | 0 (0.0%) | 0 (0.0%) |
| 65 to 74 Years | 2 (0.5%) | 2 (0.4%) |
| 75 Years and over | 123 (35.2%) | 64 (14.7%) |
Disability Class: Self-Care Difficulty
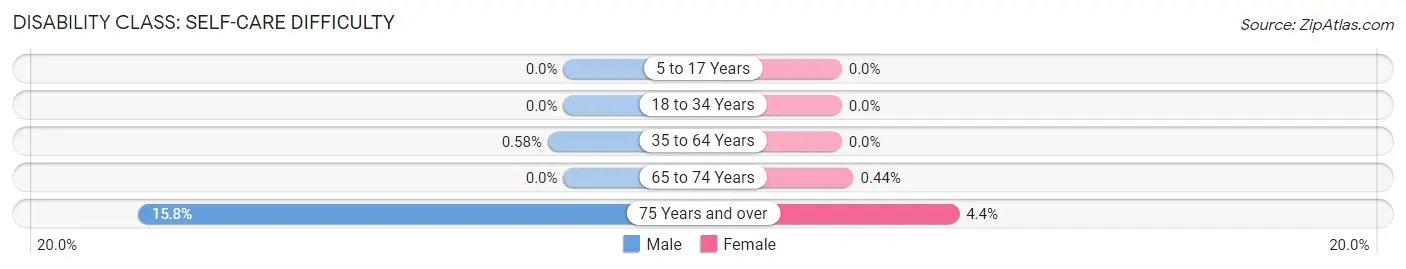
| Age Bracket | Male | Female |
| 5 to 17 Years | 0 (0.0%) | 0 (0.0%) |
| 18 to 34 Years | 0 (0.0%) | 0 (0.0%) |
| 35 to 64 Years | 3 (0.6%) | 0 (0.0%) |
| 65 to 74 Years | 0 (0.0%) | 2 (0.4%) |
| 75 Years and over | 55 (15.8%) | 19 (4.4%) |
Technology Access in Carmel By The Sea
Computing Device Access in Carmel By The Sea
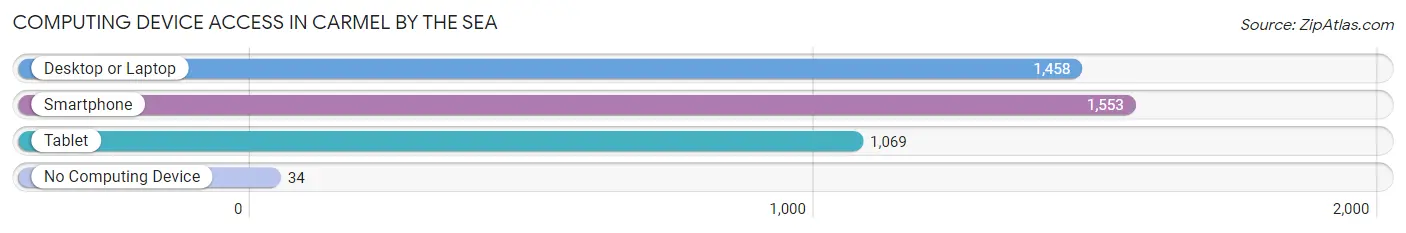
| Device Type | # Households | % Households |
| Desktop or Laptop | 1,458 | 91.9% |
| Smartphone | 1,553 | 97.9% |
| Tablet | 1,069 | 67.4% |
| No Computing Device | 34 | 2.1% |
| Total | 1,587 | 100.0% |
Internet Access in Carmel By The Sea
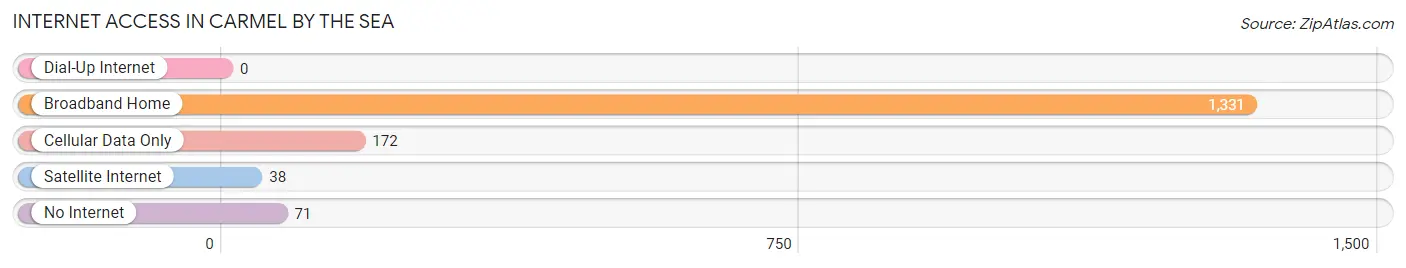
| Internet Type | # Households | % Households |
| Dial-Up Internet | 0 | 0.0% |
| Broadband Home | 1,331 | 83.9% |
| Cellular Data Only | 172 | 10.8% |
| Satellite Internet | 38 | 2.4% |
| No Internet | 71 | 4.5% |
| Total | 1,587 | 100.0% |
Carmel By The Sea Summary
Carmel-by-the-Sea, California is a small coastal city located in Monterey County, California. It is situated on the Monterey Peninsula, between the cities of Monterey and Pacific Grove. The city is known for its picturesque scenery, quaint shops, and art galleries. It is also home to a variety of restaurants, hotels, and other attractions.
History
Carmel-by-the-Sea was founded in 1902 by a group of artists and writers, led by the famous artist and writer, Hugh Comstock. Comstock and his wife, Mayotta, built a small cottage in the area, which they named “Carmel Cottage.” The cottage was the first structure in the area and served as the inspiration for the name of the city.
The city was officially incorporated in 1916 and was named after the Carmel Mission, which was founded in 1771. The mission was the first of the 21 missions established in California by the Spanish Franciscans.
Geography
Carmel-by-the-Sea is located on the Monterey Peninsula, between the cities of Monterey and Pacific Grove. It is bordered by the Pacific Ocean to the west and the Santa Lucia Mountains to the east. The city covers an area of 1.5 square miles and has a population of 4,400 people.
The city is known for its picturesque scenery, which includes white sand beaches, rocky cliffs, and lush forests. The city is also home to a variety of wildlife, including sea lions, seals, and sea otters.
Economy
Carmel-by-the-Sea is a popular tourist destination and is home to a variety of restaurants, hotels, and other attractions. The city is also home to a number of art galleries, which feature works by local and international artists.
The city’s economy is largely driven by tourism, with visitors coming from all over the world to experience the city’s unique charm. The city is also home to a number of businesses, including retail stores, restaurants, and hotels.
Demographics
As of the 2010 census, the population of Carmel-by-the-Sea was 4,400 people. The racial makeup of the city was 94.3% White, 0.7% African American, 0.2% Native American, 1.7% Asian, 0.1% Pacific Islander, 0.7% from other races, and 2.2% from two or more races. The median household income was $90,000, and the median family income was $105,000.
Carmel-by-the-Sea is a popular tourist destination and is home to a variety of people from all over the world. The city is known for its picturesque scenery, quaint shops, and art galleries. It is also home to a variety of restaurants, hotels, and other attractions. The city’s economy is largely driven by tourism, with visitors coming from all over the world to experience the city’s unique charm.
Common Questions
What is Per Capita Income in Carmel By The Sea?
Per Capita income in Carmel By The Sea is $84,508.
What is the Median Family Income in Carmel By The Sea?
Median Family Income in Carmel By The Sea is $183,607.
What is the Median Household income in Carmel By The Sea?
Median Household Income in Carmel By The Sea is $126,406.
What is Income or Wage Gap in Carmel By The Sea?
Income or Wage Gap in Carmel By The Sea is 49.1%.
Women in Carmel By The Sea earn 50.9 cents for every dollar earned by a man.
What is Inequality or Gini Index in Carmel By The Sea?
Inequality or Gini Index in Carmel By The Sea is 0.47.
What is the Total Population of Carmel By The Sea?
Total Population of Carmel By The Sea is 3,239.
What is the Total Male Population of Carmel By The Sea?
Total Male Population of Carmel By The Sea is 1,521.
What is the Total Female Population of Carmel By The Sea?
Total Female Population of Carmel By The Sea is 1,718.
What is the Ratio of Males per 100 Females in Carmel By The Sea?
There are 88.53 Males per 100 Females in Carmel By The Sea.
What is the Ratio of Females per 100 Males in Carmel By The Sea?
There are 112.95 Females per 100 Males in Carmel By The Sea.
What is the Median Population Age in Carmel By The Sea?
Median Population Age in Carmel By The Sea is 65.0 Years.
What is the Average Family Size in Carmel By The Sea
Average Family Size in Carmel By The Sea is 2.3 People.
What is the Average Household Size in Carmel By The Sea
Average Household Size in Carmel By The Sea is 2.0 People.
How Large is the Labor Force in Carmel By The Sea?
There are 1,579 People in the Labor Forcein in Carmel By The Sea.
What is the Percentage of People in the Labor Force in Carmel By The Sea?
53.3% of People are in the Labor Force in Carmel By The Sea.
What is the Unemployment Rate in Carmel By The Sea?
Unemployment Rate in Carmel By The Sea is 1.0%.