Harker Heights, TX Map & Demographics
Harker Heights Map
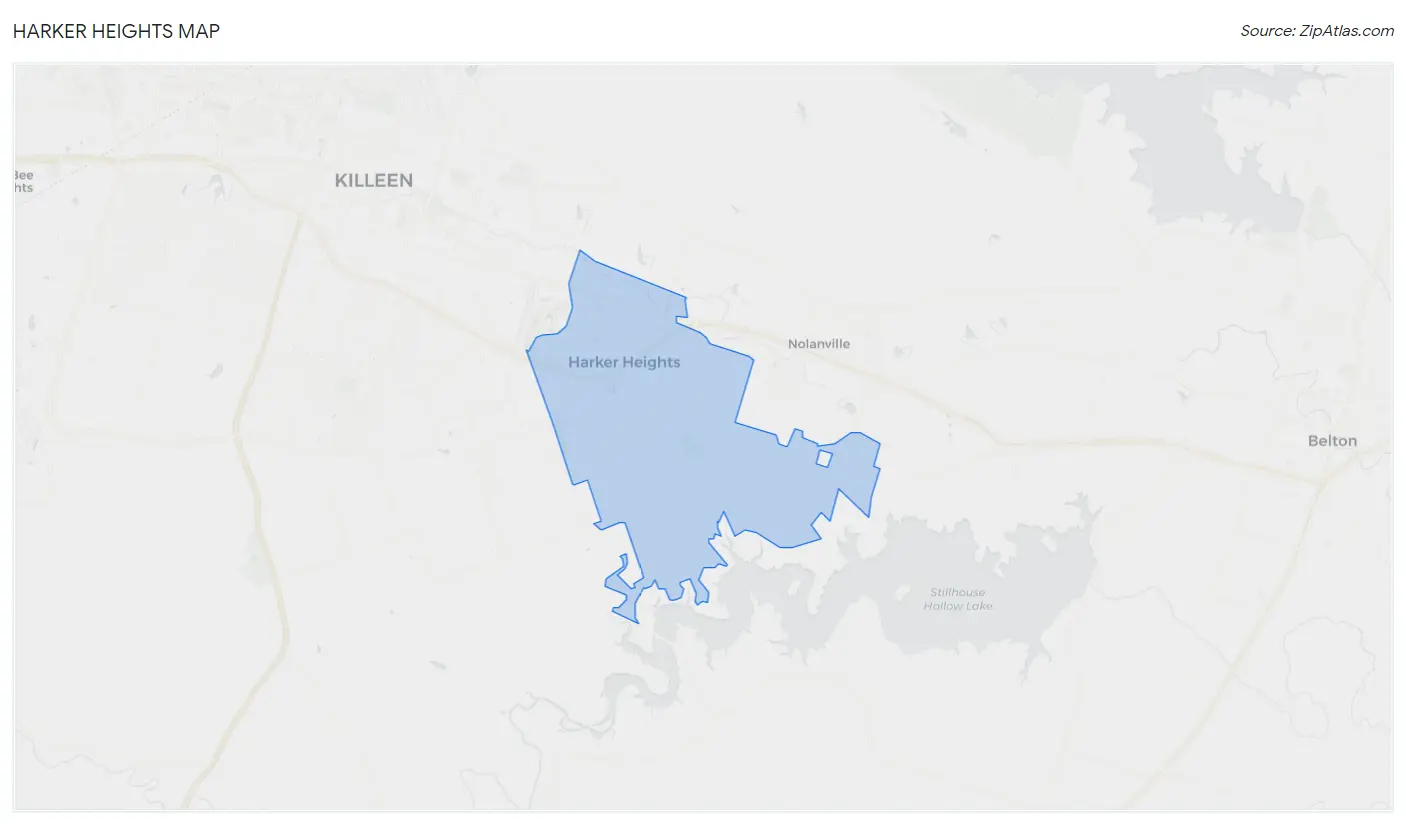
Harker Heights Overview
$34,203
PER CAPITA INCOME
$86,911
AVG FAMILY INCOME
$72,258
AVG HOUSEHOLD INCOME
48.6%
WAGE / INCOME GAP [ % ]
51.4¢/ $1
WAGE / INCOME GAP [ $ ]
0.41
INEQUALITY / GINI INDEX
33,036
TOTAL POPULATION
16,449
MALE POPULATION
16,587
FEMALE POPULATION
99.17
MALES / 100 FEMALES
100.84
FEMALES / 100 MALES
34.5
MEDIAN AGE
3.3
AVG FAMILY SIZE
2.8
AVG HOUSEHOLD SIZE
16,619
LABOR FORCE [ PEOPLE ]
67.8%
PERCENT IN LABOR FORCE
4.7%
UNEMPLOYMENT RATE
Harker Heights Zip Codes
Harker Heights Area Codes
Income in Harker Heights
Income Overview in Harker Heights
Per Capita Income in Harker Heights is $34,203, while median incomes of families and households are $86,911 and $72,258 respectively.
| Characteristic | Number | Measure |
| Per Capita Income | 33,036 | $34,203 |
| Median Family Income | 8,563 | $86,911 |
| Mean Family Income | 8,563 | $99,230 |
| Median Household Income | 11,779 | $72,258 |
| Mean Household Income | 11,779 | $91,043 |
| Income Deficit | 8,563 | $0 |
| Wage / Income Gap (%) | 33,036 | 48.57% |
| Wage / Income Gap ($) | 33,036 | 51.43¢ per $1 |
| Gini / Inequality Index | 33,036 | 0.41 |
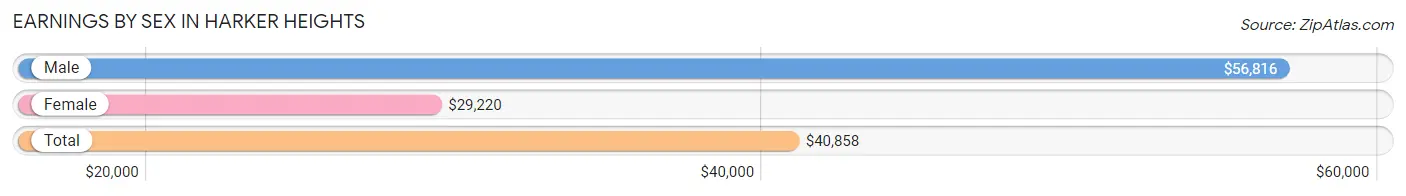
Earnings by Sex in Harker Heights
Average Earnings in Harker Heights are $40,858, $56,816 for men and $29,220 for women, a difference of 48.6%.
| Sex | Number | Average Earnings |
| Male | 8,517 (49.8%) | $56,816 |
| Female | 8,576 (50.2%) | $29,220 |
| Total | 17,093 (100.0%) | $40,858 |
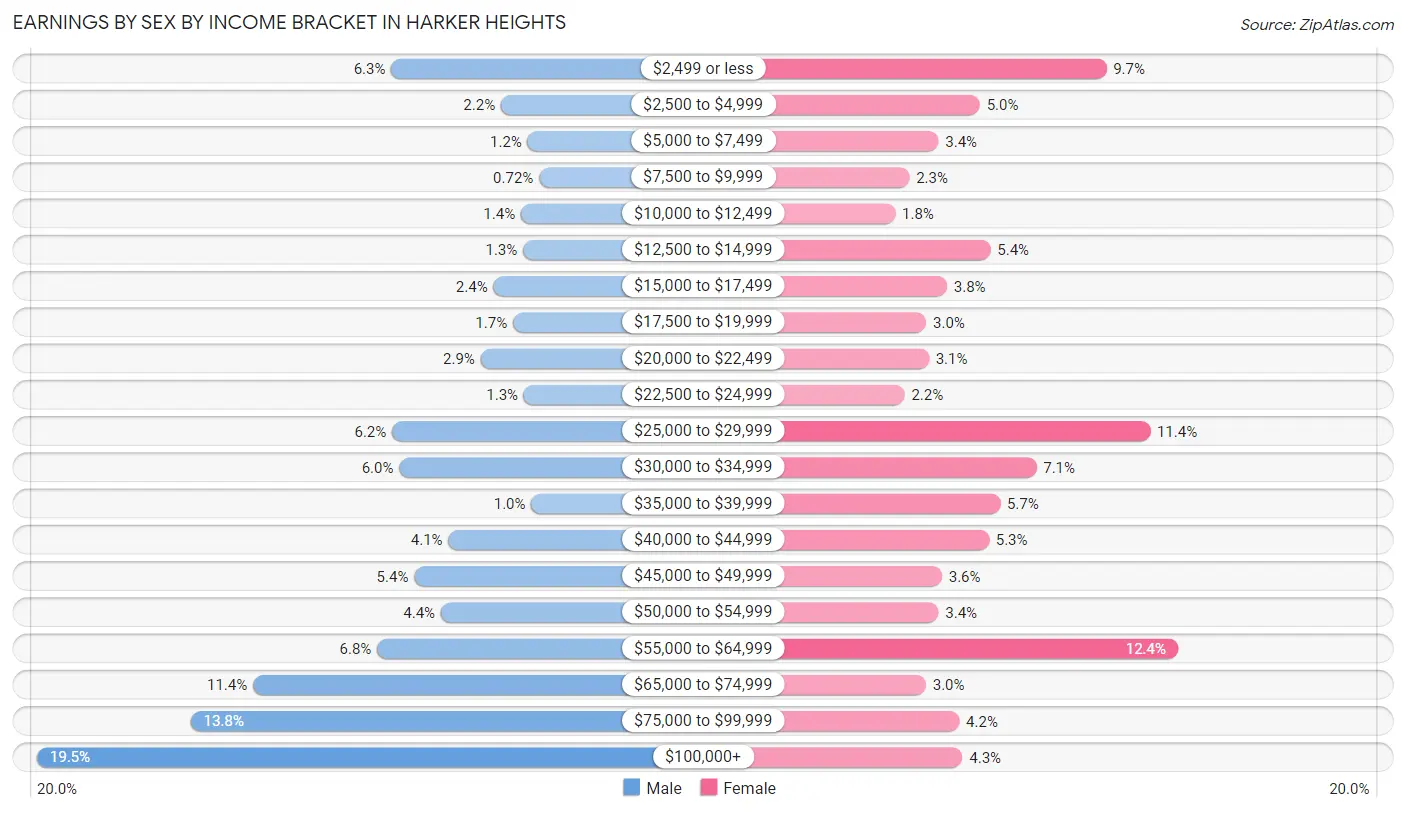
Earnings by Sex by Income Bracket in Harker Heights
The most common earnings brackets in Harker Heights are $100,000+ for men (1,664 | 19.5%) and $55,000 to $64,999 for women (1,063 | 12.4%).
| Income | Male | Female |
| $2,499 or less | 533 (6.3%) | 834 (9.7%) |
| $2,500 to $4,999 | 183 (2.1%) | 427 (5.0%) |
| $5,000 to $7,499 | 98 (1.1%) | 294 (3.4%) |
| $7,500 to $9,999 | 61 (0.7%) | 201 (2.3%) |
| $10,000 to $12,499 | 119 (1.4%) | 155 (1.8%) |
| $12,500 to $14,999 | 112 (1.3%) | 461 (5.4%) |
| $15,000 to $17,499 | 207 (2.4%) | 322 (3.7%) |
| $17,500 to $19,999 | 145 (1.7%) | 255 (3.0%) |
| $20,000 to $22,499 | 248 (2.9%) | 263 (3.1%) |
| $22,500 to $24,999 | 110 (1.3%) | 185 (2.2%) |
| $25,000 to $29,999 | 531 (6.2%) | 974 (11.4%) |
| $30,000 to $34,999 | 508 (6.0%) | 609 (7.1%) |
| $35,000 to $39,999 | 86 (1.0%) | 492 (5.7%) |
| $40,000 to $44,999 | 351 (4.1%) | 456 (5.3%) |
| $45,000 to $49,999 | 460 (5.4%) | 305 (3.6%) |
| $50,000 to $54,999 | 375 (4.4%) | 294 (3.4%) |
| $55,000 to $64,999 | 578 (6.8%) | 1,063 (12.4%) |
| $65,000 to $74,999 | 974 (11.4%) | 254 (3.0%) |
| $75,000 to $99,999 | 1,174 (13.8%) | 361 (4.2%) |
| $100,000+ | 1,664 (19.5%) | 371 (4.3%) |
| Total | 8,517 (100.0%) | 8,576 (100.0%) |
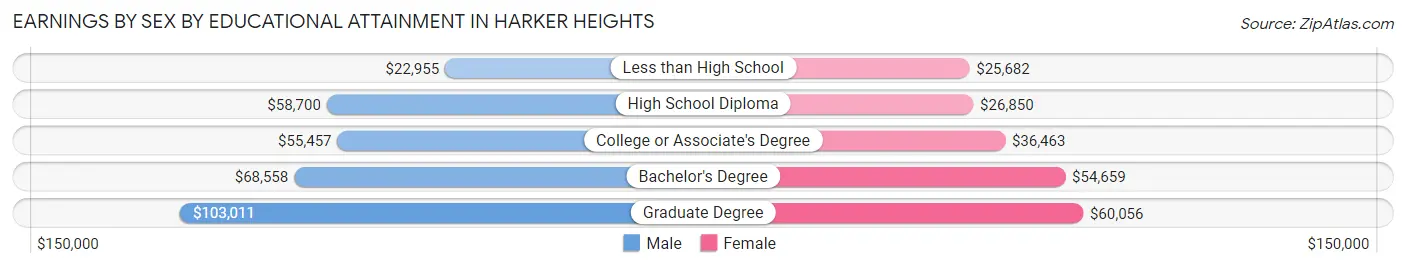
Earnings by Sex by Educational Attainment in Harker Heights
Average earnings in Harker Heights are $62,966 for men and $35,319 for women, a difference of 43.9%. Men with an educational attainment of graduate degree enjoy the highest average annual earnings of $103,011, while those with less than high school education earn the least with $22,955. Women with an educational attainment of graduate degree earn the most with the average annual earnings of $60,056, while those with less than high school education have the smallest earnings of $25,682.
| Educational Attainment | Male Income | Female Income |
| Less than High School | $22,955 | $25,682 |
| High School Diploma | $58,700 | $26,850 |
| College or Associate's Degree | $55,457 | $36,463 |
| Bachelor's Degree | $68,558 | $54,659 |
| Graduate Degree | $103,011 | $60,056 |
| Total | $62,966 | $35,319 |
Family Income in Harker Heights
Family Income Brackets in Harker Heights
According to the Harker Heights family income data, there are 1,995 families falling into the $100,000 to $149,999 income range, which is the most common income bracket and makes up 23.3% of all families. Conversely, the $10,000 to $14,999 income bracket is the least frequent group with only 120 families (1.4%) belonging to this category.
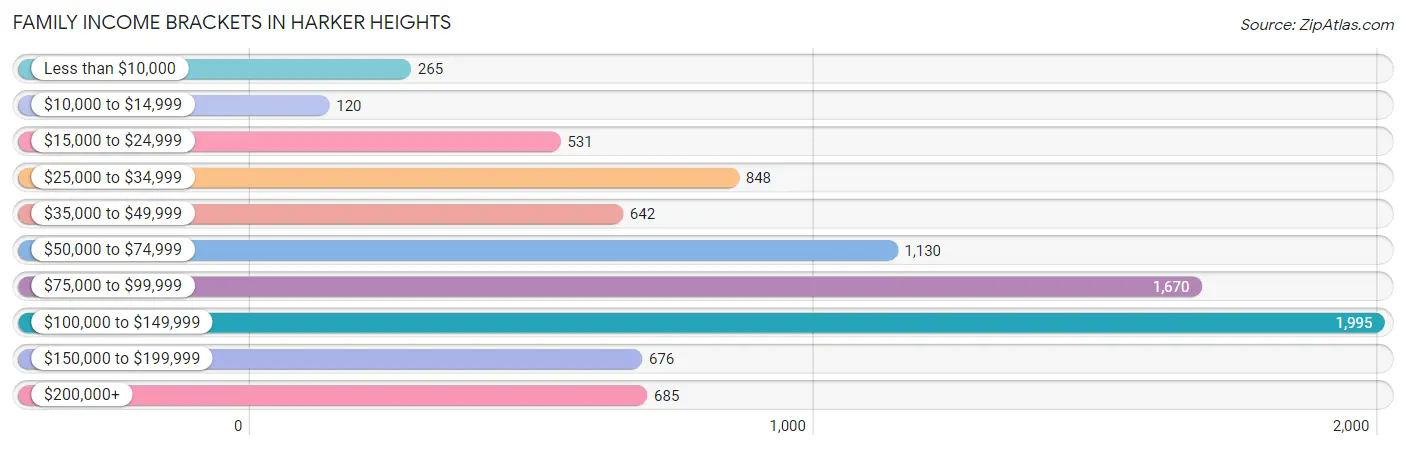
| Income Bracket | # Families | % Families |
| Less than $10,000 | 265 | 3.1% |
| $10,000 to $14,999 | 120 | 1.4% |
| $15,000 to $24,999 | 531 | 6.2% |
| $25,000 to $34,999 | 848 | 9.9% |
| $35,000 to $49,999 | 642 | 7.5% |
| $50,000 to $74,999 | 1,130 | 13.2% |
| $75,000 to $99,999 | 1,670 | 19.5% |
| $100,000 to $149,999 | 1,995 | 23.3% |
| $150,000 to $199,999 | 676 | 7.9% |
| $200,000+ | 685 | 8.0% |
Family Income by Famaliy Size in Harker Heights
4-person families (1,310 | 15.3%) account for the highest median family income in Harker Heights with $113,661 per family, while 2-person families (3,750 | 43.8%) have the highest median income of $35,532 per family member.
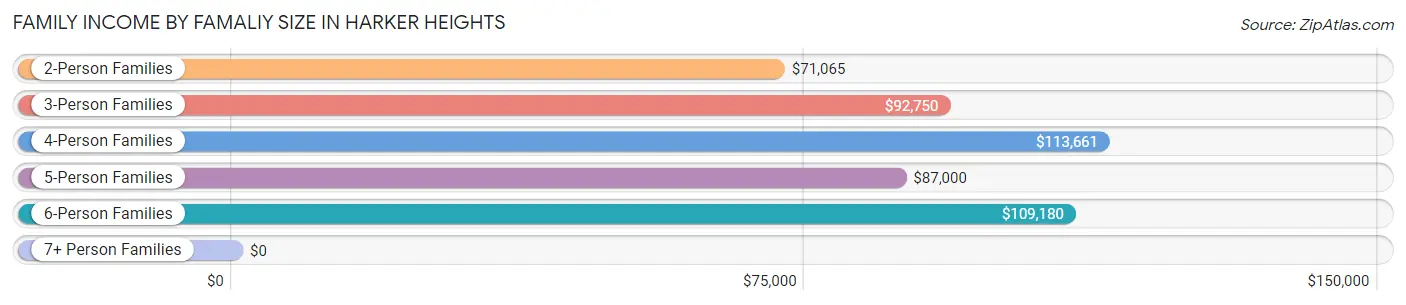
| Income Bracket | # Families | Median Income |
| 2-Person Families | 3,750 (43.8%) | $71,065 |
| 3-Person Families | 2,027 (23.7%) | $92,750 |
| 4-Person Families | 1,310 (15.3%) | $113,661 |
| 5-Person Families | 1,166 (13.6%) | $87,000 |
| 6-Person Families | 207 (2.4%) | $109,180 |
| 7+ Person Families | 103 (1.2%) | $0 |
| Total | 8,563 (100.0%) | $86,911 |
Family Income by Number of Earners in Harker Heights
The median family income in Harker Heights is $86,911, with families comprising 3+ earners (883) having the highest median family income of $137,005, while families with 1 earner (3,072) have the lowest median family income of $54,219, accounting for 10.3% and 35.9% of families, respectively.
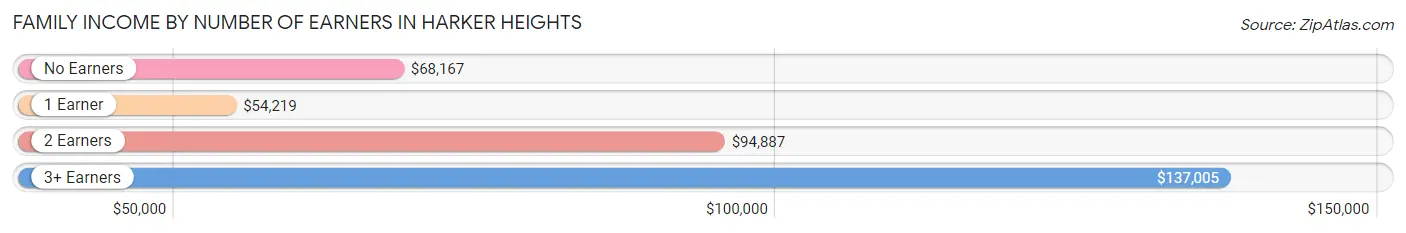
| Number of Earners | # Families | Median Income |
| No Earners | 1,072 (12.5%) | $68,167 |
| 1 Earner | 3,072 (35.9%) | $54,219 |
| 2 Earners | 3,536 (41.3%) | $94,887 |
| 3+ Earners | 883 (10.3%) | $137,005 |
| Total | 8,563 (100.0%) | $86,911 |
Household Income in Harker Heights
Household Income Brackets in Harker Heights
With 2,238 households falling in the category, the $100,000 to $149,999 income range is the most frequent in Harker Heights, accounting for 19.0% of all households. In contrast, only 306 households (2.6%) fall into the less than $10,000 income bracket, making it the least populous group.
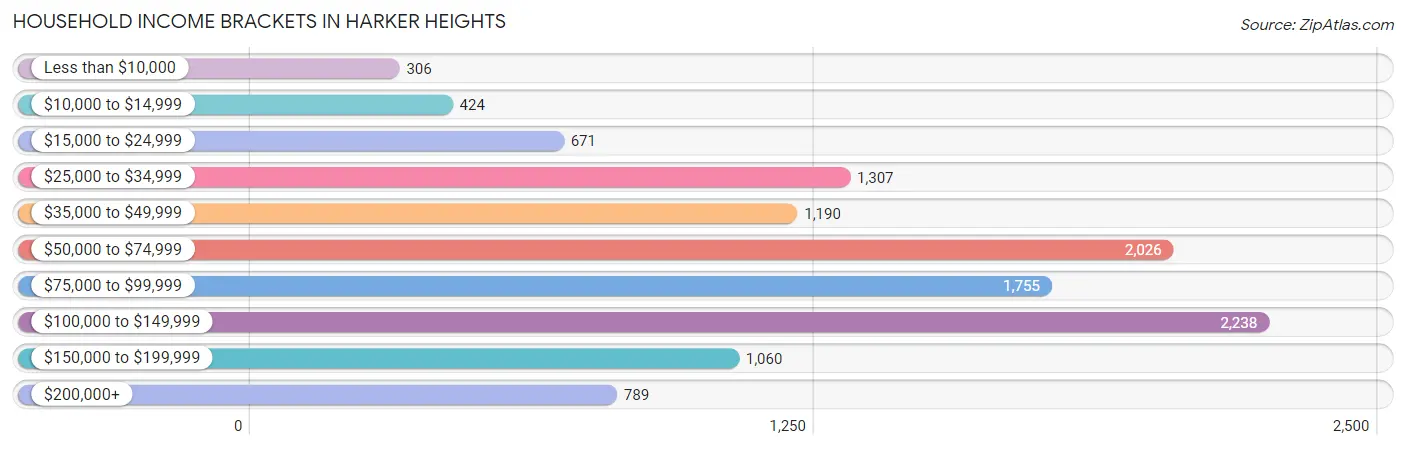
| Income Bracket | # Households | % Households |
| Less than $10,000 | 306 | 2.6% |
| $10,000 to $14,999 | 424 | 3.6% |
| $15,000 to $24,999 | 671 | 5.7% |
| $25,000 to $34,999 | 1,307 | 11.1% |
| $35,000 to $49,999 | 1,190 | 10.1% |
| $50,000 to $74,999 | 2,026 | 17.2% |
| $75,000 to $99,999 | 1,755 | 14.9% |
| $100,000 to $149,999 | 2,238 | 19.0% |
| $150,000 to $199,999 | 1,060 | 9.0% |
| $200,000+ | 789 | 6.7% |
Household Income by Householder Age in Harker Heights
The median household income in Harker Heights is $72,258, with the highest median household income of $84,798 found in the 45 to 64 years age bracket for the primary householder. A total of 4,127 households (35.0%) fall into this category. Meanwhile, the 15 to 24 years age bracket for the primary householder has the lowest median household income of $59,914, with 298 households (2.5%) in this group.
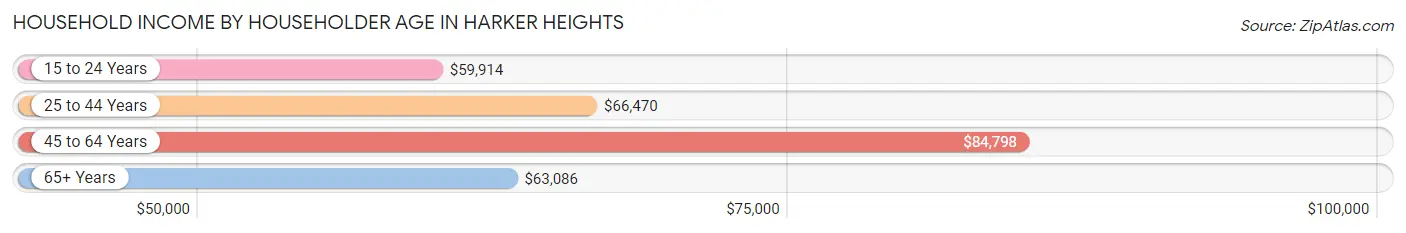
| Income Bracket | # Households | Median Income |
| 15 to 24 Years | 298 (2.5%) | $59,914 |
| 25 to 44 Years | 5,462 (46.4%) | $66,470 |
| 45 to 64 Years | 4,127 (35.0%) | $84,798 |
| 65+ Years | 1,892 (16.1%) | $63,086 |
| Total | 11,779 (100.0%) | $72,258 |
Poverty in Harker Heights
Income Below Poverty by Sex and Age in Harker Heights
With 10.9% poverty level for males and 12.8% for females among the residents of Harker Heights, 15 year old males and 12 to 14 year old females are the most vulnerable to poverty, with 79 males (35.6%) and 309 females (32.9%) in their respective age groups living below the poverty level.
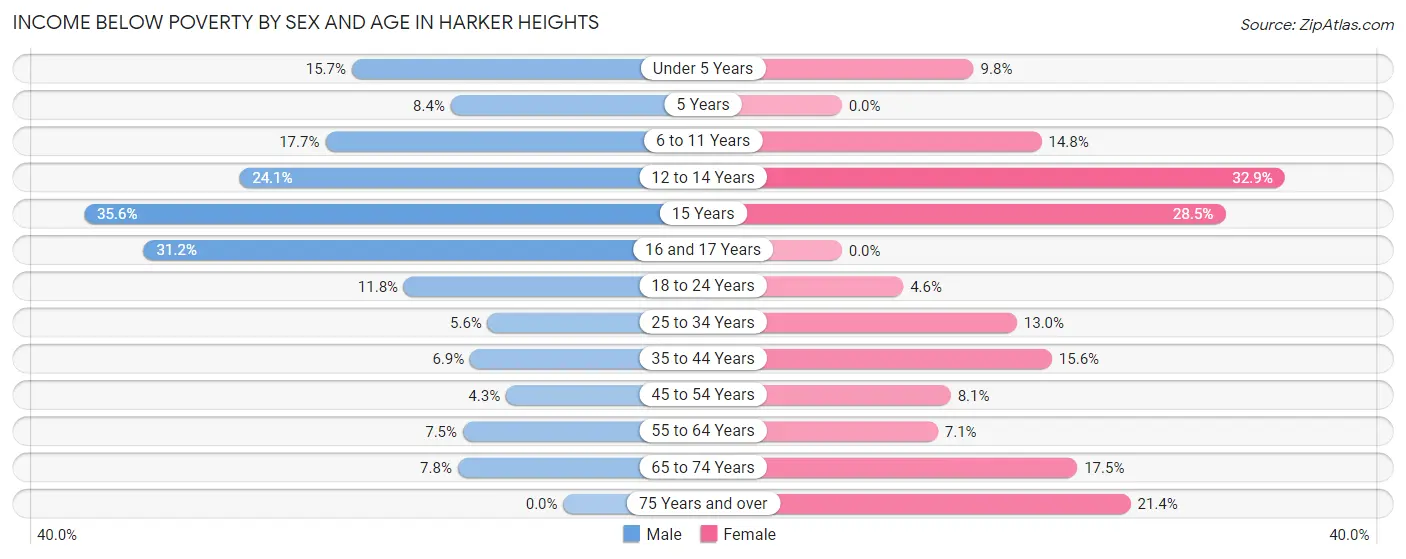
| Age Bracket | Male | Female |
| Under 5 Years | 147 (15.7%) | 95 (9.8%) |
| 5 Years | 45 (8.4%) | 0 (0.0%) |
| 6 to 11 Years | 367 (17.7%) | 187 (14.8%) |
| 12 to 14 Years | 224 (24.1%) | 309 (32.9%) |
| 15 Years | 79 (35.6%) | 107 (28.5%) |
| 16 and 17 Years | 139 (31.2%) | 0 (0.0%) |
| 18 to 24 Years | 174 (11.8%) | 58 (4.6%) |
| 25 to 34 Years | 99 (5.6%) | 303 (13.0%) |
| 35 to 44 Years | 214 (6.9%) | 423 (15.6%) |
| 45 to 54 Years | 80 (4.3%) | 178 (8.1%) |
| 55 to 64 Years | 117 (7.5%) | 115 (7.1%) |
| 65 to 74 Years | 84 (7.8%) | 214 (17.5%) |
| 75 Years and over | 0 (0.0%) | 122 (21.4%) |
| Total | 1,769 (10.9%) | 2,111 (12.8%) |
Income Above Poverty by Sex and Age in Harker Heights
According to the poverty statistics in Harker Heights, males aged 75 years and over and females aged 5 years are the age groups that are most secure financially, with 100.0% of males and 100.0% of females in these age groups living above the poverty line.
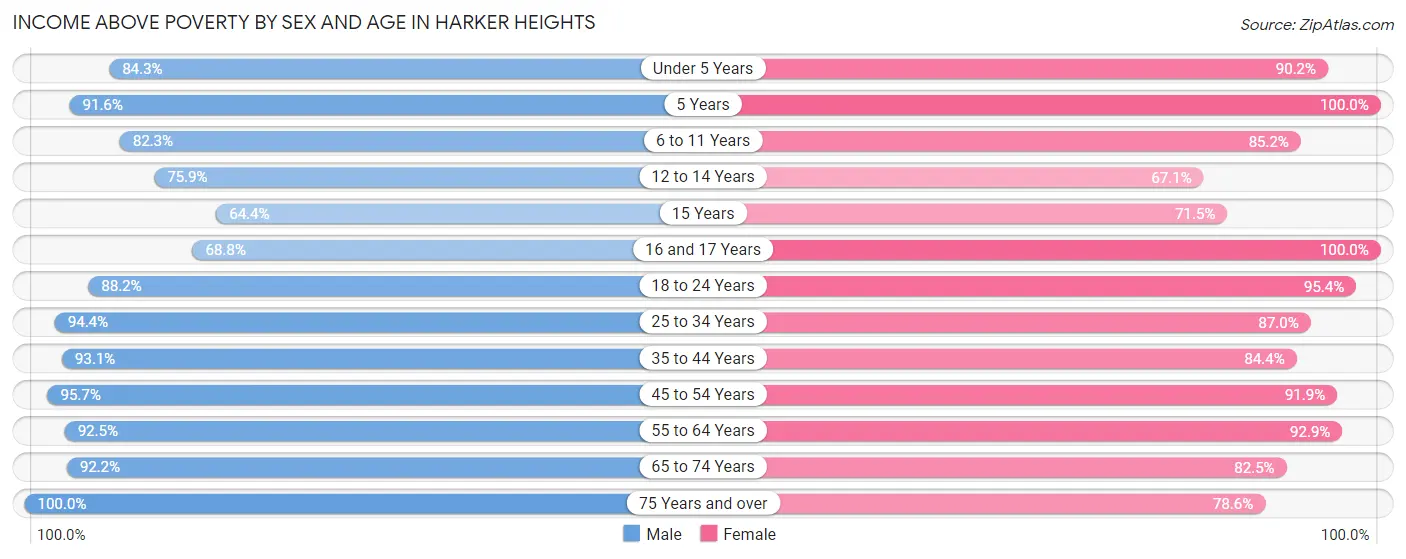
| Age Bracket | Male | Female |
| Under 5 Years | 789 (84.3%) | 875 (90.2%) |
| 5 Years | 493 (91.6%) | 107 (100.0%) |
| 6 to 11 Years | 1,709 (82.3%) | 1,074 (85.2%) |
| 12 to 14 Years | 707 (75.9%) | 631 (67.1%) |
| 15 Years | 143 (64.4%) | 269 (71.5%) |
| 16 and 17 Years | 307 (68.8%) | 864 (100.0%) |
| 18 to 24 Years | 1,295 (88.2%) | 1,215 (95.4%) |
| 25 to 34 Years | 1,662 (94.4%) | 2,027 (87.0%) |
| 35 to 44 Years | 2,876 (93.1%) | 2,289 (84.4%) |
| 45 to 54 Years | 1,800 (95.7%) | 2,023 (91.9%) |
| 55 to 64 Years | 1,452 (92.5%) | 1,499 (92.9%) |
| 65 to 74 Years | 987 (92.2%) | 1,010 (82.5%) |
| 75 Years and over | 253 (100.0%) | 447 (78.6%) |
| Total | 14,473 (89.1%) | 14,330 (87.2%) |
Income Below Poverty Among Married-Couple Families in Harker Heights
The poverty statistics for married-couple families in Harker Heights show that 5.6% or 306 of the total 5,464 families live below the poverty line. Families with 3 or 4 children have the highest poverty rate of 13.4%, comprising of 83 families. On the other hand, families with 5 or more children have the lowest poverty rate of 0.0%, which includes 0 families.
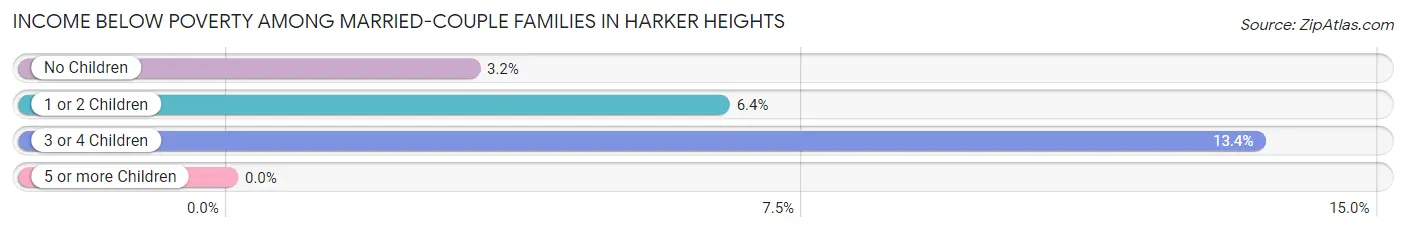
| Children | Above Poverty | Below Poverty |
| No Children | 2,574 (96.8%) | 84 (3.2%) |
| 1 or 2 Children | 2,026 (93.6%) | 139 (6.4%) |
| 3 or 4 Children | 536 (86.6%) | 83 (13.4%) |
| 5 or more Children | 22 (100.0%) | 0 (0.0%) |
| Total | 5,158 (94.4%) | 306 (5.6%) |
Income Below Poverty Among Single-Parent Households in Harker Heights
According to the poverty data in Harker Heights, 11.2% or 77 single-father households and 23.3% or 563 single-mother households are living below the poverty line. Among single-father households, those with 1 or 2 children have the highest poverty rate, with 77 households (21.7%) experiencing poverty. Likewise, among single-mother households, those with 3 or 4 children have the highest poverty rate, with 119 households (62.0%) falling below the poverty line.
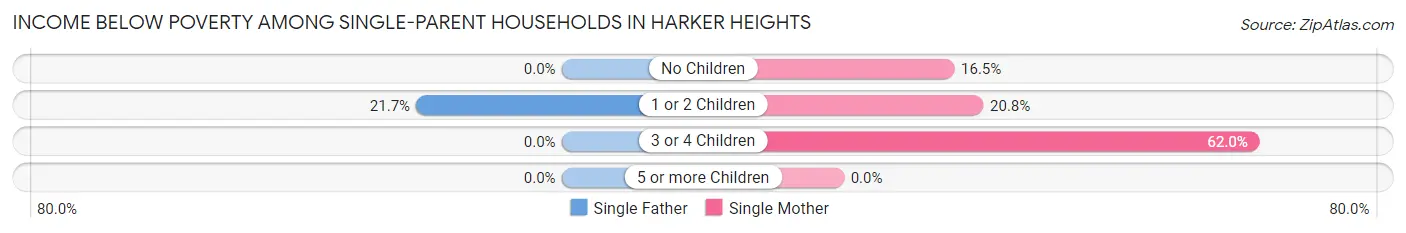
| Children | Single Father | Single Mother |
| No Children | 0 (0.0%) | 67 (16.5%) |
| 1 or 2 Children | 77 (21.7%) | 377 (20.8%) |
| 3 or 4 Children | 0 (0.0%) | 119 (62.0%) |
| 5 or more Children | 0 (0.0%) | 0 (0.0%) |
| Total | 77 (11.2%) | 563 (23.3%) |
Income Below Poverty Among Married-Couple vs Single-Parent Households in Harker Heights
The poverty data for Harker Heights shows that 306 of the married-couple family households (5.6%) and 640 of the single-parent households (20.6%) are living below the poverty level. Within the married-couple family households, those with 3 or 4 children have the highest poverty rate, with 83 households (13.4%) falling below the poverty line. Among the single-parent households, those with 3 or 4 children have the highest poverty rate, with 119 household (39.9%) living below poverty.
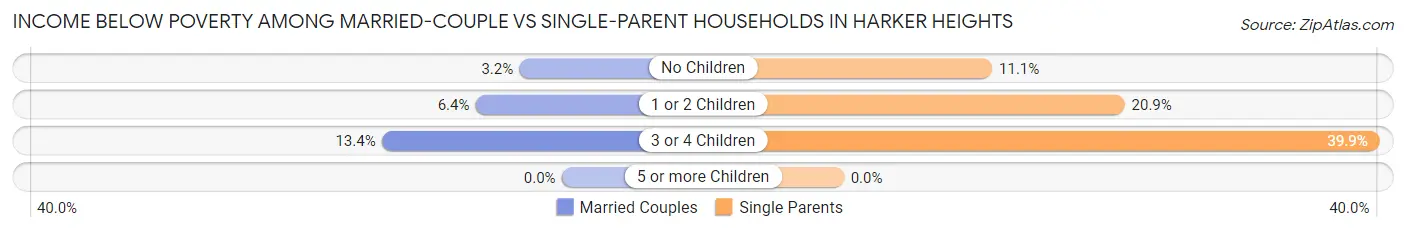
| Children | Married-Couple Families | Single-Parent Households |
| No Children | 84 (3.2%) | 67 (11.1%) |
| 1 or 2 Children | 139 (6.4%) | 454 (20.9%) |
| 3 or 4 Children | 83 (13.4%) | 119 (39.9%) |
| 5 or more Children | 0 (0.0%) | 0 (0.0%) |
| Total | 306 (5.6%) | 640 (20.6%) |
Race in Harker Heights
The most populous races in Harker Heights are White / Caucasian (16,429 | 49.7%), Black / African American (9,702 | 29.4%), and Hispanic or Latino (7,155 | 21.7%).
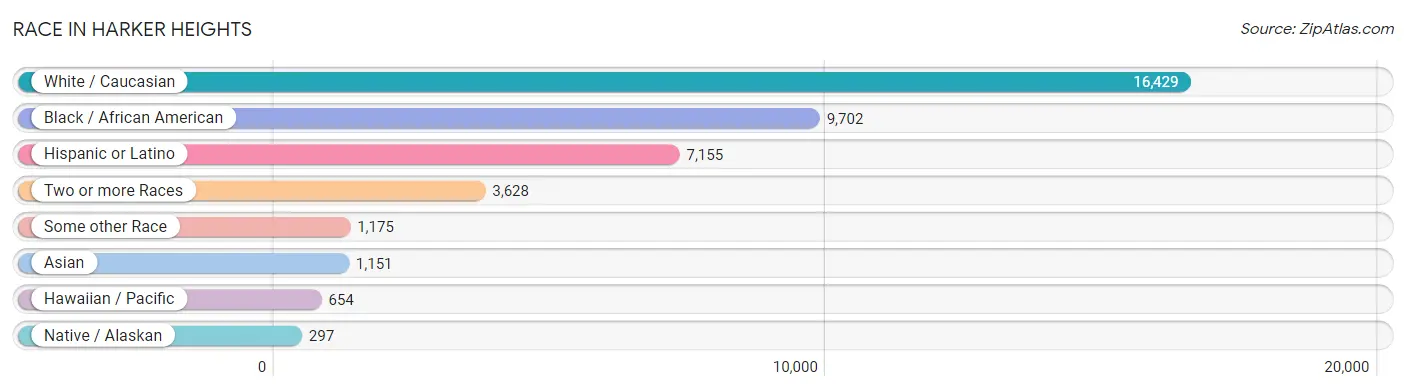
| Race | # Population | % Population |
| Asian | 1,151 | 3.5% |
| Black / African American | 9,702 | 29.4% |
| Hawaiian / Pacific | 654 | 2.0% |
| Hispanic or Latino | 7,155 | 21.7% |
| Native / Alaskan | 297 | 0.9% |
| White / Caucasian | 16,429 | 49.7% |
| Two or more Races | 3,628 | 11.0% |
| Some other Race | 1,175 | 3.6% |
| Total | 33,036 | 100.0% |
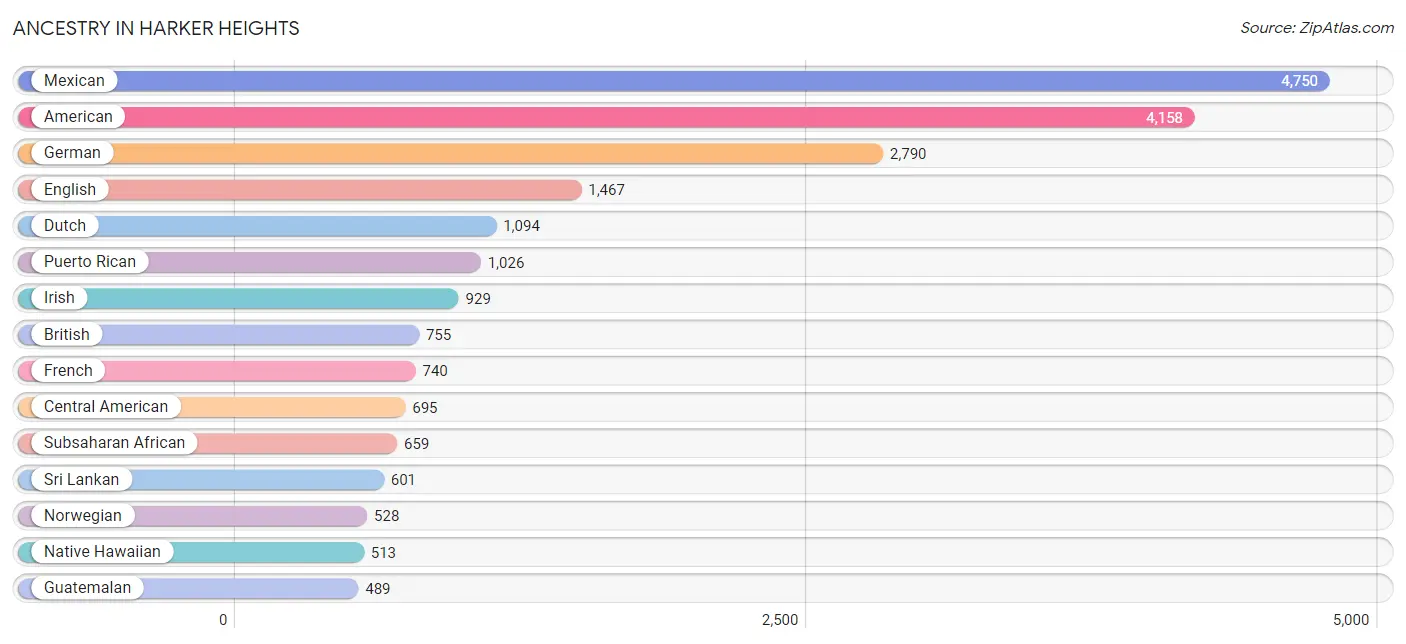
Ancestry in Harker Heights
The most populous ancestries reported in Harker Heights are Mexican (4,750 | 14.4%), American (4,158 | 12.6%), German (2,790 | 8.5%), English (1,467 | 4.4%), and Dutch (1,094 | 3.3%), together accounting for 43.2% of all Harker Heights residents.
| Ancestry | # Population | % Population |
| African | 120 | 0.4% |
| Albanian | 24 | 0.1% |
| Aleut | 33 | 0.1% |
| American | 4,158 | 12.6% |
| Arab | 221 | 0.7% |
| Austrian | 42 | 0.1% |
| Barbadian | 12 | 0.0% |
| Bhutanese | 218 | 0.7% |
| Blackfeet | 79 | 0.2% |
| British | 755 | 2.3% |
| Burmese | 397 | 1.2% |
| Cajun | 8 | 0.0% |
| Canadian | 28 | 0.1% |
| Central American | 695 | 2.1% |
| Cherokee | 62 | 0.2% |
| Chippewa | 99 | 0.3% |
| Choctaw | 17 | 0.1% |
| Colombian | 54 | 0.2% |
| Croatian | 20 | 0.1% |
| Crow | 55 | 0.2% |
| Cuban | 97 | 0.3% |
| Czech | 7 | 0.0% |
| Danish | 27 | 0.1% |
| Dutch | 1,094 | 3.3% |
| Dutch West Indian | 12 | 0.0% |
| Eastern European | 15 | 0.1% |
| Ecuadorian | 6 | 0.0% |
| Egyptian | 89 | 0.3% |
| English | 1,467 | 4.4% |
| European | 427 | 1.3% |
| Filipino | 143 | 0.4% |
| French | 740 | 2.2% |
| French Canadian | 60 | 0.2% |
| German | 2,790 | 8.5% |
| Greek | 284 | 0.9% |
| Guatemalan | 489 | 1.5% |
| Guyanese | 25 | 0.1% |
| Haitian | 22 | 0.1% |
| Honduran | 28 | 0.1% |
| Houma | 8 | 0.0% |
| Hungarian | 145 | 0.4% |
| Indian (Asian) | 342 | 1.0% |
| Irish | 929 | 2.8% |
| Italian | 408 | 1.2% |
| Jamaican | 328 | 1.0% |
| Korean | 443 | 1.3% |
| Latvian | 12 | 0.0% |
| Lebanese | 14 | 0.0% |
| Liberian | 28 | 0.1% |
| Lithuanian | 8 | 0.0% |
| Mexican | 4,750 | 14.4% |
| Mexican American Indian | 397 | 1.2% |
| Native Hawaiian | 513 | 1.5% |
| Nigerian | 294 | 0.9% |
| Northern European | 37 | 0.1% |
| Norwegian | 528 | 1.6% |
| Pakistani | 184 | 0.6% |
| Panamanian | 178 | 0.5% |
| Peruvian | 196 | 0.6% |
| Polish | 415 | 1.3% |
| Portuguese | 243 | 0.7% |
| Puerto Rican | 1,026 | 3.1% |
| Russian | 40 | 0.1% |
| Samoan | 27 | 0.1% |
| Scandinavian | 77 | 0.2% |
| Scotch-Irish | 204 | 0.6% |
| Scottish | 304 | 0.9% |
| Sioux | 55 | 0.2% |
| Slovak | 17 | 0.1% |
| South American | 256 | 0.8% |
| Spaniard | 257 | 0.8% |
| Spanish | 35 | 0.1% |
| Sri Lankan | 601 | 1.8% |
| Subsaharan African | 659 | 2.0% |
| Swedish | 91 | 0.3% |
| Swiss | 60 | 0.2% |
| Syrian | 92 | 0.3% |
| Thai | 82 | 0.3% |
| Tlingit-Haida | 11 | 0.0% |
| Ukrainian | 57 | 0.2% |
| Welsh | 67 | 0.2% |
| West Indian | 109 | 0.3% | View All 82 Rows |
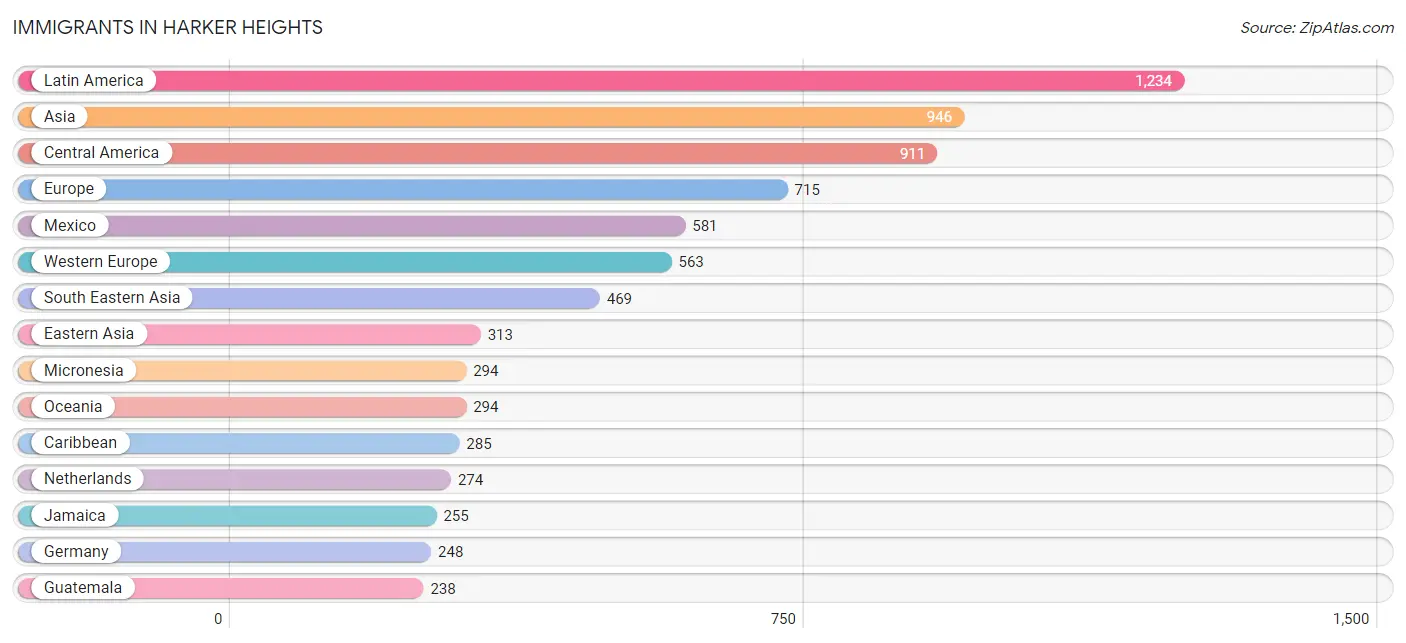
Immigrants in Harker Heights
The most numerous immigrant groups reported in Harker Heights came from Latin America (1,234 | 3.7%), Asia (946 | 2.9%), Central America (911 | 2.8%), Europe (715 | 2.2%), and Mexico (581 | 1.8%), together accounting for 13.3% of all Harker Heights residents.
| Immigration Origin | # Population | % Population |
| Africa | 168 | 0.5% |
| Albania | 24 | 0.1% |
| Asia | 946 | 2.9% |
| Belgium | 18 | 0.1% |
| Belize | 22 | 0.1% |
| Canada | 7 | 0.0% |
| Caribbean | 285 | 0.9% |
| Central America | 911 | 2.8% |
| China | 114 | 0.4% |
| Colombia | 7 | 0.0% |
| Cuba | 30 | 0.1% |
| Denmark | 27 | 0.1% |
| Eastern Africa | 21 | 0.1% |
| Eastern Asia | 313 | 0.9% |
| Eastern Europe | 97 | 0.3% |
| Ecuador | 6 | 0.0% |
| El Salvador | 15 | 0.1% |
| England | 6 | 0.0% |
| Europe | 715 | 2.2% |
| France | 23 | 0.1% |
| Germany | 248 | 0.7% |
| Greece | 8 | 0.0% |
| Guatemala | 238 | 0.7% |
| Guyana | 25 | 0.1% |
| India | 56 | 0.2% |
| Iraq | 11 | 0.0% |
| Italy | 14 | 0.0% |
| Jamaica | 255 | 0.8% |
| Japan | 22 | 0.1% |
| Kenya | 21 | 0.1% |
| Korea | 177 | 0.5% |
| Latin America | 1,234 | 3.7% |
| Mexico | 581 | 1.8% |
| Micronesia | 294 | 0.9% |
| Nepal | 33 | 0.1% |
| Netherlands | 274 | 0.8% |
| Nigeria | 142 | 0.4% |
| Northern Europe | 33 | 0.1% |
| Oceania | 294 | 0.9% |
| Panama | 55 | 0.2% |
| Philippines | 125 | 0.4% |
| Poland | 18 | 0.1% |
| Russia | 32 | 0.1% |
| South America | 38 | 0.1% |
| South Central Asia | 89 | 0.3% |
| South Eastern Asia | 469 | 1.4% |
| Southern Europe | 22 | 0.1% |
| Syria | 64 | 0.2% |
| Taiwan | 85 | 0.3% |
| Thailand | 127 | 0.4% |
| Ukraine | 23 | 0.1% |
| Vietnam | 217 | 0.7% |
| Western Africa | 142 | 0.4% |
| Western Asia | 75 | 0.2% |
| Western Europe | 563 | 1.7% | View All 55 Rows |
Sex and Age in Harker Heights
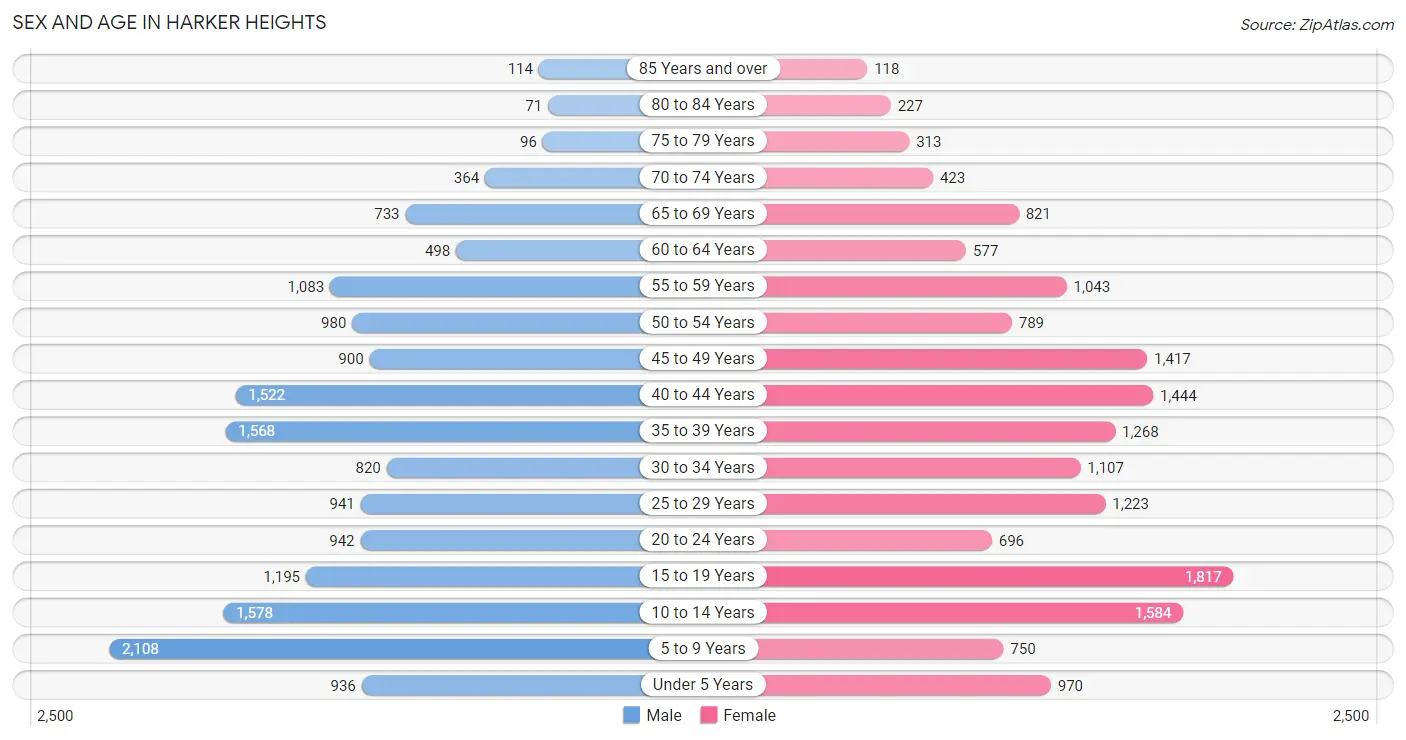
Sex and Age in Harker Heights
The most populous age groups in Harker Heights are 5 to 9 Years (2,108 | 12.8%) for men and 15 to 19 Years (1,817 | 11.0%) for women.
| Age Bracket | Male | Female |
| Under 5 Years | 936 (5.7%) | 970 (5.9%) |
| 5 to 9 Years | 2,108 (12.8%) | 750 (4.5%) |
| 10 to 14 Years | 1,578 (9.6%) | 1,584 (9.6%) |
| 15 to 19 Years | 1,195 (7.3%) | 1,817 (11.0%) |
| 20 to 24 Years | 942 (5.7%) | 696 (4.2%) |
| 25 to 29 Years | 941 (5.7%) | 1,223 (7.4%) |
| 30 to 34 Years | 820 (5.0%) | 1,107 (6.7%) |
| 35 to 39 Years | 1,568 (9.5%) | 1,268 (7.6%) |
| 40 to 44 Years | 1,522 (9.2%) | 1,444 (8.7%) |
| 45 to 49 Years | 900 (5.5%) | 1,417 (8.5%) |
| 50 to 54 Years | 980 (6.0%) | 789 (4.8%) |
| 55 to 59 Years | 1,083 (6.6%) | 1,043 (6.3%) |
| 60 to 64 Years | 498 (3.0%) | 577 (3.5%) |
| 65 to 69 Years | 733 (4.5%) | 821 (5.0%) |
| 70 to 74 Years | 364 (2.2%) | 423 (2.5%) |
| 75 to 79 Years | 96 (0.6%) | 313 (1.9%) |
| 80 to 84 Years | 71 (0.4%) | 227 (1.4%) |
| 85 Years and over | 114 (0.7%) | 118 (0.7%) |
| Total | 16,449 (100.0%) | 16,587 (100.0%) |
Families and Households in Harker Heights
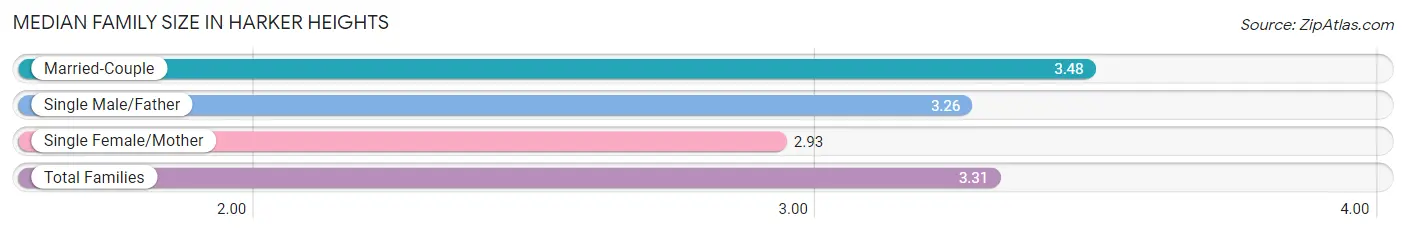
Median Family Size in Harker Heights
The median family size in Harker Heights is 3.31 persons per family, with married-couple families (5,464 | 63.8%) accounting for the largest median family size of 3.48 persons per family. On the other hand, single female/mother families (2,413 | 28.2%) represent the smallest median family size with 2.93 persons per family.
| Family Type | # Families | Family Size |
| Married-Couple | 5,464 (63.8%) | 3.48 |
| Single Male/Father | 686 (8.0%) | 3.26 |
| Single Female/Mother | 2,413 (28.2%) | 2.93 |
| Total Families | 8,563 (100.0%) | 3.31 |
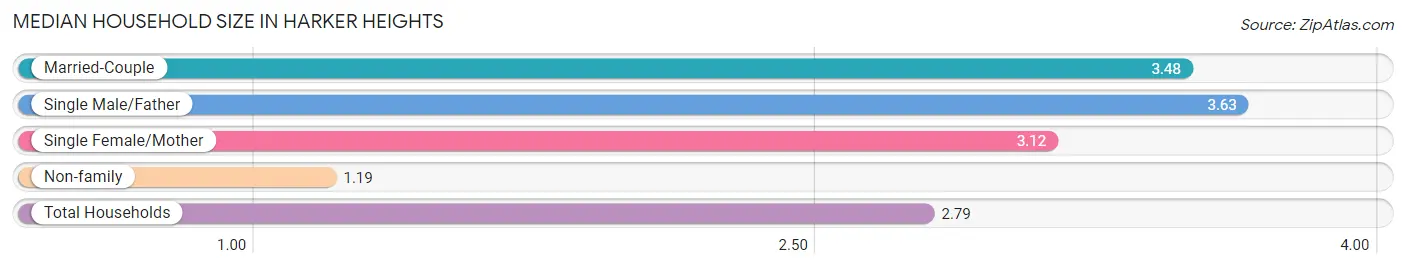
Median Household Size in Harker Heights
The median household size in Harker Heights is 2.79 persons per household, with single male/father households (686 | 5.8%) accounting for the largest median household size of 3.63 persons per household. non-family households (3,216 | 27.3%) represent the smallest median household size with 1.19 persons per household.
| Household Type | # Households | Household Size |
| Married-Couple | 5,464 (46.4%) | 3.48 |
| Single Male/Father | 686 (5.8%) | 3.63 |
| Single Female/Mother | 2,413 (20.5%) | 3.12 |
| Non-family | 3,216 (27.3%) | 1.19 |
| Total Households | 11,779 (100.0%) | 2.79 |
Household Size by Marriage Status in Harker Heights
Out of a total of 11,779 households in Harker Heights, 8,563 (72.7%) are family households, while 3,216 (27.3%) are nonfamily households. The most numerous type of family households are 2-person households, comprising 3,593, and the most common type of nonfamily households are 1-person households, comprising 2,838.
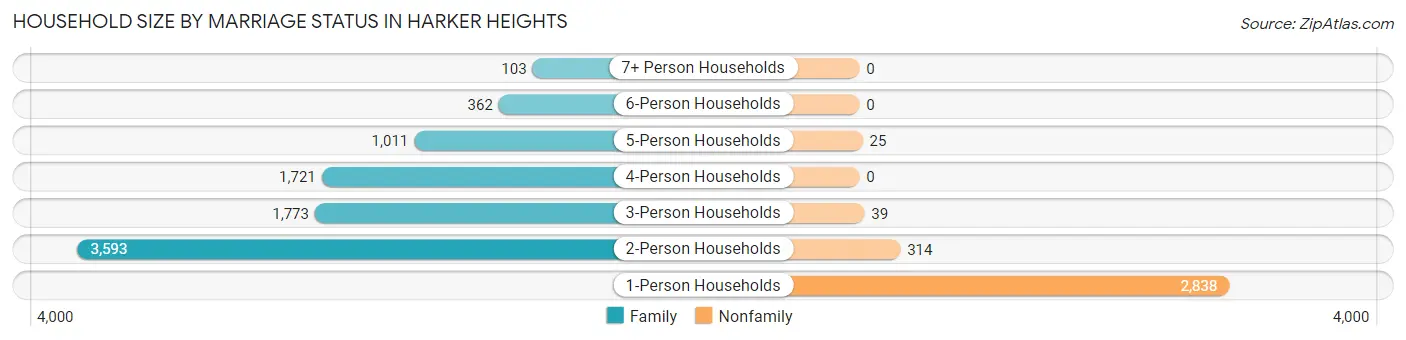
| Household Size | Family Households | Nonfamily Households |
| 1-Person Households | - | 2,838 (24.1%) |
| 2-Person Households | 3,593 (30.5%) | 314 (2.7%) |
| 3-Person Households | 1,773 (15.0%) | 39 (0.3%) |
| 4-Person Households | 1,721 (14.6%) | 0 (0.0%) |
| 5-Person Households | 1,011 (8.6%) | 25 (0.2%) |
| 6-Person Households | 362 (3.1%) | 0 (0.0%) |
| 7+ Person Households | 103 (0.9%) | 0 (0.0%) |
| Total | 8,563 (72.7%) | 3,216 (27.3%) |
Female Fertility in Harker Heights
Fertility by Age in Harker Heights
Average fertility rate in Harker Heights is 43.0 births per 1,000 women. Women in the age bracket of 20 to 34 years have the highest fertility rate with 73.0 births per 1,000 women. Women in the age bracket of 20 to 34 years acount for 57.1% of all women with births.
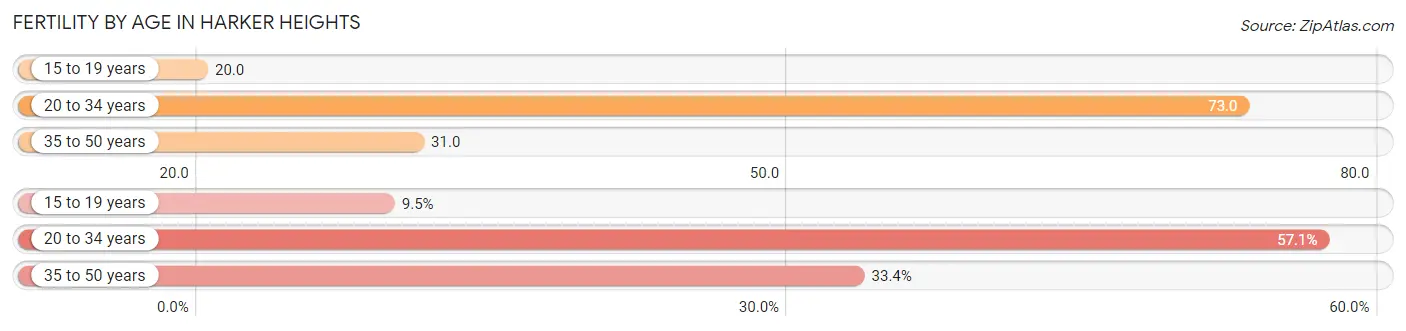
| Age Bracket | Women with Births | Births / 1,000 Women |
| 15 to 19 years | 37 (9.5%) | 20.0 |
| 20 to 34 years | 222 (57.1%) | 73.0 |
| 35 to 50 years | 130 (33.4%) | 31.0 |
| Total | 389 (100.0%) | 43.0 |
Fertility by Age by Marriage Status in Harker Heights
90.5% of women with births (389) in Harker Heights are married. The highest percentage of unmarried women with births falls into 15 to 19 years age bracket with 100.0% of them unmarried at the time of birth, while the lowest percentage of unmarried women with births belong to 20 to 34 years age bracket with 0.0% of them unmarried.
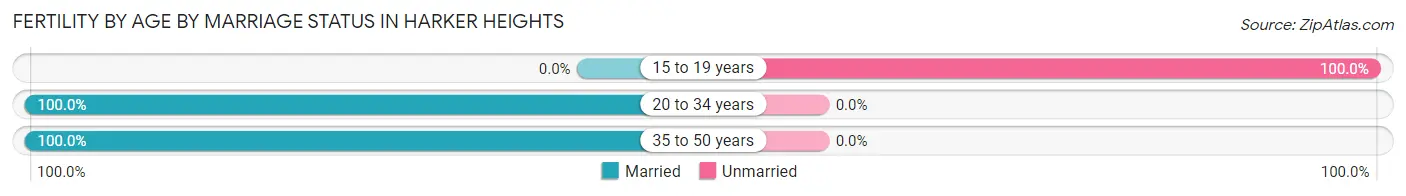
| Age Bracket | Married | Unmarried |
| 15 to 19 years | 0 (0.0%) | 37 (100.0%) |
| 20 to 34 years | 222 (100.0%) | 0 (0.0%) |
| 35 to 50 years | 130 (100.0%) | 0 (0.0%) |
| Total | 352 (90.5%) | 37 (9.5%) |
Fertility by Education in Harker Heights
Average fertility rate in Harker Heights is 43.0 births per 1,000 women. Women with the education attainment of graduate degree have the highest fertility rate of 106.0 births per 1,000 women, while women with the education attainment of less than high school have the lowest fertility at 18.0 births per 1,000 women. Women with the education attainment of college or associate's degree represent 37.0% of all women with births.
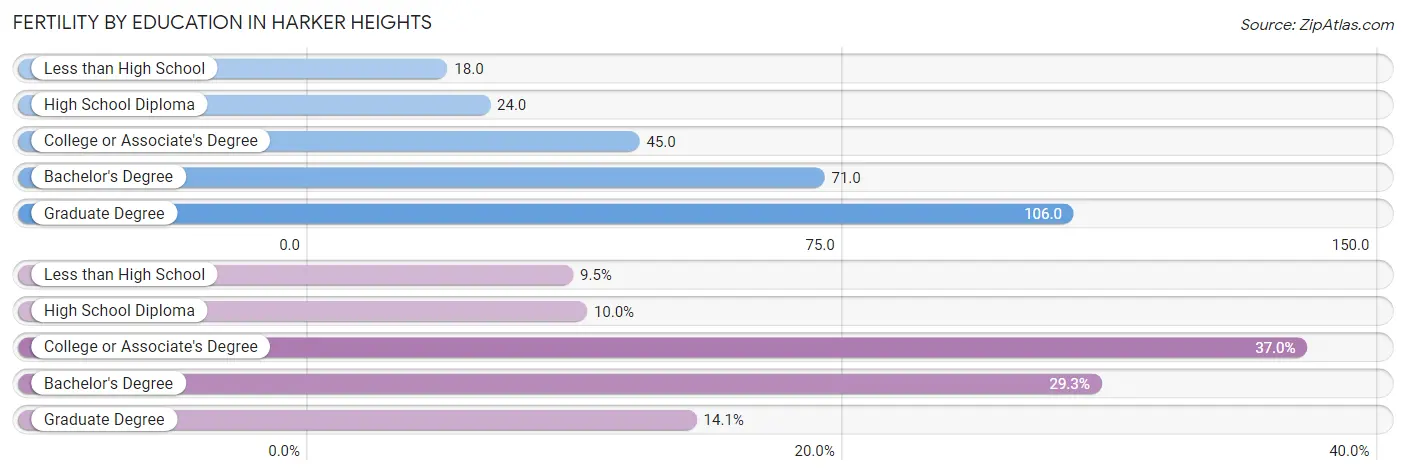
| Educational Attainment | Women with Births | Births / 1,000 Women |
| Less than High School | 37 (9.5%) | 18.0 |
| High School Diploma | 39 (10.0%) | 24.0 |
| College or Associate's Degree | 144 (37.0%) | 45.0 |
| Bachelor's Degree | 114 (29.3%) | 71.0 |
| Graduate Degree | 55 (14.1%) | 106.0 |
| Total | 389 (100.0%) | 43.0 |
Fertility by Education by Marriage Status in Harker Heights
9.5% of women with births in Harker Heights are unmarried. Women with the educational attainment of high school diploma are most likely to be married with 100.0% of them married at childbirth, while women with the educational attainment of less than high school are least likely to be married with 100.0% of them unmarried at childbirth.
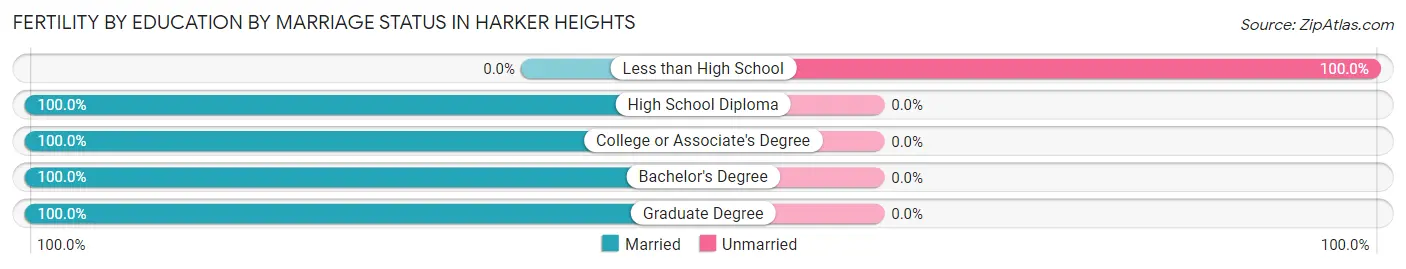
| Educational Attainment | Married | Unmarried |
| Less than High School | 0 (0.0%) | 37 (100.0%) |
| High School Diploma | 39 (100.0%) | 0 (0.0%) |
| College or Associate's Degree | 144 (100.0%) | 0 (0.0%) |
| Bachelor's Degree | 114 (100.0%) | 0 (0.0%) |
| Graduate Degree | 55 (100.0%) | 0 (0.0%) |
| Total | 352 (90.5%) | 37 (9.5%) |
Employment Characteristics in Harker Heights
Employment by Class of Employer in Harker Heights
Among the 15,810 employed individuals in Harker Heights, private company employees (8,904 | 56.3%), federal government employees (3,446 | 21.8%), and local government employees (993 | 6.3%) make up the most common classes of employment.
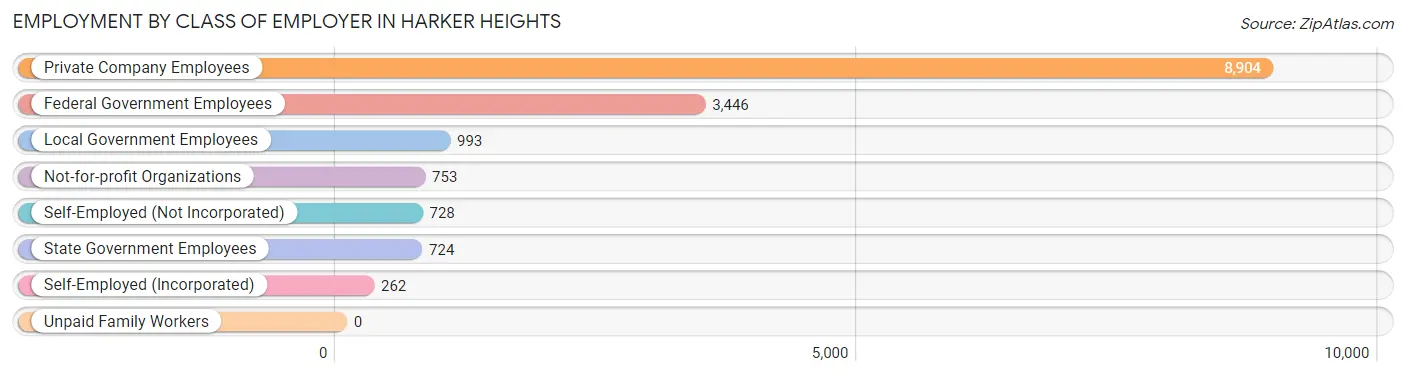
| Employer Class | # Employees | % Employees |
| Private Company Employees | 8,904 | 56.3% |
| Self-Employed (Incorporated) | 262 | 1.7% |
| Self-Employed (Not Incorporated) | 728 | 4.6% |
| Not-for-profit Organizations | 753 | 4.8% |
| Local Government Employees | 993 | 6.3% |
| State Government Employees | 724 | 4.6% |
| Federal Government Employees | 3,446 | 21.8% |
| Unpaid Family Workers | 0 | 0.0% |
| Total | 15,810 | 100.0% |
Employment Status by Age in Harker Heights
According to the labor force statistics for Harker Heights, out of the total population over 16 years of age (24,512), 67.8% or 16,619 individuals are in the labor force, with 4.7% or 781 of them unemployed. The age group with the highest labor force participation rate is 20 to 24 years, with 86.1% or 1,410 individuals in the labor force. Within the labor force, the 16 to 19 years age range has the highest percentage of unemployed individuals, with 21.8% or 244 of them being unemployed.
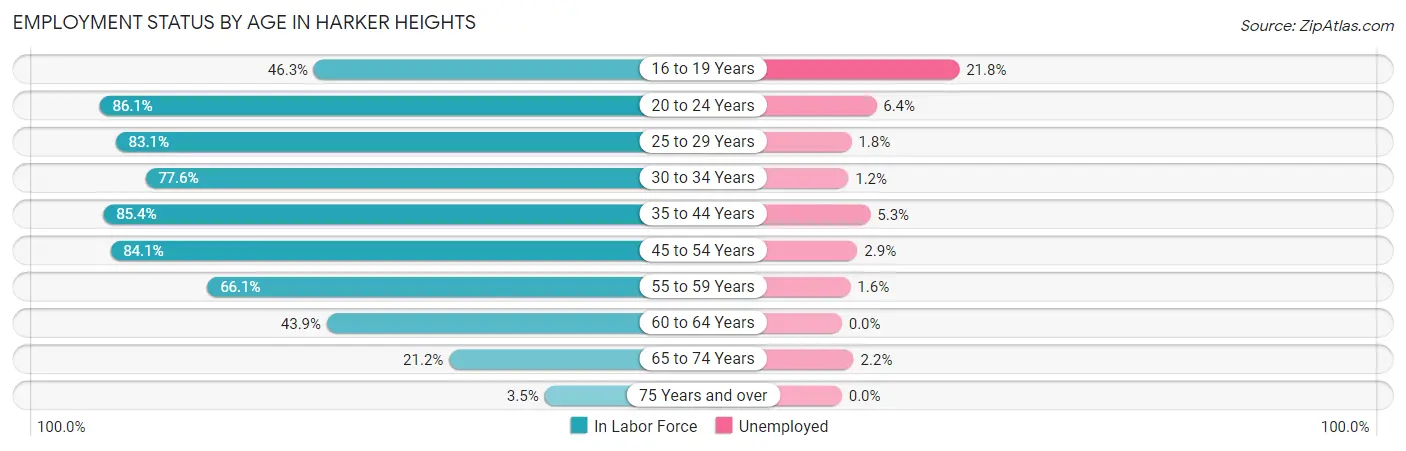
| Age Bracket | In Labor Force | Unemployed |
| 16 to 19 Years | 1,118 (46.3%) | 244 (21.8%) |
| 20 to 24 Years | 1,410 (86.1%) | 90 (6.4%) |
| 25 to 29 Years | 1,798 (83.1%) | 32 (1.8%) |
| 30 to 34 Years | 1,495 (77.6%) | 18 (1.2%) |
| 35 to 44 Years | 4,955 (85.4%) | 263 (5.3%) |
| 45 to 54 Years | 3,436 (84.1%) | 100 (2.9%) |
| 55 to 59 Years | 1,405 (66.1%) | 22 (1.6%) |
| 60 to 64 Years | 472 (43.9%) | 0 (0.0%) |
| 65 to 74 Years | 496 (21.2%) | 11 (2.2%) |
| 75 Years and over | 33 (3.5%) | 0 (0.0%) |
| Total | 16,619 (67.8%) | 781 (4.7%) |
Employment Status by Educational Attainment in Harker Heights
According to labor force statistics for Harker Heights, 78.9% of individuals (13,555) out of the total population between 25 and 64 years of age (17,180) are in the labor force, with 3.1% or 420 of them being unemployed. The group with the highest labor force participation rate are those with the educational attainment of bachelor's degree or higher, with 82.0% or 4,438 individuals in the labor force. Within the labor force, individuals with less than high school education have the highest percentage of unemployment, with 6.8% or 72 of them being unemployed.
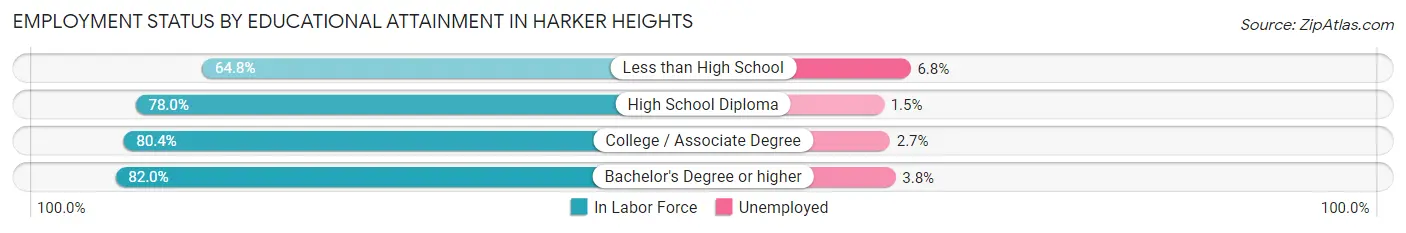
| Educational Attainment | In Labor Force | Unemployed |
| Less than High School | 1,054 (64.8%) | 111 (6.8%) |
| High School Diploma | 2,828 (78.0%) | 54 (1.5%) |
| College / Associate Degree | 5,239 (80.4%) | 176 (2.7%) |
| Bachelor's Degree or higher | 4,438 (82.0%) | 206 (3.8%) |
| Total | 13,555 (78.9%) | 533 (3.1%) |
Employment Occupations by Sex in Harker Heights
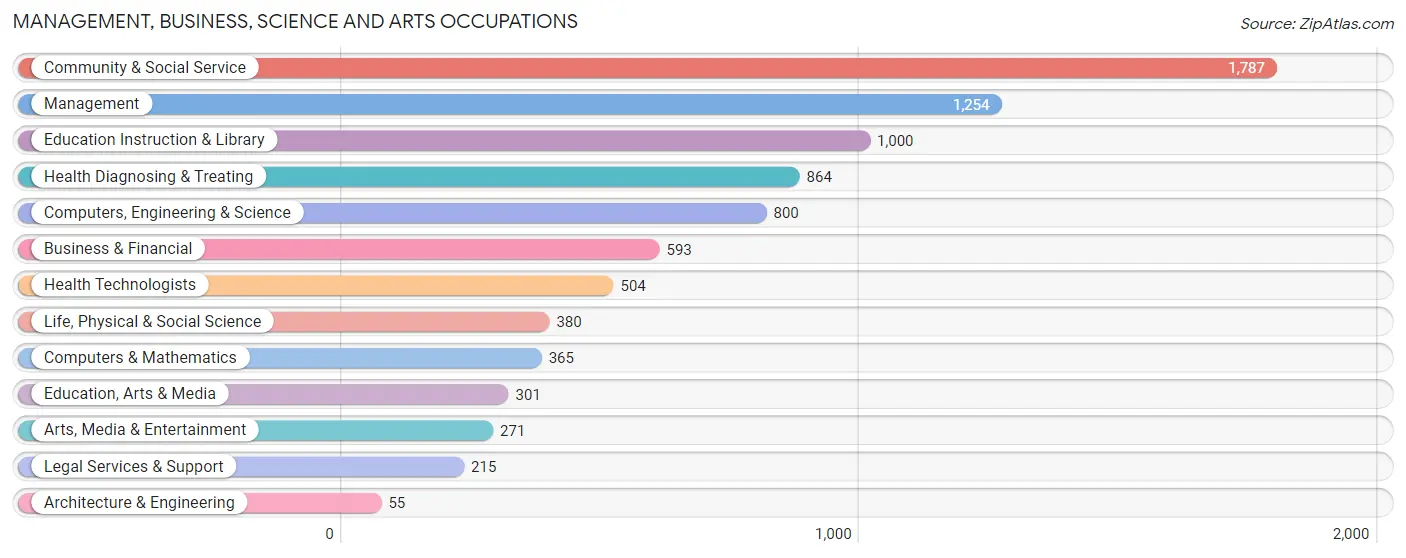
Management, Business, Science and Arts Occupations
The most common Management, Business, Science and Arts occupations in Harker Heights are Community & Social Service (1,787 | 12.7%), Management (1,254 | 8.9%), Education Instruction & Library (1,000 | 7.1%), Health Diagnosing & Treating (864 | 6.1%), and Computers, Engineering & Science (800 | 5.7%).
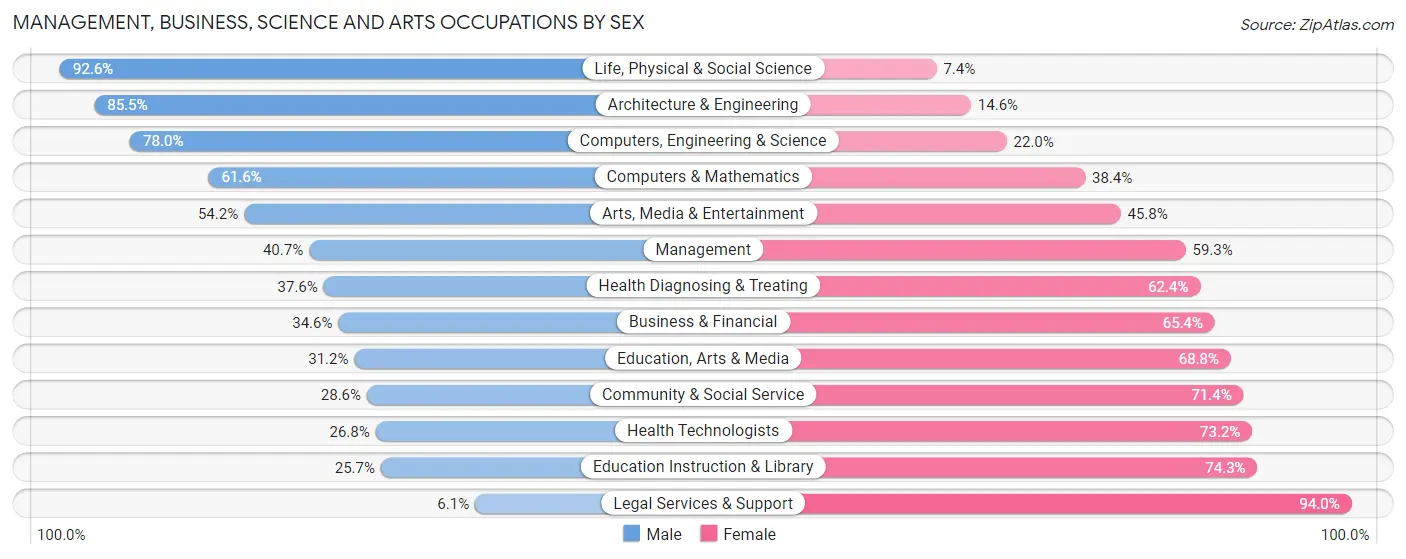
Management, Business, Science and Arts Occupations by Sex
Within the Management, Business, Science and Arts occupations in Harker Heights, the most male-oriented occupations are Life, Physical & Social Science (92.6%), Architecture & Engineering (85.5%), and Computers, Engineering & Science (78.0%), while the most female-oriented occupations are Legal Services & Support (94.0%), Education Instruction & Library (74.3%), and Health Technologists (73.2%).
| Occupation | Male | Female |
| Management | 510 (40.7%) | 744 (59.3%) |
| Business & Financial | 205 (34.6%) | 388 (65.4%) |
| Computers, Engineering & Science | 624 (78.0%) | 176 (22.0%) |
| Computers & Mathematics | 225 (61.6%) | 140 (38.4%) |
| Architecture & Engineering | 47 (85.5%) | 8 (14.5%) |
| Life, Physical & Social Science | 352 (92.6%) | 28 (7.4%) |
| Community & Social Service | 511 (28.6%) | 1,276 (71.4%) |
| Education, Arts & Media | 94 (31.2%) | 207 (68.8%) |
| Legal Services & Support | 13 (6.0%) | 202 (94.0%) |
| Education Instruction & Library | 257 (25.7%) | 743 (74.3%) |
| Arts, Media & Entertainment | 147 (54.2%) | 124 (45.8%) |
| Health Diagnosing & Treating | 325 (37.6%) | 539 (62.4%) |
| Health Technologists | 135 (26.8%) | 369 (73.2%) |
| Total (Category) | 2,175 (41.0%) | 3,123 (59.0%) |
| Total (Overall) | 6,493 (46.0%) | 7,614 (54.0%) |
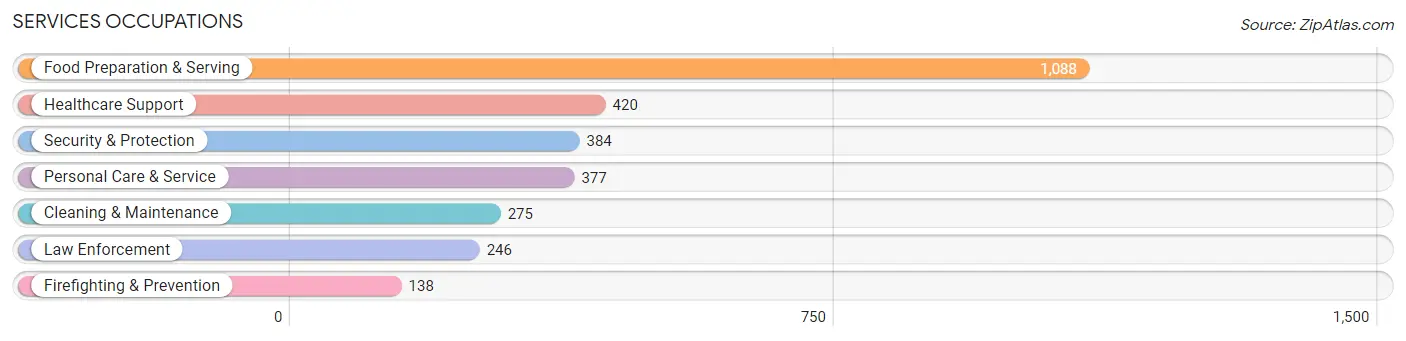
Services Occupations
The most common Services occupations in Harker Heights are Food Preparation & Serving (1,088 | 7.7%), Healthcare Support (420 | 3.0%), Security & Protection (384 | 2.7%), Personal Care & Service (377 | 2.7%), and Cleaning & Maintenance (275 | 1.9%).
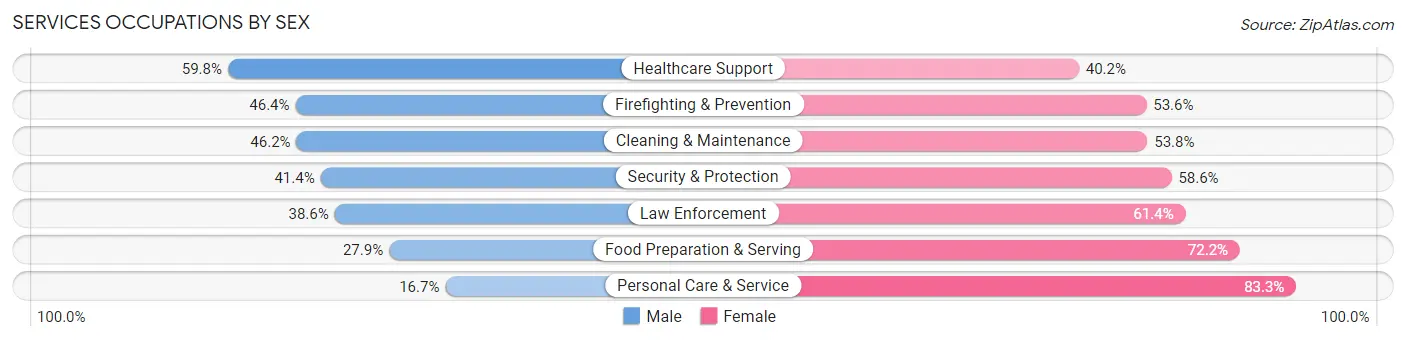
Services Occupations by Sex
Within the Services occupations in Harker Heights, the most male-oriented occupations are Healthcare Support (59.8%), Firefighting & Prevention (46.4%), and Cleaning & Maintenance (46.2%), while the most female-oriented occupations are Personal Care & Service (83.3%), Food Preparation & Serving (72.2%), and Law Enforcement (61.4%).
| Occupation | Male | Female |
| Healthcare Support | 251 (59.8%) | 169 (40.2%) |
| Security & Protection | 159 (41.4%) | 225 (58.6%) |
| Firefighting & Prevention | 64 (46.4%) | 74 (53.6%) |
| Law Enforcement | 95 (38.6%) | 151 (61.4%) |
| Food Preparation & Serving | 303 (27.9%) | 785 (72.2%) |
| Cleaning & Maintenance | 127 (46.2%) | 148 (53.8%) |
| Personal Care & Service | 63 (16.7%) | 314 (83.3%) |
| Total (Category) | 903 (35.5%) | 1,641 (64.5%) |
| Total (Overall) | 6,493 (46.0%) | 7,614 (54.0%) |
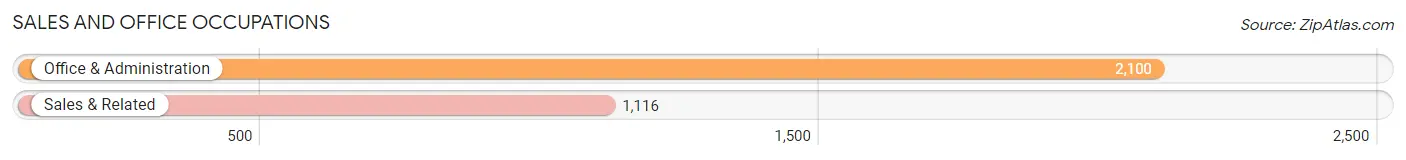
Sales and Office Occupations
The most common Sales and Office occupations in Harker Heights are Office & Administration (2,100 | 14.9%), and Sales & Related (1,116 | 7.9%).
Sales and Office Occupations by Sex
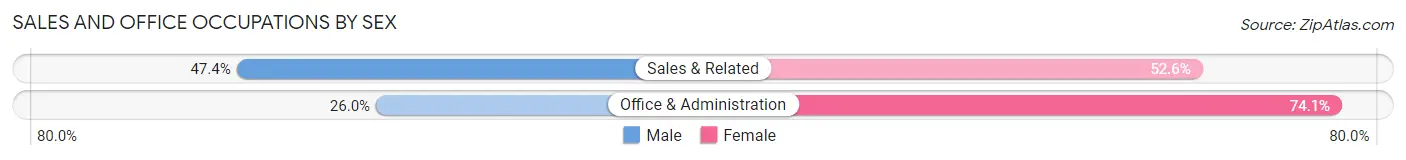
| Occupation | Male | Female |
| Sales & Related | 529 (47.4%) | 587 (52.6%) |
| Office & Administration | 545 (26.0%) | 1,555 (74.1%) |
| Total (Category) | 1,074 (33.4%) | 2,142 (66.6%) |
| Total (Overall) | 6,493 (46.0%) | 7,614 (54.0%) |
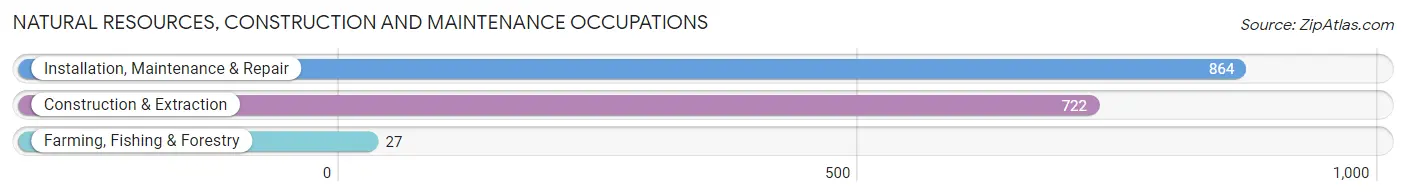
Natural Resources, Construction and Maintenance Occupations
The most common Natural Resources, Construction and Maintenance occupations in Harker Heights are Installation, Maintenance & Repair (864 | 6.1%), Construction & Extraction (722 | 5.1%), and Farming, Fishing & Forestry (27 | 0.2%).
Natural Resources, Construction and Maintenance Occupations by Sex
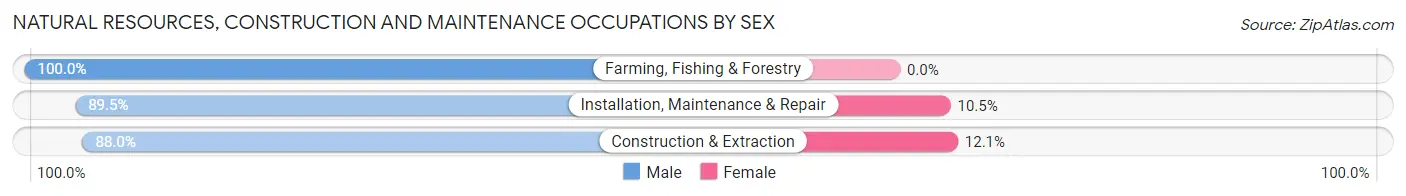
| Occupation | Male | Female |
| Farming, Fishing & Forestry | 27 (100.0%) | 0 (0.0%) |
| Construction & Extraction | 635 (87.9%) | 87 (12.0%) |
| Installation, Maintenance & Repair | 773 (89.5%) | 91 (10.5%) |
| Total (Category) | 1,435 (89.0%) | 178 (11.0%) |
| Total (Overall) | 6,493 (46.0%) | 7,614 (54.0%) |
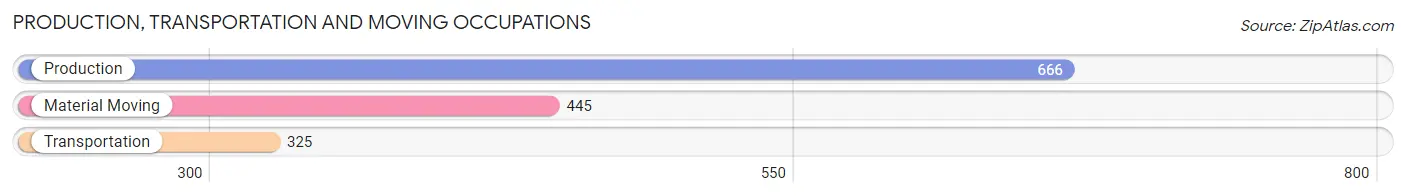
Production, Transportation and Moving Occupations
The most common Production, Transportation and Moving occupations in Harker Heights are Production (666 | 4.7%), Material Moving (445 | 3.2%), and Transportation (325 | 2.3%).
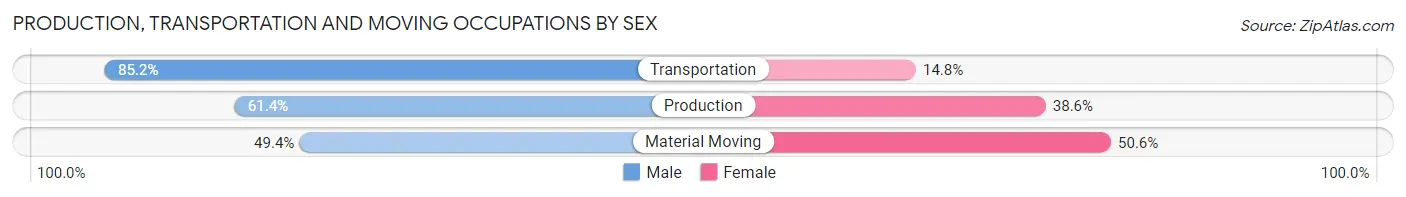
Production, Transportation and Moving Occupations by Sex
| Occupation | Male | Female |
| Production | 409 (61.4%) | 257 (38.6%) |
| Transportation | 277 (85.2%) | 48 (14.8%) |
| Material Moving | 220 (49.4%) | 225 (50.6%) |
| Total (Category) | 906 (63.1%) | 530 (36.9%) |
| Total (Overall) | 6,493 (46.0%) | 7,614 (54.0%) |
Employment Industries by Sex in Harker Heights
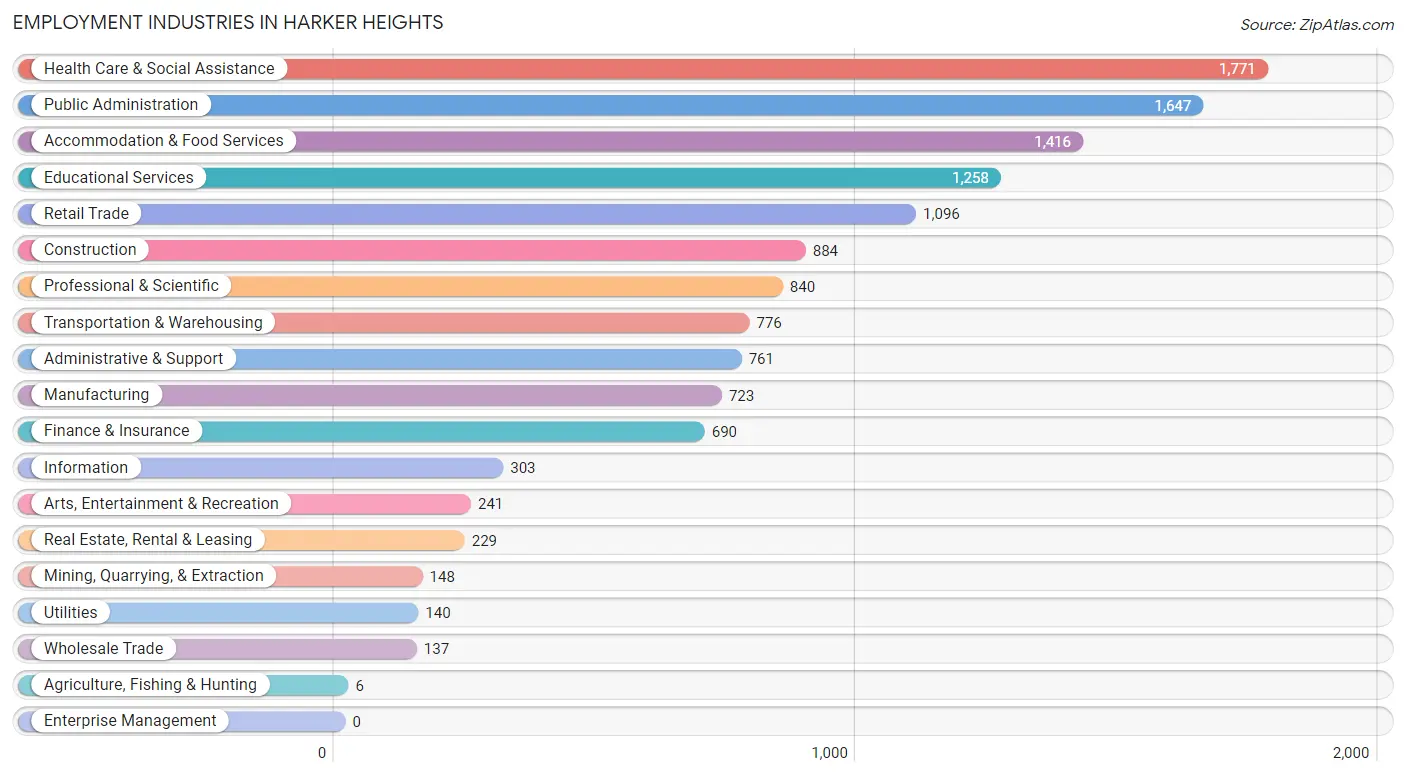
Employment Industries in Harker Heights
The major employment industries in Harker Heights include Health Care & Social Assistance (1,771 | 12.6%), Public Administration (1,647 | 11.7%), Accommodation & Food Services (1,416 | 10.0%), Educational Services (1,258 | 8.9%), and Retail Trade (1,096 | 7.8%).
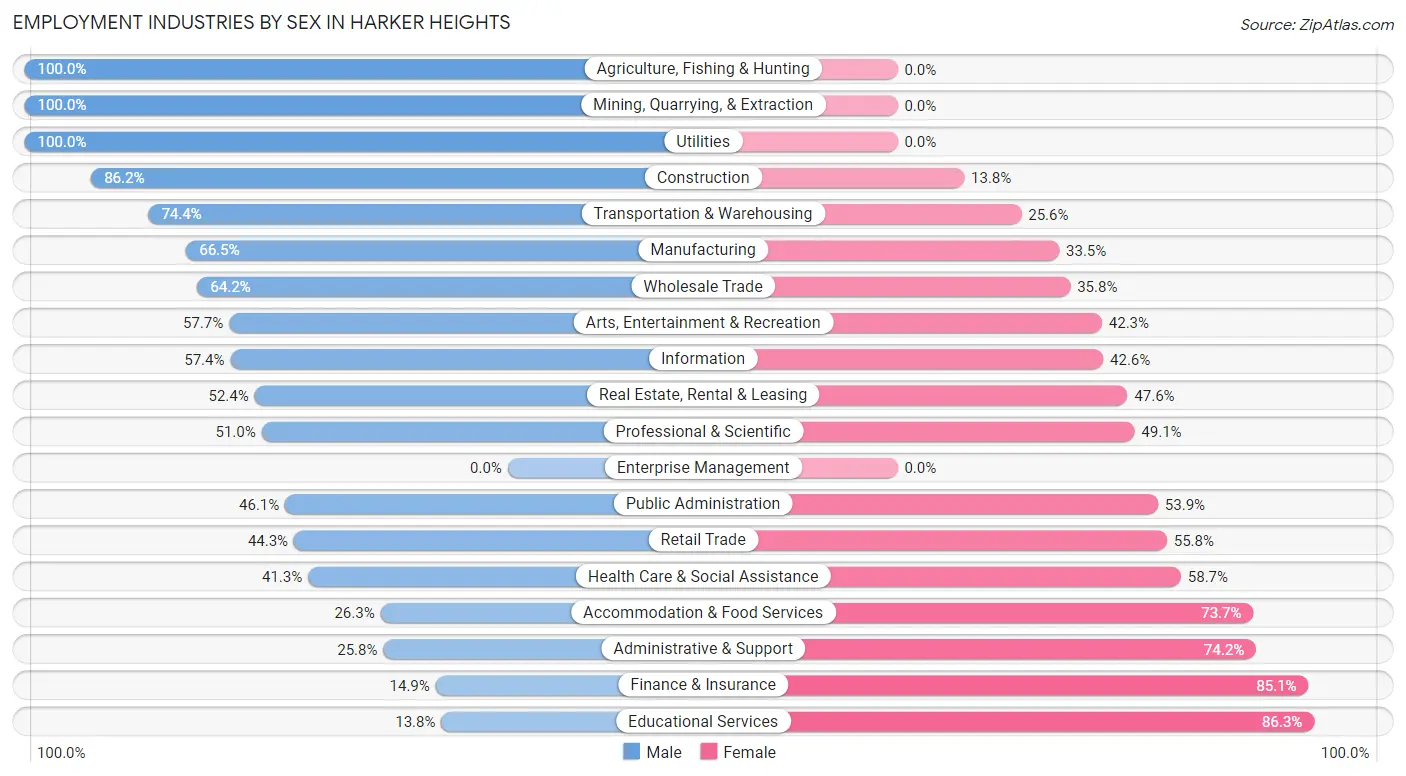
Employment Industries by Sex in Harker Heights
The Harker Heights industries that see more men than women are Agriculture, Fishing & Hunting (100.0%), Mining, Quarrying, & Extraction (100.0%), and Utilities (100.0%), whereas the industries that tend to have a higher number of women are Educational Services (86.3%), Finance & Insurance (85.1%), and Administrative & Support (74.2%).
| Industry | Male | Female |
| Agriculture, Fishing & Hunting | 6 (100.0%) | 0 (0.0%) |
| Mining, Quarrying, & Extraction | 148 (100.0%) | 0 (0.0%) |
| Construction | 762 (86.2%) | 122 (13.8%) |
| Manufacturing | 481 (66.5%) | 242 (33.5%) |
| Wholesale Trade | 88 (64.2%) | 49 (35.8%) |
| Retail Trade | 485 (44.3%) | 611 (55.7%) |
| Transportation & Warehousing | 577 (74.4%) | 199 (25.6%) |
| Utilities | 140 (100.0%) | 0 (0.0%) |
| Information | 174 (57.4%) | 129 (42.6%) |
| Finance & Insurance | 103 (14.9%) | 587 (85.1%) |
| Real Estate, Rental & Leasing | 120 (52.4%) | 109 (47.6%) |
| Professional & Scientific | 428 (50.9%) | 412 (49.0%) |
| Enterprise Management | 0 (0.0%) | 0 (0.0%) |
| Administrative & Support | 196 (25.8%) | 565 (74.2%) |
| Educational Services | 173 (13.8%) | 1,085 (86.3%) |
| Health Care & Social Assistance | 732 (41.3%) | 1,039 (58.7%) |
| Arts, Entertainment & Recreation | 139 (57.7%) | 102 (42.3%) |
| Accommodation & Food Services | 373 (26.3%) | 1,043 (73.7%) |
| Public Administration | 759 (46.1%) | 888 (53.9%) |
| Total | 6,493 (46.0%) | 7,614 (54.0%) |
Education in Harker Heights
School Enrollment in Harker Heights
The most common levels of schooling among the 10,810 students in Harker Heights are middle school (2,589 | 23.9%), high school (2,319 | 21.4%), and college / undergraduate (2,148 | 19.9%).
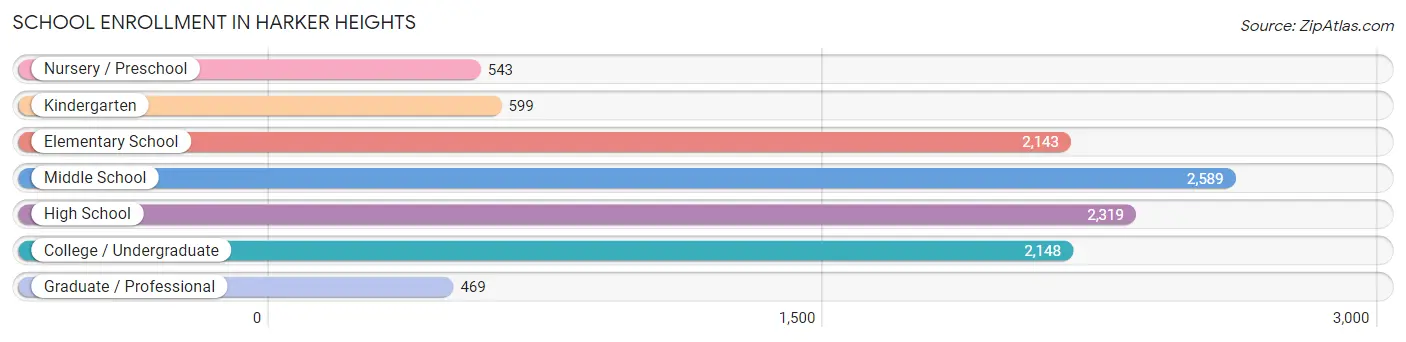
| School Level | # Students | % Students |
| Nursery / Preschool | 543 | 5.0% |
| Kindergarten | 599 | 5.5% |
| Elementary School | 2,143 | 19.8% |
| Middle School | 2,589 | 23.9% |
| High School | 2,319 | 21.4% |
| College / Undergraduate | 2,148 | 19.9% |
| Graduate / Professional | 469 | 4.3% |
| Total | 10,810 | 100.0% |
School Enrollment by Age by Funding Source in Harker Heights
Out of a total of 10,810 students who are enrolled in schools in Harker Heights, 1,427 (13.2%) attend a private institution, while the remaining 9,383 (86.8%) are enrolled in public schools. The age group of 35 years and over has the highest likelihood of being enrolled in private schools, with 299 (32.3% in the age bracket) enrolled. Conversely, the age group of 5 to 9 year old has the lowest likelihood of being enrolled in a private school, with 2,522 (93.8% in the age bracket) attending a public institution.
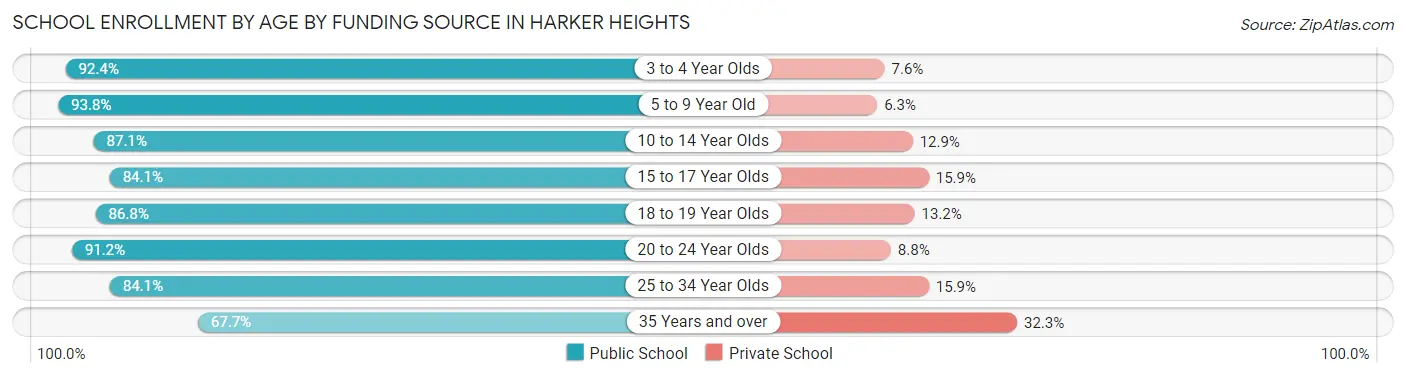
| Age Bracket | Public School | Private School |
| 3 to 4 Year Olds | 279 (92.4%) | 23 (7.6%) |
| 5 to 9 Year Old | 2,522 (93.8%) | 168 (6.2%) |
| 10 to 14 Year Olds | 2,663 (87.1%) | 393 (12.9%) |
| 15 to 17 Year Olds | 1,597 (84.1%) | 301 (15.9%) |
| 18 to 19 Year Olds | 611 (86.8%) | 93 (13.2%) |
| 20 to 24 Year Olds | 591 (91.2%) | 57 (8.8%) |
| 25 to 34 Year Olds | 493 (84.1%) | 93 (15.9%) |
| 35 Years and over | 627 (67.7%) | 299 (32.3%) |
| Total | 9,383 (86.8%) | 1,427 (13.2%) |
Educational Attainment by Field of Study in Harker Heights
Business (1,358 | 18.5%), bio, nature & agricultural (784 | 10.7%), arts & humanities (751 | 10.2%), education (718 | 9.8%), and science & technology (614 | 8.4%) are the most common fields of study among 7,349 individuals in Harker Heights who have obtained a bachelor's degree or higher.
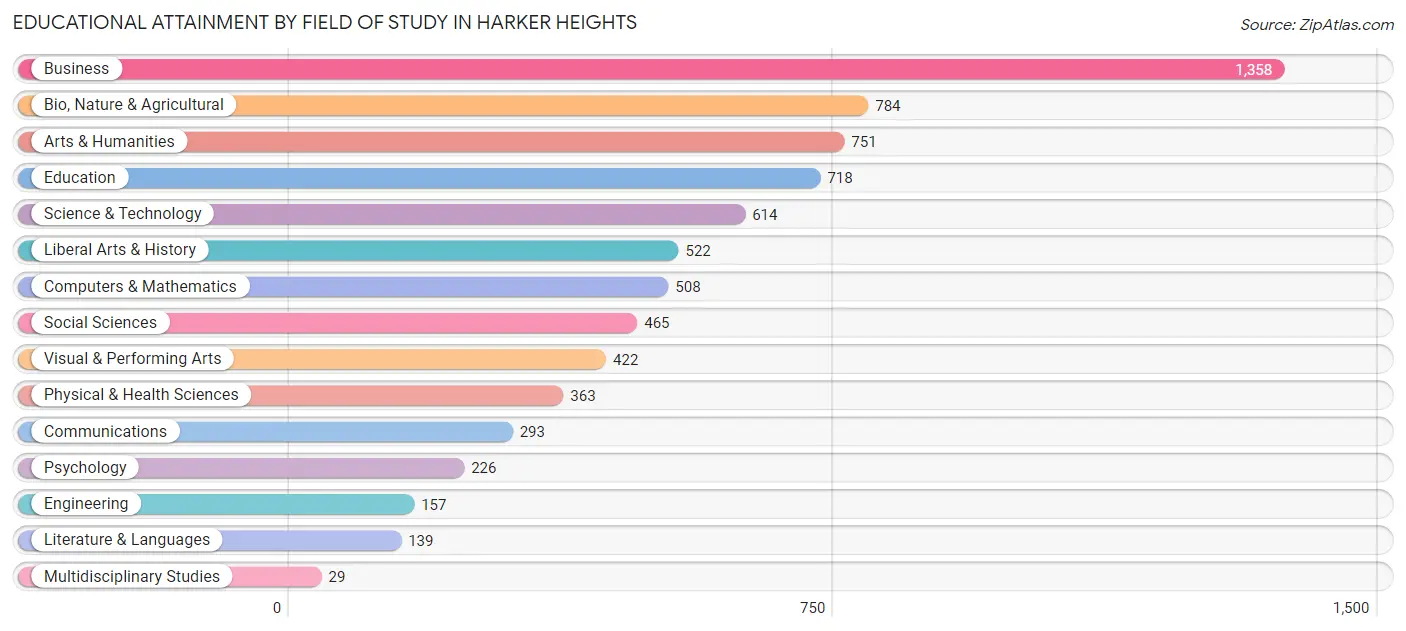
| Field of Study | # Graduates | % Graduates |
| Computers & Mathematics | 508 | 6.9% |
| Bio, Nature & Agricultural | 784 | 10.7% |
| Physical & Health Sciences | 363 | 4.9% |
| Psychology | 226 | 3.1% |
| Social Sciences | 465 | 6.3% |
| Engineering | 157 | 2.1% |
| Multidisciplinary Studies | 29 | 0.4% |
| Science & Technology | 614 | 8.4% |
| Business | 1,358 | 18.5% |
| Education | 718 | 9.8% |
| Literature & Languages | 139 | 1.9% |
| Liberal Arts & History | 522 | 7.1% |
| Visual & Performing Arts | 422 | 5.7% |
| Communications | 293 | 4.0% |
| Arts & Humanities | 751 | 10.2% |
| Total | 7,349 | 100.0% |
Transportation & Commute in Harker Heights
Vehicle Availability by Sex in Harker Heights
The most prevalent vehicle ownership categories in Harker Heights are males with 2 vehicles (3,421, accounting for 42.5%) and females with 2 vehicles (2,925, making up 44.1%).
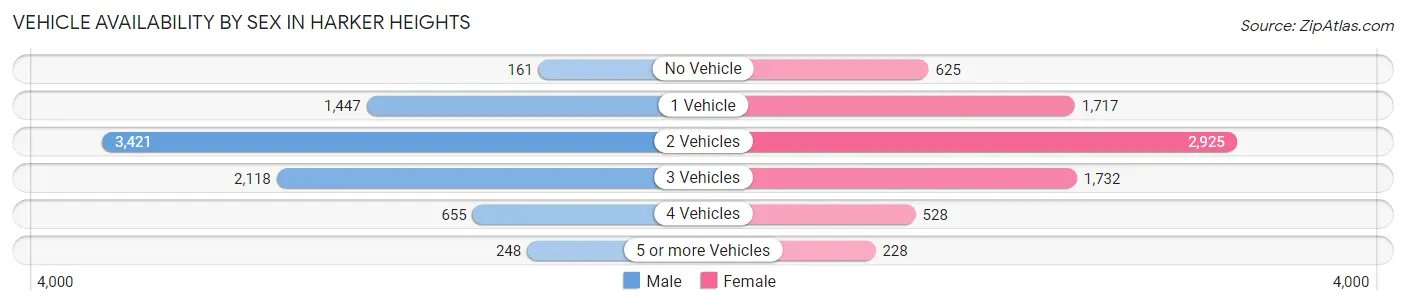
| Vehicles Available | Male | Female |
| No Vehicle | 161 (2.0%) | 625 (8.1%) |
| 1 Vehicle | 1,447 (18.0%) | 1,717 (22.1%) |
| 2 Vehicles | 3,421 (42.5%) | 2,925 (37.7%) |
| 3 Vehicles | 2,118 (26.3%) | 1,732 (22.3%) |
| 4 Vehicles | 655 (8.1%) | 528 (6.8%) |
| 5 or more Vehicles | 248 (3.1%) | 228 (2.9%) |
| Total | 8,050 (100.0%) | 7,755 (100.0%) |
Commute Time in Harker Heights
The most frequently occuring commute durations in Harker Heights are 15 to 19 minutes (3,120 commuters, 21.3%), 20 to 24 minutes (2,451 commuters, 16.7%), and 10 to 14 minutes (2,161 commuters, 14.7%).
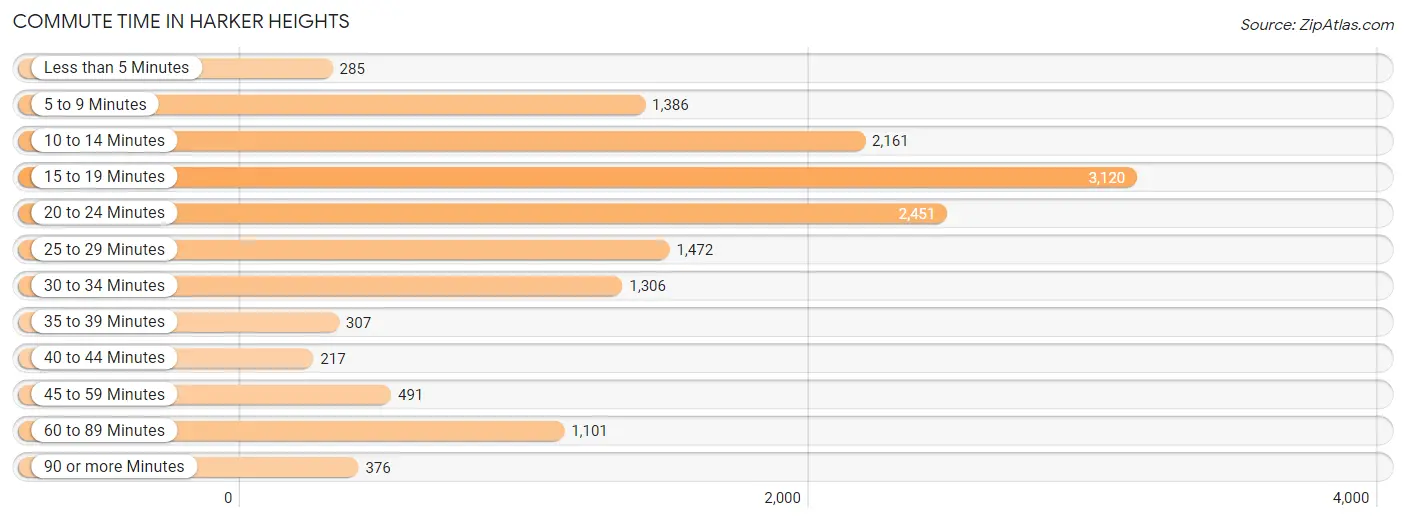
| Commute Time | # Commuters | % Commuters |
| Less than 5 Minutes | 285 | 1.9% |
| 5 to 9 Minutes | 1,386 | 9.5% |
| 10 to 14 Minutes | 2,161 | 14.7% |
| 15 to 19 Minutes | 3,120 | 21.3% |
| 20 to 24 Minutes | 2,451 | 16.7% |
| 25 to 29 Minutes | 1,472 | 10.0% |
| 30 to 34 Minutes | 1,306 | 8.9% |
| 35 to 39 Minutes | 307 | 2.1% |
| 40 to 44 Minutes | 217 | 1.5% |
| 45 to 59 Minutes | 491 | 3.4% |
| 60 to 89 Minutes | 1,101 | 7.5% |
| 90 or more Minutes | 376 | 2.6% |
Commute Time by Sex in Harker Heights
The most common commute times in Harker Heights are 15 to 19 minutes (1,626 commuters, 21.1%) for males and 15 to 19 minutes (1,494 commuters, 21.4%) for females.
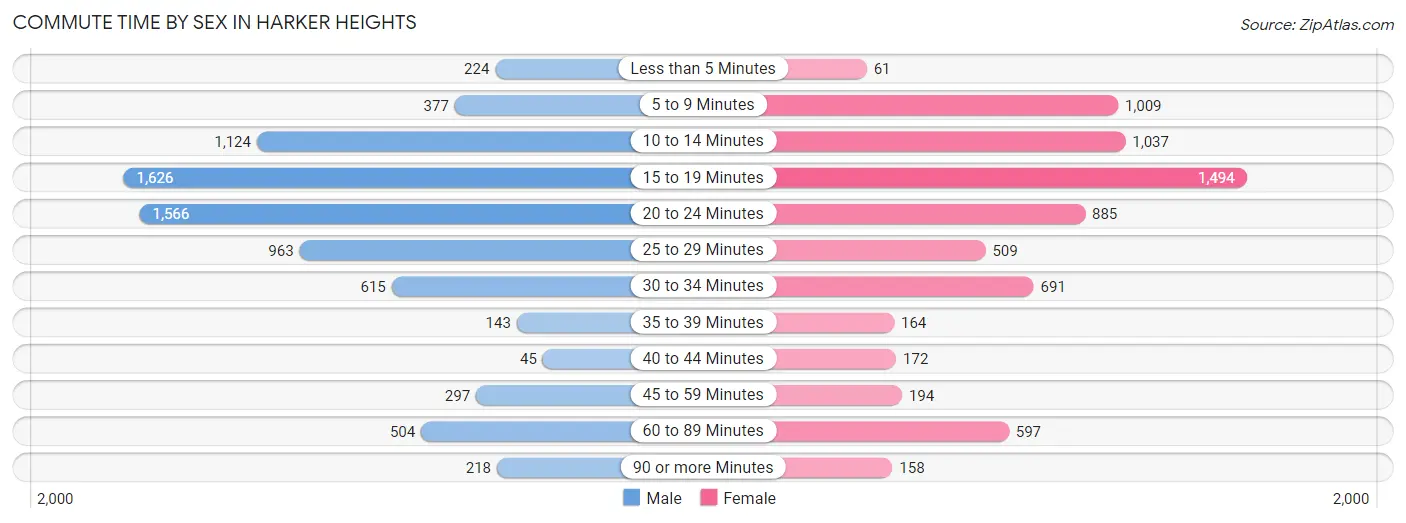
| Commute Time | Male | Female |
| Less than 5 Minutes | 224 (2.9%) | 61 (0.9%) |
| 5 to 9 Minutes | 377 (4.9%) | 1,009 (14.5%) |
| 10 to 14 Minutes | 1,124 (14.6%) | 1,037 (14.9%) |
| 15 to 19 Minutes | 1,626 (21.1%) | 1,494 (21.4%) |
| 20 to 24 Minutes | 1,566 (20.3%) | 885 (12.7%) |
| 25 to 29 Minutes | 963 (12.5%) | 509 (7.3%) |
| 30 to 34 Minutes | 615 (8.0%) | 691 (9.9%) |
| 35 to 39 Minutes | 143 (1.9%) | 164 (2.4%) |
| 40 to 44 Minutes | 45 (0.6%) | 172 (2.5%) |
| 45 to 59 Minutes | 297 (3.9%) | 194 (2.8%) |
| 60 to 89 Minutes | 504 (6.5%) | 597 (8.6%) |
| 90 or more Minutes | 218 (2.8%) | 158 (2.3%) |
Time of Departure to Work by Sex in Harker Heights
The most frequent times of departure to work in Harker Heights are 7:30 AM to 7:59 AM (1,268, 16.5%) for males and 7:00 AM to 7:29 AM (1,723, 24.7%) for females.
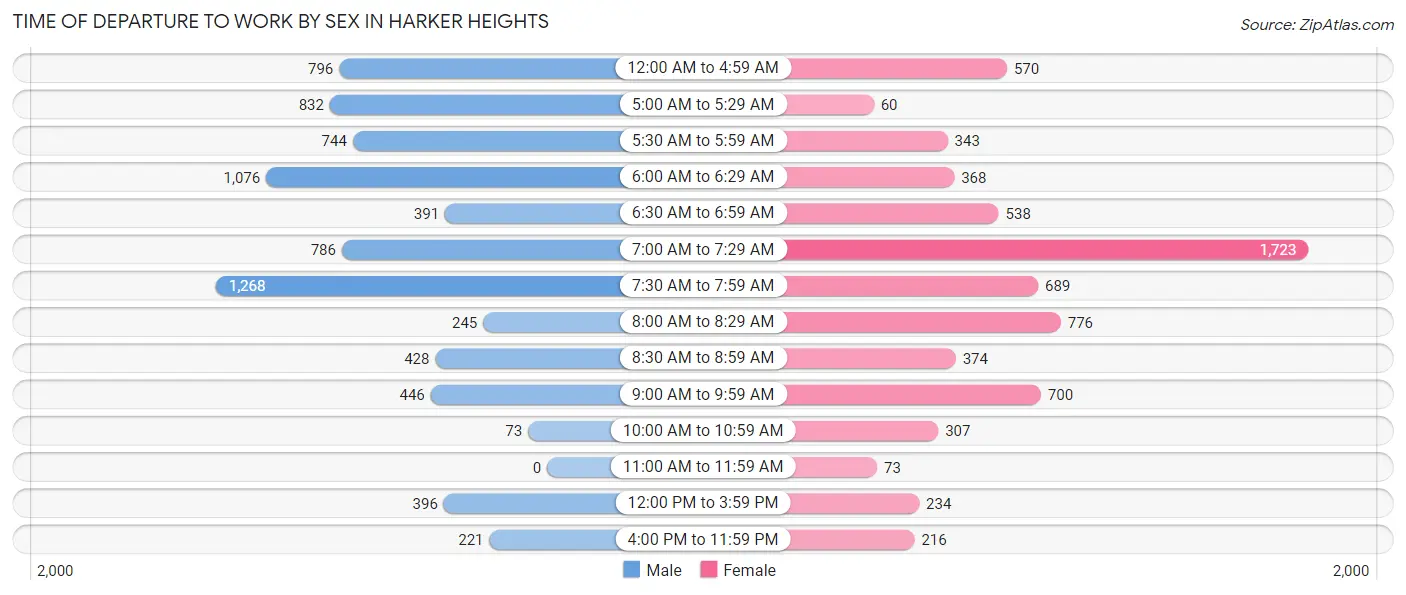
| Time of Departure | Male | Female |
| 12:00 AM to 4:59 AM | 796 (10.3%) | 570 (8.2%) |
| 5:00 AM to 5:29 AM | 832 (10.8%) | 60 (0.9%) |
| 5:30 AM to 5:59 AM | 744 (9.7%) | 343 (4.9%) |
| 6:00 AM to 6:29 AM | 1,076 (14.0%) | 368 (5.3%) |
| 6:30 AM to 6:59 AM | 391 (5.1%) | 538 (7.7%) |
| 7:00 AM to 7:29 AM | 786 (10.2%) | 1,723 (24.7%) |
| 7:30 AM to 7:59 AM | 1,268 (16.5%) | 689 (9.9%) |
| 8:00 AM to 8:29 AM | 245 (3.2%) | 776 (11.1%) |
| 8:30 AM to 8:59 AM | 428 (5.6%) | 374 (5.4%) |
| 9:00 AM to 9:59 AM | 446 (5.8%) | 700 (10.0%) |
| 10:00 AM to 10:59 AM | 73 (0.9%) | 307 (4.4%) |
| 11:00 AM to 11:59 AM | 0 (0.0%) | 73 (1.1%) |
| 12:00 PM to 3:59 PM | 396 (5.1%) | 234 (3.4%) |
| 4:00 PM to 11:59 PM | 221 (2.9%) | 216 (3.1%) |
| Total | 7,702 (100.0%) | 6,971 (100.0%) |
Housing Occupancy in Harker Heights
Occupancy by Ownership in Harker Heights
Of the total 11,779 dwellings in Harker Heights, owner-occupied units account for 6,603 (56.1%), while renter-occupied units make up 5,176 (43.9%).
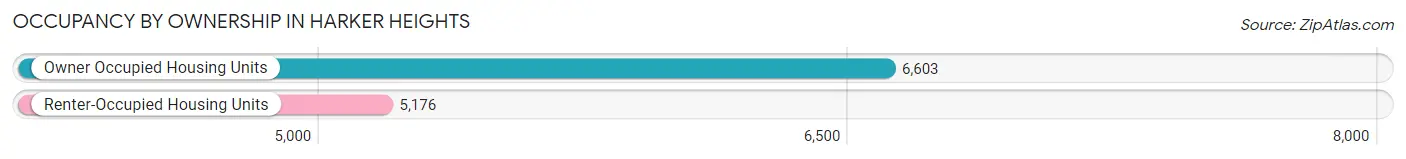
| Occupancy | # Housing Units | % Housing Units |
| Owner Occupied Housing Units | 6,603 | 56.1% |
| Renter-Occupied Housing Units | 5,176 | 43.9% |
| Total Occupied Housing Units | 11,779 | 100.0% |
Occupancy by Household Size in Harker Heights
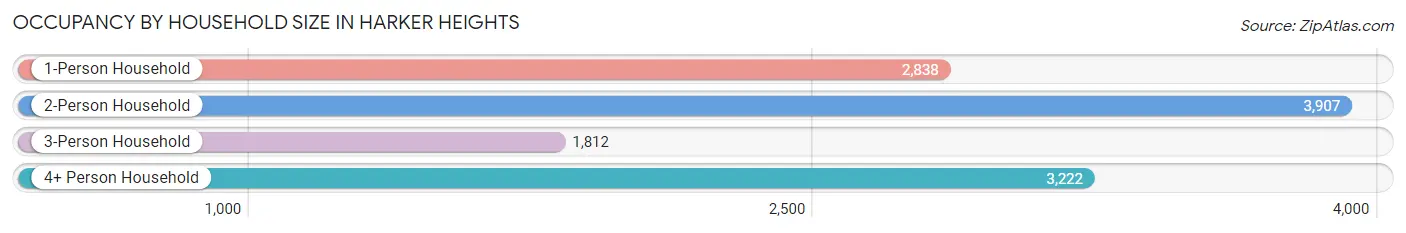
| Household Size | # Housing Units | % Housing Units |
| 1-Person Household | 2,838 | 24.1% |
| 2-Person Household | 3,907 | 33.2% |
| 3-Person Household | 1,812 | 15.4% |
| 4+ Person Household | 3,222 | 27.4% |
| Total Housing Units | 11,779 | 100.0% |
Occupancy by Ownership by Household Size in Harker Heights
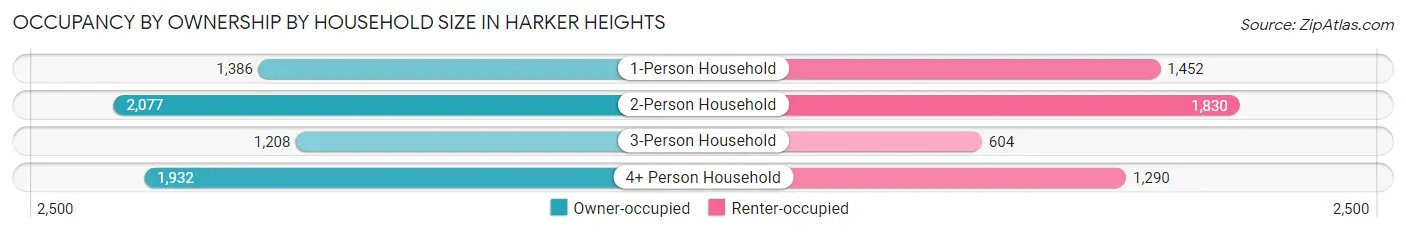
| Household Size | Owner-occupied | Renter-occupied |
| 1-Person Household | 1,386 (48.8%) | 1,452 (51.2%) |
| 2-Person Household | 2,077 (53.2%) | 1,830 (46.8%) |
| 3-Person Household | 1,208 (66.7%) | 604 (33.3%) |
| 4+ Person Household | 1,932 (60.0%) | 1,290 (40.0%) |
| Total Housing Units | 6,603 (56.1%) | 5,176 (43.9%) |
Occupancy by Educational Attainment in Harker Heights
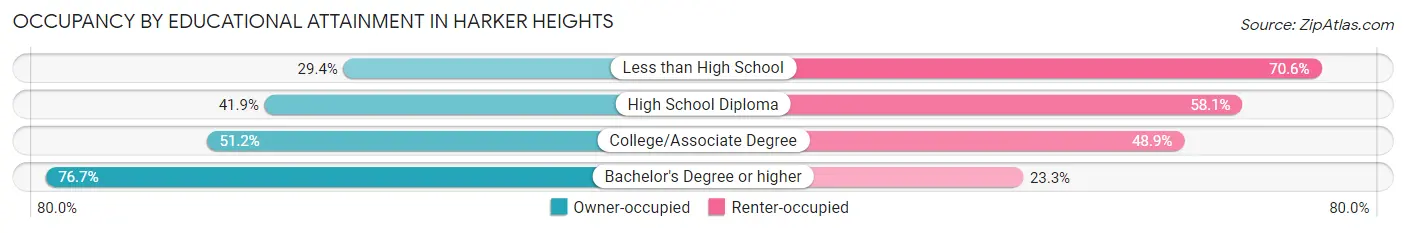
| Household Size | Owner-occupied | Renter-occupied |
| Less than High School | 335 (29.4%) | 805 (70.6%) |
| High School Diploma | 826 (41.9%) | 1,145 (58.1%) |
| College/Associate Degree | 2,417 (51.1%) | 2,308 (48.8%) |
| Bachelor's Degree or higher | 3,025 (76.7%) | 918 (23.3%) |
Occupancy by Age of Householder in Harker Heights
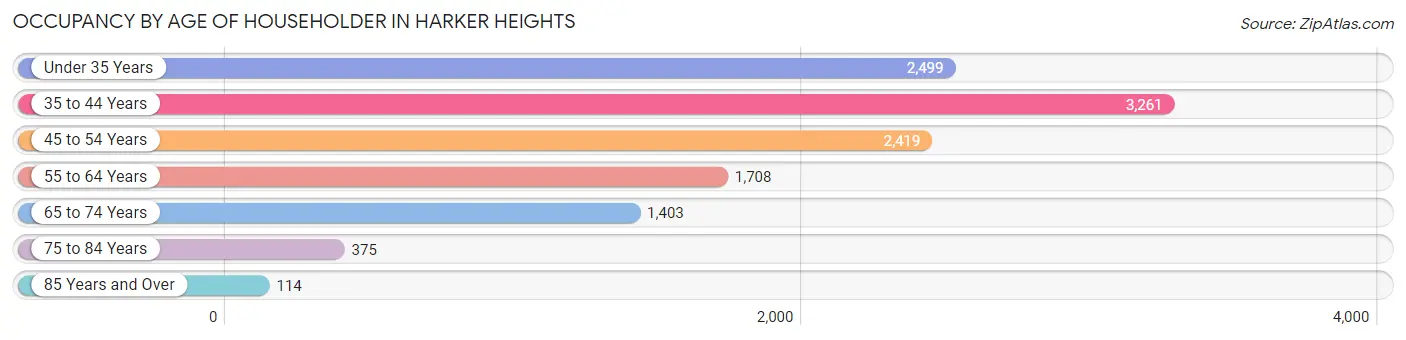
| Age Bracket | # Households | % Households |
| Under 35 Years | 2,499 | 21.2% |
| 35 to 44 Years | 3,261 | 27.7% |
| 45 to 54 Years | 2,419 | 20.5% |
| 55 to 64 Years | 1,708 | 14.5% |
| 65 to 74 Years | 1,403 | 11.9% |
| 75 to 84 Years | 375 | 3.2% |
| 85 Years and Over | 114 | 1.0% |
| Total | 11,779 | 100.0% |
Housing Finances in Harker Heights
Median Income by Occupancy in Harker Heights
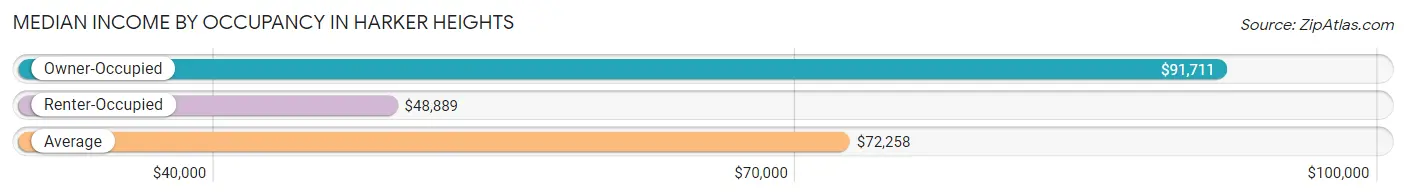
| Occupancy Type | # Households | Median Income |
| Owner-Occupied | 6,603 (56.1%) | $91,711 |
| Renter-Occupied | 5,176 (43.9%) | $48,889 |
| Average | 11,779 (100.0%) | $72,258 |
Occupancy by Householder Income Bracket in Harker Heights
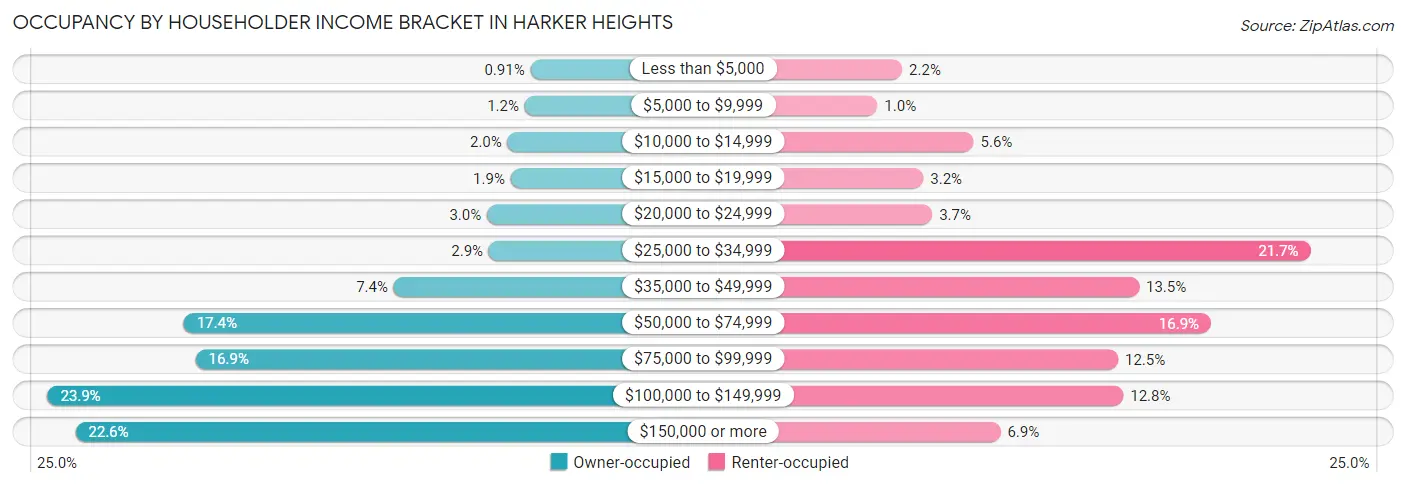
| Income Bracket | Owner-occupied | Renter-occupied |
| Less than $5,000 | 60 (0.9%) | 115 (2.2%) |
| $5,000 to $9,999 | 78 (1.2%) | 54 (1.0%) |
| $10,000 to $14,999 | 132 (2.0%) | 291 (5.6%) |
| $15,000 to $19,999 | 122 (1.8%) | 167 (3.2%) |
| $20,000 to $24,999 | 197 (3.0%) | 189 (3.6%) |
| $25,000 to $34,999 | 191 (2.9%) | 1,121 (21.7%) |
| $35,000 to $49,999 | 490 (7.4%) | 699 (13.5%) |
| $50,000 to $74,999 | 1,150 (17.4%) | 876 (16.9%) |
| $75,000 to $99,999 | 1,113 (16.9%) | 647 (12.5%) |
| $100,000 to $149,999 | 1,579 (23.9%) | 660 (12.8%) |
| $150,000 or more | 1,491 (22.6%) | 357 (6.9%) |
| Total | 6,603 (100.0%) | 5,176 (100.0%) |
Monthly Housing Cost Tiers in Harker Heights
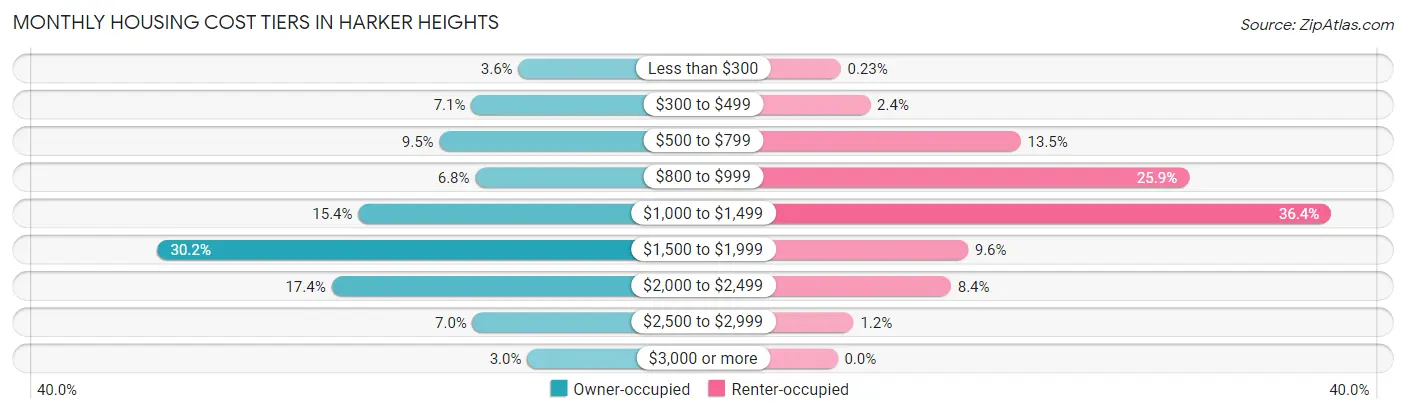
| Monthly Cost | Owner-occupied | Renter-occupied |
| Less than $300 | 240 (3.6%) | 12 (0.2%) |
| $300 to $499 | 469 (7.1%) | 125 (2.4%) |
| $500 to $799 | 624 (9.5%) | 698 (13.5%) |
| $800 to $999 | 449 (6.8%) | 1,340 (25.9%) |
| $1,000 to $1,499 | 1,018 (15.4%) | 1,882 (36.4%) |
| $1,500 to $1,999 | 1,995 (30.2%) | 497 (9.6%) |
| $2,000 to $2,499 | 1,149 (17.4%) | 432 (8.4%) |
| $2,500 to $2,999 | 462 (7.0%) | 61 (1.2%) |
| $3,000 or more | 197 (3.0%) | 0 (0.0%) |
| Total | 6,603 (100.0%) | 5,176 (100.0%) |
Physical Housing Characteristics in Harker Heights
Housing Structures in Harker Heights
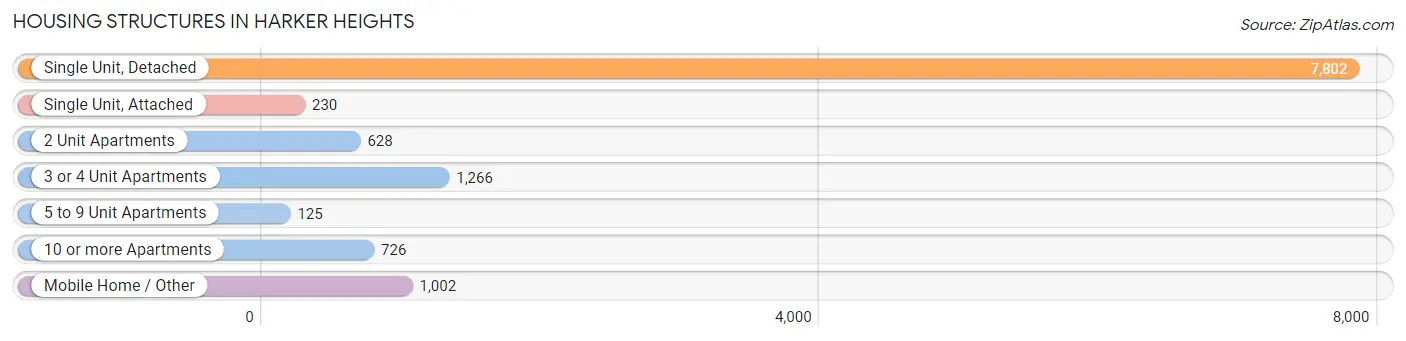
| Structure Type | # Housing Units | % Housing Units |
| Single Unit, Detached | 7,802 | 66.2% |
| Single Unit, Attached | 230 | 1.9% |
| 2 Unit Apartments | 628 | 5.3% |
| 3 or 4 Unit Apartments | 1,266 | 10.7% |
| 5 to 9 Unit Apartments | 125 | 1.1% |
| 10 or more Apartments | 726 | 6.2% |
| Mobile Home / Other | 1,002 | 8.5% |
| Total | 11,779 | 100.0% |
Housing Structures by Occupancy in Harker Heights
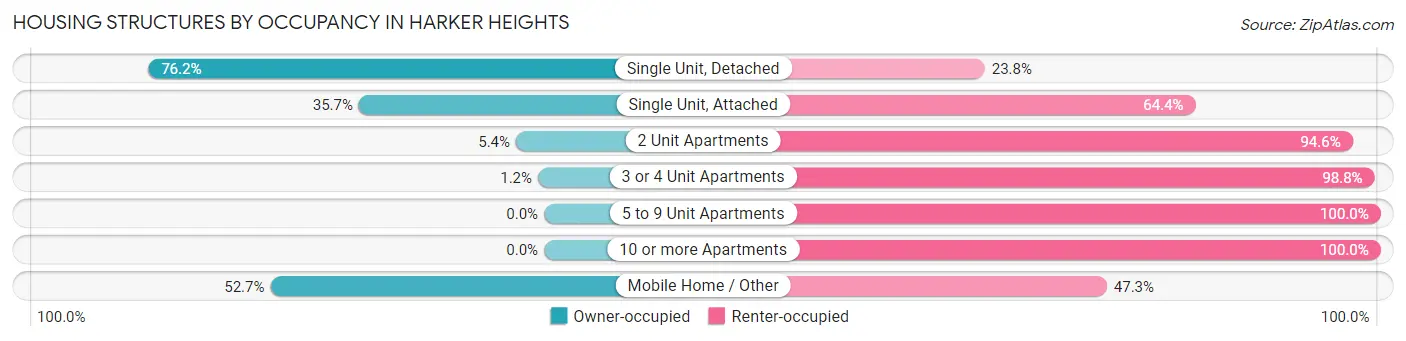
| Structure Type | Owner-occupied | Renter-occupied |
| Single Unit, Detached | 5,944 (76.2%) | 1,858 (23.8%) |
| Single Unit, Attached | 82 (35.6%) | 148 (64.3%) |
| 2 Unit Apartments | 34 (5.4%) | 594 (94.6%) |
| 3 or 4 Unit Apartments | 15 (1.2%) | 1,251 (98.8%) |
| 5 to 9 Unit Apartments | 0 (0.0%) | 125 (100.0%) |
| 10 or more Apartments | 0 (0.0%) | 726 (100.0%) |
| Mobile Home / Other | 528 (52.7%) | 474 (47.3%) |
| Total | 6,603 (56.1%) | 5,176 (43.9%) |
Housing Structures by Number of Rooms in Harker Heights
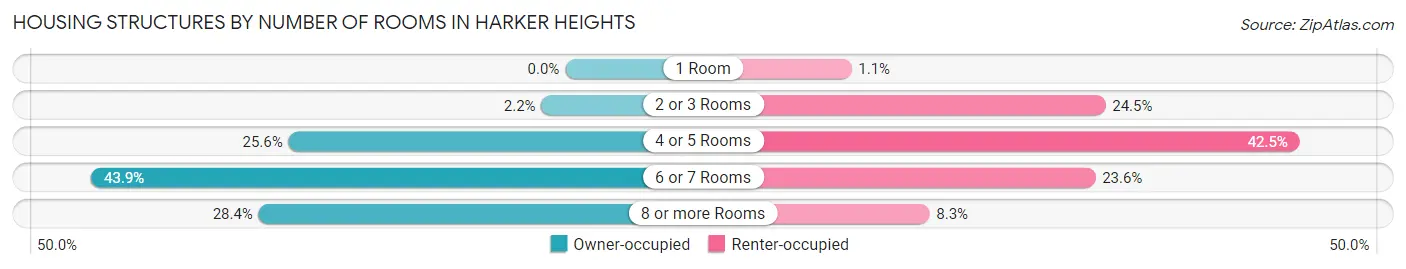
| Number of Rooms | Owner-occupied | Renter-occupied |
| 1 Room | 0 (0.0%) | 55 (1.1%) |
| 2 or 3 Rooms | 145 (2.2%) | 1,270 (24.5%) |
| 4 or 5 Rooms | 1,690 (25.6%) | 2,201 (42.5%) |
| 6 or 7 Rooms | 2,896 (43.9%) | 1,222 (23.6%) |
| 8 or more Rooms | 1,872 (28.3%) | 428 (8.3%) |
| Total | 6,603 (100.0%) | 5,176 (100.0%) |
Housing Structure by Heating Type in Harker Heights
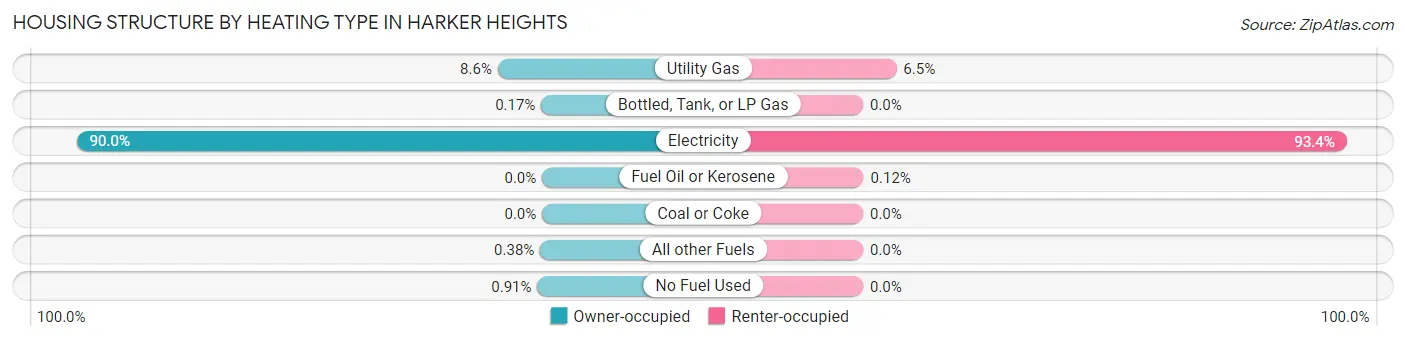
| Heating Type | Owner-occupied | Renter-occupied |
| Utility Gas | 566 (8.6%) | 334 (6.5%) |
| Bottled, Tank, or LP Gas | 11 (0.2%) | 0 (0.0%) |
| Electricity | 5,941 (90.0%) | 4,836 (93.4%) |
| Fuel Oil or Kerosene | 0 (0.0%) | 6 (0.1%) |
| Coal or Coke | 0 (0.0%) | 0 (0.0%) |
| All other Fuels | 25 (0.4%) | 0 (0.0%) |
| No Fuel Used | 60 (0.9%) | 0 (0.0%) |
| Total | 6,603 (100.0%) | 5,176 (100.0%) |
Household Vehicle Usage in Harker Heights
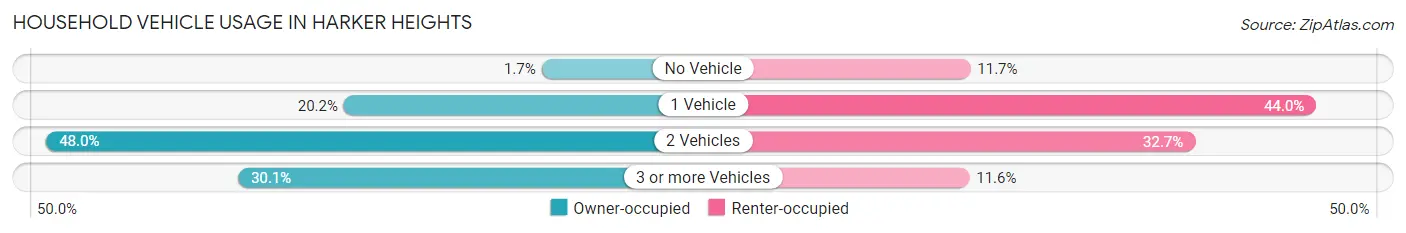
| Vehicles per Household | Owner-occupied | Renter-occupied |
| No Vehicle | 115 (1.7%) | 606 (11.7%) |
| 1 Vehicle | 1,334 (20.2%) | 2,277 (44.0%) |
| 2 Vehicles | 3,168 (48.0%) | 1,692 (32.7%) |
| 3 or more Vehicles | 1,986 (30.1%) | 601 (11.6%) |
| Total | 6,603 (100.0%) | 5,176 (100.0%) |
Real Estate & Mortgages in Harker Heights
Real Estate and Mortgage Overview in Harker Heights
| Characteristic | Without Mortgage | With Mortgage |
| Housing Units | 1,951 | 4,652 |
| Median Property Value | $207,500 | $248,000 |
| Median Household Income | $67,019 | $1,230 |
| Monthly Housing Costs | $681 | $197 |
| Real Estate Taxes | $3,358 | $756 |
Property Value by Mortgage Status in Harker Heights
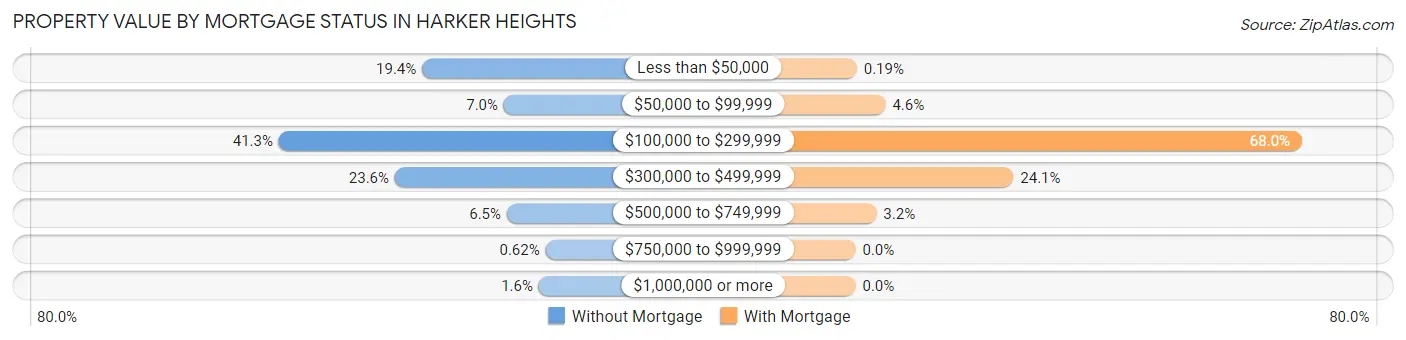
| Property Value | Without Mortgage | With Mortgage |
| Less than $50,000 | 379 (19.4%) | 9 (0.2%) |
| $50,000 to $99,999 | 136 (7.0%) | 212 (4.6%) |
| $100,000 to $299,999 | 805 (41.3%) | 3,164 (68.0%) |
| $300,000 to $499,999 | 460 (23.6%) | 1,119 (24.0%) |
| $500,000 to $749,999 | 127 (6.5%) | 148 (3.2%) |
| $750,000 to $999,999 | 12 (0.6%) | 0 (0.0%) |
| $1,000,000 or more | 32 (1.6%) | 0 (0.0%) |
| Total | 1,951 (100.0%) | 4,652 (100.0%) |
Household Income by Mortgage Status in Harker Heights
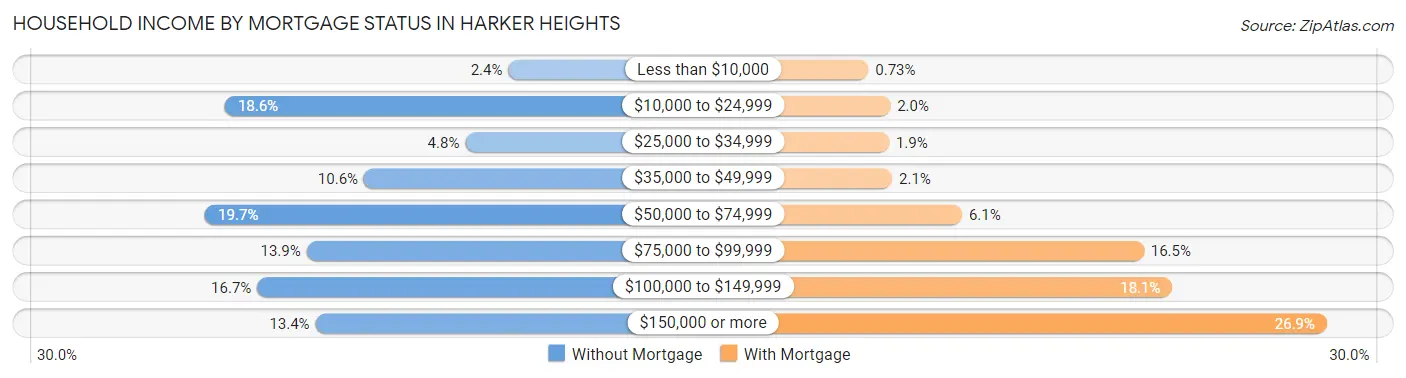
| Household Income | Without Mortgage | With Mortgage |
| Less than $10,000 | 46 (2.4%) | 34 (0.7%) |
| $10,000 to $24,999 | 362 (18.5%) | 92 (2.0%) |
| $25,000 to $34,999 | 94 (4.8%) | 89 (1.9%) |
| $35,000 to $49,999 | 207 (10.6%) | 97 (2.1%) |
| $50,000 to $74,999 | 384 (19.7%) | 283 (6.1%) |
| $75,000 to $99,999 | 271 (13.9%) | 766 (16.5%) |
| $100,000 to $149,999 | 326 (16.7%) | 842 (18.1%) |
| $150,000 or more | 261 (13.4%) | 1,253 (26.9%) |
| Total | 1,951 (100.0%) | 4,652 (100.0%) |
Property Value to Household Income Ratio in Harker Heights
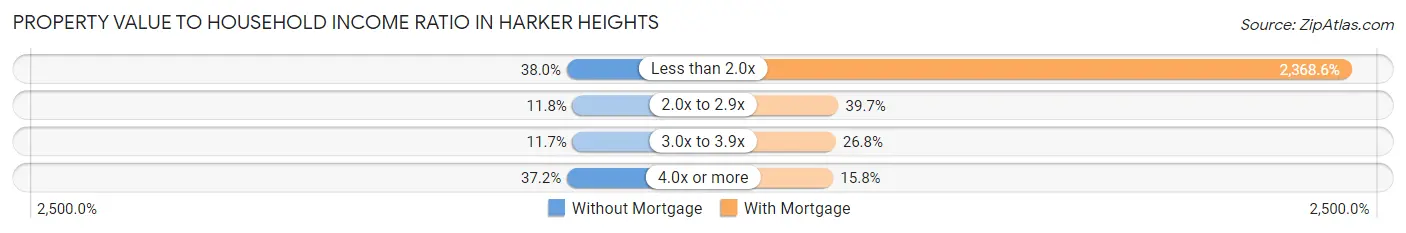
| Value-to-Income Ratio | Without Mortgage | With Mortgage |
| Less than 2.0x | 742 (38.0%) | 110,188 (2,368.6%) |
| 2.0x to 2.9x | 230 (11.8%) | 1,847 (39.7%) |
| 3.0x to 3.9x | 229 (11.7%) | 1,247 (26.8%) |
| 4.0x or more | 725 (37.2%) | 736 (15.8%) |
| Total | 1,951 (100.0%) | 4,652 (100.0%) |
Real Estate Taxes by Mortgage Status in Harker Heights
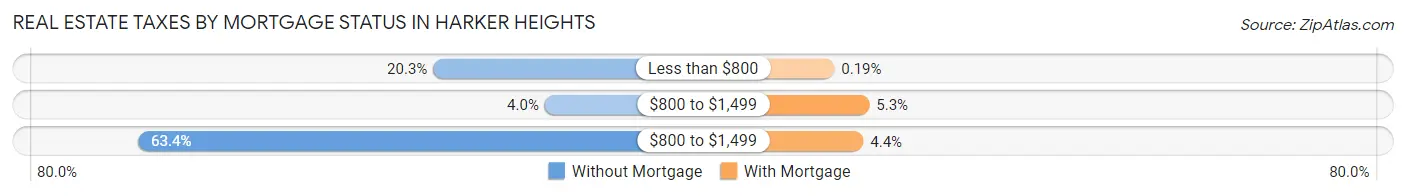
| Property Taxes | Without Mortgage | With Mortgage |
| Less than $800 | 396 (20.3%) | 9 (0.2%) |
| $800 to $1,499 | 78 (4.0%) | 247 (5.3%) |
| $800 to $1,499 | 1,237 (63.4%) | 206 (4.4%) |
| Total | 1,951 (100.0%) | 4,652 (100.0%) |
Health & Disability in Harker Heights
Health Insurance Coverage by Age in Harker Heights
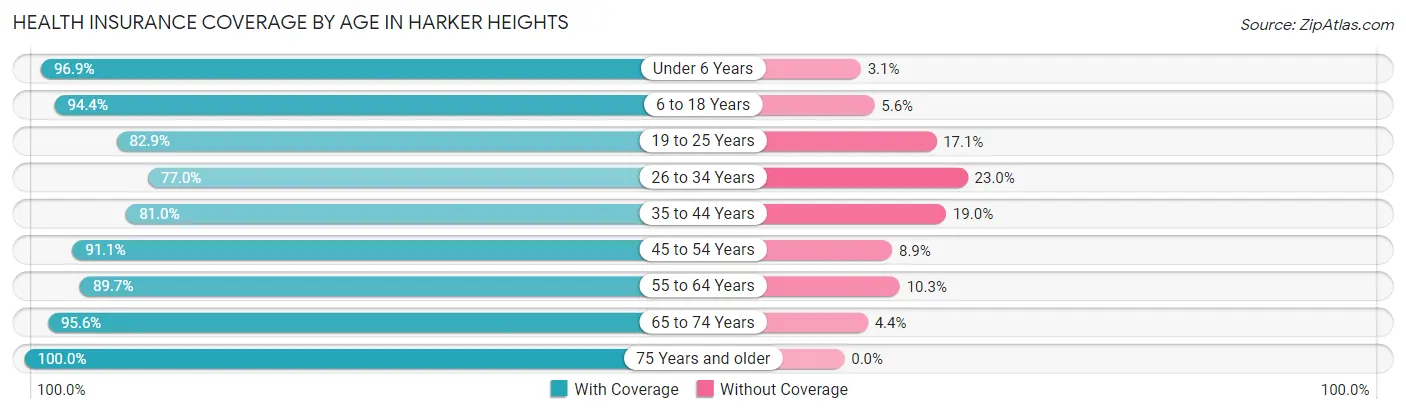
| Age Bracket | With Coverage | Without Coverage |
| Under 6 Years | 2,473 (96.9%) | 78 (3.1%) |
| 6 to 18 Years | 7,407 (94.4%) | 439 (5.6%) |
| 19 to 25 Years | 2,040 (82.9%) | 422 (17.1%) |
| 26 to 34 Years | 2,327 (77.0%) | 695 (23.0%) |
| 35 to 44 Years | 4,019 (81.0%) | 940 (19.0%) |
| 45 to 54 Years | 3,554 (91.1%) | 347 (8.9%) |
| 55 to 64 Years | 2,854 (89.7%) | 329 (10.3%) |
| 65 to 74 Years | 2,195 (95.6%) | 100 (4.4%) |
| 75 Years and older | 822 (100.0%) | 0 (0.0%) |
| Total | 27,691 (89.2%) | 3,350 (10.8%) |
Health Insurance Coverage by Citizenship Status in Harker Heights
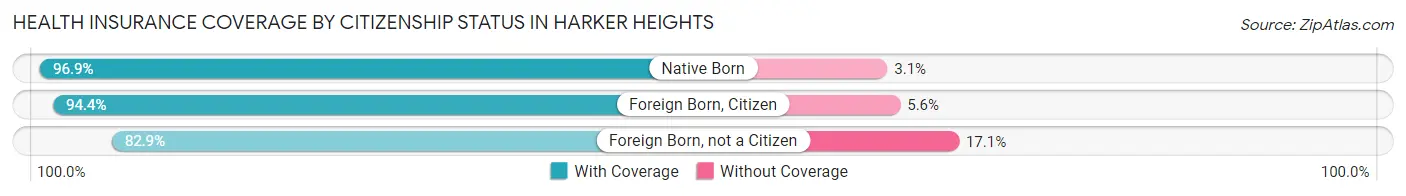
| Citizenship Status | With Coverage | Without Coverage |
| Native Born | 2,473 (96.9%) | 78 (3.1%) |
| Foreign Born, Citizen | 7,407 (94.4%) | 439 (5.6%) |
| Foreign Born, not a Citizen | 2,040 (82.9%) | 422 (17.1%) |
Health Insurance Coverage by Household Income in Harker Heights
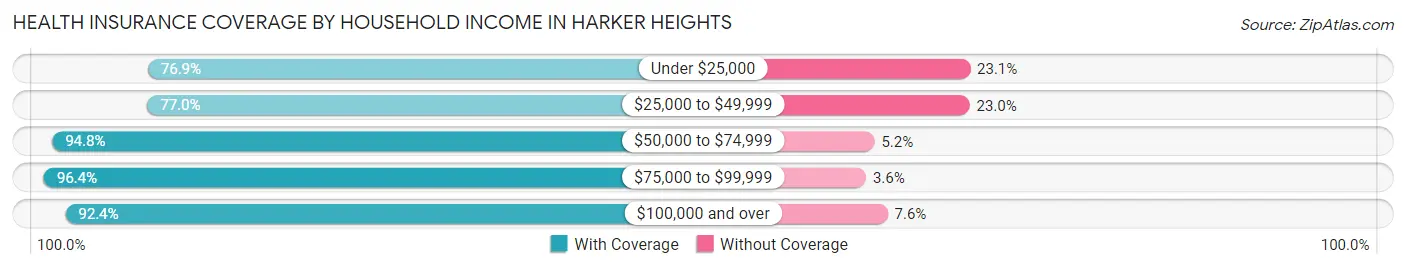
| Household Income | With Coverage | Without Coverage |
| Under $25,000 | 2,410 (76.9%) | 724 (23.1%) |
| $25,000 to $49,999 | 4,035 (77.0%) | 1,205 (23.0%) |
| $50,000 to $74,999 | 4,448 (94.8%) | 243 (5.2%) |
| $75,000 to $99,999 | 4,658 (96.4%) | 174 (3.6%) |
| $100,000 and over | 12,134 (92.4%) | 1,004 (7.6%) |
Public vs Private Health Insurance Coverage by Age in Harker Heights
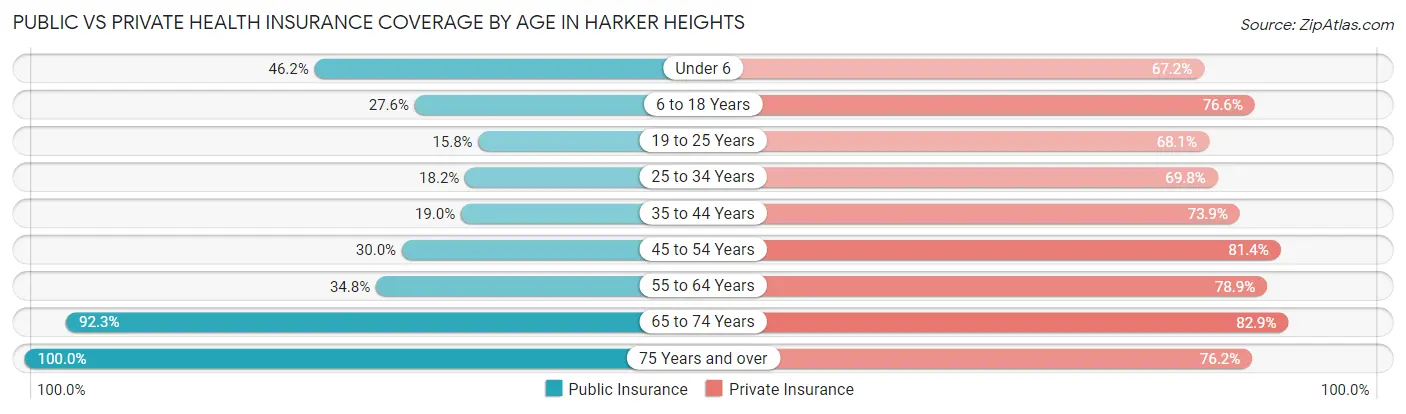
| Age Bracket | Public Insurance | Private Insurance |
| Under 6 | 1,178 (46.2%) | 1,715 (67.2%) |
| 6 to 18 Years | 2,163 (27.6%) | 6,013 (76.6%) |
| 19 to 25 Years | 388 (15.8%) | 1,677 (68.1%) |
| 25 to 34 Years | 551 (18.2%) | 2,108 (69.8%) |
| 35 to 44 Years | 942 (19.0%) | 3,663 (73.9%) |
| 45 to 54 Years | 1,169 (30.0%) | 3,177 (81.4%) |
| 55 to 64 Years | 1,107 (34.8%) | 2,512 (78.9%) |
| 65 to 74 Years | 2,118 (92.3%) | 1,902 (82.9%) |
| 75 Years and over | 822 (100.0%) | 626 (76.2%) |
| Total | 10,438 (33.6%) | 23,393 (75.4%) |
Disability Status by Sex by Age in Harker Heights
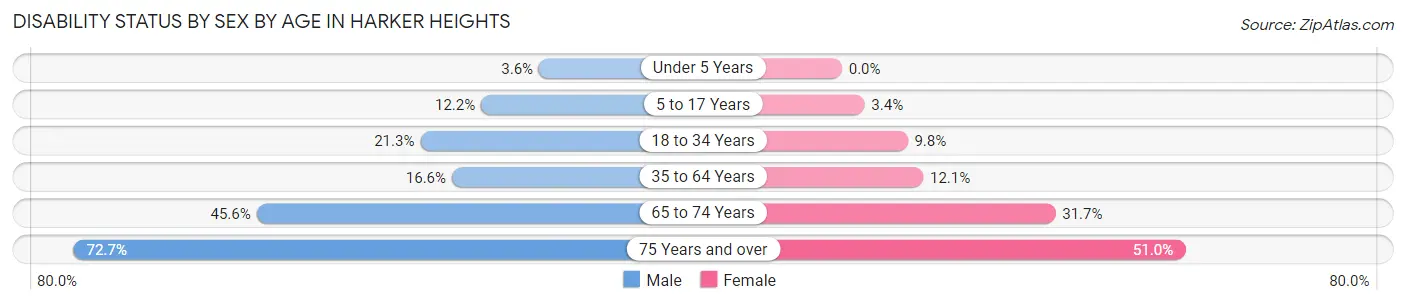
| Age Bracket | Male | Female |
| Under 5 Years | 34 (3.6%) | 0 (0.0%) |
| 5 to 17 Years | 532 (12.2%) | 120 (3.4%) |
| 18 to 34 Years | 559 (21.2%) | 333 (9.8%) |
| 35 to 64 Years | 923 (16.6%) | 781 (12.1%) |
| 65 to 74 Years | 488 (45.6%) | 388 (31.7%) |
| 75 Years and over | 184 (72.7%) | 290 (51.0%) |
Disability Class by Sex by Age in Harker Heights
Disability Class: Hearing Difficulty
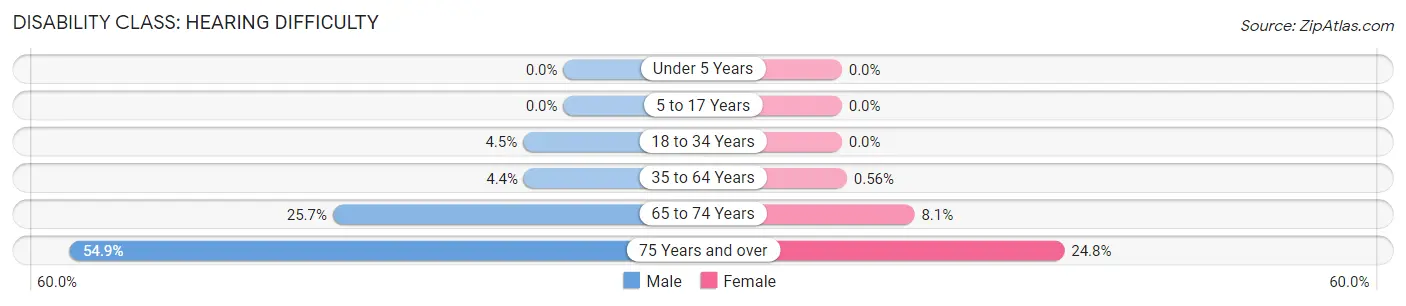
| Age Bracket | Male | Female |
| Under 5 Years | 0 (0.0%) | 0 (0.0%) |
| 5 to 17 Years | 0 (0.0%) | 0 (0.0%) |
| 18 to 34 Years | 118 (4.5%) | 0 (0.0%) |
| 35 to 64 Years | 245 (4.4%) | 36 (0.6%) |
| 65 to 74 Years | 275 (25.7%) | 99 (8.1%) |
| 75 Years and over | 139 (54.9%) | 141 (24.8%) |
Disability Class: Vision Difficulty
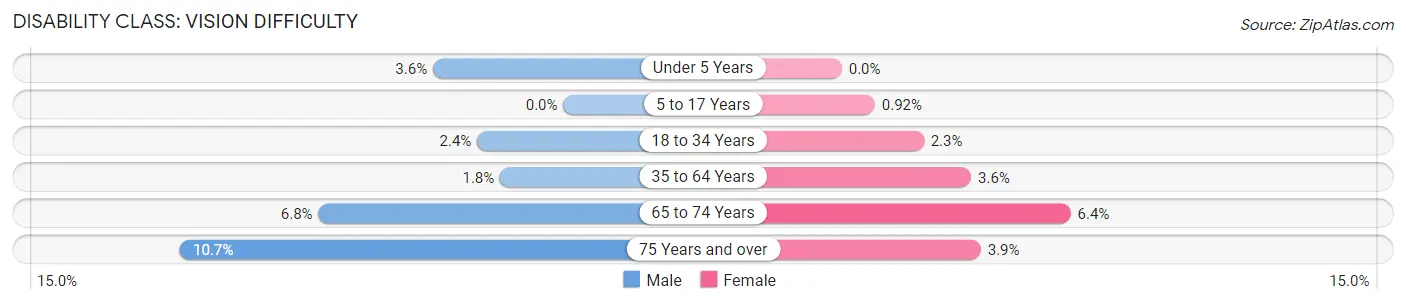
| Age Bracket | Male | Female |
| Under 5 Years | 34 (3.6%) | 0 (0.0%) |
| 5 to 17 Years | 0 (0.0%) | 33 (0.9%) |
| 18 to 34 Years | 63 (2.4%) | 78 (2.3%) |
| 35 to 64 Years | 98 (1.8%) | 233 (3.6%) |
| 65 to 74 Years | 73 (6.8%) | 78 (6.4%) |
| 75 Years and over | 27 (10.7%) | 22 (3.9%) |
Disability Class: Cognitive Difficulty
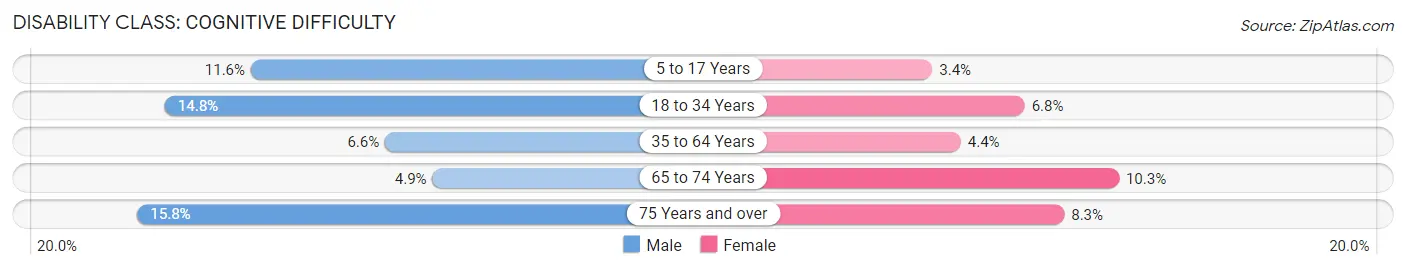
| Age Bracket | Male | Female |
| 5 to 17 Years | 505 (11.6%) | 120 (3.4%) |
| 18 to 34 Years | 389 (14.8%) | 232 (6.8%) |
| 35 to 64 Years | 369 (6.6%) | 286 (4.4%) |
| 65 to 74 Years | 52 (4.9%) | 126 (10.3%) |
| 75 Years and over | 40 (15.8%) | 47 (8.3%) |
Disability Class: Ambulatory Difficulty
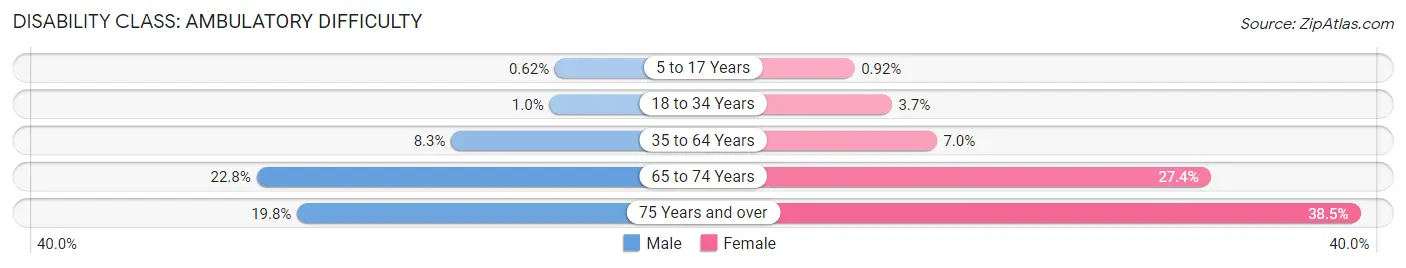
| Age Bracket | Male | Female |
| 5 to 17 Years | 27 (0.6%) | 33 (0.9%) |
| 18 to 34 Years | 27 (1.0%) | 126 (3.7%) |
| 35 to 64 Years | 464 (8.3%) | 455 (7.0%) |
| 65 to 74 Years | 244 (22.8%) | 335 (27.4%) |
| 75 Years and over | 50 (19.8%) | 219 (38.5%) |
Disability Class: Self-Care Difficulty
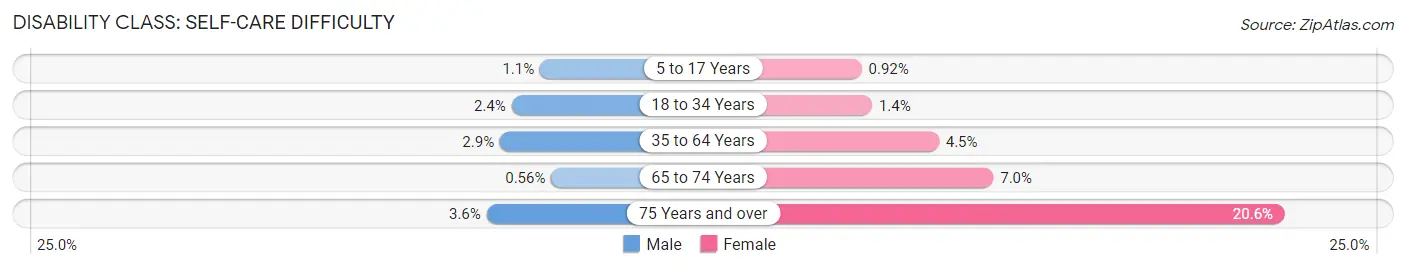
| Age Bracket | Male | Female |
| 5 to 17 Years | 47 (1.1%) | 33 (0.9%) |
| 18 to 34 Years | 63 (2.4%) | 48 (1.4%) |
| 35 to 64 Years | 164 (2.9%) | 291 (4.5%) |
| 65 to 74 Years | 6 (0.6%) | 86 (7.0%) |
| 75 Years and over | 9 (3.6%) | 117 (20.6%) |
Technology Access in Harker Heights
Computing Device Access in Harker Heights
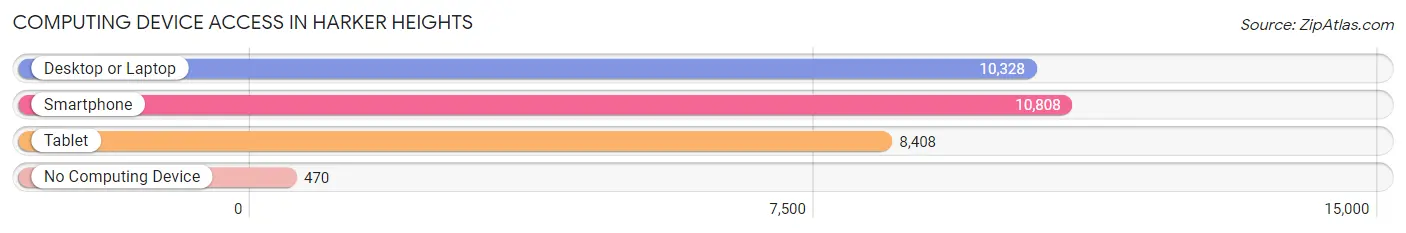
| Device Type | # Households | % Households |
| Desktop or Laptop | 10,328 | 87.7% |
| Smartphone | 10,808 | 91.8% |
| Tablet | 8,408 | 71.4% |
| No Computing Device | 470 | 4.0% |
| Total | 11,779 | 100.0% |
Internet Access in Harker Heights
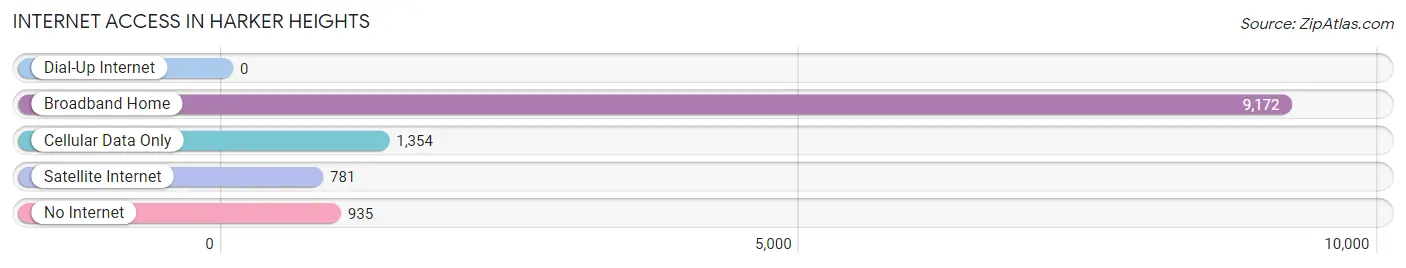
| Internet Type | # Households | % Households |
| Dial-Up Internet | 0 | 0.0% |
| Broadband Home | 9,172 | 77.9% |
| Cellular Data Only | 1,354 | 11.5% |
| Satellite Internet | 781 | 6.6% |
| No Internet | 935 | 7.9% |
| Total | 11,779 | 100.0% |
Harker Heights Summary
Harker Heights is a city located in Bell County, Texas, United States. The city is part of the Killeen–Temple–Fort Hood Metropolitan Statistical Area. As of the 2010 census, the city population was 26,700, and the estimated population in 2018 was 33,811.
History
Harker Heights was founded in 1960 by the Harker family, who owned a large ranch in the area. The city was named after the family, and the first mayor was John Harker. The city was incorporated in 1960, and the first city council meeting was held in 1961.
The city grew rapidly in the 1970s and 1980s, due to the growth of nearby Fort Hood. The city was officially recognized as a city in 1983.
Geography
Harker Heights is located in Bell County, Texas, at the intersection of Interstate 14 and US Highway 190. The city is located about 20 miles north of Killeen and about 25 miles south of Temple. The city is located in the Central Texas region, and is part of the Killeen–Temple–Fort Hood Metropolitan Statistical Area.
The city has a total area of 16.2 square miles, of which 16.1 square miles is land and 0.1 square miles is water. The city is located in the Central Texas region, and is part of the Killeen–Temple–Fort Hood Metropolitan Statistical Area.
Economy
Harker Heights is a major economic center in Central Texas. The city is home to several large employers, including the Fort Hood military base, Seton Medical Center Harker Heights, and the Harker Heights Independent School District. The city also has a large retail sector, with several shopping centers and restaurants.
The city's economy is also supported by a number of small businesses, including professional services, retail stores, and restaurants.
Demographics
As of the 2010 census, the city had a population of 26,700. The racial makeup of the city was 68.2% White, 16.3% African American, 0.7% Native American, 5.2% Asian, 0.1% Pacific Islander, 5.2% from other races, and 4.3% from two or more races. Hispanic or Latino of any race were 16.3% of the population.
The median income for a household in the city was $50,945, and the median income for a family was $60,945. The per capita income for the city was $22,945. About 8.2% of families and 10.2% of the population were below the poverty line, including 14.2% of those under age 18 and 6.2% of those age 65 or over.
Conclusion
Harker Heights is a city located in Bell County, Texas, United States. The city is part of the Killeen–Temple–Fort Hood Metropolitan Statistical Area. As of the 2010 census, the city population was 26,700, and the estimated population in 2018 was 33,811. The city was founded in 1960 by the Harker family, and has grown rapidly due to the growth of nearby Fort Hood. The city has a total area of 16.2 square miles, and is a major economic center in Central Texas. The city is home to several large employers, including the Fort Hood military base, Seton Medical Center Harker Heights, and the Harker Heights Independent School District. The city also has a large retail sector, with several shopping centers and restaurants. The racial makeup of the city was 68.2% White, 16.3% African American, 0.7% Native American, 5.2% Asian, 0.1% Pacific Islander, 5.2% from other races, and 4.3% from two or more races. The median income for a household in the city was $50,945, and the median income for a family was $60,945. The per capita income for the city was $22,945. About 8.2% of families and 10.2% of the population were below the poverty line.
Common Questions
What is Per Capita Income in Harker Heights?
Per Capita income in Harker Heights is $34,203.
What is the Median Family Income in Harker Heights?
Median Family Income in Harker Heights is $86,911.
What is the Median Household income in Harker Heights?
Median Household Income in Harker Heights is $72,258.
What is Income or Wage Gap in Harker Heights?
Income or Wage Gap in Harker Heights is 48.6%.
Women in Harker Heights earn 51.4 cents for every dollar earned by a man.
What is Inequality or Gini Index in Harker Heights?
Inequality or Gini Index in Harker Heights is 0.41.
What is the Total Population of Harker Heights?
Total Population of Harker Heights is 33,036.
What is the Total Male Population of Harker Heights?
Total Male Population of Harker Heights is 16,449.
What is the Total Female Population of Harker Heights?
Total Female Population of Harker Heights is 16,587.
What is the Ratio of Males per 100 Females in Harker Heights?
There are 99.17 Males per 100 Females in Harker Heights.
What is the Ratio of Females per 100 Males in Harker Heights?
There are 100.84 Females per 100 Males in Harker Heights.
What is the Median Population Age in Harker Heights?
Median Population Age in Harker Heights is 34.5 Years.
What is the Average Family Size in Harker Heights
Average Family Size in Harker Heights is 3.3 People.
What is the Average Household Size in Harker Heights
Average Household Size in Harker Heights is 2.8 People.
How Large is the Labor Force in Harker Heights?
There are 16,619 People in the Labor Forcein in Harker Heights.
What is the Percentage of People in the Labor Force in Harker Heights?
67.8% of People are in the Labor Force in Harker Heights.
What is the Unemployment Rate in Harker Heights?
Unemployment Rate in Harker Heights is 4.7%.