Harrison, OH Map & Demographics
Harrison Map
Harrison Overview
$41,287
PER CAPITA INCOME
$112,050
AVG FAMILY INCOME
$99,871
AVG HOUSEHOLD INCOME
30.4%
WAGE / INCOME GAP [ % ]
69.6¢/ $1
WAGE / INCOME GAP [ $ ]
0.36
INEQUALITY / GINI INDEX
13,086
TOTAL POPULATION
6,322
MALE POPULATION
6,764
FEMALE POPULATION
93.47
MALES / 100 FEMALES
106.99
FEMALES / 100 MALES
36.9
MEDIAN AGE
3.1
AVG FAMILY SIZE
2.6
AVG HOUSEHOLD SIZE
7,663
LABOR FORCE [ PEOPLE ]
77.8%
PERCENT IN LABOR FORCE
0.9%
UNEMPLOYMENT RATE
Harrison Zip Codes
Harrison Area Codes
Income in Harrison
Income Overview in Harrison
Per Capita Income in Harrison is $41,287, while median incomes of families and households are $112,050 and $99,871 respectively.
| Characteristic | Number | Measure |
| Per Capita Income | 13,086 | $41,287 |
| Median Family Income | 3,545 | $112,050 |
| Mean Family Income | 3,545 | $129,321 |
| Median Household Income | 4,929 | $99,871 |
| Mean Household Income | 4,929 | $108,941 |
| Income Deficit | 3,545 | $0 |
| Wage / Income Gap (%) | 13,086 | 30.41% |
| Wage / Income Gap ($) | 13,086 | 69.59¢ per $1 |
| Gini / Inequality Index | 13,086 | 0.36 |
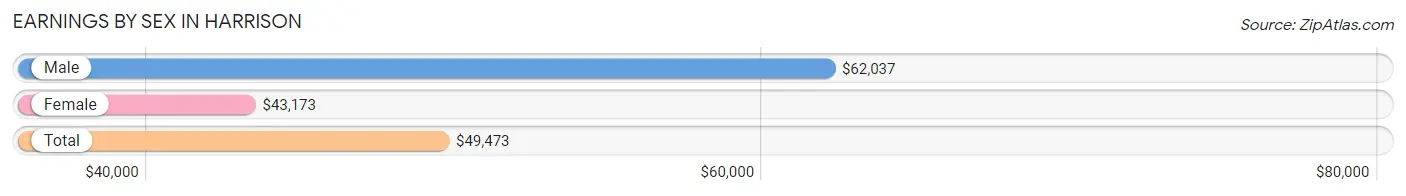
Earnings by Sex in Harrison
Average Earnings in Harrison are $49,473, $62,037 for men and $43,173 for women, a difference of 30.4%.
| Sex | Number | Average Earnings |
| Male | 4,068 (52.6%) | $62,037 |
| Female | 3,670 (47.4%) | $43,173 |
| Total | 7,738 (100.0%) | $49,473 |
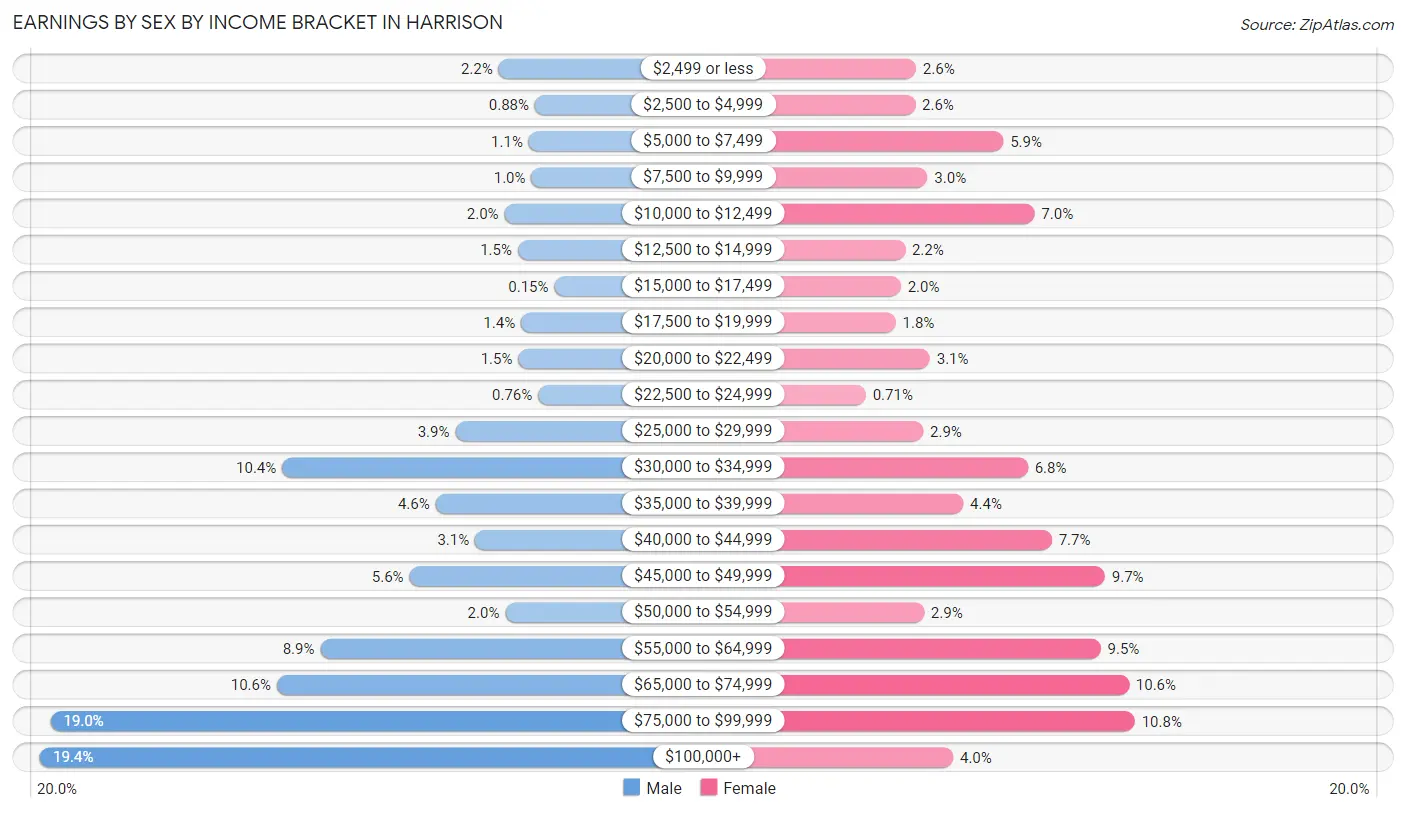
Earnings by Sex by Income Bracket in Harrison
The most common earnings brackets in Harrison are $100,000+ for men (790 | 19.4%) and $75,000 to $99,999 for women (396 | 10.8%).
| Income | Male | Female |
| $2,499 or less | 91 (2.2%) | 95 (2.6%) |
| $2,500 to $4,999 | 36 (0.9%) | 94 (2.6%) |
| $5,000 to $7,499 | 45 (1.1%) | 215 (5.9%) |
| $7,500 to $9,999 | 41 (1.0%) | 111 (3.0%) |
| $10,000 to $12,499 | 82 (2.0%) | 258 (7.0%) |
| $12,500 to $14,999 | 62 (1.5%) | 80 (2.2%) |
| $15,000 to $17,499 | 6 (0.2%) | 74 (2.0%) |
| $17,500 to $19,999 | 57 (1.4%) | 67 (1.8%) |
| $20,000 to $22,499 | 61 (1.5%) | 114 (3.1%) |
| $22,500 to $24,999 | 31 (0.8%) | 26 (0.7%) |
| $25,000 to $29,999 | 157 (3.9%) | 105 (2.9%) |
| $30,000 to $34,999 | 421 (10.3%) | 249 (6.8%) |
| $35,000 to $39,999 | 187 (4.6%) | 160 (4.4%) |
| $40,000 to $44,999 | 127 (3.1%) | 282 (7.7%) |
| $45,000 to $49,999 | 227 (5.6%) | 355 (9.7%) |
| $50,000 to $54,999 | 81 (2.0%) | 106 (2.9%) |
| $55,000 to $64,999 | 363 (8.9%) | 349 (9.5%) |
| $65,000 to $74,999 | 429 (10.5%) | 388 (10.6%) |
| $75,000 to $99,999 | 774 (19.0%) | 396 (10.8%) |
| $100,000+ | 790 (19.4%) | 146 (4.0%) |
| Total | 4,068 (100.0%) | 3,670 (100.0%) |
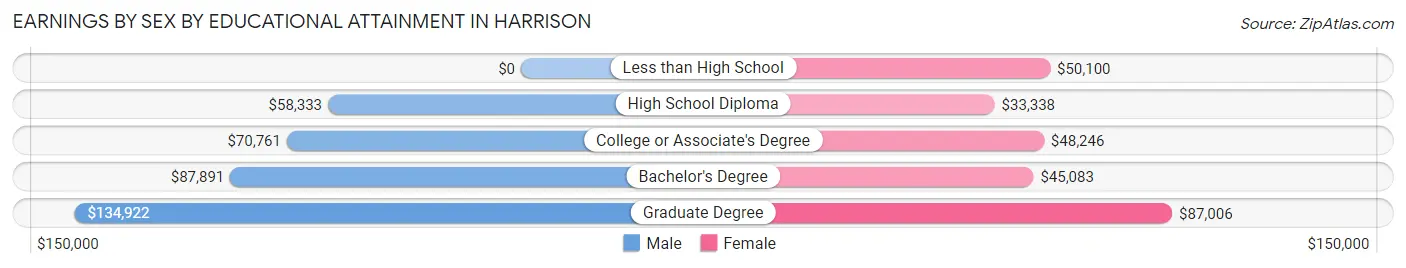
Earnings by Sex by Educational Attainment in Harrison
Average earnings in Harrison are $68,914 for men and $45,399 for women, a difference of 34.1%. Men with an educational attainment of graduate degree enjoy the highest average annual earnings of $134,922, while those with high school diploma education earn the least with $58,333. Women with an educational attainment of graduate degree earn the most with the average annual earnings of $87,006, while those with high school diploma education have the smallest earnings of $33,338.
| Educational Attainment | Male Income | Female Income |
| Less than High School | - | - |
| High School Diploma | $58,333 | $33,338 |
| College or Associate's Degree | $70,761 | $48,246 |
| Bachelor's Degree | $87,891 | $45,083 |
| Graduate Degree | $134,922 | $87,006 |
| Total | $68,914 | $45,399 |
Family Income in Harrison
Family Income Brackets in Harrison
According to the Harrison family income data, there are 918 families falling into the $100,000 to $149,999 income range, which is the most common income bracket and makes up 25.9% of all families.
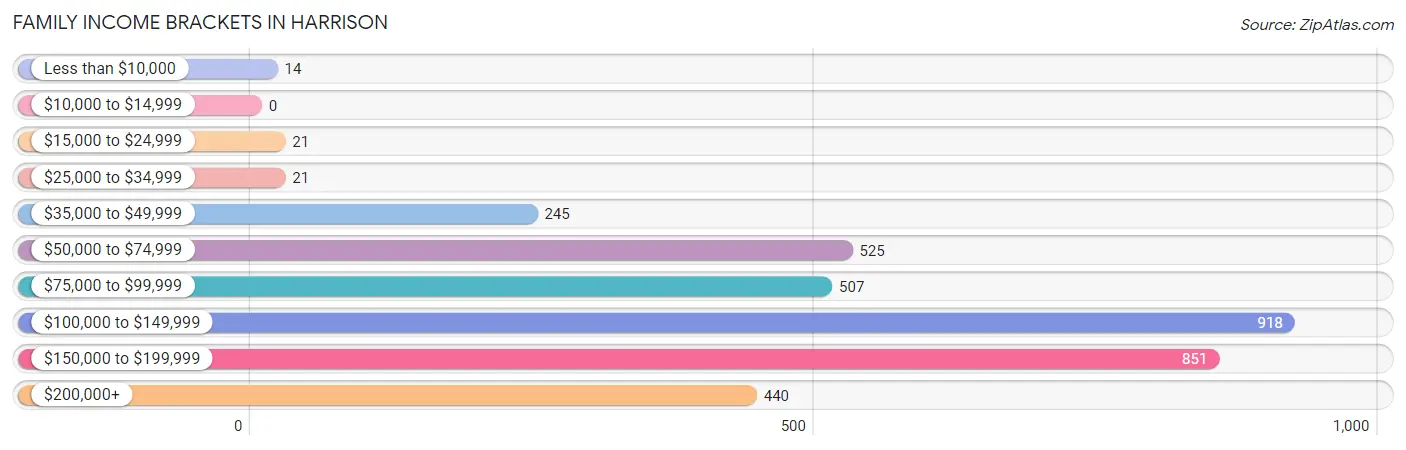
| Income Bracket | # Families | % Families |
| Less than $10,000 | 14 | 0.4% |
| $10,000 to $14,999 | 0 | 0.0% |
| $15,000 to $24,999 | 21 | 0.6% |
| $25,000 to $34,999 | 21 | 0.6% |
| $35,000 to $49,999 | 245 | 6.9% |
| $50,000 to $74,999 | 525 | 14.8% |
| $75,000 to $99,999 | 507 | 14.3% |
| $100,000 to $149,999 | 918 | 25.9% |
| $150,000 to $199,999 | 851 | 24.0% |
| $200,000+ | 440 | 12.4% |
Family Income by Famaliy Size in Harrison
5-person families (415 | 11.7%) account for the highest median family income in Harrison with $162,132 per family, while 2-person families (1,462 | 41.2%) have the highest median income of $46,768 per family member.
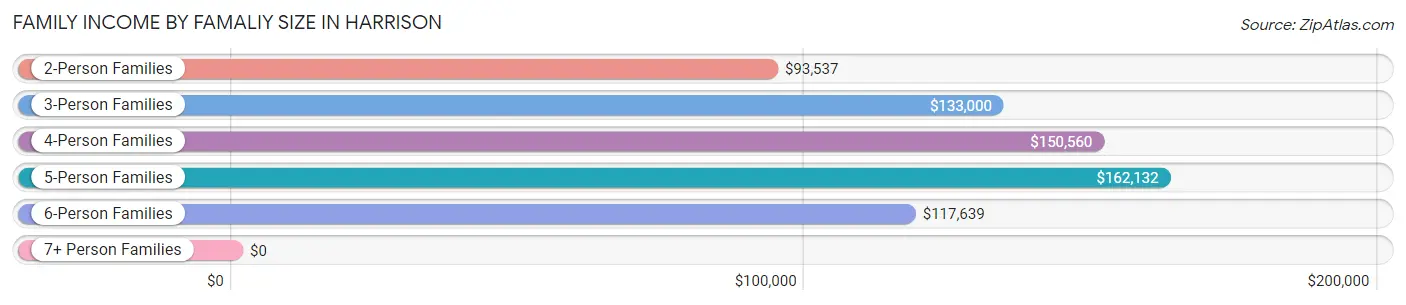
| Income Bracket | # Families | Median Income |
| 2-Person Families | 1,462 (41.2%) | $93,537 |
| 3-Person Families | 852 (24.0%) | $133,000 |
| 4-Person Families | 675 (19.0%) | $150,560 |
| 5-Person Families | 415 (11.7%) | $162,132 |
| 6-Person Families | 141 (4.0%) | $117,639 |
| 7+ Person Families | 0 (0.0%) | $0 |
| Total | 3,545 (100.0%) | $112,050 |
Family Income by Number of Earners in Harrison
The median family income in Harrison is $112,050, with families comprising 3+ earners (577) having the highest median family income of $160,089, while families with no earners (347) have the lowest median family income of $51,875, accounting for 16.3% and 9.8% of families, respectively.
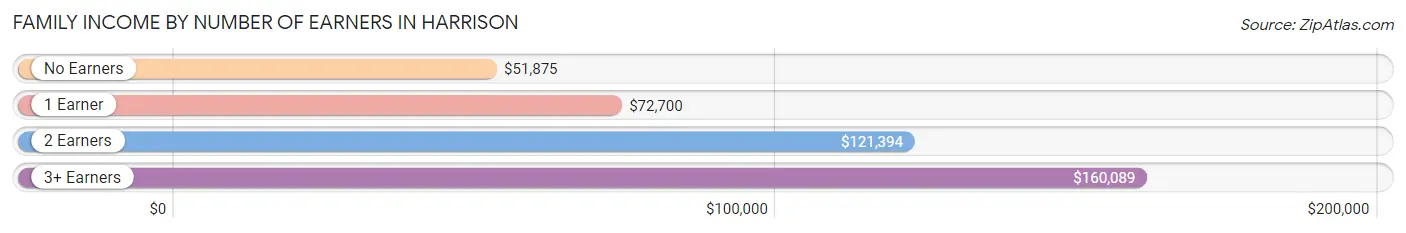
| Number of Earners | # Families | Median Income |
| No Earners | 347 (9.8%) | $51,875 |
| 1 Earner | 636 (17.9%) | $72,700 |
| 2 Earners | 1,985 (56.0%) | $121,394 |
| 3+ Earners | 577 (16.3%) | $160,089 |
| Total | 3,545 (100.0%) | $112,050 |
Household Income in Harrison
Household Income Brackets in Harrison
With 1,109 households falling in the category, the $100,000 to $149,999 income range is the most frequent in Harrison, accounting for 22.5% of all households. In contrast, only 128 households (2.6%) fall into the less than $10,000 income bracket, making it the least populous group.
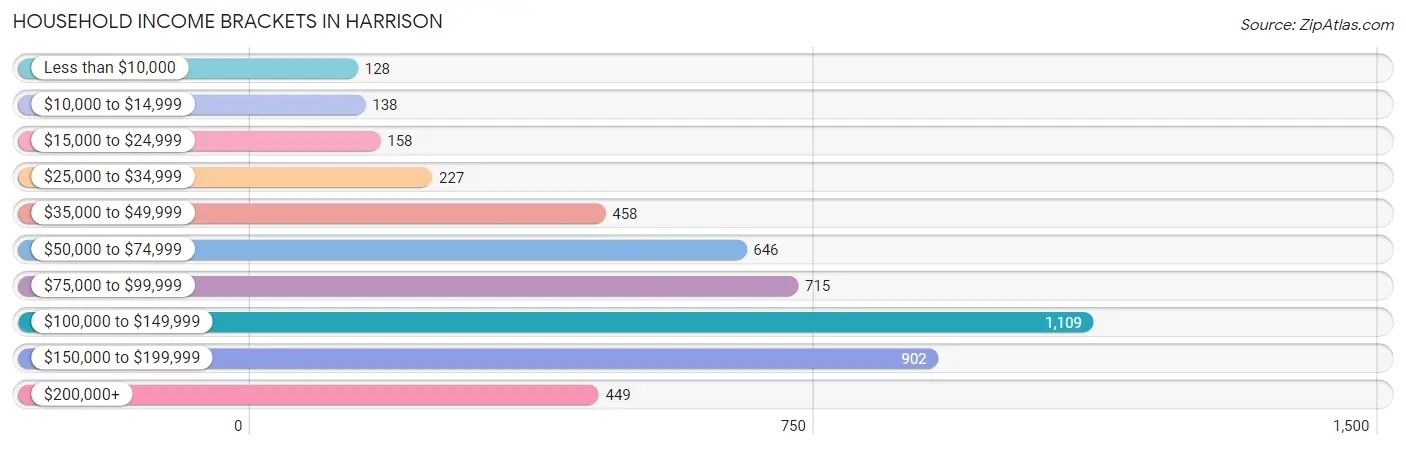
| Income Bracket | # Households | % Households |
| Less than $10,000 | 128 | 2.6% |
| $10,000 to $14,999 | 138 | 2.8% |
| $15,000 to $24,999 | 158 | 3.2% |
| $25,000 to $34,999 | 227 | 4.6% |
| $35,000 to $49,999 | 458 | 9.3% |
| $50,000 to $74,999 | 646 | 13.1% |
| $75,000 to $99,999 | 715 | 14.5% |
| $100,000 to $149,999 | 1,109 | 22.5% |
| $150,000 to $199,999 | 902 | 18.3% |
| $200,000+ | 449 | 9.1% |
Household Income by Householder Age in Harrison
The median household income in Harrison is $99,871, with the highest median household income of $122,760 found in the 45 to 64 years age bracket for the primary householder. A total of 1,511 households (30.7%) fall into this category. Meanwhile, the 15 to 24 years age bracket for the primary householder has the lowest median household income of $33,798, with 157 households (3.2%) in this group.
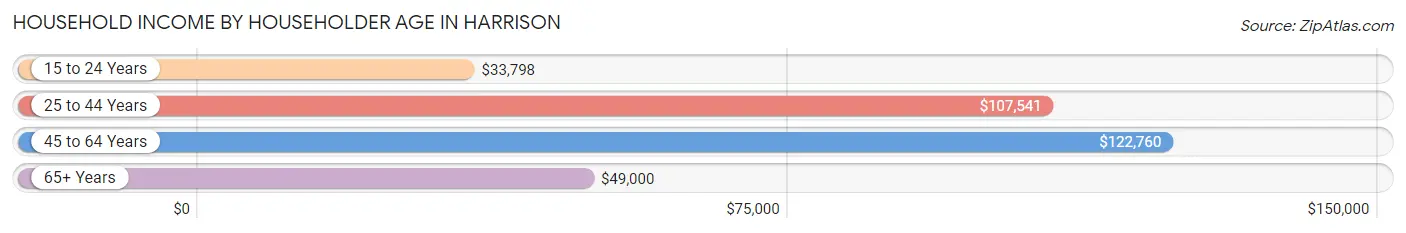
| Income Bracket | # Households | Median Income |
| 15 to 24 Years | 157 (3.2%) | $33,798 |
| 25 to 44 Years | 1,981 (40.2%) | $107,541 |
| 45 to 64 Years | 1,511 (30.7%) | $122,760 |
| 65+ Years | 1,280 (26.0%) | $49,000 |
| Total | 4,929 (100.0%) | $99,871 |
Poverty in Harrison
Income Below Poverty by Sex and Age in Harrison
With 1.5% poverty level for males and 4.5% for females among the residents of Harrison, 25 to 34 year old males and 65 to 74 year old females are the most vulnerable to poverty, with 54 males (5.1%) and 171 females (22.8%) in their respective age groups living below the poverty level.
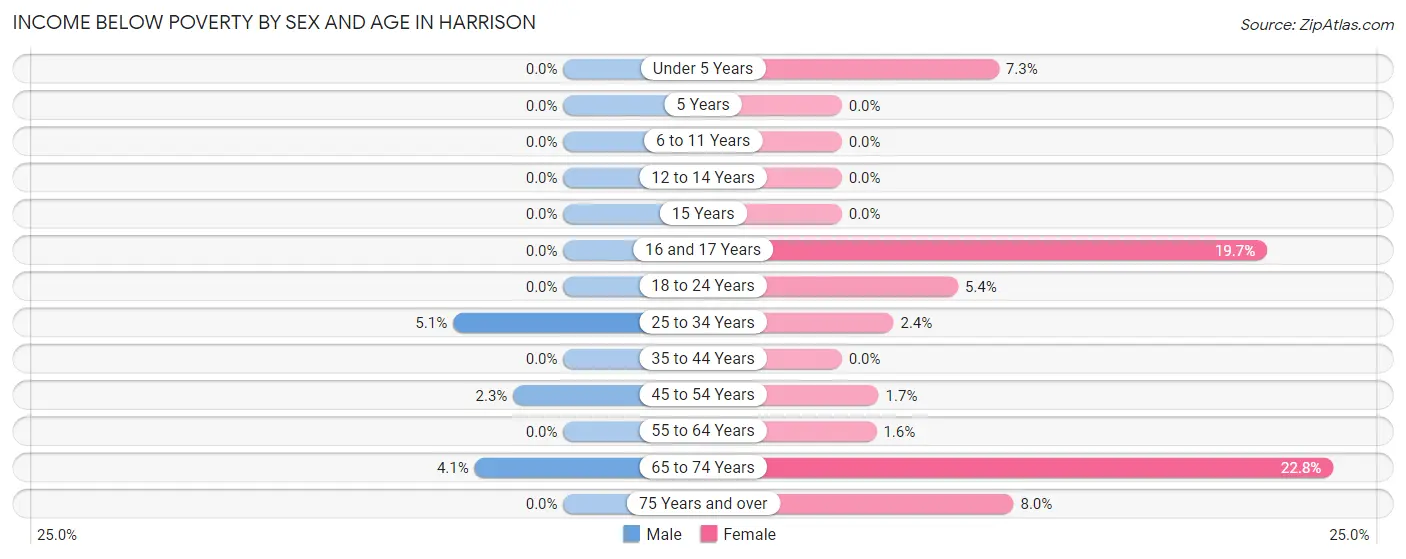
| Age Bracket | Male | Female |
| Under 5 Years | 0 (0.0%) | 18 (7.3%) |
| 5 Years | 0 (0.0%) | 0 (0.0%) |
| 6 to 11 Years | 0 (0.0%) | 0 (0.0%) |
| 12 to 14 Years | 0 (0.0%) | 0 (0.0%) |
| 15 Years | 0 (0.0%) | 0 (0.0%) |
| 16 and 17 Years | 0 (0.0%) | 29 (19.7%) |
| 18 to 24 Years | 0 (0.0%) | 13 (5.4%) |
| 25 to 34 Years | 54 (5.1%) | 22 (2.4%) |
| 35 to 44 Years | 0 (0.0%) | 0 (0.0%) |
| 45 to 54 Years | 20 (2.3%) | 14 (1.7%) |
| 55 to 64 Years | 0 (0.0%) | 12 (1.6%) |
| 65 to 74 Years | 18 (4.1%) | 171 (22.8%) |
| 75 Years and over | 0 (0.0%) | 24 (8.0%) |
| Total | 92 (1.5%) | 303 (4.5%) |
Income Above Poverty by Sex and Age in Harrison
According to the poverty statistics in Harrison, males aged under 5 years and females aged 5 years are the age groups that are most secure financially, with 100.0% of males and 100.0% of females in these age groups living above the poverty line.
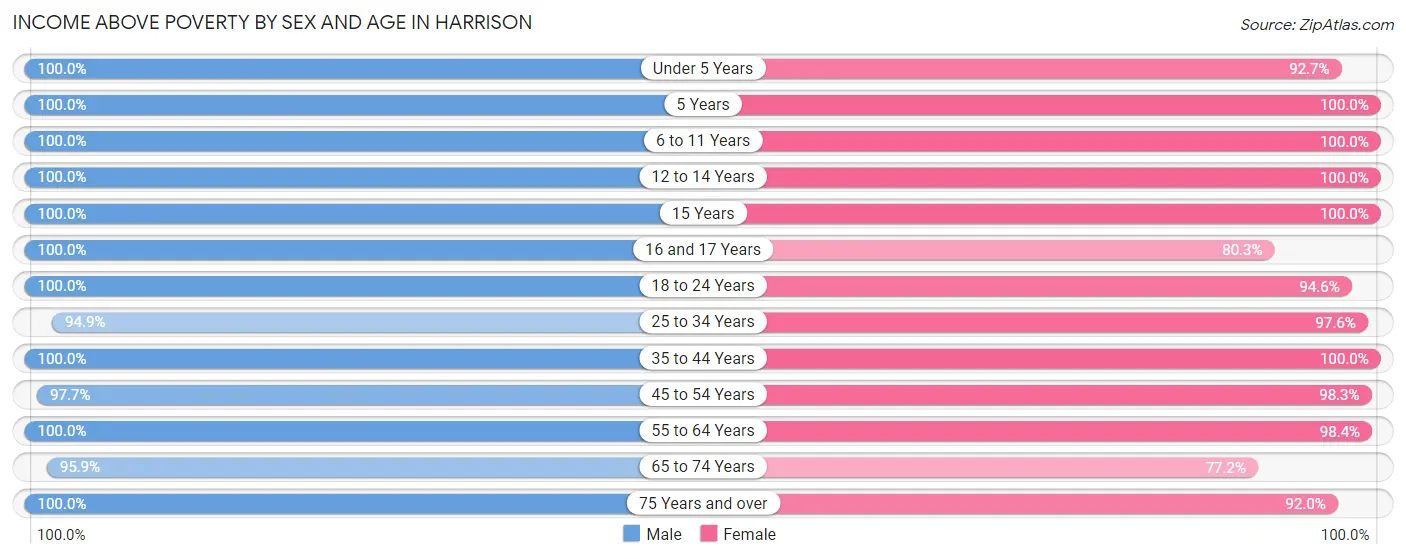
| Age Bracket | Male | Female |
| Under 5 Years | 438 (100.0%) | 229 (92.7%) |
| 5 Years | 135 (100.0%) | 78 (100.0%) |
| 6 to 11 Years | 640 (100.0%) | 789 (100.0%) |
| 12 to 14 Years | 184 (100.0%) | 480 (100.0%) |
| 15 Years | 84 (100.0%) | 56 (100.0%) |
| 16 and 17 Years | 102 (100.0%) | 118 (80.3%) |
| 18 to 24 Years | 499 (100.0%) | 228 (94.6%) |
| 25 to 34 Years | 1,001 (94.9%) | 893 (97.6%) |
| 35 to 44 Years | 1,064 (100.0%) | 1,128 (100.0%) |
| 45 to 54 Years | 840 (97.7%) | 806 (98.3%) |
| 55 to 64 Years | 473 (100.0%) | 735 (98.4%) |
| 65 to 74 Years | 419 (95.9%) | 579 (77.2%) |
| 75 Years and over | 310 (100.0%) | 277 (92.0%) |
| Total | 6,189 (98.5%) | 6,396 (95.5%) |
Income Below Poverty Among Married-Couple Families in Harrison
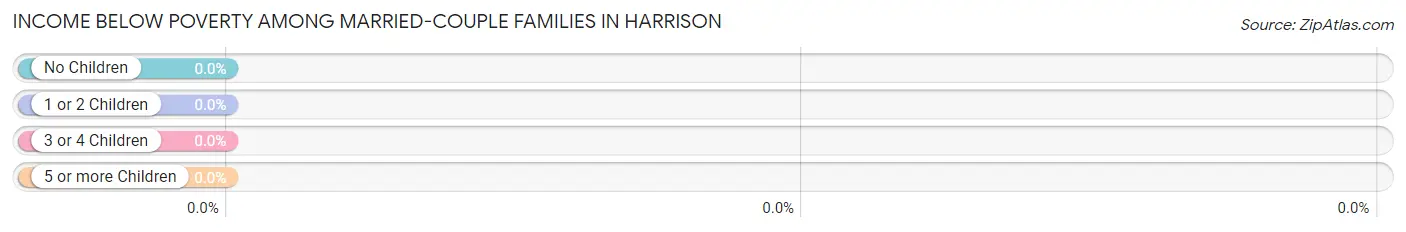
| Children | Above Poverty | Below Poverty |
| No Children | 1,600 (100.0%) | 0 (0.0%) |
| 1 or 2 Children | 966 (100.0%) | 0 (0.0%) |
| 3 or 4 Children | 389 (100.0%) | 0 (0.0%) |
| 5 or more Children | 0 (0.0%) | 0 (0.0%) |
| Total | 2,955 (100.0%) | 0 (0.0%) |
Income Below Poverty Among Single-Parent Households in Harrison
According to the poverty data in Harrison, 3.4% or 5 single-father households and 2.9% or 13 single-mother households are living below the poverty line. Among single-father households, those with no children have the highest poverty rate, with 5 households (4.8%) experiencing poverty. Likewise, among single-mother households, those with 1 or 2 children have the highest poverty rate, with 13 households (4.8%) falling below the poverty line.
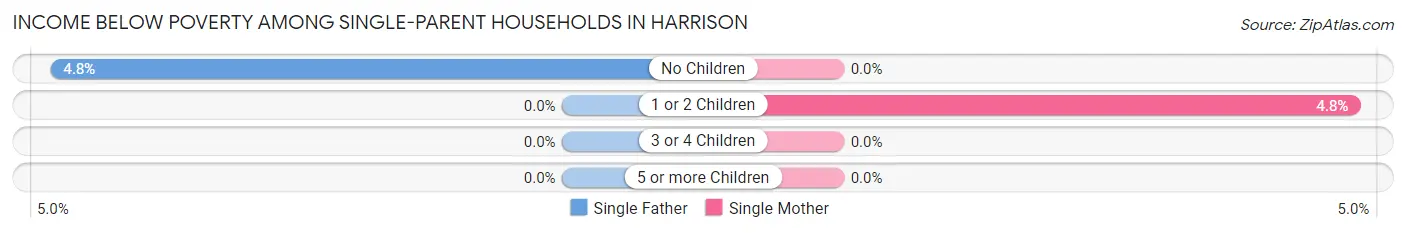
| Children | Single Father | Single Mother |
| No Children | 5 (4.8%) | 0 (0.0%) |
| 1 or 2 Children | 0 (0.0%) | 13 (4.8%) |
| 3 or 4 Children | 0 (0.0%) | 0 (0.0%) |
| 5 or more Children | 0 (0.0%) | 0 (0.0%) |
| Total | 5 (3.4%) | 13 (2.9%) |
Income Below Poverty Among Married-Couple vs Single-Parent Households in Harrison
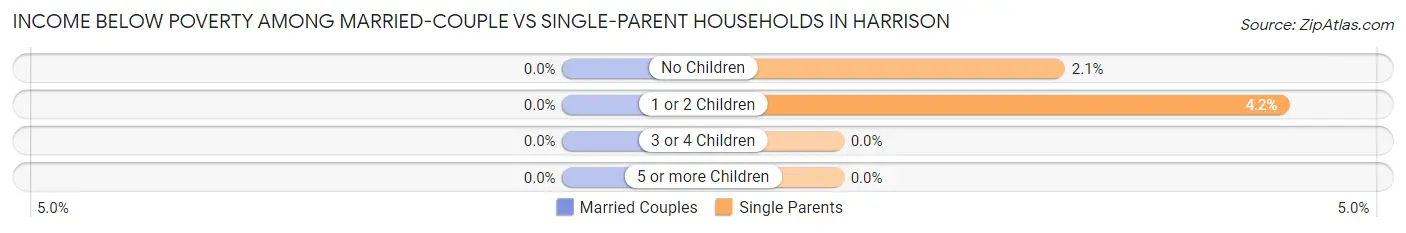
| Children | Married-Couple Families | Single-Parent Households |
| No Children | 0 (0.0%) | 5 (2.1%) |
| 1 or 2 Children | 0 (0.0%) | 13 (4.2%) |
| 3 or 4 Children | 0 (0.0%) | 0 (0.0%) |
| 5 or more Children | 0 (0.0%) | 0 (0.0%) |
| Total | 0 (0.0%) | 18 (3.0%) |
Race in Harrison
The most populous races in Harrison are White / Caucasian (12,343 | 94.3%), Two or more Races (516 | 3.9%), and Hispanic or Latino (223 | 1.7%).
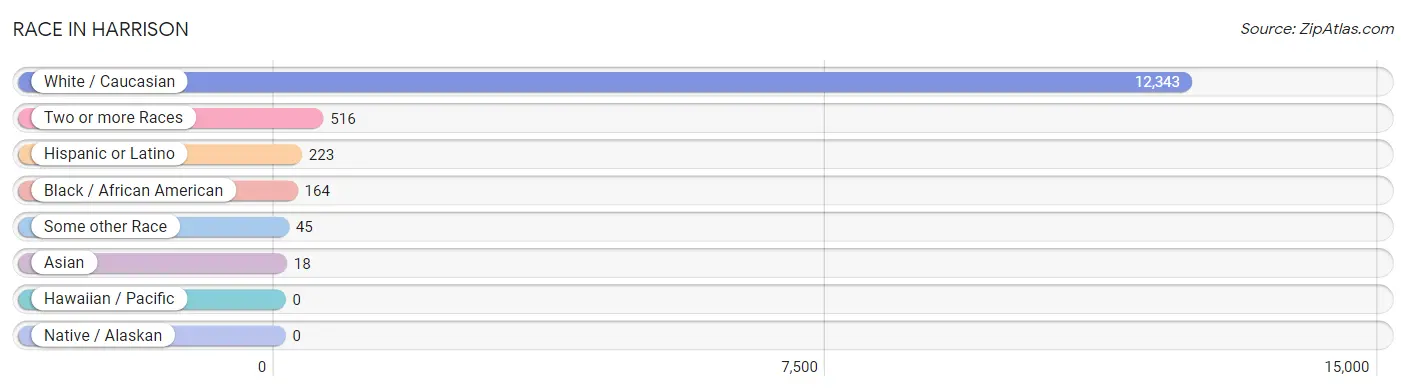
| Race | # Population | % Population |
| Asian | 18 | 0.1% |
| Black / African American | 164 | 1.3% |
| Hawaiian / Pacific | 0 | 0.0% |
| Hispanic or Latino | 223 | 1.7% |
| Native / Alaskan | 0 | 0.0% |
| White / Caucasian | 12,343 | 94.3% |
| Two or more Races | 516 | 3.9% |
| Some other Race | 45 | 0.3% |
| Total | 13,086 | 100.0% |
Ancestry in Harrison
The most populous ancestries reported in Harrison are German (5,365 | 41.0%), Irish (1,883 | 14.4%), English (1,219 | 9.3%), American (796 | 6.1%), and Italian (565 | 4.3%), together accounting for 75.1% of all Harrison residents.
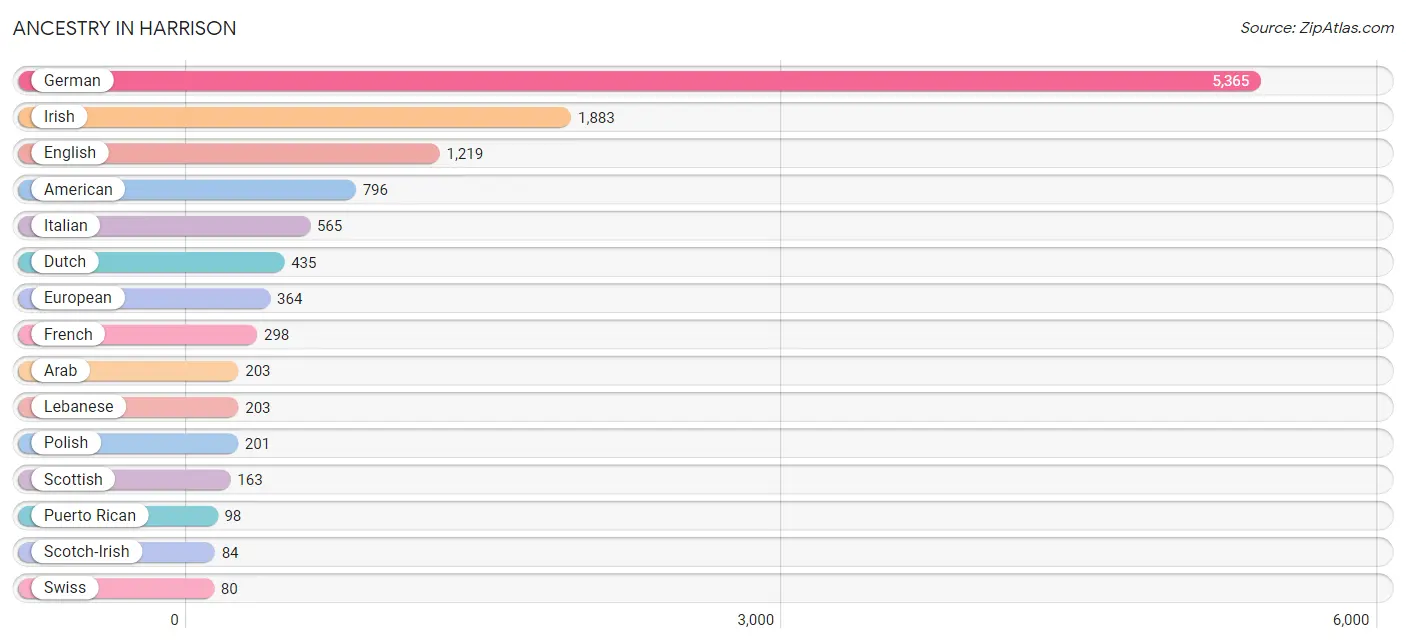
| Ancestry | # Population | % Population |
| American | 796 | 6.1% |
| Arab | 203 | 1.5% |
| Bhutanese | 26 | 0.2% |
| Blackfeet | 4 | 0.0% |
| Brazilian | 35 | 0.3% |
| British | 76 | 0.6% |
| Burmese | 14 | 0.1% |
| Central American | 39 | 0.3% |
| Croatian | 14 | 0.1% |
| Cuban | 8 | 0.1% |
| Czech | 44 | 0.3% |
| Dutch | 435 | 3.3% |
| Eastern European | 63 | 0.5% |
| Ecuadorian | 57 | 0.4% |
| English | 1,219 | 9.3% |
| European | 364 | 2.8% |
| French | 298 | 2.3% |
| German | 5,365 | 41.0% |
| Greek | 4 | 0.0% |
| Hungarian | 31 | 0.2% |
| Indian (Asian) | 25 | 0.2% |
| Irish | 1,883 | 14.4% |
| Italian | 565 | 4.3% |
| Lebanese | 203 | 1.5% |
| Mexican | 7 | 0.1% |
| Nicaraguan | 26 | 0.2% |
| Polish | 201 | 1.5% |
| Puerto Rican | 98 | 0.7% |
| Salvadoran | 13 | 0.1% |
| Scandinavian | 23 | 0.2% |
| Scotch-Irish | 84 | 0.6% |
| Scottish | 163 | 1.3% |
| Slovak | 41 | 0.3% |
| South American | 71 | 0.5% |
| Swedish | 9 | 0.1% |
| Swiss | 80 | 0.6% |
| Thai | 80 | 0.6% |
| Ukrainian | 12 | 0.1% |
| Venezuelan | 14 | 0.1% |
| Welsh | 33 | 0.3% | View All 40 Rows |
Immigrants in Harrison
The most numerous immigrant groups reported in Harrison came from Europe (351 | 2.7%), Western Europe (333 | 2.5%), Netherlands (311 | 2.4%), Latin America (59 | 0.4%), and Central America (26 | 0.2%), together accounting for 8.3% of all Harrison residents.
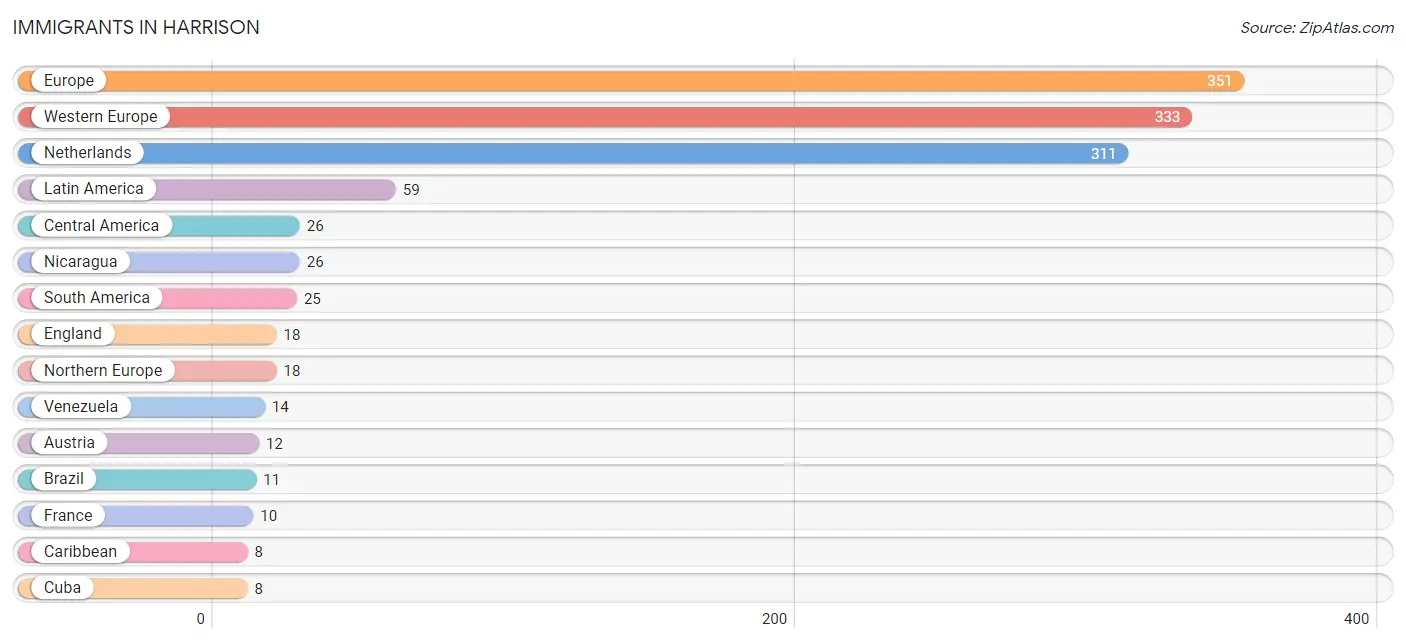
| Immigration Origin | # Population | % Population |
| Austria | 12 | 0.1% |
| Brazil | 11 | 0.1% |
| Caribbean | 8 | 0.1% |
| Central America | 26 | 0.2% |
| Cuba | 8 | 0.1% |
| England | 18 | 0.1% |
| Europe | 351 | 2.7% |
| France | 10 | 0.1% |
| Latin America | 59 | 0.4% |
| Netherlands | 311 | 2.4% |
| Nicaragua | 26 | 0.2% |
| Northern Europe | 18 | 0.1% |
| South America | 25 | 0.2% |
| Venezuela | 14 | 0.1% |
| Western Europe | 333 | 2.5% | View All 15 Rows |
Sex and Age in Harrison
Sex and Age in Harrison
The most populous age groups in Harrison are 30 to 34 Years (667 | 10.5%) for men and 10 to 14 Years (945 | 14.0%) for women.
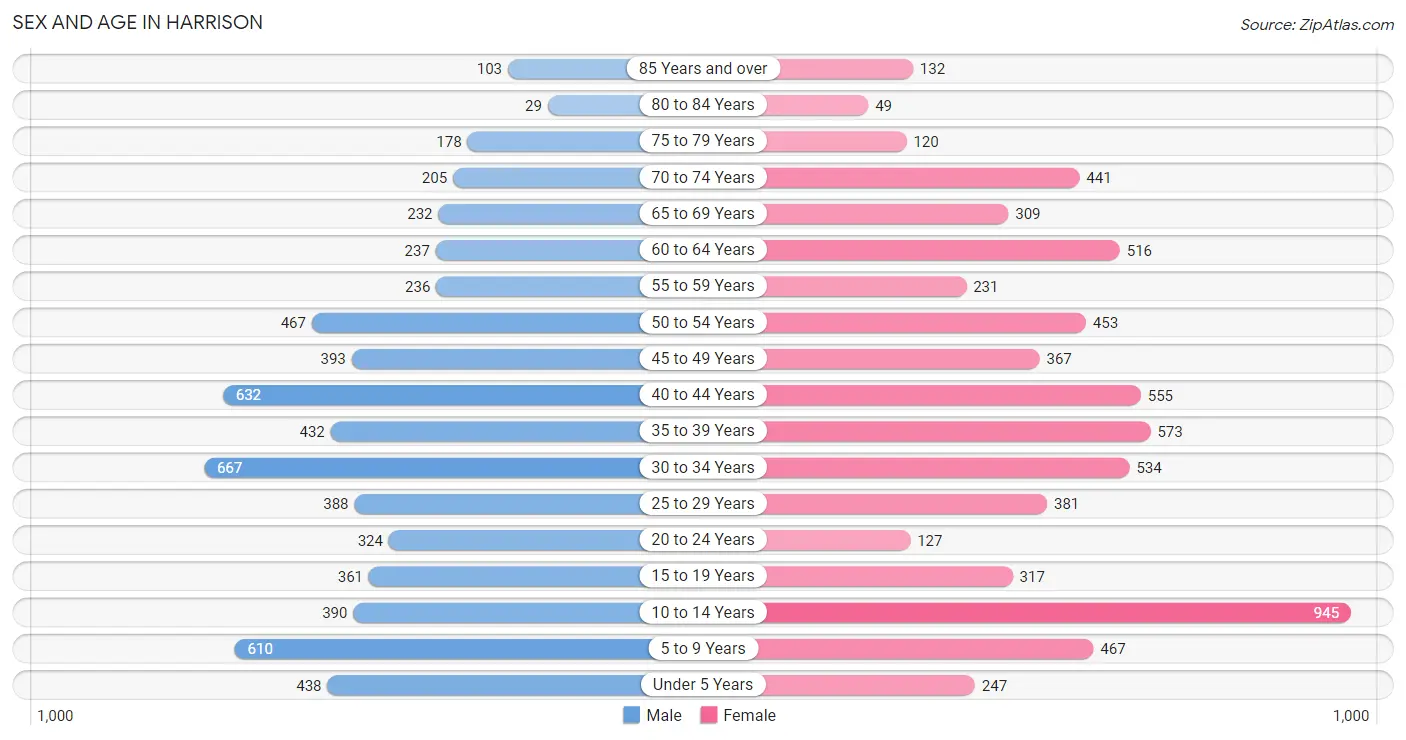
| Age Bracket | Male | Female |
| Under 5 Years | 438 (6.9%) | 247 (3.6%) |
| 5 to 9 Years | 610 (9.7%) | 467 (6.9%) |
| 10 to 14 Years | 390 (6.2%) | 945 (14.0%) |
| 15 to 19 Years | 361 (5.7%) | 317 (4.7%) |
| 20 to 24 Years | 324 (5.1%) | 127 (1.9%) |
| 25 to 29 Years | 388 (6.1%) | 381 (5.6%) |
| 30 to 34 Years | 667 (10.5%) | 534 (7.9%) |
| 35 to 39 Years | 432 (6.8%) | 573 (8.5%) |
| 40 to 44 Years | 632 (10.0%) | 555 (8.2%) |
| 45 to 49 Years | 393 (6.2%) | 367 (5.4%) |
| 50 to 54 Years | 467 (7.4%) | 453 (6.7%) |
| 55 to 59 Years | 236 (3.7%) | 231 (3.4%) |
| 60 to 64 Years | 237 (3.7%) | 516 (7.6%) |
| 65 to 69 Years | 232 (3.7%) | 309 (4.6%) |
| 70 to 74 Years | 205 (3.2%) | 441 (6.5%) |
| 75 to 79 Years | 178 (2.8%) | 120 (1.8%) |
| 80 to 84 Years | 29 (0.5%) | 49 (0.7%) |
| 85 Years and over | 103 (1.6%) | 132 (1.9%) |
| Total | 6,322 (100.0%) | 6,764 (100.0%) |
Families and Households in Harrison
Median Family Size in Harrison
The median family size in Harrison is 3.14 persons per family, with married-couple families (2,955 | 83.4%) accounting for the largest median family size of 3.26 persons per family. On the other hand, single male/father families (148 | 4.2%) represent the smallest median family size with 2.44 persons per family.
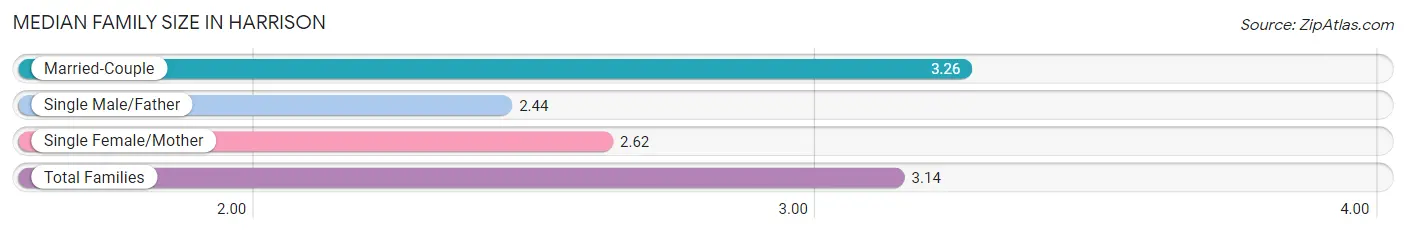
| Family Type | # Families | Family Size |
| Married-Couple | 2,955 (83.4%) | 3.26 |
| Single Male/Father | 148 (4.2%) | 2.44 |
| Single Female/Mother | 442 (12.5%) | 2.62 |
| Total Families | 3,545 (100.0%) | 3.14 |
Median Household Size in Harrison
The median household size in Harrison is 2.65 persons per household, with single male/father households (148 | 3.0%) accounting for the largest median household size of 3.51 persons per household. non-family households (1,384 | 28.1%) represent the smallest median household size with 1.22 persons per household.
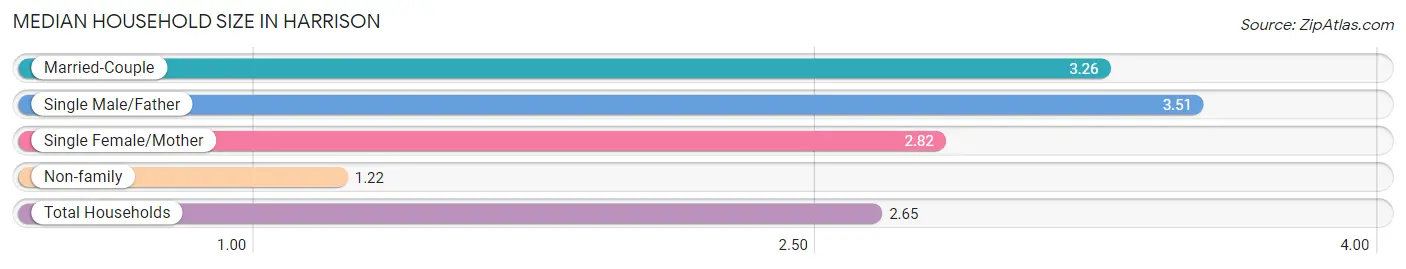
| Household Type | # Households | Household Size |
| Married-Couple | 2,955 (60.0%) | 3.26 |
| Single Male/Father | 148 (3.0%) | 3.51 |
| Single Female/Mother | 442 (9.0%) | 2.82 |
| Non-family | 1,384 (28.1%) | 1.22 |
| Total Households | 4,929 (100.0%) | 2.65 |
Household Size by Marriage Status in Harrison
Out of a total of 4,929 households in Harrison, 3,545 (71.9%) are family households, while 1,384 (28.1%) are nonfamily households. The most numerous type of family households are 2-person households, comprising 1,373, and the most common type of nonfamily households are 1-person households, comprising 1,152.
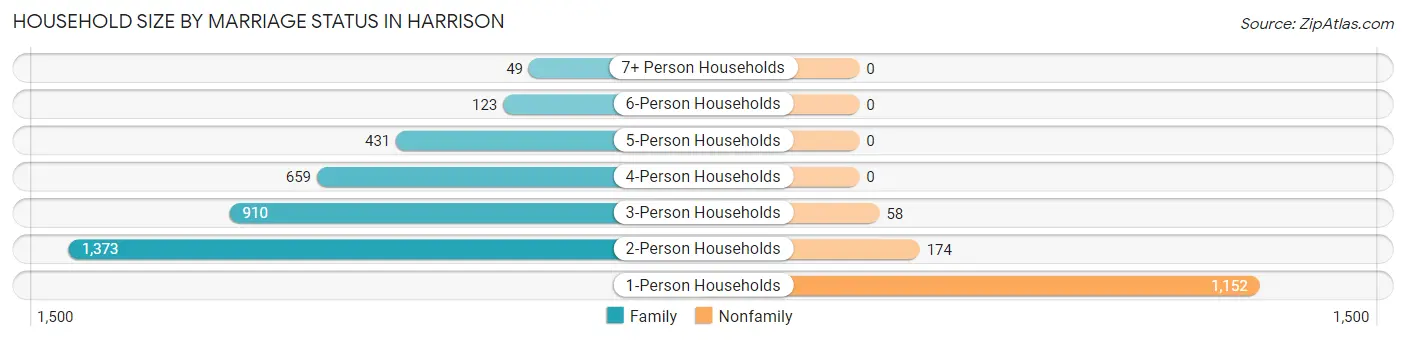
| Household Size | Family Households | Nonfamily Households |
| 1-Person Households | - | 1,152 (23.4%) |
| 2-Person Households | 1,373 (27.9%) | 174 (3.5%) |
| 3-Person Households | 910 (18.5%) | 58 (1.2%) |
| 4-Person Households | 659 (13.4%) | 0 (0.0%) |
| 5-Person Households | 431 (8.7%) | 0 (0.0%) |
| 6-Person Households | 123 (2.5%) | 0 (0.0%) |
| 7+ Person Households | 49 (1.0%) | 0 (0.0%) |
| Total | 3,545 (71.9%) | 1,384 (28.1%) |
Female Fertility in Harrison
Fertility by Age in Harrison
Average fertility rate in Harrison is 42.0 births per 1,000 women. Women in the age bracket of 20 to 34 years have the highest fertility rate with 64.0 births per 1,000 women. Women in the age bracket of 20 to 34 years acount for 54.5% of all women with births.
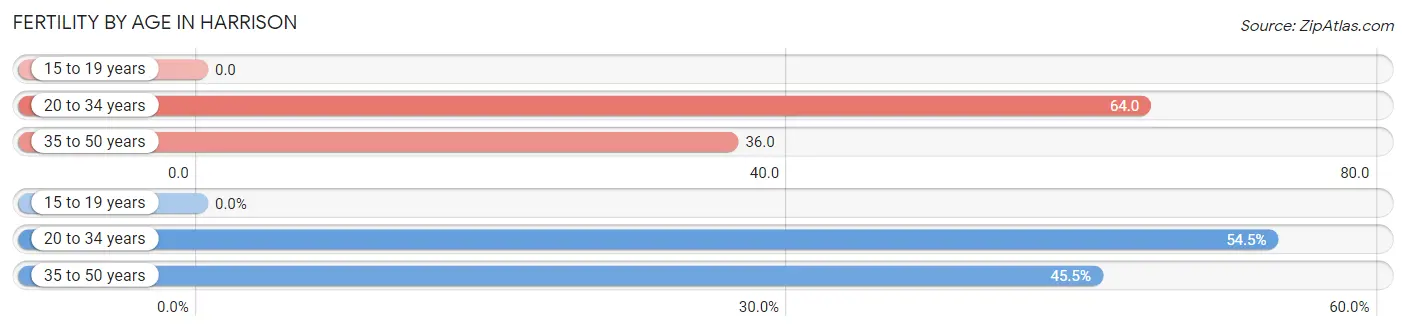
| Age Bracket | Women with Births | Births / 1,000 Women |
| 15 to 19 years | 0 (0.0%) | 0.0 |
| 20 to 34 years | 67 (54.5%) | 64.0 |
| 35 to 50 years | 56 (45.5%) | 36.0 |
| Total | 123 (100.0%) | 42.0 |
Fertility by Age by Marriage Status in Harrison
86.2% of women with births (123) in Harrison are married. The highest percentage of unmarried women with births falls into 20 to 34 years age bracket with 25.4% of them unmarried at the time of birth, while the lowest percentage of unmarried women with births belong to 35 to 50 years age bracket with 0.0% of them unmarried.
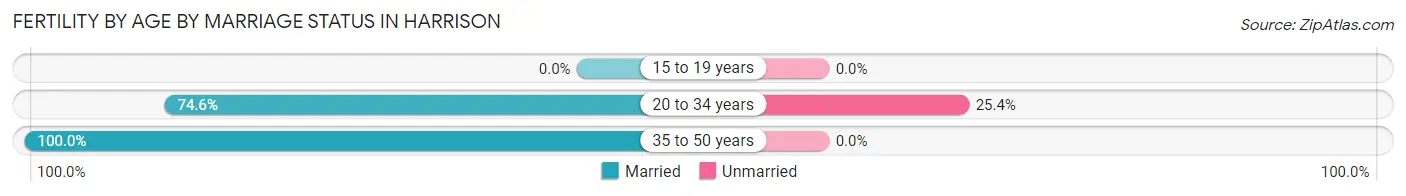
| Age Bracket | Married | Unmarried |
| 15 to 19 years | 0 (0.0%) | 0 (0.0%) |
| 20 to 34 years | 50 (74.6%) | 17 (25.4%) |
| 35 to 50 years | 56 (100.0%) | 0 (0.0%) |
| Total | 106 (86.2%) | 17 (13.8%) |
Fertility by Education in Harrison
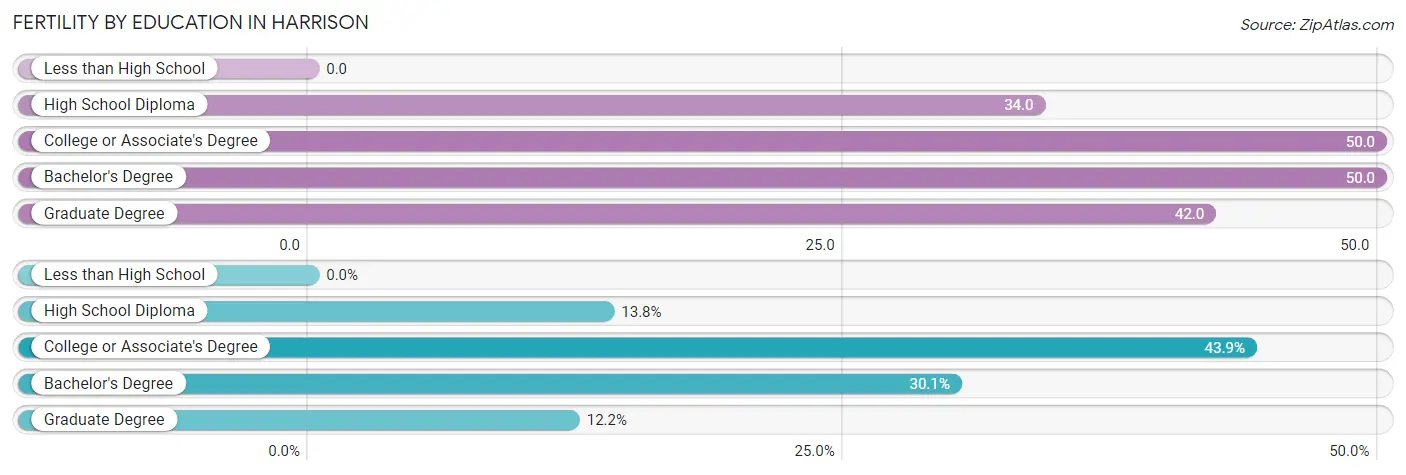
| Educational Attainment | Women with Births | Births / 1,000 Women |
| Less than High School | 0 (0.0%) | 0.0 |
| High School Diploma | 17 (13.8%) | 34.0 |
| College or Associate's Degree | 54 (43.9%) | 50.0 |
| Bachelor's Degree | 37 (30.1%) | 50.0 |
| Graduate Degree | 15 (12.2%) | 42.0 |
| Total | 123 (100.0%) | 42.0 |
Fertility by Education by Marriage Status in Harrison
13.8% of women with births in Harrison are unmarried. Women with the educational attainment of college or associate's degree are most likely to be married with 100.0% of them married at childbirth, while women with the educational attainment of high school diploma are least likely to be married with 100.0% of them unmarried at childbirth.
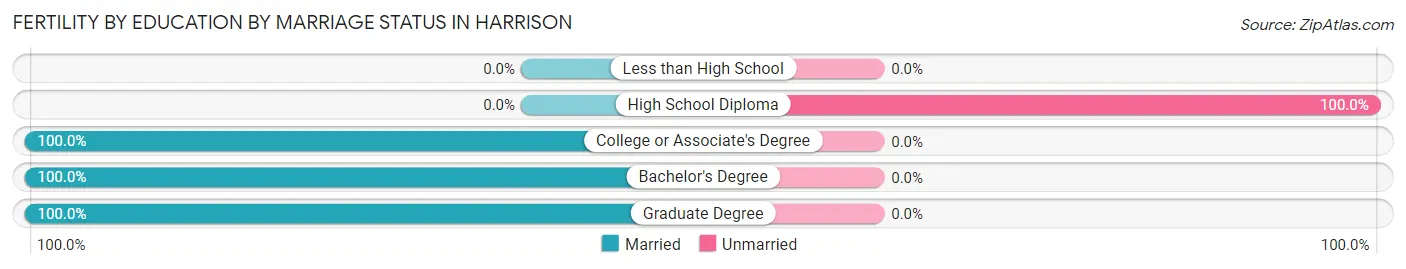
| Educational Attainment | Married | Unmarried |
| Less than High School | 0 (0.0%) | 0 (0.0%) |
| High School Diploma | 0 (0.0%) | 17 (100.0%) |
| College or Associate's Degree | 54 (100.0%) | 0 (0.0%) |
| Bachelor's Degree | 37 (100.0%) | 0 (0.0%) |
| Graduate Degree | 15 (100.0%) | 0 (0.0%) |
| Total | 106 (86.2%) | 17 (13.8%) |
Employment Characteristics in Harrison
Employment by Class of Employer in Harrison
Among the 7,547 employed individuals in Harrison, private company employees (5,441 | 72.1%), not-for-profit organizations (702 | 9.3%), and local government employees (693 | 9.2%) make up the most common classes of employment.
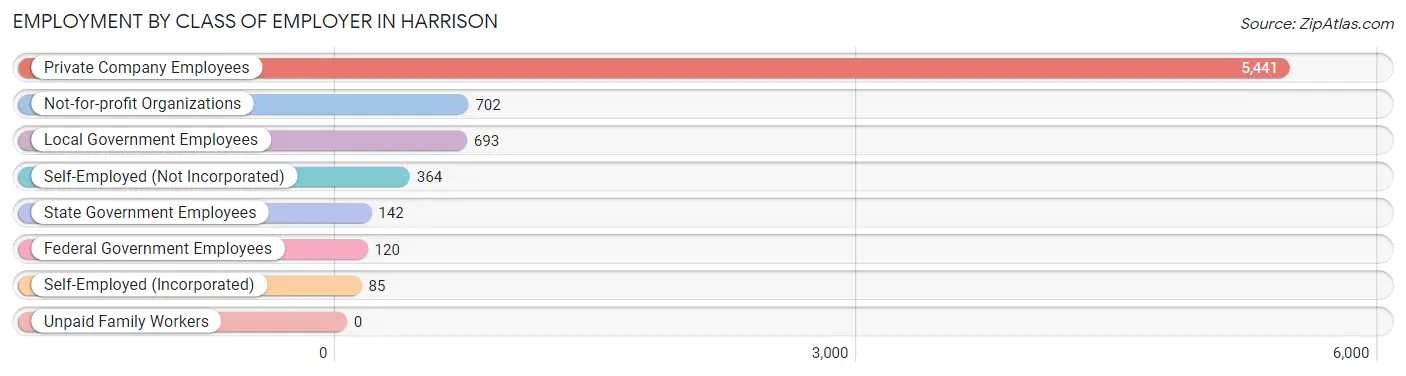
| Employer Class | # Employees | % Employees |
| Private Company Employees | 5,441 | 72.1% |
| Self-Employed (Incorporated) | 85 | 1.1% |
| Self-Employed (Not Incorporated) | 364 | 4.8% |
| Not-for-profit Organizations | 702 | 9.3% |
| Local Government Employees | 693 | 9.2% |
| State Government Employees | 142 | 1.9% |
| Federal Government Employees | 120 | 1.6% |
| Unpaid Family Workers | 0 | 0.0% |
| Total | 7,547 | 100.0% |
Employment Status by Age in Harrison
According to the labor force statistics for Harrison, out of the total population over 16 years of age (9,849), 77.8% or 7,663 individuals are in the labor force, with 0.9% or 69 of them unemployed. The age group with the highest labor force participation rate is 35 to 44 years, with 98.5% or 2,159 individuals in the labor force. Within the labor force, the 25 to 29 years age range has the highest percentage of unemployed individuals, with 4.6% or 34 of them being unemployed.
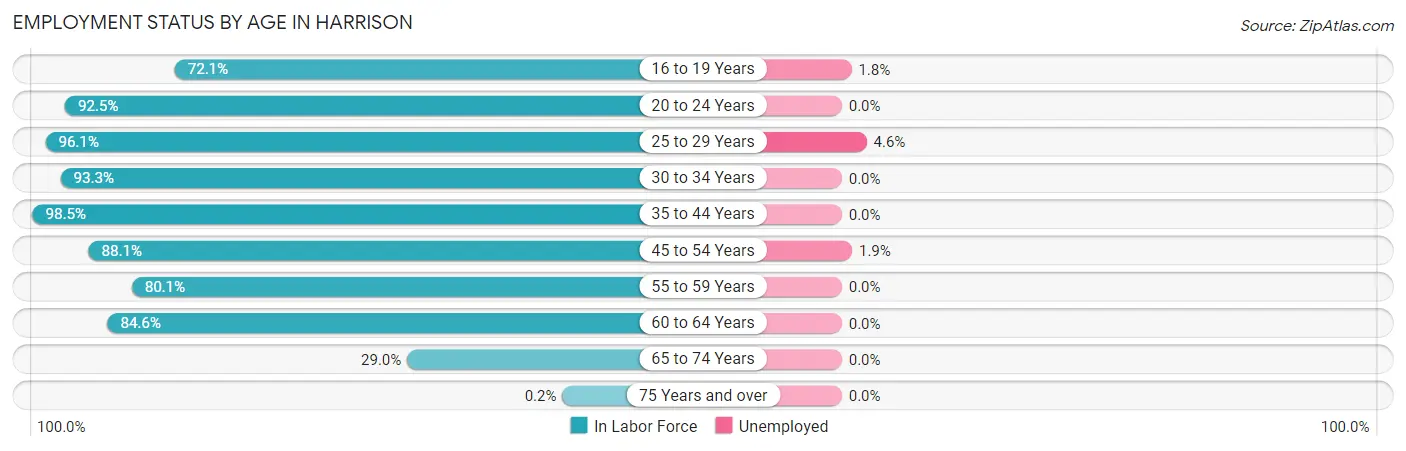
| Age Bracket | In Labor Force | Unemployed |
| 16 to 19 Years | 388 (72.1%) | 7 (1.8%) |
| 20 to 24 Years | 417 (92.5%) | 0 (0.0%) |
| 25 to 29 Years | 739 (96.1%) | 34 (4.6%) |
| 30 to 34 Years | 1,121 (93.3%) | 0 (0.0%) |
| 35 to 44 Years | 2,159 (98.5%) | 0 (0.0%) |
| 45 to 54 Years | 1,480 (88.1%) | 28 (1.9%) |
| 55 to 59 Years | 374 (80.1%) | 0 (0.0%) |
| 60 to 64 Years | 637 (84.6%) | 0 (0.0%) |
| 65 to 74 Years | 344 (29.0%) | 0 (0.0%) |
| 75 Years and over | 1 (0.2%) | 0 (0.0%) |
| Total | 7,663 (77.8%) | 69 (0.9%) |
Employment Status by Educational Attainment in Harrison
According to labor force statistics for Harrison, 92.2% of individuals (6,511) out of the total population between 25 and 64 years of age (7,062) are in the labor force, with 0.9% or 59 of them being unemployed. The group with the highest labor force participation rate are those with the educational attainment of bachelor's degree or higher, with 96.3% or 2,221 individuals in the labor force. Within the labor force, individuals with bachelor's degree or higher education have the highest percentage of unemployment, with 2.8% or 62 of them being unemployed.
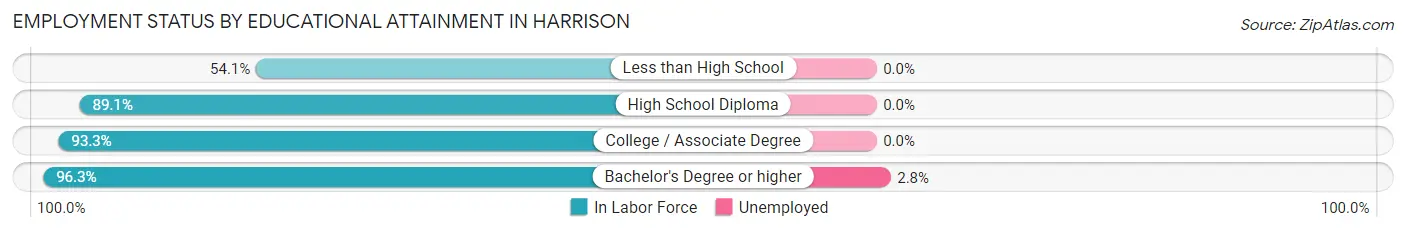
| Educational Attainment | In Labor Force | Unemployed |
| Less than High School | 93 (54.1%) | 0 (0.0%) |
| High School Diploma | 1,653 (89.1%) | 0 (0.0%) |
| College / Associate Degree | 2,546 (93.3%) | 0 (0.0%) |
| Bachelor's Degree or higher | 2,221 (96.3%) | 65 (2.8%) |
| Total | 6,511 (92.2%) | 64 (0.9%) |
Employment Occupations by Sex in Harrison
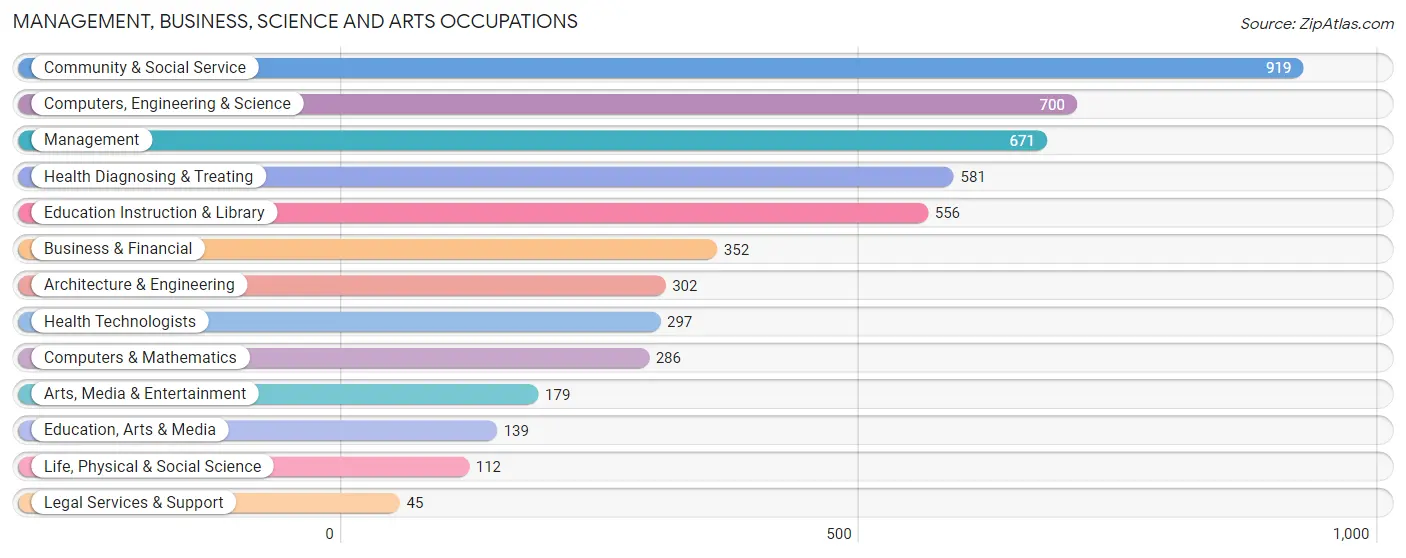
Management, Business, Science and Arts Occupations
The most common Management, Business, Science and Arts occupations in Harrison are Community & Social Service (919 | 12.2%), Computers, Engineering & Science (700 | 9.3%), Management (671 | 8.9%), Health Diagnosing & Treating (581 | 7.7%), and Education Instruction & Library (556 | 7.4%).
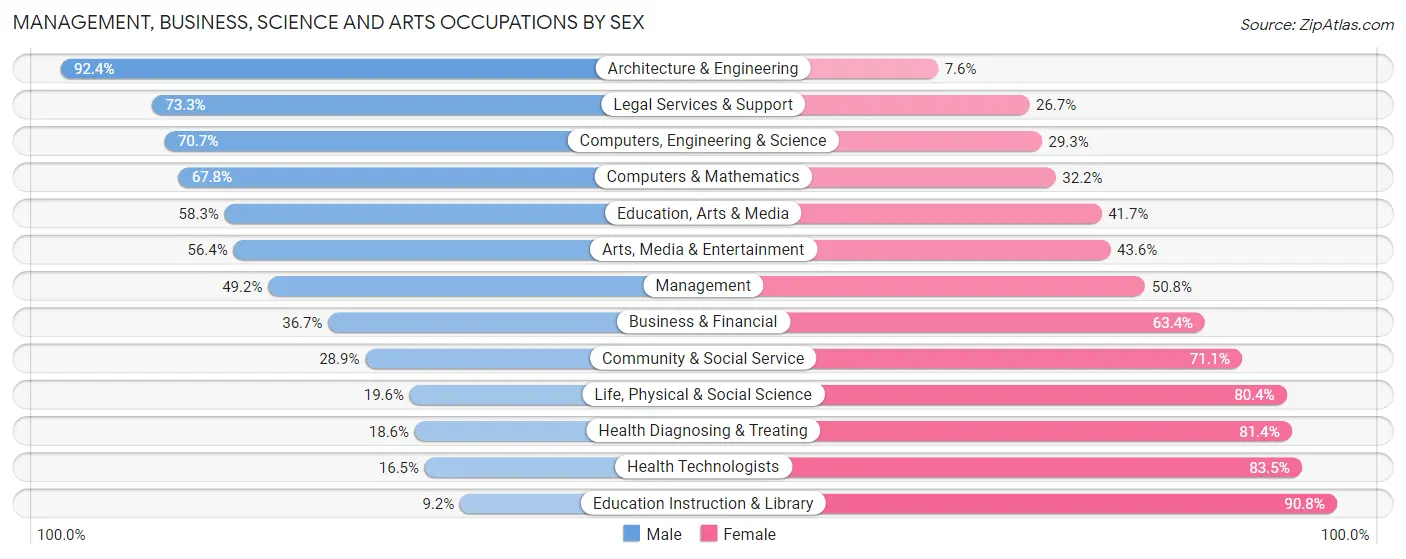
Management, Business, Science and Arts Occupations by Sex
Within the Management, Business, Science and Arts occupations in Harrison, the most male-oriented occupations are Architecture & Engineering (92.4%), Legal Services & Support (73.3%), and Computers, Engineering & Science (70.7%), while the most female-oriented occupations are Education Instruction & Library (90.8%), Health Technologists (83.5%), and Health Diagnosing & Treating (81.4%).
| Occupation | Male | Female |
| Management | 330 (49.2%) | 341 (50.8%) |
| Business & Financial | 129 (36.6%) | 223 (63.3%) |
| Computers, Engineering & Science | 495 (70.7%) | 205 (29.3%) |
| Computers & Mathematics | 194 (67.8%) | 92 (32.2%) |
| Architecture & Engineering | 279 (92.4%) | 23 (7.6%) |
| Life, Physical & Social Science | 22 (19.6%) | 90 (80.4%) |
| Community & Social Service | 266 (28.9%) | 653 (71.1%) |
| Education, Arts & Media | 81 (58.3%) | 58 (41.7%) |
| Legal Services & Support | 33 (73.3%) | 12 (26.7%) |
| Education Instruction & Library | 51 (9.2%) | 505 (90.8%) |
| Arts, Media & Entertainment | 101 (56.4%) | 78 (43.6%) |
| Health Diagnosing & Treating | 108 (18.6%) | 473 (81.4%) |
| Health Technologists | 49 (16.5%) | 248 (83.5%) |
| Total (Category) | 1,328 (41.2%) | 1,895 (58.8%) |
| Total (Overall) | 3,988 (52.8%) | 3,566 (47.2%) |
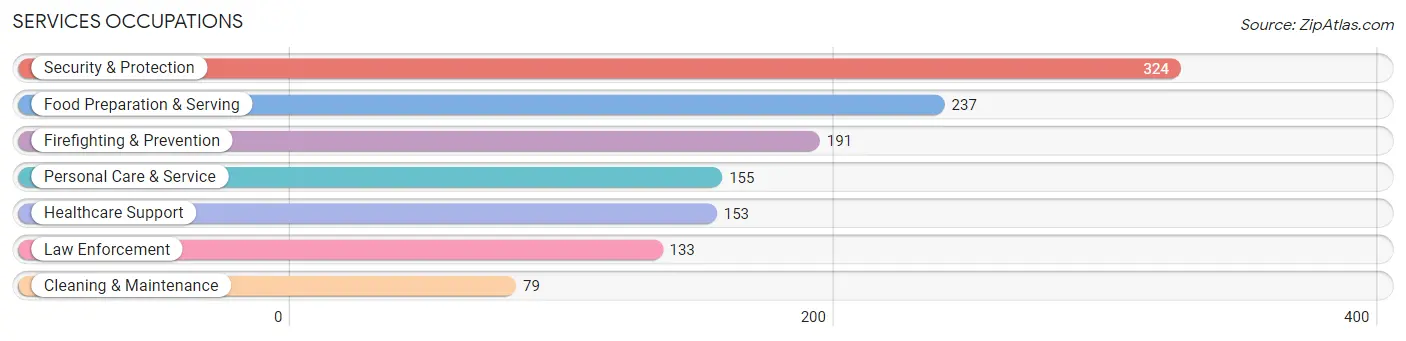
Services Occupations
The most common Services occupations in Harrison are Security & Protection (324 | 4.3%), Food Preparation & Serving (237 | 3.1%), Firefighting & Prevention (191 | 2.5%), Personal Care & Service (155 | 2.1%), and Healthcare Support (153 | 2.0%).
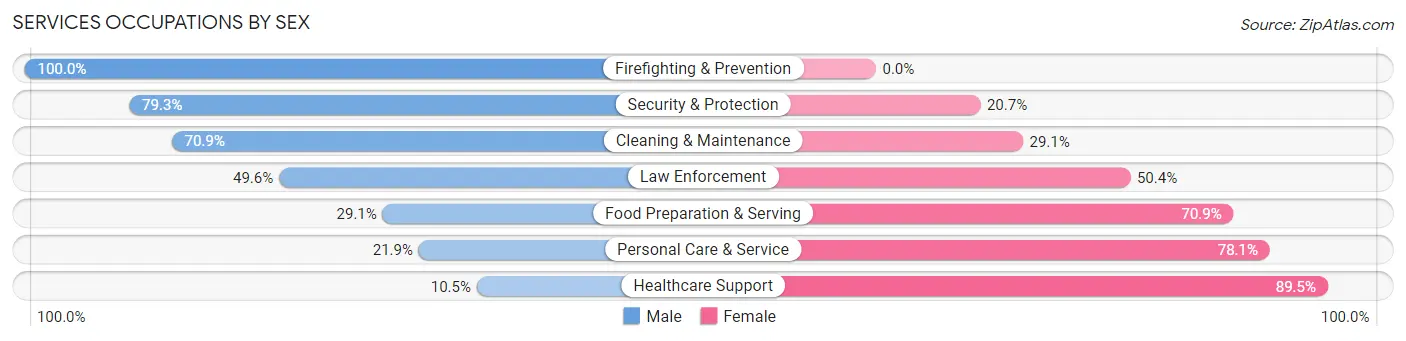
Services Occupations by Sex
Within the Services occupations in Harrison, the most male-oriented occupations are Firefighting & Prevention (100.0%), Security & Protection (79.3%), and Cleaning & Maintenance (70.9%), while the most female-oriented occupations are Healthcare Support (89.5%), Personal Care & Service (78.1%), and Food Preparation & Serving (70.9%).
| Occupation | Male | Female |
| Healthcare Support | 16 (10.5%) | 137 (89.5%) |
| Security & Protection | 257 (79.3%) | 67 (20.7%) |
| Firefighting & Prevention | 191 (100.0%) | 0 (0.0%) |
| Law Enforcement | 66 (49.6%) | 67 (50.4%) |
| Food Preparation & Serving | 69 (29.1%) | 168 (70.9%) |
| Cleaning & Maintenance | 56 (70.9%) | 23 (29.1%) |
| Personal Care & Service | 34 (21.9%) | 121 (78.1%) |
| Total (Category) | 432 (45.6%) | 516 (54.4%) |
| Total (Overall) | 3,988 (52.8%) | 3,566 (47.2%) |
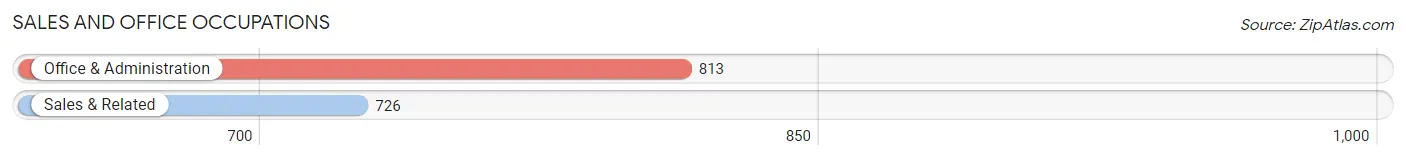
Sales and Office Occupations
The most common Sales and Office occupations in Harrison are Office & Administration (813 | 10.8%), and Sales & Related (726 | 9.6%).
Sales and Office Occupations by Sex
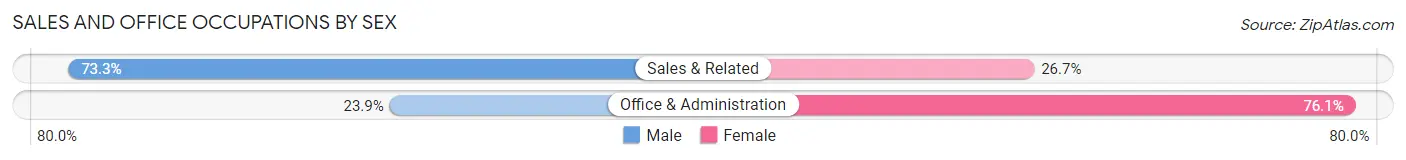
| Occupation | Male | Female |
| Sales & Related | 532 (73.3%) | 194 (26.7%) |
| Office & Administration | 194 (23.9%) | 619 (76.1%) |
| Total (Category) | 726 (47.2%) | 813 (52.8%) |
| Total (Overall) | 3,988 (52.8%) | 3,566 (47.2%) |
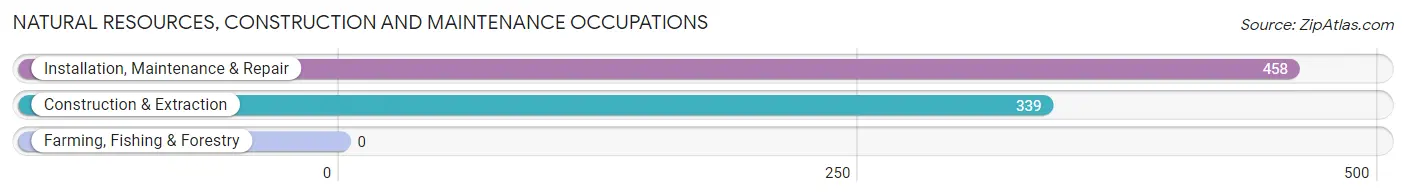
Natural Resources, Construction and Maintenance Occupations
The most common Natural Resources, Construction and Maintenance occupations in Harrison are Installation, Maintenance & Repair (458 | 6.1%), and Construction & Extraction (339 | 4.5%).
Natural Resources, Construction and Maintenance Occupations by Sex
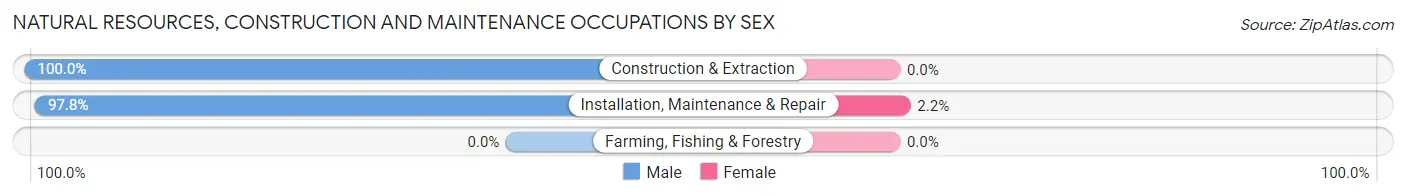
| Occupation | Male | Female |
| Farming, Fishing & Forestry | 0 (0.0%) | 0 (0.0%) |
| Construction & Extraction | 339 (100.0%) | 0 (0.0%) |
| Installation, Maintenance & Repair | 448 (97.8%) | 10 (2.2%) |
| Total (Category) | 787 (98.8%) | 10 (1.3%) |
| Total (Overall) | 3,988 (52.8%) | 3,566 (47.2%) |
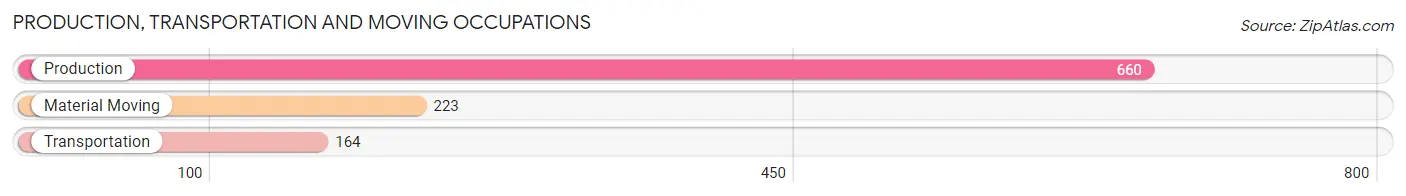
Production, Transportation and Moving Occupations
The most common Production, Transportation and Moving occupations in Harrison are Production (660 | 8.7%), Material Moving (223 | 2.9%), and Transportation (164 | 2.2%).
Production, Transportation and Moving Occupations by Sex
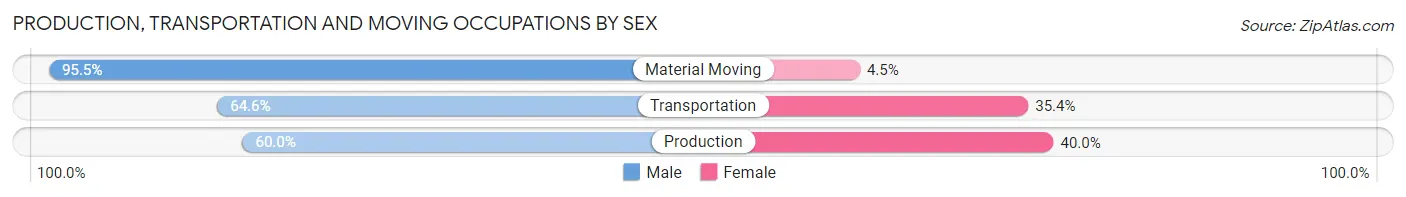
| Occupation | Male | Female |
| Production | 396 (60.0%) | 264 (40.0%) |
| Transportation | 106 (64.6%) | 58 (35.4%) |
| Material Moving | 213 (95.5%) | 10 (4.5%) |
| Total (Category) | 715 (68.3%) | 332 (31.7%) |
| Total (Overall) | 3,988 (52.8%) | 3,566 (47.2%) |
Employment Industries by Sex in Harrison
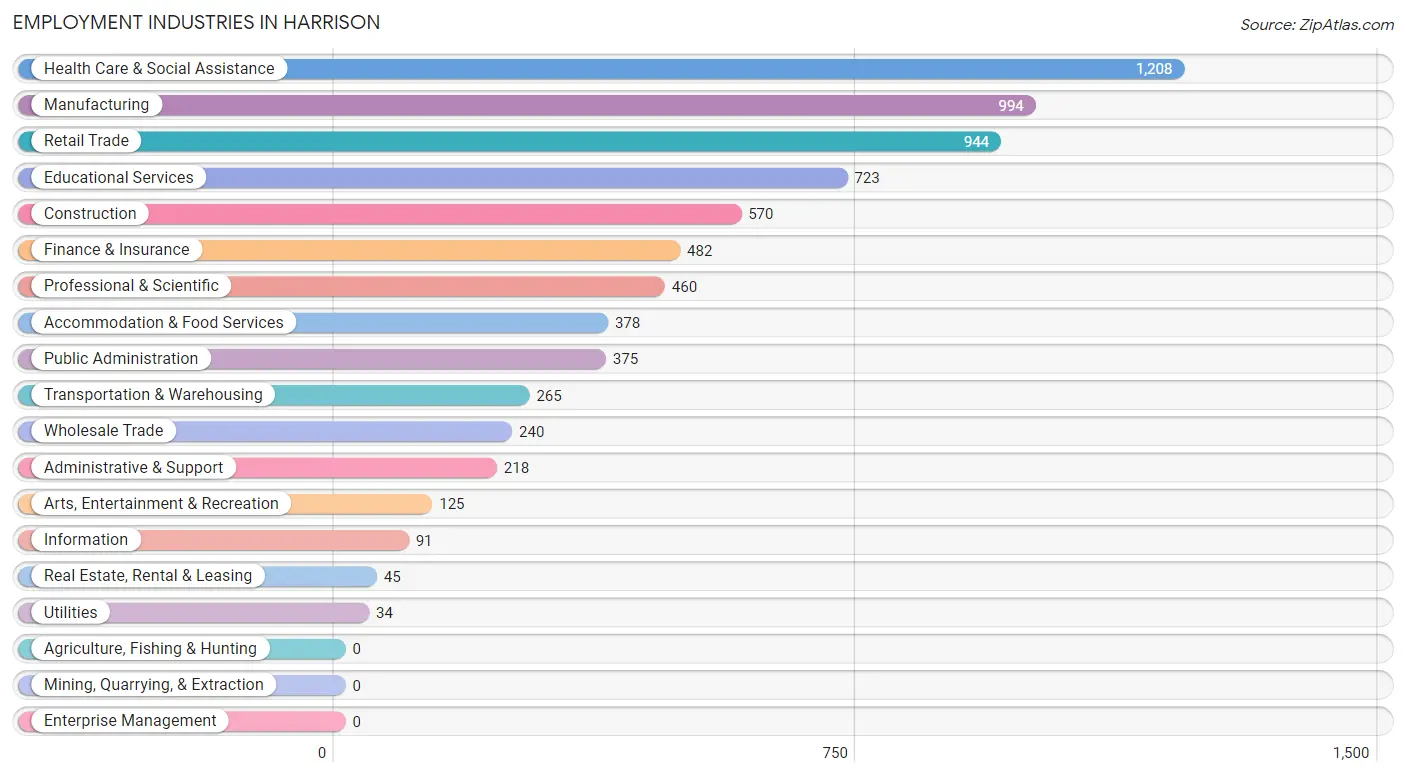
Employment Industries in Harrison
The major employment industries in Harrison include Health Care & Social Assistance (1,208 | 16.0%), Manufacturing (994 | 13.2%), Retail Trade (944 | 12.5%), Educational Services (723 | 9.6%), and Construction (570 | 7.5%).
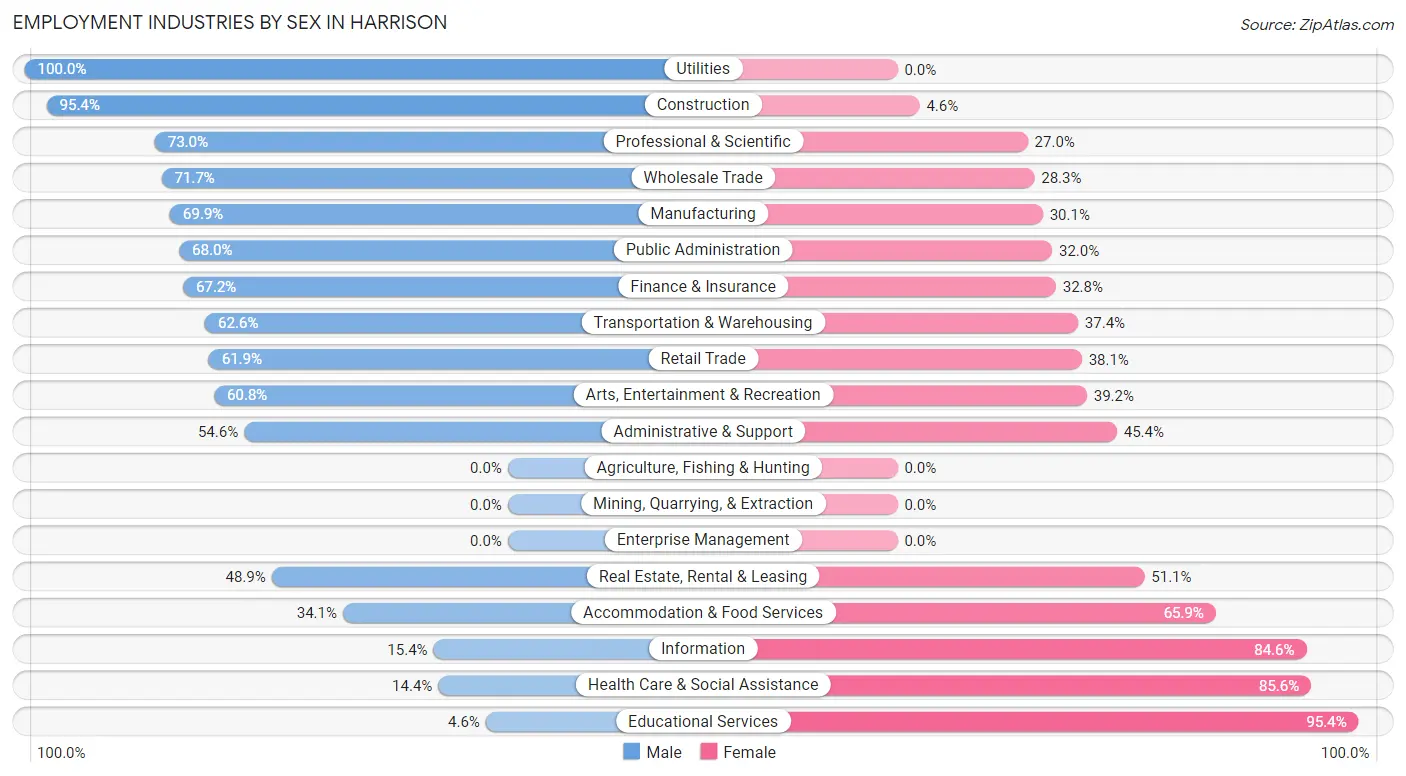
Employment Industries by Sex in Harrison
The Harrison industries that see more men than women are Utilities (100.0%), Construction (95.4%), and Professional & Scientific (73.0%), whereas the industries that tend to have a higher number of women are Educational Services (95.4%), Health Care & Social Assistance (85.6%), and Information (84.6%).
| Industry | Male | Female |
| Agriculture, Fishing & Hunting | 0 (0.0%) | 0 (0.0%) |
| Mining, Quarrying, & Extraction | 0 (0.0%) | 0 (0.0%) |
| Construction | 544 (95.4%) | 26 (4.6%) |
| Manufacturing | 695 (69.9%) | 299 (30.1%) |
| Wholesale Trade | 172 (71.7%) | 68 (28.3%) |
| Retail Trade | 584 (61.9%) | 360 (38.1%) |
| Transportation & Warehousing | 166 (62.6%) | 99 (37.4%) |
| Utilities | 34 (100.0%) | 0 (0.0%) |
| Information | 14 (15.4%) | 77 (84.6%) |
| Finance & Insurance | 324 (67.2%) | 158 (32.8%) |
| Real Estate, Rental & Leasing | 22 (48.9%) | 23 (51.1%) |
| Professional & Scientific | 336 (73.0%) | 124 (27.0%) |
| Enterprise Management | 0 (0.0%) | 0 (0.0%) |
| Administrative & Support | 119 (54.6%) | 99 (45.4%) |
| Educational Services | 33 (4.6%) | 690 (95.4%) |
| Health Care & Social Assistance | 174 (14.4%) | 1,034 (85.6%) |
| Arts, Entertainment & Recreation | 76 (60.8%) | 49 (39.2%) |
| Accommodation & Food Services | 129 (34.1%) | 249 (65.9%) |
| Public Administration | 255 (68.0%) | 120 (32.0%) |
| Total | 3,988 (52.8%) | 3,566 (47.2%) |
Education in Harrison
School Enrollment in Harrison
The most common levels of schooling among the 3,228 students in Harrison are middle school (1,048 | 32.5%), elementary school (889 | 27.5%), and high school (646 | 20.0%).
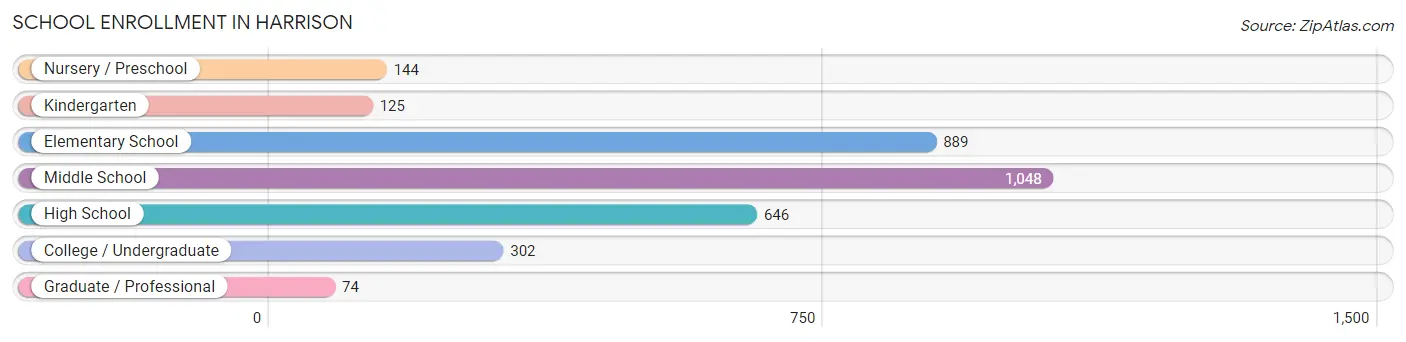
| School Level | # Students | % Students |
| Nursery / Preschool | 144 | 4.5% |
| Kindergarten | 125 | 3.9% |
| Elementary School | 889 | 27.5% |
| Middle School | 1,048 | 32.5% |
| High School | 646 | 20.0% |
| College / Undergraduate | 302 | 9.4% |
| Graduate / Professional | 74 | 2.3% |
| Total | 3,228 | 100.0% |
School Enrollment by Age by Funding Source in Harrison
Out of a total of 3,228 students who are enrolled in schools in Harrison, 413 (12.8%) attend a private institution, while the remaining 2,815 (87.2%) are enrolled in public schools. The age group of 3 to 4 year olds has the highest likelihood of being enrolled in private schools, with 38 (71.7% in the age bracket) enrolled. Conversely, the age group of 35 years and over has the lowest likelihood of being enrolled in a private school, with 90 (100.0% in the age bracket) attending a public institution.
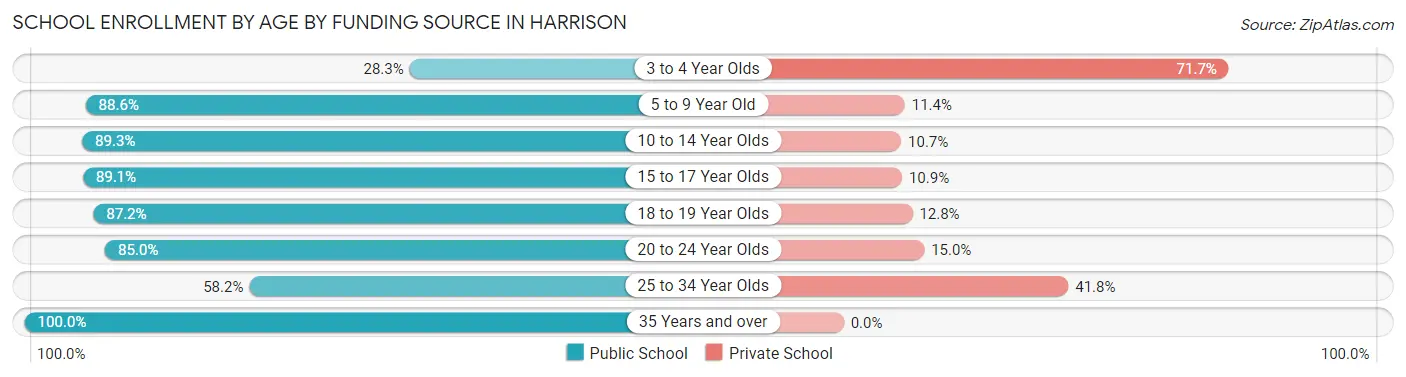
| Age Bracket | Public School | Private School |
| 3 to 4 Year Olds | 15 (28.3%) | 38 (71.7%) |
| 5 to 9 Year Old | 919 (88.6%) | 118 (11.4%) |
| 10 to 14 Year Olds | 1,168 (89.3%) | 140 (10.7%) |
| 15 to 17 Year Olds | 320 (89.1%) | 39 (10.9%) |
| 18 to 19 Year Olds | 177 (87.2%) | 26 (12.8%) |
| 20 to 24 Year Olds | 68 (85.0%) | 12 (15.0%) |
| 25 to 34 Year Olds | 57 (58.2%) | 41 (41.8%) |
| 35 Years and over | 90 (100.0%) | 0 (0.0%) |
| Total | 2,815 (87.2%) | 413 (12.8%) |
Educational Attainment by Field of Study in Harrison
Education (577 | 21.0%), business (563 | 20.5%), science & technology (343 | 12.5%), communications (212 | 7.7%), and visual & performing arts (190 | 6.9%) are the most common fields of study among 2,752 individuals in Harrison who have obtained a bachelor's degree or higher.
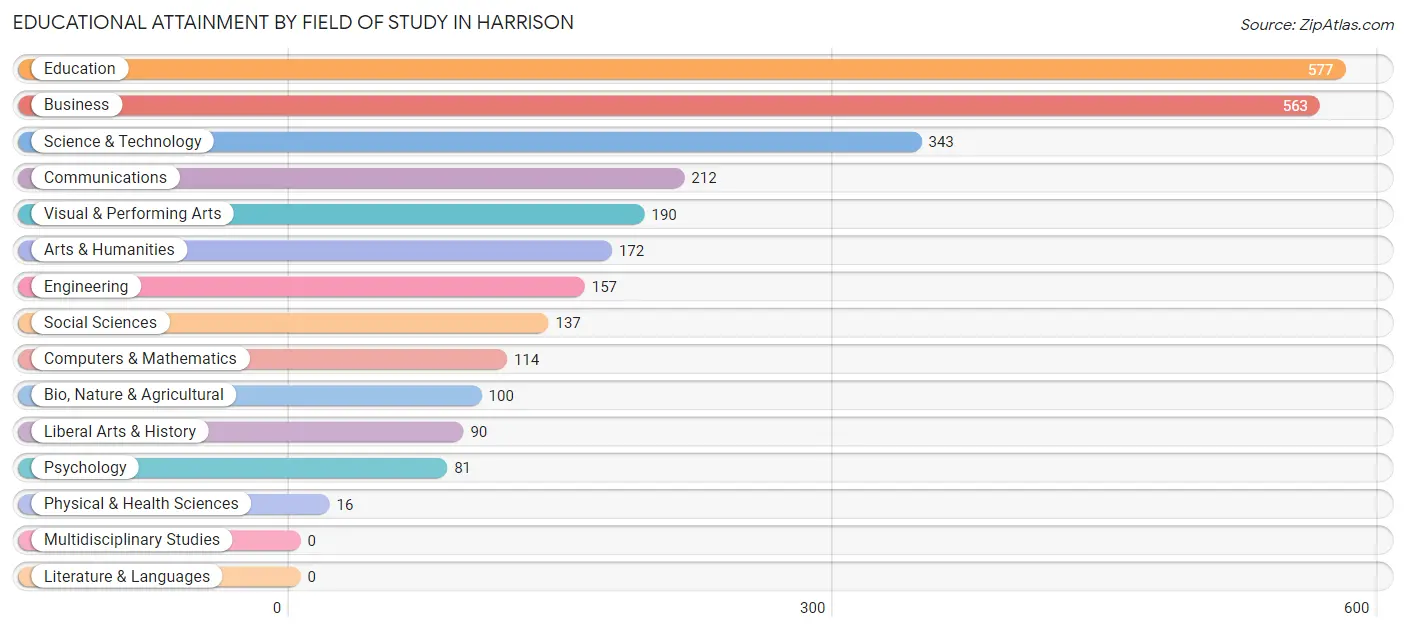
| Field of Study | # Graduates | % Graduates |
| Computers & Mathematics | 114 | 4.1% |
| Bio, Nature & Agricultural | 100 | 3.6% |
| Physical & Health Sciences | 16 | 0.6% |
| Psychology | 81 | 2.9% |
| Social Sciences | 137 | 5.0% |
| Engineering | 157 | 5.7% |
| Multidisciplinary Studies | 0 | 0.0% |
| Science & Technology | 343 | 12.5% |
| Business | 563 | 20.5% |
| Education | 577 | 21.0% |
| Literature & Languages | 0 | 0.0% |
| Liberal Arts & History | 90 | 3.3% |
| Visual & Performing Arts | 190 | 6.9% |
| Communications | 212 | 7.7% |
| Arts & Humanities | 172 | 6.2% |
| Total | 2,752 | 100.0% |
Transportation & Commute in Harrison
Vehicle Availability by Sex in Harrison
The most prevalent vehicle ownership categories in Harrison are males with 2 vehicles (1,633, accounting for 40.6%) and females with 2 vehicles (1,479, making up 46.4%).
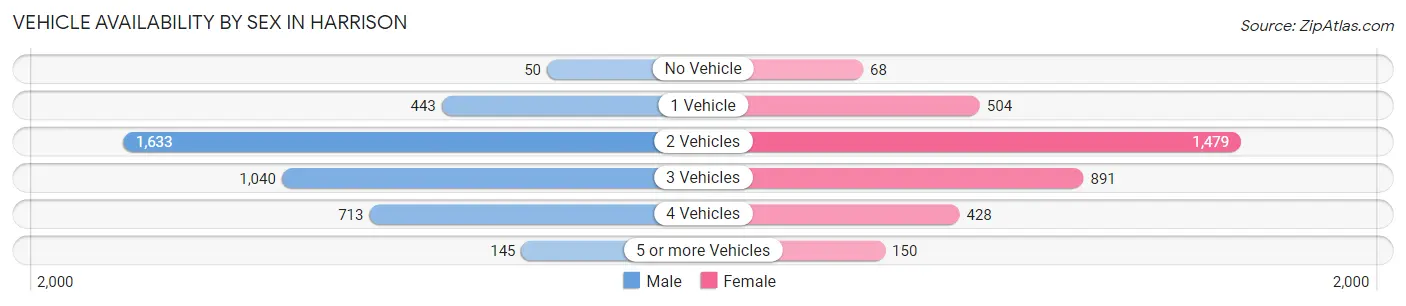
| Vehicles Available | Male | Female |
| No Vehicle | 50 (1.2%) | 68 (1.9%) |
| 1 Vehicle | 443 (11.0%) | 504 (14.3%) |
| 2 Vehicles | 1,633 (40.6%) | 1,479 (42.0%) |
| 3 Vehicles | 1,040 (25.8%) | 891 (25.3%) |
| 4 Vehicles | 713 (17.7%) | 428 (12.2%) |
| 5 or more Vehicles | 145 (3.6%) | 150 (4.3%) |
| Total | 4,024 (100.0%) | 3,520 (100.0%) |
Commute Time in Harrison
The most frequently occuring commute durations in Harrison are 30 to 34 minutes (1,981 commuters, 29.9%), 20 to 24 minutes (748 commuters, 11.3%), and 5 to 9 minutes (739 commuters, 11.2%).
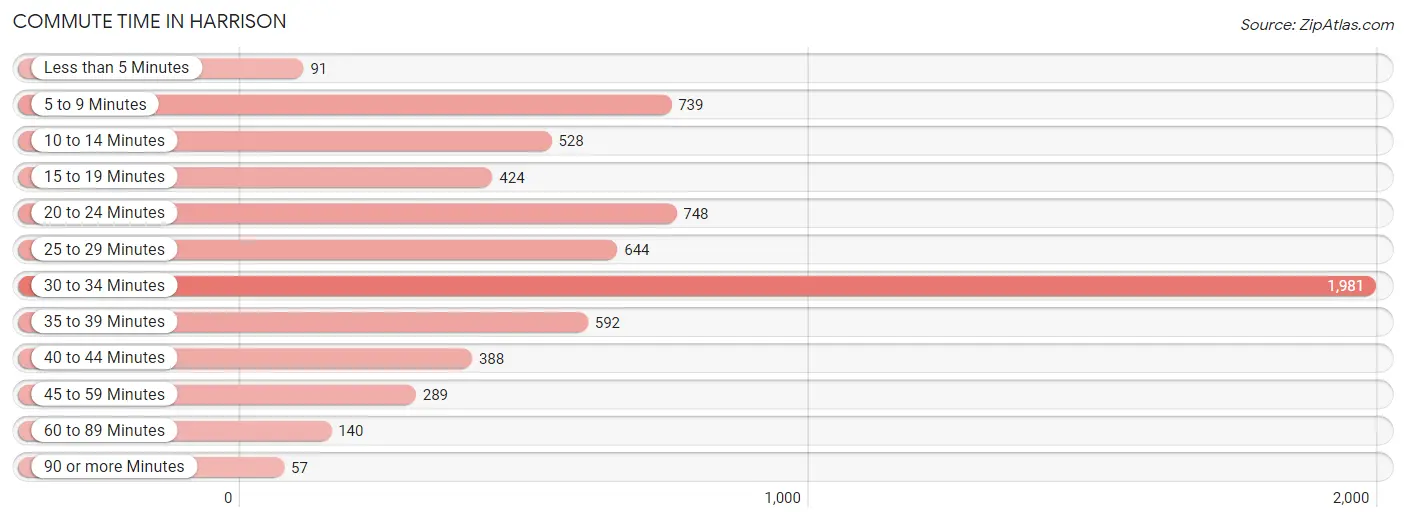
| Commute Time | # Commuters | % Commuters |
| Less than 5 Minutes | 91 | 1.4% |
| 5 to 9 Minutes | 739 | 11.2% |
| 10 to 14 Minutes | 528 | 8.0% |
| 15 to 19 Minutes | 424 | 6.4% |
| 20 to 24 Minutes | 748 | 11.3% |
| 25 to 29 Minutes | 644 | 9.7% |
| 30 to 34 Minutes | 1,981 | 29.9% |
| 35 to 39 Minutes | 592 | 8.9% |
| 40 to 44 Minutes | 388 | 5.9% |
| 45 to 59 Minutes | 289 | 4.4% |
| 60 to 89 Minutes | 140 | 2.1% |
| 90 or more Minutes | 57 | 0.9% |
Commute Time by Sex in Harrison
The most common commute times in Harrison are 30 to 34 minutes (1,009 commuters, 27.7%) for males and 30 to 34 minutes (972 commuters, 32.7%) for females.
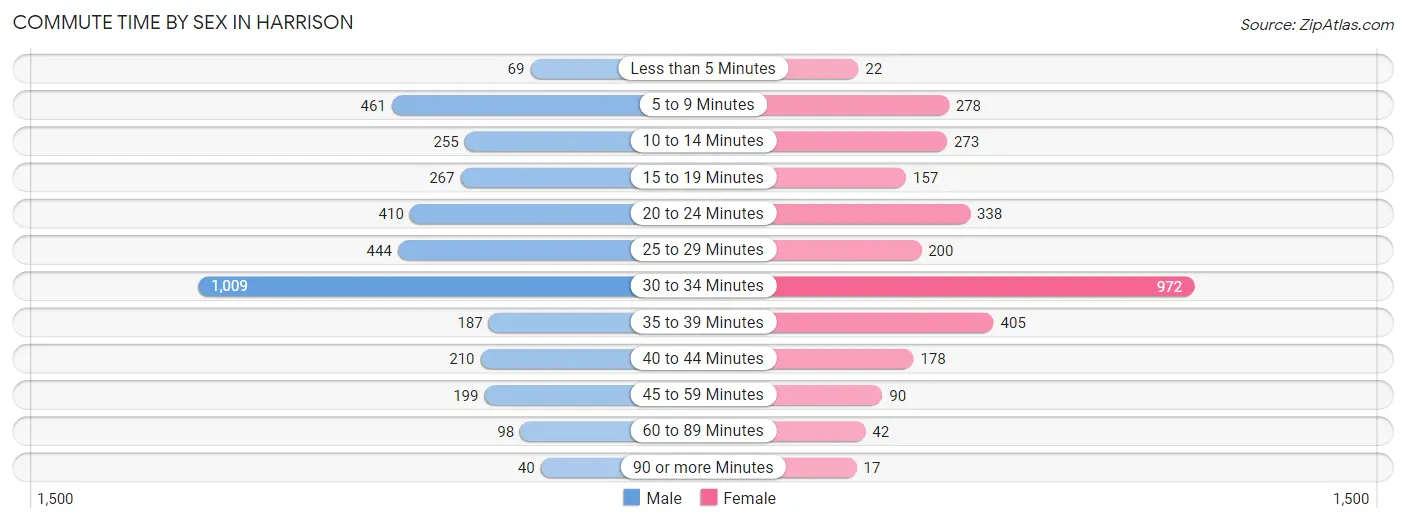
| Commute Time | Male | Female |
| Less than 5 Minutes | 69 (1.9%) | 22 (0.7%) |
| 5 to 9 Minutes | 461 (12.6%) | 278 (9.3%) |
| 10 to 14 Minutes | 255 (7.0%) | 273 (9.2%) |
| 15 to 19 Minutes | 267 (7.3%) | 157 (5.3%) |
| 20 to 24 Minutes | 410 (11.2%) | 338 (11.4%) |
| 25 to 29 Minutes | 444 (12.2%) | 200 (6.7%) |
| 30 to 34 Minutes | 1,009 (27.7%) | 972 (32.7%) |
| 35 to 39 Minutes | 187 (5.1%) | 405 (13.6%) |
| 40 to 44 Minutes | 210 (5.8%) | 178 (6.0%) |
| 45 to 59 Minutes | 199 (5.4%) | 90 (3.0%) |
| 60 to 89 Minutes | 98 (2.7%) | 42 (1.4%) |
| 90 or more Minutes | 40 (1.1%) | 17 (0.6%) |
Time of Departure to Work by Sex in Harrison
The most frequent times of departure to work in Harrison are 7:00 AM to 7:29 AM (754, 20.7%) for males and 7:00 AM to 7:29 AM (811, 27.3%) for females.
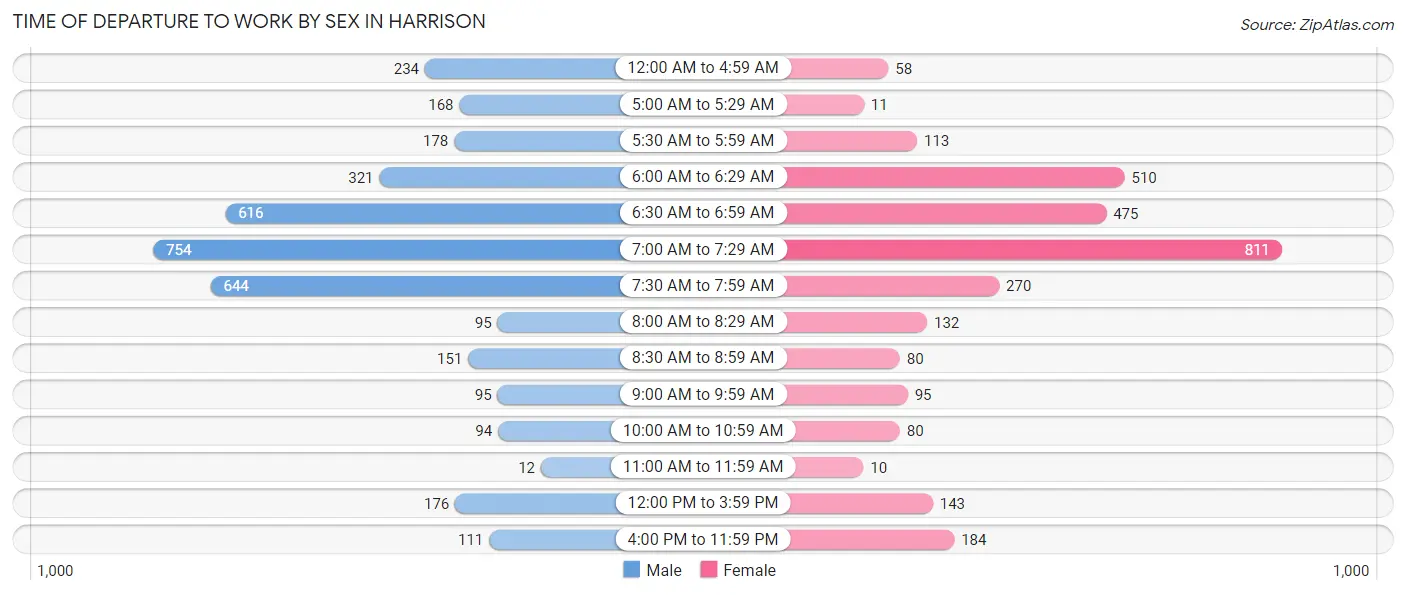
| Time of Departure | Male | Female |
| 12:00 AM to 4:59 AM | 234 (6.4%) | 58 (1.9%) |
| 5:00 AM to 5:29 AM | 168 (4.6%) | 11 (0.4%) |
| 5:30 AM to 5:59 AM | 178 (4.9%) | 113 (3.8%) |
| 6:00 AM to 6:29 AM | 321 (8.8%) | 510 (17.2%) |
| 6:30 AM to 6:59 AM | 616 (16.9%) | 475 (16.0%) |
| 7:00 AM to 7:29 AM | 754 (20.7%) | 811 (27.3%) |
| 7:30 AM to 7:59 AM | 644 (17.6%) | 270 (9.1%) |
| 8:00 AM to 8:29 AM | 95 (2.6%) | 132 (4.4%) |
| 8:30 AM to 8:59 AM | 151 (4.1%) | 80 (2.7%) |
| 9:00 AM to 9:59 AM | 95 (2.6%) | 95 (3.2%) |
| 10:00 AM to 10:59 AM | 94 (2.6%) | 80 (2.7%) |
| 11:00 AM to 11:59 AM | 12 (0.3%) | 10 (0.3%) |
| 12:00 PM to 3:59 PM | 176 (4.8%) | 143 (4.8%) |
| 4:00 PM to 11:59 PM | 111 (3.0%) | 184 (6.2%) |
| Total | 3,649 (100.0%) | 2,972 (100.0%) |
Housing Occupancy in Harrison
Occupancy by Ownership in Harrison
Of the total 4,929 dwellings in Harrison, owner-occupied units account for 3,851 (78.1%), while renter-occupied units make up 1,078 (21.9%).
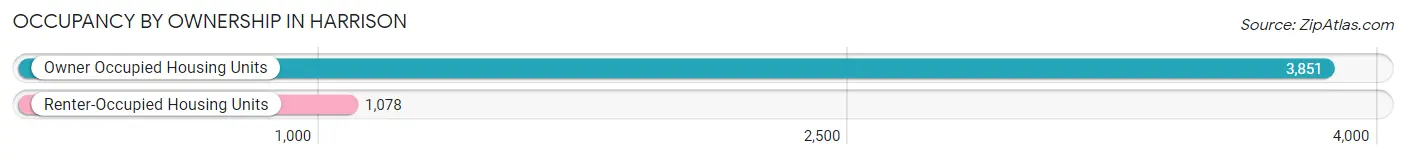
| Occupancy | # Housing Units | % Housing Units |
| Owner Occupied Housing Units | 3,851 | 78.1% |
| Renter-Occupied Housing Units | 1,078 | 21.9% |
| Total Occupied Housing Units | 4,929 | 100.0% |
Occupancy by Household Size in Harrison
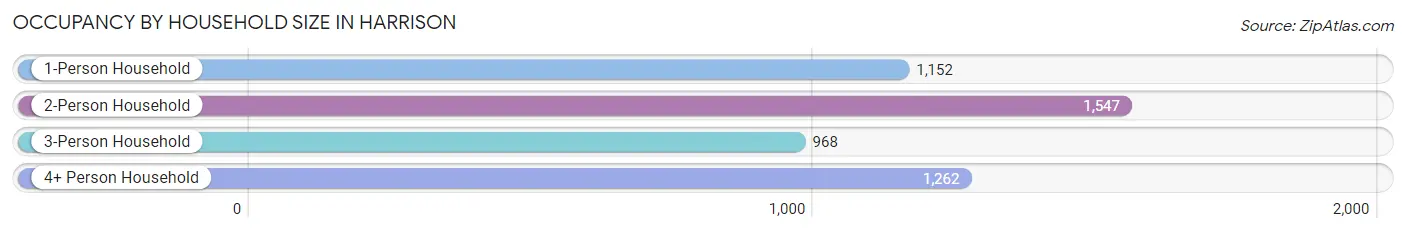
| Household Size | # Housing Units | % Housing Units |
| 1-Person Household | 1,152 | 23.4% |
| 2-Person Household | 1,547 | 31.4% |
| 3-Person Household | 968 | 19.6% |
| 4+ Person Household | 1,262 | 25.6% |
| Total Housing Units | 4,929 | 100.0% |
Occupancy by Ownership by Household Size in Harrison
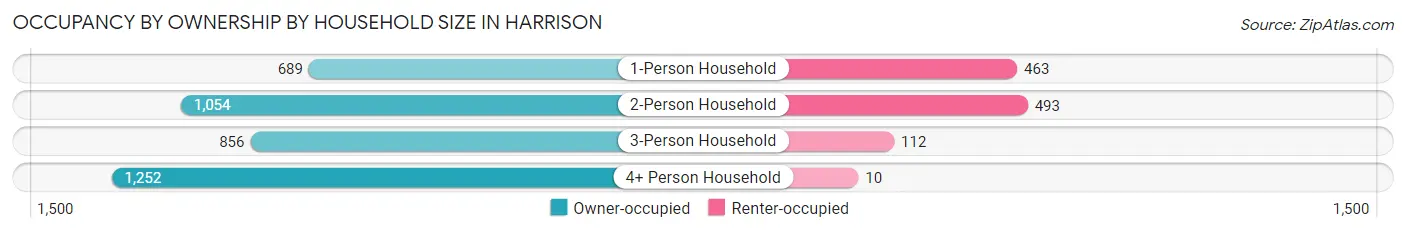
| Household Size | Owner-occupied | Renter-occupied |
| 1-Person Household | 689 (59.8%) | 463 (40.2%) |
| 2-Person Household | 1,054 (68.1%) | 493 (31.9%) |
| 3-Person Household | 856 (88.4%) | 112 (11.6%) |
| 4+ Person Household | 1,252 (99.2%) | 10 (0.8%) |
| Total Housing Units | 3,851 (78.1%) | 1,078 (21.9%) |
Occupancy by Educational Attainment in Harrison
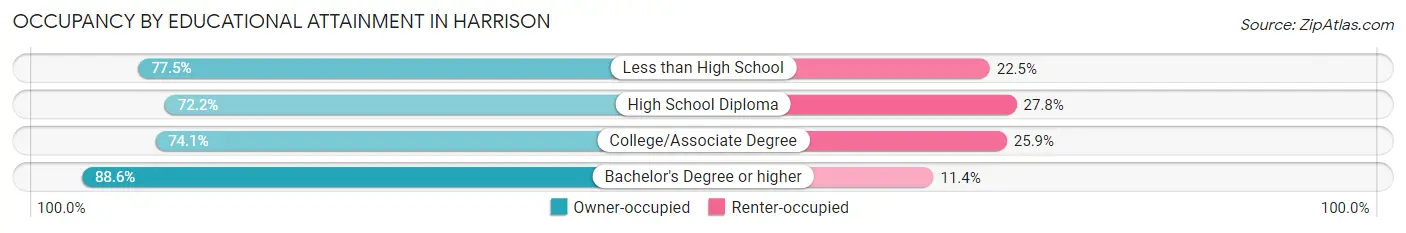
| Household Size | Owner-occupied | Renter-occupied |
| Less than High School | 196 (77.5%) | 57 (22.5%) |
| High School Diploma | 949 (72.2%) | 366 (27.8%) |
| College/Associate Degree | 1,390 (74.1%) | 486 (25.9%) |
| Bachelor's Degree or higher | 1,316 (88.6%) | 169 (11.4%) |
Occupancy by Age of Householder in Harrison
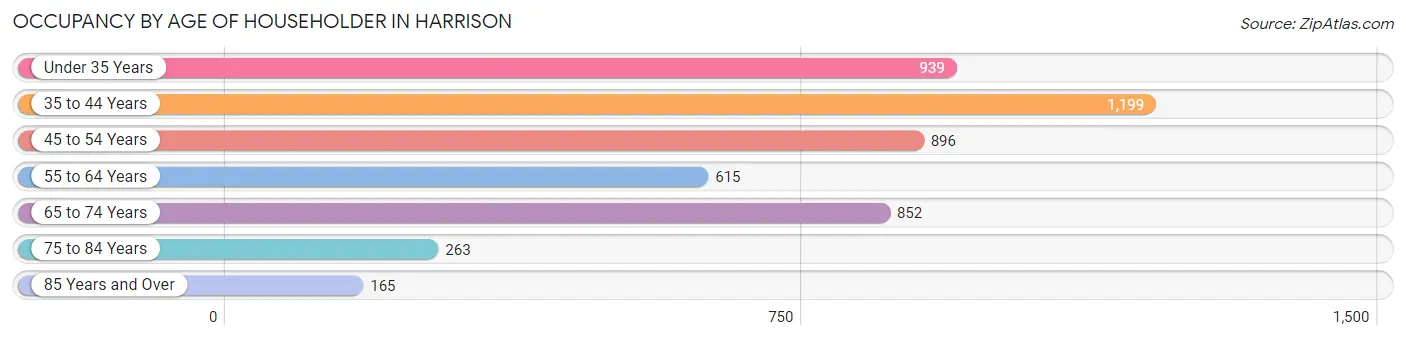
| Age Bracket | # Households | % Households |
| Under 35 Years | 939 | 19.1% |
| 35 to 44 Years | 1,199 | 24.3% |
| 45 to 54 Years | 896 | 18.2% |
| 55 to 64 Years | 615 | 12.5% |
| 65 to 74 Years | 852 | 17.3% |
| 75 to 84 Years | 263 | 5.3% |
| 85 Years and Over | 165 | 3.4% |
| Total | 4,929 | 100.0% |
Housing Finances in Harrison
Median Income by Occupancy in Harrison
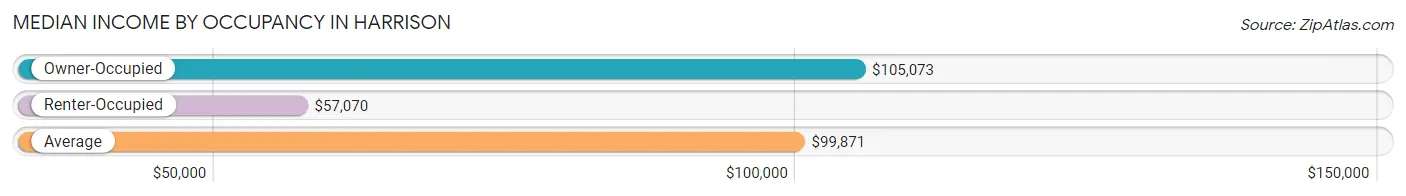
| Occupancy Type | # Households | Median Income |
| Owner-Occupied | 3,851 (78.1%) | $105,073 |
| Renter-Occupied | 1,078 (21.9%) | $57,070 |
| Average | 4,929 (100.0%) | $99,871 |
Occupancy by Householder Income Bracket in Harrison
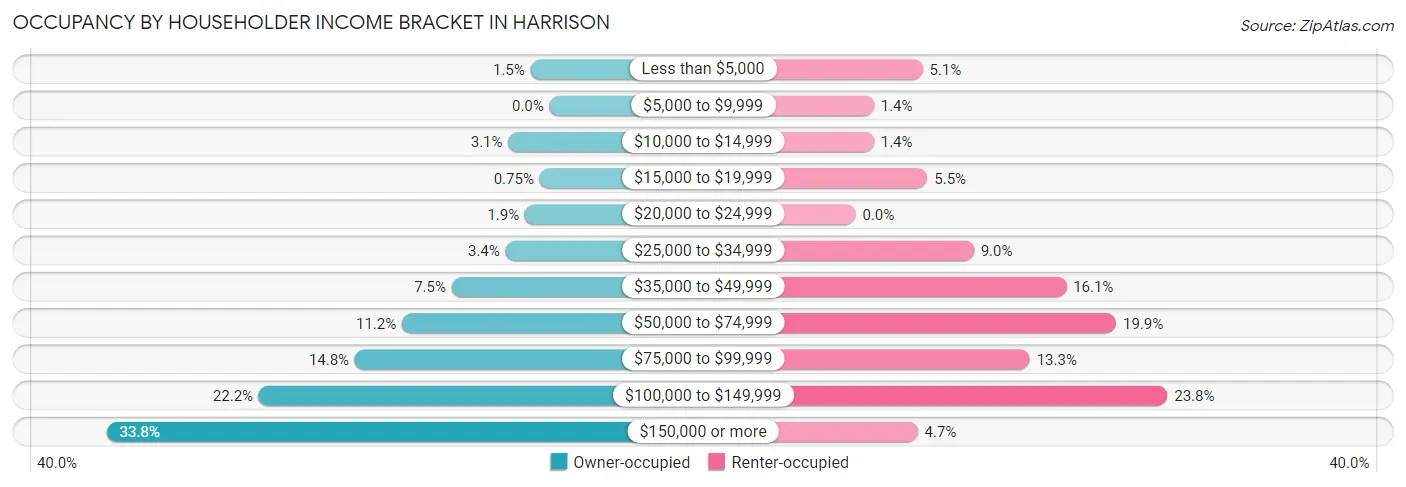
| Income Bracket | Owner-occupied | Renter-occupied |
| Less than $5,000 | 56 (1.5%) | 55 (5.1%) |
| $5,000 to $9,999 | 0 (0.0%) | 15 (1.4%) |
| $10,000 to $14,999 | 121 (3.1%) | 15 (1.4%) |
| $15,000 to $19,999 | 29 (0.7%) | 59 (5.5%) |
| $20,000 to $24,999 | 72 (1.9%) | 0 (0.0%) |
| $25,000 to $34,999 | 129 (3.4%) | 97 (9.0%) |
| $35,000 to $49,999 | 287 (7.4%) | 173 (16.1%) |
| $50,000 to $74,999 | 433 (11.2%) | 214 (19.9%) |
| $75,000 to $99,999 | 571 (14.8%) | 143 (13.3%) |
| $100,000 to $149,999 | 853 (22.2%) | 256 (23.7%) |
| $150,000 or more | 1,300 (33.8%) | 51 (4.7%) |
| Total | 3,851 (100.0%) | 1,078 (100.0%) |
Monthly Housing Cost Tiers in Harrison
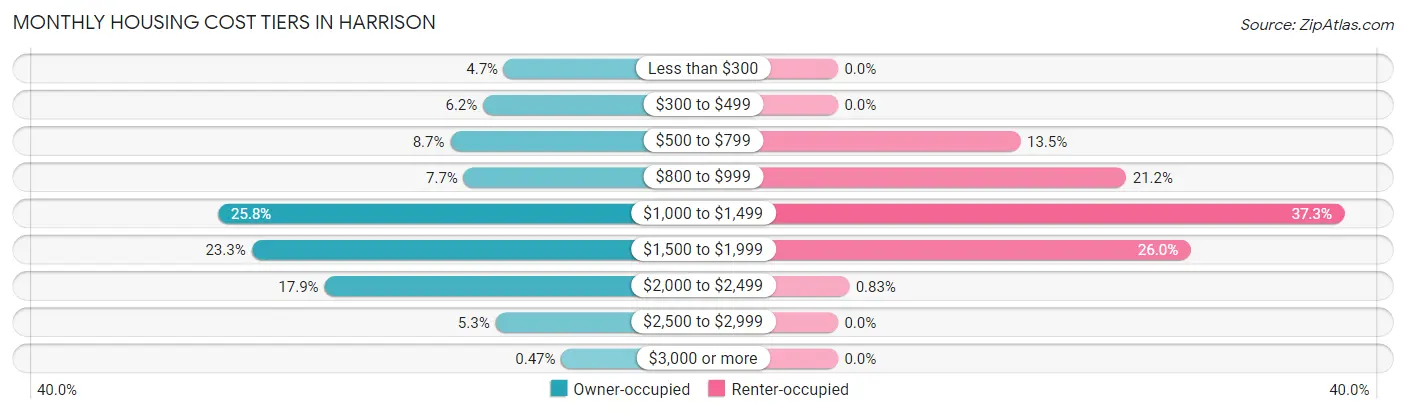
| Monthly Cost | Owner-occupied | Renter-occupied |
| Less than $300 | 181 (4.7%) | 0 (0.0%) |
| $300 to $499 | 240 (6.2%) | 0 (0.0%) |
| $500 to $799 | 333 (8.6%) | 145 (13.5%) |
| $800 to $999 | 295 (7.7%) | 229 (21.2%) |
| $1,000 to $1,499 | 992 (25.8%) | 402 (37.3%) |
| $1,500 to $1,999 | 897 (23.3%) | 280 (26.0%) |
| $2,000 to $2,499 | 690 (17.9%) | 9 (0.8%) |
| $2,500 to $2,999 | 205 (5.3%) | 0 (0.0%) |
| $3,000 or more | 18 (0.5%) | 0 (0.0%) |
| Total | 3,851 (100.0%) | 1,078 (100.0%) |
Physical Housing Characteristics in Harrison
Housing Structures in Harrison
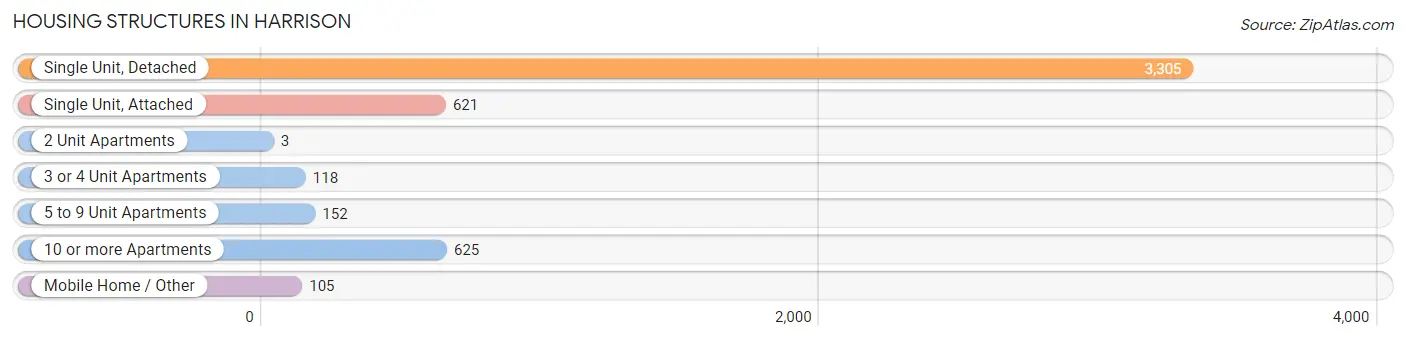
| Structure Type | # Housing Units | % Housing Units |
| Single Unit, Detached | 3,305 | 67.0% |
| Single Unit, Attached | 621 | 12.6% |
| 2 Unit Apartments | 3 | 0.1% |
| 3 or 4 Unit Apartments | 118 | 2.4% |
| 5 to 9 Unit Apartments | 152 | 3.1% |
| 10 or more Apartments | 625 | 12.7% |
| Mobile Home / Other | 105 | 2.1% |
| Total | 4,929 | 100.0% |
Housing Structures by Occupancy in Harrison
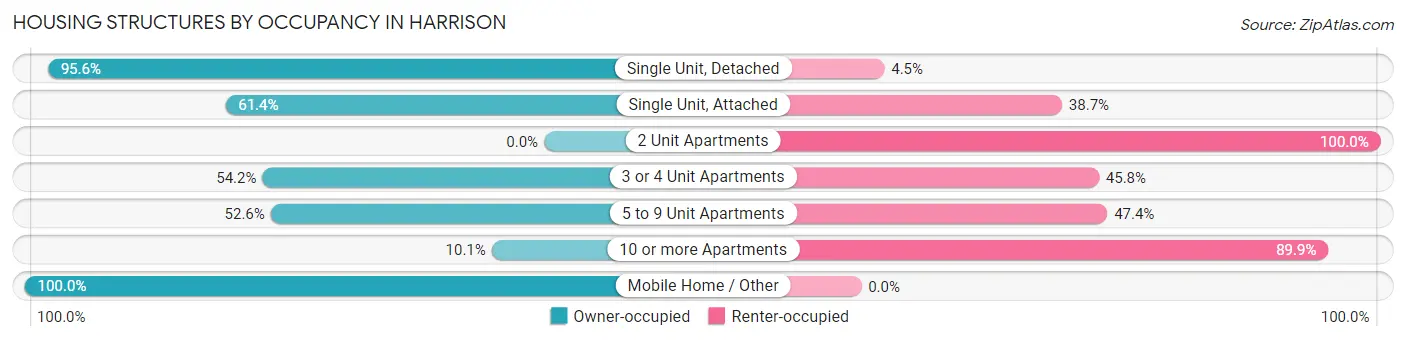
| Structure Type | Owner-occupied | Renter-occupied |
| Single Unit, Detached | 3,158 (95.6%) | 147 (4.4%) |
| Single Unit, Attached | 381 (61.4%) | 240 (38.7%) |
| 2 Unit Apartments | 0 (0.0%) | 3 (100.0%) |
| 3 or 4 Unit Apartments | 64 (54.2%) | 54 (45.8%) |
| 5 to 9 Unit Apartments | 80 (52.6%) | 72 (47.4%) |
| 10 or more Apartments | 63 (10.1%) | 562 (89.9%) |
| Mobile Home / Other | 105 (100.0%) | 0 (0.0%) |
| Total | 3,851 (78.1%) | 1,078 (21.9%) |
Housing Structures by Number of Rooms in Harrison
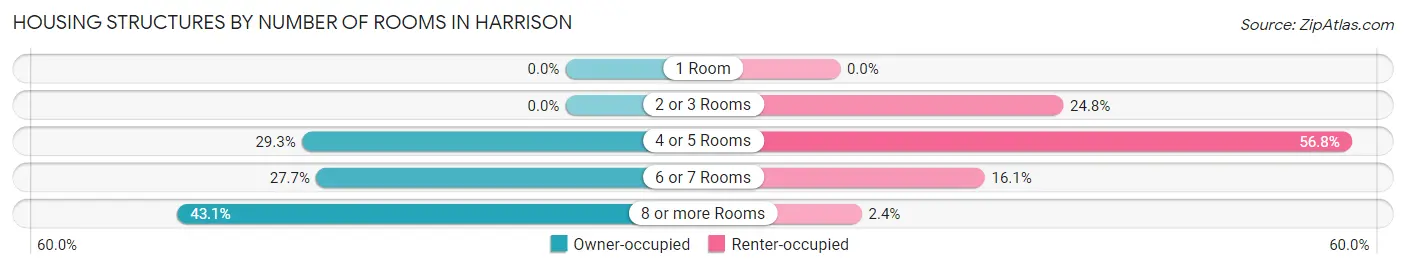
| Number of Rooms | Owner-occupied | Renter-occupied |
| 1 Room | 0 (0.0%) | 0 (0.0%) |
| 2 or 3 Rooms | 0 (0.0%) | 267 (24.8%) |
| 4 or 5 Rooms | 1,127 (29.3%) | 612 (56.8%) |
| 6 or 7 Rooms | 1,066 (27.7%) | 173 (16.1%) |
| 8 or more Rooms | 1,658 (43.0%) | 26 (2.4%) |
| Total | 3,851 (100.0%) | 1,078 (100.0%) |
Housing Structure by Heating Type in Harrison
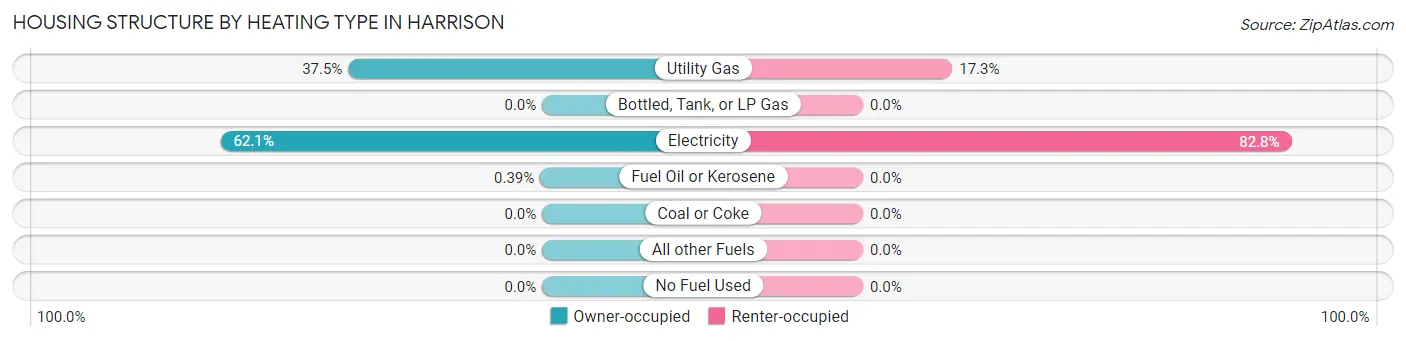
| Heating Type | Owner-occupied | Renter-occupied |
| Utility Gas | 1,443 (37.5%) | 186 (17.2%) |
| Bottled, Tank, or LP Gas | 0 (0.0%) | 0 (0.0%) |
| Electricity | 2,393 (62.1%) | 892 (82.8%) |
| Fuel Oil or Kerosene | 15 (0.4%) | 0 (0.0%) |
| Coal or Coke | 0 (0.0%) | 0 (0.0%) |
| All other Fuels | 0 (0.0%) | 0 (0.0%) |
| No Fuel Used | 0 (0.0%) | 0 (0.0%) |
| Total | 3,851 (100.0%) | 1,078 (100.0%) |
Household Vehicle Usage in Harrison
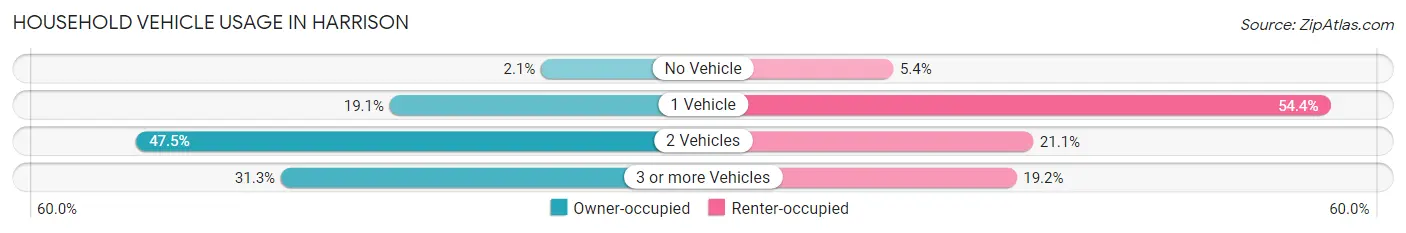
| Vehicles per Household | Owner-occupied | Renter-occupied |
| No Vehicle | 82 (2.1%) | 58 (5.4%) |
| 1 Vehicle | 735 (19.1%) | 586 (54.4%) |
| 2 Vehicles | 1,829 (47.5%) | 227 (21.1%) |
| 3 or more Vehicles | 1,205 (31.3%) | 207 (19.2%) |
| Total | 3,851 (100.0%) | 1,078 (100.0%) |
Real Estate & Mortgages in Harrison
Real Estate and Mortgage Overview in Harrison
| Characteristic | Without Mortgage | With Mortgage |
| Housing Units | 785 | 3,066 |
| Median Property Value | $160,900 | $213,700 |
| Median Household Income | $49,250 | $1,241 |
| Monthly Housing Costs | $485 | $18 |
| Real Estate Taxes | $2,270 | $38 |
Property Value by Mortgage Status in Harrison
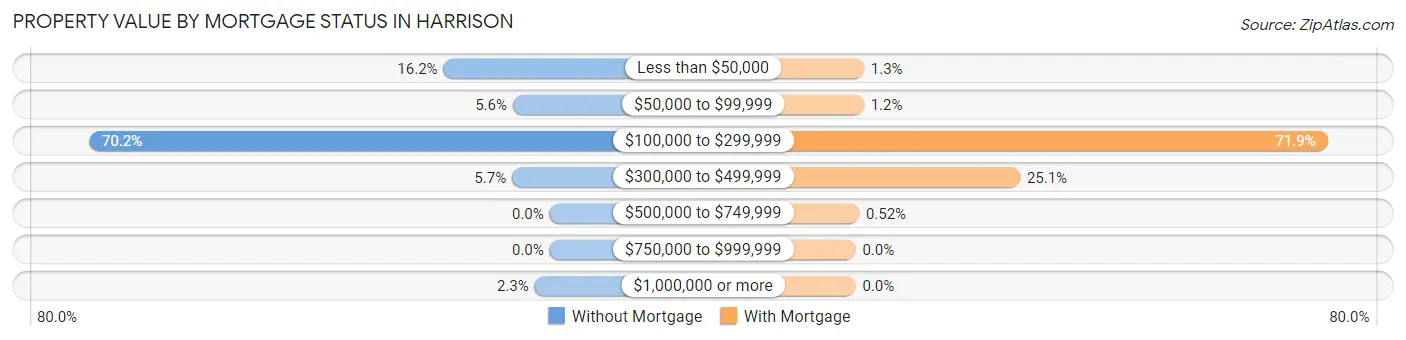
| Property Value | Without Mortgage | With Mortgage |
| Less than $50,000 | 127 (16.2%) | 39 (1.3%) |
| $50,000 to $99,999 | 44 (5.6%) | 38 (1.2%) |
| $100,000 to $299,999 | 551 (70.2%) | 2,205 (71.9%) |
| $300,000 to $499,999 | 45 (5.7%) | 768 (25.1%) |
| $500,000 to $749,999 | 0 (0.0%) | 16 (0.5%) |
| $750,000 to $999,999 | 0 (0.0%) | 0 (0.0%) |
| $1,000,000 or more | 18 (2.3%) | 0 (0.0%) |
| Total | 785 (100.0%) | 3,066 (100.0%) |
Household Income by Mortgage Status in Harrison
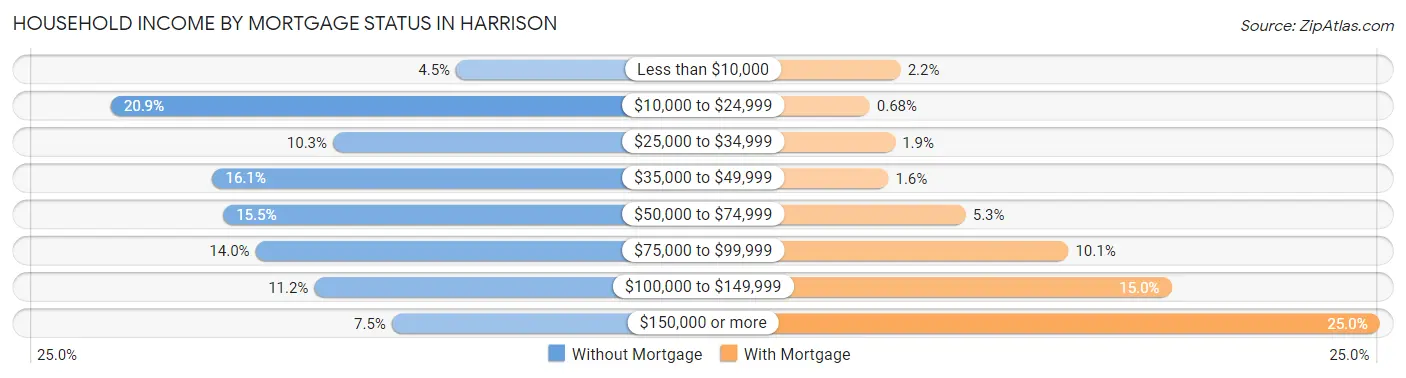
| Household Income | Without Mortgage | With Mortgage |
| Less than $10,000 | 35 (4.5%) | 66 (2.1%) |
| $10,000 to $24,999 | 164 (20.9%) | 21 (0.7%) |
| $25,000 to $34,999 | 81 (10.3%) | 58 (1.9%) |
| $35,000 to $49,999 | 126 (16.1%) | 48 (1.6%) |
| $50,000 to $74,999 | 122 (15.5%) | 161 (5.2%) |
| $75,000 to $99,999 | 110 (14.0%) | 311 (10.1%) |
| $100,000 to $149,999 | 88 (11.2%) | 461 (15.0%) |
| $150,000 or more | 59 (7.5%) | 765 (24.9%) |
| Total | 785 (100.0%) | 3,066 (100.0%) |
Property Value to Household Income Ratio in Harrison
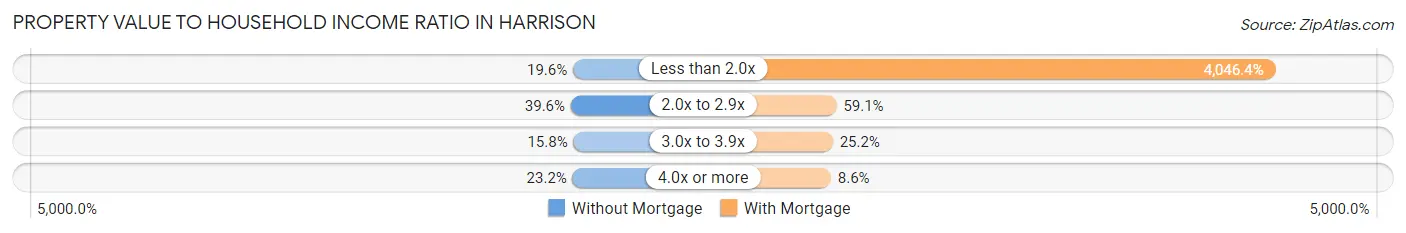
| Value-to-Income Ratio | Without Mortgage | With Mortgage |
| Less than 2.0x | 154 (19.6%) | 124,063 (4,046.4%) |
| 2.0x to 2.9x | 311 (39.6%) | 1,811 (59.1%) |
| 3.0x to 3.9x | 124 (15.8%) | 772 (25.2%) |
| 4.0x or more | 182 (23.2%) | 265 (8.6%) |
| Total | 785 (100.0%) | 3,066 (100.0%) |
Real Estate Taxes by Mortgage Status in Harrison
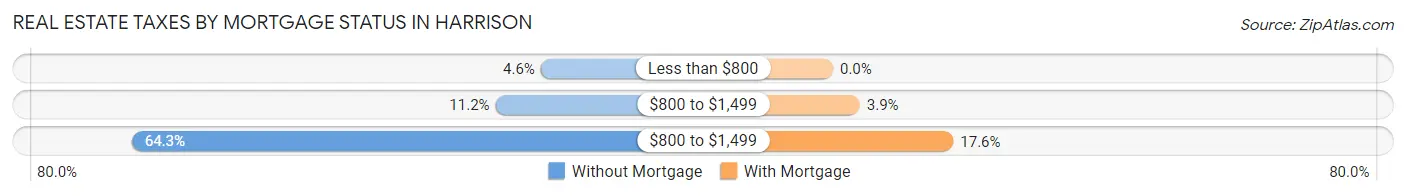
| Property Taxes | Without Mortgage | With Mortgage |
| Less than $800 | 36 (4.6%) | 0 (0.0%) |
| $800 to $1,499 | 88 (11.2%) | 120 (3.9%) |
| $800 to $1,499 | 505 (64.3%) | 539 (17.6%) |
| Total | 785 (100.0%) | 3,066 (100.0%) |
Health & Disability in Harrison
Health Insurance Coverage by Age in Harrison
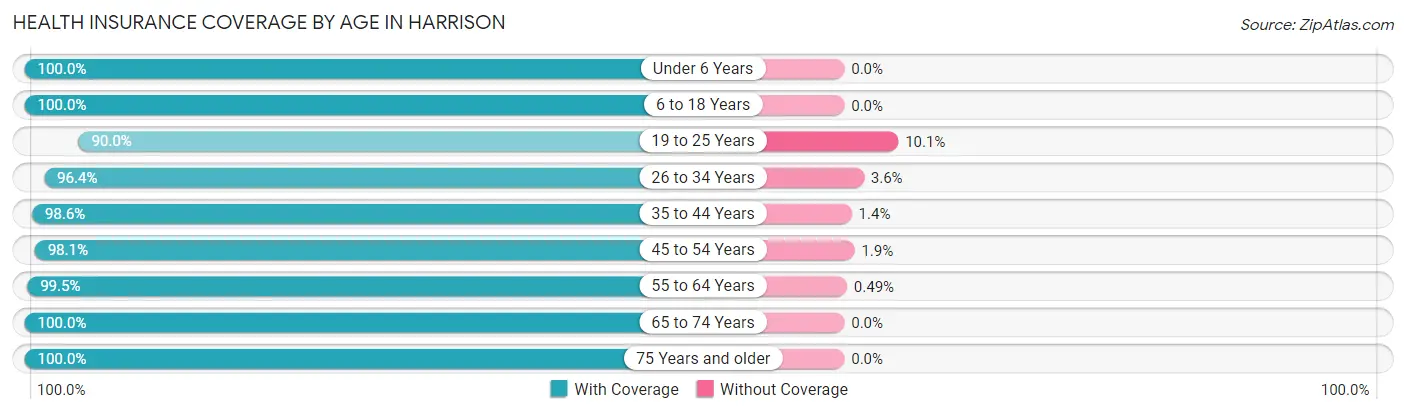
| Age Bracket | With Coverage | Without Coverage |
| Under 6 Years | 912 (100.0%) | 0 (0.0%) |
| 6 to 18 Years | 2,732 (100.0%) | 0 (0.0%) |
| 19 to 25 Years | 582 (89.9%) | 65 (10.1%) |
| 26 to 34 Years | 1,798 (96.4%) | 68 (3.6%) |
| 35 to 44 Years | 2,162 (98.6%) | 30 (1.4%) |
| 45 to 54 Years | 1,648 (98.1%) | 32 (1.9%) |
| 55 to 64 Years | 1,214 (99.5%) | 6 (0.5%) |
| 65 to 74 Years | 1,187 (100.0%) | 0 (0.0%) |
| 75 Years and older | 611 (100.0%) | 0 (0.0%) |
| Total | 12,846 (98.5%) | 201 (1.5%) |
Health Insurance Coverage by Citizenship Status in Harrison
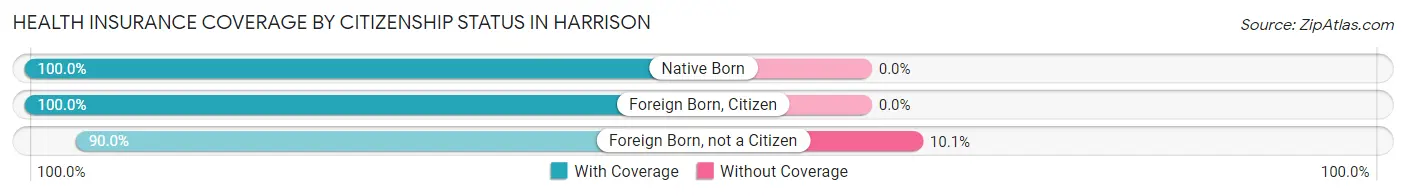
| Citizenship Status | With Coverage | Without Coverage |
| Native Born | 912 (100.0%) | 0 (0.0%) |
| Foreign Born, Citizen | 2,732 (100.0%) | 0 (0.0%) |
| Foreign Born, not a Citizen | 582 (89.9%) | 65 (10.1%) |
Health Insurance Coverage by Household Income in Harrison
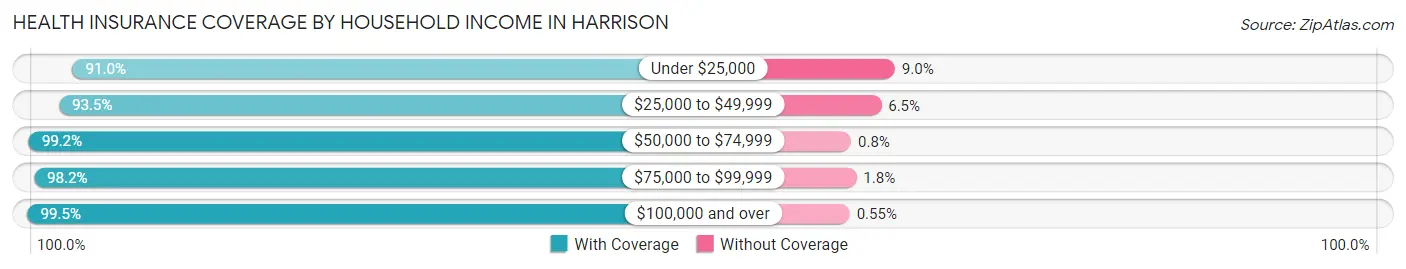
| Household Income | With Coverage | Without Coverage |
| Under $25,000 | 434 (91.0%) | 43 (9.0%) |
| $25,000 to $49,999 | 941 (93.5%) | 65 (6.5%) |
| $50,000 to $74,999 | 1,487 (99.2%) | 12 (0.8%) |
| $75,000 to $99,999 | 1,907 (98.2%) | 35 (1.8%) |
| $100,000 and over | 8,074 (99.5%) | 45 (0.5%) |
Public vs Private Health Insurance Coverage by Age in Harrison
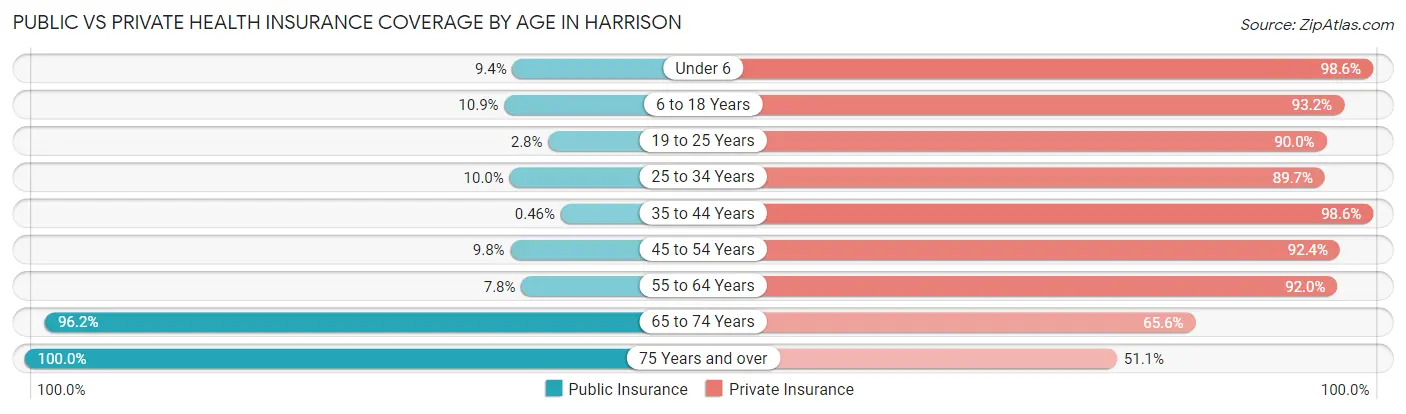
| Age Bracket | Public Insurance | Private Insurance |
| Under 6 | 86 (9.4%) | 899 (98.6%) |
| 6 to 18 Years | 299 (10.9%) | 2,546 (93.2%) |
| 19 to 25 Years | 18 (2.8%) | 582 (89.9%) |
| 25 to 34 Years | 186 (10.0%) | 1,673 (89.7%) |
| 35 to 44 Years | 10 (0.5%) | 2,162 (98.6%) |
| 45 to 54 Years | 165 (9.8%) | 1,553 (92.4%) |
| 55 to 64 Years | 95 (7.8%) | 1,122 (92.0%) |
| 65 to 74 Years | 1,142 (96.2%) | 779 (65.6%) |
| 75 Years and over | 611 (100.0%) | 312 (51.1%) |
| Total | 2,612 (20.0%) | 11,628 (89.1%) |
Disability Status by Sex by Age in Harrison
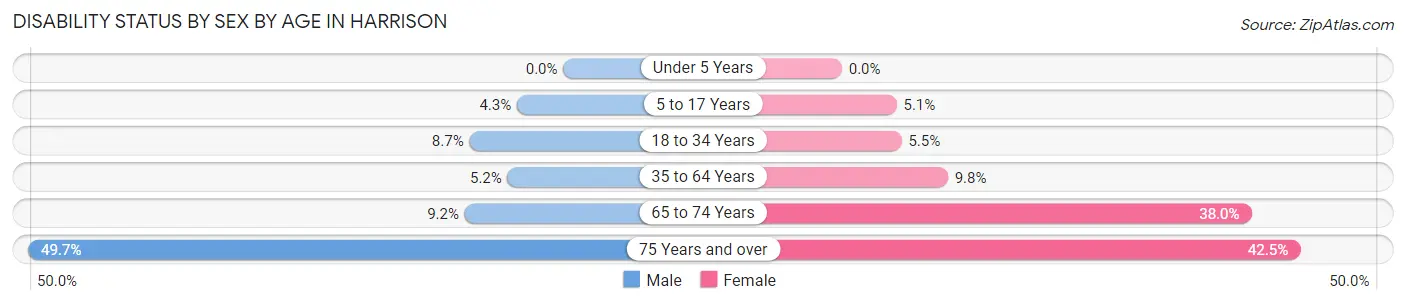
| Age Bracket | Male | Female |
| Under 5 Years | 0 (0.0%) | 0 (0.0%) |
| 5 to 17 Years | 51 (4.3%) | 82 (5.1%) |
| 18 to 34 Years | 132 (8.7%) | 64 (5.5%) |
| 35 to 64 Years | 124 (5.2%) | 265 (9.8%) |
| 65 to 74 Years | 40 (9.1%) | 285 (38.0%) |
| 75 Years and over | 154 (49.7%) | 128 (42.5%) |
Disability Class by Sex by Age in Harrison
Disability Class: Hearing Difficulty
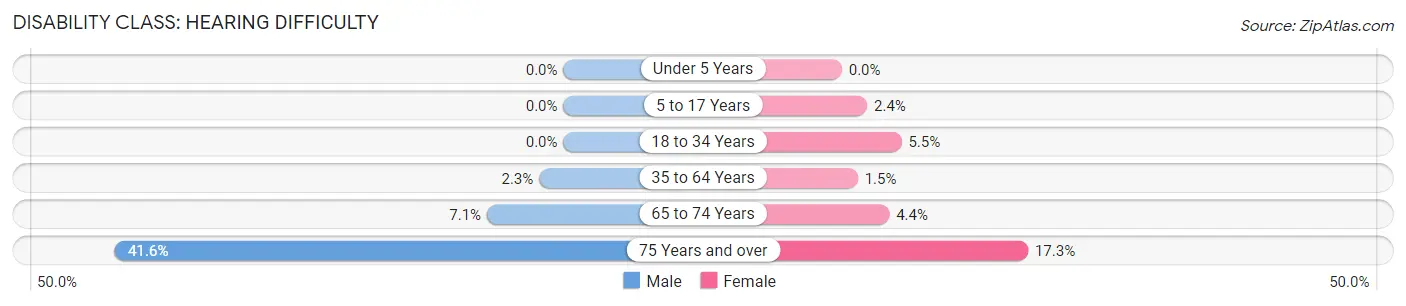
| Age Bracket | Male | Female |
| Under 5 Years | 0 (0.0%) | 0 (0.0%) |
| 5 to 17 Years | 0 (0.0%) | 38 (2.4%) |
| 18 to 34 Years | 0 (0.0%) | 64 (5.5%) |
| 35 to 64 Years | 54 (2.2%) | 40 (1.5%) |
| 65 to 74 Years | 31 (7.1%) | 33 (4.4%) |
| 75 Years and over | 129 (41.6%) | 52 (17.3%) |
Disability Class: Vision Difficulty
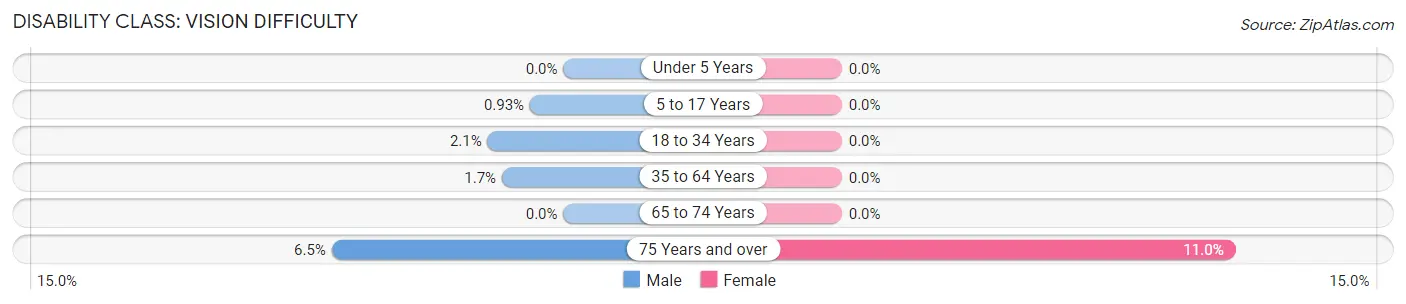
| Age Bracket | Male | Female |
| Under 5 Years | 0 (0.0%) | 0 (0.0%) |
| 5 to 17 Years | 11 (0.9%) | 0 (0.0%) |
| 18 to 34 Years | 32 (2.1%) | 0 (0.0%) |
| 35 to 64 Years | 41 (1.7%) | 0 (0.0%) |
| 65 to 74 Years | 0 (0.0%) | 0 (0.0%) |
| 75 Years and over | 20 (6.5%) | 33 (11.0%) |
Disability Class: Cognitive Difficulty
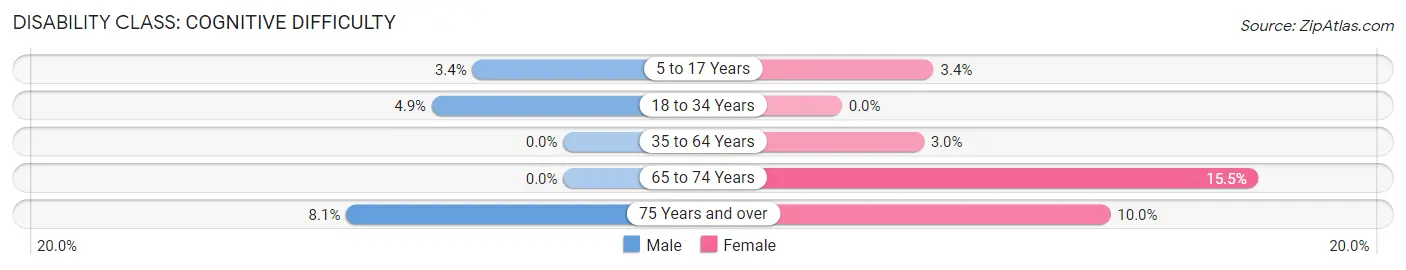
| Age Bracket | Male | Female |
| 5 to 17 Years | 40 (3.4%) | 55 (3.4%) |
| 18 to 34 Years | 74 (4.9%) | 0 (0.0%) |
| 35 to 64 Years | 0 (0.0%) | 82 (3.0%) |
| 65 to 74 Years | 0 (0.0%) | 116 (15.5%) |
| 75 Years and over | 25 (8.1%) | 30 (10.0%) |
Disability Class: Ambulatory Difficulty
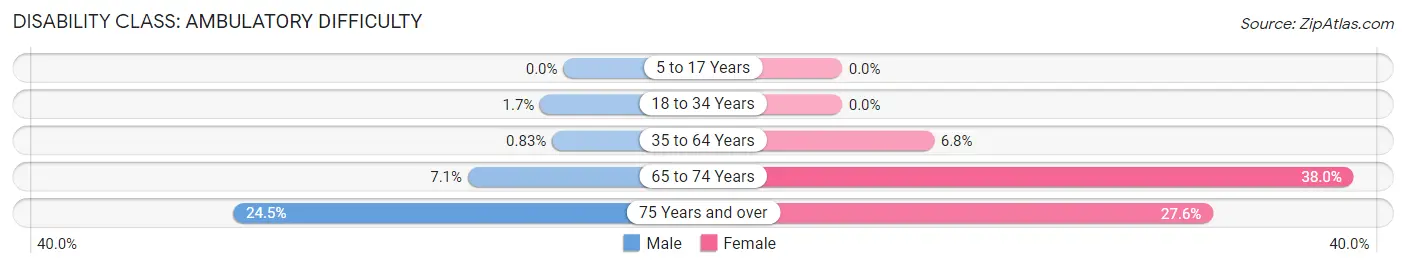
| Age Bracket | Male | Female |
| 5 to 17 Years | 0 (0.0%) | 0 (0.0%) |
| 18 to 34 Years | 26 (1.7%) | 0 (0.0%) |
| 35 to 64 Years | 20 (0.8%) | 184 (6.8%) |
| 65 to 74 Years | 31 (7.1%) | 285 (38.0%) |
| 75 Years and over | 76 (24.5%) | 83 (27.6%) |
Disability Class: Self-Care Difficulty
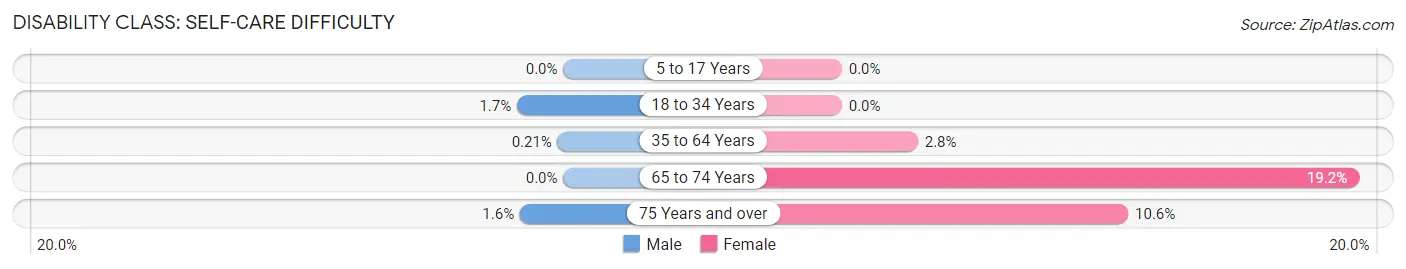
| Age Bracket | Male | Female |
| 5 to 17 Years | 0 (0.0%) | 0 (0.0%) |
| 18 to 34 Years | 26 (1.7%) | 0 (0.0%) |
| 35 to 64 Years | 5 (0.2%) | 76 (2.8%) |
| 65 to 74 Years | 0 (0.0%) | 144 (19.2%) |
| 75 Years and over | 5 (1.6%) | 32 (10.6%) |
Technology Access in Harrison
Computing Device Access in Harrison
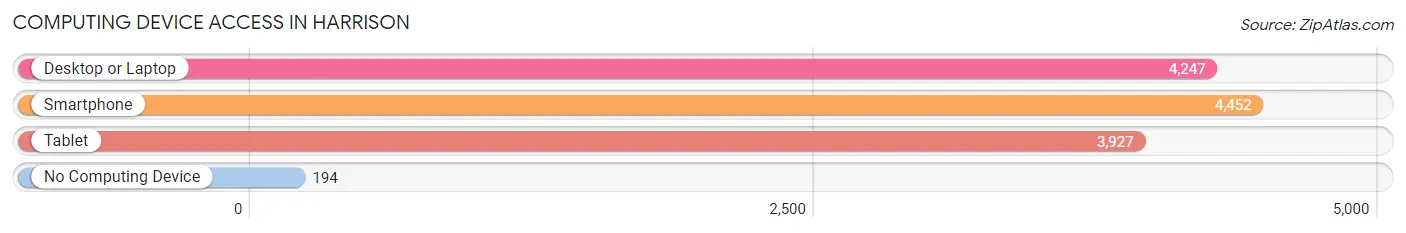
| Device Type | # Households | % Households |
| Desktop or Laptop | 4,247 | 86.2% |
| Smartphone | 4,452 | 90.3% |
| Tablet | 3,927 | 79.7% |
| No Computing Device | 194 | 3.9% |
| Total | 4,929 | 100.0% |
Internet Access in Harrison
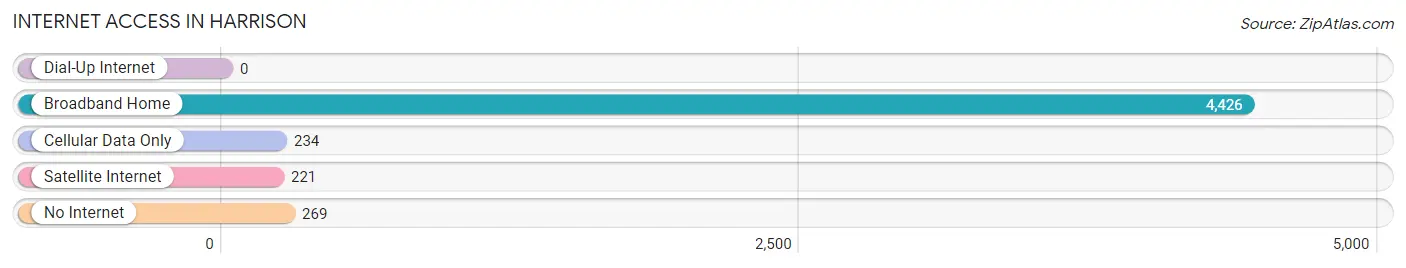
| Internet Type | # Households | % Households |
| Dial-Up Internet | 0 | 0.0% |
| Broadband Home | 4,426 | 89.8% |
| Cellular Data Only | 234 | 4.8% |
| Satellite Internet | 221 | 4.5% |
| No Internet | 269 | 5.5% |
| Total | 4,929 | 100.0% |
Harrison Summary
Harrison, Ohio is a small city located in Hamilton County, Ohio. It is situated on the banks of the Great Miami River, approximately 15 miles north of Cincinnati. The city was founded in 1810 and was named after General William Henry Harrison, the ninth President of the United States. The city has a population of approximately 9,000 people and is part of the Cincinnati metropolitan area.
Geography
Harrison is located in the southwestern corner of Hamilton County, Ohio. It is situated on the banks of the Great Miami River, approximately 15 miles north of Cincinnati. The city is bordered by the townships of Crosby, Whitewater, and Harrison. The city has a total area of 4.2 square miles, all of which is land. The terrain is mostly flat, with some rolling hills in the northern part of the city.
Climate
Harrison has a humid continental climate, with hot, humid summers and cold, snowy winters. The average annual temperature is around 50°F, with average highs in the summer reaching around 85°F and average lows in the winter reaching around 20°F. The city receives an average of 40 inches of precipitation per year, with most of it falling in the spring and summer months.
Demographics
As of the 2010 census, the population of Harrison was 8,944. The racial makeup of the city was 91.3% White, 4.2% African American, 0.3% Native American, 0.7% Asian, 0.1% Pacific Islander, 1.2% from other races, and 2.3% from two or more races. Hispanic or Latino of any race were 3.2% of the population.
Economy
Harrison’s economy is largely based on manufacturing and retail. The city is home to several large manufacturing companies, including the Harrison Radiator Division of General Motors, the Harrison Steel Casting Company, and the Harrison Foundry. The city also has a number of retail stores, including a Walmart Supercenter, a Kroger grocery store, and several restaurants.
The city is also home to several educational institutions, including the Harrison College of Business and Technology, the Harrison Career Center, and the Harrison Public Library.
Conclusion
Harrison, Ohio is a small city located in Hamilton County, Ohio. It is situated on the banks of the Great Miami River, approximately 15 miles north of Cincinnati. The city was founded in 1810 and was named after General William Henry Harrison, the ninth President of the United States. The city has a population of approximately 9,000 people and is part of the Cincinnati metropolitan area. The city has a humid continental climate, with hot, humid summers and cold, snowy winters. The economy of Harrison is largely based on manufacturing and retail, with several large manufacturing companies and retail stores located in the city. The city is also home to several educational institutions, including the Harrison College of Business and Technology, the Harrison Career Center, and the Harrison Public Library.
Common Questions
What is Per Capita Income in Harrison?
Per Capita income in Harrison is $41,287.
What is the Median Family Income in Harrison?
Median Family Income in Harrison is $112,050.
What is the Median Household income in Harrison?
Median Household Income in Harrison is $99,871.
What is Income or Wage Gap in Harrison?
Income or Wage Gap in Harrison is 30.4%.
Women in Harrison earn 69.6 cents for every dollar earned by a man.
What is Inequality or Gini Index in Harrison?
Inequality or Gini Index in Harrison is 0.36.
What is the Total Population of Harrison?
Total Population of Harrison is 13,086.
What is the Total Male Population of Harrison?
Total Male Population of Harrison is 6,322.
What is the Total Female Population of Harrison?
Total Female Population of Harrison is 6,764.
What is the Ratio of Males per 100 Females in Harrison?
There are 93.47 Males per 100 Females in Harrison.
What is the Ratio of Females per 100 Males in Harrison?
There are 106.99 Females per 100 Males in Harrison.
What is the Median Population Age in Harrison?
Median Population Age in Harrison is 36.9 Years.
What is the Average Family Size in Harrison
Average Family Size in Harrison is 3.1 People.
What is the Average Household Size in Harrison
Average Household Size in Harrison is 2.6 People.
How Large is the Labor Force in Harrison?
There are 7,663 People in the Labor Forcein in Harrison.
What is the Percentage of People in the Labor Force in Harrison?
77.8% of People are in the Labor Force in Harrison.
What is the Unemployment Rate in Harrison?
Unemployment Rate in Harrison is 0.9%.