Soquel, CA Map & Demographics
Soquel Map
Soquel Overview
$61,066
PER CAPITA INCOME
$146,346
AVG FAMILY INCOME
$113,918
AVG HOUSEHOLD INCOME
41.9%
WAGE / INCOME GAP [ % ]
58.1¢/ $1
WAGE / INCOME GAP [ $ ]
0.46
INEQUALITY / GINI INDEX
10,505
TOTAL POPULATION
5,212
MALE POPULATION
5,293
FEMALE POPULATION
98.47
MALES / 100 FEMALES
101.55
FEMALES / 100 MALES
42.2
MEDIAN AGE
3.2
AVG FAMILY SIZE
2.5
AVG HOUSEHOLD SIZE
5,519
LABOR FORCE [ PEOPLE ]
62.9%
PERCENT IN LABOR FORCE
4.5%
UNEMPLOYMENT RATE
Soquel Zip Codes
Soquel Area Codes
Income in Soquel
Income Overview in Soquel
Per Capita Income in Soquel is $61,066, while median incomes of families and households are $146,346 and $113,918 respectively.
| Characteristic | Number | Measure |
| Per Capita Income | 10,505 | $61,066 |
| Median Family Income | 2,480 | $146,346 |
| Mean Family Income | 2,480 | $190,879 |
| Median Household Income | 4,127 | $113,918 |
| Mean Household Income | 4,127 | $154,464 |
| Income Deficit | 2,480 | $0 |
| Wage / Income Gap (%) | 10,505 | 41.88% |
| Wage / Income Gap ($) | 10,505 | 58.12¢ per $1 |
| Gini / Inequality Index | 10,505 | 0.46 |
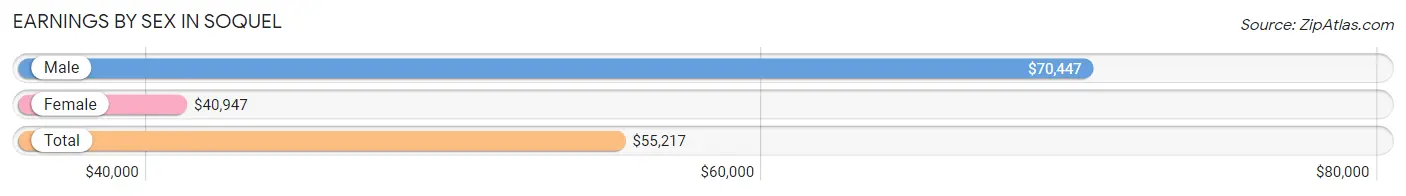
Earnings by Sex in Soquel
Average Earnings in Soquel are $55,217, $70,447 for men and $40,947 for women, a difference of 41.9%.
| Sex | Number | Average Earnings |
| Male | 2,992 (50.9%) | $70,447 |
| Female | 2,882 (49.1%) | $40,947 |
| Total | 5,874 (100.0%) | $55,217 |
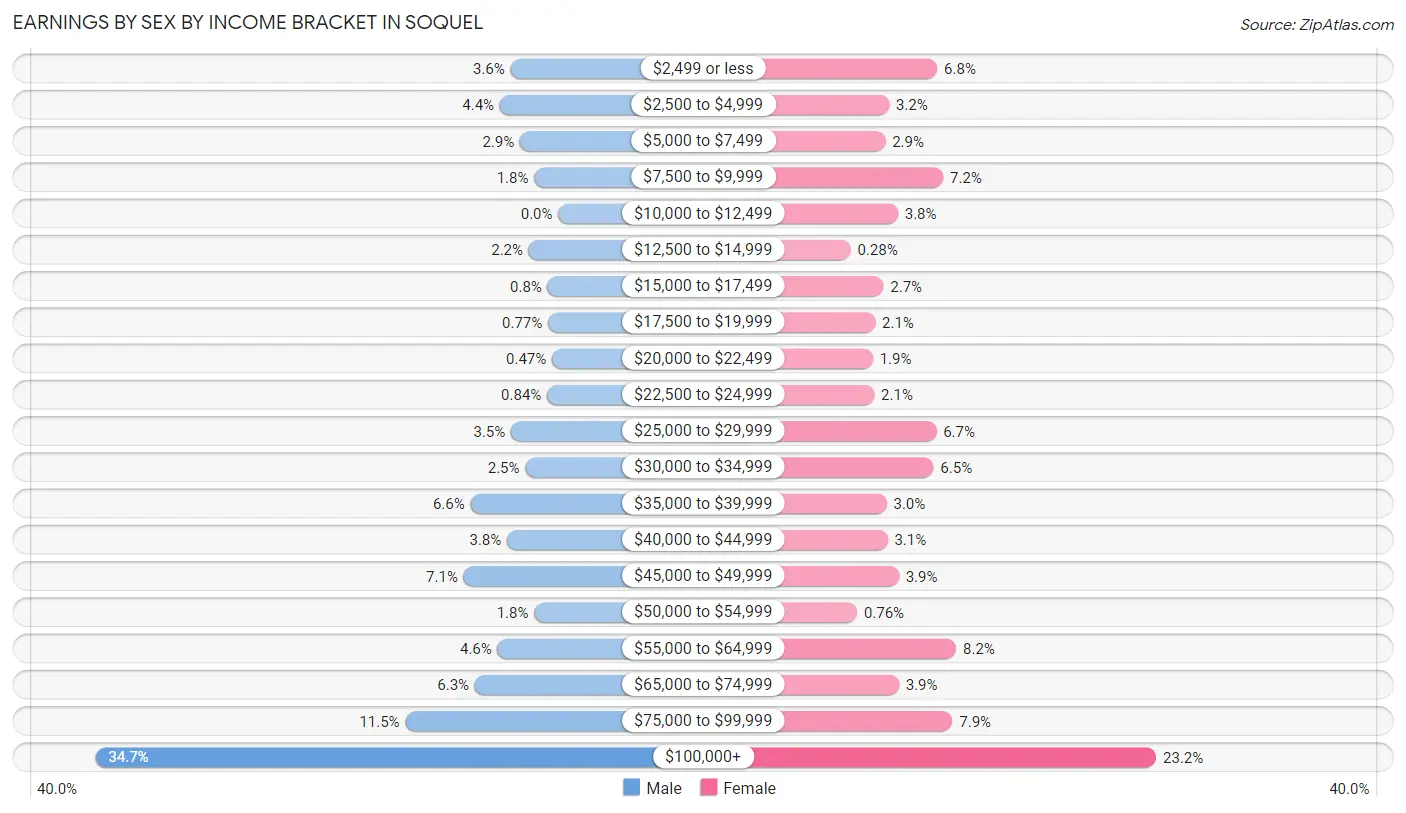
Earnings by Sex by Income Bracket in Soquel
The most common earnings brackets in Soquel are $100,000+ for men (1,038 | 34.7%) and $100,000+ for women (668 | 23.2%).
| Income | Male | Female |
| $2,499 or less | 107 (3.6%) | 195 (6.8%) |
| $2,500 to $4,999 | 131 (4.4%) | 91 (3.2%) |
| $5,000 to $7,499 | 86 (2.9%) | 83 (2.9%) |
| $7,500 to $9,999 | 54 (1.8%) | 208 (7.2%) |
| $10,000 to $12,499 | 0 (0.0%) | 110 (3.8%) |
| $12,500 to $14,999 | 66 (2.2%) | 8 (0.3%) |
| $15,000 to $17,499 | 24 (0.8%) | 79 (2.7%) |
| $17,500 to $19,999 | 23 (0.8%) | 61 (2.1%) |
| $20,000 to $22,499 | 14 (0.5%) | 56 (1.9%) |
| $22,500 to $24,999 | 25 (0.8%) | 59 (2.1%) |
| $25,000 to $29,999 | 106 (3.5%) | 193 (6.7%) |
| $30,000 to $34,999 | 74 (2.5%) | 187 (6.5%) |
| $35,000 to $39,999 | 197 (6.6%) | 86 (3.0%) |
| $40,000 to $44,999 | 115 (3.8%) | 88 (3.0%) |
| $45,000 to $49,999 | 212 (7.1%) | 112 (3.9%) |
| $50,000 to $54,999 | 54 (1.8%) | 22 (0.8%) |
| $55,000 to $64,999 | 136 (4.5%) | 236 (8.2%) |
| $65,000 to $74,999 | 187 (6.2%) | 112 (3.9%) |
| $75,000 to $99,999 | 343 (11.5%) | 228 (7.9%) |
| $100,000+ | 1,038 (34.7%) | 668 (23.2%) |
| Total | 2,992 (100.0%) | 2,882 (100.0%) |
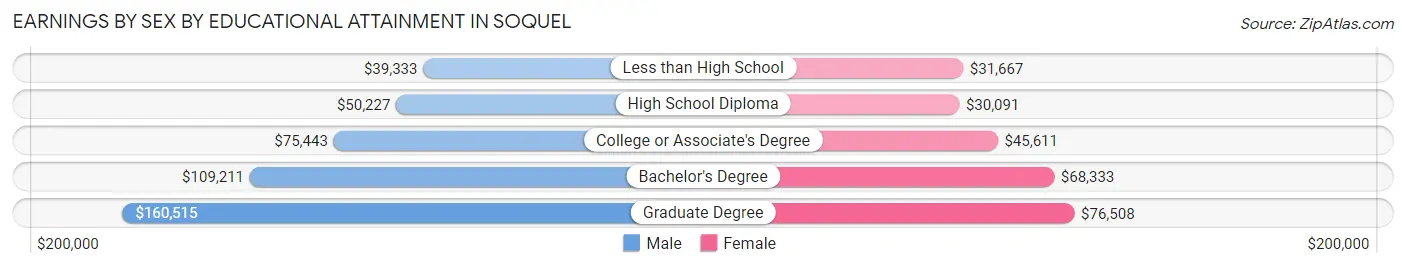
Earnings by Sex by Educational Attainment in Soquel
Average earnings in Soquel are $76,659 for men and $57,799 for women, a difference of 24.6%. Men with an educational attainment of graduate degree enjoy the highest average annual earnings of $160,515, while those with less than high school education earn the least with $39,333. Women with an educational attainment of graduate degree earn the most with the average annual earnings of $76,508, while those with high school diploma education have the smallest earnings of $30,091.
| Educational Attainment | Male Income | Female Income |
| Less than High School | $39,333 | $31,667 |
| High School Diploma | $50,227 | $30,091 |
| College or Associate's Degree | $75,443 | $45,611 |
| Bachelor's Degree | $109,211 | $68,333 |
| Graduate Degree | $160,515 | $76,508 |
| Total | $76,659 | $57,799 |
Family Income in Soquel
Family Income Brackets in Soquel
According to the Soquel family income data, there are 878 families falling into the $200,000+ income range, which is the most common income bracket and makes up 35.4% of all families.
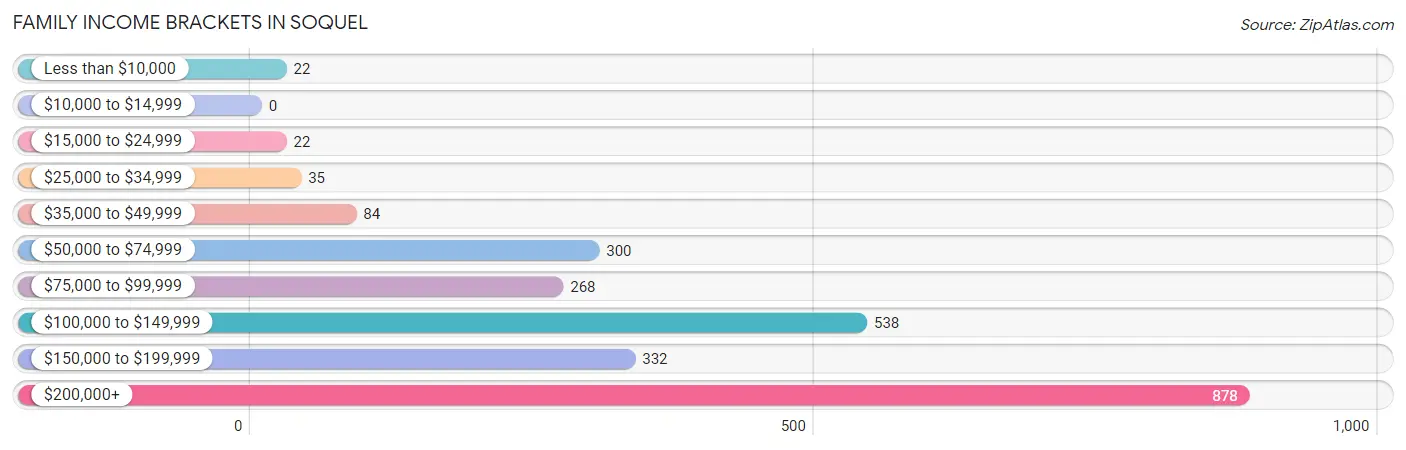
| Income Bracket | # Families | % Families |
| Less than $10,000 | 22 | 0.9% |
| $10,000 to $14,999 | 0 | 0.0% |
| $15,000 to $24,999 | 22 | 0.9% |
| $25,000 to $34,999 | 35 | 1.4% |
| $35,000 to $49,999 | 84 | 3.4% |
| $50,000 to $74,999 | 300 | 12.1% |
| $75,000 to $99,999 | 268 | 10.8% |
| $100,000 to $149,999 | 538 | 21.7% |
| $150,000 to $199,999 | 332 | 13.4% |
| $200,000+ | 878 | 35.4% |
Family Income by Famaliy Size in Soquel
6-person families (78 | 3.2%) account for the highest median family income in Soquel with $250,001 per family, while 2-person families (1,102 | 44.4%) have the highest median income of $64,861 per family member.
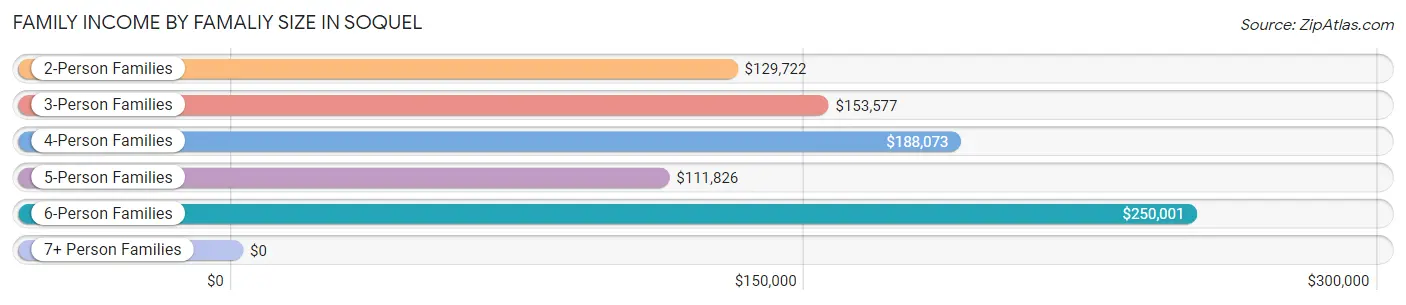
| Income Bracket | # Families | Median Income |
| 2-Person Families | 1,102 (44.4%) | $129,722 |
| 3-Person Families | 543 (21.9%) | $153,577 |
| 4-Person Families | 497 (20.0%) | $188,073 |
| 5-Person Families | 226 (9.1%) | $111,826 |
| 6-Person Families | 78 (3.2%) | $250,001 |
| 7+ Person Families | 34 (1.4%) | $0 |
| Total | 2,480 (100.0%) | $146,346 |
Family Income by Number of Earners in Soquel
The median family income in Soquel is $146,346, with families comprising 3+ earners (326) having the highest median family income of $188,646, while families with 1 earner (672) have the lowest median family income of $113,026, accounting for 13.2% and 27.1% of families, respectively.
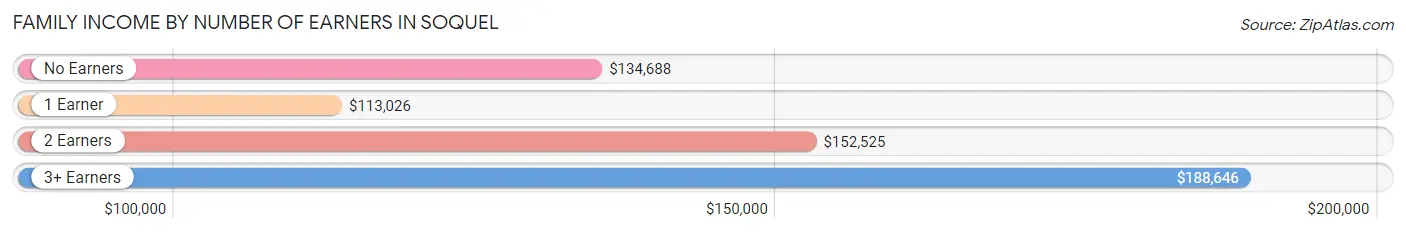
| Number of Earners | # Families | Median Income |
| No Earners | 200 (8.1%) | $134,688 |
| 1 Earner | 672 (27.1%) | $113,026 |
| 2 Earners | 1,282 (51.7%) | $152,525 |
| 3+ Earners | 326 (13.2%) | $188,646 |
| Total | 2,480 (100.0%) | $146,346 |
Household Income in Soquel
Household Income Brackets in Soquel
With 995 households falling in the category, the $200,000+ income range is the most frequent in Soquel, accounting for 24.1% of all households. In contrast, only 136 households (3.3%) fall into the less than $10,000 income bracket, making it the least populous group.
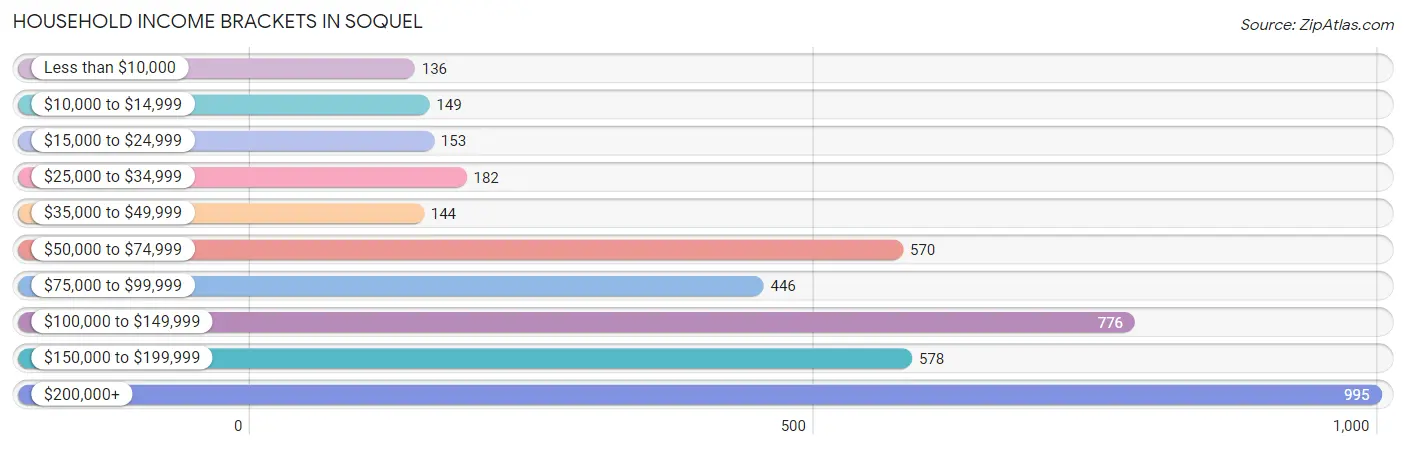
| Income Bracket | # Households | % Households |
| Less than $10,000 | 136 | 3.3% |
| $10,000 to $14,999 | 149 | 3.6% |
| $15,000 to $24,999 | 153 | 3.7% |
| $25,000 to $34,999 | 182 | 4.4% |
| $35,000 to $49,999 | 144 | 3.5% |
| $50,000 to $74,999 | 570 | 13.8% |
| $75,000 to $99,999 | 446 | 10.8% |
| $100,000 to $149,999 | 776 | 18.8% |
| $150,000 to $199,999 | 578 | 14.0% |
| $200,000+ | 995 | 24.1% |
Household Income by Householder Age in Soquel
The median household income in Soquel is $113,918, with the highest median household income of $135,774 found in the 45 to 64 years age bracket for the primary householder. A total of 1,555 households (37.7%) fall into this category. Meanwhile, the 15 to 24 years age bracket for the primary householder has the lowest median household income of $0, with 35 households (0.9%) in this group.
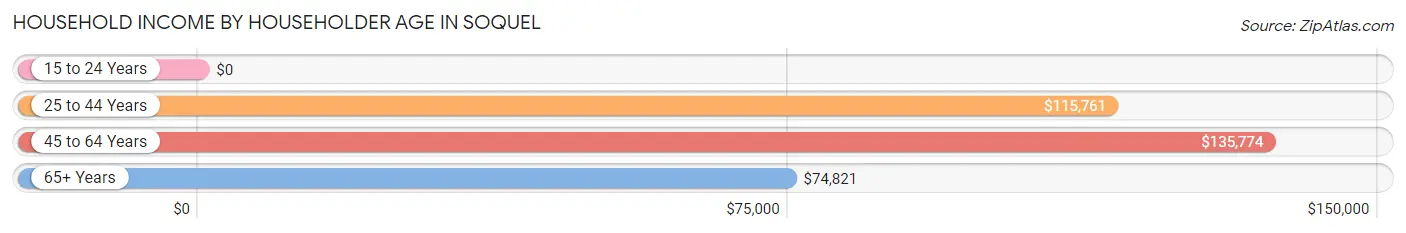
| Income Bracket | # Households | Median Income |
| 15 to 24 Years | 35 (0.9%) | $0 |
| 25 to 44 Years | 960 (23.3%) | $115,761 |
| 45 to 64 Years | 1,555 (37.7%) | $135,774 |
| 65+ Years | 1,577 (38.2%) | $74,821 |
| Total | 4,127 (100.0%) | $113,918 |
Poverty in Soquel
Income Below Poverty by Sex and Age in Soquel
With 5.5% poverty level for males and 7.0% for females among the residents of Soquel, 16 and 17 year old males and 18 to 24 year old females are the most vulnerable to poverty, with 32 males (14.4%) and 119 females (20.1%) in their respective age groups living below the poverty level.
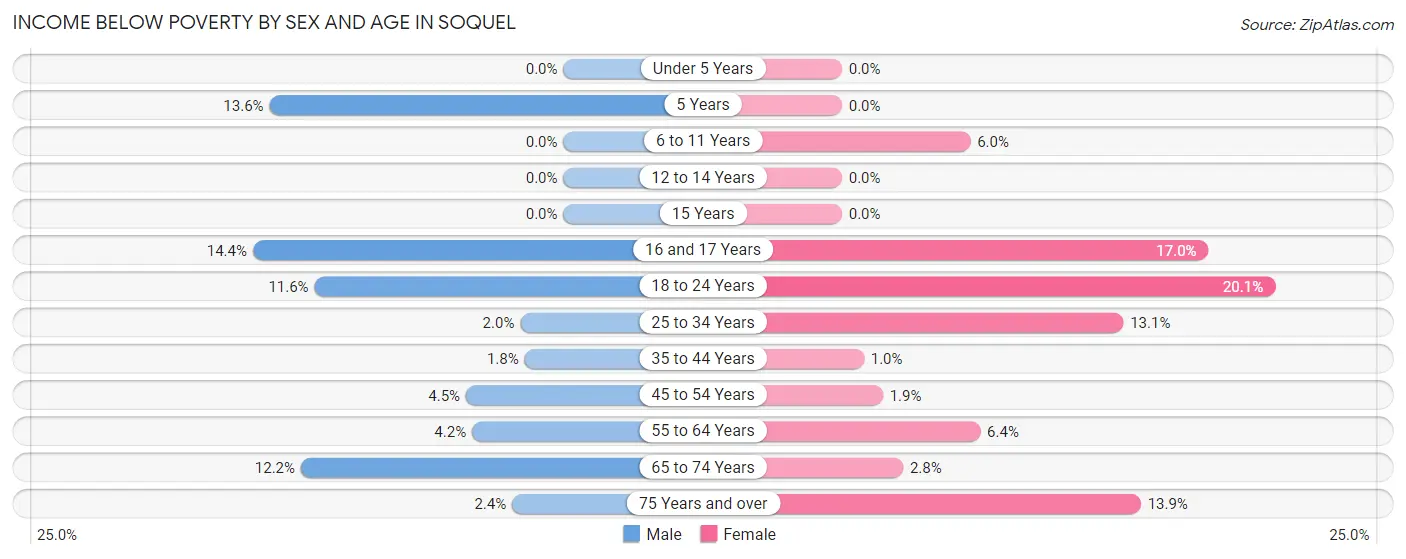
| Age Bracket | Male | Female |
| Under 5 Years | 0 (0.0%) | 0 (0.0%) |
| 5 Years | 9 (13.6%) | 0 (0.0%) |
| 6 to 11 Years | 0 (0.0%) | 13 (6.0%) |
| 12 to 14 Years | 0 (0.0%) | 0 (0.0%) |
| 15 Years | 0 (0.0%) | 0 (0.0%) |
| 16 and 17 Years | 32 (14.4%) | 25 (17.0%) |
| 18 to 24 Years | 58 (11.6%) | 119 (20.1%) |
| 25 to 34 Years | 9 (2.0%) | 61 (13.1%) |
| 35 to 44 Years | 11 (1.8%) | 8 (1.0%) |
| 45 to 54 Years | 32 (4.5%) | 10 (1.9%) |
| 55 to 64 Years | 32 (4.2%) | 47 (6.4%) |
| 65 to 74 Years | 99 (12.2%) | 22 (2.8%) |
| 75 Years and over | 5 (2.4%) | 67 (13.9%) |
| Total | 287 (5.5%) | 372 (7.0%) |
Income Above Poverty by Sex and Age in Soquel
According to the poverty statistics in Soquel, males aged under 5 years and females aged under 5 years are the age groups that are most secure financially, with 100.0% of males and 100.0% of females in these age groups living above the poverty line.
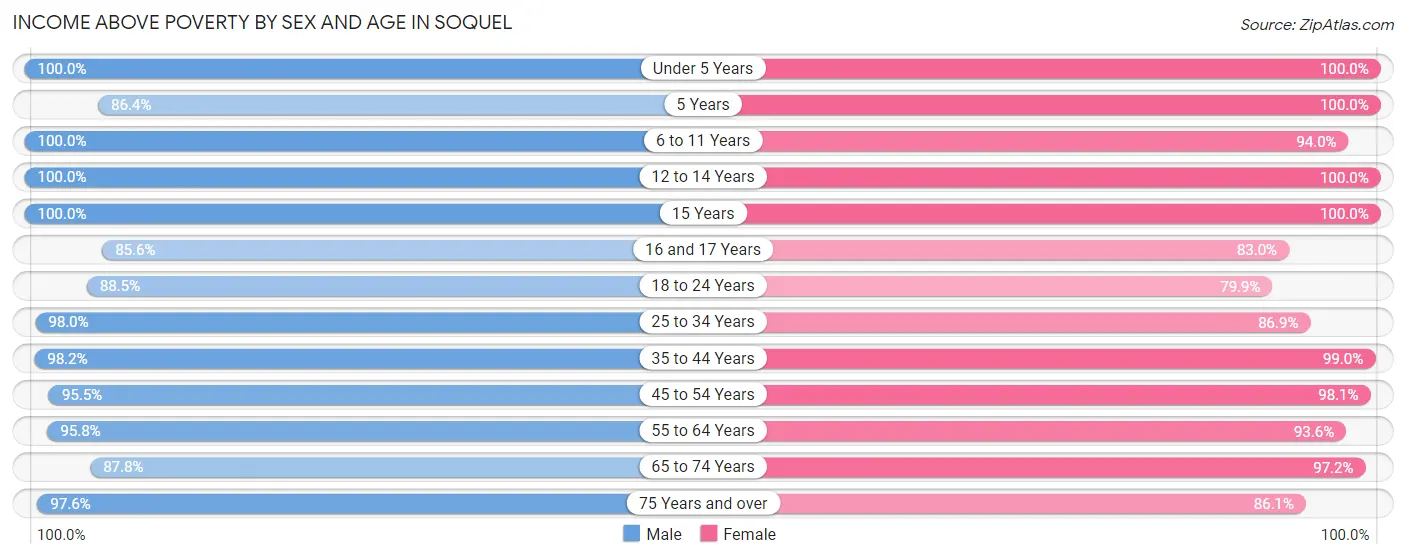
| Age Bracket | Male | Female |
| Under 5 Years | 183 (100.0%) | 297 (100.0%) |
| 5 Years | 57 (86.4%) | 15 (100.0%) |
| 6 to 11 Years | 513 (100.0%) | 205 (94.0%) |
| 12 to 14 Years | 126 (100.0%) | 197 (100.0%) |
| 15 Years | 43 (100.0%) | 53 (100.0%) |
| 16 and 17 Years | 190 (85.6%) | 122 (83.0%) |
| 18 to 24 Years | 444 (88.4%) | 473 (79.9%) |
| 25 to 34 Years | 441 (98.0%) | 406 (86.9%) |
| 35 to 44 Years | 601 (98.2%) | 774 (99.0%) |
| 45 to 54 Years | 676 (95.5%) | 515 (98.1%) |
| 55 to 64 Years | 723 (95.8%) | 685 (93.6%) |
| 65 to 74 Years | 714 (87.8%) | 752 (97.2%) |
| 75 Years and over | 205 (97.6%) | 416 (86.1%) |
| Total | 4,916 (94.5%) | 4,910 (93.0%) |
Income Below Poverty Among Married-Couple Families in Soquel
The poverty statistics for married-couple families in Soquel show that 0.6% or 13 of the total 2,020 families live below the poverty line. Families with no children have the highest poverty rate of 1.2%, comprising of 13 families. On the other hand, families with 1 or 2 children have the lowest poverty rate of 0.0%, which includes 0 families.
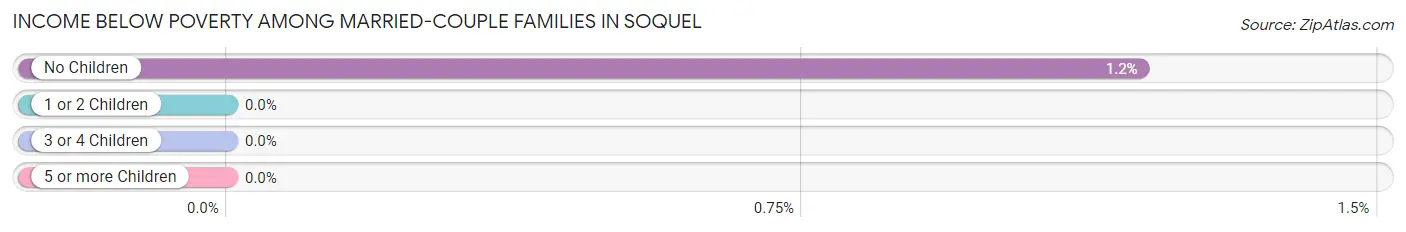
| Children | Above Poverty | Below Poverty |
| No Children | 1,080 (98.8%) | 13 (1.2%) |
| 1 or 2 Children | 700 (100.0%) | 0 (0.0%) |
| 3 or 4 Children | 227 (100.0%) | 0 (0.0%) |
| 5 or more Children | 0 (0.0%) | 0 (0.0%) |
| Total | 2,007 (99.4%) | 13 (0.6%) |
Income Below Poverty Among Single-Parent Households in Soquel
According to the poverty data in Soquel, 23.3% or 20 single-father households and 3.2% or 12 single-mother households are living below the poverty line. Among single-father households, those with no children have the highest poverty rate, with 11 households (29.7%) experiencing poverty. Likewise, among single-mother households, those with 1 or 2 children have the highest poverty rate, with 12 households (7.4%) falling below the poverty line.
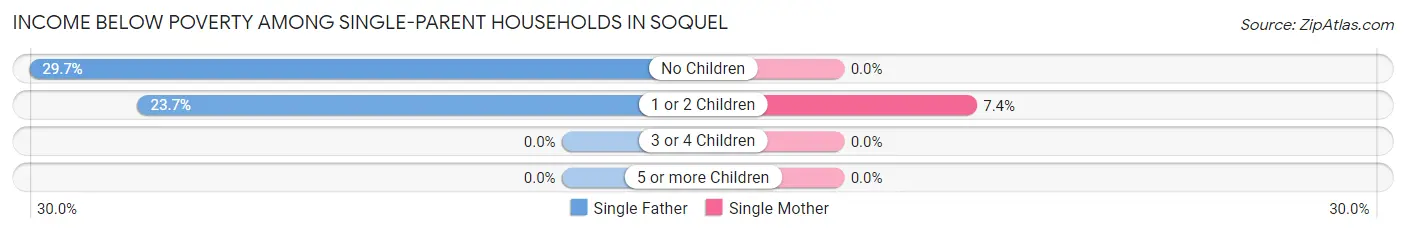
| Children | Single Father | Single Mother |
| No Children | 11 (29.7%) | 0 (0.0%) |
| 1 or 2 Children | 9 (23.7%) | 12 (7.4%) |
| 3 or 4 Children | 0 (0.0%) | 0 (0.0%) |
| 5 or more Children | 0 (0.0%) | 0 (0.0%) |
| Total | 20 (23.3%) | 12 (3.2%) |
Income Below Poverty Among Married-Couple vs Single-Parent Households in Soquel
The poverty data for Soquel shows that 13 of the married-couple family households (0.6%) and 32 of the single-parent households (7.0%) are living below the poverty level. Within the married-couple family households, those with no children have the highest poverty rate, with 13 households (1.2%) falling below the poverty line. Among the single-parent households, those with 1 or 2 children have the highest poverty rate, with 21 household (10.5%) living below poverty.
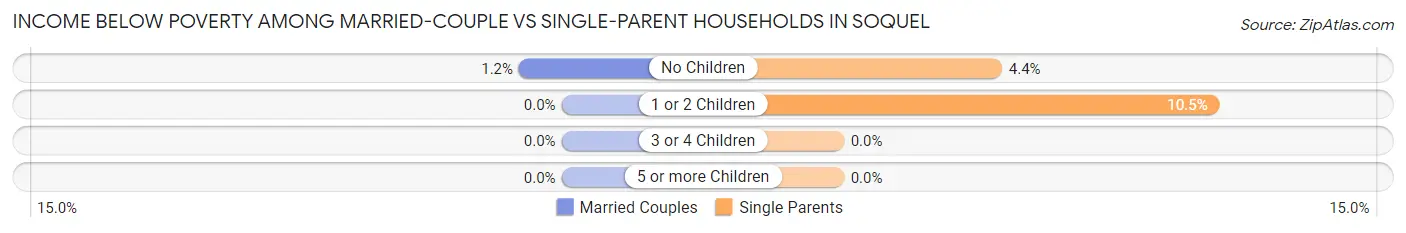
| Children | Married-Couple Families | Single-Parent Households |
| No Children | 13 (1.2%) | 11 (4.4%) |
| 1 or 2 Children | 0 (0.0%) | 21 (10.5%) |
| 3 or 4 Children | 0 (0.0%) | 0 (0.0%) |
| 5 or more Children | 0 (0.0%) | 0 (0.0%) |
| Total | 13 (0.6%) | 32 (7.0%) |
Race in Soquel
The most populous races in Soquel are White / Caucasian (8,499 | 80.9%), Hispanic or Latino (2,195 | 20.9%), and Two or more Races (1,068 | 10.2%).
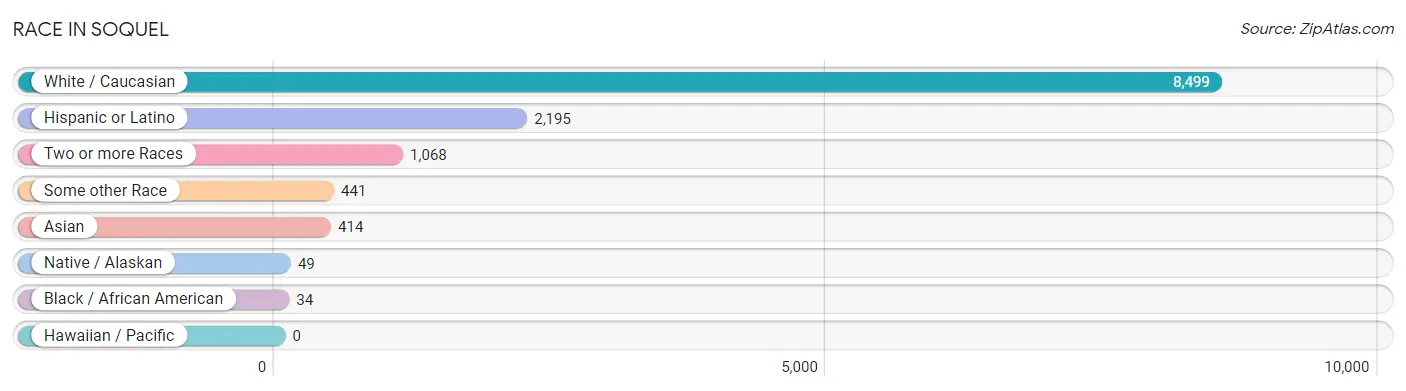
| Race | # Population | % Population |
| Asian | 414 | 3.9% |
| Black / African American | 34 | 0.3% |
| Hawaiian / Pacific | 0 | 0.0% |
| Hispanic or Latino | 2,195 | 20.9% |
| Native / Alaskan | 49 | 0.5% |
| White / Caucasian | 8,499 | 80.9% |
| Two or more Races | 1,068 | 10.2% |
| Some other Race | 441 | 4.2% |
| Total | 10,505 | 100.0% |
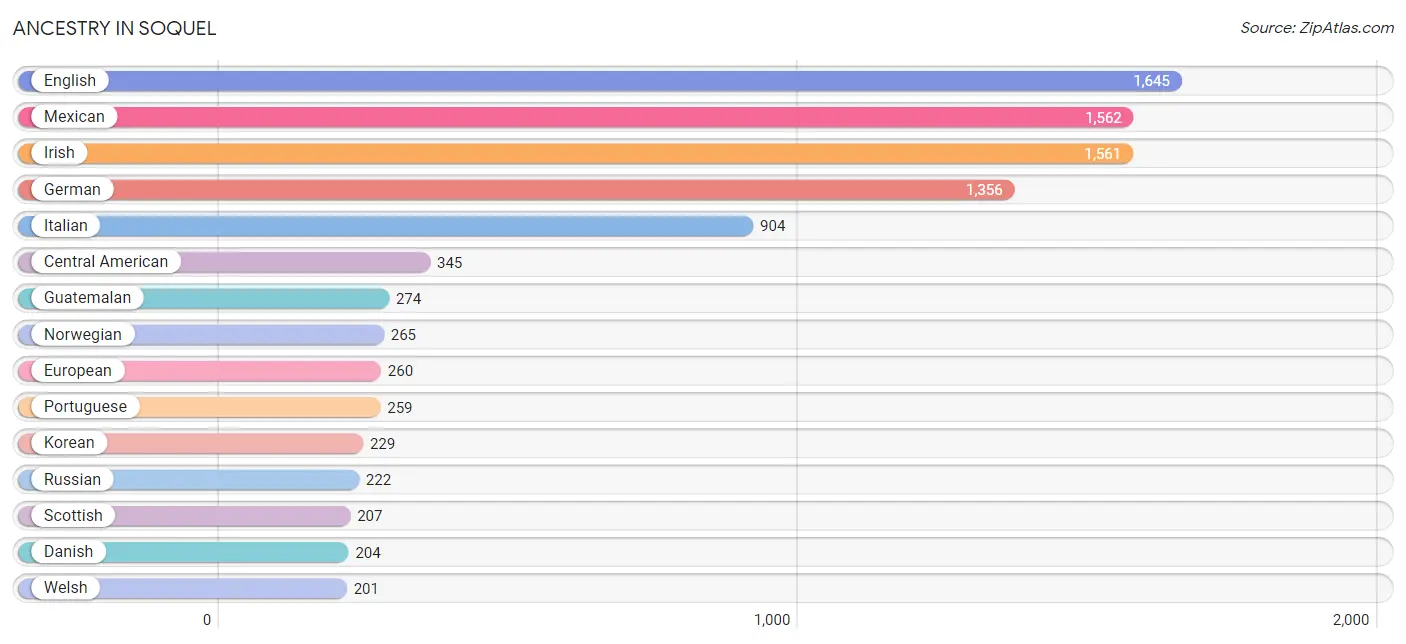
Ancestry in Soquel
The most populous ancestries reported in Soquel are English (1,645 | 15.7%), Mexican (1,562 | 14.9%), Irish (1,561 | 14.9%), German (1,356 | 12.9%), and Italian (904 | 8.6%), together accounting for 66.9% of all Soquel residents.
| Ancestry | # Population | % Population |
| American | 110 | 1.1% |
| Arab | 162 | 1.5% |
| Argentinean | 21 | 0.2% |
| Australian | 56 | 0.5% |
| Austrian | 88 | 0.8% |
| Belgian | 8 | 0.1% |
| Bhutanese | 120 | 1.1% |
| British | 159 | 1.5% |
| Burmese | 92 | 0.9% |
| Canadian | 45 | 0.4% |
| Central American | 345 | 3.3% |
| Cherokee | 62 | 0.6% |
| Croatian | 50 | 0.5% |
| Czech | 14 | 0.1% |
| Czechoslovakian | 9 | 0.1% |
| Danish | 204 | 1.9% |
| Dutch | 128 | 1.2% |
| Eastern European | 67 | 0.6% |
| English | 1,645 | 15.7% |
| Estonian | 10 | 0.1% |
| European | 260 | 2.5% |
| Finnish | 16 | 0.2% |
| French | 198 | 1.9% |
| French Canadian | 27 | 0.3% |
| German | 1,356 | 12.9% |
| Greek | 126 | 1.2% |
| Guatemalan | 274 | 2.6% |
| Hungarian | 16 | 0.2% |
| Indian (Asian) | 112 | 1.1% |
| Irish | 1,561 | 14.9% |
| Italian | 904 | 8.6% |
| Japanese | 13 | 0.1% |
| Korean | 229 | 2.2% |
| Lebanese | 106 | 1.0% |
| Maltese | 11 | 0.1% |
| Mexican | 1,562 | 14.9% |
| Mexican American Indian | 18 | 0.2% |
| Mongolian | 18 | 0.2% |
| Native Hawaiian | 25 | 0.2% |
| Navajo | 23 | 0.2% |
| Northern European | 30 | 0.3% |
| Norwegian | 265 | 2.5% |
| Polish | 166 | 1.6% |
| Portuguese | 259 | 2.5% |
| Puerto Rican | 32 | 0.3% |
| Romanian | 11 | 0.1% |
| Russian | 222 | 2.1% |
| Salvadoran | 71 | 0.7% |
| Scandinavian | 25 | 0.2% |
| Scotch-Irish | 118 | 1.1% |
| Scottish | 207 | 2.0% |
| Seminole | 31 | 0.3% |
| Serbian | 47 | 0.4% |
| Slovene | 28 | 0.3% |
| South American | 21 | 0.2% |
| Spaniard | 60 | 0.6% |
| Spanish | 60 | 0.6% |
| Swedish | 197 | 1.9% |
| Swiss | 18 | 0.2% |
| Syrian | 57 | 0.5% |
| Thai | 54 | 0.5% |
| Welsh | 201 | 1.9% |
| Yaqui | 13 | 0.1% | View All 63 Rows |
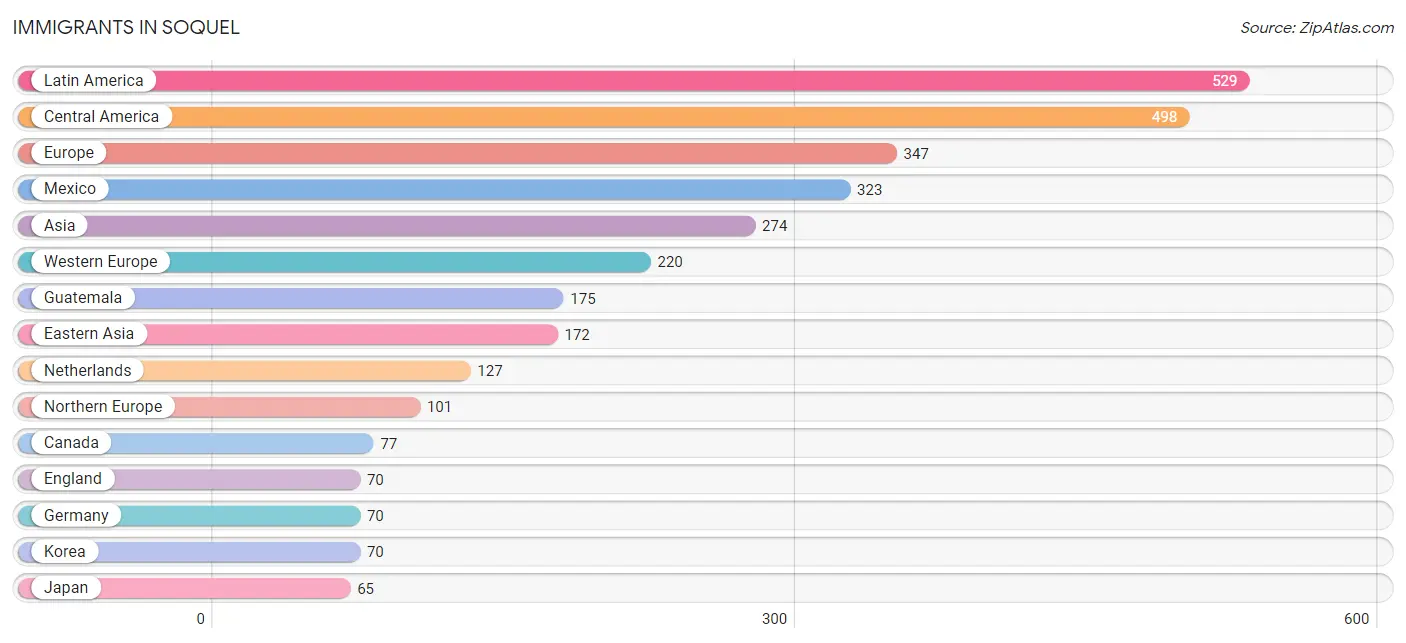
Immigrants in Soquel
The most numerous immigrant groups reported in Soquel came from Latin America (529 | 5.0%), Central America (498 | 4.7%), Europe (347 | 3.3%), Mexico (323 | 3.1%), and Asia (274 | 2.6%), together accounting for 18.8% of all Soquel residents.
| Immigration Origin | # Population | % Population |
| Africa | 16 | 0.2% |
| Argentina | 9 | 0.1% |
| Asia | 274 | 2.6% |
| Australia | 20 | 0.2% |
| Belgium | 8 | 0.1% |
| Cambodia | 13 | 0.1% |
| Canada | 77 | 0.7% |
| Caribbean | 22 | 0.2% |
| Central America | 498 | 4.7% |
| China | 37 | 0.4% |
| Cuba | 22 | 0.2% |
| Denmark | 7 | 0.1% |
| Eastern Africa | 9 | 0.1% |
| Eastern Asia | 172 | 1.6% |
| Eastern Europe | 8 | 0.1% |
| England | 70 | 0.7% |
| Europe | 347 | 3.3% |
| Germany | 70 | 0.7% |
| Guatemala | 175 | 1.7% |
| Hong Kong | 18 | 0.2% |
| Hungary | 8 | 0.1% |
| Italy | 8 | 0.1% |
| Japan | 65 | 0.6% |
| Korea | 70 | 0.7% |
| Latin America | 529 | 5.0% |
| Lebanon | 29 | 0.3% |
| Malaysia | 18 | 0.2% |
| Mexico | 323 | 3.1% |
| Morocco | 7 | 0.1% |
| Netherlands | 127 | 1.2% |
| Northern Africa | 7 | 0.1% |
| Northern Europe | 101 | 1.0% |
| Norway | 8 | 0.1% |
| Oceania | 20 | 0.2% |
| Philippines | 26 | 0.3% |
| Portugal | 10 | 0.1% |
| Saudi Arabia | 16 | 0.2% |
| Scotland | 7 | 0.1% |
| South America | 9 | 0.1% |
| South Eastern Asia | 57 | 0.5% |
| Southern Europe | 18 | 0.2% |
| Switzerland | 15 | 0.1% |
| Western Asia | 45 | 0.4% |
| Western Europe | 220 | 2.1% |
| Zimbabwe | 9 | 0.1% | View All 45 Rows |
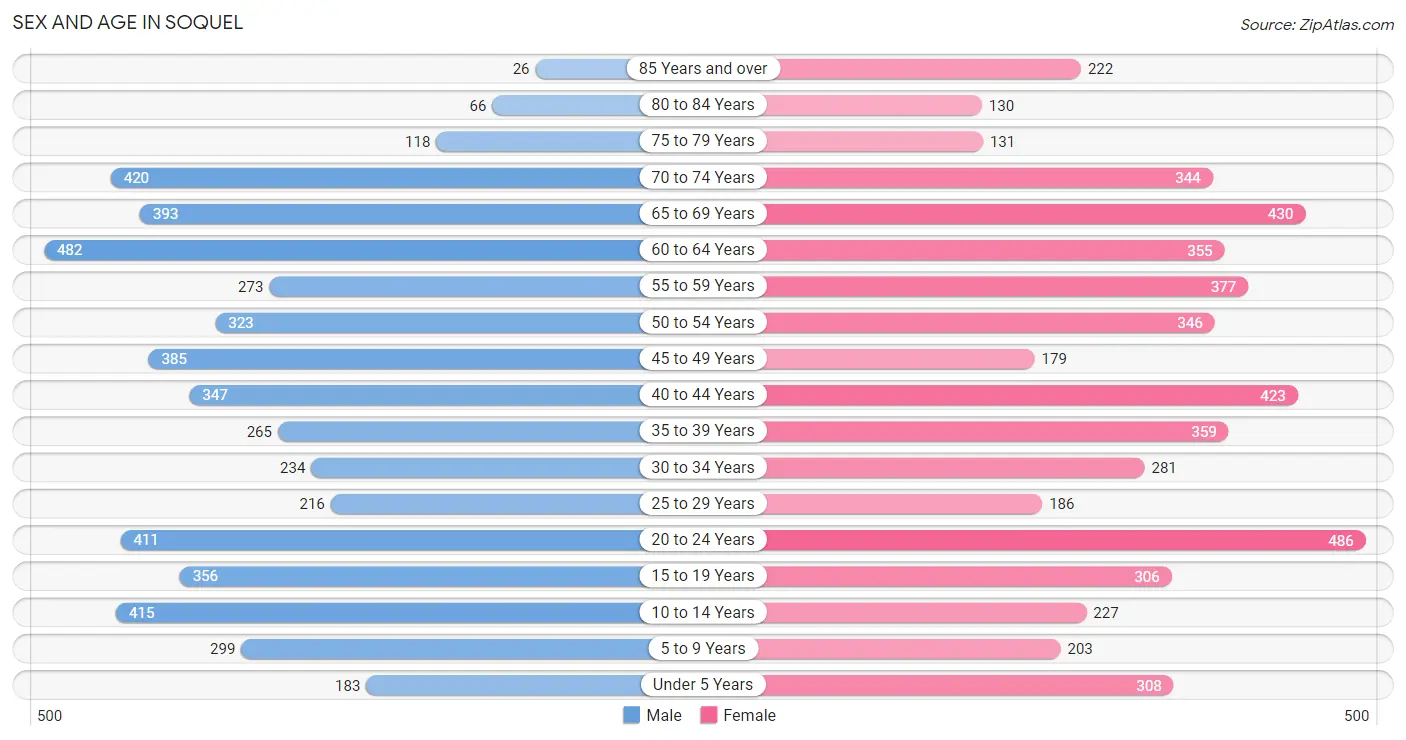
Sex and Age in Soquel
Sex and Age in Soquel
The most populous age groups in Soquel are 60 to 64 Years (482 | 9.2%) for men and 20 to 24 Years (486 | 9.2%) for women.
| Age Bracket | Male | Female |
| Under 5 Years | 183 (3.5%) | 308 (5.8%) |
| 5 to 9 Years | 299 (5.7%) | 203 (3.8%) |
| 10 to 14 Years | 415 (8.0%) | 227 (4.3%) |
| 15 to 19 Years | 356 (6.8%) | 306 (5.8%) |
| 20 to 24 Years | 411 (7.9%) | 486 (9.2%) |
| 25 to 29 Years | 216 (4.1%) | 186 (3.5%) |
| 30 to 34 Years | 234 (4.5%) | 281 (5.3%) |
| 35 to 39 Years | 265 (5.1%) | 359 (6.8%) |
| 40 to 44 Years | 347 (6.7%) | 423 (8.0%) |
| 45 to 49 Years | 385 (7.4%) | 179 (3.4%) |
| 50 to 54 Years | 323 (6.2%) | 346 (6.5%) |
| 55 to 59 Years | 273 (5.2%) | 377 (7.1%) |
| 60 to 64 Years | 482 (9.2%) | 355 (6.7%) |
| 65 to 69 Years | 393 (7.5%) | 430 (8.1%) |
| 70 to 74 Years | 420 (8.1%) | 344 (6.5%) |
| 75 to 79 Years | 118 (2.3%) | 131 (2.5%) |
| 80 to 84 Years | 66 (1.3%) | 130 (2.5%) |
| 85 Years and over | 26 (0.5%) | 222 (4.2%) |
| Total | 5,212 (100.0%) | 5,293 (100.0%) |
Families and Households in Soquel
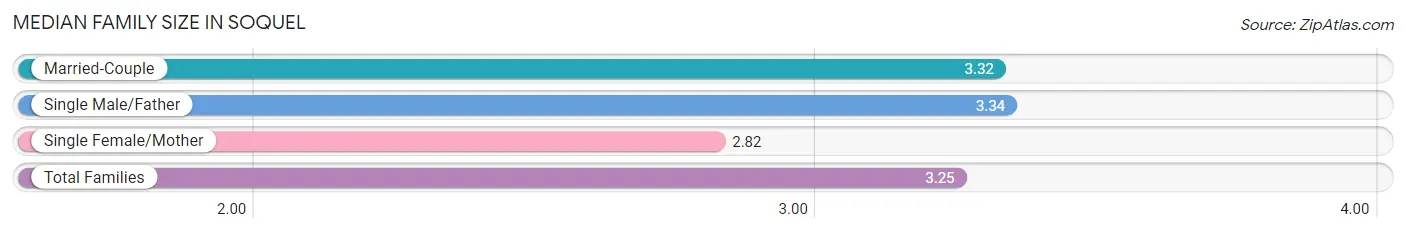
Median Family Size in Soquel
The median family size in Soquel is 3.25 persons per family, with single male/father families (86 | 3.5%) accounting for the largest median family size of 3.34 persons per family. On the other hand, single female/mother families (374 | 15.1%) represent the smallest median family size with 2.82 persons per family.
| Family Type | # Families | Family Size |
| Married-Couple | 2,020 (81.5%) | 3.32 |
| Single Male/Father | 86 (3.5%) | 3.34 |
| Single Female/Mother | 374 (15.1%) | 2.82 |
| Total Families | 2,480 (100.0%) | 3.25 |
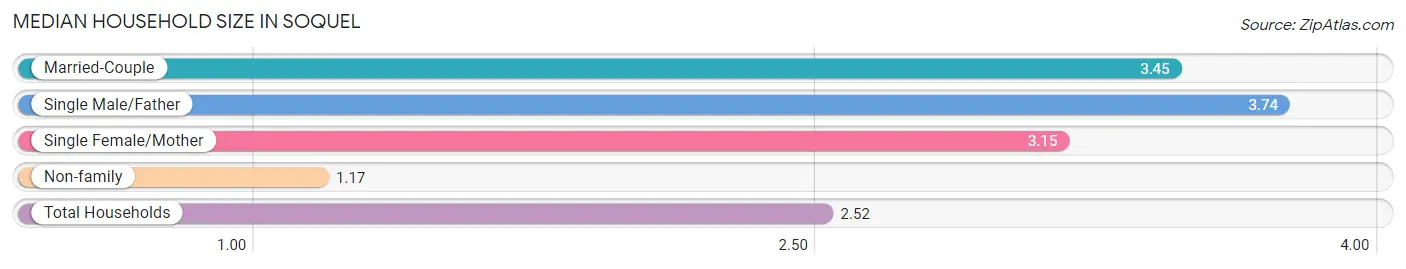
Median Household Size in Soquel
The median household size in Soquel is 2.52 persons per household, with single male/father households (86 | 2.1%) accounting for the largest median household size of 3.74 persons per household. non-family households (1,647 | 39.9%) represent the smallest median household size with 1.17 persons per household.
| Household Type | # Households | Household Size |
| Married-Couple | 2,020 (48.9%) | 3.45 |
| Single Male/Father | 86 (2.1%) | 3.74 |
| Single Female/Mother | 374 (9.1%) | 3.15 |
| Non-family | 1,647 (39.9%) | 1.17 |
| Total Households | 4,127 (100.0%) | 2.52 |
Household Size by Marriage Status in Soquel
Out of a total of 4,127 households in Soquel, 2,480 (60.1%) are family households, while 1,647 (39.9%) are nonfamily households. The most numerous type of family households are 2-person households, comprising 957, and the most common type of nonfamily households are 1-person households, comprising 1,391.
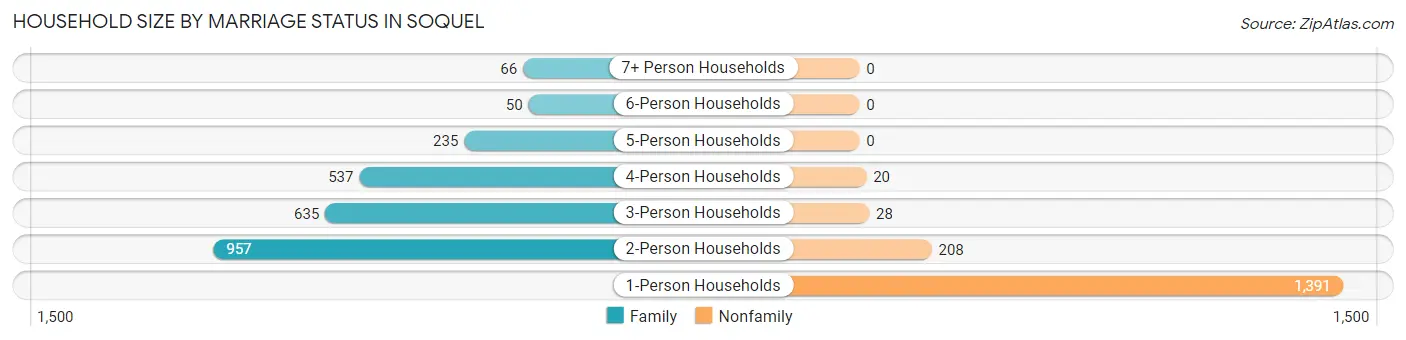
| Household Size | Family Households | Nonfamily Households |
| 1-Person Households | - | 1,391 (33.7%) |
| 2-Person Households | 957 (23.2%) | 208 (5.0%) |
| 3-Person Households | 635 (15.4%) | 28 (0.7%) |
| 4-Person Households | 537 (13.0%) | 20 (0.5%) |
| 5-Person Households | 235 (5.7%) | 0 (0.0%) |
| 6-Person Households | 50 (1.2%) | 0 (0.0%) |
| 7+ Person Households | 66 (1.6%) | 0 (0.0%) |
| Total | 2,480 (60.1%) | 1,647 (39.9%) |
Female Fertility in Soquel
Fertility by Age in Soquel
Average fertility rate in Soquel is 42.0 births per 1,000 women. Women in the age bracket of 35 to 50 years have the highest fertility rate with 74.0 births per 1,000 women. Women in the age bracket of 35 to 50 years acount for 80.4% of all women with births.
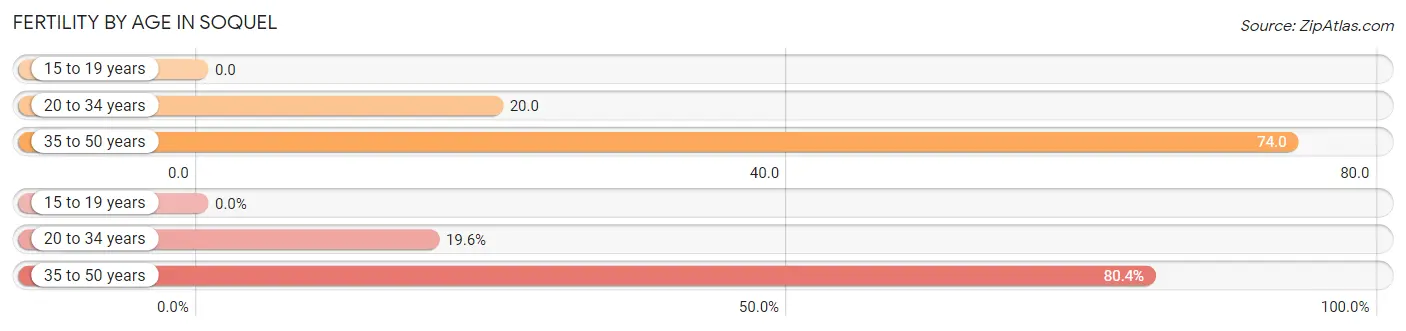
| Age Bracket | Women with Births | Births / 1,000 Women |
| 15 to 19 years | 0 (0.0%) | 0.0 |
| 20 to 34 years | 19 (19.6%) | 20.0 |
| 35 to 50 years | 78 (80.4%) | 74.0 |
| Total | 97 (100.0%) | 42.0 |
Fertility by Age by Marriage Status in Soquel
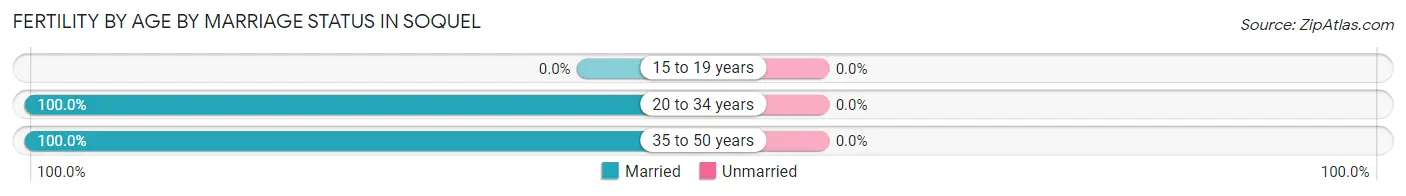
| Age Bracket | Married | Unmarried |
| 15 to 19 years | 0 (0.0%) | 0 (0.0%) |
| 20 to 34 years | 19 (100.0%) | 0 (0.0%) |
| 35 to 50 years | 78 (100.0%) | 0 (0.0%) |
| Total | 97 (100.0%) | 0 (0.0%) |
Fertility by Education in Soquel
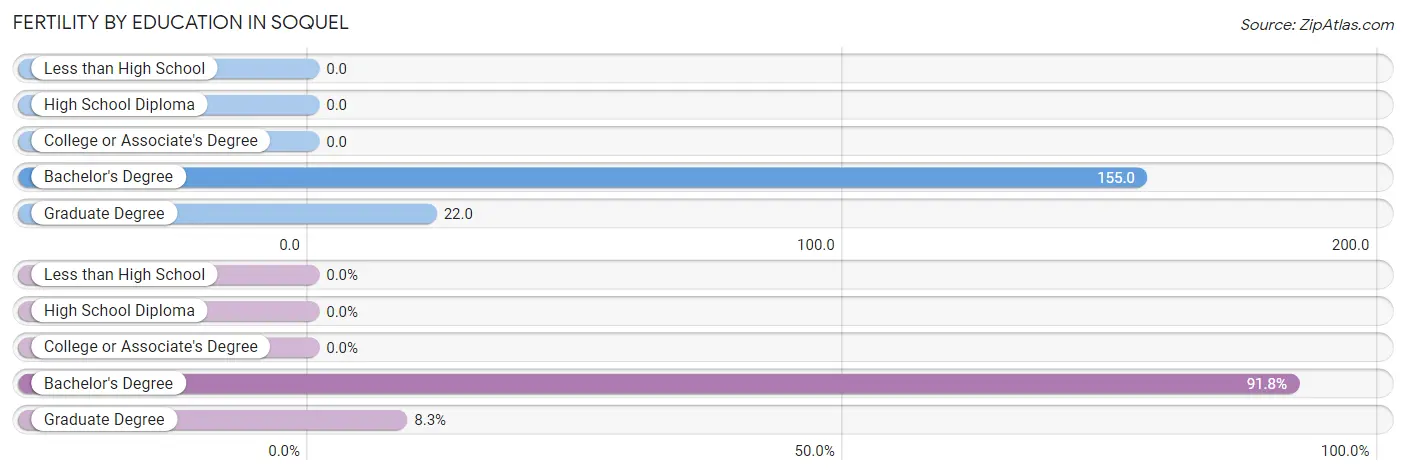
| Educational Attainment | Women with Births | Births / 1,000 Women |
| Less than High School | 0 (0.0%) | 0.0 |
| High School Diploma | 0 (0.0%) | 0.0 |
| College or Associate's Degree | 0 (0.0%) | 0.0 |
| Bachelor's Degree | 89 (91.7%) | 155.0 |
| Graduate Degree | 8 (8.3%) | 22.0 |
| Total | 97 (100.0%) | 42.0 |
Fertility by Education by Marriage Status in Soquel
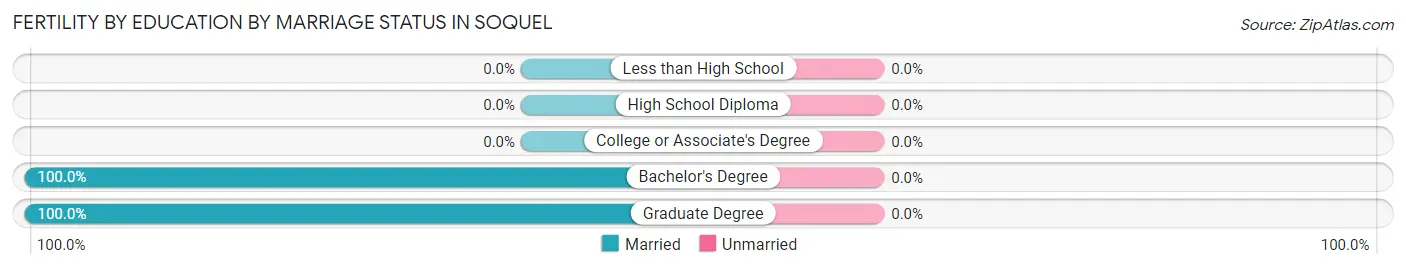
| Educational Attainment | Married | Unmarried |
| Less than High School | 0 (0.0%) | 0 (0.0%) |
| High School Diploma | 0 (0.0%) | 0 (0.0%) |
| College or Associate's Degree | 0 (0.0%) | 0 (0.0%) |
| Bachelor's Degree | 89 (100.0%) | 0 (0.0%) |
| Graduate Degree | 8 (100.0%) | 0 (0.0%) |
| Total | 97 (100.0%) | 0 (0.0%) |
Employment Characteristics in Soquel
Employment by Class of Employer in Soquel
Among the 4,995 employed individuals in Soquel, private company employees (3,117 | 62.4%), local government employees (586 | 11.7%), and not-for-profit organizations (482 | 9.7%) make up the most common classes of employment.
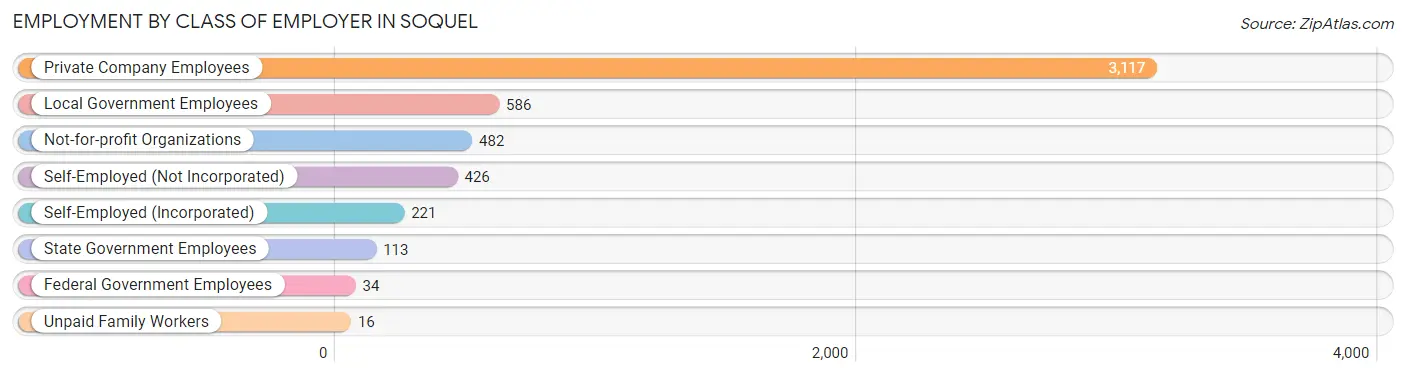
| Employer Class | # Employees | % Employees |
| Private Company Employees | 3,117 | 62.4% |
| Self-Employed (Incorporated) | 221 | 4.4% |
| Self-Employed (Not Incorporated) | 426 | 8.5% |
| Not-for-profit Organizations | 482 | 9.7% |
| Local Government Employees | 586 | 11.7% |
| State Government Employees | 113 | 2.3% |
| Federal Government Employees | 34 | 0.7% |
| Unpaid Family Workers | 16 | 0.3% |
| Total | 4,995 | 100.0% |
Employment Status by Age in Soquel
According to the labor force statistics for Soquel, out of the total population over 16 years of age (8,774), 62.9% or 5,519 individuals are in the labor force, with 4.5% or 248 of them unemployed. The age group with the highest labor force participation rate is 45 to 54 years, with 89.9% or 1,108 individuals in the labor force. Within the labor force, the 20 to 24 years age range has the highest percentage of unemployed individuals, with 27.2% or 168 of them being unemployed.
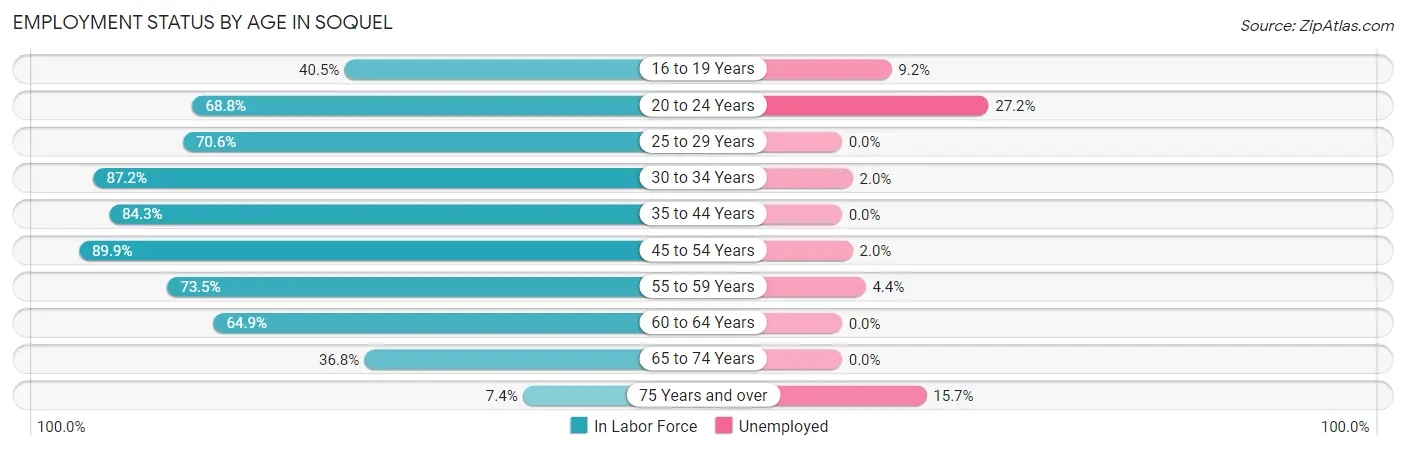
| Age Bracket | In Labor Force | Unemployed |
| 16 to 19 Years | 229 (40.5%) | 21 (9.2%) |
| 20 to 24 Years | 617 (68.8%) | 168 (27.2%) |
| 25 to 29 Years | 284 (70.6%) | 0 (0.0%) |
| 30 to 34 Years | 449 (87.2%) | 9 (2.0%) |
| 35 to 44 Years | 1,175 (84.3%) | 0 (0.0%) |
| 45 to 54 Years | 1,108 (89.9%) | 22 (2.0%) |
| 55 to 59 Years | 478 (73.5%) | 21 (4.4%) |
| 60 to 64 Years | 543 (64.9%) | 0 (0.0%) |
| 65 to 74 Years | 584 (36.8%) | 0 (0.0%) |
| 75 Years and over | 51 (7.4%) | 8 (15.7%) |
| Total | 5,519 (62.9%) | 248 (4.5%) |
Employment Status by Educational Attainment in Soquel
According to labor force statistics for Soquel, 80.2% of individuals (4,035) out of the total population between 25 and 64 years of age (5,031) are in the labor force, with 1.3% or 52 of them being unemployed. The group with the highest labor force participation rate are those with the educational attainment of college / associate degree, with 83.0% or 1,266 individuals in the labor force. Within the labor force, individuals with bachelor's degree or higher education have the highest percentage of unemployment, with 1.9% or 36 of them being unemployed.
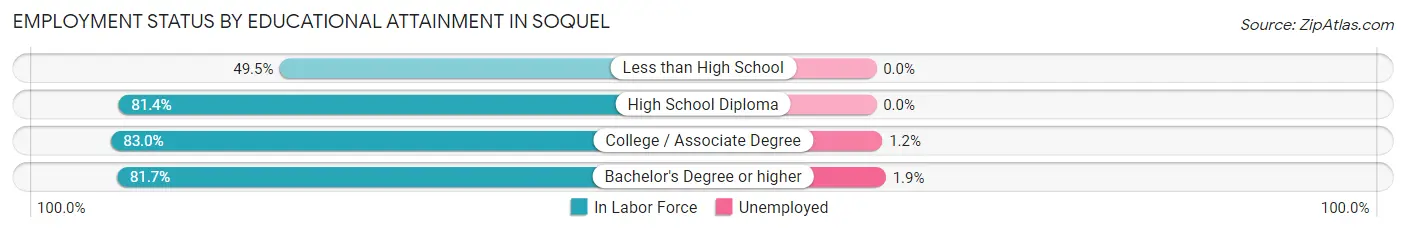
| Educational Attainment | In Labor Force | Unemployed |
| Less than High School | 138 (49.5%) | 0 (0.0%) |
| High School Diploma | 724 (81.4%) | 0 (0.0%) |
| College / Associate Degree | 1,266 (83.0%) | 18 (1.2%) |
| Bachelor's Degree or higher | 1,910 (81.7%) | 44 (1.9%) |
| Total | 4,035 (80.2%) | 65 (1.3%) |
Employment Occupations by Sex in Soquel
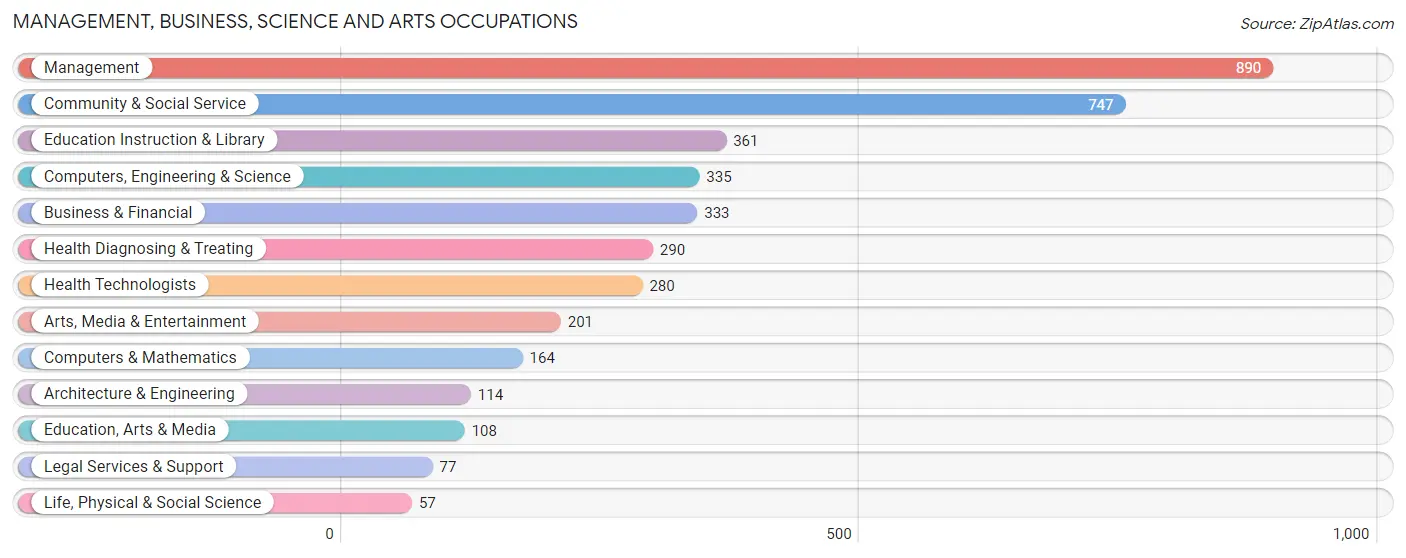
Management, Business, Science and Arts Occupations
The most common Management, Business, Science and Arts occupations in Soquel are Management (890 | 16.9%), Community & Social Service (747 | 14.2%), Education Instruction & Library (361 | 6.9%), Computers, Engineering & Science (335 | 6.4%), and Business & Financial (333 | 6.3%).
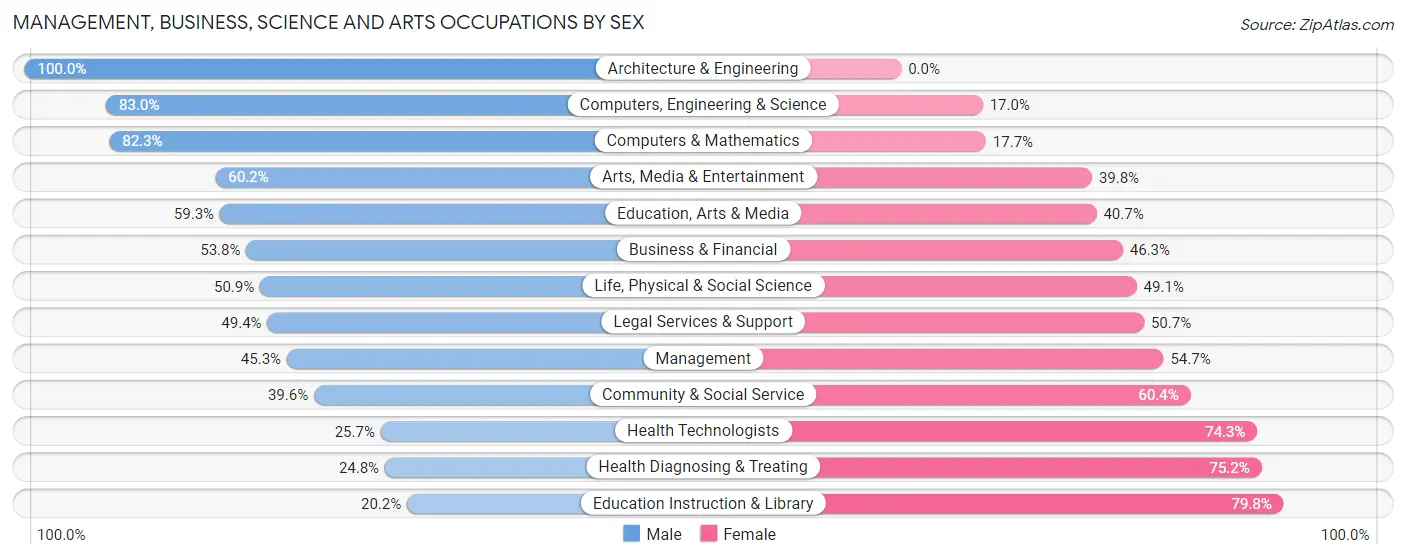
Management, Business, Science and Arts Occupations by Sex
Within the Management, Business, Science and Arts occupations in Soquel, the most male-oriented occupations are Architecture & Engineering (100.0%), Computers, Engineering & Science (83.0%), and Computers & Mathematics (82.3%), while the most female-oriented occupations are Education Instruction & Library (79.8%), Health Diagnosing & Treating (75.2%), and Health Technologists (74.3%).
| Occupation | Male | Female |
| Management | 403 (45.3%) | 487 (54.7%) |
| Business & Financial | 179 (53.7%) | 154 (46.3%) |
| Computers, Engineering & Science | 278 (83.0%) | 57 (17.0%) |
| Computers & Mathematics | 135 (82.3%) | 29 (17.7%) |
| Architecture & Engineering | 114 (100.0%) | 0 (0.0%) |
| Life, Physical & Social Science | 29 (50.9%) | 28 (49.1%) |
| Community & Social Service | 296 (39.6%) | 451 (60.4%) |
| Education, Arts & Media | 64 (59.3%) | 44 (40.7%) |
| Legal Services & Support | 38 (49.3%) | 39 (50.6%) |
| Education Instruction & Library | 73 (20.2%) | 288 (79.8%) |
| Arts, Media & Entertainment | 121 (60.2%) | 80 (39.8%) |
| Health Diagnosing & Treating | 72 (24.8%) | 218 (75.2%) |
| Health Technologists | 72 (25.7%) | 208 (74.3%) |
| Total (Category) | 1,228 (47.3%) | 1,367 (52.7%) |
| Total (Overall) | 2,785 (52.9%) | 2,478 (47.1%) |
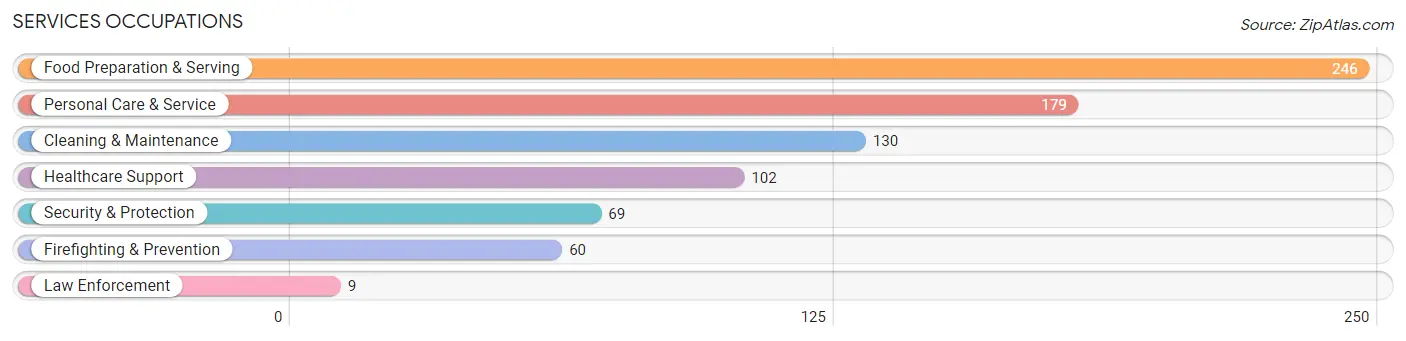
Services Occupations
The most common Services occupations in Soquel are Food Preparation & Serving (246 | 4.7%), Personal Care & Service (179 | 3.4%), Cleaning & Maintenance (130 | 2.5%), Healthcare Support (102 | 1.9%), and Security & Protection (69 | 1.3%).
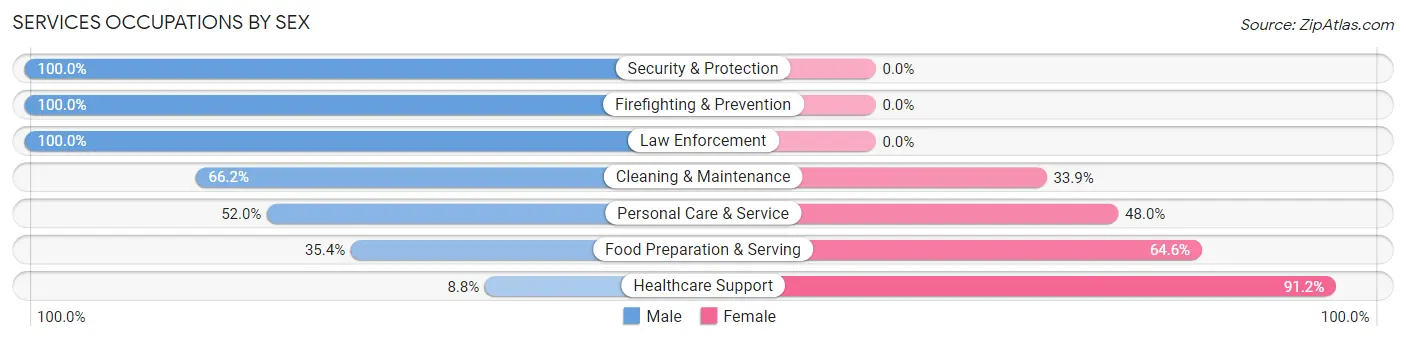
Services Occupations by Sex
Within the Services occupations in Soquel, the most male-oriented occupations are Security & Protection (100.0%), Firefighting & Prevention (100.0%), and Law Enforcement (100.0%), while the most female-oriented occupations are Healthcare Support (91.2%), Food Preparation & Serving (64.6%), and Personal Care & Service (48.0%).
| Occupation | Male | Female |
| Healthcare Support | 9 (8.8%) | 93 (91.2%) |
| Security & Protection | 69 (100.0%) | 0 (0.0%) |
| Firefighting & Prevention | 60 (100.0%) | 0 (0.0%) |
| Law Enforcement | 9 (100.0%) | 0 (0.0%) |
| Food Preparation & Serving | 87 (35.4%) | 159 (64.6%) |
| Cleaning & Maintenance | 86 (66.1%) | 44 (33.9%) |
| Personal Care & Service | 93 (52.0%) | 86 (48.0%) |
| Total (Category) | 344 (47.4%) | 382 (52.6%) |
| Total (Overall) | 2,785 (52.9%) | 2,478 (47.1%) |
Sales and Office Occupations
The most common Sales and Office occupations in Soquel are Sales & Related (490 | 9.3%), and Office & Administration (442 | 8.4%).
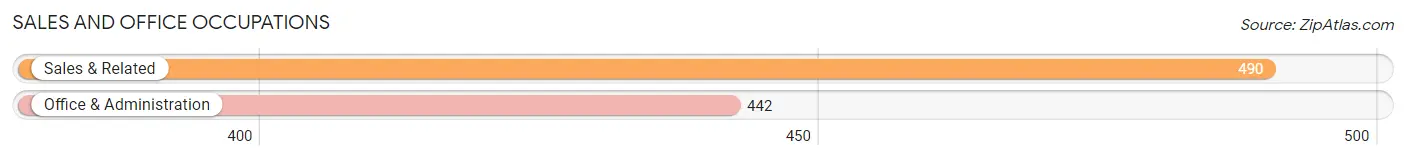
Sales and Office Occupations by Sex
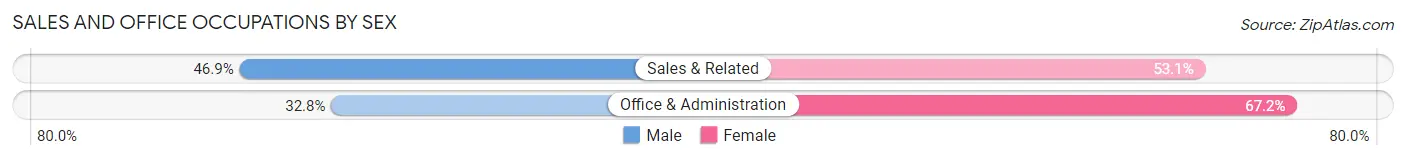
| Occupation | Male | Female |
| Sales & Related | 230 (46.9%) | 260 (53.1%) |
| Office & Administration | 145 (32.8%) | 297 (67.2%) |
| Total (Category) | 375 (40.2%) | 557 (59.8%) |
| Total (Overall) | 2,785 (52.9%) | 2,478 (47.1%) |
Natural Resources, Construction and Maintenance Occupations
The most common Natural Resources, Construction and Maintenance occupations in Soquel are Construction & Extraction (296 | 5.6%), Installation, Maintenance & Repair (158 | 3.0%), and Farming, Fishing & Forestry (45 | 0.9%).
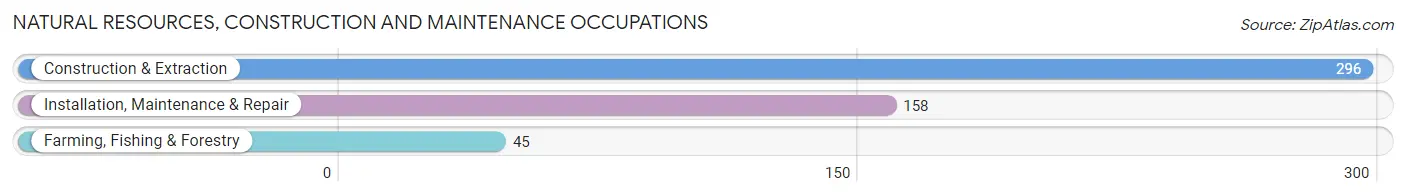
Natural Resources, Construction and Maintenance Occupations by Sex
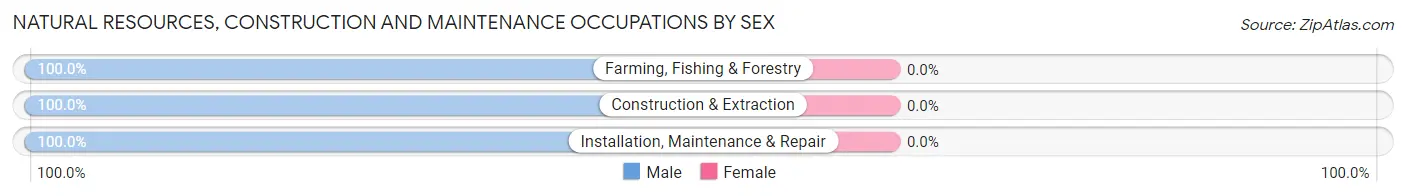
| Occupation | Male | Female |
| Farming, Fishing & Forestry | 45 (100.0%) | 0 (0.0%) |
| Construction & Extraction | 296 (100.0%) | 0 (0.0%) |
| Installation, Maintenance & Repair | 158 (100.0%) | 0 (0.0%) |
| Total (Category) | 499 (100.0%) | 0 (0.0%) |
| Total (Overall) | 2,785 (52.9%) | 2,478 (47.1%) |
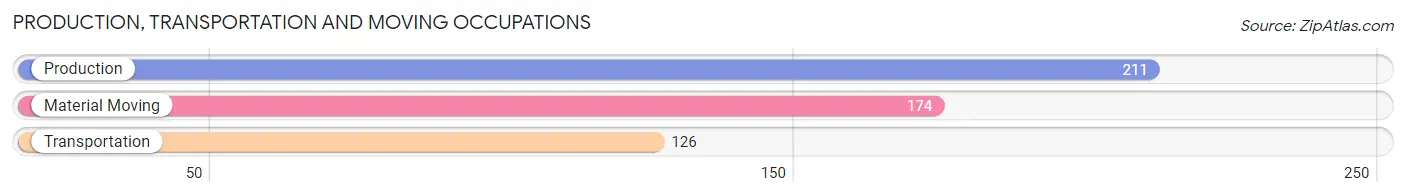
Production, Transportation and Moving Occupations
The most common Production, Transportation and Moving occupations in Soquel are Production (211 | 4.0%), Material Moving (174 | 3.3%), and Transportation (126 | 2.4%).
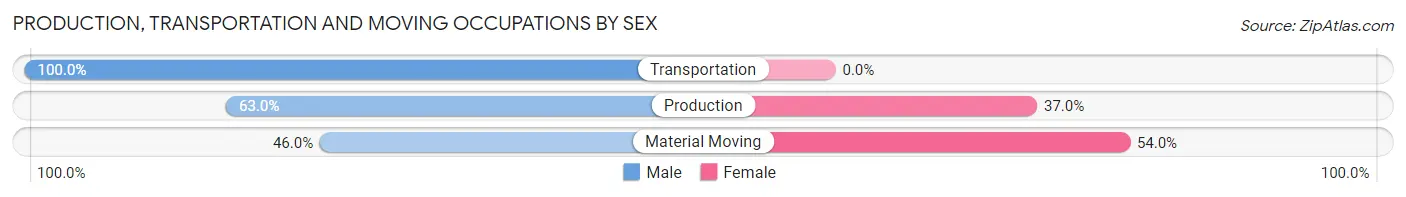
Production, Transportation and Moving Occupations by Sex
| Occupation | Male | Female |
| Production | 133 (63.0%) | 78 (37.0%) |
| Transportation | 126 (100.0%) | 0 (0.0%) |
| Material Moving | 80 (46.0%) | 94 (54.0%) |
| Total (Category) | 339 (66.3%) | 172 (33.7%) |
| Total (Overall) | 2,785 (52.9%) | 2,478 (47.1%) |
Employment Industries by Sex in Soquel
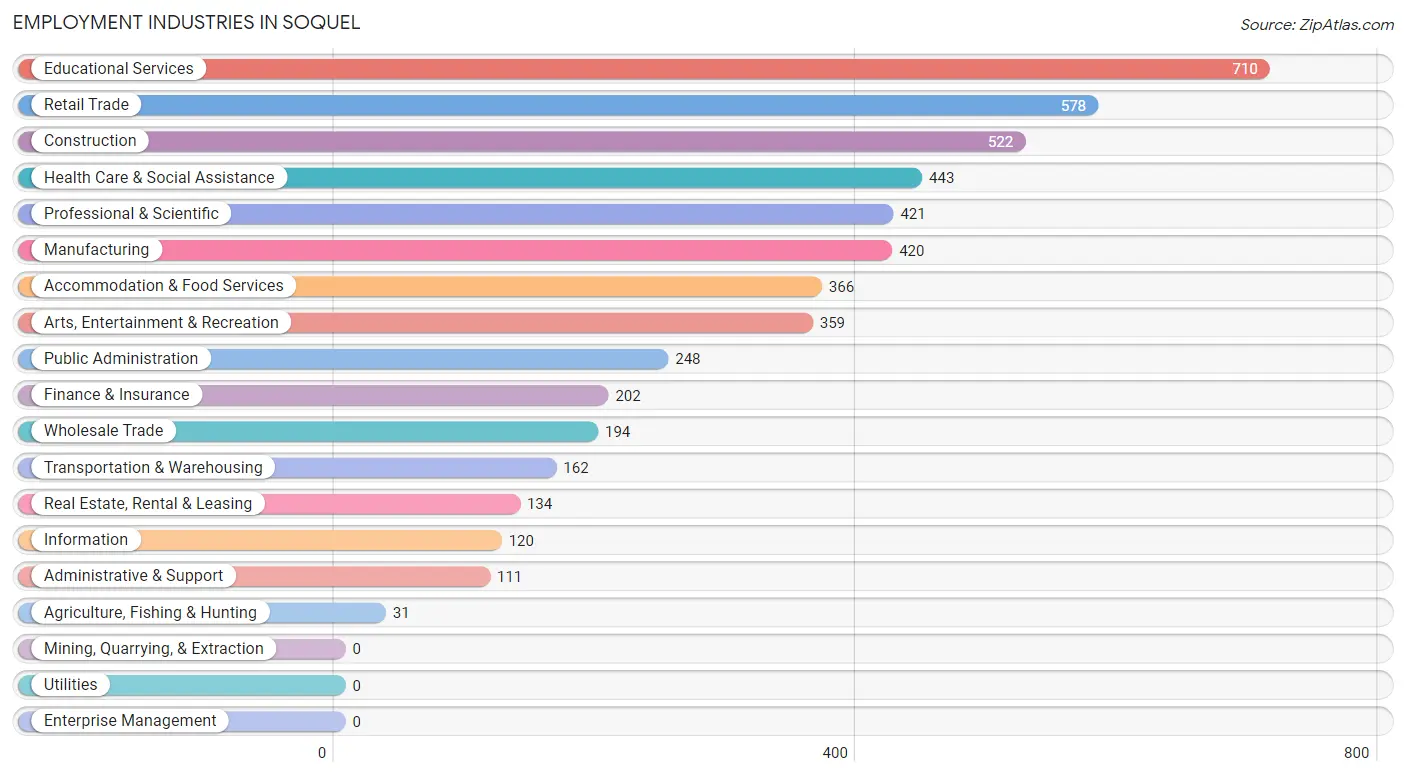
Employment Industries in Soquel
The major employment industries in Soquel include Educational Services (710 | 13.5%), Retail Trade (578 | 11.0%), Construction (522 | 9.9%), Health Care & Social Assistance (443 | 8.4%), and Professional & Scientific (421 | 8.0%).
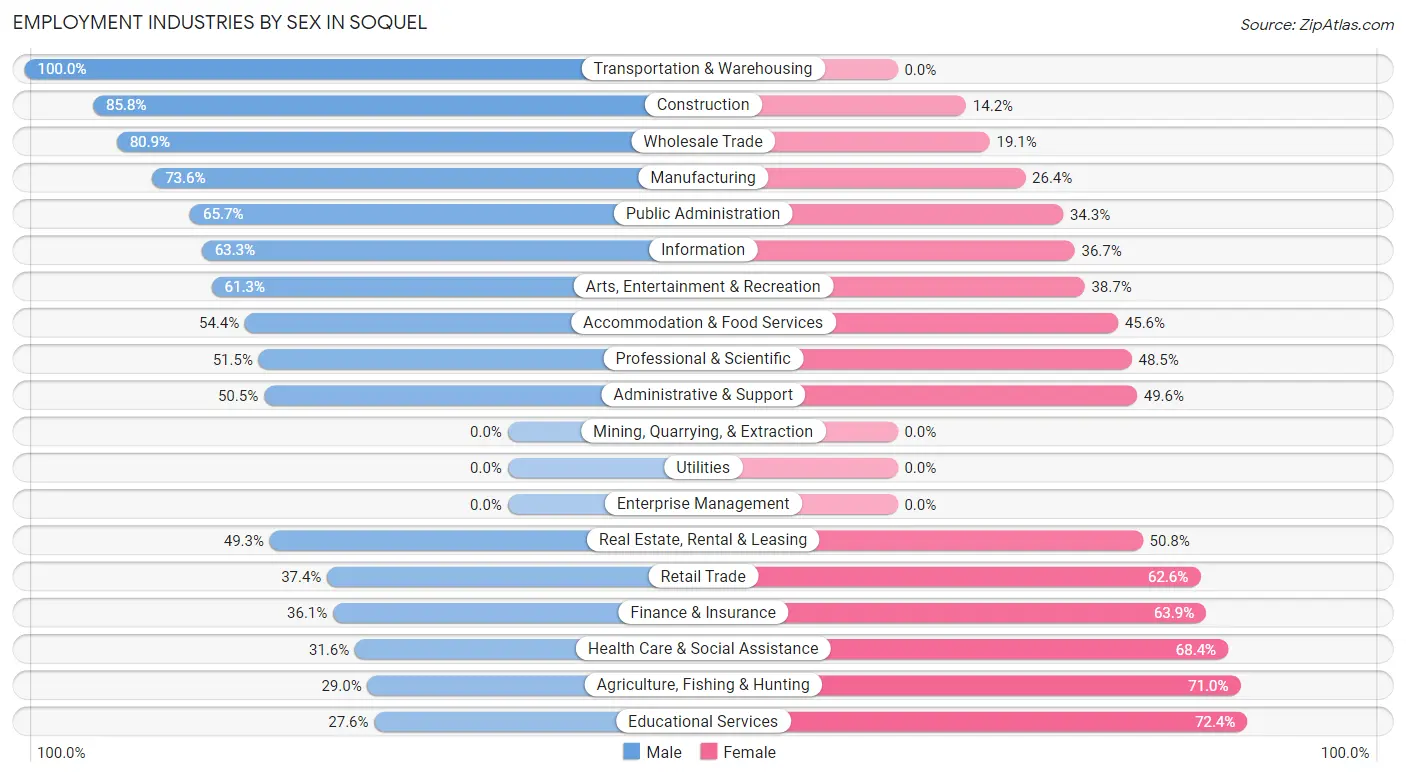
Employment Industries by Sex in Soquel
The Soquel industries that see more men than women are Transportation & Warehousing (100.0%), Construction (85.8%), and Wholesale Trade (80.9%), whereas the industries that tend to have a higher number of women are Educational Services (72.4%), Agriculture, Fishing & Hunting (71.0%), and Health Care & Social Assistance (68.4%).
| Industry | Male | Female |
| Agriculture, Fishing & Hunting | 9 (29.0%) | 22 (71.0%) |
| Mining, Quarrying, & Extraction | 0 (0.0%) | 0 (0.0%) |
| Construction | 448 (85.8%) | 74 (14.2%) |
| Manufacturing | 309 (73.6%) | 111 (26.4%) |
| Wholesale Trade | 157 (80.9%) | 37 (19.1%) |
| Retail Trade | 216 (37.4%) | 362 (62.6%) |
| Transportation & Warehousing | 162 (100.0%) | 0 (0.0%) |
| Utilities | 0 (0.0%) | 0 (0.0%) |
| Information | 76 (63.3%) | 44 (36.7%) |
| Finance & Insurance | 73 (36.1%) | 129 (63.9%) |
| Real Estate, Rental & Leasing | 66 (49.2%) | 68 (50.7%) |
| Professional & Scientific | 217 (51.5%) | 204 (48.5%) |
| Enterprise Management | 0 (0.0%) | 0 (0.0%) |
| Administrative & Support | 56 (50.4%) | 55 (49.5%) |
| Educational Services | 196 (27.6%) | 514 (72.4%) |
| Health Care & Social Assistance | 140 (31.6%) | 303 (68.4%) |
| Arts, Entertainment & Recreation | 220 (61.3%) | 139 (38.7%) |
| Accommodation & Food Services | 199 (54.4%) | 167 (45.6%) |
| Public Administration | 163 (65.7%) | 85 (34.3%) |
| Total | 2,785 (52.9%) | 2,478 (47.1%) |
Education in Soquel
School Enrollment in Soquel
The most common levels of schooling among the 2,590 students in Soquel are college / undergraduate (729 | 28.1%), middle school (588 | 22.7%), and high school (485 | 18.7%).
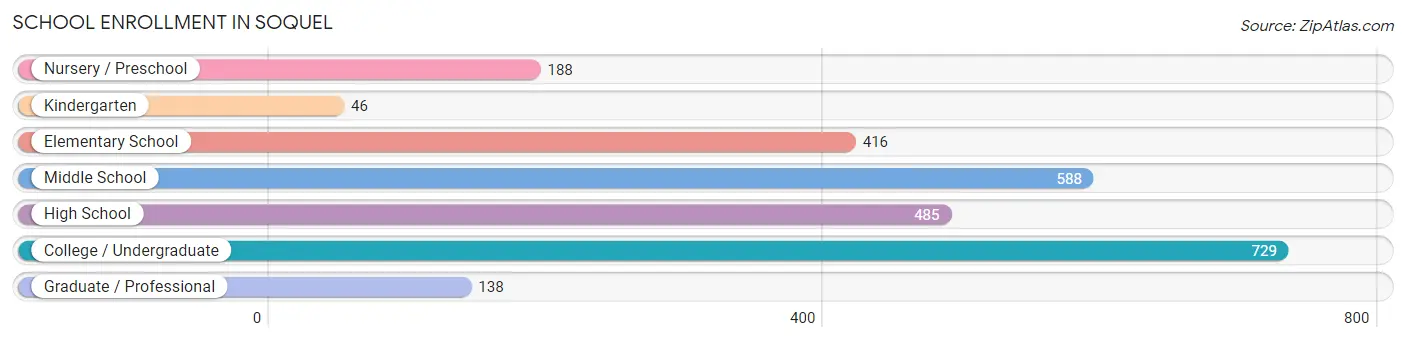
| School Level | # Students | % Students |
| Nursery / Preschool | 188 | 7.3% |
| Kindergarten | 46 | 1.8% |
| Elementary School | 416 | 16.1% |
| Middle School | 588 | 22.7% |
| High School | 485 | 18.7% |
| College / Undergraduate | 729 | 28.1% |
| Graduate / Professional | 138 | 5.3% |
| Total | 2,590 | 100.0% |
School Enrollment by Age by Funding Source in Soquel
Out of a total of 2,590 students who are enrolled in schools in Soquel, 445 (17.2%) attend a private institution, while the remaining 2,145 (82.8%) are enrolled in public schools. The age group of 3 to 4 year olds has the highest likelihood of being enrolled in private schools, with 88 (71.0% in the age bracket) enrolled. Conversely, the age group of 15 to 17 year olds has the lowest likelihood of being enrolled in a private school, with 355 (89.4% in the age bracket) attending a public institution.
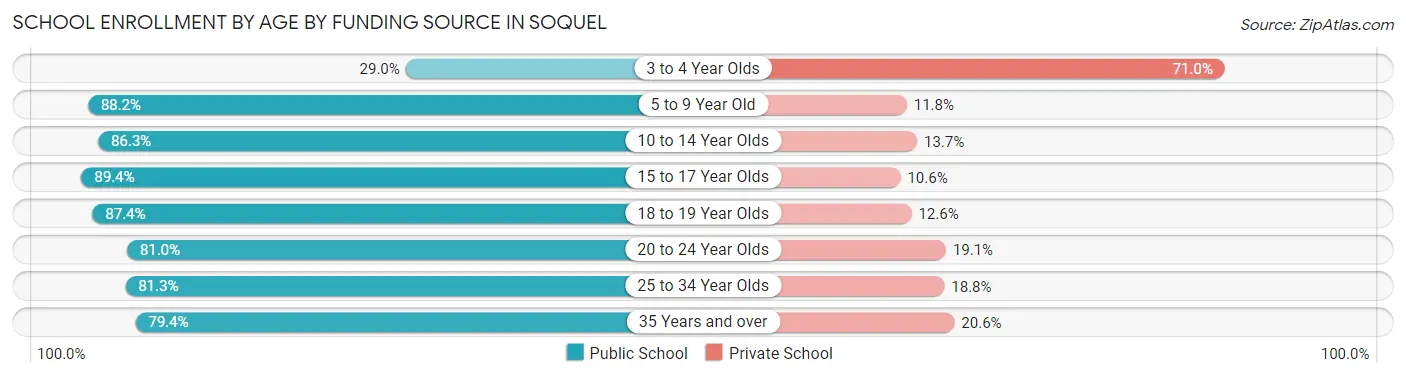
| Age Bracket | Public School | Private School |
| 3 to 4 Year Olds | 36 (29.0%) | 88 (71.0%) |
| 5 to 9 Year Old | 435 (88.2%) | 58 (11.8%) |
| 10 to 14 Year Olds | 543 (86.3%) | 86 (13.7%) |
| 15 to 17 Year Olds | 355 (89.4%) | 42 (10.6%) |
| 18 to 19 Year Olds | 166 (87.4%) | 24 (12.6%) |
| 20 to 24 Year Olds | 408 (80.9%) | 96 (19.1%) |
| 25 to 34 Year Olds | 52 (81.2%) | 12 (18.8%) |
| 35 Years and over | 150 (79.4%) | 39 (20.6%) |
| Total | 2,145 (82.8%) | 445 (17.2%) |
Educational Attainment by Field of Study in Soquel
Social sciences (428 | 12.7%), business (412 | 12.2%), bio, nature & agricultural (372 | 11.0%), visual & performing arts (350 | 10.4%), and science & technology (244 | 7.2%) are the most common fields of study among 3,376 individuals in Soquel who have obtained a bachelor's degree or higher.
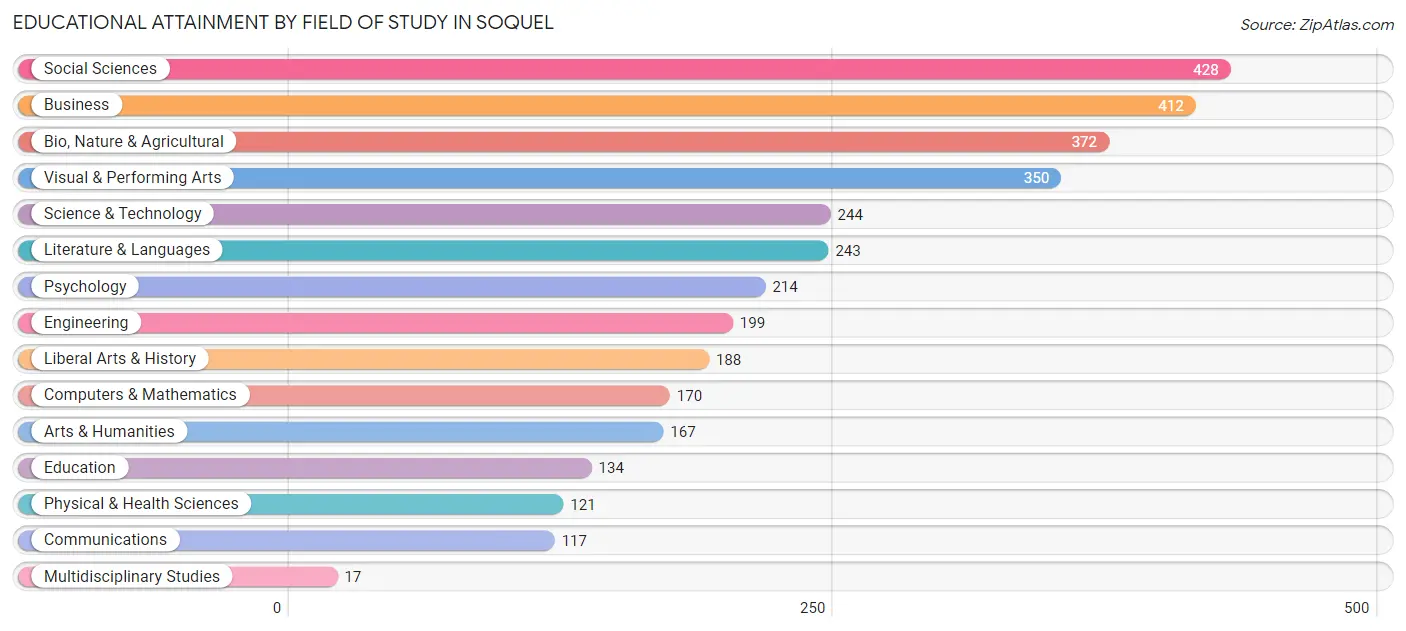
| Field of Study | # Graduates | % Graduates |
| Computers & Mathematics | 170 | 5.0% |
| Bio, Nature & Agricultural | 372 | 11.0% |
| Physical & Health Sciences | 121 | 3.6% |
| Psychology | 214 | 6.3% |
| Social Sciences | 428 | 12.7% |
| Engineering | 199 | 5.9% |
| Multidisciplinary Studies | 17 | 0.5% |
| Science & Technology | 244 | 7.2% |
| Business | 412 | 12.2% |
| Education | 134 | 4.0% |
| Literature & Languages | 243 | 7.2% |
| Liberal Arts & History | 188 | 5.6% |
| Visual & Performing Arts | 350 | 10.4% |
| Communications | 117 | 3.5% |
| Arts & Humanities | 167 | 5.0% |
| Total | 3,376 | 100.0% |
Transportation & Commute in Soquel
Vehicle Availability by Sex in Soquel
The most prevalent vehicle ownership categories in Soquel are males with 2 vehicles (1,259, accounting for 47.2%) and females with 2 vehicles (780, making up 54.2%).
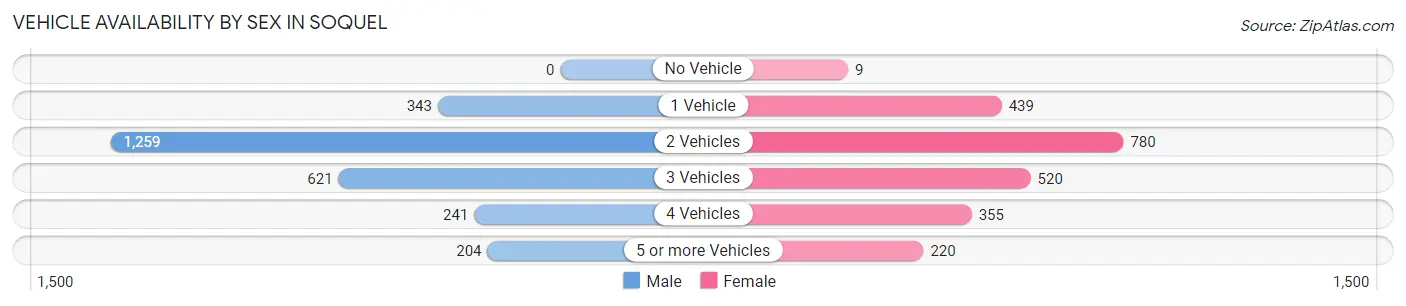
| Vehicles Available | Male | Female |
| No Vehicle | 0 (0.0%) | 9 (0.4%) |
| 1 Vehicle | 343 (12.9%) | 439 (18.9%) |
| 2 Vehicles | 1,259 (47.2%) | 780 (33.6%) |
| 3 Vehicles | 621 (23.3%) | 520 (22.4%) |
| 4 Vehicles | 241 (9.0%) | 355 (15.3%) |
| 5 or more Vehicles | 204 (7.6%) | 220 (9.5%) |
| Total | 2,668 (100.0%) | 2,323 (100.0%) |
Commute Time in Soquel
The most frequently occuring commute durations in Soquel are 15 to 19 minutes (1,101 commuters, 25.6%), 10 to 14 minutes (709 commuters, 16.5%), and 5 to 9 minutes (434 commuters, 10.1%).
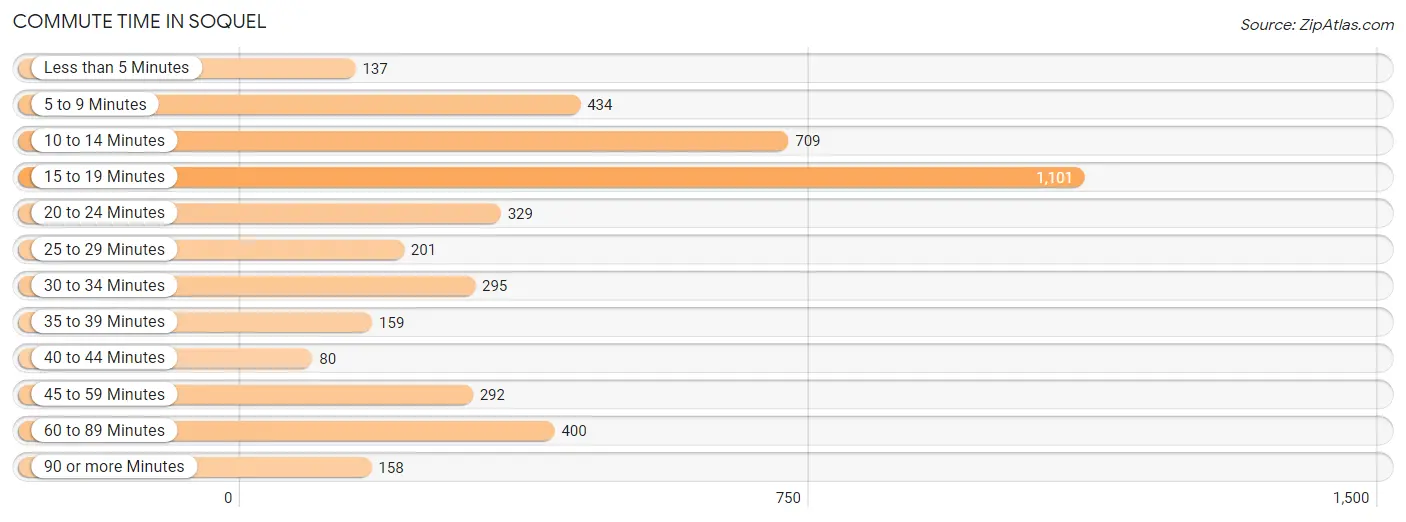
| Commute Time | # Commuters | % Commuters |
| Less than 5 Minutes | 137 | 3.2% |
| 5 to 9 Minutes | 434 | 10.1% |
| 10 to 14 Minutes | 709 | 16.5% |
| 15 to 19 Minutes | 1,101 | 25.6% |
| 20 to 24 Minutes | 329 | 7.7% |
| 25 to 29 Minutes | 201 | 4.7% |
| 30 to 34 Minutes | 295 | 6.9% |
| 35 to 39 Minutes | 159 | 3.7% |
| 40 to 44 Minutes | 80 | 1.9% |
| 45 to 59 Minutes | 292 | 6.8% |
| 60 to 89 Minutes | 400 | 9.3% |
| 90 or more Minutes | 158 | 3.7% |
Commute Time by Sex in Soquel
The most common commute times in Soquel are 15 to 19 minutes (618 commuters, 26.2%) for males and 15 to 19 minutes (483 commuters, 25.0%) for females.
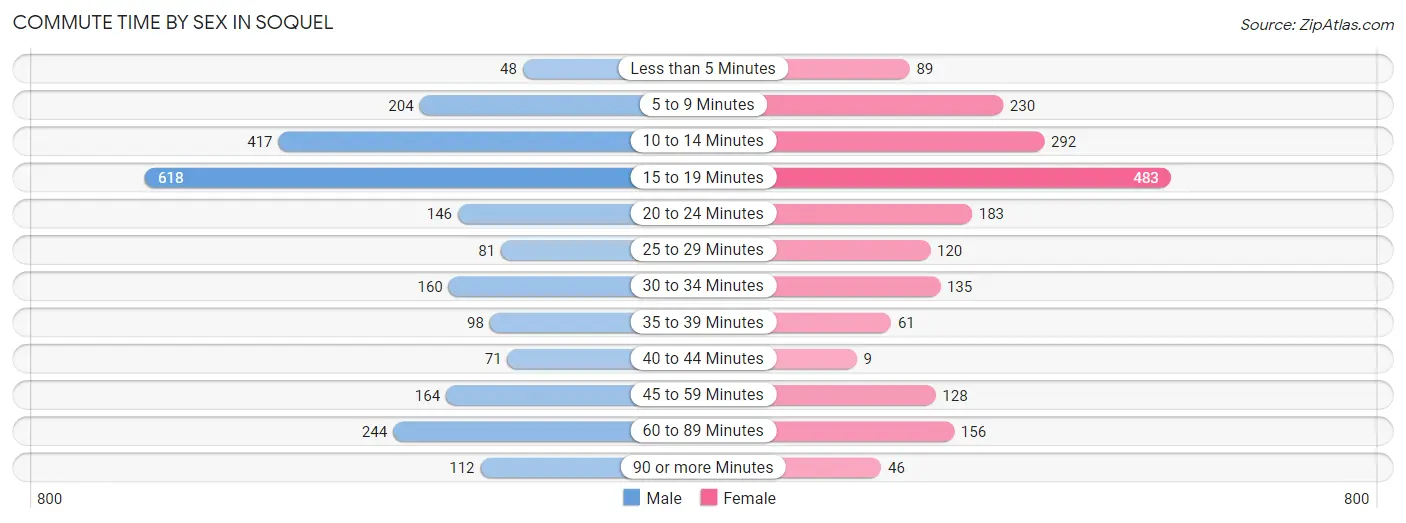
| Commute Time | Male | Female |
| Less than 5 Minutes | 48 (2.0%) | 89 (4.6%) |
| 5 to 9 Minutes | 204 (8.6%) | 230 (11.9%) |
| 10 to 14 Minutes | 417 (17.6%) | 292 (15.1%) |
| 15 to 19 Minutes | 618 (26.2%) | 483 (25.0%) |
| 20 to 24 Minutes | 146 (6.2%) | 183 (9.5%) |
| 25 to 29 Minutes | 81 (3.4%) | 120 (6.2%) |
| 30 to 34 Minutes | 160 (6.8%) | 135 (7.0%) |
| 35 to 39 Minutes | 98 (4.2%) | 61 (3.2%) |
| 40 to 44 Minutes | 71 (3.0%) | 9 (0.5%) |
| 45 to 59 Minutes | 164 (6.9%) | 128 (6.6%) |
| 60 to 89 Minutes | 244 (10.3%) | 156 (8.1%) |
| 90 or more Minutes | 112 (4.7%) | 46 (2.4%) |
Time of Departure to Work by Sex in Soquel
The most frequent times of departure to work in Soquel are 9:00 AM to 9:59 AM (389, 16.5%) for males and 7:30 AM to 7:59 AM (472, 24.4%) for females.
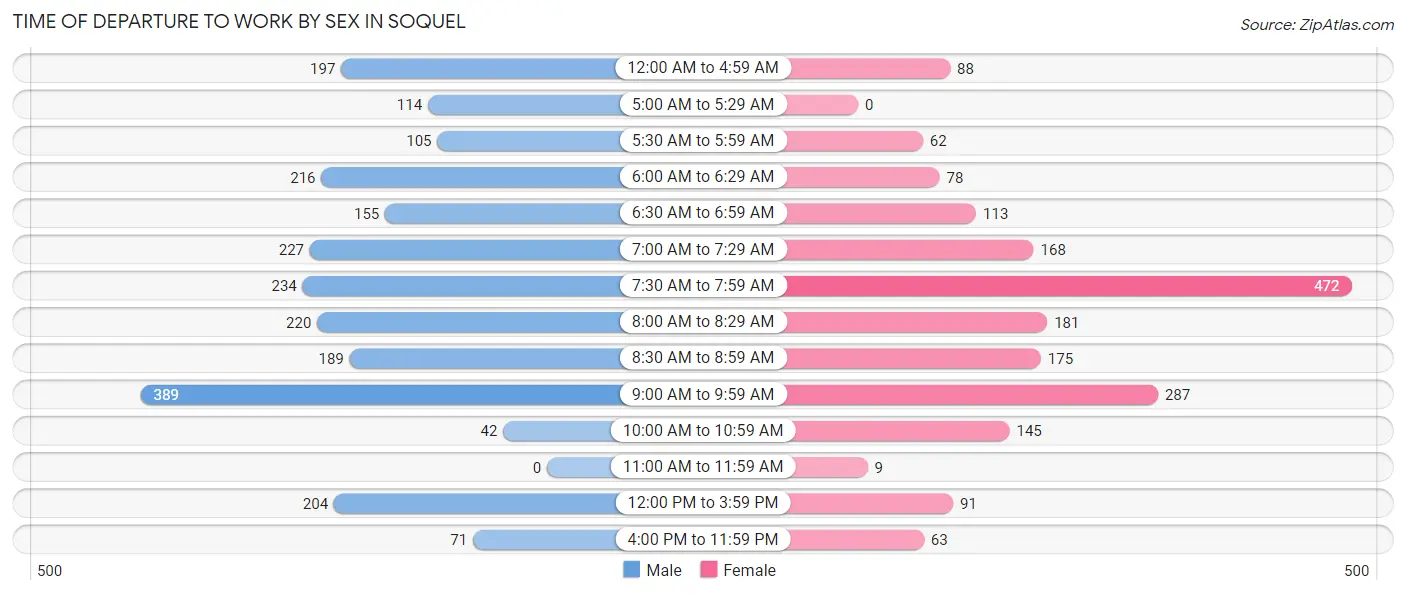
| Time of Departure | Male | Female |
| 12:00 AM to 4:59 AM | 197 (8.3%) | 88 (4.5%) |
| 5:00 AM to 5:29 AM | 114 (4.8%) | 0 (0.0%) |
| 5:30 AM to 5:59 AM | 105 (4.4%) | 62 (3.2%) |
| 6:00 AM to 6:29 AM | 216 (9.1%) | 78 (4.0%) |
| 6:30 AM to 6:59 AM | 155 (6.6%) | 113 (5.9%) |
| 7:00 AM to 7:29 AM | 227 (9.6%) | 168 (8.7%) |
| 7:30 AM to 7:59 AM | 234 (9.9%) | 472 (24.4%) |
| 8:00 AM to 8:29 AM | 220 (9.3%) | 181 (9.4%) |
| 8:30 AM to 8:59 AM | 189 (8.0%) | 175 (9.1%) |
| 9:00 AM to 9:59 AM | 389 (16.5%) | 287 (14.9%) |
| 10:00 AM to 10:59 AM | 42 (1.8%) | 145 (7.5%) |
| 11:00 AM to 11:59 AM | 0 (0.0%) | 9 (0.5%) |
| 12:00 PM to 3:59 PM | 204 (8.6%) | 91 (4.7%) |
| 4:00 PM to 11:59 PM | 71 (3.0%) | 63 (3.3%) |
| Total | 2,363 (100.0%) | 1,932 (100.0%) |
Housing Occupancy in Soquel
Occupancy by Ownership in Soquel
Of the total 4,127 dwellings in Soquel, owner-occupied units account for 3,028 (73.4%), while renter-occupied units make up 1,099 (26.6%).
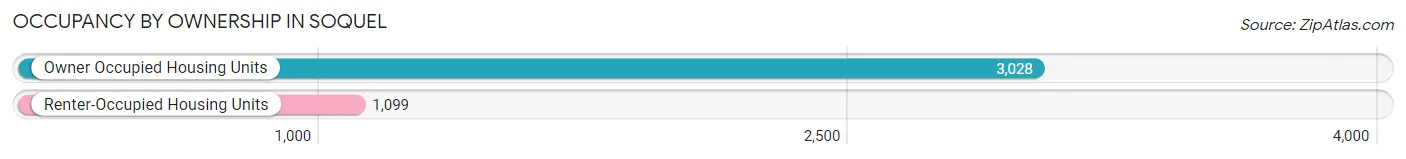
| Occupancy | # Housing Units | % Housing Units |
| Owner Occupied Housing Units | 3,028 | 73.4% |
| Renter-Occupied Housing Units | 1,099 | 26.6% |
| Total Occupied Housing Units | 4,127 | 100.0% |
Occupancy by Household Size in Soquel
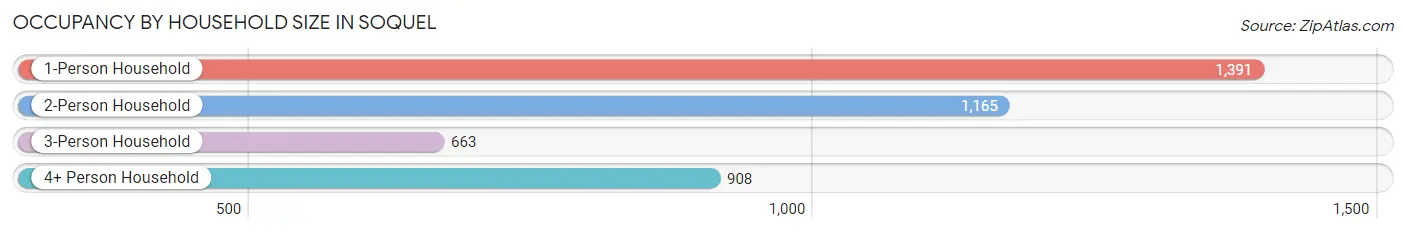
| Household Size | # Housing Units | % Housing Units |
| 1-Person Household | 1,391 | 33.7% |
| 2-Person Household | 1,165 | 28.2% |
| 3-Person Household | 663 | 16.1% |
| 4+ Person Household | 908 | 22.0% |
| Total Housing Units | 4,127 | 100.0% |
Occupancy by Ownership by Household Size in Soquel
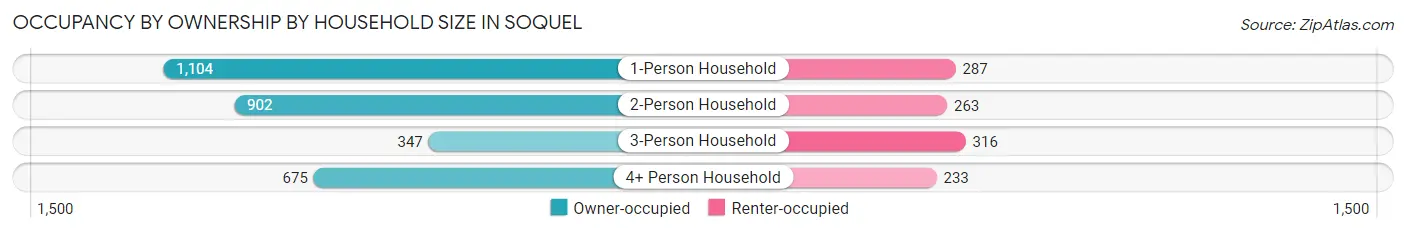
| Household Size | Owner-occupied | Renter-occupied |
| 1-Person Household | 1,104 (79.4%) | 287 (20.6%) |
| 2-Person Household | 902 (77.4%) | 263 (22.6%) |
| 3-Person Household | 347 (52.3%) | 316 (47.7%) |
| 4+ Person Household | 675 (74.3%) | 233 (25.7%) |
| Total Housing Units | 3,028 (73.4%) | 1,099 (26.6%) |
Occupancy by Educational Attainment in Soquel
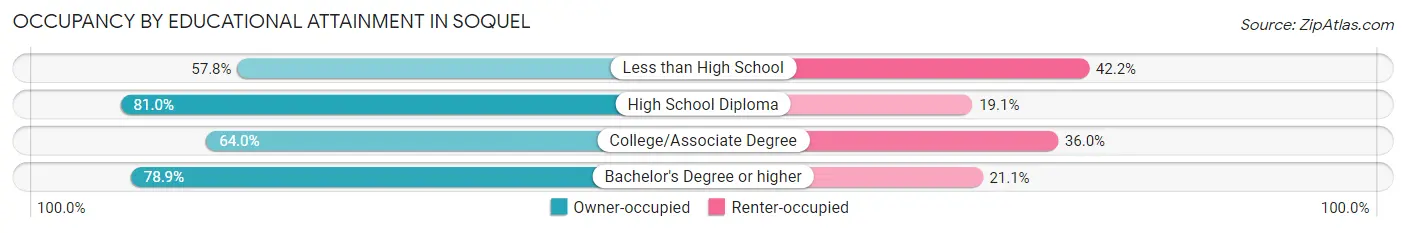
| Household Size | Owner-occupied | Renter-occupied |
| Less than High School | 85 (57.8%) | 62 (42.2%) |
| High School Diploma | 582 (80.9%) | 137 (19.1%) |
| College/Associate Degree | 911 (64.0%) | 513 (36.0%) |
| Bachelor's Degree or higher | 1,450 (78.9%) | 387 (21.1%) |
Occupancy by Age of Householder in Soquel
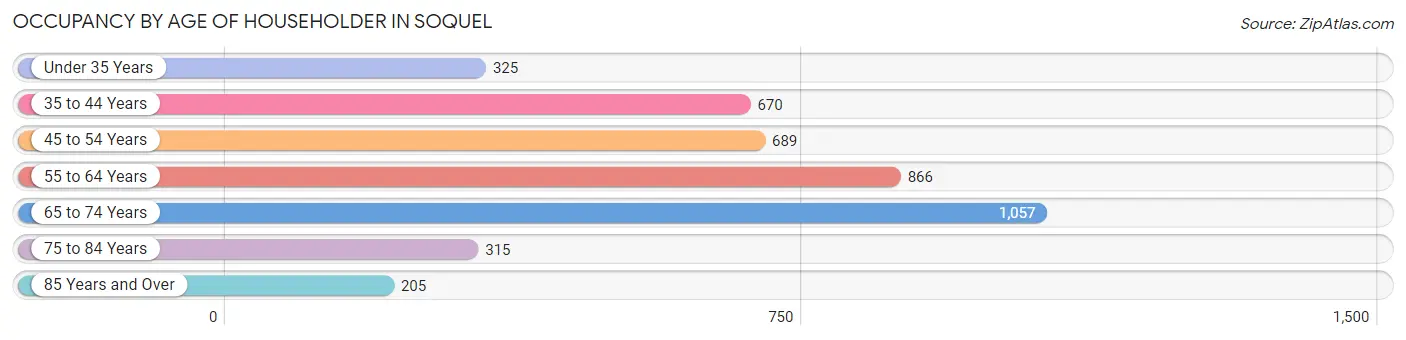
| Age Bracket | # Households | % Households |
| Under 35 Years | 325 | 7.9% |
| 35 to 44 Years | 670 | 16.2% |
| 45 to 54 Years | 689 | 16.7% |
| 55 to 64 Years | 866 | 21.0% |
| 65 to 74 Years | 1,057 | 25.6% |
| 75 to 84 Years | 315 | 7.6% |
| 85 Years and Over | 205 | 5.0% |
| Total | 4,127 | 100.0% |
Housing Finances in Soquel
Median Income by Occupancy in Soquel
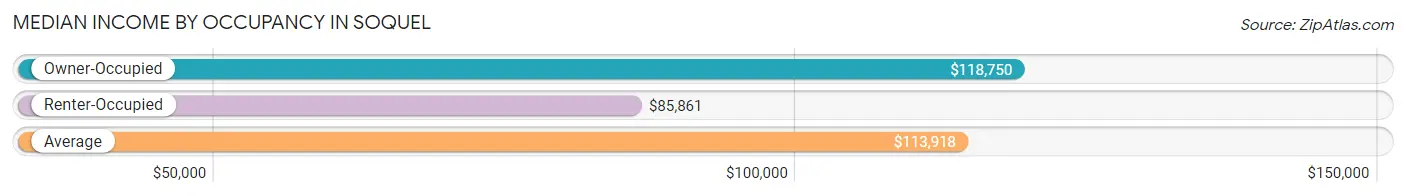
| Occupancy Type | # Households | Median Income |
| Owner-Occupied | 3,028 (73.4%) | $118,750 |
| Renter-Occupied | 1,099 (26.6%) | $85,861 |
| Average | 4,127 (100.0%) | $113,918 |
Occupancy by Householder Income Bracket in Soquel
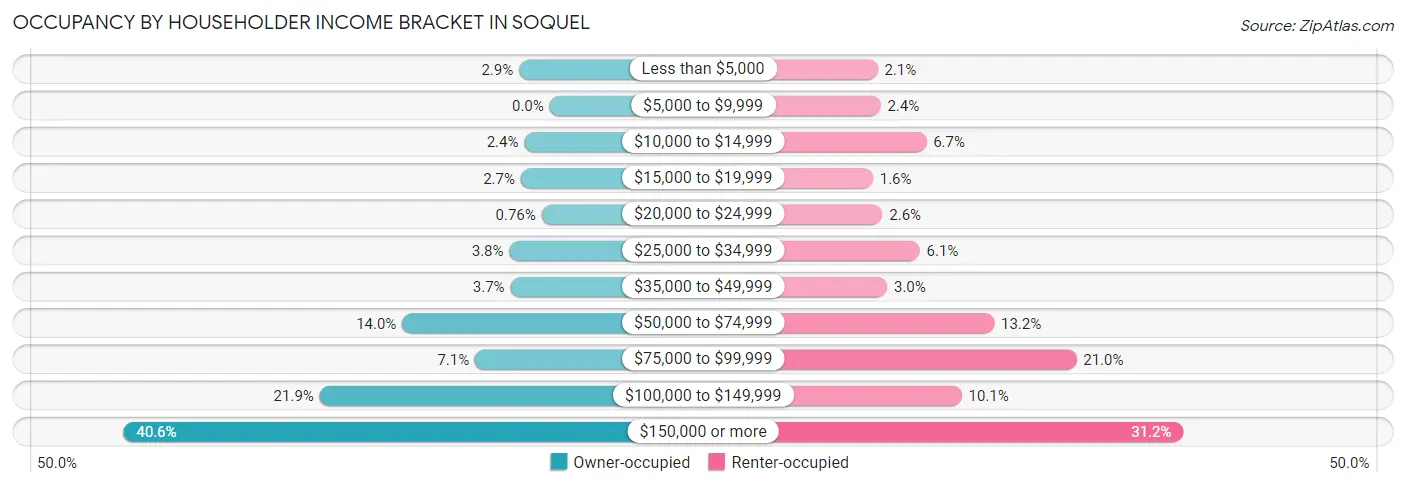
| Income Bracket | Owner-occupied | Renter-occupied |
| Less than $5,000 | 88 (2.9%) | 23 (2.1%) |
| $5,000 to $9,999 | 0 (0.0%) | 26 (2.4%) |
| $10,000 to $14,999 | 73 (2.4%) | 74 (6.7%) |
| $15,000 to $19,999 | 83 (2.7%) | 18 (1.6%) |
| $20,000 to $24,999 | 23 (0.8%) | 28 (2.5%) |
| $25,000 to $34,999 | 116 (3.8%) | 67 (6.1%) |
| $35,000 to $49,999 | 113 (3.7%) | 33 (3.0%) |
| $50,000 to $74,999 | 425 (14.0%) | 145 (13.2%) |
| $75,000 to $99,999 | 215 (7.1%) | 231 (21.0%) |
| $100,000 to $149,999 | 663 (21.9%) | 111 (10.1%) |
| $150,000 or more | 1,229 (40.6%) | 343 (31.2%) |
| Total | 3,028 (100.0%) | 1,099 (100.0%) |
Monthly Housing Cost Tiers in Soquel
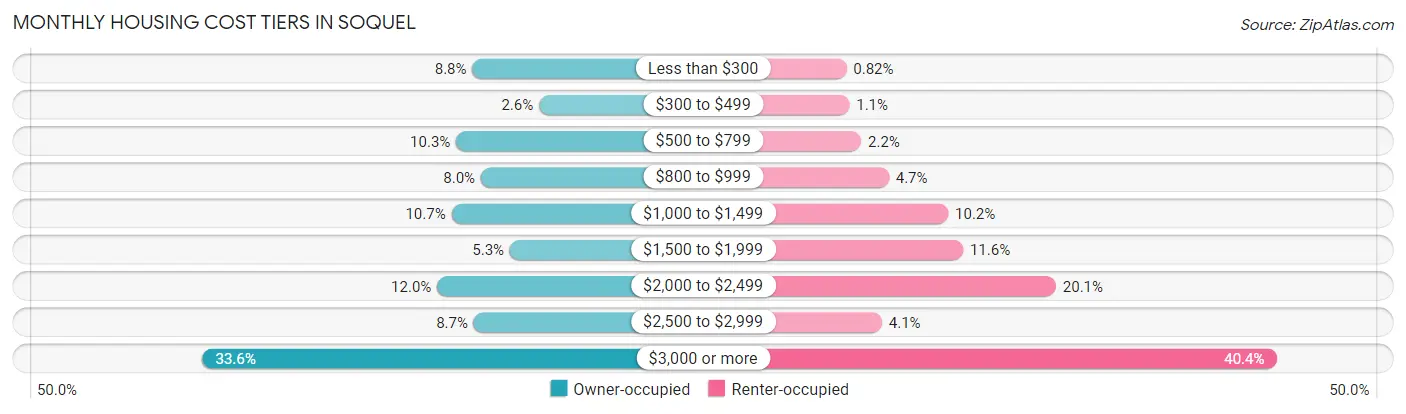
| Monthly Cost | Owner-occupied | Renter-occupied |
| Less than $300 | 266 (8.8%) | 9 (0.8%) |
| $300 to $499 | 80 (2.6%) | 12 (1.1%) |
| $500 to $799 | 311 (10.3%) | 24 (2.2%) |
| $800 to $999 | 242 (8.0%) | 52 (4.7%) |
| $1,000 to $1,499 | 324 (10.7%) | 112 (10.2%) |
| $1,500 to $1,999 | 161 (5.3%) | 127 (11.6%) |
| $2,000 to $2,499 | 364 (12.0%) | 221 (20.1%) |
| $2,500 to $2,999 | 262 (8.6%) | 45 (4.1%) |
| $3,000 or more | 1,018 (33.6%) | 444 (40.4%) |
| Total | 3,028 (100.0%) | 1,099 (100.0%) |
Physical Housing Characteristics in Soquel
Housing Structures in Soquel
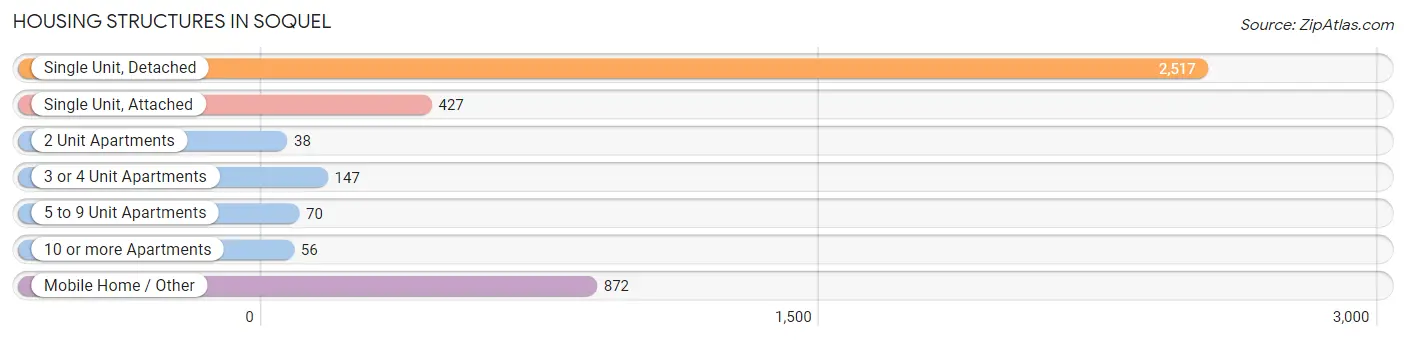
| Structure Type | # Housing Units | % Housing Units |
| Single Unit, Detached | 2,517 | 61.0% |
| Single Unit, Attached | 427 | 10.3% |
| 2 Unit Apartments | 38 | 0.9% |
| 3 or 4 Unit Apartments | 147 | 3.6% |
| 5 to 9 Unit Apartments | 70 | 1.7% |
| 10 or more Apartments | 56 | 1.4% |
| Mobile Home / Other | 872 | 21.1% |
| Total | 4,127 | 100.0% |
Housing Structures by Occupancy in Soquel
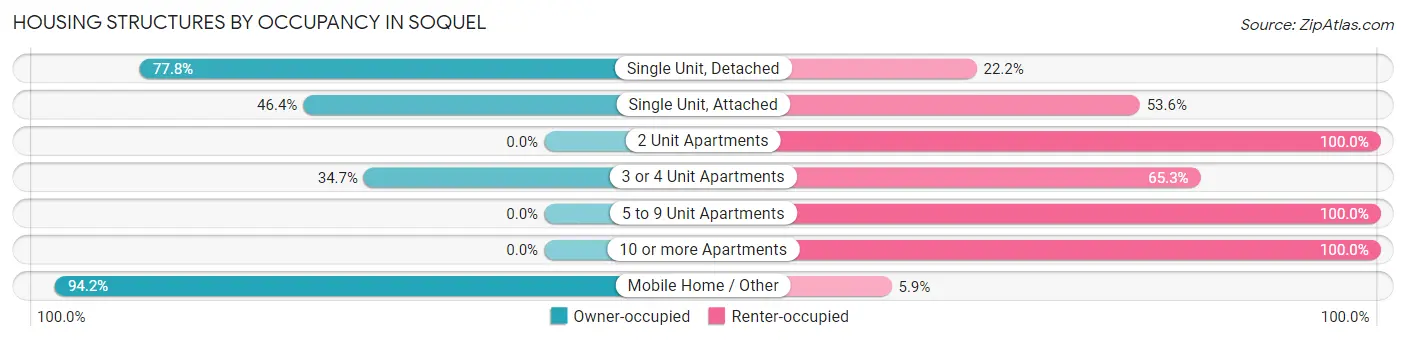
| Structure Type | Owner-occupied | Renter-occupied |
| Single Unit, Detached | 1,958 (77.8%) | 559 (22.2%) |
| Single Unit, Attached | 198 (46.4%) | 229 (53.6%) |
| 2 Unit Apartments | 0 (0.0%) | 38 (100.0%) |
| 3 or 4 Unit Apartments | 51 (34.7%) | 96 (65.3%) |
| 5 to 9 Unit Apartments | 0 (0.0%) | 70 (100.0%) |
| 10 or more Apartments | 0 (0.0%) | 56 (100.0%) |
| Mobile Home / Other | 821 (94.2%) | 51 (5.9%) |
| Total | 3,028 (73.4%) | 1,099 (26.6%) |
Housing Structures by Number of Rooms in Soquel
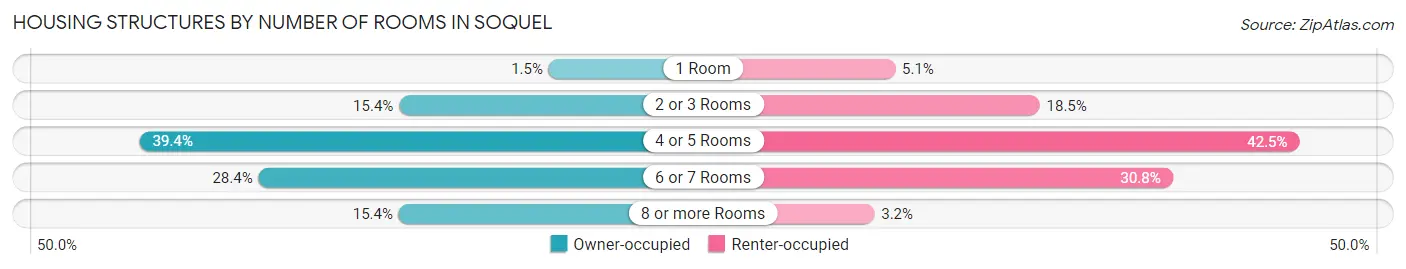
| Number of Rooms | Owner-occupied | Renter-occupied |
| 1 Room | 46 (1.5%) | 56 (5.1%) |
| 2 or 3 Rooms | 465 (15.4%) | 203 (18.5%) |
| 4 or 5 Rooms | 1,192 (39.4%) | 467 (42.5%) |
| 6 or 7 Rooms | 859 (28.4%) | 338 (30.8%) |
| 8 or more Rooms | 466 (15.4%) | 35 (3.2%) |
| Total | 3,028 (100.0%) | 1,099 (100.0%) |
Housing Structure by Heating Type in Soquel
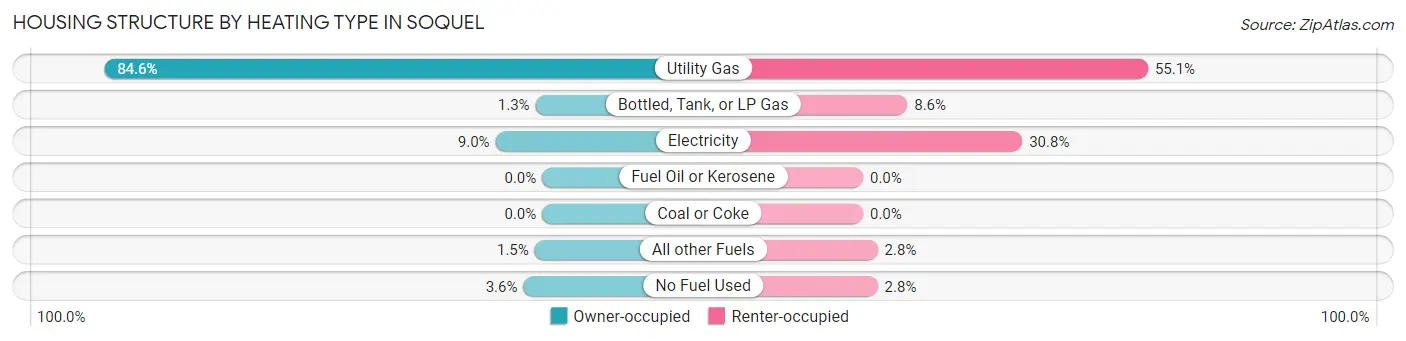
| Heating Type | Owner-occupied | Renter-occupied |
| Utility Gas | 2,562 (84.6%) | 605 (55.0%) |
| Bottled, Tank, or LP Gas | 39 (1.3%) | 94 (8.6%) |
| Electricity | 273 (9.0%) | 338 (30.8%) |
| Fuel Oil or Kerosene | 0 (0.0%) | 0 (0.0%) |
| Coal or Coke | 0 (0.0%) | 0 (0.0%) |
| All other Fuels | 44 (1.5%) | 31 (2.8%) |
| No Fuel Used | 110 (3.6%) | 31 (2.8%) |
| Total | 3,028 (100.0%) | 1,099 (100.0%) |
Household Vehicle Usage in Soquel
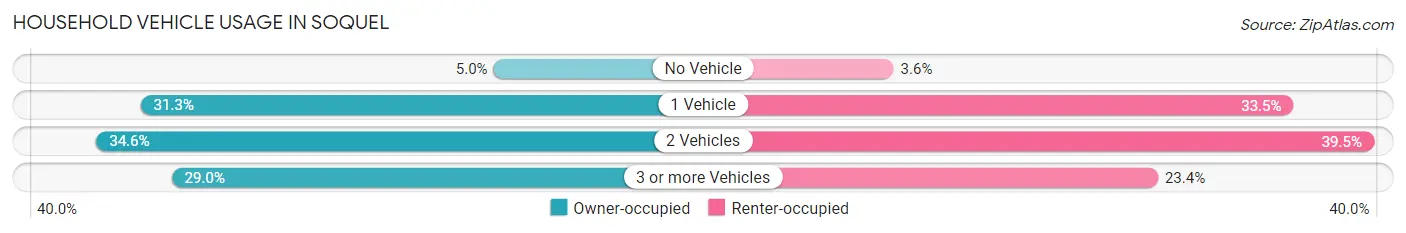
| Vehicles per Household | Owner-occupied | Renter-occupied |
| No Vehicle | 151 (5.0%) | 40 (3.6%) |
| 1 Vehicle | 949 (31.3%) | 368 (33.5%) |
| 2 Vehicles | 1,049 (34.6%) | 434 (39.5%) |
| 3 or more Vehicles | 879 (29.0%) | 257 (23.4%) |
| Total | 3,028 (100.0%) | 1,099 (100.0%) |
Real Estate & Mortgages in Soquel
Real Estate and Mortgage Overview in Soquel
| Characteristic | Without Mortgage | With Mortgage |
| Housing Units | 1,272 | 1,756 |
| Median Property Value | $584,400 | $955,800 |
| Median Household Income | $82,639 | $890 |
| Monthly Housing Costs | $805 | $991 |
| Real Estate Taxes | $3,151 | $27 |
Property Value by Mortgage Status in Soquel
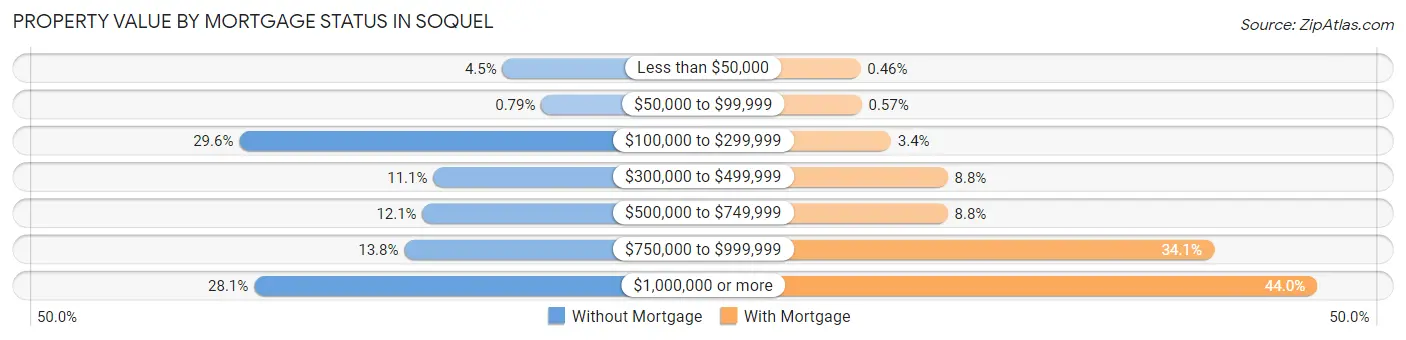
| Property Value | Without Mortgage | With Mortgage |
| Less than $50,000 | 57 (4.5%) | 8 (0.5%) |
| $50,000 to $99,999 | 10 (0.8%) | 10 (0.6%) |
| $100,000 to $299,999 | 376 (29.6%) | 59 (3.4%) |
| $300,000 to $499,999 | 141 (11.1%) | 154 (8.8%) |
| $500,000 to $749,999 | 154 (12.1%) | 154 (8.8%) |
| $750,000 to $999,999 | 176 (13.8%) | 599 (34.1%) |
| $1,000,000 or more | 358 (28.1%) | 772 (44.0%) |
| Total | 1,272 (100.0%) | 1,756 (100.0%) |
Household Income by Mortgage Status in Soquel
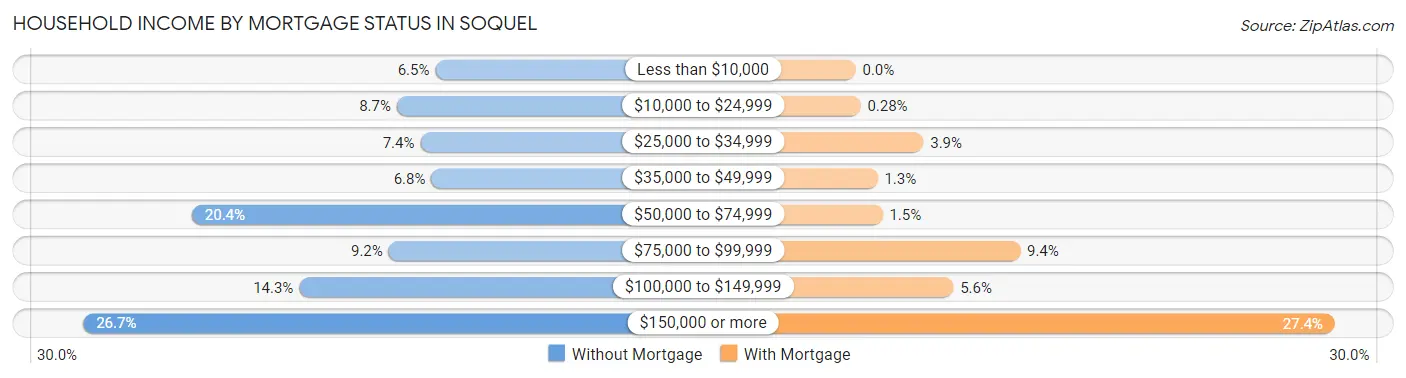
| Household Income | Without Mortgage | With Mortgage |
| Less than $10,000 | 83 (6.5%) | 0 (0.0%) |
| $10,000 to $24,999 | 111 (8.7%) | 5 (0.3%) |
| $25,000 to $34,999 | 94 (7.4%) | 68 (3.9%) |
| $35,000 to $49,999 | 86 (6.8%) | 22 (1.3%) |
| $50,000 to $74,999 | 260 (20.4%) | 27 (1.5%) |
| $75,000 to $99,999 | 117 (9.2%) | 165 (9.4%) |
| $100,000 to $149,999 | 182 (14.3%) | 98 (5.6%) |
| $150,000 or more | 339 (26.7%) | 481 (27.4%) |
| Total | 1,272 (100.0%) | 1,756 (100.0%) |
Property Value to Household Income Ratio in Soquel
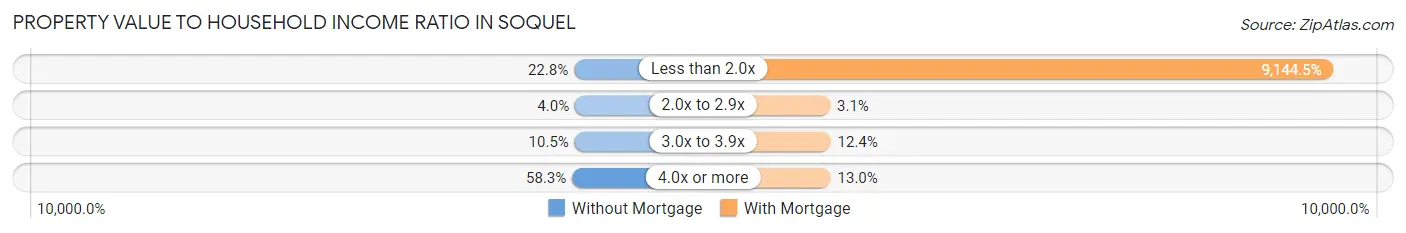
| Value-to-Income Ratio | Without Mortgage | With Mortgage |
| Less than 2.0x | 290 (22.8%) | 160,577 (9,144.5%) |
| 2.0x to 2.9x | 51 (4.0%) | 55 (3.1%) |
| 3.0x to 3.9x | 134 (10.5%) | 217 (12.4%) |
| 4.0x or more | 742 (58.3%) | 229 (13.0%) |
| Total | 1,272 (100.0%) | 1,756 (100.0%) |
Real Estate Taxes by Mortgage Status in Soquel
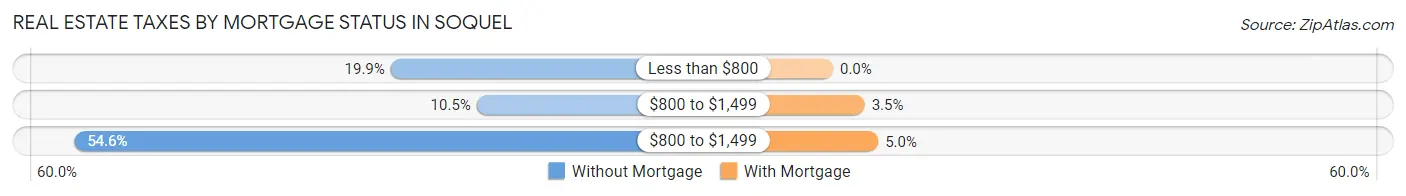
| Property Taxes | Without Mortgage | With Mortgage |
| Less than $800 | 253 (19.9%) | 0 (0.0%) |
| $800 to $1,499 | 133 (10.5%) | 61 (3.5%) |
| $800 to $1,499 | 694 (54.6%) | 87 (5.0%) |
| Total | 1,272 (100.0%) | 1,756 (100.0%) |
Health & Disability in Soquel
Health Insurance Coverage by Age in Soquel
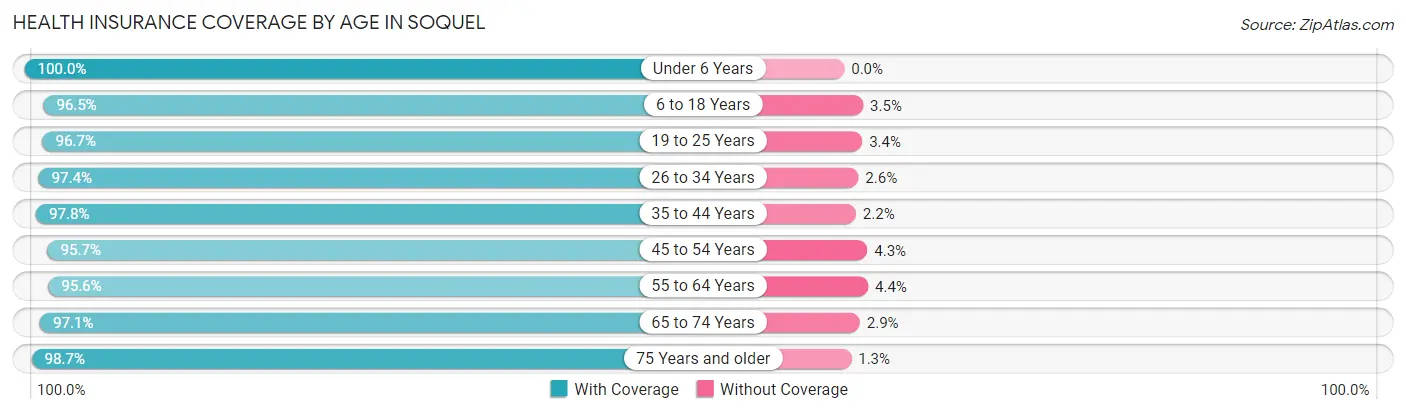
| Age Bracket | With Coverage | Without Coverage |
| Under 6 Years | 572 (100.0%) | 0 (0.0%) |
| 6 to 18 Years | 1,564 (96.5%) | 57 (3.5%) |
| 19 to 25 Years | 1,010 (96.7%) | 35 (3.4%) |
| 26 to 34 Years | 850 (97.4%) | 23 (2.6%) |
| 35 to 44 Years | 1,358 (97.8%) | 30 (2.2%) |
| 45 to 54 Years | 1,180 (95.7%) | 53 (4.3%) |
| 55 to 64 Years | 1,421 (95.6%) | 66 (4.4%) |
| 65 to 74 Years | 1,541 (97.1%) | 46 (2.9%) |
| 75 Years and older | 684 (98.7%) | 9 (1.3%) |
| Total | 10,180 (97.0%) | 319 (3.0%) |
Health Insurance Coverage by Citizenship Status in Soquel
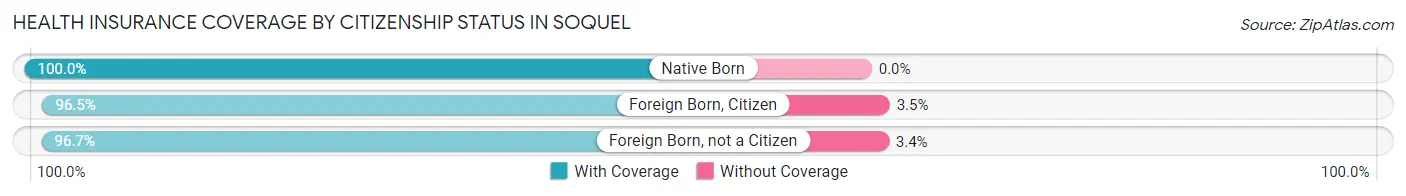
| Citizenship Status | With Coverage | Without Coverage |
| Native Born | 572 (100.0%) | 0 (0.0%) |
| Foreign Born, Citizen | 1,564 (96.5%) | 57 (3.5%) |
| Foreign Born, not a Citizen | 1,010 (96.7%) | 35 (3.4%) |
Health Insurance Coverage by Household Income in Soquel
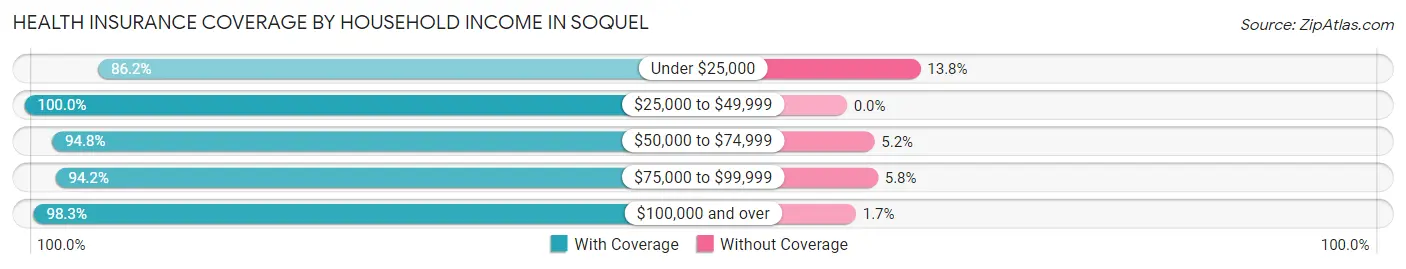
| Household Income | With Coverage | Without Coverage |
| Under $25,000 | 438 (86.2%) | 70 (13.8%) |
| $25,000 to $49,999 | 446 (100.0%) | 0 (0.0%) |
| $50,000 to $74,999 | 1,212 (94.8%) | 66 (5.2%) |
| $75,000 to $99,999 | 1,053 (94.2%) | 65 (5.8%) |
| $100,000 and over | 6,925 (98.3%) | 118 (1.7%) |
Public vs Private Health Insurance Coverage by Age in Soquel
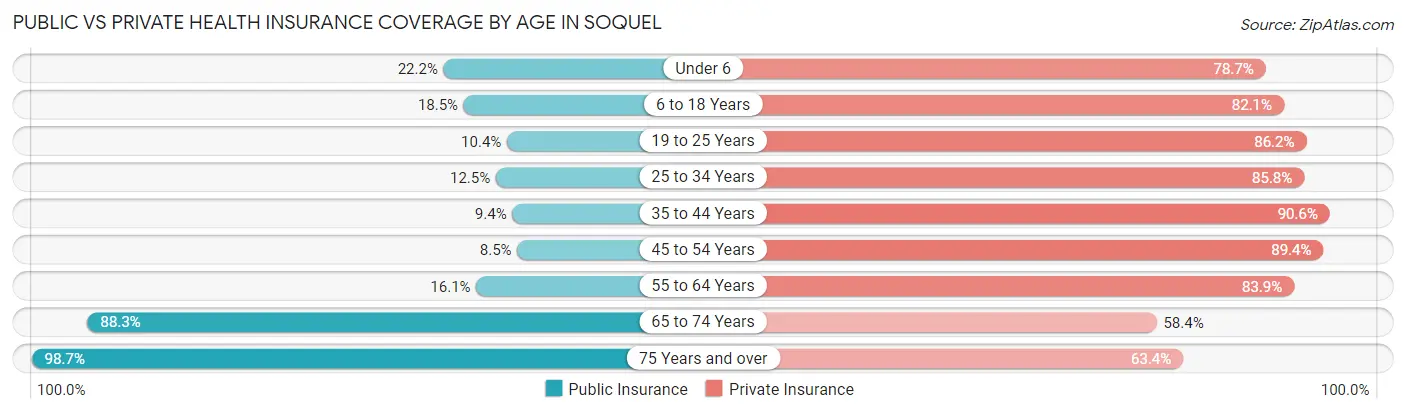
| Age Bracket | Public Insurance | Private Insurance |
| Under 6 | 127 (22.2%) | 450 (78.7%) |
| 6 to 18 Years | 299 (18.4%) | 1,330 (82.1%) |
| 19 to 25 Years | 109 (10.4%) | 901 (86.2%) |
| 25 to 34 Years | 109 (12.5%) | 749 (85.8%) |
| 35 to 44 Years | 131 (9.4%) | 1,257 (90.6%) |
| 45 to 54 Years | 105 (8.5%) | 1,102 (89.4%) |
| 55 to 64 Years | 240 (16.1%) | 1,248 (83.9%) |
| 65 to 74 Years | 1,402 (88.3%) | 927 (58.4%) |
| 75 Years and over | 684 (98.7%) | 439 (63.3%) |
| Total | 3,206 (30.5%) | 8,403 (80.0%) |
Disability Status by Sex by Age in Soquel
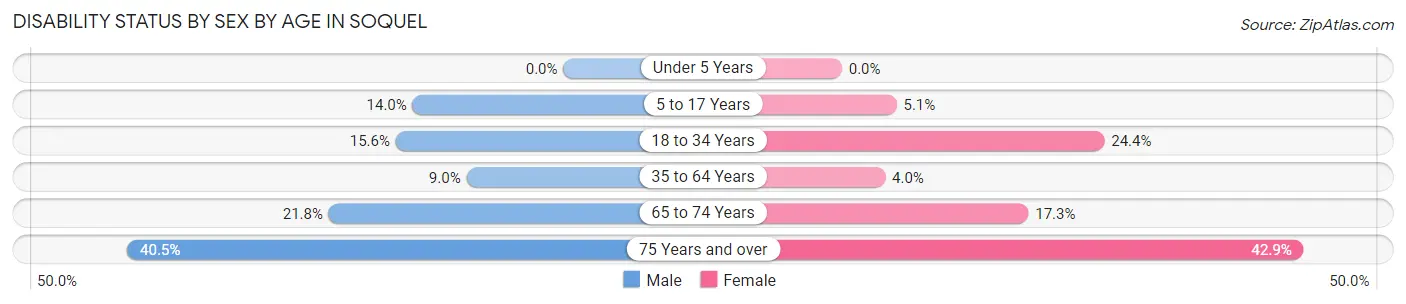
| Age Bracket | Male | Female |
| Under 5 Years | 0 (0.0%) | 0 (0.0%) |
| 5 to 17 Years | 137 (14.0%) | 32 (5.1%) |
| 18 to 34 Years | 148 (15.5%) | 258 (24.4%) |
| 35 to 64 Years | 186 (9.0%) | 82 (4.0%) |
| 65 to 74 Years | 177 (21.8%) | 134 (17.3%) |
| 75 Years and over | 85 (40.5%) | 207 (42.9%) |
Disability Class by Sex by Age in Soquel
Disability Class: Hearing Difficulty
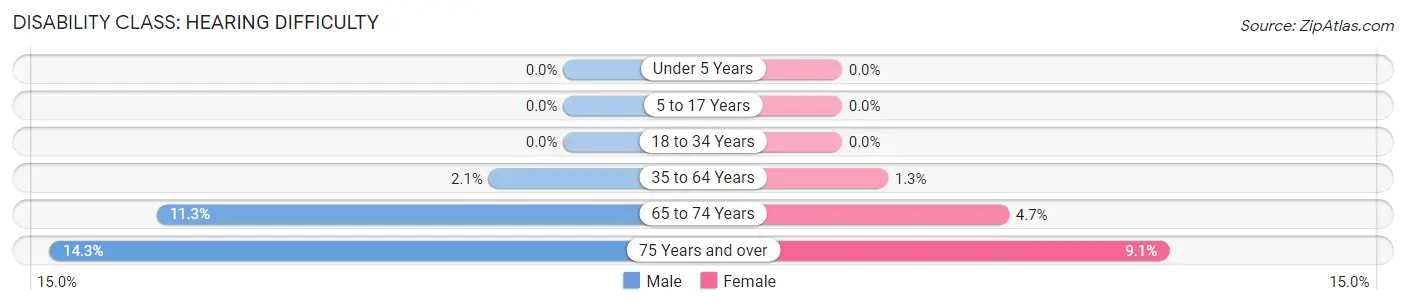
| Age Bracket | Male | Female |
| Under 5 Years | 0 (0.0%) | 0 (0.0%) |
| 5 to 17 Years | 0 (0.0%) | 0 (0.0%) |
| 18 to 34 Years | 0 (0.0%) | 0 (0.0%) |
| 35 to 64 Years | 43 (2.1%) | 26 (1.3%) |
| 65 to 74 Years | 92 (11.3%) | 36 (4.6%) |
| 75 Years and over | 30 (14.3%) | 44 (9.1%) |
Disability Class: Vision Difficulty
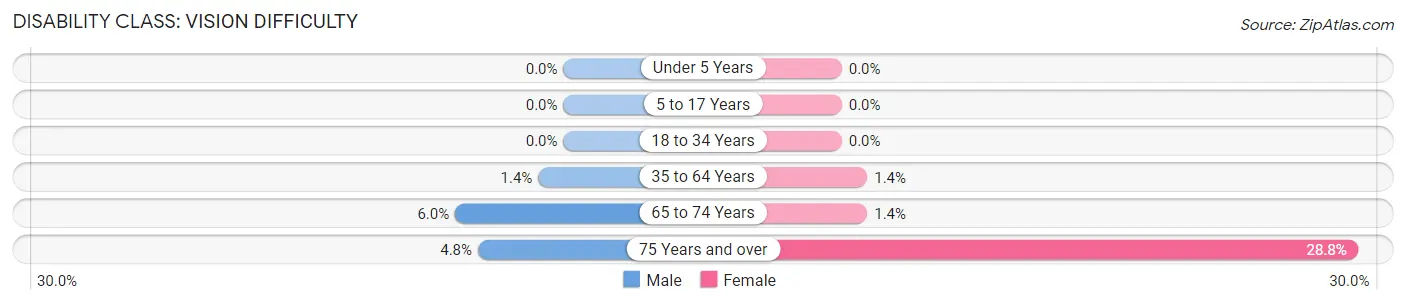
| Age Bracket | Male | Female |
| Under 5 Years | 0 (0.0%) | 0 (0.0%) |
| 5 to 17 Years | 0 (0.0%) | 0 (0.0%) |
| 18 to 34 Years | 0 (0.0%) | 0 (0.0%) |
| 35 to 64 Years | 29 (1.4%) | 29 (1.4%) |
| 65 to 74 Years | 49 (6.0%) | 11 (1.4%) |
| 75 Years and over | 10 (4.8%) | 139 (28.8%) |
Disability Class: Cognitive Difficulty
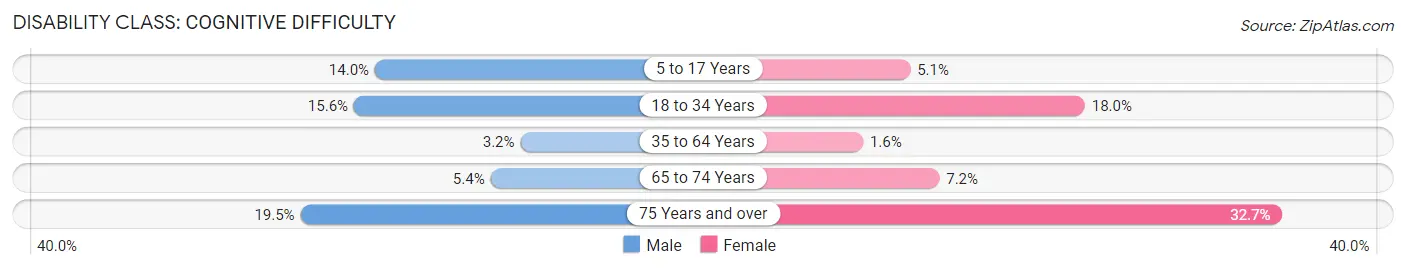
| Age Bracket | Male | Female |
| 5 to 17 Years | 137 (14.0%) | 32 (5.1%) |
| 18 to 34 Years | 148 (15.5%) | 191 (18.0%) |
| 35 to 64 Years | 66 (3.2%) | 32 (1.6%) |
| 65 to 74 Years | 44 (5.4%) | 56 (7.2%) |
| 75 Years and over | 41 (19.5%) | 158 (32.7%) |
Disability Class: Ambulatory Difficulty
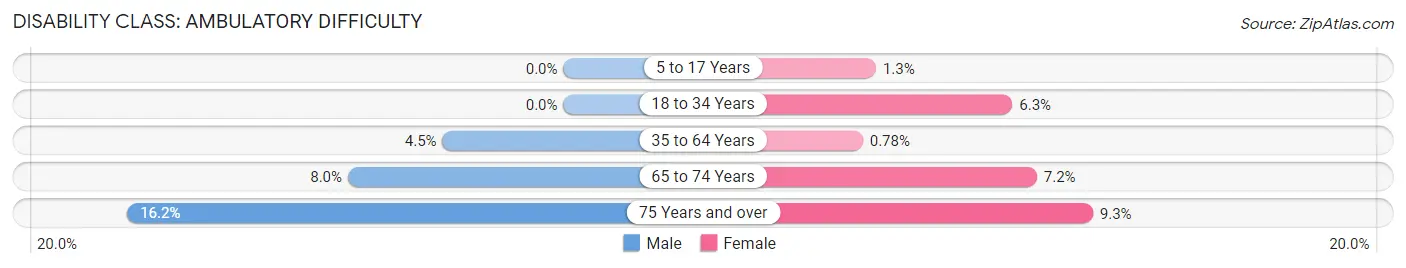
| Age Bracket | Male | Female |
| 5 to 17 Years | 0 (0.0%) | 8 (1.3%) |
| 18 to 34 Years | 0 (0.0%) | 67 (6.3%) |
| 35 to 64 Years | 93 (4.5%) | 16 (0.8%) |
| 65 to 74 Years | 65 (8.0%) | 56 (7.2%) |
| 75 Years and over | 34 (16.2%) | 45 (9.3%) |
Disability Class: Self-Care Difficulty
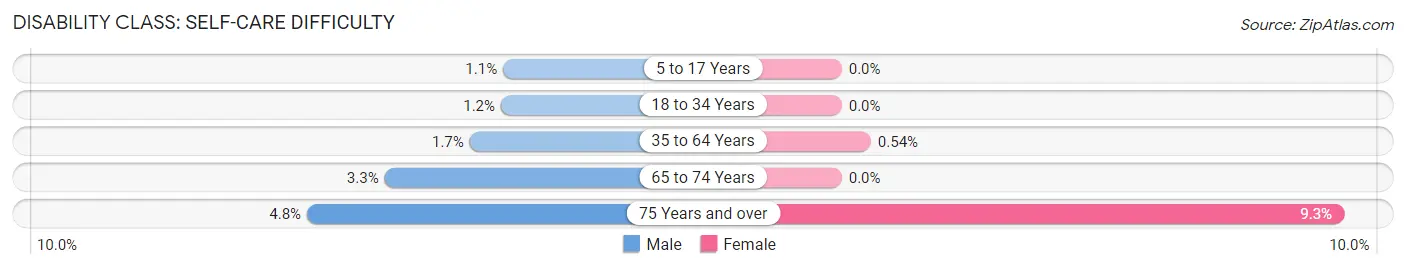
| Age Bracket | Male | Female |
| 5 to 17 Years | 11 (1.1%) | 0 (0.0%) |
| 18 to 34 Years | 11 (1.2%) | 0 (0.0%) |
| 35 to 64 Years | 36 (1.7%) | 11 (0.5%) |
| 65 to 74 Years | 27 (3.3%) | 0 (0.0%) |
| 75 Years and over | 10 (4.8%) | 45 (9.3%) |
Technology Access in Soquel
Computing Device Access in Soquel
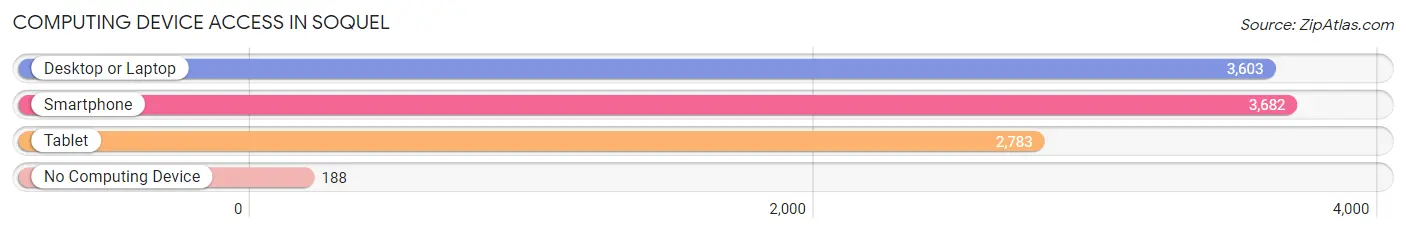
| Device Type | # Households | % Households |
| Desktop or Laptop | 3,603 | 87.3% |
| Smartphone | 3,682 | 89.2% |
| Tablet | 2,783 | 67.4% |
| No Computing Device | 188 | 4.6% |
| Total | 4,127 | 100.0% |
Internet Access in Soquel
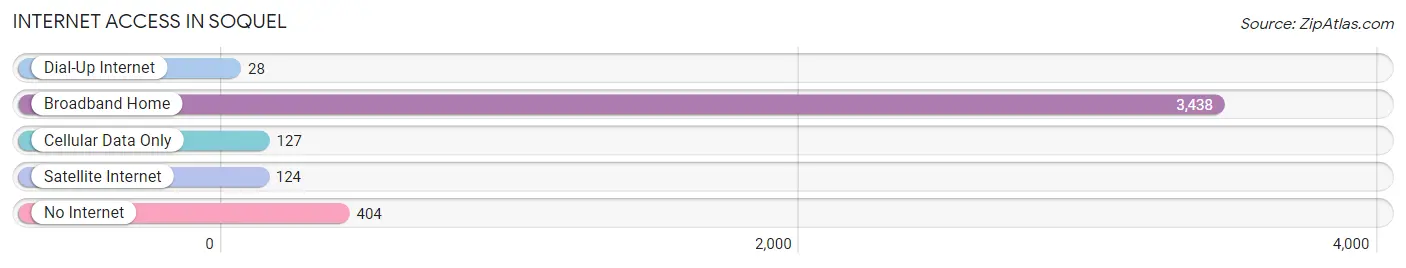
| Internet Type | # Households | % Households |
| Dial-Up Internet | 28 | 0.7% |
| Broadband Home | 3,438 | 83.3% |
| Cellular Data Only | 127 | 3.1% |
| Satellite Internet | 124 | 3.0% |
| No Internet | 404 | 9.8% |
| Total | 4,127 | 100.0% |
Soquel Summary
Soquel is a small unincorporated community located in Santa Cruz County, California. It is situated on the northern edge of the Monterey Bay, about 10 miles south of the city of Santa Cruz. The population of Soquel was estimated to be 4,845 in 2019.
History
Soquel was originally inhabited by the Ohlone people, who lived in the area for thousands of years before the arrival of Europeans. The first Europeans to settle in the area were Spanish missionaries, who established the Mission Santa Cruz in 1791. The mission was abandoned in 1834, and the land was divided into large ranchos. In 1848, the area was ceded to the United States as part of the Treaty of Guadalupe Hidalgo.
In the late 19th century, the area was settled by farmers and ranchers, who grew crops such as wheat, barley, and oats. The town of Soquel was founded in 1868, and the first post office was established in 1871. The town was named after the Soquel Creek, which runs through the area.
Geography
Soquel is located in the northern part of Santa Cruz County, about 10 miles south of the city of Santa Cruz. It is situated on the northern edge of the Monterey Bay, and is bordered by the cities of Capitola and Aptos to the south, and the Santa Cruz Mountains to the east. The town covers an area of 4.3 square miles, and has a population density of 1,093 people per square mile.
The climate in Soquel is mild and temperate, with warm summers and cool winters. The average annual temperature is 57°F, and the average annual precipitation is 24 inches.
Economy
The economy of Soquel is largely based on tourism and agriculture. The town is home to several wineries and vineyards, and is a popular destination for wine tasting. Agriculture is also an important part of the local economy, with crops such as strawberries, apples, and pumpkins being grown in the area.
The town is also home to several small businesses, including restaurants, shops, and art galleries. The local economy is also supported by the nearby University of California, Santa Cruz, which employs many of the town’s residents.
Demographics
As of 2019, the population of Soquel was estimated to be 4,845. The racial makeup of the town was 79.3% White, 8.2% Hispanic or Latino, 5.3% Asian, 4.2% African American, and 2.9% other. The median household income was $90,945, and the median home value was $845,000.
The town is served by the Soquel Union Elementary School District, which includes four elementary schools and one middle school. The nearest high school is Soquel High School, which is part of the Santa Cruz County Office of Education.
Common Questions
What is Per Capita Income in Soquel?
Per Capita income in Soquel is $61,066.
What is the Median Family Income in Soquel?
Median Family Income in Soquel is $146,346.
What is the Median Household income in Soquel?
Median Household Income in Soquel is $113,918.
What is Income or Wage Gap in Soquel?
Income or Wage Gap in Soquel is 41.9%.
Women in Soquel earn 58.1 cents for every dollar earned by a man.
What is Inequality or Gini Index in Soquel?
Inequality or Gini Index in Soquel is 0.46.
What is the Total Population of Soquel?
Total Population of Soquel is 10,505.
What is the Total Male Population of Soquel?
Total Male Population of Soquel is 5,212.
What is the Total Female Population of Soquel?
Total Female Population of Soquel is 5,293.
What is the Ratio of Males per 100 Females in Soquel?
There are 98.47 Males per 100 Females in Soquel.
What is the Ratio of Females per 100 Males in Soquel?
There are 101.55 Females per 100 Males in Soquel.
What is the Median Population Age in Soquel?
Median Population Age in Soquel is 42.2 Years.
What is the Average Family Size in Soquel
Average Family Size in Soquel is 3.2 People.
What is the Average Household Size in Soquel
Average Household Size in Soquel is 2.5 People.
How Large is the Labor Force in Soquel?
There are 5,519 People in the Labor Forcein in Soquel.
What is the Percentage of People in the Labor Force in Soquel?
62.9% of People are in the Labor Force in Soquel.
What is the Unemployment Rate in Soquel?
Unemployment Rate in Soquel is 4.5%.